Attached files
| file | filename |
|---|---|
| EX-32.2 - EX-32.2 - POWELL INDUSTRIES INC | powl-ex322_185.htm |
| EX-32.1 - EX-32.1 - POWELL INDUSTRIES INC | powl-ex321_184.htm |
| EX-31.2 - EX-31.2 - POWELL INDUSTRIES INC | powl-ex312_186.htm |
| EX-31.1 - EX-31.1 - POWELL INDUSTRIES INC | powl-ex311_187.htm |
| EX-23.2 - EX-23.2 - POWELL INDUSTRIES INC | powl-ex232_475.htm |
| EX-21.1 - EX-21.1 - POWELL INDUSTRIES INC | powl-ex211_183.htm |
| EX-10.47 - EX-10.47 - POWELL INDUSTRIES INC | powl-ex1047_310.htm |
UNITED STATES
SECURITIES AND EXCHANGE COMMISSION
Washington, D.C. 20549
Form 10-K
(Mark One)
|
☒ |
ANNUAL REPORT PURSUANT TO SECTION 13 OR 15(d) OF THE SECURITIES EXCHANGE ACT OF 1934 |
For the fiscal year ended September 30, 2016
OR
|
☐ |
TRANSITION REPORT PURSUANT TO SECTION 13 OR 15(d) OF THE SECURITIES EXCHANGE ACT OF 1934 |
Commission File Number 001-12488
Powell Industries, Inc.
(Exact name of registrant as specified in its charter)
|
Delaware |
|
88-0106100 |
|
(State or other jurisdiction of incorporation or organization) |
|
(I.R.S. Employer Identification No.) |
|
8550 Mosley Road Houston, Texas |
|
77075-1180 |
|
(Address of principal executive offices) |
|
(Zip Code) |
Registrant’s telephone number, including area code:
(713) 944-6900
Securities registered pursuant to section 12(b) of the Act:
Title of each class: Name of each exchange on which registered:
Common Stock, par value $.01 per share NASDAQ Global Market
Securities registered pursuant to Section 12(g) of Act:
None
Indicate by check mark whether the registrant is a well-known seasoned issuer, as defined in Rule 405 of the Securities Act. ☐ Yes ☒ No
Indicate by check mark if the registrant is not required to file reports pursuant to Section 13 or Section 15(d) of the Act. ☐ Yes ☒ No
Indicate by check mark whether the registrant (1) has filed all reports required to be filed by Section 13 or 15(d) of the Securities Exchange Act of 1934 during the preceding 12 months (or for such shorter period that the registrant was required to file such reports), and (2) has been subject to such filing requirements for the past 90 days. ☒ Yes ☐ No
Indicate by check mark whether the registrant has submitted electronically and posted on its corporate Web site, if any, every Interactive Date File required to be submitted and posted pursuant to Rule 405 of Regulation S-T (§232.405 of this chapter) during the preceding 12 months (or for such shorter period that the registrant was required to submit and post such files). ☒ Yes ☐ No
Indicate by check mark if disclosure of delinquent filers pursuant to Item 405 of Regulation S-K (§232.405 of this chapter) is not contained herein and will not be contained, to the best of the registrant’s knowledge, in definitive proxy or information statements incorporated by reference in Part III of this Form 10-K or any amendment to this Form 10-K. ☒
Indicate by check mark whether the registrant is a large accelerated filer, an accelerated filer, a non-accelerated filer, or a smaller reporting company. See the definitions of “large accelerated filer,” “accelerated filer” and “smaller reporting company” in Rule 12b-2 of the Exchange Act. (Check one):
|
☐ Large accelerated filer |
|
☒ Accelerated filer |
|
☐ Non-accelerated filer |
|
☐ Smaller reporting company |
|
|
|
(Do not check if a smaller reporting company) |
||||
Indicate by check mark whether the registrant is a shell company (as defined in Exchange Act Rule 12b-2). ☐ Yes ☒ No
The aggregate market value of the common stock held by non-affiliates of the registrant was approximately $339 million as of March 31, 2016, based upon the closing price on the NASDAQ Global Market on that date. For purposes of the calculation above only, all directors, executive officers and beneficial owners of 5% or more are considered to be “affiliates.”
At December 2, 2016, there were 11,411,638 outstanding shares of the registrant’s common stock, par value $0.01 per share.
Documents Incorporated By Reference
Portions of the registrant’s definitive Proxy Statement for the 2017 annual meeting of stockholders to be filed not later than 120 days after September 30, 2016, are incorporated by reference into Part III of this Form 10-K.
TABLE OF CONTENTS
|
|
|
|
Page |
|
|
|
Cautionary Statement Regarding Forward-Looking Statements; Risk Factors |
3 |
|
|
|
|
|
|
|
|
|
|
|
Item 1. |
|
4 |
|
|
Item 1A. |
|
6 |
|
|
Item 1B. |
|
10 |
|
|
Item 2. |
|
10 |
|
|
Item 3. |
|
11 |
|
|
Item 4. |
|
11 |
|
|
|
|
|
|
|
|
|
|
|
|
Item 5. |
|
12 |
|
|
Item 6. |
|
14 |
|
|
Item 7. |
|
Management’s Discussion and Analysis of Financial Condition and Results of Operations |
15 |
|
Item 7A. |
|
24 |
|
|
Item 8. |
|
25 |
|
|
Item 9. |
|
Changes in and Disagreements with Accountants on Accounting and Financial Disclosure |
50 |
|
Item 9A. |
|
50 |
|
|
Item 9B. |
|
50 |
|
|
|
|
|
|
|
|
|
|
|
|
Item 10. |
|
51 |
|
|
Item 11. |
|
51 |
|
|
Item 12. |
|
Security Ownership of Certain Beneficial Owners and Management and Related Stockholder Matters |
51 |
|
Item 13. |
|
Certain Relationships and Related Transactions, and Director Independence |
51 |
|
Item 14. |
|
51 |
|
|
|
|
|
|
|
|
|
|
|
|
Item 15. |
|
52 |
|
|
56 |
|||
2
CAUTIONARY STATEMENT REGARDING FORWARD-LOOKING STATEMENTS;
RISK FACTORS
Unless otherwise indicated, all references to “we,” “us,” “our,” “Powell” or “the Company” include Powell Industries, Inc. and its consolidated subsidiaries.
Forward-Looking Statements
This Annual Report on Form 10-K (Annual Report) includes forward-looking statements based on our current expectations, which are subject to risks and uncertainties. Forward-looking statements include information concerning future results of operations and financial condition. Statements that contain words such as “believes,” “expects,” “anticipates,” “intends,” “estimates,” “continue,” “should,” “could,” “may,” “plan,” “project,” “predict,” “will” or similar expressions may be forward-looking statements. These forward-looking statements are subject to risks and uncertainties, and many factors could affect the future financial results and condition of the Company. Factors that may have a material effect on our revenues, expenses and operating results include adverse business or market conditions, our ability to meet our customers’ scheduling requirements, our customers’ financial conditions and their ability to secure financing to support current and future projects, the availability and cost of materials from suppliers, availability of skilled labor force, adverse competitive developments and changes in customer requirements as well as those circumstances discussed under “Item 1A. Risk Factors,” below. Accordingly, actual results may differ materially from those expressed or implied by the forward-looking statements contained in this Annual Report. Any forward-looking statements made by or on our behalf are made pursuant to the safe harbor provisions of the Private Securities Litigation Reform Act of 1995.
The forward-looking statements contained in this Annual Report are based on current assumptions that we will continue to develop, market, manufacture and ship products and provide services on a competitive and timely basis; that economic and competitive conditions in our markets will not change in a materially adverse way; that we will accurately identify and meet customer needs for products and services; that we will be able to hire and retain skilled laborers and key employees; that our products and capabilities will remain competitive; that the financial markets and banking systems will remain stable and availability of credit will continue; that risks related to shifts in customer demand are minimized and that there will be no material adverse change in the operations or business of the Company. Assumptions relating to these factors involve judgments that are based on available information, which may not be complete, and are subject to changes in many factors beyond the Company’s control that can materially affect results. Because of these and other factors that affect our operating results, past financial performance should not be considered an indicator of future performance, and investors should not use historical trends to anticipate results or trends in future periods.
3
Overview
Powell Industries, Inc. was incorporated in the state of Delaware in 2004 as a successor to a Nevada company incorporated in 1968. The Nevada corporation was the successor to a company founded by William E. Powell in 1947, which merged into the Company in 1977. We are headquartered in Houston, Texas, and our major subsidiaries, all of which are wholly owned, include: Powell Electrical Systems, Inc.; Powell (UK) Limited; Powell Canada Inc. and Powell Industries International, B.V.
Our website is powellind.com. We make available, free of charge on or through our website, copies of our Annual Reports on Form 10-K, Quarterly Reports on Form 10-Q, Current Reports on Form 8-K and amendments to those reports filed or furnished pursuant to Section 13(a) or 15(d) of the Securities Exchange Act of 1934 as soon as is reasonably practicable after we electronically file such material with, or furnish it to, the Securities and Exchange Commission (SEC). Additionally, all of our reports filed with the SEC are available via their website at http://www.sec.gov, or may be read and copied at the SEC Public Reference Room at 100 F Street, NE, Washington, DC 20549.
We develop design, manufacture and service custom-engineered equipment and systems for the distribution, control and monitoring of electrical energy designed to (1) distribute, control and monitor the flow of electrical energy and (2) provide protection to motors, transformers and other electrically powered equipment. Our principal products include integrated power control room substations (PCRs®), custom-engineered modules, electrical houses (E-Houses), traditional and arc-resistant distribution switchgear and control gear, medium-voltage circuit breakers, monitoring and control communications systems, motor control centers and bus duct systems. These products are designed for application voltages ranging from 480 volts to 38,000 volts and are used in oil and gas refining, offshore oil and gas production, petrochemical, pipeline, terminal, mining and metals, light rail traction power, electric utility, pulp and paper and other heavy industrial markets. Our product scope includes designs tested to meet both U.S. standards (ANSI) and international standards (IEC). We assist customers by providing value-added services such as spare parts, field service inspection, installation, commissioning, modification and repair, retrofit and retrofill components for existing systems and replacement circuit breakers for switchgear that is obsolete or that is no longer produced by the original manufacturer. We seek to establish long-term relationships with the end users of our systems as well as the design and construction engineering firms contracted by those end users.
References to Fiscal 2016, Fiscal 2015 and Fiscal 2014 used throughout this Annual Report relate to our fiscal years ended September 30, 2016, 2015 and 2014, respectively.
Revenues from customers located in the United States of America (U.S.) accounted for approximately 72%, 72% and 56% of our consolidated revenues for Fiscal 2016, 2015 and 2014, respectively. Revenues from customers located in Canada accounted for approximately 14%, 15% and 21% of consolidated revenues for Fiscal 2016, 2015 and 2014, respectively. Approximately 61% of our long-lived assets were located in the U.S. at September 30, 2016, with 36% of long-lived assets located in Canada and 3% of long-lived assets located in the United Kingdom (U.K.). Detailed geographic information is included in Note L of the Notes to Consolidated Financial Statements included elsewhere in this Annual Report.
In January 2014, we sold our wholly owned subsidiary Transdyn Inc. (Transdyn). We have presented the results of these operations as income from discontinued operations, net of tax, in the accompanying consolidated statements of operations. Additionally, all current and historical financial information presented in this Annual Report excludes the financial information for Transdyn or presents it as discontinued operations where applicable. For more information about this disposition, see Note N of the Notes to Consolidated Financial Statements included elsewhere in this Annual Report.
Customers and Markets
Our principal customers are sophisticated users of large amounts of electrical energy that typically require a complex combination of electrical components and systems. These customers and their industries include oil and gas refining, offshore oil and gas production, petrochemical, pipeline, terminal, mining and metals, light rail traction power, electric utility, pulp and paper and other industrial markets.
Products and services are principally sold directly to the end user or to an engineering, procurement and construction (EPC) firm on behalf of the end user. Each project is specifically engineered and manufactured to meet the exact specifications and requirements of the individual customer. Powell’s expertise is in the design and engineering, manufacturing, project management and integration of the various systems into a single custom-engineered deliverable. We market and sell our products and services, which are typically awarded in competitive bid situations, to a wide variety of customers, governmental agencies, markets and geographic regions. Contracts often represent large-scale and complex projects with an individual customer. By their nature, these projects are typically
4
nonrecurring. Thus, multiple and/or continuous projects of similar magnitude with the same customer may vary. As such, the timing of large project awards may cause material fluctuations in revenues and gross margins.
Due to the nature and timing of large projects, a significant percentage of revenues in a given period may result from one specific contract or customer. Although we could be adversely impacted by a significant reduction in business volume from a particular industry, we do not believe the loss of any specific customer would have a material adverse effect on our business. However, from time to time, an individual manufacturing facility may have significant volume from one particular customer which would be material to that facility. No customer accounted for more than 10% of our revenues in Fiscal 2016, Fiscal 2015 or Fiscal 2014.
Competition
We strive to be the supplier of choice for custom-engineered system solutions and services to a variety of customers and markets. Our activities are predominantly in the oil and gas and the electric utility industries, but also include other markets where customers need to manage, monitor and control large amounts of electrical energy. The majority of our business is in support of capital investment projects that are highly complex and competitively bid. Our customized systems are designed to meet the specifications of our customers. Each system is designed, engineered and manufactured to the specific requirements of the particular application. We consider our engineering, project management, systems integration and technical support capabilities vital to the success of our business.
We believe our products and services, integration capabilities, technical and project management strengths, application engineering expertise and specialty contracting experience, together with our responsiveness and flexibility to the needs of our customers and financial strength, give us a sustainable competitive advantage in our markets. We compete with a small number of multinational competitors that sell to a broad industrial and geographic market and with smaller, regional competitors that typically have limited capabilities and scope of supply. Our principal competitors include ABB, Eaton, General Electric Company, Schneider and Siemens. The competitive factors used during bid evaluation by our customers vary from project to project and may include technical support and application expertise, engineering and manufacturing capabilities, equipment rating, delivered value, scheduling and price. While projects are typically non-recurring, a significant portion of our business is from repeat customers and many times involves third-party EPC firms hired by the end user and with which we also have long and established relationships. Ultimately, our competitive position is dependent upon our ability to provide quality custom-engineered products, services and systems on a timely basis at a competitive price.
Backlog
Backlog represents the dollar amount of revenue that we expect to realize from work to be performed on uncompleted contracts, including new contractual agreements on which work has not begun. Our methodology for determining backlog may not be comparable to the methodology used by other companies. Orders included in our backlog are represented by customer purchase orders and contracts, which we believe to be firm. Our backlog at September 30, 2016 totaled $291.4 million compared to $441.4 million at September 30, 2015. We anticipate that approximately $228 million of Fiscal 2016 ending backlog will be fulfilled during our fiscal year ending September 30, 2017. Backlog may not be indicative of future operating results as orders in our backlog may be cancelled or modified by our customers.
Raw Materials and Suppliers
The principal raw materials used in our operations include steel, copper and aluminum and various electrical components. Material costs represented 47% and 46% of revenues in Fiscal 2016 and Fiscal 2015, respectively. Unanticipated changes in material requirements, disruptions in supplies or price increases could impact production costs and affect our consolidated results of operations.
Our supply base for certain key components and raw materials is limited. Changes in our design to accommodate similar components from other suppliers could be implemented to resolve a supply problem related to a sole-sourced component. In this circumstance, supply problems could result in delays in our ability to meet commitments to our customers. We believe that sources of supply for raw materials and components are generally sufficient, and we do not believe a shortage of materials will cause any significant adverse impact in the future. While we are not dependent on any one supplier for the majority of our raw materials, we are highly dependent on our suppliers in order to meet commitments to our customers. We have not experienced significant or unusual issues in the purchase of key raw materials or components in the past three fiscal years.
Our business is subject to the effects of changing material prices. During the last three fiscal years, we have not experienced significant price volatility for raw materials or component parts used in the production of our products. While the cost outlook for commodities used in the production of our products is not certain, we believe we can manage this volatility through contract pricing
5
adjustments, with material-cost predictive estimating and by actively pursuing internal cost reduction efforts. We did not enter into any derivative contracts to hedge our exposure to commodity price changes in Fiscal 2016, 2015 or 2014.
Employees
At September 30, 2016, we had 2,323 full-time employees located primarily in the United States, Canada and the U.K. Our employees are not represented by unions, and we believe that our relationship with our employees is good.
Intellectual Property
While we are the holder of various patents, trademarks, servicemarks, copyrights and licenses, we do not consider any individual intellectual property to be material to our consolidated business operations.
Our business is subject to a variety of risks and uncertainties, including, but not limited to, the most significant risks and uncertainties described below. Additional risks and uncertainties not known to us or not described below may also impair our business operations. If any of the following risks actually occur, our business, financial condition, cash flows and results of operations could be harmed and we may not be able to achieve our goals. This Annual Report also includes statements reflecting assumptions, expectations, projections, intentions or beliefs about future events that are intended as “forward-looking statements” under the Private Securities Litigation Reform Act of 1995 and should be read in conjunction with the discussion under “Forward-Looking Statements,” above.
Due to the cyclical nature of the oil and gas industry, our business may be adversely impacted by extended periods of low oil or gas prices or unsuccessful exploration efforts which may decrease our customers’ spending and therefore our results in the future.
Oil and gas prices have declined from 2014 levels and are expected to remain unpredictable. This decline in oil and gas prices has had a negative effect on our markets and led to the reduction of projects available and thus reduced our backlog of projects. These unfavorable commodity prices have caused oil and gas companies to change their strategies, delay and/or cancel projects. The price for oil and gas can be influenced by many factors, including global economic growth, inventory levels and supply and demand for these commodities. These factors could cause oil and gas prices to remain depressed or decrease further, which could result in a continued decrease in customer projects that could adversely impact our operations. Continued periods of reduced oil and gas prices could negatively impact our consolidated results of operations, cash flows and financial position and would likely result in operating losses and could result in impairment losses on our long-lived assets.
Economic uncertainty and financial market conditions may impact our customer base, suppliers and backlog.
Various factors drive demand for our products and services, including the price and demand for oil and gas, capital expenditures, economic forecasts and financial markets. Uncertainty regarding these factors could impact our customers and severely impact the demand for projects and orders for our products and services. If one or more of our suppliers or subcontractors experiences difficulties that result in a reduction or interruption in supply to us, or they fail to meet our manufacturing requirements, our business could be adversely impacted until we are able to secure alternative sources. Additionally, the loss of significant volume from one particular customer at one of our facilities could materially impact that facility. Furthermore, our ability to maintain or expand our business would be limited in the future if we are unable to maintain or increase our bonding capacity or our credit facility on favorable terms or at all. These disruptions could lead to reduced demand for our products and services, could materially impact our business, financial condition, cash flows and results of operations and could potentially impact the trading price of our common stock.
Our stock price could decline or fluctuate significantly due to unforeseen circumstances. These fluctuations may cause our stockholders to incur losses.
Our stock price could fluctuate or decline from quarter to quarter due to a variety of factors including, but not limited to, the timing and cancellation of projects, changes in our estimated costs to complete projects, or failure of our operating results to meet the expectations of securities analysts or investors which could reduce investor confidence. Additionally, we are required to assess and report on our internal controls each year. Findings of inadequate or failed internal controls could reduce investor confidence in the reliability of our financial information. These factors could adversely affect our operating results and the trading price of our common stock could decline significantly.
6
Our backlog is subject to unexpected adjustments and cancellations and, therefore, may not be a reliable indicator of our future earnings.
We have a backlog of uncompleted contracts. Backlog represents the dollar amount of revenue that we expect to realize from work to be performed on uncompleted contracts, including new contractual agreements on which work has not begun. From time to time, projects are cancelled that appeared to have a high certainty of going forward at the time the order was recorded. In the event of a project cancellation, or modification, we may be reimbursed for certain costs but may not have a contractual right to the total revenue reflected in our backlog. In addition to our being unable to recover certain direct costs, cancelled projects may also result in additional unrecoverable costs due to the underutilization of our assets. Accordingly, the amounts recorded in backlog may not be a reliable indicator of our future earnings.
The use of percentage-of-completion accounting on our fixed-price contracts could result in volatility in our results of operations.
As discussed in “Management’s Discussion and Analysis of Financial Condition and Results of Operations — Critical Accounting Policies and Estimates” and in the Notes to Consolidated Financial Statements included elsewhere in this Annual Report, the majority of our revenues are recognized on the percentage-of-completion method of accounting. Under the percentage-of-completion method of accounting, revenues are recognized as work is performed and costs are incurred. The revenue earned to date is calculated by multiplying the total contract price by the percentage of performance to date, which is based on total costs or total labor dollars incurred to date compared to the total estimated costs or total labor dollars estimated at completion. The method used to determine the percentage of completion is typically the cost method, unless the labor method is a more accurate method of measuring the progress of the project. Application of the percentage-of-completion method of accounting requires the use of estimates of costs to be incurred for the performance of the contract. The cost estimation process is based upon the professional knowledge and experience of our management teams, engineers, project managers and financial professionals. Contract losses are recognized in full when determined, and estimates of revenue and cost to complete are adjusted based on ongoing reviews of estimated contract performance. Previously recorded estimates are adjusted as the project progresses and circumstances change. In certain circumstances, it is possible that such adjustments to costs and revenues could have a significant impact on our operating results for any fiscal quarter or year.
The majority of our contracts contain performance obligations that may subject us to penalties or additional liabilities.
Most of our customer contracts have schedule and performance obligation clauses that, if we fail to meet them, could subject us to penalty provisions, liquidated damages or claims against our outstanding letters of credit or performance bonds. In addition, some customer contracts stipulate protection against our gross negligence or willful misconduct. Each individual contract defines the conditions under which the customer may make a claim against us. It is possible that adjustments arising from such claims, or our failure to manage our contract risk, may not be covered by insurance and could have a significant impact on our operating results for any fiscal quarter or year.
Fluctuations in the price and supply of materials used to manufacture our products may reduce our profits and could materially impact our ability to meet commitments to our customers.
Our material costs represented 47% of our consolidated revenues for Fiscal 2016. Unanticipated increases in raw material requirements, changes in supplier availability or price increases could increase production costs and adversely affect profitability as fixed-price contracts may prohibit our ability to charge the customer for the increase in raw material prices. We purchase a wide variety of materials and component parts from various suppliers to manufacture our products, including steel, aluminum, copper and various components. Our supply base for certain key components and raw materials is limited and may come from a single supplier. If we are unable to obtain key components and raw materials from these suppliers, the key components and raw materials may not be readily available from other suppliers or available with acceptable terms. Our success depends on our ability to meet customer commitments and could be negatively impacted if a supplier experiences a disruption or discontinuance in their operations. The time and effort associated with the selection and qualification of a new supplier and changes in our design to accommodate similar components from other suppliers could be significant. Additionally, we rely on certain competitors for key materials used in our products. This could put us at risk if the relationships change or become adversarial.
Our industry is highly competitive.
Some of our competitors are significantly larger and have substantially greater resources around the world such as engineering, manufacturing and marketing resources. Competition in the industry depends on a number of factors, including the number of projects available, technical ability, production capacity, location and price. Certain of our competitors may have lower cost structures and may, therefore, be able to provide their products or services at lower prices than we are able to provide. Similarly, we cannot be certain that we will be able to maintain or enhance our competitive position within our industry, maintain our customer base at current levels, increase our customer base or continue to provide technologically superior products at a competitive price. New companies may enter the markets in which we compete, or industry consolidation may occur, further increasing competition in our markets. Our
7
failure to compete effectively could adversely affect future sales and have a material impact on our business model, financial position and our consolidated results of operations.
Our operations could be adversely impacted by the effects of government regulations, including regulations related to conflict minerals.
Changes in policy, laws or regulations, including oil and gas exploration and development activities and decisions by customers and other industry participants could reduce demand for our products and services, which would have a negative impact on our operations. Various regulations have been implemented around the world related to safety and certification requirements applicable to oil and gas drilling and production activities and we cannot predict whether operators will be able to satisfy these requirements. Further, we cannot predict future changes in any country in which we operate and how those changes may affect our ability to perform projects in those regions.
The Dodd-Frank Wall Street Reform and Consumer Protection Act requires disclosure of use of "conflict" minerals mined from the Democratic Republic of Congo and adjoining countries and our efforts to prevent the use of such minerals. We may incur significant costs associated with the compliance with SEC reporting and due diligence requirements. In our industry, conflict minerals are most commonly found in metals. As there may be only a limited number of suppliers offering "conflict free" metals, we cannot be sure that we will be able to obtain necessary metals in sufficient quantities or at competitive prices. Also, we may face challenges with our customers and suppliers if we are unable to sufficiently verify that the metals used in our products are "conflict free.”
Changes in tax laws and regulations may change our effective tax rate and could have a material effect on our financial results.
We are subject to income taxes in the United States and numerous foreign jurisdictions. A change in tax laws, deductions or credits, treaties or regulations, or their interpretation, in the countries in which we operate could result in a higher tax rate on our pre-tax income, which could have a material impact on our net income and cash flows from operations. We are regularly under audit by tax authorities, and our tax estimates and tax positions could be materially affected by many factors including the final outcome of tax audits and related litigation, the introduction of new tax accounting standards, legislation, regulations and related interpretations, our global mix of earnings, the extent to which deferred tax assets are realized and changes in uncertain tax positions. A significant increase in our tax rate could have a material effect on our profitability.
Our international operations expose us to risks that are different from, or possibly greater than, the risks we are exposed to domestically and may adversely affect our operations.
Revenues with customers located outside of the U.S., including sales from our operations in the U.K. and Canada, accounted for approximately 28% of our consolidated revenues in Fiscal 2016. While our manufacturing facilities are located in developed countries with historically stable operating and fiscal environments, our consolidated results of operations, cash flows and financial condition could be adversely affected by a number of factors, including: political and economic instability; social unrest, acts of terrorism, force majeure, war or other armed conflict; the pending exit of the U.K. from the European union; inflation; currency fluctuations, devaluations and conversion restrictions; governmental activities that limit or disrupt markets, restrict payments or limit the movement of funds and trade restrictions or economic embargoes imposed by the U.S. or other countries. Additionally, the compliance with foreign and domestic import and export regulations and anti-corruption laws, such as the U.S. Foreign Corrupt Practices Act, or similar laws of other jurisdictions outside the United States, could adversely impact our ability to compete for contracts in such jurisdictions. Moreover, the violation of such laws or regulations could result in severe penalties including monetary fines, criminal proceedings and suspension of export privileges.
Our operating results may vary significantly from quarter to quarter.
Our quarterly results may be materially and adversely affected by a number of factors, including: changes in estimates relating to revenues, costs, project scheduling; the timing and volume of work under new agreements; changes in existing customer schedules; general economic conditions; the spending patterns of customers; variations in the margins of projects performed during any particular quarter; losses experienced in our operations not otherwise covered by insurance; a change in the demand or production of our products and our services caused by severe weather conditions; a change in the mix of our customers, contracts and business; increases in design and manufacturing costs; the ability of customers to pay their invoices owed to us and disagreements with customers related to project performance on delivery. Accordingly, our operating results in any particular quarter may vary significantly and may not be indicative of future results.
8
The departure of key personnel could disrupt our business.
We depend on the continued efforts of our executive officers, senior management and other key professionals. We cannot be certain that any individual will continue in such capacity for any particular period of time. The loss of key personnel, or the inability to hire and retain qualified employees, could negatively impact our ability to perform and manage our business.
Our business requires skilled labor and we may be unable to attract and retain qualified employees.
Our ability to maintain our productivity and profitability may be limited by our ability to employ, train and retain personnel necessary to meet our requirements. We may experience shortages of qualified personnel such as engineers, project managers and select skilled trades. We cannot be certain that we will be able to maintain an adequate skilled labor force or key technical personnel necessary to operate efficiently and to support our growth strategy and operations. We cannot be certain that our labor expenses will not increase as a result of a shortage in the supply of skilled and technical personnel. Labor shortages or increased labor costs could impair our ability to maintain our business, meet customer commitments or grow our revenues, and may adversely impact our results of operations.
Actual and potential claims, lawsuits and proceedings could ultimately reduce our profitability and liquidity and weaken our financial condition.
We could be named as a defendant in future legal proceedings that claim damages in connection with the operation of our business. Most of the actions against us arise out of the normal course of our performing services or manufacturing equipment. From time to time, we may be a plaintiff in legal proceedings against customers in which we seek to recover payment of contractual amounts due to us, as well as claims for increased costs incurred by us. When appropriate, we establish provisions against certain legal exposures, and we adjust such provisions from time to time according to ongoing developments related to each exposure, as well as any potential recovery from our insurance, if applicable. If, in the future, our assumptions and estimates related to such exposures prove to be inadequate or wrong, or our insurance coverage is insufficient, our consolidated results of operations, cash flows and financial condition could be adversely affected. In addition, claims, lawsuits and proceedings may harm our reputation or divert management resources away from operating our business.
Quality problems with our products could harm our reputation and erode our competitive position.
The success of our business depends upon the quality of our products and our relationships with customers. In the event that one of our products fails to meet our customers' standards or to operate effectively, our reputation could be harmed, which would adversely affect our marketing and sales efforts. We provide warranties to our customers for our products and the cost to satisfy customer warranty claims, which may include, among other things, costs for the repair or replacement of products, could adversely impact our results of operations.
A failure in our business systems or cyber security attacks on any of our facilities, or those of third parties, could adversely affect our business and our internal controls.
Our organization is dependent upon the proper functioning of our business systems that support our production, engineering, human resources, estimating, finance, and project management functions. If any of our financial, operational, or other data processing systems fail or have other significant shortcomings due to natural disaster, power loss or telecommunications failures or other similar events, our business or results of operations could be adversely affected. In addition, despite implementation of security measures, our business systems may be vulnerable to computer viruses, cyber-attacks and other unauthorized access; and these security breaches could result in a disruption to our operations or in legal claims or proceedings. A material network breach of our business systems could involve the theft of intellectual property, financial data, employee data, or customer data which may be used by competitors. We rely on third-party systems which could also suffer operational system failure or cyber-attacks. Any of these occurrences could disrupt our business, result in potential liability or reputational damage or otherwise have an adverse effect on our business or results of operations.
We carry insurance against many potential liabilities, but our management of risk may leave us exposed to unidentified or unanticipated risks.
Although we maintain insurance policies with respect to our related exposures, including certain casualty, property, business interruption, self-insured medical and dental programs, these policies contain deductibles, self-insured retentions and limits of coverage. We estimate our liabilities for known claims and unpaid claims and expenses based on information available as well as projections for claims incurred but not reported. However, insurance liabilities, some of which are self-insured, are difficult to estimate due to various factors. If any of our insurance policies or programs are not effective in mitigating our risks, we may incur losses that are not covered by our insurance policies, subject to deductibles, or that exceed our estimated accruals or our insurance
9
policy limits and could adversely impact our consolidated results of operations, cash flows and financial position. In addition, we may not be able to continue to obtain insurance at commercially reasonable rates or may be faced with liabilities not covered by insurance such as, but not limited to, environmental contamination or terrorist attacks.
Changes in and compliance with environmental laws could adversely impact our financial results.
Private lawsuits or enforcement actions by federal, state, provincial or foreign regulatory agencies may materially increase our costs. Certain environmental laws may make us potentially liable for the remediation of contamination at or emanating from our properties or facilities. Although we seek to obtain indemnities against liabilities relating to historical contamination at the facilities we own or operate, we cannot provide any assurance that we will not incur liabilities relating to the remediation of potential contamination, including contamination we did not cause.
Technological innovations by competitors may make existing products and production methods obsolete.
All of the products that we manufacture and sell depend upon the best available technology for success in the marketplace. The industries in which we operate are characterized by intense competition and are highly sensitive to technological innovation and customer requirements. It is possible for competitors (both domestic and international) to develop products or production methods that will make current products or methods obsolete or at a minimum hasten their obsolescence; therefore, we cannot be certain that our competitors will not develop the expertise, experience and resources to provide products and services that are superior in both price and quality. Our future success will depend, in part, on our ability to anticipate and offer products that meet changing customer specifications. Failure to successfully develop new products, or to enhance existing products, could result in the loss of existing customers to competitors, the inability to attract new business or an overall reduction in our competitive position, any of which may adversely affect our business or results of operations.
Catastrophic events could disrupt our business.
The occurrence of catastrophic events, ranging from natural disasters to health epidemics, to acts of war and terrorism, could disrupt or delay our ability to complete projects for our customers and could potentially expose us to third-party liability claims. Such events may or may not be fully covered by our various insurance policies, may be subject to deductibles or exceed coverage limits. In addition, such events could result in temporary or long-term delays and/or cancellations of orders for raw materials from our suppliers which could impact our project execution. These situations are outside our control and could have a significant adverse impact on our consolidated results of operations, cash flows and financial position.
Unforeseen difficulties with expansions, relocations or consolidations of existing facilities could adversely affect our operations.
From time to time we may decide to enter new markets, build additional facilities, expand our existing facilities or relocate or consolidate one or more of our operations. Increased costs and production delays arising from the staffing, relocation, expansion or consolidation of our facilities could adversely affect our operations and may adversely impact our profitability.
Acquisitions involve a number of risks.
Our strategy includes the pursuit of growth and product diversification through the acquisition of companies or assets that will enable us to expand our geographic coverage and product and service offerings. We periodically review potential acquisitions; however, we may be unable to implement this strategy. Acquisitions involve certain risks, including difficulties in the integration of operations and systems; failure to realize cost savings; the termination of relationships by key personnel and customers of the acquired company and a failure to add additional employees to handle the increased volume of business. Additionally, financial and accounting challenges and complexities in areas such as valuation, tax planning, treasury management and financial reporting from our acquisitions pose risks to our strategy. Due diligence may not reveal all risks and challenges associated with our acquisitions. Companies that we acquire may not achieve revenues, profitability or cash flows that we expected, or that ultimately justify the investment. It is possible that impairment charges resulting from the overpayment for an acquisition may negatively impact our results of operations. Financing for acquisitions may require us to obtain additional equity or debt financing which may not be available on attractive terms, if at all. Any failure to successfully complete or successfully integrate acquisitions could have a material adverse effect on our business, consolidated results of operations and financial condition.
Item 1B. Unresolved Staff Comments
10
We own our principal manufacturing and fabrication facilities and periodically lease smaller facilities throughout the United States, Canada and the U.K. Our facilities are generally located in areas that are readily accessible to materials and labor pools and are maintained in good condition. These facilities are expected to meet our needs for the foreseeable future.
Our principal locations as of September 30, 2016, are as follows:
|
|
|
|
|
|
|
|
|
||||||||
|
Location |
Description |
|
|
Acres |
|
|
Approximate Square Footage |
|
|
|
|||||
|
Houston, TX |
Corporate office and manufacturing facility |
|
|
|
21.4 |
|
|
|
428,515 |
|
|
|
|
||
|
Houston, TX |
Office and manufacturing facility |
|
|
|
53.4 |
|
|
|
290,554 |
|
|
|
|
||
|
Houston, TX |
Office, fabrication facility and yard |
|
|
|
63.3 |
|
|
|
82,320 |
|
|
|
|
||
|
North Canton, OH |
Office and manufacturing facility |
|
|
|
8.0 |
|
|
|
115,200 |
|
|
|
|
||
|
Northlake, IL |
Office and manufacturing facility |
|
|
|
10.0 |
|
|
|
103,500 |
|
|
|
|
||
|
Bradford, U.K. |
Office and manufacturing facility |
|
|
|
7.9 |
|
|
|
129,200 |
|
|
|
|
||
|
Acheson, Alberta, Canada |
Office and manufacturing facility |
|
|
|
20.1 |
|
|
|
330,168 |
|
|
|
|
||
In Fiscal 2015, we completed the expansion of our Acheson, Alberta, Canada facility. The expansion cost approximately $26 million, funded by cash on hand, and increased the manufacturing capacity of that facility by approximately 144,000 square feet.
We are involved in various legal proceedings, claims and other disputes arising from our commercial operations, projects, employees and other matters which, in general, are subject to uncertainties and in which the outcomes are not predictable. These legal proceedings and claims may not be covered by our insurance policies or may exceed our policy limits. Although we can give no assurances about the outcome of pending legal proceedings, claims and other disputes, we do not believe that the ultimate conclusion of these disputes could materially affect our results of operations, cash flow and financial position.
Item 4. Mine Safety Disclosures
Not applicable.
11
Item 5. Market for Registrant’s Common Equity, Related Stockholder Matters and Issuer Purchases of Equity Securities
Price Range of Common Stock
Our common stock trades on the NASDAQ Global Market (NASDAQ) under the symbol “POWL.” The following table sets forth, for the periods indicated, the high and low sales prices per share as reported on the NASDAQ for our common stock.
|
|
High |
|
|
Low |
|
||
|
Fiscal 2015: |
|
|
|
|
|
|
|
|
First Quarter |
$ |
51.33 |
|
|
$ |
38.12 |
|
|
Second Quarter |
|
49.93 |
|
|
|
31.54 |
|
|
Third Quarter |
|
39.45 |
|
|
|
32.54 |
|
|
Fourth Quarter |
|
35.44 |
|
|
|
25.60 |
|
|
Fiscal 2016: |
|
|
|
|
|
|
|
|
First Quarter |
$ |
35.89 |
|
|
$ |
25.99 |
|
|
Second Quarter |
|
30.41 |
|
|
|
23.00 |
|
|
Third Quarter |
|
39.47 |
|
|
|
26.22 |
|
|
Fourth Quarter |
|
41.10 |
|
|
|
34.40 |
|
As of December 2, 2016, the closing price of our common stock on the NASDAQ was $43.38 per share. As of December 2, 2016, there were 405 stockholders of record of our common stock. All common stock held in street names are recorded in the Company’s stock register as being held by one stockholder.
See “Part III, Item 12. Security Ownership of Certain Beneficial Owners and Management and Related Stockholder Matters” of this Annual Report for information regarding securities authorized for issuance under our equity compensation plans.
Dividend Policy
In November 2013, our Board of Directors (the Board) elected to begin the payments of quarterly cash dividends. We paid $11.8 million and $12.4 million in dividends in Fiscal 2016 and Fiscal 2015, respectively. The Board anticipates declaring cash dividends in future quarters; however, there is no assurance as to future dividends or their amounts because they depend on future earnings, capital requirements and financial condition.
12
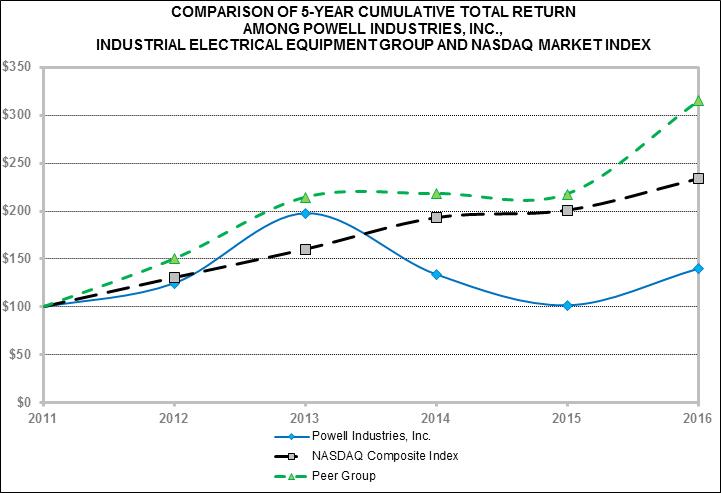
The following Performance Graph and related information shall not be deemed “soliciting material” or to be “filed” with the Securities and Exchange Commission, nor shall such information be incorporated by reference into any future filing under the Securities Act of 1933 or Securities Act of 1934, each as amended, except to the extent that we specifically incorporate it by reference into such filing.
The following graph compares, for the period from October 1, 2011 to September 30, 2016, the cumulative stockholder return on our common stock with the cumulative total return on the NASDAQ Market Index and the Industrial Electrical Equipment Group (a select group of peer companies – Altra Industrial Motion Corp.; Ameresco, Inc.; AZZ Inc.; Belden Inc.; Daktronics Inc.; Electro Scientific Industries, Inc.; EnerSys; Franklin Electric Co, Inc.; GrafTech International Ltd; Littelfuse Inc.; LSI Industries Inc.; Preformed Line Products; A O Smith Corporation and Woodward, Inc.). The comparison assumes that $100 was invested on October 1, 2011, in our common stock, the NASDAQ Market Index and the Industrial Electrical Equipment Group, and that all dividends were re-invested. The stock price performance reflected on the following graph is not necessarily indicative of future stock price performance.
13
Item 6. Selected Financial Data
The selected financial data shown below for the past five years was derived from our audited financial statements, adjusted for discontinuing operations. The historical results are not necessarily indicative of the operating results to be expected in the future. The selected financial data should be read in conjunction with “Part II, Item 7. Management’s Discussion and Analysis of Financial Condition and Results of Operations” and the consolidated financial statements and related notes included elsewhere in this Annual Report.
|
|
Years ended September 30, |
|
|||||||||||||||||
|
|
2016 |
|
|
2015 |
|
|
2014 |
|
|
2013 |
|
|
2012 |
|
|||||
|
Statement of Operations: |
(In thousands, except per share data) |
|
|||||||||||||||||
|
Revenues |
$ |
565,243 |
|
|
$ |
661,858 |
|
|
$ |
647,814 |
|
|
$ |
640,867 |
|
|
$ |
690,741 |
|
|
Cost of goods sold |
|
459,038 |
|
|
|
553,597 |
|
|
|
522,340 |
|
|
|
502,375 |
|
|
|
557,938 |
|
|
Gross profit |
|
106,205 |
|
|
|
108,261 |
|
|
|
125,474 |
|
|
|
138,492 |
|
|
|
132,803 |
|
|
Selling, general and administrative expenses |
|
74,924 |
|
|
|
76,801 |
|
|
|
87,756 |
|
|
|
79,707 |
|
|
|
76,961 |
|
|
Research and development expenses |
|
6,731 |
|
|
|
6,980 |
|
|
|
7,608 |
|
|
|
7,615 |
|
|
|
6,286 |
|
|
Amortization of intangible assets |
|
352 |
|
|
|
435 |
|
|
|
779 |
|
|
|
1,659 |
|
|
|
2,599 |
|
|
Restructuring and separation expenses |
|
8,441 |
|
|
|
3,397 |
|
|
|
— |
|
|
|
3,927 |
|
|
|
— |
|
|
Operating income |
|
15,757 |
|
|
|
20,648 |
|
|
|
29,331 |
|
|
|
45,584 |
|
|
|
46,957 |
|
|
Gain on settlement |
|
— |
|
|
|
— |
|
|
|
— |
|
|
|
(1,709 |
) |
|
|
— |
|
|
Other income |
|
(2,029 |
) |
|
|
(2,402 |
) |
|
|
(1,522 |
) |
|
|
— |
|
|
|
— |
|
|
Interest expense (net) |
|
(7 |
) |
|
|
59 |
|
|
|
165 |
|
|
|
167 |
|
|
|
158 |
|
|
Income from continuing operations before income taxes |
|
17,793 |
|
|
|
22,991 |
|
|
|
30,688 |
|
|
|
47,126 |
|
|
|
46,799 |
|
|
Income tax provision (1) |
|
2,283 |
|
|
|
13,552 |
|
|
|
11,068 |
|
|
|
7,387 |
|
|
|
18,056 |
|
|
Income from continuing operations |
|
15,510 |
|
|
|
9,439 |
|
|
|
19,620 |
|
|
|
39,739 |
|
|
|
28,743 |
|
|
Income from discontinued operations, net of tax |
|
— |
|
|
|
— |
|
|
|
9,604 |
|
|
|
2,337 |
|
|
|
914 |
|
|
Net income |
$ |
15,510 |
|
|
$ |
9,439 |
|
|
$ |
29,224 |
|
|
$ |
42,076 |
|
|
$ |
29,657 |
|
|
|
|
|
|
|
|
|
|
|
|
|
|
|
|
|
|
|
|
|
|
|
Earnings per share: |
|
|
|
|
|
|
|
|
|
|
|
|
|
|
|
|
|
|
|
|
Continuing operations |
$ |
1.36 |
|
|
$ |
0.80 |
|
|
$ |
1.63 |
|
|
$ |
3.32 |
|
|
$ |
2.43 |
|
|
Discontinued operations |
|
— |
|
|
|
— |
|
|
|
0.80 |
|
|
|
0.20 |
|
|
|
0.07 |
|
|
Basic earnings per share |
$ |
1.36 |
|
|
$ |
0.80 |
|
|
$ |
2.43 |
|
|
$ |
3.52 |
|
|
$ |
2.50 |
|
|
|
|
|
|
|
|
|
|
|
|
|
|
|
|
|
|
|
|
|
|
|
Continuing operations |
$ |
1.36 |
|
|
$ |
0.79 |
|
|
$ |
1.62 |
|
|
$ |
3.32 |
|
|
$ |
2.41 |
|
|
Discontinued operations |
|
— |
|
|
|
— |
|
|
|
0.80 |
|
|
|
0.19 |
|
|
|
0.08 |
|
|
Diluted earnings per share |
$ |
1.36 |
|
|
$ |
0.79 |
|
|
$ |
2.42 |
|
|
$ |
3.51 |
|
|
$ |
2.49 |
|
|
|
|
|
|
|
|
|
|
|
|
|
|
|
|
|
|
|
|
|
|
|
(1) For an explanation of the effective tax rate for the last three fiscal years, see Note H of the Notes to Consolidated Financial |
|
||||||||||||||||||
|
Statements included elsewhere in this Annual Report. |
|
||||||||||||||||||
|
|
Years ended September 30, |
|
|||||||||||||||||
|
|
2016 |
|
|
2015 |
|
|
2014 |
|
|
2013 |
|
|
2012 |
|
|||||
|
Balance Sheet Data: |
(In thousands) |
|
|||||||||||||||||
|
Cash and cash equivalents |
$ |
97,720 |
|
|
$ |
43,569 |
|
|
$ |
103,118 |
|
|
$ |
107,411 |
|
|
$ |
89,669 |
|
|
Property, plant and equipment, net |
|
144,977 |
|
|
|
154,594 |
|
|
|
156,896 |
|
|
|
144,495 |
|
|
|
78,489 |
|
|
Total assets |
|
462,516 |
|
|
|
468,824 |
|
|
|
541,443 |
|
|
|
530,903 |
|
|
|
448,312 |
|
|
Long-term debt, including current maturities |
|
2,400 |
|
|
|
2,800 |
|
|
|
3,200 |
|
|
|
3,616 |
|
|
|
4,355 |
|
|
Total stockholders' equity |
|
335,317 |
|
|
|
333,262 |
|
|
|
371,097 |
|
|
|
355,226 |
|
|
|
310,103 |
|
|
Total liabilities and stockholders' equity |
|
462,516 |
|
|
|
468,824 |
|
|
|
541,443 |
|
|
|
530,903 |
|
|
|
448,312 |
|
|
Dividends paid on common stock |
|
11,845 |
|
|
|
12,358 |
|
|
|
11,998 |
|
|
|
— |
|
|
|
— |
|
14
Item 7. Management’s Discussion and Analysis of Financial Condition and Results of Operations
The following discussion should be read in conjunction with the accompanying consolidated financial statements and related notes. Any forward-looking statements made by or on our behalf are made pursuant to the safe-harbor provisions of the Private Securities Litigation Reform Act of 1995. Readers are cautioned that such forward-looking statements involve risks and uncertainties and the actual results may differ materially from those projected in the forward-looking statements. For a description of the risks and uncertainties, please see “Cautionary Statement Regarding Forward-Looking Statements; Risk Factors” and “Item 1A. Risk Factors” included elsewhere in this Annual Report.
Overview
We develop design, manufacture and service custom-engineered equipment and systems for the distribution, control and monitoring of electrical energy. Headquartered in Houston, Texas, we serve the oil and gas refining, offshore oil and gas production, petrochemical, pipeline, terminal, mining and metals, light rail traction power, electric utility, pulp and paper and other industrial markets. Revenues and costs are primarily related to custom engineered-to-order equipment and systems and are accounted for under percentage-of-completion accounting which precludes us from providing detailed price and volume information. Our backlog includes various projects that take a number of months to produce.
The markets in which we participate are capital intensive and cyclical in nature. Cyclicality is predominantly driven by customer demand, global economic conditions and anticipated environmental, safety or regulatory changes that affect the manner in which our customers proceed with capital investments. Our customers analyze various factors including the demand and price for oil, gas and electrical energy, the overall economic and financial environment, governmental budgets, regulatory actions and environmental concerns. These factors influence the release of new capital projects by our customers, which are traditionally awarded in competitive bid situations. Scheduling of projects is matched to the customer requirements and projects typically take a number of months to produce. Schedules may change during the course of any particular project and our operating results can therefore be impacted by factors outside of our control. Due to the decline in oil and gas prices from 2014 levels, many of our customers have reduced their capital budgets and cut costs, and in certain instances have delayed or cancelled projects that we were pursuing.
Our strategy in Canada has been to replicate our project-based integration model which allows for the design, fabrication, integration and testing of our products at a single location. This strategic initiative has presented challenges for our Canadian operations in prior years, resulting in inefficiencies that led to higher operating costs, gross margin deterioration and operating losses. We took various actions in Canada and have seen improvements in our operational efficiencies during Fiscal 2016. However, the depressed oil and gas market conditions will likely have a negative impact on our Canadian operations for the foreseeable future.
During Fiscal 2015, our consolidated operating results were negatively impacted by operational inefficiencies resulting from increased volume and project scheduling delays. Our inability to meet contractual commitments on existing projects, as well as delays in customer construction schedules, negatively impacted the timing and costs related to project execution. Our operating results were negatively impacted by the timing and resolution of change orders, project close-out and resolution of potential liquidated damage claims, all of which impacted gross margins during the period in which these items are resolved with our customers.
During Fiscal 2016, continued weakness in the oil and gas markets caused further declines in the number and size of projects leading to a decrease in revenues and backlog of projects. In response to our reduced project backlog, we have taken steps to reduce our cost structure, restructure our senior management team and align our salaried and hourly workforce with future production requirements.
On January 15, 2014, we sold our wholly-owned subsidiary Transdyn to a global provider of electronic toll collection systems, headquartered in Vienna, Austria. The purchase price from the sale of this subsidiary totaled $16.0 million, subject to working capital adjustments. We received cash of $14.4 million and the remaining $1.6 million was placed into an escrow account and released to us in July 2015. We have presented the results of these operations as income from discontinued operations, net of tax, in the consolidated statements of operations for all periods presented. Accordingly, we have removed Transdyn from the Results of Operations discussions below.
Results of Operations
Twelve Months Ended September 30, 2016 Compared to Twelve Months Ended September 30, 2015
Revenue and Gross Profit
Revenues decreased 15%, or $96.6 million, to $565.2 in Fiscal 2016, compared to Fiscal 2015, primarily due to the continued decrease in our project backlog as we continue to see lower demand from our customers in the oil and gas markets. Domestic revenues decreased 15%, or $69.4 million, to $405.3 million and international revenues decreased 15%, or $27.2 million, to $159.9 million in
15
Fiscal 2016, compared to Fiscal 2015. These decreases are due to the overall reduction in revenues year over year primarily driven by the decline in backlog resulting from lower demand from our customers in the oil and gas markets. Revenues from commercial and industrial customers decreased 20%, or $105.4 million, to $419.1 million in Fiscal 2016, compared to Fiscal 2015, primarily from lower demand from our customers in the oil and gas markets. Revenues from public and private utilities increased 20%, or $16.8 million, to $101.9 million in Fiscal 2016, compared to Fiscal 2015. Revenues from municipal and transit projects decreased 15%, or $8.0 million, to $44.2 million in Fiscal 2016, compared to Fiscal 2015.
Gross profit decreased 2%, or $2.1 million, to $106.2 million in Fiscal 2016, compared to Fiscal 2015. Gross profit as a percentage of revenues increased to 19% in Fiscal 2016 compared to 16% in Fiscal 2015, primarily due to improvements in our international operations. The improvements in gross profit and gross profit as a percentage of revenues were primarily due to improved efficiencies in project execution at our Canadian operations as the implementation of our project-based integration model has been completed in Canada. Our Canadian operations have also overcome the operational challenges and cost overruns that occurred in previous years from their expansion and relocation into our new Canadian facility. Additionally, gross profit at our United Kingdom (U.K.) operations improved due to project execution. The increase in gross profit from our international operations was partially offset by a decline in gross profit from our domestic operations as margins were negatively impacted primarily by our reduced volume as a result of weak oil and gas market conditions and cost overruns related to a large U.S.-based transit project.
Selling, General and Administrative Expenses
Selling, general and administrative expenses decreased 2%, or $1.9 million, to $74.9 million in Fiscal 2016, compared to Fiscal 2015. Selling, general and administrative expenses, as a percentage of revenues, increased slightly to 13% in Fiscal 2016 compared to 12% in Fiscal 2015, primarily due to the reduction in revenue year over year and the reduction in personnel as a result of the restructuring efforts discussed below.
Restructuring and Separation Expenses
In Fiscal 2016, we incurred $8.4 million in separation and restructuring costs, compared to $3.4 million in Fiscal 2015. This increase in Fiscal 2016 was primarily due to separation costs we incurred from our continued efforts to align our workforce with future production requirements, the departure of our former Chief Executive Officer in December 2015, as well as additional costs related to a leased Canadian facility that we exited in the third quarter of Fiscal 2015 and that has now been sublet through the remaining term of the lease.
Other Income
We recorded other income of $2.0 million in Fiscal 2016, compared to $2.4 million in Fiscal 2015. The $2.0 million in Fiscal 2016 was the amortization of the deferred gain from the amended supply agreement, discussed in Note E of the Notes to Consolidated Financial Statements. In Fiscal 2015, in addition to the amortization of the gain from the amended supply agreement, we also recorded a $0.4 million death benefit received from our company-owned life insurance policy.
Income Tax Provision
Our provision for income taxes was $2.3 million in Fiscal 2016, compared to $13.6 million in Fiscal 2015. The effective tax rate for Fiscal 2016 was 13% compared to an effective tax rate of 59% for Fiscal 2015. The effective tax rate for Fiscal 2016 was favorably impacted by $1.4 million due to the lower statutory tax rates in the U.K. and Canada and the relative amounts of income earned in those jurisdictions, as well as the utilization of net operating loss carryforwards of $1.9 million in Canada that are fully reserved with a valuation allowance. Additionally, the effective tax rate for Fiscal 2016 was favorably impacted by a $0.8 million discrete item recorded in the first quarter of Fiscal 2016 related to the retroactive reinstatement of the Research and Development Tax Credit (R&D Tax Credit) for the previously expired period from January 1, 2015 to September 30, 2015. The effective tax rate in Fiscal 2015 was above the combined U.S. federal and state statutory rate as no tax benefit was recorded against Canadian pre-tax losses due to the $9.0 million valuation allowance recorded in Fiscal 2015, partially offset by the resolution of an IRS audit and the retroactive reinstatement of the R&D Tax Credit for the second through fourth quarters of Fiscal 2014 (see Note H of the Notes to Consolidated Financial Statements included elsewhere in this Annual Report).
Net Income
In Fiscal 2016, we recorded net income of $15.5 million, or $1.36 per diluted share, which increased from net income of $9.4 million, or $0.79 per diluted share that we recorded in Fiscal 2015. This increase in net income was due to the reduction in income tax provision in Fiscal 2016 compared to Fiscal 2015, which was favorably impacted by the income from our Canadian and U.K. operations in Fiscal 2016 and the utilization of net operating loss carryforwards discussed above.
16
Our backlog includes various projects, some of which are petrochemical, oil and gas construction and transportation infrastructure projects which take a number of months to produce. The order backlog at September 30, 2016 was $291.4 million, compared to $441.4 million at September 30, 2015. New orders placed in Fiscal 2016 totaled $417.5 million, compared to $606.8 million in Fiscal 2015. This decrease in orders was primarily due to lower demand from our customers in the oil and gas markets.
Twelve Months Ended September 30, 2015 Compared to Twelve Months Ended September 30, 2014
Revenue and Gross Profit
Revenues increased 2%, or $14.0 million, to $661.9 million in Fiscal 2015, primarily due to the increase in domestic revenues. Domestic revenues increased 30%, or $109.6 million, to $474.7 million in Fiscal 2015 primarily due to our production efforts on various large petrochemical projects awarded in Fiscal 2014. International revenues decreased 34%, or $95.6 million, to $187.2 million in Fiscal 2015 primarily due to the substantial completion of several large projects for both the Canadian market and the U.S. export projects. Revenues from commercial and industrial customers increased $50.0 million to $524.5 million in Fiscal 2015. Revenues from public and private utilities decreased $41.9 million to $85.1 million in Fiscal 2015. Revenues from municipal and transit projects increased $5.9 million to $52.2 million in Fiscal 2015.
Gross profit decreased 14%, or $17.2 million, to $108.3 million in Fiscal 2015. Gross profit as a percentage of revenues decreased to 16% in Fiscal 2015 compared to 19% in Fiscal 2014. Our gross profit and gross profit as a percentage of revenues decreased in Fiscal 2015 compared to Fiscal 2014, primarily due to inefficiencies resulting from our production efforts and incremental costs required to maintain our customer’s schedules, as well as the overall mix of project types.
Selling, General and Administrative Expenses
Selling, general and administrative expenses decreased by $11.0 million to $76.8 million in Fiscal 2015 compared to Fiscal 2014. Selling, general and administrative expenses, as a percentage of revenues, decreased to 12% in Fiscal 2015 compared to 14% in Fiscal 2014. These decreases were primarily due to a decrease in performance-based compensation, sales commissions, personnel and administrative costs resulting from reductions in force, reduced bad debt expense and overall cost reduction efforts.
Restructuring and Separation Expenses
In Fiscal 2015, we incurred $3.4 million in restructuring and separation costs. Of this, $2.6 million was from separation and severance costs and the remaining $0.8 million resulted from the exit of a Canadian facility lease and the write-off of associated leasehold improvements.
Other Income
We recorded other income of $2.4 million in Fiscal 2015, of which $2.0 million related to the amortization of the deferred gain from the amended supply agreement, discussed in Note E of the Notes to Consolidated Financial Statements, and $0.4 million was from a death benefit received from our company-owned life insurance policy. We recorded other income of $1.5 million in Fiscal 2014, which was solely from the amortization of the deferred gain.
Income Tax Provision
Our provision for income taxes was $13.6 million in Fiscal 2015, compared to $11.1 million in Fiscal 2014. The effective tax rate in Fiscal 2015 was 59% compared to an effective tax rate of 36% for Fiscal 2014. This increase in effective tax rate in Fiscal 2015 was primarily due to the establishment of a valuation allowance against the Canadian net deferred tax assets, partially offset by the resolution of an IRS audit and the retroactive reinstatement of the Federal Research and Development Tax Credit for the second through fourth quarters of Fiscal 2014 (see Note H of the Notes to Consolidated Financial Statements included elsewhere in this Annual Report). The effective tax rate for Fiscal 2014 approximated the combined U.S. federal and state statutory rate as the majority of our income was attributable to the U.S.
17
Income from Continuing Operations
In Fiscal 2015, we recorded income from continuing operations of $9.4 million, or $0.79 per diluted share, compared to $19.6 million, or $1.62 per diluted share in Fiscal 2014. This reduction to net income was primarily due to a valuation allowance recorded against our Canadian deferred tax assets (as discussed above) and higher domestic productions costs caused by inefficiencies resulting from our production efforts and incremental costs to maintain our customers’ scheduling requirements. These reductions to net income were partially offset by lower selling, general and administrative costs.
Income from Discontinued Operations
In Fiscal 2014, we recorded $9.6 million, or $0.80 per diluted share, of income from discontinued operations which included the gain on the sale. For additional information about this disposition, see Note N of the Notes to Consolidated Financial Statements.
Backlog
Our backlog includes various projects, some of which are petrochemical, oil and gas construction and transportation infrastructure projects which take a number of months to produce. The order backlog at September 30, 2015 was $441.4 million, compared to $507.1 million at September 30, 2014. New orders placed in Fiscal 2015 totaled $606.8 million, compared to $725.8 million in Fiscal 2014. This decrease in orders was due to reduced capital investments by our customers primarily in oil and gas and petrochemical industries.
Liquidity and Capital Resources
Cash and cash equivalents increased to $97.7 million at September 30, 2016, compared to $43.6 million at September 30, 2015. As of September 30, 2016, current assets exceeded current liabilities by 2.6 times and our total debt-to-capitalization ratio was 0.71%.
We have a $75.0 million revolving credit facility in the U.S., which expires in December 2018. As of September 30, 2016, there were no amounts borrowed under this line of credit. We also have a $7.6 million revolving credit facility in Canada. At September 30, 2016, there was no balance outstanding under the Canadian revolving credit facility. Total long-term debt obligations, including current maturities, totaled $2.4 million at September 30, 2016, compared to $2.8 million at September 30, 2015. Total letters of credit outstanding were $26.8 million and $21.1 million at September 30, 2016 and 2015, respectively, which reduce our availability under our U.S. credit facility. Amounts available at September 30, 2016 under the U.S. and Canadian revolving credit facilities were $48.3 million and $7.6 million, respectively. For further information regarding our debt, see Notes F and G of the Notes to Consolidated Financial Statements included elsewhere in this Annual Report.
Approximately $30 million of our cash at September 30, 2016 was held outside of the United States for international operations. It is our intention to indefinitely reinvest all current and future foreign earnings internationally in order to ensure sufficient working capital to support and expand these international operations. In the event that we elect to repatriate some or all of the foreign earnings that were previously deemed to be indefinitely reinvested outside the U.S., under current tax laws we would incur additional tax expense upon such repatriation.
We believe that cash available and borrowing capacity under our existing credit facilities should be sufficient to finance future operating activities, capital improvements and debt repayments for the foreseeable future. We continue to monitor the factors that drive our markets and will continue to strive to maintain our leadership and competitive advantage in the markets we serve while aligning our cost structures with market conditions.
Operating Activities
During Fiscal 2016, net cash provided by operating activities was $74.9 million. During Fiscal 2015, net cash provided by operating activities was $12.9 million and in Fiscal 2014, net cash provided by operating activities was $9.1 million. Cash flow from operations is primarily influenced by the timing of milestone payments from our customers and the payment terms with our suppliers, and is favorably impacted during a down cycle as project milestones are billed and collected as projects are completed. During Fiscal 2016, our cash provided by operations increased over Fiscal 2015 primarily due to our ability to reduce working capital as projects were completed and payments on contracts were received. In Fiscal 2014, we received the $10.0 million payment related to the amended supply agreement discussed in Note E of the Notes to Consolidated Financial Statements included elsewhere in this Annual Report.
18
Purchases of property, plant and equipment during Fiscal 2016 totaled $3.0 million compared to $34.7 million and $16.5 million in Fiscal 2015 and 2014, respectively. This decrease in Fiscal 2016 was due to the completion of the expansion of our Canadian facilities in Fiscal 2015.
Financing Activities
Net cash used in financing activities was $17.4 in Fiscal 2016, $34.9 in Fiscal 2015 and $12.5 million in Fiscal 2014. This reduction was primarily due to the completion of our share repurchase program in December 2015 discussed below.
Share Repurchase Program
On December 17, 2014, our Board of Directors authorized a share repurchase program which allowed us to repurchase up to $25 million of our outstanding stock. The purchases were made in the open market through Rule 10b5-1 trading plans in accordance with applicable laws, rules and regulations. The Repurchase Program was funded from cash on hand and cash provided by operating activities. The Repurchase Program expired on December 31, 2015. As of December 31, 2015, we had purchased 806,018 shares at an aggregate cost of $25 million under the Repurchase Program. The average purchase price per share from inception of the program until its expiration was $31.02.
Contractual and Other Obligations
At September 30, 2016, our long-term contractual obligations were limited to debt and leases. The table below details our commitments by type of obligation, including interest if applicable, and the period that the payment will become due (in thousands).
|
As of September 30, 2016, |
|
|
|
|
|
|
|
|
|
|
|
|
Payments Due by Period: |
|
|
|
|
|
|
|
|
|
|
|
|
|
Long-Term Debt Obligations |
|
|
Operating Lease Obligations |
|
|
Total |
|
|||
|
Less than 1 year |
$ |
420 |
|
|
$ |
2,495 |
|
|
$ |
2,915 |
|
|
1 to 3 years |
|
829 |
|
|
|
2,657 |
|
|
|
3,486 |
|
|
3 to 5 years |
|
812 |
|
|
|
2,840 |
|
|
|
3,652 |
|
|
More than 5 years |
|
400 |
|
|
|
2,485 |
|
|
|
2,885 |
|
|
Total long-term contractual obligations |
$ |
2,461 |
|
|
$ |
10,477 |
|
|
$ |
12,938 |
|
As of September 30, 2016, the total unrecognized tax benefit related to uncertain tax positions was $1.0 million. We estimate that none of this will be paid within the next 12 months. However, we believe that it is reasonably possible that within the next 12 months, the total unrecognized tax benefits will decrease by approximately 65% due to the expiration of certain statutes of limitations or resolution of tax audits. We are unable to make reasonably reliable estimates regarding the timing of future cash outflows, if any, associated with the remaining unrecognized tax benefits.
Other Commercial Commitments
We are contingently liable for secured and unsecured letters of credit of $30.8 million as of September 30, 2016, of which $26.8 million reduces our borrowing capacity.
The following table reflects potential cash outflows that may result in the event that we are unable to perform under our contracts (in thousands):
|
As of September 30, 2016, Payments Due by Period: |
|
Letters of |
|
|
|
Less than 1 year |
|
$ |
11,417 |
|
|
1 to 3 years |
|
|
18,362 |
|
|
More than 3 years |
|
|
986 |
|
|
Total long-term commercial obligations |
|
$ |
30,765 |
|
We also had performance and maintenance bonds totaling $233.6 million that were outstanding at September 30, 2016. Performance and maintenance bonds are primarily used to guarantee our contract performance to our customers.
19
Off-Balance Sheet Arrangements
We had no off-balance sheet arrangements during the periods presented.
Outlook
The markets in which we participate are capital-intensive and cyclical in nature. Cyclicality is predominantly driven by customer demand, global economic conditions and anticipated environmental or regulatory changes which affect the manner in which our customers proceed with capital investments. Our customers analyze various factors including the demand and price for oil, gas and electrical energy, the overall economic and financial environment, governmental budgets, regulatory actions and environmental concerns. These factors influence the release of new capital projects by our customers, which are traditionally awarded in competitive bid situations. Scheduling of projects is matched to customer requirements. Projects typically take a number of months to produce, and schedules may change during the course of any particular project.
A significant portion of our revenues have historically been from the oil and gas markets. Unfavorable long-term oil and gas commodity price levels have caused, and may continue to cause, our customers to change their strategies or delay or cancel planned projects. We believe that sustained lower oil and gas prices from a continued global supply/demand imbalance will continue to negatively impact future orders due to reduced capital spending by our customers. The reduction in available projects, across the markets we serve, has increased market price pressures during this downward market cycle. This reduction in new business opportunities and increased market price pressures have impacted, and will continue to negatively impact, our backlog, revenues and operating results. It is difficult to predict how long the current depressed market cycle will continue.
Our operating results have been, and may continue to be, negatively impacted by factors such as the timing of new order awards, customer approval of final engineering and design specifications and delays in customer construction schedules, all of which have and may continue to have, a negative impact on the timing of project execution. Our operating results also have been, and may continue to be, impacted by the timing and resolution of change orders, project close-out and resolution of potential contract claims, all of which could improve or deteriorate gross margins during the period in which these items are resolved with our customers. These factors may result in periods of underutilization of our resources and facilities and negatively impact our ability to cover our fixed costs. In 2016, in response to the continued adverse effects of the materially lower oil and gas commodity prices on our results of operations, we took steps to reduce our costs structure, restructure our senior management team and align our salaried and hourly workforce with future production requirements. However, these efforts may not be sufficient to avoid operating losses in the near-term.
We believe that our strong working capital position, cash available, low debt position and borrowing capacity under our existing credit facilities should be sufficient to finance future operating activities, research and development initiatives, capital improvements and debt repayments for the foreseeable future. We continue to monitor the factors that drive our markets and will continue to strive to maintain our leadership and competitive advantage in the markets we serve while aligning our cost structures with market conditions.
Effects of Inflation
We are subject to inflation, which can cause increases in our costs of raw materials, primarily copper, aluminum and steel. Fixed-price contracts can limit our ability to pass these increases to our customers, thus negatively impacting our earnings. The inflation in commodity prices could potentially impact our operations in future years.
Critical Accounting Policies and Estimates
The preparation of consolidated financial statements in conformity with accounting principles generally accepted in the United States of America requires management to make estimates and assumptions that affect the reported amounts of assets, liabilities, revenues and expenses and the disclosures of contingent assets and liabilities. We base our estimates on historical experience and on various other assumptions that are believed to be reasonable under the circumstances. Actual results may differ from these estimates. We believe the following accounting policies and estimates to be critical in the preparation and reporting of our consolidated financial statements.
Revenue Recognition
Our revenues are primarily generated from the engineering and manufacturing of custom products under long-term contracts that may last from one month to several years, depending on the contract. Revenues from long-term contracts are recognized on the percentage-of-completion method of accounting. Occasionally a contract may require that we segment the project into specific deliverables for revenue recognition. Segmenting a contract may result in different interim rates of profitability for each scope of service than if we had recognized revenue on a combined basis.
20
Under the percentage-of-completion method of accounting, revenues are recognized as work is performed. The revenue earned to date is calculated by multiplying the total contract price by the percentage of performance to date, which is based on total costs or total labor dollars incurred to date compared to the total estimated costs or total labor dollars estimated at completion. The method used to determine the percentage of completion is typically the cost method, unless the labor method is a more accurate method of measuring the progress of the project. Application of the percentage-of-completion method of accounting requires the use of estimates of costs to be incurred for the performance of the contract. Contract costs include all direct material costs, direct labor costs and those indirect costs related to contract performance, such as indirect labor, supplies, tools, repairs and all costs associated with operation of equipment. The cost estimation process is based upon the professional knowledge and experience of our engineers, project managers and financial professionals. Factors that are considered in estimating the work to be completed and ultimate contract recovery include the availability and productivity of labor, the nature and complexity of the work to be performed, the effect of change orders, the availability of materials, the effect of any delays on our project performance and the recoverability of any claims. Changes in job performance, job conditions, estimated profitability and final contract settlements, including our estimate of liquidated damages, if any, may result in revisions to costs and income, with their effects being recognized in the period in which the revisions are determined. Whenever revisions of estimated contract costs and contract values indicate that the contract costs will exceed estimated revenues, thus creating a loss, a provision for the total estimated loss is recorded in that period.
Revenues associated with maintenance, repair and service contracts are recognized when the services are performed. Expenses related to these types of services are recognized as incurred.
Costs and estimated earnings in excess of billings on uncompleted contracts also include certain costs associated with unapproved change orders. These costs are included when change order approval is probable. Amounts are carried at the lower of cost or net realizable value. Revenue is recognized to the extent of costs incurred when recovery is probable. The amounts recorded involve the use of judgments and estimates; thus, actual recoverable amounts could differ from original assumptions.
Allowance for Doubtful Accounts
We maintain and continually assess the adequacy of an allowance for doubtful accounts representing our estimate for losses resulting from the inability of our customers to pay amounts due to us. This estimated allowance is based on historical experience of uncollected accounts, the level of past due accounts, the overall level of outstanding accounts receivable, information about specific customers with respect to their inability to make payments and expectations of future conditions that could impact the collectability of accounts receivable. However, future changes in our customers’ operating performance and cash flows, or in general economic conditions, could have an impact on their ability to fully pay these amounts, which, among other things, could have a material adverse impact on our operating results.
Impairment of Long-Lived Assets
We review long-lived assets for impairment whenever events or changes in circumstances indicate that the carrying value may not be realizable. If an evaluation is required, the estimated future undiscounted cash flows associated with the asset are compared to the asset’s carrying amount to determine if recording an impairment of such asset is necessary. This requires us to make long-term forecasts of the future revenues and costs related to the assets subject to review. Forecasts require assumptions about demand for our products and future market conditions. Estimating future cash flows requires significant judgment, and our projections may vary from cash flows eventually realized. Future events and unanticipated changes to assumptions could require a provision for impairment in a future period. The effect of any impairment would be reflected in income (loss) from operations in the Consolidated Statements of Operations. In addition, we estimate the useful lives of our long-lived assets and other intangibles and periodically review these estimates to determine whether these lives are appropriate.
Accruals for Contingent Liabilities
From time to time, contingencies such as insurance-related claims, liquidated damages and legal claims arise in the normal course of business. Pursuant to applicable accounting standards, we must evaluate such contingencies to subjectively determine the likelihood that an asset has been impaired or a liability has been incurred at the date of the financial statements, as well as evaluate whether the amount of the loss can be reasonably estimated. If the likelihood is determined to be probable and it can be reasonably estimated, the estimated loss is recorded. The amounts we record for contingent liabilities require judgments regarding the amount of expenses that will ultimately be incurred. We use past experience and history, as well as the specific circumstances surrounding each contingent liability, in evaluating the amount of liability that should be recorded. Actual results could differ from our estimates.
21
We provide for estimated warranty costs with the recognition of revenue based upon historical rates applicable to individual product lines. In addition, specific provisions are made when the costs of such warranties are expected to exceed accruals. Our standard terms and conditions of sale include a warranty for parts and service for the earlier of 18 months from the date of shipment or 12 months from the date of energization, whichever occurs first. Occasionally projects require warranty terms which are longer than our standard terms due to the nature of the project. Extended warranty terms may be negotiated and included in our contracts. We use past experience and historical claims to determine the estimated liability. Actual results could differ from our estimate.
Accounting for Income Taxes
We account for income taxes under the asset and liability method, based on the income tax laws and rates in the countries in which operations are conducted and income is earned. This approach requires the recognition of deferred tax assets and liabilities for the expected future tax consequences of temporary differences between the carrying amounts and the tax basis of assets and liabilities. Developing our provision for income taxes requires significant judgment and expertise in federal, international and state income tax laws, regulations and strategies, including the determination of deferred tax assets and liabilities and, if necessary, any valuation allowances that may be required for deferred tax assets. In assessing the extent to which net deferred tax assets may be realized, we consider whether it is more-likely-than-not that some portion or all of the net deferred tax assets may not be realized. The ultimate realization of net deferred tax assets is dependent on the generation of future taxable income during the periods in which those temporary differences become deductible. Due to the historical Canadian losses, and the losses that we projected at the time of determination, we were required under the more-likely-than-not accounting standard to record a valuation allowance against the Canadian net deferred tax assets because we anticipated that we may not be able to realize the benefits of the net operating loss carryforwards and other deductible differences. Estimates may change as new events occur, estimates of future taxable income during the carryforward period are reduced or increased, additional information becomes available or operating environments change, which may result in a full or partial reversal of the valuation allowance. We will continue to assess the adequacy of the valuation allowance on a quarterly basis. Our judgments and tax strategies are subject to audit by various taxing authorities.
The objectives of accounting for income taxes are to recognize the amount of taxes payable or refundable for the current year and deferred tax liabilities and assets for the future tax consequences of events that have been recognized in an entity’s financial statements or tax returns. We recognize the tax benefit from an uncertain tax position only if it is more likely than not that the tax position will be sustained on examination by the taxing authorities, based on the technical merits of the position. The tax benefits recognized in the financial statements from such a position should be measured based on the largest benefit that has a greater than 50% likelihood of being realized upon ultimate settlement. Accounting literature also provides guidance on derecognition of income tax assets and liabilities, classification of current and deferred income tax assets and liabilities, accounting for interest and penalties associated with tax positions, and income tax disclosures. Judgment is required in assessing the future tax consequences of events that have been recognized in our financial statements or tax returns. Variations in the actual outcome of these future tax consequences could materially impact our financial statements.
See Note H of Notes to Consolidated Financial Statements included elsewhere in this Annual Report for disclosures related to the valuation allowance recorded in relation to foreign deferred taxes.
Foreign Currency Translation
The functional currency for our foreign subsidiaries is the local currency in which the entity is located. The financial statements of all subsidiaries with a functional currency other than the U.S. Dollar have been translated into U.S. Dollars. All assets and liabilities of foreign operations are translated into U.S. Dollars using year-end exchange rates, and all revenues and expenses are translated at average rates during the respective period. The U.S. Dollar results that arise from such translation, as well as exchange gains and losses on intercompany balances of a long-term investment nature, are included in the cumulative currency translation adjustments in accumulated other comprehensive income in stockholders’ equity.
New Accounting Standards
From time to time, new accounting pronouncements are issued by the Financial Accounting Standards Board (the FASB), which are adopted by us as of the specified effective date. Unless otherwise discussed, management believes that the impact of recently issued standards, which are not yet effective, will not have a material impact on our consolidated statements upon adoption.
In May 2014, the FASB issued a new standard on revenue recognition that supersedes previously issued revenue recognition guidance. This standard provides a five-step approach to be applied to all contracts with customers and requires expanded disclosures about the nature, amount, timing and uncertainty of revenue (and the related cash flows) arising from customer contracts, significant judgments and changes in judgments used in applying the revenue model and the assets recognized from costs incurred to obtain or fulfill a
22
contract. This guidance is now effective for fiscal years, and interim periods within those years, beginning after December 15, 2017, which would be our fiscal year ending September 30, 2019. The standard permits the use of either the full retrospective or modified retrospective transition method; therefore, we are evaluating the effect that this new guidance will have on our consolidated financial statements and related disclosures. We have not yet selected a transition method nor have we determined the effect of the standard on our ongoing financial reporting.
In November 2015, the FASB issued an amendment to the topic regarding income taxes which requires an entity to separate deferred income tax liabilities and assets into current and noncurrent amounts in the statement of financial position. Deferred tax liabilities and assets are classified as current or noncurrent based on the classification of the related asset or liability for financial reporting. Deferred tax liabilities and assets that are not related to an asset or liability for financial reporting are classified according to the expected reversal date of the temporary difference. To simplify the presentation of deferred income taxes, the amendments require that deferred income tax liabilities and assets be classified as noncurrent in a classified statement of financial position. This amendment is effective for annual reporting periods beginning after December 15, 2016, which would be our fiscal year ending September 30, 2018. We have no plans for early adoption. The adoption of this guidance is not expected to have a material impact on our consolidated financial position or results of operations.
In February 2016, the FASB issued a new topic on leases which requires lessees to recognize lease assets and lease liabilities on the balance sheet for all leases with terms longer than twelve months. Leases will be classified as either finance or operating, with classification affecting the pattern of expense recognition in the income statement. A modified retrospective transition approach is required for lessees for capital and operating leases existing at, or entered into after, the beginning of the earliest comparative period presented in the financial statements, with certain practical expedients available. The new standard is effective for fiscal years beginning after December 15, 2018, including interim periods within those fiscal years. This would be our fiscal year ending September 30, 2020. We are currently evaluating the impact of our pending adoption of the new standard, but do not expect it to have a material impact on our consolidated financial position or results of operations.
In March 2016, the FASB issued new guidance on stock-based compensation, which includes amendments to existing guidance for employee share-based payment accounting. The amendments require the recognition in the income statement of the income tax effects of vested or settled awards. The amendments also allow for the employer to repurchase more of an employee’s shares for tax withholding purposes and not classify the award as a liability that requires valuation on a mark-to-market basis. In addition, the amendments allow for a policy election to account for forfeitures as they occur rather than on an estimated basis. For public companies, the amendments in this standard are effective for annual periods beginning after December 15, 2016, including interim periods within those annual periods. This would be our fiscal year ending September 30, 2018. Early adoption is permitted in any interim or annual period. We will early adopt in Fiscal 2017, but it will not have a material impact on our consolidated financial position or results of operations.
23
Item 7A. Quantitative and Qualitative Disclosures about Market Risk
We are exposed to certain market risks arising from transactions we have entered into in the normal course of business. These risks primarily relate to fluctuations in interest rates, foreign exchange rates and commodity prices.
Market Risk
We are exposed to general market risk and its potential impact on accounts receivable or costs and estimated earnings in excess of billings on uncompleted contracts. The amounts recorded may be at risk if our customers’ ability to pay these obligations is negatively impacted by economic conditions. Our customers and their industries are typically engineering, procurement and construction firms, oil and gas refining, offshore oil and gas production, petrochemical, pipeline, terminal, mining and metals, light rail traction power, electric utility, pulp and paper and other heavy industrial customers. We maintain ongoing discussions with customers regarding contract status with respect to payment status, change orders and billing terms in an effort to monitor collections of amounts billed.
Commodity Price Risk
We are subject to market risk from fluctuating market prices of certain raw materials used in our products. While such materials are typically available from numerous suppliers, commodity raw materials are subject to price fluctuations. We attempt to pass along such commodity price increases to our customers on a contract-by-contract basis to avoid a negative effect on profit margin. While we may do so in the future, we have not currently entered into any derivative contracts to hedge our exposure to commodity risk. We continue to experience price volatility with some of our key raw materials and components. Fixed-price contracts may limit our ability to pass cost increases to our customers, thus negatively impacting our earnings. Fluctuations in commodity prices may have a material impact on our future earnings and cash flows.
Foreign Currency Transaction Risk
We have operations that expose us to currency risk in the British Pound Sterling, the Canadian Dollar and to a lesser extent the Euro. Amounts invested in our foreign operations are translated into U.S. Dollars at the exchange rates in effect at the balance sheet date. The resulting translation adjustments are recorded as accumulated other comprehensive income (loss), a component of stockholders’ equity in our consolidated balance sheets. We believe the exposure to the effects that fluctuating foreign currencies have on our consolidated results of operations is limited because the foreign operations primarily invoice customers and collect obligations in their respective currencies or U.S. Dollars. Additionally, expenses associated with these transactions are generally contracted and paid for in the same local currencies. For Fiscal 2016, our realized foreign exchange gains were $0.8 million and are included in selling, general and administrative expenses in the Consolidated Statements of Operations.
Our accumulated other comprehensive loss, which is included as a component of stockholders’ equity, was $23.8 million as of September 30, 2016, a slight increase from $22.4 million at September 30, 2015. This improvement was primarily a result of fluctuations in the currency exchange rates for the Canadian Dollar and British Pound Sterling as we remeasured the foreign operations of those divisions. During Fiscal 2016, the U.S. Dollar improved relative to these foreign currencies and, as a result, our accumulated other comprehensive losses increased.
We do not currently hedge our exposure to potential foreign currency translation adjustments.
Interest Rate Risk
If we decide to borrow under one of our credit facilities, we will be subject to market risk resulting from changes in interest rates related to our floating rate bank credit facility. If we were to make such borrowings, a hypothetical 100 basis point increase in variable interest rates may result in a material impact to our financial statements. While we do not currently have any derivative contracts to hedge our exposure to interest rate risk, in the past we have entered and may in the future enter into such contracts. During each of the past three years, we have not experienced a significant effect on our business due to changes in interest rates.
24
Item 8. Financial Statements and Supplementary Data
|
Index to Consolidated Financial Statements |
|
Page |
|
Financial Statements: |
|
|
|
|
26 |
|
|
Consolidated Balance Sheets as of September 30, 2016 and 2015 |
|
27 |
|
Consolidated Statements of Operations for the Years Ended September 30, 2016, 2015 and 2014 |
|
28 |
|
|
29 |
|
|
|
30 |
|
|
Consolidated Statements of Cash Flows for the Years Ended September 30, 2016, 2015 and 2014 |
|
31 |
|
|
32 |
25
REPORT OF INDEPENDENT REGISTERED PUBLIC ACCOUNTING FIRM
To the Board of Directors
and Stockholders of Powell Industries, Inc.:
In our opinion, the accompanying consolidated balance sheets and the related consolidated statements of operations, of comprehensive income, of stockholders’ equity and of cash flows present fairly, in all material respects, the financial position of Powell Industries, Inc. and its subsidiaries at September 30, 2016 and 2015, and the results of their operations and their cash flows for each of the three years in the period ended September 30, 2016 in conformity with accounting principles generally accepted in the United States of America. Also in our opinion, the Company maintained, in all material respects, effective internal control over financial reporting as of September 30, 2016, based on criteria established in Internal Control - Integrated Framework 2013 issued by the Committee of Sponsoring Organizations of the Treadway Commission (COSO). The Company's management is responsible for these financial statements, for maintaining effective internal control over financial reporting and for its assessment of the effectiveness of internal control over financial reporting, included in Management's Report on Internal Control over Financial Reporting. Our responsibility is to express opinions on these financial statements, and on the Company's internal control over financial reporting based on our integrated audits. We conducted our audits in accordance with the standards of the Public Company Accounting Oversight Board (United States). Those standards require that we plan and perform the audits to obtain reasonable assurance about whether the financial statements are free of material misstatement and whether effective internal control over financial reporting was maintained in all material respects. Our audits of the financial statements included examining, on a test basis, evidence supporting the amounts and disclosures in the financial statements, assessing the accounting principles used and significant estimates made by management, and evaluating the overall financial statement presentation. Our audit of internal control over financial reporting included obtaining an understanding of internal control over financial reporting, assessing the risk that a material weakness exists, and testing and evaluating the design and operating effectiveness of internal control based on the assessed risk. Our audits also included performing such other procedures as we considered necessary in the circumstances. We believe that our audits provide a reasonable basis for our opinions.
A company’s internal control over financial reporting is a process designed to provide reasonable assurance regarding the reliability of financial reporting and the preparation of financial statements for external purposes in accordance with generally accepted accounting principles. A company’s internal control over financial reporting includes those policies and procedures that (i) pertain to the maintenance of records that, in reasonable detail, accurately and fairly reflect the transactions and dispositions of the assets of the company; (ii) provide reasonable assurance that transactions are recorded as necessary to permit preparation of financial statements in accordance with generally accepted accounting principles, and that receipts and expenditures of the company are being made only in accordance with authorizations of management and directors of the company; and (iii) provide reasonable assurance regarding prevention or timely detection of unauthorized acquisition, use, or disposition of the company’s assets that could have a material effect on the financial statements.
Because of its inherent limitations, internal control over financial reporting may not prevent or detect misstatements. Also, projections of any evaluation of effectiveness to future periods are subject to the risk that controls may become inadequate because of changes in conditions, or that the degree of compliance with the policies or procedures may deteriorate.
/s/ PricewaterhouseCoopers LLP
Houston, Texas
December 7, 2016
26
POWELL INDUSTRIES, INC. AND SUBSIDIARIES
CONSOLIDATED BALANCE SHEETS
(In thousands, except share and per share data)
|
|
September 30, |
|
|||||
|
|
2016 |
|
|
2015 |
|
||
|
ASSETS |
|
|
|
|
|
|
|
|
Current Assets: |
|
|
|
|
|
|
|
|
Cash and cash equivalents |
$ |
97,720 |
|
|
$ |
43,569 |
|
|
Accounts receivable, less allowance for doubtful accounts of $811 and $746 |
|
101,048 |
|
|
|
101,784 |
|
|
Costs and estimated earnings in excess of billings on uncompleted contracts |
|
66,106 |
|
|
|
104,793 |
|
|
Inventories |
|
26,521 |
|
|
|
32,891 |
|
|
Income taxes receivable |
|
1,713 |
|
|
|
1,232 |
|
|
Deferred income taxes |
|
4,006 |
|
|
|
3,910 |
|
|
Prepaid expenses |
|
4,569 |
|
|
|
5,004 |
|
|
Other current assets |
|
2,457 |
|
|
|
3,916 |
|
|
Total Current Assets |
|
304,140 |
|
|
|
297,099 |
|
|
Property, plant and equipment, net |
|
144,977 |
|
|
|
154,594 |
|
|
Goodwill and intangible assets, net |
|
2,059 |
|
|
|
2,393 |
|
|
Other assets |
|
11,340 |
|
|
|
10,117 |
|
|
Deferred income taxes |
|
— |
|
|
|
2,288 |
|
|
Long-term receivable (Note E) |
|
— |
|
|
|
2,333 |
|
|
Total Assets |
$ |
462,516 |
|
|
$ |
468,824 |
|
|
LIABILITIES AND STOCKHOLDERS' EQUITY |
|
|
|
|
|
|
|
|
Current Liabilities: |
|
|
|
|
|
|
|
|
Current maturities of long-term debt |
$ |
400 |
|
|
$ |
400 |
|
|
Income taxes payable |
|
1,459 |
|
|
|
784 |
|
|
Accounts payable |
|
34,985 |
|
|
|
48,008 |
|
|
Accrued salaries, bonuses and commissions |
|
22,550 |
|
|
|
19,223 |
|
|
Billings in excess of costs and estimated earnings on uncompleted contracts |
|
43,974 |
|
|
|
42,057 |
|
|
Accrued product warranty |
|
4,639 |
|
|
|
4,930 |
|
|
Other accrued expenses |
|
8,212 |
|
|
|
7,521 |
|
|
Deferred credit ─ short term (Note E) |
|
2,029 |
|
|
|
2,029 |
|
|
Total Current Liabilities |
|
118,248 |
|
|
|
124,952 |
|
|
Long-term debt, net of current maturities |
|
2,000 |
|
|
|
2,400 |
|
|
Deferred compensation |
|
4,840 |
|
|
|
4,950 |
|
|
Deferred income taxes |
|
138 |
|
|
|
— |
|
|
Other long-term liabilities |
|
1,466 |
|
|
|
723 |
|
|
Deferred credit ─ long term (Note E) |
|
507 |
|
|
|
2,537 |
|
|
Total Liabilities |
|
127,199 |
|
|
|
135,562 |
|
|
Commitments and Contingencies (Note G) |
|
|
|
|
|
|
|
|
Stockholders' Equity: |
|
|
|
|
|
|
|
|
Preferred stock, par value $.01; 5,000,000 shares authorized; none issued |
|
— |
|
|
|
— |
|
|
Common stock, par value $.01; 30,000,000 shares authorized; 12,199,511 and 12,031,243 shares issued, respectively |
|
122 |
|
|
|
121 |
|
|
Additional paid-in capital |
|
52,003 |
|
|
|
48,507 |
|
|
Retained earnings |
|
331,959 |
|
|
|
328,294 |
|
|
Treasury stock, 806,018 and 670,181 shares at cost |
|
(24,999 |
) |
|
|
(21,259 |
) |
|
Accumulated other comprehensive loss |
|
(23,768 |
) |
|
|
(22,401 |
) |
|
Total Stockholders' Equity |
|
335,317 |
|
|
|
333,262 |
|
|
Total Liabilities and Stockholders' Equity |
$ |
462,516 |
|
|
$ |
468,824 |
|
The accompanying notes are an integral part of these consolidated financial statements.
27
POWELL INDUSTRIES, INC. AND SUBSIDIARIES
CONSOLIDATED STATEMENTS OF OPERATIONS
(In thousands, except per share data)
|
|
|
Year Ended September 30, |
|
|||||||||
|
|
|
2016 |
|
|
2015 |
|
|
2014 |
|
|||
|
|
|
|
|
|
|
|
|
|
|
|
|
|
|
Revenues |
|
$ |
565,243 |
|
|
$ |
661,858 |
|
|
$ |
647,814 |
|
|
Cost of goods sold |
|
|
459,038 |
|
|
|
553,597 |
|
|
|
522,340 |
|
|
Gross profit |
|
|
106,205 |
|
|
|
108,261 |
|
|
|
125,474 |
|
|
|
|
|
|
|
|
|
|
|
|
|
|
|
|
Selling, general and administrative expenses |
|
|
74,924 |
|
|
|
76,801 |
|
|
|
87,756 |
|
|
Research and development expenses |
|
|
6,731 |
|
|
|
6,980 |
|
|
|
7,608 |
|
|
Amortization of intangible assets |
|
|
352 |
|
|
|
435 |
|
|
|
779 |
|
|
Restructuring and separation expenses |
|
|
8,441 |
|
|
|
3,397 |
|
|
|
— |
|
|
Operating income |
|
|
15,757 |
|
|
|
20,648 |
|
|
|
29,331 |
|
|
|
|
|
|
|
|
|
|
|
|
|
|
|
|
Other income (See Note E) |
|
|
(2,029 |
) |
|
|
(2,402 |
) |
|
|
(1,522 |
) |
|
Interest expense |
|
|
149 |
|
|
|
145 |
|
|
|
178 |
|
|
Interest income |
|
|
(156 |
) |
|
|
(86 |
) |
|
|
(13 |
) |
|
Income from continuing operations before income taxes |
|
|
17,793 |
|
|
|
22,991 |
|
|
|
30,688 |
|
|
|
|
|
|
|
|
|
|
|
|
|
|
|
|
Income tax provision |
|
|
2,283 |
|
|
|
13,552 |
|
|
|
11,068 |
|
|
|
|
|
|
|
|
|
|
|
|
|
|
|
|
Income from continuing operations |
|
|
15,510 |
|
|
|
9,439 |
|
|
|
19,620 |
|
|
|
|
|
|
|
|
|
|
|
|
|
|
|
|
Income from discontinued operations, net of tax (Note N) |
|
|
— |
|
|
|
— |
|
|
|
9,604 |
|
|
|
|
|
|
|
|
|
|
|
|
|
|
|
|
Net income |
|
$ |
15,510 |
|
|
$ |
9,439 |
|
|
$ |
29,224 |
|
|
|
|
|
|
|
|
|
|
|
|
|
|
|
|
Earnings per share: |
|
|
|
|
|
|
|
|
|
|
|
|
|
Continuing operations |
|
$ |
1.36 |
|
|
$ |
0.80 |
|
|
$ |
1.63 |
|
|
Discontinued operations |
|
|
— |
|
|
|
— |
|
|
|
0.80 |
|
|
Basic earnings per share |
|
$ |
1.36 |
|
|
$ |
0.80 |
|
|
$ |
2.43 |
|
|
|
|
|
|
|
|
|
|
|
|
|
|
|
|
Continuing operations |
|
$ |
1.36 |
|
|
$ |
0.79 |
|
|
$ |
1.62 |
|
|
Discontinued operations |
|
|
— |
|
|
|
— |
|
|
|
0.80 |
|
|
Diluted earnings per share |
|
$ |
1.36 |
|
|
$ |
0.79 |
|
|
$ |
2.42 |
|
|
|
|
|
|
|
|
|
|
|
|
|
|
|
|
Weighted average shares: |
|
|
|
|
|
|
|
|
|
|
|
|
|
Basic |
|
|
11,400 |
|
|
|
11,869 |
|
|
|
12,003 |
|
|
Diluted |
|
|
11,431 |
|
|
|
11,908 |
|
|
|
12,058 |
|
|
|
|
|
|
|
|
|
|
|
|
|
|
|
|
Dividends per share |
|
$ |
1.04 |
|
|
$ |
1.04 |
|
|
$ |
1.00 |
|
The accompanying notes are an integral part of these consolidated financial statements.
28
POWELL INDUSTRIES, INC. AND SUBSIDIARIES
CONSOLIDATED STATEMENTS OF COMPREHENSIVE INCOME (LOSS)
(In thousands)
|
|
Year Ended September 30, |
|
|||||||||
|
|
2016 |
|
|
2015 |
|
|
2014 |
|
|||
|
|
|
|
|
|
|
|
|
|
|
|
|
|
Net income |
$ |
15,510 |
|
|
$ |
9,439 |
|
|
$ |
29,224 |
|
|
Foreign currency translation adjustments |
|
(928 |
) |
|
|
(16,104 |
) |
|
|
(4,447 |
) |
|
Postretirement benefit adjustment, net of tax |
|
(439 |
) |
|
|
206 |
|
|
|
17 |
|
|
Comprehensive income (loss) |
$ |
14,143 |
|
|
$ |
(6,459 |
) |
|
$ |
24,794 |
|
The accompanying notes are an integral part of these consolidated financial statements.
29
POWELL INDUSTRIES, INC. AND SUBSIDIARIES
CONSOLIDATED STATEMENTS OF STOCKHOLDERS’ EQUITY
(In thousands)
|
|
|
|
|
|
|
|
|
|
|
|
|
|
|
|
|
|
|
|
|
|
|
|
|
|
Accumulated |
|
|
|
|
|
|
|
|
|
|
|
|
|
|
|
|
Additional |
|
|
|
|
|
|
|
|
|
|
|
|
|
|
Other |
|
|
|
|
|
||
|
|
Common Stock |
|
|
Paid-in |
|
|
Retained |
|
|
Treasury Stock |
|
|
Comprehensive |
|
|
|
|
|
|||||||||||||
|
|
Shares |
|
|
Amount |
|
|
Capital |
|
|
Earnings |
|
|
Shares |
|
|
Amount |
|
|
Income/(Loss) |
|
|
Total |
|
||||||||
|
Balance, September 30, 2013 |
|
11,971 |
|
|
$ |
119 |
|
|
$ |
43,193 |
|
|
$ |
313,987 |
|
|
|
— |
|
|
$ |
— |
|
|
$ |
(2,073 |
) |
|
$ |
355,226 |
|
|
Net income |
|
— |
|
|
|
— |
|
|
|
— |
|
|
|
29,224 |
|
|
|
— |
|
|
|
— |
|
|
|
— |
|
|
|
29,224 |
|
|
Foreign currency translation adjustments |
|
— |
|
|
|
— |
|
|
|
— |
|
|
|
— |
|
|
|
— |
|
|
|
— |
|
|
|
(4,447 |
) |
|
|
(4,447 |
) |
|
Stock-based compensation |
|
44 |
|
|
|
— |
|
|
|
3,385 |
|
|
|
— |
|
|
|
— |
|
|
|
— |
|
|
|
— |
|
|
|
3,385 |
|
|
Excess tax benefit from share-based compensation |
|
— |
|
|
|
— |
|
|
|
407 |
|
|
|
— |
|
|
|
— |
|
|
|
— |
|
|
|
— |
|
|
|
407 |
|
|
Shares withheld in lieu of employee tax withholding |
|
— |
|
|
|
— |
|
|
|
(718 |
) |
|
|
— |
|
|
|
— |
|
|
|
— |
|
|
|
— |
|
|
|
(718 |
) |
|
Issuance of restricted stock |
|
16 |
|
|
|
1 |
|
|
|
— |
|
|
|
— |
|
|
|
— |
|
|
|
— |
|
|
|
— |
|
|
|
1 |
|
|
Retirement of stock |
|
— |
|
|
|
— |
|
|
|
— |
|
|
|
(11,998 |
) |
|
|
— |
|
|
|
— |
|
|
|
— |
|
|
|
(11,998 |
) |
|
Postretirement benefit adjustment, net of tax of $9 |
|
— |
|
|
|
— |
|
|
|
— |
|
|
|
— |
|
|
|
— |
|
|
|
— |
|
|
|
17 |
|
|
|
17 |
|
|
Balance, September 30, 2014 |
|
12,031 |
|
|
$ |
120 |
|
|
$ |
46,267 |
|
|
$ |
331,213 |
|
|
|
— |
|
|
$ |
— |
|
|
$ |
(6,503 |
) |
|
$ |
371,097 |
|
|
Net income |
|
— |
|
|
|
— |
|
|
|
— |
|
|
|
9,439 |
|
|
|
— |
|
|
|
— |
|
|
|
— |
|
|
|
9,439 |
|
|
Foreign currency translation adjustments |
|
— |
|
|
|
— |
|
|
|
— |
|
|
|
— |
|
|
|
— |
|
|
|
— |
|
|
|
(16,104 |
) |
|
|
(16,104 |
) |
|
Stock-based compensation |
|
53 |
|
|
|
— |
|
|
|
3,171 |
|
|
|
— |
|
|
|
— |
|
|
|
— |
|
|
|
— |
|
|
|
3,171 |
|
|
Excess tax benefit from share-based compensation |
|
— |
|
|
|
— |
|
|
|
(191 |
) |
|
|
— |
|
|
|
— |
|
|
|
— |
|
|
|
— |
|
|
|
(191 |
) |
|
Shares withheld in lieu of employee tax withholding |
|
— |
|
|
|
— |
|
|
|
(740 |
) |
|
|
— |
|
|
|
— |
|
|
|
— |
|
|
|
— |
|
|
|
(740 |
) |
|
Issuance of restricted stock |
|
16 |
|
|
|
1 |
|
|
|
— |
|
|
|
— |
|
|
|
— |
|
|
|
— |
|
|
|
— |
|
|
|
1 |
|
|
Purchase of treasury shares |
|
— |
|
|
|
— |
|
|
|
— |
|
|
|
— |
|
|
|
(670 |
) |
|
|
(21,259 |
) |
|
|
— |
|
|
|
(21,259 |
) |
|
Dividends paid |
|
— |
|
|
|
— |
|
|
|
— |
|
|
|
(12,358 |
) |
|
|
— |
|
|
|
— |
|
|
|
— |
|
|
|
(12,358 |
) |
|
Postretirement benefit adjustment, net of tax of $123 |
|
— |
|
|
|
— |
|
|
|
— |
|
|
|
— |
|
|
|
— |
|
|
|
— |
|
|
|
206 |
|
|
|
206 |
|
|
Balance, September 30, 2015 |
|
12,100 |
|
|
$ |
121 |
|
|
$ |
48,507 |
|
|
$ |
328,294 |
|
|
|
(670 |
) |
|
$ |
(21,259 |
) |
|
$ |
(22,401 |
) |
|
$ |
333,262 |
|
|
Net income |
|
— |
|
|
|
— |
|
|
|
— |
|
|
|
15,510 |
|
|
|
— |
|
|
|
— |
|
|
|
— |
|
|
|
15,510 |
|
|
Foreign currency translation adjustments |
|
— |
|
|
|
— |
|
|
|
— |
|
|
|
— |
|
|
|
— |
|
|
|
— |
|
|
|
(928 |
) |
|
|
(928 |
) |
|
Stock-based compensation |
|
81 |
|
|
|
— |
|
|
|
4,883 |
|
|
|
— |
|
|
|
— |
|
|
|
— |
|
|
|
— |
|
|
|
4,883 |
|
|
Excess tax benefit from share-based compensation |
|
— |
|
|
|
— |
|
|
|
(387 |
) |
|
|
— |
|
|
|
— |
|
|
|
— |
|
|
|
— |
|
|
|
(387 |
) |
|
Shares withheld in lieu of employee tax withholding |
|
— |
|
|
|
— |
|
|
|
(1,000 |
) |
|
|
— |
|
|
|
— |
|
|
|
— |
|
|
|
— |
|
|
|
(1,000 |
) |
|
Issuance of restricted stock |
|
18 |
|
|
|
1 |
|
|
|
— |
|
|
|
— |
|
|
|
— |
|
|
|
— |
|
|
|
— |
|
|
|
1 |
|
|
Purchase of treasury shares |
|
— |
|
|
|
— |
|
|
|
— |
|
|
|
— |
|
|
|
(136 |
) |
|
|
(3,740 |
) |
|
|
— |
|
|
|
(3,740 |
) |
|
Dividends paid |
|
— |
|
|
|
— |
|
|
|
— |
|
|
|
(11,845 |
) |
|
|
— |
|
|
|
— |
|
|
|
— |
|
|
|
(11,845 |
) |
|
Postretirement benefit adjustment, net of tax of $(237) |
|
— |
|
|
|
— |
|
|
|
— |
|
|
|
— |
|
|
|
— |
|
|
|
— |
|
|
|
(439 |
) |
|
|
(439 |
) |
|
Balance, September 30, 2016 |
|
12,199 |
|
|
$ |
122 |
|
|
$ |
52,003 |
|
|
$ |
331,959 |
|
|
|
(806 |
) |
|
$ |
(24,999 |
) |
|
$ |
(23,768 |
) |
|
$ |
335,317 |
|
The accompanying notes are an integral part of these consolidated financial statements.
30
POWELL INDUSTRIES, INC. AND SUBSIDIARIES
CONSOLIDATED STATEMENTS OF CASH FLOWS
(In thousands)
|
|
Year Ended September 30, |
|
|||||||||
|
|
2016 |
|
|
2015 |
|
|
2014 |
|
|||
|
|
|
|
|
|
|
|
|
|
|
|
|
|
Operating Activities: |
|
|
|
|
|
|
|
|
|
|
|
|
Net income |
$ |
15,510 |
|
|
$ |
9,439 |
|
|
$ |
29,224 |
|
|
Adjustments to reconcile net income to net cash provided by operating activities: |
|
|
|
|
|
|
|
|
|
|
|
|
Depreciation |
|
12,979 |
|
|
|
13,120 |
|
|
|
11,386 |
|
|
Amortization |
|
352 |
|
|
|
435 |
|
|
|
779 |
|
|
Gain on sale of discontinued operations, net of tax |
|
— |
|
|
|
— |
|
|
|
(8,563 |
) |
|
Stock-based compensation |
|
4,883 |
|
|
|
3,171 |
|
|
|
3,385 |
|
|
Excess tax benefit from stock-based compensation |
|
387 |
|
|
|
191 |
|
|
|
(407 |
) |
|
Bad debt expense/(recovery) |
|
187 |
|
|
|
(29 |
) |
|
|
1,074 |
|
|
Deferred income tax expense (benefit) |
|
2,330 |
|
|
|
10,521 |
|
|
|
(3,212 |
) |
|
Gain on amended supply agreement |
|
(2,029 |
) |
|
|
(2,029 |
) |
|
|
(1,522 |
) |
|
Cash received from amended supply agreement |
|
2,333 |
|
|
|
2,333 |
|
|
|
10,000 |
|
|
Changes in operating assets and liabilities: |
|
|
|
|
|
|
|
|
|
|
|
|
Accounts receivable, net |
|
369 |
|
|
|
391 |
|
|
|
1,959 |
|
|
Costs and billings in excess of estimates on uncompleted contracts |
|
39,612 |
|
|
|
(17,430 |
) |
|
|
(17,089 |
) |
|
Inventories |
|
6,159 |
|
|
|
(572 |
) |
|
|
(3,959 |
) |
|
Prepaid expenses and other current assets |
|
1,342 |
|
|
|
2,656 |
|
|
|
(1,101 |
) |
|
Accounts payable and income taxes payable |
|
(12,334 |
) |
|
|
(5,073 |
) |
|
|
1,002 |
|
|
Accrued liabilities |
|
3,927 |
|
|
|
(3,373 |
) |
|
|
(4,997 |
) |
|
Other, net |
|
(1,101 |
) |
|
|
(833 |
) |
|
|
1,524 |
|
|
Net assets held for sale |
|
— |
|
|
|
— |
|
|
|
(10,355 |
) |
|
Net cash provided by operating activities |
|
74,906 |
|
|
|
12,918 |
|
|
|
9,128 |
|
|
Investing Activities: |
|
|
|
|
|
|
|
|
|
|
|
|
Proceeds from sale of property, plant and equipment |
|
187 |
|
|
|
112 |
|
|
|
118 |
|
|
Proceeds from sale of Transdyn |
|
— |
|
|
|
— |
|
|
|
14,819 |
|
|
Purchases of property, plant and equipment |
|
(3,044 |
) |
|
|
(34,719 |
) |
|
|
(16,495 |
) |
|
Net cash used in investing activities |
|
(2,857 |
) |
|
|
(34,607 |
) |
|
|
(1,558 |
) |
|
Financing Activities: |
|
|
|
|
|
|
|
|
|
|
|
|
Payments on industrial development revenue bonds |
|
(400 |
) |
|
|
(400 |
) |
|
|
(400 |
) |
|
Excess tax benefit from stock-based compensation |
|
(387 |
) |
|
|
(191 |
) |
|
|
407 |
|
|
Shares withheld in lieu of employee tax withholding |
|
(1,000 |
) |
|
|
(740 |
) |
|
|
(499 |
) |
|
Purchase of treasury shares |
|
(3,740 |
) |
|
|
(21,259 |
) |
|
|
— |
|
|
Dividends paid |
|
(11,845 |
) |
|
|
(12,358 |
) |
|
|
(11,998 |
) |
|
Payments on short-term and other financing |
|
— |
|
|
|
— |
|
|
|
(16 |
) |
|
Net cash used in financing activities |
|
(17,372 |
) |
|
|
(34,948 |
) |
|
|
(12,506 |
) |
|
Net increase (decrease) in cash and cash equivalents |
|
54,677 |
|
|
|
(56,637 |
) |
|
|
(4,936 |
) |
|
Effect of exchange rate changes on cash and cash equivalents |
|
(526 |
) |
|
|
(2,912 |
) |
|
|
643 |
|
|
Cash and cash equivalents, beginning of period |
|
43,569 |
|
|
|
103,118 |
|
|
|
107,411 |
|
|
Cash and cash equivalents, end of period |
$ |
97,720 |
|
|
$ |
43,569 |
|
|
$ |
103,118 |
|
The accompanying notes are an integral part of these consolidated financial statements.
31
POWELL INDUSTRIES, INC. AND SUBSIDIARIES
NOTES TO CONSOLIDATED FINANCIAL STATEMENTS
A. Business and Organization
Powell Industries, Inc. (we, us, our, Powell or the Company) was incorporated in the state of Delaware in 2004 as a successor to a Nevada company incorporated in 1968. The Nevada corporation was the successor to a company founded by William E. Powell in 1947, which merged into the Company in 1977. Our major subsidiaries, all of which are wholly owned, include: Powell Electrical Systems, Inc.; Powell (UK) Limited; Powell Canada Inc. and Powell Industries International, B.V.
We develop, design, manufacture and service custom-engineered equipment and systems for the distribution, control and monitoring of electrical energy designed to (1) distribute, control and monitor the flow of electrical energy and (2) provide protection to motors, transformers and other electrically powered equipment. Our principal products include integrated power control room substations (PCRs®), custom-engineered modules, electrical houses (E-Houses), traditional and arc-resistant distribution switchgear and control gear, medium-voltage circuit breakers, monitoring and control communications systems, motor control centers and bus duct systems. These products are designed for application voltages ranging from 480 volts to 38,000 volts and are used in oil and gas refining, offshore oil and gas production, petrochemical, pipeline, terminal, mining and metals, light rail traction power, electric utility, pulp and paper and other heavy industrial markets. Our product scope includes designs tested to meet both U.S. standards (ANSI) and international standards (IEC). We assist customers by providing value-added services such as spare parts, field service inspection, installation, commissioning, modification and repair, retrofit and retrofill components for existing systems and replacement circuit breakers for switchgear that is obsolete or that is no longer produced by the original manufacturer. We seek to establish long-term relationships with the end users of our systems as well as the design and construction engineering firms contracted by those end users.
References to Fiscal 2016, Fiscal 2015 and Fiscal 2014 used throughout these Notes to Consolidated Financial Statements relate to our fiscal years ended September 30, 2016, 2015 and 2014, respectively.
In January 2014, we sold our wholly owned subsidiary Transdyn Inc. (Transdyn), which was reported in our Process Controls business segment. We have presented the results of these operations as income from discontinued operations, net of tax, in the Fiscal 2014 consolidated statement of operations. All current and historical financial information presented exclude the financial information for Transdyn or presents it as discontinued operations where applicable. For more information about this disposition, see Note N.
B. Summary of Significant Accounting Policies
Principles of Consolidation
The consolidated financial statements include the accounts of Powell and our wholly owned subsidiaries. All intercompany accounts and transactions have been eliminated in consolidation.
Use of Estimates
The preparation of financial statements in conformity with accounting principles generally accepted in the United States (U.S. GAAP) requires management to make estimates and assumptions that affect the amounts reported in the consolidated financial statements and accompanying footnotes. The most significant estimates used in our financial statements affect revenue and cost recognition for construction contracts, the allowance for doubtful accounts, provision for excess and obsolete inventory, goodwill and other intangible assets, self-insurance, warranty accruals and income taxes. The amounts recorded for insurance claims, warranties, legal, income taxes and other contingent liabilities require judgments regarding the amount of expenses that will ultimately be incurred. We base our estimates on historical experience and on various other assumptions, as well as the specific circumstances surrounding these contingent liabilities, in evaluating the amount of liability that should be recorded. Additionally, the recognition of deferred tax assets requires estimates related to future income and other assumptions regarding timing and future profitability. Estimates may change as new events occur, additional information becomes available or operating environments change. Actual results may differ from our estimates.
Cash and Cash Equivalents
Cash and cash equivalents include cash on hand, deposits with banks and highly liquid investments with original maturities of three months or less.
32
Supplemental Disclosures of Cash Flow Information (in thousands):
|
|
Year Ended September 30, |
||||||||||||||||
|
|
2016 |
|
|
2015 |
|
|
2014 |
|
|||||||||
|
Cash paid (received) during the period for: |
|
|
|
|
|
|
|
|
|
|
|
||||||
|
Interest, net of interest income |
$ |
4 |
|
|
$ |
70 |
|
|
$ |
149 |
|
||||||
|
Income taxes, net of refunds |
|
(352) |
|
|
|
2,298 |
|
|
|
18,889 |
|
||||||
|
Non-cash capital expenditures |
|
221 |
|
|
|
147 |
|
|
|
13,527 |
|
||||||
Fair Value of Financial Instruments
Financial instruments include cash, cash equivalents, receivables, deferred compensation, payables and debt obligations. Except as described below, due to the short-term nature of account receivables and account payables, the book value is representative of their fair value. The carrying value of debt approximates fair value as interest rates are indexed to the Federal Funds Rate, the Canadian Prime Rate or the bank’s prime rate.
Accounts Receivable
Accounts receivable are stated net of allowances for doubtful accounts. We maintain and continually assess the adequacy of the allowance for doubtful accounts representing our estimate for losses resulting from the inability of our customers to pay amounts due to us. This estimated allowance is based on historical experience of uncollected accounts, the level of past due accounts, the overall level of outstanding accounts receivable, information about specific customers with respect to their inability to make payments and expectations of future conditions that could impact the collectability of accounts receivable. Future changes in our customers’ operating performance and cash flows, or in general economic conditions, could have an impact on their ability to fully pay these amounts, which could have a material impact on our operating results. In most cases, receivables are not collateralized. However, we utilize letters of credit to secure payment on projects when possible. At September 30, 2016 and 2015, accounts receivable included retention amounts of $2.7 million and $5.4 million, respectively. Retention amounts are in accordance with applicable provisions of contracts and become due upon completion of contractual requirements. All of the retained amount at September 30, 2016, is expected to be collected in the next fiscal year.
Costs and Estimated Earnings in Excess of Billings on Uncompleted Contracts
Costs and estimated earnings in excess of billings on uncompleted contracts arise when revenues are recorded on a percentage-of-completion basis but cannot be invoiced under the terms of the contract. Such amounts are invoiced upon completion of contractual milestones.
Costs and estimated earnings in excess of billings on uncompleted contracts also include certain costs associated with unapproved change orders. These costs are included when the approval of the change order is probable. Amounts are carried at the lower of cost or net realizable value. Revenue is recognized to the extent of costs incurred when recovery is probable. The amounts recorded involve the use of judgments and estimates; thus, actual recoverable amounts could differ from original assumptions.
In accordance with industry practice, assets and liabilities related to costs and estimated earnings in excess of billings on uncompleted contracts, as well as billings in excess of costs and estimated earnings on uncompleted contracts, have been classified as current. The contract cycle for certain long-term contracts may extend beyond one year; thus, collection of amounts related to these contracts may extend beyond one year.
Inventories
Inventories are stated at the lower of cost or market using weighted-average methods and include the cost of materials, labor and manufacturing overhead. We use estimates in determining the level of reserves required to state inventory at the lower of cost or market. Our estimates are based on market activity levels, production requirements, the physical condition of products and technological innovation. Changes in any of these factors may result in adjustments to the carrying value of inventory.
Property, Plant and Equipment
Property, plant and equipment are stated at cost and are depreciated using the straight-line method over the estimated useful lives of the assets. Expenditures for repairs and maintenance are charged to expense when incurred. Expenditures for major renewals and improvements, which extend the useful lives of existing equipment, are capitalized and depreciated. Upon retirement or disposition of
33
property, plant and equipment, the cost and related accumulated depreciation are removed from the accounts, and any resulting gain or loss is recognized in the Consolidated Statements of Operations.
We review property, plant and equipment for impairment whenever events or changes in circumstances indicate that the carrying value may not be realizable. If an evaluation is required, the estimated future undiscounted cash flows associated with the asset are compared to the asset’s carrying amount to determine if recording an impairment of such asset is necessary. If an impairment is indicated, we record an impairment loss equal to the difference between the carrying value and the fair value of the long-lived asset. This requires us to make long-term forecasts of the future revenues and the costs related to the assets subject to review. Forecasts require assumptions about demand for our products and future market conditions. Estimating future cash flows requires significant judgment and our projections may vary from cash flows eventually realized. Future events and unanticipated changes to assumptions could require a provision for impairment in a future period. The effect of any impairment would be reflected in income (loss) from operations in the Consolidated Statements of Operations. In addition, we estimate the useful lives of our property, plant and equipment and periodically review these estimates to determine whether these lives are appropriate.
Goodwill
Goodwill is evaluated for impairment annually, or immediately if conditions indicate that impairment could exist. The evaluation requires a two-step impairment test to identify potential goodwill impairment and measure the amount of a goodwill impairment loss. The first step of the test compares the fair value of a reporting unit with its carrying amount, including goodwill. If the carrying amount of a reporting unit exceeds its fair value, the second step of the goodwill impairment test is performed to measure the amount of the impairment loss. Both steps of the goodwill impairment testing involve significant estimates.
Intangible Assets
The costs of intangible assets with determinable useful lives are amortized over their estimated useful lives. Intangible assets with determinable lives are reviewed for impairment in a similar method as property, plant and equipment as discussed above. For additional information regarding our intangible assets, see Note E herein.
Income Taxes
We account for income taxes under the asset and liability method, based on the income tax laws and rates in the countries in which operations are conducted and income is earned. This approach requires the recognition of deferred tax assets and liabilities for the expected future tax consequences of temporary differences between the carrying amounts and the tax basis of assets and liabilities. Developing our provision for income taxes requires significant judgment and expertise in federal, international and state income tax laws, regulations and strategies, including the determination of deferred tax assets and liabilities and, if necessary, any valuation allowances that may be required for deferred tax assets. In assessing the extent to which net deferred tax assets may be realized, we consider whether it is more-likely-than-not that some portion or all of the net deferred tax assets may not be realized. The ultimate realization of net deferred tax assets is dependent on the generation of future taxable income during the periods in which those temporary differences become deductible. Due to the historical Canadian losses, and the losses that we projected at the time of determination, we were required under the more-likely-than-not accounting standard to record a valuation allowance against the Canadian net deferred tax assets because we anticipated that we may not be able to realize the benefits of the net operating loss carryforwards and other deductible differences. Estimates may change as new events occur, estimates of future taxable income during the carryforward period are reduced or increased, additional information becomes available or operating environments change, which may result in a full or partial reversal of the valuation allowance. We will continue to assess the adequacy of the valuation allowance on a quarterly basis. Our judgments and tax strategies are subject to audit by various taxing authorities.
The objectives of accounting for income taxes are to recognize the amount of taxes payable or refundable for the current year and deferred tax liabilities and assets for the future tax consequences of events that have been recognized in an entity’s financial statements or tax returns. We recognize the tax benefit from an uncertain tax position only if it is more likely than not that the tax position will be sustained on examination by the taxing authorities, based on the technical merits of the position. The tax benefits recognized in the financial statements from such a position should be measured based on the largest benefit that has a greater than 50% likelihood of being realized upon ultimate settlement. Accounting literature also provides guidance on derecognition of income tax assets and liabilities, classification of current and deferred income tax assets and liabilities, accounting for interest and penalties associated with tax positions, and income tax disclosures. Judgment is required in assessing the future tax consequences of events that have been recognized in our financial statements or tax returns. Variations in the actual outcome of these future tax consequences could materially impact our financial statements.
34
Our revenues are primarily generated from the engineering and manufacturing of custom products under long-term contracts that may last from one month to several years, depending on the contract. Revenues from long-term contracts are recognized on the percentage-of-completion method of accounting. Occasionally a contract may require that we segment the project into specific deliverables for revenue recognition. Segmenting a contract may result in different interim rates of profitability for each scope of service than if we had recognized revenue on a combined basis.
Under the percentage-of-completion method of accounting, revenues are recognized as work is performed. The revenue earned to date is calculated by multiplying the total contract price by the percentage of performance to date, which is based on total costs or total labor dollars incurred to date compared to the total estimated costs or total labor dollars estimated at completion. The method used to determine the percentage of completion is typically the cost method, unless the labor method is a more accurate method of measuring the progress of the project. Application of the percentage-of-completion method of accounting requires the use of estimates of costs to be incurred for the performance of the contract. Contract costs include all direct material costs, direct labor costs and those indirect costs related to contract performance, such as indirect labor, supplies, tools, repairs and all costs associated with operation of equipment. The cost estimation process is based upon the professional knowledge and experience of our engineers, project managers and financial professionals. Factors that are considered in estimating the work to be completed and ultimate contract recovery include the availability and productivity of labor, the nature and complexity of the work to be performed, the effect of change orders, the availability of materials, the effect of any delays on our project performance and the recoverability of any claims. Changes in job performance, job conditions, estimated profitability and final contract settlements, including our estimate of liquidated damages, if any, may result in revisions to costs and income, with their effects being recognized in the period in which the revisions are determined. Whenever revisions of estimated contract costs and contract values indicate that the contract costs will exceed estimated revenues, thus creating a loss, a provision for the total estimated loss is recorded in that period.
Revenues associated with maintenance, repair and service contracts are recognized when the services are performed. Expenses related to these types of services are recognized as incurred.
Warranty Costs
We provide for estimated warranty costs with the recognition of revenue based upon historical rates applicable to individual product lines. In addition, specific provisions are made when the costs of such warranties are expected to exceed accruals. Our standard terms and conditions of sale include a warranty for parts and service for the earlier of 18 months from the date of shipment or 12 months from the date of energization, whichever occurs first. Occasionally projects require warranty terms that are longer than our standard terms due to the nature of the project. Extended warranty terms may be negotiated and included in our contracts. We use past experience and historical claims to determine the estimated liability. Actual results could differ from our estimate.
Research and Development Expense
Research and development activities are directed toward the development of new products and processes as well as improvements in existing products and processes. These costs, which primarily include salaries, contract services and supplies, are expensed as incurred. Such amounts were $6.7 million, $7.0 million and $7.6 million in Fiscal 2016, 2015 and 2014, respectively.
Foreign Currency Translation
The functional currency for our foreign subsidiaries is the local currency in which the entity is located. The financial statements of all subsidiaries with a functional currency other than the U.S. Dollar have been translated into U.S. Dollars. All assets and liabilities of foreign operations are translated into U.S. Dollars using year-end exchange rates, and all revenues and expenses are translated at average rates during the respective period. The U.S. Dollar results that arise from such translation, as well as exchange gains and losses on intercompany balances of a long-term investment nature, are included in the cumulative currency translation adjustments in accumulated other comprehensive income in stockholders’ equity.
Stock-Based Compensation
We measure stock-based compensation cost at the grant date based on the fair value of the award. Compensation expense is recognized over the period during which the recipient is required to provide service in exchange for the awards, typically the vesting period. Excess income tax benefits related to share-based compensation expense that must be recognized directly in equity are considered financing rather than operating cash flow activities.
35
From time to time, new accounting pronouncements are issued by the Financial Accounting Standards Board (the FASB), which are adopted by us as of the specified effective date. Unless otherwise discussed, management believes that the impact of recently issued standards, which are not yet effective, will not have a material impact on our consolidated statements upon adoption.
In May 2014, the FASB issued a new standard on revenue recognition that supersedes previously issued revenue recognition guidance. This standard provides a five-step approach to be applied to all contracts with customers and requires expanded disclosures about the nature, amount, timing and uncertainty of revenue (and the related cash flows) arising from customer contracts, significant judgments and changes in judgments used in applying the revenue model and the assets recognized from costs incurred to obtain or fulfill a contract. This guidance is now effective for fiscal years, and interim periods within those years, beginning after December 15, 2017, which would be our fiscal year ending September 30, 2019. The standard permits the use of either the full retrospective or modified retrospective transition method; therefore, we are evaluating the effect that this new guidance will have on our consolidated financial statements and related disclosures. We have not yet selected a transition method nor have we determined the effect of the standard on our ongoing financial reporting.
In November 2015, the FASB issued an amendment to the topic regarding income taxes which requires an entity to separate deferred income tax liabilities and assets into current and noncurrent amounts in the statement of financial position. Deferred tax liabilities and assets are classified as current or noncurrent based on the classification of the related asset or liability for financial reporting. Deferred tax liabilities and assets that are not related to an asset or liability for financial reporting are classified according to the expected reversal date of the temporary difference. To simplify the presentation of deferred income taxes, the amendments require that deferred income tax liabilities and assets be classified as noncurrent in a classified statement of financial position. This amendment is effective for annual reporting periods beginning after December 15, 2016, which would be our fiscal year ending September 30, 2018. We have no plans for early adoption. The adoption of this guidance is not expected to have a material impact on our consolidated financial position or results of operations.
In February 2016, the FASB issued a new topic on leases which requires lessees to recognize lease assets and lease liabilities on the balance sheet for all leases with terms longer than twelve months. Leases will be classified as either finance or operating, with classification affecting the pattern of expense recognition in the income statement. A modified retrospective transition approach is required for lessees for capital and operating leases existing at, or entered into after, the beginning of the earliest comparative period presented in the financial statements, with certain practical expedients available. The new standard is effective for fiscal years beginning after December 15, 2018, including interim periods within those fiscal years. This would be our fiscal year ending September 30, 2020. We are currently evaluating the impact of our pending adoption of the new standard, but do not expect it to have a material impact on our consolidated financial position or results of operations.
In March 2016, the FASB issued new guidance on stock-based compensation, which includes amendments to existing guidance for employee share-based payment accounting. The amendments require the recognition in the income statement of the income tax effects of vested or settled awards. The amendments also allow for the employer to repurchase more of an employee’s shares for tax withholding purposes and not classify the award as a liability that requires valuation on a mark-to-market basis. In addition, the amendments allow for a policy election to account for forfeitures as they occur rather than on an estimated basis. For public companies, the amendments in this standard are effective for annual periods beginning after December 15, 2016, including interim periods within those annual periods. This would be our fiscal year ending September 30, 2018. Early adoption is permitted in any interim or annual period. We will early adopt in Fiscal 2017, but it will not have a material impact on our consolidated financial position or results of operations.
C. Earnings Per Share
We compute basic earnings per share by dividing net income by the weighted average number of common shares outstanding during the period. Diluted earnings per common and potential common share includes the weighted average of additional shares associated with the incremental effect of dilutive restricted stock and restrictive stock units, as prescribed by the FASB guidance on earnings per share.
36
The following table reconciles basic and diluted weighted average shares used in the computation of earnings per share for the years ended September 30, 2016, 2015 and 2014 (in thousands, except per share data):
|
|
Year Ended September 30, |
|
|||||||||
|
|
2016 |
|
|
2015 |
|
|
2014 |
|
|||
|
Numerator: |
|
|
|
|
|
|
|
|
|
|
|
|
Income from continuing operations |
$ |
15,510 |
|
|
$ |
9,439 |
|
|
$ |
19,620 |
|
|
Income from discontinued operations |
|
— |
|
|
|
— |
|
|
|
9,604 |
|
|
Net income |
$ |
15,510 |
|
|
$ |
9,439 |
|
|
$ |
29,224 |
|
|
Denominator: |
|
|
|
|
|
|
|
|
|
|
|
|
Weighted average basic shares |
|
11,400 |
|
|
|
11,869 |
|
|
|
12,003 |
|
|
Dilutive effect of restricted stock units |
|
31 |
|
|
|
39 |
|
|
|
55 |
|
|
Weighted average diluted shares with assumed conversions |
|
11,431 |
|
|
|
11,908 |
|
|
|
12,058 |
|
|
Net earnings per share: |
|
|
|
|
|
|
|
|
|
|
|
|
Continuing operations |
$ |
1.36 |
|
|
$ |
0.80 |
|
|
$ |
1.63 |
|
|
Discontinued operations |
|
— |
|
|
|
— |
|
|
|
0.80 |
|
|
Basic earnings per share |
$ |
1.36 |
|
|
$ |
0.80 |
|
|
$ |
2.43 |
|
|
|
|
|
|
|
|
|
|
|
|
|
|
|
Continuing operations |
$ |
1.36 |
|
|
$ |
0.79 |
|
|
$ |
1.62 |
|
|
Discontinued operations |
|
— |
|
|
|
— |
|
|
|
0.80 |
|
|
Diluted earnings per share |
$ |
1.36 |
|
|
$ |
0.79 |
|
|
$ |
2.42 |
|
D. Detail of Selected Balance Sheet Accounts
Allowance for Doubtful Accounts
Activity in our allowance for doubtful accounts consisted of the following (in thousands):
|
|
September 30, |
|
|||||
|
|
2016 |
|
|
2015 |
|
||
|
Balance at beginning of period |
$ |
746 |
|
|
$ |
1,577 |
|
|
Bad debt expense (recovery) |
|
187 |
|
|
|
(29 |
) |
|
Uncollectible accounts written off, net of recoveries |
|
(120 |
) |
|
|
(749 |
) |
|
Change due to foreign currency translation |
|
(2 |
) |
|
|
(53 |
) |
|
Balance at end of period |
$ |
811 |
|
|
$ |
746 |
|
Inventories
The components of inventories are summarized below (in thousands):
|
|
September 30, |
|
|||||
|
|
2016 |
|
|
2015 |
|
||
|
Raw materials, parts and subassemblies |
$ |
29,639 |
|
|
$ |
36,575 |
|
|
Work-in-progress |
|
996 |
|
|
|
1,084 |
|
|
Provision for excess and obsolete inventory |
|
(4,114 |
) |
|
|
(4,768 |
) |
|
Total inventories |
$ |
26,521 |
|
|
$ |
32,891 |
|
37
Cost and Estimated Earnings on Uncompleted Contracts
The components of costs and estimated earnings and related amounts billed on uncompleted contracts are summarized below (in thousands):
|
|
September 30, |
|
|||||
|
|
2016 |
|
|
2015 |
|
||
|
Costs incurred on uncompleted contracts |
$ |
1,088,921 |
|
|
$ |
912,237 |
|
|
Estimated earnings |
|
350,125 |
|
|
|
271,640 |
|
|
|
|
1,439,046 |
|
|
|
1,183,877 |
|
|
Less: Billings to date |
|
(1,416,914 |
) |
|
|
(1,121,141 |
) |
|
Net underbilled position |
$ |
22,132 |
|
|
$ |
62,736 |
|
|
|
|
|
|
|
|
|
|
|
Included in the accompanying balance sheets under the following captions: |
|
|
|
|
|
|
|
|
Costs and estimated earnings in excess of billings on uncompleted contracts – underbilled |
$ |
66,106 |
|
|
$ |
104,793 |
|
|
Billings in excess of costs and estimated earnings on uncompleted contracts – overbilled |
|
(43,974 |
) |
|
|
(42,057 |
) |
|
Net underbilled position |
$ |
22,132 |
|
|
$ |
62,736 |
|
Property, Plant and Equipment
Property, plant and equipment are summarized below (in thousands):
|
|
September 30, |
|
|
Range of |
|||||
|
|
2016 |
|
|
2015 |
|
|
Asset Lives |
||
|
Land |
$ |
22,107 |
|
|
$ |
22,380 |
|
|
— |
|
Buildings and improvements |
|
119,512 |
|
|
|
120,983 |
|
|
3 - 39 Years |
|
Machinery and equipment |
|
103,268 |
|
|
|
100,306 |
|
|
3 - 15 Years |
|
Furniture and fixtures |
|
3,806 |
|
|
|
3,564 |
|
|
3 - 10 Years |
|
Construction in process |
|
1,009 |
|
|
|
1,013 |
|
|
— |
|
|
$ |
249,702 |
|
|
$ |
248,246 |
|
|
|
|
Less: Accumulated depreciation |
|
(104,725 |
) |
|
|
(93,652 |
) |
|
|
|
Total property, plant and equipment, net |
$ |
144,977 |
|
|
$ |
154,594 |
|
|
|
There were no assets under capital lease as of September 30, 2016 or September 30, 2015. Depreciation expense from continuing operations, including the depreciation of capital leases when applicable, was $13.0 million, $13.1 million and $11.4 million for fiscal years 2016, 2015, and 2014, respectively.
Warranty Accrual
Activity in our warranty accrual consisted of the following (in thousands):
|
|
September 30, |
|
|||||
|
|
2016 |
|
|
2015 |
|
||
|
Balance at beginning of period |
$ |
4,930 |
|
|
$ |
4,557 |
|
|
Increase to warranty expense |
|
4,249 |
|
|
|
3,364 |
|
|
Deduction for warranty charges |
|
(4,464 |
) |
|
|
(2,738 |
) |
|
Change due to foreign currency translation |
|
(76 |
) |
|
|
(253 |
) |
|
Balance at end of period |
$ |
4,639 |
|
|
$ |
4,930 |
|
E. Goodwill and Intangible Assets
Our intangible assets consist of goodwill, which is not being amortized and purchased technology, which is amortized over 6 to 7 years. We evaluate goodwill and intangible assets for impairment annually, or immediately if qualitative conditions indicate that an impairment could exist. No impairment expense has been recorded for the last three fiscal years.
38
Intangible assets balances, subject to amortization, at September 30, 2016 and 2015 consisted of the following (in thousands):
|
|
September 30, 2016 |
|
|
September 30, 2015 |
|
||||||||||||||||||
|
|
Gross |
|
|
|
|
|
|
Net |
|
|
Gross |
|
|
|
|
|
|
Net |
|
||||
|
|
Carrying |
|
|
Accumulated |
|
|
Carrying |
|
|
Carrying |
|
|
Accumulated |
|
|
Carrying |
|
||||||
|
|
Value |
|
|
Amortization |
|
|
Value |
|
|
Value |
|
|
Amortization |
|
|
Value |
|
||||||
|
Purchased technology |
$ |
11,749 |
|
|
$ |
(10,693 |
) |
|
$ |
1,056 |
|
|
$ |
11,749 |
|
|
$ |
(10,359 |
) |
|
$ |
1,390 |
|
Amortization of intangible assets recorded for the years ended September 30, 2016, 2015 and 2014, was $0.4 million, $0.4 million and $0.8 million, respectively.
Estimated amortization expense for each of the five subsequent fiscal years is expected to be (in thousands):
|
Years Ending September 30, |
|
Total |
|
|
|
2017 |
|
$ |
352 |
|
|
2018 |
|
|
352 |
|
|
2019 |
|
|
352 |
|
|
2020 |
|
|
― |
|
|
2021 |
|
|
― |
|
On August 7, 2006, we purchased certain assets related to the manufacturing of ANSI medium-voltage switchgear and circuit breaker business from General Electric Company (GE). In connection with the acquisition, we entered into a 15-year supply agreement with GE pursuant to which GE would purchase from us all of its requirements for ANSI medium-voltage switchgear and circuit breakers and other related equipment and components (the Products). In connection with the acquisition, we recorded an intangible asset related to this supply agreement. On December 30, 2013, we and GE amended the supply agreement to allow GE to manufacture similar Products for sale immediately and allow them to begin purchasing Products from other suppliers beginning December 31, 2014. In return, GE paid us $10 million upon execution of the amended supply agreement and agreed to pay an additional $7 million over three years, subject to certain conditions. As of September 30, 2016, the remaining balance of $2.3 million is classified as other current assets. We wrote off the intangible asset related to the original supply agreement and recorded a deferred credit in the amount of $8.1 million at December 31, 2013, the amount by which the total proceeds from GE exceeded the unamortized balance of our intangible asset. We are amortizing this deferred credit over the four-year life of the agreement and have recognized gains in other income of $2.0 million for both the years ended September 30, 2016 and 2015.
F. Long-Term Debt
Long-term debt consisted of the following (in thousands):
|
|
September 30, |
|
|||||
|
|
2016 |
|
|
2015 |
|
||
|
Industrial development revenue bonds |
$ |
2,400 |
|
|
$ |
2,800 |
|
|
Less: current portion |
|
(400 |
) |
|
|
(400 |
) |
|
Total long-term debt |
$ |
2,000 |
|
|
$ |
2,400 |
|
The annual maturities of long-term debt as of September 30, 2016, were as follows (in thousands):
|
Year Ending September 30, |
|
Long‑Term |
|
|
|
2017 |
|
$ |
400 |
|
|
2018 |
|
|
400 |
|
|
2019 |
|
|
400 |
|
|
2020 |
|
|
400 |
|
|
2021 |
|
|
400 |
|
|
Thereafter |
|
|
400 |
|
|
Total long-term debt maturities |
|
$ |
2,400 |
|
39
We have a $75.0 million revolving credit facility (U.S. Revolver) to provide working capital support and letters of credit.
The interest rate for amounts outstanding under the U.S. Revolver is a floating rate based upon the higher of the Federal Funds Rate plus 0.5%, the bank’s prime rate, or the Eurocurrency rate plus 1.00%. Once the applicable rate is determined, a margin ranging up to 1.75%, as determined by our consolidated leverage ratio, is added to the applicable rate.
The U.S. Revolver provides for the issuance of letters of credit which reduce the amounts that may be borrowed under this revolver. The amount available under the U.S. Revolver was reduced by $26.8 million for our outstanding letters of credit at September 30, 2016.
There were no borrowings outstanding under the U.S. Revolver as of September 30, 2016. Amounts available under the U.S. Revolver were $48.2 million at September 30, 2016. The U.S. Revolver expires on December 31, 2018.
The U.S. Revolver contains certain restrictive and maintenance-type covenants, such as restrictions on the amount of capital expenditures allowed. It also contains financial covenants defining various financial measures and the levels of these measures with which we must comply, as well as a “material adverse change” clause. A “material adverse change” is defined as a material change in our operations, business, properties, liabilities or condition (financial or otherwise) or a material impairment of our ability to perform our obligations under our credit agreements.
The U.S. Revolver is collateralized by a pledge of 100% of the voting capital stock of each of our domestic subsidiaries and 65% of the voting capital stock of each non-domestic subsidiary. The U.S. Revolver provides for customary events of default and carries cross-default provisions with other existing debt agreements. If an event of default (as defined in the U.S. Revolver) occurs and is continuing, on the terms and subject to the conditions set forth in the U.S. Revolver, amounts outstanding under the U.S. Revolver may be accelerated and may become immediately due and payable. As of September 30, 2016, we were in compliance with all of the financial covenants of the U.S. Revolver.
Canadian Revolver
We have a $7.6 million credit agreement with a major international bank in Canada (the Canadian Revolver) to provide working capital support and letters of credit for our operations in Canada. The Canadian Revolver provides for the issuance of letters of credit which reduce the amounts that may be borrowed under this revolver. There were no outstanding letters of credit at September 30, 2016. The interest rate for amounts outstanding under the Canadian Revolver is a floating interest rate based upon either the Canadian Prime Rate, or the lender’s Bankers’ Acceptance Rate. Once the applicable rate is determined, a margin of 0.50% to 1.75%, as determined by our consolidated leverage ratio, is added to the applicable rate. The Canadian Revolver expires on March 31, 2018.
There were no borrowings outstanding under the Canadian Revolver as of September 30, 2016 and amounts available under the Canadian Revolver were $7.6 million at September 30, 2016.
The principal financial covenants are consistent with those described in our U.S. Revolver. The Canadian Revolver contains a “material adverse effect” clause. A “material adverse effect” is defined as a material change in the operations of Powell or Powell Canada Inc. in relation to our financial condition, property, business operations, expected net cash flows, liabilities or capitalization.
The Canadian Revolver is secured by the assets of our Canadian operations and provides for customary events of default and carries cross-default provisions with our existing debt agreements. If an event of default (as defined in the Canadian Revolver) occurs and is continuing, per the terms and subject to the conditions set forth in the Canadian Revolver, amounts outstanding under the Canadian Revolver may be accelerated and may become immediately due and payable. As of September 30, 2016, we were in compliance with all of the financial covenants of the Canadian Revolver.
Industrial Development Revenue Bonds
We borrowed $8.0 million in October 2001 through a loan agreement funded with proceeds from tax-exempt industrial development revenue bonds (Bonds). These Bonds were issued by the Illinois Development Finance Authority and were used for the completion of our Northlake, Illinois facility. Pursuant to the Bond issuance, a reimbursement agreement between us and a major domestic bank required an issuance by the bank of an irrevocable direct-pay letter of credit (Bond LC), as collateral, to the Bonds’ trustee to guarantee payment of the Bonds’ principal and interest when due. The Bond LC is subject to both early termination and extension provisions customary to such agreements, as well as various covenants, for which we were in compliance at September 30, 2016. While the Bonds mature in 2021, the reimbursement agreement requires annual redemptions of $0.4 million that commenced on October 25, 2002. A sinking fund is used for the redemption of the Bonds. The Bonds bear interest at a floating rate determined
40
weekly by the Bonds’ remarketing agent, which was the underwriter for the Bonds and is an affiliate of the bank. This interest rate was 1.02% as of September 30, 2016.
G. Commitments and Contingencies
Long-Term Debt
See Note F herein for a discussion of our long-term debt.
Leases
We lease certain offices, facilities and equipment under operating leases expiring at various dates through 2023.
At September 30, 2016, the minimum annual rental commitments under leases having terms in excess of one year were as follows (in thousands):
|
Years Ending September 30, |
|
Operating |
|
|
|
2017 |
$ |
2,495 |
|
|
|
2018 |
|
1,491 |
|
|
|
2019 |
|
1,167 |
|
|
|
2020 |
|
1,470 |
|
|
|
2021 |
|
1,370 |
|
|
|
Thereafter |
|
2,485 |
|
|
|
Total lease commitments |
$ |
10,478 |
|
|
Lease expense for all operating leases was $3.5 million, $4.0 million and $3.9 million for Fiscal 2016, 2015 and 2014, respectively. In Fiscal 2015, we exited one of our previously occupied leased facilities in Acheson, Alberta, Canada. The lease does not expire until October 2019; however, we have sublet that facility through the remaining term of the lease. In Fiscal 2014, we also exited one of our previously occupied leased facilities in Edmonton, Alberta, Canada. This lease does not expire until July 2023; however, we have sublet that facility through July 2019.
Letters of Credit and Bonds
Certain customers require us to post bank letter of credit guarantees or surety bonds. These guarantees and surety bonds assure that we will perform under the terms of our contract. In the event of default, the counterparty may demand payment from the bank under a letter of credit or performance by the surety under a bond. To date, there have been no significant expenses related to either letters of credit or surety bonds for the periods reported. We were contingently liable for secured and unsecured letters of credit of $26.8 million as of September 30, 2016. We also had performance and maintenance bonds totaling $233.6 million that were outstanding, with additional bonding capacity of $516.4 million available, at September 30, 2016.
We have a $9.1 million facility agreement (Facility Agreement) between Powell (UK) Limited and a large international bank. This Facility Agreement provides Powell (UK) Limited the ability to enter into bank guarantees as well as forward exchange contracts and currency options. At September 30, 2016, we had outstanding guarantees totaling $4.1 million under this Facility Agreement and amounts available under this Facility Agreement were $5.0 million. This facility expired in November 2016. The Facility Agreement provides for financial covenants and customary events of default, and carries cross-default provisions with our U.S. Revolver. If an event of default (as defined in the Facility Agreement) occurs and is continuing, per the terms and subject to the conditions set forth therein, obligations outstanding under the Facility Agreement may be accelerated and may become or be declared immediately due and payable. As of September 30, 2016, we were in compliance with all of the financial covenants of the Facility Agreement.
Litigation
We are involved in various legal proceedings, claims and other disputes arising from our commercial operations, projects, employees and other matters which, in general, are subject to uncertainties and in which the outcomes are not predictable. Although we can give no assurances about the resolution of pending claims, litigation or other disputes and the effect such outcomes may have on us, management believes that any ultimate liability resulting from the outcome of such proceedings, to the extent not otherwise provided or covered by insurance, will not have a material adverse effect on our consolidated financial position or results of operations or liquidity.
41
Liquidated Damages
Certain of our customer contracts have schedule and performance obligation clauses that, if we fail to meet them, could require us to pay liquidated damages. Each individual contract defines the conditions under which the customer may make a claim against us. As of September 30, 2016, our exposure to possible liquidated damages is $2.5 million, of which approximately $1.5 million is probable. Based on our actual or projected failure to meet these various contractual commitments, $1.5 million has been recorded as a reduction to revenue. We will attempt to obtain change orders, contract extensions or accelerate project completion which may resolve the potential for any unaccrued liquidated damage. Should we fail to achieve relief on some or all of these contractual obligations, we could be required to pay additional liquidated damages, which could negatively impact our future operating results.
H. Income Taxes
The components of the income tax provision were as follows (in thousands):
|
|
Year Ended September 30, |
|
|||||||||
|
|
2016 |
|
|
2015 |
|
|
2014 |
|
|||
|
Current: |
|
|
|
|
|
|
|
|
|
|
|
|
Federal |
$ |
(1,395 |
) |
|
$ |
2,638 |
|
|
$ |
12,184 |
|
|
State |
|
449 |
|
|
|
699 |
|
|
|
2,226 |
|
|
Foreign |
|
899 |
|
|
|
(306 |
) |
|
|
(130 |
) |
|
|
|
(47 |
) |
|
|
3,031 |
|
|
|
14,280 |
|
|
Deferred: |
|
|
|
|
|
|
|
|
|
|
|
|
Federal |
|
1,923 |
|
|
|
3,296 |
|
|
|
(1,798 |
) |
|
State |
|
47 |
|
|
|
420 |
|
|
|
(311 |
) |
|
Foreign |
|
360 |
|
|
|
6,805 |
|
|
|
(1,103 |
) |
|
|
|
2,330 |
|
|
|
10,521 |
|
|
|
(3,212 |
) |
|
Total income tax provision |
$ |
2,283 |
|
|
$ |
13,552 |
|
|
$ |
11,068 |
|
Income before income taxes was as follows (in thousands):
|
|
Year Ended September 30, |
|
|||||||||
|
|
2016 |
|
|
2015 |
|
|
2014 |
|
|||
|
U.S. |
$ |
5,087 |
|
|
$ |
33,549 |
|
|
$ |
35,131 |
|
|
Other than U.S. |
|
12,706 |
|
|
|
(10,558 |
) |
|
|
(4,443 |
) |
|
Income before income taxes |
$ |
17,793 |
|
|
$ |
22,991 |
|
|
$ |
30,688 |
|
A reconciliation of the statutory U.S. income tax rate and the effective income tax rate, as computed on earnings before income tax provision in each of the three years presented in the Consolidated Statements of Operations, was as follows:
|
|
Year Ended September 30, |
|
|||||||||
|
|
2016 |
|
|
2015 |
|
|
2014 |
|
|||
|
Statutory rate |
|
35 |
% |
|
|
35 |
% |
|
|
35 |
% |
|
State income taxes, net of federal benefit |
|
2 |
|
|
|
3 |
|
|
|
3 |
|
|
Research and development credit |
|
(8 |
) |
|
|
(21 |
) |
|
|
— |
|
|
Foreign rate differential |
|
(8 |
) |
|
|
4 |
|
|
|
1 |
|
|
Domestic production activities deduction |
|
— |
|
|
|
(3 |
) |
|
|
(3 |
) |
|
Foreign valuation allowance |
|
(11 |
) |
|
|
43 |
|
|
|
— |
|
|
Other |
|
3 |
|
|
|
(2 |
) |
|
|
— |
|
|
Effective rate |
|
13 |
% |
|
|
59 |
% |
|
|
36 |
% |
Our provision for income taxes reflects an effective tax rate on pre-tax earnings of 13% in Fiscal 2016 compared to 59% and 36% in Fiscal 2015 and 2014, respectively. The effective tax rate for Fiscal 2016 was favorably impacted by the statutory tax rates in the United Kingdom (U.K.) and Canada and the relative amounts of income earned in those jurisdictions, as well as the utilization of net operating loss carryforwards in Canada that have been fully reserved with a valuation allowance. Additionally, the effective tax rate for Fiscal 2016 was favorably impacted by a $0.8 million discrete item recorded in the first quarter of Fiscal 2016 related to the retroactive reinstatement of the Research and Development Tax Credit (R&D Tax Credit) for the previously expired period from
42
January 1, 2015 to September 30, 2015. On December 18, 2015, the “Protecting Americans from Tax Hikes Act of 2015” was enacted which retroactively reinstated and made permanent the R&D Tax Credit. The effective tax rate for Fiscal 2015 was adversely impacted by the establishment of a valuation allowance against our Canadian deferred tax assets during the second quarter of Fiscal 2015. This was partially offset by the release of a $4.1 million FIN 48 reserve related to the R&D Tax Credit upon closing an IRS audit. We also recorded a $0.6 million discrete item in Fiscal 2015 that was also related to the retroactive reinstatement of the R&D Tax Credit referred to above. The effective tax rate for Fiscal 2014 approximated the combined U.S. federal and state statutory rate.
We have not recorded deferred income taxes on $21.5 million of undistributed earnings of our foreign subsidiaries because of management’s intent to indefinitely reinvest such earnings. Upon distribution of these earnings in the form of dividends or otherwise, we may be subject to U.S. income taxes and foreign withholding taxes. It is not practical, however, to estimate the amount of taxes that may be payable on the eventual remittance of these earnings.
We are subject to income tax in the U.S., multiple state jurisdictions and certain international jurisdictions, primarily the U.K. and Canada. We do not consider any state in which we do business to be a major tax jurisdiction. We remain open to examination in the other jurisdictions as follows: Canada 2011 – 2015, United Kingdom 2014 – 2015 and the United States 2013 and 2015.
The net deferred income tax asset was comprised of the following (in thousands):
|
|
September 30, |
|
|||||
|
|
2016 |
|
|
2015 |
|
||
|
Current deferred income taxes: |
|
|
|
|
|
|
|
|
Gross assets |
$ |
4,384 |
|
|
$ |
3,910 |
|
|
Gross liabilities |
|
(378 |
) |
|
|
— |
|
|
Net current deferred income tax asset |
|
4,006 |
|
|
|
3,910 |
|
|
Noncurrent deferred income taxes: |
|
|
|
|
|
|
|
|
Gross assets |
|
16,170 |
|
|
|
5,005 |
|
|
Gross liabilities |
|
(16,308 |
) |
|
|
(2,717 |
) |
|
Net noncurrent deferred income tax asset (liability) |
|
(138 |
) |
|
|
2,288 |
|
|
Net deferred income tax asset |
$ |
3,868 |
|
|
$ |
6,198 |
|
The tax effect of temporary differences between U.S. GAAP accounting and federal income tax accounting creating deferred income tax assets and liabilities was as follows (in thousands):
|
|
September 30, |
|
|||||
|
|
2016 |
|
|
2015 |
|
||
|
Deferred Tax Assets: |
|
|
|
|
|
|
|
|
Net operating loss |
$ |
10,453 |
|
|
$ |
9,877 |
|
|
Uniform capitalization and inventory |
|
1,596 |
|
|
|
1,895 |
|
|
Deferred compensation |
|
1,853 |
|
|
|
1,848 |
|
|
Stock-based compensation |
|
760 |
|
|
|
993 |
|
|
Reserve for accrued employee benefits |
|
1,679 |
|
|
|
1,482 |
|
|
Warranty accrual |
|
1,388 |
|
|
|
915 |
|
|
Goodwill |
|
345 |
|
|
|
398 |
|
|
Postretirement benefits liability |
|
503 |
|
|
|
— |
|
|
Allowance for doubtful accounts |
|
220 |
|
|
|
166 |
|
|
Accrued legal |
|
294 |
|
|
|
60 |
|
|
Credit carryforwards |
|
1,292 |
|
|
|
1,329 |
|
|
Other |
|
171 |
|
|
|
8 |
|
|
Deferred tax assets |
|
20,554 |
|
|
|
18,971 |
|
|
Deferred Tax Liabilities: |
|
|
|
|
|
|
|
|
Depreciation and amortization |
|
(8,247 |
) |
|
|
(2,705 |
) |
|
Other |
|
— |
|
|
|
(12 |
) |
|
Deferred tax liabilities |
|
(8,247 |
) |
|
|
(2,717 |
) |
|
|
|
|
|
|
|
|
|
|
Less: valuation allowance |
|
(8,439 |
) |
|
|
(10,056 |
) |
|
Net deferred tax asset |
$ |
3,868 |
|
|
$ |
6,198 |
|
At September 30, 2016, we had $39 million of gross foreign net operating loss carryforwards, the majority of which are subject to a
43
20-year carryforward period and will begin to expire in 2031. During Fiscal 2015, we established a valuation allowance in the amount of $9.3 million against Canadian net deferred tax assets. In assessing the realizability of net deferred tax assets, we consider whether it is more-likely-than-not that some portion or all of the net deferred tax assets may not be realized. The ultimate realization of net deferred tax assets is dependent on the generation of future taxable income during the periods in which those temporary differences become deductible. Due to the historical Canadian losses, and the losses that we projected at the time of determination, we were required under the more-likely-than-not accounting standard to record a valuation allowance against the Canadian net deferred tax assets because we anticipated that we may not be able to realize the benefits of the net operating loss carryforwards and other deductible differences.
A rollforward of the valuation allowance for the past three years is summarized below:
|
Balance at September 30, 2013 |
$ |
135 |
|
|
|
Charged to cost and expenses |
|
80 |
|
|
|
Charged to other accounts |
|
688 |
|
|
|
Balance at September 30, 2014 |
$ |
903 |
|
|
|
Charged to cost and expenses |
|
10,048 |
|
|
|
Charged to other accounts |
|
(895 |
) |
|
|
Balance at September 30, 2015 |
$ |
10,056 |
|
|
|
Charged to cost and expenses |
|
(1,934 |
) |
|
|
Charged to other accounts |
|
317 |
|
|
|
Balance at September 30, 2016 |
$ |
8,439 |
|
|
A reconciliation of the beginning and ending amount of the unrecognized tax benefits follows (in thousands):
|
|
Year Ended September 30, |
|
|||||||||
|
|
2016 |
|
|
2015 |
|
|
2014 |
|
|||
|
Balance at beginning of period |
$ |
784 |
|
|
$ |
4,026 |
|
|
$ |
3,845 |
|
|
Increases related to tax positions taken during the current period |
|
293 |
|
|
|
954 |
|
|
|
225 |
|
|
Increases related to tax positions taken during a prior period |
|
― |
|
|
|
2 |
|
|
|
14 |
|
|
Decreases related to expiration of statute of limitations |
|
(31 |
) |
|
|
(49 |
) |
|
|
(58 |
) |
|
Decreases related to settlement with taxing authorities |
|
― |
|
|
|
(4,149 |
) |
|
|
— |
|
|
Balance at end of period |
$ |
1,046 |
|
|
$ |
784 |
|
|
$ |
4,026 |
|
Our continuing policy is to recognize interest and penalties related to income tax matters as tax expense. The amount of interest and penalty expense recorded for the year ended September 30, 2016 was not material.
During Fiscal 2013, prior year U.S. federal income tax returns were amended to reflect increased R&D Credits and unrecognized tax benefits related to these refund claims were recorded. These amended returns, along with the refund claims, were subject to an Internal Revenue Service audit which was closed during the second quarter of Fiscal 2015 resulting in a $4.1 million tax benefit. Due to the expiration of certain federal statutes of limitations, management believes that, within the next 12 months, it is reasonably possible that the unrecognized tax benefits will decrease by approximately 32%.
Management believes that an adequate provision has been made for any adjustments that may result from tax examinations. However, the outcome of tax audits cannot be predicted with certainty. If any issues addressed in our tax audits are resolved in a manner not consistent with management’s expectations, we could be required to adjust our provision for income tax in the period such resolution occurs. Although timing of the resolution and/or closure of audits is uncertain, we believe it is probable that our unrecognized tax benefits could decrease by approximately 33% in the next 12 months due to an audit resolution.
44
Retirement Plans
We have defined employee contribution plans for substantially all of our U.S. employees (401(k) plan) and our Canadian employees (Registered Retirement Savings Plan). We recognized expenses under these plans primarily related to matching contributions of $3.9 million, $5.9 million and $5.3 million in Fiscal 2016, 2015 and 2014, respectively.
Deferred Compensation
We offer a non-qualified deferred compensation plan to a select group of management and highly compensated individuals. The plan permits the deferral of up to 50% of a participant’s base salary and/or 100% of a participant’s annual incentive bonus. The deferrals are held in a separate trust, an irrevocable rabbi trust (the Rabbi Trust), which has been established to administer the plan. The Rabbi Trust is intended to be used as a source of funds to match respective funding obligations to participants. The assets of the trust are subject to the claims of our creditors in the event that we become insolvent. Consequently, the Rabbi Trust qualifies as a grantor trust for income tax purposes. We make periodic payments into company-owned life insurance policies held in this Rabbi Trust to fund the expected obligations arising under this plan. The assets and liabilities of the plan are recorded in other assets and deferred compensation, respectively, in the accompanying Consolidated Balance Sheets. Changes in the deferred compensation balance are recorded to compensation expense and reflected within the selling, general and administrative line in the Consolidated Statements of Operations. The plan is not qualified under Section 401 of the Internal Revenue code. We recorded net compensation expense adjustments of $0.1 million related to this plan in Fiscal 2016. Total assets held by the trustee and deferred compensation liabilities were $5.8 million and $4.4 million, respectively, at September 30, 2016.
Certain former executives were provided an executive benefit plan which provides for fixed payments upon normal retirement on or after age 65 and the completion of at least 10 years of continuous employment. The estimated present value of these payments were accrued over the service life of these individuals, and $0.4 million is recorded in deferred compensation related to this executive benefit plan. To assist in funding the deferred compensation liability, we have invested in corporate-owned life insurance policies. The cash surrender value of these policies is presented in other assets and was $4.6 million at September 30, 2016.
Retiree Medical Plan
We have a plan that extends health benefits to retirees that are also available to active employees under our existing health plans. This plan is unfunded. The plan provides coverage for employees with at least 10 years of service who are age 55 or older but less than 65. The retiree is required to pay the COBRA rate less a subsidy provided by us based on years of service at the time of retirement. The unfunded liability was $1.4 million and $0.7 million as of September 30, 2016 and 2015, respectively, and our net periodic postretirement benefit expenses have been less than $0.1 million for the last three fiscal years. Due to the immateriality of the costs and liabilities of this plan, no further disclosure is being presented.
J. Stock-Based Compensation
We have the following stock-based compensation plans:
2014 Equity Incentive Plan
In February 2014, our stockholders approved and adopted at the Annual Meeting of Stockholders the 2014 Equity Incentive Plan (the 2014 Plan) which replaced our 2006 Equity Compensation Plan (2006 Plan). Persons eligible to receive awards under the 2014 Plan include our officers and employees. The 2014 Plan authorizes stock options, stock appreciation rights, restricted stock, restricted stock units and performance-based awards, as well as certain other awards. Restricted stock grants vest equally over their respective vesting period on each anniversary of the grant date and compensation expense is recognized over their respective vesting periods based on the price per share on the grant date.
In accordance with the 2014 Plan, the compensation committee has authorized grants of restricted stock units (RSUs) to certain officers and key employees of the company. The fair value of the RSUs is based on the closing price of our common stock as reported on the NASDAQ Global Market (NASDAQ) on the grant dates. Typically, these grants vest over a three-year period from their date of issuance. In February 2016, the Board of Directors voted to modify future RSU awards. The modification provides that sixty percent of the grant is time-based and vests over a three-year period on each anniversary of the grant date, based on continued employment. The remaining forty percent of the grant will be earned based on the three-year earnings performance of the Company following the grant date. At September 30, 2016, there were 159,988 RSUs outstanding. The RSUs do not have voting rights but do receive dividend equivalents upon vesting; additionally, the shares of common stock underlying the RSUs are not considered issued and outstanding until vested and common stock is issued.
45
Total RSU activity (number of shares) for the past three years is summarized below:
|
|
Number of |
|
|
Weighted |
|
||
|
|
Restricted |
|
|
Average |
|
||
|
|
Stock |
|
|
Fair Value |
|
||
|
|
Units |
|
|
Per Share |
|
||
|
Outstanding at September 30, 2013 |
|
81,555 |
|
|
$ |
38.66 |
|
|
Granted |
|
57,200 |
|
|
|
66.15 |
|
|
Vested |
|
(29,832 |
) |
|
|
44.88 |
|
|
Forfeited |
|
(2,078 |
) |
|
|
56.34 |
|
|
Outstanding at September 30, 2014 |
|
106,845 |
|
|
$ |
51.30 |
|
|
Granted |
|
89,500 |
|
|
|
41.75 |
|
|
Vested |
|
(55,431 |
) |
|
|
45.23 |
|
|
Forfeited |
|
(7,408 |
) |
|
|
43.82 |
|
|
Outstanding at September 30, 2015 |
|
133,506 |
|
|
$ |
47.83 |
|
|
Granted |
|
168,800 |
|
|
|
31.64 |
|
|
Vested(1) |
|
(116,568 |
) |
|
|
33.10 |
|
|
Forfeited |
|
(25,750 |
) |
|
|
50.28 |
|
|
Outstanding at September 30, 2016 |
|
159,988 |
|
|
$ |
43.12 |
|
|
|
(1) |
Includes the accelerated vesting of 84,043 shares previously issued to our former Chief Executive Officer and other senior managers as part of their separation packages, see Note M. |
We have reserved 750,000 shares of common stock for issuance under the 2014 Plan. In Fiscal 2016, 63,628 shares were issued under the 2014 Plan and the total number of shares of common stock left available was 664,911 shares.
2014 Non-Employee Director Equity Incentive Plan
In February 2014, our stockholders approved and adopted at the Annual Meeting of Stockholders the 2014 Non-Employee Director Equity Incentive Plan (the 2014 Director Plan). The total number of shares of common stock reserved under the plan is 150,000 shares. The plan is administered by the Compensation Committee. Eligibility to participate in the plan is limited to those individuals who are members of the Board of the Company and who are not employees of the Company or any affiliate of the Company.
Under the terms of the 2014 Director Plan, the maximum number of shares that may be granted during any calendar year to any individual is 12,000 shares. The total number of shares that may be issued for awards to any single participant during a calendar year for other stock-based awards (excluding stock options and SARs) is 4,000 shares. The Compensation Committee has determined that each non-employee director will receive 2,000 restricted shares of the Company’s common stock annually and that the annual grant of restricted shares will vest over a two-year period, of which 50% will vest on each anniversary of the grant date.
In February 2016, we issued 16,000 shares of restricted stock to our non-employee directors at a price of $25.63 per share and in April 2016, we also issued 1,000 shares of restricted stock to a non-employee director at a price of $29.38 per share under the 2014 Director Plan. In February 2015, we issued 16,000 restricted shares at a price of $33.37 per share and in September 2015, we issued 1,400 restricted shares at a price of $29.48 per share under the 2014 Director Plan. The total number of shares of common stock available for future awards under the 2014 Director plan was 101,600 shares as of September 30, 2016.
At September 30, 2016 and 2015, there were 26,800 shares and 26,200 shares of unvested restricted stock outstanding. Total compensation expense related to restricted stock grants under all plans was $0.7 million, $1.3 million and $1.3 million for the years ended September 30, 2016, 2015 and 2014, respectively. Total compensation expense related to RSU’s under all plans was $4.2 million, $1.9 million and $2.1 million for the years ended September 30, 2016, 2015 and 2014, respectively.
We record the amortization of non-vested restricted stock and restricted stock units as an increase to additional paid-in capital. As of September 30, 2016 and 2015, amounts not yet recognized related to non-vested stock totaled $2.1 million and $1.9 million, respectively. As of September 30, 2016, the total weighted average remaining contractual life of our restricted stock and RSU’s is 0.82 years and 1.83 years, respectively.
K. Fair Value Measurements
We measure certain financial assets and liabilities at fair value. Fair value is defined as an “exit price” which represents the amount that would be received to sell an asset or paid to transfer a liability in an orderly transaction between market participants as of the
46
measurement date. As such, fair value is a market-based measurement that should be determined based on assumptions that market participants would use in valuing an asset or liability. The accounting guidance requires the use of valuation techniques to measure fair value that maximize the use of observable inputs and minimize the use of unobservable inputs. As a basis for considering such assumptions and inputs, a fair value hierarchy has been established that identifies and prioritizes three levels of inputs to be used in measuring fair value.
The three levels of the fair value hierarchy are as follows:
Level 1 — Observable inputs such as quoted prices (unadjusted) in active markets for identical assets or liabilities.
Level 2 — Inputs other than the quoted prices in active markets that are observable either directly or indirectly, including: quoted prices for similar assets and liabilities in active markets; quoted prices for identical or similar assets and liabilities in markets that are not active or other inputs that are observable or can be corroborated by observable market data.
Level 3 — Unobservable inputs that are supported by little or no market data and require the reporting entity to develop its own assumptions.
The following table summarizes the fair value of our assets and liabilities that were accounted for at fair value on a recurring basis as of September 30, 2016 (in thousands):
|
|
Fair Value Measurements at September 30, 2016 |
|
|||||||||||||
|
|
Quoted Prices in |
|
|
Significant Other |
|
|
Significant |
|
|
|
|
|
|||
|
|
Active Markets for |
|
|
Observable |
|
|
Unobservable |
|
|
Fair Value at |
|
||||
|
|
Identical Assets |
|
|
Inputs |
|
|
Inputs |
|
|
September 30, |
|
||||
|
|
(Level 1) |
|
|
(Level 2) |
|
|
(Level 3) |
|
|
2016 |
|
||||
|
Assets: |
|
|
|
|
|
|
|
|
|
|
|
|
|
|
|
|
Cash equivalents |
$ |
435 |
|
|
$ |
— |
|
|
$ |
— |
|
|
$ |
435 |
|
|
Deferred compensation |
|
1,643 |
|
|
|
4,130 |
|
|
|
— |
|
|
|
5,773 |
|
|
Liabilities: |
|
|
|
|
|
|
|
|
|
|
|
|
|
|
|
|
Deferred compensation |
|
— |
|
|
|
4,449 |
|
|
|
— |
|
|
|
4,449 |
|
The following table summarizes the fair value of our assets and liabilities that were accounted for at fair value on a recurring basis as of September 30, 2015 (in thousands):
|
|
Fair Value Measurements at September 30, 2015 |
|
|||||||||||||
|
|
Quoted Prices in |
|
|
Significant Other |
|
|
Significant |
|
|
|
|
|
|||
|
|
Active Markets for |
|
|
Observable |
|
|
Unobservable |
|
|
Fair Value at |
|
||||
|
|
Identical Assets |
|
|
Inputs |
|
|
Inputs |
|
|
September 30, |
|
||||
|
|
(Level 1) |
|
|
(Level 2) |
|
|
(Level 3) |
|
|
2015 |
|
||||
|
Assets: |
|
|
|
|
|
|
|
|
|
|
|
|
|
|
|
|
Cash equivalents |
$ |
434 |
|
|
$ |
— |
|
|
$ |
— |
|
|
$ |
434 |
|
|
Deferred compensation |
|
1,879 |
|
|
|
2,904 |
|
|
|
— |
|
|
|
4,783 |
|
|
Liabilities: |
|
|
|
|
|
|
|
|
|
|
|
|
|
|
|
|
Deferred compensation |
|
— |
|
|
|
4,487 |
|
|
|
— |
|
|
|
4,487 |
|
Cash equivalents, primarily funds held in money market savings instruments, are reported at their current carrying value which approximates fair value due to the short-term nature of these instruments and are included in cash and cash equivalents in our Consolidated Balance Sheets.
Fair Value of Other Financial Instruments
Fair value guidance requires certain fair value disclosures be presented in both interim and annual reports. The estimated fair value amounts of financial instruments have been determined using available market information and valuation methodologies described below.
Deferred Compensation – We hold investments in an irrevocable Rabbi Trust for our deferred compensation plan. These assets include both mutual fund investments and company-owned life insurance policies. Under the plan, participants designate investment options to serve as the basis for measurement of the notional value of their accounts. The fair values of the underlying securities of these funds are based on quoted market prices and are categorized as Level I in the fair value measurement hierarchy. The company-owned life insurance policies are valued at cash surrender value and are therefore categorized as Level 2 in the fair value measurement
47
hierarchy.
Industrial Development Revenue Bonds – The fair value of our long-term debt depends primarily on the coupon rate of our industrial development revenue bonds. The carrying value of our long-term debt at September 30, 2016, approximates fair value based on the current coupon rate of the bonds, which is reset weekly. It is classified as a Level 2 input in the fair value measurement hierarchy as there is an active market for the trading of these industrial development revenue bonds.
There were no transfers between levels with the fair value measurement hierarchy during Fiscal 2016.
L. Geographic Information
Revenues by country represent sales to unaffiliated customers as determined by the ultimate destination of our products and services, summarized for the last three fiscal years by region in the table below (in thousands):
|
|
Year Ended September 30, |
|
|||||||||
|
|
2016 |
|
|
2015 |
|
|
2014 |
|
|||
|
United States |
$ |
405,298 |
|
|
$ |
474,038 |
|
|
$ |
365,085 |
|
|
Canada |
|
77,252 |
|
|
|
101,191 |
|
|
|
137,684 |
|
|
Middle East and Africa |
|
40,294 |
|
|
|
40,557 |
|
|
|
84,330 |
|
|
Europe |
|
26,200 |
|
|
|
23,567 |
|
|
|
34,920 |
|
|
Far East |
|
7,895 |
|
|
|
12,026 |
|
|
|
15,127 |
|
|
Mexico, Central and South America |
|
8,304 |
|
|
|
10,479 |
|
|
|
10,668 |
|
|
Total revenues |
$ |
565,243 |
|
|
$ |
661,858 |
|
|
$ |
647,814 |
|
|
|
September 30, |
|
|||||
|
|
2016 |
|
|
2015 |
|
||
|
Long-lived assets: |
|
|
|
|
|
|
|
|
United States |
$ |
88,304 |
|
|
$ |
95,694 |
|
|
Canada |
|
52,292 |
|
|
|
53,879 |
|
|
United Kingdom |
|
4,381 |
|
|
|
5,021 |
|
|
Total |
$ |
144,977 |
|
|
$ |
154,594 |
|
Long-lived assets by country consist of property, plant and equipment, net of accumulated depreciation and are determined based on the location of the tangible assets.
M. Restructuring and Separation Costs
In response to challenging conditions primarily in the oil and gas markets, we have taken various actions during Fiscal 2016 to continue to align our workforce with future production requirements. In Fiscal 2016, we incurred approximately $7.9 million of separation costs, of which $3.8 million were separation costs related to the departure of our former Chief Executive Officer in December 2015. Additionally in Fiscal 2016, we incurred approximately $0.5 million of restructuring costs related to a Canadian facility that we leased and exited in the third quarter of Fiscal 2015. Of the $7.9 million in separation costs recorded in Fiscal 2016, $6.8 million has been paid and the remaining $1.1 million will be paid over the next fiscal year.
In Fiscal 2015, we incurred $3.4 million of restructuring and separation costs. Of this, $2.6 million were separation and severance costs associated with headcount reductions in Canada and certain U.S. operations, as well as the departure of our former Chief Operating Officer. The remaining $0.8 million was related to the exit of one of our previously occupied leased facilities in Acheson, Alberta, Canada and the write-off of associated leasehold improvements. The lease does not expire until October 2019; however, we have sublet the facility through the remaining term of the lease.
N. Discontinued Operations
On January 15, 2014, we sold our wholly owned subsidiary Transdyn to a global provider of electronic toll collection systems, headquartered in Vienna, Austria. The purchase price from the sale of this subsidiary totaled $16.0 million, of which we received cash of $14.4 million. The remaining $1.6 million was placed into an escrow account and was released to us in July 2015. We received additional cash of $0.4 million after the final working capital adjustment was calculated in March 2014. We recorded a gain on this
48
transaction of $8.6 million, net of tax, which has been included in income from discontinued operations in Fiscal 2014 in the accompanying consolidated statements of operations. Transdyn’s results were previously reflected in the Process Control Systems business segment.
We have presented the results of these operations as income from discontinued operations, net of tax, in the Fiscal 2014 consolidated statement of operations.
Summary comparative financial results of discontinued operations were as follows (in thousands):
|
|
Year Ended September 30, |
|
|||||||||
|
|
2016 |
|
|
2015 |
|
|
2014 |
|
|||
|
Revenues |
$ |
— |
|
|
$ |
— |
|
|
$ |
13,923 |
|
|
Income from discontinued operations, net of tax of $633 |
$ |
— |
|
|
$ |
— |
|
|
$ |
1,041 |
|
|
Gain on sale of discontinued operations, net of tax of $5,218 |
|
— |
|
|
|
— |
|
|
|
8,563 |
|
|
Net income from discontinued operations, net of tax |
$ |
— |
|
|
$ |
— |
|
|
$ |
9,604 |
|
|
Earnings per share information: |
|
|
|
|
|
|
|
|
|
|
|
|
Basic |
$ |
— |
|
|
$ |
— |
|
|
$ |
0.80 |
|
|
Diluted |
$ |
— |
|
|
$ |
— |
|
|
$ |
0.80 |
|
O. Share Repurchase Program
On December 17, 2014, our Board of Directors authorized a share repurchase program (the Repurchase Program) which allowed us to repurchase up to $25 million of our outstanding stock. The purchases were made from time to time in the open market, through privately negotiated transactions and Rule 10b5-1 trading plans in accordance with applicable laws, rules and regulations. The Repurchase Program was funded from cash on hand and cash provided by operating activities. The Repurchase Program expired on December 31, 2015. As of December 31, 2015, we had purchased 806,018 shares at a cost of $25 million under the Repurchase Program. The average purchase price per share from inception of the program until its expiration was $31.02.
P. Quarterly Information
The table below sets forth the unaudited consolidated operating results by fiscal quarter for the years ended September 30, 2016 and 2015 (in thousands, except per share data):
|
|
2016 Quarters |
|
|||||||||||||||||
|
|
First |
|
|
Second |
|
|
Third |
|
|
Fourth |
|
|
2016 |
|
|||||
|
Revenues |
$ |
149,977 |
|
|
$ |
152,266 |
|
|
$ |
133,207 |
|
|
$ |
129,793 |
|
|
$ |
565,243 |
|
|
Gross profit |
|
23,150 |
|
|
|
30,094 |
|
|
|
27,285 |
|
|
|
25,676 |
|
|
|
106,205 |
|
|
Net income (loss) |
|
(459 |
) |
|
|
5,567 |
|
|
|
4,894 |
|
|
|
5,508 |
|
|
|
15,510 |
|
|
Earnings (loss) per share: |
|
|
|
|
|
|
|
|
|
|
|
|
|
|
|
|
|
|
|
|
Basic |
$ |
(0.04 |
) |
|
$ |
0.49 |
|
|
$ |
0.43 |
|
|
$ |
0.48 |
|
|
$ |
1.36 |
|
|
Diluted |
$ |
(0.04 |
) |
|
$ |
0.49 |
|
|
$ |
0.43 |
|
|
$ |
0.48 |
|
|
$ |
1.36 |
|
|
|
2015 Quarters |
|
|||||||||||||||||
|
|
First |
|
|
Second |
|
|
Third |
|
|
Fourth |
|
|
2015 |
|
|||||
|
Revenues |
$ |
152,601 |
|
|
$ |
170,199 |
|
|
$ |
176,733 |
|
|
$ |
162,325 |
|
|
$ |
661,858 |
|
|
Gross profit |
|
21,069 |
|
|
|
24,301 |
|
|
|
32,944 |
|
|
|
29,947 |
|
|
|
108,261 |
|
|
Net income (loss) |
|
(239 |
) |
|
|
(3,683 |
) |
|
|
7,049 |
|
|
|
6,312 |
|
|
|
9,439 |
|
|
Earnings (loss) per share: |
|
|
|
|
|
|
|
|
|
|
|
|
|
|
|
|
|
|
|
|
Basic |
$ |
(0.02 |
) |
|
$ |
(0.31 |
) |
|
$ |
0.60 |
|
|
$ |
0.54 |
|
|
$ |
0.80 |
|
|
Diluted |
$ |
(0.02 |
) |
|
$ |
(0.31 |
) |
|
$ |
0.60 |
|
|
$ |
0.54 |
|
|
$ |
0.79 |
|
|
|
|
|
|
|
|
|
|
|
|
|
|
|
|
|
|
|
|
|
|
The sum of the individual earnings per share amounts may not agree with year-to-date earnings per share as each period’s computation is based on the weighted-average number of shares outstanding during the period.
49
Item 9. Changes in and Disagreements with Accountants on Accounting and Financial Disclosure
None.
Item 9A. Controls and Procedures
Evaluation of Disclosure Controls and Procedures
We have established and maintain a system of disclosure controls and procedures that are designed to provide reasonable assurance that information required to be disclosed in our reports filed with the SEC pursuant to the Securities Exchange Act of 1934, as amended (Exchange Act), is recorded, processed, summarized and reported within the time periods specified in the rules and forms of the SEC and that such information is accumulated and communicated to our management, including our Chief Executive Officer (CEO) and Chief Financial Officer (CFO), as appropriate, to allow timely decisions regarding required disclosures.
Management, with the participation of our CEO and CFO, has evaluated the effectiveness of the design and operation of our disclosure controls and procedures (as defined in Rules 13a-15(e) and 15d-15(e) of the Exchange Act) as of the end of the period covered by this Annual Report on Form 10-K. Based on such evaluation, our CEO and CFO have each concluded that, as of September 30, 2016, the end of the period covered by this Annual Report on Form 10-K, our disclosure controls and procedures were effective to provide reasonable assurance that information required to be disclosed by us in reports that we file or submit under the Exchange Act is recorded, processed, summarized and reported within the time periods specified in the SEC’s rules and forms and that such information is accumulated and communicated to our management, including the CEO and CFO, as appropriate, to allow timely decisions regarding required disclosures.
Management’s Report on Internal Control Over Financial Reporting
Management is responsible for establishing and maintaining effective internal control over financial reporting as defined in Rule 13a-15(f) under the Exchange Act. Our system of internal control was designed using a top-down risk-based approach to provide reasonable assurance regarding the reliability of financial reporting and the preparation of financial statements for external purposes in accordance with generally accepted accounting principles. Due to its inherent limitations, internal control over financial reporting may not prevent or detect misstatements. Also, projections of any evaluation of effectiveness to future periods are subject to the risk that controls may become ineffective due to changes in conditions or deterioration in the degree of compliance with the policies or procedures.
Management of the Company has assessed the effectiveness of our internal control over financial reporting as of September 30, 2016. Management evaluated the effectiveness of our internal control over financial reporting based on the criteria in Internal Control – Integrated Framework (2013) issued by the Committee of Sponsoring Organizations of the Treadway Commission (COSO). Based on management’s evaluation, management has concluded that our internal control over financial reporting was effective at the reasonable assurance level as of September 30, 2016, based on criteria in Internal Control – Integrated Framework (2013) issued by the COSO.
PricewaterhouseCoopers LLP, an independent registered public accounting firm, has audited and issued their report on the effectiveness of our internal control over financial reporting as of September 30, 2016, which appears in their report on the financial statements included herein.
Changes in Internal Control Over Financial Reporting
There have been no changes in our internal control over financial reporting that occurred during the last fiscal quarter that have materially affected, or are reasonably likely to materially affect, our internal control over financial reporting.
None.
50
Item 10. Directors, Executive Officers and Corporate Governance
The information required by this item is incorporated in this Annual Report by reference to our definitive proxy statement pursuant to Regulation 14A, to be filed with the Securities and Exchange Commission not later than 120 days after the close of our fiscal year ended September 30, 2016.
We have adopted a Code of Business Conduct and Ethics that applies to all employees, including our executive officers and directors. A copy of our Code of Business Conduct and Ethics may be obtained at the Investor Relations section of our website, www.powellind.com, or by written request addressed to the Secretary, Powell Industries, Inc., 8550 Mosley Road, Houston, Texas 77075. We will satisfy the requirements under Item 5.05 of Form 8-K regarding disclosure of amendments to, or waivers from, provisions of our code of ethics that apply to the chief executive officer, chief financial officer or controller by posting such information on our website.
Item 11. Executive Compensation
The information required by this item is incorporated in this Annual Report by reference to our definitive proxy statement pursuant to Regulation 14A, to be filed with the Securities and Exchange Commission not later than 120 days after the close of our fiscal year ended September 30, 2016.
Item 12. Security Ownership of Certain Beneficial Owners and Management and Related Stockholder Matters
The information required by this item is incorporated in this Annual Report by reference to our definitive proxy statement pursuant to Regulation 14A, to be filed with the Securities and Exchange Commission not later than 120 days after the close of our fiscal year ended September 30, 2016.
Item 13. Certain Relationships and Related Transactions, and Director Independence
The information required by this item is incorporated in this Annual Report by reference to our definitive proxy statement pursuant to Regulation 14A, to be filed with the Securities and Exchange Commission not later than 120 days after the close of our fiscal year ended September 30, 2016.
Item 14. Principal Accountant Fees and Services
The information required by this item is incorporated in this Annual Report by reference to our definitive proxy statement pursuant to Regulation 14A, to be filed with the Securities and Exchange Commission not later than 120 days after the close of our fiscal year ended September 30, 2016.
51
Item 15. Exhibits and Financial Statement Schedules
1. Financial Statements. Reference is made to the Index to Consolidated Financial Statements at Item 8 of this Annual Report.
2. Financial Statement Schedule. All schedules are omitted because they are not applicable or the required information is shown in the financial statements or the notes to the financial statements.
3. Exhibits.
|
Number |
|
|
|
Description of Exhibits |
|
3.1 |
|
— |
|
Certificate of Incorporation of Powell Industries, Inc. filed with the Secretary of State of the State of Delaware on February 11, 2004 (filed as Exhibit 3.1 to our Form 8-A/A filed November 1, 2004, and incorporated herein by reference). |
|
|
|
|
|
|
|
3.2 |
|
— |
|
Amended and Restated By-laws of Powell Industries, Inc. (filed as Exhibit 3.1 to our Form 8-K filed October 12, 2012, and incorporated herein by reference). |
|
|
|
|
|
|
|
10.1 |
|
— |
|
Powell Industries, Inc., Incentive Compensation Plan (filed as Exhibit 10.1 to our Form 10-K for the fiscal year ended October 31, 2003, and incorporated herein by reference). |
|
|
|
|
|
|
|
10.2 |
|
— |
|
Description of Supplemental Executive Benefit Plan (filed as Exhibit 10 to our Form 10-K for the fiscal year ended October 31, 1984, and incorporated herein by reference). |
|
|
|
|
|
|
|
10.3 |
|
— |
|
1992 Powell Industries, Inc. Stock Option Plan (filed as Exhibit 10.1 to our registration statement on Form S-8 filed on December 21, 2010, and incorporated herein by reference). |
|
|
|
|
|
|
|
10.4 |
|
— |
|
Amendment to 1992 Powell Industries, Inc. Stock Option Plan (filed as Exhibit 10.8 to our Form 10-Q for the quarter ended April 30, 1996, and incorporated herein by reference). |
|
|
|
|
|
|
|
10.5 |
|
— |
|
Amendment to 1992 Powell Industries, Inc. Stock Option Plan (the cover of the 1992 Powell Industries, Inc. Stock Option Plan has been noted to reflect the increase in the number of shares authorized for issuance under the Plan from 2,100,000 to 2,700,000, which increase was approved by the stockholders of the Company at the 2005 Annual Meeting of Stockholders). |
|
|
|
|
|
|
|
10.6 |
|
— |
|
Powell Industries, Inc. Directors’ Fees Program (filed as Exhibit 10.7 to our Form 10-K for the fiscal year ended October 31, 1992, and incorporated herein by reference). |
|
|
|
|
|
|
|
10.7 |
|
— |
|
Powell Industries, Inc. Executive Severance Protection Plan (filed as Exhibit 10.7 to our Form 10-K for the fiscal year ended October 31, 2002, and incorporated herein by reference). |
|
|
|
|
|
|
|
10.8 |
|
— |
|
Powell Industries, Inc. Non-Employee Directors Stock Option Plan (filed as Exhibit 10.8 to our Form 10-K for the fiscal year ended October 31, 2002, and incorporated herein by reference). |
|
|
|
|
|
|
|
10.9 |
|
— |
|
Powell Industries, Inc. Deferred Compensation Plan (filed as Exhibit 10.9 to our Form 10-K for the fiscal year ended October 31, 2002, and incorporated herein by reference). |
|
|
|
|
|
|
|
10.10 |
|
— |
|
Powell Industries, Inc. Non-Employee Director Restricted Stock Plan (filed as Exhibit 10.3 to our registration statement on Form S-8 filed on December 21, 2010, and incorporated herein by reference). |
|
|
|
|
|
|
|
10.11 |
|
— |
|
Amended Loan Agreement dated October 29, 2004, between the Company and Bank of America, N.A. (filed as Exhibit 10.10 to our Form 10-K for the fiscal year ended October 31, 2004, and incorporated herein by reference). |
|
|
|
|
|
|
|
10.12 |
|
— |
|
Credit and Reimbursement Agreement dated April 15, 2004, between the Company and Bank of America, N.A. (filed as Exhibit 10.11 to our Form 10-K for the fiscal year ended October 31, 2004, and incorporated herein by reference). |
52
|
|
|
|
Description of Exhibits |
|
|
10.13 |
|
— |
|
Credit Agreement dated June 29, 2005 among Powell Industries, Inc., Inhoco 3210 Limited and Switchgear & Instrumentation Properties Limited, and Bank of America and the other lenders parties thereto (filed as Exhibit 10.1 to our Form 8-K filed July 6, 2005, and incorporated herein by reference). |
|
|
|
|
|
|
|
10.14 |
|
— |
|
First Amendment to Credit Agreement dated November 7, 2005 among Powell Industries, Inc., Inhoco 3210 Limited (n/k/a Switchgear & Instrumentation Limited), Switchgear & Instrumentation Properties Limited, Bank of America, N.A., and the other lenders parties thereto (filed as Exhibit 10.14 to our Form 10-K for the fiscal year ended October 31, 2005, and incorporated herein by reference). |
|
|
|
|
|
|
|
10.15 |
|
— |
|
Second Amendment to Credit Agreement dated January 11, 2006 among Powell Industries, Inc., Switchgear & Instrumentation Limited, Switchgear & Instrumentation Properties Limited, Bank of America, N.A., and the other lenders parties thereto (filed as Exhibit 10.15 to our Form 10-K for the fiscal year ended October 31, 2005, and incorporated herein by reference). |
|
|
|
|
|
|
|
10.16 |
|
— |
|
Third Amendment to Credit Agreement dated August 4, 2006 among Powell Industries, Inc., Switchgear & Instrumentation Limited, Switchgear & Instrumentation Properties Limited, Bank of America, N.A., and the other lenders parties thereto (filed as Exhibit 10.3 to our Form 8-K filed August 9, 2006, and incorporated herein by reference). |
|
|
|
|
|
|
|
10.17 |
|
— |
|
Fourth Amendment to Credit Agreement dated December 7, 2006 among Powell Industries, Inc., Switchgear & Instrumentation Limited, Switchgear & Instrumentation Properties Limited, Bank of America, N.A., and the other lenders parties thereto (filed as Exhibit 10.17 to our Transition report on Form 10-K for the fiscal year ended September 30, 2006, and incorporated herein by reference). |
|
|
|
|
|
|
|
10.18 |
|
— |
|
Fifth Amendment to Credit Agreement, dated as of December 4, 2007, among Powell Industries, Inc., as Parent, the subsidiaries of Powell Industries, Inc. identified therein, as Borrowers, Bank of America, N.A., as Administrative Agent, Swing Line Lender and L/C Issuer, and the Lenders party thereto (filed as Exhibit 10.1 to our Quarterly Report on Form 10-Q for the quarter ended December 31, 2007, and incorporated herein by reference). |
|
|
|
|
|
|
|
10.19 |
|
— |
|
Sixth Amendment to Credit Agreement, dated as of December 14, 2007, among Powell Industries, Inc., as Parent, the subsidiaries of Powell Industries, Inc. identified therein, as Borrowers, Bank of America, N.A., as Administrative Agent, Swing Line Lender and L/C issuer, and the Lenders party thereto (filed as Exhibit 10.1 to our Form 8-K filed December 19, 2007, and incorporated herein by reference). |
|
|
|
|
|
|
|
10.20 |
|
— |
|
Banking facilities between HSBC Bank plc and Switchgear & Instrumentation Limited and Switchgear & Instrumentation Properties Limited dated September 12, 2005 (filed as Exhibit 10.16 to our Form 10-K for the fiscal year ended October 31, 2005, and incorporated herein by reference). |
|
|
|
|
|
|
|
**10.21 |
|
— |
|
Powell Supply Agreement between the Company and General Electric Company dated August 7, 2006 (filed as Exhibit 10.1 to our Form 8-K/A filed June 16, 2008, and incorporated herein by reference). |
|
|
|
|
|
|
|
10.22 |
|
— |
|
Lease Agreement between the Company and C&L Partnership, Ltd. dated April 19, 2006 (filed as Exhibit 10.2 to our Form 8-K filed August 9, 2006, and incorporated herein by reference). |
|
|
|
|
|
|
|
10.23 |
|
— |
|
Seventh Amendment to Credit Agreement, dated as of December 10, 2008, among Powell Industries, Inc., as Parent, the subsidiaries of Powell Industries, Inc. identified therein, as Borrowers, Bank of America, N.A., as Administrative Agent, Swing Line Lender and L/C issuer, and the Lenders party (filed as Exhibit 10.24 to our Form 10-K for the fiscal year ended September 30, 2008, and incorporated herein by reference). |
|
|
|
|
|
|
|
10.24 |
|
— |
|
Powell Industries, Inc. 2006 Equity Compensation Plan (filed as Exhibit 10.2 to our registration statement on Form S-8 filed on December 21, 2010, and incorporated herein by reference). |
|
|
|
|
|
|
|
10.25 |
|
— |
|
Credit Agreement dated as of December 15, 2009, between Powell PowerComm Inc., as Borrower, Powell Industries, Inc., Nextron Limited, PPC Technical Services Inc., as Guarantors, and HSBC Bank Canada, as Lender (filed as Exhibit 10.1 to our Form 8-K filed on December 21, 2009, and incorporated herein by reference). |
53
|
|
|
|
Description of Exhibits |
|
|
10.26 |
|
— |
|
Ninth Amendment to Credit Agreement, dated as of May 18, 2011, among Powell Industries, Inc., as Parent, the subsidiaries of Powell Industries, Inc. identified therein, as Borrowers, Bank of America, N.A., as Administrative Agent, Swing Line Lender and L/C issuer, and the Lenders party (filed as Exhibit 10.1 to our Form 8-K dated May 18, 2011, and incorporated herein by reference). |
|
|
|
|
|
|
|
10.27 |
|
— |
|
Employment Agreement dated as of May 8, 2012 between the Company and Don R. Madison (filed as Exhibit 10.1 to our Form 10-Q for the quarter ended March 31, 2012, and incorporated herein by reference). |
|
|
|
|
|
|
|
10.28 |
|
— |
|
Employment Agreement dated as of May 8, 2012 between the Company and Milburn E. Honeycutt (filed as Exhibit 10.2 to our Form 10-Q for the quarter ended March 31, 2012, and incorporated herein by reference). |
|
|
|
|
|
|
|
10.29 |
|
— |
|
Tenth Amendment to Credit Agreement, dated as of March 26, 2012, among Powell Industries, Inc., as Parent, the subsidiaries of Powell Industries, Inc. identified herein, as Borrowers, Bank of America, N.A., as Administrative Agent, Swing Line Lender and L/C issuer, and the Lenders party (filed as Exhibit 10.3 to our Form 10-Q for the quarter ended March 31, 2012, and incorporated herein by reference). |
|
|
|
|
|
|
|
10.30 |
|
— |
|
Amended and Restated Credit Agreement dated as of April 26, 2012, between Powell PowerComm Inc., as Borrower, Powell Industries, Inc., Nextron Limited, PPC Technical Services Inc., as Guarantors, and HSBC Bank Canada, as Lender (filed as Exhibit 10.4 to our Form 10-Q for the quarter ended March 31, 2012, and incorporated herein by reference). |
|
|
|
|
|
|
|
10.31 |
|
— |
|
Eleventh Amendment to Credit Agreement, dated as of June 27, 2013, among Powell Industries, Inc., as Parent, the subsidiaries of Powell Industries, Inc. identified therein, as Borrowers, Bank of America, N.A., as Administrative Agent, Swing Line Lender and L/C issuer, and the Lenders party thereto. (filed as Exhibit 10.1 to our Form 10-Q filed August 7, 2013, and incorporated herein by reference).
|
|
10.32 |
|
— |
|
Stock Purchase Agreement dated as of January 15, 2014, between the Company and Kapsch TrafficCom IVHS, Inc. (filed as Exhibit 10.1 to our Form 8-K filed January 17, 2014, and incorporated herein by reference). |
|
|
|
|
|
|
|
**10.33 |
|
— |
|
Amended and Restated Powell Supply Agreement dated as of December 30, 2013, between the Company and General Electric Company (filed as Exhibit 10.2 to our Form 10-Q filed February 5, 2014 and incorporated herein by reference). |
|
|
|
|
|
|
|
10.34 |
|
— |
|
Restated Credit Agreement dated as of December 31, 2013, between the Company and Bank of America, N.A. (filed as Exhibit 10.3 to our Form 10-Q filed February 5, 2014 and incorporated herein by reference). |
|
|
|
|
|
|
|
10.35 |
|
— |
|
2014 Equity Incentive Plan (filed as Exhibit 10.2 to our Form 10-Q filed May 7, 2014 and incorporated herein by reference). |
|
|
|
|
|
|
|
10.36 |
|
— |
|
Form of Restricted Stock Award Agreement under 2014 Equity Incentive Plan (filed as Exhibit 10.3 to our Form 10-Q filed May 7, 2014 and incorporated herein by reference). |
|
|
|
|
|
|
|
10.37 |
|
— |
|
Form of Restricted Stock Unit Award Agreement under 2014 Equity Incentive Plan (filed as Exhibit 10.4 to our Form 10-Q filed May 7, 2014 and incorporated herein by reference). |
|
|
|
|
|
|
|
10.38 |
|
— |
|
Form of Performance Unit Award Agreement under 2014 Equity Incentive Plan (filed as Exhibit 10.5 to our Form 10-Q filed May 7, 2014 and incorporated herein by reference). |
|
|
|
|
|
|
|
10.39 |
|
— |
|
Form of Stock Option Award Agreement under 2014 Equity Incentive Plan (filed as Exhibit 10.6 to our Form 10-Q filed May 7, 2014 and incorporated herein by reference). |
|
|
|
|
|
|
|
10.40 |
|
— |
|
Form of Stock Appreciation Right Award Agreement under 2014 Equity Incentive Plan (filed as Exhibit 10.7 to our Form 10-Q filed May 7, 2014 and incorporated herein by reference). |
|
|
|
|
|
|
|
10.41 |
|
— |
|
2014 Non-Employee Director Equity Incentive Plan (filed as Exhibit 10.8 to our Form 10-Q filed May 7, 2014 and incorporated herein by reference). |
|
|
|
|
|
|
|
10.42 |
|
— |
|
Form of Restricted Stock Award Agreement under 2014 Non-Employee Director Equity Incentive Plan (filed as Exhibit 10.9 to our Form 10-Q filed May 7, 2014 and incorporated herein by reference). |
|
|
|
|
|
|
|
10.43 |
|
— |
|
First Amendment to Credit Agreement, dated as of March 28, 2014, among Powell Industries, Inc., as Parent, certain subsidiaries of Powell Industries, Inc. identified therein, as Guarantors, Bank of America, N.A., as Administrative Agent, Swing Line Lender and L/C issuer, and the Lenders party thereto (filed as Exhibit 10.10 to our Form 10-Q filed May 7, 2014 and incorporated herein by reference). |
54
|
|
|
|
Description of Exhibits |
|
|
10.44 |
|
— |
|
Renewed banking facilities between HSBC Bank plc and Powell (UK) Limited dated October 20, 2014 (filed as Exhibit 10.48 to our Form 10-K filed December 3, 2014, and incorporated herein by reference). |
|
|
|
|
|
|
|
10.45 |
|
— |
|
Second Amendment to Amended Credit Agreement, dated December 31, 2014, among Powell Industries, Inc., as Parent, certain subsidiaries of Powell Industries, Inc. identified therein, as Guarantors, Bank of America, N.A., as Administrative Agent, Swing Line Lender and L/C issuer, and the Lenders party thereto (filed as Exhibit 10.1 to our Form 10-Q filed February 4, 2015 and incorporated herein by reference). |
|
|
|
|
|
|
|
10.46 |
|
— |
|
Amending Agreement to Amended and Restated Credit Agreement, effective as of March 31, 2015, between Powell Canada Inc., Powell Industries, Inc., Nextron Limited, PCG Northern Services Inc. and HSBC Bank Canada (filed as Exhibit 10.1 to our Form 10-Q filed May 6, 2015 and incorporated herein by reference). |
|
|
|
|
|
|
|
*10.47 |
|
— |
|
Severance Agreement and Release effective as of March 05, 2015, between the Company and Neil Dial. |
|
|
|
|
|
|
|
10.48 |
|
— |
|
Severance Agreement and Release effective as of December 24, 2015, between the Company and Michael A. Lucas (filed as Exhibit 10.1 to our Form 10-Q filed February 3, 2016 and incorporated herein by reference). |
|
|
|
|
|
|
|
10.49 |
|
— |
|
Employment Agreement dated September 29, 2016, between the Company and Brett A. Cope (filed as Exhibit 10.1 to our 8-K filed September 30, 2016 and incorporated herein by reference). |
|
|
|
|
|
|
|
*21.1 |
|
— |
|
Subsidiaries of Powell Industries, Inc. |
|
|
|
|
|
|
|
*23.2 |
|
— |
|
Consent of PricewaterhouseCoopers LLP. |
|
|
|
|
|
|
|
*31.1 |
|
— |
|
Certification of Chief Executive Officer pursuant to Rule 13a-14(a)/15d-14(a). |
|
|
|
|
|
|
|
*31.2 |
|
— |
|
Certification of Chief Financial Officer pursuant to Rule 13a-14(a)/15d-14(a). |
|
|
|
|
|
|
|
*32.1 |
|
— |
|
Certification of Chief Executive Officer Pursuant to Section 18 U.S.C. Section 1350, as Adopted Pursuant to Section 906 of the Sarbanes-Oxley Act of 2002. |
|
|
|
|
|
|
|
*32.2 |
|
— |
|
Certification of Chief Financial Officer Pursuant to Section 18 U.S.C. Section 1350, as Adopted Pursuant to Section 906 of the Sarbanes-Oxley Act of 2002. |
|
|
|
|
|
|
|
101.INS |
|
— |
|
XBRL Instance Document |
|
|
|
|
|
|
|
101.SCH |
|
— |
|
XBRL Taxonomy Extension Schema Document |
|
|
|
|
|
|
|
101.CAL |
|
— |
|
XBRL Taxonomy Extension Calculation Linkbase Document |
|
|
|
|
|
|
|
101.DEF |
|
— |
|
XBRL Taxonomy Extension Definition Linkbase Document |
|
|
|
|
|
|
|
101.LAB |
|
— |
|
XBRL Taxonomy Extension Label Linkbase Document |
|
|
|
|
|
|
|
101.PRE |
|
— |
|
XBRL Taxonomy Extension Presentation Linkbase Document |
|
|
|
* |
Filed herewith. |
|
** |
Portions of this exhibit have been omitted based on a request for confidential treatment pursuant to Rule 24b-2 of the Securities Exchange Act of 1934. Such omitted portions have been filed separately with the Commission. |
55
Pursuant to the requirements of Section 13 or 15(d) of the Securities Exchange Act of 1934, the Registrant has duly caused this report to be signed on its behalf by the undersigned, thereunto duly authorized.
|
POWELL INDUSTRIES, INC. |
|
|
By: |
/s/ Brett A. Cope |
|
|
Brett A. Cope |
|
|
President and Chief Executive Officer |
Pursuant to the requirements of the Securities Exchange Act of 1934, this report has been signed below by the following persons on behalf of the registrant in the capacities and on the date indicated:
|
Signature |
|
Title |
|
/s/ Thomas W. Powell |
|
Chairman of the Board |
|
Thomas W. Powell |
||
|
|
|
|
|
/s/ Brett A. Cope |
|
Director |
|
Brett A. Cope |
||
|
|
|
|
|
/s/ Don R. Madison |
|
Executive Vice President |
|
Don R. Madison |
||
|
|
|
|
|
/s/ Milburn Honeycutt |
|
Vice President |
|
Milburn Honeycutt |
||
|
|
|
|
|
/s/ Eugene L. Butler |
|
Director |
|
Eugene L. Butler |
||
|
|
|
|
|
/s/ Christopher E. Cragg |
|
Director |
|
Christopher E. Cragg |
||
|
|
|
|
|
/s/ Bonnie V. Hancock |
|
Director |
|
Bonnie V. Hancock |
||
|
|
|
|
|
/s/ Scott E. Rozzell |
|
Director |
|
Scott E. Rozzell |
||
|
|
|
|
|
/s/ Stephen W. Seale, Jr. |
|
Director |
|
Stephen W. Seale, Jr. |
||
|
|
|
|
|
/s/ John D. White |
|
Director |
|
John D. White |
||
|
/s/ Richard E. Williams |
|
Director |
|
Richard E. Williams |
|
|
Date: December 7, 2016
56
|
Number |
|
|
|
Description of Exhibits |
|
3.1 |
|
— |
|
Certificate of Incorporation of Powell Industries, Inc. filed with the Secretary of State of the State of Delaware on February 11, 2004 (filed as Exhibit 3.1 to our Form 8-A/A filed November 1, 2004, and incorporated herein by reference). |
|
|
|
|
|
|
|
3.2 |
|
— |
|
Amended and Restated By-laws of Powell Industries, Inc. (filed as Exhibit 3.1 to our Form 8-K filed October 12, 2012, and incorporated herein by reference). |
|
|
|
|
|
|
|
10.1 |
|
— |
|
Powell Industries, Inc., Incentive Compensation Plan (filed as Exhibit 10.1 to our Form 10-K for the fiscal year ended October 31, 2003, and incorporated herein by reference). |
|
|
|
|
|
|
|
10.2 |
|
— |
|
Description of Supplemental Executive Benefit Plan (filed as Exhibit 10 to our Form 10-K for the fiscal year ended October 31, 1984, and incorporated herein by reference). |
|
|
|
|
|
|
|
10.3 |
|
— |
|
1992 Powell Industries, Inc. Stock Option Plan (filed as Exhibit 10.1 to our registration statement on Form S-8 filed on December 21, 2010, and incorporated herein by reference). |
|
|
|
|
|
|
|
10.4 |
|
— |
|
Amendment to 1992 Powell Industries, Inc. Stock Option Plan (filed as Exhibit 10.8 to our Form 10-Q for the quarter ended April 30, 1996, and incorporated herein by reference). |
|
|
|
|
|
|
|
10.5 |
|
— |
|
Amendment to 1992 Powell Industries, Inc. Stock Option Plan (the cover of the 1992 Powell Industries, Inc. Stock Option Plan has been noted to reflect the increase in the number of shares authorized for issuance under the Plan from 2,100,000 to 2,700,000, which increase was approved by the stockholders of the Company at the 2005 Annual Meeting of Stockholders). |
|
|
|
|
|
|
|
10.6 |
|
— |
|
Powell Industries, Inc. Directors’ Fees Program (filed as Exhibit 10.7 to our Form 10-K for the fiscal year ended October 31, 1992, and incorporated herein by reference). |
|
|
|
|
|
|
|
10.7 |
|
— |
|
Powell Industries, Inc. Executive Severance Protection Plan (filed as Exhibit 10.7 to our Form 10-K for the fiscal year ended October 31, 2002, and incorporated herein by reference). |
|
|
|
|
|
|
|
10.8 |
|
— |
|
Powell Industries, Inc. Non-Employee Directors Stock Option Plan (filed as Exhibit 10.8 to our Form 10-K for the fiscal year ended October 31, 2002, and incorporated herein by reference). |
|
|
|
|
|
|
|
10.9 |
|
— |
|
Powell Industries, Inc. Deferred Compensation Plan (filed as Exhibit 10.9 to our Form 10-K for the fiscal year ended October 31, 2002, and incorporated herein by reference). |
|
|
|
|
|
|
|
10.10 |
|
— |
|
Powell Industries, Inc. Non-Employee Director Restricted Stock Plan (filed as Exhibit 10.3 to our registration statement on Form S-8 filed on December 21, 2010, and incorporated herein by reference). |
|
|
|
|
|
|
|
10.11 |
|
— |
|
Amended Loan Agreement dated October 29, 2004, between the Company and Bank of America, N.A. (filed as Exhibit 10.10 to our Form 10-K for the fiscal year ended October 31, 2004, and incorporated herein by reference). |
|
|
|
|
|
|
|
10.12 |
|
— |
|
Credit and Reimbursement Agreement dated April 15, 2004, between the Company and Bank of America, N.A. (filed as Exhibit 10.11 to our Form 10-K for the fiscal year ended October 31, 2004, and incorporated herein by reference). |
|
|
|
|
|
|
|
10.13 |
|
— |
|
Credit Agreement dated June 29, 2005 among Powell Industries, Inc., Inhoco 3210 Limited and Switchgear & Instrumentation Properties Limited, and Bank of America and the other lenders parties thereto (filed as Exhibit 10.1 to our Form 8-K filed July 6, 2005, and incorporated herein by reference). |
|
|
|
|
|
|
|
10.14 |
|
— |
|
First Amendment to Credit Agreement dated November 7, 2005 among Powell Industries, Inc., Inhoco 3210 Limited (n/k/a Switchgear & Instrumentation Limited), Switchgear & Instrumentation Properties Limited, Bank of America, N.A., and the other lenders parties thereto (filed as Exhibit 10.14 to our Form 10-K for the fiscal year ended October 31, 2005, and incorporated herein by reference). |
|
|
|
|
|
|
|
10.15 |
|
— |
|
Second Amendment to Credit Agreement dated January 11, 2006 among Powell Industries, Inc., Switchgear & Instrumentation Limited, Switchgear & Instrumentation Properties Limited, Bank of America, N.A., and the other lenders parties thereto (filed as Exhibit 10.15 to our Form 10-K for the fiscal year ended October 31, 2005, and incorporated herein by reference). |
57
|
|
|
|
Description of Exhibits |
|
|
10.16 |
|
— |
|
Third Amendment to Credit Agreement dated August 4, 2006 among Powell Industries, Inc., Switchgear & Instrumentation Limited, Switchgear & Instrumentation Properties Limited, Bank of America, N.A., and the other lenders parties thereto (filed as Exhibit 10.3 to our Form 8-K filed August 9, 2006, and incorporated herein by reference). |
|
|
|
|
|
|
|
10.17 |
|
— |
|
Fourth Amendment to Credit Agreement dated December 7, 2006 among Powell Industries, Inc., Switchgear & Instrumentation Limited, Switchgear & Instrumentation Properties Limited, Bank of America, N.A., and the other lenders parties thereto (filed as Exhibit 10.17 to our Transition report on Form 10-K for the fiscal year ended September 30, 2006, and incorporated herein by reference). |
|
|
|
|
|
|
|
10.18 |
|
— |
|
Fifth Amendment to Credit Agreement, dated as of December 4, 2007, among Powell Industries, Inc., as Parent, the subsidiaries of Powell Industries, Inc. identified therein, as Borrowers, Bank of America, N.A., as Administrative Agent, Swing Line Lender and L/C Issuer, and the Lenders party thereto (filed as Exhibit 10.1 to our Quarterly Report on Form 10-Q for the quarter ended December 31, 2007, and incorporated herein by reference). |
|
|
|
|
|
|
|
10.19 |
|
— |
|
Sixth Amendment to Credit Agreement, dated as of December 14, 2007, among Powell Industries, Inc., as Parent, the subsidiaries of Powell Industries, Inc. identified therein, as Borrowers, Bank of America, N.A., as Administrative Agent, Swing Line Lender and L/C issuer, and the Lenders party thereto (filed as Exhibit 10.1 to our Form 8-K filed December 19, 2007, and incorporated herein by reference). |
|
|
|
|
|
|
|
10.20 |
|
— |
|
Banking facilities between HSBC Bank plc and Switchgear & Instrumentation Limited and Switchgear & Instrumentation Properties Limited dated September 12, 2005 (filed as Exhibit 10.16 to our Form 10-K for the fiscal year ended October 31, 2005, and incorporated herein by reference). |
|
|
|
|
|
|
|
**10.21 |
|
— |
|
Powell Supply Agreement between the Company and General Electric Company dated August 7, 2006 (filed as Exhibit 10.1 to our Form 8-K/A filed June 16, 2008, and incorporated herein by reference). |
|
|
|
|
|
|
|
10.22 |
|
— |
|
Lease Agreement between the Company and C&L Partnership, Ltd. dated April 19, 2006 (filed as Exhibit 10.2 to our Form 8-K filed August 9, 2006, and incorporated herein by reference). |
|
|
|
|
|
|
|
10.23 |
|
— |
|
Seventh Amendment to Credit Agreement, dated as of December 10, 2008, among Powell Industries, Inc., as Parent, the subsidiaries of Powell Industries, Inc. identified therein, as Borrowers, Bank of America, N.A., as Administrative Agent, Swing Line Lender and L/C issuer, and the Lenders party (filed as Exhibit 10.24 to our Form 10-K for the fiscal year ended September 30, 2008, and incorporated herein by reference). |
|
|
|
|
|
|
|
10.24 |
|
— |
|
Powell Industries, Inc. 2006 Equity Compensation Plan (filed as Exhibit 10.2 to our registration statement on Form S-8 filed on December 21, 2010, and incorporated herein by reference). |
|
|
|
|
|
|
|
10.25 |
|
— |
|
Credit Agreement dated as of December 15, 2009, between Powell PowerComm Inc., as Borrower, Powell Industries, Inc., Nextron Limited, PPC Technical Services Inc., as Guarantors, and HSBC Bank Canada, as Lender (filed as Exhibit 10.1 to our Form 8-K filed on December 21, 2009, and incorporated herein by reference). |
|
|
|
|
|
|
|
10.26 |
|
— |
|
Ninth Amendment to Credit Agreement, dated as of May 18, 2011, among Powell Industries, Inc., as Parent, the subsidiaries of Powell Industries, Inc. identified therein, as Borrowers, Bank of America, N.A., as Administrative Agent, Swing Line Lender and L/C issuer, and the Lenders party (filed as Exhibit 10.1 to our Form 8-K dated May 18, 2011, and incorporated herein by reference). |
|
|
|
|
|
|
|
10.27 |
|
— |
|
Employment Agreement dated as of May 8, 2012 between the Company and Don R. Madison (filed as Exhibit 10.1 to our Form 10-Q for the quarter ended March 31, 2012, and incorporated herein by reference). |
|
|
|
|
|
|
|
10.28 |
|
— |
|
Employment Agreement dated as of May 8, 2012 between the Company and Milburn E. Honeycutt (filed as Exhibit 10.2 to our Form 10-Q for the quarter ended March 31, 2012, and incorporated herein by reference). |
|
|
|
|
|
|
|
10.29 |
|
— |
|
Tenth Amendment to Credit Agreement, dated as of March 26, 2012, among Powell Industries, Inc., as Parent, the subsidiaries of Powell Industries, Inc. identified herein, as Borrowers, Bank of America, N.A., as Administrative Agent, Swing Line Lender and L/C issuer, and the Lenders party (filed as Exhibit 10.3 to our Form 10-Q for the quarter ended March 31, 2012, and incorporated herein by reference). |
|
|
|
|
|
|
|
10.30 |
|
— |
|
Amended and Restated Credit Agreement dated as of April 26, 2012, between Powell PowerComm Inc., as Borrower, Powell Industries, Inc., Nextron Limited, PPC Technical Services Inc., as Guarantors, and HSBC Bank Canada, as Lender (filed as Exhibit 10.4 to our Form 10-Q for the quarter ended March 31, 2012, and incorporated herein by reference). |
58
|
|
|
|
Description of Exhibits |
|
|
10.31 |
|
— |
|
Eleventh Amendment to Credit Agreement, dated as of June 27, 2013, among Powell Industries, Inc., as Parent, the subsidiaries of Powell Industries, Inc. identified therein, as Borrowers, Bank of America, N.A., as Administrative Agent, Swing Line Lender and L/C issuer, and the Lenders party thereto. (filed as Exhibit 10.1 to our Form 10-Q filed August 7, 2013, and incorporated herein by reference). |
|
|
|
|
|
|
|
10.32 |
|
— |
|
Stock Purchase Agreement dated as of January 15, 2014, between the Company and Kapsch TrafficCom IVHS, Inc. (filed as Exhibit 10.1 to our Form 8-K filed January 17, 2014, and incorporated herein by reference). |
|
|
|
|
|
|
|
**10.33 |
|
— |
|
Amended and Restated Powell Supply Agreement dated as of December 30, 2013, between the Company and General Electric Company (filed as Exhibit 10.2 to our Form 10-Q filed February 5, 2014 and incorporated herein by reference). |
|
|
|
|
|
|
|
10.34 |
|
— |
|
Restated Credit Agreement dated as of December 31, 2013, between the Company and Bank of America, N.A. (filed as Exhibit 10.3 to our Form 10-Q filed February 5, 2014 and incorporated herein by reference). |
|
|
|
|
|
|
|
10.35 |
|
— |
|
2014 Equity Incentive Plan (filed as Exhibit 10.2 to our Form 10-Q filed May 7, 2014 and incorporated herein by reference). |
|
|
|
|
|
|
|
10.36 |
|
— |
|
Form of Restricted Stock Award Agreement under 2014 Equity Incentive Plan (filed as Exhibit 10.3 to our Form 10-Q filed May 7, 2014 and incorporated herein by reference). |
|
|
|
|
|
|
|
10.37 |
|
— |
|
Form of Restricted Stock Unit Award Agreement under 2014 Equity Incentive Plan (filed as Exhibit 10.4 to our Form 10-Q filed May 7, 2014 and incorporated herein by reference). |
|
|
|
|
|
|
|
10.38 |
|
— |
|
Form of Performance Unit Award Agreement under 2014 Equity Incentive Plan (filed as Exhibit 10.5 to our Form 10-Q filed May 7, 2014 and incorporated herein by reference). |
|
|
|
|
|
|
|
10.39 |
|
— |
|
Form of Stock Option Award Agreement under 2014 Equity Incentive Plan (filed as Exhibit 10.6 to our Form 10-Q filed May 7, 2014 and incorporated herein by reference). |
|
|
|
|
|
|
|
10.40 |
|
— |
|
Form of Stock Appreciation Right Award Agreement under 2014 Equity Incentive Plan (filed as Exhibit 10.7 to our Form 10-Q filed May 7, 2014 and incorporated herein by reference). |
|
|
|
|
|
|
|
10.41 |
|
— |
|
2014 Non-Employee Director Equity Incentive Plan (filed as Exhibit 10.8 to our Form 10-Q filed May 7, 2014 and incorporated herein by reference). |
|
|
|
|
|
|
|
10.42 |
|
— |
|
Form of Restricted Stock Award Agreement under 2014 Non-Employee Director Equity Incentive Plan (filed as Exhibit 10.9 to our Form 10-Q filed May 7, 2014 and incorporated herein by reference). |
|
|
|
|
|
|
|
10.43 |
|
— |
|
First Amendment to Credit Agreement, dated as of March 28, 2014, among Powell Industries, Inc., as Parent, certain subsidiaries of Powell Industries, Inc. identified therein, as Guarantors, Bank of America, N.A., as Administrative Agent, Swing Line Lender and L/C issuer, and the Lenders party thereto (filed as Exhibit 10.10 to our Form 10-Q filed May 7, 2014 and incorporated herein by reference). |
|
|
|
|
|
|
|
10.44 |
|
— |
|
Renewed banking facilities between HSBC Bank plc and Powell (UK) Limited dated October 20, 2014 (filed as Exhibit 10.48 to our Form 10-K filed December 3, 2014, and incorporated herein by reference). |
|
|
|
|
|
|
|
10.45 |
|
— |
|
Second Amendment to Amended Credit Agreement, dated December 31, 2014, among Powell Industries, Inc., as Parent, certain subsidiaries of Powell Industries, Inc. identified therein, as Guarantors, Bank of America, N.A., as Administrative Agent, Swing Line Lender and L/C issuer, and the Lenders party thereto (filed as Exhibit 10.1 to our Form 10-Q filed February 4, 2015 and incorporated herein by reference). |
|
|
|
|
|
|
|
10.46 |
|
— |
|
Amending Agreement to Amended and Restated Credit Agreement, effective as of March 31, 2015, between Powell Canada Inc., Powell Industries, Inc., Nextron Limited, PCG Northern Services Inc. and HSBC Bank Canada (filed as Exhibit 10.1 to our Form 10-Q filed May 6, 2015 and incorporated herein by reference). |
|
|
|
|
|
|
|
*10.47 |
|
— |
|
Severance Agreement and Release effective as of March 05, 2015, between the Company and Neil Dial. |
|
|
|
|
|
|
|
10.48 |
|
— |
|
Severance Agreement and Release effective as of December 24, 2015, between the Company and Michael A. Lucas. (filed as Exhibit 10.1 to our Form 10-Q filed February 3, 2016 and incorporated herein by reference) |
|
|
|
|
|
|
|
10.49 |
|
— |
|
Employment Agreement dated September 29, 2016, between the Company and Brett A. Cope (filed as Exhibit 10.1 to our 8-K filed September 30, 2016 and incorporated herein by reference). |
59
|
|
|
|
Description of Exhibits |
|
|
*21.1 |
|
— |
|
Subsidiaries of Powell Industries, Inc. |
|
|
|
|
|
|
|
*23.2 |
|
— |
|
Consent of PricewaterhouseCoopers LLP. |
|
|
|
|
|
|
|
*31.1 |
|
— |
|
Certification of Chief Executive Officer pursuant to Rule 13a-14(a)/15d-14(a). |
|
|
|
|
|
|
|
*31.2 |
|
— |
|
Certification of Chief Financial Officer pursuant to Rule 13a-14(a)/15d-14(a). |
|
|
|
|
|
|
|
*32.1 |
|
— |
|
Certification of Chief Executive Officer Pursuant to Section 18 U.S.C. Section 1350, as Adopted Pursuant to Section 906 of the Sarbanes-Oxley Act of 2002. |
|
|
|
|
|
|
|
*32.2 |
|
— |
|
Certification of Chief Financial Officer Pursuant to Section 18 U.S.C. Section 1350, as Adopted Pursuant to Section 906 of the Sarbanes-Oxley Act of 2002. |
|
|
|
|
|
|
|
101.INS |
|
— |
|
XBRL Instance Document |
|
|
|
|
|
|
|
101.SCH |
|
— |
|
XBRL Taxonomy Extension Schema Document |
|
|
|
|
|
|
|
101.CAL |
|
— |
|
XBRL Taxonomy Extension Calculation Linkbase Document |
|
|
|
|
|
|
|
101.DEF |
|
— |
|
XBRL Taxonomy Extension Definition Linkbase Document |
|
|
|
|
|
|
|
101.LAB |
|
— |
|
XBRL Taxonomy Extension Label Linkbase Document |
|
|
|
|
|
|
|
101.PRE |
|
— |
|
XBRL Taxonomy Extension Presentation Linkbase Document |
|
|
|
* |
Filed herewith. |
|
** |
Portions of this exhibit have been omitted based on a request for confidential treatment pursuant to Rule 24b-2 of the Securities Exchange Act of 1934. Such omitted portions have been filed separately with the Commission. |
60