UNITED STATES SECURITIES AND
EXCHANGE COMMISSION
Washington, D.C.
20549
Form 10-K
| |
|
|
|
(Mark One)
|
|
|
|
|
|
þ
|
|
ANNUAL REPORT PURSUANT TO SECTION 13 OR 15(d) OF THE
SECURITIES EXCHANGE ACT OF 1934
|
|
|
|
For the fiscal
year ended September 30, 2010
|
|
OR
|
|
o
|
|
TRANSITION REPORT PURSUANT TO SECTION 13 OR 15(d) OF THE
SECURITIES EXCHANGE ACT OF 1934
|
Commission File Number
001-12488
Powell Industries,
Inc.
(Exact name of registrant as
specified in its charter)
| |
|
|
|
Delaware
|
|
88-0106100
|
(State or other jurisdiction
of
incorporation or organization)
|
|
(I.R.S. Employer
Identification No.)
|
8550 Mosley RD
Houston, Texas
(Address of principal
executive offices)
|
|
77075-1180
(Zip
Code)
|
Registrant’s telephone number, including area code:
(713) 944-6900
Securities registered pursuant to section 12(b) of the
Act:
Common Stock, par value $.01 per share
Securities registered pursuant to Section 12(g) of
Act:
None
Indicate by check mark whether the registrant is a well-known
seasoned issuer, as defined in Rule 405 of the Securities
Act. o Yes þ No
Indicate by check mark if the registrant is not required to file
reports pursuant to Section 13 or Section 15(d) of the
Act. o Yes þ No
Indicate by check mark whether the registrant (1) has filed
all reports required to be filed by Section 13 or 15(d) of
the Securities Exchange Act of 1934 during the preceding
12 months (or for such shorter period that the registrant
was required to file such reports), and (2) has been
subject to such filing requirements for the past
90 days. þ Yes o No
Indicate by check mark whether the registrant has submitted
electronically and posted on its corporate Web site, if any,
every Interactive Date File required to be submitted and posted
pursuant to Rule 405 of
Regulation S-T
(§232.405 of this chapter) during the preceding
12 months (or for such shorter period that the registrant
was required to submit and post such
files). o Yes o No
Indicate by check mark if disclosure of delinquent filers
pursuant to Item 405 of
Regulation S-K
is not contained herein and will not be contained, to the best
of the registrant’s knowledge, in definitive proxy or
information statements incorporated by reference in
Part III of this
Form 10-K
or any amendment to this
Form 10-K. o
Indicate by check mark whether the registrant is a large
accelerated filer, an accelerated filer, a non-accelerated
filer, or a smaller reporting company. See the definitions of
“large accelerated filer,” “accelerated
filer” and “smaller reporting company” in
Rule 12b-2
of the Exchange Act. (Check one):
|
|
|
|
| o Large
accelerated filer
|
þ Accelerated
filer
|
o Non-accelerated
filer
|
o Smaller
reporting company
|
(Do not check if a smaller reporting company)
Indicate by check mark whether the registrant is a shell company
(as defined in Exchange Act
Rule 12b-2). o Yes þ No
The aggregate market value of the voting stock held by
non-affiliates of the registrant as of the last business day of
the most recently completed second fiscal quarter,
March 31, 2010, was approximately $376,593,000.
Indicate the number of shares outstanding of each of the
registrant’s classes of common stock, as of the latest
practicable date.
At December 3, 2010, there were 11,689,607 outstanding
shares of the registrant’s common stock, par value $0.01
per share.
Documents Incorporated By Reference
Portions of the registrant’s definitive Proxy Statement for
the 2011 annual meeting of stockholders to be filed not later
than 120 days after September 30, 2010, are
incorporated by reference into Part III of this
Form 10-K.
POWELL
INDUSTRIES, INC.
TABLE OF
CONTENTS
2
CAUTIONARY
STATEMENT REGARDING FORWARD-LOOKING STATEMENTS;
RISK FACTORS
Forward-Looking
Statements
This Annual Report on
Form 10-K
(Annual Report) includes forward-looking statements based on our
current expectations, which are subject to risks and
uncertainties. Forward-looking statements include information
concerning future results of operations and financial condition.
Statements that contain words such as “believes,”
“expects,” “anticipates,”
“intends,” “estimates,”
“continue,” “should,” “could,”
“may,” “plan,” “project,”
“predict,” “will” or similar expressions may
be forward-looking statements. These forward-looking statements
are subject to risks and uncertainties, and many factors could
affect the future financial results and condition of the
Company. Factors that may have a material effect on our
revenues, expenses and operating results include adverse
business or market conditions, our ability to secure and satisfy
customers, our customers’ financial condition and their
ability to secure financing to support current and future
projects, the availability and cost of materials from suppliers,
adverse competitive developments and changes in customer
requirements as well as those circumstances discussed under
“Item 1A. Risk Factors,” below. Accordingly,
actual results may differ materially from those expressed or
implied by the forward-looking statements contained in this
Annual Report. Any forward-looking statements made by or on our
behalf are made pursuant to the safe harbor provisions of the
Private Securities Litigation Reform Act of 1995.
The forward-looking statements contained in this Annual Report
are based on current assumptions that we will continue to
develop, market, manufacture and ship products and provide
services on a competitive and timely basis; that competitive
conditions in our markets will not change in a materially
adverse way; that we will accurately identify and meet customer
needs for products and services; that we will be able to retain
and hire key employees; that our products and capabilities will
remain competitive; that the financial markets and banking
systems will stabilize and availability of credit will continue;
that risks related to shifts in customer demand are minimized
and that there will be no material adverse change in the
operations or business of the Company. Assumptions relating to
these factors involve judgments that are based on available
information, which may not be complete, and are subject to
changes in many factors beyond the Company’s control that
can materially affect results. Because of these and other
factors that affect our operating results, past financial
performance should not be considered an indicator of future
performance, and investors should not use historical trends to
anticipate results or trends in future periods.
3
PART I
Overview
Powell Industries, Inc. (we, us, our, Powell or the Company) was
incorporated in the state of Delaware in 2004 as a successor to
a Nevada company incorporated in 1968. The Nevada corporation
was the successor to a company founded by William E. Powell in
1947, which merged into the Company in 1977. Our major
subsidiaries, all of which are wholly-owned, include: Powell
Electrical Systems, Inc.; Transdyn, Inc.; Powell Industries
International, Inc.; Switchgear & Instrumentation
Limited (S&I) and Powell Canada Inc.
We develop, design, manufacture and service custom
engineered-to-order
equipment and systems for the management and control of
electrical energy and other critical processes. Headquartered in
Houston, Texas, we serve the transportation, environmental,
energy, industrial and utility industries.
Our website address is www.powellind.com. We make
available, free of charge on or through our website, copies of
our Annual Reports on
Form 10-K,
Quarterly Reports on
Form 10-Q,
Current Reports on
Form 8-K
and amendments to those reports filed or furnished pursuant to
Section 13(a) or 15(d) of the Securities Exchange Act of
1934 as soon as reasonable after we electronically file such
material with, or furnish it to, the Securities and Exchange
Commission (SEC). Paper or electronic copies of such material
may also be requested by contacting the Company at our corporate
offices.
On December 13, 2005, we announced a change in our fiscal
year-end from October 31 to September 30, effective
September 30, 2006. The change was designed to align our
financial reporting with calendar quarters and to reduce the
impact holidays have on our reporting timeline.
Our business operations are consolidated into two business
segments: Electrical Power Products and Process Control Systems.
Approximately 71%, 77% and 73% of our consolidated revenues for
the fiscal years ended September 30, 2010, 2009 and 2008,
respectively, were generated in the United States of America.
Approximately 79% of our long-lived assets were located in the
United States at September 30, 2010, with the remaining
balance located primarily in the United Kingdom and Canada.
Financial information related to our business and geographical
segments is included in Note N of Notes to Consolidated
Financial Statements.
On December 15, 2009, we acquired the business and certain
assets of PowerComm Inc. and its subsidiaries, Redhill Systems
Ltd., Nextron Corporation, PCG Technical Services Inc. and
Concorde Metal Manufacturing Ltd (the entire business of which
is referred to herein as Powell Canada) for $23.4 million,
not including expenses. Powell Canada is headquartered in
Edmonton, Alberta, Canada, and provides electrical and
maintenance services in western Canada. Powell Canada is also a
manufacturer of switchgear and related products, primarily
serving the oil and gas industry in western Canada. The
operating results of Powell Canada are included in our
Electrical Power Products business segment from the acquisition
date. In conjunction with the acquisition of Powell Canada, on
April 1, 2010, we finalized the acquisition of a 50%
ownership in a joint venture in Kazakhstan. The Company has made
a strategic decision to exit this joint venture. For further
information on the Powell Canada acquisition, see Note D of
Notes to Consolidated Financial Statements.
On August 7, 2006, we purchased certain assets related to
the manufacturing of American National Standards Institute
(ANSI) medium-voltage switchgear and circuit breaker business of
General Electric Company’s (GE) Consumer &
Industrial unit for $32.0 million, not including expenses.
We refer to the acquired product line herein as
“Power/Vac®.”
The operating results of
Power/Vac®
are included in our Electrical Power Products business segment
from the acquisition date.
On July 14, 2006, we acquired certain assets and hired the
service and administrative employees of an electrical services
company in Louisiana for approximately $1.5 million. The
purchase price was paid from existing cash and short-term
marketable securities. The operating results of this acquisition
are included in our Electrical Power Products business segment
from the acquisition date.
4
Electrical
Power Products
Our Electrical Power Products business segment designs,
develops, manufactures and markets custom
engineered-to-order
electrical power distribution and control systems designed
(1) to distribute, monitor and control the flow of
electrical energy and (2) to provide protection to motors,
transformers and other electrically-powered equipment. Our
principal products include power control room substation
packages, traditional and arc-resistant distribution switchgear,
medium-voltage circuit breakers, offshore generator and control
modules, monitoring and control communications systems, motor
control centers and bus duct systems. These products are
designed for application voltages ranging from 480 volts to in
excess of 38,000 volts and are used in electric rail
transportation, refining, chemical, offshore oil and gas
production, electric utility and other heavy industrial markets.
Our product scope includes designs tested to meet both
U.S. standards (ANSI) and international design standards
(IEC — International Electrotechnical Commission). We
also seek to assist customers by providing value-added services
such as spare parts, field service inspection and repair,
retrofit and retrofill components for existing systems and
replacement circuit breakers for switchgear that is obsolete or
that is no longer produced by the original manufacturer. We work
to establish long-term relationships with the end users of our
systems and with the design and construction engineering firms
contracted by those end users.
Customers
and Markets
This business segment’s principal products are designed for
use by and marketed to technologically sophisticated users of
large amounts of electrical energy that typically have a need
for complex combinations of electrical components and systems.
Our customers and their industries include oil and gas
producers, oil and gas pipelines, refineries, petrochemical
plants, electrical power generators, public and private
utilities, co-generation facilities, mining/metals operations,
pulp and paper plants, transportation authorities, governmental
agencies and other large industrial customers.
Products and services are principally sold directly to the
end-user or to an engineering, procurement and construction
(EPC) firm on behalf of the end-user. Each project is
specifically tailored to meet the exact specifications and
requirements of the individual customer. Powell’s expertise
is in the engineering and packaging of the various systems into
a single deliverable. We market and sell our products and
services to a wide variety of customers, markets and geographic
regions. Contracts may represent large-scale projects with an
individual customer. By their nature, these projects are
typically nonrecurring. Thus, multiple
and/or
continuous projects of similar magnitude with the same customer
may vary. As such, gaps in large project awards may cause
material fluctuations in segment revenues.
We could be adversely impacted by a significant reduction in
business volume from a particular industry which we currently
serve. As a result of the supply agreement that we entered into
on August 7, 2006, with GE, our revenues from GE were
approximately $58 million, $86 million and
$82 million in fiscal 2010, fiscal 2009 and fiscal 2008,
respectively, or approximately 11%, 14% and 13% of our
consolidated revenues for these periods. Aside from GE, with
whom we have a long-term supply agreement, we do not believe
that the loss of any specific customer would have a material
adverse effect on our business. GE has become a significant
customer and has accounted for, and could continue to account
for, more than 10% of the annual revenues of this business
segment as a result of the supply agreement that we entered into
on August 7, 2006.
During each of the past three fiscal years, no one country
outside of the United States accounted for more than 10% of
segment revenues. For information on the geographic areas in
which our consolidated revenues were recorded in each of the
past three fiscal years, see Note N of Notes to
Consolidated Financial Statements.
Competition
We strive to be the supplier of choice for custom engineered
system solutions and services to a variety of customers and
markets. Our activities are predominantly in the oil and gas and
the electric utility industries, but also include other markets
where customers need to manage, monitor and control large
amounts of electrical energy. The majority of our business is in
support of capital investment projects which are competitively
bid. We compete with a small number of multinational competitors
that sell to a broad industrial and geographic market and with
smaller, regional competitors that typically have limited
capabilities and scope of supply.
5
Our principal competitors include ABB, Eaton Corporation, GE,
Schneider Electric and Siemens. The competitive factors used
during bid evaluation by our customers vary from project to
project and may include technical support and application
expertise, engineering and manufacturing capabilities, equipment
rating, delivered value, scheduling and price. A significant
portion of our business is from repeat customers and many times
involves third-party engineering and construction companies
hired by the end-user and with which we also have long and
established relationships. We consider our engineering,
manufacturing and service capabilities vital to the success of
our business, and believe our technical and project management
strengths, together with our responsiveness and flexibility to
the needs of our customers, give us a competitive advantage in
our markets. Ultimately, our competitive position is dependent
upon our ability to provide quality custom
engineered-to-order
products, services and systems on a timely basis at a
competitive price.
Backlog
Backlog represents the dollar amount of revenue that we expect
to realize from work to be performed on uncompleted contracts,
including new contractual agreements on which work has not
begun. Our methodology for determining backlog may not be
comparable to the methodology used by other companies. Orders
included in our backlog are represented by customer purchase
orders and contracts, which we believe to be firm. Orders in the
Electrical Power Products business segment backlog at
September 30, 2010, totaled $245.4 million compared to
$329.6 million at September 30, 2009. Our backlog has
declined due to the ongoing economic downturn which has lead our
customers to reduce and delay spending on new capital projects.
We anticipate that approximately $242.6 million of our
ending fiscal 2010 backlog will be fulfilled during our fiscal
year 2011. Conditions outside of our control have caused us to
experience some customer delays and cancellations of certain
projects in the past; accordingly, backlog may not be indicative
of future operating results as orders in our backlog may be
cancelled or modified by our customers.
Raw
Materials and Suppliers
The principal raw materials used in Electrical Power
Products’ operations include steel, copper, aluminum and
various electrical components. These raw material costs
represented approximately 45% of our revenues in fiscal 2010.
Unanticipated increases in raw material requirements,
disruptions in supplies or price increases could increase
production costs and adversely affect profitability.
We purchase certain key electrical components on a sole-sourced
basis and maintain a qualification and performance monitoring
program to control risk associated with sole-sourced items.
Changes in our design to accommodate similar components from
other suppliers could be implemented to resolve a supply problem
related to a sole-sourced component. In this circumstance,
supply problems could result in short-term delays in our ability
to meet commitments to our customers. We believe that sources of
supply for raw materials and components are generally
sufficient, and we have no reason to believe a shortage of raw
materials will cause any material adverse impact during fiscal
year 2011. While we are not dependent on any one supplier for a
material amount of our raw materials, we are highly dependent on
our suppliers in order to meet commitments to our customers. We
did not experience significant or unusual problems in the
purchase of key raw materials and commodities in the past three
years.
Inflation
This business segment is subject to the effects of changing
prices. During the last three fiscal years, we experienced price
volatility for certain commodities, in particular steel, copper
and aluminum products, which are used in the production of our
products. While the cost outlook for commodities used in the
production of our products is not certain, we believe we can
manage these inflationary pressures through contract pricing
adjustments and by actively pursuing internal cost reduction
efforts. We did not enter into any derivative contracts to hedge
our exposure to commodity price changes in fiscal years 2010,
2009 or 2008.
6
Employees
At September 30, 2010, the Electrical Power Products
business segment had 2,430 full-time employees located in
the United States, the United Kingdom, Canada and Singapore. Our
employees are not represented by unions, and we believe that our
relationship with our employees is good.
Research
and Development
This business segment’s research and development activities
are directed toward the development of new products and
processes as well as improvements in existing products and
processes. Research and development expenditures were
$6.0 million, $5.8 million and $6.3 million in
fiscal years 2010, 2009 and 2008, respectively, and are reported
in selling, general and administrative expenses in the
consolidated statement of operations.
Intellectual
Property
While we are the holder of various patents, trademarks and
licenses relating to this business segment, we do not consider
any individual intellectual property to be material to our
consolidated business operations.
Process
Control Systems
Our Process Control Systems business segment designs and
delivers custom
engineered-to-order
technology solutions that help our customers manage their
critical transportation, environmental and energy management
processes and facilities. Our proprietary
DYNAC®
software suite provides a highly integrated operations
management solution for these vital operations. The
mission-critical information may be traffic flow in our
intelligent transportation management solutions, water quality
in our environmental treatment solutions or electrical power
status in the case of our substation automation solutions.
DYNAC®
has user configurable applications designed specifically for
clients that require high performance, 24/7 availability and
superior data integrity in a secure environment.
We provide a comprehensive set of technical services to deliver
these systems. A diverse team of professional systems engineers,
software engineers, analysts, network specialists and automation
engineers provide expertise for the entire life cycle of a
technology project. We have designed and built systems for
various facilities and roadways around the world.
Customers
and Markets
This business segment’s products and services are
principally sold directly to end-users in the transportation,
environmental and energy sectors. From time to time, a
significant percentage of revenues may result from one specific
contract or customer due to the nature of large projects common
to this business segment. In each of the past three fiscal
years, revenues with one or more customers individually
accounted for more than 10% of our segment revenues. Revenues
from these customers totaled $3.2 million,
$7.4 million and $5.4 million in fiscal 2010, 2009 and
2008, respectively. Contracts often represent large-scale,
single-need projects with an individual customer. By their
nature, these projects are typically nonrecurring for a given
customer. Thus, multiple
and/or
continuous projects of similar magnitude with the same customer
are rare. As such, gaps in large project awards may cause
material fluctuations in segment revenues.
During each of the past three fiscal years, the United States is
the only country that accounted for more than 10% of segment
revenues. For information on the geographic areas in which our
consolidated revenues were recorded in each of the past three
fiscal years, see Note N of Notes to Consolidated Financial
Statements.
Competition
This business segment operates in a competitive market where
competition for each contract varies. Depending upon the type of
system and customer requirements, the competition may include
large multinational firms as well as smaller regional
competitors.
7
Our customized systems are designed to meet the specifications
of our customers. Each system is designed, delivered and
installed to the specific requirements of the particular
application. We consider our engineering, systems integration
and technical support capabilities vital to the success of our
business. We believe our turnkey systems integration
capabilities, customizable software, domain expertise, specialty
contracting experience and financial strength give us a
competitive advantage in our markets.
Backlog
Backlog represents the dollar amount of revenue that we expect
to realize from work to be performed on uncompleted contracts,
including new contractual agreements on which work has not
begun. Our methodology for determining backlog may not be
comparable to the methodology used by other companies. Orders
included in our backlog are represented by customer purchase
orders and contracts, which we believe to be firm. Orders in the
Process Control Systems business segment backlog at
September 30, 2010, totaled $36.9 million compared to
$36.2 million at September 30, 2009. We anticipate
that approximately $16.3 million of our ending fiscal 2010
backlog will be fulfilled during our 2011 fiscal year.
Conditions outside of our control have caused us to experience
some customer delays and cancellations of certain projects in
the past; accordingly, backlog may not be indicative of future
operating results as orders in our backlog may be cancelled or
modified by our customers.
Employees
The Process Control Systems business segment had
125 full-time employees at September 30, 2010,
primarily located in the United States. Our employees are not
represented by unions, and we believe that our relationship with
our employees is good.
Research
and Development
The majority of research and development activities of this
business segment are directed toward the development of our
software suites for the management and control of the critical
processes and facilities of our customers. Non-project research
and development expenditures were $0.4 million,
$0.3 million and $0.3 million in fiscal years 2010,
2009 and 2008, respectively, and are reported in selling,
general and administrative expenses in the Consolidated
Statements of Operations.
Intellectual
Property
While we are the holder of various copyrights related to
software for this business segment, we do not consider any
individual intellectual property to be material to our
consolidated business operations.
Our business is subject to a variety of risks and uncertainties,
including, but not limited to, the most significant risks and
uncertainties described below. Additional risks and
uncertainties not known to us or not described below may also
impair our business operations. If any of the following risks
actually occur, our business, financial condition and results of
operations could be harmed and we may not be able to achieve our
goals. This Annual Report also includes statements reflecting
assumptions, expectations, projections, intentions or beliefs
about future events that are intended as “forward-looking
statements” under the Private Securities Litigation Reform
Act of 1995 and should be read in conjunction with the
discussion under “Forward-Looking Statements,” above.
The
ongoing economic uncertainty and financial market conditions
have negatively impacted and may continue to impact our customer
base, suppliers and backlog.
The ongoing economic downturn has reduced our backlog of orders.
Various factors drive demand for our products and services,
including the price of oil, capital expenditures, economic
forecasts and financial markets. Continued uncertainty in the
price of oil, capital expenditures, economic recovery or the
financial markets could continue to impact our customers and
severely impact the demand for projects that would result in
orders for our products and services. If one or more of our
suppliers or subcontractors experiences difficulties that result
in a reduction or interruption in supply to us, or they fail to
meet our manufacturing requirements, our business could be
8
adversely impacted until we are able to secure alternative
sources. Furthermore, our ability to expand our business would
be limited in the future if we are unable to increase our
bonding capacity or our credit facility on favorable terms or at
all. These disruptions could lead to a lower demand for our
products and services and could materially impact our business,
financial condition and results of operations and potentially
impact the trading price of our common stock.
Our
operations could be adversely impacted by the Macondo well
incident, the continuing effects from the U.S. government
moratorium on offshore deepwater drilling projects and related
new regulations.
On April 22, 2010, the drilling rig Deepwater
Horizon, which was engaged in deepwater drilling operations
in the U.S. Gulf of Mexico, sank after an explosion and
fire. The incident resulted in a significant and uncontrolled
oil spill off the coast of Louisiana. On May 28, 2010, the
U.S. government imposed a six-month moratorium on all
offshore deepwater drilling projects. A preliminary injunction
was issued blocking enforcement of the moratorium on
June 22, 2010, and the U.S. government issued a new
moratorium on deepwater drilling on July 12, 2010. On
October 12, 2010, the U.S. government lifted the
moratorium. The U.S. government has also implemented
additional safety and certification requirements applicable to
drilling activities in the U.S. Gulf of Mexico, has imposed
additional requirements with respect to development and
production activities in the U.S. Gulf of Mexico and has
delayed the approval of applications to drill in both deepwater
and shallow-water areas. In addition, the U.S. government
has announced that it intends to require that operators
demonstrate their compliance with new regulations before
resuming deepwater drilling. We cannot predict when, if at all,
operators in the U.S. Gulf of Mexico will be able to
satisfy these requirements. At this time, we cannot predict
what, if any, impact the Macondo well incident, the continuing
effects from the U.S. government moratorium on offshore
deepwater drilling projects and related new regulations may have
on the regulation of offshore oil and gas exploration and
development activity, or what actions may be taken by our
customers or other industry participants in response to the
incident. Changes in laws or regulations regarding offshore oil
and gas exploration and development activities and decisions by
customers and other industry participants could reduce demand
for our services, which would have a negative impact on our
operations.
Our
industry is highly competitive.
Many of our competitors are significantly larger and have
substantially greater resources than we do. Competition in the
industry depends on a number of factors, including price.
Certain of our competitors may have lower cost structures and
may, therefore, be able to provide their products or services at
lower prices than we are able to provide. We cannot be certain
that our competitors will not develop the expertise, experience
and resources to provide products or services that are superior
in both price and quality to our services. Similarly, we cannot
be certain that we will be able to maintain or enhance our
competitive position within our industry, maintain our customer
base at current levels or increase our customer base.
International
and political events may adversely affect our
operations.
International sales accounted for approximately 29% of our
revenues in fiscal 2010, including sales from our operations in
the United Kingdom and Canada. We primarily operate in developed
countries with historically stable operating and fiscal
environments. Our consolidated results of operations, cash flows
and financial condition could be adversely affected by the
occurrence of political and economic instability; social unrest,
acts of terrorism, force majeure, war or other armed conflict;
inflation; currency fluctuations, devaluations and conversion
restrictions; governmental activities that limit or disrupt
markets, restrict payments or limit the movement of funds and
trade restrictions and economic embargoes imposed by the United
States or other countries.
Fluctuations
in the price and supply of raw materials used to manufacture our
products may reduce our profits.
Our raw material costs represented approximately 45% of our
revenues for the fiscal year ended September 30, 2010. We
purchase a wide variety of raw materials to manufacture our
products, including steel, aluminum, copper and various
electrical components. Unanticipated increases in raw material
requirements or price increases could increase production costs
and adversely affect profitability.
9
Our
volume of fixed-price contracts and use of
percentage-of-completion
accounting could result in volatility in our results of
operations.
As discussed in “Management’s Discussion and Analysis
of Financial Condition and Results of Operations —
Critical Accounting Policies and Estimates” and in Notes to
Consolidated Financial Statements, a significant portion of our
revenues is recognized on the
percentage-of-completion
method of accounting. The
percentage-of-completion
accounting practice we use results in our recognizing contract
revenues and earnings ratably over the contract term in
proportion to our incurrence of contract costs. The earnings or
losses recognized on individual contracts are based on estimates
of contract revenues, costs and profitability. The process of
estimating costs on projects requires a significant amount of
judgment and combines professional engineering, cost estimating,
pricing and accounting inputs. Contract losses are recognized in
full when determined, and contract profit estimates of revenue
and cost to complete are adjusted based on ongoing reviews of
estimated contract profitability. Previously recorded estimates
are adjusted as the project progresses. In certain
circumstances, it is possible that such adjustments could have a
significant impact on our operating results for any fiscal
quarter or year. Some of our contracts contain penalty
provisions that require us to pay liquidated damages if we are
responsible for the failure to meet specified contractual
milestones and the applicable customer asserts a claim under
these provisions. These contractual provisions define the
conditions under which our customers may make claims against us
to pay liquidated damages. In many cases in which we have had
potential exposure for liquidated damages, such damages
ultimately were not fully asserted by our customers.
Our
acquisition strategy involves a number of risks.
Our strategy has been to pursue growth and product
diversification through the acquisition of companies or assets
that will enable us to expand our product and service offerings.
We routinely review potential acquisitions. We may be unable to
implement this strategy if we cannot reach agreement on
potential strategic acquisitions on acceptable terms or for
other reasons. Our acquisition strategy involves certain risks,
including difficulties in the integration of operations and
systems; failure to realize cost savings; the termination of
relationships by key personnel and customers of the acquired
company and a failure to add additional employees to handle the
increased volume of business. Additionally, financial and
accounting challenges and complexities in areas such as
valuation, tax planning, treasury management and financial
reporting from our acquisitions pose risks to our strategy. Due
diligence may not reveal all risks and challenges associated
with our acquisitions. A disruption of our ongoing business or
an inability of our ongoing business to receive sufficient
management attention could adversely affect profitability.
Financing for acquisitions may require us to obtain additional
equity or debt financing, which, if available, may not be
available on attractive terms.
Our
backlog is subject to unexpected adjustments and cancellations
and, therefore, may not be a reliable indicator of our future
earnings.
We have a backlog of work to be completed on contracts. Orders
included in our backlog are represented by customer purchase
orders and contracts, which we believe to be firm. Backlog
develops as a result of new business taken, which represents the
revenue value of new project commitments received by us during a
given period. Backlog consists of projects which either
(1) have not yet been started or (2) are in progress
and are not yet completed. In the latter case, the revenue value
reported in backlog is the remaining value associated with work
that has not yet been completed. From time to time, projects are
canceled that appeared to have a high certainty of going forward
at the time they were recorded as new business taken. In the
event of a project cancellation, we may be reimbursed for
certain costs but typically have no contractual right to the
total revenue reflected in our backlog. In addition to our being
unable to recover certain direct costs, canceled projects may
also result in additional unrecoverable costs due to the
resulting underutilization of our assets.
Our
operating results may vary significantly from quarter to
quarter.
Our quarterly results may be materially and adversely affected
by changes in estimated costs or revenues under fixed-price
contracts; the timing and volume of work under new agreements;
general economic conditions; the
10
spending patterns of customers; variations in the margins of
projects performed during any particular quarter; losses
experienced in our operations not otherwise covered by
insurance; a change in the demand or production of our products
and our services caused by severe weather conditions; a change
in the mix of our customers, contracts and business; increases
in design and manufacturing costs; the ability of customers to
pay their invoices owed to us and disagreements with customers
related to project performance on delivery.
Accordingly, our operating results in any particular quarter may
not be indicative of the results that you can expect for any
other quarter or for an entire year.
We may
be unsuccessful at generating profitable internal
growth.
Our ability to generate profitable internal growth will be
affected by, among other factors, potential regulatory changes,
our ability to attract new customers, increase the number or
size of projects performed for existing customers, hire and
retain employees and increase volume utilizing our existing
facilities.
In addition, our customers may reduce the number or size of
projects available to us. Many of the factors affecting our
ability to generate internal growth may be beyond our control,
and we cannot be certain that our strategies will be successful
or that we will be able to generate cash flow sufficient to fund
our operations and to support internal growth. If we are
unsuccessful, we may not be able to achieve internal growth,
expand our operations or grow our business.
The
departure of key personnel could disrupt our
business.
We depend on the continued efforts of our executive officers and
senior management. We cannot be certain that any individual will
continue in such capacity for any particular period of time. The
loss of key personnel, or the inability to hire and retain
qualified employees, could negatively impact our ability to
manage our business.
Our
business requires skilled labor, and we may be unable to attract
and retain qualified employees.
Our ability to maintain our productivity and profitability will
be limited by our ability to employ, train and retain skilled
personnel necessary to meet our requirements. We may experience
shortages of qualified personnel. We cannot be certain that we
will be able to maintain an adequate skilled labor force
necessary to operate efficiently and to support our growth
strategy or that our labor expenses will not increase as a
result of a shortage in the supply of skilled personnel. Labor
shortages or increased labor costs could impair our ability to
maintain our business or grow our revenues, and may adversely
impact our profitability.
Actual
and potential claims, lawsuits and proceedings could ultimately
reduce our profitability and liquidity and weaken our financial
condition.
We could be named as a defendant in future legal proceedings
claiming damages from us in connection with the operation of our
business. Most of the actions against us arise out of the normal
course of our performing services or manufacturing equipment. We
are and will likely continue to be a plaintiff in legal
proceedings against customers, in which we seek to recover
payment of contractual amounts due to us, as well as claims for
increased costs incurred by us. When appropriate, we establish
provisions against certain legal exposures, and we adjust such
provisions from time to time according to ongoing developments
related to each exposure. If in the future our assumptions and
estimates related to such exposures prove to be inadequate or
wrong, our consolidated results of operations, cash flows and
financial condition could be adversely affected. In addition,
claims, lawsuits and proceedings may harm our reputation or
divert management resources away from operating our business.
We
carry insurance against many potential liabilities, and our
management of risk may leave us exposed to unidentified or
unanticipated risks.
Although we maintain insurance policies with respect to our
related exposures, including certain self-insured medical and
dental programs, these policies contain deductibles,
self-insured retentions and limits of coverage. We estimate our
liabilities for known claims and unpaid claims and expenses
based on information available as well as projections for claims
incurred but not reported. However, insurance liabilities, some
of which are self-insured, are
11
difficult to estimate due to various factors. If any of our
insurance policies or programs are not effective in mitigating
our risks, we may incur losses that are not covered by our
insurance policies or that exceed our accruals or that exceed
our coverage limits and could adversely impact our consolidated
results of operations, cash flows and financial position.
We may
incur additional healthcare costs arising from federal
healthcare reform legislation.
In March 2010, the Patient Protection and Affordable Care Act
and the Health Care and Education Reconciliation Act of 2010
were signed into law in the U.S. This legislation expands
health care coverage to many uninsured individuals and expands
coverage to those already insured. The changes required by this
legislation could cause us to incur additional healthcare and
other costs, but we do not expect any material short-term impact
on our financial results as a result of the legislation and are
currently assessing the extent of any long-term impact.
Technological
innovations by competitors may make existing products and
production methods obsolete.
All of the products manufactured and sold by the Company depend
upon the best available technology for success in the
marketplace. The competitive environment is highly sensitive to
technological innovation in both segments of our business. It is
possible for competitors (both domestic and foreign) to develop
products or production methods, which will make current products
or methods obsolete or at least hasten their obsolescence.
Catastrophic
events could disrupt our business.
The occurrence of catastrophic events ranging from natural
disasters such as hurricanes to epidemics such as health
epidemics to acts of war and terrorism could disrupt or delay
the Company’s ability to complete projects for its
customers and could potentially expose the Company to
third-party liability claims. Such events may or may not be
fully covered by our various insurance policies or may be
subject to deductibles. In addition, such events could impact
the Company’s customers and suppliers, resulting in
temporary or long-term delays
and/or
cancellations of orders or raw materials used in normal business
operations. These situations are outside the Company’s
control and could have a significant adverse impact on the
results of operations.
|
|
|
Item 1B.
|
Unresolved
Staff Comments
|
None.
We own or lease manufacturing facilities, sales offices, field
offices and repair centers located throughout the United States
and Canada, and we have a manufacturing facility located in the
United Kingdom. Our facilities are generally located in areas
that are readily accessible to raw materials and labor pools and
are maintained in good condition. These facilities, together
with recent expansions, are expected to meet our needs for the
foreseeable future.
12
Our principal locations by segment as of September 30,
2010, are as follows:
| |
|
|
|
|
|
|
|
|
|
|
|
|
|
|
|
|
|
|
|
|
|
|
|
Approximate
|
|
|
|
Number
|
|
|
|
Square Footage
|
|
Location
|
|
of Facilities
|
|
Acres
|
|
Owned
|
|
Leased
|
|
|
|
Electrical Power Products:
|
|
|
|
|
|
|
|
|
|
|
|
|
|
|
|
|
|
Houston, TX
|
|
|
3
|
|
|
|
78.1
|
|
|
|
430,600
|
|
|
|
138,600
|
|
|
North Canton, OH
|
|
|
1
|
|
|
|
8.0
|
|
|
|
115,200
|
|
|
|
—
|
|
|
Northlake, IL
|
|
|
1
|
|
|
|
10.0
|
|
|
|
103,500
|
|
|
|
—
|
|
|
Bradford, United Kingdom
|
|
|
1
|
|
|
|
7.9
|
|
|
|
129,200
|
|
|
|
—
|
|
|
Edmonton, Alberta, Canada
|
|
|
2
|
|
|
|
|
|
|
|
—
|
|
|
|
70,700
|
|
|
Calgary, Alberta, Canada
|
|
|
1
|
|
|
|
|
|
|
|
—
|
|
|
|
8,200
|
|
|
Process Control Systems:
|
|
|
|
|
|
|
|
|
|
|
|
|
|
|
|
|
|
Pleasanton, CA
|
|
|
1
|
|
|
|
|
|
|
|
—
|
|
|
|
21,200
|
|
|
Duluth, GA
|
|
|
1
|
|
|
|
|
|
|
|
—
|
|
|
|
29,700
|
|
|
Chantilly, VA
|
|
|
1
|
|
|
|
|
|
|
|
—
|
|
|
|
5,200
|
|
|
East Rutherford, NJ
|
|
|
1
|
|
|
|
|
|
|
|
—
|
|
|
|
8,700
|
|
All leased properties are subject to long-term leases with
remaining lease terms ranging from one to 13 years as of
September 30, 2010. We do not anticipate experiencing
significant difficulty in retaining occupancy of any of our
leased facilities through lease renewals prior to expiration or
through
month-to-month
occupancy, or in replacing them with equivalent facilities.
|
|
|
Item 3.
|
Legal
Proceedings
|
We are involved in various legal proceedings, claims and other
disputes arising in the ordinary course of business which, in
general, are subject to uncertainties and the outcomes are not
predictable. We do not believe that the ultimate conclusion of
these disputes could materially affect our financial position or
results of operations.
|
|
|
Item 4.
|
Submission
of Matters to a Vote of Security Holders
|
We did not submit any matter to a vote of our stockholders
during the fourth quarter of fiscal year 2010.
13
PART II
|
|
|
Item 5.
|
Market
for Registrant’s Common Equity, Related Stockholder Matters
and Issuer Purchases of Equity Securities
|
Price
Range of Common Stock
Our common stock trades on the NASDAQ Global Market (NASDAQ)
under the symbol “POWL.” The following table sets
forth, for the periods indicated, the high and low sales prices
per share as reported on the NASDAQ for our common stock.
| |
|
|
|
|
|
|
|
|
|
|
|
High
|
|
Low
|
|
|
|
Fiscal Year 2009:
|
|
|
|
|
|
|
|
|
|
First Quarter
|
|
$
|
41.00
|
|
|
$
|
16.74
|
|
|
Second Quarter
|
|
|
37.31
|
|
|
|
23.25
|
|
|
Third Quarter
|
|
|
44.93
|
|
|
|
30.60
|
|
|
Fourth Quarter
|
|
|
42.55
|
|
|
|
33.73
|
|
|
Fiscal Year 2010:
|
|
|
|
|
|
|
|
|
|
First Quarter
|
|
$
|
41.66
|
|
|
$
|
30.32
|
|
|
Second Quarter
|
|
|
34.27
|
|
|
|
27.71
|
|
|
Third Quarter
|
|
|
36.10
|
|
|
|
27.01
|
|
|
Fourth Quarter
|
|
|
36.67
|
|
|
|
26.26
|
|
As of December 3, 2010, the last reported sales price of
our common stock on the NASDAQ was $36.97 per share. As of
December 3, 2010, there were 536 stockholders of record of
our common stock. All common stock held in street names are
recorded in the Company’s stock register as being held by
one stockholder.
See Part III, Item 12 for information regarding
securities authorized for issuance under our equity compensation
plans.
Dividend
Policy
Our current credit agreements limit the payment of dividends,
other than dividends payable solely in our capital stock,
without prior consent of our lenders. To date, we have not paid
cash dividends on our common stock, and for the foreseeable
future we intend to retain earnings for the development of our
business. Future decisions to pay cash dividends will be at the
discretion of the Board of Directors and will depend upon our
results of operations, financial condition and capital
expenditure plans and restrictive covenants under our credit
facilities, along with other relevant factors.
14
Performance
Graph
The following Performance Graph and related information shall
not be deemed “soliciting material” or to be
“filed” with the Securities and Exchange Commission,
nor shall such information be incorporated by reference into any
future filing under the Securities Act of 1933 or Securities Act
of 1934, each as amended, except to the extent that we
specifically incorporate it by reference into such filing.
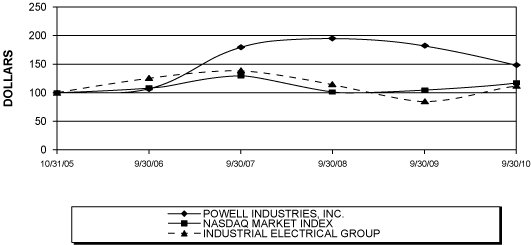
The following graph compares, for the period from
October 31, 2005, to September 30, 2010, the
cumulative stockholder return on our common stock with the
cumulative total return on the NASDAQ Market Index and
Industrial Electrical Equipment Group (a select group of peer
companies — Advanced Energy Industries, Inc.; Altra
Holdings Inc.; AZZ Inc.; CTC Corporation; DXP Enterprises Inc.;
ENGlobal Corporation; ESCO Technologies Inc.; Franklin Electric
Company, Inc.; Integrated Electrical Services, Inc.; Methode
Electronics Inc. and Power-One Inc.). The comparison assumes
that $100 was invested on October 31, 2005, in our common
stock, the NASDAQ Market Index and Industrial Electrical
Equipment Group. The stock price performance reflected on the
following graph is not necessarily indicative of future stock
price performance.
COMPARISON
OF 5-YEAR
CUMULATIVE TOTAL RETURN
AMONG POWELL INDUSTRIES, INC.,
INDUSTRIAL ELECTRICAL EQUIPMENT GROUP AND NASDAQ MARKET
INDEX
|
|
|
Item 6.
|
Selected
Financial Data
|
The selected financial data shown below for the past five years
(including the
11-month
period ended September 30, 2006) was derived from our
audited financial statements. The historical results are not
necessarily indicative of the operating results to be expected
in the future. The selected financial data should be read in
conjunction with “Management’s Discussion and Analysis
of Financial Condition and Results of Operations” and the
consolidated financial statements and related notes included
elsewhere in this Annual Report.
On December 15, 2009, we acquired Powell Canada. Powell
Canada is headquartered in Edmonton, Alberta, Canada and
provides electrical and maintenance services in western Canada.
Powell Canada is also a manufacturer of switchgear and related
products, primarily serving the oil and gas industry in western
Canada. The operating results of Powell Canada, are included in
our Electrical Power Products business segment from the
acquisition date.
On August 7, 2006, we purchased certain assets related to
the ANSI medium-voltage switchgear and circuit breaker business
of GE’s Consumer & Industrial unit. The operating
results of the
Power/Vac®
product line are included from that date.
15
On July 14, 2006, we acquired certain assets and hired the
service and administrative employees of an electrical services
company in Louisiana. The operating results of this acquisition
are included in our Electrical Power Products business segment
from that date.
| |
|
|
|
|
|
|
|
|
|
|
|
|
|
|
|
|
|
|
|
|
|
|
|
|
|
|
|
|
|
|
|
|
|
|
|
11 Months
|
|
|
|
|
Years Ended
|
|
|
Ended
|
|
|
|
|
September 30,
|
|
|
September 30,
|
|
|
|
|
2010
|
|
|
2009
|
|
|
2008
|
|
|
2007
|
|
|
2006
|
|
|
|
|
(In thousands, except per share data)
|
|
|
|
|
Statements of Operations:
|
|
|
|
|
|
|
|
|
|
|
|
|
|
|
|
|
|
|
|
|
|
Revenues
|
|
$
|
550,692
|
|
|
$
|
665,851
|
|
|
$
|
638,704
|
|
|
$
|
564,282
|
|
|
$
|
374,547
|
|
|
Cost of goods sold
|
|
|
408,635
|
|
|
|
520,802
|
|
|
|
512,298
|
|
|
|
468,691
|
|
|
|
305,489
|
|
|
|
|
|
|
|
|
|
|
|
|
|
|
|
|
|
|
|
|
|
|
|
|
Gross profit
|
|
|
142,057
|
|
|
|
145,049
|
|
|
|
126,406
|
|
|
|
95,591
|
|
|
|
69,058
|
|
|
Selling, general and administrative expenses
|
|
|
84,457
|
|
|
|
79,954
|
|
|
|
80,416
|
|
|
|
73,639
|
|
|
|
54,172
|
|
|
Amortization of intangible assets
|
|
|
4,477
|
|
|
|
3,460
|
|
|
|
3,585
|
|
|
|
3,607
|
|
|
|
1,173
|
|
|
Impairment of goodwill
|
|
|
7,452
|
|
|
|
—
|
|
|
|
—
|
|
|
|
—
|
|
|
|
—
|
|
|
|
|
|
|
|
|
|
|
|
|
|
|
|
|
|
|
|
|
|
|
|
|
Operating income
|
|
|
45,671
|
|
|
|
61,635
|
|
|
|
42,405
|
|
|
|
18,345
|
|
|
|
13,713
|
|
|
Interest expense, net
|
|
|
610
|
|
|
|
976
|
|
|
|
2,537
|
|
|
|
2,943
|
|
|
|
698
|
|
|
|
|
|
|
|
|
|
|
|
|
|
|
|
|
|
|
|
|
|
|
|
|
Income before income taxes
|
|
|
45,061
|
|
|
|
60,659
|
|
|
|
39,868
|
|
|
|
15,402
|
|
|
|
13,015
|
|
|
Income tax provision
|
|
|
19,894
|
|
|
|
20,734
|
|
|
|
14,072
|
|
|
|
5,468
|
|
|
|
4,609
|
|
|
|
|
|
|
|
|
|
|
|
|
|
|
|
|
|
|
|
|
|
|
|
|
Net income
|
|
|
25,167
|
|
|
|
39,925
|
|
|
|
25,796
|
|
|
|
9,934
|
|
|
|
8,406
|
|
|
Net (income) loss attributable to noncontrolling interest
|
|
|
(159
|
)
|
|
|
(208
|
)
|
|
|
51
|
|
|
|
(21
|
)
|
|
|
3
|
|
|
|
|
|
|
|
|
|
|
|
|
|
|
|
|
|
|
|
|
|
|
|
|
Net income attributable to Powell Industries, Inc.
|
|
$
|
25,008
|
|
|
$
|
39,717
|
|
|
$
|
25,847
|
|
|
$
|
9,913
|
|
|
$
|
8,409
|
|
|
|
|
|
|
|
|
|
|
|
|
|
|
|
|
|
|
|
|
|
|
|
|
Basic earnings per share attributable to Powell Industries,
Inc.
|
|
$
|
2.17
|
|
|
$
|
3.48
|
|
|
$
|
2.29
|
|
|
$
|
0.90
|
|
|
$
|
0.77
|
|
|
|
|
|
|
|
|
|
|
|
|
|
|
|
|
|
|
|
|
|
|
|
|
Diluted earnings per share attributable to Powell Industries,
Inc.
|
|
$
|
2.14
|
|
|
$
|
3.43
|
|
|
$
|
2.26
|
|
|
$
|
0.88
|
|
|
$
|
0.76
|
|
|
|
|
|
|
|
|
|
|
|
|
|
|
|
|
|
|
|
|
|
|
|
| |
|
|
|
|
|
|
|
|
|
|
|
|
|
|
|
|
|
|
|
|
|
|
|
As of September 30,
|
|
|
|
|
2010
|
|
|
2009
|
|
|
2008
|
|
|
2007
|
|
|
2006
|
|
|
|
|
(In thousands)
|
|
|
|
|
Balance Sheet Data:
|
|
|
|
|
|
|
|
|
|
|
|
|
|
|
|
|
|
|
|
|
|
Cash and cash equivalents
|
|
$
|
115,353
|
|
|
$
|
97,403
|
|
|
$
|
10,134
|
|
|
$
|
5,257
|
|
|
$
|
10,495
|
|
|
Property, plant and equipment, net
|
|
|
63,676
|
|
|
|
61,036
|
|
|
|
61,546
|
|
|
|
67,401
|
|
|
|
60,336
|
|
|
Total assets
|
|
|
400,712
|
|
|
|
404,840
|
|
|
|
397,634
|
|
|
|
341,015
|
|
|
|
292,678
|
|
|
Long-term debt and capital lease obligations, including current
maturities
|
|
|
6,885
|
|
|
|
9,492
|
|
|
|
41,758
|
|
|
|
35,836
|
|
|
|
42,396
|
|
|
Total stockholders’ equity
|
|
|
277,303
|
|
|
|
246,761
|
|
|
|
206,874
|
|
|
|
173,549
|
|
|
|
156,931
|
|
|
Total liabilities and stockholders’ equity
|
|
|
400,712
|
|
|
|
404,840
|
|
|
|
397,634
|
|
|
|
341,015
|
|
|
|
292,678
|
|
|
|
|
Item 7.
|
Management’s
Discussion and Analysis of Financial Condition and Results of
Operations
|
The following discussion should be read in conjunction with the
accompanying consolidated financial statements and related
notes. Any forward-looking statements made by or on our behalf
are made pursuant to the safe-harbor provisions of the Private
Securities Litigation Reform Act of 1995. Readers are cautioned
that such forward-looking statements involve risks and
uncertainties in that the actual results may differ materially
from those projected in the forward-looking statements. For a
description of the risks and uncertainties, please see
“Cautionary
16
Statement Regarding Forward-Looking Statements; Risk
Factors” and “Item 1A. Risk Factors”
contained in this Annual Report.
Overview
We develop, design, manufacture and service custom
engineered-to-order
equipment and systems for the management and control of
electrical energy and other critical processes. Headquartered in
Houston, Texas, we serve the transportation, environmental,
energy, industrial and utility industries. Our business
operations are consolidated into two business segments:
Electrical Power Products and Process Control Systems. Revenues
and costs are primarily related to
engineered-to-order
equipment and systems, which precludes us from providing
detailed price and volume information.
Throughout fiscal years 2007 and 2008, we experienced strong
market demand for our products and services. New investments in
oil and gas infrastructure, as well as new investments by
municipal and transit authorities to expand and improve public
transportation, were key drivers of increased business volume
with favorable margins in fiscal year 2009. Customer inquiries
and requests for proposals remained strong throughout fiscal
2008 and the first half of fiscal 2009. Accordingly, we entered
fiscal 2009 with a strong backlog of orders which resulted in
record revenues in fiscal year 2009. Throughout the second half
of 2009, customer inquiries and requests for proposal activity
decreased and an increasing number of our customers began to
cancel or delay the start of new capital projects for various
reasons. This decreased our backlog of orders during 2009, and
we began fiscal year 2010 with a backlog of $365.8 million,
a $152.8 million decrease from the backlog of orders at the
beginning of fiscal year 2009. The order backlog at
September 30, 2010, was $282.3 million. This decline
in orders related to large capital projects with favorable
margins in the second half of fiscal 2009 and throughout fiscal
year 2010 will reduce our revenues and gross profits in fiscal
year 2011, as compared to fiscal years 2009 and 2010.
On December 15, 2009, we acquired the business and certain
assets of PowerComm Inc. and its subsidiaries, Redhill Systems
Ltd., Nextron Corporation, PCG Technical Services Inc. and
Concorde Metal Manufacturing Ltd (the entire business of which
is referred to herein as Powell Canada). Powell Canada is
headquartered in Edmonton, Alberta, Canada, and provides
electrical and maintenance services in western Canada. Powell
Canada is also a manufacturer of switchgear and related
products, primarily serving the oil and gas industry in western
Canada. The operating results of Powell Canada are included in
our Electrical Power Products business segment from the
acquisition date. In conjunction with the acquisition of Powell
Canada, on April 1, 2010, we finalized the acquisition of a
50% ownership in a joint venture in Kazakhstan. The Company has
made a strategic decision to exit this joint venture. For
further information on the Powell Canada acquisition, see
Note D of Notes to Consolidated Financial Statements.
Results
of Operations
Twelve
Months Ended September 30, 2010 (Fiscal 2010) Compared
to Twelve Months Ended September 30, 2009 (Fiscal
2009)
Revenue
and Gross Profit
Consolidated revenues decreased $115.2 million to
$550.7 million in Fiscal 2010 compared to
$665.9 million in Fiscal 2009. Revenues decreased as a
result of the decrease in demand for our products and services
as discussed above. Domestic revenues decreased by 23.8% to
$393.3 million in Fiscal 2010 compared to
$516.0 million in Fiscal 2009. International revenues
increased from $149.9 million in Fiscal 2009 to
$157.6 million in Fiscal 2010. The acquisition of Powell
Canada contributed approximately $51.1 million of our
international revenues during Fiscal 2010. Gross profit in
Fiscal 2010 decreased by approximately $3.0 million
compared to Fiscal 2009, primarily as a result of lower revenues.
Consolidated gross profit, as a percentage of revenues, was
25.8% in Fiscal 2010 compared to 21.8% in Fiscal 2009. This
increase in gross profit as a percentage of revenues resulted
from strong market demand when the projects were negotiated,
reduced costs on project completion from operational
efficiencies, a reduced work force, reduced warranty costs,
cancellation fees for orders that were cancelled from our
backlog and the successful
17
negotiation of change orders and the favorable negotiation of a
customer claim for which the costs were previously recognized.
Electrical
Power Products
Our Electrical Power Products business segment recorded revenues
of $524.2 million in Fiscal 2010, compared to
$637.9 million in Fiscal 2009. In Fiscal 2010, revenues
from public and private utilities were approximately
$148.6 million compared to $154.3 million in Fiscal
2009. The acquisition of Powell Canada contributed approximately
$51.1 million of revenue during Fiscal 2010. Revenues from
commercial and industrial customers totaled $338.0 million
in Fiscal 2010, a decrease of $94.5 million compared to
Fiscal 2009. Municipal and transit projects generated revenues
of $37.6 million in Fiscal 2010 compared to
$51.1 million in Fiscal 2009.
Business segment gross profit, as a percentage of revenues, was
25.5% in Fiscal 2010 compared to 20.9% in Fiscal 2009. This
increase in gross profit as a percentage of revenues resulted
from strong market demand when the projects were negotiated,
reduced costs on project completion from operational
efficiencies, a reduced workforce, reduced warranty costs,
cancellation fees for orders that were cancelled from our
backlog and the successful negotiation of change orders and the
favorable negotiation of a customer claim for which the costs
were previously recognized.
Process
Control Systems
In Fiscal 2010, our Process Control Systems business segment
recorded revenues of $26.5 million, a decrease from
$28.0 million in Fiscal 2009. Business segment gross
profit, as a percentage of revenues, decreased to 31.3% for
Fiscal 2010, compared to 40.8% for Fiscal 2009. This decrease in
revenues and gross profit as a percentage of revenues is related
to the mix of jobs currently in the backlog and revenues of
$3.5 million and gross profit of $2.8 million in the
third quarter of Fiscal 2009, resulting from a mediated
settlement related to a previously completed contract that was
in dispute for several years.
For additional information related to our business segments, see
Note N of Notes to Consolidated Financial Statements.
Consolidated
Selling, General and Administrative Expenses
Consolidated selling, general and administrative expenses
increased to 15.3% of revenues in Fiscal 2010 compared to 12.0%
of revenues in Fiscal 2009. Selling, general and administrative
expenses increased to $84.5 million in Fiscal 2010 compared
to $80.0 million in Fiscal 2009. This increase was
primarily related to the acquisition of Powell Canada and
includes acquisition-related costs of approximately
$2.4 million. Selling, general and administration expenses
increased as a percentage of revenues as a result of our decline
in revenues, along with the fact that portions of our sales and
administrative support infrastructure is necessary to support
our customers, invest in information systems, continue research
and development and pursue project opportunities.
Amortization
of Intangible Assets
Amortization of intangible assets increased to $4.5 million
in Fiscal 2010, compared to $3.5 million in Fiscal 2009.
This increase was from the amortization of the intangible assets
recorded as a result of the acquisition of Powell Canada.
Impairment
of Goodwill
An impairment of goodwill of approximately $7.5 million was
recorded in Fiscal 2010 related to the Powell Canada
acquisition. The Company’s strategic decision to exit the
50% owned joint venture in Kazakhstan and delays in the
anticipated growth in capital investments in the Oil Sands
Region of western Canada, relative to our expectations, resulted
in the impairment charge.
18
Interest
Income and Expense
Interest expense was $0.9 million in Fiscal 2010, a
decrease of approximately $0.2 million compared to Fiscal
2009. The decrease in interest expense was primarily due to
lower amounts outstanding under our U.S. and U.K. credit
facilities during Fiscal 2010.
Interest income was $0.3 million in Fiscal 2010 compared to
$0.1 million in Fiscal 2009. This increase resulted from
larger cash amounts being invested during Fiscal 2010.
Income
Tax Provision
Our provision for income taxes reflects an effective tax rate on
earnings before income taxes of 44.1% in Fiscal 2010 compared to
34.2% in Fiscal 2009. The increase in the effective tax rate was
primarily related to the valuation allowance recorded related to
foreign deferred tax assets.
Net
Income Attributable to Powell Industries, Inc.
In Fiscal 2010, we recorded net income of $25.0 million, or
$2.14 per diluted share, compared to $39.7 million, or
$3.43 per diluted share, in Fiscal 2009. We generated improved
gross profits as a percentage of revenues for the Company as a
whole as a result of favorable margins on project completion due
to operational efficiencies and cancellation fees for orders
that were cancelled from our backlog, along with the successful
negotiation of change orders and the favorable negotiation of a
customer claim in Fiscal 2010 for which costs were previously
recognized. Net income for Fiscal 2010 was negatively impacted
by the impairment of goodwill of approximately $7.5 million
and the valuation allowance recorded on foreign deferred tax
assets of approximately $3.7 million. As previously
discussed, net income in Fiscal 2009 included the benefit of the
$3.5 million mediated settlement, reduced by legal and
other expenses of approximately $0.7 million, net of tax,
related to a previously completed contract that was in dispute
for several years.
Backlog
The order backlog at September 30, 2010, was
$282.3 million, compared to $365.8 million at
September 30, 2009. New orders placed during Fiscal 2010
totaled $466.8 million compared to $511.2 million in
Fiscal 2009. Backlog decreased during the second half of Fiscal
2009 and into Fiscal 2010 due to the ongoing economic downturn
which has led our customers to reduce and delay spending on new
capital projects. This decline in backlog throughout Fiscal 2010
negatively impacted our revenues in Fiscal 2010 and will
continue to negatively impact our revenues going into 2011.
Fiscal
2009 Compared to Twelve Months Ended September 30, 2008
(Fiscal 2008)
Revenue
and Gross Profit
Consolidated revenues increased $27.2 million to
$665.9 million in Fiscal 2009 compared to
$638.7 million in Fiscal 2008. Revenues increased as we
responded to strong market demand by increasing our capacity and
throughput. Domestic revenues increased by 10.0% to
$516.0 million in Fiscal 2009 compared to
$469.1 million in Fiscal 2008. International revenues
decreased from $169.6 million in Fiscal 2008 to
$149.9 million in Fiscal 2009, primarily as the result of
changes in the British Pound
Sterling-to-U.S. Dollar
exchange rate. The increase in consolidated revenues was
primarily due to an increased sales effort and strong market
demand in Fiscal 2008 and the first half of Fiscal 2009. Gross
profit in Fiscal 2009 increased by approximately
$18.6 million compared to Fiscal 2008 as a result of our
ability to absorb our fixed costs and improved pricing as a
result of strong market activity.
Electrical
Power Products
Our Electrical Power Products business segment recorded revenues
of $637.9 million in Fiscal 2009, compared to
$611.5 million in Fiscal 2008. In Fiscal 2009, revenues
from public and private utilities were approximately
$154.3 million compared to $171.8 million in Fiscal
2008. Revenues from commercial and industrial customers
19
totaled $432.5 million in Fiscal 2009, an increase of
$32.5 million compared to Fiscal 2008. Municipal and
transit projects generated revenues of $51.1 million in
Fiscal 2009 compared to $39.7 million in Fiscal 2008.
Business segment gross profit, as a percentage of revenues, was
20.9% in Fiscal 2009 compared to 19.3% in Fiscal 2008. The
increase in gross profit as a percentage of revenues was
attributable to efficiencies resulting from an increase in
production volume and improved pricing as a result of strong
market activity.
Process
Control Systems
In Fiscal 2009, our Process Control Systems business segment
recorded revenues of $28.0 million, up from
$27.2 million in Fiscal 2008. Business segment gross profit
increased as a percentage of revenues, to 40.8% for Fiscal 2009,
compared to 30.2% for Fiscal 2008. This increase resulted from a
favorable mix of jobs and increased efficiencies through
regionalization of operations. Revenues and gross profit
benefited in Fiscal 2009 by approximately $3.5 million and
$2.8 million, respectively, due to a mediated settlement
related to a previously completed contract that was in dispute
for several years.
For additional information related to our business segments, see
Note N of Notes to Consolidated Financial Statements.
Consolidated
Selling, General and Administrative Expenses
Consolidated selling, general and administrative expenses
decreased to 12.0% of revenues in Fiscal 2009 compared to 12.6%
of revenues in Fiscal 2008. Selling, general and administrative
expenses decreased to $80.0 million in Fiscal 2009 compared
to $80.4 million in Fiscal 2008. This decrease was
primarily a result of decreased commissions and incentive
compensation. Selling, general and administrative expenses as a
percentage of revenues decreased primarily due to our ability to
leverage our existing infrastructure to support our increased
production volume, along with the timing of commissions related
to new orders.
Interest
Income and Expense
Interest expense was $1.1 million in Fiscal 2009, a
decrease of approximately $1.8 million compared to Fiscal
2008. The decrease in interest expense was primarily due to
lower interest rates and the lower amounts outstanding under our
credit facility during Fiscal 2009.
Interest income was $0.1 million in Fiscal 2009 compared to
$0.4 million in Fiscal 2008. This decrease resulted from
lower interest rates being earned on amounts invested.
Income
Tax Provision
Our provision for income taxes reflects an effective tax rate on
earnings before income taxes of 34.2% in Fiscal 2009 compared to
35.3% in Fiscal 2008. The decrease in the effective tax rate
resulted primarily from an agreement reached with the taxing
authorities in the United Kingdom resulting in a reduction in
tax expense of approximately $568,000 related to foreign tax
credits from previous years.
Net
Income Attributable to Powell Industries, Inc.
In Fiscal 2009, we recorded net income of $39.7 million, or
$3.43 per diluted share, compared to $25.8 million, or
$2.26 per diluted share, in Fiscal 2008. We generated higher
revenues and improved gross profits for the Company as a whole,
while leveraging our existing infrastructure to support our
increased production volume. As previously discussed, net income
in Fiscal 2009 included the benefit of the $3.5 million
mediated settlement, reduced by legal and other expenses of
approximately $0.7 million, net of tax, related to a
previously completed contract that was in dispute for several
years.
20
Backlog
The order backlog at September 30, 2009, was
$365.8 million, compared to $518.6 million at
September 30, 2008. New orders placed during Fiscal 2009
totaled $511.2 million compared to $705.4 million in
Fiscal 2008. Our decline in backlog was due to the amount of
projects completed being greater than the amount of orders
received.
Liquidity
and Capital Resources
Cash and cash equivalents increased to approximately
$115.4 million at September 30, 2010, as a result of
cash flow provided by operations of approximately
$64.1 million for Fiscal 2010. The approximately
$64.1 million of cash flow from operations resulted from
net income and our continued efforts to manage inventory and
billings to customers. As of September 30, 2010, current
assets exceeded current liabilities by 2.6 times and our debt to
total capitalization ratio was 2.4%.
At September 30, 2010, we had cash and cash equivalents of
$115.4 million, compared to $97.4 million at
September 30, 2009. We have a $58.5 million revolving
credit facility in the U.S. and an additional
£4.0 million (approximately $6.3 million)
revolving credit facility in the United Kingdom, both of which
expire in December 2012. As of September 30, 2010, there
were no amounts borrowed under these lines of credit. We also
have a $19.4 million revolving credit facility and a
$2.4 million single advance term loan in Canada. At
September 30, 2010, there was no balance outstanding under
the Canadian revolving credit facility or the Canadian term
loan. Total long-term debt and capital lease obligations,
including current maturities, totaled $6.9 million at
September 30, 2010, compared to $9.5 million at
September 30, 2009. Letters of credit outstanding were
$15.2 million and $17.6 million at September 30,
2010 and 2009, respectively, which reduce our availability under
our credit facilities. Amounts available under the
U.S. revolving credit facility and the revolving credit
facility in the United Kingdom were approximately
$43.3 million and $6.3 million, respectively, at
September 30, 2010. Amounts available under the Canadian
revolving credit facility were approximately $14.4 million
at September 30, 2010. For further information regarding
our debt, see Notes H and L of Notes to Consolidated
Financial Statements.
Operating
Activities
During Fiscal 2010, cash provided by operating activities was
approximately $64.1 million. Cash flow from operations is
primarily influenced by demand for our products and services and
is impacted as our progress payment terms with our customers are
matched with the payment terms with our suppliers. During Fiscal
2009, cash provided by operating activities was approximately
$127.0 million. The increase in Fiscal 2009 cash flow from
operations resulted primarily from net income and our increased
efforts to manage inventory and billings to customers. During
Fiscal 2008, cash used in operating activities was approximately
$5.2 million. Cash flow from operations was negatively
impacted as accounts receivable and inventories increased due to
higher volume as a result of demand for our products and
services.
Investing
Activities
Investments in property, plant and equipment during Fiscal 2010
totaled approximately $4.4 million compared to
$8.1 million and $3.4 million in Fiscal 2009 and 2008,
respectively. During Fiscal 2010, we acquired Powell Canada for
approximately $23.4 million. Additionally, approximately
$0.6 million was paid to acquire the noncontrolling
interest related to our joint venture in Singapore (Powell
Asia), which has been strategically realigned from an operating
entity to a sales and marketing function within Powell. Our
capital expenditures in Fiscal 2009 related primarily to the
expansion of one of our operating facilities and for upgrades to
our enterprise resource planning system (ERP system).
There were no material proceeds from the sale of fixed assets in
Fiscal 2010, 2009 or 2008. Proceeds from the sale of fixed
assets in Fiscal 2009 were primarily from the sale of idled
manufacturing facilities and equipment.
Financing
Activities
Net cash used in financing activities was approximately
$19.4 million in Fiscal 2010, as we paid down our Canadian
revolving line of credit and term loan from the cash flow
provided by our operating activities. Net cash
21
used in financing activities was approximately
$30.4 million in Fiscal 2009 because we paid down our
U.S. and U.K. revolving lines of credit and the term loan
from the cash flow provided by our operating activities. Net
cash provided by financing activities was approximately
$13.8 million in Fiscal 2008. The primary source of cash in
financing activities in Fiscal 2008 was due to borrowings on the
U.S. revolving line of credit and proceeds from the
exercise of stock options, which were used to fund operations
and capital expenditures.
Contractual
and Other Obligations
At September 30, 2010, our long-term contractual
obligations were limited to debt and leases. The table below
details our commitments by type of obligation, including
interest if applicable, and the period that the payment will
become due (in thousands).
| |
|
|
|
|
|
|
|
|
|
|
|
|
|
|
|
|
|
|
|
Long-Term
|
|
|
Capital
|
|
|
Operating
|
|
|
|
|
As of September 30, 2010,
|
|
Debt
|
|
|
Lease
|
|
|
Lease
|
|
|
|
|
|
Payments Due by Period:
|
|
Obligations
|
|
|
Obligations
|
|
|
Obligations
|
|
|
Total
|
|
|
|
|
Less than 1 year
|
|
$
|
424
|
|
|
$
|
1,403
|
|
|
$
|
3,362
|
|
|
$
|
5,189
|
|
|
1 to 3 years
|
|
|
842
|
|
|
|
830
|
|
|
|
5,002
|
|
|
|
6,674
|
|
|
3 to 5 years
|
|
|
833
|
|
|
|
23
|
|
|
|
729
|
|
|
|
1,585
|
|
|
More than 5 years
|
|
|
2,846
|
|
|
|
—
|
|
|
|
1
|
|
|
|
2,847
|
|
|
|
|
|
|
|
|
|
|
|
|
|
|
|
|
|
|
|
|
Total long-term contractual obligations
|
|
$
|
4,945
|
|
|
$
|
2,256
|
|
|
$
|
9,094
|
|
|
$
|
16,295
|
|
|
|
|
|
|
|
|
|
|
|
|
|
|
|
|
|
|
|
As of September 30, 2010, the total unrecognized tax
benefit related to uncertain tax positions was approximately
$0.8 million. We estimate that none of this will be paid
within the next 12 months. However, we believe that it is
reasonably possible that within the next 12 months
unrecognized tax benefits will remain unchanged due to the
expiration of certain statutes of limitations. We are unable to
make reasonably reliable estimates regarding the timing of
future cash outflows, if any, associated with the remaining
unrecognized tax benefits.
Other
Commercial Commitments
We are contingently liable for secured and unsecured letters of
credit of $18.2 million as of September 30, 2010, of
which $15.2 million reduces our borrowing capacity.
The following table reflects potential cash outflows that may
result from a contingent event related to our letters of credit
(in thousands):
| |
|
|
|
|
As of September 30, 2010,
|
|
Letters of
|
|
|
Payments Due by Period:
|
|
Credit
|
|
|
|
|
Less than 1 year
|
|
$
|
10,042
|
|
|
1 to 3 years
|
|
|
7,857
|
|
|
3 to 5 years
|
|
|
135
|
|
|
More than 5 years
|
|
|
156
|
|
|
|
|
|
|
|
|
Total long-term commercial obligations
|
|
$
|
18,190
|
|
|
|
|
|
|
|
We also had performance and maintenance bonds totaling
approximately $185.3 million that were outstanding at
September 30, 2010. Performance and maintenance bonds are
used to guarantee contract performance to our customers.
Outlook
We participate in large capital-intensive projects in the oil
and gas, petrochemical, utility and transportation markets,
which can take several years to plan and execute. Once our
customers begin the construction phase, projects are typically
completed. Our record revenues in Fiscal 2009 were driven by the
large number and size of capital projects that were planned and
initiated over the previous two years.
22
However, our backlog of orders going into our fiscal year 2011
(Fiscal 2011) is approximately $282.3 million, a
decrease of $83.5 million from the beginning backlog of
orders going into Fiscal 2010. Throughout the second half of
Fiscal 2009 and continuing into Fiscal 2010, customer inquiries
and requests for proposal activity decreased and an increasing
number of our customers cancelled or delayed the start of new
capital projects. We believe these delays resulted from the
short-term reduction in the demand for oil, uncertainty in the
worldwide economy and financial markets, as well as increasing
uncertainty as to the impact that potential regulatory changes
could have on their business.
Growth in demand for energy is expected to continue over the
long term. New infrastructure investments will be needed to
ensure the available supply of petroleum products. New power
generation and distribution infrastructure will also be needed
to meet the growing demand for electrical energy. New power
generation plants will also be needed to replace the aging
facilities across the United States, as those plants reach the
end of their life cycle. A heightened concern for environmental
damage, together with the uncertainty of gasoline prices, has
expanded the popularity of urban transit systems and pushed
ridership to an all-time high, which will drive new investment
in transit infrastructure. Opportunities for future projects
continue; however, the timing of many of these projects is
difficult to predict. The demand for our products and services
will increase as investments in large capital-intensive
infrastructure projects begins to receive funding and support.
We believe that cash available and borrowing capacity under our
existing credit facilities should be sufficient to finance
anticipated operational activities, capital improvements and
debt repayments for the foreseeable future. During this period
of continued economic and market uncertainty, we will continue
to monitor the factors that drive our markets. We will strive to
maintain our leadership and competitive advantage in the markets
we serve while aligning our cost structures with market
conditions.
Effects
of Inflation
We have experienced price volatility related to raw materials,
primarily copper, aluminum and steel, during the past three
years. Fixed-price contracts can limit our ability to pass cost
increases to our customers, thus negatively impacting our
earnings. We anticipate that the volatility in commodity prices
could impact our operations in Fiscal 2011.
Critical
Accounting Policies and Estimates
The preparation of consolidated financial statements in
conformity with accounting principles generally accepted in the
United States of America requires management to make estimates
and assumptions that affect the reported amounts of assets,
liabilities, revenues and expenses and the disclosures of
contingent assets and liabilities. We base our estimates on
historical experience and on various other assumptions that are
believed to be reasonable under the circumstances. Actual
results may differ from these estimates. We believe the
following accounting policies and estimates to be critical in
the preparation and reporting of our consolidated financial
statements.
Revenue
Recognition
Our revenues are primarily generated from engineering and
manufacturing of custom products under long-term contracts that
may last from one month to several years, depending on the
contract. Revenues from long-term contracts are recognized on
the
percentage-of-completion
method of accounting.
Under the
percentage-of-completion
method of accounting, revenues are recognized as work is
performed primarily based on the estimated completion to date
calculated by multiplying the total contract price by percentage
of performance to date, based on total costs or total labor
dollars incurred to date to the total estimated costs or total
labor dollars estimated at completion. The method used to
determine the percentage of completion is typically the cost
method, unless the labor method is a more accurate method of
measuring the progress of the project. Application of the
percentage-of-completion
method of accounting requires the use of estimates of costs to
be incurred for the performance of the contract. Contract costs
include all direct material, direct labor costs and those
indirect costs related to contract performance, such as indirect
labor, supplies, tools, repairs and all costs associated with
operation of equipment. The cost estimation process is based
upon the professional knowledge and experience of the
Company’s engineers, project managers and financial
professionals. Factors that are considered in estimating
23
the work to be completed and ultimate contract recovery include
the availability and productivity of labor, the nature and
complexity of the work to be performed, the effect of change
orders, the availability of materials, the effect of any delays
in our project performance and the recoverability of any claims.
Changes in job performance, job conditions, estimated
profitability and final contract settlements, including our
estimate of liquidated damages, if any, may result in revisions
to costs and income, with their effects being recognized in the
period in which the revisions are determined. Whenever revisions
of estimated contract costs and contract values indicate that
the contract costs will exceed estimated revenues, thus creating
a loss, a provision for the total estimated loss is recorded in
that period.
Revenues associated with maintenance, repair and service
contracts are recognized when the services are performed.
Expenses related to these types of services are recognized as
incurred.
Allowance
for Doubtful Accounts
We maintain and continually assess the adequacy of an allowance
for doubtful accounts representing our estimate for losses
resulting from the inability of our customers to pay amounts due
to us. This estimated allowance is based on historical
experience of uncollected accounts, the level of past due
accounts, the overall level of outstanding accounts receivable,
information about specific customers with respect to their
inability to make payments and expectations of future conditions
that could impact the collectibility of accounts receivable.
However, future changes in our customers’ operating
performance and cash flows, or in general economic conditions,
could have an impact on their ability to fully pay these
amounts, which, among other things, could have a material
adverse impact on our operating results.
Impairment
of Long-Lived Assets
We review long-lived assets for impairment whenever events or
changes in circumstances indicate that the carrying value may
not be realizable. If an evaluation is required, the estimated
future undiscounted cash flows associated with the asset are
compared to the asset’s carrying amount to determine if an
impairment of such asset is necessary. This requires us to make
long-term forecasts of the future revenues and costs related to
the assets subject to review. Forecasts require assumptions
about demand for our products and future market conditions.
Estimating future cash flows requires significant judgment, and
our projections may vary from cash flows eventually realized.
Future events and unanticipated changes to assumptions could
require a provision for impairment in a future period. The
effect of any impairment would be reflected in income (loss)
from operations in the Consolidated Statements of Operations. In
addition, we estimate the useful lives of our long-lived assets
and other intangibles and periodically review these estimates to
determine whether these lives are appropriate.
Intangible
Assets
Goodwill and other intangible assets with indefinite useful
lives are no longer amortized, but are evaluated for impairment
annually, or immediately if conditions indicate that impairment
could exist. The evaluation requires a two-step impairment test
to identify potential goodwill impairment and measure the amount
of a goodwill impairment loss. The first step of the test
compares the fair value of a reporting unit with its carrying
amount, including goodwill. If the carrying amount of a
reporting unit exceeds its fair value, the second step of the
goodwill impairment test is performed to measure the amount of
the impairment loss. Both steps of the goodwill impairment
testing involve significant estimates.
The costs of intangible assets with determinable useful lives
are amortized over their estimated useful lives. When certain
events or changes in operating conditions occur, an impairment
assessment is performed and lives of intangible assets with
determinable lives may be adjusted.
See Note E of the Notes to Consolidated Financial
Statements for a discussion of our impairment recorded related
to the goodwill associated with the acquisition of Powell Canada
and the 50% ownership in the operations in a joint venture in
Kazakhstan.
24
Accruals
for Contingent Liabilities
From time to time, contingencies such as insurance and legal
claims arise in the normal course of business. Pursuant to
current accounting standards, we must evaluate such
contingencies to subjectively determine the likelihood that an
asset has been impaired or a liability has been incurred at the
date of the financial statements, as well as evaluating whether
the amount of the loss can be reasonably estimated. If the
likelihood is determined to be probable and it can be reasonably
estimated, the estimated loss is recorded. The amounts we record
for insurance claims, warranties, legal and other contingent
liabilities require judgments regarding the amount of expenses
that will ultimately be incurred. We use past experience and
history, as well as the specific circumstances surrounding each
contingent liability, in evaluating the amount of liability that
should be recorded. Actual results could differ from our
estimates.
Warranty
Costs
We provide for estimated warranty costs at the time of sale
based upon historical rates applicable to individual product
lines. In addition, specific provisions are made when the costs
of such warranties are expected to exceed accruals. We use past
experience and historical claims to determine the estimated
liability. Actual results could differ from our estimate.
Accounting
for Income Taxes
We account for income taxes under the asset and liability
method, based on the income tax laws and rates in the countries
in which operations are conducted and income is earned. This
approach requires the recognition of deferred tax assets and
liabilities for the expected future tax consequences of
temporary differences between the carrying amounts and the tax
basis of assets and liabilities. Developing our provision for
income taxes requires significant judgment and expertise in
federal, international and state income tax laws, regulations
and strategies, including the determination of deferred tax
assets and liabilities and, if necessary, any valuation
allowances that may be required for deferred tax assets. We
record a valuation allowance to reduce our deferred tax assets
to the amount that is more likely than not to be realized. We
believe that the deferred tax asset recorded as of
September 30, 2010, is realizable through future reversals
of existing taxable temporary differences and future taxable
income. If we were to subsequently determine that we would be
able to realize deferred tax assets in the future in excess of
our net recorded amount, an adjustment to deferred tax assets
would increase earnings for the period in which such
determination was made. We will continue to assess the adequacy
of the valuation allowance on a quarterly basis. Our judgments
and tax strategies are subject to audit by various taxing
authorities.
The objectives of accounting for income taxes are to recognize
the amount of taxes payable or refundable for the current year
and deferred tax liabilities and assets for the future tax
consequences of events that have been recognized in an
entity’s financial statements or tax returns. We recognize
the tax benefit from an uncertain tax position only if it is
more likely than not that the tax position will be sustained on
examination by the taxing authorities, based on the technical
merits of the position. The tax benefits recognized in the
financial statements from such a position should be measured
based on the largest benefit that has a greater than 50%
likelihood of being realized upon ultimate settlement.
Accounting literature also provides guidance on derecognition of
income tax assets and liabilities, classification of current and
deferred income tax assets and liabilities, accounting for
interest and penalties associated with tax positions, and income
tax disclosures. Judgment is required in assessing the future
tax consequences of events that have been recognized in our
financial statements or tax returns. Variations in the actual
outcome of these future tax consequences could materially impact
our financial statements.
See Note I of the Notes to Consolidated Financial
Statements for disclosures related to the valuation allowance
recorded related to foreign deferred tax assets.
Foreign
Currency Translation
The functional currency for our foreign subsidiaries is the
local currency in which the entity is located. The financial
statements of all subsidiaries with a functional currency other
than the U.S. Dollar have been translated into
U.S. Dollars. All assets and liabilities of foreign
operations are translated into U.S. Dollars using year-end
exchange rates, and all revenues and expenses are translated at
average rates during the respective period. The
25
U.S. Dollar results that arise from such translation, as
well as exchange gains and losses on intercompany balances of a
long-term investment nature, are included in the cumulative
currency translation adjustments in accumulated other
comprehensive income in stockholders’ equity.
Derivative
Financial Instruments
As part of managing our exposure to changes in foreign currency
exchange rates, we periodically utilize foreign exchange forward
contracts. The objective of these contracts is to minimize
impacts to cash flows and profitability due to changes in
foreign currency exchange rates on accounts receivable, accounts
payable and forecasted cash transactions. These contracts are
recorded in the consolidated balance sheets at fair value, which
is based upon an income approach consisting of a discounted cash
flow model that takes into account the present value of the
future cash flows under the terms of the contracts using current
market information, such as foreign currency spot and forward
rates, as of the reporting date.
We formally document our hedging relationships, including
identifying the hedging instruments and the hedged items, as
well as our risk management objectives and strategies for
undertaking the hedge transactions. We also formally assess,
both at inception and at least quarterly thereafter, whether the
derivatives that are used in hedging transactions are highly
effective in offsetting changes in the cash flows of the hedged
item. The effective portion of the change in fair value of a
derivative is recorded as a component of accumulated other
comprehensive income in the consolidated balance sheets. When
the hedged item affects the consolidated statement of
operations, the gain or loss included in accumulated other
comprehensive income is reported on the same line in the
consolidated statements of operations as the hedged item. In
addition, any ineffective portion of the changes in the fair
value of derivatives used as cash flow hedges is reported in the
consolidated statements of operations as the changes occur. If
it is determined that a derivative ceases to be a highly
effective hedge, or it is probable that the forecasted
transaction will not occur, we discontinue hedge accounting and
any unrealized gains or losses are recorded in the consolidated
statement of operations.
On January 1, 2009, we adopted accounting guidance that
amended and expanded the disclosure requirements related to
derivative instruments and hedging activities. This guidance
enhances the disclosure requirements for derivative instruments
and hedging activities. The guidance is focused on requiring
enhanced disclosure on: 1) how and why an entity uses
derivative instruments and hedging activities; 2) how
derivative instruments and related hedging activities are
accounted for and 3) how derivative instruments and related
hedging activities affect an entity’s cash flows, financial
position and performance.
To accomplish the three objectives listed above, we are required
to provide: 1) qualitative disclosures regarding the
objectives and strategies for using derivative instruments and
engaging in hedging activities in the context of our overall
risk exposure; 2) quantitative disclosure in tabular format
of the fair values of derivative instruments and their gains and
losses and 3) disclosures about credit-risk related
contingent features in derivative instruments.
New
Accounting Pronouncements
In December 2007, the FASB issued accounting guidance on
business combinations. The guidance establishes principles and
requirements for how an acquirer recognizes and measures in its
financial statements the identifiable assets acquired, the
liabilities assumed, any noncontrolling interest in the acquiree
and the goodwill acquired. The accounting guidance also
establishes disclosure requirements to enable the evaluation of
the nature and financial effects of the business combination.
The guidance is effective as of the beginning of an
entity’s fiscal year that begins after December 15,
2008, and was adopted by us on October 1, 2009. Refer to
Note D for additional information regarding our recent
acquisition of Powell Canada and the impact of this guidance.
In December 2007, the FASB issued accounting guidance for
noncontrolling interests in consolidated financial statements.
This guidance establishes accounting and reporting standards for
ownership interests in subsidiaries held by parties other than
the parent, the amount of consolidated net income attributable
to the parent and to the noncontrolling interest, changes in a
parent’s ownership interest and the valuation of retained
noncontrolling equity investments when a subsidiary is
deconsolidated. The accounting guidance also establishes
disclosure requirements that clearly identify and distinguish
between the interests of the parent and the interests of the
noncontrolling owners. The guidance is effective as of the
beginning of an entity’s fiscal year that begins after
December 15, 2008,
26
and was adopted by us on October 1, 2009. This guidance did
not have an impact on our consolidated financial position or
results of operations, but did change the presentation of
noncontrolling interests in our Consolidated Balance Sheets and
Consolidated Statements of Operations.
In December 2008, the FASB issued accounting guidance on
employers’ disclosures about postretirement benefit plan
assets. The disclosures about plan assets required by this
guidance shall be provided for fiscal years beginning after
December 15, 2009, and will be adopted by us in the first
quarter of fiscal year 2011. We do not expect adoption of this
guidance to have a material impact on our consolidated financial
statements.
In April 2009, the FASB issued accounting guidance regarding the
accounting for assets acquired and liabilities assumed in a
business combination due to contingencies. This guidance
clarifies the initial and subsequent recognition, subsequent
accounting and disclosure of assets and liabilities arising from
contingencies in a business combination. This guidance requires
that assets acquired and liabilities assumed in a business
combination that arise from contingencies be recognized at fair
value, if the acquisition-date fair value can be reasonably
estimated. If the acquisition-date fair value of an asset or
liability cannot be reasonably estimated, the asset or liability
would be measured at the amount that would be recognized using
the accounting guidance related to accounting for contingencies
or the guidance for reasonably estimating losses. This
accounting guidance became effective for us on October 1,
2010. The adoption of this guidance did not have a material
impact on our consolidated financial statements.
In January 2010, the FASB issued updated guidance to amend the
disclosure requirements related to recurring and nonrecurring
fair value measurements. This update requires new disclosures
about significant transfers of assets and liabilities between
Level 1 and Level 2 of the fair value hierarchy
(including the reasons for these transfers) and the reasons for
any transfers in or out of Level 3. This update also
requires a reconciliation of recurring Level 3 measurements
about purchases, sales, issuances and settlements on a gross
basis. In addition to these new disclosure requirements, this
update clarifies certain existing disclosure requirements. For
example, this update clarifies that reporting entities are
required to provide fair value measurement disclosures for each
class of assets and liabilities, rather than each major category
of assets or liabilities. This update also clarifies the
requirement for entities to disclose information about both the
valuation techniques and inputs used in estimating Level 2
and Level 3 fair value measurements. This update will
become effective for us with the interim and annual reporting
period beginning after December 15, 2009, our fiscal year
2011, except for the requirement to provide the Level 3
activity of purchases, sales, issuances and settlements on a
gross basis, which will become effective for us with the interim
and annual reporting period beginning after December 15,
2010, our fiscal year 2012. We will not be required to provide
the amended disclosures for any previous periods presented for
comparative purposes. Other than requiring additional
disclosures, adoption of this update will not have a material
impact on our consolidated financial statements.
In April 2010, the FASB issued accounting guidance for the
milestone method of revenue recognition. This guidance allows
entities to make a policy election to use the milestone method
of revenue recognition and provides guidance on defining a
milestone and the criteria that should be met for applying the
milestone method. The scope of this guidance is limited to
transactions involving milestones relating to research and
development deliverables. The guidance includes enhanced
disclosure requirements about each arrangement, individual
milestones and related contingent consideration, information
about substantive milestones and factors considered in the
determination. This guidance is effective prospectively to
milestones achieved in fiscal years, and interim periods within
those years, beginning after June 15, 2010. Early
application and retrospective application are permitted. We have
evaluated this new guidance and have determined that it will not
currently have a significant impact on the determination or
reporting of our financial results.
|
|
|
Item 7A.
|
Quantitative
and Qualitative Disclosures About Market Risk
|
We are exposed to certain market risks arising from transactions
we have entered into in the normal course of business. These
risks primarily relate to fluctuations in interest rates,
foreign exchange rates and commodity prices.
27
Interest
Rate Risk
We are subject to market risk resulting from changes in interest
rates related to our floating rate bank credit facility. At
September 30, 2010, $15.2 million was outstanding,
bearing interest at approximately 2.5% per year. A hypothetical
100 basis point increase in variable interest rates would
result in a total annual increase in interest expense of
approximately $152,000. While we do not currently have any
derivative contracts to hedge our exposure to interest rate
risk, we have in the past and may in the future enter into such
contracts. During each of the past three years, we have not
experienced a significant effect on our business due to changes
in interest rates.
Foreign
Currency Transaction Risk
We have operations that expose us to currency risk in the
British Pound Sterling, the Canadian Dollar and to a lesser
extent the Euro. Amounts invested in our foreign operations are
translated into U.S. Dollars at the exchange rates in
effect at the balance sheet date. The resulting translation
adjustments are recorded as accumulated other comprehensive
income (loss), a component of stockholders’ equity in our
consolidated balance sheets. We believe the exposure to the
effects that fluctuating foreign currencies have on our
consolidated results of operations is limited because the
foreign operations primarily invoice customers and collect
obligations in their respective currencies or U.S. Dollars.
Our international operations are financed utilizing local credit
facilities denominated in local currencies. Additionally,
expenses associated with these transactions are generally
contracted and paid for in the same local currencies. A 10%
unfavorable change in the U.S. Dollar exchange rate,
relative to other functional currencies in which we operate,
would not materially impact our consolidated balance sheet at
September 30, 2010.
During Fiscal 2009 and Fiscal 2010, we entered into eight
foreign currency forward contracts to manage the volatility of
future cash flows on certain long-term contracts that are
denominated in the British Pound Sterling. The contracts are
designated as cash flow hedges for accounting purposes. The
changes in fair value related to the effective portion of the
hedges are recognized as a component of accumulated other
comprehensive income on our consolidated balance sheets. At
September 30, 2010, we recorded a net liability of
approximately $47,000 on our consolidated balance sheets related
to these transactions.
Commodity
Price Risk
We are subject to market risk from fluctuating market prices of
certain raw materials. While such materials are typically
available from numerous suppliers, commodity raw materials are
subject to price fluctuations. We attempt to pass along such
commodity price increases to our customers on a
contract-by-contract
basis to avoid a negative effect on profit margin. While we may
do so in the future, we have not currently entered into any
derivative contracts to hedge our exposure to commodity risk. We
continue to experience price volatility with some of our key raw
materials and components. Fixed-price contracts may limit our
ability to pass cost increases to our customers, thus negatively
impacting our earnings. Fluctuations in commodity prices may
have a material impact on our future earnings and cash flows.
Market
Risk
We are also exposed to general market and other risk and its
potential impact on accounts receivable or costs and estimated
earnings in excess of billings on uncompleted contracts. The
amounts recorded may be at risk if our customers’ ability
to pay these obligations is negatively impacted by economic
conditions. Our customers and their industries are typically EPC
firms, oil and gas producers, oil and gas pipelines, refineries,
petrochemical plants, electrical power generators, public and
private utilities, co-generation facilities, mining/metals
operations, pulp and paper plants, transportation authorities,
governmental agencies and other large industrial customers. We
maintain ongoing discussions with customers regarding contract
status with respect to payment status, change orders and billing
terms in an effort to monitor collections of amounts billed.
28
|
|
|
Item 8.
|
Financial
Statements and Supplementary Data
|
| |
|
|
|
|
|
Index to Consolidated Financial Statements
|
|
Page
|
|
|
|
Financial Statements:
|
|
|
|
|
|
|
|
|
30
|
|
|
|
|
|
31
|
|
|
|
|
|
32
|
|
|
|
|
|
33
|
|
|
|
|
|
34
|
|
|
|
|
|
35
|
|
29
REPORT OF
INDEPENDENT REGISTERED PUBLIC ACCOUNTING FIRM
To the Board of Directors
and Stockholders of Powell Industries, Inc.:
In our opinion, the consolidated financial statements listed in
the accompanying index present fairly, in all material respects,
the financial position of Powell Industries, Inc. and its
subsidiaries at September 30, 2010 and 2009, and the
results of their operations and their cash flows for each of the
three years in the period ended September 30, 2010 in
conformity with accounting principles generally accepted in the
United States of America. Also, in our opinion, the Company
maintained, in all material respects, effective internal control
over financial reporting as of September 30, 2010, based on
criteria established in Internal Control —
Integrated Framework issued by the Committee of Sponsoring
Organizations of the Treadway Commission (COSO). The
Company’s management is responsible for these financial
statements, for maintaining effective internal control over
financial reporting and for its assessment of the effectiveness
of internal control over financial reporting, included in
Management’s Report on Internal Control over Financial
Reporting appearing under Item 9A. Our responsibility is to
express opinions on these financial statements and on the
Company’s internal control over financial reporting based
on our integrated audits. We conducted our audits in accordance
with the standards of the Public Company Accounting Oversight
Board (United States). Those standards require that we plan and
perform the audits to obtain reasonable assurance about whether
the financial statements are free of material misstatement and
whether effective internal control over financial reporting was
maintained in all material respects. Our audits of the financial
statements included examining, on a test basis, evidence
supporting the amounts and disclosures in the financial
statements, assessing the accounting principles used and
significant estimates made by management, and evaluating the
overall financial statement presentation. Our audit of internal
control over financial reporting included obtaining an
understanding of internal control over financial reporting,
assessing the risk that a material weakness exists, and testing
and evaluating the design and operating effectiveness of
internal control based on the assessed risk. Our audits also
included performing such other procedures as we considered
necessary in the circumstances. We believe that our audits
provide a reasonable basis for our opinions.
A company’s internal control over financial reporting is a
process designed to provide reasonable assurance regarding the
reliability of financial reporting and the preparation of
financial statements for external purposes in accordance with
generally accepted accounting principles. A company’s
internal control over financial reporting includes those
policies and procedures that (i) pertain to the maintenance
of records that, in reasonable detail, accurately and fairly
reflect the transactions and dispositions of the assets of the
company; (ii) provide reasonable assurance that
transactions are recorded as necessary to permit preparation of
financial statements in accordance with generally accepted
accounting principles, and that receipts and expenditures of the
company are being made only in accordance with authorizations of
management and directors of the company; and (iii) provide
reasonable assurance regarding prevention or timely detection of
unauthorized acquisition, use, or disposition of the
company’s assets that could have a material effect on the
financial statements.
Because of its inherent limitations, internal control over
financial reporting may not prevent or detect misstatements.
Also, projections of any evaluation of effectiveness to future
periods are subject to the risk that controls may become
inadequate because of changes in conditions, or that the degree
of compliance with the policies or procedures may deteriorate.
As described in Management’s Report on Internal Control
over Financial Reporting appearing under Item 9A,
management has excluded Powell Canada from its assessment of
internal control over financial reporting as of
September 30, 2010 because it was acquired by the Company
in a purchase business combination in December 2009. We
have also excluded Powell Canada from our audit of internal
control over financial reporting. Powell Canada is a
wholly-owned subsidiary whose total assets and total revenues
represent 10% and 9%, respectively, of the related consolidated
financial statement amounts as of and for the year ended
September 30, 2010.
/s/ PricewaterhouseCoopers
LLP
Houston, Texas
December 8, 2010
30
POWELL
INDUSTRIES, INC. AND SUBSIDIARIES
(In
thousands, except share and per share data)
| |
|
|
|
|
|
|
|
|
|
|
|
September 30,
|
|
|
|
|
2010
|
|
|
2009
|
|
|
|
|
ASSETS
|
|
Current Assets:
|
|
|
|
|
|
|
|
|
|
Cash and cash equivalents
|
|
$
|
115,353
|
|
|
$
|
97,403
|
|
|
Accounts receivable, less allowance for doubtful accounts of
$907 and $1,607, respectively
|
|
|
91,766
|
|
|
|
114,274
|
|
|
Costs and estimated earnings in excess of billings on
uncompleted contracts
|
|
|
38,064
|
|
|
|
46,335
|
|
|
Inventories, net
|
|
|
38,244
|
|
|
|
46,252
|
|
|
Income taxes receivable
|
|
|
6,726
|
|
|
|
695
|
|
|
Deferred income taxes
|
|
|
3,087
|
|
|
|
3,303
|
|
|
Prepaid expenses and other current assets
|
|
|
8,951
|
|
|
|
6,741
|
|
|
|
|
|
|
|
|
|
|
|
|
Total Current Assets
|
|
|
302,191
|
|
|
|
315,003
|
|
|
Property, plant and equipment, net
|
|
|
63,676
|
|
|
|
61,036
|
|
|
Goodwill
|
|
|
1,003
|
|
|
|
1,084
|
|
|
Intangible assets, net
|
|
|
26,132
|
|
|
|
21,305
|
|
|
Other assets
|
|
|
7,710
|
|
|
|
6,412
|
|
|
|
|
|
|
|
|
|
|
|
|
Total Assets
|
|
$
|
400,712
|
|
|
$
|
404,840
|
|
|
|
|
|
|
|
|
|
|
|
|
|
|
LIABILITIES AND STOCKHOLDERS’ EQUITY
|
|
Current Liabilities:
|
|
|
|
|
|
|
|
|
|
Current maturities of long-term debt and capital lease
obligations
|
|
$
|
1,683
|
|
|
$
|
4,692
|
|
|
Income taxes payable
|
|
|
1,500
|
|
|
|
7,637
|
|
|
Accounts payable
|
|
|
41,850
|
|
|
|
48,124
|
|
|
Accrued salaries, bonuses and commissions
|
|
|
25,064
|
|
|
|
24,503
|
|
|
Billings in excess of costs and estimated earnings on
uncompleted contracts
|
|
|
31,009
|
|
|
|
44,772
|
|
|
Accrued product warranty
|
|
|
5,929
|
|
|
|
7,558
|
|
|
Other accrued expenses
|
|
|
7,711
|
|
|
|
11,856
|
|
|
|
|
|
|
|
|
|
|
|
|
Total Current Liabilities
|
|
|
114,746
|
|
|
|
149,142
|
|
|
Long-term debt and capital lease obligations, net of current
maturities
|
|
|
5,202
|
|
|
|
4,800
|
|
|
Deferred compensation
|
|
|
2,730
|
|
|
|
2,685
|
|
|
Postretirement benefit obligation
|
|
|
532
|
|
|
|
784
|
|
|
Other liabilities
|
|
|
199
|
|
|
|
212
|
|
|
|
|
|
|
|
|
|
|
|
|
Total Liabilities
|
|
|
123,409
|
|
|
|
157,623
|
|
|
|
|
|
|
|
|
|
|
|
|
Commitments and Contingencies (Note L)
|
|
|
|
|
|
|
|
|
|
Equity:
|
|
|
|
|
|
|
|
|
|
Stockholders’ Equity:
|
|
|
|
|
|
|
|
|
|
Preferred stock, par value $.01; 5,000,000 shares
authorized; none issued
|
|
|
—
|
|
|
|
—
|
|
|
Common stock, par value $.01; 30,000,000 shares authorized;
11,676,955 and 11,479,610 shares issued, respectively;
11,676,955 and 11,479,610 shares outstanding, respectively
|
|
|
117
|
|
|
|
115
|
|
|
Additional paid-in capital
|
|
|
34,546
|
|
|
|
29,970
|
|
|
Retained earnings
|
|
|
244,969
|
|
|
|
219,961
|
|
|
Accumulated other comprehensive income (loss)
|
|
|
(1,352
|
)
|
|
|
(2,716
|
)
|
|
Deferred compensation
|
|
|
(977
|
)
|
|
|
(569
|
)
|
|
|
|
|
|
|
|
|
|
|
|
Total Stockholders’ Equity
|
|
|
277,303
|
|
|
|
246,761
|
|
|
Noncontrolling interest
|
|
|
—
|
|
|
|
456
|
|
|
|
|
|
|
|
|
|
|
|
|
Total Equity
|
|
|
277,303
|
|
|
|
247,217
|
|
|
|
|
|
|
|
|
|
|
|
|
Total Liabilities and Equity
|
|
$
|
400,712
|
|
|
$
|
404,840
|
|
|
|
|
|
|
|
|
|
|
|
The accompanying notes are an integral part of these
consolidated financial statements.
31
POWELL
INDUSTRIES, INC. AND SUBSIDIARIES
(In thousands, except per share data)
| |
|
|
|
|
|
|
|
|
|
|
|
|
|
|
|
Year Ended September 30,
|
|
|
|
|
2010
|
|
|
2009
|
|
|
2008
|
|
|
|
|
Revenues
|
|
$
|
550,692
|
|
|
$
|
665,851
|
|
|
$
|
638,704
|
|
|
Cost of goods sold
|
|
|
408,635
|
|
|
|
520,802
|
|
|
|
512,298
|
|
|
|
|
|
|
|
|
|
|
|
|
|
|
|
|
Gross profit
|
|
|
142,057
|
|
|
|
145,049
|
|
|
|
126,406
|
|
|
Selling, general and administrative expenses
|
|
|
84,457
|
|
|
|
79,954
|
|
|
|
80,416
|
|
|
Amortization of intangible assets
|
|
|
4,477
|
|
|
|
3,460
|
|
|
|
3,585
|
|
|
Impairment of goodwill
|
|
|
7,452
|
|
|
|
—
|
|
|
|
—
|
|
|
|
|
|
|
|
|
|
|
|
|
|
|
|
|
Operating income
|
|
|
45,671
|
|
|
|
61,635
|
|
|
|
42,405
|
|
|
Interest expense
|
|
|
870
|
|
|
|
1,107
|
|
|
|
2,892
|
|
|
Interest income
|
|
|
(260
|
)
|
|
|
(131
|
)
|
|
|
(355
|
)
|
|
|
|
|
|
|
|
|
|
|
|
|
|
|
|
Income before income taxes
|
|
|
45,061
|
|
|
|
60,659
|
|
|
|
39,868
|
|
|
Income tax provision
|
|
|
19,894
|
|
|
|
20,734
|
|
|
|
14,072
|
|
|
|
|
|
|
|
|
|
|
|
|
|
|
|
|
Net income
|
|
|
25,167
|
|
|
|
39,925
|
|
|
|
25,796
|
|
|
Net (income) loss attributable to noncontrolling interest
|
|
|
(159
|
)
|
|
|
(208
|
)
|
|
|
51
|
|
|
|
|
|
|
|
|
|
|
|
|
|
|
|
|
Net income attributable to Powell Industries, Inc.
|
|
$
|
25,008
|
|
|
$
|
39,717
|
|
|
$
|
25,847
|
|
|
|
|
|
|
|
|
|
|
|
|
|
|
|
|
Earnings per share attributable to Powell Industries, Inc.:
|
|
|
|
|
|
|
|
|
|
|
|
|
|
Basic
|
|
$
|
2.17
|
|
|
$
|
3.48
|
|
|
$
|
2.29
|
|
|
|
|
|
|
|
|
|
|
|
|
|
|
|
|
Diluted
|
|
$
|
2.14
|
|
|
$
|
3.43
|
|
|
$
|
2.26
|
|
|
|
|
|
|
|
|
|
|
|
|
|
|
|
|
Weighted average shares:
|
|
|
|
|
|
|
|
|
|
|
|
|
|
Basic
|
|
|
11,545
|
|
|
|
11,424
|
|
|
|
11,265
|
|
|
|
|
|
|
|
|
|
|
|
|
|
|
|
|
Diluted
|
|
|
11,693
|
|
|
|
11,591
|
|
|
|
11,452
|
|
|
|
|
|
|
|
|
|
|
|
|
|
|
|
The accompanying notes are an integral part of these
consolidated financial statements.
32
POWELL
INDUSTRIES, INC. AND SUBSIDIARIES
(In
thousands)
| |
|
|
|
|
|
|
|
|
|
|
|
|
|
|
|
|
|
|
|
|
|
|
|
|
|
|
|
|
|
|
|
|
|
|
|
Other
|
|
|
|
|
|
|
|
|
|
|
|
|
|
|
Accumulated
|
|
|
|
|
|
|
|
|
|
|
Compre-
|
|
|
|
|
|
|
|
|
Additional
|
|
|
|
|
|
Other
|
|
|
|
|
|
|
|
|
|
|
hensive
|
|
|
Common Stock
|
|
|
Paid-in
|
|
|
Retained
|
|
|
Comprehensive
|
|
|
Deferred
|
|
|
|
|
|
|
|
Income
|
|
|
Shares
|
|
|
Amount
|
|
|
Capital
|
|
|
Earnings
|
|
|
Income/(Loss)
|
|
|
Compensation
|
|
|
Total
|
|
|
|
|
Balance, September 30, 2007
|
|
|
|
|
|
|
11,144
|
|
|
$
|
111
|
|
|
$
|
16,854
|
|
|
$
|
154,572
|
|
|
$
|
2,557
|
|
|
$
|
(545
|
)
|
|
$
|
173,549
|
|
|
Net income
|
|
$
|
25,847
|
|
|
|
—
|
|
|
|
—
|
|
|
|
—
|
|
|
|
25,847
|
|
|
|
—
|
|
|
|
—
|
|
|
|
25,847
|
|
|
Foreign currency translation adjustments
|
|
|
(2,395
|
)
|
|
|
—
|
|
|
|
—
|
|
|
|
—
|
|
|
|
—
|
|
|
|
(2,395
|
)
|
|
|
—
|
|
|
|
(2,395
|
)
|
|
Amortization of deferred compensation-ESOP
|
|
|
—
|
|
|
|
—
|
|
|
|
—
|
|
|
|
—
|
|
|
|
—
|
|
|
|
—
|
|
|
|
387
|
|
|
|
387
|
|
|
Exercise of stock options
|
|
|
—
|
|
|
|
239
|
|
|
|
3
|
|
|
|
4,234
|
|
|
|
—
|
|
|
|
—
|
|
|
|
—
|
|
|
|
4,237
|
|
|
Stock-based compensation
|
|
|
—
|
|
|
|
—
|
|
|
|
—
|
|
|
|
2,166
|
|
|
|
—
|
|
|
|
—
|
|
|
|
—
|
|
|
|
2,166
|
|
|
Income tax benefit from stock options exercised
|
|
|
—
|
|
|
|
—
|
|
|
|
—
|
|
|
|
2,510
|
|
|
|
—
|
|
|
|
—
|
|
|
|
—
|
|
|
|
2,510
|
|
|
Amortization of restricted stock
|
|
|
—
|
|
|
|
—
|
|
|
|
—
|
|
|
|
290
|
|
|
|
—
|
|
|
|
—
|
|
|
|
134
|
|
|
|
424
|
|
|
Deferred compensation — restricted stock
|
|
|
—
|
|
|
|
7
|
|
|
|
—
|
|
|
|
111
|
|
|
|
—
|
|
|
|
—
|
|
|
|
—
|
|
|
|
111
|
|
|
Issuance of restricted stock
|
|
|
—
|
|
|
|
14
|
|
|
|
—
|
|
|
|
716
|
|
|
|
—
|
|
|
|
—
|
|
|
|
(716
|
)
|
|
|
—
|
|
|
Adjustment from adoption of accounting guidance on the
accounting for uncertainty in income taxes
|
|
|
—
|
|
|
|
—
|
|
|
|
—
|
|
|
|
40
|
|
|
|
(175
|
)
|
|
|
—
|
|
|
|
—
|
|
|
|
(135
|
)
|
|
Postretirement benefit adjustment, net of tax of $97
|
|
|
173
|
|
|
|
—
|
|
|
|
—
|
|
|
|
—
|
|
|
|
—
|
|
|
|
173
|
|
|
|
—
|
|
|
|
173
|
|
|
|
|
|
|
|
|
|
|
|
|
|
|
|
|
|
|
|
|
|
|
|
|
|
|
|
|
|
|
|
|
|
|
|
|
Total comprehensive income
|
|
|
23,625
|
|
|
|
—
|
|
|
|
—
|
|
|
|
—
|
|
|
|
25,847
|
|
|
|
(2,222
|
)
|
|
|
—
|
|
|
|
23,625
|
|
|
|
|
|
|
|
|
|
|
|
|
|
|
|
|
|
|
|
|
|
|
|
|
|
|
|
|
|
|
|
|
|
|
|
|
Balance, September 30, 2008
|
|
|
|
|
|
|
11,404
|
|
|
|
114
|
|
|
|
26,921
|
|
|
|
180,244
|
|
|
|
335
|
|
|
|
(740
|
)
|
|
|
206,874
|
|
|
Net income
|
|
|
39,717
|
|
|
|
—
|
|
|
|
—
|
|
|
|
—
|
|
|
|
39,717
|
|
|
|
—
|
|
|
|
—
|
|
|
|
39,717
|
|
|
Foreign currency translation adjustments
|
|
|
(2,867
|
)
|
|
|
—
|
|
|
|
—
|
|
|
|
—
|
|
|
|
—
|
|
|
|
(2,867
|
)
|
|
|
—
|
|
|
|
(2,867
|
)
|
|
Amortization of deferred compensation-ESOP
|
|
|
—
|
|
|
|
—
|
|
|
|
—
|
|
|
|
—
|
|
|
|
—
|
|
|
|
—
|
|
|
|
158
|
|
|
|
158
|
|
|
Exercise of stock options
|
|
|
—
|
|
|
|
31
|
|
|
|
1
|
|
|
|
513
|
|
|
|
—
|
|
|
|
—
|
|
|
|
—
|
|
|
|
514
|
|
|
Stock-based compensation
|
|
|
—
|
|
|
|
29
|
|
|
|
—
|
|
|
|
1,623
|
|
|
|
—
|
|
|
|
—
|
|
|
|
—
|
|
|
|
1,623
|
|
|
Income tax benefit from stock options exercised
|
|
|
—
|
|
|
|
—
|
|
|
|
—
|
|
|
|
291
|
|
|
|
—
|
|
|
|
—
|
|
|
|
|
|
|
|
291
|
|
|
Amortization of restricted stock
|
|
|
—
|
|
|
|
—
|
|
|
|
—
|
|
|
|
|
|
|
|
—
|
|
|
|
—
|
|
|
|
476
|
|
|
|
476
|
|
|
Issuance of restricted stock
|
|
|
—
|
|
|
|
16
|
|
|
|
—
|
|
|
|
622
|
|
|
|
—
|
|
|
|
—
|
|
|
|
(463
|
)
|
|
|
159
|
|
|
Unrealized loss on cash flow hedges, net of tax of $164
|
|
|
(304
|
)
|
|
|
—
|
|
|
|
—
|
|
|
|
—
|
|
|
|
—
|
|
|
|
(304
|
)
|
|
|
—
|
|
|
|
(304
|
)
|
|
Postretirement benefit adjustment, net of tax of $67
|
|
|
120
|
|
|
|
—
|
|
|
|
—
|
|
|
|
—
|
|
|
|
—
|
|
|
|
120
|
|
|
|
—
|
|
|
|
120
|
|
|
|
|
|
|
|
|
|
|
|
|
|
|
|
|
|
|
|
|
|
|
|
|
|
|
|
|
|
|
|
|
|
|
|
|
Total comprehensive income
|
|
|
36,666
|
|
|
|
—
|
|
|
|
—
|
|
|
|
—
|
|
|
|
39,717
|
|
|
|
(3,051
|
)
|
|
|
—
|
|
|
|
36,666
|
|
|
|
|
|
|
|
|
|
|
|
|
|
|
|
|
|
|
|
|
|
|
|
|
|
|
|
|
|
|
|
|
|
|
|
|
Balance, September 30, 2009
|
|
|
|
|
|
|
11,480
|
|
|
|
115
|
|
|
|
29,970
|
|
|
|
219,961
|
|
|
|
(2,716
|
)
|
|
|
(569
|
)
|
|
|
246,761
|
|
|
Net income
|
|
|
25,008
|
|
|
|
—
|
|
|
|
—
|
|
|
|
—
|
|
|
|
25,008
|
|
|
|
—
|
|
|
|
—
|
|
|
|
25,008
|
|
|
Foreign currency translation adjustments
|
|
|
1,467
|
|
|
|
—
|
|
|
|
—
|
|
|
|
—
|
|
|
|
—
|
|
|
|
1,467
|
|
|
|
—
|
|
|
|
1,467
|
|
|
Exercise of stock options
|
|
|
—
|
|
|
|
109
|
|
|
|
1
|
|
|
|
1,699
|
|
|
|
—
|
|
|
|
—
|
|
|
|
—
|
|
|
|
1,700
|
|
|
Stock-based compensation
|
|
|
—
|
|
|
|
58
|
|
|
|
1
|
|
|
|
1,113
|
|
|
|
—
|
|
|
|
—
|
|
|
|
(322
|
)
|
|
|
792
|
|
|
Income tax benefit from stock options exercised
|
|
|
—
|
|
|
|
—
|
|
|
|
—
|
|
|
|
878
|
|
|
|
—
|
|
|
|
—
|
|
|
|
—
|
|
|
|
878
|
|
|
Amortization of restricted stock
|
|
|
—
|
|
|
|
—
|
|
|
|
—
|
|
|
|
—
|
|
|
|
—
|
|
|
|
—
|
|
|
|
467
|
|
|
|
467
|
|
|
Issuance of restricted stock
|
|
|
—
|
|
|
|
30
|
|
|
|
—
|
|
|
|
886
|
|
|
|
—
|
|
|
|
—
|
|
|
|
(553
|
)
|
|
|
333
|
|
|
Unrealized loss on cash flow hedges, net of tax of $265
|
|
|
(206
|
)
|
|
|
—
|
|
|
|
—
|
|
|
|
—
|
|
|
|
—
|
|
|
|
(206
|
)
|
|
|
—
|
|
|
|
(206
|
)
|
|
Postretirement benefit adjustment, net of tax of $58
|
|
|
103
|
|
|
|
—
|
|
|
|
—
|
|
|
|
—
|
|
|
|
—
|
|
|
|
103
|
|
|
|
—
|
|
|
|
103
|
|
|
|
|
|
|
|
|
|
|
|
|
|
|
|
|
|
|
|
|
|
|
|
|
|
|
|
|
|
|
|
|
|
|
|
|
Total comprehensive income
|
|
$
|
26,372
|
|
|
|
—
|
|
|
|
—
|
|
|
|
—
|
|
|
|
25,008
|
|
|
|
1,364
|
|
|
|
—
|
|
|
|
26,372
|
|
|
|
|
|
|
|
|
|
|
|
|
|
|
|
|
|
|
|
|
|
|
|
|
|
|
|
|
|
|
|
|
|
|
|
|
Balance, September 30, 2010
|
|
|
|
|
|
|
11,677
|
|
|
$
|
117
|
|
|
$
|
34,546
|
|
|
$
|
244,969
|
|
|
$
|
(1,352
|
)
|
|
$
|
(977
|
)
|
|
$
|
277,303
|
|
|
|
|
|
|
|
|
|
|
|
|
|
|
|
|
|
|
|
|
|
|
|
|
|
|
|
|
|
|
|
|
|
|
|
The accompanying notes are an integral part of these
consolidated financial statements.
33
POWELL
INDUSTRIES, INC. AND SUBSIDIARIES
(In
thousands)
| |
|
|
|
|
|
|
|
|
|
|
|
|
|
|
|
Year Ended September 30,
|
|
|
|
|
2010
|
|
|
2009
|
|
|
2008
|
|
|
|
|
Operating Activities:
|
|
|
|
|
|
|
|
|
|
|
|
|
|
Net income
|
|
$
|
25,167
|
|
|
$
|
39,925
|
|
|
$
|
25,796
|
|
|
Adjustments to reconcile net income to net cash provided by
(used in) operating activities:
|
|
|
|
|
|
|
|
|
|
|
|
|
|
Depreciation
|
|
|
9,154
|
|
|
|
7,493
|
|
|
|
8,133
|
|
|
Amortization
|
|
|
4,549
|
|
|
|
3,469
|
|
|
|
3,740
|
|
|
Impairment of goodwill
|
|
|
7,452
|
|
|
|
—
|
|
|
|
—
|
|
|
Stock-based compensation
|
|
|
1,929
|
|
|
|
2,256
|
|
|
|
2,592
|
|
|
Bad debt expense
|
|
|
410
|
|
|
|
959
|
|
|
|
637
|
|
|
Deferred income taxes
|
|
|
(348
|
)
|
|
|
(1,447
|
)
|
|
|
318
|
|
|
Changes in operating assets and liabilities:
|
|
|
|
|
|
|
|
|
|
|
|
|
|
Accounts receivable, net
|
|
|
39,687
|
|
|
|
15,392
|
|
|
|
(27,146
|
)
|
|
Costs and estimated earnings in excess of billings on
uncompleted contracts
|
|
|
8,243
|
|
|
|
35,701
|
|
|
|
(14,062
|
)
|
|
Inventories
|
|
|
12,320
|
|
|
|
25,884
|
|
|
|
(25,513
|
)
|
|
Prepaid expenses and other current assets
|
|
|
(5,813
|
)
|
|
|
(3,432
|
)
|
|
|
657
|
|
|
Other assets
|
|
|
440
|
|
|
|
(194
|
)
|
|
|
—
|
|
|
Accounts payable and income taxes payable
|
|
|
(20,281
|
)
|
|
|
(4,891
|
)
|
|
|
(4,916
|
)
|
|
Accrued liabilities
|
|
|
(5,392
|
)
|
|
|
(40
|
)
|
|
|
10,422
|
|
|
Billings in excess of costs and estimated earnings on
uncompleted contracts
|
|
|
(13,762
|
)
|
|
|
5,789
|
|
|
|
13,773
|
|
|
Other
|
|
|
378
|
|
|
|
120
|
|
|
|
381
|
|
|
|
|
|
|
|
|
|
|
|
|
|
|
|
|
Net cash provided by (used in) operating activities
|
|
|
64,133
|
|
|
|
126,984
|
|
|
|
(5,188
|
)
|
|
|
|
|
|
|
|
|
|
|
|
|
|
|
|
Investing Activities:
|
|
|
|
|
|
|
|
|
|
|
|
|
|
Proceeds from sale of fixed assets
|
|
|
14
|
|
|
|
30
|
|
|
|
—
|
|
|
Purchases of property, plant and equipment
|
|
|
(4,420
|
)
|
|
|
(8,081
|
)
|
|
|
(3,428
|
)
|
|
Purchase of noncontrolling interest — Powell Asia
|
|
|
(659
|
)
|
|
|
—
|
|
|
|
—
|
|
|
Acquisition of Powell Canada
|
|
|
(23,394
|
)
|
|
|
—
|
|
|
|
—
|
|
|
|
|
|
|
|
|
|
|
|
|
|
|
|
|
Net cash used in investing activities
|
|
|
(28,459
|
)
|
|
|
(8,051
|
)
|
|
|
(3,428
|
)
|
|
|
|
|
|
|
|
|
|
|
|
|
|
|
|
Financing Activities:
|
|
|
|
|
|
|
|
|
|
|
|
|
|
Borrowings on US revolving line of credit
|
|
|
—
|
|
|
|
50,953
|
|
|
|
229,480
|
|
|
Payments on US revolving line of credit
|
|
|
—
|
|
|
|
(69,953
|
)
|
|
|
(212,480
|
)
|
|
Payments on UK revolving line of credit
|
|
|
—
|
|
|
|
(2,388
|
)
|
|
|
(1,596
|
)
|
|
Payments on UK term loan
|
|
|
—
|
|
|
|
(4,223
|
)
|
|
|
(2,343
|
)
|
|
Borrowings on Canadian revolving line of credit
|
|
|
891
|
|
|
|
—
|
|
|
|
—
|
|
|
Payments on Canadian revolving line of credit
|
|
|
(13,984
|
)
|
|
|
—
|
|
|
|
—
|
|
|
Payments on Canadian term loan
|
|
|
(2,429
|
)
|
|
|
—
|
|
|
|
—
|
|
|
Payments on industrial development revenue bonds
|
|
|
(400
|
)
|
|
|
(400
|
)
|
|
|
(400
|
)
|
|
Payments on deferred acquisition payable
|
|
|
(4,292
|
)
|
|
|
(5,220
|
)
|
|
|
(5,563
|
)
|
|
Payments on short-term and other financing
|
|
|
(1,087
|
)
|
|
|
(13
|
)
|
|
|
(52
|
)
|
|
Proceeds from exercise of stock options
|
|
|
1,700
|
|
|
|
515
|
|
|
|
4,236
|
|
|
Tax benefit from exercise of stock options
|
|
|
209
|
|
|
|
291
|
|
|
|
2,510
|
|
|
|
|
|
|
|
|
|
|
|
|
|
|
|
|
Net cash (used in) provided by financing activities
|
|
|
(19,392
|
)
|
|
|
(30,438
|
)
|
|
|
13,792
|
|
|
|
|
|
|
|
|
|
|
|
|
|
|
|
|
Net increase in cash and cash equivalents
|
|
|
16,282
|
|
|
|
88,495
|
|
|
|
5,176
|
|
|
Effect of exchange rate changes on cash and cash equivalents
|
|
|
1,668
|
|
|
|
(1,226
|
)
|
|
|
(299
|
)
|
|
Cash and cash equivalents at beginning of year
|
|
|
97,403
|
|
|
|
10,134
|
|
|
|
5,257
|
|
|
|
|
|
|
|
|
|
|
|
|
|
|
|
|
Cash and cash equivalents at end of year
|
|
$
|
115,353
|
|
|
$
|
97,403
|
|
|
$
|
10,134
|
|
|
|
|
|
|
|
|
|
|
|
|
|
|
|
The accompanying notes are an integral part of these
consolidated financial statements.
34
POWELL
INDUSTRIES, INC. AND SUBSIDIARIES
|
|
|
A.
|
Business
and Organization
|
Powell Industries, Inc. (we, us, our, Powell or the Company) was
incorporated in the state of Delaware in 2004 as a successor to
a Nevada company incorporated in 1968. The Nevada corporation
was the successor to a company founded by William E. Powell in
1947, which merged into the Company in 1977. Our major
subsidiaries, all of which are wholly-owned, include: Powell
Electrical Systems, Inc.; Transdyn, Inc.; Powell Industries
International, Inc.; Switchgear & Instrumentation
Limited (S&I) and Powell Canada Inc.
We develop, design, manufacture and service custom
engineered-to-order
equipment and systems for the management and control of
electrical energy and other critical processes. Headquartered in
Houston, Texas, we serve the transportation, environmental,
energy, industrial and utility industries.
On December 15, 2009, we acquired the business and certain
assets of PowerComm Inc. and its subsidiaries, Redhill Systems
Ltd., Nextron Corporation, PCG Technical Services Inc. and
Concorde Metal Manufacturing Ltd (the entire business of which
is referred to herein as Powell Canada) for $23.4 million,
not including expenses. Powell Canada is headquartered in
Edmonton, Alberta, Canada, and provides electrical and
maintenance services in western Canada. Powell Canada is also a
manufacturer of switchgear and related products, primarily
serving the oil and gas industry in western Canada. The
operating results of Powell Canada are included in our
Electrical Power Products business segment from the acquisition
date. In conjunction with the acquisition of Powell Canada, on
April 1, 2010, we finalized the acquisition of a 50%
ownership in a joint venture in Kazakhstan. Our interest in the
net assets of the 50% ownership in the joint venture is recorded
at its estimated net realizable value, as the Company has made a
strategic decision to exit this joint venture. For further
information on the Powell Canada acquisition, see Note D.
|
|
|
B.
|
Summary
of Significant Accounting Policies
|
Principles
of Consolidation
The consolidated financial statements include the accounts of
Powell and our wholly-owned subsidiaries. The financial position
and results of operation of our Singapore joint venture, in
which we held a majority ownership, have also been consolidated.
As a result of this consolidation, we record noncontrolling
interest on our balance sheet for our joint venture
partner’s share of equity in the joint venture. All
significant intercompany accounts and transactions have been
eliminated in consolidation.
Reclassifications
Certain reclassifications have been made in prior years’
financial statements to conform to the presentation used in the
current year. These reclassifications have not resulted in any
changes to previously reported net income for any periods.
Use of
Estimates
The preparation of financial statements in conformity with
accounting principles generally accepted in the United States
(U.S. GAAP) requires management to make estimates and
assumptions that affect the amounts reported in the consolidated
financial statements and accompanying footnotes. The most
significant estimates used in our financial statements affect
revenue and cost recognition for construction contracts, the
allowance for doubtful accounts, goodwill, self-insurance,
warranty accruals, income taxes, postretirement benefit
obligations and estimates related to acquisition valuations. The
amounts recorded for insurance claims, warranties, legal, income
taxes and other contingent liabilities require judgments
regarding the amount of expenses that will ultimately be
incurred. We base our estimates on historical experience and on
various other assumptions, as well as the specific circumstances
surrounding these contingent liabilities, in evaluating the
amount of liability that should be recorded. Estimates may
change as new events occur, additional information becomes
available or operating environments change. Actual results may
differ from our estimates.
35
POWELL
INDUSTRIES, INC. AND SUBSIDIARIES
NOTES TO
CONSOLIDATED FINANCIAL
STATEMENTS — (Continued)
Cash
and Cash Equivalents
Cash and cash equivalents include cash on hand, deposits with
banks and highly liquid investments with original maturities of
three months or less.
Supplemental
Disclosures of Cash Flow Information (in
thousands):
| |
|
|
|
|
|
|
|
|
|
|
|
|
|
|
|
Year Ended September 30,
|
|
|
|
2010
|
|
2009
|
|
2008
|
|
|
|
Cash paid during the period for:
|
|
|
|
|
|
|
|
|
|
|
|
|
|
Interest
|
|
$
|
563
|
|
|
$
|
439
|
|
|
$
|
1,447
|
|
|
Income taxes, net of refunds
|
|
|
31,993
|
|
|
|
21,527
|
|
|
|
3,641
|
|
Fair
Value of Financial Instruments
Financial instruments include cash, short-term investments,
marketable securities, receivables, payables and debt
obligations. Except as described below, due to the short-term
nature of the investments, the book value is representative of
their fair value. The carrying value of debt approximates fair
value as interest rates are indexed to the Federal Funds Rate,
the London interbank offered rate (LIBOR) or the bank’s
prime rate.
The deferred acquisition payable was discounted based on a rate
of approximately 6.6%, which approximated our incremental
borrowing rate for obligations of a similar nature. The carrying
value of this debt approximates fair value. For additional
information regarding the deferred acquisition payable, see
Note H.
Accounts
Receivable
Accounts receivable are stated net of allowances for doubtful
accounts. We maintain and continually assess the adequacy of the
allowance for doubtful accounts representing our estimate for
losses resulting from the inability of our customers to pay
amounts due to us. This estimated allowance is based on
historical experience of uncollected accounts, the level of past
due accounts, the overall level of outstanding accounts
receivable, information about specific customers with respect to
their inability to make payments and expectations of future
conditions that could impact the collectibility of accounts
receivable. Future changes in our customers’ operating
performance and cash flows or in general economic conditions
could have an impact on their ability to fully pay these
amounts, which could have a material impact on our operating
results. In most cases, receivables are not collateralized.
However, we utilize letters of credit to secure payment on sales
when possible. At September 30, 2010 and 2009, accounts
receivable included retention amounts of $9.0 million and
$8.1 million, respectively. Retention amounts are in
accordance with applicable provisions of engineering and
construction contracts and become due upon completion of
contractual requirements. Approximately $1.3 million of the
retained amount at September 30, 2010, is expected to be
collected subsequent to September 30, 2011.
Costs
and Estimated Earnings in Excess of Billings on Uncompleted
Contracts
Costs and estimated earnings in excess of billings on
uncompleted contracts arise when revenues are recorded on a
percentage-of-completion
basis but cannot be invoiced under the terms of the contract.
Such amounts are invoiced upon completion of contractual
milestones.
Costs and estimated earnings in excess of billings on
uncompleted contracts also include certain costs associated with
unapproved change orders. These costs are included when change
order approval is probable. Amounts are carried at the lower of
cost or net realizable value. No profit is recognized on costs
incurred until change order approval is obtained. The amounts
recorded involve the use of judgments and estimates; thus,
actual recoverable amounts could differ from original
assumptions. See Note L — Commitments and
Contingencies for a discussion related to certain costs recorded
in costs and estimated earnings in excess of billings on
uncompleted contracts.
36
POWELL
INDUSTRIES, INC. AND SUBSIDIARIES
NOTES TO
CONSOLIDATED FINANCIAL
STATEMENTS — (Continued)
In accordance with industry practice, assets and liabilities
related to costs and estimated earnings in excess of billings on
uncompleted contracts, as well as billings in excess of costs
and estimated earnings on uncompleted contracts, have been
classified as current. The contract cycle for certain long-term
contracts may extend beyond one year; thus, collection of
amounts related to these contracts may extend beyond one year.
Inventories
Inventories are stated at the lower of cost or market using
first-in,
first-out (FIFO) or weighted-average methods and include the
cost of materials, labor and manufacturing overhead. We use
estimates in determining the level of reserves required to state
inventory at the lower of cost or market. Our estimates are
based on market activity levels, production requirements, the
physical condition of products and technological innovation.
Changes in any of these factors may result in adjustments to the
carrying value of inventory.
Property,
Plant and Equipment
Property, plant and equipment are stated at cost and are
depreciated using the straight-line method over the estimated
useful lives of the assets. Expenditures for repairs and
maintenance are charged to expense when incurred. Expenditures
for major renewals and improvements, which extend the useful
lives of existing equipment, are capitalized and depreciated.
Upon retirement or disposition of property, plant and equipment,
the cost and related accumulated depreciation are removed from
the accounts, and any resulting gain or loss is recognized in
the Consolidated Statements of Operations.
Impairment
of Long-Lived Assets and Amortization of Intangible
Assets
We review long-lived assets for impairment whenever events or
changes in circumstances indicate that the carrying value may
not be realizable. If an evaluation is required, the estimated
future undiscounted cash flows associated with the asset are
compared to the asset’s carrying amount to determine if an
impairment of such asset is necessary. This requires us to make
long-term forecasts of the future revenues and the costs related
to the assets subject to review. Forecasts require assumptions
about demand for our products and future market conditions.
Estimating future cash flows requires significant judgment, and
our projections may vary from cash flows eventually realized.
Future events and unanticipated changes to assumptions could
require a provision for impairment in a future period. The
effect of any impairment would be reflected in income (loss)
from operations in the Consolidated Statements of Operations. In
addition, we estimate the useful lives of our long-lived assets
and other intangibles and periodically review these estimates to
determine whether these lives are appropriate.
The costs of intangible assets with determinable useful lives
are amortized over their estimated useful lives. When certain
events or changes in operating conditions occur, an impairment
assessment is performed and lives of intangible assets with
determinable lives may be adjusted. For additional information
regarding our intangible assets and related impairment, see
Note E.
Goodwill
and Indefinite Lived Assets
Goodwill and other intangible assets with indefinite useful
lives are evaluated for impairment annually, or immediately if
conditions indicate that impairment could exist. The evaluation
requires a two-step impairment test to identify potential
goodwill impairment and measure the amount of a goodwill
impairment loss. The first step of the test compares the fair
value of a reporting unit with its carrying amount, including
goodwill. If the carrying amount of a reporting unit exceeds its
fair value, the second step of the goodwill impairment test is
performed to measure the amount of the impairment loss. Both
steps of the goodwill impairment testing involve significant
estimates.
37
POWELL
INDUSTRIES, INC. AND SUBSIDIARIES
NOTES TO
CONSOLIDATED FINANCIAL
STATEMENTS — (Continued)
Income
Taxes
We account for income taxes under the asset and liability
method, based on the income tax laws and rates in the countries
in which operations are conducted and income is earned. This
approach requires the recognition of deferred tax assets and
liabilities for the expected future tax consequences of
temporary differences between the carrying amounts and the tax
basis of assets and liabilities. Developing our provision for
income taxes requires significant judgment and expertise in
federal, international and state income tax laws, regulations
and strategies, including the determination of deferred tax
assets and liabilities and, if necessary, any valuation
allowances that may be required for deferred tax assets. We
record a valuation allowance to reduce our deferred tax assets
to the amount that is more likely than not to be realized. We
believe that the deferred tax asset recorded as of
September 30, 2010, is realizable through future reversals
of existing taxable temporary differences and future taxable
income. If we were to subsequently determine that we would be
able to realize deferred tax assets in the future in excess of
our net recorded amount, an adjustment to deferred tax assets
would increase earnings for the period in which such
determination was made. We will continue to assess the adequacy
of the valuation allowance on a quarterly basis. Our judgments
and tax strategies are subject to audit by various taxing
authorities.
The objectives of accounting for income taxes are to recognize
the amount of taxes payable or refundable for the current year
and deferred tax liabilities and assets for the future tax
consequences of events that have been recognized in an
entity’s financial statements or tax returns. We recognize
the tax benefit from an uncertain tax position only if it is
more likely than not that the tax position will be sustained on
examination by the taxing authorities, based on the technical
merits of the position. The tax benefits recognized in the
financial statements from such a position should be measured
based on the largest benefit that has a greater than 50%
likelihood of being realized upon ultimate settlement.
Accounting literature also provides guidance on derecognition of
income tax assets and liabilities, classification of current and
deferred income tax assets and liabilities, accounting for
interest and penalties associated with tax positions, and income
tax disclosures. Judgment is required in assessing the future
tax consequences of events that have been recognized in our
financial statements or tax returns. Variations in the actual
outcome of these future tax consequences could materially impact
our financial statements.
Revenue
Recognition
Our revenues are primarily generated from engineering and
manufacturing of custom products under long-term contracts that
may last from one month to several years, depending on the
contract. Revenues from long-term contracts are recognized on
the
percentage-of-completion
method of accounting.
Under the
percentage-of-completion
method of accounting, revenues are recognized as work is
performed primarily based on the estimated completion to date
calculated by multiplying the total contract price by percentage
of performance to date, based on total costs or total labor
dollars incurred to date to the total estimated costs or total
labor dollars estimated at completion. The method used to
determine the percentage of completion is typically the cost
method, unless the labor method is a more accurate method of
measuring the progress of the projects. Application of the
percentage-of-completion
method of accounting requires the use of estimates of costs to
be incurred for the performance of the contract. Contract costs
include all direct material, direct labor costs and those
indirect costs related to contract performance, such as indirect
labor, supplies, tools, repairs and all costs associated with
operation of equipment. The cost estimation process is based
upon the professional knowledge and experience of our engineers,
project managers and financial professionals. Factors that are
considered in estimating the work to be completed and ultimate
contract recovery include the availability and productivity of
labor, the nature and complexity of the work to be performed,
the effect of change orders, the availability of materials, the
effect of any delays in our project performance and the
recoverability of any claims. Changes in job performance, job
conditions, estimated profitability and final contract
settlements, including our estimate of liquidated damages, if
any, may result in revisions to costs and income, with their
effects being recognized in the period in which the revisions
are determined. Whenever revisions of estimated contract costs
and contract values indicate that the contract costs will exceed
estimated revenues, thus creating a loss, a provision for the
total estimated loss is recorded in that period.
38
POWELL
INDUSTRIES, INC. AND SUBSIDIARIES
NOTES TO
CONSOLIDATED FINANCIAL
STATEMENTS — (Continued)
Revenues associated with maintenance, repair and service
contracts are recognized when the services are performed.
Expenses related to these types of services are recognized as
incurred.
Warranties
We provide for estimated warranty costs at the time of sale
based upon historical rates applicable to individual product
lines. In addition, specific provisions are made when the costs
of such warranties are expected to exceed accruals. Our standard
terms and conditions of sale include a warranty for parts and
service for the earlier of 18 months from the date of
shipment or 12 months from the date of initial operations.
Research
and Development Expense
Research and development costs are charged to expense as
incurred. These costs are included as a component of selling,
general and administrative expenses on the Consolidated
Statements of Operations. Such amounts were $6.5 million,
$6.0 million and $6.6 million in fiscal years 2010,
2009 and 2008, respectively.
Foreign
Currency Translation
The functional currency for our foreign subsidiaries is the
local currency in which the entity is located. The financial
statements of all subsidiaries with a functional currency other
than the U.S. Dollar have been translated into
U.S. Dollars. All assets and liabilities of foreign
operations are translated into U.S. Dollars using year-end
exchange rates, and all revenues and expenses are translated at
average rates during the respective period. The U.S. Dollar
results that arise from such translation, as well as exchange
gains and losses on intercompany balances of a long-term
investment nature, are included in the cumulative currency
translation adjustments in accumulated other comprehensive
income in stockholders’ equity.
Stock-Based
Compensation
We measure stock-based compensation cost at the grant date based
on the fair value of the award and recognize it as expense over
the applicable vesting period of the stock award (generally five
years) using the straight-line method. Excess income tax
benefits related to share-based compensation expense that must
be recognized directly in equity are considered financing rather
than operating cash flow activities.
We use the Black-Scholes option pricing model, with expanded
guidance for the development of our assumption used as inputs,
to estimate the fair value of our stock options. Expected
volatility is determined using volatilities based on historical
stock prices for a period equal to the expected term. The
expected volatility assumption is adjusted if future volatility
is expected to vary from historical experience. The expected
term of options represents the period of time that options
granted are expected to be outstanding and falls between the
options’ vesting and contractual expiration dates. The
risk-free interest rate is based on the yield at the date of
grant of a zero-coupon U.S. Treasury bond whose maturity
period equals the option’s expected term. There have been
no stock options granted since July 2005.
Derivative
Financial Instruments
As part of managing our exposure to changes in foreign currency
exchange rates, we periodically utilize foreign exchange forward
contracts. The objective of these contracts is to minimize
impacts to cash flows and profitability due to changes in
foreign currency exchange rates on accounts receivable, accounts
payable and forecasted cash transactions. These contracts are
recorded in the Consolidated Balance Sheets at fair value, which
is based upon an income approach consisting of a discounted cash
flow model that takes into account the present value of the
future cash flows under the terms of the contracts using current
market information as of the reporting date, such as foreign
currency spot and forward rates.
39
POWELL
INDUSTRIES, INC. AND SUBSIDIARIES
NOTES TO
CONSOLIDATED FINANCIAL
STATEMENTS — (Continued)
We formally document our hedging relationships, including
identifying the hedging instruments and the hedged items, as
well as our risk management objectives and strategies for
undertaking the hedge transaction. We also formally assess, both
at inception and at least quarterly thereafter, whether the
derivatives that are used in hedging transactions are highly
effective in offsetting changes in the cash flows of the hedged
item. The effective portion of the change in fair value of a
derivative is recorded as a component of accumulated other
comprehensive income in the Consolidated Balance Sheets. When
the hedged item affects the income statement, the gain or loss
included in accumulated other comprehensive income is reported
on the same line in the Consolidated Statements of Operations as
the hedged item. In addition, any ineffective portion of the
changes in the fair value of derivatives used as cash flow
hedges is reported in the Consolidated Statements of Operations
as the changes occur. If it is determined that a derivative
ceases to be a highly effective hedge, or it is probable that
the forecasted transaction will not occur, we discontinue hedge
accounting and any unrealized gains or losses are recorded in
the consolidated financial statements.
On January 1, 2009, we adopted accounting guidance that
amended and expanded the disclosure requirements related to
derivative instruments and hedging activities. This guidance
enhances the disclosure requirements for derivative instruments
and hedging activities. The guidance is focused on requiring
enhanced disclosure on: 1) how and why an entity uses
derivative instruments and hedging activities; 2) how
derivative instruments and related hedging activities are
accounted for and 3) how derivative instruments and related
hedging activities affect an entity’s cash flows, financial
position and performance.
To accomplish the three objectives listed above, we are required
to provide: 1) qualitative disclosures regarding the
objectives and strategies for using derivative instruments and
engaging in hedging activities in the context of our overall
risk exposure; 2) quantitative disclosure in tabular format
of the fair values of derivative instruments and their gains and
losses and 3) disclosures about credit-risk related
contingent features in derivative instruments.
The adoption of this accounting guidance did not have an impact
on our consolidated financial position or results of operations.
As a result of the adoption of this guidance, we have expanded
our disclosures regarding derivative instruments and hedging
activities within Note J.
Accumulated
Other Comprehensive Income (Loss)
Accumulated other comprehensive income (loss), which is included
as a component of stockholders’ equity net of tax, includes
unrealized gains or losses on derivative instruments,
postretirement benefit adjustments and currency translation
adjustments in foreign consolidated subsidiaries.
Fair
Value Measurements
On October 1, 2008, we adopted authoritative guidance
issued by the Financial Accounting Standards Board (FASB)
related to fair value measurements. The authoritative guidance
defines fair value, establishes a framework for measuring fair
value under U.S. GAAP and expands disclosures about fair
value measurements. The authoritative guidance was effective for
us beginning October 1, 2008, for financial assets and
liabilities. Refer to Note C for additional information
regarding our fair value measurements for financial assets and
liabilities. The changes became effective for non-financial
assets and liabilities recognized or disclosed at fair value on
a nonrecurring basis beginning October 1, 2009. The
application of the authoritative guidance, as it relates to
non-financial assets and liabilities, had no impact on our
consolidated financial statements.
New
Accounting Standards
In December 2007, the FASB issued accounting guidance on
business combinations. The guidance establishes principles and
requirements for how an acquirer recognizes and measures in its
financial statements the identifiable assets acquired, the
liabilities assumed, any noncontrolling interest in the acquiree
and the goodwill acquired. The accounting guidance also
establishes disclosure requirements to enable the evaluation of
the nature and financial
40
POWELL
INDUSTRIES, INC. AND SUBSIDIARIES
NOTES TO
CONSOLIDATED FINANCIAL
STATEMENTS — (Continued)
effects of the business combination. The guidance is effective
as of the beginning of an entity’s fiscal year that begins
after December 15, 2008, and was adopted by us on
October 1, 2009. Refer to Note D for additional
information regarding our recent acquisition of Powell Canada
and the impact of this guidance.
In December 2007, the FASB issued accounting guidance for
noncontrolling interests in consolidated financial statements.
This guidance establishes accounting and reporting standards for
ownership interests in subsidiaries held by parties other than
the parent, the amount of consolidated net income attributable
to the parent and to the noncontrolling interest, changes in a
parent’s ownership interest and the valuation of retained
noncontrolling equity investments when a subsidiary is
deconsolidated. The accounting guidance also establishes
disclosure requirements that clearly identify and distinguish
between the interests of the parent and the interests of the
noncontrolling owners. The guidance is effective as of the
beginning of an entity’s fiscal year that begins after
December 15, 2008, and was adopted by us on October 1,
2009. This guidance did not have an impact on our consolidated
financial position or results of operations, but did change the
presentation of noncontrolling interests in our Consolidated
Balance Sheets and Consolidated Statements of Operations.
In December 2008, the FASB issued accounting guidance on
employers’ disclosures about postretirement benefit plan
assets. The disclosures about plan assets required by this
guidance shall be provided for fiscal years beginning after
December 15, 2009, and will be adopted by us in the first
quarter of fiscal year 2011. We do not expect adoption of this
guidance to have a material impact on our consolidated financial
statements.
In April 2009, the FASB issued accounting guidance regarding the
accounting for assets acquired and liabilities assumed in a
business combination due to contingencies. This guidance
clarifies the initial and subsequent recognition, subsequent
accounting and disclosure of assets and liabilities arising from
contingencies in a business combination. This guidance requires
that assets acquired and liabilities assumed in a business
combination that arise from contingencies be recognized at fair
value, if the acquisition-date fair value can be reasonably
estimated. If the acquisition-date fair value of an asset or
liability cannot be reasonably estimated, the asset or liability
would be measured at the amount that would be recognized using
the accounting guidance related to accounting for contingencies
or the guidance for reasonably estimating losses. This
accounting guidance became effective for us on October 1,
2010. The adoption of this guidance did not have a material
impact on our consolidated financial statements.
In January 2010, the FASB issued updated guidance to amend the
disclosure requirements related to recurring and nonrecurring
fair value measurements. This update requires new disclosures
about significant transfers of assets and liabilities between
Level 1 and Level 2 of the fair value hierarchy
(including the reasons for these transfers) and the reasons for
any transfers in or out of Level 3. This update also
requires a reconciliation of recurring Level 3 measurements
about purchases, sales, issuances and settlements on a gross
basis. In addition to these new disclosure requirements, this
update clarifies certain existing disclosure requirements. For
example, this update clarifies that reporting entities are
required to provide fair value measurement disclosures for each
class of assets and liabilities, rather than each major category
of assets or liabilities. This update also clarifies the
requirement for entities to disclose information about both the
valuation techniques and inputs used in estimating Level 2
and Level 3 fair value measurements. This update will
become effective for us with the interim and annual reporting
period beginning after December 15, 2009, our fiscal year
2011, except for the requirement to provide the Level 3
activity of purchases, sales, issuances and settlements on a
gross basis, which will become effective for us with the interim
and annual reporting period beginning after December 15,
2010, our fiscal year 2012. We will not be required to provide
the amended disclosures for any previous periods presented for
comparative purposes. Other than requiring additional
disclosures, adoption of this update will not have a material
impact on our consolidated financial statements.
In April 2010, the FASB issued accounting guidance for the
milestone method of revenue recognition. This guidance allows
entities to make a policy election to use the milestone method
of revenue recognition and provides guidance on defining a
milestone and the criteria that should be met for applying the
milestone method. The scope of this guidance is limited to
transactions involving milestones relating to research and
development deliverables.
41
POWELL
INDUSTRIES, INC. AND SUBSIDIARIES
NOTES TO
CONSOLIDATED FINANCIAL
STATEMENTS — (Continued)
The guidance includes enhanced disclosure requirements about
each arrangement, individual milestones and related contingent
consideration, information about substantive milestones and
factors considered in the determination. This guidance is
effective prospectively to milestones achieved in fiscal years,
and interim periods within those years, beginning after
June 15, 2010. Early application and retrospective
application are permitted. We have evaluated this new guidance
and have determined that it will not currently have a
significant impact on the determination or reporting of our
financial results.
Subsequent
Events
We evaluated subsequent events through the time of filing this
Annual Report on
Form 10-K.
No significant events occurred subsequent to the balance sheet
or prior to the filing of this report that would have a material
impact on our consolidated financial statements or results of
operations.
|
|
|
C.
|
Fair
Value Measurements
|
We measure certain financial assets and liabilities at fair
value. Fair value is defined as an “exit price” which
represents the amount that would be received to sell an asset or
paid to transfer a liability in an orderly transaction between
market participants as of the measurement date. As such, fair
value is a market-based measurement that should be determined
based on assumptions that market participants would use in
valuing an asset or liability. The accounting guidance requires
the use of valuation techniques to measure fair value that
maximize the use of observable inputs and minimize the use of
unobservable inputs. As a basis for considering such assumptions
and inputs, a fair value hierarchy has been established which
identifies and prioritizes three levels of inputs to be used in
measuring fair value.
The three levels of the fair value hierarchy are as follows:
Level 1 — Observable inputs such as quoted prices
(unadjusted) in active markets for identical assets or
liabilities.
Level 2 — Inputs other than the quoted prices in
active markets that are observable either directly or
indirectly, including: quoted prices for similar assets and
liabilities in active markets; quoted prices for identical or
similar assets and liabilities in markets that are not active or
other inputs that are observable or can be corroborated by
observable market data.
Level 3 — Unobservable inputs that are supported
by little or no market data and require the reporting entity to
develop its own assumptions.
The following table summarizes the fair value of our assets and
liabilities that were accounted for at fair value on a recurring
basis as of September 30, 2010 (in thousands):
| |
|
|
|
|
|
|
|
|
|
|
|
|
|
|
|
|
|
|
|
Fair Value Measurements at September 30, 2010
|
|
|
|
|
|
|
|
Quoted Prices in
|
|
|
Significant Other
|
|
|
|
|
|
|
|
|
|
|
Active Markets for
|
|
|
Observable
|
|
|
Significant
|
|
|
Fair Value at
|
|
|
|
|
Identical Assets
|
|
|
Inputs
|
|
|
Unobservable Inputs
|
|
|
September 30,
|
|
|
|
|
(Level 1)
|
|
|
(Level 2)
|
|
|
(Level 3)
|
|
|
2010
|
|
|
|
|
Assets
|
|
|
|
|
|
|
|
|
|
|
|
|
|
|
|
|
|
Cash equivalents
|
|
$
|
64,014
|
|
|
$
|
—
|
|
|
$
|
—
|
|
|
$
|
64,014
|
|
|
|
|
|
|
|
|
|
|
|
|
|
|
|
|
|
|
|
|
Total
|
|
$
|
64,014
|
|
|
$
|
—
|
|
|
$
|
—
|
|
|
$
|
64,014
|
|
|
|
|
|
|
|
|
|
|
|
|
|
|
|
|
|
|
|
|
Liabilities
|
|
|
|
|
|
|
|
|
|
|
|
|
|
|
|
|
|
Foreign currency forward contracts
|
|
$
|
—
|
|
|
$
|
47
|
|
|
$
|
—
|
|
|
$
|
47
|
|
|
|
|
|
|
|
|
|
|
|
|
|
|
|
|
|
|
|
|
Total
|
|
$
|
—
|
|
|
$
|
47
|
|
|
$
|
—
|
|
|
$
|
47
|
|
|
|
|
|
|
|
|
|
|
|
|
|
|
|
|
|
|
|
42
POWELL
INDUSTRIES, INC. AND SUBSIDIARIES
NOTES TO
CONSOLIDATED FINANCIAL
STATEMENTS — (Continued)
The following table summarizes the fair value of our assets and
liabilities that were accounted for at fair value on a recurring
basis as of September 30, 2009 (in thousands):
| |
|
|
|
|
|
|
|
|
|
|
|
|
|
|
|
|
|
|
|
Fair Value Measurements at September 30, 2009
|
|
|
|
|
|
|
|
Quoted Prices in
|
|
|
Significant Other
|
|
|
|
|
|
|
|
|
|
|
Active Markets for
|
|
|
Observable
|
|
|
Significant
|
|
|
Fair Value at
|
|
|
|
|
Identical Assets
|
|
|
Inputs
|
|
|
Unobservable Inputs
|
|
|
September 30,
|
|
|
|
|
(Level 1)
|
|
|
(Level 2)
|
|
|
(Level 3)
|
|
|
2009
|
|
|
|
|
Assets
|
|
|
|
|
|
|
|
|
|
|
|
|
|
|
|
|
|
Cash equivalents
|
|
$
|
59,324
|
|
|
$
|
—
|
|
|
$
|
—
|
|
|
$
|
59,324
|
|
|
|
|
|
|
|
|
|
|
|
|
|
|
|
|
|
|
|
|
Total
|
|
$
|
59,324
|
|
|
$
|
—
|
|
|
$
|
—
|
|
|
$
|
59,324
|
|
|
|
|
|
|
|
|
|
|
|
|
|
|
|
|
|
|
|
|
Liabilities
|
|
|
|
|
|
|
|
|
|
|
|
|
|
|
|
|
|
Foreign currency forward contracts
|
|
$
|
—
|
|
|
$
|
752
|
|
|
$
|
—
|
|
|
$
|
752
|
|
|
|
|
|
|
|
|
|
|
|
|
|
|
|
|
|
|
|
|
Total
|
|
$
|
—
|
|
|
$
|
752
|
|
|
$
|
—
|
|
|
$
|
752
|
|
|
|
|
|
|
|
|
|
|
|
|
|
|
|
|
|
|
|
Cash equivalents, primarily funds held in money market savings
instruments, are reported at their current carrying value which
approximates fair value due to the short-term nature of these
instruments and are included in cash and cash equivalents in our
Consolidated Balance Sheets.
Foreign currency forward contracts are valued using an income
approach which consists of a discounted cash flow model that
takes into account the present value of future cash flows under
the terms of the contracts using observable market spot and
forward rates as of our reporting date, and are included in
Level 2 inputs in the above tables. We use these derivative
instruments to mitigate non-functional currency transaction
exposure on certain contracts with customers and vendors. We
mitigate derivative credit risk by transacting with highly rated
counterparties. We have evaluated the credit and non-performance
risks associated with our derivative counterparties and believe
them to be insignificant at September 30, 2010. All
contracts are recorded at fair value and
marked-to-market
at the end of each reporting period, with unrealized gains and
losses being included in accumulated other comprehensive income
on the Consolidated Balance Sheets for that period. See
Note J for further discussion regarding our derivative
instruments.
On December 15, 2009, we acquired the business and certain
assets of PowerComm Inc. and its subsidiaries, Redhill Systems,
Ltd., Nextron Corporation, PCG Technical Services Inc. and
Concorde Metal Manufacturing Ltd (the entire business of which
is referred to herein as Powell Canada). Powell Canada is
headquartered in Edmonton, Alberta, Canada and provides
electrical and maintenance services in western Canada. Powell
Canada is also a manufacturer of switchgear and related
products, primarily serving the oil and gas industry in western
Canada. This acquisition supports our strategy to expand our
geographic presence into Canada, as well as increasing our
service and maintenance capabilities.
We paid $23.4 million, plus expenses of approximately
$2.4 million, for the acquisition from our existing cash
and cash equivalents and assumed $15.1 million of existing
bank debt. See the table below for assets acquired and
liabilities assumed. In December 2009, approximately
$2.4 million of the $23.4 million purchase price was
placed into an escrow account related to the purchase of
PowerComm’s 50% interest in the operations of a joint
venture in Kazakhstan. This transaction closed in April 2010 and
the escrow was released.
An additional contingent payment of up to approximately
$7.6 million could have been payable after March 31,
2010, based on the earnings performance of Powell Canada and
PowerComm’s joint venture operations in Kazakhstan for the
12-month
period ended March 31, 2010 (the Earnout). We have not
recorded a liability related to the Earnout as it was not earned.
43
POWELL
INDUSTRIES, INC. AND SUBSIDIARIES
NOTES TO
CONSOLIDATED FINANCIAL
STATEMENTS — (Continued)
The purchase price allocated to the assets acquired and
liabilities assumed is based on the estimated fair value as of
the acquisition date.
Additionally, the finalization of the net asset adjustment
related to the Kazakhstan transaction and the calculation of the
management fee agreement related to the operating results of the
Kazakhstan joint venture from December 16, 2009, through
March 31, 2010, as defined in the acquisition agreement,
resulted in a refund to the Company of approximately $472,000,
which was received subsequent to September 30, 2010, and
was recorded as a receivable at September 30, 2010, in our
consolidated balance sheet. Our interest in the net assets of
the 50% ownership in the joint venture is recorded at its
estimated net realizable value as the Company has made a
strategic decision to exit this joint venture.
Intangible assets recorded are approximately $9.0 million
and will be amortized over an estimated weighted average life of
approximately 8.4 years. Goodwill was recorded at
approximately $7.2 million and will not be amortized.
Goodwill represents the excess purchase price over the estimated
fair value allocated to the net assets acquired and will be
deductible for income tax purposes. The amount paid in excess of
the fair value of the net assets acquired was to obtain an
existing service and manufacturing presence in Canada and to
strengthen our strategic position in the electrical power
business, utilizing the combined capabilities of Powell Canada
with our existing operations. See discussion of impairment in
Note E.
The purchase price allocation was as follows, based on the
exchange rate as of December 15, 2009 (in thousands):
| |
|
|
|
|
|
Accounts receivable
|
|
$
|
16,643
|
|
|
Inventories
|
|
|
4,180
|
|
|
Prepaid expenses and other current assets
|
|
|
3,401
|
|
|
Property, plant and equipment
|
|
|
7,863
|
|
|
Goodwill
|
|
|
7,180
|
|
|
Intangible assets
|
|
|
9,043
|
|
|
Accounts payable and other current liabilities
|
|
|
(7,649
|
)
|
|
Capital lease obligations
|
|
|
(2,667
|
)
|
|
Bank debt assumed
|
|
|
(15,072
|
)
|
|
|
|
|
|
|
|
Total purchase price
|
|
$
|
22,922
|
|
|
|
|
|
|
|
Operating results of Powell Canada are included in our
Electrical Power Products business segment in our Consolidated
Statements of Operations from December 15, 2009.
Pro
forma results for Powell Canada Acquisition
(Unaudited)
The unaudited pro forma data presented below reflects the
results of Powell Industries, Inc. and the acquisition of Powell
Canada, assuming the acquisition was completed on
October 1, 2007, (in thousands, except per share data):
| |
|
|
|
|
|
|
|
|
|
|
|
Year Ended September 30,
|
|
|
|
2009
|
|
2008
|
|
|
|
Revenues
|
|
$
|
718,156
|
|
|
$
|
706,830
|
|
|
Net income attributable to Powell Industries, Inc.
|
|
|
34,077
|
|
|
|
21,678
|
|
|
Earnings per share attributable to Powell Industries, Inc.:
|
|
|
|
|
|
|
|
|
|
Basic
|
|
$
|
2.98
|
|
|
$
|
1.92
|
|
|
Diluted
|
|
$
|
2.94
|
|
|
$
|
1.89
|
|
44
POWELL
INDUSTRIES, INC. AND SUBSIDIARIES
NOTES TO
CONSOLIDATED FINANCIAL
STATEMENTS — (Continued)
Pro forma results for fiscal year 2010 are not included above as
the results would not be materially different from the actual
results reported, as the results of Powell Canada are included
in our consolidated financial statements for
91/2
months.
The unaudited pro forma information includes operating results
of Powell Canada prior to the acquisition date adjusted to
include the pro forma impact of the following:
1) Impact of interest expense as a result of increased
borrowings to fund the purchase price;
2) Elimination of the operating results of certain
businesses to be disposed of;
3) Impact of amortization expense related to intangible
assets; and
4) Adjustment to record no income tax benefit from the
losses of Powell Canada.
The unaudited pro forma results above do not purport to be
indicative of the results that would have been obtained if the
acquisitions had occurred as of the beginning of the periods
presented or that may be obtained in the future.
|
|
|
E.
|
Goodwill
and Other Intangible Assets
|
Our intangible assets consist of (1) goodwill, which is not
being amortized, and (2) customer relationships
(15 years), trademarks (15 years), trade names
(10 years), non-compete agreements (5 years), a supply
agreement (15 years) and purchased technologies (6 to
7 years) which are amortized over their estimated useful
lives. We test for impairment of goodwill annually, or
immediately if conditions indicate that impairment could exist.
During the year ended September 30, 2010, we acquired
intangible assets and recorded goodwill in connection with our
acquisition of Powell Canada and our acquisition of a 50%
interest in the operations of a joint venture in Kazakhstan. See
Note D for additional information regarding the
acquisition. During fiscal year 2010, our impairment analyses
for goodwill indicated that an impairment was required. A loss
on impairment of approximately $7.5 million was recorded in
fiscal year 2010 related to the Powell Canada acquisition. The
Company’s strategic decision to exit the 50% owned joint
venture in Kazakhstan and delays in the anticipated growth in
capital investments in the Oil Sands Region of western Canada,
relative to our expectations, resulted in the impairment charge.
No impairment was identified as a result of performing our
annual impairment test for fiscal years 2009 or 2008.
Changes in our goodwill and intangible assets balances for the
years ended September 30, 2010 and 2009, consisted of the
following (in thousands):
| |
|
|
|
|
|
|
|
|
|
|
|
Goodwill
|
|
|
Intangible Assets
|
|
|
|
|
Balance at September 30, 2008
|
|
$
|
1,084
|
|
|
$
|
25,014
|
|
|
Amortization
|
|
|
—
|
|
|
|
(3,460
|
)
|
|
Foreign currency translation adjustment
|
|
|
—
|
|
|
|
(249
|
)
|
|
|
|
|
|
|
|
|
|
|
|
Balance at September 30, 2009
|
|
|
1,084
|
|
|
|
21,305
|
|
|
Acquisition of Powell Canada
|
|
|
7,180
|
|
|
|
9,043
|
|
|
Amortization
|
|
|
—
|
|
|
|
(4,477
|
)
|
|
Impairment
|
|
|
(7,452
|
)
|
|
|
—
|
|
|
Foreign currency translation adjustment
|
|
|
272
|
|
|
|
261
|
|
|
Other
|
|
|
(81
|
)
|
|
|
—
|
|
|
|
|
|
|
|
|
|
|
|
|
Balance at September 30, 2010
|
|
$
|
1,003
|
|
|
$
|
26,132
|
|
|
|
|
|
|
|
|
|
|
|
45
POWELL
INDUSTRIES, INC. AND SUBSIDIARIES
NOTES TO
CONSOLIDATED FINANCIAL
STATEMENTS — (Continued)
All goodwill and intangible assets disclosed above are reported
in our Electrical Power Products business segment.
Amortization of intangible assets recorded for the years ended
September 30, 2010, 2009 and 2008, was approximately
$4.5 million, $3.5 million and $3.6 million,
respectively.
Estimated amortization expense for each of the five subsequent
fiscal years is expected to be (in thousands):
| |
|
|
|
|
|
Years Ending September 30,
|
|
Total
|
|
|
|
2011
|
|
$
|
3,444
|
|
|
2012
|
|
|
2,422
|
|
|
2013
|
|
|
2,209
|
|
|
2014
|
|
|
1,473
|
|
|
2015
|
|
|
1,375
|
|
The following table sets forth the computation of basic and
diluted earnings per share (in thousands, except per share data):
| |
|
|
|
|
|
|
|
|
|
|
|
|
|
|
|
Year Ended September 30,
|
|
|
|
|
2010
|
|
|
2009
|
|
|
2008
|
|
|
|
|
Numerator:
|
|
|
|
|
|
|
|
|
|
|
|
|
|
Net income attributable to Powell Industries, Inc.
|
|
$
|
25,008
|
|
|
$
|
39,717
|
|
|
$
|
25,847
|
|
|
|
|
|
|
|
|
|
|
|
|
|
|
|
|
Denominator:
|
|
|
|
|
|
|
|
|
|
|
|
|
|
Weighted average basic shares
|
|
|
11,545
|
|
|
|
11,424
|
|
|
|
11,265
|
|
|
Dilutive effect of stock options, restricted stock and
restricted stock units
|
|
|
148
|
|
|
|
167
|
|
|
|
187
|
|
|
|
|
|
|
|
|
|
|
|
|
|
|
|
|
Weighted average diluted shares with assumed conversions
|
|
|
11,693
|
|
|
|
11,591
|
|
|
|
11,452
|
|
|
|
|
|
|
|
|
|
|
|
|
|
|
|
|
Net earnings per share:
|
|
|
|
|
|
|
|
|
|
|
|
|
|
Basic
|
|
$
|
2.17
|
|
|
$
|
3.48
|
|
|
$
|
2.29
|
|
|
|
|
|
|
|
|
|
|
|
|
|
|
|
|
Diluted
|
|
$
|
2.14
|
|
|
$
|
3.43
|
|
|
$
|
2.26
|
|
|
|
|
|
|
|
|
|
|
|
|
|
|
|
All options were included in the computation of diluted earnings
per share for the years ended September 30, 2010, 2009 and
2008, respectively, as the options’ exercise prices were
less than the average market price of our common stock.
46
POWELL
INDUSTRIES, INC. AND SUBSIDIARIES
NOTES TO
CONSOLIDATED FINANCIAL
STATEMENTS — (Continued)
|
|
|
G.
|
Detail of
Selected Balance Sheet Accounts
|
Allowance
for Doubtful Accounts
Activity in our allowance for doubtful accounts receivable
consisted of the following (in thousands):
| |
|
|
|
|
|
|
|
|
|
|
|
September 30,
|
|
|
|
|
2010
|
|
|
2009
|
|
|
|
|
Balance at beginning of year
|
|
$
|
1,607
|
|
|
$
|
1,180
|
|
|
Increase to bad debt expense
|
|
|
422
|
|
|
|
959
|
|
|
Deductions for uncollectible accounts written off, net of
recoveries
|
|
|
(1,168
|
)
|
|
|
(631
|
)
|
|
Increase due to foreign currency translation
|
|
|
46
|
|
|
|
99
|
|
|
|
|
|
|
|
|
|
|
|
|
Balance at end of year
|
|
$
|
907
|
|
|
$
|
1,607
|
|
|
|
|
|
|
|
|
|
|
|
Warranty
Accrual
Activity in our product warranty accrual consisted of the
following (in thousands):
| |
|
|
|
|
|
|
|
|
|
|
|
September 30,
|
|
|
|
|
2010
|
|
|
2009
|
|
|
|
|
Balance at beginning of year
|
|
$
|
7,558
|
|
|
$
|
6,793
|
|
|
Increase to warranty expense
|
|
|
1,118
|
|
|
|
5,124
|
|
|
Deductions for warranty charges
|
|
|
(2,703
|
)
|
|
|
(4,008
|
)
|
|
Decrease due to foreign currency translation
|
|
|
(44
|
)
|
|
|
(351
|
)
|
|
|
|
|
|
|
|
|
|
|
|
Balance at end of year
|
|
$
|
5,929
|
|
|
$
|
7,558
|
|
|
|
|
|
|
|
|
|
|
|
Inventories
The components of inventories are summarized below (in
thousands):
| |
|
|
|
|
|
|
|
|
|
|
|
September 30,
|
|
|
|
|
2010
|
|
|
2009
|
|
|
|
|
Raw materials, parts and subassemblies
|
|
$
|
40,325
|
|
|
$
|
43,968
|
|
|
Work-in-progress
|
|
|
4,646
|
|
|
|
8,597
|
|
|
Provision for excess and obsolete inventory
|
|
|
(6,727
|
)
|
|
|
(6,313
|
)
|
|
|
|
|
|
|
|
|
|
|
|
Total inventories
|
|
$
|
38,244
|
|
|
$
|
46,252
|
|
|
|
|
|
|
|
|
|
|
|
47
POWELL
INDUSTRIES, INC. AND SUBSIDIARIES
NOTES TO
CONSOLIDATED FINANCIAL
STATEMENTS — (Continued)
Cost
and Estimated Earnings on Uncompleted Contracts
The components of costs and estimated earnings and related
amounts billed on uncompleted contracts are summarized below (in
thousands):
| |
|
|
|
|
|
|
|
|
|
|
|
September 30,
|
|
|
|
|
2010
|
|
|
2009
|
|
|
|
|
Costs incurred on uncompleted contracts
|
|
$
|
482,149
|
|
|
$
|
552,805
|
|
|
Estimated earnings
|
|
|
138,836
|
|
|
|
136,603
|
|
|
|
|
|
|
|
|
|
|
|
|
|
|
|
620,985
|
|
|
|
689,408
|
|
|
Less: Billings to date
|
|
|
613,930
|
|
|
|
687,845
|
|
|
|
|
|
|
|
|
|
|
|
|
Net underbilled position
|
|
$
|
7,055
|
|
|
$
|
1,563
|
|
|
|
|
|
|
|
|
|
|
|
|
Included in the accompanying balance sheets under the following
captions:
|
|
|
|
|
|
|
|
|
|
Costs and estimated earnings in excess of billings on
uncompleted contracts — underbilled
|
|
$
|
38,064
|
|
|
$
|
46,335
|
|
|
Billings in excess of costs and estimated earnings on
uncompleted contracts — overbilled
|
|
|
(31,009
|
)
|
|
|
(44,772
|
)
|
|
|
|
|
|
|
|
|
|
|
|
Net underbilled position
|
|
$
|
7,055
|
|
|
$
|
1,563
|
|
|
|
|
|
|
|
|
|
|
|
Property,
Plant and Equipment
Property, plant and equipment are summarized below (in
thousands):
| |
|
|
|
|
|
|
|
|
|
|
|
|
|
|
|
September 30,
|
|
|
Range of
|
|
|
|
|
2010
|
|
|
2009
|
|
|
Asset Lives
|
|
|
|
|
Land
|
|
$
|
7,641
|
|
|
$
|
7,268
|
|
|
|
—
|
|
|
Buildings and improvements
|
|
|
52,627
|
|
|
|
51,056
|
|
|
|
3 - 39 Years
|
|
|
Machinery and equipment
|
|
|
61,877
|
|
|
|
51,977
|
|
|
|
3 - 15 Years
|
|
|
Furniture and fixtures
|
|
|
3,332
|
|
|
|
3,050
|
|
|
|
3 - 10 Years
|
|
|
Construction in process
|
|
|
1,384
|
|
|
|
3,771
|
|
|
|
—
|
|
|
|
|
|
|
|
|
|
|
|
|
|
|
|
|
|
|
|
126,861
|
|
|
|
117,122
|
|
|
|
|
|
|
Less: Accumulated depreciation
|
|
|
(63,185
|
)
|
|
|
(56,086
|
)
|
|
|
|
|
|
|
|
|
|
|
|
|
|
|
|
|
|
|
|
Total property, plant and equipment, net
|
|
$
|
63,676
|
|
|
$
|
61,036
|
|
|
|
|
|
|
|
|
|
|
|
|
|
|
|
|
|
|
|
Included in property and equipment are assets under capital
lease of approximately $4.2 million and $246,000 at
September 30, 2010 and 2009, with related accumulated
depreciation of approximately $2.2 million and $246,000,
respectively. Depreciation expense, including the depreciation
of capital leases, was approximately $9.2 million,
$7.5 million and $8.1 million for fiscal years 2010,
2009 and 2008, respectively.
48
POWELL
INDUSTRIES, INC. AND SUBSIDIARIES
NOTES TO
CONSOLIDATED FINANCIAL
STATEMENTS — (Continued)
Long-term debt consisted of the following (in thousands):
| |
|
|
|
|
|
|
|
|
|
|
|
September 30,
|
|
|
|
|
2010
|
|
|
2009
|
|
|
|
|
Industrial development revenue bonds
|
|
$
|
4,800
|
|
|
$
|
5,200
|
|
|
Capital lease obligations
|
|
|
2,085
|
|
|
|
—
|
|
|
Deferred acquisition payable
|
|
|
—
|
|
|
|
4,292
|
|
|
|
|
|
|
|
|
|
|
|
|
Subtotal long-term debt and capital lease obligations
|
|
|
6,885
|
|
|
|
9,492
|
|
|
Less current portion
|
|
|
(1,683
|
)
|
|
|
(4,692
|
)
|
|
|
|
|
|
|
|
|
|
|
|
Total long-term debt and capital lease obligations
|
|
$
|
5,202
|
|
|
$
|
4,800
|
|
|
|
|
|
|
|
|
|
|
|
The annual maturities of long-term debt as of September 30,
2010, were as follows (in thousands):
| |
|
|
|
|
|
|
|
Long-Term
|
|
|
|
|
Debt
|
|
|
Year Ending September 30,
|
|
Maturities
|
|
|
|
|
2011
|
|
$
|
1,683
|
|
|
2012
|
|
|
917
|
|
|
2013
|
|
|
662
|
|
|
2014
|
|
|
423
|
|
|
2015
|
|
|
400
|
|
|
Thereafter
|
|
|
2,800
|
|
|
|
|
|
|
|
|
Total long-term debt maturities
|
|
$
|
6,885
|
|
|
|
|
|
|
|
US and
UK Revolvers
In December 2007 and 2008, we amended our existing credit
agreement (Amended Credit Agreement) with a major domestic bank
and certain other financial institutions. These amendments to
our credit facility were made to expand our US borrowing
capacity to provide additional working capital support for the
Company. The Amended Credit Agreement provides for a
1) $58.5 million revolving credit facility (US
Revolver); 2) £4.0 million (pound sterling)
(approximately $6.3 million) revolving credit facility (UK
Revolver) and 3) £6.0 million (approximately
$9.5 million) single advance term loan (UK Term Loan). The
UK Term Loan was repaid in September 2009 and may not be
reborrowed. Expenses associated with the issuance of the
original credit agreement are classified as deferred loan costs,
totaled $576,000 and are being amortized as a non-cash charge to
interest expense. Obligations are collateralized by the stock of
certain of our subsidiaries.
The interest rate for amounts outstanding under the Amended
Credit Agreement for the US Revolver is a floating rate based
upon the higher of the Federal Funds Rate plus 0.5%, or the
bank’s prime rate. Once the applicable rate is determined,
a margin ranging from negative 0.5% to 0.5%, as determined by
our consolidated leverage ratio, is added to the applicable
rate. The floating interest rate for amounts outstanding under
the Amended Credit Agreement for the UK Revolver is a floating
rate based upon the LIBOR plus a margin which can range from
1.25% to 2.25%, as determined by our consolidated leverage ratio
as defined within the Amended Credit Agreement.
The US Revolver and the UK Revolver provide for the issuance of
letters of credit which would reduce the amounts available under
the respective revolvers. The amount available under the US
Revolver was reduced by approximately $15.2 million for our
outstanding letters of credit at September 30, 2010. There
were no letters of credit outstanding under the UK Revolver.
49
POWELL
INDUSTRIES, INC. AND SUBSIDIARIES
NOTES TO
CONSOLIDATED FINANCIAL
STATEMENTS — (Continued)
There were no borrowings under the US Revolver or the UK
Revolver as of September 30, 2010. Amounts available under
the US Revolver and the UK Revolver were approximately
$43.3 million and $6.3 million, respectively, at
September 30, 2010. The US Revolver and the UK Revolver
expire on December 31, 2012.
The Amended Credit Agreement contains certain restrictive and
maintenance-type covenants, including a restriction on our
ability to pay dividends. It also contains financial covenants
defining various financial measures and the levels of these
measures with which we must comply, as well as a “material
adverse change” clause. A “material adverse
change” is defined as a material change in our operations,
business, properties, liabilities or condition (financial or
otherwise) or a material impairment of our ability to perform
our obligations under our credit agreements.
The Amended Credit Agreement’s principal financial
covenants include:
Minimum Tangible Net Worth — The Amended Credit
Agreement requires consolidated tangible net worth
(stockholders’ equity, less intangible assets) as of the
end of each quarter to be greater than the sum of $172,500,000,
plus an amount equal to 50% of our consolidated net income for
each fiscal quarter, plus an amount equal to 100% of the
aggregate increase in stockholders’ equity by reason of the
issuance and sale of any equity interests.
Minimum Fixed Charge Coverage Ratio — The
Amended Credit Agreement requires that the consolidated fixed
charge coverage ratio be greater than 1.25 to 1.00. The
consolidated fixed charge calculation is income before interest
and income taxes, increased by depreciation and amortization
expense (EBITDA) and reduced by income taxes and capital
expenditures for the previous 12 months, divided by the sum
of payments on long-term debt, excluding the US Revolver and the
UK Revolver and interest expense, during the previous
12 months.
Maximum Leverage Ratio — The Amended Credit
Agreement requires that the ratio be less than 2.75 to 1.00 for
the quarter ended September 30, 2010, and thereafter. The
maximum leverage ratio is the sum of total long-term debt and
outstanding letters of credit, less industrial development
revenue bonds, divided by the EBITDA for the previous
12 months.
The Amended Credit Agreement is collateralized by a pledge of
100% of the voting capital stock of each of our domestic
subsidiaries and 66% of the voting capital stock of each
non-domestic subsidiary, excluding Powell Canada. The Amended
Credit Agreement provides for customary events of default and
carries cross-default provisions with other existing debt
agreements. If an event of default (as defined in the Amended
Credit Agreement) occurs and is continuing, on the terms and
subject to the conditions set forth in the Amended Credit
Agreement, amounts outstanding under the Amended Credit
Agreement may be accelerated and may become immediately due and
payable. As of September 30, 2010, we were in compliance
with all of the financial covenants of the Amended Credit
Agreement.
Canadian
Revolver
On December 15, 2009, we entered into a credit agreement
with a major international bank (the Canadian Facility) to
finance the $15.1 million debt assumed in the acquisition
of Powell Canada, and to provide additional working capital
support for our operations in Canada. The Canadian Facility
provides for a $20 million CAD (approximately
$19.4 million) revolving credit facility (the Canadian
Revolver), subject to certain limitations including a limitation
on borrowings based upon certain financial ratios, as defined in
the credit agreement. Expenses associated with the Canadian
Facility were approximately $0.1 million and are classified
as deferred loan costs in other assets and are being amortized
as a non-cash charge to interest expense over two years.
The Canadian Revolver provides for the issuance of letters of
credit which reduce the amounts which may be borrowed under the
Canadian Revolver. As of September 30, 2010, there were no
letters of credit outstanding under the Canadian Revolver.
50
POWELL
INDUSTRIES, INC. AND SUBSIDIARIES
NOTES TO
CONSOLIDATED FINANCIAL
STATEMENTS — (Continued)
There were no borrowings outstanding under the Canadian
Revolver, and approximately $14.4 million was available at
September 30, 2010. The amount available under the Canadian
Revolver was reduced to approximately $14.4 million based
upon the available borrowing base as defined in the Canadian
Facility credit agreement. The Canadian Facility expires on
February 29, 2012. The interest rate for amounts
outstanding under the Canadian Revolver is a floating interest
rate based upon either the Canadian Prime Rate, or the
lender’s US Bank Rate. Once the applicable rate is
determined, a margin of 0.3755% to 1.125%, as determined by our
consolidated leverage ratio is added to the applicable rate.
The principal financial covenants are consistent with those
described in our US Revolver facility above. As discussed above,
the borrowings under the Canadian Revolver are subject to a
borrowing base limitation. The Canadian Facility contains a
“material adverse effect” clause. A “material
adverse effect” is defined as a material change in the
operations of Powell or Powell Canada in relation to our
financial condition, property, business operations, expected net
cash flows, liabilities or capitalization.
The Canadian Facility is secured by the assets of our Canadian
operations and provides for customary events of default and
carries cross-default provisions with our existing debt
agreements. If an event of default (as defined in the Canadian
Facility credit agreement) occurs and is continuing, on the
terms and subject to the conditions set forth in the Canadian
Facility credit agreement, amounts outstanding under the
Canadian Facility may be accelerated and may become immediately
due and payable. As of September 30, 2010, we were in
compliance with all of the financial covenants of the Canadian
Facility credit agreement.
Canadian
Term Loan
The Canadian Facility also provided for a single advance term
loan of $2.5 million CAD (approximately $2.3 million)
(the Canadian Term Loan). The Canadian Term Loan provided a
single advance of $2.4 million for financing the
acquisition of Powell Canada. The Canadian Term Loan was repaid
in September 2010 and may not be reborrowed.
Industrial
Development Revenue Bonds
We borrowed $8.0 million in October 2001 through a loan
agreement funded with proceeds from tax-exempt industrial
development revenue bonds (Bonds). These Bonds were issued by
the Illinois Development Finance Authority and were used for the
completion of our Northlake, Illinois, facility. Pursuant to the
Bond issuance, a reimbursement agreement between us and a major
domestic bank required an issuance by the bank of an irrevocable
direct-pay letter of credit (Bond LC) to the Bonds’
trustee to guarantee payment of the Bonds’ principal and
interest when due. The Bond LC is subject to both early
termination and extension provisions customary to such
agreements, as well as various covenants, for which we are in
compliance at September 30, 2010. While the Bonds mature in
2021, the reimbursement agreement requires annual redemptions of
$400,000 that commenced on October 25, 2002. A sinking fund
is used for the redemption of the Bonds. At September 30,
2010, the balance in the restricted sinking fund was
approximately $434,000 and was recorded in cash and cash
equivalents. The Bonds bear interest at a floating rate
determined weekly by the Bonds’ remarketing agent, which
was the underwriter for the Bonds and is an affiliate of the
bank. This interest rate was 0.55% per year on
September 30, 2010.
Deferred
Acquisition Payable
In connection with the acquisition of the
Power/Vac®
product line, $8.5 million of the total purchase price of
$32.0 million was paid to General Electric Company at
closing on August 7, 2006. The remaining balance of the
purchase price of $23.5 million was payable in four
installments every 10 months over the 40 months
following the acquisition date, with the final installment being
paid in December 2009. At September 30, 2010, there was no
balance remaining related to the deferred acquisition payable.
51
POWELL
INDUSTRIES, INC. AND SUBSIDIARIES
NOTES TO
CONSOLIDATED FINANCIAL
STATEMENTS — (Continued)
The components of the income tax provision were as follows (in
thousands):
| |
|
|
|
|
|
|
|
|
|
|
|
|
|
|
|
Year Ended September 30,
|
|
|
|
|
2010
|
|
|
2009
|
|
|
2008
|
|
|
|
|
Current:
|
|
|
|
|
|
|
|
|
|
|
|
|
|
Federal
|
|
$
|
18,126
|
|
|
$
|
18,028
|
|
|
$
|
10,487
|
|
|
State
|
|
|
1,750
|
|
|
|
2,910
|
|
|
|
1,628
|
|
|
Foreign
|
|
|
1,071
|
|
|
|
1,146
|
|
|
|
1,601
|
|
|
Deferred
|
|
|
(1,053
|
)
|
|
|
(1,350
|
)
|
|
|
356
|
|
|
|
|
|
|
|
|
|
|
|
|
|
|
|
|
Total income tax provision
|
|
$
|
19,894
|
|
|
$
|
20,734
|
|
|
$
|
14,072
|
|
|
|
|
|
|
|
|
|
|
|
|
|
|
|
Income before interest, income taxes and minority interest was
as follows (in thousands):
| |
|
|
|
|
|
|
|
|
|
|
|
|
|
|
|
Year Ended September 30,
|
|
|
|
|
2010
|
|
|
2009
|
|
|
2008
|
|
|
|
|
U.S.
|
|
$
|
53,467
|
|
|
$
|
56,115
|
|
|
$
|
35,089
|
|
|
Other than U.S.
|
|
|
(8,406
|
)
|
|
|
4,544
|
|
|
|
4,779
|
|
|
|
|
|
|
|
|
|
|
|
|
|
|
|
|
Income from continuing operations before provision for income
taxes
|
|
$
|
45,061
|
|
|
$
|
60,659
|
|
|
$
|
39,868
|
|
|
|
|
|
|
|
|
|
|
|
|
|
|
|
A reconciliation of the statutory U.S. income tax rate and
the effective income tax rate, as computed on earnings before
income tax provision in each of the three years presented in the
Consolidated Statements of Operations, was as follows:
| |
|
|
|
|
|
|
|
|
|
|
|
|
|
|
|
Year Ended September 30,
|
|
|
|
|
2010
|
|
|
2009
|
|
|
2008
|
|
|
|
|
Statutory rate
|
|
|
35
|
%
|
|
|
35
|
%
|
|
|
35
|
%
|
|
State income taxes, net of federal benefit
|
|
|
3
|
|
|
|
3
|
|
|
|
3
|
|
|
International withholding tax
|
|
|
—
|
|
|
|
(1
|
)
|
|
|
—
|
|
|
Other permanent tax items
|
|
|
—
|
|
|
|
—
|
|
|
|
(1
|
)
|
|
Foreign rate differential
|
|
|
1
|
|
|
|
(1
|
)
|
|
|
(1
|
)
|
|
Domestic production activities deduction
|
|
|
(2
|
)
|
|
|
(2
|
)
|
|
|
(1
|
)
|
|
Foreign valuation allowance and other
|
|
|
7
|
|
|
|
—
|
|
|
|
—
|
|
|
|
|
|
|
|
|
|
|
|
|
|
|
|
|
Effective rate
|
|
|
44
|
%
|
|
|
34
|
%
|
|
|
35
|
%
|
|
|
|
|
|
|
|
|
|
|
|
|
|
|
Our provision for income taxes reflects an effective tax rate on
earnings before income taxes of 44% in fiscal year 2010 compared
to 34% and 35% in fiscal years 2009 and 2008, respectively. The
increase in the effective tax rate resulted from a valuation
allowance against deferred tax assets in Canada.
We have not recorded deferred income taxes on approximately
$20.0 million of undistributed earnings of our foreign
subsidiaries because of management’s intent to indefinitely
reinvest such earnings. Upon distribution of these earnings in
the form of dividends or otherwise, we may be subject to
U.S. income taxes and foreign withholding taxes. It is not
practical, however, to estimate the amount of taxes that may be
payable on the eventual remittance of these earnings.
52
POWELL
INDUSTRIES, INC. AND SUBSIDIARIES
NOTES TO
CONSOLIDATED FINANCIAL
STATEMENTS — (Continued)
We are subject to income tax in the United States, multiple
state jurisdictions and a few international jurisdictions,
primarily the United Kingdom and in Canada as of
December 15, 2009. For United States Federal income tax
purposes, all years prior to 2007 are closed. The Internal
Revenue Service (IRS) recently completed an examination of the
returns for the 2005 and 2006 tax years. No material adjustments
were identified during the examination. We do not consider any
state in which we do business to be a major tax jurisdiction. We
remain open to examination in the United Kingdom for tax years
2008 to the present.
The net deferred income tax asset (liability) was comprised of
the following (in thousands):
| |
|
|
|
|
|
|
|
|
|
|
|
September 30,
|
|
|
|
|
2010
|
|
|
2009
|
|
|
|
|
Current deferred income taxes:
|
|
|
|
|
|
|
|
|
|
Gross assets
|
|
$
|
8,057
|
|
|
$
|
9,457
|
|
|
Gross liabilities
|
|
|
(4,970
|
)
|
|
|
(6,154
|
)
|
|
|
|
|
|
|
|
|
|
|
|
Net current deferred income tax asset
|
|
|
3,087
|
|
|
|
3,303
|
|
|
|
|
|
|
|
|
|
|
|
|
Noncurrent deferred income taxes:
|
|
|
|
|
|
|
|
|
|
Gross assets
|
|
|
7,721
|
|
|
|
3,894
|
|
|
Gross liabilities
|
|
|
(5,634
|
)
|
|
|
(2,703
|
)
|
|
|
|
|
|
|
|
|
|
|
|
Net noncurrent deferred income tax asset
|
|
|
2,087
|
|
|
|
1,191
|
|
|
|
|
|
|
|
|
|
|
|
|
Net deferred income tax asset
|
|
$
|
5,174
|
|
|
$
|
4,494
|
|
|
|
|
|
|
|
|
|
|
|
At September 30, 2010 and 2009, the noncurrent deferred
income tax asset was included in other assets on the
Consolidated Balance Sheets.
The tax effect of temporary differences between GAAP accounting
and federal income tax accounting creating deferred income tax
assets and liabilities were as follows (in thousands):
| |
|
|
|
|
|
|
|
|
|
|
|
September 30,
|
|
|
|
|
2010
|
|
|
2009
|
|
|
|
|
Allowance for doubtful accounts
|
|
$
|
110
|
|
|
$
|
40
|
|
|
Workers’ compensation
|
|
|
200
|
|
|
|
388
|
|
|
Stock-based compensation
|
|
|
390
|
|
|
|
458
|
|
|
Reserve for accrued employee benefits
|
|
|
1,638
|
|
|
|
2,431
|
|
|
Warranty accrual
|
|
|
1,672
|
|
|
|
2,900
|
|
|
Uncompleted long-term contracts
|
|
|
(4,164
|
)
|
|
|
(6,155
|
)
|
|
Depreciation and amortization
|
|
|
1,291
|
|
|
|
(627
|
)
|
|
Deferred compensation
|
|
|
999
|
|
|
|
1,062
|
|
|
Postretirement benefits liability
|
|
|
350
|
|
|
|
396
|
|
|
Accrued legal
|
|
|
88
|
|
|
|
93
|
|
|
Uniform capitalization and inventory
|
|
|
3,813
|
|
|
|
3,495
|
|
|
Software development costs
|
|
|
(461
|
)
|
|
|
(488
|
)
|
|
Goodwill impairment
|
|
|
2,122
|
|
|
|
—
|
|
|
Net operating loss
|
|
|
903
|
|
|
|
—
|
|
|
Valuation allowance on foreign deferred tax assets
|
|
|
(3,729
|
)
|
|
|
—
|
|
|
Other
|
|
|
(48
|
)
|
|
|
501
|
|
|
|
|
|
|
|
|
|
|
|
|
Net deferred income tax asset
|
|
$
|
5,174
|
|
|
$
|
4,494
|
|
|
|
|
|
|
|
|
|
|
|
53
POWELL
INDUSTRIES, INC. AND SUBSIDIARIES
NOTES TO
CONSOLIDATED FINANCIAL
STATEMENTS — (Continued)
At September 30, 2010, we had approximately
$2.7 million of foreign net operating loss carryforward,
which is subject to a
20-year
carryforward. During the fourth quarter of the fiscal year ended
September 30, 2010, we recorded a valuation allowance of
$3.7 million against our Canadian deferred tax assets,
which we expect cannot be realized through future reversals of
existing taxable temporary differences and our estimate of
future taxable income. We believe that our deferred tax assets
in other tax jurisdictions are more likely than not realizable
through future reversals of existing taxable temporary
differences and our estimate of future taxable income.
In the first quarter of fiscal year 2008, we adopted accounting
guidance on the accounting for uncertainty in income taxes. Upon
adoption of the guidance, we recorded a $0.3 million
increase in our tax reserves, an offsetting decrease of
$0.2 million to retained earnings for uncertain tax
positions and an increase in deferred income tax assets of
$0.1 million. As of the adoption date, we had total tax
reserves of approximately $1.2 million. This reserve
includes an estimate of potential interest and penalties on
estimated liabilities for uncertain tax positions, which were
recorded as components of income tax expense, in the amount of
$135,000 as of September 30, 2010. A reconciliation of the
beginning and ending amount of the unrecognized tax benefits
follows (in thousands):
| |
|
|
|
|
|
Balance as of September 30, 2009
|
|
$
|
588
|
|
|
Increases related to tax positions taken during a prior period
|
|
|
331
|
|
|
Decreases related to expectations of statute of limitations
|
|
|
(78
|
)
|
|
|
|
|
|
|
|
Balance as of September 30, 2010
|
|
$
|
841
|
|
|
|
|
|
|
|
Our continuing policy is to recognize interest and penalties
related to income tax matters as tax expense. The amount of
interest and penalty expense recorded for the year ended
September 30, 2010, was not material.
There was no material change in the net amount of unrecognized
tax benefits in the year ended September 30, 2010.
Management believes that it is reasonably possible that within
the next 12 months, the total unrecognized tax benefits
will decrease by approximately 1% due to the expiration of
certain statutes of limitations in various state and local
jurisdictions.
Management believes that an adequate provision has been made for
any adjustments that may result from tax examinations. However,
the outcome of tax audits cannot be predicted with certainty. If
any issues addressed in our tax audits are resolved in a manner
not consistent with management’s expectations, we could be
required to adjust our provision for income tax in the period
such resolution occurs. Although timing of the resolution
and/or
closure of audits is highly uncertain, we do not believe it is
reasonably possible that our unrecognized tax benefits would
materially change in the next 12 months.
|
|
|
J.
|
Derivative
Instruments and Hedging Strategies
|
We operate in various countries and have operations in the
United Kingdom and Canada. These international operations expose
us to market risk associated with foreign currency exchange rate
fluctuations. We have entered into certain forward contracts to
hedge the risk of certain foreign currency rate fluctuations. To
the extent we choose to manage volatility associated with the
net exposures, we enter into various financial transactions
which we account for using the applicable accounting guidance
for derivative instruments and hedging activities. Our objective
is to hedge the variability in forecasted cash flow due to the
foreign currency risk associated with certain long-term sales.
As of September 30, 2010, we held only derivatives that
were designated as cash flow hedges related to the
U.S. Dollar/British Pound Sterling exchange rate.
In order for a derivative to qualify for hedge accounting, the
derivative must be formally designated as a hedge by documenting
the relationship between the derivative and the hedged item. The
documentation includes a description of the hedging instrument,
the hedge item, the risk being hedged, our risk management
objective and strategy for undertaking the hedge, the method for
assessing the effectiveness of the hedge and the method for
measuring hedge ineffectiveness. Additionally, the hedge
relationship must be expected to be highly effective at
offsetting changes in either the fair value or cash flows of the
hedged item at both inception of the hedge and on an
54
POWELL
INDUSTRIES, INC. AND SUBSIDIARIES
NOTES TO
CONSOLIDATED FINANCIAL
STATEMENTS — (Continued)
ongoing basis. We assess the ongoing effectiveness of our hedges
in accordance with the Cumulative Dollar-Offset Approach,
and measure and record hedge ineffectiveness at the end of
each fiscal quarter, as necessary.
All derivatives are recognized on the Consolidated Balance
Sheets at their fair value and classified based on the
instrument’s maturity date. The total notional amount of
outstanding derivatives as of September 30, 2010, was
approximately $1.5 million.
The following table presents the fair value of derivative
instruments included with the Consolidated Balance Sheets as of
September 30, 2010:
| |
|
|
|
|
|
|
|
|
|
|
|
|
|
|
|
Asset Derivatives
|
|
|
Liability Derivatives
|
|
|
|
|
|
|
Fair
|
|
|
|
|
Fair
|
|
|
|
|
Balance Sheet Location
|
|
Value
|
|
|
Balance Sheet Location
|
|
Value
|
|
|
|
|
(In thousands)
|
|
|
|
|
Derivatives designated as hedging instruments:
|
|
|
|
|
|
|
|
|
|
|
|
|
|
Foreign exchange forwards
|
|
Prepaid expenses and other current assets
|
|
$
|
—
|
|
|
Other accrued expenses
|
|
$
|
47
|
|
|
|
|
|
|
|
|
|
|
|
|
|
|
|
|
Total derivatives
|
|
|
|
$
|
—
|
|
|
|
|
$
|
47
|
|
|
|
|
|
|
|
|
|
|
|
|
|
|
|
The following table presents the fair value of derivative
instruments included with the Consolidated Balance Sheets as of
September 30, 2009:
| |
|
|
|
|
|
|
|
|
|
|
|
|
|
|
|
Asset Derivatives
|
|
|
Liability Derivatives
|
|
|
|
|
|
|
Fair
|
|
|
|
|
Fair
|
|
|
|
|
Balance Sheet Location
|
|
Value
|
|
|
Balance Sheet Location
|
|
Value
|
|
|
|
|
(In thousands)
|
|
|
|
|
Derivatives designated as hedging instruments:
|
|
|
|
|
|
|
|
|
|
|
|
|
|
Foreign exchange forwards
|
|
Prepaid expenses and other current assets
|
|
$
|
—
|
|
|
Other accrued expenses
|
|
$
|
752
|
|
|
Foreign exchange forwards
|
|
Deferred income taxes
|
|
|
164
|
|
|
Other liabilities
|
|
|
—
|
|
|
|
|
|
|
|
|
|
|
|
|
|
|
|
|
Total derivatives
|
|
|
|
$
|
164
|
|
|
|
|
$
|
752
|
|
|
|
|
|
|
|
|
|
|
|
|
|
|
|
The following table presents the amounts affecting the
Consolidated Statements of Operations for the year ended
September 30, 2010:
| |
|
|
|
|
|
|
|
|
|
|
|
|
|
|
|
|
|
|
Amount of Gain (Loss)
|
|
|
|
|
Amount of Gain (Loss)
|
|
|
|
|
Reclassified from
|
|
|
|
|
Recognized in Other
|
|
|
|
|
Accumulated Other
|
|
|
|
|
Comprehensive Income
|
|
|
Location of Gain (Loss)
|
|
Comprehensive Income
|
|
|
|
|
on Derivatives(1)
|
|
|
Reclassified from Accumulated
|
|
into Income(1)
|
|
|
|
|
Year Ended
|
|
|
Other Comprehensive
|
|
Year Ended
|
|
|
Derivatives Designated
|
|
September 30, 2010
|
|
|
Income into Income
|
|
September 30, 2010
|
|
|
|
|
Derivatives designated as cash flow hedges:
|
|
|
|
|
|
|
|
|
|
|
|
Foreign exchange forwards
|
|
$
|
757
|
|
|
Revenues
|
|
$
|
(89
|
)
|
|
|
|
|
|
|
|
|
|
|
|
|
|
Total designated cash flow hedges
|
|
$
|
757
|
|
|
|
|
$
|
(89
|
)
|
|
|
|
|
|
|
|
|
|
|
|
|
|
|
|
|
(1) |
|
For the year ended September 30, 2010, we recorded in other
(income) expense an immaterial amount of ineffectiveness from
cash flow hedges. |
55
POWELL
INDUSTRIES, INC. AND SUBSIDIARIES
NOTES TO
CONSOLIDATED FINANCIAL
STATEMENTS — (Continued)
The following table presents the amounts affecting the
Consolidated Statements of Operations for the year ended
September 30, 2009:
| |
|
|
|
|
|
|
|
|
|
|
|
|
|
|
|
|
|
|
Amount of Gain (Loss)
|
|
|
|
|
Amount of Gain (Loss)
|
|
|
|
|
Reclassified from
|
|
|
|
|
Recognized in Other
|
|
|
|
|
Accumulated Other
|
|
|
|
|
Comprehensive Income
|
|
|
Location of Gain (Loss)
|
|
Comprehensive Income
|
|
|
|
|
on Derivatives(1)
|
|
|
Reclassified from Accumulated
|
|
into Income(1)
|
|
|
|
|
Year Ended
|
|
|
Other Comprehensive
|
|
Year Ended
|
|
|
Derivatives Designated
|
|
September 30, 2009
|
|
|
Income into Income
|
|
September 30, 2009
|
|
|
|
|
Derivatives designated as cash flow hedges:
|
|
|
|
|
|
|
|
|
|
|
|
Foreign exchange forwards
|
|
$
|
(467
|
)
|
|
Revenues
|
|
$
|
22
|
|
|
|
|
|
|
|
|
|
|
|
|
|
|
Total designated cash flow hedges
|
|
$
|
(467
|
)
|
|
|
|
$
|
22
|
|
|
|
|
|
|
|
|
|
|
|
|
|
|
|
|
|
(1) |
|
For the year ended September 30, 2009, we recorded in other
(income) expense an immaterial amount of ineffectiveness from
cash flow hedges. |
Refer to Note C for a description of how the above
financial instruments are valued in accordance with the fair
value measurement accounting guidance for the year ended
September 30, 2010.
Cash
Flow Hedges
The purpose of our foreign currency hedging activities is to
protect us from the risk that the eventual cash flows resulting
from transactions that are denominated in currencies other than
the U.S. Dollar will be adversely affected by changes in
exchange rates. We are currently hedging our exposure to the
reduction in value of forecasted foreign currency cash flows
through foreign currency forward agreements through
August 15, 2011, for transactions denominated in the
British Pound Sterling.
All changes in the fair value of outstanding cash flow hedge
derivatives, except the ineffective portion, are recorded in
accumulated other comprehensive income, until net income is
affected by the variability of cash flows of the hedged
transaction, or until it is probable that the forecasted
transaction will not occur. In most cases, amounts recorded in
accumulated other comprehensive income will be released to net
income some time after the maturity of the related derivative.
The Consolidated Statements of Operations’ classification
of effective hedge results is the same as that of the underlying
exposure. Results of hedges of revenue and product costs are
recorded in revenue and costs of sales, respectively, when the
underlying hedged transaction affects net income. Results of
hedges of selling and administrative expense are recorded
together with those costs when the related expense is recorded.
In addition, any ineffective portion of the changes in the fair
value of the derivatives designated as cash flow hedges are
reported in the Consolidated Statements of Operations as the
changes occur.
As of September 30, 2010, approximately $11,000 of deferred
net losses (net of tax) on outstanding derivatives recorded in
accumulated other comprehensive income are expected to be
reclassified to net income during the next 12 months as a
result of underlying hedged transactions being recorded in net
income. Actual amounts ultimately reclassified to net income are
dependent on the exchange rates in effect when the derivative
contracts that are currently outstanding mature. As of
September 30, 2010, the maximum term over which we are
hedging exposure to the variability of cash flows for our
forecasted and recorded transactions is 11 months.
We formally assess both at a hedge’s inception and on an
ongoing basis, whether the derivatives that are used in the
hedging transaction have been highly effective in offsetting
changes in the cash flows of hedged items and whether those
derivatives may be expected to remain highly effective in future
periods. Effectiveness for cash flow hedges is assessed based on
forward rates.
We discontinue hedge accounting prospectively when (1) we
determine that the derivative is no longer highly effective in
offsetting changes in the cash flows of a hedged item (including
hedged items such as firm commitments or forecasted
transactions); (2) the derivative expires or is sold,
terminated or exercised; (3) it is no longer probable
56
POWELL
INDUSTRIES, INC. AND SUBSIDIARIES
NOTES TO
CONSOLIDATED FINANCIAL
STATEMENTS — (Continued)
that the forecasted transaction will occur or
(4) management determines that designating the derivative
as a hedging instrument is no longer appropriate.
When we discontinue hedge accounting because it is no longer
probable that the forecasted transaction will occur in the
originally expected period, the gain or loss on the derivative
remains in accumulated other comprehensive income and is
reclassified to net income when the forecasted transaction
affects net income. However, if it is probable that a forecasted
transaction will not occur by the end of the originally
specified time period or within an additional two-month period
of time thereafter, the gains and losses that were accumulated
in other comprehensive income will be recognized immediately in
net income. In all situations in which hedge accounting is
discontinued and the derivative remains outstanding, we will
carry the derivative at its fair value on the balance sheet,
recognizing future changes in the fair value in selling, general
and administrative expense. For the year ended
September 30, 2010, we recorded in selling, general and
administrative expense an immaterial amount of ineffectiveness
from cash flow hedges.
Credit
Risk
We are exposed to credit-related losses in the event of
non-performance by counterparties to hedging instruments.
Recently, the ability of financial counterparties to perform
under financial instruments has become less certain. We attempt
to take into account the financial viability of counterparties
in both valuing the instruments and determining their
effectiveness as hedging instruments. If a counterparty was
unable to perform, our ability to qualify for hedging certain
transactions would be compromised and the realizable value of
the financial instruments would be uncertain. As a result, our
results of operations and cash flows would be impacted.
|
|
|
K.
|
Employee
Benefit Plans
|
401(k)
Plan
We have a defined employee contribution 401(k) plan for
substantially all of our employees. We match 100% of employee
contributions up to an employee contribution of 4% of each
employee’s salary. We recognized expenses of
$2.9 million, $3.0 million and $2.2 million in
fiscal years 2010, 2009 and 2008, respectively, under this plan
primarily related to matching contributions.
Employee
Stock Ownership Plan
We had an employee stock ownership plan (ESOP) which initially
purchased 793,525 shares of the Company’s common stock
from a major stockholder. The funding for this plan was provided
through a loan from the Company of $4.5 million in 1992.
This loan was repaid by the ESOP as of September 30, 2009.
The Company has no current plans to contribute additional shares
to the ESOP and has transferred the employees’ shares in
the ESOP to their respective 401(k) plan and terminated the ESOP
during fiscal year 2010.
Deferred
Compensation
We offer an unfunded, non-qualified deferred compensation plan
to a select group of management and highly compensated
individuals. The plan permits the deferral of up to 50% of a
participant’s base salary
and/or 100%
of a participant’s annual incentive bonus. The deferrals
are held in a separate trust, which has been established to
administer the plan. The assets of the trust are subject to the
claims of our creditors in the event that we become insolvent.
Consequently, the trust qualifies as a grantor trust for income
tax purposes (a Rabbi Trust). The assets and liabilities of the
plan are recorded in other assets and deferred compensation in
the accompanying Consolidated Balance Sheets, respectively.
Changes in the deferred compensation balance are charged to
compensation expense. The plan is not qualified under
Section 401 of the Internal Revenue code. There was no
compensation expense related to this plan in fiscal year 2010.
Total assets held by the trustee and deferred compensation
liabilities were $1.6 million at September 30, 2010.
57
POWELL
INDUSTRIES, INC. AND SUBSIDIARIES
NOTES TO
CONSOLIDATED FINANCIAL
STATEMENTS — (Continued)
Certain executives were provided an executive benefit plan which
provides for fixed payments upon normal retirement on or after
age 65 and the completion of at least 10 years of
continuous employment. The estimated present value of these
payments were accrued over the service life of these
individuals, and $1.2 million is recorded in deferred
compensation in the accompanying Consolidated Balance Sheets
related to this executive benefit plan. To assist in funding the
deferred compensation liability, we have invested in
corporate-owned life insurance policies. The cash surrender
value of these policies is presented in other assets in the
accompanying Consolidated Balance Sheets. The cash surrender
value of life insurance policies was $3.8 million at
September 30, 2010.
Retiree
Medical Plan
We have a plan to extend to retirees health benefits which are
available to active employees under our existing health plans.
This plan is unfunded. The plan provides coverage for employees
with at least 10 years of service, age 55 or older but
less than 65, who retire on or after January 1, 2000. The
retiree is required to pay the COBRA rate less a subsidy
provided by us based on years of service at the time of
retirement.
For the year ended September 30, 2010, the measurement of
postretirement benefit expense was based on assumptions used to
value the postretirement benefit liability as of October 1,
2009, our measurement date.
Amounts recognized in accumulated other comprehensive income as
of September 30, 2010 and 2009, consisted of the following
on a pretax basis (in thousands):
| |
|
|
|
|
|
|
|
|
|
|
|
September 30,
|
|
|
|
|
2010
|
|
|
2009
|
|
|
|
|
Net actuarial gain
|
|
$
|
(1,113
|
)
|
|
$
|
(1,067
|
)
|
|
Prior service cost
|
|
|
167
|
|
|
|
282
|
|
|
|
|
|
|
|
|
|
|
|
|
Total recognized in accumulated other comprehensive income
|
|
$
|
(946
|
)
|
|
$
|
(785
|
)
|
|
|
|
|
|
|
|
|
|
|
Amounts in accumulated other comprehensive income as of
September 30, 2010, expected to be recognized as components
of net periodic postretirement benefit cost in 2011 were as
follows (in thousands):
| |
|
|
|
|
|
Net actuarial gain
|
|
$
|
(58
|
)
|
|
Prior service cost
|
|
|
116
|
|
|
|
|
|
|
|
|
Total
|
|
$
|
58
|
|
|
|
|
|
|
|
58
POWELL
INDUSTRIES, INC. AND SUBSIDIARIES
NOTES TO
CONSOLIDATED FINANCIAL
STATEMENTS — (Continued)
The following table illustrates the changes in accumulated
postretirement benefit obligation, changes in fair value of
assets and the funded status of the postretirement benefit plan
(in thousands):
| |
|
|
|
|
|
|
|
|
|
|
|
September 30,
|
|
|
|
|
2010
|
|
|
2009
|
|
|
|
|
Changes in postretirement benefit obligation:
|
|
|
|
|
|
|
|
|
|
Balance at beginning of year
|
|
$
|
741
|
|
|
$
|
807
|
|
|
Service cost
|
|
|
33
|
|
|
|
60
|
|
|
Interest cost
|
|
|
39
|
|
|
|
59
|
|
|
Actuarial loss (gain)
|
|
|
(95
|
)
|
|
|
(147
|
)
|
|
Benefits paid
|
|
|
(55
|
)
|
|
|
(38
|
)
|
|
|
|
|
|
|
|
|
|
|
|
Balance at end of year
|
|
$
|
663
|
|
|
$
|
741
|
|
|
|
|
|
|
|
|
|
|
|
|
Change in plan assets:
|
|
|
|
|
|
|
|
|
|
Fair value of assets at beginning of year
|
|
$
|
—
|
|
|
$
|
—
|
|
|
Employer contributions
|
|
|
55
|
|
|
|
38
|
|
|
Benefits paid
|
|
|
(55
|
)
|
|
|
(38
|
)
|
|
|
|
|
|
|
|
|
|
|
|
Fair value of assets at end of year
|
|
$
|
—
|
|
|
$
|
—
|
|
|
|
|
|
|
|
|
|
|
|
|
Reconciliation of funded status:
|
|
|
|
|
|
|
|
|
|
Unfunded liability
|
|
$
|
(663
|
)
|
|
$
|
(741
|
)
|
|
Unrecognized prior service cost
|
|
|
167
|
|
|
|
282
|
|
|
Unrecognized net actuarial gain
|
|
|
(1,113
|
)
|
|
|
(1,067
|
)
|
|
|
|
|
|
|
|
|
|
|
|
Net liability recognized
|
|
$
|
(1,609
|
)
|
|
$
|
(1,526
|
)
|
|
|
|
|
|
|
|
|
|
|
| |
|
|
|
|
|
|
|
|
|
|
|
2010
|
|
2009
|
|
|
|
Weighted-average assumptions used to determine benefit
obligations at September 30:
|
|
|
|
|
|
|
|
|
|
Discount rate pre-retirement
|
|
|
0.00
|
%
|
|
|
0.00
|
%
|
|
Discount rate post-retirement
|
|
|
4.56
|
|
|
|
5.45
|
|
|
Current year trend rate
|
|
|
9.00
|
|
|
|
9.00
|
|
|
Ultimate trend rate
|
|
|
5.00
|
|
|
|
5.00
|
|
|
Year ultimate trend rate reached
|
|
|
2013
|
|
|
|
2012
|
|
If the medical care cost trend rate assumptions were increased
or decreased by 1% as of September 30, 2010, the effect of
this change on the accumulated postretirement benefit obligation
and service and interest costs would be an increase of
approximately $28,000 and $5,000 or a decrease of approximately
$25,000 and $4,000, respectively.
| |
|
|
|
|
|
|
|
|
|
|
|
|
|
|
|
Year Ended September 30,
|
|
|
|
|
2010
|
|
|
2009
|
|
|
2008
|
|
|
|
|
Components of net periodic postretirement benefit cost:
|
|
|
|
|
|
|
|
|
|
|
|
|
|
Service cost
|
|
$
|
33
|
|
|
$
|
60
|
|
|
$
|
52
|
|
|
Interest cost
|
|
|
39
|
|
|
|
59
|
|
|
|
49
|
|
|
Prior service cost
|
|
|
115
|
|
|
|
115
|
|
|
|
115
|
|
|
Net gain recognized
|
|
|
(49
|
)
|
|
|
(75
|
)
|
|
|
(79
|
)
|
|
|
|
|
|
|
|
|
|
|
|
|
|
|
|
Net periodic postretirement benefit cost
|
|
$
|
138
|
|
|
$
|
159
|
|
|
$
|
137
|
|
|
|
|
|
|
|
|
|
|
|
|
|
|
|
59
POWELL
INDUSTRIES, INC. AND SUBSIDIARIES
NOTES TO
CONSOLIDATED FINANCIAL
STATEMENTS — (Continued)
| |
|
|
|
|
|
|
|
|
|
|
|
2010
|
|
2009
|
|
|
|
Weighted-average assumptions used to determine benefit costs at
September 30:
|
|
|
|
|
|
|
|
|
|
Discount rate pre-retirement
|
|
|
0.00
|
%
|
|
|
0.00
|
%
|
|
Discount rate post-retirement
|
|
|
5.45
|
|
|
|
7.45
|
|
|
Current year trend rate
|
|
|
9.00
|
|
|
|
9.00
|
|
|
Ultimate trend rate
|
|
|
5.00
|
|
|
|
5.00
|
|
|
Year ultimate trend rate reached
|
|
|
2012
|
|
|
|
2011
|
|
Future expected benefit payments as of September 30, 2010,
related to postretirement benefits for the subsequent five years
were as follows (in thousands):
| |
|
|
|
|
|
|
|
Expected
|
|
|
|
Benefit
|
|
Year Ending September 30,
|
|
Payments
|
|
|
|
2011
|
|
$
|
62
|
|
|
2012
|
|
|
68
|
|
|
2013
|
|
|
58
|
|
|
2014
|
|
|
65
|
|
|
2015
|
|
|
55
|
|
|
2016 through 2020
|
|
|
284
|
|
|
|
|
L.
|
Commitments
and Contingencies
|
Long-Term
Debt
See Note H herein for discussion of our long-term debt.
Leases
We lease certain offices, facilities and equipment under
operating leases expiring at various dates through 2017. At
September 30, 2010, the minimum annual rental commitments
under leases having terms in excess of one year were as follows
(in thousands):
| |
|
|
|
|
|
|
|
Operating
|
|
|
Years Ending September 30,
|
|
Leases
|
|
|
|
|
2011
|
|
$
|
3,362
|
|
|
2012
|
|
|
3,014
|
|
|
2013
|
|
|
1,988
|
|
|
2014
|
|
|
728
|
|
|
2015
|
|
|
1
|
|
|
Thereafter
|
|
|
1
|
|
|
|
|
|
|
|
|
Total lease commitments
|
|
$
|
9,094
|
|
|
|
|
|
|
|
Lease expense for all operating leases was $3.3 million,
$3.1 million and $2.7 million for fiscal years 2010,
2009 and 2008, respectively.
60
POWELL
INDUSTRIES, INC. AND SUBSIDIARIES
NOTES TO
CONSOLIDATED FINANCIAL
STATEMENTS — (Continued)
Letters
of Credit and Bonds
Certain customers require us to post bank letter of credit
guarantees or performance bonds issued by a surety. These
guarantees and performance bonds assure that we will perform
under the terms of our contract. In the event of default, the
counterparty may demand payment from the bank under a letter of
credit or performance by the surety under a performance bond. To
date, there have been no significant expenses related to either
for the periods reported. We were contingently liable for
secured and unsecured letters of credit of $15.2 million as
of September 30, 2010. We also had performance and
maintenance bonds totaling approximately $185.3 million
that were outstanding, with additional bonding capacity of
approximately $114.7 million available, at
September 30, 2010.
In March 2007, we renewed and amended our facility agreement
(Facility Agreement) between S&I and a large international
bank. The Facility Agreement provides S&I with
1) approximately $15.8 million in bonds;
2) approximately $4.0 million of forward exchange
contracts and currency options and 3) the ability to issue
bonds and enter into forward exchange contracts and currency
options. At September 30, 2010, we had outstanding a total
of approximately $3.0 million of contingent obligations
under this Facility Agreement.
The Facility Agreement is secured by a guarantee from Powell.
The Facility Agreement’s principal financial covenants are
the same as those discussed in Note H for the Amended
Credit Facility. The Facility Agreement provides for customary
events of default and carries cross-default provisions with our
Amended Credit Facility. If an event of default (as defined in
the Facility Agreement) occurs and is continuing, on the terms
and subject to the conditions set forth in the Facility
Agreement, obligations outstanding under the Facility Agreement
may be accelerated and may become or be declared immediately due
and payable.
Litigation
We are involved in various legal proceedings, claims and other
disputes arising in the ordinary course of business which, in
general, are subject to uncertainties and the outcomes are not
predictable. We do not believe that the ultimate conclusion of
these disputes could materially affect our financial position or
results of operations.
|
|
|
M.
|
Stock-Based
Compensation
|
We have the following stock-based compensation plans:
We have a Restricted Stock Plan for the benefit of members of
the Board of Directors of the Company who, at the time of their
service, are not employees of the Company or any of its
affiliates. Subject to certain conditions and restrictions as
determined by the Compensation Committee of the Board of
Directors and proportionate adjustments in the event of stock
dividends, stock splits and similar corporate transactions, each
eligible director will receive 2,000 shares of restricted
stock annually in the third fiscal quarter. In fiscal 2010,
16,000 shares of restricted stock were issued at a price of
$28.95 per share. The maximum aggregate number of shares of
stock that may be issued under the Restricted Stock Plan is
150,000 and will consist of authorized but unissued or
reacquired shares of stock, or any combination thereof. The
restricted stock grants vest 50% per year over a two-year period
on each anniversary of the grant date. Unless terminated by the
Board, the Restricted Stock Plan will terminate at the close of
business on December 16, 2014, and no further grants shall
be made under the plan after such date. Awards granted before
such date shall continue to be subject to the terms and
conditions of the plan and the respective agreements pursuant to
which they were granted. The total number of shares of common
stock available under the plan was 66,379 as of
September 30, 2010.
The 2000 Non-Employee Stock Option Plan, as amended, previously
had been adopted for the benefit of members of the Board of
Directors of the Company who, at the time of their service, were
not employees of the Company or any of its affiliates. Following
the adoption of the Restricted Stock Plan described above, the
Compensation Committee ceased the use of this plan in making new
grants to directors. This plan will maintain its effectiveness
until all options have been exercised or have expired. The total
number of shares of our common stock available under this plan
was approximately 33,000 as of September 30, 2010. Stock
options granted to the
61
POWELL
INDUSTRIES, INC. AND SUBSIDIARIES
NOTES TO
CONSOLIDATED FINANCIAL
STATEMENTS — (Continued)
Directors under this plan were non-qualified and were granted at
an exercise price equal to the fair market value of the common
stock at the date of grant. Generally, options granted had
expiration terms of seven years from the date of grant and
vested in full one year from the grant date.
In September 2006, our Board of Directors adopted, and in
February 2007, our stockholders approved, the 2006 Equity
Compensation Plan (the 2006 Plan), which became retroactively
effective to September 29, 2006. Under the 2006 Plan, any
employee of the Company and its subsidiaries and consultants are
eligible to participate in the plan and receive awards. Awards
can take the form of options, stock appreciation rights, stock
awards and performance unit awards. The maximum aggregate number
of shares of stock that may be issued under the 2006 Plan is
750,000 shares. The total number of shares common stock
available under the plan was approximately 566,000 shares
as of September 30, 2010.
In October 2009, 10,000 shares of restricted stock were
issued to our President and Chief Executive Officer at a price
of $37.67 per share under the 2006 Plan. The restricted stock
grant vests 20% per year over a five-year period on each
anniversary of the grant date. Compensation expense is
recognized over the five-year vesting period based on the $37.67
price per share on the grant date.
In October 2007, October 2008 and October 2009, we granted
approximately 34,300, 32,900 and 34,700 restricted stock units
(RSUs), respectively, with a fair value of $37.89, $40.81 and
$38.36 per unit, respectively, to certain officers and key
employees. The RSUs vest over a three-year period from their
date of issuance. The fair value of the RSUs was based on the
closing price of our common stock as reported on the NASDAQ
Global Market (NASDAQ) on the grant dates. The actual amount of
the RSUs earned will be based on the cumulative earnings per
share as reported relative to established goals for the
three-year performance cycle which began October 1 of the year
granted, and ranges from 0% to 150% of the target RSUs granted.
At September 30, 2010, there were approximately 87,500 RSUs
outstanding. The RSUs do not have voting rights of common stock,
and the shares of common stock underlying the RSUs are not
considered issued and outstanding until actually issued.
RSU activity (number of shares) for us was as follows:
| |
|
|
|
|
|
|
|
|
|
|
|
|
|
|
Weighted
|
|
|
|
|
Number of
|
|
|
Average
|
|
|
|
|
Restricted
|
|
|
Grant Date
|
|
|
|
|
Stock
|
|
|
Fair Value
|
|
|
|
|
Units
|
|
|
Per Share
|
|
|
|
|
Outstanding at September 30, 2007
|
|
|
106,706
|
|
|
|
31.86
|
|
|
Granted
|
|
|
31,353
|
|
|
|
37.68
|
|
|
Expired or cancelled
|
|
|
(19,591
|
)
|
|
|
31.86
|
|
|
Vested/exercised
|
|
|
—
|
|
|
|
—
|
|
|
|
|
|
|
|
|
|
|
|
|
Outstanding at September 30, 2008
|
|
|
118,468
|
|
|
|
33.40
|
|
|
Granted
|
|
|
32,911
|
|
|
|
40.48
|
|
|
Expired or cancelled
|
|
|
(23,230
|
)
|
|
|
34.92
|
|
|
Vested/exercised
|
|
|
(33,560
|
)
|
|
|
31.86
|
|
|
|
|
|
|
|
|
|
|
|
|
Outstanding at September 30, 2009
|
|
|
94,589
|
|
|
|
36.04
|
|
|
Granted
|
|
|
34,688
|
|
|
|
38.36
|
|
|
Expired or cancelled
|
|
|
—
|
|
|
|
—
|
|
|
Vested/exercised
|
|
|
(41,823
|
)
|
|
|
31.86
|
|
|
|
|
|
|
|
|
|
|
|
|
Outstanding at September 30, 2010
|
|
|
87,454
|
|
|
|
38.96
|
|
|
|
|
|
|
|
|
|
|
|
A total of approximately 566,000 shares of our common stock
are available for issuance under the 2006 Plan at
September 31, 2010.
62
POWELL
INDUSTRIES, INC. AND SUBSIDIARIES
NOTES TO
CONSOLIDATED FINANCIAL
STATEMENTS — (Continued)
We recorded compensation expense of approximately
$1.3 million, $1.7 million and $2.3 million
related to RSUs for the years ended September 30, 2010,
2009 and 2008, respectively.
The 1992 Stock Option Plan, as amended (the 1992 Plan), permits
us to grant to key employees non-qualified options and stock
grants, subject to certain conditions and restrictions as
determined by the Compensation Committee of the Board of
Directors and proportionate adjustments in the event of stock
dividends, stock splits and similar corporate transactions. The
maximum number of shares that may be issued under the 1992 Plan
is 2.7 million shares. Stock options are granted at an
exercise price equal to the fair market value of the common
stock on the date of the grant. Generally, options granted have
an expiration date of seven years from the grant date and vest
in increments of 20% per year over a five-year period. Pursuant
to the 1992 Plan, option holders who exercise their options and
hold the underlying shares of common stock for five years, vest
in a stock grant equal to 20% of the original option shares.
While restricted until the expiration of five years, the stock
grant is considered issued at the date of the stock option
exercise and is included in earnings per share. There have been
no stock options granted since July 2005. There were
approximately 470,000 shares available to be granted under
this plan as of September 30, 2010. During fiscal year
2010, approximately 40,000 shares of restricted stock were
issued to option holders who met specified requirements under
the 1992 Plan. There were no restricted stock grants under the
1992 Plan during fiscal years 2009 and 2008.
Stock option activity (number of shares) for us was as follows:
| |
|
|
|
|
|
|
|
|
|
|
|
|
|
|
|
|
|
|
|
|
|
|
|
|
|
Remaining
|
|
|
|
|
|
|
|
|
|
|
Weighted
|
|
|
Weighted
|
|
|
|
|
|
|
|
|
|
|
Average
|
|
|
Average
|
|
|
Aggregate
|
|
|
|
|
Stock
|
|
|
Exercise
|
|
|
Contractual
|
|
|
Intrinsic
|
|
|
|
|
Options
|
|
|
Price
|
|
|
Term (Years)
|
|
|
Value
|
|
|
|
|
|
|
|
|
|
|
|
|
|
(In thousands)
|
|
|
|
|
Outstanding at September 30, 2007
|
|
|
505,450
|
|
|
|
17.44
|
|
|
|
|
|
|
|
|
|
|
Granted
|
|
|
—
|
|
|
|
—
|
|
|
|
|
|
|
|
|
|
|
Exercised
|
|
|
(235,350
|
)
|
|
|
17.79
|
|
|
|
|
|
|
|
|
|
|
Forfeited
|
|
|
(2,800
|
)
|
|
|
17.85
|
|
|
|
|
|
|
|
|
|
|
|
|
|
|
|
|
|
|
|
|
|
|
|
|
|
|
|
|
Outstanding at September 30, 2008
|
|
|
267,300
|
|
|
|
17.14
|
|
|
|
|
|
|
|
|
|
|
Granted
|
|
|
—
|
|
|
|
—
|
|
|
|
|
|
|
|
|
|
|
Exercised
|
|
|
(29,950
|
)
|
|
|
17.15
|
|
|
|
|
|
|
|
|
|
|
Forfeited
|
|
|
—
|
|
|
|
—
|
|
|
|
|
|
|
|
|
|
|
|
|
|
|
|
|
|
|
|
|
|
|
|
|
|
|
|
|
Outstanding at September 30, 2009
|
|
|
237,350
|
|
|
|
17.14
|
|
|
|
|
|
|
|
|
|
|
Granted
|
|
|
—
|
|
|
|
—
|
|
|
|
|
|
|
|
|
|
|
Exercised
|
|
|
(108,750
|
)
|
|
|
15.63
|
|
|
|
|
|
|
|
|
|
|
Forfeited
|
|
|
—
|
|
|
|
—
|
|
|
|
|
|
|
|
|
|
|
|
|
|
|
|
|
|
|
|
|
|
|
|
|
|
|
|
|
Outstanding at September 30, 2010
|
|
|
128,600
|
|
|
|
18.41
|
|
|
|
1.72
|
|
|
$
|
2,367
|
|
|
|
|
|
|
|
|
|
|
|
|
|
|
|
|
|
|
|
|
Exercisable at September 30, 2010
|
|
|
128,600
|
|
|
|
18.41
|
|
|
|
1.72
|
|
|
$
|
2,367
|
|
|
|
|
|
|
|
|
|
|
|
|
|
|
|
|
|
|
|
The following table summarizes information about stock options
outstanding as of September 30, 2010:
| |
|
|
|
|
|
|
|
|
|
|
|
|
|
|
|
|
|
|
|
|
|
Outstanding
|
|
|
Exercisable
|
|
|
|
|
|
|
|
Weighted
|
|
|
Weighted
|
|
|
|
|
|
Weighted
|
|
|
|
|
Number
|
|
|
Average
|
|
|
Average
|
|
|
Number
|
|
|
Average
|
|
Range of
|
|
Outstanding at
|
|
|
Remaining
|
|
|
Exercise
|
|
|
Exercisable at
|
|
|
Exercise
|
|
|
Exercise Prices
|
|
09/30/10
|
|
|
Contractual Life
|
|
|
Price
|
|
|
09/30/10
|
|
|
Price
|
|
|
|
|
16.30 - 18.44
|
|
|
128,600
|
|
|
|
1.72
|
|
|
$
|
18.41
|
|
|
|
128,600
|
|
|
$
|
18.41
|
|
|
|
|
|
|
|
|
|
|
|
|
|
|
|
|
|
|
|
|
|
|
|
|
Total Options
|
|
|
128,600
|
|
|
|
|
|
|
|
|
|
|
|
128,600
|
|
|
|
|
|
|
|
|
|
|
|
|
|
|
|
|
|
|
|
|
|
|
|
|
|
|
|
63
POWELL
INDUSTRIES, INC. AND SUBSIDIARIES
NOTES TO
CONSOLIDATED FINANCIAL
STATEMENTS — (Continued)
We manage our business through operating segments, which are
comprised of two reportable business segments: Electrical Power
Products and Process Control Systems. Electrical Power Products
includes equipment and systems for the distribution and control
of electrical energy. The operating results of Powell Canada are
included in our Electrical Power Products business segment from
December 16, 2009 and contributed $51.1 million of
revenue during fiscal year 2010. Process Control Systems
consists principally of instrumentation, computer controls,
communications and data management systems to control and manage
critical processes.
The table below reflects certain information relating to our
operations by business segment. All revenues represent sales
from unaffiliated customers. The accounting policies of the
business segments are the same as those described in the summary
of significant accounting policies. Corporate expenses are
allocated to the operating business segments primarily based on
revenues.
Detailed information regarding our business segments is shown
below (in thousands):
| |
|
|
|
|
|
|
|
|
|
|
|
|
|
|
|
Year Ended September 30,
|
|
|
|
|
2010
|
|
|
2009
|
|
|
2008
|
|
|
|
|
Revenues:
|
|
|
|
|
|
|
|
|
|
|
|
|
|
Electrical Power Products
|
|
$
|
524,236
|
|
|
$
|
637,845
|
|
|
$
|
611,470
|
|
|
Process Control Systems
|
|
|
26,456
|
|
|
|
28,006
|
|
|
|
27,234
|
|
|
|
|
|
|
|
|
|
|
|
|
|
|
|
|
Total
|
|
$
|
550,692
|
|
|
$
|
665,851
|
|
|
$
|
638,704
|
|
|
|
|
|
|
|
|
|
|
|
|
|
|
|
|
Gross profit:
|
|
|
|
|
|
|
|
|
|
|
|
|
|
Electrical Power Products
|
|
$
|
133,778
|
|
|
$
|
133,629
|
|
|
$
|
118,171
|
|
|
Process Control Systems
|
|
|
8,279
|
|
|
|
11,420
|
|
|
|
8,235
|
|
|
|
|
|
|
|
|
|
|
|
|
|
|
|
|
Total
|
|
$
|
142,057
|
|
|
$
|
145,049
|
|
|
$
|
126,406
|
|
|
|
|
|
|
|
|
|
|
|
|
|
|
|
|
Income (loss) before income taxes:
|
|
|
|
|
|
|
|
|
|
|
|
|
|
Electrical Power Products
|
|
$
|
44,557
|
|
|
$
|
56,700
|
|
|
$
|
38,241
|
|
|
Process Control Systems
|
|
|
504
|
|
|
|
3,959
|
|
|
|
1,627
|
|
|
|
|
|
|
|
|
|
|
|
|
|
|
|
|
Total
|
|
$
|
45,061
|
|
|
$
|
60,659
|
|
|
$
|
39,868
|
|
|
|
|
|
|
|
|
|
|
|
|
|
|
|
The Process Control Systems business segment benefitted from
revenues of $3.5 million and gross profit of
$2.8 million during fiscal year 2009, resulting from a
mediated settlement related to a previously completed contract
that was in dispute for several years.
Geographic
Information
Revenues are as follows (in thousands):
| |
|
|
|
|
|
|
|
|
|
|
|
|
|
|
|
Year Ended September 30,
|
|
|
|
|
2010
|
|
|
2009
|
|
|
2008
|
|
|
|
|
Europe (including former Soviet Union)
|
|
$
|
25,174
|
|
|
$
|
30,582
|
|
|
$
|
50,807
|
|
|
Far East
|
|
|
24,998
|
|
|
|
62,155
|
|
|
|
13,092
|
|
|
Middle East and Africa
|
|
|
25,880
|
|
|
|
28,405
|
|
|
|
55,960
|
|
|
North, Central and South America (excluding U.S.)
|
|
|
81,506
|
|
|
|
28,737
|
|
|
|
49,772
|
|
|
United States
|
|
|
393,134
|
|
|
|
515,972
|
|
|
|
469,073
|
|
|
|
|
|
|
|
|
|
|
|
|
|
|
|
|
Total revenues
|
|
$
|
550,692
|
|
|
$
|
665,851
|
|
|
$
|
638,704
|
|
|
|
|
|
|
|
|
|
|
|
|
|
|
|
64
POWELL
INDUSTRIES, INC. AND SUBSIDIARIES
NOTES TO
CONSOLIDATED FINANCIAL
STATEMENTS — (Continued)
The United States is the only country that accounted for more
than 10% of consolidated revenues in fiscal years 2010, 2009 or
2008.
| |
|
|
|
|
|
|
|
|
|
|
|
September 30,
|
|
|
|
|
2010
|
|
|
2009
|
|
|
|
|
Long-lived assets:
|
|
|
|
|
|
|
|
|
|
United States
|
|
$
|
50,211
|
|
|
$
|
53,503
|
|
|
United Kingdom
|
|
|
6,937
|
|
|
|
7,481
|
|
|
Canada
|
|
|
6,528
|
|
|
|
—
|
|
|
Other
|
|
|
—
|
|
|
|
52
|
|
|
|
|
|
|
|
|
|
|
|
|
Total
|
|
$
|
63,676
|
|
|
$
|
61,036
|
|
|
|
|
|
|
|
|
|
|
|
Long-lived assets consist of property, plant and equipment net
of accumulated depreciation.
|
|
|
O.
|
Quarterly
Results of Operations (Unaudited)
|
The table below sets forth the unaudited consolidated operating
results by fiscal quarter for the years ended September 30,
2010 and 2009 (in thousands, except per share data):
| |
|
|
|
|
|
|
|
|
|
|
|
|
|
|
|
|
|
|
|
|
|
|
|
2010 Quarters
|
|
|
|
First
|
|
Second
|
|
Third
|
|
Fourth
|
|
2010
|
|
|
|
Revenues
|
|
$
|
135,916
|
|
|
$
|
142,135
|
|
|
$
|
138,880
|
|
|
$
|
133,761
|
|
|
$
|
550,692
|
|
|
Gross profit
|
|
|
37,817
|
|
|
|
36,533
|
|
|
|
38,244
|
|
|
|
29,463
|
|
|
|
142,057
|
|
|
Net income (loss) attributable to Powell Industries, Inc.
|
|
|
9,644
|
|
|
|
9,860
|
|
|
|
10,286
|
|
|
|
(4,782
|
)
|
|
|
25,008
|
|
|
Basic earnings (loss) per share
|
|
|
0.84
|
|
|
|
0.86
|
|
|
|
0.89
|
|
|
|
(0.41
|
)
|
|
|
2.17
|
|
|
Diluted earnings (loss) per share
|
|
|
0.83
|
|
|
|
0.85
|
|
|
|
0.88
|
|
|
|
(0.41
|
)
|
|
|
2.14
|
|
| |
|
|
|
|
|
|
|
|
|
|
|
|
|
|
|
|
|
|
|
|
|
|
|
2009 Quarters
|
|
|
|
First
|
|
Second
|
|
Third
|
|
Fourth
|
|
2009
|
|
|
|
Revenues
|
|
$
|
170,489
|
|
|
$
|
164,099
|
|
|
$
|
165,942
|
|
|
$
|
165,321
|
|
|
$
|
665,851
|
|
|
Gross profit
|
|
|
34,502
|
|
|
|
33,844
|
|
|
|
41,107
|
|
|
|
35,596
|
|
|
|
145,049
|
|
|
Net income attributable to Powell Industries, Inc.
|
|
|
7,853
|
|
|
|
8,852
|
|
|
|
13,138
|
|
|
|
9,874
|
|
|
|
39,717
|
|
|
Basic earnings per share
|
|
|
0.69
|
|
|
|
0.78
|
|
|
|
1.15
|
|
|
|
0.86
|
|
|
|
3.48
|
|
|
Diluted earnings per share
|
|
|
0.68
|
|
|
|
0.77
|
|
|
|
1.14
|
|
|
|
0.85
|
|
|
|
3.43
|
|
The sum of the individual earnings per share amounts may not
agree with
year-to-date
earnings per share as each period’s computation is based on
the weighted-average number of shares outstanding during the
period.
65
|
|
|
Item 9.
|
Changes
in and Disagreements with Accountants on Accounting and
Financial Disclosure
|
None.
|
|
|
Item 9A.
|
Controls
and Procedures
|
Evaluation
of Disclosure Controls and Procedures
We have established and maintain a system of disclosure controls
and procedures that are designed to provide reasonable assurance
that information required to be disclosed in our reports filed
with the Securities and Exchange Commission pursuant to the
Securities Exchange Act of 1934 is recorded, processed,
summarized and reported within the time periods specified in the
rules and forms of the Commission and that such information is
accumulated and communicated to our management, including our
Chief Executive Officer (CEO) and Chief Financial Officer (CFO),
as appropriate, to allow timely decisions regarding required
disclosures.
Management, with the participation of our CEO and CFO, has
evaluated the effectiveness of the design and operation of our
disclosure controls and procedures (as defined in
Rules 13a-15(e)
and
15d-15(e) of
the Securities Exchange Act of 1934, as amended) as of the end
of the period covered by this report. Based on such evaluation,
our CEO and CFO have each concluded that as of the end of the
period, our disclosure controls and procedures were effective to
provide reasonable assurance that information required to be
disclosed by us in reports that we file or submit under the
Securities Exchange Act of 1934, as amended, is recorded,
processed, summarized and reported within the time periods
specified in the Securities and Exchange Commission’s rules
and forms and that such information is accumulated and
communicated to our management, including the CEO and CFO, as
appropriate, to allow timely decisions regarding required
disclosures.
Management’s
Report on Internal Control Over Financial Reporting
Management is responsible for establishing and maintaining
adequate internal control over financial reporting as defined in
Rule 13a-15(f)
under the Securities and Exchange Act of 1934. Our internal
control system was designed to provide reasonable assurance
regarding the reliability of financial reporting and the
preparation of financial statements for external purposes in
accordance with generally accepted accounting principles. Due to
its inherent limitations, internal control over financial
reporting may not prevent or detect misstatements. Also,
projections of any evaluation of effectiveness to future periods
are subject to the risk that controls may become inadequate
because of changes in conditions, or that the degree of
compliance with the policies or procedures may deteriorate.
Management of the Company has assessed the effectiveness of our
internal control over financial reporting as of
September 30, 2010. Management evaluated the effectiveness
of internal control over financial reporting based on the
criteria in Internal Control — Integrated Framework
issued by the Committee of Sponsoring Organizations of the
Treadway Commission (COSO). Based on management’s
evaluation, management has concluded that internal control over
financial reporting was effective at the reasonable assurance
level as of September 30, 2010, based on criteria in
Internal Control — Integrated Framework issued by the
COSO.
The evaluation did not include an assessment of internal control
over financial reporting related to Powell Canada as it was
acquired in December 2009 in a purchase business combination.
Total revenues and total assets of Powell Canada represents 9%
and 10%, respectively, of the related consolidated financial
statement amounts as of and for the year ended
September 30, 2010 (see Note D to the Notes to
Consolidated Financial Statements).
PricewaterhouseCoopers LLP, an independent registered public
accounting firm, has audited and issued their report on the
effectiveness of our internal control over financial reporting
as of September 30, 2010, which appears in their report to
the financial statements included herein.
Changes
in Internal Control over Financial Reporting
There has been no change in our internal control over financial
reporting during the year ended September 30, 2010, that
has materially affected, or is reasonably likely to materially
affect, our internal control over financial reporting.
|
|
|
Item 9B.
|
Other
Information
|
None.
66
PART III
|
|
|
Item 10.
|
Directors,
Executive Officers and Corporate Governance
|
The information required by this item is incorporated in this
Annual Report by reference to our definitive proxy statement
pursuant to Regulation 14A, to be filed with the Securities
and Exchange Commission not later than 120 days after the
close of our fiscal year ended September 30, 2010.
We have adopted a Code of Business Conduct and Ethics that
applies to all employees, including our executive officers and
directors. A copy of our Code of Business Conduct and Ethics may
be obtained at the Investor Relations section of our website,
www.powellind.com, or by written request addressed to the
Secretary, Powell Industries, Inc., 8550 Mosley Drive, Houston,
Texas 77075. We will satisfy the requirements under
Item 5.05 of
Form 8-K
regarding disclosure of amendments to, or waivers from,
provisions of our code of ethics that apply to the chief
executive officer, chief financial officer or controller by
posting such information on our website.
|
|
|
Item 11.
|
Executive
Compensation
|
The information required by this item is incorporated in this
Annual Report by reference to our definitive proxy statement
pursuant to Regulation 14A, to be filed with the Securities
and Exchange Commission not later than 120 days after the
close of our fiscal year ended September 30, 2010.
|
|
|
Item 12.
|
Security
Ownership of Certain Beneficial Owners and Management and
Related Stockholder Matters
|
The information required by this item is incorporated in this
Annual Report by reference to our definitive proxy statement
pursuant to Regulation 14A, to be filed with the Securities
and Exchange Commission not later than 120 days after the
close of our fiscal year ended September 30, 2010.
|
|
|
Item 13.
|
Certain
Relationships and Related Transactions, and Director
Independence
|
The information required by this item is incorporated in this
Annual Report by reference to our definitive proxy statement
pursuant to Regulation 14A, to be filed with the Securities
and Exchange Commission not later than 120 days after the
close of our fiscal year ended September 30, 2010.
|
|
|
Item 14.
|
Principal
Accountant Fees and Services
|
The information required by this item is incorporated in this
Annual Report by reference to our definitive proxy statement
pursuant to Regulation 14A, to be filed with the Securities
and Exchange Commission not later than 120 days after the
close of our fiscal year ended September 30, 2010.
PART IV
|
|
|
Item 15.
|
Exhibits
and Financial Statement Schedules
|
1. Financial Statements. Reference is
made to the Index to Consolidated Financial Statements at
Item 8 of this Annual Report.
2. Financial Statement Schedule. All
schedules are omitted because they are not applicable or the
required information is shown in the financial statements or the
notes to the financial statements.
67
3. Exhibits.
| |
|
|
|
|
|
|
|
Number
|
|
|
|
Description of Exhibits
|
|
|
|
|
2
|
.4
|
|
—
|
|
Asset Purchase Agreement dated October 21, 2009 by and
among, Powell PowerComm Inc. (as a Buyer) and PowerComm Inc.,
Redhill Systems Ltd., Nextron Corporation, PCG Technical
Services Inc., and Concorde metal Manufacturing Ltd. (as
Sellers) (filed as Exhibit 2.1 to our
Form 8-K
filed October 27, 2009, and incorporated herein by
reference).
|
|
|
2
|
.5
|
|
—
|
|
Purchase Agreement dated October 21, 2009 by and among
Powell PowerComm KO Inc. (as a Buyer) and PowerComm Inc. (as a
Seller) (filed as Exhibit 2.2 to our
Form 8-K
filed October 27, 2009, and incorporated herein by
reference).
|
|
|
2
|
.6
|
|
—
|
|
Purchase Agreement dated October 21, 2009 by and among
Powell PowerComm Ventures Inc. (as a Buyer) and PowerComm Inc.
(as a Seller) (filed as Exhibit 2.3 to our
Form 8-K
filed October 27, 2009, and incorporated herein by
reference).
|
|
|
3
|
.1
|
|
—
|
|
Certificate of Incorporation of Powell Industries, Inc. filed
with the Secretary of State of the State of Delaware on
February 11, 2004 (filed as Exhibit 3.1 to our
Form 8-A/A
filed November 1, 2004, and incorporated herein by
reference).
|
|
|
3
|
.2
|
|
—
|
|
By-laws of Powell Industries, Inc. (filed as Exhibit 3.2 to
our
Form 8-A/A
filed November 1, 2004, and incorporated herein by
reference).
|
|
|
10
|
.1
|
|
—
|
|
Powell Industries, Inc., Incentive Compensation Plan (filed as
Exhibit 10.1 to our
Form 10-K
for the fiscal year ended October 31, 2003, and
incorporated herein by reference).
|
|
|
10
|
.2
|
|
—
|
|
Description of Supplemental Executive Benefit Plan (filed as
Exhibit 10 to our
Form 10-K
for the fiscal year ended October 31, 1984, and
incorporated herein by reference).
|
|
|
10
|
.3
|
|
—
|
|
1992 Powell Industries, Inc. Stock Option Plan (filed as an
exhibit to our preliminary proxy statement dated
January 24, 1992, and incorporated herein by reference).
|
|
|
10
|
.4
|
|
—
|
|
Amendment to 1992 Powell Industries, Inc. Stock Option Plan
(filed as Exhibit 10.8 to our
Form 10-Q
for the quarter ended April 30, 1996, and incorporated
herein by reference).
|
|
|
10
|
.5
|
|
—
|
|
Amendment to 1992 Powell Industries, Inc. Stock Option Plan (the
cover of the 1992 Powell Industries, Inc. Stock Option Plan has
been noted to reflect the increase in the number of shares
authorized for issuance under the Plan from 2,100,000 to
2,700,000, which increase was approved by the stockholders of
the Company at the 2005 Annual Meeting of Stockholders).
|
|
|
10
|
.6
|
|
—
|
|
Powell Industries, Inc. Directors’ Fees Program (filed as
Exhibit 10.7 to our
Form 10-K
for the fiscal year ended October 31, 1992, and
incorporated herein by reference).
|
|
|
10
|
.7
|
|
—
|
|
Powell Industries, Inc. Executive Severance Protection Plan
(filed as Exhibit 10.7 to our
Form 10-K
for the fiscal year ended October 31, 2002, and
incorporated herein by reference).
|
|
|
10
|
.8
|
|
—
|
|
Powell Industries, Inc. Non-Employee Directors Stock Option Plan
(filed as Exhibit 10.9 to our
Form 10-K
for the fiscal year ended October 31, 2002, and
incorporated herein by reference).
|
|
|
10
|
.9
|
|
—
|
|
Powell Industries, Inc. Deferred Compensation Plan (filed as
Exhibit 10.9 to our
Form 10-K
for the fiscal year ended October 31, 2002, and
incorporated herein by reference).
|
|
|
10
|
.10
|
|
—
|
|
Powell Industries, Inc. Non-Employee Director Restricted Stock
Plan (filed as Exhibit 10.10 to our
Form 10-K
for the fiscal year ended October 31, 2005, and
incorporated herein by reference).
|
|
|
10
|
.11
|
|
—
|
|
Amended Loan Agreement dated October 29, 2004, between
Powell Industries, Inc. and Bank of America, N.A. (filed as
Exhibit 10.10 to our
Form 10-K
for the fiscal year ended October 31, 2004, and
incorporated herein by reference).
|
|
|
10
|
.12
|
|
—
|
|
Credit and Reimbursement Agreement dated April 15, 2004,
between Powell Industries, Inc. and Bank of America, N.A. (filed
as Exhibit 10.11 to our
Form 10-K
for the fiscal year ended October 31, 2004, and
incorporated herein by reference).
|
|
|
10
|
.13
|
|
—
|
|
Credit Agreement dated June 29, 2005 among Powell
Industries, Inc., Inhoco 3210 Limited and Switchgear &
Instrumentation Properties Limited, and Bank of America and the
other lenders parties thereto (filed as Exhibit 10.1 to our
Form 8-K
filed July 6, 2005, and incorporated herein by reference).
|
|
|
10
|
.14
|
|
—
|
|
First Amendment to Credit Agreement dated November 7, 2005
among Powell Industries, Inc., Inhoco 3210 Limited (n/k/a
Switchgear & Instrumentation Limited),
Switchgear & Instrumentation Properties Limited, Bank
of America, N.A., and the other lenders parties thereto (filed
as Exhibit 10.14 to our
Form 10-K
for the fiscal year ended October 31, 2005, and
incorporated herein by reference).
|
68
| |
|
|
|
|
|
|
|
Number
|
|
|
|
Description of Exhibits
|
|
|
|
|
10
|
.15
|
|
—
|
|
Second Amendment to Credit Agreement dated January 11, 2006
among Powell Industries, Inc., Switchgear &
Instrumentation Limited, Switchgear & Instrumentation
Properties Limited, Bank of America, N.A., and the other lenders
parties thereto (filed as Exhibit 10.15 to our
Form 10-K
for the fiscal year ended October 31, 2005, and
incorporated herein by reference).
|
|
|
10
|
.16
|
|
—
|
|
Third Amendment to Credit Agreement dated August 4, 2006
among Powell Industries, Inc., Switchgear &
Instrumentation Limited, Switchgear & Instrumentation
Properties Limited, Bank of America, N.A., and the other lenders
parties thereto (filed as Exhibit 10.3 to our
Form 8-K
filed August 9, 2006, and incorporated herein by reference).
|
|
|
10
|
.17
|
|
—
|
|
Fourth Amendment to Credit Agreement dated December 7, 2006
among Powell Industries, Inc., Switchgear &
Instrumentation Limited, Switchgear & Instrumentation
Properties Limited, Bank of America, N.A., and the other lenders
parties thereto (filed as Exhibit 10.17 to our Transition
report on
Form 10-K
for the fiscal year ended September 30, 2006, and
incorporated herein by reference).
|
|
|
10
|
.18
|
|
—
|
|
Fifth Amendment to Credit Agreement, dated as of
December 4, 2007, among Powell Industries, Inc., as Parent,
the subsidiaries of Powell Industries, Inc. identified therein,
as Borrowers, Bank of America, N.A., as Administrative Agent,
Swing Line Lender and L/C Issuer, and the Lenders party thereto
(filed as Exhibit 10.1 to our Quarterly Report on
Form 10-Q
for the quarter ended December 31, 2007, and incorporated
herein by reference).
|
|
|
10
|
.19
|
|
—
|
|
Sixth Amendment to Credit Agreement, dated as of
December 14, 2007, among Powell Industries, Inc., as
Parent, the subsidiaries of Powell Industries, Inc. identified
therein, as Borrowers, Bank of America, N.A., as Administrative
Agent, Swing Line Lender and L/C issuer, and the Lenders party
thereto (filed as Exhibit 10.1 to our
Form 8-K
filed December 19, 2007, and incorporated herein by
reference).
|
|
|
10
|
.20
|
|
—
|
|
Banking facilities between HSBC Bank plc and
Switchgear & Instrumentation Limited and
Switchgear & Instrumentation Properties Limited dated
September 12, 2005 (filed as Exhibit 10.16 to our
Form 10-K
for the fiscal year ended October 31, 2005, and
incorporated herein by reference).
|
|
|
**10
|
.21
|
|
—
|
|
Powell Supply Agreement between the Company and General Electric
Company dated August 7, 2006 (filed as Exhibit 10.1 to
our
Form 8-K/A
filed June 16, 2008, and incorporated herein by reference).
|
|
|
10
|
.22
|
|
—
|
|
Lease Agreement between the Company and C&L Partnership,
Ltd. dated April 19, 2006 (filed as Exhibit 10.2 to
our
Form 8-K
filed August 9, 2006, and incorporated herein by reference).
|
|
|
10
|
.23
|
|
—
|
|
Consulting Agreement dated July 18, 2008 between the
Company and Thomas W. Powell (filed as Exhibit 10.1 to our
Form 8-K
filed July 24, 2008, and incorporated herein by reference).
|
|
|
10
|
.24
|
|
—
|
|
Seventh Amendment to Credit Agreement, dated as of
December 10, 2008, among Powell Industries, Inc., as
Parent, the subsidiaries of Powell Industries, Inc. identified
therein, as Borrowers, Bank of America, N.A., as Administrative
Agent, Swing Line Lender and L/C issuer, and the Lenders party
(filed as Exhibit 10.24 to our
form 10-K
for the fiscal year ended September 30, 2008, and
incorporated herein by reference).
|
|
|
10
|
.25
|
|
—
|
|
Powell Industries, Inc. 2006 Equity Compensation Plan (filed as
Appendix A to our definitive proxy statement dated
January 12, 2007, and incorporated herein by reference).
|
|
|
10
|
.26
|
|
—
|
|
Credit Agreement dated as of December 15, 2009, between
Powell PowerComm Inc., as Borrower, Powell Industries, Inc.,
Nextron Limited, PPC Technical Services Inc., as Guarantors, and
HSBC Bank Canada, as Lender (filed as Exhibit 10.1 to our
Form 8-K
filed on December 21, 2009, and incorporated herein by
reference).
|
|
|
*21
|
.1
|
|
—
|
|
Subsidiaries of Powell Industries, Inc.
|
|
|
*23
|
.2
|
|
—
|
|
Consent of PricewaterhouseCoopers, LLP.
|
|
|
*31
|
.1
|
|
—
|
|
Certification of Chief Executive Officer pursuant to
Rule 13a-14(a)/15d-14(a).
|
|
|
*31
|
.2
|
|
—
|
|
Certification of Chief Financial Officer pursuant to
Rule 13a-14(a)/15d-14(a).
|
|
|
*32
|
.1
|
|
—
|
|
Certification of Chief Executive Officer Pursuant to
Section 18 U.S.C. Section 1350, as Adopted
Pursuant to Section 906 of the Sarbanes-Oxley Act of 2002.
|
|
|
*32
|
.2
|
|
—
|
|
Certification of Chief Financial Officer Pursuant to
Section 18 U.S.C. Section 1350, as Adopted
Pursuant to Section 906 of the Sarbanes-Oxley Act of 2002.
|
|
|
|
|
* |
|
Filed herewith |
| |
|
** |
|
Portions of this exhibit have been omitted based on a request
for confidential treatment pursuant to
Rule 24b-2
of the Securities Exchange Act of 1934. Such omitted portions
have been filed separately with the Commission. |
69
SIGNATURES
Pursuant to the requirements of Section 13 or 15(d) of the
Securities Exchange Act of 1934, the Registrant has duly caused
this report to be signed on its behalf by the undersigned,
thereunto duly authorized.
POWELL INDUSTRIES, INC.
|
|
|
| |
By:
|
/s/ Patrick
L. McDonald
|
Patrick L. McDonald
President and Chief Executive Officer
(Principal Executive Officer)
Don R. Madison
Executive Vice President
Chief Financial and Administrative Officer
(Principal Financial and Accounting Officer)
Pursuant to the requirements of the Securities Exchange Act of
1934, this report has been signed below by the following persons
on behalf of the registrant in the capacities and on the date
indicated:
| |
|
|
|
|
|
Signature
|
|
Title
|
|
|
|
|
|
|
|
/s/ Thomas
W. Powell
Thomas
W. Powell
|
|
Chairman of the Board
|
|
|
|
|
|
/s/ Joseph
L. Becherer
Joseph
L. Becherer
|
|
Director
|
|
|
|
|
|
/s/ Eugene
L. Butler
Eugene
L. Butler
|
|
Director
|
|
|
|
|
|
/s/ James
F. Clark
James
F. Clark
|
|
Director
|
|
|
|
|
|
/s/ Christopher
E. Cragg
Christopher
E. Cragg
|
|
Director
|
|
|
|
|
|
/s/ Bonnie
V. Hancock
Bonnie
V. Hancock
|
|
Director
|
|
|
|
|
|
/s/ Stephen
W. Seale, Jr.
Stephen
W. Seale, Jr.
|
|
Director
|
|
|
|
|
|
/s/ Robert
C. Tranchon
Robert
C. Tranchon
|
|
Director
|
|
|
|
|
|
/s/ Ronald
J. Wolny
Ronald
J. Wolny
|
|
Director
|
Date: December 8, 2010
70
EXHIBIT INDEX
| |
|
|
|
|
|
|
|
Number
|
|
|
|
Exhibit Title
|
|
|
|
|
2
|
.4
|
|
—
|
|
Asset Purchase Agreement dated October 21, 2009 by and
among, Powell PowerComm Inc. (as a Buyer) and PowerComm Inc.,
Redhill Systems Ltd., Nextron Corporation, PCG Technical
Services Inc., and Concorde metal Manufacturing Ltd. (as
Sellers) (filed as Exhibit 2.1 to our
Form 8-K
filed October 27, 2009, and incorporated herein by
reference).
|
|
|
2
|
.5
|
|
—
|
|
Purchase Agreement dated October 21, 2009 by and among
Powell PowerComm KO Inc. (as a Buyer) and PowerComm Inc. (as a
Seller) (filed as Exhibit 2.2 to our
Form 8-K
filed October 27, 2009, and incorporated herein by
reference).
|
|
|
2
|
.6
|
|
—
|
|
Purchase Agreement dated October 21, 2009 by and among
Powell PowerComm Ventures Inc. (as a Buyer) and PowerComm Inc.
(as a Seller) (filed as Exhibit 2.3 to our
Form 8-K
filed October 27, 2009, and incorporated herein by
reference).
|
|
|
3
|
.1
|
|
—
|
|
Certificate of Incorporation of Powell Industries, Inc. filed
with the Secretary of State of the State of Delaware on
February 11, 2004 (filed as Exhibit 3.1 to our
Form 8-A/A
filed November 1, 2004, and incorporated herein by
reference).
|
|
|
3
|
.2
|
|
—
|
|
By-laws of Powell Industries, Inc. (filed as Exhibit 3.2 to
our
Form 8-A/A
filed November 1, 2004, and incorporated herein by
reference).
|
|
|
10
|
.1
|
|
—
|
|
Powell Industries, Inc., Incentive Compensation Plan (filed as
Exhibit 10.1 to our
Form 10-K
for the fiscal year ended October 31, 2003, and
incorporated herein by reference).
|
|
|
10
|
.2
|
|
—
|
|
Description of Supplemental Executive Benefit Plan (filed as
Exhibit 10 to our
Form 10-K
for the fiscal year ended October 31, 1984, and
incorporated herein by reference).
|
|
|
10
|
.3
|
|
—
|
|
1992 Powell Industries, Inc. Stock Option Plan (filed as an
exhibit to our preliminary proxy statement dated
January 24, 1992, and incorporated herein by reference).
|
|
|
10
|
.4
|
|
—
|
|
Amendment to 1992 Powell Industries, Inc. Stock Option Plan
(filed as Exhibit 10.8 to our
Form 10-Q
for the quarter ended April 30, 1996, and incorporated
herein by reference).
|
|
|
10
|
.5
|
|
—
|
|
Amendment to 1992 Powell Industries, Inc. Stock Option Plan (the
cover of the 1992 Powell Industries, Inc. Stock Option Plan has
been noted to reflect the increase in the number of shares
authorized for issuance under the Plan from 2,100,000 to
2,700,000, which increase was approved by the stockholders of
the Company at the 2005 Annual Meeting of Stockholders).
|
|
|
10
|
.6
|
|
—
|
|
Powell Industries, Inc. Directors’ Fees Program (filed as
Exhibit 10.7 to our
Form 10-K
for the fiscal year ended October 31, 1992, and
incorporated herein by reference).
|
|
|
10
|
.7
|
|
—
|
|
Powell Industries, Inc. Executive Severance Protection Plan
(filed as Exhibit 10.7 to our
Form 10-K
for the fiscal year ended October 31, 2002, and
incorporated herein by reference).
|
|
|
10
|
.8
|
|
—
|
|
Powell Industries, Inc. Non-Employee Directors Stock Option Plan
(filed as Exhibit 10.9 to our
Form 10-K
for the fiscal year ended October 31, 2002, and
incorporated herein by reference).
|
|
|
10
|
.9
|
|
—
|
|
Powell Industries, Inc. Deferred Compensation Plan (filed as
Exhibit 10.9 to our
Form 10-K
for the fiscal year ended October 31, 2002, and
incorporated herein by reference).
|
|
|
10
|
.10
|
|
—
|
|
Powell Industries, Inc. Non-Employee Director Restricted Stock
Plan (filed as Exhibit 10.10 to our
Form 10-K
for the fiscal year ended October 31, 2005, and
incorporated herein by reference).
|
|
|
10
|
.11
|
|
—
|
|
Amended Loan Agreement dated October 29, 2004, between
Powell Industries, Inc. and Bank of America, N.A. (filed as
Exhibit 10.10 to our
Form 10-K
for the fiscal year ended October 31, 2004, and
incorporated herein by reference).
|
|
|
10
|
.12
|
|
—
|
|
Credit and Reimbursement Agreement dated April 15, 2004,
between Powell Industries, Inc. and Bank of America, N.A. (filed
as Exhibit 10.11 to our
Form 10-K
for the fiscal year ended October 31, 2004, and
incorporated herein by reference).
|
|
|
10
|
.13
|
|
—
|
|
Credit Agreement dated June 29, 2005 among Powell
Industries, Inc., Inhoco 3210 Limited, and
Switchgear & Instrumentation Properties Limited, and
Bank of America and the other lenders parties thereto (filed as
Exhibit 10.1 to our
Form 8-K
filed July 6, 2005, and incorporated herein by reference).
|
|
|
10
|
.14
|
|
—
|
|
First Amendment to Credit Agreement dated November 7, 2005
among Powell Industries, Inc., Inhoco 3210 Limited (n/k/a
Switchgear & Instrumentation Limited.),
Switchgear & Instrumentation Properties Limited, Bank
of America, N.A., and the other lenders parties thereto (filed
as Exhibit 10.14 to our
Form 10-K
for the fiscal year ended October 31, 2005, and
incorporated herein by reference).
|
71
| |
|
|
|
|
|
|
|
Number
|
|
|
|
Exhibit Title
|
|
|
|
|
10
|
.15
|
|
—
|
|
Second Amendment to Credit Agreement dated January 11, 2006
among Powell Industries, Inc., Switchgear &
Instrumentation Limited, Switchgear & Instrumentation
Properties Limited, Bank of America, N.A., and the other lenders
parties thereto (filed as Exhibit 10.15 to our
Form 10-K
for the fiscal year ended October 31, 2005, and
incorporated herein by reference).
|
|
|
10
|
.16
|
|
—
|
|
Third Amendment to Credit Agreement dated August 4, 2006
among Powell Industries, Inc., Switchgear &
Instrumentation Limited, Switchgear & Instrumentation
Properties Limited, Bank of America, N.A., and the other lenders
parties thereto (filed as Exhibit 10.3 to our
Form 8-K
filed August 9, 2006, and incorporated herein by reference).
|
|
|
10
|
.17
|
|
—
|
|
Fourth Amendment to Credit Agreement dated December 7, 2006
among Powell Industries, Inc., Switchgear &
Instrumentation Limited, Switchgear & Instrumentation
Properties Limited, Bank of America, N.A., and the other lenders
parties thereto (filed as Exhibit 10.17 to our Transition
report on
Form 10-K
for the fiscal year ended September 30, 2006, and
incorporated herein by reference).
|
|
|
10
|
.18
|
|
—
|
|
Fifth Amendment to Credit Agreement, dated as of
December 4, 2007, among Powell Industries, Inc., as Parent,
the subsidiaries of Powell Industries, Inc. identified therein,
as Borrowers, Bank of America, N.A., as Administrative Agent,
Swing Line Lender and L/C Issuer, and the Lenders party thereto
(filed as Exhibit 10.1 to our Quarterly Report on
Form 10-Q
for the quarter ended December 31, 2007, and incorporated
herein by reference).
|
|
|
10
|
.19
|
|
—
|
|
Sixth Amendment to Credit Agreement, dated as of
December 14, 2007, among Powell Industries, Inc., as
Parent, the subsidiaries of Powell Industries, Inc. identified
therein, as Borrowers, Bank of America, N.A., as Administrative
Agent, Swing Line Lender and L/C Issuer, and the Lenders party
thereto (filed as Exhibit 10.1 to our
Form 8-K
filed December 19, 2007, and incorporated herein by
reference).
|
|
|
10
|
.20
|
|
—
|
|
Banking facilities between HSBC Bank plc and
Switchgear & Instrumentation Limited and
Switchgear & Instrumentation Properties Limited dated
September 12, 2006 (filed as Exhibit 10.16 to our
Form 10-K
for the fiscal year ended October 31, 2005, and
incorporated herein by reference).
|
|
|
**10
|
.21
|
|
—
|
|
Powell Supply Agreement between the Company and General Electric
Company dated August 7, 2006 (filed as Exhibit 10.1 to
our
Form 8-K/A
filed June 16, 2008, and incorporated herein by reference).
|
|
|
10
|
.22
|
|
—
|
|
Lease Agreement between the Company and C&L Partnership,
Ltd. dated April 19, 2006 (filed as Exhibit 10.2 to
our
Form 8-K
filed August 9, 2006, and incorporated herein by reference).
|
|
|
10
|
.23
|
|
—
|
|
Consulting Agreement dated July 18, 2008 between the
Company and Thomas W. Powell (filed as Exhibit 10.1 to our
Form 8-K
filed on July 24, 2008, and incorporated herein by
reference).
|
|
|
10
|
.24
|
|
—
|
|
Seventh Amendment to Credit Agreement, dated as of
December 10, 2008, among Powell Industries, Inc., as
Parent, the subsidiaries of Powell Industries, Inc. identified
therein, as Borrowers, Bank of America, N.A., as Administrative
Agent, Swing Line Lender and L/C issuer, and the Lenders party
(filed as Exhibit 10.24 to out
Form 10-K
for the fiscal year ended September 30, 2008, and
incorporated herein by reference).
|
|
|
10
|
.25
|
|
—
|
|
Powell Industries, Inc. 2006 Equity Compensation Plan (filed as
Appendix A to our definitive proxy statement dated
January 12, 2007, and incorporated herein by reference).
|
|
|
10
|
.26
|
|
—
|
|
Credit Agreement dated as of December 15, 2009, between
Powell PowerComm Inc., as Borrower, Powell Industries, Inc.,
Nextron Limited, PPC Technical Services Inc., as Guarantors, and
HSBC Bank Canada, as Lender (filed as Exhibit 10.1 to our
Form 8-K
filed on December 21, 2009, and incorporated herein by
reference).
|
|
|
*21
|
.1
|
|
—
|
|
Subsidiaries of Powell Industries, Inc.
|
|
|
*23
|
.2
|
|
—
|
|
Consent of PricewaterhouseCoopers, LLP.
|
|
|
*31
|
.1
|
|
—
|
|
Certification of Chief Executive Officer pursuant to
Rule 13a-14(a)/15d-14(a).
|
|
|
*31
|
.2
|
|
—
|
|
Certification of Chief Financial Officer pursuant to
Rule 13a-14(a)/15d-14(a).
|
|
|
*32
|
.1
|
|
—
|
|
Certification of Chief Executive Officer Pursuant to
Section 18 U.S.C. Section 1350, as Adopted
Pursuant to Section 906 of the Sarbanes-Oxley Act of 2002.
|
|
|
*32
|
.2
|
|
—
|
|
Certification of Chief Financial Officer Pursuant to
Section 18 U.S.C. Section 1350, as Adopted
Pursuant to Section 906 of the Sarbanes-Oxley Act of 2002.
|
|
|
|
|
* |
|
Filed herewith |
| |
|
** |
|
Portions of this exhibit have been omitted based on a request
for confidential treatment pursuant to
Rule 24b-2
of the Securities Exchange Act of 1934. Such omitted portions
have been filed separately with the Commission. |
72