Attached files
| file | filename |
|---|---|
| 8-K - 8-K - OVERSEAS SHIPHOLDING GROUP INC | v454469_8k.htm |
Exhibit 99.1

December 6, 2016 Overseas Shipholding Group Investor Day

1 Disclaimer Forward - Looking Statements During the course of this presentation, the Company (Overseas Shipholding Group, Inc.) may make forward - looking statements or provide forward - looking information. All statements other than statements of historical facts should be considered forward - looki ng statements, including but not limited to statements regarding the effect of the Company’s spin - off of International Seaways, Inc . and any related matters such as expected operating efficiencies and cost reductions. Some of these statements include words such as ‘‘outlook,’’ ‘‘believe,’’ ‘‘expect,’’ ‘‘potential,’’ ‘‘continue,’’ ‘‘may,’’ ‘‘will,’’ ‘‘should,’’ ‘‘could,’’ ‘‘seek,’’ ‘‘pred ict ,’’ ‘‘intend,’’ ‘‘plan,’’ ‘‘estimate,’’ ‘‘anticipate,’’ ‘‘target,’’ ‘‘project,’’ ‘‘forecast,’’ ‘‘shall,’’ ‘‘contemplate’’ or the negative version of those words or o the r comparable words. Although they reflect OSG’s current expectations, these statements are not guarantees of future performance, but involve a nu mbe r of risks, uncertainties, and assumptions which are difficult to predict. Some of the factors that may cause actual outcomes a nd results to differ materially from those expressed in, or implied by, the forward - looking statements include, but are not necessa rily limited to, general economic conditions, competitive pressures, the nature of the Company’s services and their price movement s, and the ability to retain key employees. The Company does not undertake to update any forward - looking statements as a result of futu re developments, new information or otherwise. Non - GAAP Financial Measures Included in this presentation are certain non - GAAP financial measures, including Time Charter Equivalent (“TCE”) revenue, EBITDA , Adjusted EBITDA, and total leverage ratios, designed to complement the financial information presented in accordance with generally accepted accounting principles in the United States of America because management believes such measures are useful to investors. TCE revenues, which represents shipping revenues less voyage expenses, is a measure to compare revenue generated from a voyage charter to revenue generated from a time charter. EBITDA represents net (loss)/income before interest expense, income taxes and depreciation and amortization expense. Adjusted EBITDA consists of EBITDA adjusted for the impact o f certain items that we do not consider indicative of our ongoing operating performance. Total leverage ratios are calculated a s t otal debt divided by Adjusted EBITDA. We present non - GAAP measures when we believe that the additional information is useful and meaningful to investors. Non - GAAP financial measures do not have any standardized meaning and are therefore unlikely to be comparable to similar measures presented by other companies. The presentation of non - GAAP financial measures is not intended to be a substitute for, and should not be considered in isolation from, the financial measures reported in accordance with GAAP. Se e Appendix for a reconciliation of certain non - GAAP measures to the comparable GAAP measures. This presentation also contains estimates and other information concerning our industry that are based on industry publicatio ns, surveys and forecasts. This information involves a number of assumptions and limitations, and we have not independently verif ied the accuracy or completeness of the information.
2 Disclaimer Restrictions on Foreign Ownership The Jones Act places a limit of 25% on foreign ownership or control of persons engaged in transporting merchandise by water o r b y land and water either directly or via a foreign port between points in the United States and certain of its island territorie s a nd possessions. OSG’s organizational documents, among other things, limit ownership by non - U.S. Citizens (as defined under the Jones Act) of any class or series of its capital stock to 23%, and in certain circumstances permit OSG to withhold dividends and suspend voting rights with respect to shares held by non - U.S. Citizens and to redeem shares held by non - U.S. Citizens so that OSG’s foreign ownership remains less than 23%. As disclosed in the prospectus for the offering to which this presentation rel ate s, if a prospective purchaser or transferee is unable to certify it is a U.S. Citizen before purchasing our Class A common stock, o r a sale of stock or transfer of stock would result in non - U.S. Citizens owning 23% or more of our Class A common stock, such person may not be allowed to complete such purchase or transfer, or such purchase or transfer may be reversed, or the shares so purchase d o r transferred may be redeemed by OSG pursuant to its organizational documents. Additional Information You should read the Company’s Annual Report on Form 10 - K for the year ended December 31, 2015 and the Quarterly Report on Form 10 - Q for the quarter ended September 30, 2016, and the pro forma financial statements on Form 8 - K, and the other documents the Company has filed with the SEC for additional information regarding the Company, its operations and the risks and uncerta int ies it faces. You may obtain these documents for free by visiting EDGAR on the SEC Web site at www.sec.gov .

3 Today’s Presenters • Joined OSG Board of Directors in August 2014 and was appointed SVP and President & CEO of US Flag business in July 2016 • Co - Founder & CEO SeaChange Maritime, and spent 17 - year period ending July 2005 as a senior executive officer at Tanker Pacific Management (Singapore) Pte. Ltd Samuel H. Norton President and CEO, OSG U.S. Flag Future President and CEO, OSG • Joined OSG in January 2015 following a 30 - year career at Deloitte • Provided tax advisory services to OSG as a partner at Deloitte Rick Oricchio SVP and CFO

4 Today’s Agenda x Investment Highlights x Company Overview x Financial Overview x Closing Remarks x Q&A

Company Overview

6 Two Industry - Leading Public Companies Enhanced Strategic Focus Simplified Operating Structure Strong Financial Profile
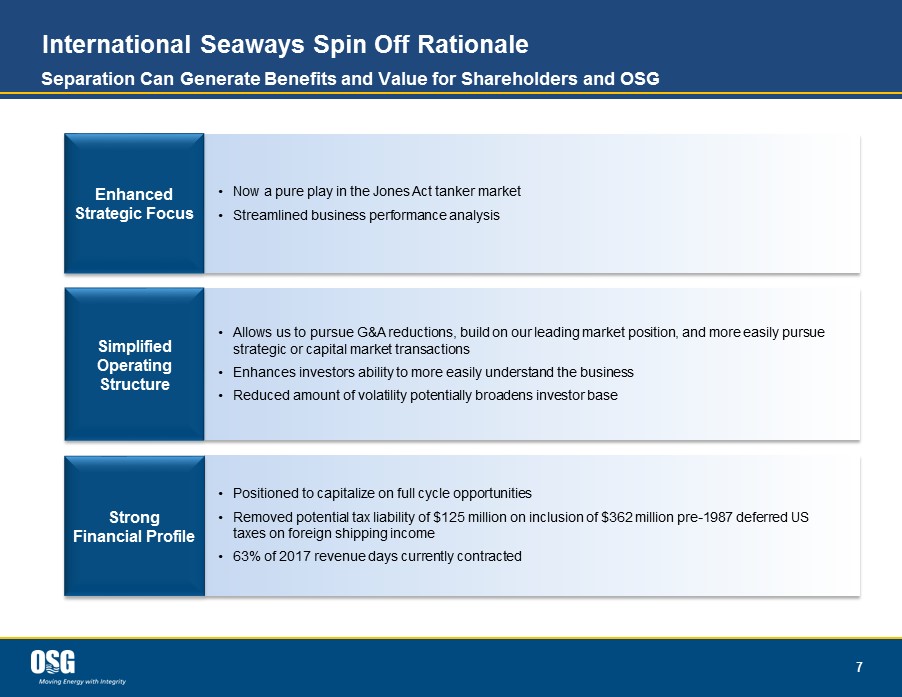
7 International Seaways Spin Off Rationale Separation Can Generate Benefits and Value for Shareholders and OSG Enhanced Strategic Focus • Now a pure play in the Jones Act tanker market • Streamlined business performance analysis Simplified Operating Structure • Allows us to pursue G&A reductions, build on our leading market position, and more easily pursue strategic or capital market transactions • Enhances investors ability to more easily understand the business • Reduced amount of volatility potentially broadens investor base Strong Financial Profile • Positioned to capitalize on full cycle opportunities • Removed potential tax liability of $125 million on inclusion of $362 million pre - 1987 deferred US taxes on foreign shipping income • 63% of 2017 revenue days currently contracted

8 Experienced Management Team Strategic • Formed and led the entry of Tanker Pacific into the floating storage business • Directed the initial investments of the Ofer family into the container sector • Led development and expansion of Seachange Maritime business through challenging market conditions • Co - founded and developed a specialty marine focused enterprise software company Financial • Monitoring P&L for shipping businesses for over 25 years • Deep expertise of technical, operational, and commercial shipping Commercial • Extensive background in shipping restructuring in the Asian markets with the Bank of Boston • Former Executive Officer at Tanker Pacific and member of the Board for the Ofer family global business • Led expansion of Tanker Pacific and the Tanker Pacific Offshore Terminals division • Co - founded Seachange Maritime, a ship owning and operating company for container ships Samuel H. Norton President and CEO, OSG U.S. Flag Future President and CEO, OSG
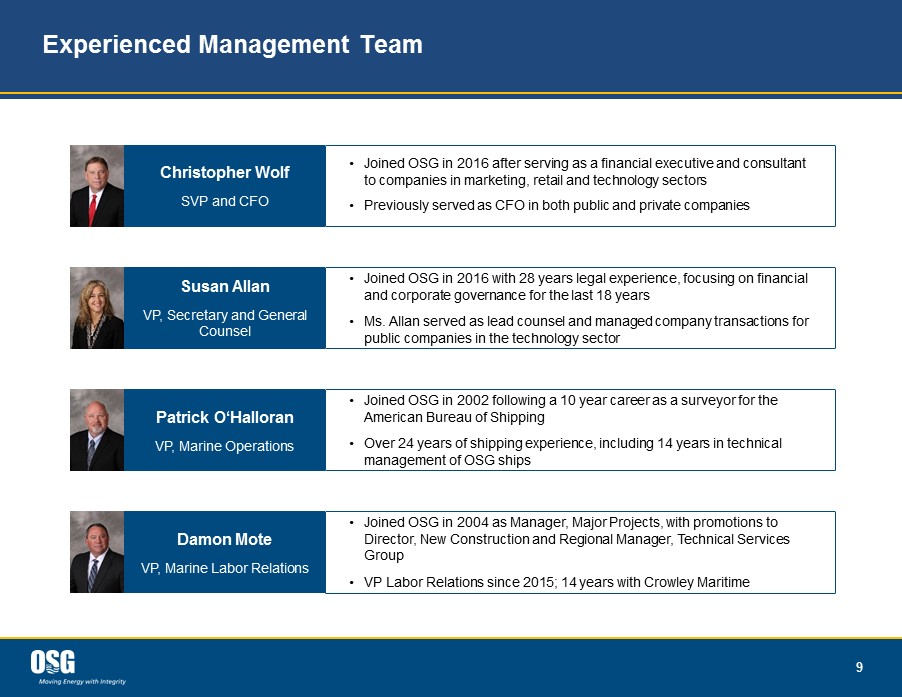
9 Experienced Management Team • Joined OSG in 2004 as Manager, Major Projects, with promotions to Director, New Construction and Regional Manager, Technical Services Group • VP Labor Relations since 2015; 14 years with Crowley Maritime Damon Mote VP, Marine Labor Relations • Joined OSG in 2016 after serving as a financial executive and consultant to companies in marketing, retail and technology sectors • Previously served as CFO in both public and private companies Christopher Wolf SVP and CFO • Joined OSG in 2016 with 28 years legal experience, focusing on financial and corporate governance for the last 18 years • Ms. Allan served as lead counsel and managed company transactions for public companies in the technology sector Susan Allan VP, Secretary and General Counsel • Joined OSG in 2002 following a 10 year career as a surveyor for the American Bureau of Shipping • Over 24 years of shipping experience, including 14 years in technical management of OSG ships Patrick O‘Halloran VP, Marine Operations
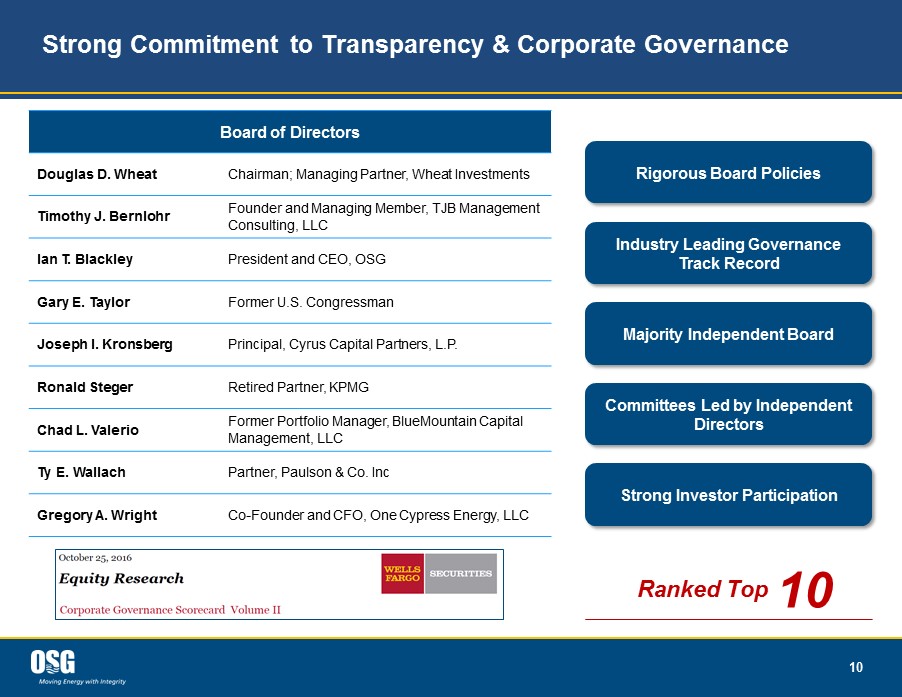
10 Strong Commitment to Transparency & Corporate Governance Board of Directors Douglas D. Wheat Chairman; Managing Partner, Wheat Investments Timothy J. Bernlohr Founder and Managing Member, TJB Management Consulting, LLC Ian T. Blackley President and CEO, OSG Gary E. Taylor Former U.S. Congressman Joseph I. Kronsberg Principal, Cyrus Capital Partners, L.P. Ronald Steger Retired Partner, KPMG Chad L. Valerio Former Portfolio Manager, BlueMountain Capital Management, LLC Ty E. Wallach Partner, Paulson & Co. Inc Gregory A. Wright Co - Founder and CFO, One Cypress Energy, LLC Majority Independent Board Rigorous Board Policies Committees Led by Independent Directors Industry Leading Governance Track Record Strong Investor Participation 10 Ranked Top
Investment Highlights

12 Investment Highlights Niche Market Regulatory constraints and limited shipyard capacity Strong Financial Profile Balance sheet and cash position provide flexibility to address growth opportunities Leading Market Position Major operator of Jones Act vessels Trusted Operating Franchise Reputation for integrity, service excellence, and high quality customers

13 Leading Market Position Leading and Diversified Portfolio in Jones Act Market • Florida market requires ships • Expanded Gulf Coast market • West Coast / Alaska market • Market disruptions • Delaware Bay Lightering • Shuttle Tanker / Maritime Security Program • Vessel mix, including leases and ATBs • Fleet deployment within the stable Clean US Gulf and swing Crude Oil markets Note: Graphic is illustrative Increasing Market Conditions Decreasing Market Conditions Current Market Conditions A B C D E F G H Solid base of vessel mix and market deployment Positioned to capture incremental market upside Built - in hedge provides insulation from Jones Act market deterioration

14 Leading Market Position Diversified Fleet Within Jones Act Market Sources: Company filings, Navigistics Vessel Type Vessel Class Capacity (in Barrels) Approximate US Fleet OSG Fleet Number Owned Market Share (%) Tanker Tanker 330,000 36 9 0 25% Shuttle Tanker 330,000 3 3 2 100% Large ATB ATB 237,000 45 8 8 18% Lightering ATB 320,000 2 2 2 100% Total Jones Act 86 22 12 26% MSP Tanker 400,000 2 2 2 100% Total US Flag 24 14 A

15 Leading Market Position • Contract Structure Provides Significant Optionality 10 Long term bareboat leases 9 Contracts expire in December 2019, with optional renewal on the same date 1 Converted shuttle tanker, the Overseas Tampa, is on a long term charter through June 2025 with coterminous lease • Option to extend the bareboat contracts for the remaining life of the vessels at pre - determined charter rates • Usage protected by covenants from AMSC and its lenders Current AMSC Lease Contracts Current Payment Schedule • AMSC is entitled to a 50% share of “profits” generated on an aggregate fleet basis, once a Credit Amount due to OSG has been fully offset • No profit share is payable to AMSC until after provisions for drydocks are met and an OSG profit layer is achieved • 9.5% interest per annum on outstanding balance on the credit amount • Approximately $31 million (as of 9/30/16) of an outstanding Deferred Payment Obligation due to AMSC for 5 vessels is carried as a liability under Other Non - Current liabilities. This liability is being amortized on a straight - line basis and will be fully repaid in approximately 16 years • No distribution of cash profits is expected during the current firm charter period A

16 Leading Market Position Rebuilt ATB Fleet All barges have been rebuilt within the past 20 years and are double hulled and certified to "CAP 1" standards • Vessels are maintained to the highest industry standards • Customer acceptance is the limiting factor, not vessel condition Vessel Condition Approvals apply to customers who want to charter vessels and to terminals at which vessels could call • Demand for these vessels exists because they are competitively priced in the market Vetting Approvals Adjacent markets exist for repurposing rebuilt ATBs • $98 million of the rebuilt ATB carrying value was written off during 3Q’16 • Opportunities exist for repurposing rebuilt ATBs and finding niche trades Niche Trades/ Repurposing • 41% of rebuilt ATB 2017 revenue days contracted TCE Revenue Million (USD) $92 $98 $105 $104 2013 2014 2015 3Q'16 LTM A

17 Leading Market Position Jones Act Trades Source: Navigistics Jones Act Fleet Deployment September 2016 - % of Capacity Clean US Gulf 45% Crude Oil 24% West Coast 17% Chemicals 8% Idle 4% MSC 2% Tankers and ATBs • 45% of capacity within the stable Clean US Gulf market • 24% of capacity within the volatile Crude Oil market OPEC agreement to decrease production could potentially raise prices and lead to an increase in US crude production, depending on demand location B Clean US Gulf Capacity ( k bbls ) Market OSG % 9,975 2,941 29%

18 Leading Market Position Delaware Bay Lightering Sources: EIA, Company info Market Attributes Market Position • Competitive advantage is our Title V permit, advanced lightering ATBs and long term customers ‒ Only company permitted to lighter in Delaware Bay ‒ Permit allows for reverse lightering should trade develop ‒ Provide customers with the most advanced lightering ATBs ‒ Core customer contract with Philadelphia Energy Solutions (PES) ending in 2020. Other customers include PBF and Monroe Energy • 3Q’16 Delaware Bay lightering volumes averaged 156K barrels/day, up 32% compared to 3Q’15 • Contract of affreightment business based on crude oil cargo volumes • Historical trend of cyclicality of the business • Crude oil price decline driving foreign crude imports & increased lightering volumes ‒ Crude imports to Northeast refineries up 36% YTD 2016 • High degree of vulnerability to pipeline capacity (Colonial) 595 600 690 736 829 860 911 1Q15 2Q15 3Q15 4Q15 1Q16 2Q16 3Q16 Lightering Quarterly Fleet Barrels (thousand barrels per day) Crude Oil Imports to U.S. East Coast (PADD 1) 0 5 10 15 20 2013 2014 2015 2016 Q1 Q2 Q3 Q4 (million barrels per quarter) C

19 Leading Market Position Shuttle Tanker Fleet and Maritime Security Program • Shuttle tankers are a cost - effective means of transporting offshore oil where pipeline infrastructure is too costly or technologically not feasible to construct • Gulf of Mexico crude oil production is estimated to increase to record high levels in 2017 • Three deep water Gulf of Mexico operators began drilling in 2016, two more are expected to start in 2017 • Shuttle tanker fleet is poised to capture growth opportunities in the Gulf Coast • Only shuttle tanker provider in the Gulf Coast • 2 vessels owned and 1 additional vessel leased • Shell Stones Field FPSO started production in Sept.’16 ‒ The average time charter rate on the 10 year deal is more than 2X recent time charters • There are 60 vessels in the MSP program • Congress has approved an increase in annual fees applicable to these vessels from $3.5 million to $5 million per annum beginning in fiscal 2017 • OSG is the only company that has tankers operating in the program: ‒ Government of Israel COA ‒ Military Sealift Command usage • Secretary of Transportation, in consultation with the Secretary of Defense, maintains a fleet of active, commercially viable, militarily useful, privately - owned vessels to meet national defense and other security requirements Maritime Security Program D Market Attributes Market Position Market Attributes Market Position Shuttle Tanker
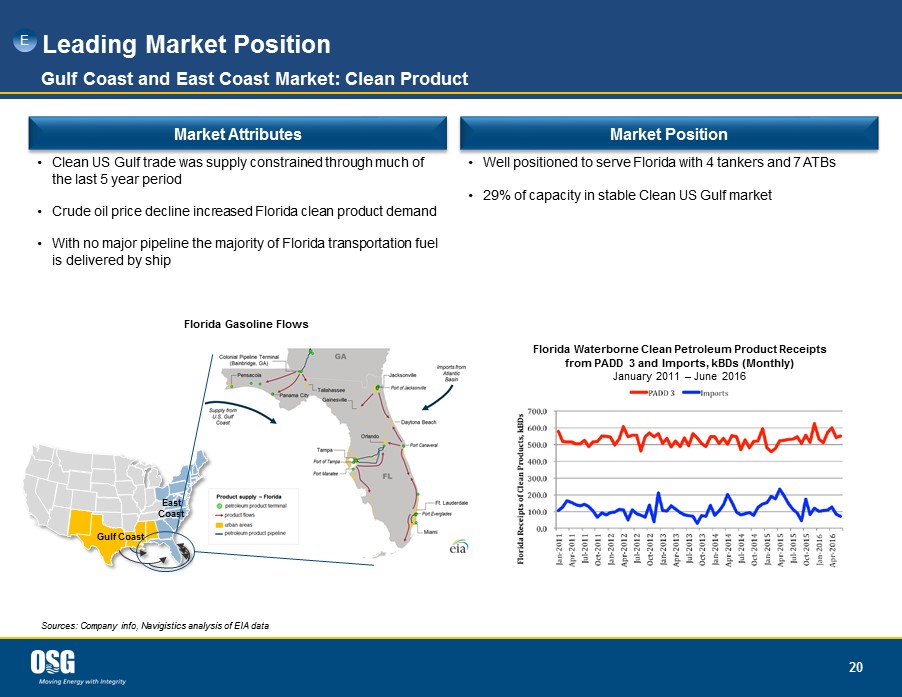
20 Leading Market Position Gulf Coast and East Coast Market: Clean Product Sources: Company info, Navigistics analysis of EIA data • Clean US Gulf trade was supply constrained through much of the last 5 year period • Crude oil price decline increased Florida clean product demand • With no major pipeline the majority of Florida transportation fuel is delivered by ship Market Attributes Market Position East Coast Gulf Coast • Well positioned to serve Florida with 4 tankers and 7 ATBs • 29% of capacity in stable Clean US Gulf market Florida Waterborne Clean Petroleum Product Receipts from PADD 3 and Imports, kBDs (Monthly) January 2011 – June 2016 E Florida Gasoline Flows

21 Leading Market Position Gulf Coast and East Coast Market: Crude Sources: Navigistics analysis of EIA data Note: Illustrative example provided on Slide 23 • New market for crude oil transportation; Experienced a boom over past 4 years • Eagle Ford is the largest source for Jones Act crude oil trade ‒ Corpus Christi’s close proximity to Eagle Ford makes it a central distribution point to move crude to other refining locations • Decline in oil prices put pressure on US shale production and impacted the crude oil tanker trade • Recent OPEC agreement to reduce production could lead to a revival in US shale production Market Attributes • US crude oil production averaged 8.5M barrels/day in 3Q’16, down 845K barrels/day from 3Q’15 • If outbound production from Corpus Christi increases by 350K barrels/day, the implied incremental number of tankers depending on the discharge destination is: ‒ Houston: 3.5 tankers ‒ Mississippi: 7 tankers ‒ LOOP: 5 tankers ‒ Delaware: 14 tankers Market Position Corpus Christi Marine Movements of Crude Oil & Condensates Inbound and Outbound Jan. 2011 to July 2016, kBD F Corpus Christi Crude Trades

22 Leading Market Position West Coast and Alaska Market Note: Illustrative example provided on Slide 23 • Expertise required to operate in Puget Sound, Alaska, Washington State, and California markets due to heavy regulatory and environmental concerns • Transport of crude from Alaska to the West Coast served by oil majors with their own tankers • Six billion barrel discovery at Smith Bay in Alaska; lack of pipeline infrastructure could change distribution methods • Tesoro - Savage JV agreement to develop and operate a 360K barrel/day rail - to - marine terminal at the Port of Vancouver, WA Market Attributes Market Position West Coast • Unique ability to participate in Alaska crude transportation through Alaska Tanker Company joint venture • Extensive experience with the regulatory, governmental, and regional market dynamics • Strategic partnerships in place and well positioned in the region with 4 vessels • If production at the Tesoro - Savage facility increases by 350K barrels/day, implied incremental tankers is: ‒ San Francisco: 7 tankers G Proposed Tesoro - Savage Oil Terminal Intra - West Coast Movements
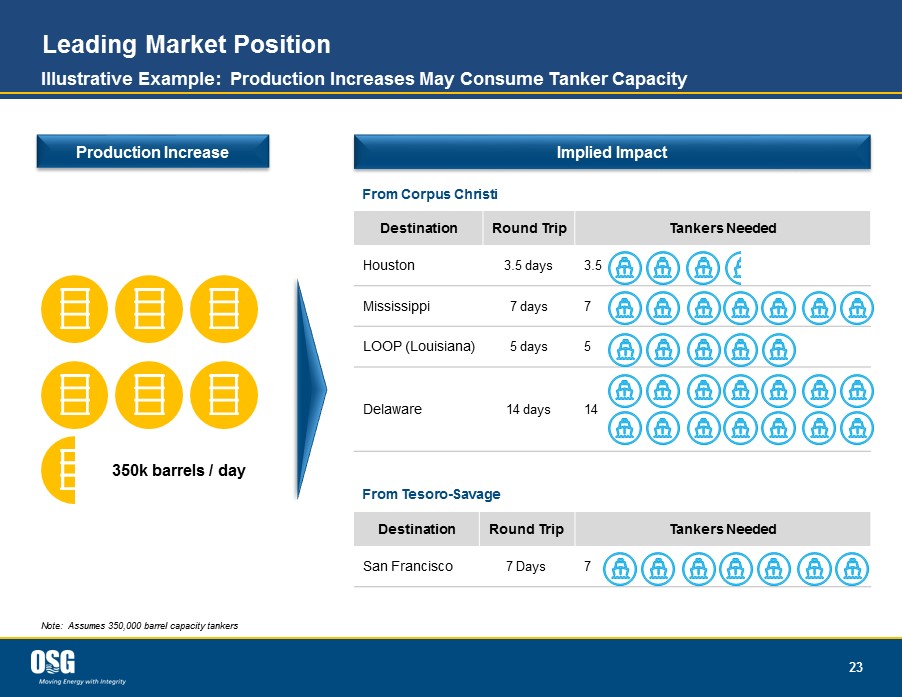
23 Leading Market Position Illustrative Example: Production Increases May Consume Tanker Capacity Note: Assumes 350,000 barrel capacity tankers 350k barrels / day Production Increase Implied Impact Destination Round Trip Tankers Needed Houston 3.5 days 3.5 Mississippi 7 days 7 LOOP (Louisiana) 5 days 5 Delaware 14 days 14 From Corpus Christi Destination Round Trip Tankers Needed San Francisco 7 Days 7 From Tesoro - Savage

24 Market Disruptions Pipeline Ruptures Can Impact Freight Delivery Colonial Pipeline Rupture and Explosion • Reduced product flow a total of 13 million barrels over the 11 day shut shutdown Plantation Pipeline Rupture • Resulted in the loss of 336,000 gallons of gasoline Colonial Pipeline • Carries ~1.3M barrels/day of gasoline, home heating oil, aviation fuel and other refined petroleum products between the U.S. Gulf Coast and the New York area Plantation Pipeline • Delivers approximately 700K barrels/day of gasoline, jet fuel, diesel and biodiesel between Louisiana and Washington, D.C. • Jones Act tankers are the only cost effective alternative to deliver Gulf Coast production to the East Coast in the event of a pipeline disruption • Tankers are also a cost effective delivery alternative to meet high demand when pipelines are running at capacity Overview Opportunities for Tankers and ATBs Results of Disruption H

25 Trusted Operating Franchise OSG Fleet has a Strong Presence in all US Coastwise Trade Routes Long - standing relationships with major independent oil companies, oil traders and refinery operators Proven track record of safe, reliable, and efficient operations

26 Niche Market Structural Benefits of the Jones Act Market Customer Requirements Limited Foreign Access Regulatory Environment Economic Barriers Strong Niche Market
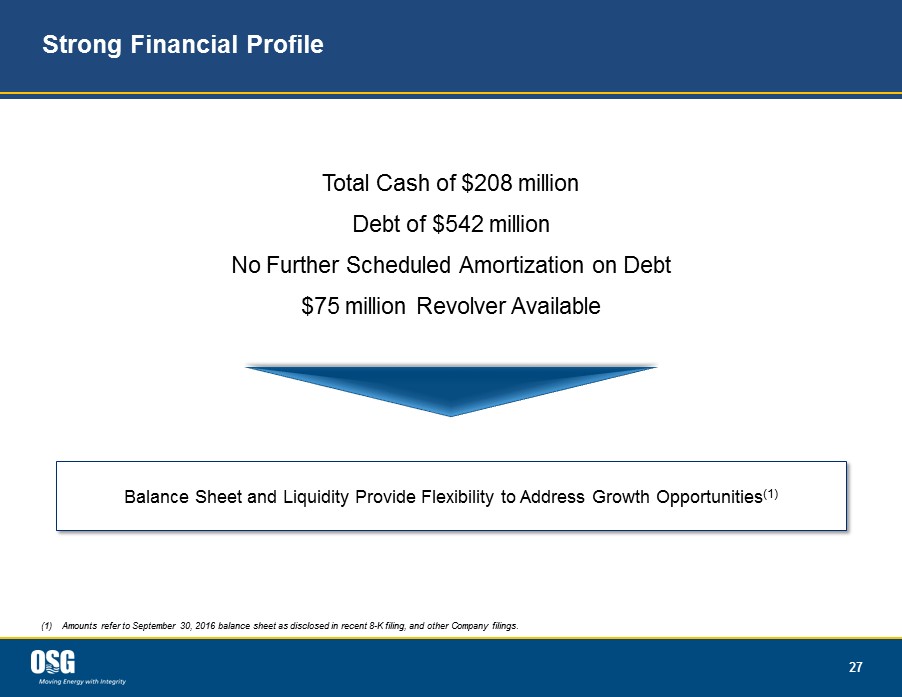
27 Strong Financial Profile Total Cash of $208 million Debt of $542 million No Further Scheduled Amortization on Debt $75 million Revolver Available Balance Sheet and Liquidity Provide Flexibility to Address Growth Opportunities (1) (1) Amounts refer to September 30, 2016 balance sheet as disclosed in recent 8 - K filing, and other Company filings.

Financial Overview

29 Strong Financial Profile Balance Sheet and Liquidity Provide Flexibility to Address Growth Opportunities (1) Q3 2016 Cash includes $90 million of cash at Parent Company, OSG. Also, includes $15.8 million of restricted cash, of which $10 .2 million is restricted for the payment of bond interest and became restricted on November 30 as a result of the distribution of INSW. (2) Q3 2016 Debt includes $82 million of outstanding Bonds. (3) Total liquidity defined as Cash plus available amount under Revolver. (4) Subject to ongoing cash sweep payment. Capital Structure • Net Debt to Equity of 1.4x • Total Liquidity of $284 million • No Scheduled Debt Amortization (4) ($ Millions) 9/30/2016 Cash (1) $209 Debt (2) 542 Net Debt 333 Equity 245 Total Liquidity (3) $284 Net Debt to Equity Ratio 1.4x Balance Sheet Provides Ability to Take Advantage of the Opportunities Within OSG’s Portfolio

30 Debt Overview Bonds • $82 million outstanding as of 9/30/2016 • Due March 2018 • $0.7 million due post - 2020 Revolver • $75 million available / zero currently outstanding • Due February 2019 so long as the 2018 Bonds have been paid off prior to 12/29/2017, otherwise 12/29/2017 Term Loan • $474 million outstanding as of 9/30/2016 • Due August 2019 • 2016 cash sweep: Prepaid $40 million, with $19 million due March 2017 • Estimated 2016 available amount of approximately $59 million in March of 2017 • No further amortization payments required

31 Historical TCE Revenue Overview (1) (1) See Appendix for TCE Revenue reconciliation Sources: Company filings $242 $246 $274 $276 $21 $19 $18 $22 $92 $98 $105 $104 $46 $52 $52 $50 2013 2014 2015 3Q16 LTM Jones Act Handysize Product Tankers Non-Jones Act Handysize Product Tankers ATBs Lightering $451 $401 $414 $449 ($ Millions)

32 Revenue and Tax Overview (1) See Appendix for TCE Revenue reconciliation Sources: Company filings $46,783 $49,231 $54,035 $52,546 2013 2014 2015 3Q16 LTM Avg. Fleet 24 24 24 24 Rev. Days 8,569 8,417 8,313 8,587 Historical Avg. TCE Revenue Per Day Per Vessel • Net Operating Loss of $396 million fully available to OSG in 2016, subject to an 18 year carryforward • Eliminating potential tax liability of $125 million on inclusion of $362 million pre - 1987 deferred US taxes on foreign shipping income Tax Highlights • 63% of 2017 revenue days currently contracted Adjusted EBITDA (1) $137 $140 $169 $127 2013 2014 2015 9 months ended 9/30/16 ($ Millions)
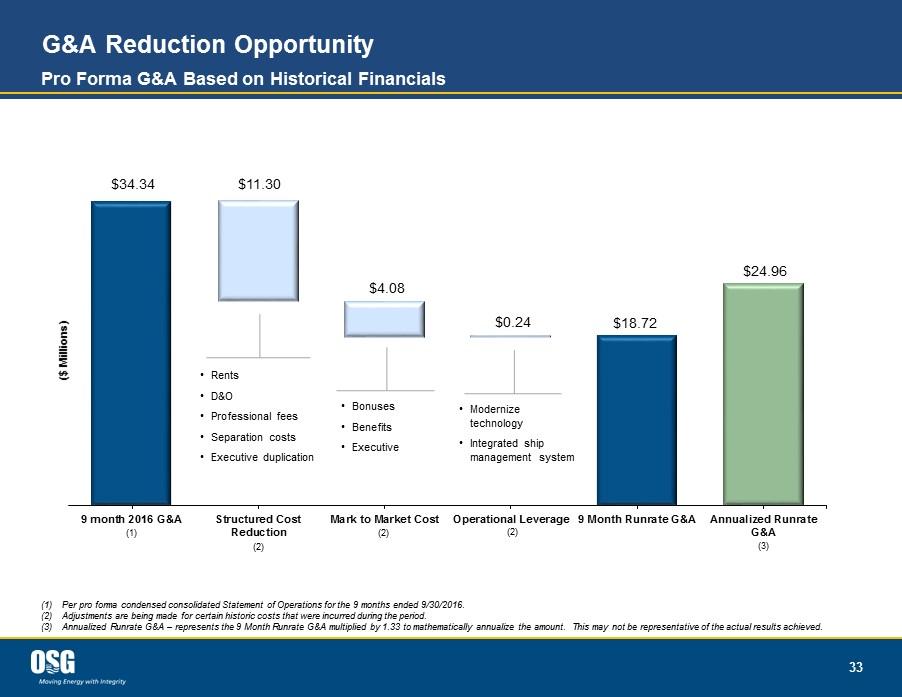
33 G&A Reduction Opportunity (1) Per pro forma condensed consolidated Statement of Operations for the 9 months ended 9/30/2016. (2) Adjustments are being made for certain historic costs that were incurred during the period. (3) Annualized Runrate G&A – represents the 9 Month Runrate G&A multiplied by 1.33 to mathematically annualize the amount. This may not be representative of the actual results achieved . 9 month 2016 G&A Structured Cost Reduction Mark to Market Cost Operational Leverage 9 Month Runrate G&A Annualized Runrate G&A ($ Millions) • Modernize technology • Integrated ship management system • Rents • D&O • Professional fees • Separation costs • Executive duplication • Bonuses • Benefits • Executive $18.72 $34.34 $11.30 $4.08 $0.24 $24.96 (2) (2) (2) (1) Pro Forma G&A Based on Historical Financials (3)

Closing Remarks
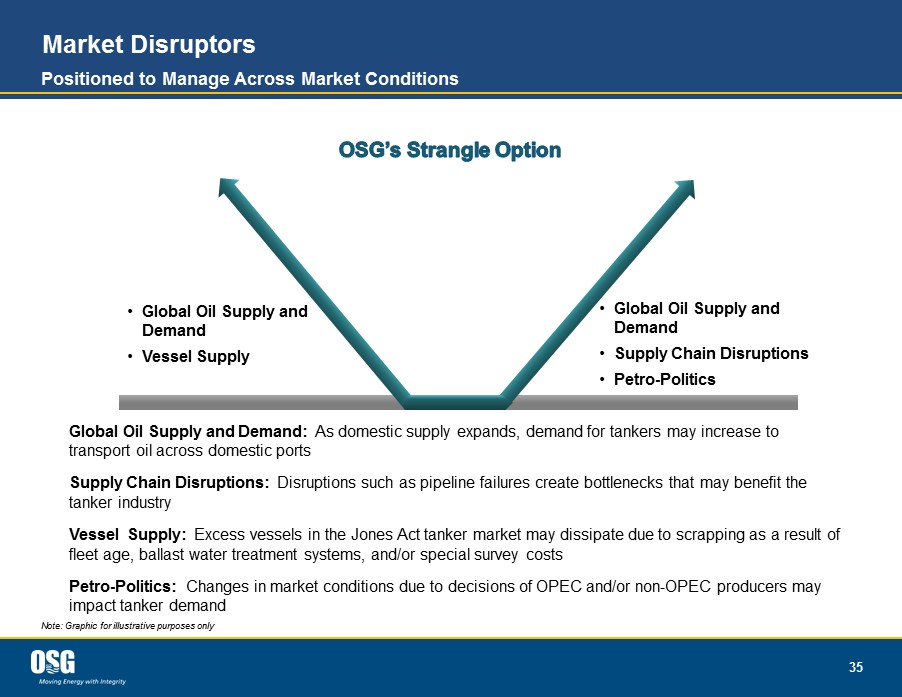
35 Market Disruptors Positioned to Manage Across Market Conditions Note: Graphic for illustrative purposes only • Global Oil Supply and Demand • Supply Chain Disruptions • Petro - Politics • Global Oil Supply and Demand • Vessel Supply Global Oil Supply and Demand: As domestic supply expands, demand for tankers may increase to transport oil across domestic ports Supply Chain Disruptions: Disruptions such as pipeline failures create bottlenecks that may benefit the tanker industry Vessel Supply: Excess vessels in the Jones Act tanker market may dissipate due to scrapping as a result of fleet age, ballast water treatment systems, and/or special survey costs Petro - Politics: Changes in market conditions due to decisions of OPEC and/or non - OPEC producers may impact tanker demand

36 Transforming Our Business Leverage Operational Excellence and Financial Flexibility to Achieve Scale Future Growth Opportunities Opportunistically Grow Through Acquisitions Expand Opportunities in West Coast U.S. Trades Extend Core Operational Skills to Open Adjacent Asset Classes Evaluate Redeployment Opportunities

Q&A

Appendix

39 OSG TCE Revenue ($ Thousands) 2013 2014 2015 3Q16 LTM Shipping Revenues 430,636 440,416 466,872 466,398 Subtract: Voyage Expenses 29,760 26,044 17,814 15,236 Time Charter Equivalent Revenues 400,876 414,372 449,058 451,162 Note: The amounts in the above table were derived from the OSG unaudited pro forma condensed consolidated financial statement s w hich were filed with the SEC on December 6, 2016 and other Company filings.

40 Pro Forma OSG Continuing Operations Adjusted EBITDA Note: The amounts in the above table were derived from the OSG unaudited pro forma condensed consolidated financial statement s w hich were filed with the SEC on December 6, 2016, and other Company filings. Such statements were prepared in accordance with Article 11 of SEC Regulation S - X, and do not reflect any cost savings that the Company's management believes could have been achieved had it been an entity that operated independently of International Seaways, Inc. during the respective historical pe rio ds. ($ Thousands) Nine months ended September 30, 2016 Year ended December 31, 2015 Year ended December 31, 2014 Year ended December 31, 2013 Net (loss)/income (46,047) 138,949 (136,714) 20,543 Income tax benefit (20,583) (158,223) (121,305) (22,742) Interest expense 33,386 70,365 176,233 - Depreciation and amortization 68,401 76,160 66,827 67,601 EBITDA 35,157 127,251 (14,959) 65,403 Technical management transition costs - - 10 - Severance costs 2,238 - 2,161 2,417 Loss/(gain) on disposal of vessels, including impairments 97,908 208 (577) (1,168) Loss on repurchase of debt 2,531 26,516 - - Other costs associated with repurchase of debt 77 3,099 - - Write - off of registration statement costs - 3,493 - - Reorganization items, net (11,318) 8,052 153,124 70,264 Adjusted EBITDA 126,593 168,619 139,759 136,915