Attached files
| file | filename |
|---|---|
| EX-32 - EXHIBIT 32 - OVERSEAS SHIPHOLDING GROUP INC | v456569_ex32.htm |
| EX-31.2 - EXHIBIT 31.2 - OVERSEAS SHIPHOLDING GROUP INC | v456569_ex31-2.htm |
| EX-31.1 - EXHIBIT 31.1 - OVERSEAS SHIPHOLDING GROUP INC | v456569_ex31-1.htm |
| EX-23.1 - EXHIBIT 23.1 - OVERSEAS SHIPHOLDING GROUP INC | v456569_ex23-1.htm |
| EX-21 - EXHIBIT 21 - OVERSEAS SHIPHOLDING GROUP INC | v456569_ex21.htm |
| EX-10.49 - EXHIBIT 10.49 - OVERSEAS SHIPHOLDING GROUP INC | v456569_ex10-49.htm |
| EX-10.48 - EXHIBIT 10.48 - OVERSEAS SHIPHOLDING GROUP INC | v456569_ex10-48.htm |
| EX-10.47 - EXHIBIT 10.47 - OVERSEAS SHIPHOLDING GROUP INC | v456569_ex10-47.htm |
SECURITIES AND EXCHANGE COMMISSION
Washington, D.C. 20549
FORM 10-K
FOR ANNUAL AND TRANSITION REPORTS
PURSUANT TO SECTION 13 OR 15(d) OF THE
SECURITIES EXCHANGE ACT OF 1934
(Mark One)
x ANNUAL REPORT PURSUANT TO SECTION 13 OR 15(d) OF THE SECURITIES EXCHANGE ACT OF 1934
For the fiscal year ended December 31, 2016
OR
¨ TRANSITION REPORT PURSUANT TO SECTION 13 OR 15(d) OF THE SECURITIES EXCHANGE ACT OF 1934
For the Transition Period from __________ to __________.
Commission File Number 1-6479-1
OVERSEAS SHIPHOLDING GROUP, INC.
(Exact name of registrant as specified in its charter)
| Delaware | 13-2637623 | |
| (State or other jurisdiction of incorporation or organization) | (I.R.S. Employer Identification Number) | |
| 302 Knights Run Avenue, Tampa, Florida | 33602 | |
| (Address of principal executive offices) | (Zip Code) |
Registrant’s telephone number, including area code: 813-209-0600
Securities registered pursuant to Section 12(b) of the Act:
| Title of each class | Name of each exchange on which registered | |
| Class A Common Stock (par value $0.01 per share) | New York Stock Exchange |
Securities registered pursuant to Section 12(g) of the Act: None
Indicate by check mark if the registrant is a well-known seasoned issuer, as defined in Rule 405 of the Securities Act. Yes ¨ No x
Indicate by check mark if the registrant is not required to file reports pursuant to Section 13 or Section 15(d) of the Exchange Act. Yes o No x
Indicate by check mark whether the registrant: (1) has filed all reports required to be filed by Section 13 or 15(d) of the Securities Exchange Act of 1934 during the preceding 12 months (or for such shorter period that the registrant was required to file such reports), and (2) has been subject to such filing requirements for the past 90 days. Yes x No o
Indicate by check mark whether the registrant has submitted electronically and posted on its corporate Website, if any, every Interactive Data File required to be submitted and posted pursuant to Rule 405 of Regulation S-T (Section 232.405 of this chapter) during the preceding 12 months (or for such shorter period that the registrant was required to submit and post such files). Yes x No o
Indicate by check mark if disclosure of delinquent filers pursuant to Item 405 of Regulation S-K is not contained herein, and will not be contained, to the best of registrant’s knowledge, in definitive proxy or information statements incorporated by reference in Part III of this Form 10-K or any amendment to this Form 10-K. o
Indicate by check mark whether the registrant is a large accelerated filer, an accelerated filer, a non-accelerated filer, or a smaller reporting company. See definitions of “large accelerated filer,” “accelerated filer,” and “smaller reporting company” in Rule 12b-2 of the Exchange Act. (Check one):
| Large accelerated filer o | Accelerated filer x | Non-accelerated filer o (Do not check if a smaller reporting company) |
Smaller reporting company o |
Indicate by check mark whether the registrant is a shell company (as defined in Rule 12b-2 of the Exchange Act). Yes o No x
APPLICABLE ONLY TO ISSUERS INVOLVED IN BANKRUPTCY PROCEEDINGS DURING THE PRECEDING FIVE YEARS
Indicate by check mark whether the registrant has filed all documents and reports required to be filed by Sections 12, 13 or 15(d) of the Securities Exchange Act of 1934 subsequent to the distribution of securities under a plan confirmed by a court. Yes x No o
The aggregate market value of the common equity held by non-affiliates of the registrant on June 30, 2016, the last business day of the registrant’s most recently completed second quarter, was $431,429,000, based on the closing price of $10.99 per share of Class A common stock on the NYSE MKT exchange on that date. For this purpose, all outstanding shares of common stock have been considered held by non-affiliates, other than the shares beneficially owned by directors, officers and certain 5% shareholders of the registrant; certain of such persons disclaim that they are affiliates of the registrant.
The number of shares outstanding of the issuer’s Class A common stock, as of March 3, 2017: Class A common stock, par value $0.01 –70,806,901 shares. Excluded from these amounts are penny warrants, which were outstanding as of March 3, 2017, for the purchase of 16,958,511 shares of Class A common stock without consideration of any withholding pursuant to the cashless exercise procedures.
DOCUMENTS INCORPORATED BY REFERENCE
Portions of the registrant’s definitive proxy statement to be filed by the registrant in connection with its 2017 Annual Meeting of Shareholders are incorporated by reference in Part III
TABLE OF CONTENTS
References in this Annual Report on Form 10-K to the “Company”, “OSG”, “we”, “us”, or “our” refer to Overseas Shipholding Group, Inc. and, unless the context otherwise requires or otherwise is expressly stated, its subsidiaries.
A glossary of shipping terms (the “Glossary”) that should be used as a reference when reading this Annual Report on Form 10-K can be found immediately prior to Part I. Capitalized terms that are used in this Annual Report are either defined when they are first used or in the Glossary.
All dollar amounts are stated in thousands of U.S. dollars unless otherwise stated.
The Company makes available free of charge through its internet website www.osg.com, its Annual Report on Form 10-K, quarterly reports on Form 10-Q, current reports on Form 8-K and amendments to these reports filed or furnished pursuant to Section 13(a) or 15(d) of the Securities Exchange Act of 1934, as amended, as soon as reasonably practicable after the Company electronically files such material with, or furnishes it to, the Securities and Exchange Commission (the “SEC”). Our website and the information contained on that site, or connected to that site, are not incorporated by reference in this Annual Report on Form 10-K.
The public may also read and copy any materials the Company files with the SEC at the SEC's Public Reference Room at 100 F Street, N.E., Washington, D.C. 20549 (information on the operation of the Public Reference Room is available by calling the SEC at 1-800-SEC-0330). The SEC also maintains a website that contains reports, proxy and information statements, and other information regarding issuers that file electronically with the SEC at http://www.sec.gov.
The Company also makes available on its website its corporate governance guidelines, its code of business conduct, insider trading policy, anti-bribery and corruption policy and charters of the Audit Committee, Human Resources and Compensation Committee and Corporate Governance and Risk Assessment Committee of the Board of Directors. Neither our website nor the information contained on that site, or connected to that site, is incorporated by reference into this Annual Report on Form 10-K.
This Annual Report on Form 10-K contains forward looking statements. In addition, we may make or approve certain statements in future filings with the SEC, in press releases, or oral or written presentations by representatives of the Company. All statements other than statements of historical facts should be considered forward-looking statements. Words such as “may”, “will”, “should”, “would”, “could”, “appears”, “believe”, “intends”, “expects”, “estimates”, “targeted”, “plans”, “anticipates”, “goal”, and similar expressions are intended to identify forward-looking statements but should not be considered as the only means through which these statements may be made. Such forward-looking statements represent the Company’s reasonable expectation with respect to future events or circumstances based on various factors and are subject to various risks and uncertainties and assumptions relating to the Company’s operations, financial results, financial condition, business, prospects, growth strategy and liquidity. Accordingly, there are or will be important factors, many of which are beyond the control of the Company, that could cause the Company’s actual results to differ materially from the expectations expressed or implied in these statements. Undue reliance should not be placed on any forward-looking statements and consideration should be given to the following factors when reviewing such statements. Such factors include, but are not limited to:
| · | the reduced diversification and heightened exposure to the Jones Act market of OSG’s business following the spin-off from OSG on November 30, 2016 of International Seaways, Inc. (INSW), which owned or leased OSG’s fleet of International Flag vessels, which may make OSG more susceptible to market fluctuations than before such spin-off; |
| · | the failure by INSW to satisfy the terms of agreements related to the spin-off; |
| · | the highly cyclical nature of OSG’s industry; |
| · | fluctuations in the market value of vessels; |
| · | declines in charter rates, including spot charter rates or other market deterioration; |
| · | an increase in the supply of vessels without a commensurate increase in demand; |
| · | the impact of adverse weather and natural disasters; |
| · | the adequacy of OSG’s insurance to cover its losses, including in connection with maritime accidents or spill events; |
| · | constraints on capital availability; |
| · | changing economic, political and governmental conditions in the United States and/or abroad and general conditions in the oil and natural gas industry; |
| · | public health threats; |
| · | changes in fuel prices; |
| · | acts of piracy on ocean-going vessels; |
| · | terrorist attacks and international hostilities and instability; |
| i |
| · | the effect of the Company’s indebtedness on its ability to finance operations, pursue desirable business operations and successfully run its business in the future; |
| · | the Company’s ability to generate sufficient cash to service its indebtedness and to comply with debt covenants; |
| · | the Company’s ability to make additional capital expenditures to expand the number of vessels in its fleet and to maintain all its vessels; |
| · | the Company’s ability to renew its time charters when they expire or to enter into new time charters; |
| · | competition within the Company’s industry and OSG’s ability to compete effectively for charters; |
| · | the loss of a large customer; |
| · | the Company’s ability to realize benefits from its past acquisitions or acquisitions or other strategic transactions it may make in the future; |
| · | changes in demand in specialized markets in which the Company currently trades; |
| · | increasing operating costs and capital expenses as the Company’s vessels age, including increases due to limited shipbuilder warranties of the consolidation of suppliers; |
| · | the effects of lifting of the U.S. crude oil export ban; |
| · | refusal of certain customers to use vessels of a certain age; |
| · | the Company’s ability to replace its operating leases on favorable terms, or at all; |
| · | changes in credit risk with respect to the Company’s counterparties on contracts; |
| · | the failure of contract counterparties to meet their obligations; |
| · | the Company’s ability to attract, retain and motivate key employees; |
| · | work stoppages or other labor disruptions by the unionized employees of OSG or other companies in related industries; |
| · | unexpected drydock costs; |
| · | the potential for technological innovation to reduce the value of the Company’s vessels and charter income derived therefrom; |
| · | the impact of an interruption in or failure of the Company’s information technology and communication systems upon the Company’s ability to operate or a cybersecurity breach; |
| · | the Company’s compliance with 46 U.S.C. sections 50501 and 55101 (commonly known as the “Jones Act”) limitations on U.S. coastwise trade, the waiver, modification or repeal of the Jones Act limitations or changes in international trade agreements; |
| · | government requisition of the Company’s vessels during a period of war or emergency; |
| · | the inability to clear oil majors’ risk assessment process; |
| · | the Company’s compliance with complex laws, regulations and in particular, environmental laws and regulations, including those relating to the emission of greenhouse gases and ballast water treatment; |
| · | any non-compliance with the U.S. Foreign Corrupt Practices Act of 1977 or other applicable regulations relating to bribery; |
| · | the impact of litigation, government inquiries and investigations; |
| · | governmental claims against the Company; |
| · | the arrest of OSG’s vessels by maritime claimants; |
| · | the potential for audit or material adjustment by the IRS of certain tax benefits recognized by the Company; |
| · | the Company’s ability to use its net operating loss carryforwards; |
| · | the impact of a delay or disruption in implementing new technological and management systems; and |
| · | the impact of any potential liabilities resulting from the withdrawal from participation in multiemployer pension plans; and | |
| · | the impact of potential changes in U.S. tax laws. |
Investors should carefully consider these risk factors and the additional risk factors outlined in more detail in this Annual Report on Form 10-K and in other reports hereafter filed by the Company with the SEC under the caption “Risk Factors.” The Company assumes no obligation to update or revise any forward looking statements. Forward looking statements in this Annual Report on Form 10-K and written and oral forward looking statements attributable to the Company or its representatives after the date of this Annual Report on Form 10-K are qualified in their entirety by the cautionary statement contained in this paragraph and in other reports hereafter filed by the Company with the SEC.
SUPPLEMENTARY FINANCIAL INFORMATION
The Company reports its financial results in accordance with generally accepted accounting principles of the United States of America (“GAAP”). However, the Company has included certain non-GAAP financial measures and ratios, which it believes, provide useful information to both management and readers of this report in measuring the financial performance and financial condition of the Company. These measures do not have a standardized meaning prescribed by GAAP and, therefore, may not be comparable to similarly titled measures presented by other publicly traded companies, nor should they be construed as an alternative to other titled measures determined in accordance with GAAP.
| ii |
The Company presents three non-GAAP financial measures: time charter equivalent revenues, EBITDA and Adjusted EBITDA. Time charter equivalent revenues represent shipping revenues less voyage expenses, as a measure to compare revenue generated from a voyage charter to revenue generated from a time charter. EBITDA represents net (loss)/income from continuing operations before interest expense and income taxes and depreciation and amortization expense. Adjusted EBITDA consists of EBITDA adjusted for the impact of certain items that we do not consider indicative of our ongoing operating performance.
This Annual Report on Form 10-K includes industry data and forecasts that we have prepared based, in part, on information obtained from industry publications and surveys. Third-party industry publications, surveys and forecasts generally state that the information contained therein has been obtained from sources believed to be reliable. In addition, certain statements regarding our market position in this report are based on information derived from the Company’s market studies and research reports. Unless we state otherwise, statements about the Company’s relative competitive position in this report are based on our management's beliefs, internal studies and management's knowledge of industry trends.
Unless otherwise noted or indicated by the context, the following terms used in the Annual Report on Form 10-K have the following meanings:
Aframax—A medium size crude oil tanker of approximately 80,000 to 120,000 deadweight tons. Aframaxes can generally transport from 500,000 to 800,000 barrels of crude oil and are also used in Lightering. A coated Aframax operating in the refined petroleum products trades may be referred to as an LR2.
Articulated Tug Barge or ATB—A tug-barge combination system capable of operating on the high seas, coastwise and further inland. It combines a normal barge, with a bow resembling that of a ship, but having a deep indent at the stern to accommodate the bow of a tug. The fit is such that the resulting combination behaves almost like a single vessel at sea as well as while maneuvering.
Ballast — Any heavy material, including water, carried temporarily or permanently in a vessel to provide desired draft and stability.
Bareboat Charter—A Charter under which a customer pays a fixed daily or monthly rate for a fixed period of time for use of the vessel. The customer pays all costs of operating the vessel, including voyage and vessel expenses. Bareboat charters are usually long term.
b/d—Barrels per day.
CERCLA—The abbreviation for the U.S. Comprehensive Environmental Response, Compensation, and Liability Act.
Charter—Contract entered into with a customer for the use of the vessel for a specific voyage at a specific rate per unit of cargo (“Voyage Charter”), or for a specific period of time at a specific rate per unit (day or month) of time (“Time Charter”).
Classification Societies—Organizations that establish and administer standards for the design, construction and operational maintenance of vessels. As a practical matter, vessels cannot trade unless they meet these standards.
Contract of Affreightment or COA—An agreement providing for the transportation between specified points for a specific quantity of cargo over a specific time period but without designating specific vessels or voyage schedules, thereby allowing flexibility in scheduling since no vessel designation is required. COAs can either have a fixed rate or a market-related rate. One example would be two shipments of 70,000 tons per month for two years at the prevailing spot rate at the time of each loading.
Crude Oil—Oil in its natural state that has not been refined or altered.
Deadweight tons or dwt—The unit of measurement used to represent cargo carrying capacity of a vessel, but including the weight of consumables such as fuel, lube oil, drinking water and stores.
Demurrage—Additional revenue paid to the shipowner on its Voyage Charters for delays experienced in loading and/or unloading cargo that are not deemed to be the responsibility of the shipowner, calculated in accordance with specific Charter terms.
Double Hull—Hull construction design in which a vessel has an inner and an outer side and bottom separated by void space, usually two meters in width.
Drydocking—An out-of-service period during which planned repairs and maintenance are carried out, including all underwater maintenance such as external hull painting. During the drydocking, certain mandatory Classification Society inspections are carried out and relevant certifications issued. Normally, as the age of a vessel increases, the cost and frequency of drydockings increase.
Exclusive Economic Zone—An area that extends up to 200 nautical miles beyond the territorial sea of a state’s coastline (land at lowest tide) over which the state has sovereign rights for the purpose of exploring, exploiting, conserving and managing natural resources.
Floating Storage Offloading Unit or FSO—A converted or newbuild barge or tanker, moored at a location to receive crude or other products for storage and transfer purposes. FSOs are not equipped with processing facilities.
| iii |
Handysize Product Carrier—A small size Product Carrier of approximately 29,000 to 50,000 deadweight tons. This type of vessel generally operates on shorter routes (short haul).
International Energy Agency or IEA — An intergovernmental organization established in the framework of the Organization for Economic Co-operation and Development in 1974. Among other things, the IEA provides research, statistics, analysis and recommendations relating to energy.
International Maritime Organization or IMO—An agency of the United Nations, which is the body that is responsible for the administration of internationally developed maritime safety and pollution treaties, including MARPOL.
International Flag—International law requires that every merchant vessel be registered in a country. International Flag refers to those vessels that are registered under a flag other that of the United States.
International Flag vessel—A vessel that is registered under a flag other than that of the United States.
Jones Act—U.S. law that applies to port-to-port shipments within the continental U.S. and between the continental U.S. and Hawaii, Alaska, Puerto Rico, and Guam, and restricts such shipments to U.S. Flag Vessels that are built in the United States and that are owned by a U.S. company that is more than 75% owned and controlled by U.S. citizens, set forth in 46 U.S.C. sections 50501 and 55101.
Jones Act Fleet—A fleet comprised of vessels that comply with the Jones Act regulations.
Lightering—The process of off-loading crude oil or petroleum products from large size tankers, typically Very Large Crude Carriers, into smaller tankers and/or barges for discharge in ports from which the larger tankers are restricted due to the depth of the water, narrow entrances or small berths.
LNG Carrier—A vessel designed to carry liquefied natural gas, that is, natural gas cooled to −163° centigrade, turning it into a liquid and reducing its volume to 1/600 of its volume in gaseous form. LNG is the abbreviation for liquefied natural gas.
LR1—A coated Panamax tanker. LR is an abbreviation of Long Range.
LR2—A coated Aframax tanker,
MarAd—The Maritime Administration of the U.S. Department of Transportation.
Maritime Security Program or MSP—The U.S. Maritime Security Program, which ensures that militarily useful U.S. Flag vessels are available to the U.S. Department of Defense in the event of war or national emergency. These vessels are required to trade outside the United States but are eligible for government sponsored business. Under the MSP, participants receive an annual fee in exchange for a guarantee that the vessels will be made available to the U.S. government in the event of war or national emergency.
MARPOL—International Convention for the Prevention of Pollution from Ships, 1973, as modified by the Protocol of 1978 relating thereto. This convention includes regulations aimed at preventing and minimizing pollution from ships by accident and by routine operations.
MR—An abbreviation for Medium Range. Certain types of vessel, such as a Product Carrier of approximately 45,000 to 53,000 deadweight tons, generally operate on medium-range routes.
MSP vessels—U.S. Flag vessels that participate in the Maritime Security Program.
OECD—Organization for Economic Cooperation and Development is a group of developed countries in North America, Europe and Asia.
OPA 90—OPA 90 is the abbreviation for the U.S. Oil Pollution Act of 1990.
OPEC—Organization of Petroleum Exporting Countries, which is an international organization established to coordinate and unify the petroleum policies of its members.
P&I Insurance —Protection and indemnity insurance is a form of marine insurance provided by a P&I club. A P&I club is a mutual (i.e., a co-operative) insurance association that provides cover for its members, who will typically be ship-owners, ship-operators or demise charterers.
Panamax—A medium size vessel of approximately 53,000 to 80,000 deadweight tons. A coated Panamax operating in the refined petroleum products trades may be referred to as an LR1.
Product Carrier—General term that applies to any tanker that is used to transport refined oil products, such as gasoline, jet fuel or heating oil.
Safety Management System or SMS—A framework of processes and procedures that addresses a spectrum of operational risks associated with quality, environment, health and safety. The SMS is certified by ISM (International Safety Management Code), ISO 9001 (Quality Management) and ISO 14001 (Environmental Management).
Scrapping—The disposal of vessels by demolition for scrap metal.
| iv |
Shuttle Tanker—A tanker, usually with special fittings for mooring, which lifts oil from offshore fields and transports it to a shore storage or refinery terminal on repeated trips.
Special Survey—An extensive inspection of a vessel by classification society surveyors that must be completed once within every five-year period. Special Surveys require a vessel to be drydocked.
Suezmax—A large crude oil tanker of approximately 120,000 to 200,000 deadweight tons. Suezmaxes can generally transport about one million barrels of crude oil.
Technical Management or technically managed—The management of the operation of a vessel, including physically maintaining the vessel, maintaining necessary certifications, and supplying necessary stores, spares, and lubricating oils. Responsibilities also generally include selecting, engaging and training crew, and arranging necessary insurance coverage.
Time Charter—A Charter under which a customer pays a fixed daily or monthly rate for a fixed period of time for use of the vessel. Subject to any restrictions in the Charter, the customer decides the type and quantity of cargo to be carried and the ports of loading and unloading. The customer pays all voyage expenses such as fuel, canal tolls, and port charges. The shipowner pays all vessel expenses such as the Technical Management expenses.
Time Charter Equivalent or TCE—TCE is the abbreviation for Time Charter Equivalent. TCE revenues, which are voyage revenues less voyage expenses, serve as an industry standard for measuring and managing fleet revenue and comparing results between geographical regions and among competitors.
Ton-mile demand—A calculation that multiplies the average distance of each route a tanker travels by the volume of cargo moved. The greater the increase in long haul movement compared with shorter haul movements, the higher the increase in ton-mile demand.
U.S. Flag fleet — Our Jones Act Fleet together with our MSP vessels.
U.S. Flag vessel—A U.S. Flag vessel must be crewed by U.S. sailors, and owned and operated by a U.S. company.
Vessel Expenses—Includes crew costs, vessel stores and supplies, lubricating oils, maintenance and repairs, insurance and communication costs associated with the operations of vessels.
VLCC—VLCC is the abbreviation for Very Large Crude Carrier, a large crude oil tanker of approximately 200,000 to 320,000 deadweight tons. VLCCs can generally transport two million barrels or more of crude oil. These vessels are mainly used on the longest (long haul) routes from the Arabian Gulf to North America, Europe, and Asia, and from West Africa to the United States and Far Eastern destinations.
Voyage Charter—A Charter under which a customer pays a transportation charge for the movement of a specific cargo between two or more specified ports. The shipowner pays all voyage expenses, and all vessel expenses, unless the vessel to which the Charter relates has been time chartered in. The customer is liable for Demurrage, if incurred.
Voyage Expenses—Includes fuel, port charges, canal tolls, cargo handling operations and brokerage commissions paid by the Company under Voyage Charters. These expenses are subtracted from shipping revenues to calculate Time Charter Equivalent revenues for Voyage Charters.
| v |
OVERVIEW AND RECENT DEVELOPMENTS
Overseas Shipholding Group, Inc., a Delaware corporation incorporated in 1969, and its wholly owned subsidiaries own and operate a fleet of oceangoing vessels engaged in the transportation of crude oil and petroleum products in the U.S. Flag trades. The Company manages the operations of its U.S. Flag fleet through its wholly owned subsidiary, OSG Bulk Ships, Inc. (“OBS”), a New York corporation. At December 31, 2016, the Company owned or operated a fleet of 24 vessels totaling an aggregate of approximately 1 million deadweight tons (“dwt”). Additional information about the Company’s fleet, including its ownership profile, is set forth under “— Fleet Operations— Fleet Summary,” as well as on the Company’s website, www.osg.com. Neither our website nor the information contained on that site, or connected to that site, is incorporated by reference in this Annual Report on Form 10-K, except to the extent otherwise included herein.
OSG primarily charters its vessels to customers for voyages at specific periods of time at fixed daily amounts through Time Charters. The Company also charters its vessels for specific voyages at spot rates. Spot market rates are highly volatile, while Time Charter and Bareboat Charter rates provide more predictable streams of time charter equivalent (“TCE”) revenues because they are fixed for specific periods of time. For a more detailed discussion on factors influencing spot and time charter markets, see “Fleet Operations—Commercial Management” below.
Spin Off of International Flag Business
Effective as of 5:00 p.m., New York time, on November 30, 2016 (the “Distribution Date”), OSG completed the separation of its business into two independent publicly-traded companies through the spin-off of International Seaways, Inc. (“INSW”). The spin-off separated OSG and INSW into two distinct businesses with separate management. OSG retained the U.S. Flag business and INSW holds entities and other assets and liabilities that formed OSG’s former International Flag business.
In accordance with Accounting Standards Update (“ASU”) 2014-08, Reporting Discontinued Operations and Disclosures of Disposals of Components of an Entity, the assets and liabilities and results of operations of INSW are reported as discontinued operations, net of taxes for all periods presented. Accordingly, all references made to financial data in this Annual Report on Form 10-K are to the Company’s continuing operations unless specifically noted. See Note 5, “Discontinued Operations,” to the Company’s consolidated financial statements set forth in Item 8 for additional information.
The spin-off transaction was in the form of a pro rata distribution of INSW common stock to OSG’s stockholders and warrant holders of record as of 5:00 p.m., New York time, on November 18, 2016 (the “Record Date”). On the Distribution Date, each holder of OSG common stock received 0.3333 shares of INSW common stock for every share of OSG common stock held on the Record Date. Each holder of OSG warrants received a 0.3333 share of INSW common stock for every one share of OSG common stock they would have received if they exercised their warrants immediately prior to the Distribution (or 0.063327 INSW shares per warrant).
The spin-off was completed pursuant to a Separation and Distribution Agreement and several other agreements between INSW and OSG related to the spin-off, including a Transition Services Agreement and an Employee Matters Agreement. These agreements govern the relationship between us and INSW following the spin-off and provided for the allocation of various assets, liabilities, rights and obligations. These agreements include arrangements for transition services to be provided by OSG to INSW and by INSW to OSG. As a result of the spin-off transaction, the Company distributed $895,650 in net assets of INSW, which has been reflected as a reduction to additional paid-in capital and accumulated other comprehensive loss in the accompanying consolidated balance sheet as of December 31, 2016 and statement of changes in equity/(deficit) for the year ended December 31, 2016.
Emergence from Bankruptcy
On November 14, 2012 (the “Petition Date”), the Company and 180 of its subsidiaries (together with OSG, the “Debtors”) filed voluntary petitions for reorganization under Chapter 11 of Title II of the U.S. Code (the “Bankruptcy Code”) in the U.S. Bankruptcy Court for the District of Delaware (the “Bankruptcy Court”). On March 7, 2014, the Debtors filed a plan of reorganization supported by certain of the lenders under OSG’s $1,500,000 credit agreement, dated as of February 9, 2006 (the “Lender Plan”). On April 18, 2014, the Debtors received a proposal for an alternative plan of reorganization from certain holders of existing equity interests of OSG, which the Debtors determined to be more favorable to the Debtors’ creditors and equity interest holders than the Lender Plan (the “Equity Proposal”). Accordingly, the Debtors filed with the Bankruptcy Court a plan of reorganization that effectuated the terms of the Equity Proposal (as subsequently amended, the “Equity Plan”). The Bankruptcy Court confirmed the Equity Plan by order entered on July 18, 2014 (the “Confirmation Order”). On August 5, 2014 (the “Effective Date”), the Equity Plan became effective and OSG emerged from bankruptcy. On February 10, 2017, pursuant to a final decree and order of the Bankruptcy Court, OSG’s one remaining case, as the Parent Company, was closed.
| 1 | Overseas Shipholding Group, Inc. |
Strategy
Our primary objective is to maximize shareholder value by generating strong cash flows through the combination of contracted time charter revenues and opportunistically trading vessels in the spot market; actively managing the size and composition of our fleet over the course of market cycles to increase investment returns and available capital; and entering into value-creating transactions, including acquisitions of competitive businesses. The key elements of our strategy are to:
| • | Generate strong cash flows by capitalizing on our leading Jones Act market position, complementary time charter and spot market exposures, and long-standing customer relationships; |
| • | Emphasize quality of operations and adhere to the highest safety standards attainable; and |
| • | Seek out opportunities to increase scale and drive cost efficiencies through a disciplined approach to investment in core and adjacent asset classes to maximize return on capital across market cycles. |
We believe we are well-positioned to generate strong cash flows by identifying and taking advantage of attractive chartering opportunities in the U.S. market. We currently operate one of the largest tanker fleets in the U.S. Flag market, with a strong presence in all major U.S. coastwise trades. Our market position allows us to maintain long-standing relationships with many of the largest energy companies, which in some cases date back many decades. We consider attaining the stability of cash flow offered by medium term charters to be a fundamental characteristic of the objectives of our chartering approach. Over time, we will pursue an overall chartering strategy that seeks to cover the majority of available operating days with medium-term time charters. A policy of medium term charters will not, however, always be remunerative, nor prove achievable under certain market conditions. As such, during periods of uncertainty in the markets within which we operate, more of our vessels will be exposed to the more volatile and less predictable spot market with a corresponding impact on the visibility and amount of revenue which our vessels may earn.
We believe that OSG has a good standing in the community of our customers, our peers and our regulators, with a long established reputation for a focus on maintaining the highest standards in both protecting the environment and maintaining the health and safety of all of our employees. We believe that continued improvement in these areas is important not only to the constituents directly affected, but equally as important in sustaining a key differentiating competitive factor amongst the customers whom we serve.
We plan to actively manage the size and composition of our fleet through opportunistic acquisitions and dispositions of vessel assets as part of our effort to achieve above-market returns on capital. Using our commercial, financial and operational expertise, we seek to opportunistically grow our fleet through the timely and selective acquisition of high-quality secondhand vessels or new-build contracts when we believe those acquisitions will result in attractive returns on invested capital and increased cash flow. We also intend to engage in opportunistic dispositions and/or repurposing of our vessel assets where we can achieve attractive values relative to their anticipated future earnings from operations as we assess market cycles and requirements. Taken together, we believe these activities will help us to maintain a diverse, high-quality and modern fleet of crude oil, refined product, and potentially other U.S. Flag vessels with an enhanced return on invested capital. We believe our diverse and versatile fleet, our experience and our long-standing relationships with participants in the crude and refined product shipping industry, position us to identify and take advantage of attractive acquisition opportunities in any vessel class and in the Jones Act market.
Customers
OSG’s customers include major independent oil traders, refinery operators and U.S. and international government entities. The Company’s top five customers comprised 59% of shipping revenues during the year ended December 31, 2016. The customers and their related percentage of revenues are as follows: Tesoro (16%), Petrobras America Inc. (12%), Shell (12%), Marathon Petroleum Company (11%) and British Petroleum (8%). See Note 3 - “Summary of Significant Accounting Policies, Concentration of Credit Risk,” to the Company’s consolidated financial statements set forth in Item 8 for further information regarding the Company’s customers for 2016, 2015 and 2014.
| 2 | Overseas Shipholding Group, Inc. |
Fleet Summary
As of December 31, 2016, OSG’s operating fleet consisted of 24 vessels, 14 of which were owned, with the remaining vessels chartered-in. Vessels chartered-in are on Bareboat Charters.
| Vessels Owned | Vessels Chartered-in | Total at December 31, 2016 | ||||||||||||||||||||||||||
| Vessel Type | Number | Weighted by Ownership | Number | Weighted by Ownership | Total Vessels | Vessels Weighted by Ownership | Total dwt (2)) | |||||||||||||||||||||
| Handysize Product Carriers (1) | 4 | 4.0 | 10 | 10.0 | 14 | 14.0 | 664,490 | |||||||||||||||||||||
| Refined Product ATBs | 8 | 8.0 | - | - | 8 | 8.0 | 226,064 | |||||||||||||||||||||
| Lightering ATBs | 2 | 2.0 | - | - | 2 | 2.0 | 91,112 | |||||||||||||||||||||
| Total Operating Fleet | 14 | 14.0 | 10 | 10.0 | 24 | 24.0 | 981,666 | |||||||||||||||||||||
| (1) | Includes two owned shuttle tankers, one chartered-in shuttle tanker and two owned U.S. Flag Product Carriers that trade internationally. |
| (2) | Total dwt is defined as total deadweight tons for all vessels of that type. |
Commercial Management
Time-Charter Market
The Company’s operating fleet currently includes a number of vessels that operate on time charters. Within a contract period, time charters provide a predictable level of revenues without the fluctuations inherent in spot-market rates. Once a time charter expires, however, the ability to secure a new time charter may be uncertain and subject to market conditions at such time. Time charters constituted 83% of the Company’s TCE revenues in 2016, 85% in 2015 and 83% in 2014.
Spot Market
Voyage Charters constituted 17% of the Company’s aggregate TCE revenues in 2016, 15% in 2015 and 17% in 2014. Accordingly, the Company’s shipping revenues are affected by prevailing spot rates for voyage charters in the markets in which the Company’s vessels operate. Spot market rates are highly volatile because they are determined by market forces including local and worldwide demand for the commodities carried (such as crude oil or petroleum products), volumes of trade, distances that the commodities must be transported, the amount of available tonnage both at the time such tonnage is required and over the period of projected use, and the levels of seaborne and shore-based inventories of crude oil and refined products. As several time charters are expiring in 2017 and may not be renewed, the Company will likely have more exposure to the spot market.
Seasonal trends affect oil consumption and consequently vessel demand. While trends in consumption vary with seasons, peaks in demand quite often precede the seasonal consumption peaks as refiners and suppliers try to anticipate consumer demand. Seasonal peaks in oil demand have been principally driven by increased demand prior to winters and increased demand for gasoline prior to the summer driving season. Available tonnage is affected over time, by the volume of newbuilding deliveries, the number of tankers used to store clean products and crude oil, and the removal (principally through scrapping or conversion) of existing vessels from service. Scrapping is affected by the level of freight rates, scrap prices, vetting standards established by charterers and terminals and by U.S. governmental regulations that establish maintenance standards. Voyage charters include COAs on four vessels. Changes in the percentage contributions are therefore affected by Delaware Bay lightering volumes. In addition, as ships come off of their time charters, they may be forced into short-term trades.
Business Segment
The Company has one reportable business segment. The Company’s U.S. Flag Fleet consists of twenty-two owned and chartered-in Jones Act Handysize Product Carriers and ATBs and two non-Jones Act U.S. Flag Handysize Product Carriers that participate in the U.S. Maritime Security Program. Under the Jones Act, shipping between U.S. ports, including the movement of Alaskan crude oil to U.S. ports, is reserved for U.S. Flag vessels that are built in the United States and owned by U.S. companies that are more than 75% owned and controlled by U.S. citizens. OSG is one of the largest commercial owners and operators of U.S. Flag vessels and participates in U.S. government programs, including the following:
| · | Maritime Security Program—Two non-Jones Act U.S. Flag Product Carriers participate in the U.S. Maritime Security Program, which ensures that militarily useful U.S. Flag vessels are available to the U.S. Department of Defense in the event of war or national emergency. Each of the vessel owning companies with a ship that participates in the program receives an annual subsidy that is intended to offset the increased cost incurred by such vessels from operating under the U.S. Flag. Such subsidy was $3.5 million on one vessel and $2.7 million on one vessel in 2016, $3.2 million for each vessel in 2015 and $3.1 million for each vessel in 2014. |
| 3 | Overseas Shipholding Group, Inc. |
Under the terms of the program, the Company expects to receive $5.0 million annually for each vessel from 2017 through 2020, and $5.2 million for each vessel beginning in 2021. The Company does not receive the subsidy with respect to any days for which one or both of the vessels operate under a time charter to a U.S. government agency, which was the case for one vessel during 2016.
| · | Maritime Administration of the U.S. Department of Transportation (“MarAd”) trading restrictions—Two of the modern U.S. Flag ATBs owned by the Company, which are currently used in the Delaware Bay Lightering business, had their construction financed with the Capital Construction Fund (“CCF”). As such, daily liquidated damages are payable by the Company to MarAd if these vessels operate in contiguous coastwise trades, which is not permitted under trading restrictions currently imposed by the CCF agreement between MarAd and the Company. The Company incurred liquidated damages that were not material in amount during each of the years ended December 31, 2015 and 2014, for deploying these two ATBs on contiguous coastwise trade voyages during such years. There were no liquidated damages incurred during the year ended December 31, 2016. |
The Company also has a 37.5% interest in Alaska Tanker Company, LLC (“ATC”), a joint venture that was formed in 1999 among OSG, Keystone Shipping Company and BP plc (“BP”) to support BP’s Alaskan crude oil transportation requirements. Each member in ATC is entitled to receive its respective share of any incentive charter hire payable by BP to ATC based on meeting certain predetermined performance standards. The Company’s share of the income earned by ATC is recorded in equity in income of affiliated companies and amounted to $3.6 million in 2016, $3.8 million in 2015 and $3.4 million in 2014.
Ten of the Handysize product carriers in our U.S. Flag fleet are chartered-in. Those chartered-in vessels provide for the payment of profit share to the owners of the vessels calculated in accordance with the respective charter-in agreements on a 50/50 basis following the funding of certain reserves such as for drydocking and the payment to OSG of a daily management fee and a preferred profit layer. Due to reserve funding requirements, no profits have yet been paid to the owners or are, based on management’s current forecast, expected to be paid to the owners in respect of the charter term through December 31, 2019.
Technical Management
OSG’s fleet operations are managed in-house. In addition to regular maintenance and repair, crews onboard each vessel and shore side personnel must ensure that the Company’s fleet meets or exceeds regulatory standards established by the International Maritime Organization (“IMO”) and U.S. Coast Guard (“USCG”).
The Company recruits, hires and trains the crews on its U.S. Flag vessels. The Company believes that its mandatory training and education requirements exceed the requirements of the USCG. The Company believes its ability to provide professional development for qualified U.S. Flag crew is necessary in a market where skilled labor shortages are expected to remain a challenge. The U.S. Flag fleet is supported by shore side staff that includes fleet managers, marine and technical superintendents, purchasing and marine insurance staff, crewing and training personnel and health, safety, quality and environmental (“SQE”) personnel.
Safety
The Company is committed to providing safe, reliable and environmentally sound transportation to its customers. Integral to meeting standards mandated by regulators and customers is the use of robust Safety Management Systems (“SMS”) by the Company. The SMS is a framework of processes and procedures that addresses a spectrum of operational risks associated with quality, environment, health and safety. The SMS is certified by the International Safety Management Code (“ISM Code,”) promulgated by the IMO and the International Standards Organization (“ISO”) ISO 9001 (Quality Management) and ISO 14001 (Environmental Management). To support a culture of compliance and transparency, OSG has an open reporting system on all of its vessels, whereby seafarers can anonymously report possible violations of OSG’s policies and procedures. All open reports are investigated and appropriate actions are taken when necessary.
As of December 31, 2016, the Company had approximately 882 employees comprised of 768 seagoing personnel and 114 shore-side staff. The Company has collective bargaining agreements with three different U.S. maritime unions covering 632 seagoing personnel employed on the Company’s vessels. These agreements are in effect for periods ending between March 2018 and June 2020. Under the collective bargaining agreements, the Company is obligated to make contributions to pension and other welfare programs.
| 4 | Overseas Shipholding Group, Inc. |
OSG’s primary competitors are operators of U.S. Flag oceangoing barges and tankers, operators of rail transportation for crude oil and operators of refined product pipelines systems that transport refined petroleum products directly from U.S. refineries to markets in the United States. In addition, indirect competition comes from International Flag vessels transporting imported refined petroleum products.
ENVIRONMENTAL AND SECURITY MATTERS RELATING TO BULK SHIPPING
Government regulation significantly affects the operation of the Company's vessels. OSG's vessels operate in a heavily regulated environment and are subject to international conventions and international, national, state and local laws and regulations in force in the countries in which such vessels operate or are registered.
The Company's vessels undergo regular and rigorous in-house safety inspections and audits. In addition, a variety of governmental and private entities subject the Company's vessels to both scheduled and unscheduled inspections. These entities include USCG, local port state control authorities (harbor master or equivalent), coastal states, Classification Societies and customers, particularly major oil companies and petroleum terminal operators. Certain of these entities require OSG to obtain permits, licenses and certificates for the operation of the Company's vessels. Failure to maintain necessary permits or approvals could require OSG to incur substantial costs or temporarily suspend operation of one or more of the Company's vessels.
The Company believes that the heightened level of environmental, health, safety and quality awareness among various stakeholders, including insurance underwriters, regulators and charterers, is leading to greater safety and other regulatory requirements and a more stringent inspection regime on all vessels. In recognition of this heightened awareness, the Company has set internal goals for environmental, health, safety and quality that are intended to meet the higher expectations of our stakeholders. The Company is required to maintain operating standards for all of its vessels emphasizing operational safety and quality, environmental stewardship, preventive planned maintenance, continuous training of its officers and crews and compliance with international and U.S. regulations. OSG believes that the operation of its vessels is in compliance with applicable environmental laws and regulations. However, because such laws and regulations are changed frequently, and new laws and regulations impose new or increasingly stringent requirements, OSG cannot predict the cost of complying with requirements beyond those that are currently in force. The impact of future regulatory requirements on operations or the resale value or useful lives of its vessels may result in substantial additional costs in meeting new legal and regulatory requirements. See Item 1A, “Risk Factors-Compliance with complex laws, regulations, and, in particular, environmental laws or regulations, including those relating to the emission of greenhouse gases, may adversely affect OSG’s business.”
U.S. Environmental and Safety Regulations and Standards
The United States regulates the shipping industry with an extensive regulatory and liability regime for environmental protection and cleanup of oil spills, consisting primarily of the Oil Pollution Act of 1990 (“OPA 90”), and the Comprehensive Environmental Response, Compensation, and Liability Act (“CERCLA”). OPA 90 affects all owners and operators whose vessels trade with the United States or its territories or possessions, or whose vessels operate in the waters of the United States, which include the U.S. territorial sea and the 200 nautical mile Exclusive Economic Zone around the United States. CERCLA applies to the discharge of hazardous substances (other than oil) whether on land or at sea. Both OPA 90 and CERCLA impact the Company's operations.
Liability Standards and Limits
Under OPA 90, vessel owners, operators and bareboat or demise charterers are "responsible parties" who are liable, without regard to fault, for all containment and clean-up costs and other damages, including property and natural resource damages and economic loss without physical damage to property, arising from oil spills and pollution from their vessels. Currently, the limits of OPA 90 liability with respect to (i) tanker vessels with a qualifying double hull are the greater of $2,200 per gross ton or approximately $18.8 million per vessel that is over 3,000 gross tons; and (ii) non-tanker vessels, the greater of $1,100 per gross ton or $0.9 million per vessel. The statute specifically permits individual states to impose their own liability regimes with regard to oil pollution incidents occurring within their boundaries, and some states have enacted legislation providing for unlimited liability for discharge of pollutants within their waters. In some cases, states that have enacted this type of legislation have not yet issued implementing regulations defining vessel owners' responsibilities under these laws. CERCLA, which applies to owners and operators of vessels, contains a similar liability regime and provides for cleanup, removal and natural resource damages associated with discharges of hazardous substances (other than oil). Liability under CERCLA is limited to the greater of $300 per gross ton or $5 million.
These limits of liability do not apply, however, where the incident is caused by violation of applicable U.S. federal safety, construction or operating regulations, or by the responsible party's gross negligence or willful misconduct. Similarly, these limits do not apply if the responsible party fails or refuses to report the incident or to cooperate and assist in connection with the substance removal activities. OPA 90 and CERCLA each preserve the right to recover damages under existing law, including maritime tort law.
| 5 | Overseas Shipholding Group, Inc. |
OPA 90 also requires owners and operators of vessels to establish and maintain with the USCG evidence of financial responsibility sufficient to meet the limit of their potential strict liability under the statute. The USCG enacted regulations requiring evidence of financial responsibility consistent with the previous limits of liability described above for OPA 90 and CERCLA. Under the regulations, evidence of financial responsibility may be demonstrated by insurance, surety bond, self-insurance, guaranty or an alternative method subject to approval by the Director of the USCG National Pollution Funds Center. Under OPA 90 regulations, an owner or operator of more than one vessel is required to demonstrate evidence of financial responsibility for the entire fleet in an amount equal only to the financial responsibility requirement of the vessel having the greatest maximum strict liability under OPA 90 and CERCLA. OSG has provided the requisite guarantees and has received certificates of financial responsibility from the USCG for each of its vessels required to have one.
OSG has insurance for each of its vessels with pollution liability insurance in the amount of $1 billion. However, a catastrophic spill could exceed the insurance coverage available, in which event there could be a material adverse effect on the Company's business.
In response to the Deepwater Horizon oil spill in the Gulf of Mexico in 2010, the U.S. Congress proposed legislation to create more stringent requirements related to the prevention and response to oil spills in U.S. waters and to increase both financial responsibility requirements and the limits in liability under OPA 90, although Congress has not yet enacted any such legislation. In addition to potential liability under OPA 90, vessel owners may in some instances incur liability on an even more stringent basis under state law in the particular state where the spillage occurred.
Other U.S. Environmental and Safety Regulations and Standards
OPA 90 also amended the Federal Water Pollution Control Act to require owners and operators of vessels to adopt vessel response plans, including marine salvage and firefighting plans, for reporting and responding to vessel emergencies and oil spill scenarios up to a "worst case" scenario and to identify and ensure, through contracts or other approved means, the availability of necessary private response resources to respond to a “worst case discharge.” The plans must include contractual commitments with clean-up response contractors and salvage and marine firefighters in order to ensure an immediate response to an oil spill/vessel emergency. OSG has developed and completed the necessary submittals of the plans to the USCG. The USCG has approved OSG’s vessel response plans. This approval is valid until August 16, 2021 for tank vessels and non-tank vessels.
OPA 90 requires training programs and periodic drills for shore side staff and response personnel and for vessels and their crews. OSG conducts such required training programs and periodic drills.
OPA 90 does not prevent individual U.S. states from imposing their own liability regimes with respect to oil pollution incidents occurring within their boundaries. In fact, most U.S. states that border a navigable waterway have enacted environmental pollution laws that impose strict liability on a person for removal costs and damages resulting from a discharge of oil or a release of a hazardous substance. These laws are in some cases more stringent than U.S. federal law.
In addition, the U.S. Clean Water Act (“CWA”) prohibits the discharge of oil or hazardous substances in U.S. navigable waters and imposes strict liability in the form of penalties for unauthorized discharges. The CWA also imposes substantial liability for the costs of removal, remediation and damages and complements the remedies available under the more recent OPA 90 and CERCLA, discussed above.
At the federal level in the United States, ballast water management is subject to two separate, partially interrelated regulatory regimes. One is administered by the USCG under the National Aquatic Nuisance and Control Act and National Invasive Species Act, and the other is administered by the EPA under the CWA.
In March 2012, the USCG promulgated its final rule on ballast water management for the control of nonindigenous species in U.S. waters. While generally in line with the requirements set out in the BWM Convention, the final rule requires that treatment systems for domestic and foreign vessels operating in U.S. waters must be Type Approved by the USCG. The USCG first approved a treatment system as Type Approved in December 2016, and accordingly before such date the USCG had a policy to issue temporary extensions of the compliance dates for the implementation of approved treatment systems. OSG has obtained extensions from the USCG of the treatment system requirement and its first compliance date for any of its vessels is in 2018. OSG expects that its vessels will have Type Approved treatment systems by their extended compliance dates. Each vessel will be required to install the treatment systems during the vessels next scheduled drydock through 2022.
The discharge of ballast water and other substances incidental to the normal operation of vessels in U.S. ports also is subject to CWA permitting requirements. In accordance with the EPA’s National Pollutant Discharge Elimination System, the Company is subject to a Vessel General Permit (“VGP”), which addresses, among other matters, the discharge of ballast water and effluents. The current VGP, which was issued in 2013, identifies twenty-six vessel discharge streams and establishes numeric ballast water discharge limits that generally align with the treatment technologies to be implemented under USCG’s 2012 final rule, requirements to ensure that the ballast water treatment systems are functioning correctly, and more stringent effluent limits for oil to sea interfaces and exhaust gas scrubber wastewater. As of December 31, 2016, the Company believes that its fleet is in compliance with the currently applicable requirements of the VGP. The VGP contains a compliance date schedule for these requirements. The VGP standards and requirements are due for modification and renewal in 2018.
| 6 | Overseas Shipholding Group, Inc. |
Certain of the Company’s vessels are subject to more stringent numeric discharge limits under the EPA’s VGP, even though those vessels have obtained a valid extension from the USCG for implementation of treatment technology under its 2012 final rule. The EPA has determined that it will not issue extensions under the VGP, but in December 2013 it issued an Enforcement Response Policy (“ERP”) to address this industry-wide issue. Under the ERP, the EPA states that vessels that have received an extension from the USCG, are in compliance with all of the VGP’s requirements other than the numeric discharge limits, and meet certain other requirements will be entitled to a “low enforcement priority.” While OSG believes that any vessel that is or may become subject to the VGP’s numeric discharge limits during the pendency of a USCG extension will be entitled to such low priority treatment under the ERP, no assurance can be given that they will do so.
Legislation has also been proposed in the U.S. Congress to amend the federal regimes for regulation of ballast water discharges. However, it cannot currently be determined whether such legislation will eventually be enacted, and if enacted, how the Company’s operations might be impacted under such legislation.
The VGP system also permits individual states and territories to impose more stringent requirements for discharges into the navigable waters of such state or territory. Certain individual states have enacted legislation or regulations addressing hull cleaning and ballast water management. For example, on October 10, 2007, California enacted law AB 740, legislation expanding regulation of ballast water discharges and the management of hull-fouling organisms. California has extensive requirements for more stringent effluent limits and discharge monitoring and testing requirements with respect to discharges in its waters. Due to delays by manufacturers in developing ballast water treatment systems that are able to comply with these effluent limits and in creating equipment to reliably test such compliance, the compliance date for all vessels making ballast water discharges in California waters have been deferred to the first scheduled drydocking after January 1, 2020. OSG’s vessels and systems are currently in compliance with the California discharge standards.
Following an assessment by the California State Lands Commission of the current technology for meeting ballast water management standards, the deadline for compliance for interim standards has been extended from 2016 to 2020 and the deadline for final “zero detect” standards has been extended from 2020 to 2030.
New York State has imposed a more stringent bilge water discharge requirement for vessels in its waters than what is required by the VGP or IMO. Through its Section 401 Certification of the VGP, New York prohibits the discharge of all bilge water in its waters. New York State also requires that vessels entering its waters from outside the Exclusive Economic Zone must perform ballast water exchange in addition to treating it with a ballast water treatment system.
The Company anticipates that, in the next several years, compliance with the various conventions, laws and regulations relating to ballast water management that have already been adopted or that may be adopted in the future will require substantial additional capital and/or operating expenditures and could have operational impacts on OSG’s business. Although OSG cannot predict such expenditures and impacts with certainty at this time, they may be material to OSG’s financial statements.
U.S. Air Emissions Standards
As discussed above, MARPOL Annex VI came into force in the United States in January 2009. In April 2010, EPA adopted regulations implementing the provisions of Annex VI. Under these regulations, both U.S. Flag and International Flag vessels subject to the engine and fuel standards of Annex VI must comply with the applicable Annex VI provisions when they enter U.S. ports or operate in most internal U.S. waters. The Company's vessels are currently Annex VI compliant. Accordingly, absent any new and onerous Annex VI implementing regulations, the Company does not expect to incur material additional costs in order to comply with this convention.
The U.S. Clean Air Act of 1970, as amended by the Clean Air Act Amendments of 1977 and 1990 (“CAA”), requires the EPA to promulgate standards applicable to emissions of volatile organic compounds and other air contaminants. OSG's vessels are subject to vapor control and recovery requirements for certain cargoes when loading, unloading, ballasting, cleaning and conducting other operations in regulated port areas. Each of the Company's vessels operating in the transport of clean petroleum products in regulated port areas where vapor control standards are required has been outfitted with a vapor recovery system that satisfies these requirements. In addition, the EPA issued emissions standards for marine diesel engines. The EPA has implemented rules comparable to those of Annex VI to increase the control of air pollutant emissions from certain large marine engines by requiring certain new marine-diesel engines installed on U.S. registered ships to meet lower NOx standards which will be implemented in two phases. The newly built engine standards that became effective in 2011 require more efficient use of current engine technologies, including engine timing, engine cooling, and advanced computer controls to achieve a 15 to 25 percent NOx reduction below previous levels. The new long-term standards for newly built engines apply beginning in 2016 and require the use of high efficiency emission control technology such as selective catalytic reduction to achieve NOx reductions 80 percent below the pre-2016 levels. Adoption of these and emerging standards may require substantial modifications to some of the Company’s existing marine diesel engines and may require the Company to incur substantial capital expenditures. Moreover, the North American ECA, encompassing the area extending 200 miles from the coastlines of the Atlantic, Gulf and Pacific coasts and the eight main Hawaiian Islands, became effective on August 1, 2012, and the United States Caribbean Sea ECA, encompassing water around Puerto Rico and the U.S. Virgin Islands, became effective on January 1, 2014. Fuel used by all vessels operating in the ECA cannot exceed 0.1% sulfur, effective January 1, 2015. The Company believes that its vessels are in compliance with the current requirements of the ECAs. From 2016, NOx after-treatment requirements also apply. If other ECAs are approved by the IMO or other new or more stringent requirements relating to emissions from marine diesel engines or port operations by vessels are adopted by the EPA or the states where OSG operates, compliance could require or affect the timing of significant capital and/or operating expenditures that could be material to OSG’s consolidated financial statements.
| 7 | Overseas Shipholding Group, Inc. |
The CAA also requires states to draft State Implementation Plans (“SIPs”), designed to attain national health-based air quality standards in major metropolitan and industrial areas. Where states fail to present approvable SIPs, or SIP revisions by certain statutory deadlines, the EPA is required to draft a Federal Implementation Plan. Several SIPs regulate emissions resulting from barge loading and degassing operations by requiring the installation of vapor control equipment. Where required, the Company's vessels are already equipped with vapor control systems that satisfy these requirements. Although a risk exists that new regulations could require significant capital expenditures and otherwise increase its costs, the Company believes, based upon the regulations that have been proposed to date, that no material capital expenditures beyond those currently contemplated and no material increase in costs are likely to be required as a result of the SIPs program.
Individual states have been considering their own restrictions on air emissions from engines on vessels operating within state waters. California requires certain ocean going vessels operating within 24 nautical miles of the Californian coast to reduce air pollution by using only low-sulfur marine distillate fuel rather than bunker fuel in auxiliary diesel and diesel-electric engines, main propulsion diesel engines and auxiliary boilers. Vessels sailing within 24 miles of the California coastline whose itineraries call for them to enter any California ports, terminal facilities, or internal or estuarine waters must use marine gas oil or marine diesel oil with a sulfur content at or below 0.1% sulfur. The Company believes that its vessels that operate in California waters are in compliance with these regulations.
The Delaware Department of Natural Resources and Environment Control (“DNREC”) monitors OSG’s U.S. Flag Lightering activities within the Delaware River. Lightering activities in Delaware are subject to Title V of the Coastal Zone Act of 1972, and OSG is the only marine operator with a Title V permit to engage in Lightering operations. These Lightering activities are monitored and regulated through DNREC’s Title V air permitting process. The regulations are designed to reduce the amount of VOCs entering the atmosphere during a crude oil Lightering operation. DNREC and OSG have worked in cooperation to reduce the amount of emitted VOCs by defining the vapor balancing process between Lightering vessels and ships to be lightered.
This defined process has reduced air emissions associated with venting of crude oil vapors to the atmosphere. In accordance with its Title V permit, OSG’s Delaware Lightering fleet is 100% vapor balance capable.
SOLAS
From January 1, 2014, various amendments to the SOLAS conventions came into force, including an amendment to Chapter VI of SOLAS, which prohibits the blending of bulk liquid cargoes during sea passage and the production process on board ships. This prohibition does not preclude the master of the vessel from undertaking cargo transfers for the safety of the ship or protection of the marine environment. The prohibition does not apply to the blending of products for use in the search and exploitation of the sea-bed mineral resources on board vessels used to facilitate such operations.
Chapter VII of SOLAS has also been amended to require certain transport information to be provided in respect of the carriage of dangerous goods in package form. A copy of one of these documents must be made available to any person designated by the port state authority before the ship’s departure.
The International Code on the Enhanced Program of inspections during surveys of Bulk Carriers and Oil Tankers, 2011 has been made mandatory (“ESP Code”) pursuant to an amendment to SOLAS. The ESP Code provides requirements for an enhanced program of inspection during surveys of tankers.
International and U.S. Greenhouse Gas Regulations
In February 2005, the Kyoto Protocol to the United Nations Framework Convention on Climate Change (“UNFCCC”) (commonly called the Kyoto Protocol) became effective. Pursuant to the Kyoto Protocol, adopting countries are required to implement national programs to reduce emissions of certain gases, generally referred to as greenhouse gases (“GHGs”), which contribute to global warming. The Kyoto Protocol, which was adopted by about 190 countries, commits its parties by setting internationally binding emission reduction targets. In December 2012, the Doha Amendment to the Kyoto Protocol was adopted to further extend the Kyoto Protocol’s GHG emissions reductions through 2020. The United Nations Climate Change Conference has continued negotiations and forged a new international framework in December 2015 (the “Paris Agreement”) that is to take effect by 2020. The Paris Agreement sets a goal of holding the increase in global average temperature to well below 2 degrees Celsius and pursuing efforts to limit the increase to 1.5 degrees Celsius, to be achieved by aiming to reach a global peaking of GHG emissions as soon as possible. To meet these objectives, the participating countries, acting individually or jointly, are to develop and implement successive “nationally determined contributions.” The countries will assess their collective programs toward achieving the goals of the Paris Agreement every five years beginning in 2023, referred to as the global stocktake, and subsequently are to update and enhance their actions on climate change. The Paris Agreement does not specifically require controls on shipping or other industries, but it is possible that countries or groups of countries will seek to impose such controls as they implement the Paris Agreement.
| 8 | Overseas Shipholding Group, Inc. |
The IMO’s third study of GHG emissions from the global shipping fleet which concluded in 2014 predicted that, in the absence of appropriate policies, greenhouse emissions from ships may increase by 50% to 250% by 2050 due to expected growth in international seaborne trade. Methane emissions are projected to increase rapidly (albeit from a low-base) as the share of LNG in the fuel mix increases. With respect to energy efficiency measures, the Marine Environmental Protection Committee (“MEPC”) adopted guidelines on the Energy Efficiency Design Index (“EEDI”), which reflects the primary fuel for the calculation of the attained EEDI for ships having dual fuel engines using LNG and liquid fuel oil (see discussion below). The IMO is committed to developing limits on greenhouse gases from international shipping and is working on proposed mandatory technical and operational measures to achieve these limits.
In 2011, the European Commission established a working group on shipping to provide input to the European Commission in its work to develop and assess options for the inclusion of international maritime transport in the GHG reduction commitment of the EU. The MRV Regulation was adopted on April 29, 2015 and creates an EU-wide framework for the monitoring, reporting and verification of carbon dioxide emissions from maritime transport. The MRV Regulation requires large ships (over 5,000 gross tons) calling at EU ports from January 1, 2018, to collect and later publish verified annual data on carbon dioxide emissions.
In the United States, pursuant to an April 2007 U.S. Supreme Court decision, the U.S. Environmental Protection Agency (“EPA”) was required to consider whether carbon dioxide should be considered a pollutant that endangers public health and welfare, and thus subject to regulation under the U.S. Clean Air Act. On December 1, 2009, the EPA issued an “endangerment finding” regarding GHGs under the Clean Air Act. While this finding in itself does not impose any requirements on industry or other entities, the EPA is in the process of promulgating regulations of GHG emissions. To date, the regulations proposed and enacted by the EPA have not involved ocean-going vessels.
Future passage of climate control legislation or other regulatory initiatives by the IMO, EU, United States or other countries where OSG operates that restrict emissions of GHGs could require significant additional capital and/or operating expenditures and could have operational impacts on OSG’s business. Although OSG cannot predict such expenditures and impacts with certainty at this time, they may be material to OSG’s results of operations.
International Environmental and Safety Regulations and Standards
Liability Standards and Limits
Many countries have ratified and follow the liability plan adopted by the IMO and set out in the International Convention on Civil Liability for Oil Pollution Damage of 1969 (the "1969 Convention"). Some of these countries have also adopted the 1992 Protocol to the 1969 Convention (the "1992 Protocol"). Under both the 1969 Convention and the 1992 Protocol, a vessel's registered owner is strictly liable for pollution damage caused in the territorial waters of a contracting state by discharge of persistent oil, subject to certain complete defenses. These conventions also limit the liability of the shipowner under certain circumstances. As these conventions calculate liability in terms of a basket of currencies, the figures in this section are converted into U.S. dollars based on currency exchange rates on January 8, 2017 and are approximate. Actual dollar amounts are used in this section “-Liability Standards and Limits” and in “-U.S. Environmental and Safety Regulations and Standards-Liability Standards and Limits” below.
Under the 1969 Convention, except where the owner is guilty of actual fault, its liability is limited to $4.0 million for a ship not exceeding 5,000 units of tonnage (a unit of measurement for the total enclosed spaces within a vessel) and $565 per gross ton thereafter, with a maximum liability of $80.1 million. Under the 1992 Protocol, the owner's liability is limited except where the pollution damage results from its personal act or omission, committed with the intent to cause such damage, or recklessly and with knowledge that such damage would probably result. Under the 2000 amendments to the 1992 Protocol, which became effective on November 1, 2003, liability is limited to $6.1 million plus $848 for each additional gross ton over 5,000 for vessels of 5,000 to 140,000 gross tons, and $120.1 million for vessels over 140,000 gross tons, subject to the exceptions discussed above for the 1992 Protocol.
Vessels trading to states that are parties to these conventions must provide evidence of insurance covering the liability of the owner. The Company believes that its P&I insurance will cover any liability under the plan adopted by the IMO. See the discussion of insurance in “-U.S. Environmental and Safety Regulations and Standards-Liability Standards and Limits” below.
The United States is not a party to the 1969 Convention or the 1992 Protocol. See “- U.S. Environmental and Safety Restrictions and Regulations” above. In other jurisdictions where the 1969 Convention has not been adopted, various legislative schemes or common law govern, and liability is imposed either on the basis of fault or in a manner similar to that convention.
| 9 | Overseas Shipholding Group, Inc. |
The International Convention on Civil Liability for Bunker Oil Pollution Damage, 2001, which became effective on November 21, 2008, is a separate convention adopted to ensure that adequate, prompt and effective compensation is available to persons who suffer damage caused by spills of oil when used as fuel by vessels. The convention applies to damage caused to the territory, including the territorial sea, and in its exclusive economic zones, of states that are party to it. While the United States has not yet ratified this convention, vessels operating internationally would be subject to it, if sailing within the territories of those countries that have implemented its provisions. The Company believes that its vessels comply with these requirements.
Other International Environmental and Safety Regulations and Standards
Under the International Safety Management Code (“ISM Code”), promulgated by the IMO, vessel operators are required to develop a safety management system that includes, among other things, the adoption of a safety and environmental protection policy describing how the objectives of a functional safety management system will be met. The Company has a safety management system for its fleet, with instructions and procedures for the safe operation of its vessels, reporting accidents and non-conformities, internal audits and management reviews and responding to emergencies, as well as defined levels of responsibility. The ISM Code requires the Company to have a Document of Compliance (“DoC”) for the vessels it operates and a Safety Management Certificate (“SMC”) for each vessel it operates. Once issued, these certificates are valid for a maximum of five years. The Company in turn must undergo an annual internal audit and an external verification audit in order to maintain the DoC. In accordance with the ISM Code, each vessel must also undergo an annual internal audit at intervals not to exceed twelve months and vessels must undergo an external verification audit twice in a five-year period. The Company maintains a DoC and is also certified under the standards promulgated by the International Standards Organization in ISO 9001 in 2008 (Quality Management) and in ISO 14001 in 2008 (Environmental Management) for the management of operation of oil tankers, chemical tankers and other cargo ships.
The SMC is issued after verifying that the company responsible for operating the vessel and its shipboard management operate in accordance with the approved safety management system. No vessel can obtain a certificate unless its operator has been awarded a DoC issued by the administration of that vessel’s flag state or as otherwise permitted under the International Convention for the Safety of Life at Sea, 1974, as amended (“SOLAS”).
IMO regulations also require owners and operators of vessels to adopt Shipboard Oil Pollution Emergency Plans (“SOPEPs”). Periodic training and drills for response personnel and for vessels and their crews are required. In addition to SOPEPs, OSG has adopted Shipboard Marine Pollution Emergency Plans (“SMPEPs”), which cover potential releases not only of oil but of any noxious liquid substances (“NLSs”). Noncompliance with the ISM Code and other IMO regulations may subject the shipowner or charterer to increased liability, may lead to decreases in available insurance coverage for affected vessels and may result in the denial of access to, or detention in, some ports. For example, the USCG and EU authorities have indicated that vessels not in compliance with the ISM Code will be prohibited from trading to U.S. and EU ports.
The International Convention for the Control and Management of Ships' Ballast Water and Sediments (“BWM Convention”) is designed to protect the marine environment from the introduction of non-native (alien) species as a result of the carrying of ships’ ballast water from one place to another. The introduction of non-native species has been identified as one of the top five threats to biological diversity. Expanding seaborne trade and traffic have exacerbated the threat. Tankers must take on ballast water in order to maintain their stability and draft, and must discharge the ballast water when they load their next cargo. When emptying the ballast water, which they carried from the previous port, they may release organisms and pathogens that have been identified as being potentially harmful in the new environment.
The BWM Convention was adopted in 2004 and will enter into force on September 8, 2017. The BWM Convention is applicable to new and existing vessels that are designed to carry ballast water. It defines a discharge standard consisting of maximum allowable levels of critical invasive species. This standard will likely be met by installing treatment systems that render the invasive species non-viable. In addition, each vessel will be required to have on board a valid International Ballast Water Management Certificate, a Ballast Water Management Plan and a Ballast Water Record Book.
OSG’s vessels are subject to other international, national and local ballast water management regulations (including those described below under “U.S. Environmental and Safety Regulations and Standards”). OSG complies with these regulations through ballast water management plans implemented on each of the vessels it technically manages. To meet existing and anticipated ballast water treatment requirements, including those contained in the BWM Convention, OSG has a fleetwide action plan to comply with IMO, EPA, USCG and possibly more stringent U.S. state mandates as they are implemented and become effective, which may require the installation and use of costly control technologies. Compliance with the ballast water requirements expected to go into effect under the BWM Convention and other regulations may have material impacts on OSG’s operations and financial results, as discussed above under “U.S. Environmental and Safety Regulations and Standards-Other U.S. Environmental and Safety Regulations and Standards.”
| 10 | Overseas Shipholding Group, Inc. |
Other EU Legislation and Regulations
The EU has adopted legislation that: (1) bans manifestly sub-standard vessels (defined as those over 15 years old that have been detained by port authorities at least twice in the course of the preceding 24 months) from European waters, creates an obligation for port states to inspect at least 25% of vessels using their ports annually and provides for increased surveillance of vessels posing a high risk to maritime safety or the marine environment, and (2) provides the EU with greater authority and control over Classification Societies, including the ability to seek to suspend or revoke the authority of negligent societies. OSG believes that none of its vessels meet the "sub-standard" vessel definitions contained in the EU legislation. EU directives enacted in 2005 and amended in 2009 require EU member states to introduce criminal sanctions for illicit ship-source discharges of polluting substances (e.g., from tank cleaning operations) which result in deterioration in the quality of water and has been committed with intent, recklessness or serious negligence. Certain member states of the EU, by virtue of their national legislation, already impose criminal sanctions for pollution events under certain circumstances. The Company cannot predict what additional legislation or regulations, if any, may be promulgated by the EU or any other country or authority, or how these might impact OSG.
International Air Emission Standards
Annex VI to MARPOL (“Annex VI”), which was designed to address air pollution from vessels and which became effective internationally on May 19, 2005, sets limits on sulfur oxide (“SOx”) and nitrogen oxide (“NOx”) emissions from ship exhausts and prohibits deliberate emissions of ozone depleting substances, such as chlorofluorocarbons. Annex VI also regulated shipboard incineration and the emission of volatile organic compounds from tankers. Annex VI was amended in 2008 to provide for a progressive and substantial reduction in SOx and NOx emissions from vessels and allow for the designation of Emission Control Areas (“ECAs”) in which more stringent controls would apply. The primary changes were that the global cap on the sulfur content of fuel oil was reduced to 3.50% from 4.50% effective from January 1, 2012, and such cap is further reduced progressively to 0.50% effective from January 1, 2020. Further, the sulfur content of fuel oil for vessels operating in designated ECAs was progressively reduced from 1.5% to 1.0% effective July 2010 and further reduced to 0.1% effective January 2015. Currently designated ECAs are: the Baltic Sea area, the North Sea area, the North American area (covering designated coastal areas off the United States and Canada) and the United States Caribbean Sea area (around Puerto Rico and the United States Virgin Islands). For vessels over 400 gross tons, Annex VI imposes various survey and certification requirements. The U.S. Maritime Pollution Prevention Act of 2008 amended the U.S. Act to Prevent Pollution from Ships to provide for the adoption of Annex VI. In October 2008, the U.S. ratified Annex VI, which came into force in the United States on January 8, 2009.
In addition to Annex VI, there are regional mandates in ports and certain territorial waters within the EU regarding reduced SOx emissions. These requirements establish maximum allowable limits for sulfur content in fuel oils used by vessels when operating within certain areas and waters and while “at berth.” In December 2012, an EU directive that aligned the EU requirements with Annex VI entered into force. For vessels at berth in EU ports, sulfur content of fuel oil is limited to 0.1%. For vessels operating in SOx Emission Control Areas (“SECAs”), sulfur content of fuel oil is limited to 1% as of June 18, 2014, which was reduced to 0.1% as of January 1, 2015. For vessels operating outside SECAs, sulfur content of fuel oil is limited to 3.5% as of June 18, 2014, further reducing to 0.5% as of January 1, 2020. Alternatively, emission abatement methods are permitted as long as they continuously achieve reductions of SOx emissions that are at least equivalent to those obtained using compliant marine fuels.
More stringent Tier III emission limits are applicable to engines installed on a ship constructed on or after January 1, 2016 operating in ECAs. NOx emission Tier III standards came into force on January 1, 2016 in ECAs.
Additional air emission requirements under Annex VI became effective on July 1, 2010 mandating the development of Volatile Organic Compound (“VOC”) Management Plans for tank vessels and certain gas ships.
In July 2011, the IMO further amended Annex VI to include energy efficiency standards for “new ships” through the designation of an EEDI. The EEDI standards apply to new ships of 400 gross tons or above (except those with diesel-electric, turbine or hybrid propulsion systems). “New ships” for purposes of this standard are those for which the building contract was placed on or after January 1, 2013; or in the absence of a building contract, the keel of which is laid or which is at a similar stage of construction on or after July 1, 2013; or the delivery of which is on or after July 1, 2015. The EEDI standards phase in from 2013 to 2025 and are anticipated to result in significant reductions in fuel consumption, as well as air and marine pollution. In 2011, IMO’s Greenhouse Gas Work Group agreed on Ship Energy Efficiency Management Plan (“SEEMP”) development guidelines, which were provided by the MEPC, Resolution MEPC.213 (63), which adopted the 2012 development guidelines on March 2, 2012, entered into force on January 1, 2013. The SEEMP, unlike the EEDI, applies to all ships of 400 gross tons and above. The verification of the requirement to have a SEEMP on board shall take place at the first or intermediate or renewal survey, whichever is the first, on or after January 1, 2013. Each of the vessels technically managed by the Company has a SEEMP, which was prepared in accordance with these development guidelines and addresses technically viable options that create value added strategies to reduce the vessels’ energy footprint through the implementation of specific energy saving measures. An Energy Efficiency Certificate (“IEEC”) is to be issued for both new and existing ships of 400 gross tons or above. The IEEC shall be issued once for each ship and shall be valid throughout its lifetime, until the ship is withdrawn from service or unless a new certificate is issued following a major conversion of the ship, or until transfer of the ship to the flag of another state.
The Company believes that its vessels are compliant with the current requirements of Annex VI and that those of its vessels that operate in the EU are also compliant with the regional mandates applicable there. However, the Company anticipates that, in the next several years, compliance with the increasingly stringent requirements of Annex VI and other conventions, laws and regulations imposing air emission standards that have already been adopted or that may be adopted will require substantial additional capital and/or operating expenditures and could have operational impacts on OSG’s business. Although OSG cannot predict such expenditures and impacts with certainty at this time, they may be material to OSG’s financial statements.
| 11 | Overseas Shipholding Group, Inc. |
Security Regulations and Practices
Security at sea has been a concern to governments, shipping lines, port authorities and importers and exporters for years. Since the terrorist attacks of September 11, 2001, there have been a variety of initiatives intended to enhance vessel security. In 2002, the U.S. Maritime Transportation Security Act of 2002 (“MTSA”) came into effect and the USCG issued regulations in 2003 implementing certain portions of the MTSA by requiring the implementation of certain security requirements aboard vessels operating in waters subject to the jurisdiction of the United States. Similarly, in December 2002, a coalition of 150 IMO contracting states drafted amendments to SOLAS by creating a new subchapter dealing specifically with maritime security. This new subchapter, which became effective in July 2004, imposes various detailed security obligations on vessels and port authorities, most of which are contained in the International Ship and Port Facilities Security Code (the “ISPS Code”). The ISPS Code is applicable to all cargo vessels of 500 gross tons plus all passenger ships operating on international voyages, mobile offshore drilling units, as well as port facilities that service them. The objective of the ISPS Code is to establish the framework that allows detection of security threats and implementation of preventive measures against security incidents that can affect ships or port facilities used in international trade. Among other things, the ISPS Code requires the development of vessel security plans and compliance with flag state security certification requirements. To trade internationally, a vessel must attain an International Ship Security Certificate (“ISSC”) from a recognized security organization approved by the vessel's flag state.
All of OSG’s vessels have developed and implemented vessel security plans that have been approved by the appropriate regulatory authorities, have obtained ISSCs and comply with applicable security requirements.
The Company monitors the waters in which its vessels operate for pirate activity. Company vessels that transit areas where there is a high risk of pirate activity follow best management practices for reducing risk and preventing pirate attacks and are in compliance with protocols established by the naval coalition protective forces operating in such areas.
INSPECTION BY CLASSIFICATION SOCIETIES
Every oceangoing vessel must be “classed” by a Classification Society. The Classification Society certifies that the vessel is “in class” signifying that the vessel has been built and maintained in accordance with the rules of the Classification Society and complies with applicable rules and regulations of the vessel’s country of registry and the international conventions of which that country is a member. In addition, where surveys are required by international conventions and corresponding laws and ordinances of a flag state, the Classification Society will undertake them on application or by official order, acting on behalf of the authorities concerned.
The Classification Society also undertakes on request other surveys and checks that are required by regulations and requirements of the flag state. These surveys are subject to agreements made in each individual case and/or to the regulations of the country concerned.
For maintenance of the class certification, regular and extraordinary surveys of hull, machinery, including the electrical plant, and any special equipment classed are required to be performed as follows:
| · | Annual Surveys. For seagoing ships, annual surveys are conducted for the hull and the machinery, including the electrical plant and where applicable for special equipment classed, at intervals of 12 months from the date of commencement of the class period indicated in the certificate. |
| · | Intermediate Surveys. Extended annual surveys are referred to as intermediate surveys and typically are conducted two and one-half years after commissioning and each class renewal. Intermediate surveys may be carried out on the occasion of the second or third annual survey. |
| · | Class Renewal Surveys. Class renewal surveys, also known as Special Surveys, are carried out for the ship’s hull, machinery, including the electrical plant, and for any special equipment classed, at the intervals indicated by the character of classification for the hull. At the special survey the vessel is thoroughly examined, including audio-gauging to determine the thickness of the steel structures. Should the thickness be found to be less than class requirements, the Classification Society would prescribe steel renewals. The Classification Society may grant a one-year grace period for completion of the special survey. Substantial amounts of money may have to be spent for steel renewals to pass a special survey if the vessel experiences excessive wear and tear. In lieu of the special survey every four or five years, depending on whether a grace period was granted, a shipowner has the option of arranging with the Classification Society for the vessel’s hull or machinery to be on a continuous survey cycle, in which every part of the vessel would be surveyed within a five-year cycle. Upon a shipowner’s request, the surveys required for class renewal may be split according to an agreed schedule to extend over the entire period of class survey period. This process is referred to as continuous class renewal. |
| 12 | Overseas Shipholding Group, Inc. |
Vessels are required to dry dock for inspection of the underwater hull at each intermediate survey and at each class renewal survey. For vessels less than 15 years old, Classification Societies permit for intermediate surveys in water inspections by divers in lieu of dry docking, subject to other requirements of such Classification Societies.
If defects are found during any survey, the Classification Society surveyor will issue a “recommendation” which must be rectified by the vessel owner within prescribed time limits.
Most insurance underwriters make it a condition for insurance coverage that a vessel be certified as “in class” by a Classification Society that is a member of the International Association of Classification Societies, or the IACS. In December 2013, the IACS adopted new harmonized Common Structure Rules, which will apply to crude oil tankers and dry bulk carriers to be constructed on or after July 1, 2015. All our vessels are currently, and we expect will be, certified as being “in class” by the American Bureau of Shipping, (“ABS”), a major classification society. All new and secondhand vessels that we acquire must be certified prior to their delivery under our standard purchase contracts and memorandum of agreement. If the vessel is not certified on the date of closing, we have no obligation to take delivery of the vessel.
Consistent with the currently prevailing practice in the industry, the Company presently carries protection and indemnity (“P&I”) insurance coverage for pollution of $1.0 billion per occurrence on every vessel in its fleet. P&I insurance is currently provided by three mutual protection and indemnity associations (“P&I Associations”), all of whom are members of the International Group. The P&I Associations that comprise the International Group insure approximately 90% of the world's commercial tonnage and have entered into a pooling agreement to reinsure each association's liabilities. Each P&I Association has capped its exposure to each of its members at approximately $7.5 billion. As a member of a P&I Association that is a member of the International Group, the Company is subject to calls payable to the P&I Associations based on its claim record as well as the claim records of all other members of the individual Associations of which it is a member, and the members of the pool of P&I Associations comprising the International Group. As of December 31, 2016, the Company was a member of three P&I Associations. Each of the Company’s vessels is insured by one of these three Associations with deductibles ranging from $0.025 million to $0.1 million per vessel per incident. While the Company has historically been able to obtain pollution coverage at commercially reasonable rates, no assurances can be given that such insurance will continue to be available in the future.
The Company carries marine hull and machinery and war risk (including piracy) insurance, which includes the risk of actual or constructive total loss, for all of its vessels. The vessels are each covered up to at least their fair market value, with deductibles ranging from $0.1 million to $0.125 million per vessel per incident. The Company is self-insured for hull and machinery claims in amounts in excess of the individual vessel deductibles up to a maximum aggregate loss of $.750 million per policy year.
The Company currently maintains loss of hire insurance to cover loss of charter income resulting from accidents or breakdowns of its three shuttle tankers. Loss of hire insurance covers up to 120 days lost charter income per vessel per incident in excess of the first 60 days lost for each covered incident, which is borne by the Company.
The following summary of the principal U.S. tax laws applicable to the Company, as well as the conclusions regarding certain issues of tax law, are based on the provisions of the U.S. Internal Revenue Code of 1986, as amended (the “Code”), existing and proposed U.S. Treasury Department regulations, administrative rulings, pronouncements and judicial decisions, all as of the date of this Annual Report on Form 10-K. No assurance can be given that changes in or interpretation of existing laws will not occur or will not be retroactive or that anticipated future circumstances will in fact occur.
All of the Company’s International Flag vessels were owned or operated by foreign corporations that are subsidiaries of INSW (a Marshall Islands corporation), which, prior to the spin-off from OSG, was a wholly owned subsidiary of the Company.
For taxable years beginning after December 31, 2004, the Company generally was not required to include the undistributed foreign shipping income earned by INSW in its taxable income on a current basis under the “Subpart F” provisions of the Code. However, as a result of borrowings from 2000 to 2011 under certain credit agreements, as well as intercompany balances, OSG was deemed to have received distributions that were subject to U.S. income taxes under Section 956 of the Code.
Taxation to INSW of its Shipping Income
INSW derived substantially all of its gross income from the use and operation of vessels in international commerce. This income principally consists of hire from time and voyage charters for the transportation of cargoes and the performance of services directly related thereto, which is referred to herein as “shipping income.”
| 13 | Overseas Shipholding Group, Inc. |
INSW was exempt from taxation on its U.S. source shipping income under Section 883 of the Code and Treasury regulations as it was a CFC and more than 50 percent of the total value of its stock was owned by OSG or certain other U.S. persons.
Taxation to OSG of INSW’s Shipping Income
The U.S. tax rules applicable to the income of the Company’s subsidiaries have undergone several changes over the years, with the result that different pools of earnings are subject to slightly different regimes, which are discussed below.
Foreign shipping income earned before 1976 was not subject to tax unless actually distributed to the United States. For taxable years beginning on or after January 1, 1976 and ending on or before December 31, 1986, the Company did not include in income the undistributed shipping income of its foreign subsidiaries that was reinvested in so-called “qualified shipping assets.” For taxable years beginning on or after January 1, 1987, the Company was required to include in income the deferred shipping income from this pre-1987 period to the extent that, at the end of any year, the investment in qualified shipping assets was less than the Company’s amount of qualified shipping assets at December 31, 1986. The Company did maintain its investments in qualified shipping assets in excess of it pre-1987 deferred shipping income up to November 30, 2016, the date of the spin-off of INSW.
For taxable years beginning on or after January 1, 1987 and ending on or before December 31, 2004, the Company was subject to current taxation on the shipping income of its foreign subsidiaries. However, for years beginning on or after January 1, 2005, the Company was generally not required to include in taxable income INSW’s undistributed shipping income unless INSW repatriated cash and assets held outside the United States in excess of its previously taxed income.
U.S. Tonnage Tax Regime
The Company made an election to have the foreign operations of the Company’s U.S. Flag vessels taxed under a “tonnage tax” regime rather than the usual U.S. corporate income tax regime. As a result, the Company’s gross income for U.S. income tax purposes with respect to eligible U.S. Flag vessels for 2005 and subsequent years does not include (1) income from qualifying shipping activities in U.S. foreign trade (i.e., transportation between the United States and foreign ports or between foreign ports), (2) income from cash, bank deposits and other temporary investments that are reasonably necessary to meet the working capital requirements of qualifying shipping activities, and (3) income from cash or other intangible assets accumulated pursuant to a plan to purchase qualifying shipping assets. The Company’s taxable income with respect to the operations of its eligible U.S. Flag vessels, of which there are two, is based on a “daily notional taxable income,” which is taxed at the highest U.S. corporate income tax rate. The daily notional taxable income from the operation of a qualifying vessel is 40 cents per 100 tons of the net tonnage of the vessel up to 25,000 net tons, and 20 cents per 100 tons of the net tonnage of the vessel in excess of 25,000 net tons. The taxable income of each qualifying vessel is the product of its daily notional taxable income and the number of days during the taxable year that the vessel operates in U.S. foreign trade.
Tax Treatment of the Spin-Off
Although the matter is not entirely free from doubt, we believe that the spin-off of INSW likely did not qualify under Section 355 of the Code as a tax-free corporate division, because among other matters, we believe that INSW would not be viewed as engaged in an “active trade or business” within the meaning of that Code section. Accordingly, this discussion assumes that Section 355 did not apply to the spin-off and that, as a result, the spin-off will be treated for U.S. federal income tax purposes as a taxable distribution by OSG to OSG’s common stockholders and warrant holders (together, “OSG equity holders”) in an amount equal to the fair market value of the shares of INSW Common Stock received by such OSG equity holders, determined as of the date of spin-off.
OSG would be required to recognize any taxable gain, but would not be permitted to recognize any taxable loss, with respect to INSW common stock that it distributed in the spin-off. Because we believe that OSG’s basis in the INSW common stock exceeded the fair market value of the INSW stock as of the date of the spin-off, we do not believe that OSG will be required to recognize any taxable gain on account of the spin-off.
| 14 | Overseas Shipholding Group, Inc. |
The following important risk factors could cause actual results to differ materially from those contained in the forward-looking statements made in this report or presented elsewhere by management from time to time. If any of the circumstances or events described below actually arise or occur, the Company’s business, results of operations and financial condition could be materially adversely affected. Actual dollar amounts are used in this Item 1 A. “Risk Factors” section.
Risks Related to Our Industry
The highly cyclical nature of the industry may lead to volatile changes in charter rates and vessel values, which could adversely affect the Company’s earnings and available cash.
The tanker industry is both cyclical and volatile in terms of charter rates and profitability. Fluctuations in charter rates and vessel values result from changes in supply and demand both for tanker capacity and for oil and oil products. Factors affecting these changes in supply and demand are generally outside of the Company’s control. The nature, timing and degree of changes in industry conditions are unpredictable and could adversely affect the values of the Company’s vessels or result in significant fluctuations in the amount of charter revenues the Company earns, which could result in significant volatility in OSG’s quarterly results and cash flows. Factors influencing the demand for tanker capacity include:
| · | supply and demand for, and availability of, energy resources such as oil, oil products and natural gas, which affect customers’ need for vessel capacity; |
| · | global and regional economic and political conditions, including armed conflicts, terrorist activities and strikes, that among other things could impact the supply of oil, as well as trading patterns and the demand for various vessel types; |
| · | regional availability of refining capacity and inventories; |
| · | changes in the production levels of crude oil (including in particular production by OPEC, the United States and other key producers); |
| · | changes in seaborne and other transportation patterns, including changes in the distances that cargoes are transported, changes in the price of crude oil and changes to the West Texas Intermediate and Brent Crude Oil pricing benchmarks; |
| · | environmental and other legal and regulatory developments and concerns; |
| · | construction or expansion of new or existing pipelines or railways; |
| · | weather and natural disasters; |
| · | competition from alternative sources of energy; and |
| · | international sanctions, embargoes, import and export restrictions or nationalizations and wars. |
Factors influencing the supply of vessel capacity include:
| · | the number of newbuilding deliveries; |
| · | the scrapping rate of older vessels; |
| · | the number of vessels being used for storage; |
| · | the conversion of vessels from transporting oil and oil products to carrying dry bulk cargo or vice versa; |
| · | the number of vessels that are removed from service; |
| · | availability and pricing of other energy sources such as natural gas for which tankers can be used or to which construction capacity may be dedicated; |
| 15 | Overseas Shipholding Group, Inc. |
| · | port or canal congestion; and |
| · | environmental and maritime regulations. |
Many of the factors that influence the demand for tanker capacity will also, in the longer term, effectively influence the supply of tanker capacity, since decisions to build new capacity, invest in capital repairs, or to retain in service older obsolescent capacity are influenced by the general state of the marine transportation industry from time to time.
The market value of vessels fluctuates significantly, which could adversely affect OSG’s liquidity or otherwise adversely affect its financial condition.
The market value of vessels has fluctuated over time. The fluctuation in market value of vessels over time is based upon various factors, including:
| · | age of the vessel; |
| · | general economic and market conditions affecting the tanker industry, including the availability of vessel financing; |
| · | number of vessels in the Jones Act fleet; |
| · | types and sizes of vessels available; |
| · | changes in trading patterns affecting demand for particular sizes and types of vessels; |
| · | cost of newbuildings; |
| · | prevailing level of charter rates; |
| · | competition from other shipping companies and from other modes of transportation; and |
| · | technological advances in vessel design and propulsion. |
Jones Act vessel market values have, on average, generally declined over the past several years. In addition, as vessels grow older, they generally decline in value. These factors will affect the value of the Company’s vessels at the time of any vessel sale. If OSG sells a vessel at a sale price that is less than the vessel’s carrying amount on the Company’s financial statements, OSG will incur a loss on the sale and a reduction in earnings and surplus. In addition, declining values of the Company’s vessels could adversely affect the Company’s liquidity by limiting its ability to raise cash by refinancing vessels.
Declines in charter rates and other market deterioration could cause OSG to incur impairment charges.
The Company evaluates events and changes in circumstances that have occurred to determine whether they indicate that the carrying amount of the vessel assets might not be recoverable. This review for potential impairment indicators and projection of future cash flows related to the vessels is complex and requires the Company to make various estimates, including future freight rates, earnings from the vessels, market appraisals and discount rates. All of these items have historically been volatile. The Company evaluates the recoverable amount of a vessel asset as the sum of its undiscounted estimated future cash flows. If the recoverable amount is less than the vessel’s carrying amount, the vessel’s carrying amount is then compared to its estimated fair value, which is determined using vessel appraisals or discounted estimated future cash flows. If the vessel’s carrying amount is less than its fair value, it is deemed impaired. The carrying values of the Company’s vessels may differ significantly from their fair market value. Impairment charges aggregating $104.4 million on seven of the Company’s eight rebuilt Jones Act ATBs were recorded during 2016.
An increase in the supply of vessels without a commensurate increase in demand for such vessels could cause charter rates to decline, which could adversely affect OSG’s revenues, profitability and cash flows, as well as the value of its vessels.
The marine transportation industry has historically been highly cyclical, as the profitability and asset values of companies in the industry have fluctuated based on changes in the supply and demand of vessels. If the number of new ships of a particular class delivered exceeds the number of vessels of that class being scrapped, available capacity in that class will increase. In the U.S. domestic market, as of December 31, 2016, there were firm orders to build five tankers and four ATBs, representing approximately 10% of the existing Jones Act fleet of Product Carriers and large ATBs (defined as vessels having carrying capacities of between 0.14 million barrels and 0.35 million barrels, which excludes numerous tank barges below 0.14-million- barrel capacity and 11 much larger tankers dedicated exclusively to the Alaskan crude oil trade). Given the smaller number of tankers operating in the U.S. domestic market, even a limited increase in capacity supply may negatively impact the market and may have a material adverse effect on OSG’s revenues, profitability and cash flows.
| 16 | Overseas Shipholding Group, Inc. |
Shipping is a business with inherent risks, and OSG’s insurance may not be adequate to cover its losses.
OSG’s vessels and their cargoes are at risk of being damaged or lost because of events including, but not limited to:
| · | marine disasters; |
| · | bad weather; |
| · | mechanical failures; |
| · | human error; |
| · | war, terrorism and piracy; |
| · | grounding, fire, explosions and collisions; and |
| · | other unforeseen circumstances or events. |
In addition, transporting crude oil is at risk of business interruptions due to labor strikes, port closings and boycotts. These hazards may result in death or injury to persons; loss of revenues or property; environmental damage; higher insurance rates; damage to OSG’s customer relationships; and market disruptions, delay or rerouting, which may also subject OSG to litigation. In addition, the operation of tankers has unique operational risks associated with the transportation of oil. An oil spill may cause significant environmental damage and the associated costs could exceed the insurance coverage available to the Company. Compared to other types of vessels, tankers are also exposed to a higher risk of damage and loss by fire, whether ignited by a terrorist attack, collision, or other cause, due to the high flammability and high volume of the oil transported in tankers. Furthermore, any such incident could seriously damage OSG’s reputation and cause OSG either to lose business or to be less likely to enter into new business (either because of customer concerns or changes in customer vetting processes). Any of these events could result in loss of revenues, decreased cash flows and increased costs.
While the Company carries insurance to protect against certain risks involved in the conduct of its business, risks may arise against which the Company is not adequately insured. For example, a catastrophic spill could exceed OSG’s $1 billion per vessel insurance coverage and have a material adverse effect on its operations. There are certain liability limits and standards established under OPA 90 and CERCLA that may impact our operations. See Item 1. “U.S. Environmental and Safety Regulations and Standards” above for additional information. In addition, OSG may not be able to procure adequate insurance coverage at commercially reasonable rates in the future, and OSG cannot guarantee that any particular claim will be paid by its insurers. In the past, new and stricter environmental regulations have led to higher costs for insurance covering environmental damage or pollution, and new regulations could lead to similar increases or even make this type of insurance unavailable. Furthermore, even if insurance coverage is adequate to cover the Company’s losses, OSG may not be able to timely obtain a replacement ship in the event of a loss. OSG may also be subject to calls, or premiums, in amounts based not only on its own claim records but also the claim records of all other members of the protection and indemnity associations through which OSG obtains insurance coverage for tort liability. OSG’s payment of these calls could result in significant expenses which would reduce its profits and cash flows or cause losses.
Constraints on capital availability have adversely affected the tanker industry and OSG’s business.
Constraints on capital that have occurred during recent years have adversely affected the financial condition of certain of the Company’s customers, financial lenders and suppliers. Entities that suffer a material adverse impact on their financial condition may be unable or unwilling to comply with their contractual commitments to OSG including the refusal or inability of customers to pay charter hire to OSG or the inability or unwillingness of financial lenders to honor their commitments to lend funds. While OSG seeks to monitor the financial condition of its customers, financial lenders and suppliers, the availability and accuracy of information about the financial condition of such entities and the actions that OSG may take to reduce possible losses resulting from the failure of such entities to comply with their contractual obligations may be limited. Any such failure could have a material adverse effect on OSG’s revenues, profitability and cash flows. In addition, adverse financial conditions may inhibit these entities from entering into new commitments with OSG, which could also have a material adverse effect on OSG’s revenues, profitability and cash flows.
| 17 | Overseas Shipholding Group, Inc. |
The Company also faces other potential constraints on capital relating to counterparty credit risk and constraints on OSG’s ability to borrow funds. See also, “Risk Factors-Risks Related to Our Company ___ The Company is subject to credit risks with respect to its counterparties on contracts and any failure by these counterparties to meet their obligations could cause the Company to suffer losses on such contracts, decreasing revenues and earnings” and “ Risks Related to Our Company ___ OSG has incurred significant indebtedness which could affect its ability to finance its operations, pursue desirable business opportunities and successfully run its business in the future, all of which could affect OSG’s ability to fulfill its obligations under that indebtedness.”
The current state of the financial markets and current economic conditions may adversely impact the Company’s ability to obtain additional financing on acceptable terms and otherwise negatively impact the Company’s business.
Financial markets and economic conditions have been, and continue to be, volatile. In recent years, businesses in the economy have faced tightening credit, weakening demand for goods and services, deteriorating liquidity conditions, volatile interest rates, and declining markets. There has been a general decline in the willingness of banks and other financial institutions to extend credit, particularly in the shipping industry, due to the historically volatile asset values of vessels. As the shipping industry is highly dependent on the availability of credit to finance and expand operations, companies within the shipping industry have been negatively affected by this decline.
Also, as a result of concerns about the stability of financial markets generally and the solvency of counterparties specifically, the cost of obtaining money from the credit markets has increased as many lenders have increased interest rates, enacted tighter lending standards, refused to refinance existing debt at all or on terms similar to current debt and reduced, and in some cases ceased to provide, funding to borrowers. Due to these factors, additional financing may not be available if needed and to the extent required, on acceptable terms or at all. If additional financing is not available when needed, or is available only on unfavorable terms, the Company may be unable to meet its obligations as they come due or the Company may be unable to execute its business strategy, complete additional vessel acquisitions, or otherwise take advantage of potential business opportunities as they arise.
OSG conducts certain of its operations internationally, which subjects the Company to changing economic, political and governmental conditions abroad that may adversely affect its business.
The Company conducts certain of its operations internationally, and its business, financial condition, results of operations and cash flows may be adversely affected by changing economic, political and government conditions in the countries and regions where its vessels are employed.
OSG must comply with complex foreign and U.S. laws and regulations, such as the U.S. Foreign Corrupt Practices Act, the U.K. Bribery Act and other local laws prohibiting corrupt payments to government officials, anti-money laundering laws; and anti-competition regulations. Moreover, the shipping industry is generally considered to present elevated risks in these areas. Violations of these laws and regulations could result in fines and penalties, criminal sanctions, restrictions on the Company’s business operations and on the Company’s ability to transport cargo to one or more countries, and could also materially affect the Company’s brand, ability to attract and retain employees, international operations, business and operating results. Although OSG has policies and procedures designed to achieve compliance with these laws and regulations, OSG cannot be certain that its employees, contractors, joint venture partners or agents will not violate these policies and procedures. OSG’s operations may also subject its employees and agents to extortion attempts.
Changes in fuel prices may adversely affect profits.
Fuel is a significant, if not the largest, expense in the Company’s shipping operations when vessels are under voyage charter. Accordingly, an increase in the price of fuel may adversely affect the Company’s profitability if these increases cannot be passed onto customers. The price and supply of fuel is unpredictable and fluctuates based on events outside the Company’s control, including geopolitical developments; supply and demand for oil and gas; actions by OPEC, and other oil and gas producers; war and unrest in oil producing countries and regions; regional production patterns; and environmental concerns. Fuel may become much more expensive in the future, which could reduce the profitability and competitiveness of the Company’s business compared to other forms of transportation.
Public health threats could have an adverse effect on the Company’s operations and financial results.
Public health threats and other highly communicable diseases, outbreaks of which have already occurred in various parts of the world near where OSG operates, could adversely impact the Company’s operations, the operations of the Company’s customers and the global economy, including the worldwide demand for crude oil and the level of demand for OSG’s services. Any quarantine of personnel, restrictions on travel to or from countries in which OSG operates, or inability to access certain areas could adversely affect the Company’s operations. Travel restrictions, operational problems or large-scale social unrest in any part of the world in which OSG operates, or any reduction in the demand for tanker services caused by public health threats in the future, may impact OSG’s operations and adversely affect the Company’s financial results.
| 18 | Overseas Shipholding Group, Inc. |
Acts of piracy on ocean-going vessels could adversely affect the Company’s business.
Although the Company’s fleet operates mainly in U.S. waters, there are occasions when a vessel may be in an area where pirate attacks are a concern. The frequency of pirate attacks on seagoing vessels remains high, particularly in the western part of the Indian Ocean, off the west coast of Africa and in the South China Sea. If piracy attacks result in regions in which the Company’s vessels are deployed being characterized by insurers as “war risk” zones, as the Gulf of Aden has been, or Joint War Committee “war and strikes” listed areas, premiums payable for insurance coverage could increase significantly, and such insurance coverage may become difficult to obtain. Crew costs could also increase in such circumstances due to risks of piracy attacks.
In addition, while OSG believes the charterer remains liable for charter payments when a vessel is seized by pirates, the charterer may dispute this and withhold charter hire until the vessel is released. A charterer may also claim that a vessel seized by pirates was not “on-hire” for a certain number of days and it is therefore entitled to cancel the charter party, a claim the Company would dispute. The Company may not be adequately insured to cover losses from these incidents, which could have a material adverse effect on the Company. In addition, hijacking as a result of an act of piracy against the Company’s vessels, or an increase in the cost (or unavailability) of insurance for those vessels, could have a material adverse impact on OSG’s business, financial condition, results of operations and cash flows. Such attacks may also impact the Company’s customers, which could impair their ability to make payments to the Company under its charters.
Terrorist attacks and international hostilities and instability can affect the tanker industry, which could adversely affect OSG’s business.
Terrorist attacks, the outbreak of war, or the existence of international hostilities could damage the world economy, adversely affect the availability of and demand for crude oil and petroleum products and adversely affect both the Company’s ability to charter its vessels and the charter rates payable under any such charters. In addition, OSG operates in a sector of the economy that is likely to be adversely impacted by the effects of political instability, terrorist or other attacks, war or international hostilities. In the past, political instability has also resulted in attacks on vessels, mining of waterways and other efforts to disrupt international shipping, particularly in the Arabian Gulf region. These factors could also increase the costs to the Company of conducting its business, particularly crew, insurance and security costs, and prevent or restrict the Company from obtaining insurance coverage, all of which could have a material adverse effect on OSG’s business, financial condition, results of operations and cash flows.
Risks Related to Our Company
As a result of the spin-off of INSW on November 30, 2016, OSG’s historical financial information may not be a reliable indicator of OSG’s future financial results and the spin-off may adversely affect OSG’s business.
In accordance with Accounting Standards Update 2014-08, Reporting Discontinued Operations and Disclosures of Disposals of Components of an Entity, the assets and liabilities and results of operations of INSW are reported as discontinued operations for all periods presented. Accordingly, all references made to financial data in this Annual Report on Form 10-K are to OSG’s continuing operations, unless specifically noted. Accordingly, the historical financial information included in this Annual Report does not necessarily reflect the financial condition, operating performance or cash flows that OSG would have achieved without INSW as a wholly owned subsidiary during the periods presented or those that OSG will achieve in the future, including as a result of the following factors:
| · | Prior to the spin-off, OSG or one of its affiliates performed various corporate functions for INSW, such as treasury, accounting, auditing, legal, investor relations and finance. OSG’s historical results reflect allocations of corporate expenses to INSW for such functions. In connection with the spin-off, OSG may incur additional expenses for such services after the spin-off. |
| · | As a result of the spin-off, the cost of capital of OSG’s business may be higher than its cost of capital prior to the spin-off. |
OSG may not be able to achieve the full strategic and financial benefits expected to result from the spin-off or such benefits may be delayed or not occur at all. The anticipated benefits may not be achieved for a variety of reasons, including among others:
| · | The separation of our business from INSW and provision of services to INSW under the Transition Services Agreement require significant amounts of management’s time and effort in developing standalone organizations which may divert management’s attention from operating and growing OSG’s business; |
| · | Following the spin-off, OSG may be more susceptible to market fluctuations and other adverse events than if INSW was still a part of OSG; and |
| · | Following the spin-off, OSG’s business is less diversified and has a more concentrated exposure to U.S specific risks such as the Jones Act market than prior to the spin-off. |
If OSG fails to achieve some or all of the benefits to result from the spin-off, or if such benefits are delayed, it could have an adverse effect on OSG’s competitive position, financial condition, operating results or cash flows.
| 19 | Overseas Shipholding Group, Inc. |
OSG has incurred significant indebtedness which could affect its ability to finance its operations, pursue desirable business opportunities and successfully run its business in the future, all of which could affect OSG’s ability to fulfill its obligations under that indebtedness.
As of December 31, 2016, OSG had $525.1 million of outstanding indebtedness. OSG’s substantial indebtedness and interest expense could have important consequences, including:
| · | limiting OSG’s ability to use a substantial portion of its cash flow from operations in other areas of its business, including for working capital, capital expenditures and other general business activities, because OSG must dedicate a substantial portion of these funds to service its debt; |
| · | to the extent OSG’s future cash flows are insufficient, requiring the Company to seek to incur additional indebtedness in order to make planned capital expenditures and other expenses or investments; |
| · | limiting OSG’s ability to obtain additional financing in the future for working capital, capital expenditures, debt service requirements, acquisitions, and other expenses or investments planned by the Company; |
| · | limiting the Company’s flexibility and ability to capitalize on business opportunities and to react to competitive pressures and adverse changes in government regulation, and OSG’s business and industry; |
| · | limiting OSG’s ability to satisfy its obligations under its indebtedness; |
| · | increasing OSG’s vulnerability to a downturn in its business and to adverse economic and industry conditions generally; |
| · | placing OSG at a competitive disadvantage as compared to its less-leveraged competitors; |
| · | limiting the Company’s ability, or increasing the costs, to refinance indebtedness; and |
| · | limiting the Company’s ability to enter into hedging transactions by reducing the number of counterparties with whom OSG can enter into such transactions as well as the volume of those transactions. |
OSG’s ability to continue to fund its obligations and to reduce debt may be affected by general economic, financial market, competitive, legislative and regulatory factors, among other things. An inability to fund the Company’s debt requirements or reduce debt could have a material adverse effect on OSG’s business, financial condition, results of operations and cash flows.
Additionally, the actual or perceived credit quality of the Company’s charterers (as well as any defaults by them) could materially affect the Company’s ability to obtain the additional capital resources that it will require to purchase additional vessels or significantly increase the costs of obtaining such capital. The Company’s inability to obtain additional financing at a higher-than-anticipated cost, or at all, could materially affect the Company’s results of operation and its ability to implement its business strategy.
The Company may not be able to generate sufficient cash to service all of its indebtedness, and could in the future breach covenants in its credit facilities and term loans.
The Company’s earnings, cash flow and the market value of its vessels vary significantly over time due to the cyclical nature of the tanker industry, as well as general economic and market conditions affecting the industry. As a result, the amount of debt that OSG can manage in some periods may not be appropriate in other periods and its ability to meet the financial covenants to which it is subject or may be subject in the future may vary. Additionally, future cash flow may be insufficient to meet the Company’s debt obligations and commitments. Any insufficiency could negatively impact OSG’s business.
The OBS Term Loan and the ABL Facility contain certain restrictions relating to new borrowings and, the movement of funds between OBS and OSG, as set forth in the loan agreement. Furthermore, drawdowns under the OBS ABL Facility borrowings are limited based upon the available borrowing base, as defined in that loan agreement and, if availability falls below a certain amount for a specified period of time, the administrative agent could exercise cash dominion rights permitting it to invoke control rights over certain of our accounts. While the Company was in compliance with these requirements as of December 31, 2016, a decrease in vessel values could cause the Company to breach certain covenants its existing credit facilities and term loans, or in future financing agreements that the Company may enter into from time to time. If the Company breaches such covenants and is unable to remedy the relevant breach or obtain a waiver, the Company’s lenders could accelerate its debt and foreclose on the Company’s owned vessels.
| 20 | Overseas Shipholding Group, Inc. |
A range of economic, competitive, financial, business, industry and other factors will affect future financial performance, and, accordingly, the Company’s ability to generate cash flow from operations and to pay debt. Many of these factors, such as charter rates, economic and financial conditions in the tanker industry and the economy or competitive initiatives of competitors, are beyond the Company’s control. If OSG does not generate sufficient cash flow from operations to satisfy its debt obligations, it may have to undertake alternative financing plans, such as:
| · | refinancing or restructuring its debt; |
| · | selling tankers or other assets; |
| · | reducing or delaying investments and capital expenditures; or |
| · | seeking to raise additional capital. |
Undertaking alternative financing plans, if necessary, might not allow OSG to meet its debt obligations. The Company’s ability to restructure or refinance its debt will depend on the condition of the capital markets, its access to such markets and its financial condition at that time. The 8.125% unsecured Notes will mature on March 30, 2018. To remain in compliance with the OBS ABL Facility, the Company’s current plan is to pay off or refinance the outstanding balance on its 8.125% unsecured Notes by December 29, 2017. Any refinancing of debt could be at higher interest rates and might require the Company to comply with more onerous covenants, which could further restrict OSG’s business operations. In addition, the terms of existing or future debt instruments may restrict OSG from adopting certain alternatives. These alternative measures may not be successful and may not permit OSG to meet its scheduled debt service obligations. The Company’s inability to generate sufficient cash flow to satisfy its debt obligations, to meet the covenants of its credit agreements and term loans and/or to obtain alternative financing in such circumstances, could materially and adversely affect OSG’s business, financial condition, results of operations and cash flows.
The Company will be required to make additional capital expenditures to expand the number of vessels in its fleet and to maintain all of its vessels, which depend on additional financing.
The Company has not started or completed construction on any vessels during the five years ended December 31, 2016. The Company’s business strategy is based in part upon the expansion of its fleet through the purchase of additional vessels at attractive points. If OSG is unable to fulfill its obligations under any memorandum of agreement or newbuilding construction contract for future vessel acquisitions, the sellers of such vessels may be permitted to terminate such contracts and the Company may be required to forfeit all or a portion of the down payments it made under such contracts and it may also be sued for any outstanding balance. In addition, as a newbuilding vessel must be drydocked within five years of its delivery from a shipyard, with survey cycles of no more than 60 months for the first three surveys, and 30 months thereafter, not including any unexpected repairs, the Company will incur significant maintenance costs for its existing and any newly-acquired vessels. As a result, if the Company does not utilize its vessels as planned, these maintenance costs could have material adverse effects on the Company’s business, financial condition, results of operations and cash flows.
OSG may not be able to renew Time Charters when they expire or enter into new Time Charters.
OSG’s ability to renew expiring contracts or obtain new charters will depend on the prevailing market conditions at the time of renewal. As of December 31, 2016, OSG employed 16 vessels on Time Charters, with eight of those charters expiring in 2017, five expiring in 2018, one expiring in 2019, one expiring in 2020 and one expiring in 2025. The Company’s existing Time Charters may not be renewed at comparable rates or if renewed or entered into, those new contracts may be at less favorable rates. In addition, there may be a gap in employment of vessels between current charters and subsequent charters. If at a time when OSG is seeking to arrange new charters for its vessels, market participants expect that less capacity will be necessary in the future (for example, if it is expected that oil and natural gas prices will decrease in the future, which could suggest that future oil and gas production levels will decline from then-current levels), OSG may not be able to obtain charters at attractive rates or at all. If, upon expiration of the existing Time Charter, OSG is unable to obtain Time Charters or Voyage Charters at desirable rates, the Company’s business, financial condition, results of operations and cash flows may be adversely affected.
In the highly competitive Jones Act market, OSG may not be able to compete effectively for charters.
The Company’s vessels are employed in a highly competitive market. Competition arises from other vessel owners, including major oil companies, which may have substantially greater resources than OSG does. Competition for the transportation of crude oil and other petroleum products depends on price, location, size, age, condition, and the acceptability of the vessel operator to the charterer. To the extent OSG enters into new geographic regions or provides new services, it may not be able to compete profitably. New markets may involve competitive factors that differ from those of the Company’s current markets, and the competitors in those markets may have greater financial strength and capital resources than OSG does.
| 21 | Overseas Shipholding Group, Inc. |
OSG may not realize the benefits it expects from past acquisitions or acquisitions or other strategic transactions it may make in the future.
OSG’s business strategy includes ongoing efforts to engage in material acquisitions of assets or ownership interests in entities in the tanker industry and of individual tankers. The success of OSG’s acquisitions will depend upon a number of factors, some of which may not be within its control. These factors include OSG’s ability to:
| · | identify suitable tankers and/or shipping companies for acquisitions at attractive prices, which may not be possible if asset prices rise too quickly; |
| · | obtain financing; |
| · | identify businesses engaged in managing, operating or owning tankers for acquisitions or joint ventures; |
| · | integrate any acquired tankers or businesses successfully with the OSG’s then-existing operations; and |
| · | enhance OSG’s customer base. |
OSG intends to finance these acquisitions by using available cash from operations and through incurrence of debt or bridge financing, either of which may increase its leverage ratios, or by issuing equity, which may have a dilutive impact on its existing shareholders. At any given time, OSG may be engaged in a number of discussions that may result in one or more acquisitions, some of which may be material to OSG as a whole. These opportunities require confidentiality and may involve negotiations that require quick responses by OSG. Although there can be no certainty that any of these discussions will result in definitive agreements or the completion of any transactions, the announcement of any such transaction may lead to increased volatility in the trading price of OSG’s securities.
Acquisitions and other transactions can also involve a number of special risks and challenges, including:
| · | diversion of management time and attention from the Company’s existing business and other business opportunities; |
| · | delays in closing or the inability to close an acquisition for any reason, including third-party consents or approvals; |
| · | any unanticipated negative impact on the Company of disclosed or undisclosed matters relating to any vessels or operations acquired; and |
| · | assumption of debt or other liabilities of the acquired business, including litigation related to the acquired business. |
The success of acquisitions or strategic investments depends on the effective integration of newly acquired businesses or assets into OSG’s current operations. Such integration is subject to risks and uncertainties, including realization of anticipated synergies and cost savings, the ability to retain and attract personnel and clients, the diversion of management’s attention from other business concerns, risk of non-compliance with internal controls over financial reporting for an acquired company, in accordance with the Sarbanes-Oxley Act and undisclosed or potential legal liabilities of the acquired company or asset. OSG may not realize the strategic and financial benefits that it expects from any of its past acquisitions, or any future acquisitions. Further, if a portion of the purchase price of a business is attributable to goodwill and if the acquired business does not perform up to expectations at the time of the acquisition some or all of the goodwill may be written off, adversely affecting OSG’s earnings. OSG has recorded material write-offs of goodwill and intangible assets in prior years related to earlier acquisitions it consummated.
Changes in demand in specialized markets in which the Company currently trades may lead the Company to redeploy certain vessels to other markets.
The Company deploys its vessels in several specialized markets, including, without limitation, Lightering in the Delaware Bay. The Company conducts those Lightering operations with two ATBs which were constructed using funds withdrawn from the CCF. If there is lower demand in these markets, the Company may have to consider redeploying these two ATBs in other markets. If that occurs, the Company may not be able to compete profitably in the new markets, and the ATBs may not be able to be redeployed to new markets without substantial modification. In addition, we would be required to pay daily liquidated damages to MARAD if those vessels were deployed in the contiguous coastwise trades.
| 22 | Overseas Shipholding Group, Inc. |
Operating costs and capital expenses will increase as the Company’s vessels age and may also increase due to unanticipated events relating to secondhand vessels and the consolidation of suppliers.
In general, capital expenditures and other costs necessary for maintaining a vessel in good operating condition increase as the age of the vessel increases. As of December 31, 2016, the weighted average age of the Company’s total owned and operated fleet was 9.4 years, which is based on the vessels’ year of rebuild, where applicable. Cargo insurance rates are also expected to increase with the age of a vessel, since older vessels may be less desirable to charterers. Accordingly, it is likely that the operating costs of OSG’s currently operated vessels will increase. In addition, changes in governmental regulations and compliance with Classification Society standards may restrict the type of activities in which the vessels may engage and/or may require OSG to make additional expenditures for new equipment. Every commercial tanker must pass inspection by a Classification Society authorized by the vessel’s country of registry. The Classification Society certifies that a tanker is safe and seaworthy in accordance with the applicable rule and regulations of the country of registry of the tanker and the international conventions of which that country is a number. If a Classification Society requires the Company to add equipment, OSG may be required to incur substantial costs or take its vessels out of service. Market conditions may not justify such expenditures or permit OSG to operate its older vessels profitably even if those vessels remain operational. If a vessel in OSG’s fleet does not maintain its class and/or fails any survey, it will be unemployable and unable to trade between ports. This would negatively impact the Company’s results of operation.
Furthermore, recent mergers have reduced the number of available suppliers, resulting in fewer alternatives for sourcing key supplies. With respect to certain items, OSG is generally dependent upon the original equipment manufacturer for repair and replacement of the item or its spare parts. Supplier consolidation may result in a shortage of supplies and services, thereby increasing the cost of supplies or potentially inhibiting the ability of suppliers to deliver on time. These cost increases or delays could result in downtime, and delays in the repair and maintenance of the Company’s vessels and have a material adverse effect on OSG’s business, financial condition, results of operations and cash flows.
The Company derives a substantial portion of its revenue from a limited number of customers, and the loss of, or reduction in business by, any of these customers could materially adversely affect its business, financial condition and results of operations.
The Company’s largest customers account for a significant portion of its revenues. The Company’s top five customers comprised approximately 59% of the Company’s revenues during 2016. The loss of, or reduction in business by, any of these customers could materially adversely affect the Company’s business, financial condition and results of operations.
The lifting of the U.S. crude oil export ban could adversely impact the Company.
Over the last four decades, the ability of U.S. producers to export domestic crude oil has been restricted by the U.S. government. In December 2015, the U.S. government enacted the Consolidated Appropriations Act, 2016, which, among other things, removed the restriction on the export of domestic crude oil from the United States. The removal of the crude oil export restrictions may result in a continuing decline in demand for coastwise transportation of crude oil, which may have an adverse impact on the Company.
Certain potential customers will not use vessels older than a specified age, even if they have been subsequently rebuilt.
All of the Company’s existing ATBs with the exception of the OSG Vision/OSG 350 and the OSG Horizon/OSG 351 were originally constructed more than 25 years ago. While all of these tug-barge units were rebuilt and double-hulled since 1998 and are “in-class,” meaning the vessel has been certified by a Classification Society as being built and maintained in accordance with the rules of that Classification Society and complies with the applicable rules and regulations of the vessel’s country of registry and applicable international conventions, some potential customers have stated that they will not charter vessels that are more than 20 years old, even if they have been rebuilt. Other customers may not continue to view rebuilt vessels as suitable. With an increase in the supply of newer vessels, customers may become more selective. If more customers differentiate rebuilt vessels, time charter rates for the Company’s rebuilt ATBs will likely be adversely affected.
The Company’s significant operating leases could be replaced on less favorable terms or may not be replaced.
The Company’s operating fleet includes ten vessels that have been chartered-in under operating leases. The significant operating leases of the Company in its various businesses expire at various points in the future and may not be replaced at all or on as favorable terms, which could have a material adverse effect on the Company’s future financial position, results of operations and cash flow.
| 23 | Overseas Shipholding Group, Inc. |
The Company is subject to credit risks with respect to its counterparties on contracts, and any failure by those counterparties to meet their obligations could cause the Company to suffer losses on such contracts, decreasing revenues and earnings.
The Company has entered into, and in the future will enter into, various contracts, including charter agreements and other agreements associated with the operation of its vessels. The Company charters its vessels to other parties, who pay the company a daily rate of hire. The Company also enters COAs and Voyage Charters. Historically, the Company has not experienced material problems collecting charter hire but the economic downturn of recent years has affected charterers more severely than the prior recessions that have occurred since the Company’s establishment more than 45 years ago. Additionally, the Company enters into derivative contracts (interest rate swaps and caps) from time to time. As a result, the Company is subject to credit risks. The ability of each of the Company’s counterparties to perform its obligations under a contract with it will depend on a number of factors that are beyond the Company’s control and may include, among other things, general economic conditions; availability of debt or equity financing; the condition of the maritime and offshore industries; the overall financial condition of the counterparty; charter rates received for specific types of vessels; and various expenses. Charterers are sensitive to the commodity markets and may be impacted by market forces affecting commodities such as oil. In addition, in depressed market conditions, the Company’s charterers and customers may no longer need a vessel that is currently under charter or contract or may be able to obtain a comparable vessel at lower rates. As a result, the Company’s customers may fail to pay charter hire or attempt to renegotiate charter rates. If the counterparties fail to meet their obligations, the Company could suffer losses on such contracts which would decrease revenues, cash flows and earnings.
The Company depends on its key personnel and may have difficulty attracting and retaining skilled employees.
OSG’s success depends to a significant extent upon the abilities and efforts of its key personnel. The loss of the services of key personnel or the Company’s inability to attract, motivate and retain qualified personnel in the future could have a material adverse effect on OSG’s business, financial condition and operating results. In addition, several of the Company’s executive officers have served in their current positions for less than one year. Accordingly, the management team has not worked together as a team for a significant period of time and their focus and attention may be diverted while they familiarize themselves with OSG’s business.
Work stoppages or other labor disruptions by the unionized employees of OSG or other companies in related industries may adversely affect OSG’s operations.
As of December 31, 2016, OSG had approximately 882 regular full-time employees, of which 632 employees were covered by collective bargaining agreements with unions. See Item 1, “Business __ Employees.” OSG could be adversely affected by actions taken by employees of OSG or other companies in related industries (including third parties providing services to OSG) against efforts by management to control labor costs, restrain wage or benefits increases or modify work practices or the failure of OSG or other companies in its industry to successfully negotiate collective bargaining agreements.
The Company may face unexpected drydock costs for its vessels.
Vessels must be drydocked periodically. For example, the USCG requires the Company’s vessels to be drydocked for inspection and maintenance twice every five years. The cost of repairs and renewals required at each drydock are difficult to predict with certainty, can be substantial and the Company’s insurance does not cover these costs. In addition, vessels may have to be drydocked in the event of accidents or other unforeseen damage, and OSG’s insurance may not cover all of these costs. Vessels in drydock will generally not generate any income. Large drydocking expenses could adversely affect the Company’s results of operations and cash flows. In addition, the time when a vessel is out of service for maintenance is determined by a number of factors including regulatory deadlines, market conditions, shipyard availability and customer requirements, and accordingly the length of time that a vessel may be off-hire may be longer than anticipated, which could adversely affect the Company’s business, financial condition, results of operations and cash flows.
Technological innovation could reduce the Company’s charter income and the value of the Company’s vessels.
The charter rates and the value and operational life of a vessel are determined by a number of factors including the vessel’s efficiency, operational flexibility and physical life. Efficiency includes speed, fuel economy and the ability to load and discharge cargo quickly. Flexibility includes the ability to enter harbors, utilize related docking facilities and pass through canals and straits. The length of a vessel’s physical life is related to its original design and construction, its maintenance and the impact of the stress of operations. If new tankers are built that are more efficient or more flexible or have longer physical lives than the Company’s vessels, competition from these more technologically advanced vessels could adversely affect the amount of charter payments the Company receives for its vessels once their initial charters expire and the resale value of the Company’s vessels could significantly decrease. As a result, the Company’s business, financial condition, results of operations and cash flows could be adversely affected.
Interruption or failure of OSG’s information technology and communications systems could impair its ability to operate and adversely affect its business.
OSG is highly dependent on information technology systems. These dependencies include accounting, billing, disbursement, cargo booking and tracking, vessel scheduling and stowage, equipment tracking, customer service, banking, payroll and communication systems. Information technology and communication systems are subject to reliability issues, integration and compatibility concerns, and security-threatening intrusions. OSG may experience failures caused by the occurrence of a natural disaster, computer hacking or viruses or other unanticipated problems at OSG’s facilities, aboard its vessels or at third-party locations. Any failure of OSG’s or third-party systems could result in interruptions in service, reductions in its revenue and profits, damage to its reputation or liability for the release of confidential information.
| 24 | Overseas Shipholding Group, Inc. |
Effective internal controls are necessary for the Company to provide reliable financial reports and effectively prevent fraud.
The Company maintains a system of internal controls to provide reasonable assurance regarding the reliability of financial reporting and the preparation of financial statements for external purposes in accordance with GAAP. The process of designing and implementing effective internal controls is a continuous effort that requires the Company to anticipate and react to changes in its business and the economic and regulatory environments and to expend significant resources to maintain a system of internal controls that is adequate to satisfy its reporting obligations as a public company.
The spin-off of INSW involved significant changes to the Company’s operations and senior management, including those with primary responsibility for maintaining the system of internal controls. The management team has not worked together as a team for a significant amount of time, and their focus and attention may be diverted while they familiarize themselves with OSG’s business and gain knowledge of the Company’s financial reporting controls.
Any system of controls, however well designed and operated, can provide only reasonable, and not absolute, assurance that the objectives of the system are met. Any failure to maintain that adequacy, or consequent inability to produce accurate financial statements on a timely basis, could increase the Company’s operating costs and harm its business. Furthermore, investors’ perceptions that the Company’s internal controls are inadequate or that the Company is unable to produce accurate financial statements on a timely basis may harm its stock price.
Delays or disruptions in implementing new technological and management systems could impair the Company’s ability to operate and adversely affect its business.
The Company is currently in the process of transitioning to a new software system for managing ship operations. In addition, from time to time the Company will implement or upgrade certain other technological resources utilized in running its business. The Company could be adversely affected if the new software system it is implementing for managing ship operations or other new or upgraded technological systems are defective, not installed properly, fail to perform as marketed or are not properly integrated into existing operations. In addition, the implementation of a new system may not result in improvements that outweigh the cost of implementation. System implementation failures could have an adverse effect on the Company’s business, financial position, and ability to operate in a complex industry.
We could face significant liability if one or more multiemployer plans in which we participate is reported to have underfunded liabilities and we withdraw from participation in one or more multiemployer pension plans in which we participate.
Certain of the Company’s subsidiaries are parties to collective-bargaining agreements that require them to make contributions to three jointly managed (Company and union) multiemployer pension plans covering seagoing personnel of U.S. Flag vessels. Our required contributions to these plans could increase because of a shrinking contribution base as a result of the insolvency or withdrawal of other companies that currently contribute to these plans, the inability or failure of withdrawing companies to pay their withdrawal liability, low interest rates, lower than expected returns on pension fund assets or other funding deficiencies. Certain of these multiemployer plans are currently underfunded. Significantly underfunded pension plans are required to improve their funding ratios within prescribed intervals based on the level of their under-funding. As a result, our required contributions to these plans may increase in the future. In addition, a termination of, our voluntary withdrawal from or a mass withdrawal of all contributing employers from any underfunded multiemployer pension plan to which we contribute would require us to make payments to the plan for our proportionate share of such multiemployer pension plan’s unfunded vested liabilities. See Note 17, “Pension and Other Post Retirement Benefit Plans,” to the Company’s consolidated financial statements set forth in Item 8 for additional information. Requirements to pay increased contributions or withdrawal liabilities could have a material adverse impact on our liquidity and results of operations.
We may be adversely affected by potential changes in U.S. tax laws.
The U.S. Congress and the new Administration have indicated an interest in U.S. corporate income tax reform, with possible approaches including lowering the corporate income tax rate and disallowing any deduction for interest expense except to the extent of interest income. We had significant deferred tax assets at December 31, 2016, which consists primarily of federal and state net operating loss carryforwards that are expected to be realized over an extended number of years. Although any reduction in the corporate income tax rate would reduce the amount of taxes we would pay in the future, a reduction in the corporate income tax rate would also result in a decrease in the value of our net operating loss carryforwards and a reduction to our net income and total equity during the period in which the rate reduction is enacted. We also currently benefit from the deduction of interest expense on our indebtedness. Any elimination or modification of that deduction may increase our cash taxes payable, reducing our future cash available for operations and dividend payments.
| 25 | Overseas Shipholding Group, Inc. |
Risks Related to Legal and Regulatory Matters
The Company’s business would be adversely affected if it failed to comply with the Jones Act’s limitations on U.S. coastwise trade, or if these limitations were waived, modified or repealed, or if changes in international trade agreements were to occur.
A significant majority of the Company’s operations are conducted in the U.S. coastwise trade and are governed by U.S. federal laws commonly known as the “Jones Act”. The Jones Act restricts waterborne transportation of goods between points in the United States to vessels meeting certain requirements, including ownership and control by “U.S. Citizens” as defined thereunder. The Company is responsible for monitoring the foreign ownership of its common stock and other interests to ensure compliance with the Jones Act. The Company could lose the privilege of owning and operating vessels in the Jones Act trade if non-U.S. Citizens were to own or control, in the aggregate, more than 25% of the equity interests in the Company. Such loss would have a material adverse effect on the Company’s business and results of operations. In addition, under certain circumstances failure to comply with the Jones Act may result in the Company being deemed to have violated other U.S. federal laws that prohibit a foreign transfer of U.S. documented vessels without government approval, resulting in severe penalties, including permanent loss of U.S. coastwise trading privileges or forfeiture of the vessels deemed transferred, and fines.
Additionally, maritime transportation services are currently excluded from the General Agreement on Trade in Services (“GATS”) and are the subject of reservations by the United States in the North American Free Trade Agreement (“NAFTA”) and other international free trade agreements. If maritime transportation services were included in GATS, NAFTA or other international trade agreements, or if the restrictions contained in the Jones Act were otherwise repealed or altered, the transportation of maritime cargo between U.S. ports could be opened to international flag or foreign built vessels. During the past several years, interest groups have lobbied Congress, and legislation has been introduced, to repeal certain provisions of the Jones Act to facilitate international flag competition for trades and cargoes currently reserved for U.S. Flag vessels under the Jones Act. The Company expects that continued efforts will be made to modify or repeal the Jones Act. Because international vessels may have lower construction costs, wage rates and operating costs, this could significantly increase competition in the coastwise trade, which could have a material adverse effect on the Company’s business, results of operations, cash flows and financial condition.
The U.S. government could requisition the Company’s vessels during a period of war or emergency, which may negatively impact the Company’s business, financial condition, results of operations and available cash.
The U.S. government could requisition one or more of the Company’s vessels for title or hire. Requisition for title occurs when a government takes control of a vessel and becomes the owner. Requisition for hire occurs when a government takes control of a vessel and effectively becomes the charterer at dictated charter rates. Generally, requisitions occur during a period of war or emergency. In addition, two OSG vessels participate in the U.S. Maritime Security Program, which ensures that militarily useful U.S. Flag vessels are available to the U.S. Department of Defense in the event of war or national emergency. These vessels are required to trade outside the United States but are eligible for government-sponsored business. Under the program, OSG receives an annual fee, subject in each case to annual Congressional appropriations, in exchange for a guarantee that the ships will be made available to the U.S. government in the time of war or national emergency. The U.S. government requisition of one or more of the Company’s vessels may negatively impact the Company’s business, financial condition, results of operations and available cash.
Compliance with complex laws, regulations, and, in particular, environmental laws or regulations, including those relating to the emission of greenhouse gases, may adversely affect OSG’s business.
The Company’s operations are affected by extensive and changing international, national and local environmental protection laws, regulations, treaties, conventions and standards. Many of these requirements are designed to reduce the risk of oil spills. They also regulate other water pollution issues, including discharge of ballast water and effluents and air emissions, including emission of greenhouse gases. These requirements impose significant capital and operating costs on OSG, including, without limitation, ones related to engine adjustments and ballast water treatment.
Environmental laws and regulations also can affect the resale value or significantly reduce the useful lives of the Company’s vessels, require a reduction in carrying capacity, ship modifications or operational changes or restrictions (and related increased operating costs) or retirement of service, lead to decreased availability or higher cost of insurance coverage for environmental matters or result in the denial of access to, or detention in, certain jurisdictional waters or ports. Under local, national and foreign laws, as well as international treaties and conventions, OSG could incur material liabilities, including cleanup obligations, in the event that there is a release of petroleum or other hazardous substances from its vessels or otherwise in connection with its operations. OSG could also become subject to personal injury or property damage claims relating to the release of or exposure to hazardous materials associated with its current or historic operations. Violations of or liabilities under environmental requirements also can result in substantial penalties, fines and other sanctions, including in certain instances, seizure or detention of the Company’s vessels.
OSG could incur significant costs, including cleanup costs, fines, penalties, third-party claims and natural resource damages, as the result of an oil spill or liabilities under environmental laws. The Company is subject to the oversight of several government agencies, including the U.S. Coast Guard, the Environmental Protection Agency and the Maritime Administration of the U.S. Department of Transportation. OPA 90 affects all vessel owners shipping oil or hazardous material to, from or within the United States. OPA 90 allows for potentially unlimited liability without regard to fault for owners, operators and bareboat charterers of vessels for oil pollution in U.S. waters. Similarly, the International Convention on Civil Liability for Oil Pollution Damage, 1969, as amended, which has been adopted by most countries outside of the United States, imposes liability for oil pollution in international waters. OPA 90 expressly permits individual states to impose their own liability regimes with regard to hazardous materials and oil pollution incidents occurring within their boundaries. Coastal states in the United States have enacted pollution prevention liability and response laws, many providing for unlimited liability.
| 26 | Overseas Shipholding Group, Inc. |
In addition, in complying with OPA 90, IMO regulations and other existing laws and regulations and those that may be adopted, shipowners likely will incur substantial additional capital and/or operating expenditures in meeting new regulatory requirements, in developing contingency arrangements for potential spills and in obtaining insurance coverage. Key regulatory initiatives that are anticipated to require substantial additional capital and/or operating expenditures in the next several years include more stringent limits on the sulfur content of fuel oil for vessels operating in certain areas and more stringent requirements for management and treatment of ballast water.
Certain of the Company’s vessels are subject to more stringent numeric discharge limits of ballast water under the EPA’s VGP, with additional vessels becoming subject in future years, even though those vessels have obtained a valid extension from the USCG for implementation of treatment technology under the USCG’s final rules. The EPA has determined that it will not issue extensions under the VGP but has stated that vessels that (i) have received an extension from the USCG (ii) are in compliance with all of the VGP requirements other than numeric discharge limits and (iii) meet certain other requirements will be entitled to “low enforcement priority”. While OSG believes that any vessel that is or may become subject to the more stringent numeric discharge limits of ballast water meets the conditions for “low enforcement priority,” no assurance can be given that they will do so. If the EPA determines to enforce the limits for such vessels, such action could have a material adverse effect on OSG. See Item 1, “Business ___ Environmental and Security Matters Relating to Bulk Shipping.”
Other government regulation of vessels, particularly in the areas of safety and environmental requirements, can be expected to become stricter in the future and require the Company to incur significant capital expenditures on its vessels to keep them in compliance, or even to scrap or sell certain vessels altogether. Such expenditures could result in financial and operational impacts that may be material to OSG’s financial statements. Additionally, the failure of a shipowner or bareboat charterer to comply with local, domestic and foreign regulations may subject it to increased liability, may invalidate existing insurance or decrease available insurance coverage for the affected vessels and may result in a denial of access to, or detention in, certain ports. If any of our vessels are denied access to, or are detained in, certain ports, reputation, business, financial results and cash flows could be materially adversely affected.
Accidents involving highly publicized oil spills and other mishaps involving vessels can be expected in the tanker industry, and such accidents or other events could be expected to result in the adoption of even stricter laws and regulations, which could limit the Company’s operations or its ability to do business and which could have a material adverse effect on OSG’s business, financial results and cash flows. In addition, the Company is required by various governmental and quasi-governmental agencies to obtain certain permits, licenses and certificates with respect to its operations. The Company believes its vessels are maintained in good condition in compliance with present regulatory requirements, are operated in compliance with applicable safety and environmental laws and regulations and are insured against usual risks for such amounts as the Company’s management deems appropriate. The vessels’ operating certificates and licenses are renewed periodically during each vessel’s required annual survey. However, government regulation of tankers, particularly in the areas of safety and environmental impact may change in the future and require the Company to incur significant capital expenditures with respect to its ships to keep them in compliance.
Due to concern over the risk of climate change, a number of countries, including the United States, and international organizations, including the IMO and the UN, have adopted, or are considering the adoption of, regulatory frameworks to reduce greenhouse gas emissions. These regulatory measures include, among others, adoption of cap and trade regimes, carbon taxes, increased efficiency standards, and incentives or mandates for renewable energy. Such actions could result in significant financial and operational impacts on the Company’s business, including requiring OSG to install new emission controls, acquire allowances or pay taxes related to its greenhouse gas emissions, or administer and manage a greenhouse gas emission program. See Item 1, “Business ___ Environmental and Security Matters Relating to Bulk Shipping.” In addition to the added costs, the concern over climate change and regulatory measures to reduce greenhouse gas emissions may reduce global demand for oil and oil products, which would have an adverse effect on OSG’s business, financial results and cash flows.
The employment of the Company’s vessels could be adversely affected by an inability to clear the oil majors’ risk assessment process.
The shipping industry, and especially vessels that transport crude oil and refined petroleum products, is heavily regulated. In addition, the “oil majors” such as BP, Chevron Corporation, ConocoPhillips Company, Exxon Mobil Corp., Royal Dutch Shell, and Total S.A. have developed a strict due diligence process for selecting their shipping partners out of concerns for the environmental impact of spills. This vetting process has evolved into a sophisticated and comprehensive risk assessment of both the vessel manager and the vessel, including audits of the management office and physical inspections of the ship. Under the terms of the Company’s charter agreements, the Company’s charterers require that the Company’s vessels and the technical managers pass vetting inspections and management audits respectively. The Company’s failure to maintain any of its vessels to the standards required by the oil majors could put the Company in breach of the applicable charter agreement and lead to termination of such agreement. Should the Company not be able to successfully clear the oil majors’ risk assessment processes on an ongoing basis, the future employment of the Company’s vessels could be adversely affected since it might lead to the oil majors’ terminating existing charters.
| 27 | Overseas Shipholding Group, Inc. |
The Company may be subject to litigation and government inquiries or investigations that, if not resolved in the Company’s favor and not sufficiently covered by insurance, could have a material adverse effect on it.
The Company has been and is, from time to time, involved in various litigation matters and subject to government inquiries and investigations. These matters may include, among other things, contract disputes, personal injury claims, environmental claims or proceedings, asbestos and other toxic tort claims, employment matters, governmental claims for taxes or duties, and other disputes that arise in the ordinary course of the Company’s business.
Additionally, there are a number of pending lawsuits alleging injuries related to purported asbestos exposure in various state and federal courts. The Company believes it has insurance coverage for the majority, though not all, of these cases.
Although the Company intends to defend these matters vigorously, it cannot predict with certainty the outcome or effect of any such matter, and the ultimate outcome of these matters or the potential costs to resolve them could involve or result in significant expenditures or losses by the Company, or result in significant changes to OSG’s rules and practices in dealing with its customers, all of which could have a material adverse effect on the Company’s future operating results, including profitability, cash flows, and financial condition. Insurance may not be applicable or sufficient in all cases and/or insurers may not remain solvent which may have a material adverse effect on the Company’s financial condition. The Company’s recorded liabilities and estimates of reasonably possible losses for its contingent liabilities are based on its assessment of potential liability using the information available to the Company at the time and, as applicable, any past experience and trends with respect to similar matters. However, because litigation is inherently uncertain, the Company’s estimates for contingent liabilities may be insufficient to cover the actual liabilities from such claims, resulting in a material adverse effect on the Company’s business, financial condition, results of operations and cash flows. See Item 3, “Legal Proceedings,” and Note 21, “Contingencies,” to the Company’s consolidated financial statements included in Item 8, “Financial Statement and Supplementary Data.”
The smuggling of drugs or other contraband onto the Company’s vessels may lead to governmental claims against the Company.
The Company expects that its vessels will call in ports where smugglers attempt to hide drugs and other contraband on vessels, with or without the knowledge of crew members. To the extent the Company’s vessels are found with contraband, whether inside or attached to the hull of our vessel and whether with or without the knowledge of any of its crew, we may face governmental or other regulatory claims which could have an adverse effect on the Company’s business, financial condition, results of operations and cash flows.
Maritime claimants could arrest OSG’s vessels, which could interrupt cash flows.
Crew members, suppliers of goods and services to a vessel, shippers of cargo and other parties may be entitled to a maritime lien against that vessel for unsatisfied debts, claims or damages. In many jurisdictions, a maritime lien holder may enforce its lien by arresting a vessel through foreclosure proceedings. The arrest or attachment of one or more of the Company’s vessels could interrupt OSG’s cash flow and require it to pay a significant amount of money to have the arrest lifted. Claimants could try to assert “sister ship” liability against one vessel in the Company’s fleet for claims relating to another vessel in its fleet which, if successful, could have an adverse effect on the Company’s business, financial condition, results of operations and cash flows.
The Company’s U.S. federal income tax position in respect of certain credit agreement borrowings used by INSW is not free from doubt.
The Company has taken the position that certain drawdowns by the Company under the Unsecured Revolving Credit Facility used solely by INSW should not be taken into account in determining amounts includible in OSG’s income as deemed dividends under section 951(a)(1)(B) and section 956 of the Internal Revenue Code of 1986, as amended, for taxable years 2013 and earlier. Although the Company believes that it has a strong basis for taking this position, there is no authority directly on point and the Company has established a reserve in accordance with Financial Accounting Standards Board Accounting Standards Codification 740. If the IRS were to challenge the Company’s position, the Company’s total cash exposure could exceed the reserve, which could have a material adverse effect on the Company’s financial condition, results of operations and cash flows.
| 28 | Overseas Shipholding Group, Inc. |
Transfers or issuances of the Company’s equity may impair or reduce the Company’s ability to utilize its net operating loss carryforwards and certain other tax attributes in the future.
Section 382 of the Internal Revenue Code of 1986, as amended, or the Code, contain rules that limit the ability of a company that undergoes an “ownership change” to utilize its net operating loss and tax credit carry forwards and certain built-in losses recognized in years after the ownership change. An “ownership change” is generally defined as any change in ownership of more than 50% of a corporation’s stock over a rolling three-year period by stockholders that own (directly or indirectly) 5% or more of the stock of a corporation, or arising from a new issuance of stock by a corporation. If an ownership change occurs, Section 382 imposes an annual limitation on the use of pre-ownership change NOLs, credits and certain other tax attributes to offset taxable income earned after the ownership change. The annual limitation is equal to the product of the applicable long-term tax exempt rate and the value of the company’s stock immediately before the ownership change. This annual limitation may be adjusted to reflect any unused annual limitation for prior years and certain recognized built-in gains and losses for the year. In addition, Section 383 generally limits the amount of tax liability in any post-ownership change year that can be reduced by pre-ownership change tax credit carryforwards. If the Company were to undergo an “ownership change,” it could have a material adverse effect on the Company’s business, financial condition, results of operations and cash flows.
Risks Related to the Common Stock and Warrants
The market price of the Company’s securities may fluctuate significantly.
The market price of the Company’s securities may fluctuate substantially. You may not be able to resell your Class A common stock or Class A warrants at or above the price you paid for such securities due to a number of factors, some of which are beyond the Company’s control. These risks include those described or referred to in this “Risk Factors” section and under “Forward -Looking Statements,” as well as, among other things: fluctuations in the Company’s operating results; activities of and results of operations of the Company’s competitors; changes in the Company’s relationships with the Company’s customers or the Company’s vendors; changes in business or regulatory conditions; changes in the Company’s capital structure; any announcements by the Company or its competitors of significant acquisitions, strategic alliances or joint ventures; additions or departures of key personnel; investors’ general perception of the Company; failure to meet market expectations; future sales of the Company’s securities by it, directors, executives and significant stockholders; changes in domestic and international economic and political conditions; and other events or factors, including those resulting from natural disasters, war, acts of terrorism or responses to these events. Any of the foregoing factors could also cause the price of the Company’s equity securities to fall and may expose the Company to securities class action litigation. Any securities class action litigation could result in substantial cost and the diversion of management’s attention and resources.
In addition, the stock market has recently experienced volatility that, in some cases, has been unrelated or disproportionate to the operating performance of particular companies. These broad market and industry fluctuations may adversely affect the market price of the Company’s securities, regardless of its actual operating performance.
The Company’s warrants are thinly traded, and your ability to sell such securities may be limited.
The Company’s Class A warrants are currently traded as “restricted securities” in the over-the-counter market and in privately negotiated transactions among individual holders pursuant to exemptions from the Securities Act of 1933, as amended. Transactions are reported as taking place only sporadically. Certain broker-dealers report quotes for the purchase and sale of Class A warrants. The Company cannot assure you as to the liquidity of any market that may develop for the Class A warrants, your ability to sell your Class A warrants or the price at which you would be able to sell such securities.
The exercise of outstanding warrants may result in substantial dilution to the Company’s stockholders.
As of March 3, 2017, the Company had outstanding 89,255,322 Class A warrants with an exercise price of $0.01 per share exercisable into an aggregate of 16,958,511 shares of Class A common stock. If exercised, the shares of Class A common stock underlying these warrants would represent, as of that date, approximately 19% of the Company’s outstanding Class A common stock following such exercise. Accordingly, any such exercise would result in substantial dilution to the Company’s stockholders.
The Company’s common stock is subject to restrictions on foreign ownership, which could have a negative impact on the transferability of the Company’s common stock, its liquidity and market value, and on a change of control of the Company.
The Company’s Amended and Restated Certificate of Incorporation and Amended and Restated By-Laws authorize its Board of Directors to establish with respect to any class or series of capital stock of the Company certain rules, policies and procedures, including procedures with respect to transfer of shares, to assist in monitoring and maintaining compliance with the Jones Act ownership restrictions. In order to provide a reasonable margin for compliance with the Jones Act, the Company’s Board of Directors has determined that until further action by it, at least 77% (the “Minimum Percentage”) of the outstanding shares of each class of capital stock of the Company must be owned by U.S. Citizens. Moreover, the Company’s Amended and Restated Certificate of Incorporation and Amended and Restated By-Laws provide that any purported transfer of equity interests in the Company that caused the percentage of outstanding shares of a class of capital stock of the Company to fall below the Minimum Percentage will be ineffective to transfer the equity interests or any voting, dividend or other rights associated with such interests.
| 29 | Overseas Shipholding Group, Inc. |
The percentage of U.S. citizenship ownership of the Company’s outstanding common stock fluctuates based on daily trading, and at times in the past, including at times in 2015 and 2016, has declined to the Minimum Percentage. At and during such time that the Minimum Percentage is reached with respect to outstanding shares of a class of the Company’s stock, the Company is unable to issue any further shares of such class of common stock or approve transfers of such class of common stock to non-U.S. Citizens among other things. The existence and enforcement of these ownership restrictions could have an adverse impact on the liquidity or market value of the Company’s equity securities. Furthermore, under certain circumstances, the ownership restrictions could discourage, delay or prevent a change of control of the Company.
The Company’s outstanding warrants are not subject to the above ownership restrictions, but the warrants include provisions limiting the right of non-U.S. Citizens to exercise warrants if the shares of common stock that would be issued upon exercise would cause the percentage of the Company’s outstanding common stock held by U.S. Citizens to decline below the Minimum Percentage.
The Company has a limited history of paying cash dividends on its securities.
The Company has not paid any regular cash dividends since the third quarter of 2011. On February 29, 2016, the Board of Directors declared a cash dividend of $0.08 per share of common stock paid prior to the end of March 2016. The declaration and timing of future cash dividends, if any, will be at the discretion of the Board of Directors and will depend upon, among other things, our future operations and earnings, capital requirements, general financial condition, contractual restrictions, restrictions imposed by applicable law or the SEC and such other factors as our Board of Directors may deem relevant.
OSG is a holding company and depends on the ability of its subsidiaries to distribute funds to it in order to satisfy its financial obligations or pay dividends.
Overseas Shipholding Group, Inc. is a holding company and its subsidiaries conduct all of its operations and own all of its operating assets. It has no significant assets other than the equity interests in its subsidiaries. As a result, its ability to satisfy its financial obligations or pay dividends is dependent on the ability of its subsidiaries to distribute funds to it. In addition, the terms of the OBS Term Loan and the ABL Facility restrict the ability of OBS and its subsidiaries to distribute funds to Overseas Shipholding Group, Inc.
Some provisions of Delaware law and the Company’s governing documents could influence its ability to effect a change of control.
Certain provisions of Delaware law and contained in the Company’s Amended and Restated Certificate of Incorporation and Amended and Restated By-Laws could have the effect of delaying, deferring or preventing a change of control of the Company. In addition, these provisions could make it more difficult to bring about a change in the composition of the Company’s board of directors. For example, the Company’s Amended and Restated Certificate of Incorporation and Amended and Restated By-Laws:
| · | give the sole ability to then-current members of its board of directors to fill a vacancy on the board of directors; |
| · | require the affirmative vote of two-thirds or more of the combined voting power of the outstanding shares of its capital stock in order to amend or repeal certain provisions of its Amended and Restated Certificate of Incorporation and Amended and Restated By-Laws; and |
| · | establish advance notice requirements for nomination for elections to its board of directors or for proposing matters that can be acted upon by stockholders at stockholder meetings. |
These and other provisions of the Company’s organizational documents and Delaware law may have the effect of delaying, deferring or preventing changes of control or changes in management, even if such transactions or changes would have significant benefits for its stockholders. As a result, these provisions could limit the price some investors might be willing to pay in the future for shares of the Company’s common stock.
Separately, the Company has elected to opt out of Section 203 (“Section 203”) of the Delaware General Corporation Law (the “DGCL”), which restricts certain business combinations between a Delaware corporation and an “interested stockholder.” Accordingly, the Company will be able to enter into such transactions with its principal stockholders without complying with the requirements of Section 203. The election to opt out of Section 203 could deprive certain stockholders of an opportunity to receive a premium for their common stock as part of a sale of the Company, particularly if it enters into a transaction with an “interested stockholder.”
| 30 | Overseas Shipholding Group, Inc. |
ITEM 1B. UNRESOLVED STAFF COMMENTS
None.
We lease two properties which house offices used in the administration of our operations: a property of approximately 18,300 square feet in Tampa, Florida, and a property of approximately 2,500 square feet in Newark, Delaware. We also lease land of 3.2 acres in Tampa, Florida on which two Company-owned buildings aggregating 15,000 square feet sit.
We do not own or lease any production facilities, plants, mines or similar real properties.
| 31 | Overseas Shipholding Group, Inc. |
Vessels:
At December 31, 2016, the Company owned or operated an aggregate of 24 vessels. See tables presented under Item 1, “Business—Fleet Operations.”
See Note 21, “Contingencies,” to the Company’s consolidated financial statements set forth in Item 8, “Financial Statements and Supplementary Data” of this Form 10-K, for information regarding legal proceedings in which we are involved.
ITEM 4. MINE SAFETY DISCLOSURES
Not applicable.
ITEM 5. MARKET FOR REGISTRANT’S COMMON EQUITY, RELATED STOCKHOLDER MATTERS AND ISSUER PURCHASES OF EQUITY SECURITIES
Market Information, Holders and Dividends
The Company’s common stock was listed for trading in the over-the-counter (“OTC”) market under the trading symbol “OSGIQ” from November 12, 2012 through August 5, 2014. Pursuant to an order by the Bankruptcy Court, the Company suspended trading of the Company’s common stock in the OTC market on June 3, 2014 in order to ensure that all trades in those securities would be able to settle no later than the June 6, 2014 voting record date for the Company’s reorganization plan. At emergence from bankruptcy on August 5, 2014, the Company’s common stock was cancelled and the Company issued Class A and Class B common stock (See Item 8, “Financial Statements and Supplementary Data,” Note 2, “Chapter 11 Filing and Emergence from Bankruptcy,” and Note 14, “Capital Stock and Stock Compensation,” for additional information relating to the Company’s emergence from bankruptcy and capital structure, respectively). The Company’s Class B common stock was subsequently approved for listing on the NYSE MKT on October 9, 2014 under the trading symbol “OSGB”. The Company’s Class A common stock was also approved for listing on the NYSE MKT on December 1, 2015 and began trading under the symbol “OSG” on December 1, 2015.
On May 13, 2016, all holders of Class B common stock and Class B warrants as of May 9, 2016 received a distribution from the Company representing their pro-rata share of the Net Litigation Recovery (see Note 2, “Chapter 11 Filing and Emergence from Bankruptcy to the Company’s consolidated financial statements set forth in Item 8, “Financial Statements and Supplementary Data”). On May 27, 2016, pursuant to the Company’s Amended and Restated Certificate of Incorporation and the warrant agreement governing the Class B warrants, each Class B common share and Class B warrant automatically converted to a Class A common share and Class A warrant, respectively.
On June 2, 2016, the Board authorized the Company to take action to transfer the listing of its Class A common stock to the New York Stock Exchange from the NYSE MKT (the “Transfer”). In conjunction with the Transfer, the Board approved the Reverse Split Amendment to the Company’s Amended and Restated Certificate of Incorporation (the “Reverse Split Amendment”). The Reverse Split Amendment effected a one (1) for six (6) reverse stock split and corresponding reduction of the number of authorized shares of Class A common stock and Class B common stock, par value $0.01 per share. On June 7, 2016, the Company filed the Reverse Split Amendment with the Secretary of State of the State of Delaware. The Reverse Split Amendment became effective on June 13, 2016. As previously reported, the Company’s stockholders approved the filing of the Reverse Split Amendment at the Company’s annual meeting of stockholders held on June 9, 2015. The Transfer was approved by the New York Stock Exchange on June 23, 2016.
On November 30, 2016 (the “Distribution Date”), OSG completed the separation of its business into two independent publicly-traded companies through the spin-off of INSW. The spin-off transaction was in the form of a pro rata dividend to holders of OSG common stock and warrants of 100% of the common stock of INSW. Effective as of 5:00 p.m., New York time, on the Distribution Date, INSW common stock was distributed, on a pro rata basis, to OSG’s stockholders and warrant holders of record as of 5:00 p.m., New York time, on November 18, 2016 (the “Record Date”). On the Distribution Date, each holder of OSG common stock received 0.3333 shares of INSW common stock for every share of OSG common stock held on the Record Date. Each holder of OSG warrants received 0.3333 shares of INSW common stock for every one share of OSG common stock they would have received if they exercised their warrants immediately prior to the Distribution (or 0.063327 INSW shares per warrant). Fractional shares of INSW common stock were not distributed in the spin-off. Holders of OSG common stock and warrants received cash in lieu of fractional shares.
| 32 | Overseas Shipholding Group, Inc. |
The following table summarizes (i) the quarterly high and low closing sales prices of the Company’s Class A common stock (OSG) since December 1, 2015 and Class B common stock (OSGB) from January 1, 2015 to May 27, 2016, adjusted to reflect the impact of the one (1) for six (6) reverse stock split described above.
| Class
A common stock (OSG)(a) | Class
B Common Stock (OSGB)(b) | |||||||||||||||
| 2016 | High | Low | High | Low | ||||||||||||
| (In dollars) | (In dollars) | |||||||||||||||
| First Quarter (c) | 16.38 | 11.28 | 20.64 | 12.90 | ||||||||||||
| Second Quarter (c) | 11.86 | 10.62 | 14.04 | 11.10 | ||||||||||||
| Third Quarter (c) | 13.09 | 10.19 | - | - | ||||||||||||
| Fourth Quarter (c) | 10.70 | 2.92 | - | - | ||||||||||||
| Class
A common stock (OSG)(a) | Class
B Common Stock (OSGB)(b) | |||||||||||||||
| 2015 | High | Low | ||||||||||||||
| First Quarter (c) | - | - | 33.00 | 24.24 | ||||||||||||
| Second Quarter (c) | - | - | 27.18 | 19.92 | ||||||||||||
| Third Quarter (c) | - | - | 23.64 | 19.68 | ||||||||||||
| Fourth Quarter (c) | 19.86 | 15.90 | 22.62 | 18.90 | ||||||||||||
| (a) | Not publicly traded prior to December 1, 2015. |
| (b) | Converted to Class A common stock on May 27, 2016. |
| (c) | Stock prices prior to June 13, 2016 were adjusted for the one (1) for six (6) reverse stock split. |
On February 13, 2017, there were 292 stockholders of record of the Company’s Class A common stock.
On November 20, 2015, the Board of Directors declared a dividend of one-tenth of one share of Class A common stock for each share of Class A common stock and Class B common stock and applied for listing of its Class A common stock on the NYSE MKT. In connection with the stock dividend, in accordance with the terms of the outstanding warrants for the Company's Class A and Class B common stock, those warrants were automatically adjusted so that exercising holders would be entitled to receive, upon exercise, additional shares of Class A common stock in respect of the stock dividend.
On February 29, 2016, the Board of Directors declared a cash dividend of $0.08 per share of common stock payable prior to the end of March 2016. The declaration and timing of future cash dividends, if any, will be at the discretion of the Board of Directors and will depend upon, among other things, our future operations and earnings, capital requirements, general financial condition, contractual restrictions, restrictions imposed by applicable law or the SEC and such other factors as our Board of Directors may deem relevant. In addition, the Company’s ability to pay cash dividends in the future may be limited by certain of the Company’s loan agreements.
As required by the Equity Plan, the Company’s Certificate of Incorporation and the Class B Warrant Agreement, the Company distributed 10%, or $1,423, of the Net Litigation Recovery amount to the Class B shareholders and warrant holders in May 2016. Approximately $86 of the aforementioned $1,423, which represents the proportional share of the Net Litigation Recovery payable to the Company’s Class B warrant holders, was recognized as a charge to reorganization items, net in the second quarter of 2016. The balance of $1,337 was distributed in the form of a special dividend to Class B shareholders.
Stockholder Return Performance Presentation
Set forth below is a line graph for the period between October 9, 2014 and December 31, 2016 comparing the percentage change in the cumulative total stockholder return on the Company’s Class A common stock and Class B common stock against the cumulative return of (i) the published Standard and Poor’s 500 index and (ii) a peer group index consisting of Frontline Ltd., Teekay Tankers, Ltd., Kirby Corporation, Tsakos Energy Navigation Limited, Ship Finance International Limited, Nordic American Tankers Limited, DHT Holdings, Inc., Matson, Inc., Ardmore Shipping Corporation, Scorpio Tankers, Inc. and the Company, referred to as the Peer Group index. The Company believes that this peer group index is relevant for comparative purposes.
| 33 | Overseas Shipholding Group, Inc. |
STOCK PERFORMANCE GRAPH
COMPARISON OF CUMULATIVE TOTAL RETURN*
THE COMPANY, S&P 500 INDEX, PEER GROUP INDEX
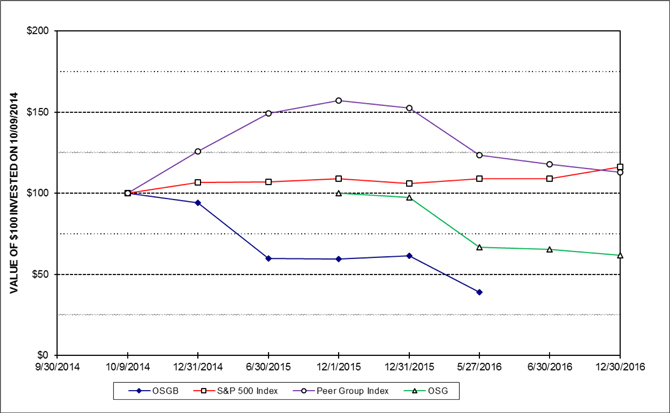
*Assumes that the value of the investment in the Company’s Class A common stock and Class B common stock and each index was $100 on October 9, 2014 (December 1, 2015 for the Class A common stock) and that all dividends were reinvested. Historical stock price data prior to June 13, 2016 were adjusted for the one (1) for six (6) reverse stock split.
Equity Compensation Plan Information
See Item 12, “Security Ownership of Certain Beneficial Owners and Management and Related Stockholder Matters,” for further information on the number of shares of the Company’s Class A common stock that may be issued under the Management Incentive Compensation Plan and the Non-Employee Director Incentive Compensation Plan.
Purchase of Equity Securities
See Note 14, “Capital Stock and Stock Compensation,” to the Company’s consolidated financial statements set forth in Item 8, “Financial Statements and Supplementary Data,” for a description of Class A and Class B warrants exercised in exchange for Class A and Class B common stock, which is incorporated by reference in this Part I, Item 5.
On October 20, 2015, the Board approved a resolution authorizing the Company to repurchase up to $200,000 worth of shares of the Company’s Class A and Class B common stock and warrants from time to time over the next 24 months, on the open market or otherwise, in such quantities, at such prices, in such manner and on such terms and conditions as management determines is in the best interests of the Company. Shares owned by employees and directors of the Company are not eligible for repurchase under this program. The remaining buyback authorization as of December 31, 2016 was approximately $77,025. There were no purchases made by the Company pursuant to the authorized buyback program during the three months ended December 31, 2016.
Unregistered Sales of Securities.
See Note 14, “Capital Stock and Stock Compensation,” to the accompanying consolidated financial statements for a description of Class A warrants exercised in exchange for Class A common stock, which is incorporated by reference in this Item 5.
| 34 | Overseas Shipholding Group, Inc. |
ITEM 6. SELECTED FINANCIAL DATA
As discussed in Note 1, “Basis of presentation and Description of Business,” to the Company’s consolidated financial statements set forth in Item 8, “Financial Statements and Supplementary Data,” on November 30, 2016 (the “Distribution Date”), OSG completed the separation of its business into two independent publicly-traded companies through the spin-off of its then wholly-owned subsidiary International Seaways, Inc. (“INSW”). The spin-off separated OSG and INSW into two distinct businesses with separate management. OSG retained the U.S. Flag business and INSW holds entities and other assets and liabilities that formed OSG’s former International Flag business. The spin-off transaction was in the form of a pro rata distribution of INSW’s common stock to our stockholders and warrant holders of record as of the close of business on November 18, 2016 (the “Record Date”). On the Distribution Date, each holder of OSG common stock received 0.3333 shares of INSW’s common stock for every share of OSG common stock held on the Record Date. Each holder of OSG warrants received 0.3333 shares of INSW’s common stock for every one share of OSG common stock they would have received if they exercised their warrants immediately prior to the Distribution (or 0.063327 INSW shares per warrant).
The selected financial data as of and for the five years ended December 31, 2016, presented below, is derived from our consolidated financial statements and presented in accordance with Accounting Standards Update (“ASU”) 2014-08, Reporting Discontinued Operations and Disclosures of Disposals of Components of an Entity, and therefore, has been adjusted to reflect the spin-off of INSW on November 30, 2016 and the related classification of INSW’s assets, liabilities, results of operations and cash flows as discontinued operations. This selected financial data is not necessarily indicative of results of future operations and should be read in conjunction with Item 7, “Management’s Discussion and Analysis of Financial Condition and Results of Operations. Also, see Note 5, “Discontinued Operations,” to the Company’s consolidated financial statements set forth in Item 8 for additional information.
| 35 | Overseas Shipholding Group, Inc. |
In thousands, except per share amounts and as otherwise stated
| 2016 | 2015 | 2014 | 2013 | 2012 | ||||||||||||||||
| Shipping revenues | $ | 462,420 | $ | 466,872 | $ | 440,417 | $ | 430,636 | $ | 450,468 | ||||||||||
| Income/(loss) from vessel operations | (35,182 | ) | 80,406 | 66,649 | 63,811 | 59,849 | ||||||||||||||
| Income/(loss) before reorganization items and income taxes | (77,082 | ) | (12,415 | ) | (105,633 | ) | 68,065 | (10,671 | ) | |||||||||||
| Reorganization items, net | 10,925 | (8,052 | ) | (153,125 | ) | (70,264 | ) | (8,024 | ) | |||||||||||
| Loss from continuing operations before income taxes | (66,157 | ) | (20,467 | ) | (258,758 | ) | (2,198 | ) | (18,695 | ) | ||||||||||
| Income/(loss) from continuing operations | (1,059 | ) | 80,565 | (143,206 | ) | 16,764 | (17,130 | ) | ||||||||||||
| Depreciation and amortization | 89,563 | 76,851 | 67,547 | 67,601 | 69,129 | |||||||||||||||
| Net cash provided by/(used in) operating activities | 328,860 | 276,333 | (411,482 | ) | 40,201 | 63,571 | ||||||||||||||
| Cash and cash equivalents | 191,089 | 193,978 | 210,986 | 427,984 | 400,996 | |||||||||||||||
| Restricted cash -current | 7,272 | 10,583 | 53,085 | - | - | |||||||||||||||
| Restricted cash - non-current | 8,572 | - | - | - | - | |||||||||||||||
| Total vessels, deferred drydock and other property at net book amount | 715,640 | 902,613 | 929,767 | 952,857 | 1,009,759 | |||||||||||||||
| Total assets of continuing operations (a) | 1,030,497 | 1,200,498 | 1,351,255 | 1,502,401 | 1,535,700 | |||||||||||||||
| Debt of continuing operations (a) (b) | 525,082 | 691,041 | 1,022,570 | 1,778,694 | 1,782,875 | |||||||||||||||
| Allowance for deferred income taxes and reserve for unrecognized tax benefits | 144,586 | 210,715 | 312,485 | 625,698 | 715,708 | |||||||||||||||
| Total equity/(deficit) | 254,332 | 1,580,488 | 1,286,087 | (60,247 | ) | 534,246 | ||||||||||||||
| Per share amounts: | ||||||||||||||||||||
| Basic and Diluted net income/(loss) - Class A from continuing operations | (0.01 | ) | 0.83 | (2.48 | ) | - | - | |||||||||||||
| Basic and Diluted net income/(loss) - Class B and common stock from continuing operations | (0.11 | ) | 0.83 | (2.48 | ) | 0.55 | (0.56 | ) | ||||||||||||
| Equity per share | 3.62 | 16.33 | 13.27 | (1.96 | ) | 17.28 | ||||||||||||||
| Cash dividends paid - Class A | 0.48 | - | - | - | - | |||||||||||||||
| Cash dividends paid - Class B | 1.56 | - | - | - | - | |||||||||||||||
| Weighted average shares outstanding (in thousands) for: | ||||||||||||||||||||
| Basic earnings per share | ||||||||||||||||||||
| Class A | 90,950 | 95,585 | 39,014 | - | - | |||||||||||||||
| Class B and common stock | 534 | 1,320 | 18,676 | 30,483 | 30,339 | |||||||||||||||
| Diluted earnings per share | ||||||||||||||||||||
| Class A | 90,950 | 95,629 | 39,014 | - | - | |||||||||||||||
| Class B and common stock | 534 | 1,320 | 18,676 | 30,483 | 30,339 | |||||||||||||||
| Other data: | ||||||||||||||||||||
| Time charter equivalent revenues (c) | 446,160 | 449,058 | 414,373 | 400,876 | 401,569 | |||||||||||||||
| EBITDA (d) | 66,557 | 126,749 | (14,977 | ) | 65,403 | 125,362 | ||||||||||||||
| Adjusted EBITDA (d) | 176,225 | 168,116 | 139,731 | 136,915 | 133,898 | |||||||||||||||
| (a) | Total assets and debt for the years ended December 31, 2015 and 2014, each reflect a reduction in amounts previously reported of $21,676 and $21,935, respectively, relating to the retrospective adoption of ASU 2015-03 which required the reclassification of unamortized deferred financing costs from other assets to debt. |
| (b) | For the years ended December 31, 2013 and 2012, both debt and the related unamortized deferred financing costs were components of liabilities subject to compromise in the consolidated balance sheet. Therefore, the adoption of ASU 2015-03 had no impact for such years. Debt shown in the table above for the years ended December 31, 2013 and 2012 is net of unamortized deferred financing costs related to unsecured senior notes of $5,914 for both years. |
| (c) | Reconciliations of time charter equivalent revenues to shipping revenues as reflected in the consolidated statements of operations follow: |
| 36 | Overseas Shipholding Group, Inc. |
| For the year ended December 31, | 2016 | 2015 | 2014 | 2013 | 2012 | |||||||||||||||
| Time charter equivalent revenues | $ | 446,160 | $ | 449,058 | $ | 414,373 | $ | 400,876 | $ | 401,569 | ||||||||||
| Add: Voyage expenses | 16,260 | 17,814 | 26,044 | 29,760 | 48,899 | |||||||||||||||
| Shipping revenues | $ | 462,420 | $ | 466,872 | $ | 440,417 | $ | 430,636 | $ | 450,468 | ||||||||||
Consistent with general practice in the shipping industry, the Company uses time charter equivalent revenues, which represents shipping revenues less voyage expenses, as a measure to compare revenue generated from a voyage charter to revenue generated from a time charter. Time charter equivalent revenues, a non-GAAP measure, provides additional meaningful information in conjunction with shipping revenues, the most directly comparable GAAP measure, because it assists Company management in decisions regarding the deployment and use of its vessels and in evaluating their financial performance.
| (d) | EBITDA represents net (loss)/income from continuing operations before interest expense, income taxes and depreciation and amortization expense. Adjusted EBITDA consists of EBITDA adjusted for the impact of certain items that we do not consider indicative of our ongoing operating performance. EBITDA and Adjusted EBITDA are presented to provide investors with meaningful additional information that management uses to monitor ongoing operating results and evaluate trends over comparative periods. EBITDA and Adjusted EBITDA do not represent, and should not be considered a substitute for, net income/(loss) or cash flows from operations determined in accordance with GAAP. EBITDA and Adjusted EBITDA have limitations as analytical tools, and should not be considered in isolation, or as a substitute for analysis of our results reported under GAAP. Some of the limitations are: |
| a. | EBITDA and Adjusted EBITDA do not reflect our cash expenditures, or future requirements for capital expenditures or contractual commitments; |
| b. | EBITDA and Adjusted EBITDA do not reflect changes in, or cash requirements for, our working capital needs; and |
| c. | EBITDA and Adjusted EBITDA do not reflect the significant interest expense, or the cash requirements necessary to service interest or principal payments, on our debt. |
While EBITDA and Adjusted EBITDA are frequently used by companies as a measure of operating results and performance, neither of those items as prepared by the Company is necessarily comparable to other similarly titled captions of other companies due to differences in methods of calculation. The following table reconciles net income/(loss) from continuing operations, as reflected in the consolidated statements of operations, to EBITDA and Adjusted EBITDA:
| For the year ended December 31, | 2016 | 2015 | 2014 | 2013 | 2012 | |||||||||||||||
| Net (loss)/income from continuing operations | $ | (1,059 | ) | $ | 80,565 | $ | (143,206 | ) | $ | 16,764 | $ | (17,130 | ) | |||||||
| Income tax benefit from continuing operations | (65,098 | ) | (101,032 | ) | (115,552 | ) | (18,962 | ) | (1,565 | ) | ||||||||||
| Interest expense | 43,151 | 70,365 | 176,234 | - | 74,928 | |||||||||||||||
| Depreciation and amortization | 89,563 | 76,851 | 67,547 | 67,601 | 69,129 | |||||||||||||||
| EBITDA | 66,557 | 126,749 | (14,977 | ) | 65,403 | 125,362 | ||||||||||||||
| Severance costs | 12,996 | - | 2,161 | 2,417 | 80 | |||||||||||||||
| (Gain)/loss on disposal of vessels and other property, including impairments | 104,532 | 207 | (578 | ) | (1,168 | ) | 432 | |||||||||||||
| Loss on repurchase of debt | 2,988 | 26,516 | - | - | - | |||||||||||||||
| Other costs associated with repurchase of debt | 77 | 3,099 | - | - | - | |||||||||||||||
| Write-off of registration statement costs | - | 3,493 | - | - | - | |||||||||||||||
| Reorganization items, net | (10,925 | ) | 8,052 | 153,125 | 70,263 | 8,024 | ||||||||||||||
| Adjusted EBITDA | $ | 176,225 | $ | 168,116 | $ | 139,731 | $ | 136,915 | $ | 133,898 | (1) | |||||||||
| (1) | Includes $40,400 recognized in shipping revenues during 2012 in relation to the termination, settlement and replacement agreement with Sunoco. |
| 37 | Overseas Shipholding Group, Inc. |
ITEM 7. MANAGEMENT’S DISCUSSION AND ANALYSIS OF FINANCIAL CONDITION AND RESULTS OF OPERATIONS
The following is a discussion and analysis of (i) industry operations that have an impact on the Company’s financial position and results of operations, (ii) the Company’s financial condition at December 31, 2016 and 2015 and its results of operations comparing the years ended December 31, 2016 and 2015 and the years ended December 31, 2015 and 2014, and (iii) critical accounting policies used in the preparation of the Company’s consolidated financial statements. All dollar amounts are presented in thousands, except daily dollar amounts and per share amounts.
GENERAL
We are a leading provider of energy transportation services, delivering crude oil and petroleum products. We own and operate a combined fleet of 24 vessels registered in the United States. Our well maintained fleet and commitment to high quality, incident-free service positions us as a preferred service provider of major oil companies and refiners.
Incorporated in 1969, OSG has operated through multiple shipping cycles, making adjustments to our business as needed to compete and succeed. We provide safe, efficient and reliable transportation to customers and strive to ensure the highest standards of safety and environmental compliance throughout our organization.
Our business operates as a single reportable segment. We believe that this is appropriate as our chief decision maker and our management team make decisions about resource allocations and review and measure our results as one line of business with similar regulatory requirements, customers and commodities transported. Our fleet includes tankers and ATBs, of which 22 operate under the Jones Act and two operate internationally and participate in the MSP. We own ten ATBs, which consist of eight vessels that transport primarily petroleum products and two that perform lightering operations in the Delaware Bay. We operate fourteen tankers, ten that have been chartered-in under operating leases and four that we own, including the two that participate in the MSP. Revenues are derived predominantly from time charter agreements, which provide a more predictable level of revenues. We derived approximately 17% of our total TCE revenues in the spot market for 2016.
On November 30, 2016, OSG completed the separation of its business into two independent publicly-traded companies through the spin-off of INSW. INSW holds entities and other assets and liabilities that formed OSG’s former International Flag business, which was made up of two reportable segments – International Crude Tankers and International Product Carriers. In accordance with Accounting Standards Update (ASU) 2014-08, Reporting Discontinued Operations and Disclosures of Disposals of Components of an Entity, the assets and liabilities and results of operations of INSW are reported as discontinued operations for all periods presented. Accordingly, all references made to financial data in this Annual Report on Form 10-K are to OSG’s continuing operations, unless specifically noted.
OPERATIONS AND OIL TANKER MARKETS
The Company’s revenues are highly sensitive to patterns of supply and demand for vessels of the size and design configurations owned and operated by the Company and the trades in which those vessels operate. Rates for the transportation of crude oil and refined petroleum products are determined by market forces such as the supply and demand for oil. The demand for oil shipments is significantly affected by the state of the global economy, level of OPEC exports and oil production in the United States. The number of vessels is affected by newbuilding deliveries and by the removal of existing vessels from service, principally because of storage, scrappings or conversions. The Company’s revenues are also affected by the mix of charters between spot (Voyage Charter) and long-term (Time or Bareboat Charter). Because shipping revenues and voyage expenses are significantly affected by the mix between voyage charters and time charters, the Company manages its vessels based on TCE revenues. Management makes economic decisions based on anticipated TCE rates and evaluates financial performance based on TCE rates achieved.
Estimated TCE rates for prompt Jones Act Product Carriers and large ATBs decreased during the year ended December 31, 2016 from 2015 for each class of vessel. The decrease in 2016 compared with 2015 can be attributed to market uncertainty created by the decline in oil prices, the degree to which sustained low prices might cause U.S. crude oil production to decline further, and the increase in vessel supply.
The average monthly rate of production from the Eagle Ford formation decreased 410,000 b/d, or 28%, in December 2016 compared with December 2015. Eagle Ford crude is transported through pipeline infrastructure to Corpus Christi, where it is loaded on Jones Act vessels for transportation to refineries in Texas, Louisiana, Mississippi and the Philadelphia area. The reduction in production has led to the redeployment of a number of Jones Act vessels out of the crude trades into clean product trades, placing significant downward pressure on TCE rates. As of December 2016, 26% of the Jones Act tank vessel fleet deployment was in crude trades compared with 36% in December 2015. Jones Act tank vessel deployment in US Gulf clean product trades was 44% in December 2016 compared with 35% in December 2015. Adding to the impact of declining U.S. production was the lifting of the crude oil export ban on December 18, 2015.
| 38 | Overseas Shipholding Group, Inc. |
As of December 31, 2016, the industry’s entire Jones Act fleet of Product Carriers and large ATBs (defined as vessels having carrying capacities of between 140,000 barrels and 350,000 barrels, which excludes numerous tank barges below 140,000-barrel capacity and 11 much larger tankers dedicated exclusively to the Alaskan crude oil trade) consisted of 90 vessels, compared with 79 vessels as of December 31, 2015. There were 12 deliveries and two vessels scrapped during 2016. The deliveries included eight Product Tankers and four ATBs. The scrapped vessels were two tankers, one of which was a late 1970s-built Alaskan crude tanker redeployed into the lower-48 coastwise trade during 2015, which was not part of the 79 vessel count noted above. In addition to the 90 vessels mentioned above, one late-1970s-built Alaskan crude tanker was sold by Exxon to competitors and redeployed into the lower-48 coastwise trade during 2015.
The industry’s firm Jones Act orderbook as of December 31, 2016, with deliveries scheduled through the fourth quarter of 2017 consisted of nine vessels (five Product Carriers and four large ATBs). Options for an additional three ATBs remain open. The Company does not have any Jones Act vessels on order.
Delaware Bay lightering volumes averaged 172,000 b/d in 2016 compared with 105,000 b/d in 2015. The increase resulted from imported crude oil becoming more economically attractive to Delaware Bay refiners compared with the cost of transporting domestically produced shale oil on vessels that do not require lightering services.
RESULTS FROM VESSEL OPERATIONS
| 2016 | 2015 | 2014 | ||||||||||
| TCE revenues | $ | 446,160 | $ | 449,058 | $ | 414,373 | ||||||
| Vessel expenses | (140,696 | ) | (138,179 | ) | (135,079 | ) | ||||||
| Charter hire expenses | (91,947 | ) | (91,875 | ) | (91,061 | ) | ||||||
| Depreciation and amortization | (89,257 | ) | (76,431 | ) | (66,584 | ) | ||||||
| Income from vessel operations (a) | $ | 124,260 | $ | 142,573 | $ | 121,649 | ||||||
| Average daily TCE rate | $ | 51,540 | $ | 54,035 | $ | 49,231 | ||||||
| Average number of owned vessels | 14.0 | 14.0 | 14.0 | |||||||||
| Average number of vessels chartered-in under operating leases | 10.0 | 10.0 | 10.0 | |||||||||
| Number of revenue days (b) | 8,657 | 8,311 | 8,417 | |||||||||
| Number of ship-operating days: (c) | ||||||||||||
| Owned vessels | 5,124 | 5,110 | 5,110 | |||||||||
| Vessels bareboat chartered-in under operating leases | 3,660 | 3,653 | 3,650 | |||||||||
| Vessels time chartered-in under operating leases | - | - | 8 | |||||||||
| (a) | Income from vessel operations is before general and administrative expenses, depreciation on non-vessel related fixed assets, technical management transition costs, severance costs, and gain/(loss) on disposal of vessels, including impairments. |
| (b) | Revenue days represent ship-operating days less days that vessels were not available for employment due to repairs, drydock or lay-up. |
| (c) | Ship-operating days represent calendar days |
Reconciliations of time charter equivalent revenues to shipping revenues as reported in the consolidated statements of operations follows:
| For the year ended December 31, | 2016 | 2015 | 2014 | |||||||||
| Time charter equivalent revenues | $ | 446,160 | $ | 449,058 | $ | 414,373 | ||||||
| Add: Voyage expenses | 16,260 | 17,814 | 26,044 | |||||||||
| Shipping revenues | $ | 462,420 | $ | 466,872 | $ | 440,417 | ||||||
The following table provides a breakdown of TCE rates achieved for the years ended December 31, 2016, 2015 and 2014 between spot and fixed earnings and the related revenue days.
| 39 | Overseas Shipholding Group, Inc. |
| 2016 | 2015 | 2014 | ||||||||||||||||||||||
| Spot | Fixed | Spot | Fixed | Spot | Fixed | |||||||||||||||||||
| Earnings | Earnings | Earnings | Earnings | Earnings | Earnings | |||||||||||||||||||
| Jones Act Handysize Product Carriers: | ||||||||||||||||||||||||
| Average rate | $ | 27,989 | $ | 64,919 | $ | - | $ | 64,350 | $ | - | $ | 58,478 | ||||||||||||
| Revenue days | 208 | 4,103 | - | 4,260 | - | 4,205 | ||||||||||||||||||
| Non-Jones Act Handysize Product Carriers: | ||||||||||||||||||||||||
| Average rate | $ | 31,422 | $ | 16,141 | $ | 29,453 | $ | 15,958 | $ | 27,487 | $ | 13,528 | ||||||||||||
| Revenue days | 544 | 186 | 535 | 164 | 656 | 73 | ||||||||||||||||||
| ATBs: | ||||||||||||||||||||||||
| Average rate | $ | 26,473 | $ | 35,269 | $ | - | $ | 38,605 | $ | - | $ | 35,372 | ||||||||||||
| Revenue days | 83 | 2,802 | - | 2,700 | - | 2,750 | ||||||||||||||||||
| Lightering: | ||||||||||||||||||||||||
| Average rate | $ | 72,271 | $ | - | $ | 79,209 | $ | - | $ | 70,316 | $ | - | ||||||||||||
| Revenue days | 732 | - | 652 | - | 733 | - | ||||||||||||||||||
During 2016, TCE revenues decreased by $2,898, or 1%, to $446,160 from $449,058 in 2015. A weakening Jones Act crude oil transportation market during the current year resulted in a decline in average daily rates earned by the Company’s Jones Act ATBs and Jones Act Product Carriers, as well as increased spot market exposure, which accounted for a $16,204 decrease in revenue. The spot rates in the above table for Jones Act Product Carriers reflect idle days awaiting cargoes for one of the vessels that redelivered from a long-term charter in mid-June 2016. Offsetting this decrease to a large degree was (i) a 266-day increase in Jones Act ATB, Jones Act Product Carrier and Non-Jones Act Product Carrier revenue days, which accounted for a $11,175 increase in revenue, (ii) a $1,219 increase in Delaware Bay lightering revenue, and (iii) increased average daily rates for the Company’s Non-Jones Act Product Carriers which accounted for a $911 increase in revenue. The increase in revenue days was principally attributable to a reduction in drydock and repair days in the current year. The increase in revenue earned by the Delaware Bay lightering vessels was primarily due to an increase in Delaware Bay lightering volumes and an 81-day decrease in drydock and repair days in the current year, partially offset by certain coastwise voyage opportunities that were available in the first half of 2015, but not in 2016.
Vessel expenses increased by $2,517 to $140,696 in 2016 from $138,179 in 2015, primarily due to an increase in average daily vessel expenses of $249 per day, which resulted principally from higher crew costs. Depreciation expense increased by $12,826 to $89,257 in 2016 from $76,431 in 2015 primarily as a result of the shortening of the useful lives of six of the Company’s Jones Act ATBs effective October 1, 2015 and a further shortening of the useful lives of seven of the Jones Act ATBs effective October 1, 2016, as discussed further in Note 3, “Summary of Significant Accounting Policies” to the accompanying consolidated financial statements.
During 2015, TCE revenues increased by $34,685, or 8%, to $449,058 from $414,373 in 2014. Growth in the average daily rates earned by the Company’s Jones Act Product Carriers and Jones Act ATBs accounted for $33,689 of such increase. This increase reflected the strength of the Jones Act market in 2015, which allowed the Jones Act Product Carriers and ATBs to generally achieve higher rates on new or extended time charters upon the expiry of existing time charters through the first half of 2015. Contributing to an increase in TCE revenues in the second half of 2015 was the June 2015 commencement of a ten-year time charter out entered into by one of the Company’s Jones Act Product Carriers that had been converted into a shuttle tanker.
Vessel expenses increased by $3,100 to $138,179 in 2015 from $135,079 in 2014, primarily due to an increase in average daily vessel expenses of $654 per day, which resulted principally from higher crew costs. Depreciation expense increased by $9,847 to $76,431 in 2015 from $66,584 in 2014. Such increase reflects (i) the depreciation of costs incurred in 2014 to convert the conventional Jones Act Product Carrier referred to above into a shuttle tanker, (ii) the impact on amortization of drydock costs incurred during 2015, which were approximately $16,000 higher than drydock costs incurred during 2014 as more vessels were drydocked in 2015 and (iii) the reduction in useful lives of the Company’s rebuilt Jones Act ATBs.
Two reflagged U.S. Flag Product Carriers participate in the U.S. Maritime Security Program, which ensures that privately-owned, military-useful U.S. Flag vessels are available to the U.S. Department of Defense in the event of war or national emergency. Each of the vessel-owning companies receives an annual subsidy, subject in each case to annual congressional appropriations, which is intended to offset the increased cost incurred by such vessels from operating under the U.S. Flag. In December 2015, the annual subsidy was increased and the Company expects to receive $5.0 million from 2017 through 2020, and $5.2 million beginning in 2021. As of December 31, 2016 funds had not been appropriated for the fiscal year 2017 vessel subsidy of $5.0 million. The Company does not receive the subsidy with respect to any days for which one or both of the vessels operate under a time charter to a U.S. government agency, which was the case for one vessel during the third quarter of 2016.
| 40 | Overseas Shipholding Group, Inc. |
General and Administrative Expenses
During 2016, general and administrative expenses decreased by $19,932 to $41,608 from $61,540 in 2015. This decrease reflects: (i) lower compensation and benefit costs of $5,501 primarily due to a decrease in incentive compensation; and (ii) a net decrease in legal, accounting and consulting fees aggregating $16,198, as the prior period reflected higher costs incurred in the period subsequent to the Company’s emergence from bankruptcy.
During 2015, general and administrative expenses increased by $9,117 to $61,540 from $52,423 in 2014. The increase primarily reflects the following: (i) higher legal, consulting and accounting fees aggregating $8,873 resulting from higher costs incurred in the period subsequent to the Company’s emergence from bankruptcy; (ii) higher compensation and benefit expenses aggregating $2,485 mostly related to employee bonus programs, including certain retention programs put in place as a result of the Company’s bankruptcy filing and an increase in share-based compensation; and (iii) a reduction in costs allocated and directly attributable to INSW aggregating $1,003. These increases were partially offset by lower insurance premiums of $2,964 as the 2014 period included an increase in liability insurance, principally related to the acceleration of Directors and Officers liability insurance costs in the third quarter of 2014, since the then existing coverage ended upon the Company’s emergence from bankruptcy, and a one-time premium paid in the third quarter of 2014 for runoff coverage for the former directors and officers of the Company and the removal of certain exclusions in such policy.
INTEREST EXPENSE
The components of interest expense are as follows:
| 2016 | 2015 | 2014 | ||||||||||
| Interest before impact of interest rate caps | $ | 42,812 | $ | 70,364 | $ | 176,234 | ||||||
| Impact of interest rate caps | 339 | 1 | - | |||||||||
| Interest expense | $ | 43,151 | $ | 70,365 | $ | 176,234 | ||||||
Interest expense, including administrative and other fees was $43,151 for 2016 compared with $70,365 in 2015. The decrease in interest expense associated with the Company’s Exit Financing Facilities and Unsecured Senior Notes from the prior year reflects the impact of the Company’s repurchases and prepayments of $137,295 in aggregate principal amount of its OBS Term Loan in 2016 and the repurchase of $363,690 in aggregate principal amount of its outstanding Unsecured Senior Notes between the third quarter of 2015 and September 2016. Refer to Note 9, “Debt,” in the accompanying consolidated financial statements for additional information.
Interest expense, including administrative and other fees, was $70,365 in 2015 and comprised primarily of $32,669 associated with the Company’s reinstated Unsecured Senior Notes and $37,666 relating to the Exit Financing Facility.
Interest expense in 2014 reflects interest expense of $176,234, including contractual post-petition interest from the Petition Date through the effective date of the Equity Plan of $106,400 associated with the Company’s Unsecured Senior Notes and $15,282 associated with the Company’s Exit Financing Facilities. The balance of interest expense recognized during 2014 represented contractual post-petition interest from the Petition Date through the effective date of the Equity Plan on allowed claims associated with our pre-reorganized OSG loan agreements (excluding reinstated Unsecured Senior Notes) and certain rejected executory contracts. Accordingly, interest expense for the year ended December 31, 2014 is not comparable to either 2016 or 2015.
INCOME TAX BENEFIT FROM CONTINUING OPERATIONS
The effective tax rates for the years ended December 31, 2016, 2015 and 2014 were 98.4%, 493.7% and 44.8%, respectively. The Company’s effective tax rates are affected by recurring items, such as permanent differences (and their relative amount versus income) and discrete items that may occur in one year but are not consistent from year to year.
For the year ended December 31, 2016, our effective tax rate decreased compared with the year ended December 31, 2015, primarily as a result of the absence of the tax benefit attributable to the Pre-Filing Agreement with the Internal Revenue Service (“IRS”) in 2015, offset in part by the reversal of the deferred tax liability associated with the Company’s investment in INSW.
In January 2015, the Company requested that the IRS review under its Pre-Filing Agreement Program the deductibility of certain payments made by OSG in 2014, in the aggregate amount of $477,835, in its capacity as guarantor of the obligations of subsidiaries of INSW under certain loan agreements. In connection with these payments, the Company had established an unrecognized tax benefit equal to the full amount of such benefits, or $179,151 as of December 31, 2014. On September 4, 2015, the Company received an executed closing agreement from the IRS, which allowed a deduction of $424,523. As a result of the closing agreement, the Company reduced its reserve for uncertain tax positions by $179,151, recognized an income tax benefit of $150,073 and reduced its deferred tax asset for net operating loss carryforwards by $29,078 during the year ended December 31, 2015.
| 41 | Overseas Shipholding Group, Inc. |
As a result of the aforementioned closing agreement, OSG’s investment in INSW for financial reporting purposes exceeded its tax basis, and as of December 31, 2015, management did not believe it could make an assertion that OSG’s investment in INSW was essentially permanent in duration. Accordingly, the Company recognized a deferred tax liability and tax provision of $48,856 for the year ended December 31, 2015 on the accumulated and current year undistributed earnings of its foreign operations, aggregating approximately $138,881, arising principally from companies domiciled in the Marshall Islands.
As of December 31, 2016, as a result of the spin-off of INSW, the Company reversed its deferred tax liability in the amount of $48,856 recognized on the basis difference in its investment in INSW as the Spin-off resulted in a non-deductible taxable loss on the Company’s investment in INSW.
As of December 31, 2016, the Company had U.S. federal net operating loss carryforwards of approximately $308,289, which are available to reduce future taxes, if any. The federal net operating loss carryforwards begin to expire in 2034. The amount of net operating loss carryforwards reflected in this paragraph are presented on a tax return basis and differ from the amounts reflected in the balance sheet, which are reflected net of unrecognized tax benefits.
In connection with the emergence from bankruptcy, under applicable U.S. tax regulations, the Company underwent an ownership change. As a result, there is an annual limitation on the use of pre-ownership change net operating losses, tax credits and certain other tax attributes to offset taxable income earned after the ownership change. The annual limitation is equal to the product of the applicable long-term tax exempt rate and the value of the Company’s stock immediately before the ownership change. This annual limitation may be adjusted to reflect any unused annual limitation for prior years and certain recognized built-in gains and losses for the year. The Company does not believe that the limitations imposed will impact its ability to utilize pre-ownership change net operating losses before the carryforward period expires.
For the year ended December 31, 2015, our effective tax rate increased by approximately 449% compared with the year ended December 31, 2014, primarily as a result of the Pre-Filing Agreement with the IRS offset in part by the deferred tax liability recognized on the Company’s investment in INSW.
During the year ended December 31, 2014, the Company repaid the Unsecured Revolving Credit Facility, for which INSW was liable on a joint and several basis. As a result, because INSW was no longer liable on a joint and several basis for the year ended December 31, 2014, the Company released its deferred tax liability for undistributed earnings of its foreign subsidiaries attributable to the excess Unsecured Revolving Credit Facility over the cumulative potential deemed dividends arising from the drawdowns by OSG under such facility, and recorded an income tax benefit of $55,602. As of December 31, 2014, the Company’s tax basis in its investment in INSW exceeded the book basis of such investment and the Company therefore did not record any deferred tax asset for the unremitted earnings of its foreign subsidiaries.
The Company is currently undergoing an examination by the Internal Revenue Service of its 2012 through 2015 tax returns.
EBITDA and Adjusted EBITDA
EBITDA represents net (loss)/income from continuing operations before interest expense, income taxes and depreciation and amortization expense. Adjusted EBITDA consists of EBITDA adjusted for the impact of certain items that we do not consider indicative of our ongoing operating performance. EBITDA and Adjusted EBITDA are presented to provide investors with meaningful additional information that management uses to monitor ongoing operating results and evaluate trends over comparative periods. EBITDA and Adjusted EBITDA do not represent, and should not be considered a substitute for, net income or cash flows from operations determined in accordance with GAAP. EBITDA and Adjusted EBITDA have limitations as analytical tools, and should not be considered in isolation, or as a substitute for analysis of our results reported under GAAP. Some of the limitations are:
| · | EBITDA and Adjusted EBITDA do not reflect our cash expenditures, or future requirements for capital expenditures or contractual commitments; |
| · | EBITDA and Adjusted EBITDA do not reflect changes in, or cash requirements for, our working capital needs; and |
| · | EBITDA and Adjusted EBITDA do not reflect the significant interest expense, or the cash requirements necessary to service interest or principal payments, on our debt. |
While EBITDA and Adjusted EBITDA are frequently used by companies as a measure of operating results and performance, neither of those items as prepared by the Company is necessarily comparable to other similarly titled captions of other companies due to differences in methods of calculation.
| 42 | Overseas Shipholding Group, Inc. |
The following table reconciles net income/(loss) from continuing operations, as reflected in the consolidated statements of operations set forth in Item 8, “Financial Statements and Supplementary Data,” to EBITDA and Adjusted EBITDA:
| For the year ended December 31, | 2016 | 2015 | 2014 | |||||||||
| Net (loss)/income from continuing operations | $ | (1,059 | ) | $ | 80,565 | $ | (143,206 | ) | ||||
| Income tax benefit from continuing operations | (65,098 | ) | (101,032 | ) | (115,552 | ) | ||||||
| Interest expense | 43,151 | 70,365 | 176,234 | |||||||||
| Depreciation and amortization | 89,563 | 76,851 | 67,547 | |||||||||
| EBITDA | 66,557 | 126,749 | (14,977 | ) | ||||||||
| Severance costs | 12,996 | - | 2,161 | |||||||||
| Loss/(gain) on disposal of vessels and other property, including impairments | 104,532 | 207 | (578 | ) | ||||||||
| Loss on repurchase of debt | 2,988 | 26,516 | - | |||||||||
| Other costs associated with repurchase of debt | 77 | 3,099 | - | |||||||||
| Write-off of registration statement costs | - | 3,493 | - | |||||||||
| Reorganization items, net | (10,925 | ) | 8,052 | 153,125 | ||||||||
| Adjusted EBITDA | $ | 176,225 | $ | 168,116 | $ | 139,731 | ||||||
DISCONTINUED OPERATIONS
On November 30, 2016, we completed the spinoff of INSW, which previously made up our International Crude Tankers and International Product Carriers reportable segments. The results of INSW have been classified as discontinued operations. See Note 5, “Discontinued Operations,” to the Company’s consolidated financial statements set forth in Item 8 for additional information.
Results from Vessel Operations
The following is a discussion of the results from vessel operations of the INSW discontinued operations for the eleven months ended November 30, 2016, and for the years ended December 31, 2015 and 2014.
During the eleven months ended November 30, 2016, results from vessel operations of discontinued operations decreased by $499,804 to a loss of $298,911 from income of $200,893 in the year ended December 31, 2015. This decrease reflects the impact of net held-for-sale basis and held-for-use basis impairments of $332,562 and $49,640, respectively, declining TCE revenues, and the incurrence of spin-off related costs in 2016. Such impacts were partially offset by a decrease in vessel expenses, depreciation and amortization, and charter hire in the 2016 period.
TCE revenues decreased in 2016 by $121,889, or 26%, to $353,901 from $475,790 in 2015. The decrease was principally as a result of a weakening in rates throughout the International Flag sectors, most significantly in the MR, VLCC, Aframax and LR2 fleets. Further contributing to the decrease was a 1,226-day decrease in revenue days, primarily as a result of (i) the 2016 period only including 11 months and (ii) a decrease in MR revenue days, as a result of the sale of a 1998-built MR in July 2015 and the redelivery of an MR to its owners at the expiry of its time charter in March 2015. The negative factors were partially offset by 477 fewer drydock and repair days in the 2016 period and an increase in revenue from the Company’s ULCC being taken out of lay-up in the first quarter of 2015.
The decreases in vessel expenses, depreciation and amortization and charter hire during the 2016 period are principally as a result of factors impacting revenue days described above.
During 2015, income from vessel operations improved by $172,436 to $200,893 from $28,457 in 2014. This increase reflects the impact of a significant strengthening of TCE revenues, declining charter hire expense, and decreases in depreciation and amortization, severance and technical management transition costs and general and administrative expense. Such impacts were partially offset by a period-over-period increase in vessel expenses and a reduction in gains on vessel sales in the current year.
TCE revenues increased in 2015 by $128,803, or 37%, to $475,790 from $346,987 in 2014. The increase was primarily due to a strengthening of rates in all of the International Flag sectors, most significantly in the VLCC and MR fleets. These positive factors were partially offset by a 3,700-day decrease in revenue days during 2015, which was driven by (i) fewer chartered-in days in the current year, (ii) the Company’s reduced participation in the full service International Flag Lightering business upon the expiry of its lightering contracts in September 2014, and (iii) the sale of two VLCCs and one Panamax in December 2014, and one MR in July 2015.
| 43 | Overseas Shipholding Group, Inc. |
The decrease in charter hire expense in 2015 compared with 2014 was principally the result of the redeliveries of ten vessels (eight Aframaxes, one Suezmax and one MR) at the expiry of their short-term time charters in 2014. Also contributing to the decrease was the redelivery of one additional MR upon its time charter’s expiration in March 2015.
The increase in 2015 vessel expenses resulted primarily from (i) reactivation and operating costs incurred in conjunction with the Company’s ULCC being taken out of lay-up in the first quarter of 2015 and commencing a time charter in April 2015, (ii) incremental costs relating to the redelivery of one of the Company’s Panamaxes that had previously been bareboat chartered-out, (iii) the recording of a $1,450 reserve in 2015 for an assessment by a multi-employer defined benefit pension plan covering British crew members that served onboard INSW vessels (as well as vessels of other owners) more than 20 years ago, (iv) the Company taking delivery of a newbuild LR2 in the second quarter of 2014, and (v) technical management fees paid to V.Ships. The Company began transferring management of its International Flag conventional tankers to V.Ships in March 2014 and completed the transfers by September of 2014. Vessel operating expenses in 2015 included approximately $7,200 in technical management fees, compared with approximately $4,100 in 2014. These increases in vessel expense were more than offset by a decrease in the cost of providing technical and commercial management by the Company’s shore-based staff that were previously included in general and administrative expenses.
The decrease in depreciation and amortization in 2015 compared with 2014 was primarily due to the vessel sales noted above. This decrease was partially offset by the impact of the LR2 newbuild delivery referred to above.
Impact of Spin off
As discussed in Note 5, “Discontinued Operations,” to the Company’s consolidated financial statements set forth in Item 8, “Financial Statements and Supplementary Data,” the accounting for the distribution of nonmonetary assets to owners of an entity in a spinoff should be based on the recorded amount (after reduction, if appropriate, for an indicated impairment of value). The nonmonetary distribution of the assets of INSW constituted the disposal of a business. Accordingly, OSG's distribution of the shares of INSW to its shareholders on November 30, 2016 was recorded based on the carrying value of the INSW disposal group, after reduction for $332,562 in net impairment charges recognized for the excess of the carrying value of the INSW disposal group over its fair value, calculated on a held for sale basis. Such impairment charges are included in the results from discontinued operations for the year ended December 31, 2016. Refer to Critical Accounting Policies - Vessel and Investment in Joint Venture Impairments – Held for Sale Basis (Disposal Group) below for additional information on management’s judgments and estimates in determining the impairment charge for the INSW disposal group.
LIQUIDITY AND SOURCES OF CAPITAL
Our business is capital intensive. Our ability to successfully implement our strategy is dependent on the continued availability of capital on attractive terms. In addition, our ability to successfully operate our business to meet near-term and long-term debt repayment obligations is dependent on maintaining sufficient liquidity.
Liquidity
Working capital from continuing operations at December 31, 2016 was approximately $181,000 compared with $110,000 at December 31, 2015. Current assets are highly liquid, consisting principally of cash, interest-bearing deposits and receivables. The Company’s total cash (including restricted cash) increased by approximately $2,372 during 2016. Such increase resulted from positive cash from continuing operations, $202,000 of dividends received from INSW, and proceeds from the Proskauer litigation settlement, which is net of (i) all related out-of-pocket expenses incurred by the Company during the three months ended March 31, 2016 and (ii) related amounts paid to the class action plaintiffs. These inflows were offset in part by the use of cash for repurchases and principal prepayments on outstanding debt and repurchases of outstanding Class A common stock and Class A warrants during 2016, as discussed further below.
As of December 31, 2016, we had total liquidity on a consolidated basis of $281,933, comprised of $206,933 of cash (including $15,844 of restricted cash) and $75,000 of undrawn revolver capacity. We manage our cash in accordance with our intercompany cash management system subject to the requirements of our Exit Financing Facilities. Our cash and cash equivalents, as well as our restricted cash balances, generally exceed Federal Deposit Insurance Corporation insured limits. We place our cash, cash equivalents and restricted cash in what we believe to be credit-worthy financial institutions. In addition, certain of our money market accounts invest in U.S. Treasury securities or other obligations issued or guaranteed by the U.S. government, or its agencies.
| 44 | Overseas Shipholding Group, Inc. |
Management has designated cash reserves of $5,576 as of December 31, 2016 (compared with $10,583 at December 31, 2015) to be utilized within the next twelve months for the settlement of certain unsecured claims related to the Company’s emergence from bankruptcy, $5 million of which was paid on February 27, 2017. The remainder of such restricted cash reserves will be used to settle claims or released in 2017. Additionally, restricted cash as of December 31, 2016 includes approximately $10,268 of legally restricted cash relating to the Unsecured Senior Notes, $1,696 of which is classified within current assets. The remaining $8,572 is included in non-current assets. The OBS Term Loan required that upon the spin-off of INSW the Company set aside in an escrow account (1) all accrued and unpaid interest on the existing Unsecured Senior Notes through the date of the consummation of the INSW spin-off and (2) all interest expense that will accrue under the respective existing Unsecured Senior Notes from the date of the consummation of the INSW spin-off through the maturity of the respective existing Unsecured Senior Notes.
As of December 31, 2016, we had total debt outstanding (net of original issue discount and deferred finance costs) of $525,082 and a total debt to total capitalization of 67.4%. Our debt profile reflects recent actions (discussed further below) to deleverage our balance sheet as well as no scheduled amortization requirements before 2018.
Sources, Uses and Management of Capital
We generate significant cash flows from our complementary mix of time charters, voyage charters and contracts of affreightment. Net cash provided by operating activities in the year ended December 31, 2016 was $328,860. In addition to operating cash flows, our other current sources of funds are proceeds from issuances of equity securities, additional borrowings as permitted under the Exit Financing Facilities and proceeds from the opportunistic sales of our vessels. In the past we have also obtained funds from the issuance of long-term debt securities. We may in the future complete transactions consistent with achieving the objectives of our business plan.
Our current uses of funds are to fund working capital requirements, maintain the quality of our vessels, comply with U.S. and international shipping standards and environmental laws and regulations, repay or repurchase our outstanding loan facilities and to repurchase our common stock from time to time. The OBS Term Loan Facility requires that a portion of Excess Cash Flow (as defined in the term loan agreement) be used to prepay the outstanding principal balance of the term loan, commencing with the annual period beginning January 1, 2015. Management determined that no incremental prepayments will be required for the OBS Term Loan Facility for 2017 as the voluntary prepayment made during the fourth quarter of 2016 exceeded any prepayments which would have been required under the OBS Term Loan Facility for 2017. To the extent permitted under the terms of the OBS Term Loan, we may also use cash generated by operations to finance capital expenditures to modernize and grow our fleet.
Historically, we have also used funds to pay dividends and to repurchase our common stock from time to time. Pursuant to the October 2015 Board resolution authorizing the Company to repurchase up to $200,000 worth of the Company’s Class A and Class B common stock and warrants, we repurchased 106,350 shares of Class A common stock at an aggregate cost of $1,301. In addition, during 2016, we repurchased 55,306,351 Class A warrants at an aggregate cost of $118,041.
On February 29, 2016, the Board declared a cash dividend of $0.08 per share on its Class A and Class B common stock. This dividend, totaling $30,573, was paid on March 25, 2016. The declaration and timing of future cash dividends, if any, will be at the discretion of the Board and will depend upon, among other things, our future operations and earnings, capital requirements, general financial condition, contractual restrictions and such other factors as our Board of Directors may deem relevant.
During 2016, we repurchased and retired $294 of our outstanding 2024 Notes and $37,345 of our 2018 Notes. Also, during 2016, OBS opportunistically repurchased and retired $27,000 of the outstanding principal under the OBS Term Loan at a discounted price of $23,584. During the year ended December 31, 2016, OBS also made optional and mandatory principal prepayments of $59,000 and $51,295, respectively.
The Parent Company’s ability to receive cash dividends, loans or advances from OBS is restricted under its loan facility. The Available Amount for cash dividends, loans or advances to the Parent Company permitted under the OBS Term Loan was $0 as of December 31, 2016, after OBS’s dividend distributions to the Parent Company of $51,295 during 2016. Management expects that the Available Amount will increase to $93,592 by the end of the first quarter of 2017, after the required reports are filed with the banks.
Outlook
We believe the actions we have taken have strengthened our balance sheet and at the same time positioned us to generate sufficient cash to support our operations over the next twelve months. The Company currently plans to pay off or refinance the outstanding principal balance on its 8.125% Notes, which mature on March 30, 2018, by December 29, 2017.
On June 2, 2016, the Board authorized the Company to take action to transfer the listing of its Class A common stock to the New York Stock Exchange from the NYSE MKT. In conjunction with the Transfer, the Board approved the Reverse Split Amendment to the Company’s Amended and Restated Certificate of Incorporation. The Reverse Split Amendment effected a one (1) for six (6) reverse stock split and corresponding reduction of the number of authorized shares of Class A common stock and Class B common stock. On June 7, 2016, the Company filed the Reverse Split Amendment with the Secretary of State of the State of Delaware. The Reverse Split Amendment became effective on June 13, 2016. As previously reported, the Company’s stockholders approved the filing of the Reverse Split Amendment at the Company’s annual meeting of stockholders held on June 9, 2015. The Transfer was approved by the New York Stock Exchange on June 23, 2016.
| 45 | Overseas Shipholding Group, Inc. |
Effective as of 5:00 p.m., New York time, on November 30, 2016 (the “Distribution Date”), OSG completed the separation of its business into two independent publicly-traded companies through the spin-off of INSW. The spin-off separates OSG and INSW into two distinct business with separate management. OSG has retained the U.S. Flag business and INSW holds entities and other assets and liabilities that formed OSG’s former International Flag business.
The spin-off transaction was in the form of a pro rata distribution of INSW common stock to OSG’s stockholders and warrant holders of record as of the close of business on November 18, 2016 (the “Record Date.”) On the Distribution Date, each holder of OSG common stock received 0.3333 shares of INSW common stock for every share of OSG common stock held on the Record Date. Each holder of OSG warrants received 0.3333 shares of INSW common stock for every one share of OSG common stock they would have received if they exercised their warrants immediately prior to the Distribution (or 0.063327 INSW shares per warrant).
The spin-off was completed pursuant to a Separation and Distribution Agreement and several other agreements with OSG related to the spin-off, including a Transition Services Agreement and an Employee Matters Agreement. These agreements govern the relationship between us and OSG following the spin-off and provide for the allocation of various assets, liabilities, rights and obligations. These agreements also include arrangements for transition services to be provided by OSG to INSW and by INSW to OSG.
Off-Balance Sheet Arrangements
In accordance with the Separation and Distribution Agreement, subsequent to the November 30, 2016 spin-off of INSW, OSG will continue to guarantee debt and other obligations of certain of INSW’s equity method investees. The debt and other obligations are primarily due to banks in connection with financing the purchase and conversion of vessels and equipment used in the joint venture operations. As of December 31, 2016, the maximum potential amount of future principal payments (undiscounted) that OSG could be required to make relating to such equity method investees secured bank debt and interest rate swaps was $38,789 and the carrying amount of the liability related to this guarantee was $0. In connection with the continuing OSG guarantees, INSW will pay a $125 fee per year to OSG, which is subject to escalation after 2017. INSW has indemnified OSG for liabilities arising from the continuing OSG guarantees pursuant to the terms of the Separation and Distribution Agreement.
Carrying Value of Vessels
Twelve of the Company’s owned vessels are pledged as collateral under the Exit Financing Facilities. The carrying value of each of the Company’s vessels does not necessarily represent its fair market value or the amount that could be obtained if the vessel were sold.
The Company believes that the availability, quality and reliability of fair market valuations of U.S Flag vessels are limited given the fact that the U.S. Flag market is relatively small and illiquid with very limited second hand sales and purchases activity from which to benchmark vessel values. As discussed in Note 6, “Vessels, Deferred Drydock and Other Property,” to the Company’s consolidated financial statements set forth in Item 8, “Financial Statements and Supplementary Data,” the Company monitors for any indicators of impairment in regards to the carrying value of its vessels.
| 46 | Overseas Shipholding Group, Inc. |
Aggregate Contractual Obligations
A summary of the Company’s long-term contractual obligations as of December 31, 2016 follows:
| Beyond | ||||||||||||||||||||||||||||
| 2017 | 2018 | 2019 | 2020 | 2021 | 2021 | Total | ||||||||||||||||||||||
| Long-term debt (1) | ||||||||||||||||||||||||||||
| Unsecured senior notes - fixed rate | $ | 6,683 | $ | 84,987 | $ | 52 | $ | 52 | $ | 342 | $ | 462 | $ | 92,578 | ||||||||||||||
| OBS term loan - floating rate | 24,168 | 24,168 | 473,415 | - | - | - | 521,751 | |||||||||||||||||||||
| Operating lease obligations (2) | ||||||||||||||||||||||||||||
| Bareboat Charter-ins | 91,576 | 91,457 | 111,819 | 9,168 | 9,143 | 31,864 | 345,027 | |||||||||||||||||||||
| Office space | 526 | 539 | 568 | 538 | 538 | 931 | 3,640 | |||||||||||||||||||||
| Total | $ | 122,953 | $ | 201,151 | $ | 585,854 | $ | 9,758 | $ | 10,023 | $ | 33,257 | $ | 962,996 | ||||||||||||||
(1) Amounts shown include contractual interest obligations. Interest obligations on fixed rate debt of $82,310 as of December 31, 2016 range from 7.5% to 8.125%. The interest rate obligations of floating rate debt have been estimated based on the aggregate of the LIBOR floor rate of 1% and the applicable margin for the OBS Term Loan of 4.25%. Management believes that no prepayment in 2017 is required for the OBS Term Loan as a result of Excess Cash Flow for the twelve- month period ended December 31, 2016. Amounts shown for the OBS Term Loan for years subsequent to 2017 exclude any estimated repayment as a result of Excess Cash Flow.
(2) As of December 31, 2016, the Company had charter-in commitments for 10 vessels on leases that are accounted for as operating leases. These leases provide the Company with various renewal options.
In addition to the above long-term contractual obligations the Company has certain obligations for its domestic shore-based employees as of December 31, 2016, related to pension and other post-retirement benefit plans as follows:
| 2017 | 2018 | 2019 | 2020 | 2021 | ||||||||||||||||
| Defined benefit pension plan contributions (1) | $ | 1,082 | $ | 1,362 | $ | 1,499 | $ | 1,395 | $ | 1,454 | ||||||||||
| Postretirement health care plan obligations (2) | 203 | 205 | 182 | 183 | 186 | |||||||||||||||
| (1) | Represents estimated contributions under the Maritrans Inc. defined benefit retirement plan. |
| (2) | Amounts are estimated based on the 2016 cost taking the assumed health care cost trend rate for 2017 to 2021 into consideration. See Note 17, “Pension and Other Postretirement Benefit Plans,” to the Company’s consolidated financial statements set forth in Item 8,” Financial Statements and Supplementary Data.” Because of the subjective nature of the assumptions made, actual premiums paid in future years may differ significantly from the estimated amounts. |
RISK MANAGEMENT
Interest rate risk
The Company is exposed to market risk from changes in interest rates, which could impact its results of operations and financial condition. The Company manages this exposure to market risk through its regular operating and financing activities and, when deemed appropriate, through the use of derivative financial instruments. To manage its interest rate risk in a cost-effective manner, the Company, from time-to-time, enters into interest rate swap or cap agreements, in which it agrees to exchange various combinations of fixed and variable interest rates based on agreed upon notional amounts or to receive payments if floating interest rates rise above a specified cap rate. The Company uses such derivative financial instruments as risk management tools and not for speculative or trading purposes. In addition, derivative financial instruments are entered into with a diversified group of major financial institutions in order to manage exposure to nonperformance on such instruments by the counterparties.
At December 31, 2016, OBS was party to an interest rate cap agreement (“Interest Rate Cap”) with a date of February 15, 2015 with major financial institutions covering the notional amount of $375,000, to limit the floating interest rate exposure associated with its term loan. This agreement contains no leverage features. The OBS Interest Rate Cap has a cap rate of 2.5% through February 5, 2017, at which time the cap rate increases to 3.0% through the termination date of February 5, 2018.
| 47 | Overseas Shipholding Group, Inc. |
INTEREST RATE SENSITIVITY
The following table presents information about the Company’s financial instruments that are sensitive to changes in interest rates. For debt obligations, the table presents the principal cash flows and related weighted average interest rates by expected maturity dates of the Company’s debt obligations.
Principal (Notional) Amount (dollars in millions) by Expected Maturity and Average Interest (Swap) Rate
| Fair Value at | ||||||||||||||||||||||||||||
| Beyond | Dec. 31, | |||||||||||||||||||||||||||
| At December 31, 2016 | 2017 | 2018 | 2019 | 2020 | 2020 | Total | 2016 | |||||||||||||||||||||
| Liabilities | ||||||||||||||||||||||||||||
| Long-term debt * | ||||||||||||||||||||||||||||
| Fixed rate debt | $ | - | $ | 81.6 | $ | - | $ | - | $ | 0.7 | $ | 82.3 | $ | 85.6 | ||||||||||||||
| Average interest rate | - | 8.125 | % | - | - | 7.5 | % | |||||||||||||||||||||
| Variable rate debt | $ | - | $ | - | $ | 455.3 | $ | - | $ | - | $ | 455.3 | $ | 442.2 | ||||||||||||||
| Average interest rate | - | - | 5.32 | % | - | - | ||||||||||||||||||||||
*Including current portion.
As of December 31, 2016, the Company had a secured term loan (OBS Term Loan) and a revolving credit facility (OBS ABL Facility) under which borrowings bear interest at a rate based on LIBOR, plus the applicable margin, as stated in the respective loan agreements. There were no amounts outstanding under the OBS ABL Facility as of December 31, 2016.
CRITICAL ACCOUNTING POLICIES
The Company’s consolidated financial statements are prepared in accordance with accounting principles generally accepted in the United States, which require the Company to make estimates in the application of its accounting policies based on the best assumptions, judgments, and opinions of management. Following is a discussion of the accounting policies that involve a higher degree of judgment and the methods of their application. For a description of all of the Company’s material accounting policies, see Note 3, “Summary of Significant Accounting Policies” to the Company’s consolidated financial statements set forth in Item 8, “Financial Statements and Supplementary Data.”
Revenue Recognition
The majority of revenue is generated from time charters and is accounted for as operating leases and are thus recognized ratably over the rental periods of such charters, as service is performed. The Company does not recognize time charter revenues during periods that vessels are off hire.
The Company generates a portion of its revenue from voyage charters. Within the shipping industry, there are two methods used to account for voyage charter revenue: (1) ratably over the estimated length of each voyage and (2) completed voyage. The recognition of voyage revenues ratably over the estimated length of each voyage is the most prevalent method of accounting for voyage revenues in the shipping industry and the method used by OSG. Under each method, voyages may be calculated on either a load-to-load or discharge-to-discharge basis. In applying its revenue recognition method, management believes that the discharge-to-discharge basis of calculating voyages more accurately estimates voyage results than the load-to-load basis. Since, at the time of discharge, management generally knows the next load port and expected discharge port, the discharge-to-discharge calculation of voyage revenues can be estimated with a greater degree of accuracy. OSG does not begin recognizing voyage revenue until a charter has been agreed to by both the Company and the customer, even if the vessel has discharged its cargo and is sailing to the anticipated load port on its next voyage, because it is at this time the charter rate is determinable for the specified load and discharge ports and collectability is reasonably assured.
Vessel Lives and Salvage Values
The carrying value of each of the Company’s vessels represents its original cost at the time it was delivered or purchased less depreciation calculated using an estimated useful life of 25 years (except for new ATBs for which estimated useful lives of 30 years are used) from the date such vessel was originally delivered from the shipyard or 20 years from the date the Company’s ATBs were rebuilt. A vessel’s carrying value is reduced to its new cost basis (i.e. its current fair value) if a vessel impairment charge is recorded.
| 48 | Overseas Shipholding Group, Inc. |
If the estimated economic lives assigned to the Company’s vessels prove to be too long because of new regulations, an extended period of weak markets, the broad imposition of age restrictions by the Company’s customers, or other future events, it could result in higher depreciation expense and impairment losses in future periods related to a reduction in the useful lives of any affected vessels. In evaluating various impairment indicators that existed at September 30, 2015 (as discussed below under Vessel Impairment) management believed at that time that it was more likely than not that the Company would scrap six of its rebuilt ATBs at the time of their next scheduled drydock special survey date rather than make the significant capital expenditures necessary to comply with regulatory requirements. Accordingly, the remaining useful lives for such ATBs were adjusted on a prospective basis beginning on October 1, 2015. This reduction in useful lives increased depreciation expense on these vessels by approximately $3,600 per quarter. During the third quarter of 2016, management evaluated various impairment indicators that existed at the end of such period and as a result, determined that it was more likely than not that the Company would scrap seven of its rebuilt ATBs prior to their then estimated disposal date as described above. Accordingly, the remaining useful lives for such ATBs were further adjusted. This reduction in useful lives negatively impacted depreciation expense attributable to the ATB vessel impairments discussed in Note 6, “Vessels, Deferred Drydock and Other Property,” by approximately $2,200 per quarter beginning on October 1, 2016.
The United States has not adopted the Hong Kong International Convention for the Safe and Environmentally Sound Recycling of Ships (the “Convention”). While the Convention is not in effect in the United States, the EPA and the Maritime Administration of the U.S. Department of Transportation (“MarAd”) have, from time to time, required the owners of U.S. Flag vessels to make certifications regarding the presence of certain toxic substances onboard vessels that they are seeking to sell to parties who (a) are not citizens of the United States and (b) intend to recycle the vessels after they have been purchased (the "Recycling Purchasers"). In the event that more stringent requirements are imposed upon the owners of U.S. Flag vessels seeking to sell their vessels to the Recycling Purchasers, such requirements could (a) negatively impact the sales prices obtainable from the Recycling Purchasers or (b) require companies, including OSG, to incur additional costs in order to sell their U.S. Flag vessels to the Recycling Purchasers or to other foreign buyers intending to use such vessels for further trading. Management currently believes that $300 per lightweight ton is a reasonable estimate of recycling prices for OSG's U.S. Flag vessels.
Vessel Impairment
The carrying values of the Company’s vessels may not represent their fair market value or the amount that could be obtained by selling the vessel at any point in time since the market prices of second-hand vessels tend to fluctuate with changes in charter rates and the cost of newbuildings. Historically, both charter rates and vessel values tend to be cyclical. Management evaluates the carrying amounts of vessels held and used by the Company for impairment only when it determines that it will sell a vessel or when events or changes in circumstances occur that cause management to believe that future cash flows for any individual vessel will be less than its carrying value. In such instances, an impairment charge would be recognized if the estimate of the undiscounted future cash flows expected to result from the use of the vessel and its eventual disposition is less than the vessel’s carrying amount. This assessment is made at the individual vessel level as separately identifiable cash flow information for each vessel is available.
In developing estimates of future cash flows, the Company must make assumptions about future performance, with significant assumptions being related to charter rates, ship operating expenses, utilization, drydocking requirements, residual value and the estimated remaining useful lives of the vessels. These assumptions are based on historical trends as well as future expectations. Specifically, in estimating future charter rates, management takes into consideration rates currently in effect for existing time charters and estimated daily time charter equivalent rates for each vessel class for the unfixed days over the estimated remaining lives of each of the vessels. The estimated daily time charter equivalent rates used for unfixed days beyond the expiry of any current time charters are based on internally forecasted rates that take into consideration average annual rates published by a third party maritime research service and are consistent with forecasts provided to the Company’s senior management and Board of Directors. The internally forecasted rates are based on management’s evaluation of current economic data and trends in the shipping and oil and gas industries. Recognizing that the transportation of crude oil and petroleum products is cyclical and subject to significant volatility based on factors beyond the Company’s control, management believes the use of estimates based on the internally forecasted rates to be reasonable.
Estimated outflows for operating expenses and drydocking requirements are based on historical and budgeted costs and are adjusted for assumed inflation. Finally, utilization is based on historical levels achieved and estimates of a residual value are consistent with the pattern of scrap rates used in management’s evaluation of salvage value.
In estimating the fair value of vessels for the purposes of step 2 of the impairment tests, the Company utilizes estimates of discounted future cash flows for each of the vessels (income approach) since the secondhand sale and purchase market for the type of U.S. Flag vessels owned by OSG is not considered to be robust.
| 49 | Overseas Shipholding Group, Inc. |
The Company considered changes in circumstances that appeared to be indicative of a continued weakening of the Jones Act crude oil transportation market during the quarter ended September 30, 2016. Such indicators included a decline in the number of Jones Act tank vessels transporting crude oil, which led to (i) increased competition for clean cargoes and the idling of some Jones Act vessels; (ii) a sharp decrease in estimated spot rates for Jones Act Product Carriers and large ATBs between July and September 2016; and (iii) a significant decline in forecasted near term TCE rates reported by a leading third party industry analyst. These factors were viewed as an impairment trigger event for the Company’s eight rebuilt ATBs at September 30, 2016. In addition, given the uncertainty around how long the weak market conditions discussed above could last taking into consideration the large number of newbuildings scheduled for delivery, management believed that it was more likely than not that some of the rebuilt ATBs would be laid-up, scrapped or disposed of before the end of their estimated useful lives, which currently range between 2019 and 2020.The indicators discussed above were not considered to be impairment triggering events for the other ATBs and tankers in the Company’s fleet as these vessels (i) were fairly recently built and do not face the same commercial obsolescence issues faced by the rebuilt ATBs, and (ii) are currently operating under long-term charters or contracts of affreightment.
In developing estimates of undiscounted future cash flows for performing Step 1 of the impairment tests, management made assumptions about future performance, with significant assumptions being related to charter rates, ship operating expenses, utilization, drydocking requirements, residual value and the estimated remaining useful lives of the vessels. The assumptions about the estimated remaining useful lives of the ATBs reflects management’s current belief that the Company would scrap these ATBs at the expiry of their current time charters. Based on tests performed, the sum of the undiscounted cash flows for seven of the eight rebuilt ATBs were less than their September 30, 2016 carrying values. Accordingly, the Company recorded an impairment charge of $97,782 (including $3,873 recorded as a reduction in deferred drydock costs) to write down the carrying values of the seven ATBs to their estimated fair values as of September 30, 2016.
In addition, during the fourth quarter of 2016, the Company decided to delay the disposal of one of its rebuilt ATBs from the estimated disposal date utilized in the September 30, 2016 impairment testing. This decision resulted in a change in the expected deployment of a second rebuilt ATB, which had been projected to assume the first ATB’s time charter on January 1, 2017, and a decline in its forecasted cash flows. Accordingly, the Company recorded an impairment charge of $6,623 at December 31, 2016.
During the third quarter of 2015, in evaluating whether or not certain events or circumstances existing at that time resulted in a triggering event for impairment testing of the U.S. Flag fleet, management gave consideration to various indicators of a weakening of the Jones Act crude oil transportation market that began to materialize during the period. Such indicators included a decline in U.S crude oil production beginning in May 2015 following a decrease in oil prices beginning in late 2014, which quickly led to steep cuts in drilling activity. The resulting decrease in demand for the coastwise transportation of crude oil led to a decline in average daily spot rates for Jones Act tankers during the nine-month period ending September 30, 2015 and the redeployment of several Jones Act vessels, including some of the Company’s vessels, from the crude oil transportation trade to the clean oil transportation trade. In addition, the decline in U.S. crude oil production coupled with the large orderbook for Jones Act vessels scheduled for delivery through late 2017 increased uncertainty around the likelihood of being able to renew or extend the time charters on the Company’s fleet of eight rebuilt Jones Act ATBs, of which two expired during 2016 and four are scheduled to expire in the second quarter of 2017. Management believed that if the weakness identified in the market continued for a prolonged period of time, it would become increasingly difficult for the Company’s older ATBs to find employment at attractive rates that justify the expenditure required to put these vessels through their next drydock special surveys.
Management concluded that the above indicators constituted impairment triggering events for six of the eight vessels in the Company’s fleet of rebuilt ATBs at September 30, 2015. In addition, given the uncertainty around how long the weak market conditions discussed above could last, management determined that it was more likely than not that the rebuilt ATBs will be scrapped before the end of their estimated useful lives, which ranged from 2021 to 2028 (see discussion above under “—Vessel Lives and Salvage Values”). The indicators discussed above were not considered to be impairment triggering events for the other U.S. Flag ATBs employed in lightering and currently operating under long-term charters or contracts of affreightment agreements.
Management prepared undiscounted cash flows models, which utilized weighted probabilities assigned to possible outcomes for the six rebuilt ATBs. A significant probability was assigned to the possibility that the estimated remaining useful life of each ATB would end at its next drydock special survey date, as management believed it was more likely than not that the Company would scrap these vessels rather than make the significant capital expenditure necessary to comply with regulatory requirements. Based on tests performed, the sum of the undiscounted cash flows for each of the six rebuilt ATBs was in excess of its September 30, 2015 carrying value and no impairment was therefore recorded at that date. As of December 31, 2015, management determined that there had been no significant changes in the facts and circumstances that existed at the end of September 30, 2015 that would warrant a change to the assumptions utilized in the undiscounted cash flows analysis on the six rebuilt ATBs prepared at that date. Accordingly, no further analysis was performed as of December 31, 2015.
Intangible Asset
The Company allocates the cost of acquired companies to the identifiable tangible and intangible assets and liabilities acquired, with the remaining amount being classified as goodwill. The Company’s sole intangible asset represent long-term customer relationships acquired as part of the 2006 purchase of Maritrans, Inc. The events noted above under Vessel Impairment during the third quarter of 2016 also triggered an interim impairment test on its customer relationship intangible asset. The business as a whole was determined to be the lowest level at which cash flows are largely independent of the cash flows of other groups of assets and liabilities for purposes of testing the customer relationship intangible asset for recoverability. Based on the results of the recoverability test performed, no intangible assets impairment was recorded as of September 30, 2016 as the net undiscounted cash flows from the asset group were significantly in excess of the carrying value of the asset group. The Company also determined that there were no triggering events between September 30, 2016 and December 31, 2016.
| 50 | Overseas Shipholding Group, Inc. |
Drydocking
Within the shipping industry, there are two methods that are used to account for dry dockings: (1) capitalize drydocking costs as incurred (deferral method) and amortize such costs over the period to the next scheduled drydocking, and (2) expense drydocking costs as incurred. Since drydocking cycles typically extend over two and a half years or five years, management uses the deferral method because management believes it provides a better matching of revenues and expenses than the expense-as-incurred method.
Income Taxes, Deferred Tax Assets and Valuation Allowance
Our income tax expense, deferred tax assets and liabilities, and reserves for unrecognized tax benefits reflect management’s best assessment of estimated future taxes to be paid. We are subject to income taxes primarily in the U.S. Significant judgments and estimates are required in determining the consolidated income tax expense.
Deferred income taxes arise from temporary differences between the financial reporting and the tax basis of assets and liabilities and from events that have been recognized in the financial statements and will result in taxable or deductible amounts based on provisions of the tax law in different periods. In evaluating our ability to recover our net deferred tax assets within the jurisdiction from which they arise we consider all available positive and negative evidence, including scheduled reversals of deferred tax liabilities, projected future taxable income, tax planning strategies and recent financial operations. A valuation allowance is established to the extent it is more likely than not that some portion or the entire deferred tax asset will not be realized. Changes in tax laws and rates could also affect recorded deferred tax assets and liabilities in the future.
The calculation of our tax liabilities involves dealing with uncertainties in the application of complex tax laws and regulations across our global operations. ASC 740 provides that a tax benefit from an uncertain tax position may be recognized when it is more likely than not that the position will be sustained upon examination, including resolutions of any related appeals or litigation processes, on the basis of the technical merits of the position. ASC 740 also provides guidance on measurement, derecognition, classification, interest and penalties, accounting in interim periods, disclosure, and transition. We recognize tax liabilities and reductions in deferred tax assets in accordance with ASC 740 and we adjust these liabilities and deferred tax assets when our judgment changes as a result of the evaluation of new information not previously available. Because of the complexity of some of these uncertainties, the ultimate resolution may result in a payment that is materially different from our current estimate of the tax liabilities. These differences will be reflected as increases or decreases to income tax expense in the period in which new information is available.
Pension Benefits
In connection with the acquisition of Maritrans in November 2006, the Company assumed the obligations under the noncontributory defined benefit pension plan that covered eligible employees of Maritrans (“the Maritrans Plan”). The Company froze the benefits payable under the Maritrans Plan as of December 31, 2006. The Company has recorded pension benefit costs based on complex valuations developed by its actuarial consultants. These valuations are based on estimates and key assumptions, including those related to the discount rates, the rates expected to be earned on investments of plan assets and the life expectancy/mortality of plan participants. OSG is required to consider market conditions in selecting a discount rate that is representative of the rates of return currently available on high-quality fixed income investments. A higher discount rate would result in a lower benefit obligation and a lower rate would result in a higher benefit obligation. The expected rate of return on plan assets is management’s best estimate of expected returns on plan assets. A decrease in the expected rate of return will increase net periodic benefit costs and an increase in the expected rate of return will decrease benefit costs. The mortality assumption is management's best estimate of the expected duration of future benefit payments at the measurement date. The estimate is based on the specific demographics and other relevant facts and circumstances of the Maritrans Plan and considers all relevant information available at the measurement date. Longer life expectancies would result in higher benefit obligations and a decrease in life expectancies would result in lower benefit obligations.
In determining the benefit obligations at the end of the year measurement date, the Company continues to use the equivalent single weighted-average discount rate, rounded to the nearest 5 basis points, that best matches projected benefit payments. During 2016, the Company changed its actuarial service provider and, therefore, for December 31, 2016, the Company based the discount rate on such actuary’s proprietary index, which was calculated based on a universe of approximately 500 Aa-graded non-callable bonds. This rate was 3.95% as of December 31, 2016. For at least the two prior years ended December 31, 2015 and December 31, 2014, the Company used the Citigroup Above Median Pension Discount Curve applied to the future payouts under the Maritrans Plan. The rates were 4.00% and 3.75% at December 31, 2015 and December 31, 2014, respectively. Although the December 31, 2016 index was different from that used in prior years, management believes that the current results are consistent with those that would have been produced had the Company continued to use the Citigroup Above Median Pension Discount Curve as it did in 2015 and 2014. The Company also assumed a long-term rate of return on the Maritrans Plan assets of 7.25% at December 31, 2016 and 2015, based on the asset mix as of such dates and management’s estimate of the long term rate of return that could be achieved over the remaining duration of the Maritrans Plan. Based on the current asset mix, management believes the probability of achieving a long-term return of 7.25% over the remaining duration of the Maritrans Plan is more likely than not.
| 51 | Overseas Shipholding Group, Inc. |
In late 2014, the Society of Actuaries (“RPEC”) published a new set of mortality tables (RP-2014) and a related, mortality improvement scale (MP-2014). The Company’s policy is to utilize the latest published mortality tables and improvement scales, without adjustment to determine the year-end benefit obligation. The set of mortality tables used in determining the net benefit cost for 2016 as well as the December 31, 2015 end of year measurement is the RP-2016 mortality tables, with separate rates for male non-annuitants and annuitants and for female non-annuitants and annuitants. Gender-distinct generational mortality improvements under Scale MP-2015 were included. For the 2016 end of year measurement of the benefit obligations, the RP-2014 mortality tables with generational mortality improvements under Scale MP-2016 were used. Management believes the use of the unadjusted tables is appropriate given the diversity of the participants of the Maritrans Plan, which include both inter-waterway tug officers and office employees.
The duration of the benefit obligation at each of December 31, 2016 and 2015 was 11.26 years and 11.71 years, respectively.
Critical Accounting Policies of the Company’s Discontinued Operations
We believe the following discussion provides useful additional information with respect to the critical accounting policies used in the preparation of our financial statements with respect to the assets and liabilities and results of operations of INSW, which are presented as discontinued operations for all periods presented.
Revenue Recognition
INSW generates a majority of its revenue from voyage charters, including vessels in pools that predominantly perform voyage charters, and recognizes revenue ratably over the estimated length of each voyage using the discharge-to-discharge basis.
For the INSW vessels operating in Commercial Pools, revenues and voyage expenses are pooled and allocated to each pool’s participants on a time charter equivalent basis in accordance with an agreed-upon formula. The formulas in the pool agreements for allocating gross shipping revenues net of voyage expenses are based on points allocated to participants’ vessels based on cargo carrying capacity and other technical characteristics, such as speed and fuel consumption. The selection of charterers, negotiation of rates and collection of related receivables and the payment of voyage expenses are the responsibility of the pools. The pools may enter into contracts that earn either voyage charter revenue or time charter revenue. Each of the pools follows the same revenue recognition principles, as applied by the Company, in determining shipping revenues and voyage expenses, including recognizing revenue only after a charter has been agreed to by both the pool and the customer, even if the vessel has discharged its cargo and is sailing to the anticipated load port on its next voyage.
For the pools in which INSW participates, Company management monitored, among other things, the relative proportion of INSW’s vessels operating in each of the pools to the total number of vessels in each of the respective pools, and assesses whether or not INSW’s participation interest in each of the pools is sufficiently significant so as to determine that INSW has effective control of the pool. Company management determined that as of June 30, 2013, it had effective control of one of the pools in which INSW participated. Such pool was not a legal entity but operated under a contractual agreement. Therefore, effective July 1, 2013 through June 30, 2014, when INSW’s participation in this pool ended, INSW’s allocated TCE revenues for such pool were reported on a gross basis as voyage charter revenues and voyage expenses in the consolidated statement of operations. The impact of this method of presenting earnings for this pool was an increase in both voyage charter revenues and voyage expenses of $40,454 for the year ended December 31, 2014.
Vessel Lives and Salvage Values
The carrying value of each of INSW’s vessels represented its original cost at the time it was delivered or purchased less depreciation calculated using an estimated useful life of 25 years (except for FSO service vessels for which estimated useful lives of 30 years are used and LNG Carriers for which estimated useful lives of 35 years are used) from the date such vessel was originally delivered from the shipyard. A vessel’s carrying value is reduced to its new cost basis (i.e. its current fair value) if a vessel impairment charge is recorded.
Company management estimated the scrap value of INSW’s vessels to be $300 per lightweight ton. The assumptions used in the determination of estimated salvage value took into account current scrap prices, the historic pattern of annual average scrap rates over the four year and eleven-month period ended November 30, 2016, which ranged from $280 to $480 per lightweight ton, estimated changes in future market demand for scrap steel and estimated future demand for vessels. Scrap prices also fluctuate depending upon type of ship, bunkers on board, spares on board and delivery range.
| 52 | Overseas Shipholding Group, Inc. |
Although management believes that the assumptions used to determine the scrap rate for its International Flag vessels are reasonable and appropriate, such assumptions are highly subjective, in part, because of the cyclicality of the nature of future demand for scrap steel.
Vessel and Investment in Joint Venture Impairments – Held for Sale Basis (Disposal Group)
As discussed in Note 5, “Discontinued Operations,” to the Company’s consolidated financial statements set forth in Item 8, “Financial Statements and Supplementary Data,” ASC 845 requires that the accounting for the distribution of nonmonetary assets to owners of an entity in a spinoff be based on the historical recorded amount, after reduction, if appropriate, for an indicated impairment of value, calculated on a held for sale basis.
The determination of fair value is highly judgmental. In estimating the fair value of INSW’s vessels as of November 30, 2016 the Company considered the market and income approaches by using a combination of third party appraisals and discounted cash flow models prepared by the Company. In preparing the discounted cash flow models, the Company used a methodology consistent with the methodology and assumptions detailed in the “Vessel Impairment – Held for Use Basis” section below, and discounted the cash flows using its current estimate of INSW’s weighted average cost of capital, of 9%.
In estimating the fair value of INSW’s investments in and advances to affiliated companies as of November 30, 2016, the Company utilized an income approach since there is a lack of comparable market transactions for the specially built assets held by the joint ventures, by preparing discounted cash flow models. In preparing the discounted cash flows models the Company used a methodology largely consistent with the methodology and assumptions detailed in the “Vessel Impairment – Held for Use Basis” section below, with the exception being that as the assets owned by the joint ventures serve under specific service contracts, the estimated charter rates for periods after the expiry of the existing contracts are based upon management’s internally forecasted rates. The cash flows were discounted using the current estimated weighted average cost of capital for each joint venture, which ranged from 8.7% to 9.5% and took into consideration country risk, entity size and uncertainty with respect to the cash flows for periods beyond the current charter expires.
Accordingly, management recorded a charge in the fourth quarter of 2016, as part of income/(loss) from discontinued operations of $332,562 to reduce the carrying value of the disposal group to its estimated fair value, calculated on a held for sale basis. Management believes that it has identified and evaluated all long-lived assets within the disposal group for impairment in accordance with the guidance in ASC 845. Management also took into account the market capitalization of INSW following the spin on November 30, 2016 to assess and conclude on the reasonableness of the impairment charge related to the INSW disposal group, and considered the following factors: (i) INSW was a new public entity with little analyst coverage until January 2017; (ii) currently there is a lower level of liquidity for the INSW common stock since six shareholders hold approximately 60% of INSW’s shares; (iii) the stock price as of February 27, 2017 was more than 25% higher than the closing price on the date of the spin off transaction; (iv) the shipping industry is highly cyclical and in periods of negative market sentiment, such as existed at the time of the spin off transaction and that currently persists, it is common for companies to trade at discounts to NAV.
Vessel Impairment – Held for Use Basis
In developing estimates of future cash flows for the INSW vessels, the Company must make assumptions about future performance, with significant assumptions being related to charter rates, ship operating expenses, utilization, drydocking requirements, residual value and the estimated remaining useful lives of the vessels. These assumptions are based on historical trends as well as future expectations. Specifically, in estimating future charter rates, management takes into consideration rates currently in effect for existing time charters and estimated daily time charter equivalent rates for each vessel class for the unfixed days over the estimated remaining lives of each of the vessels. The estimated daily time charter equivalent rates used for unfixed days are based on a combination of (i) internally forecasted rates that are consistent with forecasts provided to the Company’s senior management and Board of Directors, and (ii) the trailing 12-year historical average rates, based on quarterly average rates published by a third party maritime research service. The internally forecasted rates are based on management’s evaluation of current economic data and trends in the shipping and oil and gas industries. Management used the published 12-year historical average rates in its assumptions because it is management’s belief that the 12-year period captures an even distribution of strong and weak charter rate periods, which results in the use of an average mid-cycle rate that is more in line with management’s forecast of a return to mid-cycle charter rate levels in the medium term. Recognizing that the transportation of crude oil and petroleum products is cyclical and subject to significant volatility based on factors beyond the Company’s control, management believes the use of estimates based on the combination of internally forecasted rates and 12-year historical average rates calculated as of the reporting date to be reasonable.
In estimating the fair value of vessels for the purposes of step 2 of the impairment tests, the Company utilizes a market approach by using third party appraisals for the vessels in the INSW fleet.
| 53 | Overseas Shipholding Group, Inc. |
The more significant factors that could impact management’s assumptions regarding time charter equivalent rates include (i) loss or reduction in business from significant customers, (ii) unanticipated changes in demand for transportation of crude oil and petroleum products, (iii) changes in production of or demand for oil and petroleum products, generally or in particular regions, (iv) greater than anticipated levels of tanker newbuilding orders or lower than anticipated levels of tanker scrappings, and (v) changes in rules and regulations applicable to the tanker industry, including legislation adopted by international organizations such as IMO and the EU or by individual countries. Although management believes that the assumptions used to evaluate potential impairment are reasonable and appropriate at the time they were made, such assumptions are highly subjective.
International Flag Fleet Impairment Evaluations
September 30, 2016 Impairment evaluation – Management concluded that declines in third party vessel valuations of up to 20% during the quarter ended September 30, 2016 for 28 vessels in INSW’s fleet with carrying values in excess of their estimated market values, constituted an impairment trigger event for these vessels as of September 30, 2016. Based upon the impairment tests performed impairment charges totaling $49,640 were recorded on two LR1s, an Aframax and a Panamax to write-down their carrying values to their estimated fair values at September 30, 2016. The remaining 24 vessels tested had estimated undiscounted future cash flows in excess of their carrying values.
December 31, 2015 Impairment evaluation - Management gave consideration as to whether any events and changes in circumstances existed as of December 31, 2015 that could be viewed as indicators that the carrying amounts of the vessels in the Company’s International Flag fleet were not recoverable as of December 31, 2015 and determined there were no such events or changes in circumstances.
December 31, 2014 Impairment evaluation - Management gave consideration to the following events and changes in circumstances in determining whether there were any indicators that the carrying amounts of the vessels in INSW’s fleet were not recoverable as of December 31, 2014:
| i. | A significant year-over-year decline in third party valuation appraisals of four MRs securing the INSW term loan; |
| ii. | the impact, if any, of management’s intent to dispose of or continue to trade certain vessels during 2015; and |
| iii. | the impact, if any, of outsourcing technical and commercial management of the INSW conventional tanker fleet. |
Management determined that the latter two factors had no impact on the carrying value INSW’s fleet as of December 31, 2014. However, the decline in the third party valuation appraisals on four modern MRs, which were built between 2009 and 2011, was deemed to be an impairment indicator requiring the need to test the recoverability of the carrying value of these vessels. Based on tests performed, it was determined that the vessels would generate undiscounted cash flows in excess of their December 31, 2014 carrying values over the remainder of their useful lives.
Newly Issued Accounting Standards
See Note 3, “Summary of Significant Accounting Policies,” to the Company’s consolidated financial statements set forth in Item 8, “Financial Statements and Supplementary Data.”
ITEM 7A. QUANTITATIVE AND QUALITATIVE DISCLOSURES ABOUT MARKET RISK
See Item 7, “Management’s Discussion and Analysis of Financial Condition and Results of Operations —Risk Management” and “— Interest Rate Sensitivity.”
| 54 | Overseas Shipholding Group, Inc. |
FINANCIAL STATEMENTS AND SUPPLEMENTARY DATA
TABLE OF CONTENTS
| 55 | Overseas Shipholding Group, Inc. |
OVERSEAS SHIPHOLDING GROUP, INC. AND SUBSIDIARIES
CONSOLIDATED BALANCE SHEETS
AT DECEMBER 31
DOLLARS IN THOUSANDS
| December 31, | December 31, | |||||||
| 2016 | 2015 | |||||||
| ASSETS | ||||||||
| Current Assets: | ||||||||
| Cash and cash equivalents | $ | 191,089 | $ | 193,978 | ||||
| Restricted cash | 7,272 | 10,583 | ||||||
| Voyage receivables, including unbilled of $12,593 and $2,166 | 23,456 | 6,662 | ||||||
| Income tax recoverable | 877 | 1,200 | ||||||
| Receivable from INSW | 683 | - | ||||||
| Other receivables | 2,696 | 3,195 | ||||||
| Inventories, prepaid expenses and other current assets | 12,243 | 11,615 | ||||||
| Current assets of discontinued operations | - | 396,698 | ||||||
| Total Current Assets | 238,316 | 623,931 | ||||||
| Restricted cash | 8,572 | - | ||||||
| Vessels and other property, less accumulated depreciation | 684,468 | 844,447 | ||||||
| Deferred drydock expenditures, net | 31,172 | 58,166 | ||||||
| Total Vessels, Deferred Drydock and Other Property | 715,640 | 902,613 | ||||||
| Investments in and advances to affiliated companies | 3,694 | 3,827 | ||||||
| Intangible assets, less accumulated amortization | 45,617 | 50,217 | ||||||
| Other assets | 18,658 | 16,608 | ||||||
| Non-current assets of discontinued operations | - | 1,633,214 | ||||||
| Total Assets | $ | 1,030,497 | $ | 3,230,410 | ||||
| LIABILITIES AND EQUITY | ||||||||
| Current Liabilities: | ||||||||
| Accounts payable, accrued expenses and other current liabilities | $ | 57,222 | $ | 60,450 | ||||
| Income taxes payable | 306 | 50 | ||||||
| Current installments of long-term debt | - | 56,755 | ||||||
| Current liabilities of discontinued operations | - | 37,030 | ||||||
| Total Current Liabilities | 57,528 | 154,285 | ||||||
| Reserve for uncertain tax positions | 3,129 | 2,520 | ||||||
| Long-term debt | 525,082 | 634,286 | ||||||
| Deferred income taxes | 141,457 | 208,195 | ||||||
| Other liabilities | 48,969 | 52,889 | ||||||
| Non-current liabilities of discontinued operations | - | 597,747 | ||||||
| Total Liabilities | 776,165 | 1,649,922 | ||||||
| Commitments and contingencies | ||||||||
| Equity: | ||||||||
| Common stock - Class A ($0.01 par value; 166,666,666 shares authorized; 70,271,172 and 60,775,943 shares issued and outstanding) | 702 | 3,646 | ||||||
| Common stock - Class B ($0.01 par value; 1,321,134 shares authorized; 1,232,247 shares issued and outstanding in 2015) | - | 74 | ||||||
| Paid-in additional capital | 583,526 | 1,651,511 | ||||||
| Accumulated deficit | (321,736 | ) | (1,282 | ) | ||||
| 262,492 | 1,653,949 | |||||||
| Accumulated other comprehensive loss | (8,160 | ) | (73,461 | ) | ||||
| Total Equity | 254,332 | 1,580,488 | ||||||
| Total Liabilities and Equity | $ | 1,030,497 | $ | 3,230,410 | ||||
See notes to consolidated financial statements
| 56 | Overseas Shipholding Group, Inc. |
OVERSEAS SHIPHOLDING GROUP, INC. AND SUBSIDIARIES
CONSOLIDATED STATEMENTS OF OPERATIONS
FOR THE YEARS ENDED DECEMBER 31
DOLLARS IN THOUSANDS, EXCEPT PER SHARE AMOUNTS
| 2016 | 2015 | 2014 | ||||||||||
| Shipping Revenues: | ||||||||||||
| Time charter revenues | $ | 372,149 | $ | 385,206 | $ | 347,823 | ||||||
| Voyage charter revenues | 90,271 | 81,666 | 92,594 | |||||||||
| 462,420 | 466,872 | 440,417 | ||||||||||
| Operating Expenses: | ||||||||||||
| Voyage expenses | 16,260 | 17,814 | 26,044 | |||||||||
| Vessel expenses | 140,696 | 138,179 | 135,079 | |||||||||
| Charter hire expenses | 91,947 | 91,875 | 91,061 | |||||||||
| Depreciation and amortization | 89,563 | 76,851 | 67,547 | |||||||||
| General and administrative | 41,608 | 61,540 | 52,454 | |||||||||
| Severance costs | 12,996 | - | 2,161 | |||||||||
| Loss/(gain) on disposal of vessels and other property, including impairments | 104,532 | 207 | (578 | ) | ||||||||
| Total Operating Expenses | 497,602 | 386,466 | 373,768 | |||||||||
| (Loss)/Income from Vessel Operations | (35,182 | ) | 80,406 | 66,649 | ||||||||
| Equity in Income of Affiliated Companies | 3,642 | 3,783 | 3,483 | |||||||||
| Operating (Loss)/Income | (31,540 | ) | 84,189 | 70,132 | ||||||||
| Other (Expense)/Income | (2,391 | ) | (26,239 | ) | 469 | |||||||
| (Loss)/Income before Interest Expense, Reorganization Items and Income Taxes | (33,931 | ) | 57,950 | 70,601 | ||||||||
| Interest Expense | (43,151 | ) | (70,365 | ) | (176,234 | ) | ||||||
| Loss before Reorganization Items and Income Taxes | (77,082 | ) | (12,415 | ) | (105,633 | ) | ||||||
| Reorganization Items, net | 10,925 | (8,052 | ) | (153,125 | ) | |||||||
| Loss from Continuing Operations before Income Taxes | (66,157 | ) | (20,467 | ) | (258,758 | ) | ||||||
| Income Tax Benefit from Continuing Operations | 65,098 | 101,032 | 115,552 | |||||||||
| Net (Loss)/Income from Continuing Operations | (1,059 | ) | 80,565 | (143,206 | ) | |||||||
| Net (Loss)/Income from Discontinued Operations | (292,555 | ) | 203,395 | (9,067 | ) | |||||||
| Net (Loss)/Income | $ | (293,614 | ) | $ | 283,960 | $ | (152,273 | ) | ||||
| Weighted Average Number of Common Shares Outstanding: | ||||||||||||
| Basic - Class A | 90,949,577 | 95,584,559 | 39,013,720 | |||||||||
| Basic - Class B and Common Stock | 533,758 | 1,320,337 | 18,675,839 | |||||||||
| Diluted - Class A | 90,949,577 | 95,629,090 | 39,013,720 | |||||||||
| Diluted - Class B and Common Stock | 533,758 | 1,320,337 | 18,675,839 | |||||||||
| Per Share Amounts: | ||||||||||||
| Basic and diluted net income/(loss) - Class A from Continuing operations | $ | (0.01 | ) | $ | 0.83 | $ | (2.48 | ) | ||||
| Basic and diluted net income/(loss) - Class A from Discontinued operations | $ | (3.24 | ) | $ | 2.10 | $ | (0.16 | ) | ||||
| Basic and diluted net income/(loss) - Class A | $ | (3.25 | ) | $ | 2.93 | $ | (2.64 | ) | ||||
| Basic and diluted net income/(loss) - Class B from Continuing operations | $ | (0.11 | ) | $ | 0.83 | $ | (2.48 | ) | ||||
| Basic and diluted net income/(loss) - Class B from Discontinued operations | $ | 4.54 | $ | 2.10 | $ | (0.16 | ) | |||||
| Basic and diluted net income/(loss) - Class B | $ | 4.43 | $ | 2.93 | $ | (2.64 | ) | |||||
| Cash dividends declared Class A | $ | 0.48 | $ | - | $ | - | ||||||
| Cash dividends declared Class B | $ | 1.56 | $ | - | $ | - | ||||||
See notes to consolidated financial statements
| 57 | Overseas Shipholding Group, Inc. |
OVERSEAS SHIPHOLDING GROUP, INC. AND SUBSIDIARIES
CONSOLIDATED STATEMENTS OF COMPREHENSIVE INCOME/(LOSS)
FOR THE YEARS ENDED DECEMBER 31
DOLLARS IN THOUSANDS
| 2016 | 2015 | 2014 | ||||||||||
| Net (Loss)/Income | $ | (293,614 | ) | $ | 283,960 | $ | (152,273 | ) | ||||
| Other Comprehensive Income/(Loss), net of tax: | ||||||||||||
| Net change in unrealized gains/(losses) on cash flow hedges | 10,311 | 6,927 | (2,284 | ) | ||||||||
| Defined benefit pension and other postretirement benefit plans: | ||||||||||||
| Net change in unrecognized transition obligation | - | - | 4 | |||||||||
| Net change in unrecognized prior service costs | (60 | ) | (211 | ) | (77 | ) | ||||||
| Net change in unrecognized actuarial losses | (3,295 | ) | 3,203 | (11,679 | ) | |||||||
| Other Comprehensive Income/(Loss) | 6,956 | 9,919 | (14,036 | ) | ||||||||
| Comprehensive (Loss)/Income | $ | (286,658 | ) | $ | 293,879 | $ | (166,309 | ) | ||||
See notes to consolidated financial statements
| 58 | Overseas Shipholding Group, Inc. |
OVERSEAS SHIPHOLDING GROUP, INC. AND SUBSIDIARIES
CONSOLIDATED STATEMENTS OF CASH FLOWS
FOR THE YEARS ENDED DECEMBER 31
DOLLARS IN THOUSANDS
| 2016 | 2015 | 2014 | ||||||||||
| Cash Flows from Operating Activities: | ||||||||||||
| Net (loss)/income | $ | (293,614 | ) | $ | 283,960 | $ | (152,273 | ) | ||||
| Less: Net (loss)/income from discontinued operations | (292,555 | ) | 203,395 | (9,067 | ) | |||||||
| Net (loss)/income from continuing operations | (1,059 | ) | 80,565 | (143,206 | ) | |||||||
| Items included in net (loss)/income from continuing operations not affecting cash flows: | ||||||||||||
| Depreciation and amortization | 89,563 | 76,851 | 67,547 | |||||||||
| Vessel impairment charges | 104,405 | - | - | |||||||||
| Amortization of debt discount and other deferred financing costs | 6,005 | 5,154 | 1,964 | |||||||||
| Compensation relating to restricted stock/stock unit and stock option grants | 7,441 | 3,580 | 554 | |||||||||
| Deferred income tax benefit | (67,394 | ) | (69,564 | ) | (82,432 | ) | ||||||
| Undistributed earnings of affiliated companies | 132 | (399 | ) | 108 | ||||||||
| Deferred payment obligations on charters-in | - | 590 | 3,232 | |||||||||
| Reorganization items, non-cash | 5,198 | (50 | ) | 22,402 | ||||||||
| Other – net | 2,268 | 1,971 | 2,032 | |||||||||
| Items included in net income/(loss) related to investing and financing activities: | ||||||||||||
| Discount on repurchase of debt | (3,415 | ) | - | - | ||||||||
| Loss/(gain) on disposal of vessels and other property, net | 127 | 207 | (578 | ) | ||||||||
| Distributions from INSW | 202,000 | 200,000 | 53,225 | |||||||||
| Payments for drydocking | (6,844 | ) | (41,323 | ) | (25,740 | ) | ||||||
| Bankruptcy and IRS claim payments | (7,136 | ) | (8,343 | ) | (289,899 | ) | ||||||
| Deferred financing costs paid for loan modification | - | (4,220 | ) | - | ||||||||
| Changes in operating assets and liabilities: | ||||||||||||
| (Increase)/decrease in receivables | (16,794 | ) | 6,502 | 7,979 | ||||||||
| Decrease in income tax recoverable | 323 | 54,637 | (51,904 | ) | ||||||||
| Security deposits with vendors and lenders | - | - | 10,369 | |||||||||
| Increase/(decrease) in deferred revenue | 63 | (3,034 | ) | (2,989 | ) | |||||||
| Net change in prepaid items and accounts payable, accrued expenses and other current and long-term liabilities | 13,977 | (26,791 | ) | 15,854 | ||||||||
| Net cash provided by/(used in) operating activities | 328,860 | 276,333 | (411,482 | ) | ||||||||
| Cash Flows from Investing Activities: | ||||||||||||
| Change in restricted cash | (5,261 | ) | 42,502 | (53,085 | ) | |||||||
| Expenditures for vessels and vessel improvements | - | (53 | ) | (10,958 | ) | |||||||
| Expenditures for other property | (666 | ) | (75 | ) | (489 | ) | ||||||
| Contributions to INSW | - | - | (11,260 | ) | ||||||||
| Other – net | - | (1 | ) | 833 | ||||||||
| Net cash provided by/(used in) investing activities | (5,927 | ) | 42,373 | (74,959 | ) | |||||||
| Cash Flows from Financing Activities: | ||||||||||||
| Issuance of common stock, net of issuance costs | - | - | 1,510,000 | |||||||||
| Cash dividends paid | (31,910 | ) | - | - | ||||||||
| Issuance of debt, net of issuance and deferred financing costs | - | - | 576,058 | |||||||||
| Payments on debt, including adequate protection payments | (54,345 | ) | (6,030 | ) | (1,338,618 | ) | ||||||
| Extinguishment of debt | (120,224 | ) | (326,051 | ) | - | |||||||
| Repurchases of common stock and common stock warrants | (119,343 | ) | (3,633 | ) | - | |||||||
| Payments on debt of INSW guaranteed by OSG | - | - | (477,835 | ) | ||||||||
| Purchases of treasury stock | - | - | (162 | ) | ||||||||
| Net cash (used in)/provided by financing activities | (325,822 | ) | (335,714 | ) | 269,443 | |||||||
| Net decrease in cash and cash equivalents | (2,889 | ) | (17,008 | ) | (216,998 | ) | ||||||
| Cash and cash equivalents at beginning of year | 193,978 | 210,986 | 427,984 | |||||||||
| Cash and cash equivalents at end of year | $ | 191,089 | $ | 193,978 | $ | 210,986 | ||||||
| Cash flows from discontinued operations: | ||||||||||||
| Cash flows provided by/(used in) operating activities | $ | 111,768 | $ | 222,739 | $ | (253,295 | ) | |||||
| Cash flows provided by investing activities | 25,202 | 114,163 | 16,361 | |||||||||
| Cash flows provided by/(used in) financing activities | (355,687 | ) | (206,284 | ) | 241,231 | |||||||
| Net (decrease)/increase in cash and cash equivalents from discontinued operations | $ | (218,717 | ) | $ | 130,618 | $ | 4,297 | |||||
See notes to consolidated financial statements
| 59 | Overseas Shipholding Group, Inc. |
OVERSEAS SHIPHOLDING GROUP, INC. AND SUBSIDIARIES
CONSOLIDATED STATEMENTS OF CHANGES IN EQUITY/(DEFICIT)
DOLLARS IN THOUSANDS
| Retained | Accumulated | |||||||||||||||||||||||||||
| Paid-in | Earnings / | Other | ||||||||||||||||||||||||||
| Common | Additional | (Accumulated | Treasury Stock | Comprehensive | ||||||||||||||||||||||||
| Stock | Capital | Deficit) | Shares | Amount | Loss | Total | ||||||||||||||||||||||
| Balance at December 31, 2013 | $ | 44,291 | $ | 413,753 | $ | 386,250 | 13,575,339 | $ | (835,197 | ) | $ | (69,344 | ) | $ | (60,247 | ) | ||||||||||||
| Net Loss | (152,273 | ) | (152,273 | ) | ||||||||||||||||||||||||
| Other Comprehensive Loss, net of taxes | (14,036 | ) | (14,036 | ) | ||||||||||||||||||||||||
| Forfeitures of Restricted Stock Awards | 3,110 | 138,330 | (3,110 | ) | - | |||||||||||||||||||||||
| Cancellation of Common Stock | (44,291 | ) | (419,176 | ) | (375,002 | ) | (13,743,949 | ) | 838,469 | - | ||||||||||||||||||
| Issuance of Common Stock | 3,148 | 1,506,852 | 1,510,000 | |||||||||||||||||||||||||
| Issuance of Restricted Stock Awards | 3 | (3 | ) | - | ||||||||||||||||||||||||
| Compensation Related to Options Granted, net of true-up for actual forfeitures | 278 | 278 | ||||||||||||||||||||||||||
| Amortization of Restricted Stock Awards, net of true-up for actual forfeitures | 2,035 | 2,035 | ||||||||||||||||||||||||||
| Compensation Related to Class A Options Granted | 60 | 60 | ||||||||||||||||||||||||||
| Amortization of Class A Restricted Stock and Restricted Stock Unit Awards | 432 | 432 | ||||||||||||||||||||||||||
| Conversion of Class B Warrants to Class B Common Stock | 7 | (7 | ) | - | ||||||||||||||||||||||||
| Purchases of Treasury Stock | 30,280 | (162 | ) | (162 | ) | |||||||||||||||||||||||
| Balance at December 31, 2014 | 3,158 | 1,507,334 | (141,025 | ) | - | - | (83,380 | ) | 1,286,087 | |||||||||||||||||||
| Net Income | 283,960 | 283,960 | ||||||||||||||||||||||||||
| Other comprehensive income, net of taxes | 9,919 | 9,919 | ||||||||||||||||||||||||||
| Stock Dividends Declared | 338 | 143,879 | (144,217 | ) | - | |||||||||||||||||||||||
| Issuance and Vesting of Restricted Stock Awards | 5 | (5 | ) | - | ||||||||||||||||||||||||
| Forfeitures and Cancellation of Restricted Stock Awards | (257 | ) | (257 | ) | ||||||||||||||||||||||||
| Compensation Related to Class A Options Granted | 621 | 621 | ||||||||||||||||||||||||||
| Amortization of Restricted Stock Awards | 1,217 | 1,217 | ||||||||||||||||||||||||||
| Compensation Related to Class A Restricted Stock Awards | 2,574 | 2,574 | ||||||||||||||||||||||||||
| Repurchase of Class A Warrants | (3,633 | ) | (3,633 | ) | ||||||||||||||||||||||||
| Conversion of Class A and Class B Warrants to Common Stock | 219 | (219 | ) | - | ||||||||||||||||||||||||
| Balance at December 31, 2015 | 3,720 | 1,651,511 | (1,282 | ) | - | - | (73,461 | ) | 1,580,488 | |||||||||||||||||||
| Net Loss | (293,614 | ) | (293,614 | ) | ||||||||||||||||||||||||
| Other Comprehensive Income, net of taxes | 6,956 | 6,956 | ||||||||||||||||||||||||||
| Dividends Declared and Paid | (5,070 | ) | (25,503 | ) | (30,573 | ) | ||||||||||||||||||||||
| Special Dividend Paid to Class B shareholders | (1,337 | ) | (1,337 | ) | ||||||||||||||||||||||||
| Vesting of Restricted Stock Awards to be Settled in Cash | (528 | ) | (528 | ) | ||||||||||||||||||||||||
| Issuance and Vesting of Restricted Stock Awards | 3 | (3 | ) | - | ||||||||||||||||||||||||
| Forfeitures and Cancellation of Restricted Stock Awards | (363 | ) | (363 | ) | ||||||||||||||||||||||||
| Compensation Related to Class A Options Granted, net of forfeitures | 2,414 | 2,414 | ||||||||||||||||||||||||||
| Compensation Related to Class A Restricted Stock Awards, net of forfeitures | 5,882 | 5,882 | ||||||||||||||||||||||||||
| Repurchase of Class A Warrants and Class A Common Stock | (5 | ) | (119,338 | ) | (119,343 | ) | ||||||||||||||||||||||
| Conversion of Class A and B Warrants to Common Stock | 413 | (413 | ) | - | ||||||||||||||||||||||||
| Reverse Stock Split | (3,429 | ) | 3,429 | - | ||||||||||||||||||||||||
| Distribution of INSW Stock | (953,995 | ) | 58,345 | (895,650 | ) | |||||||||||||||||||||||
| Balance at December 31, 2016 | $ | 702 | $ | 583,526 | $ | (321,736 | ) | - | - | $ | (8,160 | ) | $ | 254,332 | ||||||||||||||
See notes to consolidated financial statements
| 60 | Overseas Shipholding Group, Inc. |
OVERSEAS SHIPHOLDING GROUP, INC. AND SUBSIDIARIES
NOTES TO CONSOLIDATED FINANCIAL STATEMENTS
NOTE 1 — BASIS OF PRESENTATION AND DESCRIPTION OF BUSINESS:
The consolidated financial statements include the accounts of Overseas Shipholding Group, Inc., a Delaware corporation incorporated in 1969, and its wholly owned subsidiaries (the “Company” or “OSG”, or “we” or “us” or “our”). All significant intercompany balances and transactions have been eliminated in consolidation. Investments in 50% or less owned affiliated companies, in which the Company exercises significant influence, are accounted for by the equity method. Dollar amounts, except per share amounts, are in thousands.
The Company owns and operates a fleet of oceangoing vessels engaged primarily in the transportation of crude oil and refined petroleum products in the U.S. Flag trade through its wholly owned subsidiary, OSG Bulk Ships, Inc. (“OBS”), a New York corporation.
On November 30, 2016 (the “Distribution Date”), OSG completed the separation of its business into two independent publicly-traded companies through the spin-off of its then wholly-owned subsidiary International Seaways, Inc. (“INSW”). The spin-off separated OSG and INSW into two distinct businesses with separate management. OSG retained the U.S. Flag business and INSW holds entities and other assets and liabilities that formed OSG’s former International Flag business.
The spin-off transaction was in the form of a pro rata distribution of INSW’s common stock to our stockholders and warrant holders of record as of 5:00 p.m., New York time on November 18, 2016 (the “Record Date”). On the Distribution Date, each holder of OSG common stock received 0.3333 shares of INSW’s common stock for every share of OSG common stock held on the Record Date. Each holder of OSG warrants received 0.3333 shares of INSW’s common stock for every one share of OSG common stock they would have received if they exercised their warrants immediately prior to the Distribution (or 0.063327 INSW shares per warrant).
The spin-off was completed pursuant to a Separation and Distribution Agreement and several other agreements with INSW related to the spin-off, including a Transition Services Agreement and an Employee Matters Agreement. These agreements govern the relationship between us and INSW following the spin-off and provide for the allocation of various assets, liabilities, rights and obligations. These agreements also include arrangements for transition services to be provided by OSG to INSW and by INSW to OSG.
In accordance with Accounting Standards Update (“ASU”) 2014-08, Reporting Discontinued Operations and Disclosures of Disposals of Components of an Entity, the assets and liabilities and results of operations of INSW are reported as discontinued operations, net of taxes, for all periods presented. Accordingly, all references made to financial data in this Annual Report on Form 10-K are to the Company’s continuing operations unless specifically noted. See Note 5, “Discontinued Operations,” for additional information.
As further discussed in Note 14, “Capital Stock and Stock Compensation,” the Company’s board of directors (the “Board”) approved a stock dividend of Class A common stock, whereby on December 17, 2015, all shareholders of record of the Company’s Class A and B common stock as of December 3, 2015 (the “record date”), received a dividend of one-tenth of one share of Class A common stock for each share of Class A common stock and Class B common stock held by them as of the record date. In addition, as discussed further in Note 14, effective May 27, 2016, all Class B common shares and Class B warrants automatically converted into one Class A common share and one Class A warrant, respectively, and on June 2, 2016 the Board approved an amendment (the “Reverse Split Amendment”) to the Company’s Amended and Restated Certificate of Incorporation. The Reverse Split Amendment effected a one (1) for six (6) reverse stock split and corresponding reduction of the number of authorized shares of common stock, par value $0.01 per share (the “Reverse Split”). The Reverse Split Amendment became effective on June 13, 2016. In accordance with Financial Accounting Standards Board (“FASB”) Accounting Standards Codification (“ASC”) ASC 260, Earnings Per Share, the Company adjusted the computations of basic and diluted earnings per share retroactively for all periods presented to reflect that change in its capital structure. Accordingly, amounts previously reported in 2015 and 2014 with respect to earnings per share, outstanding Class A shares, Class A restricted stock units, restricted shares and stock options have been restated where appropriate. See Note 4, “Earnings per Common Share,” for additional information.
NOTE 2 — CHAPTER 11 FILING AND EMERGENCE FROM BANKRUPTCY:
On November 14, 2012 (the “Petition Date”), the Company and 180 of its subsidiaries (together with OSG, the “Debtors”) filed voluntary petitions for reorganization under Chapter 11 of Title II of the U.S. Code (the “Bankruptcy Code”) in the U.S. Bankruptcy Court for the District of Delaware (the “Bankruptcy Court”). On March 7, 2014, the Debtors filed a plan of reorganization supported by certain of the lenders under OSG’s $1,500,000 credit agreement, dated as of February 9, 2006 (the “Lender Plan”). On April 18, 2014, the Debtors received a proposal for an alternative plan of reorganization from certain holders of existing equity interests of OSG, which the Debtors determined to be more favorable to the Debtors’ creditors and equity interest holders than the Lender Plan (the “Equity Proposal”). Accordingly, the Debtors filed with the Bankruptcy Court a plan of reorganization that effectuated the terms of the Equity Proposal (as subsequently amended, the “Equity Plan”). The Bankruptcy Court confirmed the Equity Plan by order entered on July 18, 2014 (the “Confirmation Order”). On August 5, 2014 (the “Effective Date”), the Equity Plan became effective and OSG emerged from bankruptcy. On February 10, 2017, pursuant to a final decree and order of the Bankruptcy Court, OSG’s one remaining case, as the Parent Company, was closed.
| 61 | Overseas Shipholding Group, Inc. |
Summary of Emergence from Bankruptcy
The Equity Plan deleveraged the Company’s balance sheet by reducing debt and increasing stockholders’ equity. The financial restructuring was accomplished through exit financing and by using the proceeds from a shareholder rights offering (including Backstop Securities) and supplemental equity offering (Holdback Securities), as further discussed below, and cash on hand to reduce outstanding indebtedness. Below is a summary of the significant events affecting the Company’s capital structure as a result of the Equity Plan becoming effective. The share information below has been adjusted for the reverse stock split described in Note 1, “Basis of Presentation and Description of Business.”
Amended and Restated Certificate of Incorporation
On the Effective Date, the Company amended and restated its certificate of incorporation (the “Amended and Restated Certificate of Incorporation”) to among other things, authorize the Company to issue 177,987,801 shares of stock consisting of the following classes: (a) 166,666,666 shares of Class A common stock, par value $0.01 per share, (b) 1,321,134 shares of Class B common stock, par value $0.01 per share and (c) 10,000,000 shares of preferred stock, par value $0.01 per share, which may be issued in one or more series as the Board of Directors may determine from time to time.
Equity Commitment Agreement
On May 2, 2014, the Debtors entered into an equity commitment agreement (as subsequently amended, and including the exhibits thereto, the “Equity Commitment Agreement”) with potential investors (each, an “Initial Commitment Party”) and upon amendment of the Equity Commitment Agreement to, among other things, join certain additional parties to the Equity Commitment Agreement (each such additional party and each Initial Commitment Party, a “Commitment Party”). The Equity Commitment Agreement, along with the associated rights offering procedures, set forth the terms of an equity rights offering (the “Rights Offering”) and separate sale of Holdback Securities (as defined below) for an aggregate offering amount of $1,510,000. The Equity Plan and Equity Commitment Agreement further provided for the Company’s issuance of two separate classes of common stock (the “Class A common stock” and the “Class B common stock”, and collectively the “New Shares”) and penny warrants to purchase Class A common stock and Class B common stock (respectively “Class A warrants” and “Class B warrants”, and, together with the New Shares, the “Rights Offering Securities”).
Rights Offering and Issuance of Shares and Warrants
In accordance with the Equity Commitment Agreement and the Equity Plan, on or about June 10, 2014, subscription rights to purchase Rights Offering Securities (each such right, a “Subscription Right”) were distributed in respect of each then outstanding share of common stock of Pre-Reorganized OSG (each such share, an “Existing Share”) to the holder of record of such Existing Share as of June 6, 2014 (the “Record Date”). Each Subscription Right entitled a holder thereof that satisfied certain specified conditions (each, an “Eligible Holder”) to purchase 12 shares of Class A common stock or Class A warrants, as applicable, as described in the Equity Plan, for $18.00 per Rights Offering Security. Each Eligible Holder that timely elected to participate in the Rights Offering (each, a “Participating Eligible Holder”) was able to exercise some, all or none of the Subscription Rights it received, but each Subscription Right could only be exercised in whole, and not in part. All holders of Existing Shares of Pre-Reorganized OSG as of the Record Date that were not Participating Eligible Holders received, as described in the Equity Plan, one new share of Class B common stock or Class B warrants in respect of each Existing Share held by such holder on the Record Date.
Each Commitment Party agreed in the Equity Commitment Agreement to exercise its Subscription Rights in full (to the extent such Commitment Party received Subscription Rights), to purchase a portion of any remaining securities related to unexercised Subscription Rights following completion of the Rights Offering (the “Backstop Securities”) and to purchase a portion of a further additional number of shares of Class A common stock and/or Class A warrants (the “Holdback Securities”) (the Rights Offering Securities, Backstop Securities and Holdback Securities, collectively, the “Aggregate Offering”) allocated to such Commitment Party under the Equity Commitment Agreement. As consideration for the respective commitments to purchase Backstop Securities, the Company granted to the Commitment Parties an aggregate of 4,194,445 further shares of Class A common stock and Class A warrants.
On the Effective Date, all previously issued and outstanding shares of the Company’s common stock were cancelled and retired, and ceased to exist, and the Company issued the two series of common stock and penny warrants (described above) for an aggregate offering amount of $1,510,000. The Company issued 51,142,963 shares of Class A common stock and 35,619,237 Class A warrants pursuant to Rule 506(b) under the Securities Act of 1933, as amended. In addition, the Company issued 909,599 shares of Class B common stock and 411,502 Class B warrants pursuant to Section 1145 of the Bankruptcy Code. Pursuant to the Confirmation Order, the Class A common stock and Class B common stock were deemed to be part of the same class of securities under Section 12 of the Securities Exchange Act of 1934. The proceeds from the issuance of the Rights Offering Securities were used to satisfy certain of the Equity Plan’s cash payment obligations and to provide working capital to fund the Company’s operations after emergence from bankruptcy.
| 62 | Overseas Shipholding Group, Inc. |
For additional information regarding the Company’s capital structure see Note 14, “Capital Stock and Stock Compensation,” to these consolidated financial statements.
Exit Financing and Entry into Credit Facilities
On the Effective Date, to support the Equity Plan, OSG and its subsidiaries entered into secured debt facilities consisting of: (i) a secured asset-based revolving loan facility of $75,000, among the Parent Company, OBS, certain OBS subsidiaries, Wells Fargo Bank, National Association (“Wells Fargo”) as Administrative Agent, and the other lenders party thereto (the “OBS ABL Facility”), secured by a first lien on substantially all of the U.S. Flag assets of OBS and its subsidiaries and a second lien on certain other specified U.S. Flag assets and (ii) a secured term loan of $603,000, among the Parent Company, OBS, certain OBS subsidiaries, Jefferies Finance LLC (“Jefferies”), as Administrative Agent, and other lenders party thereto (the “OBS Term Loan”), secured by a first lien on certain specified U.S. Flag assets of OBS and its subsidiaries and a second lien on substantially all of the other U.S. Flag assets of OBS and its subsidiaries. On August 5, 2014, the available amounts under the OBS Term Loan was drawn in full.
Financial Reporting
The Company prepared its consolidated financial statements in accordance with ASC 852, Reorganizations, and on a going-concern basis, which assumes continuity of operations, realization of assets and liabilities in the ordinary course for the years ended December 31, 2016, 2015 and 2014.
ASC 852 requires that financial statements for periods subsequent to the filing of the Chapter 11 cases distinguish transactions and events that are directly associated with the reorganization from the ongoing operations of the business. Accordingly, all transactions (including but not limited to, all professional fees and other expenses, realized gains and losses, and provisions for losses) directly associated with the reorganization and restructuring of the business are reported separately as reorganization items in the consolidated statements of operations. The balance sheet, prior to emergence, was required to distinguish pre-petition liabilities subject to compromise from both those pre-petition liabilities that are not subject to compromise and from post-petition liabilities. However, there were no liabilities that are subject to compromise as of the end of December 31, 2016 and 2015.
Upon the Company’s emergence from Chapter 11 bankruptcy proceedings on August 5, 2014, the Company was not required to apply fresh start accounting based on the provisions of ASC 852 since holders of the Company’s outstanding common shares immediately before confirmation of the Equity Plan received more than 50% of the Company’s outstanding common shares upon emergence. Accordingly, a new reporting entity was not created for accounting purposes.
Reorganization Items, net
Reorganization items, net represent amounts incurred after the Petition Date as a direct result of the filing of the Chapter 11 cases and are comprised of the following:
| For the year ended December 31, | 2016 | 2015 | 2014 | |||||||||
| Trustee fees | $ | 100 | $ | 217 | $ | 2,742 | ||||||
| Professional fees | 2,288 | 8,027 | 112,280 | |||||||||
| Provision for and expenses incurred on rejected executory contracts, including post-petition interest | - | - | 107 | |||||||||
| Litigation settlement, net | (20,359 | ) | - | - | ||||||||
| Litigation settlement due to class action plaintiffs | 2,136 | - | - | |||||||||
| Litigation settlement due to Class B warrant holders | 86 | - | - | |||||||||
| Provision for claims | 4,824 | - | - | |||||||||
| Provision for post-petition interest on debt facilities | - | - | 5,321 | |||||||||
| Provision for post-petition interest on claims | - | - | (27 | ) | ||||||||
| 2004 Stock Incentive Plan | - | - | 1,488 | |||||||||
| Provision for class action lawsuit and other subordinated claims | - | - | 17,000 | |||||||||
| Other claim adjustments | - | (192 | ) | 14,214 | ||||||||
| $ | (10,925 | ) | $ | 8,052 | $ | 153,125 | ||||||
| 63 | Overseas Shipholding Group, Inc. |
On February 12, 2016, the Company entered into an agreement with Proskauer and four of its partners to settle the malpractice suit filed by the Company in March 2014. Settlement proceeds totaling $20,359 net of all related out-of-pocket expenses, including legal fees, incurred by the Company during the three months ended March 31, 2016 are included in litigation settlement, net in the table above. In addition, as discussed below in Note 21, “Contingencies,” pursuant to the terms of the Company’s settlement with members of the putative class of securities claimants, the Company recognized an income statement charge for 15%, or $2,136, of the Net Litigation Recovery amount of $14,242 (as defined below) during the year ended December 31, 2016. The “Net Litigation Recovery” is the gross amount of the settlement less all related out-of-pocket expenses, including legal fees, incurred by the Company since the inception of the action against the Proskauer Plaintiffs (as defined in Note 21) through the date of settlement. Further, as required by the Equity Plan, the Company’s Certificate of Incorporation and the Class B Warrant Agreement, the Company distributed 10%, or $1,423, of the Net Litigation Recovery amount to the Class B shareholders and warrant holders in May 2016. Approximately $86 of the aforementioned $1,423, which represents the proportional share of the Net Litigation Recovery payable to the Company’s Class B warrant holders, was recognized as a charge to reorganization items, net in the second quarter of 2016. The balance of $1,337 was distributed in the form of a special dividend to the Company’s Class B shareholders and was recorded as a reduction of retained earnings.
The table above also includes a $4,824 provision related to claims associated with the SEC investigation. As described in Note 21, “Contingencies,” such claims were subsequently settled during the first quarter of 2017.
Contractual post-petition interest for debt facilities and certain rejected executory contracts is reported as interest expense in
the consolidated statement of operations for the year ended December 31, 2014. See Note 9, “Debt.”
Cash paid for reorganization items, excluding the Proskauer related settlement amounts noted above, was $2,455, $18,068, and $443,296 for the years ended December 31, 2016, 2015 and 2014, respectively.
NOTE 3 — SUMMARY OF SIGNIFICANT ACCOUNTING POLICIES:
| 1. | Cash and cash equivalents — Interest-bearing deposits that are highly liquid investments and have a maturity of three months or less when purchased are included in cash and cash equivalents. Management has designated cash reserves of $5,576 and $10,583 as of December 31, 2016 and December 31, 2015, respectively, to be utilized for the settlement of certain unsecured claims related to the Company’s emergence from bankruptcy. Additionally, restricted cash as of December 31, 2016 includes $10,268 of legally restricted cash. Pursuant to the terms of the OBS Facility, in the event of a spinoff of INSW, the Company was required to set aside, in an escrow account, cash in an aggregate amount of not less than the sum of all accrued and unpaid interest on the outstanding Unsecured Senior Notes (as defined in Note 9, “Debt”) through the date of the consummation of the INSW Spinoff and all interest expense that will accrue under the respective outstanding Unsecured Senior Notes from the date of the consummation of the INSW Spinoff through the maturity of the respective Unsecured Senior Notes. Activity relating to restricted cash is reflected in investing activities in the consolidated statements of cash flow. |
| 2. | Vessels, vessel lives, deferred drydocking expenditures and other property —Vessels are recorded at cost and are depreciated to their estimated salvage value on the straight-line basis over the estimated useful lives of the vessels, which are generally 25 years (except for new ATBs for which estimated useful lives of 30 years are used). Each vessel’s salvage value is equal to the product of its lightweight tonnage and an estimated scrap rate of $300 per ton. |
Other property, including leasehold improvements, are recorded at cost and amortized on a straight-line basis over the shorter of the terms of the leases or the estimated useful lives of the assets, which range from three to 15 years.
Interest costs are capitalized to vessels during the period that vessels are under construction however, no interest was capitalized during 2016, 2015 or 2014, as there were no vessels under construction.
Expenditures incurred during a drydocking are deferred and amortized on the straight-line basis over the period until the next scheduled drydocking, generally two and a half to five years. The Company only includes in deferred drydocking costs those direct costs that are incurred as part of the drydocking to meet regulatory requirements, or are expenditures that add economic life to the vessel, increase the vessel’s earnings capacity or improve the vessel’s efficiency. Direct costs include shipyard costs as well as the costs of placing the vessel in the shipyard. Expenditures for normal maintenance and repairs, whether incurred as part of the drydocking or not, are expensed as incurred.
The carrying value of each of the Company’s vessels represents its original cost at the time it was delivered or purchased less depreciation calculated using estimated useful lives from the date such vessel was originally delivered from the shipyard or from the date (as in the case of certain of the Company’s ATBs) a vessel was rebuilt. A vessel’s carrying value is reduced to its new cost basis (i.e., its current fair value) if a vessel impairment charge is recorded.
| 64 | Overseas Shipholding Group, Inc. |
If the estimated economic lives assigned to the Company’s vessels prove to be too long because of new regulations, a prolonged weak market environment, a broad imposition of age restrictions by the Company’s customers, or other future events, it could result in higher depreciation expense and impairment losses in future periods related to a reduction in the useful lives of any affected vessels. In September 2015, after evaluating various impairment indicators that existed at that time, (See Note 6, “Vessels, Deferred Drydock and Other Property”), management determined that it was more likely than not that the Company would scrap six of its rebuilt ATBs at the time of their next scheduled drydock special survey date rather than make the significant capital expenditures necessary to comply with regulatory requirements. Accordingly, the remaining useful lives for such ATBs were adjusted on a prospective basis beginning on October 1, 2015, resulting in an increase in depreciation expense of approximately $3,600 per quarter or $14,400 per year after September 30, 2015. During the third quarter of 2016, management evaluated various impairment indicators that existed at the end of such period and as a result, determined that it was more likely than not that the Company would scrap seven of its rebuilt ATBs prior to their then estimated disposal date, as described above. Accordingly, the remaining useful lives for such ATBs were further adjusted. This reduction in useful lives reduced the decrease in depreciation expense attributable to the ATB vessel impairments discussed in Note 6, “Vessels, Deferred Drydock and Other Property,” by approximately $2,200 per quarter beginning on October 1, 2016.
| 3. | Impairment of long-lived assets —The carrying amounts of long-lived assets held and used by the Company are reviewed for potential impairment whenever events or changes in circumstances indicate that the carrying amount of a particular asset may not be fully recoverable. In such instances, an impairment charge would be recognized if the estimate of the undiscounted future cash flows expected to result from the use of the asset and its eventual disposition is less than the asset’s carrying amount. This assessment is made at the individual vessel level since separately identifiable cash flow information for each vessel is available. The impairment charge, if any, would be measured as the amount by which the carrying amount of a vessel exceeded its fair value. A long-lived asset impairment charge results in a new cost basis being established for the relevant long-lived asset. See Note 6, “Vessels, Deferred Drydock and Other Property,” for further discussion on the impairment tests performed on certain of our vessels during the three years ended December 31, 2016. |
| 4. | Intangible asset —Indefinite lived intangible assets acquired in a business combination are not amortized but are reviewed for impairment annually or more frequently if impairment indicators arise. Intangible assets with estimable useful lives are amortized over their estimated useful lives and are reviewed for potential impairment whenever events or changes in circumstances indicate that the carrying amount of the intangible may be impaired. |
The Company’s intangible assets at December 31, 2016 and 2015 consisted of long-term customer relationships acquired as part of the 2006 purchase of Maritrans, Inc. The long-term customer relationships are being amortized on a straight-line basis over 20 years. As discussed in Note 6, “Vessels, Deferred Drydock and Other Property,” during the quarter ended September 30, 2016, the Company identified changes in circumstances that were indicative of a continued weakening of the Jones Act market. Such indicators included a decline in the number of Jones Act tank vessels transporting crude oil, which led to (i) increased competition for clean cargoes and the idling of some Jones Act vessels; (ii) a sharp decrease in estimated spot rates for Jones Act Product Carriers and large ATBs between July and September 2016; and (iii) a significant decline in forecasted near term TCE rates reported by a leading third party industry analyst. These factors were determined to be triggering events warranting an interim impairment test of the carrying value of the customer relationships intangible asset. As there can be significant overlap between the customers served by each of the Company’s vessel types, the Company’s business as a whole was determined to be the lowest level at which cash flows are largely independent of the cash flows of other groups of assets and liabilities for purposes of testing the customer relationship intangible asset for recoverability. The Company reduced its estimates of undiscounted future cash flows to reflect consideration of the above new factors. Based on the results of the recoverability test performed, no intangible assets impairment was recorded as of September 30, 2016 as the net cash flows from the asset group were in excess of the carrying value of the asset group. The Company also determined that there were no triggering events between September 30, 2016 and December 31, 2016.
| 5. | Deferred finance charges —Finance charges incurred in the arrangement and amendment of debt are deferred and amortized to interest expense on either an effective interest method or straight-line basis over the life of the related debt. |
Unamortized deferred finance charges of $800 and $1,181 relating to the OBS ABL Facility (as defined in Note 9, “Debt”) are included in other assets in the consolidated balance sheets as of December 31, 2016 and 2015, respectively. Unamortized deferred financing charges of $10,421 and $18,153 relating to the OBS Term Loan (as defined in Note 9, “Debt”) and $1,414 and $3,523 relating to the Unsecured Senior Notes are included in long-term debt in the consolidated balance sheets as of December 31, 2016 and 2015, respectively. Interest expense relating to the amortization of deferred financing charges amounted to $6,005 in 2016, $5,154 in 2015 and $1,964 in 2014.
| 65 | Overseas Shipholding Group, Inc. |
| 6. | Revenue and expense recognition —Revenues from time charters are accounted for as operating leases and are thus recognized ratably over the rental periods of such charters, as service is performed. Voyage revenues and expenses are recognized ratably over the estimated length of each voyage, calculated on a discharge-to-discharge basis and, therefore, are allocated between reporting periods based on the relative transit time in each period. The impact of recognizing voyage expenses ratably over the length of each voyage is not materially different on a quarterly and annual basis from a method of recognizing such costs as incurred. OSG does not begin recognizing voyage revenue until a charter has been agreed to by both the Company and the customer, even if the vessel has discharged its cargo and is sailing to the anticipated load port on its next voyage. |
Under voyage charters, expenses such as fuel, port charges, canal tolls, cargo handling operations and brokerage commissions are paid by the Company whereas, under time and bareboat charters, such voyage costs are paid by the Company’s customers.
| 7. | Concentration of Credit Risk — Financial instruments that potentially subject the Company to concentrations of credit risk are voyage receivables due from charterers. With respect to voyage receivables, the Company limits its credit risk by performing ongoing credit evaluations. Voyage receivables reflected in the consolidated balance sheets as of December 31, 2016 and 2015 are net of an allowance for doubtful accounts of $70 and $31, respectively. The provisions for doubtful accounts for the years ended December 31, 2016, 2015 and 2014 were not material. |
During the three years ended December 31, 2016, 2015 and 2014, the Company had four individual customers who accounted for 10% or more of its revenues as follows:
| Percentage of Shipping Revenue | ||||||||||||
| Customer Name | 2016 | 2015 | 2014 | |||||||||
| Tesoro | 16 | % | 15 | % | 13 | % | ||||||
| Petrobras America Inc. | 12 | % | 12 | % | 12 | % | ||||||
| Shell | 12 | % | 11 | % | 12 | % | ||||||
| Marathon Petroleum Company | 11 | % | 14 | % | 12 | % | ||||||
| 8. | Derivatives —ASC 815, Derivatives and Hedging, requires the Company to recognize all derivatives on the balance sheet at fair value. Derivatives that are not effective hedges must be adjusted to fair value through earnings. If the derivative is an effective hedge, depending on the nature of the hedge, a change in the fair value of the derivative is either offset against the change in fair value of the hedged item (fair value hedge), or recognized in other comprehensive income/(loss) and reclassified into earnings in the same period or periods during which the hedge transaction affects earnings (cash flow hedge). The ineffective portion (that is, the change in fair value of the derivative that does not offset the change in fair value of the hedged item) of an effective hedge and the full amount of the change in fair value of derivative instruments that do not qualify for hedge accounting are immediately recognized in earnings. |
The Company formally documents all relationships between hedging instruments and hedged items, as well as its risk-management objective and strategy for undertaking various hedge transactions. This process includes linking all derivatives that are designated as cash flow hedges to forecasted transactions. The Company also formally assesses (both at the hedge's inception and on an ongoing basis) whether the derivatives that are used in hedging transactions have been highly effective in offsetting changes in the cash flows of hedged items and whether those derivatives may be expected to remain highly effective in future periods. When it is determined that a derivative is not (or has ceased to be) highly effective as a hedge, the Company discontinues hedge accounting prospectively, as discussed below.
The Company discontinues hedge accounting prospectively when (1) it determines that the derivative is no longer effective in offsetting changes in the cash flows of a hedged item such as forecasted transactions; (2) the derivative expires or is sold, terminated, or exercised; (3) it is no longer probable that the forecasted transaction will occur; or (4) management determines that designating the derivative as a hedging instrument is no longer appropriate or desired.
When the Company discontinues hedge accounting because it is no longer probable that the forecasted transaction will occur in the originally expected period, the gain or loss on the derivative remains in accumulated other comprehensive loss and is reclassified into earnings when the forecasted transaction affects earnings. However, if it is probable that a forecasted transaction will not occur by the end of the originally specified time period or within an additional two-month period of time thereafter, the gains and losses that were accumulated in other comprehensive loss will be recognized immediately in earnings. In all situations in which hedge accounting is discontinued and the derivative remains outstanding, the Company will carry the derivative at its fair value on the balance sheet, recognizing changes in the fair value in current-period earnings, unless it is designated in a new hedging relationship.
| 66 | Overseas Shipholding Group, Inc. |
During the three years ended December 31, 2016, no ineffectiveness gains or losses were recorded in earnings relative to interest rate caps entered into by the Company or its subsidiaries that qualified for hedge accounting. Any gain or loss realized upon the early termination of an interest rate cap is recognized as an adjustment of interest expense over the shorter of the remaining term of the cap or the hedged debt. See Note 10, “Fair Value of Financial Instruments, Derivatives and Fair Value Disclosures,” for additional disclosures on the Company’s interest rate caps and other financial instruments.
| 9. | Income taxes — The Company accounts for income taxes under the asset and liability method, which requires the recognition of deferred tax assets and liabilities for the expected future tax consequences of events that have been included in the financial statements. Under this method, deferred tax assets and liabilities are determined based on the differences between the financial statements and tax basis of assets and liabilities using enacted tax rates in effect for the year in which the differences are expected to reverse. The effect of a change in tax rates on deferred tax assets and liabilities is recognized in income in the period that includes the enactment date. |
Net deferred tax assets are recorded to the extent the Company believes these assets will more likely than not be realized. In making such a determination, all available positive and negative evidence is considered, including future reversals of existing taxable temporary differences, projected future taxable income, tax-planning strategies, and results of recent operations. In the event the Company were to determine that it would be able to realize its deferred income tax assets in the future in excess of their net recorded amount, an adjustment would be made to the deferred tax asset valuation allowance, which would reduce the provision for income taxes in the period such determination is made.
Uncertain tax positions are recorded in accordance with ASC 740, Income Taxes, on the basis of a two-step process whereby (1) the Company first determines whether it is more likely than not that the tax positions will be sustained based on the technical merits of the position and (2) for tax positions that meet the more-likely-than-not recognition threshold, the Company recognizes the largest amount of tax benefit that is greater than 50% likely to be realized upon ultimate settlement with the related tax authority.
| 10. | Use of estimates —The preparation of financial statements in conformity with accounting principles generally accepted in the United States requires management to make estimates and assumptions that affect the amounts of assets, liabilities, equity, revenues and expenses reported in the financial statements and accompanying notes. The most significant estimates relate to the depreciation of vessels and other property, amortization of drydocking costs, estimates used in assessing the recoverability of intangible and other long-lived assets, liabilities incurred relating to pension benefits, and income taxes. Actual results could differ from those estimates. |
| 11. | Issuance of shares or units by subsidiaries —The Company accounts for gains or losses from the issuance of shares or units by its subsidiaries as an adjustment to equity. |
| 12. | Segment information — Operating segments are defined as components of an enterprise that engage in business activities. The Company has determined that it operates its business as a single segment as its chief operating decision maker and its management team make decisions about resource allocations and review and measure the Company’s results as one line of business with similar regulatory requirements, customers and commodities transported. |
| 13. | Recently adopted accounting standards — In April 2015, the FASB issued ASU No. 2015-03, Simplifying the Presentation of Debt Issuance Costs (ASC 835), which amends the requirement to recognize debt issuance costs as deferred charges. The amendment requires that debt issuance costs related to a recognized debt liability be presented on the balance sheet as a direct deduction from the carrying cost of that debt liability, consistent with debt discounts. The amendments are effective for public companies for annual periods and interim periods within those annual periods beginning after December 15, 2015. The Company adopted this accounting standard on January 1, 2016 and has applied the guidance retrospectively. The impact of the retrospective adoption on the Company’s December 31, 2015 balance sheet are reductions of both other assets and long-term debt by $21,676. |
In August 2014, the FASB issued ASU No. 2014-15, Disclosure of Uncertainties about an Entity’s Ability to Continue as a Going Concern (ASC 205), which explicitly requires management to assess an entity’s ability to continue as a going concern and disclose going concern uncertainties in connection with each annual and interim period. The new standard requires management to assess if there is substantial doubt about an entity’s ability to continue to meet its obligations within one year after the reporting date based upon management’s consideration of relevant conditions that are known (and reasonably knowable) at the issuance date. The new standard defines substantial doubt and provides example indicators. Disclosures will be required if conditions give rise to substantial doubt. However, management will need to assess if its plans will alleviate substantial doubt to determine the specific disclosures. The new standard is effective for all entities in the first annual period ending after December 15, 2016. The adoption of this accounting standard did not have any impact on the Company’s consolidated financial statements.
| 67 | Overseas Shipholding Group, Inc. |
| 14. | Recently issued accounting standards — In November 2016, the FASB issued ASU No. 2016-18, Statement of Cash Flows (ASC 230): Restricted Cash, which requires that amounts generally described as restricted cash and restricted cash equivalents be included with cash and cash equivalents when reconciling the beginning-of-period and end-of-period total amounts shown on the statement of cash flows. The standard will be effective for annual periods beginning after December 31, 2017 and interim periods within that reporting period. Management does not expect the adoption of this accounting standard to have a material impact on the Company’s consolidated statements of cash flows. |
In October 2016, the FASB issued ASU No. 2016-16, Income Taxes (ASC 740): Intra-Entity Transfers of Assets Other Than Inventory, amending the accounting for income taxes. Under current guidance the recognition of current and deferred income taxes for an intra-entity asset transfer is prohibited until the asset has been sold to an outside party. The amended guidance eliminates the prohibition against immediate recognition of current and deferred income tax amounts associated with intra-entity transfers of assets other than inventory. This guidance is effective for interim and annual periods beginning after December 15, 2017 with early adoption permitted as of the beginning of an annual reporting period for which financial statements (interim or annual) have not been issued or made available for issuance. The requirements of the amended guidance should be applied on a modified retrospective basis through a cumulative-effect adjustment directly to retained earnings as of the beginning of the period of adoption. Management does not expect the adoption of this accounting standard to have a material impact on the Company’s consolidated financial statements.
In August 2016, the FASB issued ASU 2016-15, Classification of Certain Cash Receipts and Cash Payments (ASC 230), which amends the guidance in ASC 230 on the classification of certain cash receipts and payments in the statement of cash flows. The primary purpose of the ASU is to reduce the diversity in practice that has resulted from the lack of consistent principles on this topic with respect to (1) debt prepayment or debt extinguishment costs; (2) settlement of zero-coupon debt; (3) contingent consideration payments made after a business combination; (4) proceeds from the settlement of insurance claims; (5) proceeds from the settlement of corporate-owned life insurance policies; (6) distributions received from equity method investees; (7) beneficial interests in securitization transactions; and (8) separately identifiable cash flows and application of the predominance principle. The standard will be effective for interim and annual periods beginning after December 31, 2017 and early adoption is permitted. The guidance requires application using a retrospective transition method. Management is currently reviewing the impact of the adoption of this accounting standard on the Company’s consolidated financial statements.
In March 2016, the FASB issued ASU No. 2016-09, Improvements to Employee Share-Based Payment Accounting (ASC 718), which simplifies several aspects of the accounting for share-based payment transactions, including the income tax consequences, forfeitures, classification of awards as either equity or liabilities, and classification in the statement of cash flows. The standard will be effective for annual periods beginning after December 31, 2016 and interim periods within that reporting period. Management is currently reviewing the impact of the adoption of this accounting standard on the Company’s consolidated financial statements.
In February 2016, the FASB issued ASU No. 2016-02, Leases (ASC 842), which requires lessees to recognize most leases on the balance sheet. This is expected to increase both reported assets and liabilities. For public companies, the standard will be effective for the first interim reporting period within annual periods beginning after December 15, 2018, although early adoption is permitted. Lessees and lessors will be required to apply the new standard at the beginning of the earliest period presented in the financial statements in which they first apply the new guidance, using a modified retrospective transition method. The requirements of this standard include a significant increase in required disclosures. Management is analyzing the impact of the adoption of this guidance on the Company’s consolidated financial statements, including assessing changes that might be necessary to information technology systems, processes and internal controls to capture new data and address changes in financial reporting. Management expects that the Company will recognize substantial increases in reported amounts for property, plant and equipment and related lease liabilities upon adoption of the new standard. As of December 31, 2016, the contractual obligations for the Company’s leased vessels was approximately $345,027.
In May 2014, the FASB issued ASU No. 2014-09, Revenue from Contracts with Customers (ASC 606) to provide a single, comprehensive revenue recognition model for all contracts with customers to improve comparability within industries, across industries, and across capital markets. Subsequent to the May 2014 issuance, several clarifications and updates have been issued on this topic. The revenue standard contains principles that an entity will apply to determine the measurement and timing of when it is recognized. The underlying principle is that an entity will recognize revenue to depict the transfer of goods or services to customers at an amount that the entity expects to be entitled to in exchange for those goods or services. The FASB subsequently delayed the effective date of the revenue standard by one year. For public companies, the revenue standard is effective for the first interim period within annual reporting periods beginning after December 15, 2017. Reporting entities may choose to adopt the standard as of the original effective date. The requirements of this standard include an increase in required disclosures. Management has not yet selected a transition method and is currently analyzing the impact of the adoption of this guidance on the Company’s consolidated financial statements, including assessing changes that might be necessary to information technology systems, processes and internal controls to capture new data and address changes in financial reporting.
| 68 | Overseas Shipholding Group, Inc. |
NOTE 4 — EARNINGS PER COMMON SHARE:
As discussed in Note 2, “Chapter 11 Filing and Emergence from Bankruptcy,” all shares of our common stock prior to the Effective Date were cancelled pursuant to the Equity Plan. Post-emergence, the Company presents common share information for the Class A and Class B securities.
Basic earnings per common share is computed by dividing earnings, after the deduction of dividends and undistributed earnings allocated to participating securities, by the weighted average number of common shares outstanding during the period. As management deemed the exercise price for the Class A and B warrants of $0.01 per share to be nominal, warrant proceeds are ignored and the shares issuable upon Class A and B warrant exercise are included in the calculation of Class A and B basic weighted average common shares outstanding for all periods.
The computation of diluted earnings per share assumes the issuance of common stock for all potentially dilutive stock options and restricted stock units. Participating securities are defined by ASC 260, Earnings Per Share, as unvested share-based payment awards that contain non-forfeitable rights to dividends or dividend equivalents and are included in the computation of earnings per share pursuant to the two-class method.
On June 2, 2016 the Board approved the Reverse Split Amendment to the Company’s Amended and Restated Certificate of Incorporation. The Reverse Split Amendment effected the Reverse Split. The Reverse Split Amendment became effective on June 13, 2016. In accordance with ASC 260, Earnings Per Share, the Company adjusted the computations of basic and diluted earnings per share retroactively for all periods presented to reflect that change in its capital structure.
Accordingly, amounts previously reported for the years ended December 31, 2014 and 2015, and for the quarters ended March 31, 2015, June 30, 2015, September 30, 2015, and March 31, 2016 with respect to income/(loss) per share, outstanding Class A common shares, Class A restricted stock units, Class A restricted shares and Class A stock options, Class B shares and Class B warrants have been restated, where appropriate. The table below shows the effect of the Reverse Split on the calculation of per share amounts previously reported.
| 69 | Overseas Shipholding Group, Inc. |
| Year Ended | Three Months Ending | Year Ended | Three Months Ending | |||||||||||||||||||||||||
| (Thousands of shares) | December 31, 2014 | March 31, 2015 | June 30, 2015 | September 30, 2015 | December 31,
2014 | December 31, 2015 | March 31, 2016 | |||||||||||||||||||||
| (unaudited) | (unaudited) | |||||||||||||||||||||||||||
| Decrease in weighted average number of shares outstanding used to calculate basic net income/(loss) per share amounts for Class A | (195,069 | ) | (477,862 | ) | (477,881 | ) | (477,949 | ) | (477,996 | ) | (477,923 | ) | (473,688 | ) | ||||||||||||||
| Decrease in weighted average number of shares outstanding used to calculate diluted net income/(loss) per share amounts for Class A | (195,069 | ) | (477,862 | ) | (478,109 | ) | (477,996 | ) | (477,996 | ) | (478,145 | ) | (473,688 | ) | ||||||||||||||
| Decrease in weighted average number of shares outstanding used to calculate basic and diluted net income/(loss) per share amounts for Class B | (2,696 | ) | (6,604 | ) | (6,602 | ) | (6,600 | ) | (6,600 | ) | (6,602 | ) | (6,600 | ) | ||||||||||||||
Class A
There were 54,993, 52,730, and 21,073 weighted average shares of unvested Class A restricted common stock shares considered to be participating securities as of December 2016, 2015 and 2014, respectively. Such participating securities were allocated a portion of income under the two-class method for the year ended December 31, 2015, but no allocation of loss was made for the years ended December 31, 2016 and 2014 since the holders of the participating securities do not participate in losses.
The computation of diluted earnings per share assumes the issuance of common stock for all potentially dilutive stock options and restricted stock units not classified as participating securities. As of December 31, 2016, there were 485,223 shares of Class A restricted stock units and 1,114,103 Class A stock options outstanding and considered to be potentially dilutive securities. As of December 31, 2015 there were 268,066 shares of Class A restricted stock units and 268,538 Class A stock options outstanding and considered to be potentially dilutive securities. As of December 31, 2014 there were 34,907 shares of Class A restricted stock units and 86,228 Class A stock options outstanding and considered to be potentially dilutive securities.
Class B
There are no participating securities or potentially dilutive securities relating to the Class B Common Stock. The Class B shares were all converted to Class A shares in May 2016.
| 70 | Overseas Shipholding Group, Inc. |
The components of the calculation of basic earnings per share and diluted earnings per share are as follows:
| For the year ended December 31, | 2016 | 2015 | 2014 | |||||||||
| Net income/(loss) from continuing operations | $ | (1,059 | ) | $ | 80,565 | $ | (143,206 | ) | ||||
| Net income/(loss) from discontinued operations | (292,555 | ) | 203,395 | (9,067 | ) | |||||||
| Net income/(loss) | (293,614 | ) | 283,960 | (152,273 | ) | |||||||
| Weighted average common shares outstanding: | ||||||||||||
| Class A Common stock - basic | 90,949,577 | 95,584,559 | 39,013,720 | |||||||||
| Class A Common stock - diluted | 90,949,577 | 95,629,090 | 39,013,720 | |||||||||
| Class B Common stock - basic | 533,758 | 1,320,337 | 18,675,839 | |||||||||
| Class B Common stock - diluted | 533,758 | 1,320,337 | 18,675,839 | |||||||||
Reconciliations of the numerator of the basic and diluted earnings per share computations are as follows:
| 2016 | 2015 | 2014 | ||||||||||
| Net income/(loss) from continuing operations allocated to: | ||||||||||||
| Class A Common Stockholders | $ | (1,002 | ) | $ | 79,424 | $ | (96,846 | ) | ||||
| Class B Common Stockholders (2) | (57 | ) | 1,097 | (46,360 | ) | |||||||
| Participating securities | - | 44 | - | |||||||||
| $ | (1,059 | ) | $ | 80,565 | $ | (143,206 | ) | |||||
| Net income/(loss) from discontinued operations allocated to: | ||||||||||||
| Class A Common Stockholders | $ | (295,001 | ) | $ | 200,515 | $ | (6,132 | ) | ||||
| Class B Common Stockholders (2) | 2,426 | 2,770 | (2,935 | ) | ||||||||
| Participating securities (1) | 20 | 110 | - | |||||||||
| $ | (292,555 | ) | $ | 203,395 | $ | (9,067 | ) | |||||
| (1) | The 2016 income/(loss) from discontinued operations allocated to participating securities represents amounts equivalent to the cash dividends declared. |
| (2) | The 2016 income/(loss) allocated to Class B Common stockholders includes amounts equivalent to the special cash dividends declared on the Class B common stock shares. |
For annual earnings per share calculations, there were 44,531 dilutive equity awards outstanding for the year ended December 31, 2015. Awards of 1,074,548, 221,218 and 31,196 shares of common stock for 2016, 2015 and 2014, respectively, were not included in the computation of diluted earnings per share because inclusion of these awards would be anti-dilutive.
NOTE 5 — DISCONTINUED OPERATIONS:
As discussed in Note 1, on November 30, 2016 the Company completed the separation of its business into two independent publicly-traded companies through the spin-off of INSW. In connection with the spin-off, OSG and INSW entered into a number of agreements that provide a framework for governing the relationships between the parties going forward.
Separation and Distribution Agreement
OSG entered into a separation and distribution agreement (the “Separation and Distribution Agreement”) with INSW, which among other things, sets forth other agreements that govern the aspects of the relationship as follows.
Transfer of Assets and Assumption of Liabilities. The Separation and Distribution Agreement identified certain transfers of assets and assumptions of liabilities that were necessary in advance of the spin-off of INSW from OSG so that OSG and INSW retained the assets of, and the liabilities associated with, their respective businesses. The Separation and Distribution Agreement also provided for the settlement or extinguishment of certain liabilities and other obligations between OSG and INSW.
Legal Matters and Claims; Sharing of Certain Liabilities. Subject to any specified exceptions, each party to the Separation and Distribution Agreement has assumed the liability for, and control of, all pending and threatened legal matters related to its own business, as well as assumed or retained liabilities, and has indemnified the other party for any liability arising out of or resulting from such assumed legal matters.
| 71 | Overseas Shipholding Group, Inc. |
Other Matters. In addition to those matters discussed above, the Separation and Distribution Agreement, among other things, (i) governs the transfer of assets and liabilities generally, (ii) terminates all intercompany arrangements between OSG and INSW except for specified agreements and arrangements that follow the Distribution, (iii) contains further assurances, terms and conditions that require OSG and INSW to use commercially reasonable efforts to consummate the transactions contemplated by the Separation and Distribution Agreement and the ancillary agreements, (iv) releases certain claims between the parties and their affiliates, successors and assigns, (v) contains mutual indemnification clauses and (vi) allocates expenses of the spin-off between the parties.
Transition Services Agreement
OSG and INSW entered into a transition services agreement (the “TSA” or “Transition Services Agreement”) pursuant to which both parties agreed to provide each other with specified services for a limited time to help ensure an orderly transition following the Distribution. The Transition Services Agreement specifies the calculation of the costs for these services. Pursuant to the terms of the agreement, OSG will provide certain administrative services, including administrative support services related to benefit plans, human resources and legal services, for a transitional period after the spin-off. Similarly, INSW has agreed to provide certain limited transition services to OSG, including services relating to accounting activities and information and data provision services. The Transition Services Agreement will terminate 30 days after the expiration or termination of all of the services provided thereunder, which are generally provided for a maximum period of three to six months.
Employee Matters Agreement
OSG and INSW entered into an employee matters agreement (the “Employee Matters Agreement”), which addresses the allocation and treatment of assets and liabilities relating to employees and compensation and benefit plans and programs in which INSW employees participated, including equity incentive plans. The Employee Matters Agreement also governs the transfer of employees between OSG and INSW in connection with the Distribution, and set forth certain obligations for reimbursements and indemnities between OSG and INSW.
Results of Discontinued Operations
The carrying amounts of the major classes of assets and liabilities of discontinued operations as of December 31, 2015 consisted of the following:
| As of December 31, | 2015 | |||
| ASSETS | ||||
| Current Assets: | ||||
| Cash and cash equivalents | $ | 308,858 | ||
| Voyage receivables | 74,951 | |||
| Inventories, prepaids and other current assets | 12,889 | |||
| Total Current Assets | 396,698 | |||
| Restricted cash | 8,989 | |||
| Vessels and other property, less accumulated depreciation | 1,240,411 | |||
| Deferred drydock expenditures, net | 37,075 | |||
| Total Vessels, Deferred Drydock and Other Property | 1,277,486 | |||
| Investments in and advances to affiliated companies | 344,891 | |||
| Other assets | 1,848 | |||
| Total Assets | $ | 2,029,912 | ||
| LIABILITIES | ||||
| Current Liabilities: | ||||
| Accounts payable, accrued expenses and other current liabilities | $ | 30,746 | ||
| Current installments of long-term debt | 6,284 | |||
| Total Current Liabilities | 37,030 | |||
| Long-term debt | 588,938 | |||
| Other liabilities | 8,809 | |||
| Total Liabilities | $ | 634,777 | ||
| 72 | Overseas Shipholding Group, Inc. |
As a result of the spin-off transaction, the Company distributed $895,650 in net assets of INSW, which has been reflected as a reduction to paid-in additional capital and accumulated other comprehensive loss in the accompanying consolidated balance sheet as of December 31, 2016 and statement of changes in equity/(deficit) for the year ended December 31, 2016.
The table below presents statements of operations data for INSW, which has been classified as discontinued operations for the eleven months ended November 30, 2016 and the years ended December 31, 2015 and 2014.
| For the year ended December 31, | 2016 | 2015 | 2014 | |||||||||
| Shipping revenues: | ||||||||||||
| Pool revenues | $ | 226,329 | $ | 360,218 | $ | 180,813 | ||||||
| Time and bareboat charter revenues | 88,786 | 52,092 | 44,846 | |||||||||
| Voyage charter revenues | 50,005 | 85,324 | 291,359 | |||||||||
| 365,120 | 497,634 | 517,018 | ||||||||||
| Operating expenses: | ||||||||||||
| Voyage expenses | 11,219 | 21,844 | 170,031 | |||||||||
| Vessel expenses | 129,914 | 143,925 | 133,772 | |||||||||
| Charter hire expenses | 32,790 | 36,802 | 60,955 | |||||||||
| Depreciation and amortization | 73,039 | 80,962 | 84,212 | |||||||||
| General and administrative | 17,900 | 17,628 | 31,293 | |||||||||
| Technical management transition costs | - | 39 | 3,396 | |||||||||
| Spin-off related costs | 16,763 | - | - | |||||||||
| Severance costs | 243 | - | 14,859 | |||||||||
| Loss/(gain) on disposal of vessels and other property, including impairments | 382,163 | (4,459 | ) | (9,957 | ) | |||||||
| Total Operating Expenses | 664,031 | 296,741 | 488,561 | |||||||||
| (Loss)/Income from Vessel Operations | (298,911 | ) | 200,893 | 28,457 | ||||||||
| Equity in Income of Affiliated Companies | 44,067 | 45,546 | 37,872 | |||||||||
| Operating (Loss)/Income | (254,844 | ) | 246,439 | 66,329 | ||||||||
| Other (Expense)\Income | (968 | ) | 66 | (45 | ) | |||||||
| (Loss)/Income before Interest Expense, Reorganization Items and Taxes | (255,812 | ) | 246,505 | 66,284 | ||||||||
| Interest expense | 36,430 | 42,970 | 56,258 | |||||||||
| (Loss)/Income before Reorganization Items and Income Taxes | (292,242 | ) | 203,535 | 10,026 | ||||||||
| Reorganization Items, net | - | - | 18,349 | |||||||||
| (Loss)/Income before Income Taxes | (292,242 | ) | 203,535 | (8,323 | ) | |||||||
| Income Tax Provision | 313 | 140 | 744 | |||||||||
| Net (Loss)/Income | $ | (292,555 | ) | $ | 203,395 | $ | (9,067 | ) | ||||
Corporate administrative expenses, reorganization costs, employee compensation and benefits related costs, severance costs and depreciation for certain administrative fixed assets were allocated to INSW through November 30, 2016, in accordance with the "Shared Services and Cost Sharing Agreement" and the "Cost Sharing Agreement" by and among, OSG, INSW and OBS. However, in accordance with the accounting standards for discontinued operations, only costs directly attributable to INSW are to be reported in the results from discontinued operations. As such, the allocated costs in the table below will differ from the costs allocated to INSW (and reported or to be reported by INSW) in accordance with the aforementioned cost sharing agreements as discussed further in Note 13, “Related Parties.” Total indirect costs allocated to INSW that are included in continuing operations in the consolidated statement of operations are $15,380, $29,969, and $109,517 for the eleven months ended November 30, 2016 and the years ended December 31, 2015 and 2014, respectively. Such amounts include reorganization items, net of $131, $5,659, and $86,179 for the eleven months ended November 30, 2016 and the years ended December 31, 2015 and 2014, respectively.
Also, in accordance with the discontinued operations accounting standards, approximately $12,264 of one-time separation costs incurred by OSG and that are directly attributable to the spin-off transaction have been classified in the loss from discontinued operations and are included in the table below.
Vessel and Investment in Joint Venture Impairments – Held for Sale Basis (Disposal Group)
ASC 845 requires that the accounting for the distribution of nonmonetary assets to owners of an entity in a spinoff be based on the recorded amount (after reduction, if appropriate, for an indicated impairment of value). Based on ASC 505, the nonmonetary distribution of the assets of INSW constitute the disposal of a business. Accordingly, OSG's distribution of the shares of INSW to its shareholders on November 30, 2016 was recorded based on the carrying value of the INSW disposal group, after reduction for net impairment charges recognized for the excess of the carrying value of the INSW disposal group over its fair value, calculated on a held for sale basis.
| 73 | Overseas Shipholding Group, Inc. |
The determination of fair value is highly judgmental. In estimating the fair value of INSW’s vessels as of November 30, 2016 the Company considered the market and income approaches by using a combination of third party appraisals and discounted cash flow models prepared by the Company. In preparing the discounted cash flow models, the Company used a methodology consistent with the methodology and assumptions detailed in the “Vessel Impairment – Held for Use Basis” section below, and discounted the cash flows using its current estimate of INSW’s weighted average cost of capital, of 9%.
The INSW disposal group includes an approximate 50% interest in two joint ventures. One joint venture operates four LNG Carriers. The other joint venture converted two ULCCs to Floating Storage and Offloading Service (“FSO”) vessels. In estimating the fair value of INSW’s investments in and advances to these joint ventures as of November 30, 2016, the Company utilized an income approach since there is a lack of comparable market transactions for the specially built assets held by the joint ventures, by preparing discounted cash flow models. In preparing the discounted cash flows models the Company used a methodology largely consistent with the methodology and assumptions detailed in the “Vessel Impairment – Held for Use Basis” section below, with the exception being that as the assets owned by the joint ventures serve under specific service contracts, the estimated charter rates for periods after the expiry of the existing contracts are based upon management’s internally forecasted rates. The cash flows were discounted using the current estimated weighted average cost of capital for each joint venture, which ranged from 8.7% to 9.5% and took into consideration country risk, entity size and uncertainty with respect to the cash flows for periods beyond the current charter expiries.
Accordingly, the Company recorded a charge in the fourth quarter of 2016, as part of income/(loss) from discontinued operations of $332,562 to reduce the carrying value of the disposal group to its estimated fair value, calculated on a held for sale basis.
Vessel Impairment – Held for Use Basis
For INSW’s International Flag fleet, the Company has been monitoring the industry wide decline in vessel valuations during 2016 and specifically from June 30, 2016 to September 30, 2016, as well as the decline in forecasted near term charter rates, and concluded that declines in vessel valuations of up to 20% during the quarter ended September 30, 2016 for 28 vessels in its International Flag fleet with carrying values in excess of their estimated market values, constituted an impairment trigger event for these vessels as of September 30, 2016. In developing estimates of undiscounted future cash flows for performing Step 1 of the impairment tests, the Company made assumptions about future performance, with significant assumptions being related to charter rates, ship operating expenses, utilization, drydocking requirements, residual value and the estimated remaining useful lives of the vessels. These assumptions are based on historical trends as well as future expectations. The estimated daily time charter equivalent rates used for unfixed days were based on a combination of (i) internally forecasted rates that are consistent with forecasts provided to the Company’s senior management and Board of Directors, and (ii) the trailing 12-year historical average rates, based on quarterly average rates published by a third party maritime research service. The internally forecasted rates were based on management’s evaluation of current economic data and trends in the shipping and oil and gas industries. In estimating the fair value of the vessels for the purposes of step 2 of the impairment tests, the Company developed fair value estimates that utilized a market approach which considered an average of two vessel appraisals. Based on the tests performed, impairment charges totaling $49,640 were recorded on two LR1s, an Aframax and a Panamax to write-down their carrying values to their estimated fair values at September 30, 2016. The aggregate fair value of the four impaired vessels totaling $68,875 was determined using the market approach, which considers the expected sales prices of the vessels obtained from third-party appraisals.
The remaining 24 vessels tested had estimated undiscounted future cash flows in excess of their carrying values.
Because the determination of the fair value of the disposal group was based in part on an income approach, which utilized cash flow projections consistent with the most recent projections of the Company, such fair value estimate is considered to be Level 3 in the fair value hierarchy (See Note 10, “Fair Value of Financial Instruments, Derivatives and Fair Value Disclosures” for fair value hierarchy definitions).
As discussed above, assets of the discontinued operations include investments in two joint ventures accounted for using the equity method. A condensed summary of the combined assets and liabilities of the equity method investments and the results of operations of the equity method investments follows:
| November 30, 2016 | December 31, 2015 | |||||||
| Current assets | $ | 114,300 | $ | 84,129 | ||||
| Vessels, net | 1,389,684 | 1,448,489 | ||||||
| Other assets | 75,544 | 74,914 | ||||||
| Total assets | $ | 1,579,528 | $ | 1,607,532 | ||||
| Current liabilities | $ | 148,567 | $ | 109,789 | ||||
| Long-term debt and other non-current liabilities | 1,067,038 | 1,237,789 | ||||||
| Equity | 363,923 | 259,954 | ||||||
| Total liabilities and equity | $ | 1,579,528 | $ | 1,607,532 | ||||
| Eleven
Months Ending November 30, 2016 | Year
Ended December 31, 2015 | Year
Ended December 31, 2014 | ||||||||||
| Shipping revenues | $ | 225,852 | $ | 245,444 | $ | 241,303 | ||||||
| Ship operating expenses | (100,761 | ) | (112,029 | ) | (116,612 | ) | ||||||
| Income from vessel operations | 125,091 | 133,415 | 124,691 | |||||||||
| Other (expense)/income | (1,217 | ) | 634 | (1,735 | ) | |||||||
| Interest expense | (39,472 | ) | (47,106 | ) | (51,024 | ) | ||||||
| Net income | $ | 84,402 | $ | 86,943 | $ | 71,932 | ||||||
| 74 | Overseas Shipholding Group, Inc. |
NOTE 6 — VESSELS, DEFERRED DRYDOCK AND OTHER PROPERTY:
Vessels and other property consist of the following:
| As of December 31, | 2016 | 2015 | ||||||
| Vessels, at cost | $ | 892,022 | $ | 1,156,117 | ||||
| Accumulated depreciation | (208,318 | ) | (313,392 | ) | ||||
| Vessels, net | 683,704 | 842,725 | ||||||
| Other property, at cost | 5,619 | 14,600 | ||||||
| Accumulated depreciation and amortization | (4,855 | ) | (12,878 | ) | ||||
| Other property, net | 764 | 1,722 | ||||||
| Total Vessels and other property | $ | 684,468 | $ | 844,447 | ||||
As of December 31, 2016, the Company’s owned vessel fleet with a weighted average age of 9.4 years, consisted of four Handysize Product Carriers, two lightering ATBs and eight clean ATBs. Three Handysize Product Carriers and eight clean ATBs are pledged as collateral under the Exit Financing Facilities. Vessels pledged as collateral under the Exit Financing Facilities have an aggregate carrying value of $344,450.
Vessel activity, excluding construction in progress, for the three years ended December 31, 2016 is summarized as follows:
| Accumulated | Net Book | |||||||||||
| Vessel Cost | Depreciation | Value | ||||||||||
| Balance at December 31, 2013 | $ | 1,142,451 | $ | (214,619 | ) | $ | 927,832 | |||||
| Vessel additions | 13,613 | - | ||||||||||
| Depreciation | - | (47,409 | ) | |||||||||
| Balance at December 31, 2014 | 1,156,064 | (262,028 | ) | 894,036 | ||||||||
| Vessel additions | 53 | - | ||||||||||
| Depreciation | - | (51,364 | ) | |||||||||
| Balance at December 31, 2015 | 1,156,117 | (313,392 | ) | 842,725 | ||||||||
| Impairment | (264,095 | ) | 163,563 | |||||||||
| Depreciation | - | (58,489 | ) | |||||||||
| Balance at December 31, 2016 | $ | 892,022 | $ | (208,318 | ) | $ | 683,704 | |||||
The total of vessel additions will differ from expenditures for vessels as shown in the consolidated statements of cash flows because of the timing of when payments were made.
Vessel Impairments
The Company considered changes in circumstances that appeared to be indicative of a continued weakening of the Jones Act crude oil transportation market during the quarter ended September 30, 2016. Such indicators included a decline in the number of Jones Act tank vessels transporting crude oil, which led to (i) increased competition for clean cargoes and the idling of some Jones Act vessels; (ii) a sharp decrease in estimated spot rates for Jones Act Product Carriers and large ATBs between July and September 2016; and (iii) a significant decline in forecasted near term TCE rates reported by a leading third party industry analyst. These factors were viewed as an impairment trigger event for the Company’s eight rebuilt ATBs at September 30, 2016. In addition, given the uncertainty around how long the weak market conditions discussed above could last taking into consideration the large number of newbuildings scheduled for delivery, management believes it is more likely than not that some of the rebuilt ATBs will be laid-up, scrapped or disposed of before the end of their estimated useful lives, which currently range between 2019 and 2020. The indicators discussed above were not considered to be impairment triggering events for the other ATBs and tankers in the Company’s fleet as these vessels (i) were fairly recently built and do not face the same commercial obsolescence issues faced by the rebuilt ATBs, and (ii) are currently operating under long-term charters or contracts of affreightment.
| 75 | Overseas Shipholding Group, Inc. |
In developing estimates of undiscounted future cash flows for performing Step 1 of the impairment tests, management made assumptions about future performance, with significant assumptions being related to charter rates, ship operating expenses, utilization, drydocking requirements, residual value and the estimated remaining useful lives of the vessels. The assumptions about the estimated remaining useful lives of the ATBs reflects management’s current belief that the Company would scrap these ATBs at the expiry of their current time charters. Based on tests performed, the sum of the undiscounted cash flows for seven of the eight rebuilt ATBs were less than their September 30, 2016 carrying values. Accordingly, the Company recorded an impairment charge of $97,782 (including $3,873 recorded as a reduction in deferred drydock costs) to write down the carrying values of the seven ATBs to their estimated fair values as of September 30, 2016, using estimates of discounted future cash flows for each of the vessels (income approach) since the secondhand sale and purchase market for the type of vessels owned by OSG is not considered to be robust.
During the fourth quarter of 2016, the Company gave consideration as to whether events or changes in circumstances had occurred since September 30, 2016 that could indicate that the carrying amounts of the vessels in the Company’s fleet may not be recoverable. The Company concluded that the decline in previously forecasted cash flows on one of the seven ATBs discussed above, due to a change in its expected deployment, constituted an impairment trigger event as of December 31, 2016. Based on the tests performed, an additional impairment charge of $6,623 was recorded in December 2016.
During the third quarter of 2015, in evaluating whether or not certain events or circumstances existing at that time resulted in a triggering event for impairment testing of the fleet, management gave consideration to various indicators of a weakening of the Jones Act crude oil transportation market that began to materialize during the period. Such indicators included a decline in U.S crude oil production beginning in May 2015 following a decrease in oil prices beginning in late 2014, which quickly led to steep cuts in drilling activity. The resulting decrease in demand for the coastwise transportation of crude oil led to a decline in average daily spot rates for Jones Act tankers during the nine-month period ending September 30, 2015 and the redeployment of several Jones Act vessels, including some of the Company’s vessels, from the crude oil transportation trade to the clean oil transportation trade. In addition, the decline in U.S. crude oil production coupled with the large orderbook for Jones Act vessels scheduled for delivery through late 2017 increased uncertainty around the likelihood of being able to renew or extend the time charters on the Company’s fleet of eight rebuilt Jones Act ATBs, which are currently scheduled to expire between the second quarters of 2016 and 2017. Management believed that if the weakness identified in the market continued for a prolonged period of time, it would become increasingly difficult for the Company’s older ATBs to find employment at attractive rates that justify the expenditure required to put these vessels through their next drydock special surveys.
Management concluded that the above indicators constituted impairment triggering events for six of the eight vessels in the Company’s fleet of rebuilt ATBs at September 30, 2015. In addition, given the uncertainty around how long the weak market conditions discussed above could last, management determined that it was more likely than not that the rebuilt ATBs will be scrapped before the end of their estimated useful lives, which ranged from 2021 to 2028. The indicators discussed above were not considered to be impairment triggering events for the other ATBs employed in lightering and shuttle tankers in the Company’s fleet.
Management prepared undiscounted cash flows models, which utilized weighted probabilities assigned to possible outcomes for the six rebuilt ATBs. In developing estimates of future cash flows, management made assumptions about future performance, with significant assumptions being related to charter rates, ship operating expenses, utilization, drydocking requirements, residual value and the estimated remaining useful lives of the vessels. These assumptions were based on historical trends as well as future expectations, with a significant probability assigned to the possibility that the estimated remaining useful life of each ATB would end at its next drydock special survey date, as management believes it is more likely than not that the Company would scrap these vessels rather than make the significant capital expenditure necessary to comply with regulatory requirements. The estimated daily time charter equivalent rates used for days beyond the expiry of the current time charters were based on internally forecasted rates that are consistent with forecasts provided to the Company’s senior management and Board of Directors, which took into consideration average annual rates published by a third party maritime research service. The internally forecasted rates were based on management’s evaluation of current economic data and trends in the shipping and oil and gas industries. Recognizing that the transportation of crude oil and petroleum products is cyclical and subject to significant volatility based on factors beyond the Company’s control, management believes the use of estimates based on the combination of internally forecasted rates and rates projected by an independent third party maritime research service to be reasonable. Based on tests performed, the sum of the undiscounted cash flows for each of the six rebuilt ATBs were in excess of their September 30, 2015 carrying values and no impairment was therefore recorded at that date. As of December 31, 2015, management determined that there had been no significant changes in the facts and circumstances that existed at the end of September 30, 2015 that would warrant a change to the assumptions utilized in the undiscounted cash flows analysis on the six rebuilt ATBs prepared at that date. Accordingly, no further analysis was performed as of December 31, 2015.
The Company also considered the need to test its fleet for impairment as of December 31, 2014, but did not identify events or changes in circumstances that warranted impairment testing.
| 76 | Overseas Shipholding Group, Inc. |
Drydocking activity for the three years ended December 31, 2016 is summarized as follows:
| 2016 | 2015 | 2014 | ||||||||||
| Balance at January 1 | $ | 58,166 | $ | 33,087 | $ | 21,195 | ||||||
| Additions | 2,626 | 45,046 | 25,740 | |||||||||
| Sub-total | 60,792 | 78,133 | 46,935 | |||||||||
| Drydock amortization | (25,747 | ) | (19,967 | ) | (13,848 | ) | ||||||
| Impairments | (3,873 | ) | - | - | ||||||||
| Balance at December 31 | $ | 31,172 | $ | 58,166 | $ | 33,087 | ||||||
NOTE 7 — EQUITY METHOD INVESTMENT:
Investment in affiliated company is comprised of the Company’s 37.5% interest in Alaska Tanker Company, LLC, which manages vessels carrying Alaskan crude for BP. In the first quarter of 1999, OSG, BP, and Keystone Shipping Company formed Alaska Tanker Company, LLC (“ATC”) to manage the vessels carrying Alaskan crude oil for BP. ATC provides marine transportation services in the environmentally sensitive Alaskan crude oil trade. Each member in ATC is entitled to receive its respective share of any incentive charter hire payable by BP to ATC.
A condensed summary of the assets and liabilities of the equity method investment follows:
| As of December 31, | 2016 | 2015 | ||||||
| Current assets | $ | 37,680 | $ | 48,331 | ||||
| Total assets | $ | 37,680 | $ | 48,331 | ||||
| Current liabilities | $ | 29,335 | $ | 40,468 | ||||
| Non-current liabilities | 10,301 | 10,492 | ||||||
| Equity/(deficiency) | (1,956 | ) | (2,629 | ) | ||||
| Total liabilities and equity/(deficiency) | $ | 37,680 | $ | 48,331 | ||||
A condensed summary of the results of operations of the equity method investments follows:
| For the year ended December 31, | 2016 | 2015 | 2014 | |||||||||
| Shipping revenues | $ | 110,503 | $ | 126,331 | $ | 142,855 | ||||||
| Ship operating expenses | (100,752 | ) | (116,267 | ) | (133,833 | ) | ||||||
| Income from vessel operations | 9,751 | 10,064 | 9,022 | |||||||||
| Net income | $ | 9,751 | $ | 10,064 | $ | 9,022 | ||||||
| 77 | Overseas Shipholding Group, Inc. |
NOTE 8 — INTANGIBLE ASSETS:
Intangible Assets
Intangible assets activity for three years ended December 31, 2016 is summarized as follows:
| Total | ||||
| Balance at January 1, 2014 | $ | 59,943 | ||
| Amortization | (5,126 | ) | ||
| Balance at December 31, 2014 | 54,817 | |||
| Amortization | (4,600 | ) | ||
| Balance at December 31, 2015 | 50,217 | |||
| Amortization | (4,600 | ) | ||
| Balance at December 31, 2016 | $ | 45,617 | ||
As discussed in Note 3, “Summary of Significant Accounting Policies,” the Company’s intangible assets at December 31, 2016 and 2015 consist of long-term customer relationships acquired as part of the 2006 purchase of Maritrans, Inc. The gross intangible assets were $92,000 at December 31, 2016 and 2015. Amortization of intangible assets for the five years subsequent to December 31, 2016 is expected to approximate $4,600 per year.
NOTE 9 — DEBT:
Debt consists of the following:
| As of December 31, | 2016 | 2015 | ||||||
| 8.125% notes due 2018, net of unamortized discount and deferred costs of $1,406 and $3,514 | $ | 80,213 | $ | 115,450 | ||||
| OBS term loan, due 2019, net of unamortized discount and deferred costs of $11,102 and $19,340 | 444,186 | 574,615 | ||||||
| 7.5% Election 2 notes due 2021, net of unamortized discount and deferred costs of $8 and $9 | 293 | 292 | ||||||
| 7.50% notes due 2024 | 390 | 684 | ||||||
| Total debt | 525,082 | 691,041 | ||||||
| Less current portion | - | 56,755 | ||||||
| Long-term portion | $ | 525,082 | $ | 634,286 | ||||
The weighted average interest rate for debt outstanding as of December 31, 2016 and December 31, 2015 was 5.75% and 5.79%, respectively.
Exit Financing Facilities
Capitalized terms used hereafter have the meaning given in this Annual Report on Form 10-K or in the respective transaction documents referred to below, including subsequent amendments thereto. As discussed in Note 2, “Chapter 11 Filing and Emergence from Bankruptcy,” on the Effective Date, to support the Equity Plan, OSG and certain of its subsidiaries entered into secured debt facilities including: (i) a secured asset-based revolving loan facility of $75,000, among the Parent Company, OBS, certain OBS subsidiaries, Wells Fargo Bank, National Association, as Administrative Agent, and the other lenders party thereto (the “OBS ABL Facility”), secured by a first lien on substantially all of the U.S. Flag assets of OBS and its subsidiaries and a second lien on certain other specified U.S. Flag assets; and (ii) a secured term loan of $603,000, among the Parent Company, OBS, certain OBS subsidiaries, Jefferies Finance LLC (“Jefferies”), as Administrative Agent, and other lenders party thereto (the “OBS Term Loan”), secured by a first lien on certain specified U.S. Flag assets of OBS and its subsidiaries and a second lien on substantially all of the other U.S. Flag assets of OBS and its subsidiaries and collectively with the OBS ABL Facility and the OBS Term Loan, the “Exit Financing Facilities”), among OSG, Jefferies, as Administrative Agent, and other lenders party thereto. On August 5, 2014, the available amount under the OBS Term Loan was drawn in full. As of December 31, 2016, no amounts had been drawn under the OBS revolving loan facility.
| 78 | Overseas Shipholding Group, Inc. |
The OBS Term Loan provides that OBS may request an increase of the term loan commitment by an amount which may not exceed the greater of (i) $75,000 and (ii) an additional amount, if, after giving effect to the increase of such additional amount on a Pro Forma Basis, OBS is in compliance with a stated ratio for the Test Period most recently ended for which financial statements have been delivered to the Administrative Agent, provided that, among other terms and conditions, (a) no Default shall have occurred and be continuing or would occur after giving effect to such commitment increase and (b) immediately after giving effect to such increase, OBS shall be in compliance with the Loan to Value Test. However, no individual Lender is obligated to increase the amount of their loan commitment thereunder.
The OBS ABL Facility provides that OBS may request an increase of the revolving term loan commitments by up to $25,000, provided that among other terms and conditions, (a) no Default shall have occurred and be continuing or would occur after giving effect to such commitment increase and (b) immediately before and after giving effect to such increase, Suppressed Availability may not be less than $10,000. However, no individual Lender is obligated to increase the amount of their loan commitment thereunder.
Interest on the Exit Financing Facilities is calculated, at the Company’s option, based upon (i) an alternate base rate (“ABR”) plus the applicable margin or (ii) Adjusted LIBOR plus the applicable margin. ABR is defined as the highest of (i) the Base Rate (the prime rate published in The Wall Street Journal), (ii) the Federal Funds Effective Rate plus 0.50%, (iii) the one-month Adjusted LIBOR Rate plus 1.00% and (iv) 2.00% per annum. The OBS ABL Facility applicable margin varies based upon undrawn availability under the commitment and is subject to certain pricing adjustments. The OBS ABL Facility provides for quarterly payment of commitment fees at a rate of 0.50% for each quarter during which the daily average Total Revolving Exposure is less than 50% of Total Revolving Commitments or 0.375% for each quarter during which the daily average the Total Resolving Exposure is greater than or equal to 50% of Total Revolving Commitments.
The applicable margins and floor interest rates for each Exit Financing Facility is as follows:
| Facility | OBS ABL Facility | OBS Term Loan | ||||||||||
| Rate | ABR | LIBOR | ABR | LIBOR | ||||||||
| Floor | None | None | 2.00 | % | 1.00 | % | ||||||
| Applicable Margin | 1.25% - 1.75% | 2.25% - 2.75% | 3.25 | % | 4.25 | % | ||||||
The OBS Term Loan amortizes in equal quarterly installments in aggregate annual amounts equal to 1% of the original principal amount of the loans, adjusted for mandatory pre-payments. The OBS Term Loan Facility stipulates if annual aggregate net cash proceeds of asset sales exceed $5,000, net cash proceeds from each such sale are required to be reinvested in fixed or capital assets within twelve months of such sale or be used to prepay the principal balance outstanding of the respective facility. The OBS Term Loan is subject to additional mandatory annual prepayments in an aggregate principal amount of up to 50% of Excess Cash Flow. Management determined that no prepayments will be required for the OBS Term Loan Facility for 2017 because voluntary prepayments were made in 2016 in excess of the amounts that would otherwise have been payable.
Drawdowns under the OBS ABL Facility are subject to certain limitations based upon the available Borrowing Base, as described therein. The Exit Financing Facilities also contain certain restrictions relating to new borrowings, and the movement of funds between OBS and OSG (as Parent Company), which is not a borrower under the Exit Financing Facilities, as set forth in the respective loan agreements. The Parent Company’s ability to receive cash dividends, loans or advances from OBS is restricted under the Exit Financing Facilities. The Available Amount for cash dividends, loans or advances to the Parent Company permitted under the OBS Term Loan was $0 as of December 31, 2016. As a result, all of the investments in affiliates and subsidiaries on the Parent Company’s (separate company) balance sheet as of December 31, 2016 were deemed to be restricted net assets.
The OBS ABL Facility matures on February 5, 2019. However, to the extent that any of the 8.125% notes due 2018 are outstanding on December 29, 2017, the maturity date of the OBS ABL Facility will be December 29, 2017.
During the year ended December 31, 2015, the Company paid fees aggregating $642 in connection with the amendments to the Exit Financing Facilities described above, that were capitalized as deferred finance charges. (See Note 3, “Summary of Significant Accounting Policies” for additional information relating to deferred financing charges).
| 79 | Overseas Shipholding Group, Inc. |
Unsecured Senior Notes
The Company has the following separate series of unsecured notes issued and outstanding as of December 31, 2016 and 2015.
8.125% Notes (the “8.125% Notes”) – These notes were issued on March 29, 2010 and consisted of $300,000 in face value, which were due on March 30, 2018. As of the Effective Date, the 8.125% Notes were reinstated and contractual interest through the last missed coupon date was paid. The 8.125% Notes (i) are the Company’s general, unsecured obligations and rank equally and ratably in right of payment with its existing and future unsecured senior indebtedness; (ii) may not be redeemed prior to their respective maturity dates; (iii) are subject to repurchase upon certain changes of ownership or control (as further described below); (iv) are subject to certain covenants and limitations, including that the Company may not, directly or indirectly, Incur, as such term (and all capitalized terms hereafter in this paragraph) is defined within the applicable indenture, assume or suffer to exist any Mortgage on or with respect to any property or assets, now owned or hereafter acquired, to secure any present or future Designated Debt without making effective provision for securing the notes in certain circumstances; and (v) restrict the Company’s ability to merge or consolidate with another person. Upon a “Change of Control Triggering Event,” which requires both a ‘‘Change of Control’’ and a ‘‘Rating Decline,” as such terms are defined within the 8.125% Notes indenture, we would be obligated to make an offer to purchase all outstanding 8.125% Notes at a redemption price of 101% of the principal amount thereof plus accrued and unpaid interest thereon to the date of purchase. Additionally, upon certain Events of Default, the Trustee or the Holders of not less than 25% in aggregate principal amount of the outstanding 8.125% Notes may declare the entire unpaid principal of and accrued interest on the 8.125% Notes to be due and payable immediately.
7.5% Notes (the “7.5% Notes”) – These notes were issued on March 7, 2003 and consisted of $146,000 in face value, which were due on February 15, 2024. Pursuant to the Equity Plan, on the Effective Date, the Company issued two series of 7.50% Notes due February 15, 2021, one series in an aggregate principal amount of $6,508 (the “Election 1 Notes”) and the other series in an aggregate principal amount of $138,708 (the “Election 2 Notes” and together with the Election 1 Notes, the “Election Notes”) to holders of the 7.50% Notes due 2024 (the “2024 Notes”) that elected to receive Election 1 Notes or Election 2 Notes, as the case may be. As discussed below, the outstanding Election 1 notes were repurchased and retired during the year ended December 31, 2015.
The Election 2 Notes have substantially the same terms as the 2024 Notes, other than the (i) the maturity date and (ii) definitions and provisions related to a holder’s right to require the Company to repurchase such holder’s Election 2 Notes upon the occurrence of certain changes in the ownership or control of OSG. Under the Third Supplemental indenture, such right is triggered only upon the occurrence of both, a Change of Control and a Rating Decline (each as defined in the Third Supplemental Indenture). The Election 2 Notes (i) accrue interest at the rate of 7.50% per annum from August 5, 2014, payable on February 15 and August 15 of each year, beginning on February 15, 2015, to holders of record on the immediately preceding February 1 and August 1; (ii) are the Company’s general, unsecured obligations and rank equally and ratably in right of payment with its existing and future unsecured senior indebtedness; (iii) may not be redeemed prior to their maturity dates; (iv) are subject to repurchase upon certain changes of ownership or control (the provisions of which, as noted above, are different between the two series of notes); (v) are subject to certain covenants and limitations, including that the Company may not, directly or indirectly, Incur as such term (and all capitalized terms hereafter in this paragraph) are defined within the applicable indenture, assume or suffer to exist any Mortgage on or with respect to any property or assets, now owned or hereafter acquired, to secure any present or future Designated Debt without making effective provision for securing the notes in certain circumstances; and (vi) restrict the Company’s ability to merge or consolidate with another person.
Debt Repurchases, Modifications and Extinguishments
During the year ended December 31, 2016, the Company made optional and mandatory prepayments on its OBS Term Loan of $110,295 and open market repurchases of $27,000. The aggregate net loss of $525 realized on these transactions during the year ended December 31, 2016 is included in other (expense)/income in the consolidated statements of operations. The net loss reflects a $3,940 write-off of unamortized original issue discount and deferred financing costs associated with the principal reductions, which were treated as partial extinguishments. Third party legal and consulting fees (aggregating approximately $77) incurred by the Company in relation to the open market repurchases are included in general and administrative expenses in the consolidated statements of operations for the year ended December 31, 2016.
In October 2015, the board of directors of the Company adopted and approved resolutions relating to a consent solicitation (the “Consent Solicitation”) and a tender offer (the “Tender Offer”), whereby the Company was authorized to repurchase certain amounts of the Company’s Unsecured Senior Notes. In addition, the Company also solicited consents from registered holders of the Unsecured Senior Notes to approve certain amendments to the applicable indenture governing such series of Unsecured Senior Notes. During the year ended December 31, 2016, the Company repurchased and retired an aggregate principal amount of $294 of its 7.5% notes due 2024 and $37,345 of its 8.125% notes due 2018. The aggregate loss of $2,463 realized on these transactions during the year ended December 31, 2016, is included in (expense)/other income in the consolidated statements of operations. The net loss reflects a $784 write-off of unamortized deferred finance costs associated with the repurchased debt.
| 80 | Overseas Shipholding Group, Inc. |
The following table summarizes the aggregate principal amount of the Company’s Unsecured Senior Notes that were repurchased and retired during the year ended December 31, 2015:
| Unsecured Senior Note Series | Face Amount Repurchased | |||||||||||
| Open market | Tender offers and consent solicitations | Total | ||||||||||
| 8.125% notes due 2018 | $ | 61,849 | $ | 119,187 | $ | 181,036 | ||||||
| 7.50% Election 1 notes due 2021 | 3,000 | 3,508 | 6,508 | |||||||||
| 7.50% Election 2 notes due 2021 | 36,143 | 102,262 | 138,405 | |||||||||
| 7.50% notes due 2024 | 100 | 2 | 102 | |||||||||
| $ | 101,092 | $ | 224,959 | $ | 326,051 | |||||||
The aggregate net loss of $26,516 realized on these transactions during the year ended December 31, 2015 is included in other (expense)/income in the accompanying consolidated statements of operations.
In conjunction with the above tender offers and consent solicitations, the Company incurred and paid consent fees totaling $10,326. Approximately $3,578 of such amount relates to Unsecured Senior Notes that were not repurchased. Such costs have been deferred and will be amortized over the remaining term of the applicable Unsecured Senior Note series. Third party legal and consulting fees (aggregating approximately $3,099) incurred by the Company in relation to these transactions are included in general and administrative expenses in the accompanying consolidated statements of operations for the year ended December 31, 2015.
The following table summarizes interest expense, including amortization of issuance and deferred financing costs, commitment, administrative and other fees, recognized during the three years ended December 31, 2016 with respect to the Company’s debt facilities:
| Debt facility | 2016 | 2015 | 2014 (3) | |||||||||
| 8.125% notes due 2018 | $ | 10,200 | $ | 22,779 | $ | 66,199 | ||||||
| OBS Facilities, due 2019 | 32,460 | 37,666 | 15,282 | |||||||||
| 7.50% notes due 2021-2024 | 121 | 9,890 | 29,661 | |||||||||
| Other contractual post-petition interest and rejected executory contracts (1) | - | - | 78,816 | |||||||||
| 8.75% Debentures due 2013 (2) | - | - | 10,540 | |||||||||
| Total Expense on Debt Facilities | $ | 42,781 | $ | 70,335 | $ | 200,498 | ||||||
| (1) | Represents contractual post-petition interest from the Petition Date through the effective date of the Equity Plan on allowed claims associated with our pre-reorganized OSG loan agreements (excluding reinstated Unsecured Senior Notes) and certain rejected executory contracts. Accordingly, interest for 2014 is not completely comparable to 2016 and 2015. |
| (2) | The Company repaid the principal outstanding for these Pre-reorganized OSG loan facilities on the Effective Date. |
| (3) | The amounts recognized during the year ended December 31, 2014 reflect interest expense (including default interest as applicable) and reorganization items relating to default interest and changes in estimates of allowed claims as applicable pursuant to the Equity Plan. |
As of December 31, 2016, the aggregate annual principal payments required to be made on debt are as follows:
| 2017 | $ | - | ||
| 2018 | 81,619 | |||
| 2019 | 455,288 | |||
| 2020 | - | |||
| 2021 | 301 | |||
| Thereafter | 390 | |||
| $ | 537,598 |
Interest paid, amounted to $37,875 in 2016, $72,344 in 2015 and $193,210 in 2014.
| 81 | Overseas Shipholding Group, Inc. |
NOTE 10 — FAIR VALUE OF FINANCIAL INSTRUMENTS, DERIVATIVES AND FAIR VALUE DISCLOSURES:
The following methods and assumptions were used to estimate the fair value of each class of financial instrument.
Cash and cash equivalents and restricted cash— The carrying amounts reported in the consolidated balance sheets for interest-bearing deposits approximate their fair value.
Debt— The fair values of the Company’s publicly traded and non-public debt are estimated based on quoted market prices.
Interest rate swaps and caps— The fair values of interest rate swaps and caps are the estimated amounts that the Company would receive or pay to terminate the swaps or caps at the reporting date, which include adjustments for the counterparty or the Company’s credit risk, as appropriate, after taking into consideration any underlying collateral securing the swap or cap agreements.
ASC 820, Fair Value Measurements and Disclosures, relating to fair value measurements, defines fair value and established a framework for measuring fair value. The ASC 820 fair value hierarchy distinguishes between market participant assumptions developed based on market data obtained from sources independent of the reporting entity and the reporting entity's own assumptions about market participant assumptions developed based on the best information available in the circumstances. ASC 820 defines fair value as the price that would be received to sell an asset or paid to transfer a liability in an orderly transaction between market participants at the measurement date, essentially an exit price. In addition, the fair value of assets and liabilities should include consideration of non-performance risk, which for the liabilities described below includes the Company's own credit risk.
The levels of the fair value hierarchy established by ASC 820 are as follows:
Level 1—Quoted prices in active markets for identical assets or liabilities
Level 2—Quoted prices for similar assets and liabilities in active markets or inputs that are observable
Level 3—Inputs that are unobservable (for example cash flow modeling inputs based on assumptions)
The estimated fair values of the Company’s financial instruments, other than derivatives that are not measured at fair value on a recurring basis, categorized based upon the fair value hierarchy, at December 31, 2016 and 2015, are as follows:
| Fair Value | Level 1 | Level 2 | ||||||||||
| December 31, 2016: | ||||||||||||
| Cash (1) | $ | 206,933 | $ | 206,933 | $ | - | ||||||
| 8.125% notes due 2018 | (84,935 | ) | - | (84,935 | ) | |||||||
| OBS Term loan due 2019 | (442,199 | ) | - | (442,199 | ) | |||||||
| 7.5% Election 2 notes due 2021 | (303 | ) | - | (303 | ) | |||||||
| 7.5% notes due 2024 | (392 | ) | - | (392 | ) | |||||||
| December 31, 2015: | ||||||||||||
| Cash (1) | $ | 204,561 | $ | 204,561 | $ | - | ||||||
| 8.125% notes due 2018 | (121,046 | ) | - | (121,046 | ) | |||||||
| OBS Term loan due 2019 | (571,682 | ) | - | (571,682 | ) | |||||||
| 7.5% Election 2 notes due 2021 | (328 | ) | - | (328 | ) | |||||||
| 7.5% notes due 2024 | (745 | ) | - | (745 | ) | |||||||
(1) Includes current and non-current restricted cash aggregating $15,844 and $10,583 at December 31, 2016 and 2015, respectively.
Derivatives
Interest Rate Risk
The Company manages its exposure to interest rate volatility risks by using interest rate caps and swap derivative instruments. As of December 31, 2016 and 2015, OBS was party to an interest rate cap agreement (“Interest Rate Cap”) with a start date of February 15, 2015 with a major financial institution covering a notional amount of $375,000 to limit the floating interest rate exposure associated with the OBS Term Loan. The interest rate cap was designated and qualified as a cash flow hedge. The agreement contains no leverage features. The Interest Rate Cap has a cap rate of 2.5% through February 5, 2017, at which time the cap rate increases to 3.0% through the termination date of February 5, 2018.
| 82 | Overseas Shipholding Group, Inc. |
Tabular disclosure of derivatives location
Derivatives are recorded in the balance sheet on a net basis by counterparty when a legal right of offset exists. The following tables present information with respect to the fair values of derivatives reflected in the December 31, 2016 and 2015 balance sheets on a gross basis by transaction:
Fair Values of Derivative Instruments:
| Asset Derivatives | Liability Derivatives | |||||||||||
| Balance Sheet Location | Amount | Balance Sheet Location | Amount | |||||||||
| December 31, 2016: | ||||||||||||
| Derivatives designated as hedging instruments: | ||||||||||||
| Interest rate caps: | ||||||||||||
| Long-term portion | Other assets | $ | 2 | Other liabilities | $ | - | ||||||
| Total derivatives designated as hedging instruments | $ | 2 | $ | - | ||||||||
| December 31, 2015: | ||||||||||||
| Derivatives designated as hedging instruments: | ||||||||||||
| Interest rate caps: | ||||||||||||
| Long-term portion | Other assets | $ | 99 | Other liabilities | $ | - | ||||||
| Non-current assets of discontinued operations | 3 | Non-current assets of discontinued operations | - | |||||||||
| Total derivatives designated as hedging instruments | $ | 102 | $ | - | ||||||||
The following tables present information with respect to gains and losses on derivative positions reflected in the consolidated statements of operations or in the consolidated statements of other comprehensive income/(loss).
The effect of cash flow hedging relationships recognized in other comprehensive income/(loss) excluding amounts reclassified from accumulated other comprehensive loss (effective portion), including hedges of equity method investees, for the years ended December 31, 2016, 2015 and 2014 follows:
| For the year ended December 31, | 2016 | 2015 | 2014 | |||||||||
| Interest rate cap of continuing operations | $ | (97 | ) | $ | (1,537 | ) | $ | (306 | ) | |||
| Interest rate cap of discontinued operations | (3 | ) | (472 | ) | (172 | ) | ||||||
| Interest rate swaps of discontinued operations | (5,794 | ) | (9,721 | ) | (21,487 | ) | ||||||
| Total | $ | (5,894 | ) | $ | (11,730 | ) | $ | (21,965 | ) | |||
The effect of cash flow hedging relationships on the consolidated statements of operations is presented excluding hedges of equity method investees. The effect of the Company’s cash flow hedging relationships on the consolidated statement of operations for the years ended 2016 and 2015 is shown below:
| 83 | Overseas Shipholding Group, Inc. |
| Statement of Operations | ||||||||||||
| Effective Portion of Gain/(Loss) | ||||||||||||
| Reclassified from | ||||||||||||
| Accumulated Other Comprehensive | ||||||||||||
| Loss | Ineffective Portion | |||||||||||
| Amount of | Amount of | |||||||||||
| Location | Gain/(Loss) | Location | Gain/(Loss) | |||||||||
| For the year ended December 31, 2016: | ||||||||||||
| Interest rate caps | Interest expense | $ | (339 | ) | Interest expense | $ | - | |||||
| Net (loss)/income from discontinued operations | (408 | ) | - | |||||||||
| Total | $ | (747 | ) | $ | - | |||||||
| For the year ended December 31, 2015: | ||||||||||||
| Interest rate caps | Interest expense | $ | (1 | ) | Interest expense | $ | - | |||||
| Net (loss)/income from discontinued operations | (2 | ) | - | |||||||||
| Total | $ | (3 | ) | $ | - | |||||||
See Note 15, “Accumulated Other Comprehensive Loss,” for disclosures relating to the impact of derivative instruments on accumulated other comprehensive loss.
Fair Value Hierarchy
The following table presents the fair values, which are pre-tax, for assets and liabilities measured on a recurring basis (excluding investments in affiliated companies):
| Fair Value | Level 1 | Level 2 | ||||||||||
| Assets/(Liabilities) at December 31, 2016: | ||||||||||||
| Derivative assets (interest rate cap) | $ | 2 | $ | - | $ | 2 | (1) | |||||
| Assets/(Liabilities) at December 31, 2015: | ||||||||||||
| Derivative assets (interest rate cap) | $ | 99 | $ | - | $ | 99 | (1) | |||||
| Non-current assets of discontinued operations (interest rate cap) | $ | 3 | $ | - | $ | 3 | (1) | |||||
| (1) | For interest rate caps, fair values are derived using valuation models that utilize the income valuation approach. These valuation models take into account contract terms such as maturity, as well as other inputs such as interest rate yield curves and creditworthiness of the counterparty and the Company. |
The following table summarizes the fair values of vessels for which an impairment charge was recognized for the year ended December 31, 2016:
| Description | Fair Value | Level 2 | Level 3 | Total Impairment Charges | ||||||||||||
| Impairment - Vessels held and used (1)(2) | $ | 76,397 | $ | - | $ | 76,397 | $ | (104,405 | ) | |||||||
| (1) | Aggregate pre-tax impairment charges of $97,782 related to seven ATBs and $6,623 related to one ATB were recorded during the three-month periods ended September 30, 2016 and December 31, 2016, respectively. |
| (2) | The fair value measurements of $70,884 at September 30, 2016 and $5,513 at December 31, 2016, used to determine the impairment for the ATBs held and used were based on the income approach, which utilized cash flow projections consistent with the most recent projections of the Company, and a discount rate equivalent to a market participant's weighted average cost of capital. Because the Company uses its own cash flow projections, the cash flow projections are considered to be Level 3. |
| 84 | Overseas Shipholding Group, Inc. |
NOTE 11 — ACCOUNTS PAYABLE, ACCRUED EXPENSES AND OTHER CURRENT LIABILITIES:
| At December 31, | 2016 | 2015 | ||||||
| Accounts payable | $ | 2,538 | $ | 2,588 | ||||
| Payroll and benefits | 24,683 | 21,226 | ||||||
| Interest | 5,456 | 7,516 | ||||||
| Due to owners on chartered in vessels | 989 | 609 | ||||||
| Accrued drydock and repair costs | 62 | 3,980 | ||||||
| Bunkers and lubricants | 1,317 | 199 | ||||||
| Charter revenues received in advance | 9,579 | 9,516 | ||||||
| Insurance | 702 | 705 | ||||||
| Accrued vessel expenses | 1,575 | 1,879 | ||||||
| Accrued general and administrative, primarily professional fees | 3,290 | 5,457 | ||||||
| Bankruptcy claims accrual | 5,000 | 5,000 | ||||||
| Other | 2,031 | 1,775 | ||||||
| $ | 57,222 | $ | 60,450 | |||||
NOTE 12 —TAXES:
As described in Note 5, INSW has been classified as discontinued operations and as a result the net deferred tax assets and income tax (provision)/benefit of INSW are not included in the below disclosures.
The benefit/(provision) for income taxes on the (loss)/income from continuing operations before income taxes consists of the following:
| For the year ended December 31, | 2016 | 2015 | 2014 | |||||||||
| Current | $ | (2,296 | ) | $ | 31,468 | $ | 33,120 | |||||
| Deferred | 67,394 | 69,564 | 82,432 | |||||||||
| $ | 65,098 | $ | 101,032 | $ | 115,552 | |||||||
The income tax benefits are primarily attributable to U.S. federal and state income taxes and include the impact of unrecognized tax benefits.
The significant components of the Company’s deferred tax liabilities and assets follow:
| As of December 31, | 2016 | 2015 | ||||||
| Deferred tax liabilities: | ||||||||
| Vessels and other property | $ | 227,846 | $ | 279,338 | ||||
| Unremitted earnings of foreign subsidiaries | - | 48,856 | ||||||
| Prepaid expenditures | 13,553 | 23,603 | ||||||
| Other—net | 885 | 1,422 | ||||||
| Total deferred tax liabilities | 242,284 | 353,219 | ||||||
| Deferred tax assets: | ||||||||
| Loss carryforwards | 88,370 | 147,227 | ||||||
| Employee compensation and benefit plans | 12,232 | 13,186 | ||||||
| Financing and professional fees | 977 | 1,777 | ||||||
| Accrued expenses and other | 5,873 | 8,719 | ||||||
| Total deferred tax assets | 107,452 | 170,909 | ||||||
| Valuation allowance | 6,625 | 25,885 | ||||||
| Net deferred tax assets | 100,827 | 145,024 | ||||||
| Net deferred tax liabilities | $ | 141,457 | $ | 208,195 | ||||
| 85 | Overseas Shipholding Group, Inc. |
As of December 31, 2016, the Company had U.S. federal net operating loss carryforwards of $308,289 which are available to reduce future taxes, if any. The federal net operating loss carryforwards begin to expire in 2034. Additionally, as of December 31, 2016 and December 31, 2015, the Company had U.S. state net operating loss carryforwards of $292,233 and $549,042, respectively. The reduction in net operating losses results primarily from the change in state filing requirements resulting from the spin-off transaction. These U.S. state net operating loss carryforwards expire in various years ending from December 31, 2017 through December 31, 2036. The amount of net operating loss carryforwards reflected in this paragraph are presented on a tax return basis and differ from the amounts in the deferred tax table above, which reflect the future tax benefit of the losses and are reflected net of unrecognized tax benefits.
In connection with the emergence from bankruptcy, under applicable tax regulations, the Company underwent an ownership change. As a result, there is an annual limitation on the use of pre-ownership change net operating losses, tax credits and certain other tax attributes to offset taxable income earned after the ownership change. The annual limitation is equal to the product of the applicable long-term tax exempt rate and the value of the company’s stock immediately before the ownership change. This annual limitation may be adjusted to reflect any unused annual limitation for prior years and certain recognized built-in gains and losses for the year. The Company does not believe that the limitations imposed will impact its ability to utilize any pre ownership change net operating losses before the carryforward period expires but could cause the timing of utilization to be impacted.
The Company assessed all available positive and negative evidence to determine whether sufficient future taxable income will be generated to permit use of existing deferred tax assets. For U.S. federal deferred tax assets, the Company concluded that sufficient positive evidence existed, primarily the result of reversing deferred tax liabilities during the carryover period. However, for certain state deferred tax assets, the negative evidence in the form of cumulative losses incurred over the preceding three-year period and lack of positive evidence of reversing deferred tax liabilities during the carryover period resulted in the Company establishing a valuation allowance of $6,625 and $25,885 as of December 31, 2016 and 2015, respectively, to recognize only the portion of the deferred tax asset that is more likely than not to be realized. The valuation allowance decreased by $19,260 during 2016 largely due to a change in state apportionment factors. The valuation allowance increased by $21,575 and $477 in 2015 and 2014, respectively, as a result of additional losses generated in each year.
During the years ended December 31, 2016, 2015 and 2014, the Company paid (net of refunds received) $833, $(53,799) and $266,867, respectively, of income taxes of which $270,465 related to the settlement with the IRS in 2014, as part of the confirmation of the Equity Plan, closing the 2004 through 2012 tax years. During the quarter ending December 31, 2015, the Company filed a refund claim with the IRS and received $54,884 related to the carryback of its 2014 net operating loss to 2012 and 2013.
Reconciliations of the effective income tax rate attributable to pretax results and the U.S. Federal statutory income tax rate follow:
| For the year ended December 31, | 2016 | 2015 | 2014 | |||||||||
| U.S. federal statutory income tax rate | 35.0 | % | 35.0 | % | 35.0 | % | ||||||
| Adjustments due to: | ||||||||||||
| State taxes, net of federal benefit | (1.5 | )% | (1.3 | )% | 0.6 | % | ||||||
| Interest on unrecognized tax benefits | 1.8 | % | (0.5 | )% | (3.5 | )% | ||||||
| Nondeductible reorganization costs | (9.0 | )% | (30.8 | )% | (8.8 | )% | ||||||
| Foreign income and repatriations taxed in the U.S. | - | % | - | % | (1.0 | )% | ||||||
| Unremitted earnings of foreign subsidiaries | 73.5 | % | (237.5 | )% | 21.5 | % | ||||||
| Deferred compensation | (1.7 | )% | - | % | (1.9 | )% | ||||||
| Tax examination settlement | - | % | - | % | 2.0 | % | ||||||
| Payments as guarantor | - | % | 726.0 | % | - | % | ||||||
| U.S. income subject to tonnage tax | 1.4 | % | 3.0 | % | 0.9 | % | ||||||
| Other | (1.1 | )% | (0.2 | )% | - | % | ||||||
| Effective tax rate | 98.4 | % | 493.7 | % | 44.8 | % | ||||||
| 86 | Overseas Shipholding Group, Inc. |
The following is a tabular reconciliation of the total amounts of unrecognized tax benefits (excluding interest and penalties):
| 2016 | 2015 | |||||||
| Balance of unrecognized tax benefits as of January 1, | $ | 36,535 | $ | 215,328 | ||||
| Increases for positions taken in prior years | 136 | 358 | ||||||
| Decreases for positions taken in prior years | - | (179,151 | ) | |||||
| Increases for positions related to the current year | - | - | ||||||
| Amounts of decreases related to settlements | - | - | ||||||
| Reductions due to lapse of statutes of limitations | - | - | ||||||
| Balance of unrecognized tax benefits as of December 31, | $ | 36,671 | $ | 36,535 | ||||
Included in the balances of unrecognized tax benefits as of December 31, 2016 and 2015 are $36,077 and $35,989, respectively, of tax benefits that, if recognized, would affect the effective tax rate.
The Company records interest and penalties on unrecognized tax benefits in its provision for income taxes. Accrued interest and penalties are included within the related liability for unrecognized tax benefit line in the consolidated balance sheet. Related to the unrecognized tax benefits noted above, the Company recorded additional interest of $58 during the year ended December 31, 2016, and as of December 31, 2016, recognized a liability for interest of $760. During the year ended December 31, 2015, the Company recorded additional interest of $168, primarily as a result of post-petition interest due to the IRS, and as of December 31, 2015, had recognized a liability for interest of $702.
In January 2015, the Company requested that the Internal Revenue Service (“IRS”) review under its Pre-Filing Agreement Program the deductibility of certain payments made by OSG in 2014, in the aggregate amount of $477,835, in its capacity as guarantor of the obligations of subsidiaries of INSW under certain loan agreements. In connection with these payments, the Company had established an unrecognized tax benefit equal to the full amount of such benefits, or $179,151 as of December 31, 2014. On September 4, 2015, the Company received an executed closing agreement from the IRS, which allowed a deduction of $424,523. As a result of the closing agreement, the Company reduced its reserve for uncertain tax positions by $179,151, recognized an income tax benefit of $150,073 and reduced its deferred tax asset for net operating loss carryforwards by $29,078 during the year ended December 31, 2015.
As a result of the aforementioned closing agreement, OSG’s investment in INSW for financial reporting purposes exceeded its tax basis. As of December 31, 2015, management did not believe that it could make an assertion that OSG’s investment in INSW was essentially permanent in duration. Accordingly, the Company recognized a deferred tax liability and tax provision of $48,856 for the year ended December 31, 2015 on the undistributed earnings of its foreign operations, aggregating approximately $138,881, arising principally from companies domiciled in the Marshall Islands. On November 30, 2016, the Company completed the spin-off of INSW and as a result the deferred tax liability of $48,856 was reversed. In addition, as the spin-off resulted in a non-deductible taxable loss on the Company’s investment in INSW, no current benefit was recorded.
After taking into consideration tax attributes, such as net operating loss carryforwards and interest, the Company’s unrecognized tax benefits represent a noncurrent reserve for uncertain tax positions of $3,129 and $2,520 as of December 31, 2016 and 2015, respectively.
The Company is currently undergoing an examination by the IRS of its 2012 through 2015 tax returns.
NOTE 13 — RELATED PARTIES:
Transition Services Agreement and Other Spin-off related activity
OSG expects to earn fees totaling $156 for services provided to INSW pursuant to the terms of the Transition Services Agreement, over the six-month term of the TSA. Approximately $31 of such fees were earned as of December 31, 2016. OSG also expects to incur fees totaling $79 during the term of the TSA for services received from INSW. Approximately $27 of such fees were incurred as of December 31, 2016.
The outstanding amounts related to the transactions between OSG and INSW were as follows:
| As of December 31, | 2016 | 2015 | ||||||
| Receivable from INSW | $ | 683 | $ | - | ||||
| 87 | Overseas Shipholding Group, Inc. |
Receivables due from INSW as of December 31, 2016 are primarily in relation to the Transition Services Agreement and amounts owed pursuant to the Separation and Distribution Agreement, as described in Note 5, “Discontinued Operations.”
In connection with the Distribution, payments were made to or received from INSW totaling $1,969 and $9,857, respectively, for the settlement of allocated one-time separation costs, the transfer of assets and liabilities between OSG and INSW and amounts due for costs allocated pursuant to the "Shared Services and Cost Sharing Agreement" and the "Cost Sharing Agreement" by and among, OSG, INSW and OBS, that was in effect during the eleven months ended November 30, 2016.
Guarantees
INSW has equity interests in an FSO joint venture (the “FSO Joint Venture”) and an LNG joint venture (the “LNG Joint Venture”). The FSO Joint Venture is party to a number of contracts to which OSG serves as guarantor: (a) the FSO Joint Venture is the borrower pursuant to a loan agreement, as amended and restated, with OSG and Euronav, each as guarantors, certain other parties thereto and ING Bank N.V. as agent and security trustee (the ‘‘Loan Agreement’’); (b) the FSO Joint Venture is an obligor pursuant to a guarantee facility agreement, by and among, the FSO Joint Venture, those banks and financial institutions listed therein, Nordea Bank Finland PLC, as issuing bank, Nordea Bank Norge ASA as agent and ING Bank N.V. as Security Trustee (the ‘‘Guarantee Facility’’); and (c) the FSO Joint Venture is party to two service contracts with Maersk Oil Qatar AS (the ‘‘MOQ Service Contracts’’).
In connection with the Distribution on November 30, 2016, appropriate consents were obtained and INSW now also guarantees the obligations of the FSO Joint Venture pursuant to the Loan Agreement and the Guarantee Facility (together, the ‘‘ING and Nordea Guarantees’’) and guarantees the obligations of the FSO Joint Venture pursuant to the MOQ Service Contracts (the ‘‘MOQ Guarantee,’’ together with the ING and Nordea Guarantees, the ‘‘INSW FSO Guarantees’’). OSG will continue to guarantee the obligations of the FSO Joint Venture pursuant to the Loan Agreement and the Guarantee Facility (together, the ‘‘OSG FSO Guarantees’’). As of December 31, 2016, the maximum potential amount of future principal payments (undiscounted) that OSG could be required to make relating to such equity method investees secured bank debt and interest rate swaps was $38,789 and the carrying amount of the liability related to this guarantee was $0.
INSW entered into guarantee arrangements in connection with the spin-off on November 30, 2016, in favor of Qatar Liquefied Gas Company Limited (2) (‘‘LNG Charterer’’) and relating to certain LNG Tanker Time Charter Party Agreements with the LNG Charterer and each of Overseas LNG H1 Corporation, Overseas LNG H2 Corporation, Overseas LNG S1 Corporation and Overseas LNG S2 Corporation (such agreements, the ‘‘LNG Charter Party Agreements,’’ and such guarantees, collectively, the ‘‘LNG Performance Guarantees’’). OSG will continue to provide a guarantee in favor of the LNG Charterer relating to the LNG Charter Party Agreements (such guarantees, the ‘‘OSG LNG Performance Guarantees’’ and collectively, with the OSG FSO Guarantees the ‘‘Continuing OSG Guarantees’’).
In connection with the Continuing OSG Guarantees, INSW will pay a fee of $125 per year to OSG, which is subject to escalation after 2017 and will be terminated if OSG ceases to provide the OSG LNG Performance Guarantees. INSW will indemnify OSG for liabilities arising from the Continuing OSG Guarantees pursuant to the terms of the Separation and Distribution Agreement.
NOTE 14 — CAPITAL STOCK AND STOCK COMPENSATION:
Change in Capital Structure
See Note 2, “Chapter 11 Filing and Emergence from Bankruptcy,” for information relating to the Equity Plan and Rights Offering. After its emergence from Bankruptcy, the Company had two classes of common stock whereby the holders of our common stock were entitled to one vote per share, and holders of the Class A common stock and Class B common stock were entitled to vote together as a class, on any matter to be voted upon by the stockholders, other than as described below.
Each Class A warrant represents the right to purchase one share of Class A common stock, subject in each case to the adjustments as provided pursuant to the terms thereof (see discussion relating to the reverse 1 for 6 split and the discussion under Dividends below). The Warrants may be exercised at a price per share of Class A common stock, as applicable, of $0.01, which shall be paid pursuant to a cashless exercise procedure. Warrants may be exercised at any time or from time to time on or before August 5, 2039, and will expire thereafter. Until they exercise their Warrants, except as otherwise provided in the Warrants, the holders of the Warrants will not have the rights or privileges of holders of the Company’s common stock, including any voting rights. Warrants may only be exercised by holders who establish to OSG's reasonable satisfaction that they or the person designated to receive the shares is a U.S. person or to the extent shares deliverable upon exercise would not constitute Non-Complying Shares (as defined in OSG's Amended and Restated Certificate of Incorporation). As of December 31, 2016, the Company had 90,576,371 Class A warrants outstanding, convertible into 17,209,510 shares of Class A common stock.
| 88 | Overseas Shipholding Group, Inc. |
Our Class B common stock carried an entitlement to distribution of a percentage of the proceeds from the malpractice lawsuit against Proskauer Rose LLP (“Proskauer”) and four of its partners, net of related out-of-pocket expenses incurred by us, including legal fees, all reasonable and documented costs and expenses incurred and all payments made or to be made by us in respect of certain counterclaims or pursuant to indemnification obligations, as determined by our Board of Directors (“the Board”) in good faith (such net amount, the “Net Litigation Recovery”). The aggregate amount of the Net Litigation Recovery that was distributed to holders of the Class B common stock as of the relevant record date (the “Aggregate Available Distribution”) was an amount equal to the product of the Net Litigation Recovery multiplied by 0.1. The holders of record of Class B common stock on the relevant record date were entitled to receive, in respect of each share of Class B common stock held by such holder, a pro rata portion of the Aggregate Available Distribution calculated as a fraction thereof, the numerator of which was one and the denominator of which was 7,926,805 (unadjusted for subsequent reverse stock split as this was a fixed calculation at a point in time).
On May 13, 2016, all holders of Class B common stock and Class B warrants as of May 9, 2016 received a distribution from the Company representing their pro-rata share of the Net Litigation Recovery. On May 27, 2016, pursuant to the Company’s Amended and Restated Certificate of Incorporation, and the warrant agreement governing the Class B warrants, each Class B common share and Class B warrant automatically converted to a Class A common share and Class A warrant, respectively.
On June 2, 2016, the Board authorized the Company to take action to transfer the listing of its Class A common stock to the New York Stock Exchange from the NYSE MKT (the “Transfer”). In conjunction with the Transfer, the Board approved the Reverse Split Amendment to the Company’s Amended and Restated Certificate of Incorporation. The Reverse Split Amendment effected a one (1) for six (6) reverse stock split and corresponding reduction of the number of authorized shares of Class A common stock and Class B common stock, par value $0.01 per share. On June 7, 2016, the Company filed the Reverse Split Amendment with the Secretary of State of the State of Delaware. The Reverse Split Amendment became effective on June 13, 2016. As previously reported, the Company’s stockholders approved the filing of the Reverse Split Amendment at the Company’s annual meeting of stockholders held on June 9, 2015. The Transfer was approved by the New York Stock Exchange on June 23, 2016. In order to account for the impact of the reverse stock split, holders of the Company’s outstanding Class A warrants will receive, upon exercise, 0.190 shares of Class A common stock per warrant exercised.
Unless otherwise noted, all of the share and per share information below has been recast to reflect the impact of the reverse stock split.
On November 30, 2016 the Company completed the separation of its business into two independent publicly-traded companies through the spin-off of INSW. On the Distribution Date, each holder of OSG common stock received 0.3333 shares of INSW’s common stock for every share of OSG common stock held on the Record Date. Each holder of OSG warrants received 0.3333 shares of INSW’s common stock for every one share of OSG common stock they would have received if they exercised their warrants immediately prior to the Distribution.
Ownership Restrictions
In order to preserve the status of OSG as a Jones Act company, the percentage of each class of its common stock that may be owned by non-U.S. citizens is limited. In addition, the Company has established policies and procedures to ensure compliance with the Jones Act. In order to provide a reasonable margin for compliance with the Jones Act, our board of directors has determined that until further action by our board of directors, at least 77% of the outstanding shares of each class of capital stock of the Company must be owned by U.S. Citizens. At and during such time that the limit is reached with respect to shares of Class A common stock as applicable, we will be unable to issue any further shares of such class of common stock or approve transfers of such class of common stock to non-U.S. Citizens until the holdings of non-U.S. Citizens falls below the maximum percentage allowable.
Dividends
On November 20, 2015, the Company’s Board approved a stock dividend of Class A common stock, whereby on December 17, 2015, all shareholders of record of the Company’s Class A and B common stock as of December 3, 2015 (the “record date”), received a dividend of one-tenth of one share of Class A common stock for each share of Class A common stock and Class B common stock held by them as of the record date. In conjunction with the announcement of the stock dividend, the Company applied for and was granted permission to list the Class A common stock shares that were issued as a part of the dividend on the NYSE MKT. Holders of the Company’s outstanding Class A and Class B warrants were entitled to receive, upon exercise, 0.1 additional shares of Class A common stock per warrant exercised, in order to account for the dilutive impact of the stock dividend.
On February 29, 2016, the Company’s Board of Directors declared a cash dividend of $0.08 per share of common stock payable prior to the end of March 2016. In addition, in connection with the cash dividend, in accordance with the terms of the outstanding warrants for OSG’s Class A and Class B common stock, those warrants were automatically adjusted so that exercising holders received additional shares of Class A common stock reflecting the payment of the cash dividend.
| 89 | Overseas Shipholding Group, Inc. |
Registration Rights Agreement
On May 2, 2014, the Debtors entered into a registration rights agreement with each Commitment Party (as subsequently amended, the “Registration Rights Agreement”). On May 26, 2014, the Debtors and each of the Commitment Parties entered into an amendment to the Registration Rights Agreement which added, as parties to the Registration Rights Agreement, all Commitment Parties that were not Initial Commitment Parties. Pursuant to the Registration Rights Agreement, we are required to register, on a registration statement filed with the Securities and Exchange Commission (“SEC”), the resale of certain shares of Class A common stock and Class A warrants for the benefit of the Commitment Parties and potentially certain other shareholders.
Under the terms of the Registration Rights Agreement, the selling securityholders are provided with certain demand registration rights subject to certain conditions and limitations. At any time and from time to time after a shelf registration statement has been declared effective by the SEC, any one or more of the selling securityholders may request to sell all or any portion of their Registrable Securities (as defined in the Registration Rights Agreement) in an underwritten offering, provided that the total offering price of the securities to be offered in such offering is reasonably expected to exceed, in the aggregate (i) in the case of a demand by at least one selling securityholder that is an “affiliate” (within the meaning of Rule 405 under the Securities Act), $25 million or (ii) in all other cases, $75 million.
Share and Warrant Repurchases
During the year ended December 31, 2016, the Company repurchased 106,350 shares of its Class A common stock in open-market purchases on the NYSE MKT at an average price of $12.23 per share, for a total cost of $1,301. In addition, during the years ended December 31, 2016 and 2015, the Company repurchased 55,306,351 and 1,219,202 Class A warrants, respectively, in private transactions with non-affiliates at an average per share equivalent cost of $11.31 and $16.25, respectively, for a total cost of $118,041 and $3,633, respectively.
In connection with the vesting of restricted stock units in January, March, April and September 2016, the Company repurchased 25,885 shares of Class A common stock at an average cost of $14.06 per share (based on the market prices on the dates of vesting) from certain members of management to cover withholding taxes.
Warrant Conversions
During the years ended December 31, 2016, 2015 and 2014, the Company issued 8,247,648, 3,277,309 and 0 shares of Class A common stock, respectively, and 7,833, 396,025 and 106,669 shares of Class B common stock, respectively, as a result of the exercise of 43,835,170, 19,688,119 and 0 Class A warrants, respectively, and 46,997, 2,381,811, and 641,138 Class B warrants, respectively.
Management Incentive Compensation Plan and Non-Employee Director Incentive Compensation Plan
On September 23, 2014, the Committee approved the Overseas Shipholding Group, Inc. Management Incentive Compensation Plan (the “Management Plan”) and the Overseas Shipholding Group, Inc. Non-Employee Director Incentive Compensation Plan (the “Director Plan” and together with the Management Plan, the “Incentive Plans”).
The Incentive Plans described below contain anti-dilution provisions whereby in the event of any change in the capitalization of the Company, the number and type of securities underlying outstanding share based payment awards must be adjusted, as appropriate, in order to prevent dilution or enlargement of rights. The impact of these provisions resulted in a modification of all outstanding share based payment awards upon the stock dividend, reverse stock split and spin-off transactions described above. As the fair value of the awards immediately after the stock dividend, reverse stock split and spin off transactions, did not increase when compared to the fair value of such awards immediately prior to such transactions, no incremental compensation costs were recognized as a result of such modifications. Pursuant to the Employee Matters Agreement described in Note 5, “Discontinued Operations,” and below, unvested share based payment awards of OSG employees that transitioned to INSW were assumed by INSW and converted into equivalent awards of INSW’s equity.
The purpose of the Incentive Plans is to promote the interests of the Company and its shareholders by providing certain employees and members of the Board, who are largely responsible for the management, growth and protection of the business of the Company, with incentives and rewards to encourage them to continue in the service of the Company. The Incentive Plans permit the Committee to grant to eligible employees and directors of the Company, as applicable, any of the following types of awards (or any combination thereof): cash incentive awards, nonqualified stock options, incentive stock options and other stock-based awards, including, without limitation, stock appreciation rights, phantom stock, restricted stock, restricted stock units, performance shares, deferred share units and share-denominated performance units. Subject to adjustment, the maximum number of shares of the Company’s Class A common stock authorized for issuance is 6,783,333 shares under the Management Plan and 550,000 shares under the Director Plan.
| 90 | Overseas Shipholding Group, Inc. |
On September 23, 2014, the Committee also approved two forms of Stock Option Grant Agreements and two forms of Restricted Stock Unit Grant Agreements, each for use under the Management Plan (each a “Form of Grant Agreement”). Each Form of Grant Agreement provides for the grant of time-vested awards, which vest in equal installments on each of the first three anniversaries of the grant date, subject to the recipient of the award remaining employed with the Company on each such date.
OSG shareholders approved the Incentive Plans on June 9, 2015.
Stock Compensation
The Company accounts for stock compensation expense in accordance with the fair value based method required by ASC 718, Compensation – Stock Compensation. Such fair value based method requires share based payment transactions to be measured based on the fair value of the equity instruments issued.
Director Compensation - Restricted Common Stock
The Company awarded a total of 74,201, 54,881 and 54,166 restricted Class A common stock shares during the years ended December 31, 2016, 2015 and 2014, respectively, to its non-employee directors. The weighted average fair value of the Company’s stock on the measurement date of such awards was $11.64 (2016) $18.87 (2015) and $18.00 (2014) per share. Such restricted shares awards generally vest in full at the first anniversary of the grant date, subject to each director continuing to provide services to the Company through such date. The shares granted may not be transferred, pledged, assigned or otherwise encumbered prior to vesting. Prior to the vesting date, a holder of restricted shares has all the rights of a shareholder of the Company, including the right to vote such shares and the right to receive dividends paid with respect to such shares at the same time as common shareholders generally.
On March 3, 2015, Mr. John J. Ray, III resigned from the Board. Pursuant to a waiver letter agreement entered into by the Company and Mr. Ray in connection with his resignation, 5,380 shares of the 9,722 shares originally granted to Mr. Ray, relating to his period of service as a director, vested on March 3, 2015. The balance of his restricted stock awards (4,342 shares) was forfeited and cancelled. The incremental compensation expense recognized as a result of the difference between the grant date fair value of the vested shares and estimated fair value of the Company’s Class A common stock on March 3, 2015 was approximately $8.
On August 3, 2015, Mr. Alexander Greene and Mr. Nikolaus Semaca resigned from the Board. Pursuant to waiver letter agreements entered into between the Company and each of such former directors in connection with their resignations, a total of 20,829 shares originally granted these directors vested in full on August 7, 2015. The incremental compensation expense recognized as a result of the accelerated vesting and the difference between the grant date fair value of the vested shares and the estimated fair value of the Company’s Class A common stock on August 7, 2015 was approximately $189. The Company also entered into consulting agreements with each of Messrs. Greene and Semaca for the provision of advisory services as requested from time to time at the discretion of the Chairman of the Board. During the consulting period which terminated on June 30, 2016, Messrs. Greene and Semaca each received a quarterly fee of approximately $37.
Management Compensation
(i) Restricted Stock Units
During the years ended December 31, 2016, 2015 and 2014, the Company awarded 381,922, 280,545 and 35,997 time-based restricted stock units (“RSUs”) to certain of its employees, including senior officers. The average grant date fair value of these awards was $9.93 (2016), $18.65 (2015) and $19.91 (2014), per RSU. Each RSU represents a contingent right to receive one share of Class A common stock upon vesting. Each award of RSUs will vest in equal installments on each of the first three anniversaries of the grant date. RSUs may not be transferred, pledged, assigned or otherwise encumbered until they are settled. Settlement of vested RSUs may be in either shares of Class A common stock or cash, as determined at the discretion of the Human Resources and Compensation Committee, and shall occur as soon as practicable after the vesting date. If the RSUs are settled in shares of common stock, following the settlement of such shares, the grantee will be the record owner of the shares of Class A common stock and will have all the rights of a shareholder of the Company, including the right to vote such shares and the right to receive dividends paid with respect to such shares of Class A common stock. RSUs which have not become vested as of the date of a grantee’s termination from the Company will be forfeited without the payment of any consideration, unless otherwise provided for.
During the year ended December 31, 2016, the Company awarded 119,853 performance-based RSUs to its senior officers. Each performance stock unit represents a contingent right to receive RSUs based upon the covered employees being continuously employed through the end of the period over which the performance goals are measured and shall vest as follows: (i) one-third of the target RSUs shall vest on December 31, 2018, subject to OSG’s three-year earnings per share (“EPS”) performance in the three-year EPS performance period relative to a compounded annual growth rate (the “EPS Target”) set forth in the award agreements; (ii) one-third of the target RSUs shall vest on December 31, 2018, subject to OSG’s return on invested capital (“ROIC”) performance in the three-year ROIC performance period relative to a target rate (the “ROIC Target”) set forth in the award agreements; and (iii) one-third of the target RSUs will be subject to OSG’s three-year total shareholder return (“TSR”) performance relative to that of a performance peer group over a three-year TSR performance period (“TSR Target”). Vesting is subject in each case to the Human Resources and Compensation Committee’s certification of achievement of the performance measures and targets no later than March 31, 2019. The EPS Target and ROIC Target are performance conditions which, as of December 31, 2016, management believes, are not yet considered probable of being achieved. Accordingly, for financial reporting purposes, no compensation costs will be recognized for these awards until it becomes probable that the performance conditions will be achieved. The grant date fair value of the TSR based performance awards, which has a market condition, was determined to be $11.82 per RSU.
| 91 | Overseas Shipholding Group, Inc. |
In addition, during the year ended December 31, 2016, the Company granted 38,547 performance-based RSUs (which represented the 2016 tranche of the October 12, 2015 awards described below) to certain members of senior management. The grant date fair value of the performance awards was determined to be $11.82 per RSU. Each performance stock unit represents a contingent right to receive RSUs based upon certain performance related goals being met and the covered employees being continuously employed through the end of the period over which the performance goals are measured. These performance awards vested on December 31, 2016, subject in each case to the Human Resources and Compensation Committee’s certification of achievement of the performance measures and targets no later than March 31, 2017. Achievement of the performance condition in this award was considered probable and accordingly, compensation cost was recognized commencing on March 30, 2016, the grant date of the award. However, as a result of the INSW spin off transaction, the outstanding unvested performance based RSU awards held by the members of senior management that remained with OSG, but terminated employment with the Company shortly after the spinoff date, were forfeited. As noted above, the awards granted to former members of OSG senior management that transitioned to INSW were cancelled.
On October 12, 2015, the Company awarded 115,640 performance-based RSUs to certain members of senior management to be granted in three equal but separate tranches. The grant date fair value of the 2015 Tranche of the performance awards (38,547 units) was determined to be $14.51 per RSU. Each performance stock unit represents a contingent right to receive RSUs of the Company based upon certain performance related goals being met and the covered employees being continuously employed through the end of the period over which the performance goals are measured. The performance stock units have no voting rights and may not be transferred or otherwise disposed of until they vest. Each performance award tranche granted during 2015, 2016 and 2017, will vest on each of December 31, 2015, 2016 and 2017, subject in each case to the Committee’s certification of achievement of the performance measures and targets no later than each March 31 following the respective date of vesting. Settlement of the vested RSUs may be in either shares of common stock or cash, as determined by the Committee in its discretion, and shall occur as soon as practicable following the Committee's certification of the achievement of the applicable performance measures and targets for 2017 and in any event no later than April 30, 2018. With respect to the RSUs that may vest with respect to each of 2015, 2016 and 2017, the number of target RSUs shall be subject to an increase or decrease depending on performance against the applicable performance measures and targets. Compensation expense recognized with respect to the performance awards vesting on December 31, 2016 and 2015 was based upon an achievement levels of 100% and 130%, respectively, of the target RSUs.
(ii) Stock Options
During the years ended December 31, 2016, 2015 and 2014, the Company awarded to certain senior officers an aggregate of 528,304, 182,310, and 86,228 stock options, respectively. Each stock option represents an option to purchase one share of Class A common stock for an exercise price that ranged between $3.73 and $12.69 per share for 2016, $17.10 for 2015 and $19.20 for 2014. The average grant date fair value of the options was $10.83 per option in 2016, $8.40 in 2015 and 9.48 in 2014. Stock options may not be transferred, pledged, assigned or otherwise encumbered prior to vesting. Each stock option will vest in equal installments on each of the first three anniversaries of the award date. The stock options expire on the business day immediately preceding the tenth anniversary of the award date. If a stock option grantee’s employment is terminated for cause (as defined in the applicable Form of Grant Agreement), stock options (whether then vested or exercisable or not) will lapse and will not be exercisable. If a stock option grantee’s employment is terminated for reasons other than cause, the option recipient may exercise the vested portion of the stock option but only within such period of time ending on the earlier to occur of (i) the 90th day ending after the option recipient’s employment terminated and (ii) the expiration of the options, provided that if the Optionee’s employment terminates for death or disability the vested portion of the option may be exercised until the earlier of (i) the first anniversary of employment termination and (ii) the expiration date of the options.
The fair values of the options granted were estimated on the dates of grant using the Black-Scholes option pricing model with the following weighted average assumptions for 2016, 2015 and 2014 grants: risk free interest rates of 1.65%, 1.8% and 2.2%, respectively, dividend yields of 0.0%, expected stock price volatility factors of .40, .37 and .42, respectively, and expected lives of 6.0 years.
The Black-Scholes option valuation model was developed for use in estimating the fair value of traded options that have no vesting restrictions and are fully transferable. In addition, option valuation models require the input of highly subjective assumptions, including the expected stock price volatility. Since the Company’s stock options have characteristics significantly different from those of traded options, and because changes in the subjective input assumptions can materially affect the fair value estimate, in management’s opinion, the existing models do not necessarily provide a reliable single measure of the fair value of its stock options.
| 92 | Overseas Shipholding Group, Inc. |
Employee Terminations and Retirements and Impact of Spinoff
On July 29, 2016, Mr. Henry Flinter retired from his position as President of the Company’s U.S. Flag operations. Pursuant to his employment agreement, as amended on March 30, 2016, all of his unvested stock option awards, time-based RSUs and performance-based RSUs vested in full (per the terms of his agreement, performance-based RSUs vested at target performance) on July 29, 2016. The incremental compensation expense recognized as a result of the accelerated vesting and the difference between the grant date fair value of the vested shares and the fair value of the Company’s Class A common stock on July 29, 2016 was approximately $23. The Human Resources and Compensation Committee of the Company’s Board elected to settle the vested equity awards (with the exception of certain performance-based RSUs that by their terms are not settled until the first quarter of 2018) in cash. Severance costs of approximately $2,238 were recognized during the year in relation to Mr. Flinter’s separation from the Company, of which $789 was as a result of the accelerated vesting of his share based compensation awards. Also see Note 19, “Severance and Agreements with Executive Officers.”
On December 29, 2016, Captain Ian Blackley retired from his position as Chief Executive Officer of the Company. Pursuant to his employment agreement, as amended on March 30, 2016 and August 3, 2016, all of his unvested stock option awards and time-based RSUs vested in full on December 29, 2016. Stock compensation expense, net of forfeitures, totaling $1,251 was recognized in December 2016 as a result of the accelerated vesting of his time-based RSU and stock option awards offset by the related forfeitures of his unvested performance-based RSU awards.
On December 29, 2016, Mr. Rick Oricchio retired from his position as Chief Financial Officer of the Company. Pursuant to his employment agreement, as amended on March 30, 2016 and August 3, 2016, all of his unvested stock option awards, and time-based RSU awards vested in full on December 29, 2016. Stock compensation expense, net of forfeitures, totaling $984 was recognized in December 2016 as a result of the accelerated vesting of his share based compensation awards and the related forfeitures of his unvested performance-based RSU awards.
The spin-off transaction resulted in the Compensation Committee, as required by the Management and Director Incentive Plans, adjusting the number and the type of securities underlying the outstanding awards at November 30, 2016, in each case as it considered appropriate, in order to prevent dilution or enlargement of rights. The adjustments resulted in a 430,841 increase in restricted stock and restricted stock units and a 581,332 increase in stock options. Additionally, as a result of certain employees transferring from OSG to INSW, 177,635 restricted stock units and 205,427 stock options were cancelled.
A total of 3,641,791 shares of the Company’s Class A Common Stock may be issued or used as the basis for awards under the Incentive Plans as of December 31, 2016.
The 2004 Stock Incentive Plan
The Company’s 2004 Stock Incentive Plan (the “2004 Plan”) enabled the Company to grant stock-based awards, including stock options, stock appreciation rights, restricted stock and performance awards to employees, consultants and non-employee directors. On May 21, 2014, the Company filed notice with the Bankruptcy Court that it was rejecting the Company’s 2004 Plan effective June 1, 2014. As a result of the rejection of the 2004 Plan, all unvested awards and any OSG equity interests thereunder were cancelled and holders of unvested awards were not entitled to participate in the Rights Offering (see Note 2, “Chapter 11 Filing and Emergence from Bankruptcy,” to these consolidated financial statements) or to vote on or receive distributions under the Equity Plan (see Note 2). As a result of the cancellation of the unvested awards, the unrecognized stock compensation expense relating to unvested stock options, restricted common stock and restricted stock units was accelerated, and a charge of $1,796 was recorded to reorganization items in the consolidated statements of operations for the year ended December 31, 2014.
There were no stock options, restricted common stock, restricted stock units or performance related grants under the 2004 Plan during the period from January 1, 2014 through the May 21, 2014 rejection of the 2004 Plan.
For both the Incentive Plans and the 2004 Plan compensation expense is recognized over the vesting period, contingent or otherwise, applicable to each grant, using the straight-line method. Compensation expense as a result of the restricted shares and RSU awards described above was $5,198, $3,139 and $434 during each of the years ended December 31, 2016, 2015 and 2014, respectively.
There were 0 and 45,008 restricted common shares and restricted stock units outstanding relating to the 2004 Plan as of December 31, 2014 and 2013, respectively, and 15,166, 7,863 and 21,979 restricted common shares and restricted stock units were vested, forfeited and cancelled, respectively, during the year ending December 31, 2014, in connection with the Company’s Emergence from Bankruptcy. There were 0 and 124,842 stock options outstanding relating to the 2004 Plan as of December 31, 2014 and 2013, respectively, and 7,306 and 117,536 stock options were forfeited and cancelled, respectively, during the year ending December 31, 2014 in connection with the Company’s emergence from Bankruptcy.
| 93 | Overseas Shipholding Group, Inc. |
Activity with respect to restricted common stock and restricted stock units under the Incentive Plans during the three years ended December 31, 2016 is summarized as follows:
| Activity for the three years ended December 31, 2016 | Class A common shares | |||
| Nonvested Shares Outstanding at December 31, 2013 | - | |||
| Granted (1) | 90,163 | |||
| Nonvested Shares Outstanding at December 31, 2014 | 90,163 | |||
| Granted (1) | 871,439 | |||
| Vested ($3.00 to $3.65 per share) (1) | (160,835 | ) | ||
| Forfeited (1) | (4,342 | ) | ||
| Performance awards (2) | 11,564 | |||
| Nonvested Shares Outstanding at December 31, 2015 | 807,989 | |||
| Granted (1) | 614,523 | |||
| Vested ($2.87 to $21.90 per share) (1) | (1,025,212 | ) | ||
| Forfeited | (88,228 | ) | ||
| INSW Spin off modification | 430,841 | |||
| Cancellations related to INSW Spin-off | (177,635 | ) | ||
| Nonvested Shares Outstanding at December 31, 2016 | 562,278 | |||
| (1) | Share information has been recast to reflect the 2016 reverse stock split and 2015 stock dividend. |
| (2) | Represents additional shares resulting from an increase in performance awards vesting on December 31, 2016 and 2015 based on the actual achievement of performance goals. |
| Activity for the three years ended December 31, 2016 | Class A common shares | |||
| Options Outstanding at December 31, 2013 | - | |||
| Granted (1) | 86,229 | |||
| Options Outstanding at December 31, 2014 | 86,229 | |||
| Granted (1) | 182,310 | |||
| Exercised | - | |||
| Options Outstanding at December 31, 2015 | 268,539 | |||
| Granted (1) | 528,304 | |||
| Forfeited | (2,674 | ) | ||
| Expired | (55,971 | ) | ||
| Exercised | - | |||
| INSW Spin off modification | 581,332 | |||
| Cancellations related to INSW Spin-off | (205,427 | ) | ||
| Options Outstanding at December 31, 2016 | 1,114,103 | |||
| Options Exercisable at December 31, 2016 | 737,669 | |||
| (1) | Share information has been recast to reflect the 2016 reverse stock split and 2015 stock dividend. |
The weighted average remaining contractual life of the outstanding stock options at December 31, 2016 was 3.43 years. The range of exercise prices of the stock options outstanding at December 31, 2016 was between $3.73 and $8.43 per share (which reflects an adjustment as a result of the stock dividend and reverse spin modification and INSW spin off described above). The weighted average exercise prices of the stock options outstanding at December 31, 2016, 2015 and 2014 were $6.69, $2.96 and $3.65 per share, respectively. None of the stock options which vested during the three-year period ended December 31, 2016 were “in-the-money.”
| 94 | Overseas Shipholding Group, Inc. |
Net compensation expense/(income) as a result of the grants of stock options described above was $2,243, $441 and $120 during each of the years ended December 31, 2016, 2015, and 2014, respectively.
As of December 31, 2016, there was $2,869 of unrecognized compensation cost related to nonvested share-based compensation arrangements. That cost is expected to be recognized over a weighted average period of 2.29 years.
NOTE 15 — ACCUMULATED OTHER COMPREHENSIVE LOSS:
The components of accumulated other comprehensive loss, net of related taxes, in the consolidated balance sheets follow:
| At December 31, | 2016 | 2015 | ||||||
| Unrealized losses on derivative instruments | $ | (1,019 | ) | $ | (54,620 | ) | ||
| Items not yet recognized as a component of net periodic benefit cost (pension and other postretirement benefit plans) | (7,141 | ) | (18,841 | ) | ||||
| $ | (8,160 | ) | $ | (73,461 | ) | |||
The following tables present the changes in the balances of each component of accumulated other comprehensive loss, net of related taxes, for the three years ended December 31, 2016.
| Unrealized losses on cash flow hedges | Items not yet recognized as a component of net periodic benefit cost (pension and other postretirement plans) | Total | ||||||||||
| Balance as of December 31, 2015 | $ | (54,620 | ) | $ | (18,841 | ) | $ | (73,461 | ) | |||
| Current period change, excluding amounts reclassified from accumulated other comprehensive loss | (5,982 | ) | (4,055 | ) | (10,037 | ) | ||||||
| Amounts reclassified from accumulated other comprehensive loss | 16,293 | 700 | 16,993 | |||||||||
| Distribution of International Seaways, Inc. | 43,290 | 15,055 | 58,345 | |||||||||
| Total change in accumulated other comprehensive loss | 53,601 | 11,700 | 65,301 | |||||||||
| Balance as of December 31, 2016 | $ | (1,019 | ) | $ | (7,141 | ) | $ | (8,160 | ) | |||
| Balance as of December 31, 2014 | $ | (61,547 | ) | $ | (21,833 | ) | $ | (83,380 | ) | |||
| Current period change, excluding amounts reclassified from accumulated other comprehensive loss | (11,177 | ) | 2,581 | (8,596 | ) | |||||||
| Amounts reclassified from accumulated other comprehensive loss | 18,104 | 411 | 18,515 | |||||||||
| Total change in accumulated other comprehensive loss | 6,927 | 2,992 | 9,919 | |||||||||
| Balance as of December 31, 2015 | $ | (54,620 | ) | $ | (18,841 | ) | $ | (73,461 | ) | |||
| Balance as of December 31, 2013 | $ | (59,263 | ) | $ | (10,081 | ) | $ | (69,344 | ) | |||
| Current period change, excluding amounts reclassified from accumulated other comprehensive loss | (21,850 | ) | (11,969 | ) | (33,819 | ) | ||||||
| Amounts reclassified from accumulated other comprehensive loss | 19,566 | 217 | 19,783 | |||||||||
| Total change in accumulated other comprehensive loss | (2,284 | ) | (11,752 | ) | (14,036 | ) | ||||||
| Balance as of December 31, 2014 | $ | (61,547 | ) | $ | (21,833 | ) | $ | (83,380 | ) | |||
| 95 | Overseas Shipholding Group, Inc. |
The following table presents information with respect to amounts reclassified out of accumulated other comprehensive loss for the three years ended December 31, 2016.
| Years ended December 31, | ||||||||||||||
| Accumulated Other Comprehensive Loss Component | 2016 | 2015 | 2014 | Statement of Operations Line Item | ||||||||||
| Unrealized losses on cash flow hedges: | ||||||||||||||
| Interest rate swaps entered into by the Company's equity method joint venture investees | (15,664 | ) | (18,101 | ) | (19,566 | ) | Net (loss)/income from discontinued operations | |||||||
| Interest rate caps entered into by the Company's subsidiaries | (339 | ) | (1 | ) | - | Interest expense | ||||||||
| Interest rate caps entered into by the Company's subsidiaries | (408 | ) | (2 | ) | - | Net (loss)/income from discontinued operations | ||||||||
| Items not yet recognized as a component of net periodic benefit cost (pension and other postretirement plans): | ||||||||||||||
| Net periodic benefit costs associated with pension and postretirement benefit plans for shore-based employees | (645 | ) | (232 | ) | 58 | General and administrative expenses | ||||||||
| Net periodic benefit costs associated with pension and postretirement benefit plans for shore-based employees | (365 | ) | (482 | ) | (318 | ) | Net (loss)/income from discontinued operations | |||||||
| Net periodic benefit costs associated with pension and postretirement benefit plans for seagoing employees | 131 | 80 | 97 | Vessel expenses | ||||||||||
| (17,290 | ) | (18,738 | ) | (19,729 | ) | Total before tax | ||||||||
| 297 | 223 | (54 | ) | Tax provision / (benefit) | ||||||||||
| $ | (16,993 | ) | $ | (18,515 | ) | $ | (19,783 | ) | Total net of tax | |||||
The following amounts are included in accumulated other comprehensive loss at December 31, 2016, which have not yet been recognized in net periodic cost: unrecognized prior service credits of $2,304 ($1,436 net of tax) and unrecognized actuarial losses $13,298 ($8,577 net of tax). The prior service credit and actuarial loss included in accumulated other comprehensive loss and expected to be recognized in net periodic cost during 2017 are a gain of $229 ($143 net of tax) and a loss of $730 ($472 net of tax), respectively.
At December 31, 2016, the Company expects that it will reclassify $1,422 ($924 net of tax) losses on derivative instruments from accumulated other comprehensive loss to earnings during the next twelve months due to the payment of variable rate interest associated with interest rate cap held by the Company.
See Note 10, “Fair Value of Financial Instruments, Derivatives and Fair Value,” for additional disclosures relating to derivative instruments.
| 96 | Overseas Shipholding Group, Inc. |
The income tax (expense)/benefit allocated to each component of other comprehensive loss follows:
| Unrealized gains/(losses) on cash flow hedges | Items not yet recognized as a component of net periodic benefit cost | |||||||
| For the year ended December 31, 2016: | ||||||||
| Current period change excluding amounts reclassified from accumulated other comprehensive loss | $ | 30 | $ | (388 | ) | |||
| Amounts reclassified from accumulated other comprehensive loss | (118 | ) | (179 | ) | ||||
| Total change in accumulated other comprehensive loss | $ | (88 | ) | $ | (567 | ) | ||
| For the year ended December 31, 2015: | ||||||||
| Current period change excluding amounts reclassified from accumulated other comprehensive loss | $ | 553 | $ | (353 | ) | |||
| Amounts reclassified from accumulated other comprehensive loss | - | (223 | ) | |||||
| Total change in accumulated other comprehensive loss | $ | 553 | $ | (576 | ) | |||
| For the year ended December 31, 2014: | ||||||||
| Current period change excluding amounts reclassified from accumulated other comprehensive loss | $ | 115 | $ | 3,639 | ||||
| Amounts reclassified from accumulated other comprehensive loss | - | 54 | ||||||
| Total change in accumulated other comprehensive loss | $ | 115 | $ | 3,693 | ||||
NOTE 16 — LEASES:
1. Charters-in:
As of December 31, 2016, the Company had commitments to charter in 10 vessels. All of the charters-in are accounted for as operating leases and all are bareboat charters. Lease expense relating to charters-in is included in charter hire expenses in the consolidated statements of operations. The future minimum commitments and related number of operating days under these operating leases are as follows:
| Bareboat Charters-in: | ||||||||
| At December 31, | Amount | Operating Days | ||||||
| 2017 | $ | 91,576 | 3,650 | |||||
| 2018 | 91,457 | 3,650 | ||||||
| 2019 | 111,819 | 3,470 | ||||||
| 2020 | 9,168 | 366 | ||||||
| 2021 | 9,143 | 365 | ||||||
| Thereafter | 31,864 | 1,272 | ||||||
| Net minimum lease payments | $ | 345,027 | 12,773 | |||||
The bareboat charters-in provide for the payment of profit share to the owners of the vessels calculated in accordance with the respective charter agreements. Because such amounts and the periods impacted are not reasonably estimable they are not currently reflected in the table above. Due to reserve funding requirements and current rate forecasts, no profits are currently expected to be paid to the owners in respect of the charter term through December 31, 2019. The charters in the above tables also provide the Company with renewal and purchase options.
| 97 | Overseas Shipholding Group, Inc. |
2. Charters-out:
The future minimum revenues, before reduction for brokerage commissions, expected to be received on noncancelable time charters and certain COAs for which minimum annual revenues can be reasonably estimated and the related revenue days (revenue days represent calendar days, less days that vessels are not available for employment due to repairs, drydock or lay-up) are as follows:
| At December 31, 2016 | Amount | Revenue Days | ||||||
| 2017 | $ | 265,767 | 4,704 | |||||
| 2018 | 152,227 | 2,153 | ||||||
| 2019 | 78,508 | 938 | ||||||
| 2020 | 43,678 | 531 | ||||||
| 2021 | 26,644 | 324 | ||||||
| Thereafter | 108,199 | 1,251 | ||||||
| Net minimum lease payments | $ | 675,023 | 9,901 | |||||
Future minimum revenues do not include COAs for which minimum annual revenues cannot be reasonably estimated. Revenues from those COAs that are included in the table above, $22,347 (2017), $22,698 (2018), $23,031 (2019) and $6,356 (2020), are based on minimum annual volumes of cargo to be loaded during the contract periods at a fixed price, and do not contemplate early termination of the COAs as provided in certain of the agreements. Amounts that would be due to the Company in the event of the cancellation of the COA contracts have not been reflected in the above table. Revenues from a time charter are not generally received when a vessel is off-hire, including time required for normal periodic maintenance of the vessel. In arriving at the minimum future charter revenues, an estimated time off-hire to perform periodic maintenance on each vessel has been deducted, although there is no assurance that such estimate will be reflective of the actual off-hire in the future.
3. Office space:
The future minimum commitments under lease obligations for office space are as follows:
| At December 31, | Amount | |||
| 2017 | $ | 526 | ||
| 2018 | 539 | |||
| 2019 | 568 | |||
| 2020 | 538 | |||
| 2021 | 538 | |||
| Thereafter | 931 | |||
| Net minimum lease payments | $ | 3,640 | ||
The rental expense for office space, which is included in general and administrative expenses in the consolidated statements of operations, amounted to $1,324 in 2016, $1,808 in 2015 and $1,766 in 2014.
NOTE 17 — PENSION AND OTHER POSTRETIREMENT BENEFIT PLANS:
For the years ended December 31, 2016 and December 31, 2015 pension and other benefit liabilities are included in other liabilities in the consolidated balance sheets.
Pension Plans
In connection with the November 2006 acquisition of Maritrans, the Company assumed the obligations under the defined benefit retirement plan of Maritrans Inc. (“the Maritrans Plan”). As of December 31, 2006, the Company froze the benefits under the Maritrans Plan. At December 31, 2016, the Maritrans Plan is the only domestic defined benefit pension plan in existence. The Maritrans Plan was noncontributory and covered substantially all shore-based employees and substantially all of the seagoing supervisors who were supervisors in 1984, or who were hired in, or promoted into, supervisory roles between 1984 and 1998 for that period of time. Beginning in 1999, the seagoing supervisors’ retirement benefits are provided through contributions to an industry-wide, multiemployer union sponsored pension plan. Upon retirement, those seagoing supervisors are entitled to retirement benefits from the Maritrans Plan for service periods between 1984 and 1998 and from the multiemployer union sponsored plan for other covered periods. Retirement benefits are based primarily on years of service and average compensation for the five consecutive plan years that produce the highest results.
| 98 | Overseas Shipholding Group, Inc. |
Multiemployer Pension and Postretirement Benefit plans
Certain of the Company’s subsidiaries are parties to collective-bargaining agreements that require them to make contributions to three jointly managed (Company and union) multiemployer pension plans covering seagoing personnel of U.S. Flag vessels. All three plans, the American Maritime Officers (“AMO”) Pension Plan, the Seafarers Pension Plan (“SIU”) and the Marine Engineers’ Beneficial Association (“MEBA”) Defined Benefit Pension Plan, are deemed individually significant by management. Management assessed these plans as individually significant because of the potential withdrawal liabilities under the AMO Pension Plan and the MEBA Defined Benefit Pension Plan and because the Company’s contributions to the SIU plan constituted more than 5% of total employer contributions to the plan during the pension plan year ending in 2016.
Plan level information is available in the public domain for each of the multiemployer pension plans the Company participates in. The table below provides additional information about the Company’s participation in the above multi-employer pension plans:
| Pension Protection Act | Contributions made | |||||||||||||||||||
| Zone Status | by the Company | |||||||||||||||||||
| Pension Plan | EIN / Pension Plan Number | 2016 | 2015 | Rehabilitation Plan Status | 2016 | 2015 | 2014 | |||||||||||||
| AMO Pension Plan | 13-1936709 | Yellow (1) | Yellow (1) | Implemented | $ | 1,015 | $ | 1,001 | $ | 994 | ||||||||||
| MEBA Pension Plan | 51-6029896 | Green (1) | Red (1) | None | 1,406 | 1,286 | 322 | |||||||||||||
| Seafarers Pension Plan | 13-6100329 | Green (1) | Green (1) | None | 434 | 427 | 396 | |||||||||||||
| Total contributions | $ | 2,855 | $ | 2,714 | $ | 1,712 | ||||||||||||||
| (1) | A "Red" Zone (or critical) Status plan is a plan that is funded less than 65% and currently has a funding deficiency or a funding deficiency that is projected in the near term. A "Yellow" Zone Status plan is a plan that has a funding ratio between 65% and 80%. A "Green" Zone Status plan is a plan that is 80% funded or more. |
The plan years for the three union plans end as follows: MEBA and SIU on December 31 and AMO on September 30. The Company has no future minimum contribution requirements under the three multiemployer pension plans shown above as of December 31, 2016 and any future contributions are subject to negotiations between the employers and the unions.
Under the Employee Retirement Income Security Act of 1974 (“ERISA”) as amended by the Pension Protection Act of 2006 (“PPA”) and the Multiemployer Pension Reform Act of 2014 (“MPRA”), on March 31, 2015, the actuary of the MEBA Pension Plan (“Plan”) certified the Plan as being in neither endangered nor critical status as of January 1, 2015. The actuary also certified that the Plan was projected to be in critical status in at least one of the five succeeding Plan years. Under MPRA, a multiemployer pension plan that has been actuarially projected to be in critical status within the succeeding five plan years may elect to be in critical status for the current plan year within 30 days of the actuary’s certification. In accordance with applicable law, on April 30, 2015 the Plan’s Board of Trustees (“Trustees”) elected that the Plan enter critical status for the plan year beginning January 1, 2015. The Plan entered into a Rehabilitation Plan (“RP”) whereby lump sum payment options previously available under the Plan will no longer be paid to beneficiaries, and each employer became obligated to pay a 5% contribution surcharge to the Plan, effective with respect to contributions for work performed on or after June 1, 2015. On October 27, 2015, the Company received correspondence from MEBA indicating that Federal law requires that the Trustees adopt an RP with a schedule of increases in contributions and reductions in future benefits that will help the Plan emerge from critical status. However, because the Plan’s actuary has projected that the Plan will emerge from critical status without any contribution increases or benefit reductions; the RP does not include any. The letter also indicated that since the Company signed a Memorandum of Understanding on October 21, 2015 whereby the Company and MEBA amended their collective bargaining agreement to adopt the preferred schedule of the RP that was adopted by the Pension Plan’s Board of Trustees on October 21, 2015, the surcharges required to be paid to the Plan by the Company since June 1, 2015 ceased as of October 31, 2015. During April 2016, the Company received correspondence from MEBA indicating that due to the actions of the Trustees, the Plan’s actuaries certified in March 2016 that the Plan has emerged from critical status, and the Plan is not in endangered, critical, or critical and declining status for the plan year commencing January 1, 2016. As a result, the rehabilitation plan period has terminated.
ERISA requires employers who are contributors to U.S. multiemployer plans to continue funding their allocable share of each plan’s unfunded vested benefits in the event of withdrawal from or termination of such plans. Based on information received from the trustees of the SIU Pension Plan, the Company is not subject to withdrawal liabilities under that plan. Based on the actuarial report received from the trustees of the MEBA Pension Plan, as of December 31, 2015, the Company’s estimated withdrawal liability was approximately $22,287. Based on the actuarial report received from the trustees of the AMO Pension Plan, as of September 30, 2015, the Company’s estimated withdrawal liability was approximately $24,706. The Company has no intentions of terminating its participation in any of the three multiemployer pension plans and has no expectations that the plans will be terminated. Accordingly, no provisions have been made for the estimated withdrawal liability as of December 31, 2016.
| 99 | Overseas Shipholding Group, Inc. |
The SIU – Tanker Agreement, SIU – Tug Agreement, AMO and MEBA collective bargaining agreements expire in June 2017, March 2018, March 2018 and June 2020, respectively. The collective bargaining agreements also require the Company to make contributions to certain other postretirement employee benefit plans the unions offer to their members. Such contributions were not material during the three years ended December 31, 2016.
Certain other seagoing personnel of U.S. Flag vessels are covered under a defined contribution plan, the cost of which is funded as accrued. The costs of all these plans were not material during the three years ended December 31, 2016.
Postretirement Benefit Plans
The Company also provides certain postretirement health care and life insurance benefits to qualifying domestic retirees and their eligible dependents. The health care plan for shore-based employees and their dependents and seagoing licensed deck officers (“Deck Officers”) and their dependents is contributory at retirement, while the life insurance plan for all employees is noncontributory. In general, postretirement medical coverage is provided to shore-based employees hired prior to January 1, 2005 and all Deck Officers who retire and have met minimum age and service requirements under a formula related to total years of service. The Company no longer provides prescription drug coverage to its retirees or their beneficiaries once they reach age 65. The Company does not currently fund these benefit arrangements and has the right to amend or terminate the health care and life insurance benefits at any time.
Information with respect to the domestic pension and postretirement benefit plans for which the Company uses a December 31 measurement date, follow:
| Pension Benefits | Other Benefits | |||||||||||||||
| At December 31, | 2016 | 2015 | 2016 | 2015 | ||||||||||||
| Change in benefit obligation: | ||||||||||||||||
| Benefit obligation at beginning of year | $ | 49,622 | $ | 52,418 | $ | 4,623 | $ | 5,119 | ||||||||
| Cost of benefits earned (service cost) | - | - | 138 | 137 | ||||||||||||
| Interest cost on benefit obligation | 1,893 | 1,928 | 189 | 191 | ||||||||||||
| Amendments | - | - | - | - | ||||||||||||
| Curtailment gain | - | - | (451 | ) | - | |||||||||||
| Actuarial (gains)/losses | (1,520 | ) | (2,271 | ) | (192 | ) | (621 | ) | ||||||||
| Benefits paid | (2,527 | ) | (2,453 | ) | (213 | ) | (203 | ) | ||||||||
| Benefit obligation at year end | 47,468 | 49,622 | 4,094 | 4,623 | ||||||||||||
| Change in plan assets: | ||||||||||||||||
| Fair value of plan assets at beginning of year | 33,127 | 35,705 | - | - | ||||||||||||
| Actual return on plan assets | 1,413 | (125 | ) | - | - | |||||||||||
| Employer contributions | - | - | - | - | ||||||||||||
| Benefits paid | (2,527 | ) | (2,453 | ) | - | - | ||||||||||
| Fair value of plan assets at year end | 32,013 | 33,127 | - | - | ||||||||||||
| Unfunded status at December 31 | $ | (15,455 | ) | $ | (16,495 | ) | $ | (4,094 | ) | $ | (4,623 | ) | ||||
Information for defined benefit pension plans with accumulated benefit obligations in excess of plan assets follows:
| At December 31, | 2016 | 2015 | ||||||
| Projected benefit obligation | $ | 47,468 | $ | 49,622 | ||||
| Accumulated benefit obligation | 47,468 | 49,622 | ||||||
| Fair value of plan assets | 32,013 | 33,127 | ||||||
| 100 | Overseas Shipholding Group, Inc. |
Information for defined benefit pension plans and other postretirement benefit plans net periodic cost/(benefit) follows:
| Pension benefits | Other benefits | |||||||||||||||||||||||
| For the year ended December 31, | 2016 | 2015 | 2014 | 2016 | 2015 | 2014 | ||||||||||||||||||
| Components of expense: | ||||||||||||||||||||||||
| Cost of benefits earned | $ | - | $ | - | $ | - | $ | 138 | $ | 137 | $ | 89 | ||||||||||||
| Interest cost on benefit obligation | 1,893 | 1,928 | 1,951 | 189 | 191 | 193 | ||||||||||||||||||
| Expected return on plan assets | (2,309 | ) | (2,412 | ) | (2,494 | ) | - | - | - | |||||||||||||||
| Amortization of prior-service costs | - | - | - | (271 | ) | (316 | ) | (316 | ) | |||||||||||||||
| Amortization of transition obligation | - | - | - | - | - | 7 | ||||||||||||||||||
| Recognized net actuarial loss | 688 | 792 | - | 97 | 157 | 129 | ||||||||||||||||||
| Curtailment | 97 | 157 | 129 | (149 | ) | - | (42 | ) | ||||||||||||||||
| Net periodic benefit cost | $ | 369 | $ | 465 | $ | (414 | ) | $ | 4 | $ | 169 | $ | 60 | |||||||||||
The weighted-average assumptions used to determine benefit obligations follow:
| Pension benefits | Other benefits | |||||||||||||||
| At December 31, | 2016 | 2015 | 2016 | 2015 | ||||||||||||
| Discount rate | 3.95 | % | 4.00 | % | 4.15 | % | 4.25 | % | ||||||||
| Rate of future compensation increases | - | - | - | - | ||||||||||||
The selection of a single discount rate for the Maritrans Plan was derived from bond yield curves, which the Company believed as of such dates to be appropriate for ongoing plans with a long duration, such as the Maritrans Plan, and that generally mirror the type of high yield bond portfolio the Company could acquire to offset its obligations under the Maritrans Plan.
The weighted-average assumptions used to determine net periodic benefit cost follow:
| Pension benefits | Other benefits | |||||||||||||||||||||||
| For the year ended December 31, | 2016 | 2015 | 2014 | 2016 | 2015 | 2014 | ||||||||||||||||||
| Discount rate | 4.00 | % | 3.75 | % | 4.50 | % | 4.25 | % | 4.00 | % | 5.00 | % | ||||||||||||
| Expected (long-term) return on plan assets | 7.25 | % | 7.00 | % | 7.00 | % | - | - | - | |||||||||||||||
| Rate of future compensation increases | - | - | - | - | - | - | ||||||||||||||||||
The assumed health care cost trend rate for measuring the benefit obligation included in Other benefits above is an increase of 6.50% as of December 31, 2016, with the rate of increase declining steadily thereafter by 0.50% per annum to an ultimate trend rate of 5.00% per annum as of December 31, 2019. Assumed health care cost trend rates have a significant effect on the amounts reported for the health care plans. A 1% change in assumed health care cost trend rates would have the following effects:
| 1% increase | 1% decrease | |||||||
| Effect on total of service and interest cost components in 2016 | $ | 57 | $ | (39 | ) | |||
| Effect on postretirement benefit obligation as of December 31, 2016 | $ | 539 | $ | (383 | ) | |||
Expected benefit payments are as follows:
| Pension benefits | Other benefits | |||||||
| 2017 | $ | 2,621 | $ | 203 | ||||
| 2018 | 2,731 | 205 | ||||||
| 2019 | 2,825 | 182 | ||||||
| 2020 | 2,986 | 183 | ||||||
| 2021 | 3,012 | 186 | ||||||
| Years 2022-2026 | 15,752 | 988 | ||||||
| $ | 29,927 | $ | 1,947 | |||||
| 101 | Overseas Shipholding Group, Inc. |
The expected long-term rate of return on plan assets is based on the current and expected asset allocations. Additionally, the long-term rate of return is based on historical returns, investment strategy, inflation expectations and other economic factors. The expected long-term rate of return is then applied to the market value of plan assets.
The fair values of the Company’s pension plan assets at December 31, 2016, by asset category are as follows:
| Description | Fair Value | Level 1 | ||||||
| Cash and cash equivalents | $ | 742 | $ | 742 | ||||
| Equity securities: | ||||||||
| Large cap exchange traded fund | 12,331 | 12,331 | ||||||
| Small company - mid value | 2,125 | 2,125 | ||||||
| Small company - mid growth | 1,969 | 1,969 | ||||||
| International value | 2,266 | 2,266 | ||||||
| International growth | 2,427 | 2,427 | ||||||
| Fixed Income and Preferred Stock | ||||||||
| Intermediate term bond fund | 10,139 | 10,139 | ||||||
| Small company - mid value - preferred stock | 14 | 14 | ||||||
| Total | $ | 32,013 | $ | 32,013 | ||||
The Maritrans Plan has historically utilized a strategic asset allocation investment strategy that maintains a targeted allocation of 65% equity and 35% fixed income. The allocation is rebalanced periodically after considering anticipated benefit payments.
The Company contributed $0, $0 and $1,063 to the Maritrans Plan in 2016, 2015 and 2014, respectively. The Company expects to make contributions of approximately $1,082 to the Maritrans Plan in 2017.
Employee Savings Plans
The Company also had defined contribution plans covering all eligible employees. Contributions are limited to amounts allowable for income tax purposes. Commencing in 2006, employer contributions include both employer contributions made regardless of employee contributions and matching contributions to the plans. All contributions to the plans are at the discretion of the Company. The contributions to the plan during the three years ended December 31, 2016 were not material.
The Company also has an unfunded, nonqualified supplemental savings plan covering highly compensated U.S. shore-based employees of the Company, which was terminated in connection with the Company’s filing for bankruptcy in 2012. This plan provided for levels of hypothetical employer contributions that would otherwise have been made under the Company’s defined contribution plans in the absence of limitations imposed by income tax regulations. The Company’s unfunded obligations under this plan at December 31, 2016 and 2015 were $741 and $1,147, respectively.
NOTE 18 — OTHER INCOME/(EXPENSE):
Other income/(expense) consists of:
| For the year ended December 31, | 2016 | 2015 | 2014 | |||||||||
| Investment income: | ||||||||||||
| Interest | $ | 534 | $ | 219 | $ | 327 | ||||||
| Gain on sale of investments | 46 | 53 | - | |||||||||
| 580 | 272 | 327 | ||||||||||
| Loss on repurchase of debt | (2,988 | ) | (26,516 | ) | - | |||||||
| Miscellaneous—net | 17 | 5 | 142 | |||||||||
| $ | (2,391 | ) | $ | (26,239 | ) | $ | 469 | |||||
See Note 9, “Debt,” for disclosures relating to loss on repurchase of debt.
| 102 | Overseas Shipholding Group, Inc. |
NOTE 19 — SEVERANCE COSTS AND AGREEMENTS WITH EXECUTIVE OFFICERS:
Severance
Severance related costs are recognized over the period commencing on the date on which the affected employees are notified and ending on the date when required services are completed.
Severance costs for termination benefits and share based compensation costs recognized during the year ended December 31, 2016 were as follows:
| Termination Benefits | Share Based Payment Expense | Total Severance Charges | ||||||||||
| Terminations as a result of spin-off and related restructurings | $ | 8,218 | $ | 4,778 | $ | 12,996 | ||||||
See below for additional discussion on termination agreements with executive officers. Charges relating to employee termination benefits and severance are presented separately in the consolidated statement of operations.
Activity relating to the reserves for the severance arrangements incurred during the year ended December 31, 2016 is summarized as follows:
| Activity for the year ended December 31, 2016: | ||||
| Balance at December 31, 2015 | $ | - | ||
| Provision | 8,218 | |||
| Utilized | (524 | ) | ||
| Balance at December 31, 2016 | $ | 7,694 |
The above table excludes related professional fees which are expensed as incurred.
Agreements with Executive Officers
On December 29, 2016 Captain Ian T. Blackley stepped down from his role as President, Chief Executive Officer and Director of the Company. In connection with his departure from the Company, Captain Blackley entered into a letter agreement with the Company that provides for a general release and waiver of claims against the Company in addition to the payment of certain benefits that were consistent with the terms of his employment agreement, as amended including: (a) a cash payment of $1,350 in substantially equal installments over a period of twenty-four (24) months; (b) a lump sum cash payment of $3,214; (c) a lump sum cash payment of $475 pursuant to the Company’s Retention Bonus Plan; and (d) any benefits to which he is entitled under the Company’s nonqualified supplemental savings plan. Captain Blackley also received accelerated vesting of time-based equity awards. Charges recognized as part of severance costs in relation to the accelerated vesting of his time-based equity awards totaled $2,313. As of December 31, 2016, no severance related amounts had been paid to Captain Blackley.
On December 29, 2016, Mr. Rick Oricchio stepped down from his role as Senior Vice President and Chief Financial Officer of the Company. In connection with his departure, Mr. Oricchio entered into a letter agreement with the Company containing, among other things, a general release and waiver of claims against the Company, in addition to the payment of certain benefits that were consistent with the terms of his employment agreement, as amended including: (a) a cash payment of $475 in substantially equal installments over a period of twelve months; (b) a lump sum cash payment of $1,012; (c) the pro rata portion of Mr. Oricchio’s second anniversary bonus in a lump sum cash payment of $386 and (d) Mr. Oricchio’s annual incentive bonus for fiscal year 2016, to be determined based on actual performance of previously established performance metrics and paid in accordance with the Company’s normal practice. Mr. Oricchio also received accelerated vesting of time-based equity awards. Charges recognized as part of severance costs in relation to the accelerated vesting of his time-based equity awards totaled $1,676. As of December 31, 2016 no severance related amounts had been paid to Mr. Oricchio.
On July 29, 2016, Mr. Henry Flinter retired from his position as President of the Company’s U.S. Flag operations. Pursuant to his employment agreement, as amended on March 30, 2016, all of his unvested stock option awards, time-based RSUs and performance-based RSUs vested in full (per the terms of his agreement, performance-based RSUs vested at target performance) on July 29, 2016. The incremental compensation expense recognized as a result of the difference between the grant date fair value of the vested shares and the fair value of the Company’s Class A common stock on July 29, 2016 was approximately $23. The Human Resources and Compensation Committee of the Company’s Board elected to settle the vested equity awards (with the exception of certain performance-based RSUs that by their terms are not settled until the first quarter of 2018) in cash. Severance costs of approximately $2,238 were recognized during the quarter in relation to Mr. Flinter’s separation from the Company, of which $789 was as a result of the accelerated vesting of his share based compensation awards. In addition, Mr. Flinter is eligible for any benefits to which he is entitled under the Company’s nonqualified supplemental savings plan.
| 103 | Overseas Shipholding Group, Inc. |
On August 11, 2014, Captain Robert E. Johnston, President and Chief Executive Officer of the Company, retired from his positions as Chief Executive Officer and President and ceased to be an employee of the Company. On August 11, 2014, the Company entered into a letter agreement with Captain Johnston, which provided, among other things, that Captain Johnston would serve the Company as a consultant until December 31, 2015 (the “Consulting Period”). In exchange for Captain Johnston’s consulting services, the Company paid Captain Johnston a monthly fee of $56 during the Consulting Period. In addition to severance in the amount of $675 under the Company’s severance plan, pursuant to the letter agreement, Captain Johnston was paid $1,013 with respect to his 2014 bonus and $6,399 in full satisfaction of his entitlement under the Company’s nonqualified supplemental savings plan.
NOTE 20 — 2016 AND 2015 QUARTERLY RESULTS OF OPERATIONS (UNAUDITED):
| Selected Financial Data for the Quarter Ended | March 31, | June 30, | Sept. 30, | Dec. 31, | ||||||||||||
| 2016 | ||||||||||||||||
| Shipping revenues (2) | $ | 115,080 | $ | 118,384 | $ | 114,180 | $ | 114,776 | ||||||||
| Loss on disposal of vessels, including impairments (1) (2) | (14 | ) | (113 | ) | (97,782 | ) | (6,623 | ) | ||||||||
| Income/(loss) from vessel operations (2) | 17,401 | 23,035 | (83,439 | ) | 7,821 | |||||||||||
| Interest expense (2) | (11,917 | ) | (10,862 | ) | (10,607 | ) | (9,765 | ) | ||||||||
| Reorganization items, net (2) | 17,910 | (860 | ) | (5,732 | ) | (393 | ) | |||||||||
| (Provision)/benefit for taxes from continuing operations | (33,235 | ) | (15,075 | ) | 49,755 | 63,653 | ||||||||||
| Income/(loss) from continuing operations | (8,698 | ) | (4,184 | ) | (52,855 | ) | 64,678 | |||||||||
| Income/(loss) from discontinued operations (3) | 59,437 | 34,045 | (45,884 | ) | (340,153 | ) | ||||||||||
| Net income/(loss) | 50,739 | 29,861 | (98,739 | ) | (275,475 | ) | ||||||||||
| Basic and Diluted net income/(loss) per share - Class A from continuing operations | $ | (0.09 | ) | $ | (0.04 | ) | $ | (0.59 | ) | $ | 0.74 | |||||
| Basic and Diluted net income/(loss) per share - Class A from discontinued operations | 0.62 | 0.35 | (0.51 | ) | (3.89 | ) | ||||||||||
| Basic and Diluted net income/(loss) per share - Class B from continuing operations | (0.09 | ) | (0.27 | ) | - | - | ||||||||||
| Basic and Diluted net income/(loss) per share - Class B from discontinued operations | $ | 0.64 | $ | 2.19 | $ | - | $ | - | ||||||||
| (1) | As discussed in Note 6, "Vessels, Deferred Drydock and Other Property" the Company recorded an impairment charge of $97,782 (including $3,873 recorded as a reduction in deferred drydock costs) and $6,623 to write down the carrying values of the seven ATBs to their estimated fair values as of September 30, 2016 and December 31, 2016, respectively, using estimates of discounted future cash flows for each of the vessels (income approach) since the secondhand sale and purchase market for the type of U.S. Flag vessels owned by OSG is not considered to be robust. |
| (2) | Data has been adjusted from amounts previously reported in Form 10-Q to reflect discontinued operations as discussed in Note 1. |
| (3) | As discussed in Note 5, "Discontinued Operations," the Company recorded an impairment charge of $332,562 to write down the carrying values of the INSW disposal group to its fair value, calculated on a held for sale basis, on November 30, 2016. |
| 104 | Overseas Shipholding Group, Inc. |
| Selected Financial Data for the Quarter Ended | March 31, | June 30, | Sept. 30, | Dec. 31, | ||||||||||||
| 2015 | ||||||||||||||||
| Shipping revenues (2) | $ | 116,092 | $ | 121,394 | $ | 110,632 | $ | 118,754 | ||||||||
| Loss on disposal of vessels, including impairments (2) | (93 | ) | - | (53 | ) | (61 | ) | |||||||||
| Income/(loss) from vessel operations (2) | 21,861 | 27,413 | 14,004 | 17,128 | ||||||||||||
| Interest expense (2) | (18,149 | ) | (18,366 | ) | (18,141 | ) | (15,709 | ) | ||||||||
| Reorganization items, net (2) | (3,487 | ) | (1,437 | ) | (1,420 | ) | (1,708 | ) | ||||||||
| (Provision)/benefit for taxes from continuing operations (1) | (2,896 | ) | (3,434 | ) | 120,764 | (13,402 | ) | |||||||||
| Income/(loss) from continuing operations | (2,634 | ) | 4,194 | 113,240 | (34,235 | ) | ||||||||||
| Income/(loss) from discontinued operations (3) | 45,535 | 54,244 | 60,114 | 43,502 | ||||||||||||
| Net income | 42,901 | 58,438 | 173,354 | 9,267 | ||||||||||||
| Basic and Diluted net income/(loss) per share - Class A and Class B from continuing operations | $ | (0.03 | ) | $ | 0.04 | $ | 1.17 | $ | (0.35 | ) | ||||||
| Basic and Diluted net income/(loss) per share - Class A and Class B from discontinued operations | $ | 0.47 | $ | 0.56 | $ | 0.62 | $ | 0.45 | ||||||||
| (1) | As discussed in Note 12, "Taxes," the Company recorded income tax benefits of $120,764 in the third quarter due to a benefit of $150,073 as a result of the Pre-Filing Agreement with the IRS, offset by a tax expense of $30,997 attributable to the excess of the Company’s investment in INSW for financial reporting purposes over the tax basis of such investment as of September 30, 2015. |
| (2) | Data has been adjusted from amounts previously reported in Form 10-Q to reflect discontinued operations as discussed in Note 1. |
| (3) | See Note 5, "Discontinued Operations," for a discussion of the Company’s results of discontinued operations. |
NOTE 21 — CONTINGENCIES:
The Company’s policy for recording legal costs related to contingencies is to expense such legal costs as incurred.
Class Action Lawsuits and Derivative Actions
The Company has fully and finally resolved all potential direct claims by members of the putative class of securities claimants through a settlement effectuated through the Equity Plan, which became effective on August 5, 2014. Under the terms of that settlement, the Equity Plan provides for full satisfaction of the claims of the putative class through (i) $7,000 in cash, which was paid on August 5, 2014, (ii) $3,000 in cash, which was paid by the Company on August 5, 2015, (iii) any remaining cash in the Class E1 Disputed Claims Reserve established by the Equity Plan following resolution of all other Class E1 claims, which was paid on October 5, 2015, (iv) 15% (or $2,136) of the Net Litigation Recovery in the action against Proskauer (described below), which was paid on April 5, 2016, (v) $5,000 in cash, following the entry of a final order resolving the Proskauer action, which was paid on March 17, 2016, and (vi) proceeds of any residual interest the Company has in certain director and officer insurance policies.
The settled claims stem from the Company’s filing of a Form 8-K on October 22, 2012 disclosing that on October 19, 2012 the Audit Committee of the Board of Directors of the Company, on the recommendation of management, concluded that the Company’s previously issued financial statements for at least the three years ended December 31, 2011 and associated interim periods, and for the fiscal quarters ended March 31, 2012 and June 30, 2012, should no longer be relied upon. Shortly thereafter several putative class action suits were filed in the United States District Court for the Southern District of New York (the “Southern District”) against the Company, its then President and Chief Executive Officer, its then Chief Financial Officer, its then current and certain former members of its Board of the Directors, its current independent registered public accounting firm, and underwriters of the Company’s public offering of notes in March 2010 (the “Offering”). The Company’s former independent registered public accounting firm was later added as a defendant. Subsequent to the Company’s filing for relief under Chapter 11, these suits were consolidated and the plaintiffs filed an amended complaint that did not name the Company as a defendant. The consolidated suit was purportedly on behalf of purchasers of Company securities between March 1, 2010 and October 19, 2012 and purchasers of notes in the Offering. The plaintiffs alleged that documents that the Company filed with the SEC were defective, inaccurate and misleading, that the plaintiffs relied on such documents in purchasing the Company’s securities, and that, as a result, the plaintiffs suffered losses. The plaintiffs asserted claims under the Securities Act against all defendants and claims under the Securities Exchange Act of 1934 (the “Exchange Act”) against the then former President and former Chief Financial Officer of the Company. Following additional amendments on plaintiffs’ Exchange Act claims and motion to dismiss briefing, on April 28, 2014, the Southern District denied the motion to dismiss the Exchange Act claims filed by the then former President and former Chief Financial Officer on the third amended complaint. On March 18, 2015, OSG’s former independent registered public accounting firm moved for summary judgment and on May 29, 2015, the Southern District issued an order granting that motion. On July 1, 2015, the plaintiffs noticed an appeal of that order to the U.S. Court of Appeals for the Second Circuit. On September 2, 2015, the plaintiffs and OSG’s former independent registered public accounting firm filed a stipulation withdrawing that appeal with prejudice. On August 6, 2015, the plaintiffs moved for the Southern District to preliminarily approve settlements with respect to all of the plaintiffs’ remaining claims, including settlements with former officers and directors of the Company, the Company’s former underwriters, and the Company’s current independent registered public accounting firm that contemplate payments of $10,500, $4,000 and $1,750, respectively, on behalf of such defendants. On August 12, 2015, the Southern District preliminarily approved those settlements, and on December 2, 2015, entered orders that (a) certified the proposed class for settlement purposes, (b) approved a plan of allocation for distribution of settlement proceeds, (c) finally approved those settlements, and (d) entered final orders of judgment dismissing the remaining defendants from the action.
| 105 | Overseas Shipholding Group, Inc. |
The plaintiffs in the Southern District action filed a proof of claim against the Company in the Bankruptcy Court. Pursuant to a settlement with such plaintiffs and the putative class on whose behalf their claim was filed, their direct claims against the Company were fully and finally resolved based on the Equity Plan treatment described above. Separately, certain of the defendants in the Southern District filed claims in the Bankruptcy Court against the Company for indemnification or reimbursement based on potential losses incurred in connection with such action. Each of those indemnification claims, asserted by certain former directors and officers of the Company, have been released pursuant to the Equity Plan or otherwise resolved by the Reorganized Debtors. In addition, the indemnification claims asserted by the Company’s former underwriters have been resolved and paid pursuant to the orders of the Bankruptcy Court and the Equity Plan. On October 5, 2015, following the resolution of all disputed Class E1 claims, the Reorganized Debtors disbursed the remaining funds in the Disputed Claims Reserve for Class E1 to representatives of the putative class in accordance with the Equity Plan and Confirmation Order. The Equity Plan and orders of the Bankruptcy Court foreclose the defendants in the Southern District from pursuing any other or further remedies against the Company.
Proskauer Action
On February 23, 2014, Proskauer and four of its partners (the “Proskauer Plaintiffs”) filed an action in the Supreme Court of the State of New York, County of New York (the “Supreme Court”) against the then Senior Vice President, General Counsel and Secretary and the former Chief Financial Officer alleging that the defendants engaged in tortious and fraudulent conduct that caused significant harm to the Proskauer Plaintiffs and the Company. The Proskauer Plaintiffs alleged that the defendants made false representations and thereby deceived and misled Proskauer into providing legal advice to the Company, which was the subject of the Company’s malpractice suit against Proskauer and four of its partners filed on November 18, 2013 in the Bankruptcy Court. On May 1, 2014, the defendants in the action filed by the Proskauer Plaintiffs filed motions to dismiss the action. On June 9, 2014, the Proskauer Plaintiffs filed an amended complaint that included certain additional factual allegations and an additional claim against the former Chief Financial Officer of the Company. On July 18, 2014, the defendants filed motions to dismiss the Proskauer Plaintiffs’ amended complaint. On January 15, 2015, the Supreme Court dismissed the Proskauer Plaintiffs’ amended complaint in its entirety against the defendants. On March 2, 2015, the Proskauer Plaintiffs filed a notice of appeal of the Supreme Court’s decision to the Appellate Division of the Supreme Court, First Department (the “Appellate Court”). Proskauer filed its appellant’s brief on August 17, 2015. The appellees filed their response briefs on October 30, 2015 and Proskauer filed its reply brief on November 13, 2015. On February 12, 2016, as part of the settlement agreement between the Company and Proskauer and four of its partners, the Proskauer Plaintiffs agreed to withdraw their appeal of the Supreme Court’s dismissal of the amended complaint against the defendants and on March 31, 2016, the Appellate Court dismissed the appeal.
On February 21, 2014, the Bankruptcy Court declined to hear the Company’s malpractice claims against Proskauer and four of its partners that were filed on November 18, 2013 under the doctrine of permissive abstention, and on March 11, 2014, the Company re-filed its malpractice claims against such defendants in the Supreme Court. On April 11, 2014, Proskauer and four of its partners filed a motion to dismiss the malpractice action, and on September 10, 2014, the Supreme Court denied the motion to dismiss the legal malpractice claim for breach of duty of care but granted the motion to dismiss the legal malpractice claim for breach of duty of loyalty as subsumed within the duty of care claim. Proskauer and four of its partners appealed this decision to the Appellate Division of the Supreme Court, First Department and on July 2, 2015, the appellate court affirmed the Supreme Court’s denial of Proskauer’s motion to dismiss. In addition, on December 3, 2014, the Company filed a motion with the Supreme Court for partial summary judgment on whether the “joint and several” liability provisions of certain of the Company’s prior loan agreements, which were the focus of the malpractice action, were unambiguous as a matter of law. The Supreme Court denied that motion as being procedurally premature on July 24, 2015.
On May 20, 2015, the Supreme Court issued a scheduling order for discovery in the Company’s malpractice action against Proskauer. Under the terms of that scheduling order, all discovery was to be completed by April 15, 2016. On October 16, 2015, the parties agreed to extend the deadline for all discovery to be completed to August 1, 2016, and the Court issued a revised scheduling order.
| 106 | Overseas Shipholding Group, Inc. |
On February 12, 2016, the Company entered into an agreement with Proskauer and four of its partners to settle the malpractice suit. See Note 2, “Chapter 11 Filing and Emergence from Bankruptcy,” for additional information.
On March 3, 2016, pursuant to the settlement agreement with Proskauer, the Supreme Court entered an order discontinuing the Proskauer action with prejudice, which order has become final and nonappealable.
SEC Investigation
On November 13, 2012, the Company received from the staff of the SEC’s Division of Enforcement (the “Staff”) a request for documents relating to the statements in the Company’s October 22, 2012 Form 8-K. On January 29, 2013, the SEC issued a formal order of private investigation of the Company. The Company provided documents to the SEC and cooperated fully with the SEC’s investigation.
On July 25, 2016, the staff of the SEC provided a “Wells Notice” to the Company’s counsel in connection with the above-referenced investigation, advising that the staff had made a preliminary determination to recommend that the Commission file an enforcement action against the Company.
On January 23, 2017, the SEC commenced an administrative proceeding, with the Company’s consent, that fully resolved the SEC’s investigation. The Company neither admitted nor denied the SEC’s allegations that the Company violated certain provisions of the Securities Act, the Exchange Act and related rules. After receiving Bankruptcy Court approval, the Company paid a $5 million civil penalty relating to the investigation in February 2017, which was fully accrued as of December 31, 2016. The agreement does not require any further changes to the Company’s historical financial statements. Any indemnification or contribution claims by officers or directors of the Company that could be asserted in connection with the SEC’s investigation have been released or otherwise resolved pursuant to the Equity Plan and order of the Bankruptcy Court.
Legal Proceedings Arising in the Ordinary Course of Business
The Company is a party, as plaintiff or defendant, to various suits in the ordinary course of business for monetary relief arising principally from personal injuries (including without limitation exposure to asbestos and other toxic materials), wrongful death, collision or other casualty and to claims arising under charter parties. A substantial majority of such personal injury, wrongful death, collision or other casualty claims against the Company are covered by insurance (subject to deductibles not material in amount). Each of the claims involves an amount which, in the opinion of management, are not expected to be material to the Company’s financial position, results of operations and cash flows.
| 107 | Overseas Shipholding Group, Inc. |
REPORT OF INDEPENDENT REGISTERED PUBLIC ACCOUNTING FIRM
To the Board of Directors and Shareholders of
Overseas Shipholding Group, Inc.
In our opinion, the accompanying consolidated balance sheets and the related consolidated statements of operations, comprehensive income/(loss), changes in equity/(deficit) and cash flows present fairly, in all material respects, the financial position of Overseas Shipholding Group, Inc. and its subsidiaries at December 31, 2016 and 2015, and the results of their operations and their cash flows for each of the three years in the period ended December 31, 2016 in conformity with accounting principles generally accepted in the United States of America. In addition, in our opinion, the financial statement schedule listed in the index appearing under Item 15(a)(2), presents fairly, in all material respects, the information set forth therein when read in conjunction with the related consolidated financial statements. Also in our opinion, the Company maintained, in all material respects, effective internal control over financial reporting as of December 31, 2016, based on criteria established in Internal Control - Integrated Framework (2013) issued by the Committee of Sponsoring Organizations of the Treadway Commission (COSO). The Company's management is responsible for these financial statements and financial statement schedule, for maintaining effective internal control over financial reporting and for its assessment of the effectiveness of internal control over financial reporting, included in Management's Report on Internal Control over Financial Reporting appearing under item 9A. Our responsibility is to express opinions on these financial statements, on the financial statement schedule, and on the Company's internal control over financial reporting based on our integrated audits. We conducted our audits in accordance with the standards of the Public Company Accounting Oversight Board (United States). Those standards require that we plan and perform the audits to obtain reasonable assurance about whether the financial statements are free of material misstatement and whether effective internal control over financial reporting was maintained in all material respects. Our audits of the financial statements included examining, on a test basis, evidence supporting the amounts and disclosures in the financial statements, assessing the accounting principles used and significant estimates made by management, and evaluating the overall financial statement presentation. Our audit of internal control over financial reporting included obtaining an understanding of internal control over financial reporting, assessing the risk that a material weakness exists, and testing and evaluating the design and operating effectiveness of internal control based on the assessed risk. Our audits also included performing such other procedures as we considered necessary in the circumstances. We believe that our audits provide a reasonable basis for our opinions.
A company’s internal control over financial reporting is a process designed to provide reasonable assurance regarding the reliability of financial reporting and the preparation of financial statements for external purposes in accordance with generally accepted accounting principles. A company’s internal control over financial reporting includes those policies and procedures that (i) pertain to the maintenance of records that, in reasonable detail, accurately and fairly reflect the transactions and dispositions of the assets of the company; (ii) provide reasonable assurance that transactions are recorded as necessary to permit preparation of financial statements in accordance with generally accepted accounting principles, and that receipts and expenditures of the company are being made only in accordance with authorizations of management and directors of the company; and (iii) provide reasonable assurance regarding prevention or timely detection of unauthorized acquisition, use, or disposition of the company’s assets that could have a material effect on the financial statements.
Because of its inherent limitations, internal control over financial reporting may not prevent or detect misstatements. Also, projections of any evaluation of effectiveness to future periods are subject to the risk that controls may become inadequate because of changes in conditions, or that the degree of compliance with the policies or procedures may deteriorate.
/s/PricewaterhouseCoopers LLP
New York, New York
March 9, 2017
| 108 | Overseas Shipholding Group, Inc. |
ITEM 9. CHANGES IN AND DISAGREEMENTS WITH ACCOUNTANTS ON ACCOUNTING AND FINANCIAL DISCLOSURE
None.
ITEM 9A. CONTROLS AND PROCEDURES
| (a) | Evaluation of disclosure controls and procedures |
As of the end of the period covered by this Annual Report on Form 10-K, an evaluation was performed under the supervision and with the participation of the Company’s management, including the Chief Executive Officer (“CEO”) and Chief Financial Officer (“CFO”), of the effectiveness of the design and operation of the Company’s disclosure controls and procedures as defined in Rules 13a-15(e) and 15d-15(e) under the Securities Exchange Act of 1934, as amended (the “Exchange Act”). Based on that evaluation, the Company’s CEO and CFO concluded that the Company’s disclosure controls and procedures were effective as of December 31, 2016 to ensure that information required to be disclosed by the Company in the reports the Company files or submits under the Exchange Act is (i) recorded, processed, summarized and reported, within the time periods specified in the Securities and Exchange Commission’s rules and forms, and (ii) accumulated and communicated to the Company’s management, including the CEO and CFO, as appropriate to allow timely decisions regarding required disclosure.
| (b) | Management’s report on internal control over financial reporting |
Management of the Company is responsible for the establishment and maintenance of adequate internal control over financial reporting for the Company. Internal control over financial reporting, as defined in Rules 13a-15(f) and 15d-15(f) of the Exchange Act, is a process designed to provide reasonable assurance regarding the reliability of financial reporting and the preparation of financial statements for external purposes in accordance with generally accepted accounting principles. The Company’s system of internal control over financial reporting includes those policies and procedures that (i) pertain to the maintenance of records that, in reasonable detail, accurately and fairly reflect the transactions and dispositions of the assets of the Company; (ii) provide reasonable assurance that transactions are recorded as necessary to permit preparation of financial statements in accordance with generally accepted accounting principles, and that receipts and expenditures of the Company are being made only in accordance with authorizations of management and directors of the Company; and (iii) provide reasonable assurance regarding prevention or timely detection of unauthorized acquisition, use, or disposition of the Company’s assets that could have a material effect on the financial statements.
Because of its inherent limitations, internal control over financial reporting may not prevent or detect misstatements. Projections of any evaluation of effectiveness to future periods are subject to the risk that controls may become inadequate because of changes in conditions, or that the degree of compliance with the policies or procedures may deteriorate.
Management, with participation of the CEO and CFO, has performed an evaluation of the effectiveness of the Company’s internal control over financial reporting as of December 31, 2016, based on the provisions of “Internal Control—Integrated Framework (2013)” issued by the Committee of Sponsoring Organizations of the Treadway Commission (“COSO”). Management has concluded the Company’s internal control over financial reporting was effective as of December 31, 2016.
The effectiveness of the Company’s internal control over financial reporting as of December 31, 2016 has been audited by PricewaterhouseCoopers LLP, the Company’s independent registered public accounting firm, as stated in their report included in Item 8, “Financial Statements and Supplementary Data.”
| (c) | Changes in Internal Control over Financial Reporting |
There was no change in the Company’s internal control over financial reporting during the fourth quarter of fiscal year 2016 that has materially affected, or is reasonably likely to materially affect, the Company’s internal control over financial reporting.
None.
| 109 | Overseas Shipholding Group, Inc. |
Dollar amounts in Part III are expressed in whole dollars unless otherwise noted.
ITEM 10. DIRECTORS, EXECUTIVE OFFICERS AND CORPORATE GOVERNANCE
See Item 14 below.
Executive Officers
The table below sets forth the name and age of each executive officer of the Company and the date such executive officer was elected to his current position with the Company. The term of office of each executive officer continues until the first meeting of the Board of Directors of the Company immediately following the next annual meeting of its stockholders, and until the election and qualification of his or her successor. There is no family relationship between the executive officers.
| Name | Age | Position Held | Has
Served as Such Since | |||
| Samuel H. Norton | 58 | President and CEO | December 2016 | |||
| Christopher Wolf | 55 | Senior Vice President and Chief Financial Officer | December 2016 | |||
| Susan Allan | 54 | Vice President, Secretary and General Counsel | November 2016 | |||
| Patrick O’Halloran | 47 | Vice President and Chief Operations Officer | December 2016 | |||
| Damon Mote | 49 | Vice President and Chief Administrative Officer | December 2016 |
Samuel H. Norton was appointed CEO and President of OSG in December 2016. Prior to this, he served as Senior Vice President of OSG and President and CEO of the U.S. Flag Strategic Business Unit from July 2016 and has served on the Company’s Board of Directors since August 2014. Prior to joining OSG, Mr. Norton Co-Founded SeaChange Maritime, LLC in 2006 and served as its Chairman and Chief Executive Officer. Mr. Norton spent the seventeen-year period ending July 2005 as a senior executive officer at Tanker Pacific Management (Singapore) Pte. Ltd. In 1995, Mr. Norton initiated and led the entry of the Sammy Ofer Group into the container segment, and acquired and operated the first container vessels in the group's fleet. While at Tanker Pacific, Mr. Norton also conceived and started a related business, Tanker Pacific Offshore Terminals (TPOT), which owns and operates a fleet of floating, offshore oil storage terminals (FSO). Prior to joining the Ofer group, Mr. Norton played a lead role in the Asian distressed assets group of the First National Bank of Boston, a position which acquainted him with the shipping industry and the Ofer family. Mr. Norton holds a BA in Chinese Language and Literature from Dartmouth College where he graduated in 1981.
Christopher Wolf was appointed as the Senior Vice President and Chief Financial Officer of OSG in December 2016. Mr. Wolf has extensive experience as a Chief Financial Officer, having served in this role at several companies—both publicly-listed as well as privately-owned—including most recently at Higher One Holdings, Inc., a publicly-traded provider of technology-based refund disbursement, payment processing and data analytics services to higher education institutions and students, where he worked from 2013 to 2016. Earlier in his career, Mr. Wolf was a Chief Financial Officer at Acxiom Corporation and Catalina Marketing. He began his career at Arthur Andersen, LLP. Mr. Wolf has a Bachelor of Science degree in Accounting from Florida State University and a Master of Accounting from the University of North Carolina. He is a licensed CPA.
Susan Allan joined OSG in November 2016 as OSG's Vice President, General Counsel and Corporate Secretary. Ms. Allan has extensive experience in corporate governance and SEC matters from her positions as Vice President, Assistant Corporate Secretary at Jabil Circuit, Inc. since 2009, and as Director, Senior Counsel at Tech Data Corporation from 1997 to 2009. Prior to that, Ms. Allan worked as Director, Senior Counsel at Anchor Glass Container, as an Assistant County Attorney in the Hillsborough County Attorney's Office, and as an associate attorney at Barkan and Neff law firm, all in Tampa. Ms. Allan received her law degree from the University of Southern California Gould School of Law in Los Angeles and her undergraduate degree from George Mason University.
Patrick O’Halloran was appointed as Vice President and Chief Operations Officer of OSG in December 2016 with oversight of all operations, maintenance, SQE and commercial operations for the Company’s Fleet. Most recently, Mr. O’Halloran served as Vice President Marine Operations for the Company since December 2014. Mr. O’Halloran joined OSG in November 2006 as Fleet Manager as part of the acquisition of Maritrans Inc., where he served as Fleet Maintenance Manager. He joined Maritrans, Inc. in 2002 as Technical Superintendent. Prior to joining Maritrans, Mr. O’Halloran was a Surveyor for the American Bureau of Shipping for ten years. Mr. O’Halloran holds a Bachelor of Science degree in Mechanical Engineering from State University of New York – Maritime College and a Master’s in Business Administration from the University of South Florida. He sits on the Board of Directors for Alaska Tanker Company LLC, and the Chamber of Shipping of America.
| 110 | Overseas Shipholding Group, Inc. |
Damon Mote was appointed as Vice President and Chief Administrative Officer of OSG in December 2016 with oversight of the Company’s marine labor relations, human resources, and insurance functions. Most recently, Mr. Mote served as Vice President of Marine Labor Relations since December 2014. Mr. Mote joined the Company in 2004 as Manager, Major Projects and then served as Director, New Construction beginning in 2006. In 2011 he was appointed as the Regional Manager of the Technical Services Group, which included responsibilities for engineering, purchasing, and the fleet management software system. Prior to joining OSG, he worked for fourteen years with Crowley Maritime. Mr. Mote holds a Bachelor of Science in Marine Engineering from California Maritime Academy.
Code of Business Conduct and Ethics
The Company has adopted a code of business conduct and ethics which is an integral part of the Company’s business conduct compliance program and embodies the commitment of the Company and its subsidiaries to conduct operations in accordance with the highest legal and ethical standards. The Code of Business Conduct and Ethics applies to all of the Company’s officers, directors and employees. Each is responsible for understanding and complying with the Code of Business Conduct and Ethics. The Company also has an Insider Trading Policy which prohibits the Company’s directors and employees from purchasing or selling securities of the Company while in possession of material nonpublic information or otherwise using such information for their personal benefit. The Insider Trading Policy also prohibits the Company directors and employees from hedging their ownership of securities of the Company. In addition, the Company has an Anti-Bribery and Corruption Policy which memorializes the Company’s commitment to adhere faithfully to both the letter and spirit of all applicable anti-bribery legislation in the conduct of the Company’s business activities worldwide. The Code of Business Conduct and Ethics, the Insider Trading Policy and the Anti-Bribery and Corruption Policy are posted on the Company’s website, which is www.osg.com, and are available in print upon the request of any stockholder of the Company. The Company’s website and the information contained on that site, or connected to that site, are not incorporated by reference in this Annual Report on Form 10-K.
ITEM 11. EXECUTIVE COMPENSATION
See Item 14 below.
ITEM 12. SECURITY OWNERSHIP OF CERTAIN BENEFICIAL OWNERS AND MANAGEMENT AND RELATED STOCKHOLDER MATTERS
The following table provides information as of December 31, 2016 with respect to the Company’s equity compensation plans, which have been approved by the Company’s shareholders. For a description of the material features of the Company’s equity compensation plans, see Note 14, “Capital Stock and Stock Compensation,” to the consolidated financial statements set forth in Item 8, “Financial Statements and Supplementary Data.”
| Number of Securities to be issued upon exercise of outstanding options, warrants and rights | Weighted-average exercise price of outstanding options, warrants and rights | Number of securities remaining available for future issuance under equity compensation plans (excluding securities reflected in column (a)) | ||||||||||
| Plan Category | (a) | (b) | (c) | |||||||||
| Equity compensation plans approved by security holders | 1,114,103 | 6.69 | 3,641,791 | * | ||||||||
| * | Consists of 3,471,605 Class A shares eligible to be granted under the Company’s 2014 Management Incentive Compensation Plan and 170,186 shares under the 2014 Non-Employee Director Incentive Compensation Plan. |
| 111 | Overseas Shipholding Group, Inc. |
See also Item 14 below.
ITEM 13. CERTAIN RELATIONSHIPS AND RELATED TRANSACTIONS, AND DIRECTOR INDEPENDENCE
See Item 14 below.
ITEM 14. PRINCIPAL ACCOUNTANT FEES AND SERVICES
Except for the table in Item 12 above, the information called for under Items 10, 11, 12, 13 and 14 is incorporated herein by reference from the definitive Proxy Statement to be filed by the Company in connection with its 2017 Annual Meeting of Stockholders.
ITEM 15. EXHIBITS, FINANCIAL STATEMENT SCHEDULES
| (a)(1) | The following consolidated financial statements of the Company are filed in response to Item 8. |
| Consolidated Balance Sheets at December 31, 2016 and 2015. | |
| Consolidated Statements of Operations for the Years Ended December 31, 2016, 2015 and 2014. | |
| Consolidated Statements of Comprehensive Income/(Loss) for the Years Ended December 31, 2016, 2015 and 2014. | |
| Consolidated Statements of Cash Flows for the Years Ended December 31, 2016, 2015 and 2014. | |
| Consolidated Statements of Changes in Equity for the Years Ended December 31, 2016, 2015 and 2014. | |
| Notes to Consolidated Financial Statements. | |
| Report of Independent Registered Public Accounting Firm. | |
| (a)(2) | I – Condensed Financial Information of Parent Company |
| All other schedules of the Company have been omitted since they are not applicable or are not required. | |
| (a)(3) | The following exhibits are included in response to Item 15(b): |
| 2.1 | Separation and Distribution Agreement, dated as of November 30, 2016, by and between Overseas Shipholding Group, Inc. and International Seaways, Inc. (filed as Exhibit 2.1 to the Registrant’s Current Report on Form 8-K dated December 2, 2016 and incorporated herein by reference). |
| 3.1 | Amended and Restated Certificate of Incorporation of the Registrant (filed as Exhibit 3.1 to the Registrant’s Quarterly Report on Form 10-Q dated August 9, 2016 and incorporated herein by reference). |
| 3.2 | Amended and Restated Bylaws of the Registrant (filed as Exhibit 3.2 to the Registrant’s Current Report on Form 8-K filed on August 8, 2014, dated August 5, 2014 and incorporated herein by reference). |
| 4.1 | Class A Warrant Agreement, dated as of August 5, 2014, between the Registrant and Computershare Trust Company, N.A., as Warrant Agent (filed as Exhibit 4.1 to Registrant’s Current Report on Form 8-K filed on August 8, 2014, dated August 5, 2014 and incorporated herein by reference). |
| 4.2 | Form of Class A Warrant Certificate (included in Exhibit 4.1). |
| 4.3 | Class B Warrant Agreement, dated as of August 5, 2014, between the Registrant and Computershare Trust Company, N.A, as Warrant Agent (filed as Exhibit 4.2 to Registrant’s Current Report on Form 8-K filed on August 8, 2014, dated August 5, 2014 and incorporated herein by reference). |
| 4.4 | Form of Class B Warrant Certificate (included in Exhibit 4.3). |
| 112 | Overseas Shipholding Group, Inc. |
| 4.5 | Registration Rights Agreement, dated as of May 2, 2014, between the Registrant and certain stockholders party thereto (filed as Exhibit 4.5 to Registrant’s Registration Statement on Form S-1 filed on August 20, 2014 and incorporated herein by reference). |
| 4.6 | Amendment to Registration Rights Agreement, dated as of May 26, 2014, between the Registrant and certain stockholders party thereto (filed as Exhibit 4.6 to Registrant’s Statement on Form S-1 filed on August 20, 2014 and incorporated herein by reference). |
| 4.7 | Indenture dated as of March 7, 2003 between the Registrant and Wilmington Trust Company, as trustee, providing for the issuance of debt securities of the Registrant from time to time (filed as Exhibit 4(e)(1) to the Registrant’s Registration Statement on Form S-4 filed May 5, 2003 and incorporated herein by reference). Such Indenture is hereby modified, effective as of January 13, 2004, by deleting all references therein to “Wilmington Trust Company”, “March 7, 2003” and any specific day, month and/or year and substituting therefore blank spaces. |
| 4.8 | Form of First Supplemental Indenture dated as of February 19, 2004 between the Registrant and Wilmington Trust Company, as trustee (filed as Exhibit 4.1 to the Registrant’s Current Report on Form 8-K dated February 18, 2004 and incorporated herein by reference). |
| 4.9 | Second Supplemental Indenture dated as of August 5, 2014 between the Registrant and Wilmington Trust Company, as trustee (filed as Exhibit 4.3 to Registrant’s Current Report on Form 8-K dated August 8, 2014 and incorporated herein by reference). |
| 4.10 | Third Supplemental Indenture dated as of August 5, 2014 between the Registrant and Wilmington Trust Company, as trustee (filed as Exhibit 4.4 to Registrant’s Current Report on Form 8-K dated August 8, 2014 and incorporated herein by reference). |
| 4.11 | Fifth Supplemental Indenture, dated as of December 16, 2015, relating to the 7.50% Senior Notes I due 2021, between Overseas Shipholding Group, Inc. and Wilmington Trust Company, as Trustee (filed as Exhibit 4.2 to Registrant’s Current Report on Form 8-K dated December 16, 2015 and incorporated herein by reference). |
| 4.12 | Sixth Supplemental Indenture, dated as of December 16, 2015, relating to the 7.50% Senior Notes II due 2021, between Overseas Shipholding Group, Inc. and Wilmington Trust Company, as Trustee (filed as Exhibit 4.3 to Registrant’s Current Report on Form 8-K dated December 16, 2015 and incorporated herein by reference) |
| 4.13 | Indenture dated as of March 29, 2010, between the Registrant and the Bank of New York Mellon, as trustee, for the issuance of debt securities of the Registrant from time to time (filed as Exhibit 4.1 to the Registrant’s Current Report on Form 8-K dated March 29, 2010 and incorporated herein by reference). |
| 4.14 | Form of 8 1/8% Senior Notes due 2018 of the Registrant (filed as Exhibit 4.2 to the Registrant’s Current Report on Form 8-K dated March 29, 2010 and incorporated herein by reference). |
| 4.15 | First Supplemental Indenture, dated as of December 16, 2015, relating to the 8.125% Senior Notes due 2018, between Overseas Shipholding Group, Inc. and The Bank of New York Mellon, as Trustee (filed as Exhibit 4.1 to Registrant’s Current Report on Form 8-K dated December 16, 2015 and incorporated herein by reference). |
| 10.1 | ABL Credit Agreement dated as of August 5, 2014, among the Registrant, OSG Bulk Ships, Inc. (“OBS”), certain subsidiaries of OBS as other guarantors, various lenders, Jefferies Finance LLC, Barclays Bank PLC and UBS Securities LLC, as joint lead arrangers and joint book running managers, Wells Fargo Bank, National Association, as administrative agent, Barclays Bank PLC and UBS Securities LLC, as co-documentation agents, Jefferies Finance LLC, as syndication agent, Wells Fargo Bank, National Association, as collateral agent and mortgage trustee, swingline lender and issuing bank (the “ABL Credit Agreement”) (filed as Exhibit 10.1 to Registrant’s Registration Statement on Form S-1 filed on August 20, 2014 and incorporated herein by reference). |
| 10.2 | First Amendment, dated as of June 3, 2015, to the ABL Credit Agreement (filed as Exhibit 10.1 to Registrant’s Current Report on Form 8-K dated June 9, 2015 and incorporated herein by reference). |
| 10.3 | DTL Credit Agreement dated as of August 5, 2014, among the Registrant, OBS, certain subsidiaries of OBS as other guarantors, various lenders, Jefferies Finance LLC, Barclays Bank PLC and UBS Securities LLC, as joint lead arrangers and joint book running managers, Jefferies Finance LLC, as administrative agent, Barclays Bank PLC and UBS Securities LLC, as co-documentation agents, Jefferies Finance LLC, as syndication agent, collateral agent and mortgage trustee (the “DTL Credit Agreement”) (filed as Exhibit 10.2 to Registrant’s Registration Statement on Form S-1 filed on August 20, 2014 and incorporated herein by reference). |
| 113 | Overseas Shipholding Group, Inc. |
| 10.4 | First Amendment, dated as of June 3, 2015, to the DTL Credit Agreement (filed as Exhibit 10.2 to Registrant’s Current Report on Form 8-K dated June 9, 2015 and incorporated herein by reference). |
| *10.5 | Supplemental Executive Savings Plan of the Registrant dated as of December 22, 2005, as amended by Amendment One effective as of January 1, 2006 (filed as Exhibit 10(iii)(a) to the Registrant’s Annual Report on Form 10-K for 2008 and incorporated herein by reference). |
| *10.6 | Form of Director Indemnity Agreement for the directors of the Registrant (filed as Exhibit 10.8 to Registrant’s Registration Statement on Form S-1 filed on August 20, 2014 and incorporated herein by reference). |
| 10.7 | Incentive Compensation Recoupment Policy for Executive Officers (filed as Exhibit 99.2 to the Registrant’s Current Report on Form 8-K dated January 25, 2010 and incorporated herein by reference). |
| *10.8 | Engagement letter dated as of November 1, 2012 by and between the Registrant and Greylock Partners, LLC (filed as Exhibit 99.2 to the Registrant’s Current Report on Form 8-K dated November 14, 2012 and incorporated herein by reference). |
| *10.9 | Engagement letter dated as of August 6, 2014 by and between Registrant and Greylock Partners, LLC (filed as Exhibit 10.12 to Amendment No. 1 to Registrant’s Registration Statement on Form S-1 filed on September 30, 2014 and incorporated herein by reference). |
| *10.10 | Severance Plan of the Registrant effective April 1, 2013 (filed as Exhibit 10.11 to the Registrant's Annual Report on Form 10-K for the year ended December 31, 2014 and incorporated herein by reference). |
| *10.11 | Management Incentive Compensation Plan (filed as Exhibit 10.1 to the Registrant's Current Report on Form 8-K dated September 23, 2014 and incorporated herein by reference). |
| *10.12 | Non-Employee Director Incentive Compensation Plan (filed as Exhibit 10.2 to the Registrant's Current Report on Form 8-K dated September 23, 2014 and incorporated herein by reference). |
| *10.13 | Management Incentive Compensation Plan Stock Option Grant Agreement (Subject to shareholder approval) (filed as Exhibit 10.3 to the Registrant's Current Report on Form 8-K dated September 23, 2014 and incorporated herein by reference). |
| *10.14 | Management Incentive Compensation Plan Stock Option Grant Agreement (Not subject to shareholder approval) (filed as Exhibit 10.4 to the Registrant's Current Report on Form 8-K dated September 23, 2014 and incorporated herein by reference). |
| *10.15 | Management Incentive Compensation Plan Restricted Stock Unit Grant Agreement (Subject to shareholder approval) (filed as Exhibit 10.5 to the Registrant's Current Report on Form 8-K dated September 23, 2014 and incorporated herein by reference). |
| *10.16 | Management Incentive Compensation Plan Restricted Stock Unit Grant Agreement (Not subject to shareholder approval) (filed as Exhibit 10.6 to the Registrant's Current Report on Form 8-K dated September 23, 2014 and incorporated herein by reference). |
| *10.17 | Form of Officers Indemnity Agreement for the officers of the Registrant (filed as Exhibit 10.18 to the Registrant's Annual Report on Form 10-K for the year ended December 31, 2014 and incorporated herein by reference). |
| *10.18 | Employment Agreement dated as of September 29, 2014 between the Registrant and an executive (filed as Exhibit 10.13 to the Registrant's Quarterly Report on Form 10-Q for the quarter ended September 30, 2014 and incorporated herein by reference). |
| *10.19 | Employment Agreement dated as of September 29, 2014 between the Registrant and an executive (filed as Exhibit 10.14 to the Registrant's Quarterly Report on Form 10-Q for the quarter ended September 30, 2014 and incorporated herein by reference). |
| *10.20 | Employment Agreement dated as of September 29, 2014 between the Registrant and an executive (filed as Exhibit 10.15 to the Registrant's Quarterly Report on Form 10-Q for the quarter ended September 30, 2014 and incorporated herein by reference).
|
| *10.21 | Employment Agreement dated as of September 29, 2014 between the Registrant and an executive (filed as Exhibit 10.22 to the Registrant's Annual Report on Form 10-K for the year ended December 31, 2014 and incorporated herein by reference). |
| 114 | Overseas Shipholding Group, Inc. |
| *10.22 | Employment Agreement dated as of September 29, 2014 between the Registrant and an executive (filed as Exhibit 10.23 to the Registrant's Annual Report on Form 10-K for the year ended December 31, 2014 and incorporated herein by reference). |
| *10.23 | Amendment No. 1 dated as of March 2, 2015 to Employment Agreement dated as of September 29, 2014 between the Registrant and an executive (filed as Exhibit 10.24 to the Registrant's Annual Report on Form 10-K for the year ended December 31, 2014 and incorporated herein by reference). |
| *10.24 | Employment Agreement dated as of December 19, 2014 between the Registrant and an executive (filed as Exhibit 10.25 to the Registrant's Annual Report on Form 10-K for the year ended December 31, 2014 and incorporated herein by reference). |
| *10.25 | Employment Agreement dated as of January 20, 2015 between the Registrant and an executive (filed as Exhibit 10.26 to the Registrant's Annual Report on Form 10-K for the year ended December 31, 2014 and incorporated herein by reference). |
| *10.26 | Employment Agreement dated as of February 13, 2015 between the Registrant and an executive (filed as Exhibit 10.29 to the Registrant's Annual Report on Form 10-K for the year ended December 31, 2014 and incorporated herein by reference). |
| *10.27 | Letter Agreement dated as of August 31, 2015 between the Registrant and a former director (filed as Exhibit 10.1 to the Registrant's Quarterly Report on Form 10-Q for the quarter ended September 30, 2014 and incorporated herein by reference). |
| *10.28 | Letter Agreement dated as of August 31, 2015 between the Registrant and a former director (filed as Exhibit 10.2 to the Registrant's Quarterly Report on Form 10-Q for the quarter ended September 30, 2014 and incorporated herein by reference). |
| *10.29 | Letter Agreement dated March 22, 2013 with an executive officer (filed as Exhibit 10.1 to the Registrant’s Current Report on Form 8-K dated March 22, 2013 and incorporated herein by reference) (superseded by the Letter Agreement dated August 11, 2014, filed as Exhibit 10.32 hereto). |
| *10.30 | Letter Agreement dated August 11, 2014 with an executive officer (filed as Exhibit 10.7 to Registrant’s Registration Statement on Form S-1 filed on August 20, 2014 and incorporated herein by reference). |
| *10.31 | Settlement, Release and Indemnity Agreement dated as of February 3, 2015 between the Registrant, certain subsidiaries of the Registrant and an executive (filed as Exhibit 10.27 to the Registrant's Annual Report on Form 10-K for the year ended December 31, 2014 and incorporated herein by reference). |
| *10.32 | Amendment No. 1 dated as of March 30, 2016 to Employment Agreement dated as of September 29, 2014 between the Registrant and an executive (filed as Exhibit 10.2 to the Registrant's Current Report on Form 8-K dated April 5, 2016 and incorporated herein by reference). |
| *10.33 | Amendment No. 2 dated as of August 3, 2016 to Employment Agreement dated as of September 29, 2014 between the Registrant and an executive (filed as Exhibit 10.7 to the Registrant's Quarterly Report on Form 10-Q for the quarter ended September 30, 2016 and incorporated herein by reference). |
| *10.34 | Amendment No. 3 dated as of November 7, 2016 to Employment Agreement dated as of September 29, 2014 between the Registrant and an executive (filed as Exhibit 10.2 to the Registrant’s Current Report on Form 8-K dated November 14, 2016 and incorporated herein by reference). |
| *10.35 | Amendment No. 1 dated as of March 30, 2016 to Employment Agreement dated as of February 13, 2015 between the Registrant and an executive (filed as Exhibit 10.4 to the Registrant's Current Report on Form 8-K dated April 5, 2016 and incorporated herein by reference). |
| *10.36 | Amendment No. 2 dated as of August 3, 2016 to Employment Agreement dated as of February 13, 2015 between the Registrant and an executive (filed as Exhibit 10.8 to the Registrant's Quarterly Report on Form 10-Q for the quarter ended September 30, 2016 and incorporated herein by reference). |
| 115 | Overseas Shipholding Group, Inc. |
| *10.37 | Amendment No. 3 dated as of November 7, 2016 to Employment Agreement dated as of February 13, 2015 between the Registrant and an executive (filed as Exhibit 10.1 to the Registrant’s Current Report on Form 8-K dated November 14, 2016 and incorporated herein by reference). |
| *10.38 | Amendment No. 1 dated as of March 30, 2016 to Employment Agreement dated as of September 29, 2014 between the Registrant and an executive (filed as Exhibit 10.1 to the Registrant's Current Report on Form 8-K dated April 5, 2016 and incorporated herein by reference). |
| *10.39 | Amendment No. 2 dated as of August 3, 2016 to Employment Agreement dated as of September 29, 2014 between the Registrant and an executive (filed as Exhibit 10.6 to the Registrant's Quarterly Report on Form 10-Q for the quarter ended September 30, 2016 and incorporated herein by reference). |
| *10.40 | Letter Agreement dated November 7, 2016 with an executive officer (filed as Exhibit 10.3 to Registrant’s Current Report on Form 8-K dated November 14, 2016 and incorporated herein by reference). |
| *10.41 | Amendment No. 1 dated as of March 30, 2016 to Employment Agreement dated as of December 19, 2014 between the Registrant and an executive (filed as Exhibit 10.5 to the Registrant's Current Report on Form 8-K dated April 5, 2016 and incorporated herein by reference). |
| *10.42 | Amendment No. 2 dated as of August 3, 2016 to Employment Agreement dated as of December 19, 2014 between the Registrant and an executive (filed as Exhibit 10.9 to the Registrant's Quarterly Report on Form 10-Q for the quarter ended September 30, 2016 and incorporated herein by reference). |
| *10.43 | Letter Agreement dated November 7, 2016 with an executive officer (filed as Exhibit 10.4 to Registrant’s Current Report on Form 8-K dated November 14, 2016 and incorporated herein by reference). |
| *10.44 | Amendment No. 1 dated as of March 30, 2016 to Employment Agreement dated as of September 29, 2014 between the Registrant and an executive (filed as Exhibit 10.3 to the Registrant's Current Report on Form 8-K dated April 5, 2016 and incorporated herein by reference). |
| *10.45 | Separation Agreement dated July 29, 2016 between the Registrant and a former executive (filed as Exhibit 10.4 to the Registrant's Quarterly Report on Form 10-Q for the quarter ended September 30, 2016 and incorporated herein by reference). |
| *10.46 | Employment Agreement dated as of July 17, 2016 between the Registrant and an executive (filed as Exhibit 10.5 to the Registrant's Quarterly Report on Form 10-Q for the quarter ended September 30, 2016 and incorporated herein by reference). |
| *10.47** | Employment Agreement dated as of November 10, 2016 between the Registrant and an executive. |
| *10.48** | Employment Agreement dated as of November 29, 2016 between the Registrant and an executive. |
| *10.49** | Amendment No. 1 to Employment Agreement dated as of December 12, 2016 between the Registrant and an executive. |
| 10.50 | Transition Services Agreement, dated as of November 30, 2016, between Overseas Shipholding Group, Inc, and International Seaways, Inc. (filed as Exhibit 10.1 to the Registrant’s Current Report on Form 8-K dated December 2, 2016 and incorporated herein by reference). |
| 10.51 | Employee Matters Agreement, dated as of November 30, 2016, between Overseas Shipholding Group, Inc, and International Seaways, Inc. (filed as Exhibit 10.2 to the Registrant’s Current Report on Form 8-K dated December 2, 2016 and incorporated herein by reference). |
| *10.52 | Form of Overseas Shipholding Group, Inc. Management Incentive Comprehensive Plan Performance Restricted Stock Unit Grant Agreement (filed as Exhibit 10.1 to the Registrant’s Quarterly Report on Form 10-Q for the quarter ended September 30, 2016 and incorporated herein by reference). |
| 116 | Overseas Shipholding Group, Inc. |
21** |
List of subsidiaries of the Registrant. |
| 23.1** | Consent of Independent Registered Public Accounting Firm. |
| 31.1** | Certification of Chief Executive Officer pursuant to Rule 13a-14(a) and 15d-14(a), as amended. |
| 31.2** | Certification of Chief Financial Officer pursuant to Rule 13a-14(a) and 15d-14(a), as amended. |
| 32** | Certification of Chief Executive Officer and Chief Financial Officer pursuant to 18 U.S.C. Section 1350, as adopted pursuant to Section 906 of the Sarbanes-Oxley Act of 2002. |
| 101.INS | XBRL Instance Document. |
| 101.SCH | XBRL Taxonomy Schema. |
| 101.CAL | XBRL Taxonomy Extension Calculation Linkbase. |
| 101.DEF | XBRL Taxonomy Extension Definition Linkbase. |
| 101.LAB | XBRL Taxonomy Extension Label Linkbase. |
| 101.PRE | XBRL Taxonomy Extension Presentation Linkbase. |
| (1) | The Exhibits marked with one asterisk (*) are a management contract or a compensatory plan or arrangement required to be filed as an exhibit. |
| (2) | The Exhibits which have not previously been filed or listed are marked with two asterisks (**). |
None
| 117 | Overseas Shipholding Group, Inc. |
Pursuant to the requirements of Section 13 or 15(d) of the Securities Exchange Act of 1934, the Registrant has duly caused this report to be signed on its behalf by the undersigned, thereunto duly authorized.
Date: March 9, 2017
| OVERSEAS SHIPHOLDING GROUP, INC. | ||
| By: | /s/ CHRISTOPHER WOLF | |
| Christopher Wolf | ||
| Senior Vice President | ||
| and Chief Financial Officer | ||
Pursuant to the requirements of the Securities Exchange Act of 1934, this report has been signed below by the following persons on behalf of the Registrant and in the capacities and on the dates indicated. Each of such persons appoints Samuel H. Norton and Christopher Wolf, and each of them, as his agents and attorneys-in-fact, in his name, place and stead in all capacities, to sign and file with the SEC any amendments to this report and any exhibits and other documents in connection therewith, hereby ratifying and confirming all that such attorneys-in-fact or either of them may lawfully do or cause to be done by virtue of this power of attorney.
| Name | Date | |
| /s/ SAMUEL H. NORTON | March 9, 2017 | |
| Samuel H. Norton, Principal | ||
| Executive Officer and Director | ||
| /s/ CHRISTOPHER WOLF | March 9, 2017 | |
| Christopher Wolf, Principal | ||
| Financial Officer and | ||
| Principal Accounting Officer | ||
| /s/ DOUGLAS D. WHEAT | March 9, 2017 | |
| Douglas D. Wheat, Director | ||
| /s/ TIMOTHY BERNLOHR | March 9, 2017 | |
| Timothy Bernlohr, Director | ||
| /s/ JOSEPH I. KRONSBERG | March 9, 2017 | |
| Joseph I. Kronsberg, Director | ||
| /s/ RONALD STEGER | March 9, 2017 | |
| Ronald Steger, Director | ||
| /s/ CHAD L. VALERIO | March 9, 2017 | |
| Chad L. Valerio, Director | ||
| /s/ GARY EUGENE TAYLOR | March 9, 2017 | |
| Gary Eugene Taylor, Director | ||
| /s/ TY E. WALLACH | March 9, 2017 | |
| Ty E. Wallach, Director | ||
| /s/GREGORY A. WRIGHT | March 9, 2017 | |
| Gregory A. Wright, Director |
| 118 | Overseas Shipholding Group, Inc. |
OVERSEAS SHIPHOLDING GROUP, INC. AND SUBSIDIARIES
SCHEDULE I - CONDENSED FINANCIAL INFORMATION OF PARENT
OVERSEAS SHIPHOLDING GROUP, INC.
CONDENSED BALANCE SHEETS
AT DECEMBER 31
DOLLARS IN THOUSANDS
| 2016 | 2015 | |||||||
| ASSETS | ||||||||
| Current Assets: | ||||||||
| Cash and cash equivalents | $ | 74,383 | $ | 15,395 | ||||
| Restricted cash | 7,272 | 10,583 | ||||||
| Income taxes recoverable | 199 | 719 | ||||||
| Prepaid expenses and other current assets | 966 | 1,115 | ||||||
| Total Current Assets | 82,820 | 27,812 | ||||||
| Restricted cash | 8,572 | - | ||||||
| Investments in subsidiaries | 398,586 | 502,521 | ||||||
| Intercompany receivables | 809 | 2,012 | ||||||
| Other assets | 146 | 145 | ||||||
| Receivable due from and investments in INSW - Discontinued Operations | 47 | 1,388,631 | ||||||
| Total Assets | $ | 490,980 | $ | 1,921,121 | ||||
| LIABILITIES AND EQUITY | ||||||||
| Current Liabilities: | ||||||||
| Accounts payable, accrued expenses and other current liabilities | $ | 10,324 | $ | 12,905 | ||||
| Income taxes payable | 163 | 50 | ||||||
| Total Current Liabilities | 10,487 | 12,955 | ||||||
| Reserve for uncertain tax positions | 3,129 | 2,520 | ||||||
| Long-term debt | 80,896 | 116,426 | ||||||
| Deferred income taxes | 141,457 | 208,195 | ||||||
| Intercompany payables | 679 | 537 | ||||||
| Total Liabilities | 236,648 | 340,633 | ||||||
| Equity: | ||||||||
| Common stock - Class A ($0.01 par value; 166,666,666 shares authorized; 70,271,172 and 60,775,943 shares issued and outstanding) | 702 | 3,646 | ||||||
| Common stock - Class B ($0.01 par value; 1,321,134 shares authorized; 1,232,247 shares issued and outstanding in 2015 | - | 74 | ||||||
| Paid-in additional capital | 583,526 | 1,651,511 | ||||||
| Accumulated deficit | (321,736 | ) | (1,282 | ) | ||||
| 262,492 | 1,653,949 | |||||||
| Accumulated other comprehensive loss | (8,160 | ) | (73,461 | ) | ||||
| Total Equity | 254,332 | 1,580,488 | ||||||
| Total Liabilities and Equity | $ | 490,980 | $ | 1,921,121 | ||||
See notes to condensed financial statements
OVERSEAS SHIPHOLDING GROUP, INC. AND SUBSIDIARIES
SCHEDULE I - CONDENSED FINANCIAL INFORMATION OF PARENT
OVERSEAS SHIPHOLDING GROUP, INC.
CONDENSED STATEMENTS OF OPERATIONS AND COMPREHENSIVE INCOME/(LOSS)
FOR THE YEARS ENDED DECEMBER 31
DOLLARS IN THOUSANDS
| 2016 | 2015 | 2014 | ||||||||||
| Operating Expenses | ||||||||||||
| General and administrative | $ | 698 | $ | 935 | $ | 9,435 | ||||||
| Total Operating Expenses | 698 | 935 | 9,435 | |||||||||
| Equity in (loss)/income subsidiaries | (63,698 | ) | 47,534 | 59,808 | ||||||||
| Operating (loss)/income from continuing operations | (64,396 | ) | 46,599 | 50,373 | ||||||||
| Other (expense)/income | (2,363 | ) | (26,511 | ) | 1,511 | |||||||
| (Loss)/income from continuing operations before interest expense, reorganization items and income taxes | (66,759 | ) | 20,088 | 51,884 | ||||||||
| Interest expense | (10,323 | ) | (32,669 | ) | (160,461 | ) | ||||||
| Loss from continuing operations before reorganization items and income taxes | (77,082 | ) | (12,581 | ) | (108,577 | ) | ||||||
| Reorganization items, net | 10,925 | (7,888 | ) | (150,189 | ) | |||||||
| Loss from continuing operations before income taxes | (66,157 | ) | (20,469 | ) | (258,766 | ) | ||||||
| Income tax benefit | 65,098 | 101,034 | 115,560 | |||||||||
| Net (loss)/income from continuing operations | (1,059 | ) | 80,565 | (143,206 | ) | |||||||
| Net (loss)/income for discontinued operations | (292,555 | ) | 203,395 | (9,067 | ) | |||||||
| Net (loss)/income | (293,614 | ) | 283,960 | (152,273 | ) | |||||||
| Other comprehensive income/(loss), net of tax: | ||||||||||||
| Change in unrealized losses on cash flow hedges | 10,311 | 6,927 | (2,284 | ) | ||||||||
| Defined benefit pension and other postretirement benefit plans: | ||||||||||||
| Net change in unrecognized transition obligation | - | - | 4 | |||||||||
| Net change in unrecognized prior service cost | (60 | ) | (211 | ) | (77 | ) | ||||||
| Net change in unrecognized actuarial losses | (3,295 | ) | 3,203 | (11,679 | ) | |||||||
| Other comprehensive income/(loss) | 6,956 | 9,919 | (14,036 | ) | ||||||||
| Comprehensive (Loss)/Income | $ | (286,658 | ) | $ | 293,879 | $ | (166,309 | ) | ||||
See notes to condensed financial statements
OVERSEAS SHIPHOLDING GROUP, INC. AND SUBSIDIARIES
SCHEDULE I - CONDENSED FINANCIAL INFORMATION OF PARENT
OVERSEAS SHIPHOLDING GROUP, INC.
CONDENSED STATEMENTS OF CASH FLOWS
FOR THE YEARS ENDED DECEMBER 31
DOLLARS IN THOUSANDS
| 2016 | 2015 | 2014 | ||||||||||
| Cash Flows from Operating Activities: | ||||||||||||
| Net cash provided by/(used in) operating activities | $ | 202,989 | $ | 162,118 | $ | (84,829 | ) | |||||
| Cash Flows from Investing Activities: | ||||||||||||
| Change in restricted cash | (5,261 | ) | 42,502 | (53,085 | ) | |||||||
| Contributions to subsidiaries | - | (1,633 | ) | (14,316 | ) | |||||||
| Distributions from subsidiaries | 51,832 | 25,000 | 392,414 | |||||||||
| Net cash provided by investing activities | 46,571 | 65,869 | 325,013 | |||||||||
| Cash Flows from Financing Activities: | ||||||||||||
| Issuance of common stock, net of issuance costs | - | - | 1,510,000 | |||||||||
| Purchases of treasury stock | - | - | (162 | ) | ||||||||
| Payments on debt | (39,319 | ) | - | (1,335,603 | ) | |||||||
| Extinguishment of debt | - | (326,051 | ) | - | ||||||||
| Repurchases of common stock and common stock warrants | (119,343 | ) | (3,633 | ) | - | |||||||
| Cash dividends paid | (31,910 | ) | - | - | ||||||||
| Payment on debt of subsidiaries guaranteed by the Parent | - | - | (477,835 | ) | ||||||||
| Net cash used in financing activities | (190,572 | ) | (329,684 | ) | (303,600 | ) | ||||||
| Net increase/(decrease) in cash and cash equivalents | 58,988 | (101,697 | ) | (63,416 | ) | |||||||
| Cash and cash equivalents at beginning of year | 15,395 | 117,092 | 180,508 | |||||||||
| Cash and cash equivalents at end of year | $ | 74,383 | $ | 15,395 | $ | 117,092 | ||||||
See notes to condensed financial statements
OVERSEAS SHIPHOLDING GROUP, INC. AND SUBSIDIARIES
SCHEDULE I - CONDENSED FINANCIAL INFORMATION OF PARENT
OVERSEAS SHIPHOLDING GROUP, INC.
NOTES TO CONDENSED FINANCIAL STATEMENTS
DOLLARS IN THOUSANDS
NOTE A — BASIS OF PRESENTATION AND DESCRIPTION OF BUSINESS
Overseas Shipholding Group, Inc. (the “Parent”) is a holding company that conducts substantially all of its business operations through its subsidiaries. The condensed financial information and related notes have been prepared in accordance with Rule 12.04, Schedule I of Regulation S-X. This financial information should be read in conjunction with the consolidated financial statements and notes thereto of Overseas Shipholding Group, Inc., and subsidiaries (collectively, the “Company”).
The Parent owns 100% of OSG Bulk Ships, Inc. (“OBS”), which is incorporated in New York State, and OSG Financial Corp., which is incorporated in Delaware. OBS and its subsidiaries own and operate a fleet of oceangoing vessels engaged in the transportation of crude oil and refined petroleum products in the U.S. Flag trades. On November 30, 2016 (the “Distribution Date”), the Parent spun off its international business into a new independent company, International Seaways, Inc. (“INSW”). For additional information regarding the spin-off, see Note 1, “Basis of Presentation and Description of Business,” to the Company’s consolidated financial statements set forth in Item 8, “Financial Statements and Supplementary Data.”
NOTE B — BANKRUPTCY FILING AND EMERGENCE FROM BANKRUPTCY
On November 14, 2012 (the “Petition Date”), the Parent and 180 of its subsidiaries (together with OSG, the “Debtors”) filed voluntary petitions for reorganization under Chapter 11 of Title II of the U.S. Code (the “Bankruptcy Code”) in the U.S. Bankruptcy Court for the District of Delaware (the “Bankruptcy Court”). On March 7, 2014, the Debtors filed a plan of reorganization supported by certain of the lenders under OSG’s $1,500,000 credit agreement, dated as of February 9, 2006 (the “Lender Plan”). On April 18, 2014, the Debtors received a proposal for an alternative plan of reorganization from certain holders of existing equity interests of OSG, which the Debtors determined to be more favorable to the Debtors’ creditors and equity interest holders than the Lender Plan (the “Equity Proposal”). Accordingly, the Debtors filed with the Bankruptcy Court a plan of reorganization that effectuates the terms of the Equity Proposal (as subsequently amended, the “Equity Plan”). The Bankruptcy Court confirmed the Equity Plan by order entered on July 18, 2014 (the “Confirmation Order”). On August 5, 2014 (the “Effective Date”), the Equity Plan became effective and OSG emerged from bankruptcy. As of February 10, 2017, none of the original 181 Chapter 11 cases filed remains open.
For additional information regarding the Company’s emergence from bankruptcy, see Note 2, “Chapter 11 Filing and Emergence from Bankruptcy,” to the Company’s consolidated financial statements set forth in Item 8, “Financial Statements and Supplementary Data.”
NOTE C—DEBT:
Long-term debt consists of the following:
| As of December 31, | 2016 | 2015 | ||||||
| 8.125% notes due 2018, net of unamortized discount and deferred costs of $1,406 and $3,514 | $ | 80,213 | $ | 115,450 | ||||
| 7.5% Election 2 notes due 2021, net of unamortized discount and deferred costs of $8 and $9 | 293 | 292 | ||||||
| 7.50% notes due 2024 | 390 | 684 | ||||||
| $ | 80,896 | $ | 116,426 | |||||
The aggregate annual principal payments required to be made on debt over the next five years and thereafter are $81,619 (2018), $301 (2021) and $390 (2024).
During the year ended December 31, 2016, the Company repurchased and retired an aggregate principal amount of $294 of its 7.5% notes due 2024 and $37,345 of its 8.125% notes due 2018. The aggregate loss of $2,463 realized on these transactions during the year ended December 31, 2016, is included in other (expense)/income in the consolidated statements of operations. The net loss reflects a $784 write-off of unamortized deferred finance costs associated with the repurchased debt.
During 2015 the Parent repurchased and retired an aggregate principal amount of $326,051 of the above notes. The aggregate net loss of $26,516 realized on these transactions during 2015, is included in other (expense)/ income in the accompanying condensed statement of operations and comprehensive income/(loss).
See Note 9, “Debt,” to the Company’s consolidated financial statements set forth in Item 8, “Financial Statements and Supplementary Data,” for additional information relating to the Parent’s debt.
NOTE D—RELATED PARTY TRANSACTIONS:
The financial statements of the Parent included related party transactions as presented in the tables below:
| For the year ended December 31, | ||||||||||||
| 2016 | 2015 | 2014 | ||||||||||
| General and administrative expenses reimbursed to/(by) subsidiaries | ||||||||||||
| OSG Ship Management, Inc. | $ | - | $ | - | $ | 13,215 | ||||||
| International Seaways, Inc. - Discontinued Operations(1) | (7,838 | ) | (17,185 | ) | (20,067 | ) | ||||||
| OSG Bulk Ships, Inc. (1) | (17,321 | ) | (11,617 | ) | (3,556 | ) | ||||||
| Net reduction in general and administrative expenses | $ | (25,159 | ) | $ | (28,802 | ) | $ | (10,408 | ) | |||
| (1) | According to the "Shared Services and Cost Sharing Agreement" and the "Cost Sharing Agreement" signed by the Parent and its subsidiaries, effective August 5, 2014, certain overhead costs paid by the Parent on behalf of INSW and OBS are allocated to such subsidiaries. |
| For the year ended December 31, | ||||||||||||
| 2016 | 2015 | 2014 | ||||||||||
| Equity in income/(loss) of subsidiaries | ||||||||||||
| OSG Bulk Ships, Inc. | $ | (63,744 | ) | $ | 47,482 | $ | 59,808 | |||||
| OSG Financial Corp. | 46 | 52 | - | |||||||||
| $ | (63,698 | ) | $ | 47,534 | $ | 59,808 | ||||||
On November 30, 2016, the Parent completed the separation of its business into two independent publicly-traded companies through the spin-off of its then wholly-owned subsidiary INSW. Income/(loss) from the discontinued operations of INSW during the eleven months ended November 30, 2016 and the years ended December 31, 2015 and 2014 was $(292,555), $203,395 and $(9,067), respectively. For additional information regarding the spin-off, see Note 1, “Basis of Presentation and Description of Business,” and Note 5, “Discontinued Operations,” to the Company’s consolidated financial statements set forth in Item 8, “Financial Statements and Supplementary Data.”
| For the year ended December 31, | ||||||||||||
| 2016 | 2015 | 2014 | ||||||||||
| Interest income on intercompany loans receivable from OSG Bulk Ships, Inc. | $ | - | $ | - | $ | 1,535 | ||||||
Interest income on intercompany loans receivable is included in other (expense)/income in the statements of operations and comprehensive income/(loss). There was no outstanding intercompany loan nor accrued interest receivable as of December 31, 2016 and 2015.
| As of December 31, | ||||||||
| 2016 | 2015 | |||||||
| Intercompany receivables: | ||||||||
| OSG Bulk Ships, Inc. | $ | 809 | $ | 2,012 | ||||
| $ | 809 | $ | 2,012 | |||||
Intercompany receivables principally represent outstanding balances due from the subsidiaries in accordance with the "Shared Services and Cost Sharing Agreement" and the "Cost Sharing Agreement" effective August 5, 2014.
| As of December 31, | ||||||||
| 2016 | 2015 | |||||||
| Intercompany payables: | ||||||||
| OSG Bulk Ships, Inc. | $ | 563 | $ | - | ||||
| OSG Financial Corp. | 116 | 537 | ||||||
| $ | 679 | $ | 537 | |||||
During 2016, INSW, OBS, and OSG Financial Corp. paid cash distributions to the Parent of $202,000, $51,295, and $537, respectively, including earnings distributions of $202,000 from INSW and returns of capital from OBS of $51,295 and OSG Financial Corp. of $537. The earnings distributions and return of capital distributions received by the Parent are reflected in the condensed statement of cash flows as cash flows from operating activities and investing activities, respectively. Supplemental cash flow information for the year ended December 31, 2016 associated with net non-cash capital transactions aggregating $884,591 were non-cash investing activities, including $895,650 related to the spin-off of INSW.
During 2015, INSW and OBS paid cash distributions to the Parent of $200,000 and $25,000, respectively, including earnings distributions from INSW of $200,000 and a $25,000 return of capital from OBS. The earnings distributions and the return of capital distributions received by the Parent are reflected in the condensed statement of cash flows as cash flows from operating activities and investing activities, respectively. Supplemental cash flow information for the year ended December 31, 2015 associated with net non-cash capital transactions aggregating $1,502 were non-cash investing activities. Such amounts are not to be settled in cash.
On August 5, 2014, concurrent with OSG’s Emergence and as part of the plan of reorganization, OBS and INSW made cash distributions to the Parent of $600,400 and $53,225, respectively, including cash dividends of $207,986 and $53,255, respectively, and a $392,414 return of capital from OBS. The cash dividends and the return of capital distributions received by the Parent are reflected in the condensed statement of cash flows as cash flows from operating activities and investing activities, respectively. In connection with its emergence, the Parent made certain payments to creditors aggregating $477,835, in its capacity as guarantor of the secured term loans of subsidiaries of INSW, which are reported as financing activities in the condensed statement of cash flows.
In accordance with the Equity Plan, on emergence all amounts, including the related party loans, then due between Parent and INSW and its subsidiaries and OBS and its subsidiaries were deemed uncollectible and considered settled through non-cash capital contributions by the Parent. Supplemental cash flow information for the year ended December 31, 2014 associated with the aforementioned non-cash capital contributions aggregating $611,877 were non-cash investing activities.
Receivables of $47 due from INSW as of December 31, 2016 are primarily in relation to amounts owed pursuant to the Separation and Distribution Agreement, as described in Note 5, “Discontinued Operations.” Receivables of $4,845 due from INSW as of December 31, 2015 were related to the "Shared Services and Cost Sharing Agreement" and the "Cost Sharing Agreement" by and among, OSG, INSW and OBS, effective August 5, 2014.
NOTE E —GUARANTEES:
See Note 13, “Related Parties,” to the Company’s consolidated financial statements set forth in Item 8, “Financial Statements and Supplementary Data,” for information relating to Parent guarantees.
NOTE F —CONTINGENCIES:
See Note 21, “Contingencies,” to the Company’s consolidated financial statements set forth in Item 8, “Financial Statements and Supplementary Data,” for information with respect to the Parent’s contingencies.