Attached files
| file | filename |
|---|---|
| EX-99.5 - EX-99.5 - STONE ENERGY CORP | d290934dex995.htm |
| EX-99.3 - EX-99.3 - STONE ENERGY CORP | d290934dex993.htm |
| EX-99.2 - EX-99.2 - STONE ENERGY CORP | d290934dex992.htm |
| EX-99.1 - EX-99.1 - STONE ENERGY CORP | d290934dex991.htm |
| 8-K - FORM 8-K - STONE ENERGY CORP | d290934d8k.htm |

Exhibit 99.4
PRELIMINARY
DRAFT SUBJECT TO REVISION | SUBJECT TO FRE408 AND CONFIDENTIALITY AGREEMENT
STONE ENERGY
STONE ENERGY
Disclaimer
None of Stone Energy Corporation (“Stone” or the “Company”), Lazard and Alvarez & Marsal Holdings, LLC (“A&M”), and each of
their subsidiaries, affiliates, officers, directors, shareholders, employees, consultants, advisors, agents and representatives of the foregoing (collectively, “Representatives”), make any representation or warranty, express or implied at
law or in equity, in connection with any of the information made available either herein or subsequent to this document, including, but not limited to, the past, present, or future value of the anticipated cash flows, income, costs, expenses,
liabilities and profits, if any, of the Company. Accordingly, any person, company or interested party will rely solely upon its own independent examination and assessment of the information in making any decision in connection with a proposed
restructuring of the Company’s balance sheet (a “Transaction”) and in no event shall any recipient party make any claim against Stone, Lazard, A&M or any of their respective Representatives in respect of, or based upon, the
information contained either herein or subsequent to this document.
None of Stone, Lazard or A&M, nor any of their respective Representatives, shall have any
liability to any recipient party or its respective Representatives as a result of receiving and/or evaluating any information concerning the Transaction (including, but not limited to, this presentation (“Presentation”)). Information in
this Presentation is dependent upon assumptions with respect to commodity prices, production, development capital, exploration capital, operating expenses, availability and cost of adequate capital and performance as set forth in this Presentation
and in the Disclosure Statement and the Current Reports on Form 8-K filed on June 3, 2016, August 23, 2016 and October 21, 2016.
Certain statements in this
Presentation are forward-looking and are based upon the Company’s current belief as to the outcome and timing of future events. All statements, other than statements of historical facts, that address activities that Stone plans, expects,
believes, projects, estimates or anticipates will, should or may occur in the future, including anticipated cash flows, income, costs, liabilities, profits, future production of oil and gas, future capital expenditures and drilling of wells and
future financial or operating results are forward-looking statements. All forward-looking numbers are approximate. Important factors that could cause actual results to differ materially from those in the forward-looking statements herein include,
but are not limited to, the ability to confirm and consummate a plan of reorganization in accordance with the terms of the restructuring support agreement; risks attendant to the bankruptcy process, including the effects thereof on Stone’s
business and on the interests of various constituents, the length of time that Stone might be required to operate in bankruptcy and the continued availability of operating capital during the pendency of such proceedings; risks associated with third
party motions in any bankruptcy case, which may interfere with the ability to confirm and consummate a plan of reorganization; potential adverse effects on Stone’s liquidity or results of operations; increased costs to execute the
reorganization; effects on the market price of Stone’s common stock and on Stone’s ability to access the capital markets; and other risk factors and known trends and uncertainties as described in Stone’s Annual Report on Form 10-K for
the year ended December 31, 2015 (“2015 Form 10-K”) and Stone’s Quarterly Reports on Form 10-Q for the three months ended March 31, 2016, June 30, 2016 and September 30, 2016 and Stone’s Current Reports on Form 8-K, each as filed
with the Securities and Exchange Commission (the “SEC”). Should one or more of these risks or uncertainties occur, or should underlying assumptions prove incorrect, Stone’s actual results and plans could differ materially from those
expressed in the forward-looking statements. Estimates for Stone’s future production volumes and reserves are based on assumptions of capital expenditure levels and the assumption that market demand and prices for oil and gas will continue at
levels that allow for economic production of these products. The production, transportation and marketing of oil and gas are subject to disruption due to transportation and processing availability, mechanical failure, human error, hurricanes and
numerous other factors. Stone’s estimates are based on certain other assumptions, such as well performance, which may vary significantly from those assumed. The recipient hereby acknowledges that none of Stone, Lazard, A&M or any of their
Representatives has an obligation to update any such projections or forecasts.
2 PRELIMINARY DRAFT SUBJECT TO REVISION | SUBJECT TO FRE408 AND CONFIDENTIALITY
AGREEMENT
STONE ENERGY
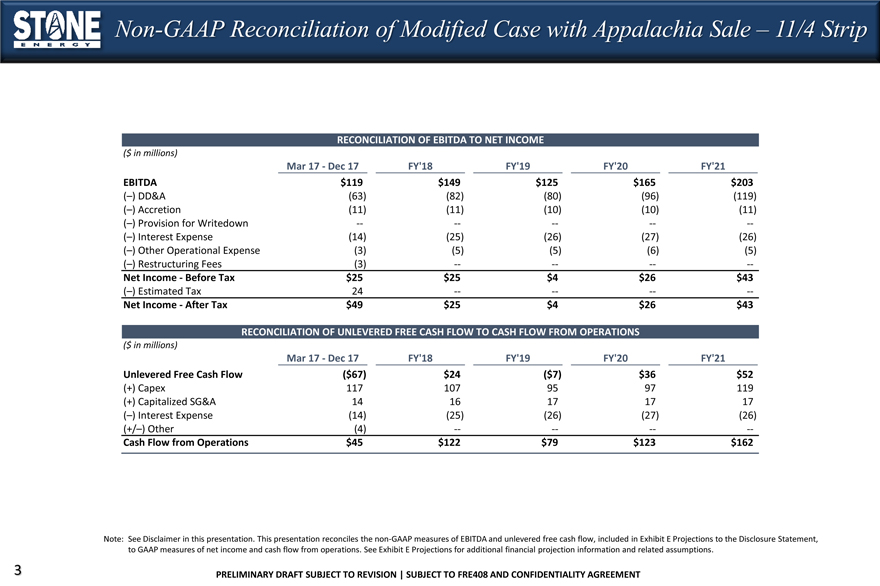
Non-GAAP
Reconciliation of Modified Case with Appalachia Sale – 11/4 Strip
RECONCILIATION OF EBITDA TO NET INCOME
($ in millions)
Mar 17 - Dec 17 FY’18 FY’19 FY’20 FY’21
EBITDA $119 $149 $125 $165 $203
(–) DD&A (63) (82) (80) (96) (119)
(–) Accretion (11) (11) (10) (10) (11)
(–) Provision for Writedown -- -- -- -- --
(–) Interest Expense (14) (25) (26) (27) (26)
(–) Other Operational
Expense (3) (5) (5) (6) (5)
(–) Restructuring Fees (3) -- -- -- --
Net
Income - Before Tax $25 $25 $4 $26 $43
(–) Estimated Tax 24 -- -- -- --
Net Income - After Tax $49 $25 $4 $26 $43
RECONCILIATION OF UNLEVERED FREE
CASH FLOW TO CASH FLOW FROM OPERATIONS
($ in millions)
Mar 17 - Dec 17
FY’18 FY’19 FY’20 FY’21
Unlevered Free Cash Flow ($67) $24 ($7) $36 $52
(+) Capex 117 107 95 97 119
(+) Capitalized SG&A 14 16 17 17 17
(–) Interest Expense (14) (25) (26) (27) (26)
(+/–) Other (4) -- -- -- --
Cash Flow from Operations $45 $122 $79 $123 $162
Note: See Disclaimer in this
presentation. This presentation reconciles the non-GAAP measures of EBITDA and unlevered free cash flow, included in Exhibit E Projections to the Disclosure Statement, to GAAP measures of net income and cash flow from operations. See Exhibit E
Projections for additional financial projection information and related assumptions.
3 PRELIMINARY DRAFT SUBJECT TO REVISION | SUBJECT TO FRE408 AND
CONFIDENTIALITY AGREEMENT
STONE ENERGY
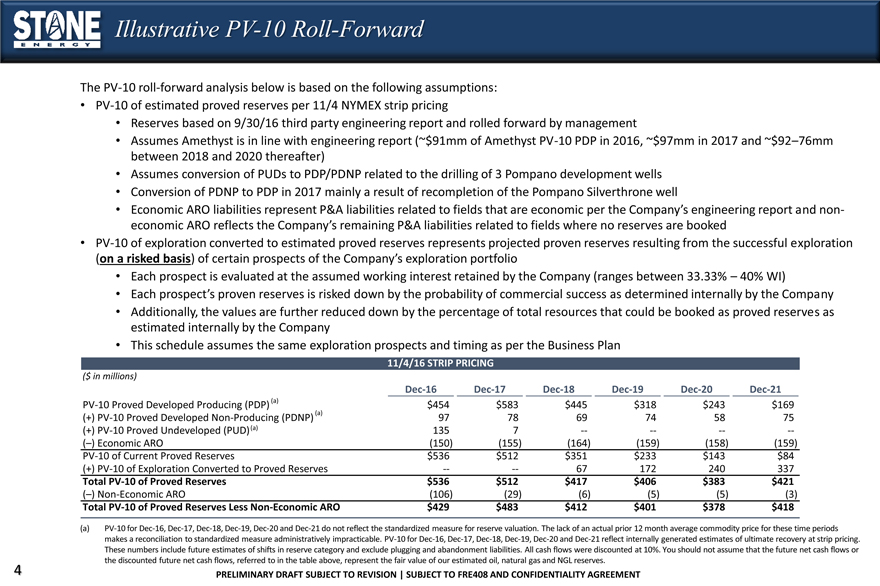
Illustrative
PV-10 Roll-Forward
The PV-10 roll-forward analysis below is based on the following assumptions:
• PV-10 of estimated proved reserves per 11/4 NYMEX strip pricing
• Reserves based
on 9/30/16 third party engineering report and rolled forward by management
• Assumes Amethyst is in line with engineering report (~$91mm of Amethyst PV-10 PDP
in 2016, ~$97mm in 2017 and ~$92–76mm between 2018 and 2020 thereafter)
• Assumes conversion of PUDs to PDP/PDNP related to the drilling of 3 Pompano
development wells
• Conversion of PDNP to PDP in 2017 mainly a result of recompletion of the Pompano Silverthrone well
• Economic ARO liabilities represent P&A liabilities related to fields that are economic per the Company’s engineering report and non-economic ARO reflects the
Company’s remaining P&A liabilities related to fields where no reserves are booked
• PV-10 of exploration converted to estimated proved reserves
represents projected proven reserves resulting from the successful exploration
(on a risked basis) of certain prospects of the Company’s exploration portfolio
• Each prospect is evaluated at the assumed working interest retained by the Company (ranges between 33.33% – 40% WI)
• Each prospect’s proven reserves is risked down by the probability of commercial success as determined internally by the Company
• Additionally, the values are further reduced down by the percentage of total resources that could be booked as proved reserves as estimated internally by the Company
• This schedule assumes the same exploration prospects and timing as per the Business Plan
11/4/16 STRIP PRICING
($ in millions)
Dec-16 Dec-17 Dec-18 Dec-19 Dec-20 Dec-21
PV-10 Proved Developed Producing (PDP) (a) $454 $583
$445 $318 $243 $169
(+) PV-10 Proved Developed Non-Producing (PDNP) (a) 97 78 69 74 58 75
(+) PV-10 Proved Undeveloped (PUD) (a) 135 7 -- -- -- --
(–) Economic ARO (150) (155)
(164) (159) (158) (159)
PV-10 of Current Proved Reserves $536 $512 $351 $233 $143 $84
(+) PV-10 of Exploration Converted to Proved Reserves -- -- 67 172 240 337
Total PV-10 of
Proved Reserves $536 $512 $417 $406 $383 $421
(–) Non-Economic ARO (106) (29) (6) (5) (5) (3)
Total PV-10 of Proved Reserves Less Non-Economic ARO $429 $483 $412 $401 $378 $418
(a) PV-10
for Dec-16, Dec-17, Dec-18, Dec-19, Dec-20 and Dec-21 do not reflect the standardized measure for reserve valuation. The lack of an actual prior 12 month average commodity price for these time periods makes a reconciliation to standardized measure
administratively impracticable. PV-10 for Dec-16, Dec-17, Dec-18, Dec-19, Dec-20 and Dec-21 reflect internally generated estimates of ultimate recovery at strip pricing.
These numbers include future estimates of shifts in reserve category and exclude plugging and abandonment liabilities. All cash flows were discounted at 10%. You should not assume
that the future net cash flows or the discounted future net cash flows, referred to in the table above, represent the fair value of our estimated oil, natural gas and NGL reserves.
4PRELIMINARY DRAFT SUBJECT TO REVISION | SUBJECT TO FRE408 AND CONFIDENTIALITY AGREEMENT