Attached files
| file | filename |
|---|---|
| EX-99.2 - EXHIBIT 99.2 - STONE ENERGY CORP | sgy123117ex992.htm |
| EX-32.1 - EXHIBIT 32.1 - STONE ENERGY CORP | sgy123117ex321.htm |
| EX-31.2 - EXHIBIT 31.2 - STONE ENERGY CORP | sgy123117ex312.htm |
| EX-31.1 - EXHIBIT 31.1 - STONE ENERGY CORP | sgy123117ex311.htm |
| EX-23.2 - EXHIBIT 23.2 - STONE ENERGY CORP | sgy123117ex232.htm |
| EX-23.1 - EXHIBIT 23.1 - STONE ENERGY CORP | sgy123117ex231.htm |
| EX-21.1 - EXHIBIT 21.1 - STONE ENERGY CORP | sgy123117ex211.htm |
| EX-10.25 - EXHIBIT 10.25 - STONE ENERGY CORP | sgy123117ex1025.htm |
| EX-10.24 - EXHIBIT 10.24 - STONE ENERGY CORP | sgy123117ex1024.htm |
| EX-10.19 - EXHIBIT 10.19 - STONE ENERGY CORP | sgy123117ex1019.htm |
| EX-10.16 - EXHIBIT 10.16 - STONE ENERGY CORP | sgy123117ex1016.htm |
| EX-10.15 - EXHIBIT 10.15 - STONE ENERGY CORP | sgy123117ex1015.htm |
UNITED STATES
SECURITIES AND EXCHANGE COMMISSION
Washington, D.C. 20549
FORM 10-K
[X] ANNUAL REPORT PURSUANT TO SECTION 13 OR 15(d) OF THE SECURITIES EXCHANGE ACT OF 1934
For the fiscal year ended December 31, 2017
or
[ ] TRANSITION REPORT PURSUANT TO SECTION 13 OR 15(d) OF THE SECURITIES EXCHANGE ACT OF 1934
For the transition period from to
Commission File Number: 1-12074
STONE ENERGY CORPORATION
(Exact name of registrant as specified in its charter)
Delaware | 72-1235413 | |||
(State or other jurisdiction of incorporation or organization) | (I.R.S. Employer Identification No.) | |||
625 E. Kaliste Saloom Road Lafayette, Louisiana | 70508 | |||
(Address of principal executive offices) | (Zip Code) | |||
Registrant’s telephone number, including area code: (337) 237-0410
Securities registered pursuant to Section 12(b) of the Act:
Title of each class | Name of each exchange on which registered | ||
Common Stock, Par Value $.01 Per Share | New York Stock Exchange | ||
Warrants to Purchase Common Stock | NYSE American | ||
Securities registered pursuant to Section 12(g) of the Act:
None
Indicate by check mark if the registrant is a well-known seasoned issuer, as defined in Rule 405 of the Securities Act. [ ] Yes [X] No
Indicate by check mark if the registrant is not required to file reports pursuant to Section 13 or Section 15(d) of the Act. [ ] Yes [X] No
Indicate by check mark whether the registrant (1) has filed all reports required to be filed by Section 13 or 15(d) of the Securities Exchange Act of 1934 during the preceding 12 months (or for such shorter period that the registrant was required to file such reports), and (2) has been subject to such filing requirements for the past 90 days. [X] Yes [ ] No
Indicate by check mark whether the registrant has submitted electronically and posted on its corporate Web site, if any, every Interactive Data File required to be submitted and posted pursuant to Rule 405 of Regulation S-T (§232.405 of this chapter) during the preceding 12 months (or for such shorter period that the registrant was required to submit and post such files). [X] Yes [ ] No
Indicate by check mark if disclosure of delinquent filers pursuant to Item 405 of Regulation S-K (§229.405 of this chapter) is not contained herein, and will not be contained, to the best of the registrant’s knowledge, in definitive proxy or information statements incorporated by reference in Part III of this Form 10-K or any amendment to this Form 10-K. [X]
Indicate by check mark whether the registrant is a large accelerated filer, an accelerated filer, a non-accelerated filer, smaller reporting company, or an emerging growth company. See the definitions of “large accelerated filer,” “accelerated filer,” “smaller reporting company,” and “emerging growth company” in Rule 12b-2 of the Exchange Act. (Check one):
Large accelerated filer | ¨ | Accelerated filer | ý | |
Non-accelerated filer | ¨ | (Do not check if a smaller reporting company) | Smaller reporting company | ¨ |
Emerging growth company | ¨ | |||
If an emerging growth company, indicate by check mark if the registrant has elected not to use the extended transition period for complying with any new or revised financial accounting standards provided pursuant to Section 13(a) of the Exchange Act. ¨
Indicate by check mark whether the registrant is a shell company (as defined in Rule 12b-2 of the Act). [ ] Yes [X] No
The aggregate market value of the voting stock held by non-affiliates of the registrant was approximately $161.2 million as of June 30, 2017 (based on the last reported sale price of such stock on the New York Stock Exchange Composite Tape on that day).
Indicate by check mark whether the registrant has filed all documents and reports required to be filed by Sections 12, 13 or 15(d) of the Securities Exchange Act of 1934 subsequent to the distribution of securities under a plan confirmed by a court. Yes ý No ¨
As of March 9, 2018, the registrant had outstanding 19,998,701 shares of Common Stock, par value $.01 per share.
TABLE OF CONTENTS
Page No. | ||
PART I | ||
Item 1. | ||
Item 1A. | ||
Item 1B. | ||
Item 2. | ||
Item 3. | ||
Item 4. | ||
PART II | ||
Item 5. | ||
Item 6. | ||
Item 7. | ||
Item 7A. | ||
Item 8. | ||
Item 9. | ||
Item 9A. | ||
Item 9B. | ||
PART III | ||
Item 10. | ||
Item 11. | ||
Item 12. | ||
Item 13. | ||
Item 14. | ||
PART IV | ||
Item 15. | ||
Item 16. | ||
PART I
This section highlights information that is discussed in more detail in the remainder of the document. Throughout this document, we make statements that are classified as “forward-looking.” Please refer to the “Forward-Looking Statements” section beginning on page 10 of this document for an explanation of these types of statements. We use the terms “Stone,” “Stone Energy,” “Company,” “we,” “us” and “our” to refer to Stone Energy Corporation and its consolidated subsidiaries. Certain terms relating to the oil and gas industry are defined in “Glossary of Certain Industry Terms,” which begins on page G-1 of this Annual Report on Form 10-K (this “Form 10-K”).
ITEM 1. BUSINESS
The Company
Stone Energy is an independent oil and natural gas company engaged in the acquisition, exploration, exploitation, development and operation of oil and gas properties. We have been operating in the Gulf of Mexico (the “GOM”) Basin since our incorporation in 1993 and have established technical and operational expertise in this area. We leveraged our experience in the GOM conventional shelf and expanded our reserve base into the more prolific plays of the GOM deep water, Gulf Coast deep gas and the Marcellus and Utica shales in Appalachia. At December 31, 2016, we had producing properties and acreage in the Marcellus and Utica Shales in Appalachia. In connection with our restructuring efforts, we determined that a sale of the Appalachia Properties (as defined below) would be a beneficial way to maximize value for all stakeholders. We completed the sale of the Appalachia Properties on February 27, 2017 for net cash consideration of approximately $522.5 million. See “Reorganization and Emergence from Voluntary Chapter 11 Proceedings” below for additional information. As of December 31, 2017, our estimated proved oil and natural gas reserves were approximately 32.5 MMBoe.
We were incorporated in 1993 as a Delaware corporation. Our corporate headquarters are located at 625 E. Kaliste Saloom Road, Lafayette, Louisiana 70508. We have an additional office in New Orleans, Louisiana.
Business Strategy
Our long-term strategy is to grow net asset value through acquiring, discovering, developing and operating a focused set of margin-advantaged properties while appropriately managing financial, exploration and operational risk. Oil and natural gas prices significantly declined in the second half of 2014, and sustained lower prices continued throughout 2015, 2016 and early 2017, with a modest recovery in late 2017. In response to that decline and the uncertainty regarding future commodity prices, we adjusted our near-term strategy and focused on maintaining maximum liquidity. We structured a plan of reorganization to improve our financial position and liquidity and filed voluntary petitions under Chapter 11 of Title 11 (“Chapter 11”) of the United States Bankruptcy Code (the “Bankruptcy Code”) on December 14, 2016 (the “Petition Date”). On February 28, 2017, we emerged from bankruptcy, and in April 2017, our board of directors retained a financial advisor to assist them in determining the Company’s strategic direction. See “Strategic Review and Pending Combination with Talos” below for additional details.
Strategic Review and Pending Combination with Talos
Following the successful completion of our financial restructuring and emergence from Chapter 11 reorganization, our Board of Directors (the “Board”) retained a financial advisor in April 2017 to assist the Board in its determination of the Company’s strategic direction, including assessing its various strategic alternatives. Pursuant to such process, on November 21, 2017, Stone and certain of its subsidiaries entered into a series of related agreements pertaining to a business combination with Talos Energy LLC (“Talos Energy”) and its indirect wholly owned subsidiary Talos Production LLC (“Talos Production” and, together with Talos Energy, “Talos”). Talos Energy is controlled indirectly by entities controlled by Apollo Management VII, L.P. (“Apollo VII”), Apollo Commodities Management, L.P., with respect to Series I (together with Apollo VII, “Apollo Management”) and Riverstone Energy Partners V, L.P. (“Riverstone”).
Under the terms of a definitive agreement, Talos and Stone will both become wholly-owned subsidiaries of a new holding company, which at closing will become a publicly traded entity named Talos Energy, Inc. (“New Talos”). The combination involves an all-stock transaction pursuant to which holders of Stone common stock immediately prior to the combination will collectively hold 37% of the outstanding New Talos common stock and the current Talos stakeholders will hold 63% of the outstanding New Talos common stock. Outstanding warrants to acquire Stone common stock will become warrants to acquire New Talos common stock with terms and conditions substantially identical to their existing terms and conditions. The combination is expected to close in the second quarter of 2018. We cannot provide any assurance that the combination will be completed on the terms or timeline currently contemplated, or at all. For additional details on the Talos combination, see Part II. Item 7. Management’s Discussion and Analysis of Financial Condition and Results of Operations.
1
Reorganization and Emergence from Voluntary Chapter 11 Proceedings
On the Petition Date, the Company and its subsidiaries Stone Energy Offshore, L.L.C. (“Stone Offshore”) and Stone Energy Holding, L.L.C. (together with the Company, the “Debtors”) filed voluntary petitions (the “Bankruptcy Petitions”) in the United States Bankruptcy Court for the Southern District of Texas, Houston Division (the “Bankruptcy Court”) seeking relief under the provisions of Chapter 11 of the Bankruptcy Code. On February 15, 2017, the Bankruptcy Court entered an order (the “Confirmation Order”) confirming the Second Amended Joint Prepackaged Plan of Reorganization of Stone Energy Corporation and its Debtor Affiliates, dated December 28, 2016 (the “Plan”), as modified by the Confirmation Order, and on February 28, 2017, the Plan became effective (the “Effective Date”) and the Debtors emerged from bankruptcy, with the bankruptcy cases then being closed by Final Decree Closing Chapter 11 Cases and Terminating Claims Agent Services entered by the Bankruptcy Court on April 20, 2017.
Our restructuring included the sale of Stone’s producing properties and acreage, including approximately 86,000 net acres, in the Appalachia regions of Pennsylvania and West Virginia (the “Appalachia Properties”) to EQT Corporation, through its wholly-owned subsidiary EQT Production Company (“EQT”), on February 27, 2017, for net cash consideration of approximately $522.5 million. A portion of the consideration received from the sale of the Appalachia Properties was used to fund the Company’s cash payment obligations under the Plan. At December 31, 2016, the Appalachia Properties accounted for approximately 34% of the Predecessor Company’s (as defined below) total estimated proved oil and natural gas reserves, on a volume equivalent basis. Upon closing of the sale on February 27, 2017, we no longer have operations or assets in Appalachia.
The voluntary reorganization under Chapter 11 substantially reduced our indebtedness and restructured our balance sheet. Upon emergence from bankruptcy, we eliminated approximately $1.1 billion in principal amount of outstanding debt. For additional details on the Chapter 11 proceedings, the sale of the Appalachia Properties and the terms of the Plan, see Part II. Item 7. Management’s Discussion and Analysis of Financial Condition and Results of Operations.
Upon emergence from bankruptcy, the Company adopted fresh start accounting in accordance with the provisions of Accounting Standards Codification (“ASC”) 852, “Reorganizations”, which resulted in the Company becoming a new entity for financial reporting purposes on the Effective Date. As a result of the adoption of fresh start accounting, the Company’s consolidated financial statements subsequent to February 28, 2017 will not be comparable to its financial statements prior to that date. See Note 3 – Fresh Start Accounting for further details on the impact of fresh start accounting on the Company’s consolidated financial statements. References to “Successor” or “Successor Company” relate to the financial position and results of operations of the reorganized Company subsequent to February 28, 2017. References to “Predecessor” or “Predecessor Company” relate to the financial position and results of operations of the Company prior to, and including, February 28, 2017.
Board of Director and Management Changes
Pursuant to the Plan, upon the Effective Date, Neal P. Goldman (Chairman of the Board), John “Brad” Juneau, David I. Rainey, Charles M. Sledge, James M. Trimble and David N. Weinstein were appointed as directors of the Board of the Successor Company. In addition, David H. Welch, the President and Chief Executive Officer of the Company at the time of the Effective Date, was reappointed to the Board pursuant to the Plan. Mr. Welch retired as President and Chief Executive Officer of the Company and as a member of the Board on April 28, 2017.
On April 28, 2017, the Board elected James M. Trimble, a member of the Board, to serve as the Company’s Interim Chief Executive Officer and President, and appointed Keith A. Seilhan, the Company’s Senior Vice President – Gulf of Mexico, to serve as the Company’s Chief Operating Officer.
Operational Overview
Gulf of Mexico Basin
We have properties in the deep water of the GOM, as well as limited exposure to GOM conventional shelf and deep gas properties. In 2014, we sold a majority of our GOM conventional shelf properties.
Gulf of Mexico — Deep Water. We believe that the deep water of the GOM is an attractive area to acquire, explore, develop and operate with high-potential investment opportunities. We have made significant investments in seismic data and leasehold interests and have assembled a technical team with prior geological, geophysical, engineering and operational experience in the deep water arena to evaluate potential exploration, development and acquisition opportunities. Since 2006, we have made two significant acquisitions that included two deep water platforms, producing reserves and numerous leases. We have a portfolio of deep water projects ranging from lower risk development projects incorporating existing facilities to higher risk exploration
2
prospects that would require a new production facility. We have utilized subsea tie-backs in the deep water on satellite discoveries close to existing facilities, which require less capital and time than new stand-alone facilities. We have higher risk exploration prospects that could expose the company to significant reserves, if successful. Projects in the deep water typically require substantially more time, planning, manpower and capital than an onshore project. Our deep water properties accounted for 86% of our estimated proved oil and natural gas reserves at December 31, 2017, on a volume equivalent basis.
Gulf Coast — Conventional Shelf and Deep Gas. We have historically focused on the GOM conventional shelf, but after the sale of a majority of our GOM conventional shelf properties in 2014, we have significantly reduced our exposure in this area to primarily two remaining fields, which provide production and cash flow. There are limited exploitation and exploration projects for us on our GOM conventional shelf properties. The Gulf Coast deep gas play (prospects below 15,000 feet) provides us with higher potential exploration opportunities with existing infrastructure nearby, which shortens the lead time to production. Our conventional shelf and deep gas properties accounted for 14% of our estimated proved oil and natural gas reserves at December 31, 2017, on a volume equivalent basis.
Appalachia
Our restructuring included the sale of the Appalachia Properties to EQT on February 27, 2017, for net cash consideration of approximately $522.5 million. At December 31, 2016, the Appalachia Properties accounted for approximately 34% of the Predecessor Company’s total estimated proved oil and natural gas reserves, on a volume equivalent basis. Upon closing of the sale on February 27, 2017, we no longer have operations or assets in Appalachia.
Oil and Gas Marketing
Our oil and natural gas production is sold at current market prices under short-term contracts. Phillips 66 Company and Shell Trading (US) Company accounted for approximately 74% and 15%, respectively, of our oil and natural gas revenue generated during the period from March 1, 2017 through December 31, 2017. We do not believe that the loss of any of our major purchasers would result in a material adverse effect on our ability to market future oil and natural gas production. From time to time, we may enter into transactions that hedge the price of oil and natural gas. See Item 7A. Quantitative and Qualitative Disclosures About Market Risk – Commodity Price Risk.
Competition and Markets
Competition in the GOM Basin and onshore plays is intense, particularly with respect to the acquisition of producing properties and undeveloped acreage. We compete with major oil and gas companies and other independent producers of varying sizes, all of which are engaged in the acquisition of properties and the exploration and development of such properties. Many of our competitors have financial resources and exploration and development budgets that are substantially greater than ours, which may adversely affect our ability to compete. See Item 1A. Risk Factors – Competition within our industry may adversely affect our operations.
The availability of a ready market for and the price of any hydrocarbons produced will depend on many factors beyond our control, including, but not limited to, the amount of domestic production and imports of foreign oil and exports of liquefied natural gas, the marketing of competitive fuels, the proximity and capacity of oil and natural gas pipelines, the availability of transportation and other market facilities, the demand for hydrocarbons, the effect of federal and state regulation of allowable rates of production, taxation and the conduct of drilling operations and federal regulation of oil and natural gas. All of these factors, together with economic factors in the marketing arena, generally may affect the supply of and/or demand for oil and natural gas and thus the prices available for sales of oil and natural gas.
Regulation
Our oil and gas operations are subject to various U.S. federal, state and local laws and regulations.
Various aspects of our oil and natural gas operations are regulated by certain agencies of the federal government for our operations on federal leases. The jurisdictions in which we own or operate producing oil and natural gas properties have statutory provisions regulating the exploration for and production of oil and natural gas, including provisions requiring permits for the drilling of wells, maintaining bonding requirements in order to drill or operate wells, provisions relating to the location of wells, the method of drilling and casing wells, the surface use and restoration of properties upon which wells are drilled and the abandonment of wells. Our operations are also subject to various conservation laws and regulations. These include the regulation of the size of drilling and spacing units or proration units, the number of wells that may be drilled in an area and the unitization or pooling of oil and natural gas properties. In this regard, some agencies can order the pooling or integration of tracts to facilitate exploration while others rely on voluntary pooling of lands and leases. In addition, certain conservation laws establish maximum
3
rates of production from oil and natural gas wells, generally prohibit the venting or flaring of natural gas and impose certain requirements regarding the ratability or fair apportionment of production from fields and individual wells.
Outer Continental Shelf Regulation. Our operations on federal oil and gas leases in the GOM are subject to regulation by the Bureau of Safety and Environmental Enforcement (“BSEE”) and the Bureau of Ocean Energy Management (“BOEM”). These leases contain relatively standardized terms and require compliance with detailed BSEE and BOEM regulations and orders issued pursuant to various federal laws, including the Outer Continental Shelf Lands Act. These laws and regulations are subject to change, and many new requirements, including those related to safety, permitting and performance, were imposed by the BSEE and BOEM subsequent to the April 2010 Deepwater Horizon incident. For offshore operations, lessees must obtain BOEM approval for exploration, development and production plans prior to the commencement of such operations. In addition to permits required from other agencies such as the U.S. Environmental Protection Agency (the “EPA”), lessees must obtain a permit from the BSEE prior to the commencement of drilling and comply with regulations governing, among other things, engineering and construction specifications for production facilities, safety procedures, plugging and abandonment of wells on the Outer Continental Shelf (“OCS”), calculation of royalty payments and the valuation of production for this purpose, and removal of facilities. These rules are frequently subject to change. For example, in April 2016, BSEE published a final rule on well control that, among other things, imposes rigorous standards relating to the design, operation and maintenance of blow-out preventers, real-time monitoring of deepwater and high temperature, high pressure drilling activities, and enhanced reporting requirements. Pursuant to President Trump’s Executive Orders dated March 28, 2017, and April 28, 2017 (the “Executive Orders”), respectively, BSEE initiated a review of the well control regulations to determine whether the rules are consistent with the stated policy of encouraging energy exploration and production, while ensuring that any such activity is safe and environmentally responsible. On October 24, 2017, BSEE announced, in a report published by the Department of the Interior, that it is considering several revisions to the regulations and that it is in the process of determining the most effective way to engage stakeholders in the process.
Also, in April 2016, BOEM published a proposed rule that would update existing air emissions requirements relating to offshore oil and natural gas activity on the OCS. BOEM regulates these air emissions in connection with its review of exploration and development plans, rights of way and rights of use and/or easement applications. The proposed rule would bolster existing air emissions requirements by, among other things, requiring the reporting and tracking of the emissions of all pollutants defined by the EPA to affect human health and public welfare. Pursuant to the Executive Orders, BOEM is reviewing the proposed air quality rule. On October 24, 2017, the Department of the Interior announced that it is currently reviewing recommendations on how to proceed, including promulgating final rules for certain necessary provisions and issuing a new proposed rule that may withdraw certain provisions and seek additional input on others.
Compliance with new and future regulations could result in significant costs, including increased capital expenditures and operating costs, and could adversely impact our business. In addition, under certain circumstances, BSEE may require Stone’s operations on federal leases to be suspended or terminated. Any such suspension or termination could adversely affect our financial condition and operations.
Furthermore, hurricanes in the GOM can have a significant impact on oil and natural gas operations on the OCS. The effects from past hurricanes have included structural damage to fixed production facilities, semi-submersibles and jack-up drilling rigs. BOEM and BSEE continue to be concerned about the loss of these facilities and rigs as well as the potential for catastrophic damage to key infrastructure and the resultant pollution from future storms. In an effort to reduce the potential for future damage, BOEM and BSEE have periodically issued guidance aimed at improving platform survivability by taking into account environmental and oceanic conditions in the design of platforms and related structures. It is possible that similar, if not more stringent, requirements will be issued by BOEM and BSEE for future hurricane seasons. New requirements, if any, could increase Stone’s operating costs and/or capital expenditures.
In addition, in order to cover the various decommissioning obligations of lessees on the OCS, BOEM generally requires that lessees post some form of acceptable financial assurances that such obligations will be met, such as surety bonds. Historically, we have been able to obtain an exemption from most bonding requirements based on our financial net worth. However, on March 21, 2016, we received notice letters from BOEM stating that BOEM had determined that we no longer qualified for a supplemental bonding waiver under the financial criteria specified in BOEM’s guidance to lessees at that time. In late March 2016, we proposed a tailored plan to BOEM for financial assurances relating to our abandonment obligations, which provides for posting some incremental financial assurances in favor of BOEM. On May 13, 2016, we received notice letters from BOEM rescinding its demand for supplemental bonding with the understanding that we will continue to make progress with BOEM towards finalizing and implementing our long-term tailored plan. Currently, we have posted an aggregate of approximately $115 million in surety bonds in favor of BOEM, third-party bonds, and letters of credit, all relating to our offshore abandonment obligations.
In July 2016, BOEM issued a new notice to lessees and operators (the “NTL”), with an effective date of September 12, 2016, that augments requirements for the posting of additional financial assurance by offshore lessees. The NTL details procedures to
4
determine a lessee’s ability to carry out its lease obligations (primarily the decommissioning of OCS facilities) and whether to require lessees to furnish additional financial assurances to meet BOEM’s estimate of the lessees decommissioning obligations. The NTL supersedes the agency’s prior practice of allowing operators of a certain net worth to waive the need for supplemental bonds and provides updated criteria for determining a lessee’s ability to self-insure only a small portion of its OCS liabilities based upon the lessee’s financial capacity and financial strength. The NTL also allows lessees to meet their additional financial security requirements pursuant to an individually approved tailored plan, whereby an operator and BOEM agree to set a timeframe for the posting of additional financial assurances.
We received a self-insurance letter from BOEM dated September 30, 2016 stating that we were not eligible to self-insure any of our additional security obligations. We received a proposal letter from BOEM dated October 20, 2016 indicating that additional security may be required. The September 30, 2016 self-insurance determination letter was rescinded by BOEM on March 24, 2017. BOEM has rescinded that order and all other sole-liability orders (i.e., orders related to properties for which there is no other current or prior owner who is liable) until further notice.
In the first quarter of 2017, BOEM announced that it would extend the implementation timeline for the July 2016 NTL by an additional six months. Furthermore, on April 28, 2017, President Trump issued an executive order directing the Secretary of the Interior to review the NTL to determine whether modifications are necessary to ensure operator compliance with lease terms while minimizing unnecessary regulatory burdens. On June 22, 2017, BOEM announced that, pending its review of the NTL, the implementation timeline would be indefinitely extended, subject to certain exceptions. At this time, it is uncertain when, or if, the July 2016 NTL will be implemented or whether a revised NTL might be proposed. Compliance with the NTL, or any other new rules, regulations, or legal initiatives by BOEM or other governmental authorities that impose more stringent requirements adversely affecting our offshore activities could delay or disrupt our operations, result in increased supplemental bonding and costs, limit our activities in certain areas, cause us to incur penalties or fines or to shut-in production at one or more of our facilities, or result in the suspension or cancellation of leases.
If fully implemented, the July 2016 NTL is likely to result in the loss of supplemental bonding waivers for a large number of operators on the OCS, which will in turn force these operators to seek additional surety bonds and could, consequently, challenge the surety bond market’s capacity for providing such additional financial assurance. Operators who have already leveraged their assets as a result of the declining oil market could face difficulty obtaining surety bonds because of concerns the surety companies may have about the priority of their lien on the operator’s collateral. All of these factors may make it more difficult for us to obtain the financial assurances required by BOEM to conduct operations on the OCS. These and other changes to BOEM bonding and financial assurance requirements could result in increased costs on our operations and consequently have a material adverse effect on our business and results of operations. See Part II. Item 7. Management’s Discussion and Analysis of Financial Condition and Results of Operations.
Natural Gas. In 2005, the United States Congress enacted the Energy Policy Act of 2005 (“EPAct 2005”). Among other matters, EPAct 2005 amends the Natural Gas Act (the “NGA”) to make it unlawful for “any entity”, including otherwise non-jurisdictional producers such as Stone Energy, to use any deceptive or manipulative device or contrivance in connection with the purchase or sale of natural gas or the purchase or sale of transportation services subject to regulation by the Federal Energy Regulatory Commission (the “FERC”), in contravention of rules prescribed by the FERC. In 2006, the FERC issued rules implementing this provision. The rules make it unlawful in connection with the purchase or sale of natural gas subject to the jurisdiction of the FERC, or the purchase or sale of transportation services subject to the jurisdiction of the FERC, for any entity, directly or indirectly, to use or employ any device, scheme or artifice to defraud, to make any untrue statement of material fact or omit to make any such statement necessary to make the statements made not misleading or to engage in any act or practice that operates as a fraud or deceit upon any person. EPAct 2005 also gives the FERC authority to impose civil penalties for violations of the NGA up to $1 million per day per violation. The anti-manipulation rule does not apply to activities that relate only to intrastate or other non-jurisdictional sales or gathering but does apply to activities of otherwise non-jurisdictional entities to the extent the activities are conducted “in connection with” gas sales, purchases or transportation subject to FERC jurisdiction. It therefore reflects a significant expansion of the FERC’s enforcement authority. The U.S. Commodity Futures Trading Commission (the “CFTC”) has similar authority with respect to energy futures commodity markets. Stone Energy does not anticipate it will be affected any differently by these requirements than other producers of natural gas.
Our sales of natural gas are affected by the availability, terms and cost of transportation. The price and terms for access to pipeline transportation are subject to extensive regulation. The FERC has undertaken various initiatives to increase competition within the natural gas industry, including requiring interstate pipelines to provide firm and interruptible transportation service on an open access basis that is equal for all natural gas supplies. In addition, the natural gas pipeline industry is also subject to state regulations, which may change from time to time in ways that affect the availability, terms and cost of transportation. However, we do not believe that any such changes would affect our business in a way that would be materially different from the way such changes would affect our competitors.
5
Oil. Effective November 4, 2009, pursuant to the Energy Independence and Security Act of 2007, the Federal Trade Commission (the “FTC”) issued a rule prohibiting market manipulation in the petroleum industry. The FTC rule prohibits any person, directly or indirectly, in connection with the purchase or sale of crude oil, gasoline or petroleum distillates at wholesale, from knowingly engaging in any act, practice or course of business, including the making of any untrue statement of material fact, that operates or would operate as a fraud or deceit upon any person or intentionally failing to state a material fact that under the circumstances renders a statement made by such person misleading, provided that such omission distorts or is likely to distort market conditions for any such product. A violation of this rule may result in civil penalties of up to $1 million per day per violation, in addition to any applicable penalty under the FTC Act.
Our sales of crude oil, condensate and natural gas liquids (“NGL”s) are not currently regulated and are transacted at market prices. In a number of instances, however, the ability to transport and sell such products is dependent on pipelines whose rates, terms and conditions of service are subject to FERC jurisdiction under the Interstate Commerce Act. The price we receive from the sale of oil and NGLs is affected by the cost of transporting those products to market. Interstate transportation rates for oil, NGLs and other products are regulated by the FERC. The FERC has established an indexing system for such transportation, which allows such pipelines to take an annual inflation-based rate increase.
In other instances, the ability to transport and sell such products is dependent on pipelines whose rates, terms and conditions of service are subject to regulation by state regulatory bodies under state statutes. As it relates to intrastate crude oil, condensate and NGL pipelines, state regulation is generally less rigorous than the federal regulation of interstate pipelines. State agencies have generally not investigated or challenged existing or proposed rates in the absence of shipper complaints or protests, which are infrequent and are usually resolved informally.
We do not believe that the regulatory decisions or activities relating to interstate or intrastate crude oil, condensate and NGL pipelines will affect us in a way that materially differs from the way it affects other crude oil, condensate and NGL producers or marketers.
Miscellaneous. Additional proposals and proceedings that might affect the oil and gas industry are regularly considered by the United States Congress, state regulatory bodies, BOEM, BSEE, FERC and other federal regulatory bodies and the courts. We cannot predict when or whether any such proposals may become effective. In the past, the oil and natural gas industry has been heavily regulated. We can give no assurance that the regulatory approach currently pursued by BOEM, BSEE, FERC or any other state or federal agency will continue indefinitely.
Environmental Regulation
As a lessee and operator of offshore oil and gas properties in the United States, we are subject to stringent federal, state and local laws and regulations relating to the protection of the environment, worker health and safety, and natural resources, as well as controlling the manner in which various substances, including wastes generated in connection with oil and gas industry operations, are released into the environment. Compliance with these laws and regulations may require us to obtain permits authorizing air emissions and wastewater discharge from operations and can affect the location or size of wells and facilities, limit or prohibit the extent to which exploration and development may be allowed, and require proper closure of wells and restoration of properties that are being abandoned. Failure to comply with these laws and regulations may result in the assessment of administrative, civil or criminal penalties, imposition of remedial obligations, incurrence of capital costs to comply with governmental standards, and even injunctions that limit or prohibit exploration and production operations or the disposal of substances generated in connection with oil and gas industry operation. The following is a summary of some of the existing laws, rules and regulations to which our business is subject.
Hazardous Substances and Waste Management. The Resource Conservation and Recovery Act (the “RCRA”) generally regulates the disposal of solid and hazardous wastes and imposes certain environmental cleanup obligations. Although RCRA specifically excludes from the definition of hazardous waste “drilling fluids, produced waters and other wastes associated with the exploration, development or production of crude oil, natural gas or geothermal energy,” the EPA and state agencies may regulate these wastes as solid wastes. In addition, in December 2016, the EPA and environmental groups entered into a consent decree to address the EPA’s alleged failure to timely assess its RCRA Subtitle D criteria regulations exempting certain exploration and production related oil and gas wastes from regulation as hazardous wastes under RCRA. The consent decree requires the EPA to propose a rulemaking no later than March 15, 2019 for revision of certain Subtitle D criteria regulations pertaining to oil and gas wastes or to sign a determination that revision of the regulations is not necessary. If the EPA proposes rulemaking for revised oil and gas regulations, the consent decree requires that the EPA take final action following notice and comment rulemaking no later than July 15, 2021. A loss of the RCRA exclusion for drilling fluids, produced waters and related wastes could result in an increase in our costs to manage and dispose of generated wastes, which could have a material adverse effect on our results of operations and financial position. Also, in the course of our operations, we generate some amounts of ordinary industrial wastes, such as paint
6
wastes, waste solvents, laboratory wastes and waste oils that may be regulated as hazardous wastes if such wastes have hazardous characteristics.
Comprehensive Environmental Response, Compensation and Liability Act. The Comprehensive Environmental Response, Compensation and Liability Act (the “CERCLA”, or the “Superfund Law”) and comparable state laws impose liability, without regard to fault or the legality of the original conduct, on persons that are considered to have contributed to the release of a “hazardous substance” into the environment. Such “responsible persons” may be subject to joint and several liability under the Superfund Law for the costs of cleaning up the hazardous substances that have been released into the environment and for damages to natural resources. Further, it is not uncommon for coastal landowners or other third parties to file claims for personal injury and property damage allegedly caused by the hazardous substances released into the environment.
We currently operate or lease, and have in the past operated or leased, a number of properties that for many years have been used in operations related to the exploration and production of oil and gas. Although we have utilized operating and disposal practices that were standard in the industry at the time, hydrocarbons or wastes may have been disposed of or released on or under the properties operated or leased by us or on or under other locations where such substances have been taken for recycling or disposal. In addition, many of these properties have been operated by third parties whose storage, treatment and disposal or release of hydrocarbons or wastes was not under our control. These properties and the hydrocarbons and wastes disposed thereon may be subject to laws and regulations imposing strict, joint and several liability, without regard to fault or the legality of the original conduct, that could require us to remove or remediate previously disposed wastes or environmental contamination, or to perform remedial plugging or pit closure to prevent future contamination.
Oil Pollution Act. The Oil Pollution Act of 1990 (“OPA”) holds owners and operators of offshore oil production or handling facilities, including the lessee or permittee of the area where an offshore facility is located, strictly liable for the costs of removing oil discharged into waters of the United States and for certain damages from such spills. OPA assigns joint and several strict liability, without regard to fault, to each liable party for all containment and oil removal costs and a variety of public and private damages including, but not limited to, the costs of responding to a release of oil, natural resource damages and economic damages suffered by persons adversely affected by an oil spill. Although defenses exist to the liability imposed by OPA, they are limited. In addition, BOEM has finalized rules raising OPA’s damages liability cap from $75 million to $134 million. OPA also requires responsible parties to maintain evidence of financial responsibility in prescribed amounts. OPA currently requires a minimum financial responsibility demonstration of between $35 million to $150 million for companies operating on the OCS, although BOEM may increase this amount in certain situations. From time to time, the United States Congress has proposed amendments to OPA raising the financial responsibility requirements. If OPA is amended to increase the minimum level of financial responsibility, we may experience difficulty in providing financial assurances sufficient to comply with this requirement. We cannot predict at this time whether OPA will be amended or whether the level of financial responsibility required for companies operating on the OCS will be increased. In any event, if an oil discharge or substantial threat of discharge were to occur, we may be liable for costs and damages, which costs and liabilities could be material to our results of operations and financial position.
National Environmental Policy Act. The National Environmental Policy Act (“NEPA”) requires federal agencies, including the Department of the Interior, to consider the impacts their actions have on the human environment, and to prepare detailed statements for major federal actions having the potential to significantly impact the environment. These requirements can lead to additional costs and delays in permitting for operators as the Department of the Interior or its bureaus may need to prepare Environmental Assessments (“EA”) and more detailed Environmental Impact Statements (“EIS”) in support of its leasing and other activities that have the potential to significantly affect the quality of the environment. If the EA indicates that no significant impact is likely, then the agency can release a finding of no significant impact and carry on with the proposed action. Otherwise, the agency must then conduct a full-scale EIS. The NEPA process involves public input through comment. These comments, as well as the agency’s analysis of the proposed project, can result in changes to the nature of a proposed project, such as by limiting the scope of the project or requiring resource-specific mitigation. The adequacy of the agency’s NEPA process can be challenged in federal court by process participants. This process may result in delaying the permitting and development of projects, and result in increased costs.
Climate Change. From time to time, the United States Congress has considered a variety of tax, energy-related or environmental market-based mechanisms to promote or induce the reduction of emissions of greenhouse gases (“GHGs”) by several commercial or industrial sectors. In addition, more than one half of the states already have begun implementing legal measures such as renewable energy requirements or cap and trade programs to reduce emissions of GHGs.
Additionally, the United States is one of almost 200 nations that, in December 2015, agreed to the Paris Agreement, an international climate change agreement in Paris, France that calls for countries to set their own GHG emissions targets and be transparent about the measures each country will use to achieve its GHG emissions targets. The Paris Agreement entered into force on November 4, 2016. In June 2017, President Trump stated that the United States would withdraw from the Paris Agreement,
7
but may enter into a future international agreement related to GHGs. The Paris Agreement provides for a four-year exit process beginning when it took effect in November 2016, which would result in an effective exit date of November 2020. The United States’ adherence to the exit process is uncertain and/or the terms on which the United States may reenter the Paris Agreement or a separately negotiated agreement are unclear at this time.
In addition, the EPA has determined that emissions of carbon dioxide, methane and other GHGs present an endangerment to public health and the environment because emissions of such gases contribute to warming of the earth’s atmosphere and other climatic changes. Based on these findings, the EPA began adopting and implementing regulations to restrict emissions of GHGs under existing provisions of the federal Clean Air Act (the “CAA”). The EPA adopted two sets of rules regulating GHG emissions under the CAA, one of which requires a reduction in emissions of greenhouse gases from motor vehicles and the other of which regulates emissions of GHGs from certain large stationary sources through preconstruction and operating permit requirements. The EPA has also adopted rules requiring the reporting of GHG emissions from specified large GHG emission sources in the United States, on an annual basis.
Recent regulation of GHGs has focused on fugitive methane emissions. For example, in June 2016, the EPA finalized rules that established new air emission controls for emissions of methane from certain equipment and processes in the oil and natural gas source category, including production, processing, transmission and storage activities. The EPA’s rule package includes first-time standards to address emissions of methane from equipment and processes across the source category, including hydraulically fractured oil and natural gas well completions. However, in a March 28, 2017 executive order, President Trump directed the EPA to review the 2016 regulations and, if appropriate, to initiate a rulemaking to rescind or revise them consistent with the stated policy of promoting clean and safe development of the nation’s energy resources, while at the same time avoiding regulatory burdens that unnecessarily encumber energy production. On June 16, 2017, the EPA published a proposed rule to stay for two years certain requirements of the 2016 regulations, including fugitive emission requirements. The regulations will remain in effect unless revised or repealed by separate EPA rulemaking in the future, which is likely to be challenged in court.
The adoption of legislation or regulatory programs to reduce emissions of greenhouse gases could require us to incur increased operating costs, such as costs to purchase and operate emissions control systems, to acquire emissions allowances or to comply with new regulatory or reporting requirements. Substantial limitations on greenhouse gas emissions could also adversely affect demand for the oil and natural gas we produce and lower the value of our reserves. Consequently, legislation and regulatory programs to reduce emissions of greenhouse gases could have an adverse effect on our business, financial condition and results of operations.
Finally, it should be noted that some scientists have concluded that increasing concentrations of GHGs in the Earth’s atmosphere may produce climate changes that have significant physical effects, such as increased frequency and severity of storms, droughts, floods and other climatic events. Our offshore operations are particularly at risk from severe climatic events. If any such climate changes were to occur, they could have an adverse effect on our financial condition and results of operations. However, at this time, we are unable to determine the extent to which climate change may lead to increased storm or weather hazards affecting our operations.
Water discharges. Stone’s discharges into waters of the United States are limited by the federal Clean Water Act (“CWA”) and analogous state laws. The CWA prohibits any discharge of pollutants, including spills and leaks of oil and other substances, into waters of the United States, except in compliance with permits issued by federal and state governmental agencies. These discharge permits also include monitoring and reporting obligations. Failure to comply with the CWA, including discharge limits set by permits issued pursuant to the CWA, may also result in administrative, civil or criminal enforcement actions. Violations of the CWA can result in suspension, debarment or the imposition of statutory disability, each of which prevents companies and individuals from participating in government contracts and receiving some non-procurement government benefits. The CWA also requires the preparation of oil spill response plans and spill prevention, control and countermeasure plans.
Air emissions. The CAA and comparable state statutes restrict the emission of air pollutants and affect both onshore and offshore oil and natural gas operations. New facilities may be required to obtain separate construction and operating permits before construction work can begin or operations may start, and existing facilities may be required to incur capital costs in order to remain in compliance. Also, the EPA has developed, and continues to develop, more stringent regulations governing emissions of toxic air pollutants, and is considering the regulation of additional air pollutants and air pollutant parameters. For example, in October 2015, the EPA lowered the National Ambient Air Quality Standard (“NAAQS”) for ozone from 75 to 70 parts per billion. State implementation of the revised NAAQS could result in stricter permitting requirements, delay or prohibit our ability to obtain such permits, and result in increased expenditures for pollution control equipment, the costs of which could be significant.
Worker Health and Safety. The Occupational Safety and Health Act (“OSHA”) and comparable state statutes regulate the protection of the health and safety of workers. The OSHA hazard communication standard requires maintenance of information
8
about hazardous materials used or produced in operations and provision of such information to employees. Other OSHA standards regulate specific worker safety aspects of our operations. Failure to comply with OSHA requirements can lead to the imposition of penalties.
Endangered Species. The Endangered Species Act (“ESA”) restricts activities that may affect federally identified endangered and threatened species or their habitats. Additionally, the Migratory Bird Treaty Act (“MBTA”) implements various treaties and conventions between the United States and certain other nations for the protection of migratory birds. Under the MBTA, the taking, killing or possessing of migratory birds is unlawful without a permit, though, in December 2017, the U.S. Fish and Wildlife Service (the “USFWS”) provided guidance limiting the reach of the MBTA. The Marine Mammal Protection Act similarly prohibits the taking of marine mammals without authorization. We conduct operations on oil and natural gas leases in areas where certain species that are listed as threatened or endangered are known to exist and where other species that potentially could be listed as threatened or endangered under the ESA may exist. Historically, our compliance costs for the protection of marine species have not had a material adverse effect on our results of operations; however, there can be no assurance that such costs will not be material in the future. The USFWS or the National Marine Fisheries Service may designate critical habitat that it believes is necessary for survival of a threatened or endangered species. A critical habitat designation could result in further material restrictions to federal land use and may materially delay or prohibit access to protected areas for oil and natural gas development. These statutes may result in operating restrictions or a temporary, seasonal or permanent ban in affected areas.
We have made, and will continue to make, expenditures on a regular basis relating to environmental compliance. Although we maintain pollution insurance to cover a portion of the costs of cleanup operations, public liability and physical damage, there is no assurance that such insurance will be adequate to cover all such costs or that such insurance will continue to be available in the future. To date, we believe that our expenditures related to compliance with existing environmental requirements has not had a material effect on our results of operations or financial condition. However, we also believe that it is reasonably likely that the historical trend in environmental legislation and regulation will continue toward stricter standards and, thus, we cannot give any assurance that material costs and liabilities will not be incurred in the future. Such costs may result in increased costs of operations and acquisitions and decreased production, and may have a material adverse impact on our results of operations and financial condition.
We have established internal guidelines to be followed in order to comply with environmental laws and regulations in the United States. We employ a safety, environmental and regulatory department whose responsibilities include providing assurance that our operations are carried out in accordance with applicable environmental guidelines and safety precautions and track regulatory developments applicable to our operations, such as the ones described in the paragraphs above.
Employees
On March 9, 2018, we had 158 full-time employees. We believe that our relationships with our employees are satisfactory. None of our employees are covered by a collective bargaining agreement. We utilize the services of independent contractors to perform various daily operational duties.
Available Information
We make available free of charge on our Internet website (www.stoneenergy.com) our Annual Report on Form 10-K, Quarterly Reports on Form 10-Q, Current Reports on Form 8-K and other filings pursuant to Section 13(a) or 15(d) of the Securities Exchange Act of 1934, as amended (the “Exchange Act”), and amendments to such filings, as soon as reasonably practicable after each are electronically filed with, or furnished to, the Securities and Exchange Commission (“SEC”). We also make available on our Internet website our Code of Business Conduct and Ethics, Corporate Governance Guidelines and Audit, Compensation, Nominating & Governance, Reserves and Safety Committee Charters, which have been approved by our Board. Copies of these documents are also available free of charge by writing to us at: Chief Financial Officer, Stone Energy Corporation, P.O. Box 52807, Lafayette, LA 70505. The annual CEO certification required by Section 303A.12 of the New York Stock Exchange Listed Company Manual was submitted on December 14, 2017.
Financial Information
Our financial information is included in the consolidated financial statements and the related notes beginning on page F-1.
9
Forward-Looking Statements
The information in this Form 10-K includes “forward-looking statements” within the meaning of Section 27A of the Securities Act of 1933, as amended (the “Securities Act”), and Section 21E of the Exchange Act. All statements, other than statements of historical or current facts, that address activities, events, outcomes and other matters that we plan, expect, intend, assume, believe, budget, predict, forecast, project, estimate or anticipate (and other similar expressions) will, should or may occur in the future are forward-looking statements. These forward-looking statements are based on management’s current belief, based on currently available information, as to the outcome and timing of future events. When considering forward-looking statements, you should keep in mind the risk factors and other cautionary statements in this Form 10-K.
Forward-looking statements may appear in a number of places in this Form 10-K and include statements with respect to, among other things:
• | expected results from risk-weighted drilling activities; |
• | estimates of our future oil and natural gas production, including estimates of any increases in oil and natural gas production; |
• | planned capital expenditures and the availability of capital resources to fund capital expenditures; |
• | our outlook on oil and natural gas prices; |
• | estimates of our oil and natural gas reserves; |
• | any estimates of future earnings growth; |
• | the impact of political and regulatory developments; |
• | our outlook on the resolution of pending litigation and government inquiry; |
• | estimates of the impact of new accounting pronouncements on earnings in future periods; |
• | our future financial condition or results of operations and our future revenues and expenses; |
• | the outcome of restructuring efforts and asset sales; |
• | the amount, nature and timing of any potential acquisition or divestiture transactions; |
• | any expected results or benefits associated with our acquisitions; |
• | our access to capital and our anticipated liquidity; |
• | estimates of future income taxes; |
• | our business strategy and other plans and objectives for future operations, including the Board’s assessment of the Company’s strategic direction; |
• | our ability to consummate our proposed combination transaction with Talos; and |
• | the timing of the consummation of the proposed combination transaction with Talos. |
We caution you that these forward-looking statements are subject to all of the risks and uncertainties, many of which are beyond our control, incident to the exploration for and development, production and marketing of oil and natural gas. These risks include, among other things:
• | commodity price volatility, including further or sustained declines in the prices we receive for our oil and natural gas production; |
• | domestic and worldwide economic conditions, which may adversely affect the demand for and supply of oil and natural gas; |
• | the availability of capital on economic terms to fund our operations, capital expenditures, acquisitions and other obligations; |
• | our future level of indebtedness, liquidity and compliance with debt covenants; |
• | our future financial condition, results of operations, revenues, cash flows and expenses; |
• | the potential need to sell certain assets or raise additional capital; |
• | our ability to post additional collateral for current bonds or comply with new supplemental bonding requirements imposed by BOEM; |
• | declines in the value of our oil and gas properties resulting in a decrease in the borrowing base under our bank credit facility and impairments; |
• | our ability to develop, explore for, acquire and replace oil and natural gas reserves and sustain production; |
• | the impact of a financial crisis on our business operations, financial condition and ability to raise capital; |
• | the ability of financial counterparties to perform or fulfill their obligations under existing agreements; |
• | third-party interruption of sales to market; |
• | inflation; |
• | lack of availability and cost of goods and services; |
• | market conditions relating to potential acquisition and divestiture transactions; |
• | regulatory and environmental risks associated with drilling and production activities; |
10
• | our ability to establish operations or production on our acreage prior to the expiration of related leaseholds; |
• | availability of drilling and production equipment, facilities, field service providers, gathering, processing and transportation; |
• | competition in the oil and gas industry; |
• | our inability to retain and attract key personnel; |
• | drilling and other operating risks, including the consequences of a catastrophic event; |
• | unsuccessful exploration and development drilling activities; |
• | hurricanes and other weather conditions; |
• | availability, cost and adequacy of insurance coverage; |
• | adverse effects of changes in applicable tax, environmental, derivatives, permitting, bonding and other regulatory requirements and legislation, as well as agency interpretation and enforcement and judicial decisions regarding the foregoing; |
• | uncertainty inherent in estimating proved oil and natural gas reserves and in projecting future rates of production and timing of development expenditures; and |
• | other risks described in this Form 10-K. |
Should one or more of the risks or uncertainties described above or elsewhere in this Form 10-K occur, or should underlying assumptions prove incorrect, our actual results and plans could differ materially from those expressed in any forward-looking statements. We specifically disclaim all responsibility to publicly update any information contained in a forward-looking statement or any forward-looking statement in its entirety and therefore disclaim any resulting liability for potentially related damages. All forward-looking statements attributable to us are expressly qualified in their entirety by this cautionary statement.
ITEM 1A. RISK FACTORS
Our business is subject to a number of risks including, but not limited to, those described below:
Risks Relating to the Pending Talos Combination
The Transactions may not be completed on the terms or timeline currently contemplated, or at all, and failure to complete the Transactions may result in material adverse consequences to our business and operations.
The transactions contemplated by the Transaction Agreement (the “Transaction Agreement”), dated as of November 21, 2017, among Stone, certain of Stone’s subsidiaries, Talos Energy, and Talos Production (the “Transactions”) are subject to several closing conditions, including, among others, the following:
• | receipt of the approval of our shareholders; |
• | receipt of clearances and approvals under the rules of antitrust and competition law authorities in the United States; |
• | the absence of any law or order prohibiting the consummation of the Transactions; |
• | receipt of governmental consents and approvals; |
• | the effectiveness of the registration statement on Form S-4, and any amendment thereof, filed in connection with the Talos combination, and there being no pending or threatened stop order relating thereto; |
• | approval for listing on the New York Stock Exchange (the “NYSE”) of the shares of New Talos common stock issuable pursuant to the Transaction Agreement; |
• | the satisfaction of closing conditions of the Debt Exchange Agreement, dated as of November 21, 2017, by and among Talos Production, Talos Production Finance Inc., Stone, New Talos and the lenders and noteholders listed on the schedules thereto, including the ability to contemporaneously close such transactions with the other transactions to occur at closing; |
• | the consummation of a tender offer and consent solicitation pursuant to which the holders of a majority of the Company’s 7 ½% Senior Second Lien Notes due 2022 (the “2022 Second Lien Notes”) (excluding the 2022 Second Lien Notes held by Franklin Advisers, Inc. (“Franklin”) and MacKay Shields LLC (“MacKay Shields”) on behalf of their clients and managed funds) will have been tendered for the consideration offered thereunder and the effectiveness of a supplemental indenture to the indenture governing the 2022 Second Lien Notes that eliminates substantially all of the restrictive covenants in such indenture; and |
• | the satisfaction of closing conditions of the Support Agreement, dated as of November 21, 2017, by and among Stone, New Talos, Apollo Management and Riverstone, and the ability to contemporaneously close such transactions with the other transactions to occur at closing. |
11
If any one of these conditions is not satisfied or waived, the Transactions may not be completed. There is no assurance that the Transactions will be completed on the terms or timeline currently contemplated, or at all.
Governmental or regulatory agencies could impose conditions on the completion of the Transactions or require changes to the terms of the Transaction Agreement or other agreements to be entered into in connection with the Transactions. Such conditions or changes could have the effect of delaying or impeding the completion of the Transactions. If these approvals are not received, then neither Stone nor Talos Energy will be obligated to complete the Transactions.
If our stockholders do not adopt the Transaction Agreement or if the Transactions are not completed for any other reason, we would be subject to a number of risks, including the following:
• | we will be required to pay our costs related to the Transactions, such as legal, accounting, financial advisory, and printing fees, whether or not the Transactions are completed; |
• | our management has committed time and resources to matters relating to the Transactions that otherwise could have been devoted to pursuing other beneficial opportunities; |
• | we and our stockholders would not realize the anticipated strategic benefits of the Transactions; |
• | we may be required to pay a termination fee and to reimburse transaction expenses to Talos Energy if the Transaction Agreement is terminated under certain circumstances; |
• | the potential occurrence of litigation related to any failure to complete the Transactions; |
• | if the Transaction Agreement is terminated and our Board seeks another business combination, our stockholders cannot be certain that we will be able to find a party willing to enter into a transaction agreement on terms equivalent to or more attractive than the terms in the Transaction Agreement; and |
• | the trading price of our common stock may decline or experience increased volatility to the extent that the current market prices reflect a market assumption that the Transactions will be completed. |
The occurrence of any of these events individually or in combination could have a material adverse effect on our results of operations or the trading price of our common stock. We are also exposed to general competitive pressures and risks, which may be increased if the Transactions are not completed.
We will be subject to business uncertainties and contractual restrictions while the Transactions are pending that could adversely affect us.
Uncertainty about the effect of the Transactions on our employees and our business relationships may have an adverse effect on us, regardless of whether the Transactions are eventually completed. These uncertainties may impair our ability to attract, retain and motivate key personnel until the Transactions are completed, or the Transaction Agreement is terminated, and for a period of time thereafter, and could cause customers, suppliers and others that deal with us to seek to change existing business relationships with Stone or to delay or defer certain business decisions.
The pursuit of the Transactions and the preparation for our potential integration with Talos Energy have placed, and will continue to place, a significant burden on the management and internal resources of Stone. There is a significant degree of difficulty and management distraction inherent in the process of closing the Transactions and integrating Stone and Talos Energy, which could cause an interruption of, or loss of momentum in, the activities of our existing business, regardless of whether the Transactions are eventually completed. Before and immediately following closing, our management team will be required to devote considerable amounts of time to this integration process, which will decrease the time they will have to manage our existing business. One potential consequence of such distractions could be the failure of management to realize other opportunities that could be beneficial to Stone. If our management is not able to effectively manage the process leading up to and immediately following closing, or if any significant business activities are interrupted as a result of the integration process, our business could suffer.
Under the terms of the Transaction Agreement, we are subject to certain restrictions on the conduct of our business until the earlier of the effective time of the combination or the termination of the Transaction Agreement, which may adversely affect our ability to execute certain of our business strategies, including the ability in certain cases to enter into contracts, acquire or dispose of assets, incur indebtedness or incur capital expenditures, as applicable. Such limitations could negatively affect our business and operations prior to the completion of the Transactions.
12
The Transaction Agreement contains provisions that may discourage other companies from trying to acquire Stone.
The Transaction Agreement contains provisions that may discourage third parties from submitting business combination proposals to Stone that might result in greater value to our stockholders than the Transactions. The Transaction Agreement generally prohibits us from soliciting any competing proposal. In addition, if the Transaction Agreement is terminated by us in circumstances that obligate us to pay a termination fee and to reimburse transaction expenses to Talos Energy, our financial condition may be adversely affected as a result of the payment of the termination fee and reimbursement of transaction expenses, which might deter third parties from proposing alternative business combination proposals.
Completion of the Transactions may trigger change in control or other provisions in certain agreements to which Stone is a party.
The completion of the Transactions may trigger change in control or other provisions in certain agreements to which Stone is a party. If we are unable to negotiate waivers of those provisions, the counterparties may exercise their rights and remedies under the agreements, potentially terminating the agreements or seeking monetary damages. Even if we are able to negotiate waivers, the counterparties may require a fee for such waivers or seek to renegotiate the agreements on terms less favorable to Stone.
Risks Relating to our Reorganization
The Plan was based in large part upon assumptions and analyses developed by us. Our actual financial results may vary materially from the projections that we filed in connection with the Plan. If these assumptions and analyses prove to be incorrect, the Plan may be unsuccessful in its execution.
The Plan affected both our capital structure and the ownership, structure and operation of our business and reflected assumptions and analyses based on our experience and perception of historical trends, current conditions and expected future developments, as well as other factors that we considered appropriate under the circumstances. In addition, the Plan relied upon financial projections, including with respect to revenues, EBITDA, capital expenditures, debt service and cash flow. The financial projections were prepared solely for the purpose of the bankruptcy proceedings and have not been, and will not be, updated on an ongoing basis and should not be relied upon by investors. Financial forecasts are necessarily speculative, and it is likely that one or more of the assumptions and estimates that were the basis of these financial forecasts will not be accurate. In our case, the forecasts were even more speculative than normal, because they involved fundamental changes in the nature of our capital structure. Accordingly, we expect that our actual financial condition and results of operations will differ, perhaps materially, from what we have anticipated. Consequently, there can be no assurance that the results or developments contemplated by the Plan will occur or, even if they do occur, that they will have the anticipated effects on us and our subsidiaries or our business or operations. The failure of any such results or developments to materialize as anticipated could materially adversely affect the successful execution of the Plan.
Our historical financial information may not be indicative of our future financial performance.
On February 28, 2017, the effective date of our emergence from bankruptcy, we adopted fresh start accounting and consequently, our assets and liabilities were adjusted to fair values and our accumulated deficit was restated to zero. Accordingly, our financial condition and results of operations following our emergence from Chapter 11 will not be comparable to the financial condition and results of operations reflected in our historical financial statements. Further, as a result of the implementation of the Plan and the transactions contemplated thereby, our historical financial information may not be indicative of our future financial performance.
There may be circumstances in which the interests of our significant stockholders could be in conflict with the interests of our other stockholders.
Funds advised by two significant stockholders currently hold approximately 36% and 20%, respectively, of our post-reorganization common stock. Circumstances may arise in which these stockholders may have an interest in pursuing or preventing acquisitions, divestitures or other transactions, including the issuance of additional shares or debt, that, in their judgment, could enhance their investment in us or another company in which they invest. Such transactions might adversely affect us or other holders of our common stock. In addition, our significant concentration of share ownership may adversely affect the trading price of our common shares because investors may perceive disadvantages in owning shares in companies with significant stockholders.
13
Business Risks
Oil and natural gas prices are volatile. Significant declines in commodity prices in the future may adversely affect our financial condition and results of operations, cash flows, access to the capital markets, and ability to grow.
Our revenues, cash flows, profitability and future rate of growth substantially depend upon the market prices of oil and natural gas. Prices affect our cash flows available for capital expenditures and our ability to access funds under our bank credit facility and through the capital markets. The amount available for borrowing under our bank credit facility is subject to a borrowing base, which is determined by the lenders taking into account our estimated proved reserves, and is subject to periodic redeterminations based on pricing models determined by the lenders at such time. Oil and natural gas prices significantly declined in second half of 2014, and sustained lower prices continued throughout 2015, 2016 and early 2017. Despite a modest recovery in late 2017, commodity prices could remain suppressed or decline further, which will likely have material adverse effects on the value of our estimated proved reserves and our borrowing base. Further, because we use the full cost method of accounting for our oil and gas operations, we perform a ceiling test each quarter, which is impacted by declining prices. Significant price declines could cause us to take additional ceiling test write-downs, which would be reflected as non-cash charges against current earnings. See “—Lower oil and natural gas prices and other factors have resulted, and in the future may result, in ceiling test write-downs and other impairments of our asset carrying values.”
In addition, significant or extended price declines may also adversely affect the amount of oil and natural gas that we can produce economically. A reduction in production could result in a shortfall in our expected cash flows and require us to reduce our capital spending or borrow funds to cover any such shortfall. Any of these factors could negatively impact our ability to replace our production and our future rate of growth.
The markets for oil and natural gas have been volatile historically and are likely to remain volatile in the future. The prices we receive for our oil and natural gas depend upon many factors beyond our control, including, among others:
• | changes in the supply of and demand for oil and natural gas; |
• | market uncertainty; |
• | level of consumer product demands; |
• | hurricanes and other weather conditions; |
• | domestic and foreign governmental regulations and taxes; |
• | price and availability of alternative fuels; |
• | political and economic conditions in oil-producing countries, particularly those in the Middle East, Russia, South America and Africa; |
• | actions by the Organization of Petroleum Exporting Countries; |
• | U.S. and foreign supply of oil and natural gas; |
• | price and quantity of oil and natural gas imports and exports; |
• | the level of global oil and natural gas exploration and production; |
• | the level of global oil and natural gas inventories; |
• | localized supply and demand fundamentals and transportation availability; |
• | speculation as to the future price of oil and the speculative trading of oil and natural gas futures contracts; |
• | price and availability of competitors’ supplies of oil and natural gas; |
• | technological advances affecting energy consumption; and |
• | overall domestic and foreign economic conditions. |
These factors make it very difficult to predict future commodity price movements with any certainty. Substantially all of our oil and natural gas sales are made in the spot market or pursuant to contracts based on spot market prices and are not long-term fixed price contracts. Further, oil prices and natural gas prices do not necessarily fluctuate in direct relation to each other.
14
Our debt level and the covenants in the current and any future agreements governing our debt could negatively impact our financial condition, results of operations and business prospects. Our failure to comply with these covenants could result in the acceleration of our outstanding indebtedness.
The terms of the current agreements governing our debt impose significant restrictions on our ability to take a number of actions that we may otherwise desire to take, including:
• | incurring additional debt; |
• | paying dividends on stock, redeeming stock or redeeming subordinated debt; |
• | making investments; |
• | creating liens on our assets; |
• | selling assets; |
• | guaranteeing other indebtedness; |
• | entering into agreements that restrict dividends from our subsidiary to us; |
• | merging, consolidating or transferring all or substantially all of our assets; |
• | hedging future production; and |
• | entering into transactions with affiliates. |
Our level of indebtedness, and the covenants contained in current and future agreements governing our debt could have important consequences on our operations, including:
• | requiring us to dedicate a substantial portion of our cash flow from operating activities to required payments on debt, thereby reducing the availability of cash flow for working capital, capital expenditures and other general business activities; |
• | limiting our ability to obtain additional financing in the future for working capital, capital expenditures, acquisitions and other general business activities; |
• | limiting our flexibility in planning for, or reacting to, changes in our business and the industry in which we operate; |
• | detracting from our ability to successfully withstand a downturn in our business or the economy generally; |
• | placing us at a competitive disadvantage against other less leveraged competitors; and |
• | making us vulnerable to increases in interest rates because debt under our bank credit facility is at variable rates. |
We may be required to repay all or a portion of our debt on an accelerated basis in certain circumstances. If we fail to comply with the covenants and other restrictions in the agreements governing our debt, it could lead to an event of default and the acceleration of our repayment of outstanding debt. Our ability to comply with these covenants and other restrictions may be affected by events beyond our control, including prevailing economic and financial conditions. Lower commodity prices have negatively impacted our revenues, earnings and cash flows, and sustained low oil and natural gas prices will have a material and adverse effect on our liquidity position. Our cash flow is highly dependent on the prices we receive for oil and natural gas, which declined significantly since mid-2014.
We depend on our bank credit facility for a portion of our future capital needs. We are required to comply with certain debt covenants and ratios under our bank credit facility. Our borrowing base under our bank credit facility, which is redetermined semi-annually, is based on an amount established by the lenders after their evaluation of our proved oil and natural gas reserve values. If, due to a redetermination of our borrowing base, our outstanding bank credit facility borrowings plus our outstanding letters of credit exceed our redetermined borrowing base (referred to as a borrowing base deficiency), we could be required to repay such borrowing base deficiency. Our current agreement with the banks allows us to cure a borrowing base deficiency through any combination of the following actions: (1) repay amounts outstanding sufficient to cure the borrowing base deficiency within 10 days after our written election to do so; (2) add additional oil and gas properties acceptable to the banks to the borrowing base and take such actions necessary to grant the banks a mortgage in such oil and gas properties within 30 days after our written election to do so and/or (3) pay the deficiency in six equal monthly installments.
We may not have sufficient funds to make such repayments. If we do not repay our debt out of cash on hand, we could attempt to restructure or refinance such debt, sell assets or repay such debt with the proceeds from an equity offering. We cannot assure you that we will be able to generate sufficient cash flows from operating activities to pay the interest on our debt or that future borrowings, equity financings or proceeds from the sale of assets will be available to pay or refinance such debt. The terms of our debt, including our bank credit facility and the indenture governing the 2022 Second Lien Notes, may also prohibit us from taking such actions. Factors that will affect our ability to raise cash through offerings of our capital stock, a refinancing of
15
our debt or a sale of assets include financial market conditions and our market value and operating performance at the time of such offerings, refinancing or sale of assets. We cannot assure you that any such offerings, restructuring, refinancing or sale of assets will be successfully completed.
Regulatory requirements and permitting procedures imposed by BOEM and BSEE could significantly delay our ability to obtain permits to drill new wells in offshore waters.
BOEM and BSEE have imposed new and more stringent permitting procedures and regulatory safety and performance requirements for new wells to be drilled in federal waters. Compliance with these added and more stringent regulatory requirements and with existing environmental and spill regulations, together with uncertainties or inconsistencies in decisions and rulings by governmental agencies and delays in the processing and approval of drilling permits and exploration, development, oil spill-response, and decommissioning plans and possible additional regulatory initiatives could result in difficult and more costly actions and adversely affect or delay new drilling and ongoing development efforts. Moreover, these governmental agencies are continuing to evaluate aspects of safety and operational performance in the GOM and, as a result, are continuing to develop and implement new, more restrictive requirements. For example, in April 2016, BSEE published a final rule on well control that, among other things, imposes rigorous standards relating to the design, operation and maintenance of blow-out preventers, real-time monitoring of deepwater and high temperature, high pressure drilling activities, and enhanced reporting requirements. Pursuant to President Trump’s Executive Orders dated March 28, 2017, and April 28, 2017 (the “Executive Orders”), respectively, BSEE initiated a review of the well control regulations to determine whether the rules are consistent with the stated policy of encouraging energy exploration and production, while ensuring that any such activity is safe and environmentally responsible. On October 24, 2017, BSEE announced, in a report published by the Department of the Interior, that it is considering several revisions to the regulations and that it is in the process of determining the most effective way to engage stakeholders in the process.
Also, in April 2016, BOEM published a proposed rule that would update existing air emissions requirements relating to offshore oil and natural gas activity on the OCS. BOEM regulates these air emissions in connection with its review of exploration and development plans, rights of way and rights of use, and/or easement applications. The proposed rule would bolster existing air emissions requirements by, among other things, requiring the reporting and tracking of the emissions of all pollutants defined by the EPA to affect human health and public welfare. Pursuant to the Executive Orders, BOEM is reviewing the proposed air quality rule. On October 24, 2017, the Department of the Interior announced that it is currently reviewing recommendations on how to proceed, including promulgating final rules for certain necessary provisions and issuing a new proposed rule that may withdraw certain provisions and seek additional input on others.
Compliance with new and future regulations could result in significant costs, including increased capital expenditures and operating costs, and could adversely impact our business. Furthermore, among other adverse impacts, new regulatory requirements could delay operations, disrupt our operations or increase the risk of leases expiring before exploration and development efforts have been completed due to the time required to develop new technology. This would result in increased financial assurance requirements and incurrence of associated added costs, limit operational activities in certain areas, or cause us to incur penalties or shut-in production at one or more of our facilities. If material spill incidents were to occur in the future, the United States or other countries where such an event may occur could elect to issue directives to temporarily cease drilling activities and, in any event, may from time to time issue further safety and environmental laws and regulations regarding offshore oil and natural gas exploration and development, any of which could have a material adverse effect on our business. We cannot predict with any certainty the full impact of any new laws or regulations on our drilling operations or on the cost or availability of insurance to cover some or all of the risks associated with such operations.
New guidelines recently issued by BOEM related to financial assurance requirements to cover decommissioning obligations for operations on the OCS may have a material adverse effect on our business, financial condition, or results of operations.
BOEM requires all operators in federal waters to provide financial assurances to cover the cost of plugging and abandoning wells and decommissioning offshore facilities. Historically, we have been able to obtain an exemption from most bonding requirements based on our financial net worth. On March 21, 2016, we received notice letters from BOEM stating that BOEM had determined that we no longer qualified for a supplemental bonding waiver under the financial criteria specified in BOEM’s guidance to lessees at that time. In late March 2016, we proposed a tailored plan to BOEM for financial assurances relating to our abandonment obligations, which provides for posting some incremental financial assurances in favor of BOEM. On May 13, 2016, we received notice letters from BOEM rescinding its demand for supplemental bonding with the understanding that we will continue to make progress with BOEM towards finalizing and implementing our long-term tailored plan. Currently, we have posted an aggregate of approximately $115 million in surety bonds in favor of BOEM, third party bonds and letters of credit, all relating to our offshore abandonment obligations.
16
In July 2016, BOEM issued a new NTL, with an effective date of September 12, 2016, that augments requirements for the posting of additional financial assurance by offshore lessees. The NTL details procedures to determine a lessee’s ability to carry out its lease obligations (primarily the decommissioning of OCS facilities) and whether to require lessees to furnish additional financial assurances to meet BOEM’s estimate of the lessees decommissioning obligations. The NTL supersedes the agency’s prior practice of allowing operators of a certain net worth to waive the need for supplemental bonds and provides updated criteria for determining a lessee’s ability to self-insure only a small portion of its OCS liabilities based upon the lessee’s financial capacity and financial strength. The NTL also allows lessees to meet their additional financial security requirements pursuant to an individually approved tailored plan, whereby an operator and BOEM agree to set a timeframe for the posting of additional financial assurances.
We received a self-insurance letter from BOEM dated September 30, 2016 stating that we were not eligible to self-insure any of our additional security obligations. We received a proposal letter from BOEM dated October 20, 2016 indicating that additional security may be required. The September 30, 2016 self-insurance determination letter was rescinded by BOEM on March 24, 2017. BOEM has rescinded that order and all other sole-liability orders (i.e., orders related to properties for which there is no other current or prior owner who is liable) until further notice.
In the first quarter of 2017, BOEM announced that it would extend the implementation timeline for the July 2016 NTL by an additional six months. Furthermore, on April 28, 2017, President Trump issued an executive order directing the Secretary of the Interior to review the NTL to determine whether modifications are necessary to ensure operator compliance with lease terms while minimizing unnecessary regulatory burdens. On June 22, 2017, BOEM announced that, pending its review of the NTL, the implementation timeline would be indefinitely extended, subject to certain exceptions. At this time, it is uncertain when, or if, the July 2016 NTL will be implemented or whether a revised NTL might be proposed. Compliance with the NTL, or any other new rules, regulations or legal initiatives by BOEM or other governmental authorities that impose more stringent requirements adversely affecting our offshore activities could delay or disrupt our operations, result in increased supplemental bonding and costs, limit our activities in certain areas, cause us to incur penalties or fines or to shut-in production at one or more of our facilities, or result in the suspension or cancellation of leases.
In addition, if fully implemented, the July 2016 NTL is likely to result in the loss of supplemental bonding waivers for a large number of operators on the OCS, which will in turn force these operators to seek additional surety bonds and could, consequently, challenge the surety bond market’s capacity for providing such additional financial assurance. Operators who have already leveraged their assets as a result of the declining oil market could face difficulty obtaining surety bonds because of concerns the surety companies may have about the priority of their lien on the operator’s collateral. Moreover, depressed oil prices could result in sureties seeking additional collateral to support existing bonds, such as cash or letters of credit, and Stone cannot provide assurance that it will be able to satisfy collateral demands for future bonds to comply with supplemental bonding requirements of BOEM. If we are required to provide collateral in the form of cash or letters of credit, our liquidity position could be negatively impacted and may require us to seek alternative financing. To the extent we are unable to secure adequate financing, we may be forced to reduce our capital expenditures. All of these factors may make it more difficult for us to obtain the financial assurances required by BOEM to conduct operations on the OCS. These and other changes to BOEM bonding and financial assurance requirements could result in increased costs on our operations and consequently have a material adverse effect on our business and results of operations.
A financial crisis may impact our business and financial condition and may adversely impact our ability to obtain funding under our current bank credit facility or in the capital markets.
Historically, we have used our cash flows from operating activities and borrowings under our bank credit facility to fund our capital expenditures and have relied on the capital markets and asset monetization transactions to provide us with additional capital for large or exceptional transactions. In the future, we may not be able to access adequate funding under our bank credit facility as a result of (i) a decrease in our borrowing base due to the outcome of a borrowing base redetermination or a breach or default under our bank credit facility, including a breach of a financial covenant or (ii) an unwillingness or inability on the part of our lending counterparties to meet their funding obligations. In addition, we may face limitations on our ability to access the debt and equity capital markets and complete asset sales, an increased counterparty credit risk on our derivatives contracts and the requirement by contractual counterparties of us to post collateral guaranteeing performance.
We require substantial capital expenditures to conduct our operations and replace our production, and we may be unable to obtain needed financing on satisfactory terms necessary to fund our planned capital expenditures.
We spend and will continue to spend a substantial amount of capital for the acquisition, exploration, exploitation, development and production of oil and natural gas reserves. We fund our capital expenditures primarily through operating cash flows, cash on hand and borrowings under our credit facility, if necessary. The actual amount and timing of our future capital expenditures may differ materially from our estimates as a result of, among other things, oil and natural gas prices, actual drilling
17
results, the availability of drilling rigs and other services and equipment, and regulatory, technological and competitive developments. A further reduction in commodity prices may result in a further decrease in our actual capital expenditures, which would negatively impact our ability to grow production.
Our cash flow from operations and access to capital are subject to a number of variables, including:
• | our proved reserves; |
• | the level of hydrocarbons we are able to produce from our wells; |
• | the prices at which our production is sold; |
• | our ability to acquire, locate and produce new reserves; and |
• | our ability to borrow under our credit facility. |
If low oil and natural gas prices, operating difficulties, declines in reserves or other factors, many of which are beyond our control, cause our revenues, cash flows from operating activities and the borrowing base under our credit facility to decrease, we may be limited in our ability to fund the capital necessary to complete our capital expenditure program. After utilizing our available sources of financing, we may be forced to raise additional debt or equity proceeds to fund such capital expenditures. We cannot be sure that additional debt or equity financing will be available or cash flows provided by operations will be sufficient to meet these requirements. For example, the ability of oil and gas companies to access the equity and high yield debt markets has been significantly limited since the significant decline in commodity prices since mid-2014.
Our production, revenue and cash flow from operating activities are derived from assets that are concentrated in a single geographic area, making us vulnerable to risks associated with operating in one geographic area.
Our production, revenue and cash flow from operating activities are derived from assets that are concentrated in a single geographic area in the GOM. Unlike other entities that are geographically diversified, we may not have the resources to effectively diversify our operations or benefit from the possible spreading of risks or offsetting of losses. Our lack of diversification may subject us to numerous economic, competitive and regulatory developments, any or all of which may have an adverse impact upon the particular industry in which we operate and result in our dependency upon a single or limited number of hydrocarbon basins. In addition, the geographic concentration of our properties in the GOM and the U.S. Gulf Coast means that some or all of the properties could be affected should the region experience:
•severe weather, such as hurricanes and other adverse weather conditions;
•delays or decreases in production, the availability of equipment, facilities or services;
•delays or decreases in the availability or capacity to transport, gather or process production;
•changes in the status of pipelines that we depend on for transportation of our production to the marketplace;
• | extensive governmental regulation (including regulations that may, in certain circumstances, impose strict liability for pollution damage or require posting substantial bonds to address decommissioning and plugging and abandonment costs and interruption or termination of operations by governmental authorities based on environmental, safety, or other considerations; and/or |
• | changes in the regulatory environment such as the new guidelines recently issued by BOEM related to financial assurance requirements to cover decommissioning obligations for operations on the OCS. |
Because all or a number of our properties could experience many of the same conditions at the same time, these conditions have a relatively greater impact on our results of operations than they might have on other producers who have properties over a wider geographic area.
We may experience significant shut-ins and losses of production due to the effects of hurricanes in the GOM.
Our production is exclusively associated with our properties in the GOM and the U.S. Gulf Coast. Accordingly, if the level of production from these properties substantially declines, it could have a material adverse effect on our overall production level and our revenue. We are particularly vulnerable to significant risk from hurricanes and tropical storms in the GOM. In past years, we have experienced shut-ins and losses of production due to the effects of hurricanes in the GOM. We are unable to predict what impact future hurricanes and tropical storms might have on our future results of operations and production. In accordance with industry practice, we maintain insurance against some, but not all, of these risks and losses.
18
A significant part of our production and estimated proved reserves are concentrated in one field.
As of and for the year ended December 31, 2017, approximately 65% of our estimated proved reserves and 53% of our production on a volume equivalent basis, respectively, were derived from our Pompano properties. Accordingly, if the level of production from these properties substantially declines, or is affected by a pipeline shut-in, it could have a material adverse effect on our overall production level and our revenue. If the actual reserves associated with these properties are less than our estimated reserves, such a reduction of reserves could have a material adverse effect on our business, financial condition, results of operations and cash flows.
We are not insured against all of the operating risks to which our business is exposed.
In accordance with industry practice, we maintain insurance against some, but not all, of the operating risks to which our business is exposed. We insure some, but not all, of our properties from operational loss-related events. We currently have insurance policies that include coverage for general liability, physical damage to our oil and gas properties, operational control of well, oil pollution, construction all risk, workers’ compensation and employers’ liability and other coverage. Our insurance coverage includes deductibles that must be met prior to recovery, as well as sub-limits or self-insurance. Additionally, our insurance is subject to exclusions and limitations, and there is no assurance that such coverage will adequately protect us against liability from all potential consequences, damages or losses.
Currently, we have general liability insurance coverage with an annual aggregate limit of $837.5 million on a 100% working interest basis. We no longer purchase physical damage insurance coverage for our platforms for losses resulting from named windstorms. Additionally, we now purchase physical damage insurance coverage for losses resulting from operational activities for only our Amberjack and Pompano platforms. We have continued purchasing physical damage insurance coverage for operational losses for a selected group of pipelines, including the majority of the pipelines and umbilicals associated with our Amberjack and Pompano facilities.
Our operational control of well coverage provides limits that vary by well location and depth and range from a combined single limit of $20 million to $500 million per occurrence. Exploratory deep water wells have a control of well coverage limit of up to $600 million per occurrence. Additionally, we currently maintain $70 million in oil pollution liability coverage. Our operational control of well and physical damage policy limits are scaled proportionately to our working interests. Our general liability program utilizes a combination of for assureds interest and scalable limits. All of our policies described above are subject to deductibles, sub-limits or self-insurance. Under our service agreements, including drilling contracts, generally we are indemnified for injuries and death of the service provider’s employees as well as contractors and subcontractors hired by the service provider, subject to the application of various states’ laws.
An operational or hurricane-related event may cause damage or liability in excess of our coverage that might severely impact our financial position. We may be liable for damages from an event relating to a project in which we own a non-operating working interest. Such events may also cause a significant interruption to our business, which might also severely impact our financial position. In past years, we have experienced production interruptions for which we had no production interruption insurance.
We reevaluate the purchase of insurance, policy limits and terms annually in May through July. Future insurance coverage for our industry could increase in cost and may include higher deductibles or retentions. In addition, some forms of insurance may become unavailable in the future or unavailable on terms that we believe are economically acceptable. No assurance can be given that we will be able to maintain insurance in the future at rates that we consider reasonable, and we may elect to maintain minimal or no insurance coverage. We may not be able to secure additional insurance or bonding that might be required by new governmental regulations. This may cause us to restrict our operations in the GOM, which might severely impact our financial position. The occurrence of a significant event, not fully insured against, could have a material adverse effect on our financial condition and results of operations.
Lower oil and natural gas prices and other factors have resulted, and in the future may result, in ceiling test write-downs and other impairments of our asset carrying values.
We use the full cost method of accounting for our oil and gas operations. Accordingly, we capitalize the costs to acquire, explore for and develop oil and gas properties. Under the full cost method of accounting, we compare, at the end of each financial reporting period for each cost center, the present value of estimated future net cash flows from proved reserves (based on a trailing twelve-month average, hedge-adjusted commodity price and excluding cash flows related to estimated abandonment costs), to the net capitalized costs of proved oil and gas properties, net of related deferred taxes. We refer to this comparison as a ceiling test. If the net capitalized costs of proved oil and gas properties exceed the estimated discounted future net cash flows from proved reserves, we are required to write down the value of our oil and gas properties to the value of the estimated discounted future net
19
cash flows. A write-down of oil and gas properties does not impact cash flows from operating activities, but does reduce net income. The risk that we will be required to write down the carrying value of oil and gas properties increases when oil and natural gas prices are low or volatile. In addition, write-downs may occur if we experience substantial downward adjustments to our estimated proved reserves or our undeveloped property values, or if estimated future development costs increase. For example, oil and natural gas prices significantly declined in the second half of 2014, and sustained lower prices continued throughout 2015, 2016 and early 2017, with a modest recovery in late 2017. We recorded non-cash ceiling test write-downs of approximately $1,362 million and $357 million for the years ended December 31, 2015 and 2016, respectively, and $256 million during the period of March 1, 2017 through December 31, 2017. Volatility in commodity prices, poor conditions in the global economic markets and other factors could cause us to record additional write-downs of our oil and natural gas properties and other assets in the future and incur additional charges against future earnings. Any required write-downs or impairments could materially affect the quantities and present value of our reserves, which could adversely affect our business, results of operations and financial condition.
Our oil and gas operations are subject to various U.S. federal, state and local governmental regulations that materially affect our operations.
Our oil and gas operations are subject to various U.S. federal, state and local laws and regulations. These laws and regulations may be changed in response to economic or political conditions. Regulated matters include: permits for exploration, development and production operations; limitations on our drilling activities in environmentally sensitive areas, such as marine habitats, and restrictions on the way we can release materials into the environment; bonds or other financial responsibility requirements to cover drilling contingencies and well plugging and abandonment and other decommissioning costs; reports concerning operations, the spacing of wells and unitization and pooling of properties; regulations regarding the rate, terms and conditions of transportation service or the price, terms and conditions related to the purchase and sale of natural gas or crude oil; and taxation. Failure to comply with these laws and regulations can result in the assessment of administrative, civil or criminal penalties, the issuance of remedial obligations and the imposition of injunctions limiting or prohibiting certain of our operations.
In addition, the OPA requires operators of offshore facilities such as us to prove that they have the financial capability to respond to costs that may be incurred in connection with potential oil spills. Under the OPA and other environmental statutes such as CERCLA and RCRA and analogous state laws, owners and operators of certain defined onshore and offshore facilities are strictly liable for spills of oil and other regulated substances, subject to certain limitations. Consequently, a substantial spill from one of our facilities subject to laws such as the OPA, CERCLA and RCRA could require the expenditure of additional, and potentially significant, amounts of capital, or could have a material adverse effect on our earnings, results of operations, competitive position or financial condition. We cannot predict the ultimate cost of compliance with these requirements or their impact on our earnings, operations or competitive position.
We may not be able to replace production with new reserves.
In general, the volume of production from oil and gas properties declines as reserves are depleted. The decline rates depend on reservoir characteristics. GOM reservoirs tend to be recovered quickly through production with associated steep declines, while declines in other regions after initial flush production tend to be relatively low. Our reserves will decline as they are produced unless we acquire properties with proved reserves or conduct successful development and exploration drilling activities. Our future oil and natural gas production is highly dependent upon our level of success in finding or acquiring additional reserves at a unit cost that is sustainable at prevailing commodity prices.
Exploring for, developing or acquiring reserves is capital intensive and uncertain. We may not be able to economically find, develop or acquire additional reserves or make the necessary capital investments if our cash flows from operations decline or external sources of capital become limited or unavailable. We cannot assure you that our future exploitation, exploration, development and acquisition activities will result in additional proved reserves or that we will be able to drill productive wells at acceptable costs. Further, current market conditions have adversely impacted our ability to obtain financing to fund acquisitions, and they have lowered the level of activity and depressed values in the oil and natural gas property sales market.
Production periods or reserve lives for GOM properties may subject us to higher reserve replacement needs and may impair our ability to reduce production during periods of low oil and natural gas prices.
High production rates generally result in recovery of a relatively higher percentage of reserves from properties in the GOM during the initial few years when compared to other regions in the United States. Typically, 50% of the reserves of properties in the GOM are depleted within three to four years with natural gas wells having a higher rate of depletion than oil wells. Due to high initial production rates, production of reserves from reservoirs in the GOM generally decline more rapidly than from other producing reservoirs. Our current operations are exclusively in the GOM. As a result, our reserve replacement needs from new prospects may be greater than those of other oil and gas companies with longer-life reserves in other producing areas. Also, our
20
expected revenues and return on capital will depend on prices prevailing during these relatively short production periods. Our need to generate revenues to fund ongoing capital commitments or repay debt may limit our ability to slow or shut-in production from producing wells during periods of low prices for oil and natural gas.
Our actual recovery of reserves may substantially differ from our proved reserve estimates.
This Form 10-K contains estimates of our proved oil and natural gas reserves and the estimated future net cash flows from such reserves. These estimates are based upon various assumptions, including assumptions required by the SEC relating to oil and natural gas prices, drilling and operating expenses, capital expenditures, taxes and availability of funds. The process of estimating oil and natural gas reserves is complex. This process requires significant decisions and assumptions in the evaluation of available geological, geophysical, engineering and economic data for each reservoir and is therefore inherently imprecise. Additionally, our interpretations of the rules governing the estimation of proved reserves could differ from the interpretation of staff members of regulatory authorities resulting in estimates that could be challenged by these authorities.
Actual future production, oil and natural gas prices, revenues, taxes, development expenditures, operating expenses and quantities of recoverable oil and natural gas reserves will most likely vary from those estimated. Any significant variance could materially affect the estimated quantities and present value of reserves set forth in this Form 10-K and the information incorporated by reference. Our properties may also be susceptible to hydrocarbon drainage from production by other operators on adjacent properties. In addition, we may adjust estimates of proved reserves to reflect production history, results of exploration and development, prevailing oil and natural gas prices and other factors, many of which are beyond our control.
You should not assume that any present value of future net cash flows from our proved reserves contained in this Form 10-K represents the market value of our estimated oil and natural gas reserves. We base the estimated discounted future net cash flows from our proved reserves at December 31, 2017 on historical twelve-month average prices and costs as of the date of the estimate. Actual future prices and costs may be materially higher or lower. Further, actual future net revenues will be affected by factors such as:
• | the amount and timing of actual development expenditures and decommissioning costs; |
• | the rate and timing of production; |
• | changes in governmental regulations or taxation; |
• | volume, pricing and duration of our oil and natural gas hedging contracts; |
• | supply of and demand for oil and natural gas; |
• | actual prices we receive for oil and natural gas; and |
• | our actual operating costs in producing oil and natural gas. |
At December 31, 2017, approximately 13% of our estimated proved reserves (by volume) were undeveloped and approximately 26% were non-producing. Any or all of our proved undeveloped or proved developed non-producing reserves may not be ultimately developed or produced. Furthermore, any or all of our undeveloped and developed non-producing reserves may not be ultimately produced during the time periods we plan or at the costs we budget, which could result in the write-off of previously recognized reserves. Recovery of undeveloped reserves generally requires significant capital expenditures and successful drilling operations. Our reserve estimates include the assumptions that we will incur capital expenditures to develop these undeveloped reserves and the actual costs and results associated with these properties may not be as estimated. In addition, the 10% discount factor that we use to calculate the net present value of future net revenues and cash flows may not necessarily be the most appropriate discount factor based on our cost of capital in effect from time to time and the risks associated with our business and the oil and gas industry in general. Any material inaccuracies in these reserve estimates or underlying assumptions will materially affect the quantities and present value of our reserves, which could adversely affect our business, results of operations and financial condition.
Three-dimensional seismic interpretation does not guarantee that hydrocarbons are present or if present will produce in economic quantities.
We rely on 3D seismic data to assist us with assessing prospective drilling opportunities on our properties, as well as on properties that we may acquire. Such seismic studies are merely an interpretive tool and do not necessarily guarantee that hydrocarbons are present or if present will produce in economic quantities, and seismic indications of hydrocarbon saturation may not be reliable indicators of productive reservoir rock. These limitations of 3D seismic data may impact our drilling and operational results, and consequently our financial condition.
21
SEC rules could limit our ability to book additional proved undeveloped reserves (“PUDs”) in the future.
SEC rules require that, subject to limited exceptions, PUDs may only be booked if they relate to wells scheduled to be drilled within five years after the date of booking. This requirement may limit our ability to book additional PUDs as we pursue our drilling program. Moreover, we may be required to write-down our proved undeveloped reserves if we do not drill those wells within the required five-year time frame.
Our acreage must be drilled before lease expiration in order to hold the acreage by production. If commodity prices become depressed for an extended period of time, it might not be economical for us to drill sufficient wells in order to hold acreage, which could result in the expiry of a portion of our acreage, which could have an adverse effect on our business.
Unless production is established as required by the leases covering our undeveloped acres, the leases for such acreage may expire. We have leases on 17,280 gross acres (17,280 net) that could potentially expire during fiscal year 2018. See Item 2. Properties – Productive Well and Acreage Data.
Our drilling plans for areas not currently held by production are subject to change based upon various factors. Many of these factors are beyond our control, including drilling results, oil and natural gas prices, the availability and cost of capital, drilling and production costs, availability of drilling services and equipment, gathering system and pipeline transportation constraints, and regulatory approvals. On our acreage that we do not operate, we have less control over the timing of drilling, therefore there is additional risk of expirations occurring in those sections.
The marketability of our production depends mostly upon the availability, proximity and capacity of oil and natural gas gathering systems, pipelines and processing facilities.
The marketability of our production depends upon the availability, proximity, operation and capacity of oil and natural gas gathering systems, pipelines and processing facilities. The lack of availability or capacity of these gathering systems, pipelines and processing facilities could result in the shut-in of producing wells or the delay or discontinuance of development plans for properties. The disruption of these gathering systems, pipelines and processing facilities due to maintenance and/or weather could negatively impact our ability to market and deliver our products. Federal, state and local regulation of oil and gas production and transportation, general economic conditions and changes in supply and demand could adversely affect our ability to produce and market our oil and natural gas. If market factors changed dramatically, the financial impact on us could be substantial. The availability of markets and the volatility of product prices are beyond our control and represent a significant risk.
Our actual production could differ materially from our forecasts.
From time to time, we provide forecasts of expected quantities of future oil and natural gas production. These forecasts are based on a number of estimates, including expectations of production from existing wells. In addition, our forecasts may assume that none of the risks associated with our oil and natural gas operations summarized in this Item 1A occur, such as facility or equipment malfunctions, adverse weather effects, or significant declines in commodity prices or material increases in costs, which could make certain production uneconomical.
Our operations are subject to numerous risks of oil and gas drilling and production activities.
Oil and gas drilling and production activities are subject to numerous risks, including the risk that no commercially productive oil or natural gas reserves will be found. The cost of drilling and completing wells is often uncertain. To the extent we drill additional wells in the GOM deep water and/or in the Gulf Coast deep gas, our drilling activities could become more expensive. In addition, the geological complexity of GOM deep water, Gulf Coast deep gas and various onshore formations may make it more difficult for us to sustain our historical rates of drilling success. Oil and gas drilling and production activities may be shortened, delayed or cancelled as a result of a variety of factors, many of which are beyond our control. These factors include:
• | unexpected drilling conditions; |
• | pressure or irregularities in formations; |
• | equipment failures or accidents; |
• | hurricanes and other weather conditions; |
• | shortages in experienced labor; and |
• | shortages or delays in the delivery of equipment. |
The prevailing prices of oil and natural gas also affect the cost of and the demand for drilling rigs, production equipment and related services. We cannot assure you that the wells we drill will be productive or that we will recover all or any portion of
22
our investment. Drilling for oil and natural gas may be unprofitable. Drilling activities can result in dry wells and wells that are productive but do not produce sufficient cash flows to recoup drilling costs.
Our industry experiences numerous operating risks.
The exploration, development and production of oil and gas properties involves a variety of operating risks including the risk of fire, explosions, blowouts, pipe failure, abnormally pressured formations and environmental hazards. Environmental hazards include oil spills, gas leaks, pipeline ruptures or discharges of toxic gases. We may also be involved in drilling operations that utilize hydraulic fracturing, which may potentially present additional operational and environmental risks. Additionally, our offshore operations are subject to the additional hazards of marine operations, such as capsizing, collision and adverse weather and sea conditions, including the effects of hurricanes.
In addition, an oil spill on or related to our properties and operations could expose us to joint and several strict liability, without regard to fault, under applicable law for containment and oil removal costs and a variety of public and private damages, including, but not limited to, the costs of responding to a release of oil, natural resource damages and economic damages suffered by persons adversely affected by an oil spill. If an oil discharge or substantial threat of discharge were to occur, we may be liable for costs and damages, which costs and damages could be material to our results of operations and financial position.
We explore for oil and natural gas in the deep waters of the GOM (water depths greater than 2,000 feet). Exploration for oil or natural gas in the deepwater of the GOM generally involves greater operational and financial risks than exploration on the GOM conventional shelf. Deepwater drilling generally requires more time and more advanced drilling technologies, involving a higher risk of technological failure and usually higher drilling costs. For example, the drilling of deepwater wells requires specific types of drilling rigs with significantly higher day rates and limited availability as compared to the rigs used in shallower waters. Deepwater wells often use subsea completion techniques with subsea trees tied back to host production facilities with flow lines. The installation of these subsea trees and flow lines requires substantial time and the use of advanced remote installation mechanics. These operations may encounter mechanical difficulties and equipment failures that could result in cost overruns. Furthermore, the deepwater operations generally lack the physical and oilfield service infrastructure present on the GOM conventional shelf. As a result, a considerable amount of time may elapse between a deepwater discovery and the marketing of the associated oil or natural gas, increasing both the financial and operational risk involved with these operations. Because of the lack and high cost of infrastructure, some reserve discoveries in the deepwater may never be produced economically.
If any of these industry operating risks occur, we could have substantial losses. Substantial losses may be caused by injury or loss of life, severe damage to or destruction of property, natural resources and equipment, pollution or other environmental damage, clean-up responsibilities, regulatory investigation and penalties, suspension of operations and production and repairs to resume operations. Any of these industry operating risks could have a material adverse effect on our business, results of operations, and financial condition.
Our business could be negatively affected by security threats, including cybersecurity threats, and other disruptions.
As an oil and gas producer, we face various security threats, including cybersecurity threats to gain unauthorized access to sensitive information or to render data or systems unusable, threats to the security of our facilities and infrastructure or third party facilities and infrastructure, such as processing plants and pipelines, and threats from terrorist acts. The potential for such security threats has subjected our operations to increased risks that could have a material adverse effect on our business. In particular, the implementation of various procedures and controls to monitor and mitigate security threats and to increase security for our information, facilities and infrastructure may result in increased capital and operating costs. Moreover, there can be no assurance that such procedures and controls will be sufficient to prevent security breaches from occurring. If any of these security breaches were to occur, they could lead to losses of sensitive information, critical infrastructure or capabilities essential to our operations and could have a material adverse effect on our reputation, financial position, results of operations or cash flows. Cybersecurity attacks in particular are becoming more sophisticated and include, but are not limited to, malicious software, attempts to gain unauthorized access to data and systems, and other electronic security breaches that could lead to disruptions in critical systems, unauthorized release of confidential or otherwise protected information, and corruption of data. These events could damage our reputation and lead to financial losses from remedial actions, loss of business or potential liability.
Our estimates of future asset retirement obligations may vary significantly from period to period and unanticipated decommissioning costs could materially adversely affect our future financial position and results of operations.
We are required to record a liability for the discounted present value of our asset retirement obligations to plug and abandon inactive, non-producing wells, to remove inactive or damaged platforms, facilities and equipment, and to restore the land or seabed at the end of oil and natural gas operations. These costs are typically considerably more expensive for offshore operations as compared to most land-based operations due to increased regulatory scrutiny and the logistical issues associated with working
23
in waters of various depths. Estimating future restoration and removal costs in the GOM is especially difficult because most of the removal obligations may be many years in the future, regulatory requirements are subject to change or more restrictive interpretation, and asset removal technologies are constantly evolving, which may result in additional or increased or decreased costs. As a result, we may make significant increases or decreases to our estimated asset retirement obligations in future periods. For example, because we operate in the GOM, platforms, facilities and equipment are subject to damage or destruction as a result of hurricanes and other adverse weather conditions. Also, the sustained lower commodity price environment may cause our non-operator partners to be unable to pay their share of costs, which may require us to pay our proportionate share of the defaulting party’s share of costs.
The estimated costs to plug and abandon a well or dismantle a platform can change dramatically if the host platform from which the work was anticipated to be performed is damaged or toppled, rather than structurally intact. Accordingly, our estimates of future asset retirement obligations could differ dramatically from what we may ultimately incur as a result of damage from a hurricane.
Moreover, the timing for pursuing restoration and removal activities has accelerated for operators in the GOM following BSEE’s issuance of an NTL that established a more stringent regimen for the timely decommissioning of what is known as “idle iron” wells, which are platforms and pipelines that are no longer producing or serving exploration or support functions with respect to an operator’s lease in the GOM. The idle iron NTL requires decommissioning of any well that has not been used during the past five years for exploration or production on active leases and is no longer capable of producing in paying quantities, which must then be permanently plugged or temporarily abandoned within three years’ time. Similarly, platforms or other facilities no longer useful for operations must be removed within five years of the cessation of operations. We may have to draw on funds from other sources to satisfy decommissioning costs. The use of other funds to satisfy such decommissioning costs could have a material adverse effect on our financial position and results of operations. Moreover, as a result of the implementation of the idle iron NTL, there is expected to be increased demand for salvage contractors and equipment operating in the GOM, resulting in increased estimates of plugging, abandonment and removal costs and associated increases in operators’ asset retirement obligations.
In addition, we could become responsible for decommissioning liabilities related to offshore facilities we no longer own or operate. Federal regulations allow the government to call upon predecessors-in-interest of oil and gas leases to pay for plugging and abandonment, restoration, and decommissioning obligations if the current operator fails to fulfill those obligations, the costs of which could be significant. Moreover, several onshore and offshore exploration and production companies have sought bankruptcy protection over the past several years. The government may seek to impose a bankrupt entity’s plugging and abandonment obligations on Stone or other predecessors-in-interest, which could be significant and adversely affect our business, results of operations, financial condition and cash flows.
We may not receive payment for a portion of our future production.
We may not receive payment for a portion of our future production. We have attempted to diversify our sales and obtain credit protections, such as parental guarantees, from certain of our purchasers. The tightening of credit in the financial markets may make it more difficult for customers to obtain financing and, depending on the degree to which this occurs, there may be a material increase in the nonpayment and nonperformance by customers. We are unable to predict what impact the financial difficulties of certain purchasers may have on our future results of operations and liquidity.
There are uncertainties in successfully integrating our acquisitions.
Integrating acquired businesses and properties involves a number of special risks. These risks include the possibility that management may be distracted from regular business concerns by the need to integrate operations and that unforeseen difficulties can arise in integrating operations and systems and in retaining and assimilating employees. Any of these or other similar risks could lead to potential adverse short-term or long-term effects on our operating results.
Competition within our industry may adversely affect our operations.
Competition within our industry is intense, particularly with respect to the acquisition of producing properties and undeveloped acreage. We compete with major oil and gas companies and other independent producers of varying sizes, all of which are engaged in the acquisition of properties and the exploration and development of such properties. Many of our competitors have financial resources and exploration and development budgets that are substantially greater than ours, which may adversely affect our ability to compete. We actively compete with other companies when acquiring new leases or oil and gas properties. For example, new leases acquired from BOEM are acquired through a “sealed bid” process and are generally awarded to the highest bidder. These additional resources can be particularly important in reviewing prospects and purchasing properties. The competitors may also have a greater ability to continue drilling activities during periods of low oil and gas prices, such as the
24
current decline in oil prices, and to absorb the burden of current and future governmental regulations and taxation. Competitors may be able to evaluate, bid for and purchase a greater number of properties and prospects than our financial or personnel resources permit. Competitors may also be able to pay more for productive oil and gas properties and exploratory prospects than we are able or willing to pay. Further, our competitors may be able to expend greater resources on the existing and changing technologies that we believe will impact attaining success in the industry. If we are unable to compete successfully in these areas in the future, our future revenues and growth may be diminished or restricted.
The loss of key personnel could adversely affect our ability to operate.
Our operations are dependent upon key management and technical personnel. We cannot assure you that individuals will remain with us for the immediate or foreseeable future. The unexpected loss of the services of one or more of these individuals could have an adverse effect on us and our operations.
Our Certificate of Incorporation and Bylaws and the Delaware General Corporation Law have provisions that, alone or in combination with each other, discourage corporate takeovers and could prevent stockholders from realizing a premium on their investment.
Certain provisions of our Certificate of Incorporation and Bylaws and the provisions of the Delaware General Corporation Law may encourage persons considering unsolicited tender offers or other unilateral takeover proposals to negotiate with our Board rather than pursue non-negotiated takeover attempts. Our Certificate of Incorporation authorizes our Board to issue preferred stock without stockholder approval and to set the rights, preferences and other designations, including voting rights of those shares, as our Board may determine. Additional provisions of our Certificate of Incorporation and of the Delaware General Corporation Law, alone or in combination with each other, include restrictions on business combinations and the availability of authorized but unissued common stock. These provisions, alone or in combination with each other, may discourage transactions involving actual or potential changes of control, including transactions that otherwise could involve payment of a premium over prevailing market prices to stockholders for their common stock.
We may issue shares of preferred stock with greater rights than our common stock.
Our Certificate of Incorporation authorizes our Board to issue one or more series of preferred stock and set the terms of the preferred stock without seeking any further approval from our stockholders. Any preferred stock that is issued may rank ahead of our common stock in terms of dividends, liquidation rights or voting rights. If we issue preferred stock, it may adversely affect the market price of our common stock.
Resolution of litigation could materially affect our financial position and results of operations.
We have been named as a defendant in certain lawsuits. In some of these suits, our liability for potential loss upon resolution may be mitigated by insurance coverage. To the extent that potential exposure to liability is not covered by insurance or insurance coverage is inadequate, we could incur losses that could be material to our financial position or results of operations in future periods. The outcome of such litigation could have a material impact on our financial position or results of operations in future periods. See Item 3. Legal Proceedings for additional information.
Tax laws and regulations may change over time, including the elimination of federal income tax deductions currently available with respect to oil and gas exploration and development.
Tax laws and regulations are highly complex and subject to interpretation, and the tax laws and regulations to which we are subject may change over time. Our tax filings are based upon our interpretation of the tax laws in effect in various jurisdictions at the time that the filings were made. If these laws or regulations change, or if the taxing authorities do not agree with our interpretation of the effects of such laws and regulations, it could have a material adverse effect on our business and financial condition.
On December 22, 2017, the President signed into law Public Law No. 115-97, a comprehensive tax reform bill commonly referred to as the Tax Cuts and Jobs Act (the “Tax Act”) that significantly reforms the Internal Revenue Code of 1986, as amended. Among other changes, the Tax Act (i) permanently reduces the U.S. corporate income tax rate, (ii) repeals the corporate alternative minimum tax, (iii) eliminates the deduction for certain domestic production activities, (iv) imposes new limitations on the utilization of net operating losses generated after 2017 and (v) provides for more general changes to the taxation of corporations, including changes to cost recovery rules and to the deductibility of interest expense, which may impact the taxation of oil and gas companies. The Tax Act is complex and far-reaching and we have not yet had enough time to complete a full analysis of the impact of all changes under the Tax Act. The ultimate impact of the Tax Act may differ from our estimates due to changes in interpretations and assumptions made by us as well as additional regulatory guidance that may be issued, and any such changes in our interpretations or assumptions could have an adverse effect on our financial position, results of operations and cash flows.
25
Climate change legislation or regulations restricting emissions of “greenhouse gases” could result in increased operating costs and reduced demand for the crude oil and natural gas that we produce.
The EPA has determined that emissions of carbon dioxide, methane and other “greenhouse gases” present an endangerment to public health and the environment because emissions of such gases contribute to warming of the Earth’s atmosphere and other climatic changes. Based on these findings, the EPA began adopting and implementing regulations to restrict emissions of greenhouse gases under existing provisions of the CAA. The EPA adopted two sets of rules regulating greenhouse gas emissions under the CAA, one of which requires a reduction in emissions of greenhouse gases from motor vehicles and the other of which regulates emissions of greenhouse gases from certain large stationary sources through preconstruction and operating permit requirements.
The EPA has also adopted rules requiring the reporting of greenhouse gas emissions from specified large greenhouse gas emission sources in the United States, on an annual basis. Recent regulation of emissions of greenhouse gases has focused on fugitive methane emissions. For example, in June 2016, the EPA finalized rules that establish new air emission controls for emissions of methane from certain equipment and processes in the oil and natural gas source category, including production, processing, transmission and storage activities. The EPA’s rule package includes first-time standards to address emissions of methane from equipment and processes across the source category, including hydraulically fractured oil and natural gas well completions. However, in a March 28, 2017 executive order, President Trump directed the EPA to review the 2016 regulations and, if appropriate, to initiate a rulemaking to rescind or revise them consistent with the stated policy of promoting clean and safe development of the nation’s energy resources, while at the same time avoiding regulatory burdens that unnecessarily encumber energy production. On June 16, 2017, the EPA published a proposed rule to stay for two years certain requirements of the 2016 regulations, including fugitive emission requirements. The regulations will remain in effect unless revised or repealed by separate EPA rulemaking in the future, which is likely to be challenged in court.
In addition, while the United States Congress has not taken any legislative action to reduce emissions of greenhouse gases, many states have established greenhouse gas cap and trade programs. Most of these cap and trade programs work by requiring major sources of emissions, such as electric power plants, or major producers of fuels, such as refineries and gas processing plants, to acquire and surrender emission allowances. The number of allowances available for purchase is reduced each year in an effort to achieve the overall greenhouse gas emission reduction goal.
Additionally, the United States is one of almost 200 nations that, in December 2015, agreed to the Paris Agreement, an international climate change agreement in Paris, France that calls for countries to set their own greenhouse gas emissions targets and be transparent about the measures each country will use to achieve its greenhouse gas emissions targets. The Paris Agreement entered into force on November 4, 2016. In June 2017, President Trump stated that the United States would withdraw from the Paris Agreement, but may enter into a future international agreement related to greenhouse gases. The Paris Agreement provides for a four-year exit process beginning when it took effect in November 2016, which would result in an effective exit date of November 2020. The United States’ adherence to the exit process is uncertain and/or the terms on which the United States may reenter the Paris Agreement or a separately negotiated agreement are unclear at this time. Furthermore, in response to President Trump’s announcement, many state and local leaders have stated their intent to intensify efforts to uphold the commitments set forth in the international accord.
The adoption of legislation or regulatory programs to reduce emissions of greenhouse gases could require us to incur increased operating costs, such as costs to purchase and operate emissions control systems, to acquire emissions allowances or to comply with new regulatory or reporting requirements. Substantial limitations on greenhouse gas emissions could also adversely affect demand for the oil and natural gas we produce and lower the value of our reserves. Consequently, legislation and regulatory programs to reduce emissions of greenhouse gases could have an adverse effect on our business, financial condition and results of operations.
In addition, claims have been made against certain energy companies alleging that greenhouse gas emissions from oil and natural gas operations constitute a public nuisance under federal and/or state common law. As a result, private individuals or public entities may seek to enforce environmental laws and regulations against us and could allege personal injury, property damage, or other liabilities. While our business is not a party to any such litigation, we could be named in actions making similar allegations. An unfavorable ruling in any such case could significantly impact our operations and could have an adverse impact on our financial condition.
Finally, it should be noted that some scientists have concluded that increasing concentrations of greenhouse gases in the Earth’s atmosphere may produce climate changes that have significant physical effects, such as increased frequency and severity of storms, droughts, floods and other climatic events. Our offshore operations will be particularly at risk from severe climatic events. If any such climate changes were to occur, they could have an adverse effect on our financial condition and results of
26
operations. However, at this time, we are unable to determine the extent to which climate change may lead to increased storm or weather hazards affecting our operations.
The enactment of derivatives legislation could have an adverse effect on our ability to use derivative instruments to reduce the effect of commodity price, interest rate and other risks associated with our business.
The Dodd-Frank Wall Street Reform and Consumer Protection Act (the “Act”), enacted on July 21, 2010, established federal oversight and regulation of the over-the-counter derivatives market and entities, such as us, that participate in that market. The Act requires the CFTC and the SEC to promulgate rules and regulations implementing the Act. Although the CFTC has finalized certain regulations, others remain to be finalized or implemented and it is not possible at this time to predict when this will be accomplished.
In one of its rulemaking proceedings still pending under the Act, the CFTC issued on December 5, 2016, re-proposed rules imposing position limits for certain futures and option contracts in various commodities (including oil and gas) and for swaps that are their economic equivalents. Under the proposed rules on position limits, certain types of hedging transactions are exempt from these limits on the size of positions that may be held, provided that such hedging transactions satisfy the CFTC’s requirements for certain enumerated “bona fide hedging” transactions or positions. As these new position limit rules are not yet final, the impact of those provisions on us is uncertain at this time.
The CFTC has designated certain interest rate swaps and credit default swaps for mandatory clearing and the associated rules also will require us, in connection with covered derivative activities, to comply with clearing and trade-execution requirements or to take steps to qualify for an exemption to such requirements. Although we expect to qualify for the end-user exception from the mandatory clearing requirements for swaps entered into to hedge our commercial risks, the application of the mandatory clearing and trade execution requirements to other market participants, such as swap dealers, may change the cost and availability of the swaps that we use for hedging. In addition, certain banking regulators and the CFTC have recently adopted final rules establishing minimum margin requirements for uncleared swaps. Although we expect to qualify for the end-user exception from such margin requirements for swaps entered into to hedge our commercial risks, the application of such requirements to other market participants, such as swap dealers, may change the cost and availability of the swaps that we use for hedging. If any of our swaps do not qualify for the commercial end-user exception, posting of collateral could impact liquidity and reduce cash available to us for capital expenditures, therefore reducing our ability to execute hedges to reduce risk and protect cash flows.
The full impact of the Act and related regulatory requirements upon our business will not be known until the regulations are implemented and the market for derivatives contracts has adjusted. The Act and any new regulations could significantly increase the cost of derivative contracts, materially alter the terms of derivative contracts, reduce the availability of derivatives to protect against risks we encounter, or reduce our ability to monetize or restructure our existing derivative contracts. If we reduce our use of derivatives as a result of the Act and regulations implementing the Act, our results of operations may become more volatile and our cash flows may be less predictable, which could adversely affect our ability to plan for and fund capital expenditures. Finally, the Act was intended, in part, to reduce the volatility of oil and gas prices, which some legislators attributed to speculative trading in derivatives and commodity instruments related to oil and natural gas. Our revenues could therefore be adversely affected if a consequence of the Act and implementing regulations is to lower commodity prices. Any of these consequences could have a material adverse effect on us, our financial condition and our results of operations.
In addition, the European Union and other non-U.S. jurisdictions have implemented and continue to implement new regulations with respect to the derivatives market. To the extent we transact with counterparties in foreign jurisdictions, we may become directly subject to such regulations and in any event the global derivatives market will be affected to the extent that foreign counterparties are affected by such regulations. At this time, the impact of such regulations is not clear.
Hedging transactions may limit our potential gains.
In order to manage our exposure to price risks in the marketing of our oil and natural gas, we periodically enter into oil and natural gas price hedging arrangements with respect to a portion of our expected production. Our hedging policy provides that not more than 60% of our estimated production quantities can be hedged for any given month without the consent of the Board. Additionally, a minimum of 25% of each month’s production will not be committed to any hedge contract regardless of the price available. While intended to reduce the effects of volatile oil and natural gas prices, such transactions, depending on the hedging instrument used, may limit our potential gains if oil and natural gas prices were to rise substantially over the price established by the hedge. In addition, such transactions may expose us to the risk of financial loss in certain circumstances, including instances in which:
• | our production is less than expected or is shut-in for extended periods due to hurricanes or other factors; |
27
• | there is a widening of price differentials between delivery points for our production and the delivery point assumed in the hedge arrangement; |
• | the counterparties to our futures contracts fail to perform the contracts; |
• | a sudden, unexpected event materially impacts oil or natural gas prices; or |
• | we are unable to market our production in a manner contemplated when entering into the hedge contract. |
Currently, all of our outstanding commodity derivative instruments are with certain lenders or affiliates of the lenders under our bank credit facility. Our existing derivative agreements with the lenders are secured by the security documents executed by the parties under our bank credit facility. Future collateral requirements for our commodity hedging activities are uncertain and will depend on the arrangements we negotiate with the counterparty and the volatility of oil and natural gas prices and market conditions.
Terrorist attacks aimed at our facilities could adversely affect our business.
The U.S. government has issued warnings that U.S. energy assets may be the future targets of terrorist organizations. These developments have subjected our operations to increased risks. Any future terrorist attack at our facilities, or those of our purchasers, could have a material adverse effect on our financial condition and operations.
ITEM 1B. UNRESOLVED STAFF COMMENTS
None.
ITEM 2. PROPERTIES
As of December 31, 2017, our property portfolio consisted primarily of eight active properties and 34 primary term leases in the GOM Basin. In connection with our restructuring efforts, we sold the Appalachia Properties on February 27, 2017. We no longer have operations or assets in Appalachia. See Item 1. Business – Operational Overview. The properties that we currently operate accounted for 94% of our year-end 2017 estimated proved reserves. This high operating percentage allows us to better control the timing, selection and costs of our drilling and production activities. Information on our significant properties is included below.
Oil and Natural Gas Reserves
Our Reserves Committee Charter provides that the reserves committee has the sole authority to recommend to our Board appointments or replacements of one or more firms of independent reservoir engineers and geoscientists. The reserves committee reviews annually the arrangements of the independent reservoir engineers and geoscientists with management, including the scope and general extent of the examination of our reserves, the reports to be rendered, the services and fees and consideration of the independence of such independent reservoir engineers and geoscientists. The reserves committee may consult with management but may not delegate these responsibilities. The reserves committee provides oversight in regards to the reserve estimation process but not the actual determination of estimated proved reserves. Our Reserves Committee Charter provides that it is the duty of management and not the duty of the reserves committee to plan or conduct reviews or to determine that our reserve estimates are complete and accurate and are in accordance with generally accepted engineering standards and applicable rules and regulations of the SEC. Our Vice President – Exploration and Business Development is the in-house person designated as primarily responsible for the process of reserve preparation. He is a petroleum engineer with over 20 years of experience in reservoir engineering and analysis. His duties include oversight of the preparation of quarterly reserve estimates and coordination with the outside engineering consultants on the preparation of year-end reserve estimates. The year-end reserve estimates prepared by our outside engineering firm are independent of any oversight of the Vice President – Exploration and Business Development or the reserves committee.
Estimates of our proved reserves at December 31, 2017 were independently prepared by Netherland, Sewell & Associates, Inc. (“NSAI”), a worldwide leader of petroleum property analysis for industry and financial organizations and government agencies. NSAI was founded in 1961 and performs consulting petroleum engineering services under the Texas Board of Professional Engineers Registration No. F-2699. Within NSAI, the technical persons primarily responsible for preparing the estimates set forth in the NSAI letter, which is filed as an exhibit to this Form 10-K, were Lily W. Cheung, Vice President and Team Leader, and Edward C. Roy III, Vice President. Ms. Cheung is a Registered Professional Engineer in the State of Texas (License No. 107207). Ms. Cheung joined NSAI in 2007 after serving as an Engineer at ExxonMobil Production Company. Ms. Cheung’s areas of specific expertise include estimation of oil and gas reserves, drilling and workover prospect evaluation, and economic evaluations. Ms. Cheung received an MBA degree from University of Texas at Austin in 2007 and a BS degree in Mechanical Engineering from Massachusetts Institute of Technology in 2003. Mr. Roy is a Registered Professional Geoscientist in the State of Texas (License No. 2364). Mr. Roy joined NSAI in 2008 after serving as a Senior Geologist at Marathon Oil Company. Mr. Roy’s areas of specific
28
expertise include deep-water stratigraphy, seismic interpretation and attribute analysis, volumetric reserve estimation, and probabilistic analysis. Mr. Roy received a MS degree in Geology from Texas A&M University in 1998 and a BS degree in Geology from Texas Christian University in 1992. Ms. Cheung and Mr. Roy both meet or exceed the education, training and experience requirements set forth in the Standards Pertaining to the Estimating and Auditing of Oil and Gas Reserves Information promulgated by the Society of Petroleum Engineers; they are proficient in judiciously applying industry standard practices to engineering and geoscience evaluations as well as applying SEC and other industry reserve definitions and guidelines.
The following table sets forth our estimated proved oil and natural gas reserves (all of which are located in the GOM) as of December 31, 2017 (Successor). The 2017 average twelve-month oil and natural gas prices, net of differentials, were $50.05 per Bbl of oil, $22.90 per Bbl of NGLs and $2.34 per Mcf of natural gas.
Oil (MBbls) | NGLs (MBbls) | Natural Gas (MMcf) | Oil, Natural Gas and NGLs (MBoe) | ||||||||
Reserves Category: | |||||||||||
PROVED | |||||||||||
Developed | 20,275 | 1,689 | 37,946 | 28,288 | |||||||
Undeveloped | 1,601 | 616 | 12,170 | 4,245 | |||||||
TOTAL PROVED | 21,876 | 2,305 | 50,116 | 32,533 | |||||||
At December 31, 2017 (Successor), we reported estimated PUDs of 4.2 MMBoe, which accounted for 13% of our total estimated proved oil and natural gas reserves, tied to a projected two new wells. Drilling was in progress at December 31, 2017 on one of the new PUD wells, and the other is projected to be drilled in 2018. SEC rules require that, subject to limited exceptions, PUDs may only be booked if they relate to wells scheduled to be drilled within five years after the date of booking. Neither of these two PUD wells will have been on our books in excess of five years at the time of their scheduled drilling. The following table discloses our progress toward the conversion of PUDs during 2017.
Oil, Natural Gas and NGLs (MBoe) | Future Development Costs (in thousands) | |||||
PUDs beginning of year (Predecessor) | 10,815 | $ | 128,972 | |||
Revisions of previous estimates | (5,282 | ) | (78,701 | ) | ||
Conversions to proved developed reserves | (1,288 | ) | (19,641 | ) | ||
Additional PUDs added | — | — | ||||
PUDs end of year (Successor) | 4,245 | $ | 30,630 | |||
During 2017, we invested approximately $19.6 million to convert 1.3 MMBoe of PUDs to proved developed reserves in the GOM. The revisions of previous estimates reflected in the table above were primarily related to the reclassification of one PUD well as a result of the five year limitation based on changes to the development plan for this well subsequent to our emergence from bankruptcy.
The following table includes production and estimated proved reserves associated with our significant properties:
December 31, 2017 | ||||||||||
2017 | Estimated | |||||||||
Field Name | Location | Production (MBoe) | Proved Reserves (MBoe) | Nature of Interest | ||||||
Pompano (1) | GOM Deep Water | 4,211 | 21,074 | Working | ||||||
Mississippi Canyon Block 109 | GOM Deep Water | 995 | 6,828 | Working | ||||||
(1) | Production volumes and estimated proved reserves include the Pompano and Cardona fields, both of which tie back to the Pompano platform. |
There are numerous uncertainties inherent in estimating quantities of proved reserves and in projecting future rates of production and the timing of development expenditures, including many factors beyond the control of the producer. The reserve data set forth herein only represents estimates. Reserve engineering is a subjective process of estimating underground accumulations
29
of oil and natural gas that cannot be measured in an exact way. The accuracy of any reserve estimate depends on the quality of available data and the interpretation of that data by geological engineers. In addition, the results of drilling, testing and production activities may justify revisions of estimates that were made previously. If significant, these revisions would change the schedule of any further production and development drilling. Accordingly, reserve estimates are generally different from the quantities of oil and natural gas that are ultimately recovered. Further, the estimated future net revenues from proved reserves and the present value thereof are based upon certain assumptions, including geological success, prices, future production levels, operating costs, development costs and income taxes that may not prove to be correct. Predictions about prices and future production levels are subject to great uncertainty, and the meaningfulness of these estimates depends on the accuracy of the assumptions upon which they are based.
As an operator of domestic oil and gas properties, we have filed U.S. Department of Energy Form EIA-23, “Annual Survey of Oil and Gas Reserves,” as required by Public Law 93-275. There are differences between the reserves as reported on Form EIA-23 and as reported herein. The differences are attributable to the fact that Form EIA-23 requires that an operator report the total reserves attributable to wells that it operates, without regard to percentage ownership (i.e., reserves are reported on a gross operated basis, rather than on a net interest basis) or non-operated wells in which it owns an interest.
Acquisition, Production and Drilling Activity
Acquisition and Development Costs. The following table sets forth certain information regarding the costs incurred in our acquisition, exploratory and development activities in the United States and Canada during the periods indicated (in thousands).
Successor | Predecessor | |||||||||||||||
Period from March 1, 2017 through December 31, 2017 | Period from January 1, 2017 through February 28, 2017 | Year Ended December 31, | ||||||||||||||
2016 | 2015 | |||||||||||||||
Acquisition costs, net of sales of unevaluated properties | $ | (8,371 | ) | $ | (324 | ) | $ | 3,425 | $ | (17,020 | ) | |||||
Exploratory costs | 12,079 | 2,055 | 20,059 | 112,936 | ||||||||||||
Development costs (1) | 33,356 | 12,547 | 102,665 | 266,982 | ||||||||||||
Subtotal | 37,064 | 14,278 | 126,149 | 362,898 | ||||||||||||
Capitalized salaries, general and administrative costs and interest, net of fees and reimbursements | 10,418 | 5,500 | 47,866 | 68,410 | ||||||||||||
Total additions to oil and gas properties, net | $ | 47,482 | $ | 19,778 | $ | 174,015 | $ | 431,308 | ||||||||
(1) | Includes net changes in capitalized asset retirement costs of ($17,446), $0, ($4,461) and ($43,901) for the period March 1, 2017 through December 31, 2017 (Successor), the period January 1, 2017 through February 28, 2017 (Predecessor) and the years ended December 31, 2016 and 2015 (Predecessor), respectively. |
30
Production Volumes, Sales Price and Cost Data. The following table sets forth certain information regarding our production volumes, sales prices and average production costs for the periods indicated.
Successor | Predecessor | |||||||||||||||
Period from March 1, 2017 through December 31, 2017 | Period from January 1, 2017 through February 28, 2017 | Year Ended December 31, | ||||||||||||||
2016 | 2015 | |||||||||||||||
Production: | ||||||||||||||||
Oil (MBbls) | 4,169 | 908 | 6,308 | 5,991 | ||||||||||||
Natural gas (MMcf) | 7,616 | 5,037 | 29,441 | 36,457 | ||||||||||||
NGLs (MBbls) | 403 | 408 | 2,183 | 2,401 | ||||||||||||
Oil, natural gas and NGLs (MBoe) | 5,841 | 2,156 | 13,398 | 14,468 | ||||||||||||
Average sales prices: (1) | ||||||||||||||||
Oil (per Bbl) | $ | 50.80 | $ | 50.48 | $ | 44.59 | $ | 69.52 | ||||||||
Natural gas (per Mcf) | 2.48 | 2.68 | 2.19 | 2.29 | ||||||||||||
NGLs (per Bbl) | 23.85 | 21.34 | 13.23 | 13.46 | ||||||||||||
Oil, natural gas and NGLs (per Boe) | 41.14 | 31.55 | 27.97 | 36.79 | ||||||||||||
Expenses (per Boe): | ||||||||||||||||
Lease operating expenses (2) | $ | 8.53 | $ | 4.09 | $ | 5.94 | $ | 6.92 | ||||||||
Transportation, processing and gathering expenses | 0.70 | 3.22 | 2.07 | 4.07 | ||||||||||||
(1) | Prices for the years ended December 31, 2016 and 2015 include the realized impact of derivative instrument settlements, which increased the price of oil by $3.77 per Bbl and $22.64 per Bbl, respectively, and increased the price of gas by $0.39 per Mcf for each of the years ended December 31, 2016 and 2015. |
(2) | Includes oil and gas operating costs and major maintenance expense and excludes production taxes. |
Production Volumes, Sales Price and Cost Data for Individually Significant Fields. The following tables set forth certain information regarding our oil, natural gas and NGL production volumes, sales prices and average production costs for the periods indicated for any field(s) containing 15% or more of our total estimated proved reserves at December 31, 2017.
Successor | Predecessor | |||||||||||||||
Period from March 1, 2017 through December 31, 2017 | Period from January 1, 2017 through February 28, 2017 | Year Ended December 31, | ||||||||||||||
FIELD: Pompano (1) | 2016 | 2015 | ||||||||||||||
Production: | ||||||||||||||||
Oil (MBbls) | 2,649 | 547 | 3,858 | 2,994 | ||||||||||||
Natural gas (MMcf) | 3,531 | 689 | 7,882 | 3,466 | ||||||||||||
NGLs (MBbls) | 267 | 44 | 267 | 245 | ||||||||||||
Oil, natural gas and NGLs (MBoe) | 3,505 | 706 | 5,439 | 3,817 | ||||||||||||
Average sales prices: | ||||||||||||||||
Oil (per Bbl) | $ | 51.60 | $ | 52.11 | $ | 41.86 | $ | 49.18 | ||||||||
Natural gas (per Mcf) | 2.47 | 2.46 | 2.15 | 2.17 | ||||||||||||
NGLs (per Bbl) | 22.24 | 24.60 | 12.46 | 15.28 | ||||||||||||
Oil, natural gas and NGLs (per Boe) | 43.18 | 44.33 | 33.43 | 41.53 | ||||||||||||
Expenses (per Boe): | ||||||||||||||||
Lease operating expenses (2) | $ | 4.48 | $ | 2.31 | $ | 4.69 | $ | 5.47 | ||||||||
Transportation, processing and gathering expenses | 0.37 | 0.49 | 0.58 | 0.44 | ||||||||||||
(1) | Includes the Pompano and Cardona fields, both of which tie back to the Pompano platform. Amounts for 2015 and 2016 include production and expenses for the Amethyst well which also tied back to the Pompano platform. The Amethyst well was shut-in in April 2016, and the lease was ultimately surrendered during the second quarter of 2017. |
(2) | Includes oil and gas operating costs and major maintenance expense and excludes production taxes. |
31
Successor | Predecessor | |||||||||||||||
Period from March 1, 2017 through December 31, 2017 | Period from January 1, 2017 through February 28, 2017 | Year Ended December 31, | ||||||||||||||
FIELD: Mississippi Canyon Block 109 | 2016 | 2015 | ||||||||||||||
Production: | ||||||||||||||||
Oil (MBbls) | 665 | 143 | 861 | 861 | ||||||||||||
Natural gas (MMcf) | 809 | 175 | 1,087 | 1,267 | ||||||||||||
NGLs (MBbls) | 19 | 4 | 22 | 42 | ||||||||||||
Oil, natural gas and NGLs (MBoe) | 819 | 176 | 1,064 | 1,114 | ||||||||||||
Average sales prices: | ||||||||||||||||
Oil (per Bbl) | $ | 49.18 | $ | 49.21 | $ | 39.22 | $ | 47.75 | ||||||||
Natural gas (per Mcf) | 1.37 | 1.51 | 1.20 | 1.41 | ||||||||||||
NGLs (per Bbl) | 30.88 | 32.33 | 23.79 | 24.78 | ||||||||||||
Oil, natural gas and NGLs (per Boe) | 42.00 | 42.23 | 33.47 | 39.43 | ||||||||||||
Expenses (per Boe): | ||||||||||||||||
Lease operating expenses (1) | $ | 13.36 | $ | 9.43 | $ | 9.94 | $ | 9.94 | ||||||||
Transportation, processing and gathering expenses (2) | 0.27 | 1.81 | (2.62 | ) | 0.32 | |||||||||||
(1) | Includes oil and gas operating costs and major maintenance expense and excludes production taxes. |
(2) | The year ended December 31, 2016 includes the recoupment of prior period expenses against federal royalties. |
Drilling Activity. The following table sets forth our drilling activity for the periods indicated.
Year Ended December 31, | |||||||||||||||||
2017 | 2016 | 2015 | |||||||||||||||
Gross | Net | Gross | Net | Gross | Net | ||||||||||||
Exploratory Wells: | |||||||||||||||||
Productive | 1 | 0.40 | — | — | 2 | 0.25 | |||||||||||
Dry | — | — | — | — | 2 | 0.42 | |||||||||||
Development Wells: | |||||||||||||||||
Productive | — | — | 1 | 0.65 | 7 | 5.81 | |||||||||||
Dry | — | — | — | — | — | — | |||||||||||
During the period from January 1, 2018 through March 9, 2018, we drilled one successful development well in which we own a 100% working interest.
32
Productive Well and Acreage Data. The following table sets forth certain statistics regarding the number of productive wells as of December 31, 2017.
Gross | Net | ||||
Productive Wells: | |||||
Oil (1): | |||||
Deep Water | 48 | 43 | |||
Deep Gas | — | — | |||
Conventional Shelf | 28 | 28 | |||
76 | 71 | ||||
Gas: | |||||
Deep Water | 2 | 2 | |||
Deep Gas | 2 | 1 | |||
Conventional Shelf | 6 | 5 | |||
10 | 8 | ||||
Total productive wells | 86 | 79 | |||
(1) Five gross wells each have dual completions.
The following table sets forth certain statistics regarding developed and undeveloped acres as of December 31, 2017.
Gross | Net | ||||
Developed Acres: | |||||
Deep Water | 86,400 | 50,891 | |||
Deep Gas | 23,797 | 1,576 | |||
Conventional Shelf | 67,789 | 47,029 | |||
Other | 6,427 | 2,250 | |||
184,413 | 101,746 | ||||
Undeveloped Acres: | |||||
Deep Water | 201,600 | 118,376 | |||
Deep Gas | 7,971 | 3,884 | |||
Conventional Shelf | — | — | |||
Other | 160 | 160 | |||
209,731 | 122,420 | ||||
Total developed and undeveloped acres | 394,144 | 224,166 | |||
Leases covering approximately 16% of our undeveloped gross acreage will expire in 2018, 25% in 2019, 14% in 2020, 9% in 2021, 14% in 2022, 16% in 2023, and 3% in 2024. As of December 31, 2017, none of our PUDs were assigned to locations that are currently scheduled to be drilled after lease expiration.
The acreage statistics above include both producing and non-producing acres. Of the producing acres, 49,788 gross acres (20,280 net) are producing acres of third parties that Stone has deep rights interest in only.
Title to Properties
We believe that we have satisfactory title to substantially all of our active properties in accordance with standards generally accepted in the oil and gas industry. Our properties are subject to customary royalty interests, liens for current taxes and other burdens, which we believe do not materially interfere with the use of or affect the value of such properties. Prior to acquiring undeveloped properties, we perform a title investigation that is thorough but less vigorous than that conducted prior to drilling, which is consistent with standard practice in the oil and gas industry. Before we commence drilling operations, we conduct a thorough title examination and perform curative work with respect to significant defects before proceeding with operations. We have performed a thorough title examination with respect to substantially all of our active properties.
33
ITEM 3. LEGAL PROCEEDINGS
We are named as a party in certain lawsuits and regulatory proceedings arising in the ordinary course of business. We do not expect that these matters, individually or in the aggregate, will have a material adverse effect on our financial condition.
On November 11, 2013, two lawsuits were filed, and on November 12, 2013, a third lawsuit was filed, against Stone and other named co-defendants, by the Parish of Jefferson (“Jefferson Parish”), on behalf of Jefferson Parish and the State of Louisiana, in the 24th Judicial District Court for the Parish of Jefferson, State of Louisiana, alleging violations of the State and Local Coastal Resources Management Act of 1978, as amended, and the applicable regulations, rules, orders and ordinances thereunder (collectively, “the CRMA”), relating to certain of the defendants’ alleged oil and gas operations in Jefferson Parish, and seeking to recover alleged unspecified damages to the Jefferson Parish Coastal Zone and remedies, including unspecified monetary damages and declaratory relief, restoration of the Jefferson Parish Coastal Zone and related costs and attorney’s fees. In March and April 2016, the Louisiana Attorney General and the Louisiana Department of Natural Resources, respectively, intervened in the three lawsuits. In connection with Stone’s filing of bankruptcy in December 2016, Jefferson Parish dismissed its claims against Stone in two of the three Jefferson Parish Coastal Zone Management lawsuits without prejudice to refiling; the claims of the Louisiana Attorney General and the Louisiana Department of Natural Resources were not similarly dismissed. Stone emerged from bankruptcy effective February 28, 2017, and the bankruptcy cases were closed by order of the Bankruptcy Court on April 20, 2017.
In addition, on November 8, 2013, a lawsuit was filed against Stone and other named co-defendants by the Parish of Plaquemines (“Plaquemines Parish”), on behalf of Plaquemines Parish and the State of Louisiana, in the 25th Judicial District Court for the Parish of Plaquemines, State of Louisiana, alleging violations of the CRMA, relating to certain of the defendants’ alleged oil and gas operations in Plaquemines Parish, and seeking to recover alleged unspecified damages to the Plaquemines Parish Coastal Zone and remedies, including unspecified monetary damages and declaratory relief, restoration of the Plaquemines Parish Coastal Zone, and related costs and attorney’s fees. In March and April 2016, the Louisiana Attorney General and the Louisiana Department of Natural Resources, respectively, intervened in the lawsuit. In connection with Stone’s filing of bankruptcy in December 2016, Plaquemines Parish dismissed its claims against Stone without prejudice to refiling; the claims of the Louisiana Attorney General and the Louisiana Department of Natural Resources were not similarly dismissed. Stone emerged from bankruptcy effective February 28, 2017, and the bankruptcy cases were closed by order of the Bankruptcy Court on April 20, 2017.
On November 17, 2014, the Pennsylvania Department of Environmental Protection (“PADEP”) issued a Notice of Violation (“NOV”) to Stone alleging releases of production fluid and an improper closure of a drill cuttings pit at Stone’s Loomis No. 1 well site in Susquehanna County, Pennsylvania. Prior to this, in September 2014, Stone had transferred ownership of the Loomis No. 1 well site to Southwestern Energy Company (“Southwestern”). PADEP approved the transfer on November 24, 2014, after issuing the NOV to Stone. Stone investigated the allegations found in the NOV and responded to PADEP on January 5, 2015. Reclamation of the site by Southwestern, with the participation of the PADEP and Stone, was completed. The PADEP may impose a penalty in this matter, but the amount of such penalty cannot be reasonably estimated at this time.
On each of January 4, February 2, and February 8, 2018, separate lawsuits were filed against Stone Energy Corporation, the individual directors of the board of directors of Stone Energy Corporation and other named co-defendants by stockholders of Stone Energy Corporation. Two of the lawsuits were filed in the U.S. District Court of Delaware and the third lawsuit was filed in the U.S. District Court for the Western District Louisiana. The three lawsuits allege violations of Sections 14(a), and 20(a) of the Securities Exchange Act of 1934 and SEC Rule 14a-9 on the grounds that the Form S-4 Registration Statement filed on December 29, 2017, was materially incomplete because it omitted material information concerning the transactions contemplated by that certain Transaction Agreement, dated November 21, 2017, by and among Stone Energy Corporation, certain wholly-owned, direct and indirect, subsidiaries of Stone Energy Corporation, Talos Energy LLC and Talos Production LLC. The three lawsuits also seek certification as class actions. These lawsuits were recently filed and are in the preliminary stages of defense and assessment. The defendants believe that the allegations contained in the matters described above are without merit and intend to vigorously defend themselves against the claims raised.
Legal proceedings are subject to substantial uncertainties concerning the outcome of material factual and legal issues relating to the litigation. Accordingly, we cannot currently predict the manner and timing of the resolution of some of these matters and may be unable to estimate a range of possible losses or any minimum loss from such matters.
ITEM 4. MINE SAFETY DISCLOSURES
Not applicable.
34
PART II
ITEM 5. MARKET FOR REGISTRANT’S COMMON EQUITY, RELATED STOCKHOLDER MATTERS AND ISSUER PURCHASES OF EQUITY SECURITIES
From July 9, 1993 through February 28, 2017, our Predecessor Company common stock was listed on the NYSE under the symbol “SGY.” Upon emergence from bankruptcy, all existing shares of Predecessor Company common stock were cancelled and the Successor Company issued an aggregate of 20.0 million shares of New Common Stock which were listed on the NYSE and began trading on March 1, 2017 under the symbol “SGY”.
The following table sets forth, for the periods indicated, the high and low sales prices per share of our Predecessor and Successor common stock. All Predecessor share prices reflect the 1-for-10 reverse stock split with respect to the Predecessor common stock which we completed on June 10, 2016.
High | Low | ||||||
Predecessor Company | |||||||
2016 | |||||||
First Quarter | $ | 46.60 | $ | 6.80 | |||
Second Quarter | 13.50 | 2.70 | |||||
Third Quarter | 25.50 | 8.42 | |||||
Fourth Quarter | 12.50 | 3.69 | |||||
2017 | |||||||
Period from January 1, 2017 through February 28, 2017 | 9.95 | 5.95 | |||||
Successor Company | |||||||
2017 | |||||||
Period from March 1, 2017 through March 31, 2017 | 32.39 | 16.50 | |||||
Second Quarter | 26.03 | 16.76 | |||||
Third Quarter | 30.92 | 18.37 | |||||
Fourth Quarter | 35.83 | 23.58 | |||||
2018 | |||||||
First Quarter (through March 7, 2018) | 39.70 | 29.18 | |||||
On March 7, 2018, the last reported sales price of our common stock on the NYSE Composite Tape was $31.31 per share. As of that date, there were 317 holders of record of our common stock.
Dividend Restrictions
In the past, we have not paid cash dividends on our common stock, and we do not intend to pay cash dividends on our common stock in the foreseeable future. We currently intend to retain earnings, if any, for the future operation and development of our business. The restrictions on our present or future ability to pay dividends are included in the provisions of the Delaware General Corporation Law and in certain restrictive provisions in the indenture executed in connection with the 2022 Second Lien Notes. In addition, the Amended Credit Agreement contains provisions that prohibit the payment of dividends.
Issuer Purchases of Equity Securities
Shares of our common stock are sometimes withheld from certain employees and nonemployee directors to pay taxes associated with the granting of stock awards and the vesting of restricted stock. These withheld shares are not issued or considered common stock repurchases under any authorized share repurchase program. We had no shares withheld from employees or nonemployee directors during the three months ended December 31, 2017.
Equity Compensation Plan Information
Please refer to Item 12. Security Ownership of Certain Beneficial Owners and Management and Related Stockholder Matters of this Form 10-K for information concerning securities authorized under our equity compensation plan.
35
Stock Performance Graph
The following graph and table compare the cumulative return to our stockholders on our Successor common stock beginning March 1, 2017 through December 31, 2017, relative to the cumulative total returns of the Standard & Poor’s 500 Stock Index (the “S&P 500 Index”) and the Peer Group (as defined below) for the same period. The comparison assumes an investment of $100 (with dividends re-invested on the ex-dividend dates) was made in our Successor common stock, in the S&P 500 Index and in the Peer Group on March 1, 2017, and relative performance is tracked through December 31, 2017. Peer Group investment is weighted based upon the market capitalization of each individual company within the Peer Group at the beginning of the period.
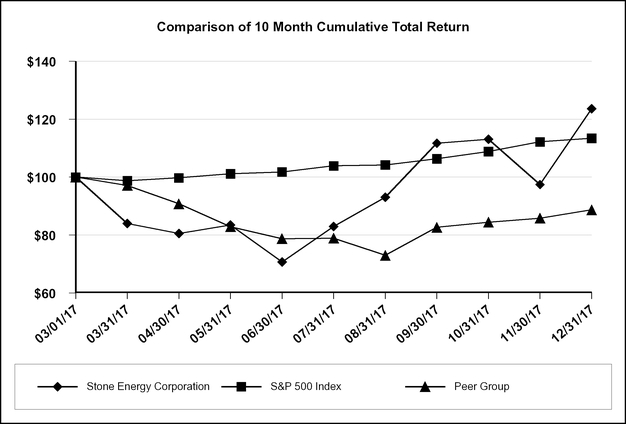
Value of Initial $100 Investment | ||||||||||||||||||||||||||||||||||
March 1, 2017 | 2017 Month-End | |||||||||||||||||||||||||||||||||
March | April | May | June | July | Aug. | Sept. | Oct. | Nov. | Dec. | |||||||||||||||||||||||||
Stone Energy | $ | 100 | $ | 83.97 | $ | 80.51 | $ | 83.43 | $ | 70.67 | $ | 82.97 | $ | 93.04 | $ | 111.73 | $ | 113.11 | $ | 97.42 | $ | 123.64 | ||||||||||||
S&P 500 Index | 100 | 98.75 | 99.76 | 101.17 | 101.80 | 103.89 | 104.21 | 106.36 | 108.84 | 112.18 | 113.43 | |||||||||||||||||||||||
Peer Group | 100 | 97.10 | 90.76 | 82.87 | 78.75 | 78.92 | 72.99 | 82.64 | 84.43 | 85.83 | 88.71 | |||||||||||||||||||||||
The companies that comprised our Peer Group in 2017 were: Cabot Oil & Gas Corporation, Callon Petroleum Company, Carrizo Oil & Gas, Inc., Cimarex Energy Company, Comstock Resources, Inc., Contango Oil & Gas Company, Denbury Resources Inc., Exco Resources, Inc., Newfield Exploration Company, PDC Energy, PetroQuest Energy, Inc., Range Resources Corporation, SandRidge Energy, Inc., Silverbow Resources, Inc. (formerly Swift Energy), SM Energy Company, Ultra Petroleum Corporation, W&T Offshore, Inc. and Whiting Petroleum Corporation.
The information in this Form 10-K appearing under the heading “Stock Performance Graph” is being “furnished” pursuant to Item 201(e) of Regulation S-K under the Securities Act and shall not be deemed to be “soliciting material” or “filed” with the SEC or subject to Regulation 14A or 14C, other than as provided in Item 201(e) of Regulation S-K, or to the liabilities of Section 18 of the Exchange Act.
36
ITEM 6. SELECTED FINANCIAL DATA
As a result of the adoption of fresh start accounting, our financial statements subsequent to February 28, 2017 will not be comparable to our financial statements prior to that date. See Item 7. Management’s Discussion and Analysis of Financial Condition and Results of Operations and Item 8. Financial Statements and Supplementary Data. The following tables set forth, as of the dates and for the periods indicated, our selected financial information, which is derived from our audited consolidated financial statements for the respective periods (in thousands, except per share amounts). Certain prior year amounts have been reclassified to conform to current year presentation.
Successor | Predecessor | ||||||||||||||||||||||||
Period from March 1, 2017 through December 31, 2017 | Period from January 1, 2017 through February 28, 2017 | Year Ended December 31, | |||||||||||||||||||||||
2016 | 2015 | 2014 | 2013 | ||||||||||||||||||||||
Operating revenue: | |||||||||||||||||||||||||
Oil production | $ | 211,792 | $ | 45,837 | $ | 281,246 | $ | 416,497 | $ | 516,104 | $ | 715,104 | |||||||||||||
Natural gas production | 18,874 | 13,476 | 64,601 | 83,509 | 166,494 | 190,580 | |||||||||||||||||||
Natural gas liquids production | 9,610 | 8,706 | 28,888 | 32,322 | 85,642 | 60,687 | |||||||||||||||||||
Other operational income | 10,008 | 903 | 2,657 | 4,369 | 7,951 | 7,808 | |||||||||||||||||||
Derivative income, net | — | — | — | 7,952 | 19,351 | — | |||||||||||||||||||
Total operating revenue | 250,284 | 68,922 | 377,392 | 544,649 | 795,542 | 974,179 | |||||||||||||||||||
Operating expenses: | |||||||||||||||||||||||||
Lease operating expenses | 49,800 | 8,820 | 79,650 | 100,139 | 176,495 | 201,153 | |||||||||||||||||||
Transportation, processing, gathering exp. | 4,084 | 6,933 | 27,760 | 58,847 | 64,951 | 42,172 | |||||||||||||||||||
Production taxes | 629 | 682 | 3,148 | 6,877 | 12,151 | 15,029 | |||||||||||||||||||
Depreciation, depletion and amortization | 99,890 | 37,429 | 220,079 | 281,688 | 340,006 | 350,574 | |||||||||||||||||||
Write-down of oil and gas properties | 256,435 | — | 357,431 | 1,362,447 | 351,192 | — | |||||||||||||||||||
Accretion expense | 21,151 | 5,447 | 40,229 | 25,988 | 28,411 | 33,575 | |||||||||||||||||||
Salaries, general and administrative exp. | 47,817 | 9,629 | 58,928 | 69,384 | 66,451 | 59,524 | |||||||||||||||||||
Franchise tax settlement | — | — | — | — | — | 12,590 | |||||||||||||||||||
Incentive compensation expense | 8,045 | 2,008 | 13,475 | 2,242 | 10,361 | 15,340 | |||||||||||||||||||
Restructuring fees | 739 | — | 29,597 | — | — | — | |||||||||||||||||||
Other operational expenses | 3,359 | 530 | 55,453 | 2,360 | 862 | 151 | |||||||||||||||||||
Derivative expense, net | 13,388 | 1,778 | 810 | — | — | 2,090 | |||||||||||||||||||
Total operating expenses | 505,337 | 73,256 | 886,560 | 1,909,972 | 1,050,880 | 732,198 | |||||||||||||||||||
Gain (loss) on Appalachia Prop. divestiture | (105 | ) | 213,453 | — | — | — | — | ||||||||||||||||||
Income (loss) from operations | (255,158 | ) | 209,119 | (509,168 | ) | (1,365,323 | ) | (255,338 | ) | 241,981 | |||||||||||||||
Other (income) expense: | |||||||||||||||||||||||||
Interest expense | 11,744 | — | 64,458 | 43,928 | 38,855 | 32,837 | |||||||||||||||||||
Interest income | (998 | ) | (45 | ) | (550 | ) | (580 | ) | (574 | ) | (1,695 | ) | |||||||||||||
Other income | (1,156 | ) | (315 | ) | (1,439 | ) | (1,783 | ) | (2,332 | ) | (2,799 | ) | |||||||||||||
Other expense | 1,230 | 13,336 | 596 | 434 | 274 | — | |||||||||||||||||||
Loss on early extinguishment of debt | — | — | — | — | — | 27,279 | |||||||||||||||||||
Reorganization items | — | (437,744 | ) | 10,947 | — | — | — | ||||||||||||||||||
Total other (income) expense | 10,820 | (424,768 | ) | 74,012 | 41,999 | 36,223 | 55,622 | ||||||||||||||||||
Income (loss) before income taxes | (265,978 | ) | 633,887 | (583,180 | ) | (1,407,322 | ) | (291,561 | ) | 186,359 | |||||||||||||||
Income tax provision (benefit) | (18,339 | ) | 3,570 | 7,406 | (316,407 | ) | (102,018 | ) | 68,725 | ||||||||||||||||
Net income (loss) | $ | (247,639 | ) | $ | 630,317 | $ | (590,586 | ) | $ | (1,090,915 | ) | $ | (189,543 | ) | $ | 117,634 | |||||||||
Basic earnings (loss) per share | $ | (12.38 | ) | $ | 110.99 | $ | (105.63 | ) | $ | (197.45 | ) | $ | (35.95 | ) | $ | 23.58 | |||||||||
Diluted earnings (loss) per share | $ | (12.38 | ) | $ | 110.99 | $ | (105.63 | ) | $ | (197.45 | ) | $ | (35.95 | ) | $ | 23.56 | |||||||||
Cash dividends declared per share | — | — | — | — | — | — | |||||||||||||||||||
Cash Flow Data: | |||||||||||||||||||||||||
Net cash provided by (used in) operating activities | $ | 89,076 | $ | (5,884 | ) | $ | 78,588 | $ | 247,474 | $ | 401,141 | $ | 594,205 | ||||||||||||
Net cash provided by (used in) investing activities | 11,993 | 421,021 | (238,172 | ) | (321,290 | ) | (872,587 | ) | (623,036 | ) | |||||||||||||||
Net cash provided by (used in) financing activities | (540 | ) | (442,752 | ) | 339,415 | 10,161 | 215,446 | 80,594 | |||||||||||||||||
37
Successor | Predecessor | |||||||||||||||||||
As of | As of December 31, | |||||||||||||||||||
December 31, 2017 | 2016 | 2015 | 2014 | 2013 | ||||||||||||||||
Balance Sheet Data (at end of period): | ||||||||||||||||||||
Working capital (deficit) | $ | 193,446 | $ | 132,409 | $ | (8,803 | ) | $ | 226,805 | $ | 181,255 | |||||||||
Oil and gas properties, net | 461,882 | 811,514 | 1,211,986 | 2,414,002 | 2,619,696 | |||||||||||||||
Total assets | 858,773 | 1,139,483 | 1,410,169 | 3,009,857 | 3,238,117 | |||||||||||||||
Long-term debt, less current portion (1) | 235,502 | 352,376 | 1,060,955 | 1,032,281 | 1,016,645 | |||||||||||||||
Stockholders’ equity | 308,168 | (637,282 | ) | (39,789 | ) | 1,101,603 | 970,286 | |||||||||||||
(1) Reduction in long-term debt in 2016 is due to the reclassification of the Company’s 1 ¾% Senior Convertible Notes due 2017 (the “2017 Convertible Notes”) and 7 ½% Senior Notes due 2022 (the “2022 Notes”) to liabilities subject to compromise.
ITEM 7. MANAGEMENT’S DISCUSSION AND ANALYSIS OF FINANCIAL CONDITION AND RESULTS OF OPERATIONS
The following discussion and analysis is intended to assist in understanding our financial condition and results of operations. This discussion and analysis should be read in conjunction with other sections of this report, including: Item 1. Business, Item 1A. Risk Factors and our consolidated financial statements and the notes thereto in Item 8. Financial Statements and Supplementary Data.
Executive Overview
We are an independent oil and natural gas company engaged in the acquisition, exploration, exploitation, development and operation of oil and gas properties. We have been operating in the GOM Basin since our incorporation in 1993 and have established technical and operational expertise in this area. We leveraged our experience in the GOM conventional shelf and expanded our reserve base into the more prolific plays of the GOM deep water, Gulf Coast deep gas and the Marcellus and Utica shales in Appalachia. At December 31, 2016, we had producing properties and acreage in the Marcellus and Utica Shales in Appalachia. In connection with our restructuring efforts, we determined that a sale of the Appalachia Properties would be a beneficial way to maximize value for all stakeholders. We completed the sale of the Appalachia Properties to EQT on February 27, 2017 for net cash consideration of approximately $522.5 million. See “Reorganization and Emergence from Voluntary Chapter 11 Proceedings” below for additional information of the sale of the Appalachia Properties.
Strategic Review and Pending Combination with Talos
Following the successful completion of our financial restructuring and emergence from Chapter 11 reorganization, the Board retained a financial advisor in April 2017 to assist the Board in its determination of the Company’s strategic direction, including assessing its various strategic alternatives, and on November 21, 2017, Stone and certain of its subsidiaries entered into a series of related agreements pertaining to a business combination with Talos.
Stone, Sailfish Energy Holdings Corporation (“New Talos”), a direct wholly owned subsidiary of Stone, and Sailfish Merger Sub Corporation, a direct wholly owned subsidiary of New Talos, entered into the Transaction Agreement with Talos on November 21, 2017, which contemplates the Transactions occurring on the date of closing of the Transaction Agreement (the “Closing”) that will result in such business combination. Stone and Talos will become wholly owned subsidiaries of New Talos. At the time of the Closing, the parties intend that New Talos will become a publicly traded entity named Talos Energy, Inc. The Transactions include (i) the contribution of 100% of the equity interests in Talos Production to New Talos in exchange for shares of New Talos common stock, (ii) the contribution by entities controlled by or affiliated with Apollo Management (the “Apollo Funds”) and Riverstone (the “Riverstone Funds”) of $102 million in aggregate principal amount of 9.75% Senior Notes due 2022 issued by Talos Production and Talos Production Finance Inc. (together, the “the Talos Issuers”) to New Talos in exchange for shares of New Talos common stock, (iii) the exchange of the second lien bridge loans due 2022 issued by the Talos Issuers for newly issued 11% second lien notes issued by the Talos Issuers, and (iv) the exchange of the 2022 Second Lien Notes issued by Stone for newly issued 11% second lien notes issued by the Talos Issuers.
Under the terms of the Transaction Agreement, each outstanding share of Stone common stock will be exchanged for one share of New Talos common stock and the current Talos stakeholders (including the Apollo Funds and the Riverstone Funds) will
38
be issued an aggregate of approximately 34.1 million common shares of New Talos. After the completion of the Transactions contemplated by the Transaction Agreement, holders of Stone common stock immediately prior to the combination will collectively hold 37% of the outstanding New Talos common stock and Talos Energy stakeholders will hold 63% of the outstanding New Talos common stock. Outstanding warrants to acquire Stone common stock will become warrants to acquire New Talos common stock with terms and conditions substantially identical to their existing terms and conditions.
The combination was unanimously approved by the boards of directors of Stone and Talos Energy. Completion of the combination is subject to the approval of Stone shareholders, the consummation of a tender offer and consent solicitation for Stone’s 2022 Second Lien Notes, certain regulatory approvals and other customary conditions. Franklin and MacKay Shields, as investment managers for approximately 53% of the outstanding common shares of Stone as of September 30, 2017, entered into voting agreements to vote in favor of the combination, subject to certain conditions. The Transaction Agreement contains certain termination rights for Stone and Talos Energy. Stone may be required to pay a termination fee and to reimburse transaction expenses to Talos Energy if the Transaction Agreement is terminated under certain circumstances. The combination is expected to close in the second quarter of 2018. We cannot provide any assurance that the combination will be completed on the terms or timeline currently contemplated, or at all. The above is a summary of the material terms of the Transactions and is qualified in its entirety by reference to the Sailfish Energy Holdings Corporation Registration Statement on Form S-4 filed with the SEC on December 29, 2017, as amended on February 8, 2018.
Reorganization and Emergence from Voluntary Chapter 11 Proceedings
On December 14, 2016, we filed Bankruptcy Petitions seeking relief under the provisions of Chapter 11 of the Bankruptcy Code to pursue a prepackaged plan of reorganization to address our liquidity and capital structure. On February 15, 2017, the Bankruptcy Court entered an order confirming the Plan, and on February 28, 2017, the Plan became effective and we emerged from bankruptcy.
Upon emergence from bankruptcy, the Company adopted fresh start accounting in accordance with the provisions of ASC 852, “Reorganizations”, which resulted in the Company becoming a new entity for financial reporting purposes on the Effective Date. As a result of the adoption of fresh start accounting, the Company’s consolidated financial statements subsequent to February 28, 2017 will not be comparable to its financial statements prior to that date. See Note 3 – Fresh Start Accounting for further details on the impact of fresh start accounting on the Company’s consolidated financial statements. References to “Successor” or “Successor Company” relate to the financial position and results of operations of the reorganized Company subsequent to February 28, 2017. References to “Predecessor” or “Predecessor Company” relate to the financial position and results of operations of the Company prior to, and including, February 28, 2017.
In connection with our reorganization, we entered into a Purchase and Sale Agreement dated October 20, 2016, as amended on December 9, 2016 (the “Tug Hill PSA”), with TH Exploration III, LLC, an affiliate of Tug Hill, Inc. (“Tug Hill”), to sell the Appalachia Properties to Tug Hill for $360 million in cash, subject to customary purchase price adjustments. Pursuant to Bankruptcy Court orders in January 2017, two additional bidders were allowed to participate in competitive bidding on the Appalachia Properties, and on February 8, 2017, Stone conducted an auction for the sale of the Appalachia Properties. Upon conclusion of the auction, Stone selected the final bid submitted by EQT. We completed the sale of the Appalachia Properties to EQT on February 27, 2017 for net cash consideration of approximately $522.5 million. At the close of the sale of the Appalachia Properties, the Tug Hill PSA was terminated, and the Company used a portion of the cash consideration received to pay Tug Hill a break-up fee and expense reimbursements totaling approximately $11.5 million. Additionally, a portion of the consideration received from the sale of the Appalachia Properties was used to fund the Company’s cash payment obligations under the Plan. At December 31, 2016, the Appalachia Properties accounted for approximately 34% of the Predecessor Company’s total estimated proved oil and natural gas reserves, on a volume equivalent basis. Upon closing of the sale on February 27, 2017, we no longer have operations or assets in Appalachia. See Note 4 – Divestiture for additional information on the sale of the Appalachia Properties.
Upon emergence from bankruptcy, pursuant to the terms of the Plan, the following significant transactions occurred:
• | Shares of the Predecessor Company’s issued and outstanding common stock immediately prior to the Effective Date were cancelled, and on the Effective Date, reorganized Stone issued an aggregate of 20.0 million shares of new common stock (the “New Common Stock”). |
• | The Predecessor Company’s 2017 Convertible Notes and 2022 Notes were cancelled and the holders of such notes received their pro rata share of (a) $100 million of cash, (b) 19.0 million shares of the New Common Stock, representing 95% of the New Common Stock, and (c) $225 million of 2022 Second Lien Notes. |
39
• | The Predecessor Company’s common stockholders received their pro rata share of 1.0 million shares of the New Common Stock, representing 5% of the New Common Stock, and warrants to purchase approximately 3.5 million shares of New Common Stock. The warrants have an exercise price of $42.04 per share and a term of four years, unless terminated earlier by their terms upon the consummation of certain business combinations or sale transactions involving the Company. |
• | The Predecessor Company’s Fourth Amended and Restated Credit Agreement, dated as of June 24, 2014, as amended, modified, or otherwise supplemented from time to time (the “Pre-Emergence Credit Agreement”) was amended and restated as the Fifth Amended and Restated Credit Agreement (as amended from time to time, the “Amended Credit Agreement”). The obligations owed to the lenders under the Pre-Emergence Credit Agreement were converted to obligations under the Amended Credit Agreement. |
• | All claims of creditors with unsecured claims, other than the claims by the holders of the 2022 Notes and 2017 Convertible Notes, including vendors, were unaltered and paid in full in the ordinary course of business to the extent the claims were undisputed. |
See Liquidity and Capital Resources below for additional information on the Successor Company’s debt instruments.
Operational Update
In June 2017, we initiated drilling operations on our Rampart Deep prospect in Mississippi Canyon Block 116, and in September 2017, the well encountered approximately 107 net vertical feet of liquids-rich natural gas pay in three primary zones, as interpreted by Stone. In addition to the reserve potential of Rampart Deep, this well also provided critical information that reduces the exploration risk of our Derbio prospect. Completion of the Rampart Deep well was deferred while the partners analyze the well data, and will be further evaluated in conjunction with Derbio drilling results, which may impact sanctioning of the project. The Derbio well spud in February 2018, with results expected in the second quarter of 2018. If successful, the Rampart Deep/Derbio project could be a multi-well tie back to the Pompano platform, which is owned 100% by Stone, with first production expected by late 2019. Stone has a 40% working interest in the Rampart Deep and Derbio wells.
We also spud the Mt. Providence development well, located in Mississippi Canyon Block 28, in December 2017. In January 2018, the well encountered approximately 153 net feet of high quality, primarily oil pay in one Miocene interval, with no visible water level, which exceeded our pre-drill expectations. Completion operations will commence in the second quarter of 2018, with first production expected in the third quarter of 2018. The well will be tied back to the Pompano platform through existing subsea infrastructure. Stone has a 100% working interest in the Mt. Providence well.
2018 Outlook
In January 2018, the Board authorized a 2018 capital expenditure budget of up to $212 million, which excludes acquisitions and capitalized salaries, general and administrative (“SG&A”) expenses and interest, and does not give effect to the potential Talos combination. The budget is spread across Stone’s major areas of investment with approximately 36% allocated to exploration, 27% to development and 37% to plugging and abandonment expenditures. The allocation of capital across the various areas is subject to change based on several factors, including permitting times, rig availability, non-operator decisions, farm-in opportunities, and commodity pricing.
Based on our current outlook of commodity prices and our estimated production for 2018, we expect that cash flows from operating activities, cash on hand and availability under the Amended Credit Agreement will be adequate to meet the current 2018 operating and capital expenditure needs of the Company.
Known Trends and Uncertainties
Non-designation of Commodity Derivatives – With respect to our 2017, 2018 and 2019 commodity derivative contracts, we have elected to not designate these contracts as cash flow hedges for accounting purposes. Accordingly, these derivative instruments are accounted for on a mark-to-market basis with changes in fair value recognized currently in earnings through derivative income (expense) in the statement of operations. As a result of these mark-to-market adjustments, we will likely experience volatility in earnings from time to time due to commodity price volatility. See Results of Operations below for more information.
BOEM Financial Assurance Requirements – BOEM requires all operators in federal waters to provide financial assurances to cover the cost of plugging and abandoning wells and decommissioning offshore facilities. Historically, we and many other operators have been able to obtain an exemption from most bonding obligations based on financial net worth.
40
On March 21, 2016, we received notice letters from BOEM stating that BOEM had determined that we no longer qualified for a supplemental bonding waiver under the financial criteria specified in BOEM’s guidance to lessees at such time. In late March 2016, we proposed a tailored plan to BOEM for financial assurances relating to our abandonment obligations, which provides for posting some incremental financial assurances in favor of BOEM. On May 13, 2016, we received notice letters from BOEM rescinding its demand for supplemental bonding with the understanding that we will continue to make progress with BOEM towards finalizing and implementing our long-term tailored plan.
In July 2016, BOEM issued a NTL, with an effective date of September 12, 2016, that augments requirements for the posting of additional financial assurances by offshore lessees. The NTL details procedures to determine a lessee’s ability to carry out its lease obligations (primarily the decommissioning of OCS facilities) and whether to require lessees to furnish additional financial assurances to meet BOEM’s estimate of the lessees decommissioning obligations. The NTL supersedes the agency’s prior practice of allowing operators of a certain net worth to waive the need for supplemental bonds and provides updated criteria for determining a lessee’s ability to self-insure only a small portion of its OCS liabilities based upon the lessee’s financial capacity and financial strength. The NTL also allows lessees to meet their additional financial security requirements pursuant to an individually approved tailored plan, whereby an operator and BOEM agree to set a timeframe for the posting of additional financial assurances.
We received a self-insurance letter from BOEM dated September 30, 2016 stating that we were not eligible to self-insure any of our additional security obligations. We received a proposal letter from BOEM dated October 20, 2016 indicating that additional security may be required. The September 30, 2016 self-insurance determination letter was rescinded by BOEM on March 24, 2017.
In the first quarter of 2017, BOEM announced that it would extend the implementation timeline for the July 2016 NTL by an additional six months. Furthermore, on April 28, 2017, President Trump issued an executive order directing the Secretary of the Interior to review the NTL to determine whether modifications are necessary to ensure operator compliance with lease terms while minimizing unnecessary regulatory burdens. On June 22, 2017, BOEM announced that, pending its review of the NTL, the implementation timeline would be indefinitely extended, subject to certain exceptions. At this time, it is uncertain when, or if, the July 2016 NTL will be implemented or whether a revised NTL might be proposed. Compliance with the NTL, or any other new rules, regulations, or legal initiatives by BOEM or other governmental authorities that impose more stringent requirements adversely affecting our offshore activities could delay or disrupt our operations, result in increased supplemental bonding and costs, limit our activities in certain areas, cause us to incur penalties or fines or to shut-in production at one or more of our facilities, or result in the suspension or cancellation of leases.
Currently, we have posted an aggregate of approximately $115 million in surety bonds in favor of BOEM, third party bonds and letters of credit, all relating to our offshore abandonment obligations. The bonds represent guarantees by the surety insurance companies that we will operate in accordance with applicable rules and regulations and perform certain plugging and abandonment obligations as specified by applicable working interest purchase and sale agreements. There is no assurance that our current tailored plan will be approved by BOEM, and BOEM may require further revisions to our plan. A revised tailored plan may require incremental financial assurance or bonding for non-sole liability properties, dependent on adjustments following ongoing discussions with BOEM and BSEE and any modifications to the proposed NTL.
Hurricanes – Since a large portion of our production originates from a concentrated area of the GOM, we are particularly vulnerable to the effects of hurricanes on production. Additionally, affordable and practical insurance coverage for property damage to our facilities for hurricanes has been difficult to obtain for some time so we have eliminated our hurricane insurance coverage. Significant hurricane impacts could include reductions and/or deferrals of future oil and natural gas production and revenues, increased lease operating expenses for evacuations and repairs and possible increases to and/or acceleration of plugging and abandonment costs, all of which could also affect our ability to remain in compliance with the covenants under our Amended Credit Agreement.
Deep Water Operations – We are currently operating two significant properties in the deep water of the GOM and engage in deep water drilling operations. Operations in the deep water involve high operational risks. Despite technological advances over the last several years, liabilities for environmental losses, personal injury and loss of life and significant regulatory fines in the event of an incident could be well in excess of insured amounts and result in significant losses on our statement of operations as well as going concern issues.
41
Liquidity and Capital Resources
Overview
In connection with our restructuring efforts, we sold our Appalachia Properties on February 27, 2017 for net cash consideration of approximately $522.5 million. A portion of the consideration received from the sale of the Appalachia Properties was used to fund the Company’s cash payment obligations under the Plan. Upon emergence from bankruptcy on February 28, 2017, we eliminated approximately $1.1 billion in principal amount of outstanding debt. For additional details, see “Reorganization and Emergence from Voluntary Chapter 11 Proceedings” above. These significant transactions improved our financial position and liquidity.
As of March 9, 2018, we had approximately $283 million of cash on hand and approximately $3 million of cash held in a restricted account to satisfy near-term plugging and abandonment liabilities, pursuant to the terms of the Amended Credit Agreement, and $235.8 million in total debt outstanding, including $225 million of 2022 Second Lien Notes and $10.8 million outstanding under the 4.20% Building Loan (the “Building Loan”). Our available borrowings under the Amended Credit Agreement were initially set at $150 million until the first borrowing base redetermination in November 2017. On November 8, 2017, the borrowing base under the Amended Credit Agreement was redetermined to $100 million. On March 9, 2018, we had no outstanding borrowings and $12.6 million of outstanding letters of credit, leaving $87.4 million of availability under the Amended Credit Agreement.
As of December 31, 2017, we had a current income tax receivable of $36.3 million, of which $20.1 million was received in January 2018.
In January 2018, the Board authorized a 2018 capital expenditure budget of up to $212 million, which excludes acquisitions and capitalized SG&A and interest, and does not give effect to the potential Talos combination. Based on our current outlook of commodity prices and our estimated production for 2018, we expect that cash flows from operating activities, cash on hand and availability under the Amended Credit Agreement will be adequate to meet the current 2018 operating and capital expenditure needs of the Company. We are currently evaluating various acquisition opportunities, which, if successful, may increase the capital requirements of the Company for 2018.
Currently, we have posted an aggregate of approximately $115 million in surety bonds in favor of BOEM, third party bonds and letters of credit, all relating to our offshore abandonment obligations. Although the surety companies have not historically required collateral from us to back our surety bonds, we have provided some cash collateral on an immaterial portion of our existing surety bonds and may be required to provide additional cash collateral on existing and/or new surety bonds required by BOEM to satisfy financial assurance requirements. This need to obtain additional surety bonds or some other form of financial assurance could impact our liquidity. See “Known Trends and Uncertainties” above.
Indebtedness
Successor Bank Credit Facility – On the Effective Date, pursuant to the terms of the Plan, the Predecessor Company’s Pre-Emergence Credit Agreement was amended and restated as the Amended Credit Agreement, and the obligations owed to the lenders under the Pre-Emergence Credit Agreement were converted to obligations under the Amended Credit Agreement. The Amended Credit Agreement provides for a reserve-based revolving credit facility and matures on February 28, 2021.
The Company’s available borrowings under the Amended Credit Agreement were initially set at $150 million until the first borrowing base redetermination in November 2017. On November 8, 2017, the borrowing base under the Amended Credit Agreement was redetermined to $100 million. On March 9, 2018, the Company had no outstanding borrowings and $12.6 million of outstanding letters of credit, leaving $87.4 million of availability under the Amended Credit Agreement. Interest on loans under the Amended Credit Agreement is calculated using the London Interbank Offering Rate (“LIBOR”) or the base rate, at the election of the Company, plus, in each case, an applicable margin. The applicable margin is determined based on borrowing base utilization and ranges from 2.00% to 3.00% per annum for base rate loans and 3.00% to 4.00% per annum for LIBOR loans.
The borrowing base under the Amended Credit Agreement is redetermined semi-annually, in May and November, by the lenders, in accordance with the lenders’ customary practices for oil and gas loans. In addition, we and the lenders each have discretion at any time, but not more than two additional times each in any calendar year, to have the borrowing base redetermined. Subject to certain exceptions, the Amended Credit Agreement is required to be guaranteed by all of the material domestic direct and indirect subsidiaries of the Company. As of December 31, 2017, the Amended Credit Agreement is guaranteed by Stone Offshore. The Amended Credit Agreement is secured by substantially all of the Company’s and its subsidiaries’ assets.
42
The Amended Credit Agreement provides for customary optional and mandatory prepayments, affirmative and negative covenants and events of default, including limitations on the incurrence of debt, liens, restrictive agreements, mergers, asset sales, dividends, investments, affiliate transactions and restrictions on commodity hedging. During the continuance of certain events of default, the lenders may take a number of actions, including declaring the entire amount then outstanding under the Amended Credit Agreement due and payable (in the event of certain insolvency-related events, the entire amount then outstanding under the Amended Credit Agreement will become automatically due and payable). The Amended Credit Agreement also requires maintenance of certain financial covenants, including (i) a consolidated funded debt to EBITDA ratio of not more than 2.75x for the test period ending March 31, 2017, 2.50x for the test period ending June 30, 2017, 3.00x for the test period ending September 30, 2017, 2.75x for the test period ending December 31, 2017, 2.50x for the test periods ending March 31, 2018, June 30, 2018, September 30, 2018 and December 31, 2018, respectively, 2.75x for the test period ending March 31, 2019, 3.00x for the test period ending June 30, 2019, 3.50x for the test periods ending September 30, 2019 and December 31, 2019, respectively, 3.00x for the test period ending March 31, 2020, 2.75x for the test periods ending June 30, 2020 and September 30, 2020, respectively, and 2.50x for the test periods ending December 31, 2020 and March 31, 2021, respectively, (ii) a consolidated interest coverage ratio of not less than 2.75 to 1.00, and (iii) a requirement to maintain minimum liquidity of at least 20% of the borrowing base. We were in compliance with all covenants under the Amended Credit Agreement as of December 31, 2017.
2022 Second Lien Notes – On the Effective Date, pursuant to the terms of the Plan, the Successor Company entered into an indenture by and among the Company, Stone Offshore, as guarantor (the “Guarantor”), and The Bank of New York Mellon Trust Company, N.A., as trustee and collateral agent (the “2022 Second Lien Notes Indenture”), and issued $225.0 million of the Company’s 2022 Second Lien Notes pursuant thereto.
Interest on the 2022 Second Lien Notes will accrue at a rate of 7.50% per annum payable semi-annually in arrears on May 31 and November 30 of each year in cash, beginning November 30, 2017. At December 31, 2017, $1.4 million had been accrued in connection with the May 31, 2018 interest payment. The 2022 Second Lien Notes are secured on a second lien priority basis by the same collateral that secures the Amended Credit Agreement, including the Company’s oil and natural gas properties, and are guaranteed by the Guarantor. The 2022 Second Lien Notes mature on May 31, 2022. Pursuant to the terms of the Intercreditor Agreement (as defined in Note 13 – Debt), the security interest in those assets that secure the 2022 Second Lien Notes and the related guarantee are contractually subordinated to liens thereon that secure the Company’s Amended Credit Agreement and certain other permitted obligations as set forth in the 2022 Second Lien Notes Indenture. Consequently, the 2022 Second Lien Notes and the related guarantee are effectively subordinated to the Amended Credit Agreement and such other permitted secured indebtedness to the extent of the value of such assets.
At any time prior to May 31, 2020, the Company may, at its option, on any one or more occasions redeem up to 35% of the aggregate principal amount of the 2022 Second Lien Notes issued under the 2022 Second Lien Notes Indenture at a redemption price of 107.5% of the principal amount of the 2022 Second Lien Notes, plus accrued and unpaid interest to the redemption date, with an amount of cash equal to the net cash proceeds of certain equity offerings; provided that at least 65% of the aggregate principal amount of the 2022 Second Lien Notes as of the Effective Date remains outstanding after each such redemption. On or after May 31, 2020, the Company may redeem all or part of the 2022 Second Lien Notes at redemption prices (expressed as percentages of the principal amount) equal to (i) 105.625% for the twelve-month period beginning on May 31, 2020; (ii) 105.625% for the twelve-month period beginning on May 31, 2021; and (iii) 100.000% for the twelve-month period beginning May 31, 2022 and at any time thereafter, in each case, plus accrued and unpaid interest at the redemption date. In addition, at any time prior to May 31, 2020, the Company may redeem all or a part of the 2022 Second Lien Notes at a redemption price equal to 100% of the principal amount of the 2022 Second Lien Notes to be redeemed plus a make-whole premium, plus accrued and unpaid interest to the redemption date.
The 2022 Second Lien Notes Indenture contains covenants that restrict the Company’s ability and the ability of certain of its subsidiaries to: (i) incur additional debt and issue preferred stock; (ii) make payments or distributions on account of the Company’s or its restricted subsidiaries’ capital stock; (iii) sell assets; (iv) restrict dividends or other payments of the Company’s restricted subsidiaries; (v) create liens that secure debt; (vi) enter into transactions with affiliates, and (vii) merge or consolidate with another company. These covenants are subject to a number of important exceptions and qualifications. At any time when the 2022 Second Lien Notes are rated investment grade by both Moody’s Investors Service, Inc. and Standard & Poor’s Ratings Services, a division of The McGraw-Hill Companies, Inc., and no Default (as defined in the 2022 Second Lien Notes Indenture) has occurred and is continuing, many of these covenants will terminate.
Building Loan – On November 20, 2015, we entered into an approximately $11.8 million term loan agreement, the Building Loan, maturing on November 20, 2030. There were no changes to the terms of the Building Loan pursuant to the Plan. The Building Loan bears interest at a rate of 4.20% per annum and is to be repaid in 180 equal monthly installments of approximately $73,000 commencing on December 20, 2015. As of December 31, 2017, the outstanding balance under the Building Loan totaled $10.9 million. The Building Loan is collateralized by our two Lafayette, Louisiana office buildings. Under the financial covenants of
43
the Building Loan, we must maintain a ratio of EBITDA to Net Interest Expense of not less than 2.00 to 1.00. In addition, the Building Loan contains certain customary restrictions or requirements with respect to change of control and reporting responsibilities. We were in compliance with all covenants under the Building Loan as of December 31, 2017.
Cash Flow and Working Capital
Net cash provided by (used in) operating activities totaled $89.1 million during the period of March 1, 2017 through December 31, 2017 (Successor) and $(5.9) million during the period of January 1, 2017 through February 28, 2017 (Predecessor), compared to $78.6 million and $247.5 million during the years ended December 31, 2016 and 2015 (Predecessor), respectively. Operating cash flows were positively impacted during the period of March 1, 2017 through December 31, 2017 (Successor) by a federal royalty refund and decreases in lease operating expenses, restructuring fees and incentive compensation expenses. Increases in the prices we received for our oil, natural gas and NGL production during 2017 were offset by decreases in oil, natural gas and NGL production volumes. Included in operating cash flows for the period of January 1, 2017 through February 28, 2017 (Predecessor) is the payment to Tug Hill of approximately $11.5 million for a break-up fee and expense reimbursements upon termination of the Tug Hill PSA. Included in operating cash flows for the period of March 1, 2017 through December 31, 2017 (Successor) is approximately $6.2 million of transaction costs related to the pending Talos combination. Operating cash flows during the year ended December 31, 2016 (Predecessor) were negatively impacted by declines in commodity prices, rig subsidy and stacking charges, rig contract and offshore vessel contract termination charges, and restructuring and reorganization charges incurred in connection with our bankruptcy filings. See Results of Operations below for additional information relative to commodity prices, production and operating expense variances.
Net cash provided by investing activities totaled $12.0 million during the period of March 1, 2017 through December 31, 2017 (Successor), which primarily represents the release of $56.8 million of previously restricted funds for near-term plugging and abandonment liabilities and $20.6 million of net proceeds from the sale of the Appalachia Properties, partially offset by $65.3 million of our investment in oil and gas properties. Net cash provided by investing activities totaled $421.0 million during the period of January 1, 2017 through February 28, 2017 (Predecessor), which primarily represents $505.4 million of net proceeds from the sale of the Appalachia Properties, partially offset by $75.5 million of funds restricted for near-term plugging and abandonment liabilities and $8.8 million of our investment in oil and gas properties. Net cash used in investing activities totaled $238.2 million during the year ended December 31, 2016 (Predecessor), which primarily represents our investment in oil and gas properties of $238.0 million. Net cash used in investing activities totaled $321.3 million during the year ended December 31, 2015 (Predecessor), which primarily represents our investment in oil and gas properties of $522.0 million, partially offset by $179.5 million of previously restricted proceeds from the sale of oil and gas properties and $22.8 million of proceeds from the sale of oil and gas properties.
Net cash used in financing activities during the period of March 1, 2017 through December 31, 2017 (Successor) totaled $0.5 million. Net cash used in financing activities totaled $442.8 million during the period of January 1, 2017 through February 28, 2017 (Predecessor), which primarily represents $341.5 million in repayments of borrowings under the Pre-Emergence Credit Agreement and $100.0 million of payments to the holders of the 2017 Convertible Notes and 2022 Notes in connection with our restructuring. Net cash provided by financing activities totaled $339.4 million during the year ended December 31, 2016 (Predecessor), which primarily represents $477.0 million in borrowings under the Pre-Emergence Credit Agreement less $135.5 million in repayments of borrowings under the Pre-Emergence Credit Agreement. Net cash provided by financing activities totaled $10.2 million during the year ended December 31, 2015 (Predecessor), which primarily represents $11.8 million of net proceeds from our Building Loan, partially offset by net payments for share-based compensation of approximately $3.1 million.
We had working capital of $193.4 million at December 31, 2017.
Capital Expenditures
During the period of March 1, 2017 through December 31, 2017 (Successor), net additions to oil and gas properties of $47.5 million included $6.5 million of capitalized SG&A expenses, $3.9 million of capitalized interest and $17.4 million of downward revisions of estimates of asset retirement obligations. During the period of January 1, 2017 through February 28, 2017 (Predecessor), net additions to oil and gas properties of $19.8 million included $3.0 million of capitalized SG&A expenses and $2.5 million of capitalized interest. These investments were financed with cash on hand and cash flows from operating activities. These additions to oil and gas property costs exclude plugging and abandonment expenditures for the period of March 1, 2017 through December 31, 2017 (Successor) and the period of January 1, 2017 through February 28, 2017 (Predecessor) of approximately $80.7 million and $3.6 million, respectively, which are recorded as reductions of asset retirement obligations.
Hedging
See Item 7A. Quantitative and Qualitative Disclosures About Market Risk – Commodity Price Risk.
44
Safety Performance
Historically, we have measured our safety performance based on the total recordable incident rate (“TRIR”), which is the number of safety incidents per 200,000 man-hours worked for employees and certain contractors. For fiscal 2015 and 2016, we broadened our safety performance measures, using a factor called our Health, Safety and Environmental (“HSE”) factor. The HSE factor included personal safety, environmental safety (as measured by reported spills of hydrocarbons) and compliance safety (as measured by fines or penalties paid to state or federal regulatory agencies). For the years ended December 31, 2015 and 2016, our HSE goal was set at 0.30, and our actual HSE performance for those years was 0.14 and 0.28, respectively.
For fiscal 2017, we expanded our measure of safety performance using a Safety and Environmental Compliance matrix, which goes beyond the traditional measure of TRIR to incorporate other safety related factors such as “Days Away from Work” as well as environmental and compliance factors. The target for 2017 was set to require a Safety and Compliance score below 0.25 and a Relative Incident of Non-Compliance (INC) to Component Ratio of 1.0. For 2017, we achieved a Safety and Compliance score of 0.22 and a Relative INC to Component Ratio of 0.60.
All onshore safety incidents are reported to the Occupational Safety and Health Administration (“OSHA”) and are tracked on OSHA Form 301. All offshore safety incidents are reported to BOEM. Our safety initiative includes formal programs for observation and reporting of at-risk and safe behavior in and away from the work place, employee awards for results and observations, employee participation in training programs and internal safety audits. We have an annual cash incentive compensation plan that includes a safety component based on our annual Safety and Environmental Compliance score.
45
Results of Operations
2017 Periods Compared to 2016. The following table sets forth certain information with respect to our oil and gas operations and summary information with respect to our estimated proved oil and natural gas reserves. See Item 2. Properties – Oil and Natural Gas Reserves.
Successor | Predecessor | |||||||||||
Period from March 1, 2017 through December 31, 2017 | Period from January 1, 2017 through February 28, 2017 | Year Ended December 31, 2016 | ||||||||||
Production: | ||||||||||||
Oil (MBbls) | 4,169 | 908 | 6,308 | |||||||||
Natural gas (MMcf) | 7,616 | 5,037 | 29,441 | |||||||||
NGLs (MBbls) | 403 | 408 | 2,183 | |||||||||
Oil, natural gas and NGLs (MBoe) | 5,841 | 2,156 | 13,398 | |||||||||
Revenue data (in thousands): (1) | ||||||||||||
Oil revenue | $ | 211,792 | $ | 45,837 | $ | 281,246 | ||||||
Natural gas revenue | 18,874 | 13,476 | 64,601 | |||||||||
NGLs revenue | 9,610 | 8,706 | 28,888 | |||||||||
Total oil, natural gas and NGL revenue | $ | 240,276 | $ | 68,019 | $ | 374,735 | ||||||
Average prices: (2) | ||||||||||||
Oil (per Bbl) | $ | 50.80 | $ | 50.48 | $ | 44.59 | ||||||
Natural gas (per Mcf) | $ | 2.48 | $ | 2.68 | $ | 2.19 | ||||||
NGLs (per Bbl) | $ | 23.85 | $ | 21.34 | $ | 13.23 | ||||||
Oil, natural gas and NGLs (per Boe) | $ | 41.14 | $ | 31.55 | $ | 27.97 | ||||||
Expenses (in thousands): | ||||||||||||
Lease operating expenses | $ | 49,800 | $ | 8,820 | $ | 79,650 | ||||||
Transportation, processing and gathering expenses | $ | 4,084 | $ | 6,933 | $ | 27,760 | ||||||
Salaries, general and administrative expenses (3) | $ | 47,817 | $ | 9,629 | $ | 58,928 | ||||||
DD&A expense on oil and gas properties | $ | 97,027 | $ | 36,751 | $ | 215,738 | ||||||
Expenses (per Boe): | ||||||||||||
Lease operating expenses | $ | 8.53 | $ | 4.09 | $ | 5.94 | ||||||
Transportation, processing and gathering expenses | $ | 0.70 | $ | 3.22 | $ | 2.07 | ||||||
Salaries, general and administrative expenses (3) | $ | 8.19 | $ | 4.47 | $ | 4.40 | ||||||
DD&A expense on oil and gas properties | $ | 16.61 | $ | 17.05 | $ | 16.10 | ||||||
Estimated Proved Reserves at period end: | ||||||||||||
Oil (MBbls) | 21,876 | 22,276 | 23,280 | |||||||||
Natural gas (MMcf) | 50,116 | 60,533 | 117,320 | |||||||||
NGLs (MBbls) | 2,305 | 2,802 | 10,629 | |||||||||
Oil, natural gas and NGLs (MBoe) | 32,533 | 35,166 | 53,462 | |||||||||
(1) | Includes the cash settlement of effective hedging contracts for the year ended December 31, 2016. With respect to our 2017, 2018 and 2019 commodity derivative contracts, we have elected to not designate these contracts as cash flow hedges, and accordingly, cash settlements of our derivative contracts for periods subsequent to January 1, 2017 are reflected in derivative income (expense). |
(2) | Prices for the year ended December 31, 2016 include the realized impact of derivative instrument settlements, which increased the price of oil by $3.77 per Bbl and increased the price of natural gas by $0.39 per Mcf. |
(3) | Excludes incentive compensation expense. |
Net Income/Loss. During the period of March 1, 2017 through December 31, 2017 (Successor), we reported a net loss totaling $247.6 million, or $12.38 per share. During the period of January 1, 2017 through February 28, 2017 (Predecessor), we reported net income totaling $630.3 million, or $110.99 per share. For the year ended December 31, 2016 (Predecessor), we reported a net loss of $590.6 million, or $105.63 per share. All per share amounts are on a diluted basis.
46
Write-down of oil and gas properties – We follow the full cost method of accounting for oil and gas properties. During the period of March 1, 2017 through December 31, 2017 (Successor), we recognized a ceiling test write-down of our U.S. oil and gas properties totaling $256.4 million. During the year ended December 31, 2016 (Predecessor), we recognized ceiling test write-downs of our U.S. and Canadian oil and gas properties totaling $357.4 million. The write-downs did not impact our cash flows from operating activities but did reduce net income and decrease stockholders’ equity.
The Successor period write-down of oil and gas properties was primarily due to differences between the trailing twelve-month average pricing assumption used in calculating the ceiling test and the forward prices used in fresh start accounting to estimate the fair value of our oil and gas properties on the fresh start reporting date of February 28, 2017.
Sale of Appalachia Properties – During the period of January 1, 2017 through February 28, 2017 (Predecessor), we recognized a $213.5 million gain on the sale of the Appalachia Properties, representing the excess of the proceeds from the sale over the carrying amount attributed to the oil and gas properties sold, adjusted for transaction costs and other items. See Note 4 – Divestiture for additional details.
Reorganization items – During the period of January 1, 2017 through February 28, 2017 (Predecessor), we recognized a net gain of $437.7 million for reorganization items. The net gain was primarily due to the gain on the discharge of debt and fresh start adjustments upon emergence from bankruptcy.
Restructuring fees – During the period of March 1, 2017 through December 31, 2017 (Successor) and the year ended December 31, 2016 (Predecessor), restructuring fees totaled $0.7 million and $29.6 million, respectively. These fees, incurred subsequent and prior to the filing of the Bankruptcy Petitions, related to our restructuring efforts, including legal and financial advisory costs for Stone, our bank group and the Predecessor Company’s noteholders.
Other expense – In connection with the termination of the Tug Hill PSA, we paid a break-up fee and expense reimbursements totaling $11.5 million, which is recognized as other expense during the period of January 1, 2017 through February 28, 2017 (Predecessor).
Other operational income – During the period of March 1, 2017 through December 31, 2017 (Successor), we recognized $9.6 million of other operational income related to the receipt of a multi-year federal royalty refund.
Production. During the period of March 1, 2017 through December 31, 2017 (Successor), the period of January 1, 2017 through February 28, 2017 (Predecessor) and the year ended December 31, 2016 (Predecessor), total production volumes were 5,841 MBoe, 2,156 MBoe and 13,398 MBoe, respectively. Oil production during the period of March 1, 2017 through December 31, 2017 (Successor), the period of January 1, 2017 through February 28, 2017 (Predecessor) and the year ended December 31, 2016 (Predecessor), totaled approximately 4,169 MBbls, 908 MBbls and 6,308 MBbls, respectively. Natural gas production totaled 7.6 Bcf, 5.0 Bcf and 29.4 Bcf during the period of March 1, 2017 through December 31, 2017 (Successor), the period of January 1, 2017 through February 28, 2017 (Predecessor) and the year ended December 31, 2016 (Predecessor), respectively. NGL production during the period of March 1, 2017 through December 31, 2017 (Successor), the period of January 1, 2017 through February 28, 2017 (Predecessor) and the year ended December 31, 2016 (Predecessor), totaled approximately 403 MBbls, 408 MBbls and 2,183 MBbls, respectively.
Production from our deep water Amethyst well was shut-in in April 2016 to allow for a technical evaluation. On November 30, 2016, we performed a routine shut-in of the well to record pressures and determined that pressure communication existed between the production tubing and production casing strings, resulting from a suspected tubing leak. In late April 2017, we completed temporary abandonment operations. The lease expired and was surrendered during the second quarter of 2017. We experienced production declines during the third quarter of 2017 as a result of planned downtime at the Pompano platform for a rig demobilization and reinstallation of living quarters. Production volumes during the fourth quarter of 2017 included five full days of downtime from Hurricane Nate and a ten day planned shut-in of the Pompano platform to replace a compressor engine.
The Mary field in Appalachia was shut-in from September 2015 through late June 2016. On February 27, 2017, we completed the sale of the Appalachia Properties to EQT. For the period of January 1, 2017 through February 27, 2017, total production volumes attributable to the Appalachia Properties were 965 MBoe, comprised of 3.5 Bcf of natural gas, 57 MBbls of oil and 330 MBbls of NGLs. For the year ended December 31, 2016, total production volumes attributable to the Appalachia Properties were approximately 4,724 MBoe, comprised of 16.1 Bcf of natural gas, 281 MBbls of oil and 1,753 MBbls of NGLs.
Prices. Prices realized during the period of March 1, 2017 through December 31, 2017 (Successor) averaged $50.80 per Bbl of oil, $2.48 per Mcf of natural gas and $23.85 per Bbl of NGLs. Prices realized during the period of January 1, 2017 through February 28, 2017 (Predecessor) averaged $50.48 per Bbl of oil, $2.68 per Mcf of natural gas and $21.34 per Bbl of NGLs. Prices realized during the year ended December 31, 2016 (Predecessor) averaged $44.59 per Bbl of oil, $2.19 per Mcf of natural gas and
47
$13.23 per Bbl of NGLs. The unit pricing amounts for the year ended December 31, 2016 include the cash settlement of effective hedging contracts.
We enter into various derivative contracts in order to reduce our exposure to the possibility of declining oil and natural gas prices. During the year ended December 31, 2016, effective hedging transactions increased our average realized natural gas price by $0.39 per Mcf and increased our average realized oil price by $3.77 per Bbl. With respect to our 2017, 2018 and 2019 derivative contracts, we elected to not designate these contracts as cash flow hedges for accounting purposes, and accordingly, settlements of our derivative contracts are now recognized in earnings through derivative income (expense). See “Known Trends and Uncertainties”.
Revenue. Oil, natural gas and NGL revenue was $240.3 million, $68.0 million and $374.7 million for the period of March 1, 2017 through December 31, 2017 (Successor), the period of January 1, 2017 through February 28, 2017 (Predecessor) and the year ended December 31, 2016 (Predecessor), respectively. The decrease in total revenue in 2017 was primarily due to a decrease in oil, natural gas and NGL production volumes partially offset by an increase in average realized commodity prices. For the period of January 1, 2017 through February 27, 2017 and the year ended December 31, 2016, total oil, natural gas and NGL revenues attributable to the Appalachia Properties were $18.6 million and $56.7 million, respectively.
Derivative Income/Expense. Net derivative expense for the year ended December 31, 2016 (Predecessor) totaled $0.8 million, comprised of $0.7 million of income from cash settlements and $1.5 million of non-cash expense resulting from changes in the fair value of unsettled derivative instruments.
With respect to our 2017, 2018 and 2019 commodity derivative contracts, we elected to not designate these contracts as cash flow hedges for accounting purposes. Accordingly, the net changes in the mark-to-market valuations and the monthly settlements of these derivative contracts are recorded in earnings in derivative income (expense). Net derivative expense for the period of March 1, 2017 through December 31, 2017 (Successor) totaled $13.4 million, comprised of $2.1 million of income from cash settlements and $15.5 million of non-cash expense resulting from changes in the fair value of derivative instruments. Net derivative expense for the period of January 1, 2017 through February 28, 2017 (Predecessor) totaled $1.8 million, comprised of non-cash expense resulting from changes in the fair value of derivative instruments.
Expenses. Lease operating expenses for the period of March 1, 2017 through December 31, 2017 (Successor), the period of January 1, 2017 through February 28, 2017 (Predecessor) and the year ended December 31, 2016 (Predecessor) totaled $49.8 million, $8.8 million and $79.7 million, respectively. The decrease in lease operating expenses in 2017 was primarily attributable to operating efficiencies, the implementation of cost-savings measures and the sale of the Appalachia Properties. Additionally, during the period of March 1, 2017 through December 31, 2017 (Successor), lease operating expenses were decreased by $4.5 million related to the receipt of a multi-year federal royalty refund. Partially offsetting these decreases were expenses incurred during this period for planned major maintenance projects. For the period of January 1, 2017 through February 27, 2017 (Predecessor) and the year ended December 31, 2016 (Predecessor), lease operating expenses attributable to the Appalachia Properties totaled $2.3 million and $11.6 million, respectively. On a unit of production basis, lease operating expenses were $8.53 per Boe, $4.09 per Boe and $5.94 per Boe for the period of March 1, 2017 through December 31, 2017 (Successor), the period of January 1, 2017 through February 28, 2017 (Predecessor) and the year ended December 31, 2016 (Predecessor), respectively. For the period of March 1, 2017 through December 31, 2017 (Successor), the higher per unit lease operating expense was the result of the sale of the lower-cost Appalachia Properties combined with lower production volumes from our GOM properties.
For the period of March 1, 2017 through December 31, 2017 (Successor), the period of January 1, 2017 through February 28, 2017 (Predecessor) and the year ended December 31, 2016 (Predecessor), transportation, processing and gathering (“TP&G”) expenses totaled $4.1 million, $6.9 million and $27.8 million, respectively, or $0.70 per Boe, $3.22 per Boe and $2.07 per Boe, respectively. TP&G expenses for the Predecessor periods primarily related to the Appalachia Properties that were sold on February 27, 2017. TP&G expenses for the year ended December 31, 2016 (Predecessor) included a $7.9 million recoupment of previously paid transportation costs allocable to the federal government’s portion of certain of our deep water production. For the period of January 1, 2017 through February 27, 2017 and the year ended December 31, 2016, TP&G expenses attributable to the Appalachia Properties totaled $6.8 million and $28.1 million, respectively.
For the period of March 1, 2017 through December 31, 2017 (Successor), the period of January 1, 2017 through February 28, 2017 (Predecessor) and the year ended December 31, 2016 (Predecessor), depreciation, depletion and amortization (“DD&A”) expense on oil and gas properties totaled $97.0 million, $36.8 million and $215.7 million, respectively. For the period of March 1, 2017 through December 31, 2017 (Successor), the period of January 1, 2017 through February 28, 2017 (Predecessor) and the year ended December 31, 2016 (Predecessor), DD&A expense on a unit of production basis was $16.61 per Boe, $17.05 per Boe and $16.10 per Boe, respectively.
48
For the period of March 1, 2017 through December 31, 2017 (Successor), the period of January 1, 2017 through February 28, 2017 (Predecessor) and the year ended December 31, 2016 (Predecessor), other operational expenses totaled $3.4 million, $0.5 million and $55.5 million, respectively. Other operational expenses for the period of March 1, 2017 through December 31, 2017 (Successor) included $2.1 million of stacking charges for the Pompano platform rig. Included in other operational expenses for the year ended December 31, 2016 are $9.9 million in charges for offshore vessel and Appalachian drilling rig contract terminations, a $20.0 million charge related to the termination of our deep water drilling rig contract with Ensco in June 2016, approximately $17.7 million of rig subsidy and stacking charges related to the ENSCO 8503 deep water drilling rig, the Appalachian drilling rig and the platform rig at Pompano, and a $6.1 million cumulative foreign currency translation loss on the substantial liquidation of our foreign subsidiary, Stone Energy Canada ULC, which was reclassified from accumulated other comprehensive income.
For the period of March 1, 2017 through December 31, 2017 (Successor), the period of January 1, 2017 through February 28, 2017 (Predecessor) and the year ended December 31, 2016 (Predecessor), SG&A expenses (exclusive of incentive compensation) totaled $47.8 million, $9.6 million and $58.9 million, respectively. For the period of March 1, 2017 through December 31, 2017 (Successor), the period of January 1, 2017 through February 28, 2017 (Predecessor) and the year ended December 31, 2016 (Predecessor), SG&A expenses on a unit of production basis were $8.19 per Boe, $4.47 per Boe and $4.40 per Boe, respectively. The decline in production volumes in 2017 resulted in an increase in SG&A expenses on a unit of production basis.
SG&A expenses for the period of March 1, 2017 through December 31, 2017 (Successor) included a $5.7 million charge incurred in connection with workforce reductions, consisting primarily of severance payments to affected employees and payment of related employer payroll taxes, and $3.0 million of severance costs related to the sale of the Appalachia Properties and the retirement of the prior chief executive officer of the Company. Also included in SG&A expenses for the period of March 1, 2017 through December 31, 2017 (Successor) is a $3.9 million success-based consulting fee paid in connection with a federal royalty refund and approximately $6.2 million of costs related to the Board-requested strategic review of the Company and the pending Talos combination. The charges for the workforce reductions, severance payments and costs associated with the pending Talos combination offset the overall reductions in SG&A expense that we realized in 2017 as a result of staff and other cost reductions in connection with our restructuring.
For the period of January 1, 2017 through February 28, 2017 (Predecessor), incentive compensation expense totaled $2.0 million and represented payments made to the Company’s executives pursuant to the Key Executive Incentive Plan (the “KEIP”). For the period of March 1, 2017 through December 31, 2017 (Successor), incentive compensation expense totaled $8.0 million. This amount consisted of $7.0 million of expense related to incentive compensation bonuses accrued pursuant to the 2017 Annual Incentive Compensation Plan (the “2017 Annual Incentive Plan”), calculated based on the Company’s performance in certain 2017 fiscal year performance areas, and $1.0 million of expense related to the accrual of estimated retention awards. Incentive compensation expense for the year ended December 31, 2016 (Predecessor) totaled $13.5 million and related to incentive compensation bonuses that were calculated based on the achievement of certain strategic objectives for each quarter of 2016. Portions of the 2016 incentive cash bonuses replaced amounts previously awarded to employees as stock-based compensation, reflected in SG&A expenses, resulting in higher incentive compensation expense in the year ended December 31, 2016 as compared to the 2017 periods.
Interest expense for the period of March 1, 2017 through December 31, 2017 (Successor), totaled $11.7 million, net of $3.9 million of capitalized interest, and included interest expense associated with the 2022 Second Lien Notes. We recorded no interest expense for the period of January 1, 2017 through February 28, 2017 (Predecessor) subsequent to the filing of the Bankruptcy Petitions. Interest expense for the year ended December 31, 2016 (Predecessor), totaled $64.5 million, net of $26.6 million of capitalized interest, and included interest expense associated with borrowings under our Pre-Emergence Credit Agreement and the 2017 Convertible Notes and 2022 Notes prior to the filing of the Bankruptcy Petitions. Upon emergence from bankruptcy on February 28, 2017, pursuant to the terms of the Plan, the 2017 Convertible Notes and 2022 Notes were cancelled and outstanding borrowings under the Pre-Emergence Credit Agreement were paid in full.
For the period of March 1, 2017 through December 31, 2017 (Successor), we recorded an income tax benefit of $18.3 million primarily related to an income tax receivable recorded related to the carryback of specified liability losses generated during the period. For the period of January 1, 2017 through February 28, 2017 (Predecessor) and the year ended December 31, 2016 (Predecessor), we recorded an income tax provision of $3.6 million and $7.4 million, respectively. As a result of the significant declines in commodity prices and the resulting ceiling test write-downs and net losses incurred, we determined in the third quarter of 2015 that it was more likely than not that a portion of our deferred tax assets will not be realized in the future. Accordingly, we established a valuation allowance against a portion of our deferred tax assets. We also established a valuation allowance against a portion of our deferred tax assets upon emergence from bankruptcy as part of fresh start accounting, and the subsequent change in the valuation allowance was recorded as an adjustment to the income tax provision. See Note 12 – Income Taxes in the Notes to the Consolidated Financial Statements under Item 8 of this Form 10-K.
49
2016 Compared to 2015 (Predecessor Company). The following table sets forth certain information with respect to our oil and gas operations and summary information with respect to our estimated proved oil and natural gas reserves. See Item 2. Properties – Oil and Natural Gas Reserves.
Predecessor | |||||||
Year Ended December 31, | |||||||
2016 | 2015 | ||||||
Production: | |||||||
Oil (MBbls) | 6,308 | 5,991 | |||||
Natural gas (MMcf) | 29,441 | 36,457 | |||||
NGLs (MBbls) | 2,183 | 2,401 | |||||
Oil, natural gas and NGLs (MBoe) | 13,398 | 14,468 | |||||
Revenue data (in thousands): (1) | |||||||
Oil revenue | $ | 281,246 | $ | 416,497 | |||
Natural gas revenue | 64,601 | 83,509 | |||||
NGL revenue | 28,888 | 32,322 | |||||
Total oil, natural gas and NGL revenue | $ | 374,735 | $ | 532,328 | |||
Average prices: (2) | |||||||
Oil (per Bbl) | $ | 44.59 | $ | 69.52 | |||
Natural gas (per Mcf) | $ | 2.19 | $ | 2.29 | |||
NGLs (per Bbl) | $ | 13.23 | $ | 13.46 | |||
Oil, natural gas and NGLs (per Boe) | $ | 27.97 | $ | 36.79 | |||
Expenses (in thousands): | |||||||
Lease operating expenses | $ | 79,650 | $ | 100,139 | |||
Transportation, processing and gathering expenses | $ | 27,760 | $ | 58,847 | |||
Salaries, general and administrative expenses (3) | $ | 58,928 | $ | 69,384 | |||
DD&A expense on oil and gas properties | $ | 215,738 | $ | 277,088 | |||
Expenses (per Boe): | |||||||
Lease operating expenses | $ | 5.94 | $ | 6.92 | |||
Transportation, processing and gathering expenses | $ | 2.07 | $ | 4.07 | |||
Salaries, general and administrative expenses (3) | $ | 4.40 | $ | 4.80 | |||
DD&A expense on oil and gas properties | $ | 16.10 | $ | 19.15 | |||
Estimated Proved Reserves at December 31: | |||||||
Oil (MBbls) | 23,280 | 30,276 | |||||
Natural gas (MMcf) | 117,320 | 121,858 | |||||
NGLs (MBbls) | 10,629 | 6,458 | |||||
Oil, natural gas and NGLs (MBoe) | 53,462 | 57,043 | |||||
(1) | Includes the cash settlement of effective hedging contracts. |
(2) | Prices include the realized impact of derivative instrument settlements which increased the price of oil by $3.77 per Bbl and increased the price of natural gas by $0.39 per Mcf for the year ended December 31, 2016, and which increased the price of oil by $22.64 per Bbl and increased the price of natural gas by $0.39 per Mcf for the year ended December 31, 2015. |
(3) | Excludes incentive compensation expense. |
Net Loss. For the year ended December 31, 2016, we reported a net loss totaling $590.6 million, or $105.63 per share, compared to a net loss for the year ended December 31, 2015 of $1,090.9 million, or $197.45 per share. All per share amounts are on a diluted basis.
Write-down of oil and gas properties – We follow the full cost method of accounting for oil and gas properties. During the year ended December 31, 2016, we recognized write-downs of our U.S. and Canadian oil and gas properties totaling $357.4 million. During the year ended December 31, 2015, we recognized write-downs of our U.S. oil and gas properties totaling $1,362.4 million. The write-downs did not impact our cash flows from operating activities but did reduce net income and decrease stockholders’ equity.
50
Restructuring fees – During the year ended December 31, 2016, we recognized a charge of $29.6 million for restructuring fees. These fees, incurred prior to the filing of the Bankruptcy Petitions, related to expenses supporting our restructuring effort, including legal and financial advisory costs for Stone, our bank group and the Predecessor Company’s noteholders.
Reorganization items – During the year ended December 31, 2016, we recognized a charge of $10.9 million for reorganization items, representing professional fees and other expenses incurred subsequent to the Chapter 11 filing, prior to emergence.
Production. During the year ended December 31, 2016, total production volumes decreased to 13,398 MBoe compared to 14,468 MBoe produced during the comparable 2015 period, representing a 7% decrease. Oil production during the year ended December 31, 2016 totaled approximately 6,308 MBbls compared to 5,991 MBbls produced during the year ended December 31, 2015. Natural gas production totaled 29.4 Bcf during the year ended December 31, 2016 compared to 36.5 Bcf produced during the comparable 2015 period. NGL production during the year ended December 31, 2016 totaled approximately 2,183 MBbls compared to 2,401 MBbls produced during the comparable 2015 period.
The decreases in natural gas and NGL production volumes during the year ended December 31, 2016 were primarily attributable to the shut-in of production at the Mary field from September 2015 until late June 2016. Additionally, in April 2016, production from our deep water Amethyst well was shut in to allow for a technical evaluation. During the first week of November 2016, we initiated acid stimulation work, and on November 30, 2016, we performed a routine shut in of the well to record pressures and determined that pressure communication existed between the production tubing and production casing strings, resulting from a suspected tubing leak. Intervention operations were unsuccessful.
For the year ended December 31, 2016, total production volumes attributable to the Appalachia Properties were approximately 4,724 MBoe, comprised of 16.1 Bcf of natural gas, 281 MBbls of oil and 1,753 MBbls of NGLs.
Prices. Prices realized during the year ended December 31, 2016 averaged $44.59 per Bbl of oil, $2.19 per Mcf of natural gas and $13.23 per Bbl of NGLs, or 24% lower, on a Boe basis, than 2015 average realized prices of $69.52 per Bbl of oil, $2.29 per Mcf of natural gas and $13.46 per Bbl of NGLs. All unit pricing amounts include the cash settlement of effective hedging contracts.
We enter into various derivative contracts in order to reduce our exposure to the possibility of declining oil and natural gas prices. During the year ended December 31, 2016, effective hedging transactions increased our average realized natural gas price by $0.39 per Mcf and increased our average realized oil price by $3.77 per Bbl. During the year ended December 31, 2015, effective hedging transactions increased our average realized natural gas price by $0.39 per Mcf and increased our average realized oil price by $22.64 per Bbl.
Revenue. Oil, natural gas and NGL revenue decreased 30% to $374.7 million for the year ended December 31, 2016 from $532.3 million for the year ended December 31, 2015. Total revenue for the year ended December 31, 2016 was lower primarily due to a 7% decrease in production volumes and a 24% decrease in average realized prices on an equivalent basis from the comparable period of 2015. For the year ended December 31, 2016, total oil, natural gas and NGL revenue attributable to the Appalachia Properties was $56.7 million.
Derivative Income/Expense. Net derivative expense for the year ended December 31, 2016 totaled $0.8 million, comprised of $0.7 million of income from cash settlements and $1.5 million of non-cash expense resulting from changes in the fair value of unsettled derivative instruments. For the year ended December 31, 2015, net derivative income totaled $8.0 million, comprised of $24.4 million of income from cash settlements and $16.4 million of non-cash income resulting from changes in the fair value of unsettled derivative instruments.
Expenses. Lease operating expenses for the years ended December 31, 2016 and 2015 totaled $79.7 million and $100.1 million, respectively. On a unit of production basis, lease operating expenses were $5.94 per Boe and $6.92 per Boe for the years ended December 31, 2016 and 2015, respectively. The decrease in lease operating expenses in 2016 was primarily attributable to service cost reductions, the implementation of cost-savings measures, operating efficiencies and the shut-in of production at the Mary field from September 2015 until late June 2016. For the year ended December 31, 2016, lease operating expenses attributable to the Appalachia Properties were $11.6 million.
TP&G expenses for the year ended December 31, 2016 totaled $27.8 million, which included a $7.9 million recoupment of prior period expenses against federal royalties, compared to $58.8 million for the year ended December 31, 2015, or $2.07 per Boe and $4.07 per Boe, respectively. The decrease in TP&G expenses during the year ended December 31, 2016 was primarily attributable to the shut-in of production at the Mary field from September 2015 until late June 2016. For the year ended December 31, 2016, TP&G expenses attributable to the Appalachia Properties were $28.1 million.
51
DD&A expense on oil and gas properties for the year ended December 31, 2016 totaled $215.7 million, or $16.10 per Boe, compared to DD&A expense of $277.1 million, or $19.15 per Boe, for the year ended December 31, 2015. The decrease in DD&A from 2015 was primarily due to the ceiling test write-downs of our oil and gas properties.
Other operational expenses for the years ended December 31, 2016 and 2015 totaled $55.5 million and $2.4 million, respectively. Included in other operational expenses for the year ended December 31, 2016 were $9.9 million in charges related to offshore vessel and Appalachian drilling rig contract terminations, a $20.0 million charge related to the termination of our deep water drilling rig contract with Ensco in June 2016, approximately $17.7 million of rig subsidy and stacking charges related to the ENSCO 8503 deep water drilling rig, the Appalachian drilling rig and the platform rig at Pompano, and a $6.1 million cumulative foreign currency translation loss on the substantial liquidation of our foreign subsidiary, Stone Energy Canada ULC, which was reclassified from accumulated other comprehensive income.
For the years ended December 31, 2016 and 2015, SG&A expenses (exclusive of incentive compensation) totaled $58.9 million and $69.4 million, respectively. On a unit of production basis, SG&A expenses were $4.40 per Boe and $4.80 per Boe for the years ended December 31, 2016 and 2015, respectively. The decrease in SG&A expenses in 2016 was primarily attributable to staff and other cost reductions. SG&A expenses for the year ended December 31, 2015 included $2.1 million of lease termination charges associated with the early termination of an office lease.
For the years ended December 31, 2016 and 2015, incentive compensation expense totaled $13.5 million and $2.2 million, respectively. The 2016 incentive compensation cash bonuses were calculated based on the achievement of certain strategic objectives for each quarter of 2016. Portions of the 2016 incentive cash bonuses replaced amounts previously awarded to employees as stock-based compensation, reflected in SG&A expenses, resulting in higher incentive compensation expense in the year ended December 31, 2016 as compared to the year ended December 31, 2015.
Interest expense for the year ended December 31, 2016 totaled $64.5 million, net of $26.6 million of capitalized interest, compared to interest expense of $43.9 million, net of $41.3 million of capitalized interest, for the year ended December 31, 2015. The increase in interest expense was primarily the result of interest expense associated with the increased borrowings under our Pre-Emergence Credit Agreement and a decrease in the amount of interest capitalized to oil and gas properties.
For the years ended December 31, 2016 and 2015, we recorded an income tax provision (benefit) of $7.4 million and ($316.4) million, respectively. The income tax benefit recorded for the year ended December 31, 2015 was a result of our loss before income taxes attributable to the ceiling test write-downs of our oil and gas properties. As a result of the significant declines in commodity prices and the resulting ceiling test write-downs and net losses incurred, we determined in the third quarter of 2015 that it was more likely than not that a portion of our deferred tax assets will not be realized in the future. Accordingly, we established a valuation allowance against a portion of our deferred tax assets. The change in the valuation allowance was recorded as an adjustment to income tax expense.
Off-Balance Sheet Arrangements
We have no off-balance sheet arrangements.
52
Contractual Obligations and Other Commitments
The following table summarizes our significant contractual obligations and commitments, other than derivative contracts, by maturity as of December 31, 2017 (Successor) (in thousands).
Payments Due By Period | |||||||||||||||||||
Total | Less than 1 Year | 1-3 Years | 3-5 Years | More than 5 Years | |||||||||||||||
Contractual Obligations and Commitments: | |||||||||||||||||||
7.50% Second Lien Notes due 2022 | $ | 225,000 | $ | — | $ | — | $ | 225,000 | $ | — | |||||||||
4.20% Building Loan | 10,972 | 425 | 906 | 985 | 8,656 | ||||||||||||||
Interest and commitment fees (1) | 80,988 | 18,040 | 36,027 | 24,792 | 2,129 | ||||||||||||||
Asset retirement obligations including accretion | 482,008 | 80,400 | 53,574 | 43,411 | 304,623 | ||||||||||||||
Rig commitments (2) | 800 | 800 | — | — | — | ||||||||||||||
Seismic data commitments | 8,565 | 7,690 | 875 | — | — | ||||||||||||||
Operating lease obligations | 261 | 261 | — | — | — | ||||||||||||||
Total Contractual Obligations and Commitments | $ | 808,594 | $ | 107,616 | $ | 91,382 | $ | 294,188 | $ | 315,408 | |||||||||
(1) Includes interest payable on the 2022 Second Lien Notes and the Building Loan. Assumes 0.375% fee on unused commitments under the Amended Credit Agreement.
(2) Represents minimum committed future expenditures for rig services.
Forward-Looking Statements
Certain of the statements set forth under this item and elsewhere in this Form 10-K are forward-looking and are based upon assumptions and anticipated results that are subject to numerous risks and uncertainties. See Item 1. Business — Forward-Looking Statements and Item 1A. Risk Factors.
Accounting Matters and Critical Accounting Estimates
Reorganization and Fresh Start Accounting. Subsequent to filing the Bankruptcy Petitions, we prepared our consolidated financial statements in accordance with ASC 852, “Reorganizations”. ASC 852 requires that the financial statements, for periods subsequent to the Chapter 11 filing, distinguish transactions and events that are directly associated with the reorganization from the ongoing operations of the business. Accordingly, professional fees and other expenses incurred in the Chapter 11 cases, and the write-off of remaining unamortized debt issuance costs, premiums and discounts associated with debt classified as liabilities subject to compromise, have been recorded as reorganization items on the consolidated statement of operations. In addition, pre-petition obligations that may have been impacted by the Chapter 11 process were classified on the consolidated balance sheet at December 31, 2016 as liabilities subject to compromise.
Upon emergence from bankruptcy, the Company qualified for and adopted fresh start accounting in accordance with the provisions of ASC 852, “Reorganizations” as (i) the holders of existing voting shares of the Predecessor Company received less than 50% of the voting shares of the Successor Company and (ii) the reorganization value of the Company’s assets immediately prior to confirmation of the Plan was less than the post-petition liabilities and allowed claims. The Company applied fresh start accounting as of February 28, 2017. Fresh start accounting required the Company to present its assets, liabilities and equity as if it were a new entity upon emergence from bankruptcy, with no beginning retained earnings or deficit as of the fresh start reporting date. The new entity is referred to as Successor or Successor Company, and includes the financial position and results of operations of the reorganized Company subsequent to February 28, 2017. References to Predecessor or Predecessor Company relate to the financial position and results of operations of the Company prior to, and including, February 28, 2017.
Fair Value Measurements. U.S. Generally Accepted Accounting Principles (“GAAP”), as codified, establish a framework for measuring fair value and require certain disclosures about fair value measurements. There is an established fair value hierarchy that has three levels based on the reliability of the inputs used to determine the fair value. These levels include: Level 1, defined as inputs such as unadjusted quoted prices in active markets for identical assets or liabilities; Level 2, defined as inputs other than quoted prices in active markets that are either directly or indirectly observable; and Level 3, defined as unobservable inputs for use when little or no market data exists, therefore requiring an entity to develop its own assumptions.
53
As of December 31, 2017 and 2016, we held certain financial assets and liabilities that are required to be measured at fair value on a recurring basis, including our commodity derivative instruments and our investments in marketable securities.
On February 28, 2017, we emerged from bankruptcy and adopted fresh start accounting, at which time our assets and liabilities were recorded at fair value. See Note 3 – Fresh Start Accounting for a detailed description of the fair value approaches used.
Asset Retirement Obligations. We are required to record our estimate of the fair value of liabilities related to future asset retirement obligations in the period the obligation is incurred. Asset retirement obligations relate to the removal of facilities and tangible equipment at the end of an oil and gas property’s useful life. The guidance regarding asset retirement obligations requires the use of management’s estimates with respect to future abandonment costs, inflation, timing of abandonment and cost of capital. Our estimate of our asset retirement obligations does not give consideration to the value the related assets could have to other parties.
Full Cost Method. We follow the full cost method of accounting for our oil and gas properties. Under this method, all acquisition, exploration, development and estimated abandonment costs, including certain related employee and general and administrative costs (less any reimbursements for such costs) and interest incurred for the purpose of acquiring and finding oil and gas are capitalized. Unevaluated property costs are excluded from the amortization base until we have made a determination as to the existence of proved reserves on the respective property or impairment. We review our unevaluated properties at the end of each quarter to determine whether the costs should be reclassified to proved oil and gas properties and thereby subject to DD&A. Sales of oil and gas properties are accounted for as adjustments to net proved oil and gas properties with no gain or loss recognized, unless the adjustment would significantly alter the relationship between capitalized costs and proved reserves.
We amortize our investment in oil and gas properties through DD&A expense using the units of production (the “UOP”) method. Under the UOP method, the quarterly provision for DD&A expense is computed by dividing production volumes for the period by the total proved reserves as of the beginning of the period (beginning of period reserves being determined by adding production to the end of period reserves), and applying the respective rate to the net cost of proved oil and gas properties, including future development costs.
We capitalize a portion of the interest costs incurred on our debt based upon the balance of our unevaluated property costs and our weighted-average borrowing rate. We also capitalize the portion of SG&A expenses that are attributable to our acquisition, exploration and development activities.
U.S. GAAP allows the option of two acceptable methods for accounting for oil and gas properties. The successful efforts method is the allowable alternative to the full cost method. The primary differences between the two methods are in the treatment of exploration costs, the computation of DD&A expense and the assessment of impairment of oil and gas properties. Under the full cost method, all exploratory costs are capitalized while under the successful efforts method, exploratory costs associated with unsuccessful exploratory wells and all geological and geophysical costs are expensed. Under the full cost method, DD&A expense is computed on cost centers represented by entire countries, while under the successful efforts method, cost centers are represented by properties, or some reasonable aggregation of properties with common geological structural features or stratigraphic condition, such as fields or reservoirs. Under the full cost method, oil and gas properties are subject to the ceiling test as discussed below while under the successful efforts method oil and gas properties are assessed for impairment in accordance with ASC 360.
Under the full cost method, we compare, at the end of each financial reporting period, the present value of estimated future net cash flows from proved reserves (adjusted for hedges and excluding cash flows related to estimated abandonment costs), to the net capitalized costs of proved oil and gas properties, net of related deferred taxes. We refer to this comparison as a ceiling test. If the net capitalized costs of proved oil and gas properties exceed the estimated discounted future net cash flows from proved reserves, we are required to write down the value of our oil and gas properties to the value of the discounted cash flows. Estimated future net cash flows from proved reserves are calculated based on a trailing twelve-month average pricing assumption.
Derivative Instruments and Hedging Activities. All derivatives are recognized as assets or liabilities on the balance sheet and are measured at fair value. At the end of each quarterly period, these derivatives are marked-to-market. If the derivative does not qualify or is not designated as a cash flow hedge, subsequent changes in the fair value of the derivative are recognized in earnings through derivative income (expense) in the statement of operations. If the derivative qualifies and is designated as a cash flow hedge, subsequent changes in the fair value of the derivative are recognized in stockholders’ equity through other comprehensive income (loss), net of related taxes, to the extent the hedge is considered effective. Monthly settlements of effective cash flow hedges are reflected in revenue from oil and natural gas production. Monthly settlements of ineffective hedges and derivatives not designated or that do not qualify for hedge accounting are recognized in earnings through derivative income (expense). The resulting cash flows from all monthly settlements are reported as cash flows from operating activities.
54
Through December 31, 2016, we designated our commodity derivatives as cash flow hedges for accounting purposes upon entering into the contracts. Accordingly, the contracts were recorded as either an asset or liability measured at fair value and subsequent changes in the derivative’s fair value were recognized in stockholders’ equity through other comprehensive income (loss), net of related taxes, to the extent the hedge was considered effective. Monthly settlements of effective hedges were reflected in revenue from oil and natural gas production. With respect to our 2017, 2018 and 2019 commodity derivative contracts, we have elected to not designate these contracts as cash flow hedges for accounting purposes. Accordingly, the net changes in the mark-to-market valuations and the monthly settlements of these derivative contracts will be recorded in earnings through derivative income (expense).
Use of Estimates. The preparation of financial statements in conformity with U.S. GAAP requires us to make estimates and assumptions that affect the reported amounts of assets and liabilities, the disclosure of contingent assets and liabilities at the date of the financial statements and the reported amounts of revenue and expenses during the reporting period. Actual results could differ from those estimates. Our most significant estimates are:
• | remaining proved oil and natural gas reserve volumes and the timing of their production; |
• | estimated costs to develop and produce proved oil and natural gas reserves; |
• | accruals of exploration costs, development costs, operating costs and production revenue; |
• | timing and future costs to abandon our oil and gas properties; |
• | estimated fair value of derivative positions; |
• | classification of unevaluated property costs; |
• | capitalized general and administrative costs and interest; |
• | estimates of fair value in business combinations; |
• | estimates of reorganization value and enterprise value; |
• | fair value of assets and liabilities recorded as a result of the adoption of fresh start accounting; |
• | current and deferred income taxes; and |
• | contingencies. |
For a more complete discussion of our accounting policies and procedures see our “Notes to Consolidated Financial Statements” beginning on page F-8.
Recent Accounting Developments
In May 2014, the Financial Accounting Standards Board (“FASB”) issued Accounting Standards Update (“ASU”) 2014-09, “Revenue from Contracts with Customers” to clarify the principles for recognizing revenue and to develop a common revenue standard and disclosure requirements. Under the new standard, revenue is recognized when a customer obtains control of promised goods or services in an amount that reflects the consideration the entity expects to receive in exchange for those goods or services. Additional disclosures will be required to describe the nature, amount, timing and uncertainty of revenue and cash flows from contracts with customers including the disaggregation of revenue and remaining performance obligations. The standard may be applied retrospectively or using a modified retrospective approach, with the cumulative effect of initially applying ASU 2014-09 recognized at the date of initial application, and is effective for interim and annual periods beginning on or after December 15, 2017.
We adopted this new standard on January 1, 2018 using the modified retrospective approach. The adoption of the standard did not have a material effect on our financial position, results of operations or cash flows, but will result in increased disclosures related to revenue recognition policies and disaggregation of revenues.
In February 2016, the FASB issued ASU 2016-02, “Leases (Topic 842)” to increase transparency and comparability among organizations by recognizing lease assets and lease liabilities on the balance sheet and disclosing key information about leasing arrangements. The standard is effective for public companies for fiscal years beginning after December 15, 2018, and for interim periods within those fiscal years, with earlier application permitted. Upon adoption the lessee will apply the new standard retrospectively to all periods presented or retrospectively using a cumulative effect adjustment in the year of adoption. We are currently evaluating the effect that this new standard may have on our financial statements and related disclosures.
In March 2016, the FASB issued ASU 2016-09, “Compensation – Stock Compensation (Topic 718)” to simplify several aspects of the accounting for share-based payment transactions, including the income tax consequences, classification of awards as either equity or liabilities, and forfeitures, as well as classification in the statement of cash flows. ASU 2016-09 became effective for us on January 1, 2017. Under ASU 2016-09, we elected to not apply a forfeiture estimate and will recognize a credit in compensation expense to the extent awards are forfeited. The implementation of this new standard did not have a material effect on our financial statements or related disclosures.
55
In August 2017, the FASB issued ASU 2017-12, “Derivatives and Hedging (Topic 815)” to improve the financial reporting of hedging relationships to better reflect an entity’s hedging strategies. The standard expands an entity’s ability to apply hedge accounting for both non-financial and financial risk components and amends the presentation and disclosure requirements. Additionally, ASU 2017-12 eliminates the need to separately measure and report hedge ineffectiveness and generally requires the entire change in fair value of a hedging instrument to be recorded in the same income statement line as the earnings effect of the hedged item. The standard is effective for public companies for fiscal years beginning after December 15, 2018 and interim periods within those fiscal years. Early adoption is permitted. The standard must be adopted by applying a modified retrospective approach to existing designated hedging relationships as of the adoption date, with a cumulative effect adjustment recorded to opening retained earnings as of the initial adoption date. We are currently evaluating the effect that this new standard may have on our financial statements and related disclosures.
ITEM 7A. QUANTITATIVE AND QUALITATIVE DISCLOSURES ABOUT MARKET RISK
Commodity Price Risk. Our major market risk exposure continues to be the pricing applicable to our oil and natural gas production. Our revenues, profitability and future rate of growth depend substantially upon the market prices of oil and natural gas, which fluctuate widely. Oil and natural gas price declines and volatility could adversely affect our revenues, cash flows and profitability. Price volatility is expected to continue. For the year ended December 31, 2017, a 10% decrease in realized oil and natural gas prices, including the effects of hedging contracts, would have resulted in an approximate $23.7 million decrease in our cash flows from operating activities, while a 10% increase would have resulted in an approximate $26.2 million increase in our cash flows from operating activities. In order to manage our exposure to oil and natural gas price declines, we enter into oil and natural gas price hedging arrangements to secure a price for a portion of our expected future production.
Our hedging policy currently provides that not more than 60% of our estimated production quantities can be hedged for any given month without the consent of the Board. Additionally, a minimum of 25% of each month’s production will not be committed to any hedge contract regardless of the price available. We believe that our outstanding hedging positions as of March 9, 2018 have hedged approximately 52% of our estimated 2018 production from estimated proved producing reserves and 47% of our estimated 2019 production from estimated proved producing reserves. We continue to monitor the marketplace for additional hedges we deem acceptable. See Note 9 – Derivative Instruments and Hedging Activities to the accompanying consolidated financial statements included in this Annual Report on Form 10-K for a detailed discussion of hedges in place to manage our exposure to oil and natural gas price declines.
Interest Rate Risk. We had total debt outstanding of $235.9 million at December 31, 2017, all of which bears interest at fixed rates. The $235.9 million of fixed-rate debt is comprised of $225 million of 2022 Second Lien Notes and $10.9 million of the Building Loan.
Our Amended Credit Agreement is subject to an adjustable interest rate. See Item 7. Management’s Discussion and Analysis of Financial Condition and Results of Operations – Liquidity and Capital Resources. At March 9, 2018, we had no outstanding borrowings under our Amended Credit Agreement. If we borrow funds under our Amended Credit Agreement, we may be subject to increased sensitivity to interest rate movements. We currently have no interest rate hedge positions in place to reduce our exposure to changes in interest rates.
ITEM 8. FINANCIAL STATEMENTS AND SUPPLEMENTARY DATA
Information concerning this Item begins on Page F-1.
ITEM 9. CHANGES IN AND DISAGREEMENTS WITH ACCOUNTANTS ON ACCOUNTING AND FINANCIAL DISCLOSURE
There have been no disagreements with our independent registered public accounting firm on our accounting or financial reporting that would require our independent registered public accounting firm to qualify or disclaim its report on our financial statements or otherwise require disclosure in this Form 10-K.
56
ITEM 9A. CONTROLS AND PROCEDURES
Evaluation of Disclosure Controls and Procedures
As required by Rule 13a-15(b) of the Exchange Act, we have evaluated, under the supervision and with the participation of our management, including our principal executive officer and principal financial officer, the effectiveness of the design and operation of our disclosure controls and procedures (as defined in Rules 13a-15(e) and 15d-15(e) of the Exchange Act) as of the end of the period covered by this Form 10-K. Our disclosure controls and procedures are designed to provide reasonable assurance that the information required to be disclosed by us in reports that we file or submit under the Exchange Act is accumulated and communicated to our management, including our principal executive officer and principal financial officer, as appropriate, to allow timely decisions regarding required disclosure and is recorded, processed, summarized and reported within the time periods specified in the rules and forms of the SEC. Based upon the evaluation, our principal executive officer and principal financial officer have concluded that our disclosure controls and procedures were effective as of December 31, 2017 at the reasonable assurance level.
Changes in Internal Controls Over Financial Reporting
There has not been any change in our internal control over financial reporting that occurred during the quarter ended December 31, 2017 that has materially affected, or is reasonably likely to materially affect, our internal control over financial reporting.
Management’s Report on Internal Control over Financial Reporting
Our management is responsible for establishing and maintaining adequate internal control over financial reporting, as such term is defined by the Exchange Act. Under the supervision and with the participation of our management, including the principal executive officer and principal financial officer, we conducted an evaluation of the effectiveness of our internal control over financial reporting as of December 31, 2017. In making this assessment, we used the criteria established in Internal Control-Integrated Framework issued by the Committee of Sponsoring Organizations of the Treadway Commission (COSO) (2013 framework). Based on our evaluation, we have concluded that our internal controls over financial reporting were effective as of December 31, 2017. Ernst and Young LLP, an independent public accounting firm, has issued its report on the Company’s internal control over financial reporting as of December 31, 2017.
57
REPORT OF INDEPENDENT REGISTERED PUBLIC ACCOUNTING FIRM
The Stockholders and Board of Directors
Stone Energy Corporation
Opinion on Internal Control over Financial Reporting
We have audited Stone Energy Corporation’s internal control over financial reporting as of December 31, 2017, based on criteria established in Internal Control—Integrated Framework issued by the Committee of Sponsoring Organizations of the Treadway Commission (2013 framework) (the COSO criteria). In our opinion, Stone Energy Corporation (the Company) maintained, in all material respects, effective internal control over financial reporting as of December 31, 2017, based on the COSO criteria.
We also have audited, in accordance with the standards of the Public Company Accounting Oversight Board (United States) (PCAOB), the consolidated balance sheets of the Company as of December 31, 2017 (Successor) and 2016 (Predecessor), the related consolidated statements of operations, comprehensive income (loss), changes in stockholders’ equity and cash flows for the period March 1, 2017 through December 31, 2017 (Successor), the period January 1, 2017 through February 28, 2017 (Predecessor), and the years ended December 31, 2016 and 2015 (Predecessor), and the related notes and our report dated March 9, 2018 expressed an unqualified opinion thereon.
Basis for Opinion
The Company’s management is responsible for maintaining effective internal control over financial reporting and for its assessment of the effectiveness of internal control over financial reporting included in the accompanying Management’s Report on Internal Control over Financial Reporting. Our responsibility is to express an opinion on the Company’s internal control over financial reporting based on our audit. We are a public accounting firm registered with the PCAOB and are required to be independent with respect to the Company in accordance with the U.S. federal securities laws and the applicable rules and regulations of the Securities and Exchange Commission and the PCAOB.
We conducted our audit in accordance with the standards of the PCAOB. Those standards require that we plan and perform the audit to obtain reasonable assurance about whether effective internal control over financial reporting was maintained in all material respects.
Our audit included obtaining an understanding of internal control over financial reporting, assessing the risk that a material weakness exists, testing and evaluating the design and operating effectiveness of internal control based on the assessed risk, and performing such other procedures as we considered necessary in the circumstances. We believe that our audit provides a reasonable basis for our opinion.
Definition and Limitations of Internal Control Over Financial Reporting
A company’s internal control over financial reporting is a process designed to provide reasonable assurance regarding the reliability of financial reporting and the preparation of financial statements for external purposes in accordance with generally accepted accounting principles. A company’s internal control over financial reporting includes those policies and procedures that (1) pertain to the maintenance of records that, in reasonable detail, accurately and fairly reflect the transactions and dispositions of the assets of the company; (2) provide reasonable assurance that transactions are recorded as necessary to permit preparation of financial statements in accordance with generally accepted accounting principles, and that receipts and expenditures of the company are being made only in accordance with authorizations of management and directors of the company; and (3) provide reasonable assurance regarding prevention or timely detection of unauthorized acquisition, use, or disposition of the company’s assets that could have a material effect on the financial statements.
Because of its inherent limitations, internal control over financial reporting may not prevent or detect misstatements. Also, projections of any evaluation of effectiveness to future periods are subject to the risk that controls may become inadequate because of changes in conditions, or that the degree of compliance with the policies or procedures may deteriorate.
/s/ Ernst & Young LLP
New Orleans, Louisiana
March 9, 2018
58
ITEM 9B. OTHER INFORMATION
The following information is being disclosed under Item 9B. of this Form 10-K in lieu of providing such disclosure in Item 5.02 of a Current Report on Form 8-K.
Amendment to Trimble Term Sheet
As previously disclosed in the Current Report on Form 8-K that was filed by the Company with the SEC on May 1, 2017, the Company entered into a compensation term sheet with James Trimble, the Company’s Interim Chief Executive Officer and President, effective April 28, 2017 (the “Term Sheet”), in connection with his appointment to such positions. On March 6, 2018, the Board and the Compensation Committee of the Board (the “Compensation Committee”) approved an amendment to the Term Sheet (the “Amendment”). Pursuant to the Amendment, notwithstanding anything in the Term Sheet to the contrary, in the event of a change in control event or the termination of Mr. Trimble’s employment by the Company without “cause” (as defined in the Term Sheet) or by him for “good reason” (as defined in the Term Sheet), in each case, occurring prior to December 31, 2018, he will be paid his target bonus (120% of his annual base salary), prorated for the period from January 1, 2018, through the date of such event, which payment will be made in a lump sum in 2018, subject to his execution, delivery and irrevocability of a release of claims no later than the sixtieth (60th) day following such event. Other than the foregoing change, the Term Sheet remains in full force and effect.
59
PART III
ITEM 10. DIRECTORS, EXECUTIVE OFFICERS AND CORPORATE GOVERNANCE
Emergence from Bankruptcy: Confirmation of Board of Directors
On December 14, 2016, the Company and certain of its subsidiaries filed voluntary petitions seeking relief under the provisions of Chapter 11 of the Bankruptcy Code to pursue a prepackaged plan of reorganization. On February 15, 2017, the Bankruptcy Court entered an order confirming the Plan and on February 28, 2017, the Plan became effective in accordance with its terms and the Company and its subsidiaries emerged from the Chapter 11 cases.
Pursuant to the Plan, upon the Effective Date, Neal P. Goldman (Chairman of the Board), John “Brad” Juneau, David I. Rainey, Charles M. Sledge, James M. Trimble and David N. Weinstein were appointed as directors of the Company. In addition, David H. Welch, the President and Chief Executive Officer of the Company at the time of the Effective Date, was reappointed to the Board pursuant to the Plan. Mr. Welch retired as President and Chief Executive Officer of the Company and as a member of the Board on April 28, 2017.
Identification of Directors
Set forth below is biographical information regarding each of our current directors as of March 9, 2018. There are no family relationships between any of our directors and executive officers. In addition, there are no arrangements or understandings between any of our directors or executive officers and any other person pursuant to which any person was selected as a director or an executive officer, respectively.
Neal P. Goldman, age 48, Director since February 2017, Chairman of the Board of Directors and the Nominating & Governance Committee and Member of the Compensation Committee. Mr. Goldman is currently the Managing Member of SAGE Capital Investments, LLC, a consulting firm specializing in independent board of director services, turnaround consulting, strategic planning, and special situation investments. Mr. Goldman was a Managing Director at Och Ziff Capital Management, L.P. from 2014 to 2016 and a Founding Partner of Brigade Capital Management, LLC from 2007 to 2012, which he helped build to over $12 billion in assets under management. Prior to this, Mr. Goldman was a Portfolio Manager at MacKay Shields, LLC and also held various positions at Salomon Brothers Inc., both as a mergers and acquisitions banker and as an investor in the high yield trading group. Throughout his career, Mr. Goldman has held numerous board representations including roles as an independent member of the boards of directors of Lightsquared, Inc., Pimco Income Strategy Fund I & II, and Catalyst Paper Corporation, as well as a member of the boards of directors of Jacuzzi Brands and NII Holdings, Inc. Mr. Goldman has served on the boards of directors of Midstates Petroleum Company, Inc. since October 2016, Walter Investment Management Corp. since January 2017, and Ultra Petroleum Corp. since April 2017. Mr. Goldman received a BA from the University of Michigan and an MBA from the University of Illinois. Based upon Mr. Goldman’s involvement in strategic planning and oversight of liability management efforts and his experience on multiple boards, we believe that Mr. Goldman is a valuable member of the Board.
John “Brad” Juneau, age 58, Director since February 2017, Chairman of the Reserves Committee and Member of the Compensation and Nominating & Governance Committees. Mr. Juneau is the co-founder of Contango ORE, Inc., a publicly traded gold exploration company, and has served as President, Chief Executive Officer and a director of Contango ORE, Inc. since August 2012 and as Chairman of the board of directors of Contango ORE, Inc. since 2013. Mr. Juneau is the sole manager of the general partner of Juneau Exploration, L.P., a company involved in the exploration and production of oil and natural gas. Prior to forming Juneau Exploration in 1998, Mr. Juneau served as Senior Vice President of exploration for Zilkha Energy Company from 1987 to 1998. Prior to joining Zilkha Energy Company, Mr. Juneau served as a Staff Petroleum Engineer with Texas International Company for three years, where his principal responsibilities included reservoir engineering, as well as acquisitions and evaluations. Prior to that, he was a Production Engineer with Enserch Corporation in Oklahoma City. Mr. Juneau holds a BS in Petroleum Engineering from Louisiana State University. We believe that Mr. Juneau’s extensive energy industry background, particularly his expertise in reservoir engineering and involvement with exploration and production companies, makes him a valuable member of the Board.
David I. Rainey, age 63, Director since February 2017, Chairman of the Safety Committee and Member of the Audit and Reserves Committees. Dr. Rainey previously served as the President Petroleum Exploration of BHP Billiton, a publicly traded mining, metals and petroleum company, from June 2011 until January 2016 and as Chief Geoscientist from February 2014 until November 2016. From 1980 to 2011, he served in various positions at BP, a publicly traded integrated oil and gas company, including as Vice President Science, Technology, Environment and Regulatory Affairs from 2010 to 2011 and Vice President Gulf of Mexico Exploration and Deputy Chair of BP’s Global Exploration Forum from 2005 to 2010. While at BP, Dr. Rainey worked in or led exploration teams in the North Sea, the North Atlantic, the Gulf of Mexico, Brazil, North Alaska, Canada, Kurdistan, India, the Philippines, Malaysia, Brunei, Australia, South Africa, Trinidad and Tobago, and Barbados. Dr. Rainey has served on
60
the boards of directors of BP Exploration and Production Inc. and multiple BHP Billiton subsidiaries. Dr. Rainey received a BSc and Ph.D. in Geology from the University of Edinburgh and has completed executive education programs at MIT Sloan School of Business, Stanford University Graduate School of Business and Northwestern University Kellogg School of Management. With more than 35 years of experience in the oil and gas industry, Dr. Rainey has extensive industry and management experience and expertise, which we believe brings valuable skills and expertise to the Board.
Charles M. Sledge, age 52, Director since February 2017, Chairman of the Audit Committee and Member of the Safety Committee. Mr. Sledge previously served as the Chief Financial Officer of Cameron International Corporation, an oilfield services company, from 2008 until 2016. Prior to that, Mr. Sledge served as the Corporate Controller of Cameron International Corporation from 2001 until 2008. Mr. Sledge has served on the boards of directors of Templar Energy LLC since January 2017 and Vine Resources, Inc. since April 2017. We believe that Mr. Sledge’s strong financial background, including his 20 years of experience as a financial executive, makes him a valuable member of the Board.
David N. Weinstein, age 58, Director since February 2017, Chairman of the Compensation Committee and Member of the Audit Committee. Mr. Weinstein has been a business consultant specializing in reorganization activities since September 2008. From March 2007 to August 2008, Mr. Weinstein served as Managing Director and Group Head, Debt Capital Markets-High Yield and Leverage Finance at Calyon Securities, a global provider of commercial and investment banking products and services for corporations and institutional clients. From September 2004 to February 2007, Mr. Weinstein was a consultant specializing in business reorganization and capital markets activities. Prior to that, Mr. Weinstein was a Managing Director and Head of High Yield Capital Markets at BNP Paribas, BancBoston Securities and Chase Securities, Inc. and head of the capital markets group in the High Yield Department at Lehman Brothers. Mr. Weinstein has previously served on the boards of directors of Pioneer Companies, Inc., York Research Corp., Horizon Lines, Interstate Bakeries Corporation and Deep Ocean Group Holdings. In addition, Mr. Weinstein has served on the boards of directors of the Oneida Group since June 2015, TORM Plc since July 2015 and Seadrill Limited since January 2017. Mr. Weinstein earned a BA from Brandeis University and a JD from Columbia University School of Law. We believe that Mr. Weinstein’s experience in evaluating financial and strategic options and his experience on multiple boards make him a valuable member of the Board.
James M. Trimble, age 69, Director since February 2017. Mr. Trimble has served as the Interim Chief Executive Officer and President of the Company since April 2017. Mr. Trimble previously served as Chief Executive Officer and President of PDC Energy, Inc., a publicly traded independent natural gas and oil company, from 2011 until 2015. From 2005 until 2010, Mr. Trimble was Managing Director of Grand Gulf Energy, Limited, a public company traded on the Australian Securities Exchange, and President and Chief Executive Officer of Grand Gulf’s U.S. subsidiary Grand Gulf Energy Company LLC, an exploration and development company focused primarily on drilling in mature basins in Texas, Louisiana and Oklahoma. From 2000 through 2004, Mr. Trimble served as Chief Executive Officer of Elysium Energy and then TexCal Energy LLC, both of which were privately held oil and gas companies that he managed through workouts. Prior to this, he was Senior Vice President of Exploration and Production for Cabot Oil and Gas, a publicly traded independent energy company. Mr. Trimble was hired in July 2002 as Chief Executive Officer of TexCal (formerly Tri-Union Development) to manage a distressed oil and gas company through bankruptcy. Mr. Trimble previously served on the boards of directors of Blue Dolphin Energy, an independent oil and gas company with operations in the Gulf of Mexico, from November 2002 until May 2006, Seisgen Exploration LLC, a small private exploration and production company operating in southern Texas, from 2008 to 2015, Grand Gulf Energy LTD from 2009 to 2012, PDC Energy from 2009 until June 2016 and C&J Energy Services LTD from March 2016 to January 2017 to assist with its Chapter 11 process. Mr. Trimble has served on the boards of directors of Callon Petroleum Company since 2014 and Crestone Peak Resources LLC (a private company operating in the DJ Basin of Colorado) since December 2016. Mr. Trimble was an officer of PDC Energy in September 2013, when each of the twelve partnerships for which the company was the managing general partner filed for bankruptcy in the federal bankruptcy court, Northern District of Texas, Dallas Division, and was on the board of C&J Energy Services LTD when it filed for bankruptcy in the court of the Southern District of Texas, Houston Division in July 2016. Mr. Trimble is a Registered Professional Engineer. Based upon Mr. Trimble’s many years of oil and gas industry executive management experience, including experience as a chief executive officer, and knowledge of current developments and best practices in the industry, we believe Mr. Trimble brings valuable skills and expertise to the Board.
61
Identification of Executive Officers
The following table sets forth information regarding the names, ages (as of March 9, 2018) and positions held by each of our executive officers, followed by biographies describing the business experience of our executive officers for at least the past five years. Our executive officers serve at the discretion of our Board.
Name | Age | Position | ||
James M. Trimble | 69 | Interim Chief Executive Officer and President | ||
Kenneth H. Beer | 60 | Executive Vice President and Chief Financial Officer | ||
Keith A. Seilhan | 51 | Chief Operating Officer | ||
Lisa S. Jaubert | 62 | Senior Vice President, General Counsel and Secretary | ||
Thomas L. Messonnier | 56 | Vice President – Exploration and Business Development | ||
Florence M. Ziegler | 57 | Vice President – Human Resources and Administration | ||
For Mr. Trimble’s biographical information, see “Identification of Directors” above.
Kenneth H. Beer was named Executive Vice President and Chief Financial Officer in January 2011. Previously, he served as Senior Vice President and Chief Financial Officer since August 2005. Prior to joining Stone, he served as a director of research and a senior energy analyst at the investment banking firm of Johnson Rice & Company. Prior to joining Johnson Rice & Company in 1992, he was an energy analyst and investment banker at Howard Weil Incorporated.
Keith A. Seilhan was named Chief Operating Officer in April 2017. Previously, he served as Senior Vice President – Gulf of Mexico from January 2015 through April 2017, Vice President – Deep Water from February 2013 through January 2015 and Deep Water Projects Manager from July 2012 through February 2013. Prior to joining Stone in July 2012, Mr. Seilhan filled various senior leadership roles for Amoco and BP over his 21 year career with them. In his final year with BP, he filled the role as BP’s Incident Commander on the Deepwater Horizon Incident in 2010, and thereafter worked as an Emergency Response Consultant with The Response Group for 1 1/2 years. While with Amoco and BP, he served, among other roles, as an Asset Manager and an Operations Manager for Deep Water assets, Operations Director for Gulf of Mexico and the Organizational Capability Manager. Pursuant to a settlement between the SEC and Mr. Seilhan, in April 2014, (i) the SEC filed a complaint in the United States District Court for the Eastern District of Louisiana alleging that Mr. Seilhan sold securities while in possession of material nonpublic information and in breach of duties owed to BP and its shareholders, in violation of federal securities laws and (ii) without admitting or denying any allegations, Mr. Seilhan consented to the entry of a final judgment therein permanently enjoining him from future violations of such federal securities laws, and agreeing to a disgorgement and payment of interest and a civil penalty.
Lisa S. Jaubert was named Senior Vice President, General Counsel and Secretary in May 2013. She previously served as Assistant General Counsel since joining Stone in July 2012. Prior to joining Stone, she worked as Counsel with Latham & Watkins, LLP where she was a specialist in mergers and acquisitions, finance and other energy related transactions. Ms. Jaubert also served over five years as Assistant General Counsel and Assistant Corporate Secretary for Mariner Energy, was a founding shareholder of Schully Roberts Slattery Jaubert & Marino PLC, and also served as an outsourced general counsel for many smaller exploration and production companies and was partner or associate in two other energy law firms.
Thomas L. Messonnier was named Vice President-Exploration and Business Development in June 2017. Previously, he served as Vice President-Planning, Marketing and Midstream from May 2015 through June 2017, Director of Strategic Planning from January 2009 through May 2015, Exploitation Manager for the Gulf of Mexico and Rockies from February 2006 through January 2009, Reserves Engineering Manager from April 2005 through February 2006, and a Reservoir Engineer from June 2004 through January 2005. Prior to joining Stone in June 2004, Mr. Messonnier was employed as President of T&T Pipeline and Construction Company from January 1997 through June 2004 and by ARCO Oil and Gas Company where he served in various engineering functions from June 1985 through January 1997.
Florence M. Ziegler was named Vice President – Human Resources and Administration in June 2017. Previously, she served as Senior Vice President – Human Resources, Communications and Administration from February 2014 through June 2017 and Vice President – Human Resources, Communications and Administration from September 2005 through February 2014. She has been employed by Stone since its inception in 1993 and served as the Director of Human Resources from 1997 to 2004.
62
Section 16(a) Beneficial Ownership Reporting Compliance
Section 16(a) of the Exchange Act and related regulations require our Section 16 officers and directors and persons who beneficially own more than 10% of a registered class of our equity securities to file reports of ownership and changes in ownership with the SEC and the NYSE. Section 16 officers, directors and greater than 10% beneficial owners are also required by SEC regulation to furnish us with copies of all Section 16(a) forms they file.
Based solely on our review of copies of such forms we received and written representations by our directors and officers, we believe that, during the fiscal year ended December 31, 2017, our Section 16 officers, directors and greater than 10% beneficial owners timely complied with all applicable filing requirements of Section 16(a).
Corporate Governance
The Board has adopted several governance documents to guide the operation and direction of the Board and its committees, which include Corporate Governance Guidelines, a Code of Business Conduct and Ethics (which applies to all directors, officers and employees, including our principal executive, financial and accounting officers) and charters for the Audit, Compensation, Nominating & Governance, Reserves and Safety Committees. Each of these documents is available on our website (www.stoneenergy.com), and stockholders may obtain a printed copy, free of charge, by sending a written request to Stone Energy Corporation, Attention: Secretary, 625 E. Kaliste Saloom Road, Lafayette, Louisiana 70508, facsimile number (337) 521-2072. We will also promptly post on our website any amendments to these documents and any waivers from the Code of Business Conduct and Ethics for our directors and principal executive, financial and accounting officers.
ITEM 11. EXECUTIVE COMPENSATION
COMPENSATION DISCUSSION AND ANALYSIS
Summary of Our Compensation Program
The Compensation Committee of our Board oversees our executive compensation program. An element of our program is “pay-for-performance,” aligning the interests of our Named Executive Officers (“NEOs”) with those of our stockholders. We pay our employees for delivering value to our stockholders, while reducing overall compensation levels if we do not achieve our performance goals. The Compensation Committee is responsible for ensuring that our program supports the Company’s strategies and objectives in a manner consistent with these principles.
This Compensation Discussion and Analysis (“CD&A”) provides important information on our executive compensation program and explains the compensation decisions made by the Compensation Committee for our NEOs for fiscal year 2017. For 2017, our NEOs were:
Name | Principal Position | |
James M. Trimble | Interim Chief Executive Officer and President | |
David H. Welch | Former Chairman of the Board, President and Chief Executive Officer | |
Kenneth H. Beer | Executive Vice President and Chief Financial Officer | |
Keith A. Seilhan | Chief Operating Officer | |
Lisa S. Jaubert | Senior Vice President, General Counsel and Secretary | |
Thomas L. Messonnier | Vice President – Exploration and Business Development | |
Richard L. Toothman, Jr. | Former Senior Vice President – Appalachia | |
2017 Overview
Emergence from Voluntary Reorganization under Chapter 11 Proceedings
Following a period of decline in oil, natural gas and natural gas liquids prices that resulted in reduced revenue and cash flows, on December 14, 2016, we filed the Chapter 11 Cases. On February 15, 2017, the Plan was confirmed and, on February 28, 2017, the Plan became effective in accordance with its terms and we emerged from bankruptcy.
63
Transition of Management
Following our emergence from bankruptcy on February 28, 2017, there were changes in the Company’s executive management. Effective April 28, 2017, Mr. Welch retired as the President and Chief Executive Officer of the Company and, on May 11, 2017, he resigned from the Board and entered into a separation agreement and general release with the Company. Effective April 28, 2017, the Board appointed Mr. Trimble, then a non-employee member of the Board, to serve as the Company’s Interim Chief Executive Officer and President and entered into a compensation term sheet with him in connection with his appointment. In addition, effective April 28, 2017, the Board appointed Mr. Seilhan, who was the Company’s Senior Vice President – Gulf of Mexico, to serve as the Company’s Chief Operating Officer.
In connection with the bankruptcy sale of the Company’s oil and gas business in the Appalachia regions of Pennsylvania and West Virginia, the employment of Mr. Toothman, the Company’s Senior Vice President – Appalachia, was terminated, effective April 30, 2017.
Talos Transaction
Following our emergence from bankruptcy, the independent members of the Board met and discussed the limitations and risks associated with the Company continuing as a standalone entity, including the risks associated with the Company’s declining asset base, the risks associated with being an undersized operator in the oil and gas business in the Gulf of Mexico deepwater, and the impact of these factors on the Company’s ability to fund its drilling operations and to fully exploit and develop its oil and gas assets. Following that discussion, those directors determined that it would be appropriate for the Board to evaluate all potential available alternatives for the Company. As part of that determination, the independent members of the Board agreed that the Company should engage a financial advisor for the Board and to advise the Board and the Company on the Company’s industry positioning, as well as to advise the Board in identifying, assessing, and possibly implementing one or more tactical or strategic alternatives.
Pursuant to the process undertaken by the Board and the Company to evaluate tactical and strategic alternatives, on November 21, 2017, we entered into a series of related agreements relating to a business combination with Talos (the “Talos Transaction”). The Company and certain of its subsidiaries entered into the Transaction Agreement with Talos on such date, which contemplates a series of transactions occurring on the date of the closing under the Transaction Agreement (the “Closing”) that will result in such business combination.
In connection with the its evaluation of tactical and strategic alternatives, the Company granted retention awards and, thereafter, in connection with the Talos Transaction, the Company granted transaction bonuses, to certain executive officers and employees, including certain of our NEOs, as further described below under “Other Program Components – Retention Awards” and “Other Program Components – Transaction Bonuses,” and amended the terms of our Executive Severance Plan (the “Executive Severance Plan”) under which certain of our executives officers, including certain of our NEOs, are entitled to severance payments and benefits in connection with a qualifying termination of employment, as further described below under “Potential Payments Upon Termination or Change of Control – Executive Severance Plan.” In addition, in connection with the Talos Transaction, except as described below, we do not anticipate making any changes to our executive compensation plans and arrangements or entering into new executive compensation plans and arrangements in 2018.
2017 Compensation Decisions and Actions
Following our emergence from bankruptcy, the Compensation Committee engaged Lyons, Benenson & Company Inc., an independent compensation consultant (referred to herein as “Lyons Benenson” or the “Compensation Consultant”), to replace Pearl Meyer, who previously served as the Compensation Committee’s independent compensation consultant, to assess the Company’s existing executive compensation arrangements and to assist in the development of short- and long-term incentive arrangements applicable to key executives and managers of the Company and to review the overall competitiveness of the Company’s executive compensation program for 2017. In that regard, the Compensation Committee decided to make the following changes and decisions with respect to our compensation program for 2017:
• | Salary Increases: The Company increased the annual base salary payable to three of our NEOs in 2017 in connection with the transition in the position and responsibilities of two such NEOs and to address pay equity considerations among the Company’s executive officers and to align compensation payable to one such NEO to the compensation payable to executives in comparable positions amongst our peer companies. The Company did not otherwise increase the annual base salary payable to any of the NEOs in 2017. |
64
Such increases in annual base salaries are further described below under “Components of 2017 Executive Compensation – Base Salary.”
• | Short-Term Incentive Program Implemented: We implemented our 2017 Annual Incentive Plan on July 25, 2017, which is a performance-based short-term cash incentive program that replaced our 2005 Annual Incentive Compensation Plan (the “2005 Annual Incentive Plan”) and our 2016 Performance Incentive Compensation Plan (the “2016 Annual Incentive Plan”). The 2017 Annual Incentive Plan provides certain of our NEOs with award opportunities based on the Company’s annual performance (as opposed to quarterly performance) against certain performance measures. |
In addition, on April 24, 2017 and May 30, 2017 (unless otherwise provided for in an NEO’s separation agreement), all of our NEOs (other than Mr. Trimble) received payments under the Company’s Key Executive Incentive Plan (the “KEIP”) that was implemented in connection with the bankruptcy.
The 2017 Annual Incentive Plan and the KEIP are further described below under “Components of 2017 Executive Compensation – Performance Incentive Compensation.”
• | Long-Term Incentive Program Implemented: We implemented our 2017 Long-Term Incentive Plan (the “2017 LTIP”) on February 28, 2017, which replaced our 2009 Amended and Restated Stock Incentive Plan (the “2009 Stock Incentive Plan”), which was terminated in connection with the bankruptcy. However, in 2017, we did not make any grants to any of our NEOs in their capacity as an NEO under the 2017 LTIP due to the impending Talos Transaction. We did, however, award restricted stock units under the 2017 LTIP to our non-employee directors on March 1, 2017, including to Mr. Trimble, who was subsequently appointed as our Interim Chief Executive Officer and President, effective April 28, 2017, as described above. |
The 2017 LTIP and the grant of restricted stock units to non-employee directors are further described below under “Components of 2017 Executive Compensation – Long-Term Incentive Compensation” and “Elements of Director Compensation – Annual Grant of Restricted Stock Units,” respectively.
In accordance with the terms of the Plan, all shares of restricted stock held by certain of our executive officers, including certain of our NEOs, under the 2009 Stock Incentive Plan on the Effective Date were cancelled and, in exchange for such shares, such individuals received shares of new common stock and warrants on the same basis as all other holders of common stock of the debtors in the Chapter 11 Cases, but such shares of new common stock and warrants were subject to the vesting provisions set forth in the agreements granting the restricted shares of common stock of the debtors in the Chapter 11 Cases and the terms of the 2009 Stock Incentive Plan.
• | Grant of Retention Awards: In connection with the Talos Transaction, on July 25, 2017, the Board approved retention awards for certain of our executive officers and other employees, including certain of our NEOs, which provide for a lump sum cash payment to be made on June 1, 2018 (or, if earlier, a qualifying termination of employment of the award recipient or a “change in control”). |
The retention awards are further described below under “Other Program Components – Retention Awards.”
• | Grant of Transaction Bonuses: In connection with the Talos Transaction and in lieu of granting equity-based awards for 2017, on November 21, 2017, the Board approved transaction bonuses for certain of our executive officers and other employees, including certain of our NEOs, which provide for a lump sum cash payment on the occurrence of a “change in control” (or, if earlier, a qualifying termination of employment of the bonus recipient). |
The transaction bonuses are further described below under “Other Program Components – Transaction Bonuses.”
• | Implementation of Executive Severance Plan: On July 25, 2017, the Board approved the Executive Severance Plan, which provides for severance payments and benefits to certain of our NEOs in the event of a qualifying termination of employment and which replaced our Executive Severance Plan implemented December 13, 2016 (the “Prior Executive Severance Plan”). The Executive Severance Plan was amended on November 21, 2017 in connection with the Talos Transaction. |
The Executive Severance Plan is further described below under “Potential Payments Upon Termination or Change of Control – Executive Severance Plan.”
65
• | Entering into New Employment or Severance Arrangements: We entered into a term sheet with Mr. Trimble in connection with his appointment as our Interim Chief Executive Officer and President on April 28, 2017, which agreement was amended on March 6, 2018, as discussed above in Part II, Item 9B. Other Information. On May 11, 2017, we entered into a separation agreement and general release with Mr. Welch, in connection with his retirement. In addition, on April 27, 2017, we entered into a severance agreement and release of claims with Mr. Toothman, our former Senior Vice President – Appalachia, in connection with the termination of his employment. |
The term sheet with Mr. Trimble is further described above in Part II, Item 9B. Other Information, and also below in this Part III, Item 11. Executive Compensation, under “Components of 2017 Executive Compensation – Performance Incentive Compensation – Trimble Bonus,” “2018 Summary Compensation Arrangements,” “Narrative Disclosure of Summary Compensation Table and Grants of Plan Based Awards Table – Employment and Separation and Severance Agreements,” and “Potential Payments Upon Termination or Change of Control – Term Sheet with Mr. Trimble.” The separation or severance agreements with Mr. Welch and Mr. Toothman are further described below under “Potential Payments Upon Termination or Change of Control.”
Say-on-Pay Advisory Vote
Pursuant to the Plan, we did not hold an annual meeting during fiscal year 2017, and, as a result, we did not have an advisory vote on executive compensation and on the frequency of future say-on-pay votes during 2017. In connection with the Talos Transaction, we also do not anticipate holding an annual meeting during fiscal year 2018.
Our Compensation Philosophy
The Compensation Committee and our Board believe that the most effective executive compensation program is one based on market competitiveness and pay-for-performance, both of which are aligned with the interests of stockholders. During 2017, the Compensation Committee and Board emphasized aligning the compensation of our executive officers with the interests of our stockholders through the process of reviewing, analyzing and pursuing tactical and strategic alternatives that resulted in the Company entering into the Transaction Agreement and continuing to work towards the Closing.
66
Elements of Our 2017 Executive Compensation Program
The purposes and characteristics of each element of our executive compensation program for 2017, including base salary and awards under the 2017 Annual Incentive Plan, are summarized below:
Form | Purpose/Terms | ||
Base Salary | ● | Fixed compensation that is reviewed annually and adjusted, as appropriate | |
● | Reflects each NEO’s level of responsibility, leadership, tenure, qualifications and contribution to the success and profitability of the Company and the competitive marketplace for executive talent specific to our industry | ||
2017 Annual Incentive Plan Awards | ● | Variable incentive awards tied to performance metrics that are intended to focus on near-term achievements, which are settled in cash | |
● | Motivate our NEOs to achieve our short-term financial and operating objectives that are critical to preservation of our longer-term prospects, which reinforces the link between the interests of our NEOs and our stockholders | ||
● | Participation by all Company employees encourages consistent behavior across the Company | ||
● | Performance goals are measured and payouts are designed to be made on an annual basis to drive performance to address current liquidity and business needs | ||
KEIP | ● | Performance-based cash incentive program related to 2017 Company performance through the date of our emergence from bankruptcy and not payable until after emergence from bankruptcy | |
● | Designed to motivate our senior executives to achieve short-term target goals to assist in the Company’s reorganization and emergence from bankruptcy | ||
401(k) Plan | ● | Provides for pre-tax employee deferrals up to IRS approved limits and discretionary match | |
● | In 2017, the Board approved a 50% match | ||
Deferred Compensation Plan | ● | Provides for pre-tax employee deferrals for eligible employees, including certain of our NEOs, to accumulate additional retirement savings | |
Health and Welfare Benefits | ● | NEOs are eligible to participate in the same health and welfare benefits available to all salaried employees | |
Perquisites | ● | Limited perquisites for certain NEOs | |
Executive Severance Plan Benefits | ● | Provide for involuntary severance protection to certain of our NEOs | |
Retention Awards | ● | Provide for lump sum cash payments intended to encourage the retention of certain of our executive officers and employees, including certain of our NEOs, until June 1, 2018, in anticipation of a corporate transaction | |
Transaction Bonuses | ● | Provide for lump sum cash payments intended to reward certain of our executive officers and employees, including certain of our NEOs, for creating incremental shareholder value in connection with the Talos Transaction, and made in lieu of grants under the 2017 LTIP | |
Alignment of Pay and Performance
Peer Group for Assessing Pay and Performance
In 2017, after our emergence from bankruptcy, the Compensation Committee, on the recommendation of the Compensation Consultant, used the following peer group in determining total cash compensation paid to our NEOs. Where references are made throughout the CD&A to our peers or our Peer Group, it is the collection of peer companies below that constitutes those peers.
● | Cabot Oil & Gas Corporation | ● | Denbury Resources Inc. | ● | PDC Energy, Inc. |
● | Callon Petroleum Company | ● | Diamondback Energy, Inc. | ● | PetroQuest Energy, Inc. |
● | Carrizo Oil & Gas, Inc. | ● | Laredo Petroleum, Inc. | ● | SandRidge Energy, Inc. |
● | Cimarex Energy Company | ● | Matador Resources Company | ● | SM Energy Company |
● | Comstock Resources, Inc. | ● | Newfield Exploration Company | ● | SRC Energy, Inc. |
● | Contango Oil & Gas Company | ● | Parsley Energy, Inc. | ● | W&T Offshore, Inc. |
67
Our Peer Group was developed by the Compensation Consultant taking into consideration peer company metrics such as asset size, revenues and enterprise value, similar strategies, comparability of asset portfolio and basins and availability of compensation data.
The Compensation Committee, our Board and our management understand the inherent limitations in using any peer group or data set. For example, there are fluctuations in survey participation from year to year, and we compete for executive talent with peers that are, in some cases, significantly larger than us. However, we believe we have established a sound review process that seeks to mitigate these limitations, including taking into consideration differences and similarities between us and the companies in our Peer Group when referencing benchmarks for NEO compensation. In connection with the Compensation Committee’s determinations of 2017 compensation for our NEOs, the Compensation Consultant provided the Compensation Committee with an analysis of prevailing compensation levels in the marketplace, including our industry peers, which analysis was adjusted for relative company size and revenue.
Willis Towers Watson Survey Data
The Compensation Consultant considered survey data produced by Willis Towers Watson to augment the peer group data that was developed. The peer group data and the survey data, taken together, constituted a basis for benchmarking the Company’s 2017 executive compensation program to the competitive marketplace. Many factors were taken into consideration in establishing compensation levels with great weight, but not total reliance, placed upon the market data.
Role of Compensation Committee and Management
The Compensation Committee is responsible for determining, with Board review, the approval and adoption of all compensation decisions for each of the NEOs. The Compensation Committee’s approach is not formulaic but consists of both subjective and objective considerations. The Compensation Committee considers our overall performance, including absolute operational and financial performance, and the overall performance of the executive officer team, including the role and relative contribution of each of its members. Each NEO’s impact during the year, and his or her overall value to the Company, is assessed through evaluating long-term and current performance in the officer’s primary area of responsibility, strategic initiatives, leadership, market competition for the officer’s position and the officer’s role in succession planning and development and other intangible qualities that contribute to corporate and individual success.
In making compensation decisions for the NEOs, the Compensation Committee relies, in part, on input from our Interim Chief Executive Officer, who provides information and makes recommendations, as appropriate, concerning executive compensation. Input from management typically includes the following:
• | The Interim Chief Executive Officer makes recommendations to the Compensation Committee relating to our performance measures, targets and similar items that affect incentive compensation. |
• | The Interim Chief Executive Officer typically attends a portion of each Compensation Committee meeting to review and discuss executive compensation matters but does not participate in deliberations relative to his own pay. |
While the Compensation Committee considers it important to receive information and recommendations from the Interim Chief Executive Officer and the Compensation Consultant, it does not delegate these compensation decisions to the Interim Chief Executive Officer, the Compensation Consultant or any other party.
Role of the Compensation Consultant
The Compensation Committee may solicit input from an independent compensation consultant from time to time in making executive compensation decisions. In general, the role of our outside compensation consultant is to assist the Compensation Committee in analyzing executive pay packages and understanding our financial measures relating to compensation, but the Compensation Committee is under no obligation to follow the advice or recommendations of any compensation consultant.
The Compensation Committee has the sole authority to hire independent compensation consultants and, for 2017, following our emergence from bankruptcy, the Compensation Committee engaged Lyons Benenson directly as its independent compensation consultant. In prior years, the Compensation Committee engaged Pearl Meyer as an independent compensation consultant to review the overall competitiveness of the executive compensation program. The Compensation Committee chose to engage Lyons Benenson in 2017 due to Lyons Benenson’s extensive experience advising companies undergoing a restructuring and to gain a fresh perspective on our executive compensation program.
68
The Compensation Committee solicited input from Lyons Benenson regarding compensation practices within our Peer Group, within the oil and gas marketplace and within the broader general industry marketplace for the United States. Lyons Benenson also assists the Compensation Committee by compiling and analyzing data on competitive executive and director compensation levels and practices, assisting in the development of compensation programs aimed at motivating executives and managers to achieve and sustain significant improvements in performance, assisting in the negotiation of employment agreements, developing special compensation programs to address specific needs as they arise, providing general advice and counsel to the Compensation Committee on all matters that come before the Compensation Committee as well as on the governance of executive and Director compensation. Lyons Benenson reports orally and in writing to the Compensation Committee on all matters it undertakes.
The Compensation Committee regularly reviews the services provided by its outside consultant and believes that Lyons Benenson is independent under applicable SEC rules in providing executive compensation consulting services. In making this determination, the Compensation Committee noted that during fiscal year 2017:
• | Lyons Benenson did not provide any services to the Company or our management other than services requested by or with the approval of the Compensation Committee, which were limited to executive and director compensation consulting; |
• | Lyons Benenson maintains a conflicts policy, which was provided to the Compensation Committee, with specific policies and procedures designed to ensure independence; |
• | We have been advised by Lyons Benenson that the fees we paid to Lyons Benenson in 2017 of $91,821 were less than 2% of Lyons Benenson’s total revenue; |
• | Lyons Benenson has an ongoing business relationship with Mr. Goldman, a member of the Compensation Committee, which is expected to continue through 2018. During 2017, Lyons Benenson served as compensation consultants to Midstates Petroleum Company and Walter Investment Management Corp., both of which Mr. Goldman is a member of the Board of Directors. None of the Lyons Benenson consultants working on our matters had any other business or personal relationship with any Compensation Committee members; |
• | None of the Lyons Benenson consultants working on our matters had any business or personal relationship with any of our executive officers; and |
• | None of the Lyons Benenson consultants working on our matters owns our stock. |
The Compensation Committee continues to monitor the independence of the Compensation Consultant on a periodic basis.
Components of 2017 Executive Compensation
Base Salary
The Compensation Committee believes it is important to provide salaries within a competitive market range in order to attract and retain personnel who are highly talented. Base salaries are primarily based on job responsibilities and individual contributions. We identify analogous base salary levels of executives in the market data based on each officer’s level of responsibility, leadership role, tenure and contribution to our success and profitability. The Compensation Committee reviews base salaries on an annual basis and adjusts them if they deviate materially from the market data or other changes or circumstances warrant a revision. These base salary levels are also reviewed by the Compensation Committee in determining severance and change in control benefits.
Upon the approval of the Board, (1) Mr. Seilhan’s annual base salary was increased from $320,000 to $400,000, effective April 28, 2017, in connection with his appointment as Chief Operating Officer of the Company, (2) Ms. Jaubert’s annual base salary was increased from $300,000 to $375,000, effective May 31, 2017, to address pay equity considerations among the Company’s executive officers and to align compensation payable to her to the compensation payable to executives in comparable positions amongst our peer companies, and (3) Mr. Messonnier’s annual base salary was increased from $253,000 to $295,000, effective July 25, 2017, in recognition of changes in the responsibilities he assumed in June 2017 when his position changed from Vice President – Planning, Midstream & Marketing to Vice President – Exploration & Business Development. The Company did not otherwise increase the annual base salary payable to any of the other NEOs in 2017. The annual base salary payable to each of our NEOs in fiscal years 2016 and 2017 is set forth below. Mr. Trimble commenced employment with the Company in fiscal year 2017 and so was not entitled to receive any base salary from the Company in fiscal year 2016.
69
2016 Base Salary | 2017 Base Salary | |||
Officer | ($) | ($) | ||
James M. Trimble | N/A | 650,000 | ||
David H. Welch | 650,000 | No change | ||
Kenneth H. Beer | 380,000 | No change | ||
Keith A. Seilhan | 320,000 | 400,000 | ||
Lisa S. Jaubert | 300,000 | 375,000 | ||
Thomas L. Messonnier | 253,000 | 295,000 | ||
Richard L. Toothman, Jr. | 300,000 | No change | ||
Performance Incentive Compensation
2017 Annual Incentive Plan
The Compensation Committee and the Board determined that, following the Company’s emergence from bankruptcy, it was in the best long-term interest of the Company to return to the Company’s historical annual cash incentive compensation program for 2017. On July 25, 2017, the Board, upon recommendation of the Compensation Committee, adopted the 2017 Annual Incentive Plan, which is an annual performance-based incentive program for the 2017 fiscal year for all salaried employees of the Company, including all of our NEOs other than Mr. Trimble and the NEOs whose employment was terminated during 2017.
The Company’s annual incentive plan in place for fiscal year 2016, the 2016 Annual Incentive Plan, had been terminated as part of the Plan. The 2016 Annual Incentive Plan had been adopted in anticipation of the Company’s restructuring and had been structured as a quarterly bonus plan in light of such anticipated restructuring. Then, in connection with our bankruptcy filing, on December 13, 2016, certain of our executive officers, including certain of the NEOs, and the Company entered into the Executive Claims Settlement Agreement (the “Settlement Agreement”), pursuant to which the Company and such executive officers agreed that the officers would waive their claims related to the 2016 Annual Incentive Plan for the fourth quarter of 2016 and any potential additional amounts at the end of fiscal year 2016 based on performance over the full year (the “annual true-up”) in exchange for participation in the KEIP. As a result, none of the NEOs was entitled to any payments with respect to the 2016 fourth quarterly period or to any annual true-up payment pursuant to the 2016 Annual Incentive Plan, which 2016 Annual Incentive Plan was terminated pursuant to the Plan, and instead received payments under the KEIP in 2017, following our emergence from bankruptcy, which payments were intended to incentivize key executive performance during our restructuring.
Under the 2016 Annual Incentive Plan, the extent to which award opportunities were earned was based on performance achieved for each fiscal quarter of 2016, with the opportunity to earn the annual true-up based on full-year 2016 performance. In contrast, the 2017 Annual Incentive Plan does not provide for quarterly payments and instead is an annual cash incentive award program similar to the program that the Company had in place prior to 2016 under the 2005 Annual Incentive Plan and is consistent with similar annual incentive compensation plans of other companies in our Peer Group.
The purpose of the 2017 Annual Incentive Plan is to attract, motivate and retain management and other designated employees by providing a financial incentive to employment with the Company for calendar year 2017 and is intended to reward the participants for exemplary performance in line with increasing shareholder value. The 2017 Annual Incentive Plan provides award opportunities based on the Company’s annual performance in six performance measures: (1) production, (2) lease operating expense, (3) EBITDA, (4) 2017 fourth quarter actual Salaries, General and Administrative expense (“SG&A (4Q)”), (5) reserves/resource enhancement, and (6) safety and environmental compliance.
The 2017 Annual Incentive Plan is administered by the Compensation Committee, and the plan and any award under the plan is subject to Compensation Committee and Board discretion. The Compensation Committee is responsible for determining the plan participants and determining the total dollar amount available to be awarded to the participants in the plan for the year (which in no case may exceed twice the aggregate base salaries of the employees of the Company in 2017).
The Compensation Committee determined a target award opportunity expressed as a percentage of base salary for each NEO participating in the 2017 Annual Incentive Plan, which was 100% of base salary. Under the 2017 Annual Incentive Plan, the maximum payout to any plan participant is 150% of the target award opportunity.
70
The Compensation Committee approved the following 2017 performance measures for the 2017 Annual Incentive Plan (expressed in terms of allocated points for threshold, target and stretch performance) and their relative weighting. The Compensation Committee also established minimum, target and stretch goals for each performance measure. For the production, lease operating expense, EBITDA and SG&A (4Q) performance measures, the threshold and stretch targets were set at 10% above and below the measurable forecasted targets. All of the performance goals were subject to adjustment by the Compensation Committee in accordance with the terms of the 2017 Annual Incentive Plan. We believe these goals maintain the same rigor and level of difficulty as prior year goals under the 2016 Annual Incentive Plan and the 2005 Annual Incentive Plan in light of changing market conditions. The performance goals for the six performance measures are reflected in the following table.
Performance Measure | Weighting at Target Performance | Performance Metric – Threshold | Performance Metric – Target | Performance Metric – Stretch | Actual Performance | Weighting at Actual Performance | |||||||||||
Production (mboed) | 15% | 16.7 | 18.5 | 20.4 | 19.1 | 17.5 | % | ||||||||||
Lease Operating Expense ($ millions) | 15% | 77 | 70 | 63 | 59 | 22.5 | % | ||||||||||
EBITDA ($ millions) | 20% | 152 | 169 | 186 | 200 | 30 | % | ||||||||||
SG&A (4Q) ($ millions) | 15% | 12.6 | 11.5 | 10.4 | 9.7 | 22.5 | % | ||||||||||
Reserves/Resources Enhancement (Events) | 15% | 1 | 2 | 3 | 5 | 22.5 | % | ||||||||||
Safety/Environmental Compliance (Matrix) | 20% | Blue | Green | Brown | Green | 20 | % | ||||||||||
With respect to the foregoing performance measures, the performance goals for each were determined as follows:
Production (mboed): The production goals were set based on production forecasts presented to the Board in March 2017 and included four months of production in 2017 from the Company’s Mt. Providence well, 10 days of hurricane downtime and 4.7% overall downtime. These forecasts were generated by the Company on a well-by-well basis and were also used in the Company’s 2017 budgeting and capital planning processes following emergence from bankruptcy.
Lease Operating Expense ($ millions): The lease operating expense goals were set based on budget forecasts as presented to the Board in March 2017. Lease operating expense included field operations expenses, expense wellwork as well as major maintenance and expense repairs.
EBITDA ($ millions): The EBITDA goals were set based on an updated pricing and production view as of July 2017, as presented to the Board.
SG&A (4Q) ($ millions): The SG&A (4Q) goals were based on the Company’s budget forecasts as of July 2017 for salaries, general and administrative expenses (“SG&A”), as presented to the Board. These goals were set for fourth quarter 2017 SG&A expense in light of the Company reductions in force and other SG&A reductions occurring in the second and third quarters of 2017.
Reserves/Resources Enhancement (Events): The goals for this measure were based on the Company’s execution in 2017 of events to add reserves or exposure to reserves such as joint venture drilling transactions, acquisition transactions and commercial success on drilling project.
Safety/Environmental Compliance (Matrix): The Safety and Environmental goals were based on a matrix adopted by the Company that went beyond the traditional measure of “Total Recordable Incident Rate” to incorporate other safety related factors such as “Days Away from Work” and environmental and compliance factors. The target for 2017 was set to require a Safety and Environmental Compliance score below 0.25 and a Relative Incident of Non-Compliance to Component Ratio of 1.0.
Following the end of the 2017 fiscal year, on March 1, 2018, the Compensation Committee determined the level of achievement on the performance measures and the extent to which award opportunities had been earned. The actual 2017 annual incentive compensation payment received by each NEO who participated in the 2017 Annual Incentive Plan was greater than the potential target opportunity as a result of the Compensation Committee’s determination that we earned a total of 135 points (out of the target total 100 potential points) (1) due to the Company’s aggregate actual performance being above target for the combined six objective performance measures, and (2) the Compensation Committee’s assessment of current economic and financial conditions and the exercise of its discretion under the plan. The full amount of the 2017 annual incentive compensation award is disclosed within the Summary Compensation Table as “Non-Equity Incentive Plan Compensation” for 2017.
71
Based on the Compensation Committee’s determinations, which were approved and adopted by the Board, the annual incentive compensation awards for the participating NEOs based on fiscal year 2017 performance were as follows compared against their target annual incentive compensation opportunity:
Officer | 2017 Target Incentive Opportunity | |||||||||||
2017 Annual Salary (as of December 31, 2017) | Percentage of Annual Salary | Dollar Amount | Actual Annual Incentive Award | |||||||||
($) | ($) | ($) | ||||||||||
Kenneth H. Beer | 380,000 | 100 | % | 380,000 | 513,000 | |||||||
Keith A. Seilhan | 400,000 | 100 | % | 400,000 | 540,000 | |||||||
Lisa S. Jaubert | 375,000 | 100 | % | 375,000 | 506,250 | |||||||
Thomas L. Messonnier | 295,000 | 100 | % | 295,000 | 398,250 | |||||||
Neither Mr. Welch nor Mr. Toothman participated in the 2017 Annual Incentive Plan because the employment of each was terminated prior to adoption of the plan in July 2017. In addition, Mr. Trimble is not a participant in the 2017 Annual Incentive Plan, but is eligible to receive an annual bonus payment pursuant to the terms of his term sheet with the Company, as discussed below.
All earned amounts are paid in a cash lump sum, subject to applicable withholding and any compensation recovery or “clawback” policy of the Company in effect at the time of payment.
Trimble Bonus
Under his term sheet, Mr. Trimble is eligible to receive an annual bonus with a target equal to 120% of his annual base salary (the “Target Bonus”), contingent on the achievement of qualitative and quantitative performance goals approved by the Board; provided, that, Mr. Trimble’s annual bonus for 2017 would not be less than his Target Bonus, prorated from April 28, 2017. In August 2017, the Board approved using the same performance measures for Mr. Trimble as provided for in the 2017 Annual Incentive Plan. As a result, Mr. Trimble’s annual bonus for 2017, prorated from April 28, 2017, was $715,463 as compared against his Target Bonus opportunity, prorated from April 28, 2017, of $526,500. The term sheet also provides Mr. Trimble with certain protections in the event of a change of control event of the Company or his qualifying termination of employment as further described below under “Potential Payments Upon Termination or Change of Control – Term Sheet with Mr. Trimble.”
KEIP
Pursuant to the terms of the Settlement Agreement, certain of our NEOs waived their claims related to the 2016 Annual Incentive Plan for the fourth quarter of 2016, including any annual true-up payment, in exchange for participation in the KEIP, subject to the terms of the KEIP.
The KEIP was intended to enable us to efficiently restructure our business operations and retain the services of our essential executives. The KEIP offered carefully crafted and narrowly tailored incentives to certain of our NEOs, who were in positions that were most integral to our restructuring process, including right-sizing our capital structure as well as improving operational and financial performance, to encourage and motivate them to maximize creditor recoveries and achieve our restructuring objectives. Payments under the KEIP were market-based and resulted in aggregate savings to us of over $1 million compared to what the executives could have potentially received under the 2016 Annual Incentive Plan for the fourth quarter of 2016 (plus the annual true-up). We believe the reduced performance bonuses under the KEIP properly incentivized the participating NEOs, who possessed the leadership skills and expertise critical to our ability to generate value for our stakeholders during the restructuring.
We structured the KEIP to incentivize improvements to operational performance in the Gulf of Mexico related to production while also incentivizing efficient management of lease operating costs related to that production and compliance with health, safety, and regulatory regulations. By linking the participating NEOs’ compensation opportunities to these important operational goals, the KEIP was intended to align our interests with the interests of our stakeholders. Specifically, the performance measures and the goals and weightings for each under the KEIP were as follows:
72
Performance Measure | Weighting | Goal -Threshold (50%) | Goal - Target (100%) | Goal - Maximum (200%) | |||||||||||
Average Monthly Production | 40 | % | 80 | 100 | 140 | ||||||||||
Calculated as Average Net Gulf of Mexico production rate in thousand cubic feet equivalent ("MCFE") per day, disregarding any production from the Company’s Amethyst well, for the period January 1, 2017 through February 28, 2017, the effective date of the Plan | |||||||||||||||
Average Monthly Lease Operating Expense (LOE) (expressed in $millions) | 40 | % | $4.23 | $3.73 | $3.23 | ||||||||||
Calculated as Average Net Gulf of Mexico monthly LOE, calculated by including production handling agreement fees and excluding major maintenance expenditures, from January 1, 2017 through February 2017 (the end of the month in which the effective date of the Plan occurred) | |||||||||||||||
Safety, Environmental and Compliance (SEC) Factor | 20 | % | 0.37 | 0.27 | 0.17 | ||||||||||
Determined based upon the number of relevant Gulf of Mexico occurrences occurring in the areas of safety, environmental and compliance during a rolling 12-month period ending on February 28, 2017 | |||||||||||||||
Under the 2016 Annual Incentive Plan, certain of the executive officers, including certain of the NEOs, would have been entitled to award opportunities for the fourth quarter of 2016 that could have totaled as much as $3,012,638. Pursuant to the terms of the Settlement Agreement and the executives’ waiver of these amounts, the aggregate incentive bonus for these individuals for the fourth quarter of 2016 was reduced to $0.
Under the KEIP, the aggregate bonus amount that could be paid to the executives was limited to $2,008,426, which was an amount equal to the aggregate target award opportunities the executives would have been eligible to receive for the fourth quarter of 2016 under the 2016 Annual Incentive Plan.
On April 18, 2017, the Compensation Committee determined the level of achievement on the performance goals under the KEIP and the extent to which the award opportunities had been earned under the KEIP. The actual points earned for each respective goal under the KEIP was (i) 61 points for Average Monthly Production based on actual production of 121MCFE/day, (ii) 48 points for Average Monthly Lease Operating Expense based on Average Monthly Lease Operating Expense of $3.63 million, and (iii) 20 points for the Safety, Environmental and Compliance Factor based on Safety, Environmental and Compliance Factor of 0.27, for a total of 129 points out of a target total of 100 points.
Notwithstanding that the Company’s actual performance on the performance measures under the KEIP exceeded target performance, in accordance with the terms of the KEIP, the actual KEIP payment received by each NEO who participated in the KEIP was paid out at target. Under the KEIP, payments to the participating NEOs were made in the following aggregate amounts: (1) Mr. Welch--$731,250, (2) Mr. Beer--$285,000, (3) Mr. Seilhan--$157,500, (4) Ms. Jaubert--$206,250, (5) Mr. Messonnier-- $120,176, and (6) Mr. Toothman--$142,500.
Payments under the KEIP were made in cash, in two installments with 50% of the award paid on April 25, 2017 and 50% of the award paid on May 30, 2017 (unless otherwise provided for under a participating NEO’s separation or severance agreement). A participant generally needed to be employed by us on the applicable payment date to receive payment under the KEIP; however, if the employment of the participant in the KEIP was terminated by us without “cause” or by the participant for “good reason” (both as defined in the Prior Executive Severance Plan), or by reason of death, such participant was entitled to receive both the first and second payments.
The aggregate amount paid to each participating NEO with respect to the 2017 Annual Incentive Plan and the KEIP are disclosed within the Summary Compensation Table as “Non-Equity Incentive Plan Compensation” for 2017.
Long-Term Incentive Compensation
The Board adopted the 2017 LTIP, which is an omnibus equity incentive plan that replaced the 2009 Stock Incentive Plan, under which equity incentive awards were previously granted. The 2017 LTIP became effective on February 28, 2017 and is substantially similar to the 2009 Stock Incentive Plan. The 2017 LTIP permits us to grant a variety of equity-based and other
73
incentive compensation awards to align the interests of eligible individuals, including the NEOs, with the interests of our shareholders. However, in light of the process undertaken by the Board and the Company following emergence from bankruptcy to evaluate tactical and strategic alternatives, resulting in the impending Talos Transaction, no awards were granted to any of the NEOs, in their capacity as an NEO, under the 2017 LTIP and, instead, certain of our executives, including certain of our NEOs, received transaction bonus awards as further described under “Other Program Components – Transaction Bonuses.” Awards of restricted stock units were granted to the Company’s non-employee directors on March 1, 2017, including Mr. Trimble, prior to his appointment as our Interim Chief Executive Officer and President.
The 2017 LTIP is administered by the Compensation Committee. The Compensation Committee has broad authority under the 2017 LTIP to, among other things: (1) determine participants in the 2017 LTIP; (2) determine the types of awards that participants are to receive and the number of shares that are to be subject to such awards; and (3) establish the terms and conditions of awards, including the price (if any) to be paid for the shares or the award.
Persons eligible to receive awards under the 2017 LTIP include non-employee directors of the Company and employees of the Company or any of its affiliates. The types of awards that may be granted under the 2017 LTIP include stock options, restricted stock, restricted stock units, dividend equivalents and other forms of awards granted or denominated in shares of common stock, as well as certain cash-based awards.
The maximum number of shares of common stock that may be issued or transferred pursuant to awards under the 2017 LTIP is 2,614,379. Shares of common stock subject to an award that expires or is cancelled, forfeited, exchanged, settled in cash or otherwise terminated without the actual delivery of shares (awards of restricted stock shall not be considered “delivered shares” for this purpose), will again be available for awards under the 2017 LTIP. However, shares (1) tendered or withheld in payment of any exercise or purchase price of an award or taxes relating to an award, (2) shares that were subject to an option or stock appreciation right but were not issued or delivered as a result of the net settlement or net exercise of such award, and (3) shares repurchased on the open market with the proceeds of an option’s exercise price, will not, in each case, be available for awards under the 2017 LTIP.
As is customary in incentive plans of this nature, each share limit and the number and kind of shares available under the 2017 LTIP and any outstanding awards, as well as the exercise or purchase prices of awards, and performance targets under certain types of performance-based awards, are subject to adjustment in the event of certain recapitalizations, reorganizations, mergers, consolidations, combinations, split-ups, split-offs, spin-offs, exchanges or other relevant changes in capitalization or distributions (other than ordinary dividends) to the holders of common stock occurring after an award is granted.
Stock Ownership and Retention Guidelines and Prohibition on Hedging
The Company has Stock Ownership Guidelines applicable to our executives designed to further align the interests of our executive officers with those of our stockholders, and the Board adopted Director Stock Ownership Guidelines on March 1, 2017, also to ensure alignment of the interests of our non-employee directors with our stockholders’ interests. Executives are required to meet ownership levels set forth in the table below by the later of May 23, 2017 or within five years of being promoted or appointed to their position. Until the applicable guideline multiple of salary is attained, an individual is required to retain, and not sell or otherwise dispose of, at least 75% of his or her net shares (shares that remain after shares are sold or netted to pay the exercise price of stock options and withholding taxes) acquired through long-term incentive awards. All of the NEOs still employed by the Company, and all other executive officers, are in compliance with the Stock Ownership Guidelines or have retained at least 75% of his or her net shares acquired through long-term incentive awards.
Individual | Multiple of Salary(1) | |
Chief Executive Officer | 5x base salary | |
Executive Vice President | 4x base salary | |
Senior Vice President | 3x base salary | |
Vice President | 2x base salary | |
(1) | In effect on January 1 of the applicable year. |
Among other terms, the Stock Ownership Guidelines provide that restricted stock will be included in determining the stock ownership of an individual. For each officer, these guidelines will be reduced 15% per year beginning on the 61st anniversary of the birth date of the officer, such that the officer need comply with only 85% of the guidelines after age 61, 70% after age 62, 55% after age 63, 40% after age 64, and 25% after age 65 and thereafter until retirement or other termination of employment. The value of our stock used in determining the number of shares needed to comply with these guidelines in a given year will be
74
the average price of our stock during January of that same calendar year. The Board may amend or terminate the Stock Ownership Guidelines in its sole discretion.
For the description of the Stock Ownership Guidelines applicable to directors, please read “Director Compensation” below.
The Board has adopted a policy prohibiting any executive officer of the Company, including the NEOs, from hedging company stock.
Clawback Policy
The Board has adopted a clawback policy under which the Board, or a committee of the Board, has the right to cause the reimbursement by an executive officer of the Company of certain incentive compensation if the compensation was predicated upon the achievement of certain financial results that were subsequently the subject of a required restatement of the Company’s financial statements and the executive officer engaged in fraudulent or intentional illegal conduct that caused the need for the restatement.
Other Program Components
The NEOs also participate in a variety of retirement, health and welfare, and paid time-off benefits that are available to all our salaried employees generally on a non-discriminatory basis. These benefits are designed to enable us to attract and retain our workforce in a competitive marketplace and to ensure that we have a productive and focused workforce. These benefit plans, and the limited perquisites we provide to our executive officers, are described in greater detail below.
Perquisites and Other Benefits
Perquisites and other personal benefits represent a small part of our overall compensation package. These benefits help us attract and retain senior level executives and are reviewed periodically to ensure that they are competitive with industry norms.
401(k) Plan
To provide employees with retirement savings in a tax efficient manner, under our 401(k) Profit Sharing Plan (“401(k) Plan”), in 2017, eligible employees were permitted to defer receipt of up to 60% of their eligible compensation, plus an additional catch-up amount for employees age 50 or over of up to $6,000 (subject to certain limits imposed by the Internal Revenue Code (the “Code”)). The 401(k) Plan provides that a discretionary match of employee deferrals, before catch-up amounts, may be made by us, at our discretion and as determined by the Board, in cash or shares of our stock. During the year ended December 31, 2017, and since the inception of the 401(k) Plan, the Board has approved, and we have made, annual matching contributions of $1.00 for every $2.00 contributed by an employee up to the maximum deferral amount permitted by the Code, excluding catch-up contributions.
Deferred Compensation Plan
To provide certain executives and other highly compensated individuals with additional retirement savings opportunities, our Deferred Compensation Plan (the “Deferred Compensation Plan”) is a non-qualified deferred compensation plan that provides eligible individuals with the option to defer up to 100% of their eligible compensation for a calendar year. The Compensation Committee amended the Deferred Compensation Plan in December 2016 to eliminate the Company’s ability to make matching contributions under the plan. We believe this amendment supports our cost-cutting initiatives and overarching restructuring objectives; however, we have not historically made matching contributions under the plan. The Board may still elect to make discretionary profit sharing contributions to the plan. During the year ended December 31, 2017, and since the inception of the Deferred Compensation Plan, there were no profit sharing contributions made under the plan. The amounts held under the Deferred Compensation Plan are invested in various investment funds maintained by a third party in accordance with the direction of each participant, which are similar to the investment options available to participants in our 401(k) Plan. The “Nonqualified Deferred Compensation” section below contains additional details regarding the Deferred Compensation Plan and each NEO’s account in such plan.
Severance Plan and Change in Control Benefits
We provide severance and change in control benefits to certain of our executive officers, including certain of our NEOs, which are designed to facilitate our ability to attract and retain executives as we compete for talented employees in a marketplace where such protections are commonly offered. We believe that providing consistent, competitive levels of severance protection
75
helps minimize distraction during times of uncertainty and helps to retain our senior people. Our severance arrangements provide benefits to ease an employee’s transition in the event of an unexpected employment termination due to ongoing changes in our employment needs. The Compensation Committee is responsible for administering these arrangements.
The Board approved the Executive Severance Plan on July 25, 2017, to replace the Prior Executive Severance Plan, with the Executive Severance Plan providing for severance payments and benefits in the event of the executive’s qualifying termination of employment. The Executive Severance Plan was amended on November 21, 2017 in connection with the Talos Transaction to provide, among other things, that if a participant in the plan experiences a qualifying termination of employment during the twelve-month period immediately following the Closing, such participant’s target bonus will be no less than such participant’s target bonus for the 2017 calendar year. In addition, the Company has entered into separation and severance agreements with certain of our NEOs that provided for the payment of severance payments and benefits in connection with such executive’s termination of employment.
The Executive Severance Plan and the separation and severance agreements are further described below under “Potential Payments Upon Termination or Change of Control.”
Retention Awards
On July 25, 2017, the Board approved retention awards for certain executives and employees, including Messrs. Beer, Seilhan and Messonnier and Ms. Jaubert, equal to one-half of the executive officer’s base salary to be paid in a lump sum cash payment within 30 days of the earliest to occur of (1) the first anniversary of the effective date (June 1, 2017) of the retention award agreement subject to the executive officer’s continued employment on such date, (2) a “change in control” of the Company (as defined in the retention award agreements) or (3) a termination of the executive officer’s employment (a) due to death, (b) by the Company without “cause” (as defined below) (including due to disability) or (c) by the executive officer for “good reason” (as defined below). The retention awards were awarded in connection with the Company’s evaluation of tactical and strategic alternatives and to encourage the retention of the retention award recipients for a period of time following grant.
For a detailed description of potential payments that could be made to certain of our NEOs pursuant to the retention award agreements, please see the Potential Payment Upon Termination or Change of Control Table below.
Transaction Bonuses
On November 21, 2017, the Board approved transaction bonuses and the form of transaction bonus agreement and authorized the Company to enter into transaction bonus agreements with certain of our executive officers, including certain of our NEOs. The transaction bonus agreements provide for the payment of a transaction bonus to each of Messrs. Beer, Seilhan, Messonnier and Ms. Jaubert equal to $300,000, $375,000, $120,000 and $202,500, respectively, payable in a lump sum cash payment within 30 days of a “change in control” (as defined in the transaction bonus agreement) if the executive officer remains employed with the Company through the date of the “change in control” or is terminated prior to the change in control (i) due to death, (ii) by the Company without “cause” (as defined below) (including due to disability), or (iii) by the executive officer for “good reason” (as defined below). The transaction bonuses were awarded as compensation for incremental shareholder value creation in connection with the Talos Transaction and were in lieu of an award of long-term equity incentives in 2017.
For a detailed description of potential payments that could be made to certain of our NEOs pursuant to the transaction bonus agreements, please see the Potential Payment Upon Termination or Change of Control Table below.
2018 Compensation Arrangements
In light of the Talos Transaction, including certain of the restrictions imposed under the terms of the Transaction Agreement with respect to changing our existing compensation arrangements and entering into new compensation arrangements, the Company does not anticipate making any changes to existing compensation arrangements for, or entering into new arrangements with, our executives in 2018, except amending Mr. Trimble’s term sheet to provide that in the event of his qualifying termination of employment or the occurrence of a change of control event, in each case occurring prior to December 31, 2018 (as opposed to December 31, 2017, as set forth in his term sheet prior to amendment), he is entitled to receive his target annual bonus amount, prorated for the period from January 1, 2018 through the date of such event, which payment will be made in a lump sum, in 2018, subject to Mr. Trimble’s execution, delivery and non-revocation of a release of claims. The amendment to Mr. Trimble’s term sheet is also discussed above in Part II, Item 9B. Other Information.
76
Tax and Accounting Considerations
The Compensation Committee considers the expected tax treatment to the Company and its executive officers as one of the factors in determining compensation matters. Code Section 162(m) generally limits the deductibility of annual compensation paid to a “covered employee” in excess of $1.0 million, unless certain exceptions are met, such as the exception for qualified performance-based compensation. Pursuant to the Tax Cuts and Jobs Act of 2017 (the “Tax Act”), as of January 1, 2018, the exception under Code Section 162(m) for qualified performance-based compensation was eliminated and the definition of “covered employee” was expanded to include the chief financial officer of a company. The Tax Act includes a transition rule under which the changes to Code Section 162(m) will not apply to compensation payable pursuant to a written binding contract that was in effect on November 2, 2017, and is not materially modified after that date. The Company intends to rely on this transition rule, to the extent applicable. The Compensation Committee currently considers the deductibility under Code Section 162(m) of compensation awarded to its executives to the extent reasonably practical and consistent with our objectives, but the Compensation Committee may nonetheless approve compensation that results in non-deductible amounts above the limits if it determines that such compensation is in our best interests.
As a result of the Settlement Agreement, none of our NEOs or other employees will have the right to any gross-up payments in connection with Section 4999 of the Code and we do not expect to enter into any such arrangements in the future. Under the Executive Severance Plan, payments and benefits to participants in the plan are subject to a “best-net” provision such that the payments and/or benefits will be cut back to avoid triggering any excise tax under Section 4999 of the Code or any related interest or penalties or will be paid in full, whichever is better for the participant on a net after-tax basis, as further described below under “Potential Payments Upon Termination or Change of Control – Executive Severance Plan.”
We are accounting for stock-based payments in accordance with the requirements of FASB ASC Topic 718.
Risks Arising from Compensation Policies and Practices
The Compensation Committee, with the assistance of the Compensation Consultant, has assessed the risks related to our compensation programs, including our executive compensation program. Based on this assessment, the Compensation Committee believes that the design and governance of our executive compensation program do not encourage our NEOs to take excessive or inappropriate risks and that the risks arising from the design of the programs are not reasonably likely to affect the Company in a material adverse manner.
The Compensation Committee believes that our executive compensation program is consistent with the highest standards of risk management. Rather than determining incentive compensation awards based on a single metric, the Compensation Committee considers a balanced set of performance measures that it believes collectively best indicate successful management of our assets and strategy in light of current circumstances. In addition to establishing measurable targets, the Compensation Committee applies its informed judgment to compensation decisions, taking into account factors such as quality and sustainability of earnings, successful implementation of strategic initiatives and adherence to core values. Essentially all of our employees participate in our compensation programs thereby encouraging consistent behavior across the Company. We have also adopted a clawback policy that permits us to recoup certain incentive compensation based on inaccurate financial results. Together, the features of our executive compensation program are intended to ensure that our compensation opportunities do not encourage excessive risk taking and to focus our NEOs on managing the Company toward long-term sustainable value for our stockholders.
77
COMPENSATION COMMITTEE REPORT
The Compensation Committee does hereby state that:
• | The Compensation Committee has reviewed and discussed the foregoing “Compensation Discussion and Analysis” required by Item 402(b) of Regulation S-K with management; and |
• | Based on the review and discussions with management, the Compensation Committee recommended to the Board of Directors that the “Compensation Discussion and Analysis” be included in Stone Energy Corporation’s Annual Report on Form 10-K for the fiscal year ended December 31, 2017. |
Compensation Committee, | ||||
David N. Weinstein - Chairman | ||||
Neal P. Goldman | ||||
John B. Juneau | ||||
COMPENSATION COMMITTEE INTERLOCKS AND INSIDER PARTICIPATION
No member of the Compensation Committee is now, or at any time since the beginning of 2017 has been, employed by or served as an officer of the Company or any of its subsidiaries or had any relationships requiring disclosure with the Company or any of its subsidiaries. None of our executive officers is now, or at any time has been, since the beginning of 2017, a member of the compensation committee or board of directors of another entity one of whose executive officers has been a member of our Board or Compensation Committee.
EXECUTIVE COMPENSATION TABLES
Summary Compensation Table
The following table sets forth the compensation earned by the NEOs for services rendered in all capacities to our Company and its subsidiaries for the fiscal years ended December 31, 2017, 2016 and 2015, as applicable. Mr. Welch served as our President and Chief Executive Officer until his retirement, effective April 28, 2017, at which time Mr. Trimble assumed the role of our Interim Chief Executive Officer and President. Between February 28, 2017 and April 28, 2017, Mr. Trimble only served as a non-employee member of our Board and received compensation for such services during such portion of 2017 as described further below under “Potential Payments Upon Termination or Change of Control – Restricted Stock Unit Award Agreement with Mr. Trimble” and “Elements of Director Compensation – Current Board Compensation Arrangements.” He did not receive any compensation from the Company prior to fiscal year 2017. In addition, Mr. Toothman served as our Senior Vice President – Appalachia until the termination of his employment, effective April 30, 2017, and Mr. Seilhan served as our Senior Vice President – Gulf of Mexico until his appointment, effective April 28, 2017, to serve as our Chief Operating Officer. The NEOs include Mr. Welch as he served as our Chief Executive Officer during a period of time in 2017 and Mr. Toothman as he would have been considered one of our three most highly compensated executive officers other than any individual serving as our Chief Executive Officer or our Chief Financial Officer during 2017 but for the fact that he was no longer serving as an executive officer of the Company as of December 31, 2017.
78
Name and Principal Position | Year | Salary ($)(1) | Stock Awards ($)(2) | Non-Equity Incentive Plan Compensation ($)(3) | All Other Compensation ($)(4) | Total ($) | ||||||||||||||||
James M. Trimble | 2017 | $ | 427,500 | $ | 264,406 | $ | 715,463 | $ | 65,854 | $ | 1,473,223 | |||||||||||
Interim Chief Executive | ||||||||||||||||||||||
Officer and President | ||||||||||||||||||||||
David H. Welch | 2017 | 225,000 | — | 731,250 | 1,358,671 | 2,314,921 | ||||||||||||||||
Former Chairman of the Board, | 2016 | 650,000 | 168,258 | 1,980,968 | 20,919 | 2,820,145 | ||||||||||||||||
President and Chief Executive Officer | 2015 | 650,000 | 3,910,250 | 130,000 | 21,289 | 4,711,539 | ||||||||||||||||
Kenneth H. Beer | 2017 | 380,000 | — | 798,000 | 9,000 | 1,187,000 | ||||||||||||||||
Executive Vice President | 2016 | 380,000 | — | 857,850 | 9,000 | 1,246,850 | ||||||||||||||||
and Chief Financial Officer | 2015 | 380,000 | 1,282,542 | 76,000 | 9,000 | 1,747,542 | ||||||||||||||||
Keith A. Seilhan | 2017 | 372,615 | — | 697,500 | 9,000 | 1,079,115 | ||||||||||||||||
Chief Operating Officer | 2016 | 305,000 | — | 449,783 | 9,000 | 763,783 | ||||||||||||||||
2015 | 288,333 | 665,992 | 57,667 | 66,000 | 1,077,992 | |||||||||||||||||
Lisa S. Jaubert | 2017 | 342,692 | — | 712,500 | — | 1,055,192 | ||||||||||||||||
Senior Vice President, General | 2016 | 300,000 | — | 620,813 | 9,000 | 929,813 | ||||||||||||||||
Counsel and Secretary | 2015 | 298,333 | 747,092 | 59,667 | 9,000 | 1,114,092 | ||||||||||||||||
Thomas L. Messonnier | 2017 | 272,385 | — | 518,426 | 9,000 | 799,811 | ||||||||||||||||
Vice President – Exploration | 2016 | 253,000 | — | 361,727 | 9,000 | 623,727 | ||||||||||||||||
and Business Development | 2015 | 249,495 | 196,995 | 49,899 | 9,000 | 505,389 | ||||||||||||||||
Richard L. Toothman, Jr. | 2017 | 103,846 | — | 142,500 | 644,402 | 890,748 | ||||||||||||||||
Former Senior Vice | 2016 | 300,000 | — | 428,925 | 9,000 | 737,925 | ||||||||||||||||
President – Appalachia | 2015 | 298,333 | 644,125 | 59,667 | 9,300 | 1,011,425 | ||||||||||||||||
(1) | The annual base salary payable to Mr. Trimble during 2017 is prorated from April 28, 2017, the date he commenced employment with the Company until December 31, 2017. The annual base salary payable to each of Messrs. Welch and Toothman during 2017 is prorated from January 1, 2017 until his termination of employment with the Company, effective April 28, 2017 (for Mr. Welch) or April 30, 2017 (for Mr. Toothman). In addition, Mr. Seilhan’s annual base salary was increased from $320,000 to $400,000, effective April 28, 2017, Ms. Jaubert’s annual base salary was increased from $300,000 to $375,000, effective May 31, 2017, and Mr. Messonnier’s annual base salary was increased from $253,000 to $295,000, effective July 25, 2017. |
(2) | Stock awards reflected in this column were made pursuant to our 2009 Stock Incentive Plan or 2017 LTIP, as applicable. The values shown in this column reflect the aggregate grant date fair value of restricted stock, restricted stock units or other awards granted in the given year, computed in accordance with FASB ASC Topic 718, determined without regard to possible forfeitures. The value ultimately received by the executive officer may or may not be equal to the values reflected above. See Note 16 to our audited financial statements included herein for the year ended December 31, 2017 for a complete description of the valuation, including the assumptions used. |
The value reported for Mr. Trimble in 2017 represents the grant of 9,811 restricted stock units made to him under the 2017 LTIP on March 1, 2017 in connection with his service as a non-employee director on our Board and prior to his appointment as our Interim Chief Executive Officer and President. The grant of such restricted stock units was not made to him in his capacity as Interim Chief Executive Officer and President.
(3) | The amounts in this column represent the aggregate payments made to our NEOs, except for Messrs. Trimble, Welch and Toothman, during 2017 under the KEIP and the 2017 Annual Incentive Plan. As set forth above under “Components of 2017 Executive Compensation – Performance Incentive Compensation – KEIP,” the payments to our NEO’s, except Messrs. Trimble, Welch and Toothman, under the KEIP were as follows: (1) Mr. Beer--$285,000, (2) Mr. Seilhan--$157,500, (3) Ms. Jaubert--$206,250, and (4) Mr. Messonnier--$120,176. As set forth above under “Components of |
79
2017 Executive Compensation – Performance Incentive Compensation – 2017 Annual Incentive Plan,” the payments to our NEO’s, except Messrs. Trimble, Welch and Toothman, under the 2017 Annual Incentive Plan were as follows: (1) Mr. Beer--$513,000, (2) Mr. Seilhan--$540,000, (3) Ms. Jaubert--$506,250, and (4) Mr. Messonnier--$398,250. For Mr. Trimble, the amount in this column represents the annual bonus payment made to him under the terms of his term sheet, as more fully discussed above under “Components of 2017 Executive Compensation – Performance Incentive Compensation – Trimble Bonus.” For each of Messrs. Welch and Toothman, the amounts in this column represent the payment made to each under the KEIP prior to his termination of employment. Each of Messrs. Welch and Toothman received a second KEIP payment in connection with his termination of employment from the Company that is included in the “All Other Compensation” column of the Summary Compensation Table. See “Components of 2017 Executive Compensation - Performance Incentive Compensation” for additional information.
(4) | The amounts in this column represent the aggregate of the following payments made to, or on behalf of, our NEOs during 2017: (i) Company matching contributions to its 401(k) Plan as described further under “Other Program Components – 401(k) Plan;” (ii) severance payments and benefits and earned time off payouts in connection with the termination of Mr. Welch’s and Mr. Toothman’s employment as described further under “Potential Payments Upon Termination or Change of Control;” (iii) Company-provided housing for Mr. Trimble; (iv) the payment of country club membership dues for Mr. Trimble; and (v) the payment of director fees for Mr. Trimble when he was a non-employee director, prior to his appointment as Interim Chief Executive Officer and President on April 28, 2017. While serving on our Board, Mr. Welch did not receive any additional compensation for his services as a director. The following table provides detail of such payments to each of the NEOs for 2017. |
Mr. Trimble | Mr. Welch | Mr. Beer | Mr. Seilhan | Ms. Jaubert | Mr. Messonnier | Mr. Toothman | |||||||||||||||||||||
Company 401(k) match | $ | — | $ | 9,000 | $ | 9,000 | $ | 9,000 | $ | — | $ | 9,000 | $ | — | |||||||||||||
Severance Payments and Benefits: | |||||||||||||||||||||||||||
Severance payment | — | 1,235,000 | — | — | — | — | 600,000 | ||||||||||||||||||||
COBRA benefit | — | 8,215 | — | — | — | — | 4,123 | ||||||||||||||||||||
Outplacement services | — | — | — | — | — | — | 1,000 | ||||||||||||||||||||
Equity award acceleration | — | 31,456 | — | — | — | — | 4,664 | ||||||||||||||||||||
Earned time off payout | — | 75,000 | — | — | — | — | 34,615 | ||||||||||||||||||||
Company-provided housing | 44,858 | — | — | — | — | — | — | ||||||||||||||||||||
Country club membership dues | 4,329 | — | — | — | — | — | — | ||||||||||||||||||||
Fees for services as non-employee director | 16,667 | — | — | — | — | — | |||||||||||||||||||||
$ | 65,854 | $ | 1,358,671 | $ | 9,000 | $ | 9,000 | $ | — | $ | 9,000 | $ | 644,402 | ||||||||||||||
Grants of Plan Based Awards
There were no grants of any plan based equity awards in fiscal 2017 to any of the NEOs under the 2017 LTIP or the 2009 Stock Incentive Plan, other than the grant of restricted stock units to Mr. Trimble on March 1, 2017 under the 2017 LTIP upon his appointment as a non-employee member of our Board on February 28, 2017, which was prior to his appointment as Interim Chief Executive Officer and President of the Company, effective April 28, 2017.
In accordance with the terms of the Plan, all shares of restricted stock held by certain of our executive officers, including certain of our NEOs, under the 2009 Stock Incentive Plan on the Effective Date were cancelled and, in exchange for such shares, such individuals received shares of new common stock and warrants on the same basis as all other holders of common stock of the debtors in the Chapter 11 Cases, but such shares of new common stock and warrants were subject to the vesting provisions set forth in the agreements granting the restricted shares of common stock of the debtors in the Chapter 11 Cases and the terms of the 2009 Stock Incentive Plan.
The following table discloses the estimated possible cash payouts under the 2017 Annual Incentive Plan (referred to in the chart below as the “2017 AIP”) and the KEIP to certain of our NEOs with respect to awards granted in 2017 and to Mr. Trimble pursuant to the terms of his term sheet (referred to in the chart below as the “Term Sheet”), as determined on the date of grant. Neither Mr. Welch nor Mr. Toothman was eligible to receive an award under the 2017 Annual Incentive Plan because each terminated employment with the Company prior to the date the 2017 Annual Incentive Plan was adopted. In addition, Mr. Trimble
80
was also not eligible to participate in the 2017 Annual Incentive Plan and instead was eligible to receive an award under the terms of his term sheet. For more information on these awards, read the section above titled “Components of 2017 Executive Compensation – Performance Incentive Compensation.”
Estimated Possible Payouts Under Non-Equity Incentive Plan Awards(1) | All Other Stock Awards: Number of Shares of Stock or Units (#) (2) | All Other Option Awards: Number of Securities Underlying Options (#) | Exercise or Base Price of Option Awards ($/sh) | Grant Date Fair Value of Stock and Option Awards ($) (3) | ||||||||||||||||||||||
Name | Grant Date | Plan | Threshold ($) | Target ($) | Maximum($) | |||||||||||||||||||||
James M. Trimble | 3/1/2017 | — | — | — | — | 9,811 | — | — | 264,406 | |||||||||||||||||
Term Sheet | 39,488 | 526,500 | 789,750 | — | — | — | — | |||||||||||||||||||
David H. Welch | ||||||||||||||||||||||||||
KEIP | 7,313 | 731,250 | — | — | — | — | — | |||||||||||||||||||
Kenneth H. Beer | KEIP | 28,500 | 285,000 | — | — | — | — | — | ||||||||||||||||||
2017 AIP | 28,500 | 380,000 | 570,000 | — | — | — | — | |||||||||||||||||||
Keith A. Seilhan | KEIP | 15,750 | 157,500 | — | — | — | — | — | ||||||||||||||||||
2017 AIP | 30,000 | 400,000 | 600,000 | — | — | — | — | |||||||||||||||||||
Lisa S. Jaubert | KEIP | 20,625 | 206,250 | — | — | — | — | — | ||||||||||||||||||
2017 AIP | 28,125 | 375,000 | 562,500 | — | — | — | — | |||||||||||||||||||
Thomas L. Messonnier | KEIP | 12,018 | 120,176 | — | — | — | — | — | ||||||||||||||||||
2017 AIP | 22,125 | 295,000 | 442,500 | — | — | — | — | |||||||||||||||||||
Richard L. Toothman, Jr. | ||||||||||||||||||||||||||
KEIP | 14,250 | 142,500 | — | — | — | — | — | |||||||||||||||||||
(1) | The amounts in these columns represent the range of possible payouts of the annual incentive awards granted under the 2017 Annual Incentive Plan for our NEOs, other than Messrs. Trimble, Welch and Toothman, the incentive awards under the KEIP for our NEOs, other than Mr. Trimble, and the annual incentive award under the terms of his term sheet for Mr. Trimble, as of the date of grant. The 2017 Annual Incentive Plan is a performance-based incentive program that provides award opportunities based on the Company’s achievement of qualitative and quantitative performance goals approved by the Board. The annual incentive award payable to Mr. Trimble under his term sheet is determined based on the same performance goals as provided under the 2017 Annual Incentive Plan. For 2017, achieving the target goals for each of the six measures under the 2017 Annual Incentive Plan would have resulted in a targeted annual incentive opportunity of 100% of the applicable participating NEO’s annual base salary or, in the case of Mr. Trimble, 120% of his annual base salary, prorated for the period between April 28, 2017 and December 31, 2017. For the 2017 Annual Incentive Plan, the amounts shown in the “Threshold” column reflect the lowest possible payout of 7.5% of the targeted annual incentive opportunity; the amounts shown in the “Target” column reflect a payout of 100% of the targeted annual incentive opportunity; and the amounts shown in the “Maximum” column reflect the highest possible payout of 150% of the targeted annual incentive opportunity. For Mr. Trimble, the amount shown in the “Target” column reflects a payout of 100% of his targeted annual incentive opportunity, prorated for the period between April 28, 2017 and December 31, 2017; the amount shown in the “Threshold” column reflects the lowest possible payout of 7.5% of his target annual incentive opportunity prorated for the period between April 28, 2017 and December 31, 2017; and the amount shown in the “Maximum” column reflects the highest possible payout of 150% of Mr. Trimble’s target annual incentive opportunity prorated for the period between April 28, 2017 and December 31, 2017. The KEIP was a performance-based incentive plan that provided award opportunities based on performance goals related to the Company’s emergence from bankruptcy. Each of the NEOs, except for Mr. Trimble, was entitled to receive “Threshold” and “Target” incentive awards under the KEIP. No “Maximum” incentive award was provided under the KEIP in excess of the “Target” incentive award. The amounts shown in the “Threshold” column reflect the lowest possible payout of 10% of the targeted incentive opportunity; and the amounts shown in the “Target” column reflect the highest possible payout of 100% |
81
of the targeted incentive opportunity.
(2) | The award in this column for Mr. Trimble represents the grant of 9,811 restricted stock units made to him under the 2017 LTIP on March 1, 2017 in connection with his service as a non-employee director on our Board and prior to his appointment as our Interim Chief Executive Officer and President. The grant of such restricted stock units was not made to him in his capacity as Interim Chief Executive Officer and President. |
(3) | The value in this column for Mr. Trimble is calculated in accordance with FASB ASC Topic 718, determined without regard to possible forfeitures, as discussed in footnote 2 to the Summary Compensation Table. |
Narrative Disclosure to Summary Compensation Table and Grants of Plan Based Awards Table
The following narrative provides additional information about the various compensation plans, programs and policies reflected in the Summary Compensation Table and the Grants of Plan Based Awards Table for the year ended December 31, 2017.
Employment and Separation and Severance Agreements
We do not maintain employment agreements with any of our NEOs. However, we entered into a term sheet with Mr. Trimble, effective April 28, 2017, which was amended on March 6, 2018 as discussed above in Part II, Item 9B. Other Information. The term sheet provides that Mr. Trimble’s employment is at-will and may be terminated by him or the Company on 30 days’ advance written notice. In addition, under the term sheet, Mr. Trimble is entitled to (1) an annual base salary equal to $650,000, (2) an annual target bonus opportunity equal to 120% of his annual base salary, as discussed above, and (3) the option to participate in the Company’s employee benefit plans available to senior executives of the Company. In addition, pursuant to the terms of the term sheet, Mr. Trimble is subject to (1) a 12-month post-termination non-competition obligation relating to the business of the Company, (2) a 12-month post-termination non-solicitation obligation applying to employees, consultants, customers and similar business relationships of the Company, (3) a perpetual confidentiality obligation, and (4) a perpetual non-disparagement obligation. Mr. Trimble is also entitled to certain protections with respect to his annual bonus in connection with a change of control event or a qualifying termination of employment as further described below under “Potential Payments Upon Termination or Change of Control – Term Sheet with Mr. Trimble.”
In addition, we have entered into a separation or severance agreement with Mr. Welch and Mr. Toothman that provided each executive with severance payments and benefits in connection with his termination of employment as further described below under “Potential Payments Upon Termination or Change of Control.”
Short-Term Performance-Based Compensation Plans
We maintain a performance-based annual cash incentive plan, the 2017 Annual Incentive Plan, under which Messrs. Beer, Seilhan and Messonnier and Ms. Jaubert received annual bonus awards as further described above under “Components of 2017 Executive Compensation – Performance Incentive Compensation – 2017 Annual Incentive Plan.” In addition, Mr. Trimble is eligible to receive an annual bonus pursuant to the terms of his term sheet as further described above under “Components of 2017 Executive Compensation – Performance Incentive Compensation – Trimble Bonus.” Each of Messrs. Welch, Beer, Seilhan, Messonnier and Toothman and Ms. Jaubert received payments under the KEIP, which was a performance-based cash incentive plan as further described above under “Components of 2017 Executive Compensation – Performance Incentive Compensation – KEIP.”
82
Outstanding Equity Awards at Fiscal Year-End
The following table contains information concerning all outstanding equity awards held by each of the NEOs as of December 31, 2017. None of the awards granted to Messrs. Welch and Toothman remained outstanding as of December 31, 2017. All outstanding stock options held by the NEOs on February 28, 2017 were cancelled pursuant to the Plan.
OUTSTANDING EQUITY AWARDS AT DECEMBER 31, 2017 | |||||||||
Stock Awards | |||||||||
Name | Stock Award Grant Date | Number of Shares or Units of Stock That Have Not Vested | Market Value of Shares or Units of Stock That Have Not Vested | ||||||
(#) (1) | ($) (2) | ||||||||
James M. Trimble | 3/1/2017 | 9,811 | 315,522 | ||||||
David H. Welch | — | — | — | ||||||
Kenneth H. Beer | 3/1/2015 | 445 (4) | 14,311 | ||||||
Keith A. Seilhan | 3/1/2015 | 231 (4) | 7,429 | ||||||
Lisa S. Jaubert | 3/1/2015 | 259 (4) | 8,329 | ||||||
Thomas L. Messonnier | 3/1/2015 | 68 (4) | 2,187 | ||||||
Richard L. Toothman, Jr. | — | — | — | ||||||
(1) | In accordance with the terms of the Plan, all shares of restricted stock held by our NEOs, except for Mr. Trimble, under the 2009 Stock Incentive Plan on the Effective Date were cancelled and, in exchange for such shares, such individuals received shares of new common stock and warrants on the same basis as all other holders of common stock of the debtors in the Chapter 11 Cases, but such shares of new common stock and warrants were subject to the vesting provisions set forth in the agreements granting the restricted shares of common stock of the debtors in the Chapter 11 Cases and the terms of the 2009 Stock Incentive Plan. The restrictions on the total number of such restricted shares lapsed as follows: (a) with respect to one-third of the total shares on January 15, 2016, (b) with respect to one-third of the total shares on January 15, 2017, and (c) with respect to the remaining one-third of the total shares on January 15, 2018. The restricted shares vested in full on January 15, 2018. |
(2) | The market value shown was determined by multiplying the number of unvested shares of stock by $32.16, which was the closing market price of our common stock on December 29, 2017 (which was the last trading day of fiscal 2017). |
Option Exercises and Stock Vested
The following table sets forth information regarding the number of stock awards vested, and the related value received, during 2017 for the NEOs. There were no stock option exercises during 2017 due to the fact that all outstanding stock options were cancelled pursuant to the terms of the Plan. All values realized were calculated by using the market value of our stock on the vesting date for the award, which was the average of the high and low price of our stock on the vesting date (or, if the vesting date was not a trading day, on the last trading day preceding the vesting date) and adjusted to take into account the effect of the 2016 reverse-stock split.
OPTION EXERCISES AND STOCK VESTED TABLE FOR THE YEAR ENDED DECEMBER 31, 2017 | ||||||
Name | Number of Shares Acquired on Vesting(#) | Value Realized on Vesting($) | ||||
James M. Trimble | — | — | ||||
David H. Welch | 13,946 | 113,823 | ||||
Kenneth H. Beer | 4,062 | 26,824 | ||||
Keith A. Seilhan | 1,825 | 12,052 | ||||
Lisa S. Jaubert | 2,164 | 14,290 | ||||
Thomas L. Messonnier | 609 | 4,022 | ||||
Richard L. Toothman, Jr. | 2,083 | 16,947 | ||||
Nonqualified Deferred Compensation
The following table sets forth information regarding nonqualified deferred compensation during 2017 for the NEOs.
83
Name | Executive Contributions in Last FY($) | Aggregate Earnings (Loss) in Last FY($) | Aggregate Withdrawals/Distributions ($) | Aggregate Balance at Last FYE ($)(1) | ||||||||
James M. Trimble | — | — | — | — | ||||||||
David H. Welch | — | 259,318 | (4,390,669 | ) | 17,322 | |||||||
Kenneth H. Beer | — | 258,752 | — | 1,425,781 | ||||||||
Keith A. Seilhan | — | — | — | — | ||||||||
Lisa S. Jaubert | — | — | — | — | ||||||||
Thomas L. Messonnier | — | 73,736 | — | 477,900 | ||||||||
Richard L. Toothman, Jr. | — | — | — | — | ||||||||
(1) | The following portions of the aggregate balance amounts for each of the NEOs were reported as compensation to the officer in the Summary Compensation Table in previous fiscal years: Mr. Welch - $526,420 for the year ended December 31, 2010 and $208,391 for the year ended December 31, 2009; and Mr. Beer - $35,333 for the year ended December 31, 2009 and $168,729 for the year ended December 31, 2015. |
Our Deferred Compensation Plan provides eligible executives and other highly compensated individuals with the option to defer up to 100% of their base salary and 100% of their annual incentive award for a given calendar year. Deferral elections are made separately for salary and bonus not later than December 31 for amounts to be earned in the following year. Currently, Messrs. Beer and Messonnier are the only NEOs, who are still employed by the Company, that participate in the Deferred Compensation Plan and neither elected to defer any amounts to the plan for 2017.
The Deferred Compensation Plan previously provided that the Compensation Committee may, at its discretion, match all or a portion of the participant’s deferral based upon a percentage determined by the Board. In addition, the Board may elect to make discretionary profit sharing contributions to participants in the Deferred Compensation Plan. Since the inception of the Deferred Compensation Plan, we have not made matching or profit sharing contributions. In connection with our entry into the Settlement Agreement, we adopted an amendment to the Deferred Compensation Plan that removed our ability to make matching contributions under the Deferred Compensation Plan.
All participant contributions to the Deferred Compensation Plan and investment returns on those contributions are fully vested. Distributions from the Deferred Compensation Plan are only made upon a separation of service and will be made as a lump-sum cash payment or in monthly installments over up to ten years, based on the participant’s election and subject to the six-month delay of distributions imposed on certain of our key employees by Section 409A of the Code. The amounts held under the Deferred Compensation Plan are invested in various investment funds maintained by a third party in accordance with the direction of each participant. Investment options under the plan are similar to the investment options available to participants in our 401(k) Plan. Both the Deferred Compensation Plan and the 401(k) Plan utilize a mutual fund investment window that enables participants to elect a wide variety of mutual funds. Participants may change their investment elections daily. The investment funds and rate of return for the year ended December 31, 2017 for the investment options elected by the NEOs who participated in the Deferred Compensation Plan during 2017 are as follows:
• | David H. Welch - Stock investments included Fidelity International Discovery, Fidelity Retirement Money Market Fund, Fidelity Retirement Government Money Market Fund and Fidelity New Markets, Inc., with a combined rate of return of 9% for the year ended December 31, 2017. |
• | Kenneth H. Beer - Stock investments included Fidelity Leveraged Co. Stock Fund, Fidelity Diversified International Fund, Fidelity Small Cap Stock Fund, Fidelity 500 Index PR, Fidelity Emerging Asia Fund and Fidelity Emerging Markets Fund, with a combined rate of return of 22% for the year ended December 31, 2017. |
• | Thomas L. Messonnier - Stock investments included Fidelity Small Cap Stock Fund, Fidelity International Discovery, Fidelity Focused High Inc., Fidelity US Bond Index PR, Fidelity Small Cap Growth Fund, Fidelity Ext Mkt Index PR, Fidelity 500 Index PR, Fidelity Select Energy, Fidelity Real Estate Investments, Fidelity International Real Estate and Fidelity Emerging Markets Fund, with a combined rate of return of 18% for the year ended December 31, 2017. |
In connection with the termination of his employment, Mr. Welch received a lump sum distribution of a portion of his account balance on November 1, 2017, in an amount equal to approximately $4,390,373 and an additional distribution of a portion of his account balance on December 1, 2017 in an amount equal to approximately $296. As of December 31, 2017, $17,322 remained in his account to be distributed in equal monthly installments until October 1, 2022.
84
Potential Payments Upon Termination or Change of Control
Executive Severance Plan
Pursuant to the Executive Severance Plan, in the event that the employment of Messrs. Beer, Seilhan, Messonnier or Ms. Jaubert is terminated by the Company without “cause” (as defined below) or by the executive due to “good reason” (as defined below), the executive is entitled to the payments and benefits described below, subject to the executive officer’s timely execution, delivery, and non-revocation of a release of claims:
• | Cash Severance. A lump sum cash severance payment in an aggregate amount equal to 1.5 times the annual base salary for Messrs. Beer and Seilhan and Ms. Jaubert or 1 times the annual base salary for Mr. Messonnier. |
• | Prorated Bonus. A lump sum cash severance payment equal to 100% of the executive officer’s annual bonus opportunity, at target, for the calendar year in which the termination occurs, prorated by the number of days that have elapsed from January 1 of that calendar year through the date of termination; provided that if such termination occurs during the 12-month period immediately following Closing, the target bonus will be deemed to be no less than the executive officer’s target bonus for the 2017 calendar year. |
• | Other Termination Benefits. The following additional benefits: |
• | continuation of health insurance benefits for the executive officer and, where applicable, the executive officer’s eligible dependents, for up to six months following such termination of employment at a cost to the executive officer that is equal to the cost for an active employee for similar coverage; |
• | accelerated vesting as specified in any long-term incentive award agreement between the executive officer and the Company for such a termination; |
• | reasonable outplacement services up to 5% of the annual base salary of the executive officer; and |
• | without regard to the release requirement, any unpaid portion of the executive officer’s earned annual base salary as of the date of the termination. |
If any payment, distribution, or benefit pursuant to the terms of the Executive Severance Plan, when aggregated with any other payment, distribution, or benefit outside of the Executive Severance Plan, would be subject to the excise tax imposed by Section 4999 of the Code, or any interest or penalties with respect to such excise tax, then, under the terms of the Executive Severance Plan, any such payment, distribution, or benefit would be reduced to the extent such reduction would result in a greater net after-tax amount being retained by the executive officer.
Retention Awards
The Company entered into a retention award agreement with each of Messrs. Beer, Seilhan, Messonnier and Ms. Jaubert on August 2, 2017, effective on June 1, 2017, as further described above under “Other Program Components – Retention Awards.”
Transaction Bonuses
The Company entered into transaction bonus agreements with each of Messrs. Beer, Seilhan, Messonnier and Ms. Jaubert on November 21, 2017, as further described above under “Other Program Components – Transaction Bonuses.”
Term Sheet with Mr. Trimble
Under the terms of Mr. Trimble’s term sheet prior to its amendment on March 6, 2018 as discussed above in Part II, Item 9B. Other Information, and as in effect during fiscal year 2017, in the event of the occurrence of a change of control event or if his employment is terminated by the Company without “cause” or by him for “good reason” (each as defined below) in 2017, he is entitled to receive the prorated Target Bonus for the period from April 28, 2017 through December 31, 2017, subject to the execution and irrevocability of a release of claims.
For purposes of the Executive Severance Plan, the retention award agreements, the transaction bonus agreements and the term sheet with Mr. Trimble:
85
• | “cause” means any termination of the executive’s employment by reason of the executive’s: (1) willful and continued failure to perform substantially his or her duties (other than any such failure resulting from his or her incapacity due to physical or mental illness) after written notice of such failure has been given to him or her specifying in detail such failure and the executive has had a reasonable period (not to exceed 30 days) to correct such failure; (2) conviction (or plea of nolo contendere) for any felony or any other crime which involves moral turpitude; (3) gross negligence or willful misconduct in the performance of his or her duties; provided, however, that no act or failure to act on the part of the executive shall be considered “gross negligence” or “willful misconduct” if done or omitted to be done by the executive in good faith and in the reasonable belief that such act or failure to act was in the best interest of the Company or its affiliate; (4) breach or violation of any material provision of any material policy of the Company or its affiliate that is reasonably likely to result in material harm to the Company, which, if capable of being remedied, remains unremedied by the executive for more than 10 days after written notice thereof is given to the executive by the Company or its affiliate; or (5) theft, fraud, embezzlement, misappropriation or material acts of dishonesty against the Company or an affiliate. |
• | “good reason” means the occurrence (without the executive’s express written consent), of any one of the following acts by the Company: (1) a material reduction in the executive’s annual base salary; (2) a material diminution in the authority, duties or responsibilities of the executive; provided, that, a change resulting from the Company’s no longer being a public company shall not be a basis for a “good reason” termination; or (3) a requirement that the executive transfer to a work location that is more than 50 miles from such executive’s principal work location and that materially increases the executive’s commute. |
Separation Agreement with Mr. Welch
On May 11, 2017, Mr. Welch entered into a separation agreement and general release with the Company. Pursuant to the separation agreement, Mr. Welch resigned from the Board effective May 11, 2017 and his separation from employment became effective April 28, 2017. In exchange for entering into the separation agreement, Mr. Welch was entitled to receive the payments, rights and benefits he was entitled to under the Prior Executive Severance Plan, which were: (1) his outstanding wages and accrued vacation and sick pay in the amount of $100,000, (2) a lump sum severance payment in the amount of 18 months of base salary, equal to $975,000, and a lump sum bonus payment of $260,000, equal to the prorated portion of his annual bonus opportunity of 120% of his annual base salary through April 28, 2017, (3) a payment equal to $365,625, which was the amount owed to him under the KEIP, (4) Company payment of medical insurance premiums under COBRA for him and his eligible dependents for up to six months after his termination of employment, and (5) reimbursement for outplacement services up to $32,500. In addition, under the separation agreement, the next tranche of unvested warrants and restricted stock held by Mr. Welch, consisting of 5,201 warrants and 1,473 shares of restricted stock, fully vested as of the date provided for under the terms of the separation agreement. In the separation agreement, Mr. Welch provided a customary general release to the Company and agreed to remain subject to certain perpetual confidentiality and non-disparagement covenants.
Severance Agreement with Mr. Toothman
On April 27, 2017, we entered into a severance agreement and release of claims with Mr. Toothman. Under his severance agreement, Mr. Toothman was entitled to receive the following severance payments and benefits: (1) a lump sum cash payment equal to $600,000, (2) six months of COBRA payments equal to $790.26 a month, and (3) his remaining KEIP payment. In the severance agreement, Mr. Toothman provided a customary general release to the Company and agreed to remain subject to certain perpetual confidentiality and non-disparagement covenants.
Restricted Stock Unit Award Agreement with Mr. Trimble
On March 1, 2017, Mr. Trimble was awarded 9,811 restricted stock units under the 2017 LTIP in connection with his service as a non-employee director prior to his appointment as Interim Chief Executive Officer and President of the Company pursuant to the terms of an award agreement. Under the award agreement, the restricted stock units are scheduled to vest in full on the day prior to the annual meeting of the Company’s stockholders in May 2018, subject to: (i) the director’s continued service on the Board through the vesting date, and (ii) earlier vesting upon the occurrence of a change of control event or the termination of the director’s service due to death or removal from the Board without cause.
Payments Made Upon Termination Generally
Regardless of the manner in which an executive’s (including a NEO) employment terminates, he or she is entitled to receive amounts earned during his or her employment. These amounts include:
86
• | annual base salary or wages earned during the fiscal year but unpaid at the time of termination; |
• | amounts contributed pursuant to our Deferred Compensation Plan; |
• | unused vacation pay; and |
• | amounts accrued and vested through our 401(k) Plan. |
Quantification of Potential Payments Upon Termination or Change of Control
The table below reflects the amount of compensation to each of the NEOs in the event of termination of such executive’s employment, or a change in control, as applicable. The amount of compensation payable to each NEO upon the occurrence of a change in control or the executive’s termination by the Company without “cause,” due to the executive’s death or disability or by the executive due to “good reason” is shown below, or, if the NEO’s employment actually terminated, the amount paid to the NEO in connection with such termination.
The following assumptions were used in determining the amounts below in the Potential Payment Upon Termination or Change of Control Table:
• | All terminations would be effective as of December 31, 2017 (except with respect to Messrs. Welch and Toothman whose employment was terminated on April 28, 2017 and April 30, 2017, respectively). |
• | Severance payments are calculated pursuant to the terms of the Executive Severance Plan or the terms of the applicable severance or separation agreement or, in the case of Mr. Trimble, his term sheet. |
• | Retention and transaction bonus payments are calculated pursuant to the terms of the applicable retention or transaction bonus agreement. |
• | Mr. Trimble’s term sheet requires us to provide him with 30 days’ advance written notice in order to terminate his employment. The amounts reported in the table below do not include any compensation or benefits that would be paid or provided to Mr. Trimble during the 30-day period from the date notice of termination of his employment was provided to the date of such termination. |
• | The closing share price of our common stock as of December 29, 2017 (the last trading day of fiscal year 2017) was $32.16, and this is the price used to determine the market value shown in the table for “Equity Awards – Accelerated Vesting.” |
• | The actual amounts to be paid can only be determined at the time of such executive’s actual separation from employment. |
• | Outplacement services are not to exceed an amount equal to 5% of the annual base salary of the executive. |
• | Vacation pay assumes the executive has not used any vacation days and is being paid for all unused days. |
In addition, upon termination in the event of death or disability, our executives, including our NEOs, receive the same benefits as are provided to our employees generally on a nondiscriminatory basis (including 401(k) matching contributions for the year of death or disability, group term life insurance benefits and long-term disability benefits). However, the maximum benefit provided under our long-term disability policy to our NEOs (and other executives) is $15,000 per month (or 66 2⁄3% of salary if less). This monthly maximum is higher than the monthly maximum established for other employees.
87
POTENTIAL PAYMENTS UPON TERMINATION OR CHANGE OF CONTROL TABLE | ||||||||||||||
Name (1) | Benefit | Termination without Cause or Due to Good Reason | Termination due to Death or Disability | Change in Control | ||||||||||
James M. Trimble | Prorated annual bonus payment (3) | $ | 526,500 | $ | — | $ | 526,500 | |||||||
Equity awards - accelerated vesting (8) | 315,522 | 315,522 | 315,522 | |||||||||||
Vacation /Sick pay (9) | 75,000 | 75,000 | — | |||||||||||
Total | $ | 917,022 | $ | 390,522 | $ | 842,022 | ||||||||
Kenneth H. Beer | Severance (2) | $ | 570,000 | $ | — | $ | — | |||||||
Prorated annual bonus payment (3) | 380,000 | — | — | |||||||||||
Transaction bonus (4) | 300,000 | 300,000 | 300,000 | |||||||||||
Retention award (5) | 190,000 | 190,000 | 190,000 | |||||||||||
Outplacement (6) | 19,000 | — | — | |||||||||||
Health and welfare benefits (7) | 8,008 | — | — | |||||||||||
Equity awards - accelerated vesting (8) | — | 14,311 | — | |||||||||||
Vacation /Sick pay (9) | 43,846 | 43,846 | — | |||||||||||
Total | $ | 1,510,854 | $ | 548,157 | $ | 490,000 | ||||||||
Keith A. Seilhan | Severance (2) | $ | 600,000 | $ | — | $ | — | |||||||
Prorated annual bonus payment (3) | 400,000 | — | — | |||||||||||
Transaction bonus (4) | 375,000 | 375,000 | 375,000 | |||||||||||
Retention award (5) | 200,000 | 200,000 | 200,000 | |||||||||||
Outplacement (6) | 20,000 | — | — | |||||||||||
Health and welfare benefits (7) | 11,060 | — | — | |||||||||||
Equity awards - accelerated vesting (8) | — | 7,429 | — | |||||||||||
Vacation /Sick pay (9) | 46,154 | 46,154 | — | |||||||||||
Total | $ | 1,652,214 | $ | 628,583 | $ | 575,000 | ||||||||
Lisa S. Jaubert | Severance (2) | $ | 562,500 | $ | — | $ | — | |||||||
Prorated annual bonus payment (3) | 375,000 | — | — | |||||||||||
Transaction bonus (4) | 202,500 | 202,500 | 202,500 | |||||||||||
Retention award (5) | 187,500 | 187,500 | 187,500 | |||||||||||
Outplacement (6) | 18,750 | — | — | |||||||||||
Health and welfare benefits (7) | 8,008 | — | — | |||||||||||
Equity awards - accelerated vesting (8) | — | 8,329 | — | |||||||||||
Vacation /Sick pay (9) | 43,269 | 43,269 | — | |||||||||||
Total | $ | 1,397,527 | $ | 441,598 | $ | 390,000 | ||||||||
Thomas L. Messonnier | Severance (2) | $ | 295,000 | $ | — | $ | — | |||||||
Prorated annual bonus payment (3) | 295,000 | — | — | |||||||||||
Transaction bonus (4) | 120,000 | 120,000 | 120,000 | |||||||||||
Retention award (5) | 147,500 | 147,500 | 147,500 | |||||||||||
Outplacement (6) | 14,750 | — | — | |||||||||||
Health and welfare benefits (7) | 11,060 | — | — | |||||||||||
Equity awards - accelerated vesting (8) | — | 2,187 | — | |||||||||||
Vacation /Sick pay (9) | 34,038 | 34,038 | — | |||||||||||
Total | $ | 917,348 | $ | 303,725 | $ | 267,500 | ||||||||
88
(1) | Mr. Welch, our former President and Chief Executive Officer, terminated employment with the Company, effective April 28, 2017, and entered into a separation agreement with the Company on May 11, 2017. In addition, Mr. Toothman, our former Senior Vice President – Appalachia, terminated employment with the Company, effective April 30, 2017, and entered into severance agreement with the Company on April 27, 2017. Pursuant to his separation or severance agreement, each of Messrs. Welch and Toothman received the payments and benefits described above under “Potential Payments Upon Termination or Change of Control – Separation Agreement with Mr. Welch” and “Potential Payments Upon Termination or Change of Control – Severance Agreement with Mr. Toothman” and quantified above in the table in the footnote to the “All Other Compensation” column of the Summary Compensation Table as “Severance Payments and Benefits” and “Earned Time Off Payout.” In addition, in connection with their termination of employment, each of Messrs. Welch and Toothman received payments under the KEIP in an amount equal to $365,625 and $71,250, respectively. |
(2) | The amounts reflect lump sum severance payments payable under the Executive Severance Plan. Severance payments are calculated by multiplying (a) Messrs. Beer’s and Seilhan’s and Ms. Jaubert’s annual base salary by 1.5 and (b) Mr. Messonnier’s annual base salary by 1.0. For 2017, Mr. Beer’s annual base salary was $380,000, Mr. Seilhan’s annual base salary was $400,000, Ms. Jaubert’s annual base salary was $375,000 and Mr. Messonnier’s annual base salary was $295,000. |
(3) | These amounts reflect lump sum prorated annual bonus payments to Messrs. Beer, Seilhan, Messonnier and Ms. Jaubert under the Executive Severance Plan and to Mr. Trimble under his term sheet. For each of Messrs. Beer, Seilhan and Messonier and Ms. Jaubert, the prorated annual bonus payment is equal to 100% of the executive’s annual target bonus opportunity for 2017. Each of Messrs. Beer, Seilhan, Messonier and Ms. Jaubert’s annual target bonus opportunity for 2017 was 100% of the executive’s annual base salary. For Mr. Trimble, the prorated annual bonus payment is equal to 100% of his annual target bonus opportunity for 2017, prorated from April 28, 2017. Mr. Trimble’s annual target bonus opportunity for 2017 was 120% of his annual base salary of $650,000. |
(4) | The amounts reflect transaction bonuses for each of Messrs. Beer, Mr. Seilhan, Messonnier and Ms. Jaubert, pursuant to transaction bonus agreements entered into on November 21, 2017, as further described above under “Other Program Components - Transaction Bonuses. |
(5) | The amounts reflect retention awards for each of Messrs. Beer, Seilhan, Messonnier and Ms. Jaubert, pursuant to retention award agreements entered into on August 2, 2017, effective on June 1, 2017, as further described above under “Other Program Components - Retention Awards.” |
(6) | The amounts reflect estimates of the cost of outplacement services for each of Messrs. Beer, Seilhan, Messonnier and Ms. Jaubert under the Executive Severance Plan and assume the maximum amount of 5% of salary was paid. |
(7) | The amounts reflect estimates of the cost of continuation of health insurance benefits for each of Messrs. Beer, Seilhan, Messonnier and Ms. Jaubert and, where applicable, the executive’s eligible dependents for six months under the Executive Severance Plan. This amount is calculated as the portion of employee health insurance premiums covered by us for each executive per month at a cost to the executive that is equal to the cost for an active employee for similar coverage multiplied by 6. |
(8) | The amounts reflect accelerated vesting of the restricted stock granted to each of Messrs. Beer, Seilhan, Messonnier and Ms. Jaubert and the restricted stock units granted to Mr. Trimble, each as described above in the Outstanding Equity Awards at December 31, 2017 Table. The amounts are calculated by multiplying the number of shares of restricted stock (or restricted stock units in the case of Mr. Trimble) that would vest on the occurrence of the events described below on December 31, 2017 by the closing share price of our common stock as of December 29, 2017 (the last trading day of fiscal year 2017), which was $32.16. The number of shares of restricted stock or restricted stock units that would vest for each executive on the occurrence of such an event on December 31, 2017 is as follows: |
• | Mr. Trimble - 9,811 shares, |
• | Mr. Beer - 445 shares, |
• | Mr. Seilhan - 231 shares, |
• | Ms. Jaubert - 259 shares, and |
• | Mr. Messonnier - 68 shares. |
89
The restricted stock granted to each of Messrs. Beer, Seilhan and Messonnier and Ms. Jaubert vested in full on January 15, 2018. Each of Messrs. Beer, Seilhan and Messonnier and Ms. Jaubert also holds warrants that vested in full on January 15, 2018; however, the exercise price with respect to these warrants exceeded the fair market value of the stock on December 29, 2017.
The Executive Severance Plan provides that in the event of the executive’s termination without cause or due to good reason, the executive will be entitled to accelerated equity as specified in the long-term incentive award agreement for such a termination. Under the restricted stock agreement applicable to each of the NEOs other than Mr. Trimble, awards are forfeited on termination of employment unless the termination is due to death or disability. In the event of a termination due to death or disability, the restrictions on such awards of restricted stock lapse.
The vesting of the restricted stock units granted to Mr. Trimble accelerates only on a change in control or in connection with his termination from service without cause or due to death.
(9) | The amounts reflect vacation and sick pay for each of Messrs. Trimble, Beer, Seilhan and Messonnier and Ms. Jaubert and were calculated by using the executive’s base salary divided by 2080 hours, multiplied by 240 hours. |
2017 PAY RATIO
As required by Section 953(b) of the Dodd-Frank Wall Street Reform and Consumer Protection Act, and Item 402(u) of Regulation S-K, we are providing the following information about the relationship of the annual total compensation of our employees and the annual total compensation of Mr. Trimble, our Interim Chief Executive Officer and President (referred to in this sub-part only as our “Interim CEO”):
For 2017, our last completed fiscal year:
• | the median of the annual total compensation of all our employees (other than our Interim CEO) was $148,542; and |
• | the annual total compensation of our Interim CEO was $2,067,466. |
Based on this information, for 2017, the ratio of the annual total compensation of Mr. Trimble, our Interim CEO, to the median of the annual total compensation of all employees was 13.9 to 1. |
We selected December 31, 2017 (the “determination date”), which is within the last three months of 2017, as the date upon which we would identify the “median employee.”
We identified the median employee by examining the total earnings, as reported on the Form W-2 for 2017, of each individual other than the Interim CEO who was employed by us on the determination date. We included all employees, whether employed on a full-time, part-time, or seasonal basis. We did not make any assumptions, adjustments, or estimates with respect to total W-2 earnings, and we did not annualize the compensation for any full-time employees other than the Interim CEO, as described below, that were not employed by us for all of 2017. We believe the use of total W-2 earnings for all employees is a consistently applied compensation measure because it includes most of the elements of compensation and earnings received by our employees, including our Interim CEO, and because we did not award equity incentive compensation to any of our employees in 2017 in their capacity as employees.
Once we identified our median employee, we combined all of the elements of such employee’s compensation for 2017 in accordance with the requirements of Item 402(c)(2)(x) of Regulation S-K, resulting in annual total compensation of $148,542. These elements included the median employee’s base salary or wages, the annual bonus earned by the median employee with respect to the 2017 fiscal year and a discretionary 401(k) matching contribution approved by the Board.
During 2017, we had two principal executive officers, as described above under “2017 Overview – Transition of Management.” As permitted under Item 402(u), we calculated the pay ratio using the total annual compensation of Mr. Trimble, who was our Interim CEO on the determination date, as reported in the “Total” column of our Summary Compensation Table included in this Form 10-K, and annualized components of that amount that were reasonably annualized (specifically, his annual base salary, his non-equity incentive compensation plan entitlement and the housing and country club membership benefits he received from the Company during 2017 in his capacity as Interim CEO). Consequently, the amount reported in the “Total” column of our Summary Compensation Table with respect to Mr. Trimble is different from the amount reported as his annual
90
total compensation above because the amount listed above includes the annualized equivalent of the amounts reported in the Summary Compensation Table with respect to his annual base salary, his non-equity incentive plan entitlement and his housing and country club membership benefits.
2017 DIRECTOR COMPENSATION
Elements of Director Compensation
Director Compensation Arrangements
Prior to our emergence from bankruptcy, between January 1, 2017 and February 28, 2017, the directors on our Board who were not officers or employees of the Company or any of its subsidiaries (“non-employee directors”) were as follows: Richard A. Pattarozzi, Kay G. Priestly, Donald E. Powell, Robert S. Murley, B.J. Duplantis, George R. Christmas, Peter D. Kinnear, Phyllis M. Taylor and David T. Lawrence (collectively, the “prior board”).
Upon emergence from bankruptcy, on February 28, 2017, pursuant to the Plan, the previous members of the Board ceased to serve on the Board and the following individuals were appointed to serve as non-employee directors on the Board: Neal P. Goldman, John B. Juneau, David I. Rainey, Charles M. Sledge, James M. Trimble (who subsequently was appointed as our Interim Chief Executive Officer and President) and David N. Weinstein (collectively, the “current board”). The following summarizes the material terms of the compensation payable to the prior board and to the current board.
Prior Board Compensation Arrangements
Each of the non-employee directors who served on the prior board was paid, in 2017, (a) $43,875 with respect to their service in the fourth quarter of 2016, representing the fourth quarterly payment of the 2016 annual retainer, and (b) $29,250 with respect to their service in 2017, representing the first quarterly payment of the 2017 annual retainer, prorated for January 1, 2017, through February 28, 2017. Additionally, the individuals serving in the following roles received additional cash retainers, paid in 2017, for their service in the fourth quarter of 2016, in the following amounts: (i) the Lead Director, $6,250, (ii) the Audit Committee Chairman, $3,750, (iii) the Compensation Committee Chairman, $2,500, (iv) the Nominating & Governance Committee Chairman, $2,250, and (v) the Reserves Committee Chairman, $2,250. And, further, additionally, the individuals serving in the following roles received additional cash retainers for their service in the first quarter of 2017, prorated for January 1, 2017, through February 28, 2017, in the following amounts: (i) the Lead Director, $4,167, (ii) the Audit Committee Chairman, $2,500, (iii) the Compensation Committee Chairman, $1,667, (iv) the Nominating & Governance Committee Chairman, $1,500, and (v) the Reserves Committee Chairman, $1,500. The prior board also reserved the right, in its sole discretion, to provide additional compensation at a rate of not more than $1,500 per additional meeting to non-employee directors who attend more than five meetings of the prior board or more than five meetings of each committee on which he or she served during a calendar year. The prior board did not exercise this right in fiscal year 2017.
Current Board Compensation Arrangements
In connection with the appointment of the non-employee directors to the current board, on March 1, 2017, the Board approved the following compensation arrangements for the non-employee directors of the Company:
•annual cash retainers of $50,000 for each of the non-employee directors of the Company, payable in advance on a quarterly basis;
•an annual cash fee of $15,000 for the Chairman of the Audit Committee, payable in advance on quarterly basis;
•a monthly retainer of $12,500 for each member of the Transaction Committee other than the Chairman of the Transaction Committee or a monthly retainer of $17,500 for the Chairman of the Transaction Committee; and
•annual grants of restricted stock units under the 2017 LTIP with grant date values of $150,000 for each non-employee director other than the Chairman of the Board and $200,000 for the Chairman of the Board, to be made on the date of the annual meeting of the stockholders each year; provided however, that the initial 2017 award service period commenced March 1, 2017, to run until the date prior to the first annual meeting in May 2017, with the initial award of restricted stock units having been increased pro rata to reflect this extended service period. Such restricted stock units are scheduled to vest in full on the date prior to the annual meeting of stockholders in the year following the grant and will be subject to: (1) the director’s continued service on the Board through the vesting date, (2) earlier vesting upon the occurrence of a change of control event or the termination of the director’s service due to death or removal from the
91
Board without cause, and (3) such other terms as set forth in the award agreements. Upon vesting, the restricted stock units will be settled partly in shares of the Company’s common stock and partly in cash to provide funds to pay any income taxes due upon settlement (based on the highest federal tax rate).
Annual Grant of Restricted Stock Units
On March 1, 2017, the Board approved the initial annual grant of restricted stock units to the non-employee directors, which were adjusted to grant date values of $182,100 for the non-employee directors other than the Chairman of the Board and $242,800 for the Chairman of the Board to reflect the extended service period commencing on March 1, 2017 until the annual meeting of stockholders in May 2018. Accordingly, on March 1, 2017, Messrs. Juneau, Rainey, Sledge, Trimble and Weinstein were awarded 9,811 restricted stock units and Mr. Goldman was awarded 13,082 restricted stock units under the 2017 LTIP pursuant to an award agreement. Under the award agreement, each of the restricted stock units are scheduled to vest in full on the day prior to the annual meeting of the Company’s stockholders in May 2018, subject to: (1) the director’s continued service on the Board through the vesting date, and (2) earlier vesting upon the occurrence of a change of control event or the termination of the director’s service due to death or removal from the Board without cause.
Deferred Compensation Plan
On March 1, 2017, the Board also approved our Directors Deferred Compensation Plan (“DCP”) under which the non-employee directors of the Company are given the opportunity to elect to defer receipt (and taxation) of vested restricted stock units until either (1) the third anniversary of the vesting date, or (2) the non-employee director’s separation from service on the Board. If deferral is elected, the payment of the deferred amounts is automatically accelerated upon a non-employee director’s death or separation from service on the Board, or upon the occurrence of a change of control event.
Stock Ownership and Retention Guidelines and Certain Prohibitions Related to Our Securities
The Board has adopted Director Stock Ownership Guidelines that apply to the non-employee directors on the current board. Under these guidelines, a non-employee director must own “qualifying shares” with a market value equal to $200,000. The non-employee directors are required to meet this ownership level within two years of being elected to their position. All non-employee directors on the current board are in compliance with the Director Stock Ownership Guidelines.
The guidelines provide that “qualifying shares” include (1) stock purchased on the open market, (2) vested and unvested restricted stock units, (3) restricted stock units deferred pursuant to the DCP, and (4) stock beneficially owned in a trust, by a spouse and/or a minor child. Until the applicable guideline is attained, in general, an individual is required to retain, and not sell or otherwise dispose of, any shares of our common stock. The value of our stock used in determining compliance with the guidelines is the volume-weighted average price of our stock over the 30 trading days prior to the date of determination. The Board may amend or terminate the Director Stock Ownership Guidelines in its sole discretion.
The Board has adopted a policy prohibiting any non-employee director of the Company from hedging company stock.
92
Director Compensation Table
The following table discloses the cash, equity awards and other compensation earned, paid or awarded, to each of our non-employee directors during 2017.
DIRECTOR SUMMARY COMPENSATION FOR THE YEAR ENDED DECEMBER 31, 2017 | ||||||||||||
Name(1) | Fees Earned or Paid in Cash($) | Stock Awards($)(2) | All Other Compensation ($)(3) | Total($) | ||||||||
Current Board: | ||||||||||||
Neal P. Goldman | 199,167 | 352,560 | — | 551,727 | ||||||||
John “Brad” Juneau | 154,167 | 264,406 | — | 418,573 | ||||||||
David I. Rainey | 154,167 | 264,406 | — | 418,573 | ||||||||
Charles M. Sledge | 166,667 | 264,406 | — | 431,073 | ||||||||
David N. Weinstein | 41,667 | 264,406 | — | 306,073 | ||||||||
Prior Board: | ||||||||||||
George R. Christmas | 77,305 | 7,706 | — | 85,011 | ||||||||
B. J. Duplantis | 76,888 | 7,706 | — | 84,594 | ||||||||
Peter D. Kinnear | 73,138 | 7,706 | — | 80,844 | ||||||||
David T. Lawrence | 73,138 | 7,706 | — | 80,844 | ||||||||
Robert S. Murley | 73,138 | 7,706 | — | 80,844 | ||||||||
Richard A. Pattarozzi | 83,555 | 7,706 | — | 91,261 | ||||||||
Donald E. Powell | 73,138 | 7,706 | 10,000 | 90,844 | ||||||||
Kay G. Priestly | 79,388 | 7,706 | — | 87,094 | ||||||||
Phyllis M. Taylor | 76,888 | 7,706 | — | 84,594 | ||||||||
(1) | During the term of his service as Interim Chief Executive Officer and President from April 28, 2017 through December 31, 2017, Mr. Trimble did not receive any additional compensation in connection with his service as a director. Mr. Trimble received director fees and an award of restricted stock units in his capacity as a non-employee director for the period during which he was not also serving as our Interim Chief Executive Officer and President in 2017. The annual cash retainer paid and restricted stock unit award granted to Mr. Trimble in his capacity as a non-employee director are reflected in the Summary Compensation Table. From January 1, 2017 through May 11, 2017, the date on which he resigned from our Board, Mr. Welch, our former Chief Executive Officer and President, did not receive any additional compensation in connection with his service as a director. |
(2) | The values shown in this column reflect the aggregate grant date fair value of stock awards granted in fiscal 2017, computed in accordance with FASB ASC Topic 718, determined without regard to possible forfeitures. The value ultimately received by the director may or may not be equal to the values reflected above. See Note 16 to our audited financial statements for the year ended December 31, 2017 for a complete description of the valuation, including the assumptions used. |
Each member of the current board received an award of restricted stock units on March 1, 2017 as follows: (i) 13,082 shares at $26.95 per share for Mr. Goldman, Chairman of the Board and (ii) 9,811 shares at $26.95 per share for all other current board members. These restricted stock units are scheduled to vest in full on the day prior to our annual meeting in May 2018, subject to (a) the director’s continued service on the Board through the vesting date, and (b) earlier vesting upon the occurrence of a change of control event or the termination of the director’s service due to death or removal from the Board without cause. On January 31, 2017, each member of the prior board received 697 shares of fully vested common stock at $6.80 per share for services related to the fourth quarter of fiscal year 2016, and, on February 17, 2017, each member of the prior board received 459 shares of fully vested common stock at $6.47 per share for services related to the first quarter of fiscal year 2017 through the emergence date.
(3) | The value shown in this column for Mr. Powell consisted solely of a matching charitable contribution of $10,000 in 2017 to the following qualified charitable organization: West Texas A&M University. |
93
ITEM 12. SECURITY OWNERSHIP OF CERTAIN BENEFICIAL OWNERS AND MANAGEMENT AND RELATED STOCKHOLDER MATTERS
Security Ownership of Directors, Management and Certain Beneficial Holders
The following table sets forth certain information regarding beneficial ownership of common stock as of March 7, 2018 (unless otherwise indicated) of (1) each person known by us to own beneficially more than 5% of our outstanding common stock, (2) our Named Executive Officers (as defined herein), (3) each of our directors and director nominees, and (4) all of our executive officers and directors as a group. Unless otherwise indicated, each of the persons below has sole voting and investment power with respect to the shares beneficially owned by such person.
Name and Address of Beneficial Owner(1) | Amount and Nature of Beneficial Ownership(2) | Percent of Class(3) | |||
Franklin Resources, Inc.(4)(6) | 7,209,575 | 36.1% | |||
MacKay Shields LLC(5)(6) | 3,920,351 | 19.6% | |||
BlackRock, Inc.(7) | 1,169,823 | 5.8% | |||
James M. Trimble | — | * | |||
David H. Welch | 63,414 | * | |||
Kenneth H. Beer | 17,123 | * | |||
Keith A. Seilhan | 4,967 | * | |||
Lisa S. Jaubert | 4,375 | * | |||
Thomas L. Messonnier | 2,896 | * | |||
Richard L. Toothman, Jr. | 4,968 | * | |||
Neal P. Goldman | — | * | |||
John “Brad” Juneau | — | * | |||
David I. Rainey | — | * | |||
Charles M. Sledge | — | * | |||
David N. Weinstein | — | * | |||
Executive officers and directors as a group (consisting of 11 persons) | 34,195 | * | |||
* | Less than 1%. |
(1) | Unless otherwise noted, the address for each beneficial owner is c/o Stone Energy Corporation, 625 E. Kaliste Saloom Road, Lafayette, Louisiana 70508. |
(2) | Under the regulations of the SEC, shares are deemed to be “beneficially owned” by a person if he or she directly or indirectly has or shares the power to vote or dispose of, or to direct the voting or disposition of, such shares, whether or not he or she has any pecuniary interest in such shares, or if he or she has the right to acquire the power to vote or dispose of such shares within 60 days, including any right to acquire such power through the exercise of any option, warrant or right. |
The shares beneficially owned by (a) Mr. Beer include 13,472 shares, (b) Mr. Seilhan include 3,938 shares, (c) Ms. Jaubert include 3,485 shares, (d) Mr. Messonnier include 2,277 shares and (c) the executive officers and directors as a group include 29,965 shares, that may be acquired by such persons within 60 days through the exercise of warrants.
The shares beneficially owned by Messrs. Welch and Toothman include 49,948 shares and 3,929 shares, respectively, that may be acquired by such persons within 60 days through the exercise of warrants. Shares beneficially owned by Mr. Welch and Mr. Toothman are not included in the shares reflected in the table above for the executive officers and directors as a group, as neither was employed by the Company on March 7, 2018.
The table does not include outstanding restricted stock units held by our directors, for which a maximum of 62,137 shares of Stone common stock will be issued upon vesting.
(3) | Based on total shares issued and outstanding of 19,998,701 as of March 7, 2018. |
94
(4) | Franklin Resources, Inc.’s (“FRI”) address is One Franklin Parkway, San Mateo, CA 94403. The number of shares held is based on information included in a Schedule 13G/A filed on January 29, 2018 by Franklin Resources, Inc., Charles B. Johnson, Rupert H. Johnson, Jr. and Franklin Advisers, Inc. According to the Schedule 13G/A, the shares reported are beneficially owned by one or more open- or closed-end investment companies or other managed accounts that are investment management clients of investment managers that are direct and indirect subsidiaries of FRI. FRI has sole voting and sole dispositive power as to 7,209,575 shares. |
(5) | MacKay Shields LLC’s address is 1345 Avenue of the Americas, New York, NY 10105. The number of shares held is based on information included in a Schedule 13G/A filed on January 11, 2018. According to the Schedule 13G/A, in its role as an investment adviser, MacKay Shields has sole voting power and sole dispositive power as to 3,920,351 shares. The MainStay High Yield Corporate Bond Fund, a registered investment company for which MacKay Shields acts as sub-investment adviser, may be deemed to beneficially own 10.37% of the outstanding common stock of the Company. |
(6) | In connection with the Transaction Agreement, each of Franklin and MacKay Shields entered into a voting agreement (the “Voting Agreements”) with Talos and Stone with respect to the Transaction Agreement. Talos does not own any shares of Stone common stock, but because of Franklin and MacKay’s obligations under the Voting Agreements, Talos may be deemed to have shared voting power to vote up to an aggregate of 10,563,263 shares of Stone common stock in favor of the adoption of the Transaction Agreement and the approval of the Transactions and the other transactions contemplated by the Transaction Agreement. Thus, for purposes of Rule 13d-3 of the Exchange Act, Talos may be deemed to be the beneficial owner of an aggregate of 10,563,263 shares of Stone common stock. The number of shares is based on information included in a Schedule 13D filed on December 1, 2017. |
(7) | BlackRock, Inc.’s address is 55 East 52nd Street, New York, NY 10055. The number of shares held is based on information included in a Schedule 13G filed on January 31, 2018. According to the Schedule 13G, BlackRock, Inc. is an institutional investment management firm, and it has sole voting power as to 1,126,049 shares and sole dispositive power as to 1,169,823 shares. |
Equity Compensation Plan Information
Upon emergence from bankruptcy, all shares of Predecessor outstanding, unvested restricted stock held by the Company’s executives were cancelled and exchanged for a proportionate share of the 5% of New Common Stock. Vesting continued in accordance with the applicable vesting provisions of the original awards. At December 31, 2017, there were 1,093 shares of unvested restricted stock. These restricted shares were originally granted under the 2009 Stock Incentive Plan, which was the predecessor to the 2017 LTIP. The 1,093 restricted shares became fully vested on January 15, 2018. All outstanding stock options under the 2009 Stock Incentive Plan were cancelled upon emergence from bankruptcy.
As required by applicable SEC rules, the following table provides information regarding our 2017 LTIP, which is the only equity plan under which we were able to grant equity awards as of December 31, 2017.
Plan category | Number of securities to be issued upon exercise of outstanding options, warrants and rights(a) | Weighted- average exercise price of outstanding options, warrants and rights(b) | Number of securities remaining available for future issuance under equity compensation plans (excluding securities reflected in column(a))(c) | |||||||
Equity compensation plans approved by security holders | — | $ | — | — | ||||||
Equity compensation plans not approved by security holders (1) | 62,137 | — | 2,552,242 | |||||||
Total | 62,137 | $ | — | 2,552,242 | ||||||
(1) | The 2017 LTIP was adopted in connection with our reorganization and emergence from bankruptcy on February 28, 2017 and was approved by the Bankruptcy Court. |
95
ITEM 13. CERTAIN RELATIONSHIPS AND RELATED TRANSACTIONS, AND DIRECTOR INDEPENDENCE
Policies and Procedures
The Nominating & Governance Committee Charter provides that the Nominating & Governance Committee periodically reviews all transactions with related persons that would require disclosure under Item 404(a) of Regulation S-K (each, a “Related Person Transaction”) and makes a recommendation to the Board regarding the initial authorization or ratification of any such transaction. In accordance with such policies and procedures, each executive officer and director must complete a directors and officers questionnaire each year that solicits information concerning transactions with related persons. Additionally, at least quarterly, the Nominating & Governance Committee asks each director whether any issues have arisen concerning independence, transactions with related persons or conflicts of interest. To the extent that a transaction or a possible transaction with a related person exists, the Nominating & Governance Committee determines whether the transaction should be approved or ratified and makes its recommendation to the Board. In determining whether or not to recommend the initial approval or ratification of a Related Person Transaction, the Nominating & Governance Committee considers all of the relevant facts and circumstances available to the committee, including (if applicable) but not limited to:
• | whether there is an appropriate business justification for the transaction; |
• | the benefits that accrue to Stone as a result of the transaction; |
• | the terms available to unrelated third parties entering into similar transactions; |
• | the impact of the transaction on a director’s independence (in the event the related person is a director, an immediate family member of a director or an entity in which a director is a partner, stockholder or executive officer); |
• | the availability of other sources for comparable products or services; |
• | whether it is a single transaction or a series of ongoing, related transactions; and |
• | whether entering into the transaction would be consistent with our Code of Business Conduct and Ethics. |
In the event that the Board considers ratification of a Related Person Transaction and determines not to so ratify, management makes all reasonable efforts to cancel or annul such transaction.
Related Party Transactions
There were no related party transactions for the year ended December 31, 2017.
Director Independence Determinations
Our Corporate Governance Guidelines provide that a majority of our Board will consist of independent directors. Only directors who have been determined to be independent serve on our Audit Committee, Compensation Committee, Nominating & Governance Committee, Reserves Committee and Safety Committee.
Rather than adopting categorical standards, the Board assesses director independence on a case-by-case basis, in each case consistent with applicable legal requirements and the independence standards adopted by the NYSE. None of the non-management directors were disqualified from “independent” status under the objective NYSE listing standards. Based on information provided by the directors and after reviewing all relationships each director has with Stone, including charitable contributions we make to organizations where our directors serve as board members, the Board has affirmatively determined that none of its non-management directors have a material relationship with Stone and therefore each is independent as defined by the current listing standards of the NYSE. In making its independence determinations, the Board took into account the relationships and recommendations of the Nominating & Governance Committee as described above. Mr. Trimble, our Interim Chief Executive Officer and President, is not considered by the Board to be an independent director because of his employment with us.
ITEM 14. PRINCIPAL ACCOUNTING FEES AND SERVICES
Preapproval Policies and Procedures
The Audit Committee has the sole authority to appoint or replace the independent registered public accounting firm (subject, if applicable, to stockholder ratification), and approves all audit and non-audit engagement fees and terms with the independent registered public accounting firm. The Audit Committee has established policies and procedures regarding pre-approval of all services provided by the independent registered public accounting firm. At the beginning of the fiscal year, the Audit Committee pre-approves the engagement of the independent registered public accounting firm to provide audit services based on fee estimates. The Audit Committee also pre-approves proposed audit-related services, tax services and other permissible services, based on specified project and service details, fee estimates, and aggregate fee limits for each service category. The Audit Committee pre-
96
approved all services provided by the independent registered public accounting firm in fiscal 2017. The Audit Committee receives a report at each meeting on the status of services provided or to be provided by the independent registered public accounting firm and the related fees.
Fees paid to Independent Accounting Firm
Ernst & Young LLP has served as our independent registered public accounting firm and audited our consolidated financial statements beginning with the fiscal year ended December 31, 2002. We are advised that no member of Ernst & Young LLP has any direct or material indirect financial interest in Stone or, during the past three years, has had any connection with us in the capacity of promoter, underwriter, voting trustee, director, officer or employee. Set forth below are the aggregate fees billed by Ernst & Young LLP, the independent registered public accounting firm, for each of the last two fiscal years:
2016 | 2017 | ||||||
Audit Fees(1) | $ | 640,000 | $ | 947,500 | |||
Audit-Related Fees | — | — | |||||
Tax Fees(2) | 419,834 | 228,314 | |||||
All Other Fees | — | — | |||||
Total | $ | 1,059,834 | $ | 1,175,814 | |||
(1) | Audit Fees represent the aggregate fees billed for professional services provided in connection with the audit of our financial statements and internal control over financial reporting, review of our quarterly financial statements and audit services provided in connection with other statutory or regulatory filings. |
(2) | Tax Fees represent the aggregate fees billed for professional services provided in connection with tax return preparation and review and tax consulting. |
97
PART IV
ITEM 15. EXHIBITS, FINANCIAL STATEMENT SCHEDULES
(a) 1. Financial Statements:
The following consolidated financial statements, notes to the consolidated financial statements and the Report of Independent Registered Public Accounting Firm thereon are included beginning on page F-1 of this Form 10-K:
• | Report of Independent Registered Public Accounting Firm |
• | Consolidated Balance Sheet as of December 31, 2017 and 2016 |
• | Consolidated Statement of Operations for the Period from March 1, 2017 through December 31, 2017, the Period from January 1, 2017 through February 28, 2017 and the Years Ended December 31, 2016 and 2015 |
• | Consolidated Statement of Comprehensive Income (Loss) for the Period from March 1, 2017 through December 31, 2017, the Period from January 1, 2017 through February 28, 2017 and the Years Ended December 31, 2016 and 2015 |
• | Consolidated Statement of Cash Flows for the Period from March 1, 2017 through December 31, 2017, the Period from January 1, 2017 through February 28, 2017 and the Years Ended December 31, 2016 and 2015 |
• | Consolidated Statement of Changes in Stockholders’ Equity for the Period from March 1, 2017 through December 31, 2017, the Period from January 1, 2017 through February 28, 2017 and the Years Ended December 31, 2016 and 2015 |
• | Notes to the Consolidated Financial Statements |
2. Financial Statement Schedules:
All schedules are omitted because the required information is inapplicable or the information is presented in the consolidated financial statements or the notes thereto.
3. Exhibits:
2.1 | ||
**2.2 | ||
**2.3 | ||
3.1 | ||
3.2 | ||
4.1 | ||
4.2 | ||
10.1 | ||
10.2 | ||
98
10.3 | ||
10.4 | ||
10.5 | ||
10.6 | ||
10.7 | ||
10.8 | ||
10.9 | ||
†10.10 | ||
†10.11 | ||
†10.12 | ||
†10.13 | ||
†10.14 | ||
*†10.15 | ||
*†10.16 | ||
†10.17 | ||
†10.18 | ||
*†10.19 | ||
†10.20 | ||
99
†10.21 | ||
†10.22 | ||
†10.23 | ||
*†10.24 | ||
*†10.25 | ||
10.26 | ||
*21.1 | ||
*23.1 | ||
*23.2 | ||
*31.1 | ||
*31.2 | ||
*#32.1 | ||
99.1 | ||
*99.2 | ||
*101.INS | XBRL Instance Document | |
*101.SCH | XBRL Taxonomy Extension Schema Document | |
*101.CAL | XBRL Taxonomy Extension Calculation Linkbase Document | |
*101.DEF | XBRL Taxonomy Extension Definition Linkbase Document | |
*101.LAB | XBRL Taxonomy Extension Label Linkbase Document | |
*101.PRE | XBRL Taxonomy Extension Presentation Linkbase Document | |
_________________
* | Filed or furnished herewith |
# | Not considered to be “filed” for the purposes of Section 18 of the Securities Exchange Act of 1934 or otherwise subject to the liabilities of that section |
† | Identifies management contracts and compensatory plans or arrangements |
** | Certain schedules, annexes and exhibits have been omitted pursuant to Item 601(b)(2) of Regulation S-K. The Company agrees to furnish supplementally a copy of such schedules, annexes and exhibits, or any section thereof, to the SEC upon request. |
100
ITEM 16. FORM 10-K SUMMARY
None.
101
SIGNATURES
Pursuant to the requirements of Section 13 or 15(d) of the Securities Exchange Act of 1934, the registrant has duly caused this report to be signed on its behalf by the undersigned, thereunto duly authorized.
STONE ENERGY CORPORATION | ||||
Date: | March 9, 2018 | By: /s/ James M. Trimble | ||
James M. Trimble | ||||
Interim Chief Executive Officer | ||||
and President | ||||
Pursuant to the requirements of the Securities Exchange Act of 1934, this report has been signed below by the following persons on behalf of the registrant and in the capacities and on the dates indicated.
Signature | Title | Date | ||
/s/ James M. Trimble | Interim Chief Executive Officer, President and Director (principal executive officer) | March 9, 2018 | ||
James M. Trimble | ||||
/s/ Kenneth H. Beer | Executive Vice President and Chief Financial Officer (principal financial officer) | March 9, 2018 | ||
Kenneth H. Beer | ||||
/s/ Karl D. Meche | Director of Accounting and Treasurer (principal accounting officer) | March 9, 2018 | ||
Karl D. Meche | ||||
/s/ Neal P. Goldman | Chairman | March 9, 2018 | ||
Neal P. Goldman | ||||
/s/ John “Brad” Juneau | Director | March 9, 2018 | ||
John “Brad” Juneau | ||||
/s/ David I. Rainey | Director | March 9, 2018 | ||
David I. Rainey | ||||
/s/ Charles M. Sledge | Director | March 9, 2018 | ||
Charles M. Sledge | ||||
/s/ David N. Weinstein | Director | March 9, 2018 | ||
David N. Weinstein | ||||
102
INDEX TO FINANCIAL STATEMENTS
F-1
REPORT OF INDEPENDENT REGISTERED PUBLIC ACCOUNTING FIRM
The Stockholders and Board of Directors
Stone Energy Corporation
Opinion on the Financial Statements
We have audited the accompanying consolidated balance sheets of Stone Energy Corporation (the Company) as of December 31, 2017 (Successor) and 2016 (Predecessor), the related consolidated statements of operations, comprehensive income (loss), changes in stockholders’ equity and cash flows for the period March 1, 2017 through December 31, 2017 (Successor), the period January 1, 2017 through February 28, 2017 (Predecessor), and the years ended December 31, 2016 and 2015 (Predecessor), and the related notes (collectively referred to as the “consolidated financial statements”). In our opinion, the consolidated financial statements present fairly, in all material respects, the financial position of the Company at December 31, 2017 (Successor) and 2016 (Predecessor), and the results of its operations and its cash flows for the period March 1, 2017 through December 31, 2017 (Successor), the period January 1, 2017 through February 28, 2017 (Predecessor), and the years ended December 31, 2016 and 2015 (Predecessor), in conformity with U.S. generally accepted accounting principles.
We also have audited, in accordance with the standards of the Public Company Accounting Oversight Board (United States) (PCAOB), the Company's internal control over financial reporting as of December 31, 2017, based on criteria established in Internal Control-Integrated Framework issued by the Committee of Sponsoring Organizations of the Treadway Commission (2013 framework) and our report dated March 9, 2018 expressed an unqualified opinion thereon.
Company Reorganization
As discussed in Note 1 to the consolidated financial statements, on February 15, 2017, the Bankruptcy Court entered an order confirming the plan of reorganization, which became effective on February 28, 2017. Accordingly, the accompanying consolidated financial statements have been prepared in conformity with Accounting Standards Codification 852-10, Reorganizations, for the Successor as a new entity with assets, liabilities and a capital structure having carrying amounts not comparable with prior periods as described in Note 1.
Basis for Opinion
These financial statements are the responsibility of the Company's management. Our responsibility is to express an opinion on the Company’s financial statements based on our audits. We are a public accounting firm registered with the PCAOB and are required to be independent with respect to the Company in accordance with the U.S. federal securities laws and the applicable rules and regulations of the Securities and Exchange Commission and the PCAOB.
We conducted our audits in accordance with the standards of the PCAOB. Those standards require that we plan and perform the audit to obtain reasonable assurance about whether the financial statements are free of material misstatement, whether due to error or fraud. Our audits included performing procedures to assess the risks of material misstatement of the financial statements, whether due to error or fraud, and performing procedures that respond to those risks. Such procedures included examining, on a test basis, evidence regarding the amounts and disclosures in the financial statements. Our audits also included evaluating the accounting principles used and significant estimates made by management, as well as evaluating the overall presentation of the financial statements. We believe that our audits provide a reasonable basis for our opinion.
/s/ Ernst & Young LLP
We have served as the Company’s auditor since 2002.
New Orleans, Louisiana
March 9, 2018
F-2
STONE ENERGY CORPORATION
CONSOLIDATED BALANCE SHEET
(In thousands of dollars)
Successor | Predecessor | |||||||
December 31, | December 31, | |||||||
Assets | 2017 | 2016 | ||||||
Current assets: | ||||||||
Cash and cash equivalents | $ | 263,495 | $ | 190,581 | ||||
Restricted cash | 18,742 | — | ||||||
Accounts receivable | 39,258 | 48,464 | ||||||
Fair value of derivative contracts | 879 | — | ||||||
Current income tax receivable | 36,260 | 26,086 | ||||||
Other current assets | 7,138 | 10,151 | ||||||
Total current assets | 365,772 | 275,282 | ||||||
Oil and gas properties, full cost method of accounting: | ||||||||
Proved | 713,157 | 9,616,236 | ||||||
Less: accumulated depreciation, depletion and amortization | (353,462 | ) | (9,178,442 | ) | ||||
Net proved oil and gas properties | 359,695 | 437,794 | ||||||
Unevaluated | 102,187 | 373,720 | ||||||
Other property and equipment, net of accumulated depreciation of $2,561 and $27,418, respectively | 17,275 | 26,213 | ||||||
Other assets, net of accumulated depreciation and amortization of $5,360 at December 31, 2016 | 13,844 | 26,474 | ||||||
Total assets | $ | 858,773 | $ | 1,139,483 | ||||
Liabilities and Stockholders’ Equity | ||||||||
Current liabilities: | ||||||||
Accounts payable to vendors | $ | 54,226 | $ | 19,981 | ||||
Undistributed oil and gas proceeds | 5,142 | 15,073 | ||||||
Accrued interest | 1,685 | 809 | ||||||
Fair value of derivative contracts | 8,969 | — | ||||||
Asset retirement obligations | 79,300 | 88,000 | ||||||
Current portion of long-term debt | 425 | 408 | ||||||
Other current liabilities | 22,579 | 18,602 | ||||||
Total current liabilities | 172,326 | 142,873 | ||||||
Long-term debt | 235,502 | 352,376 | ||||||
Asset retirement obligations | 133,801 | 154,019 | ||||||
Fair value of derivative contracts | 3,085 | — | ||||||
Other long-term liabilities | 5,891 | 17,315 | ||||||
Total liabilities not subject to compromise | 550,605 | 666,583 | ||||||
Liabilities subject to compromise | — | 1,110,182 | ||||||
Total liabilities | 550,605 | 1,776,765 | ||||||
Commitments and contingencies | ||||||||
Stockholders’ equity: | ||||||||
Predecessor common stock ($.01 par value; authorized 30,000,000 shares; issued 5,610,020 shares) | — | 56 | ||||||
Predecessor treasury stock (1,658 shares, at cost) | — | (860 | ) | |||||
Predecessor additional paid-in capital | — | 1,659,731 | ||||||
Successor common stock ($.01 par value; authorized 60,000,000 shares; issued 19,998,019 shares) | 200 | — | ||||||
Successor additional paid-in capital | 555,607 | — | ||||||
Accumulated deficit | (247,639 | ) | (2,296,209 | ) | ||||
Total stockholders’ equity | 308,168 | (637,282 | ) | |||||
Total liabilities and stockholders’ equity | $ | 858,773 | $ | 1,139,483 | ||||
The accompanying notes are an integral part of this balance sheet.
F-3
STONE ENERGY CORPORATION
CONSOLIDATED STATEMENT OF OPERATIONS
(In thousands, except per share amounts)
Successor | Predecessor | |||||||||||||||
Period from March 1, 2017 through December 31, 2017 | Period from January 1, 2017 through February 28, 2017 | Year Ended December 31, | ||||||||||||||
2016 | 2015 | |||||||||||||||
Operating revenue: | ||||||||||||||||
Oil production | $ | 211,792 | $ | 45,837 | $ | 281,246 | $ | 416,497 | ||||||||
Natural gas production | 18,874 | 13,476 | 64,601 | 83,509 | ||||||||||||
Natural gas liquids production | 9,610 | 8,706 | 28,888 | 32,322 | ||||||||||||
Other operational income | 10,008 | 903 | 2,657 | 4,369 | ||||||||||||
Derivative income, net | — | — | — | 7,952 | ||||||||||||
Total operating revenue | 250,284 | 68,922 | 377,392 | 544,649 | ||||||||||||
Operating expenses: | ||||||||||||||||
Lease operating expenses | 49,800 | 8,820 | 79,650 | 100,139 | ||||||||||||
Transportation, processing and gathering expenses | 4,084 | 6,933 | 27,760 | 58,847 | ||||||||||||
Production taxes | 629 | 682 | 3,148 | 6,877 | ||||||||||||
Depreciation, depletion and amortization | 99,890 | 37,429 | 220,079 | 281,688 | ||||||||||||
Write-down of oil and gas properties | 256,435 | — | 357,431 | 1,362,447 | ||||||||||||
Accretion expense | 21,151 | 5,447 | 40,229 | 25,988 | ||||||||||||
Salaries, general and administrative expenses | 47,817 | 9,629 | 58,928 | 69,384 | ||||||||||||
Incentive compensation expense | 8,045 | 2,008 | 13,475 | 2,242 | ||||||||||||
Restructuring fees | 739 | — | 29,597 | — | ||||||||||||
Other operational expenses | 3,359 | 530 | 55,453 | 2,360 | ||||||||||||
Derivative expense, net | 13,388 | 1,778 | 810 | — | ||||||||||||
Total operating expenses | 505,337 | 73,256 | 886,560 | 1,909,972 | ||||||||||||
Gain (loss) on Appalachia Properties divestiture | (105 | ) | 213,453 | — | — | |||||||||||
Income (loss) from operations | (255,158 | ) | 209,119 | (509,168 | ) | (1,365,323 | ) | |||||||||
Other (income) expense: | ||||||||||||||||
Interest expense | 11,744 | — | 64,458 | 43,928 | ||||||||||||
Interest income | (998 | ) | (45 | ) | (550 | ) | (580 | ) | ||||||||
Other income | (1,156 | ) | (315 | ) | (1,439 | ) | (1,783 | ) | ||||||||
Other expense | 1,230 | 13,336 | 596 | 434 | ||||||||||||
Reorganization items, net | — | (437,744 | ) | 10,947 | — | |||||||||||
Total other (income) expense | 10,820 | (424,768 | ) | 74,012 | 41,999 | |||||||||||
Income (loss) before income taxes | (265,978 | ) | 633,887 | (583,180 | ) | (1,407,322 | ) | |||||||||
Provision (benefit) for income taxes: | ||||||||||||||||
Current | (18,339 | ) | 3,570 | (5,674 | ) | (44,096 | ) | |||||||||
Deferred | — | — | 13,080 | (272,311 | ) | |||||||||||
Total income taxes | (18,339 | ) | 3,570 | 7,406 | (316,407 | ) | ||||||||||
Net income (loss) | $ | (247,639 | ) | $ | 630,317 | $ | (590,586 | ) | $ | (1,090,915 | ) | |||||
Basic income (loss) per share | $ | (12.38 | ) | $ | 110.99 | $ | (105.63 | ) | $ | (197.45 | ) | |||||
Diluted income (loss) per share | $ | (12.38 | ) | $ | 110.99 | $ | (105.63 | ) | $ | (197.45 | ) | |||||
Average shares outstanding | 19,997 | 5,634 | 5,591 | 5,525 | ||||||||||||
Average shares outstanding assuming dilution | 19,997 | 5,634 | 5,591 | 5,525 | ||||||||||||
The accompanying notes are an integral part of this statement.
F-4
STONE ENERGY CORPORATION
CONSOLIDATED STATEMENT OF COMPREHENSIVE INCOME (LOSS)
(In thousands)
Successor | Predecessor | |||||||||||||||
Period from March 1, 2017 through December 31, 2017 | Period from January 1, 2017 through February 28, 2017 | Year Ended December 31, | ||||||||||||||
2016 | 2015 | |||||||||||||||
Net income (loss) | $ | (247,639 | ) | $ | 630,317 | $ | (590,586 | ) | $ | (1,090,915 | ) | |||||
Other comprehensive income (loss), net of tax effect: | ||||||||||||||||
Derivatives | — | — | (24,025 | ) | (62,758 | ) | ||||||||||
Foreign currency translation | — | — | 6,073 | (2,605 | ) | |||||||||||
Comprehensive income (loss) | $ | (247,639 | ) | $ | 630,317 | $ | (608,538 | ) | $ | (1,156,278 | ) | |||||
The accompanying notes are an integral part of this statement.
F-5
STONE ENERGY CORPORATION
CONSOLIDATED STATEMENT OF CHANGES IN STOCKHOLDERS’ EQUITY
(In thousands)
Common Stock | Treasury Stock | Additional Paid-In Capital | Accumulated Deficit | Accumulated Other Comprehensive Income (Loss) | Total Stockholders’ Equity | ||||||||||||||||||
Balance, December 31, 2014 (Predecessor) | $ | 55 | $ | (860 | ) | $ | 1,633,801 | $ | (614,708 | ) | $ | 83,315 | $ | 1,101,603 | |||||||||
Net loss | — | — | — | (1,090,915 | ) | — | (1,090,915 | ) | |||||||||||||||
Adjustment for fair value accounting of derivatives, net of tax | — | — | — | — | (62,758 | ) | (62,758 | ) | |||||||||||||||
Adjustment for foreign currency translation, net of tax | — | — | — | — | (2,605 | ) | (2,605 | ) | |||||||||||||||
Lapsing of forfeiture restrictions of restricted stock | — | — | (2,638 | ) | — | — | (2,638 | ) | |||||||||||||||
Amortization of stock compensation expense | — | — | 17,524 | — | — | 17,524 | |||||||||||||||||
Balance, December 31, 2015 (Predecessor) | 55 | (860 | ) | 1,648,687 | (1,705,623 | ) | 17,952 | (39,789 | ) | ||||||||||||||
Net loss | — | — | — | (590,586 | ) | — | (590,586 | ) | |||||||||||||||
Adjustment for fair value accounting of derivatives, net of tax | — | — | — | — | (24,025 | ) | (24,025 | ) | |||||||||||||||
Adjustment for foreign currency translation, net of tax | — | — | — | — | 6,073 | 6,073 | |||||||||||||||||
Lapsing of forfeiture restrictions of restricted stock and granting of stock awards | 1 | — | (732 | ) | — | — | (731 | ) | |||||||||||||||
Amortization of stock compensation expense | — | — | 11,776 | — | — | 11,776 | |||||||||||||||||
Balance, December 31, 2016 (Predecessor) | 56 | (860 | ) | 1,659,731 | (2,296,209 | ) | — | (637,282 | ) | ||||||||||||||
Net income | — | — | — | 630,317 | — | 630,317 | |||||||||||||||||
Lapsing of forfeiture restrictions of restricted stock and granting of stock awards | — | — | (172 | ) | — | — | (172 | ) | |||||||||||||||
Amortization of stock compensation expense | — | — | 3,527 | — | — | 3,527 | |||||||||||||||||
Balance, February 28, 2017 (Predecessor) | 56 | (860 | ) | 1,663,086 | (1,665,892 | ) | — | (3,610 | ) | ||||||||||||||
Cancellation of Predecessor equity | (56 | ) | 860 | (1,663,086 | ) | 1,665,892 | — | 3,610 | |||||||||||||||
Balance, February 28, 2017 (Predecessor) | — | — | — | — | — | — | |||||||||||||||||
Issuance of Successor common stock and warrants | 200 | — | 554,537 | — | — | 554,737 | |||||||||||||||||
Balance, February 28, 2017 (Successor) | 200 | — | 554,537 | — | — | 554,737 | |||||||||||||||||
Net loss | — | — | — | (247,639 | ) | — | (247,639 | ) | |||||||||||||||
Lapsing of forfeiture restrictions of restricted stock | — | — | (19 | ) | — | — | (19 | ) | |||||||||||||||
Amortization of stock compensation expense | — | — | 1,272 | — | — | 1,272 | |||||||||||||||||
Stock issuance costs - Talos combination | — | — | (183 | ) | — | (183 | ) | ||||||||||||||||
Balance, December 31, 2017 (Successor) | $ | 200 | $ | — | $ | 555,607 | $ | (247,639 | ) | $ | — | $ | 308,168 | ||||||||||
The accompanying notes are an integral part of this statement.
F-6
STONE ENERGY CORPORATION
CONSOLIDATED STATEMENT OF CASH FLOWS
(In thousands)
Successor | Predecessor | |||||||||||||||
Period from March 1, 2017 through December 31, 2017 | Period from Jan. 1, 2017 through Feb. 28, 2017 | Year Ended December 31, | ||||||||||||||
2016 | 2015 | |||||||||||||||
Cash flows from operating activities: | ||||||||||||||||
Net income (loss) | $ | (247,639 | ) | $ | 630,317 | $ | (590,586 | ) | $ | (1,090,915 | ) | |||||
Adjustments to reconcile net income (loss) to net cash provided by operating activities: | ||||||||||||||||
Depreciation, depletion and amortization | 99,890 | 37,429 | 220,079 | 281,688 | ||||||||||||
Write-down of oil and gas properties | 256,435 | — | 357,431 | 1,362,447 | ||||||||||||
Accretion expense | 21,151 | 5,447 | 40,229 | 25,988 | ||||||||||||
Deferred income tax provision (benefit) | — | — | 13,080 | (272,311 | ) | |||||||||||
(Gain) loss on sale of oil and gas properties | 105 | (213,453 | ) | — | — | |||||||||||
Settlement of asset retirement obligations | (80,671 | ) | (3,641 | ) | (20,514 | ) | (72,382 | ) | ||||||||
Non-cash stock compensation expense | 1,252 | 2,645 | 8,443 | 12,324 | ||||||||||||
Excess tax benefits | — | — | — | (1,586 | ) | |||||||||||
Non-cash derivative expense | 15,548 | 1,778 | 1,471 | 16,440 | ||||||||||||
Non-cash interest expense | 4 | — | 18,404 | 17,788 | ||||||||||||
Non-cash reorganization items | — | (458,677 | ) | 8,332 | — | |||||||||||
Other non-cash expense | 1,245 | 172 | 6,248 | — | ||||||||||||
Change in current income taxes | (13,744 | ) | 3,570 | 20,088 | (37,377 | ) | ||||||||||
(Increase) decrease in accounts receivable | 2,455 | 6,354 | (1,412 | ) | 43,724 | |||||||||||
(Increase) decrease in other current assets | 4,648 | (2,274 | ) | (3,493 | ) | 1,767 | ||||||||||
Decrease in inventory | — | — | — | 1,304 | ||||||||||||
Increase (decrease) in accounts payable | 17,113 | (4,652 | ) | 1,026 | (14,582 | ) | ||||||||||
Increase (decrease) in other current liabilities | 10,677 | (9,653 | ) | 9,897 | (25,936 | ) | ||||||||||
Investment in derivative contracts | (2,416 | ) | (3,736 | ) | — | — | ||||||||||
Other | 3,023 | 2,490 | (10,135 | ) | (907 | ) | ||||||||||
Net cash provided by (used in) operating activities | 89,076 | (5,884 | ) | 78,588 | 247,474 | |||||||||||
Cash flows from investing activities: | ||||||||||||||||
Investment in oil and gas properties | (65,282 | ) | (8,754 | ) | (237,952 | ) | (522,047 | ) | ||||||||
Proceeds from sale of oil and gas properties, net of expenses | 20,633 | 505,383 | — | 22,839 | ||||||||||||
Investment in fixed and other assets | (163 | ) | (61 | ) | (1,266 | ) | (1,549 | ) | ||||||||
Change in restricted funds | 56,805 | (75,547 | ) | 1,046 | 179,467 | |||||||||||
Net cash provided by (used in) investing activities | 11,993 | 421,021 | (238,172 | ) | (321,290 | ) | ||||||||||
Cash flows from financing activities: | ||||||||||||||||
Proceeds from bank borrowings | — | — | 477,000 | 5,000 | ||||||||||||
Repayments of bank borrowings | — | (341,500 | ) | (135,500 | ) | (5,000 | ) | |||||||||
Proceeds from building loan | — | — | — | 11,770 | ||||||||||||
Repayments of building loan | (337 | ) | (24 | ) | (423 | ) | — | |||||||||
Cash payment to noteholders | — | (100,000 | ) | — | — | |||||||||||
Stock issuance costs - Talos combination | (184 | ) | — | — | — | |||||||||||
Debt issuance costs | — | (1,055 | ) | (900 | ) | (68 | ) | |||||||||
Excess tax benefits | — | — | — | 1,586 | ||||||||||||
Net payments for share-based compensation | (19 | ) | (173 | ) | (762 | ) | (3,127 | ) | ||||||||
Net cash provided by (used in) financing activities | (540 | ) | (442,752 | ) | 339,415 | 10,161 | ||||||||||
Effect of exchange rate changes on cash | — | — | (9 | ) | (74 | ) | ||||||||||
Net change in cash and cash equivalents | 100,529 | (27,615 | ) | 179,822 | (63,729 | ) | ||||||||||
Cash and cash equivalents, beginning of period | 162,966 | 190,581 | 10,759 | 74,488 | ||||||||||||
Cash and cash equivalents, end of period | $ | 263,495 | $ | 162,966 | $ | 190,581 | $ | 10,759 | ||||||||
Supplemental cash flow information: | ||||||||||||||||
Cash paid for interest, net of amount capitalized | $ | (10,256 | ) | — | $ | (32,130 | ) | $ | (34,394 | ) | ||||||
Cash refunded for income taxes, net of amounts paid | 5,420 | — | 25,762 | 7,212 | ||||||||||||
The accompanying notes are an integral part of this statement.
F-7
STONE ENERGY CORPORATION
NOTES TO CONSOLIDATED FINANCIAL STATEMENTS
NOTE 1 — ORGANIZATION AND SUMMARY OF SIGNIFICANT ACCOUNTING POLICIES
Nature of Operations
Stone Energy Corporation (“Stone” or the “Company”) is an independent oil and natural gas company engaged in the acquisition, exploration, exploitation, development and operation of oil and gas properties. We have been operating in the Gulf of Mexico (the “GOM”) Basin since our incorporation in 1993 and have established technical and operational expertise in this area. We leveraged our experience in the GOM conventional shelf and expanded our reserve base into the more prolific plays of the GOM deep water, Gulf Coast deep gas and the Marcellus and Utica shales in Appalachia. At December 31, 2016, we had producing properties and acreage in the Marcellus and Utica Shales in Appalachia. In connection with our restructuring efforts, we completed the sale of the Appalachia Properties (as defined in Note 2 – Reorganization) to EQT Corporation, through its wholly owned subsidiary EQT Production Company (“EQT”), on February 27, 2017 for net cash consideration of approximately $522.5 million. See Note 2 – Reorganization and Note 4 – Divestiture for additional information on the sale of the Appalachia Properties. We were incorporated in 1993 as a Delaware corporation. Our corporate headquarters are located at 625 E. Kaliste Saloom Road, Lafayette, Louisiana 70508. We have an additional office in New Orleans, Louisiana.
Pending Combination with Talos
On November 21, 2017, Stone and certain of its subsidiaries entered into a series of related agreements pertaining to a business combination with Talos Energy LLC (“Talos Energy”) and its indirect wholly owned subsidiary Talos Production LLC (“Talos Production” and, together with Talos Energy, “Talos”). Talos Energy is controlled indirectly by entities controlled by Apollo Management VII, L.P. (“Apollo VII”), Apollo Commodities Management, L.P., with respect to Series I (together with Apollo VII, “Apollo Management”) and Riverstone Energy Partners V, L.P. (“Riverstone”).
Stone, Sailfish Energy Holdings Corporation (“New Talos”), a direct wholly owned subsidiary of Stone, and Sailfish Merger Sub Corporation, a direct wholly owned subsidiary of New Talos, entered into a Transaction Agreement (the “Transaction Agreement”) with Talos on November 21, 2017, which contemplates a series of transactions (the “Transactions”) occurring on the date of closing of the Transaction Agreement (the “Closing”) that will result in such business combination. Stone and Talos will become wholly owned subsidiaries of New Talos. At the time of the Closing, the parties intend that New Talos will become a publicly traded entity named Talos Energy, Inc. The Transactions include (i) the contribution of 100% of the equity interests in Talos Production to New Talos in exchange for shares of New Talos common stock, (ii) the contribution by entities controlled by or affiliated with Apollo Management (the “Apollo Funds”) and Riverstone (the “Riverstone Funds”) of $102 million in aggregate principal amount of 9.75% Senior Notes due 2022 issued by Talos Production and Talos Production Finance Inc. (together, the “the Talos Issuers”) to New Talos in exchange for shares of New Talos common stock, (iii) the exchange of the second lien bridge loans due 2022 issued by the Talos Issuers for newly issued 11% second lien notes issued by the Talos Issuers, and (iv) the exchange of the 7.50% Senior Second Lien Notes due 2022 (the “2022 Second Lien Notes”) issued by Stone for newly issued 11% second lien notes issued by the Talos Issuers.
Under the terms of the Transaction Agreement, each outstanding share of Stone common stock will be exchanged for one share of New Talos common stock and the current Talos stakeholders (including the Apollo Funds and the Riverstone Funds) will be issued an aggregate of approximately 34.1 million common shares of New Talos. After the completion of the Transactions contemplated by the Transaction Agreement, holders of Stone common stock immediately prior to the combination will collectively hold 37% of the outstanding New Talos common stock and Talos Energy stakeholders will hold 63% of the outstanding New Talos common stock. Outstanding warrants to acquire Stone common stock will become warrants to acquire New Talos common stock with terms and conditions substantially identical to their existing terms and conditions.
The combination was unanimously approved by the boards of directors of Stone and Talos Energy. Completion of the combination is subject to the approval of Stone shareholders, the consummation of a tender offer and consent solicitation for Stone’s 2022 Second Lien Notes, certain regulatory approvals and other customary conditions. Franklin Advisers, Inc. and MacKay Shields LLC, as investment managers for approximately 53% of the outstanding common shares of Stone as of September 30, 2017, entered into voting agreements to vote in favor of the combination, subject to certain conditions. The Transaction Agreement contains certain termination rights for Stone and Talos Energy. Stone may be required to pay a termination fee and to reimburse transaction expenses to Talos Energy if the Transaction Agreement is terminated under certain circumstances. The combination is expected to close in the second quarter of 2018. We cannot provide any assurance that the combination will be completed on the terms or timeline currently contemplated, or at all.
F-8
Reorganization and Emergence from Voluntary Chapter 11 Proceedings
On December 14, 2016 (the “Petition Date”), the Company and its subsidiaries Stone Energy Offshore, L.L.C. (“Stone Offshore”) and Stone Energy Holding, L.L.C. (together with the Company, the “Debtors”) filed voluntary petitions (the “Bankruptcy Petitions”) in the United States Bankruptcy Court for the Southern District of Texas, Houston Division (the “Bankruptcy Court”) seeking relief under the provisions of Chapter 11 of Title 11 (“Chapter 11”) of the United States Bankruptcy Code (the “Bankruptcy Code”). On February 15, 2017, the Bankruptcy Court entered an order (the “Confirmation Order”) confirming the Second Amended Joint Prepackaged Plan of Reorganization of Stone Energy Corporation and its Debtor Affiliates, dated December 28, 2016 (the “Plan”), as modified by the Confirmation Order, and on February 28, 2017, the Plan became effective (the “Effective Date”) and the Debtors emerged from bankruptcy, with the bankruptcy cases then being closed by Final Decree Closing Chapter 11 Cases and Terminating Claims Agent Services entered by the Bankruptcy Court on April 20, 2017. See Note 2 – Reorganization for additional details.
Upon emergence from bankruptcy, the Company adopted fresh start accounting in accordance with the provisions of Accounting Standards Codification (“ASC”) 852, “Reorganizations”, which resulted in the Company becoming a new entity for financial reporting purposes on the Effective Date. As a result of the adoption of fresh start accounting, the Company’s consolidated financial statements subsequent to February 28, 2017 will not be comparable to its financial statements prior to that date. See Note 3 – Fresh Start Accounting for further details on the impact of fresh start accounting on the Company’s consolidated financial statements.
References to “Successor” or “Successor Company” relate to the financial position and results of operations of the reorganized Company subsequent to February 28, 2017. References to “Predecessor” or “Predecessor Company” relate to the financial position and results of operations of the Company prior to, and including, February 28, 2017.
Summary of Significant Accounting Policies
A summary of significant accounting policies followed in the preparation of the accompanying consolidated financial statements is set forth below.
Basis of Presentation:
The financial statements include our accounts and the accounts of our wholly owned subsidiaries, Stone Offshore, Stone Energy Holding, L.L.C. and Stone Energy Canada, ULC. On August 29, 2016, our subsidiaries SEO A LLC and SEO B LLC were merged into Stone Offshore. On December 2, 2016, Stone Energy Canada, ULC was dissolved. All intercompany balances have been eliminated. Certain prior year amounts have been reclassified to conform to current year presentation.
Reorganization and Fresh Start Accounting:
For periods subsequent to the Chapter 11 filing, but prior to emergence, ASC 852 requires that the financial statements distinguish transactions and events that are directly associated with the reorganization from the ongoing operations of the business. Accordingly, professional fees and other expenses incurred in the Chapter 11 cases, and unamortized debt issuance costs, premiums and discounts associated with debt classified as liabilities subject to compromise, have been recorded as reorganization items on the consolidated statement of operations for the applicable periods. In addition, pre-petition obligations that were to be impacted by the Chapter 11 process were classified on the consolidated balance sheet at December 31, 2016 as liabilities subject to compromise. See Note 2 – Reorganization and Note 3 – Fresh Start Accounting for more information regarding reorganization items and liabilities subject to compromise.
Upon emergence from bankruptcy, the Company qualified for and adopted fresh start accounting in accordance with the provisions of ASC 852, as (i) the holders of existing voting shares of the Predecessor Company received less than 50% of the voting shares of the Successor Company and (ii) the reorganization value of the Company’s assets immediately prior to confirmation of the Plan was less than the post-petition liabilities and allowed claims. The Company applied fresh start accounting as of February 28, 2017. Fresh start accounting required the Company to present its assets, liabilities and equity as if it were a new entity upon emergence from bankruptcy, with no beginning retained earnings or deficit as of the fresh start reporting date. The new entity is referred to as Successor or Successor Company, and includes the financial position and results of operations of the reorganized Company subsequent to February 28, 2017. References to Predecessor or Predecessor Company relate to the financial position and results of operations of the Company prior to, and including, February 28, 2017.
The Chapter 11 proceedings did not include our former foreign subsidiary Stone Energy Canada, ULC. This subsidiary had no significant activity during 2016, except for the reclassification of approximately $6.1 million of losses related to cumulative
F-9
foreign currency translation adjustments from accumulated other comprehensive income into other operational expenses upon the substantial liquidation of Stone Energy Canada, ULC. Stone Energy Canada, ULC was dissolved on December 2, 2016.
Use of Estimates:
The preparation of financial statements in conformity with U.S. Generally Accepted Accounting Principles (“GAAP”) requires our management to make estimates and assumptions that affect the reported amounts of assets and liabilities, the disclosure of contingent assets and liabilities at the date of the financial statements and the reported amounts of revenues and expenses during the reporting period. The Company bases its estimates on historical experience and on various assumptions and information believed to be reasonable under the circumstances. Estimates and assumptions about future events and their effects are uncertain and, accordingly, these estimates may change as new events occur, as additional information is obtained and as the Company’s operating environment changes. Actual results could differ from those estimates. Estimates are used primarily when accounting for depreciation, depletion and amortization (“DD&A”) expense, unevaluated property costs, estimated future net cash flows from proved reserves, costs to abandon oil and gas properties, income taxes, accruals of capitalized costs, operating costs and production revenue, capitalized general and administrative costs and interest, insurance recoveries, estimated fair value of derivative contracts, contingencies and fair value estimates, including estimates of reorganization value, enterprise value and the fair value of assets and liabilities recorded as a result of the adoption of fresh start accounting.
Fair Value Measurements:
U.S. GAAP establishes a framework for measuring fair value and requires certain disclosures about fair value measurements. As of December 31, 2017 and 2016, we held certain financial assets and liabilities that are required to be measured at fair value on a recurring basis, including our commodity derivative instruments and our investments in marketable securities.
On February 28, 2017, the Company emerged from bankruptcy and adopted fresh start accounting, which resulted in the Company becoming a new entity for financial reporting purposes. Upon the adoption of fresh start accounting, the Company’s assets and liabilities were recorded at their fair values as of the fresh start reporting date, February 28, 2017. See Note 3 – Fresh Start Accounting for a detailed discussion of the fair value approaches used by the Company.
Cash and Cash Equivalents:
We consider all money market funds and highly liquid investments in overnight securities through our commercial bank accounts, which result in available funds on the next business day, to be cash and cash equivalents. On December 31, 2017, we had $18.7 million of cash held in a restricted account to satisfy near-term plugging and abandonment liabilities, pursuant to the terms of the Amended Credit Agreement (as defined in Note 13 – Debt).
Oil and Gas Properties:
We follow the full cost method of accounting for oil and gas properties. Under this method, all acquisition, exploration, development and estimated abandonment costs, including certain related employee and general and administrative costs (less any reimbursements for such costs) and interest incurred for the purpose of finding oil and gas are capitalized. Such amounts include the cost of drilling and equipping productive wells, dry hole costs, lease acquisition costs, delay rentals and other costs related to such activities. Employee, general and administrative costs that are capitalized include salaries and all related fringe benefits paid to employees directly engaged in the acquisition, exploration and development of oil and gas properties, as well as all other directly identifiable general and administrative costs associated with such activities, such as rentals, utilities and insurance. We capitalize a portion of the interest costs incurred on our debt based upon the balance of our unevaluated property costs and our weighted-average borrowing rate. Employee, general and administrative costs associated with production operations and general corporate activities are expensed in the period incurred. Additionally, workover and maintenance costs incurred solely to maintain or increase levels of production from an existing completion interval are charged to lease operating expense in the period incurred.
U.S. GAAP allows the option of two acceptable methods for accounting for oil and gas properties. The successful efforts method is the allowable alternative to the full cost method. The primary differences between the two methods are in the treatment of exploration costs, the computation of DD&A expense and the assessment of impairment of oil and gas properties. Under the full cost method, all exploratory costs are capitalized, while under the successful efforts method, exploratory costs associated with unsuccessful exploratory wells and all geological and geophysical costs are expensed. Under the full cost method, DD&A expense is computed on cost centers represented by entire countries, while under the successful efforts method, cost centers are represented by properties, or some reasonable aggregation of properties with common geological structural features or stratigraphic condition, such as fields or reservoirs. Under the full cost method, oil and gas properties are subject to the ceiling test as discussed below while under the successful efforts method oil and gas properties are assessed for impairment in accordance with ASC 360.
F-10
We amortize our investment in oil and gas properties through DD&A expense using the units of production (the “UOP”) method. Under the UOP method, the quarterly provision for DD&A expense is computed by dividing production volumes for the period by the total proved reserves as of the beginning of the period (beginning of period reserves being determined by adding production to the end of period reserves), and applying the respective rate to the net cost of proved oil and gas properties, including future development costs.
Under the full cost method, we compare, at the end of each financial reporting period, the present value of estimated future net cash flows from proved reserves (adjusted for hedges and excluding cash flows related to estimated abandonment costs) to the net capitalized costs of proved oil and gas properties, net of related deferred taxes. We refer to this comparison as a ceiling test. If the net capitalized costs of proved oil and gas properties exceed the estimated discounted future net cash flows from proved reserves, we are required to write down the value of our oil and gas properties to the value of the discounted cash flows.
Sales of oil and gas properties are accounted for as adjustments to net oil and gas properties with no gain or loss recognized, unless the adjustment would significantly alter the relationship between capitalized costs and proved reserves.
Asset Retirement Obligations:
U.S. GAAP requires us to record our estimate of the fair value of liabilities related to future asset retirement obligations in the period the obligation is incurred. Asset retirement obligations relate to the removal of facilities and tangible equipment at the end of an oil and gas property’s useful life. The application of this rule requires the use of management’s estimates with respect to future abandonment costs, inflation, timing of abandonment and cost of capital. U.S. GAAP requires that our estimate of our asset retirement obligations does not give consideration to the value the related assets could have to other parties.
Other Property and Equipment:
Our office buildings in Lafayette, Louisiana are being depreciated on the straight-line method over their estimated useful lives of 39 years.
Derivative Instruments and Hedging Activities:
Through December 31, 2016, we designated our commodity derivatives as cash flow hedges for accounting purposes upon entering into the contracts. Accordingly, the contracts were recorded as either an asset or liability measured at fair value and subsequent changes in the derivative’s fair value were recognized in stockholders’ equity through other comprehensive income (loss), net of related taxes, to the extent the hedge was considered effective. Monthly settlements of effective hedges were reflected in revenue from oil and natural gas production. With respect to our 2017, 2018 and 2019 commodity derivative contracts, we have elected to not designate these contracts as cash flow hedges for accounting purposes. Accordingly, the net changes in the mark-to-market valuations and the monthly settlements of these derivative contracts are recorded in earnings through derivative income (expense).
Earnings Per Common Share:
Under U.S. GAAP, certain instruments granted in share-based payment transactions are considered participating securities prior to vesting and are therefore required to be included in the earnings allocation in calculating earnings per share under the two-class method. Companies are required to treat unvested share-based payment awards with a right to receive non-forfeitable dividends as a separate class of securities in calculating earnings per share.
Production Revenue:
We recognize production revenue under the entitlements method of accounting. Under this method, revenue is deferred for deliveries in excess of our net revenue interest, while revenue is accrued for undelivered or underdelivered volumes. Production imbalances are generally recorded at the estimated sales price in effect at the time of production. See Recently Issued Accounting Standards below.
Income Taxes:
Provisions for income taxes include deferred taxes resulting primarily from temporary differences due to different reporting methods for oil and gas properties for financial reporting and income tax purposes. For financial reporting purposes, all exploratory and development expenditures related to evaluated projects, including future abandonment costs, are capitalized and amortized using the UOP method. For income tax purposes, only the leasehold, geological and geophysical and equipment costs relative to successful wells are capitalized and recovered through DD&A, although for 2015, 2016 and 2017, special provisions allowed for current deductions for the cost of certain equipment. Generally, most other exploratory and development costs are charged to
F-11
expense as incurred; however, we follow certain provisions of the Internal Revenue Code (the “IRC”) that allow capitalization of intangible drilling costs where management deems appropriate. Other financial and income tax reporting differences occur as a result of statutory depletion, different reporting methods for sales of oil and gas reserves in place, different reporting methods used in the capitalization of employee, general and administrative and interest expense, and different reporting methods for employee compensation. See Note 12 – Income Taxes for a discussion of the effects of the December 22, 2017 enactment of the Tax Cuts and Jobs Act.
Share-Based Compensation:
We record share-based compensation using the grant date fair value of issued stock options, stock awards, restricted stock and restricted stock units over the vesting period of the instrument. We utilize the Black-Scholes option pricing model to measure the fair value of stock options. The fair value of stock awards, restricted stock and restricted stock units is typically determined based on the average of our high and low stock prices on the grant date.
Combination Transaction Costs:
In general, acquisition-related costs are expensed in the periods in which the costs are incurred and the services are rendered. However, some direct costs of an acquisition, such as the cost of registering and issuing equity securities to effect a business combination, are recorded as a reduction of additional paid-in-capital when incurred.
Recently Issued Accounting Standards:
In May 2014, the Financial Accounting Standards Board (“FASB”) issued Accounting Standards Update (“ASU”) 2014-09, “Revenue from Contracts with Customers (Topic 606)” to clarify the principles for recognizing revenue and to develop a common revenue standard and disclosure requirements. Under the new standard, revenue is recognized when a customer obtains control of promised goods or services in an amount that reflects the consideration the entity expects to receive in exchange for those goods or services. Additional disclosures will be required to describe the nature, amount, timing and uncertainty of revenue and cash flows from contracts with customers including the disaggregation of revenue and remaining performance obligations. The standard may be applied retrospectively or using a modified retrospective approach, with the cumulative effect of initially applying ASU 2014-09 recognized at the date of initial application, and is effective for interim and annual periods beginning on or after December 15, 2017.
We adopted this new standard on January 1, 2018 using the modified retrospective approach. The adoption of the standard did not have a material effect on our financial position, results of operations or cash flows, but will result in increased disclosures related to revenue recognition policies and disaggregation of revenues.
In February 2016, the FASB issued ASU 2016-02, “Leases (Topic 842)” to increase transparency and comparability among organizations by recognizing lease assets and lease liabilities on the balance sheet and disclosing key information about leasing arrangements. The standard is effective for public companies for fiscal years beginning after December 15, 2018, and for interim periods within those fiscal years, with earlier application permitted. Upon adoption the lessee will apply the new standard retrospectively to all periods presented or retrospectively using a cumulative effect adjustment in the year of adoption. We are currently evaluating the effect that this new standard may have on our financial statements and related disclosures.
In March 2016, the FASB issued ASU 2016-09, “Compensation – Stock Compensation (Topic 718)” to simplify several aspects of the accounting for share-based payment transactions, including the income tax consequences, classification of awards as either equity or liabilities, and forfeitures, as well as classification in the statement of cash flows. ASU 2016-09 became effective for us on January 1, 2017. Under ASU 2016-09, we elected to not apply a forfeiture estimate and will recognize a credit in compensation expense to the extent awards are forfeited. The implementation of this new standard did not have a material effect on our financial statements or related disclosures.
In August 2017, the FASB issued ASU 2017-12, “Derivatives and Hedging (Topic 815)” to improve the financial reporting of hedging relationships to better reflect an entity’s hedging strategies. The standard expands an entity’s ability to apply hedge accounting for both non-financial and financial risk components and amends the presentation and disclosure requirements. Additionally, ASU 2017-12 eliminates the need to separately measure and report hedge ineffectiveness and generally requires the entire change in fair value of a hedging instrument to be recorded in the same income statement line as the earnings effect of the hedged item. The standard is effective for public companies for fiscal years beginning after December 15, 2018 and interim periods within those fiscal years. Early adoption is permitted. The standard must be adopted by applying a modified retrospective approach to existing designated hedging relationships as of the adoption date, with a cumulative effect adjustment recorded to opening retained earnings as of the initial adoption date. We are currently evaluating the effect that this new standard may have on our financial statements and related disclosures.
F-12
NOTE 2 — REORGANIZATION
On December 14, 2016, the Debtors filed the Bankruptcy Petitions seeking relief under the provisions of Chapter 11 of the Bankruptcy Code to pursue a prepackaged plan of reorganization. On February 15, 2017, the Bankruptcy Court entered an order confirming the Plan, and on February 28, 2017, the Plan became effective and the Debtors emerged from bankruptcy.
Prior to filing the Bankruptcy Petitions, on October 20, 2016, the Debtors and certain holders of the Company’s 1¾% Senior Convertible Notes due 2017 (the “2017 Convertible Notes”) and the Company’s 7 1⁄2% Senior Notes due 2022 (the “2022 Notes”) (collectively, the “Notes” and the holders thereof, the “Noteholders”) and the lenders (the “Banks”) under the Fourth Amended and Restated Credit Agreement, dated as of June 24, 2014, as amended, modified, or otherwise supplemented from time to time (the “Pre-Emergence Credit Agreement”), entered into an Amended and Restated Restructuring Support Agreement (the “A&R RSA”). The A&R RSA contained certain covenants on the part of the Company and the Noteholders and Banks who are signatories to the A&R RSA, including that such Noteholders and Banks would support the Company’s sale of Stone’s producing properties and acreage, including approximately 86,000 net acres, in the Appalachia regions of Pennsylvania and West Virginia (the “Appalachia Properties”) to TH Exploration III, LLC, an affiliate of Tug Hill, Inc. (“Tug Hill”), pursuant to the terms of a Purchase and Sale Agreement dated October 20, 2016, as amended on December 9, 2016 (the “Tug Hill PSA”) for a purchase price of at least $350 million and approval of the Bankruptcy Court. Pursuant to the terms of the Tug Hill PSA, Stone agreed to sell the Appalachia Properties to Tug Hill for $360 million in cash, subject to customary purchase price adjustments.
Pursuant to Bankruptcy Court orders dated January 11, 2017 and January 31, 2017, two additional bidders were allowed to participate in competitive bidding on the Appalachia Properties. On January 18, 2017, the Bankruptcy Court approved certain bidding procedures (the “Bidding Procedures”) in connection with the sale of the Appalachia Properties. In accordance with the Bidding Procedures, Stone conducted an auction for the sale of the Appalachia Properties on February 8, 2017 and upon conclusion, selected the final bid submitted by EQT, with a final purchase price of $527 million in cash, subject to customary purchase price adjustments and approval by the Bankruptcy Court, with an upward adjustment to the purchase price of up to $16 million in an amount equal to certain downward adjustments, as the prevailing bid. On February 9, 2017, the Company entered into a purchase and sale agreement with EQT (the “EQT PSA”), reflecting the terms of the prevailing bid and on February 10, 2017, the Bankruptcy Court entered a sale order approving the sale of the Appalachia Properties to EQT. We completed the sale of the Appalachia Properties to EQT on February 27, 2017 for net cash consideration of approximately $522.5 million. At the close of the sale of the Appalachia Properties, the Tug Hill PSA was terminated, and the Company used a portion of the cash consideration received to pay Tug Hill a break-up fee and expense reimbursements totaling approximately $11.5 million, which is recognized as other expense in the statement of operations for the period of January 1, 2017 through February 28, 2017 (Predecessor). See Note 4 – Divestiture for additional information on the sale of the Appalachia Properties.
Upon emergence from bankruptcy, pursuant to the terms of the Plan, the following significant transactions occurred:
• | Shares of the Predecessor Company’s issued and outstanding common stock immediately prior to the Effective Date were cancelled, and on the Effective Date, reorganized Stone issued an aggregate of 20.0 million shares of new common stock (the “New Common Stock”). |
• | The Predecessor Company’s 2022 Notes and 2017 Convertible Notes were cancelled and the holders of such notes received their pro rata share of (a) $100 million of cash, (b) 19.0 million shares of New Common Stock, representing 95% of the New Common Stock and (c) $225 million of the 2022 Second Lien Notes. |
• | The Predecessor Company’s common stockholders received their pro rata share of 1.0 million shares of the New Common Stock, representing 5% of the New Common Stock, and warrants to purchase approximately 3.5 million shares of New Common Stock. The warrants have an exercise price of $42.04 per share and a term of four years, unless terminated earlier by their terms upon the consummation of certain business combinations or sale transactions involving the Company. |
• | The Predecessor Company’s Pre-Emergence Credit Agreement was amended and restated as the Amended Credit Agreement (as defined in Note 13 – Debt). The obligations owed to the lenders under the Pre-Emergence Credit Agreement were converted to obligations under the Amended Credit Agreement. |
• | All claims of creditors with unsecured claims, other than claims by the holders of the 2022 Notes and 2017 Convertible Notes, including vendors, were unaltered and paid in full in the ordinary course of business to the extent such claims were undisputed. |
F-13
For further information regarding the equity and debt instruments of the Predecessor Company and the Successor Company, see Note 5 – Stockholders’ Equity and Note 13 – Debt.
NOTE 3 — FRESH START ACCOUNTING
Upon emergence from bankruptcy, the Company qualified for and adopted fresh start accounting in accordance with the provisions of ASC 852, “Reorganizations” as (i) the holders of existing voting shares of the Predecessor Company received less than 50% of the voting shares of the Successor Company and (ii) the reorganization value of the Company’s assets immediately prior to confirmation of the Plan was less than the post-petition liabilities and allowed claims. See Note 2 – Reorganization for the terms of the Plan. The Company applied fresh start accounting as of February 28, 2017. Fresh start accounting required the Company to present its assets, liabilities and equity as if it were a new entity upon emergence from bankruptcy, with no beginning retained earnings or deficit as of the fresh start reporting date. As described in Note 1 – Organization and Summary of Significant Accounting Policies, the new entity is referred to as Successor or Successor Company, and includes the financial position and results of operations of the reorganized Company subsequent to February 28, 2017. References to Predecessor or Predecessor Company relate to the financial position and results of operations of the Company prior to, and including, February 28, 2017.
Reorganization Value
Under fresh start accounting, reorganization value represents the fair value of the Successor Company’s total assets and is intended to approximate the amount a willing buyer would pay for the assets immediately after restructuring. Upon application of fresh start accounting, the Company allocated the reorganization value to its individual assets based on their estimated fair values.
The Company’s reorganization value is derived from an estimate of enterprise value. Enterprise value represents the estimated fair value of an entity’s long-term debt and stockholders’ equity. In support of the Plan, the Company estimated the enterprise value of the core assets (as defined in the Plan) of the Successor Company to be in the range of $300 million to $450 million, which was subsequently approved by the Bankruptcy Court. This valuation analysis was prepared using reserve information, development schedules, other financial information and financial projections and applying standard valuation techniques, including net asset value analysis, precedent transactions analyses and public comparable company analyses. Based on the estimates and assumptions used in determining the enterprise value, the Company ultimately estimated the enterprise value of the Successor Company’s core assets to be approximately $420 million.
Valuation of Assets
The Company’s principal assets are its oil and gas properties, which the Company accounts for under the full cost accounting method. With the assistance of valuation experts, the Company determined the fair value of its oil and gas properties based on the discounted cash flows expected to be generated from these assets. The computations were based on market conditions and reserves in place as of the bankruptcy emergence date.
The fair value analysis performed by valuation experts was based on the Company’s estimates of reserves as developed internally by the Company’s reserve engineers. For purposes of estimating the fair value of the Company’s proved, probable and possible reserves, an income approach was used, which estimated fair value based on the anticipated cash flows associated with the Company’s reserves, risked by reserve category and discounted using a weighted average cost of capital of 12.5%. The discount factor was derived from a weighted average cost of capital computation which utilized a blended expected cost of debt and expected returns on equity for similar market participants.
Future revenues were based upon forward strip oil and natural gas prices as of the emergence date, adjusted for differentials realized by the Company, and adjusted for a 2% annual escalation after 2021. Development and operating costs were based on the Company’s recent cost trends adjusted for inflation. The discounted cash flow models also included estimates not typically included in proved reserves such as depreciation and income tax expenses. The proved reserve locations were limited to wells expected to be drilled in the Company’s five year development plan.
As a result of this analysis, the Company concluded the fair value of its proved reserves was $380.8 million and the fair value of its probable and possible reserves was $16.8 million as of the Effective Date. The Company also reviewed its undeveloped leasehold acreage and inventory. An analysis of comparable market transactions indicated a fair value of undeveloped acreage and inventory totaling $80.2 million. These amounts are reflected in the Fresh Start Adjustments item number 12 below. The fair value of the Company’s asset retirement obligations was estimated at $290.1 million and was based on estimated plugging and abandonment costs as of the Effective Date, adjusted for inflation and discounted at the Successor Company’s credit-adjusted risk free rate of 12%.
F-14
See further discussion in Fresh Start Adjustments below for details on the specific assumptions used in the valuation of the Company’s various other assets.
The following table reconciles the enterprise value per the Plan to the estimated fair value (for fresh start accounting purposes) of the Successor Company’s common stock as of February 28, 2017 (in thousands, except per share value):
February 28, 2017 | ||||
Enterprise value | $ | 419,720 | ||
Plus: Cash and other assets | 371,278 | |||
Less: Fair value of debt | (236,261 | ) | ||
Less: Fair value of warrants | (15,648 | ) | ||
Fair value of Successor common stock | $ | 539,089 | ||
Shares issued upon emergence | 20,000 | |||
Per share value | $ | 26.95 | ||
The following table reconciles the enterprise value per the Plan to the estimated reorganization value as of the Effective Date (in thousands):
February 28, 2017 | ||||
Enterprise value | $ | 419,720 | ||
Plus: Cash and other assets | 371,278 | |||
Plus: Asset retirement obligations (current and long-term) | 290,067 | |||
Plus: Working capital and other liabilities | 58,055 | |||
Reorganization value of Successor assets | $ | 1,139,120 | ||
Reorganization value and enterprise value were estimated using numerous projections and assumptions that are inherently subject to significant uncertainties and resolution of contingencies that are beyond our control. Accordingly, the estimates set forth herein are not necessarily indicative of actual outcomes, and there can be no assurance that the estimates, projections or assumptions will be realized.
Condensed Consolidated Balance Sheet
The adjustments set forth in the following condensed consolidated balance sheet reflect the effects of the transactions contemplated by the Plan and carried out by the Company (reflected in the column “Reorganization Adjustments”) as well as fair value adjustments as a result of the adoption of fresh start accounting (reflected in the column “Fresh Start Adjustments”). The explanatory notes highlight methods used to determine fair values or other amounts of the assets and liabilities as well as significant assumptions or inputs. The following table reflects the reorganization and application of ASC 852 on our consolidated balance sheet as of February 28, 2017 (in thousands):
F-15
Predecessor Company | Reorganization Adjustments | Fresh Start Adjustments | Successor Company | ||||||||||||
Assets | |||||||||||||||
Current assets: | |||||||||||||||
Cash and cash equivalents | $ | 198,571 | $ | (35,605 | ) | (1) | $ | — | $ | 162,966 | |||||
Restricted cash | — | 75,547 | (1) | — | 75,547 | ||||||||||
Accounts receivable | 42,808 | 9,301 | (2) | — | 52,109 | ||||||||||
Fair value of derivative contracts | 1,267 | — | — | 1,267 | |||||||||||
Current income tax receivable | 22,516 | — | — | 22,516 | |||||||||||
Other current assets | 11,033 | 875 | (3) | (124 | ) | (12) | 11,784 | ||||||||
Total current assets | 276,195 | 50,118 | (124 | ) | 326,189 | ||||||||||
Oil and gas properties, full cost method of accounting: | |||||||||||||||
Proved | 9,633,907 | (188,933 | ) | (1) | (8,774,122 | ) | (12) | 670,852 | |||||||
Less: accumulated DD&A | (9,215,679 | ) | — | 9,215,679 | (12) | — | |||||||||
Net proved oil and gas properties | 418,228 | (188,933 | ) | 441,557 | 670,852 | ||||||||||
Unevaluated | 371,140 | (127,838 | ) | (1) | (146,292 | ) | (12) | 97,010 | |||||||
Other property and equipment, net | 25,586 | (101 | ) | (4) | (4,423 | ) | (13) | 21,062 | |||||||
Fair value of derivative contracts | 1,819 | — | — | 1,819 | |||||||||||
Other assets, net | 26,516 | (4,328 | ) | (5) | — | 22,188 | |||||||||
Total assets | $ | 1,119,484 | $ | (271,082 | ) | $ | 290,718 | $ | 1,139,120 | ||||||
Liabilities and Stockholders’ Equity | |||||||||||||||
Current liabilities: | |||||||||||||||
Accounts payable to vendors | $ | 20,512 | $ | — | $ | — | $ | 20,512 | |||||||
Undistributed oil and gas proceeds | 5,917 | (4,139 | ) | (1) | — | 1,778 | |||||||||
Accrued interest | 266 | — | — | 266 | |||||||||||
Asset retirement obligations | 92,597 | — | — | 92,597 | |||||||||||
Fair value of derivative contracts | 476 | — | — | 476 | |||||||||||
Current portion of long-term debt | 411 | — | — | 411 | |||||||||||
Other current liabilities | 17,032 | (195 | ) | (6) | — | 16,837 | |||||||||
Total current liabilities | 137,211 | (4,334 | ) | — | 132,877 | ||||||||||
Long-term debt | 352,350 | (116,500 | ) | (7) | — | 235,850 | |||||||||
Asset retirement obligations | 151,228 | (8,672 | ) | (1) | 54,914 | (14) | 197,470 | ||||||||
Fair value of derivative contracts | 653 | — | — | 653 | |||||||||||
Other long-term liabilities | 17,533 | — | — | 17,533 | |||||||||||
Total liabilities not subject to compromise | 658,975 | (129,506 | ) | 54,914 | 584,383 | ||||||||||
Liabilities subject to compromise | 1,110,182 | (1,110,182 | ) | (8) | — | — | |||||||||
Total liabilities | 1,769,157 | (1,239,688 | ) | 54,914 | 584,383 | ||||||||||
Commitments and contingencies | |||||||||||||||
Stockholders’ equity: | |||||||||||||||
Common stock (Predecessor) | 56 | (56 | ) | (9) | — | — | |||||||||
Treasury stock (Predecessor) | (860 | ) | 860 | (9) | — | — | |||||||||
Additional paid-in capital (Predecessor) | 1,660,810 | (1,660,810 | ) | (9) | — | — | |||||||||
Common stock (Successor) | — | 200 | (10) | — | 200 | ||||||||||
Additional paid-in capital (Successor) | — | 554,537 | (10) | — | 554,537 | ||||||||||
Accumulated deficit | (2,309,679 | ) | 2,073,875 | (11) | 235,804 | (15) | — | ||||||||
Total stockholders’ equity | (649,673 | ) | 968,606 | 235,804 | 554,737 | ||||||||||
Total liabilities and stockholders’ equity | $ | 1,119,484 | $ | (271,082 | ) | $ | 290,718 | $ | 1,139,120 | ||||||
F-16
Reorganization Adjustments
1. | Reflects the net cash proceeds received from the sale of the Appalachia Properties in connection with the Plan and net cash payments made as of the Effective Date from implementation of the Plan (in thousands): |
Sources: | ||||
Net cash proceeds from sale of Appalachia Properties (a) | $ | 512,472 | ||
Total sources | 512,472 | |||
Uses: | ||||
Cash transferred to restricted account (b) | 75,547 | |||
Break-up fee to Tug Hill | 10,800 | |||
Repayment of outstanding borrowings under Pre-Emergence Credit Agreement | 341,500 | |||
Repayment of 2017 Convertible Notes and 2022 Notes | 100,000 | |||
Other fees and expenses (c) | 20,230 | |||
Total uses | 548,077 | |||
Net uses | $ | (35,605 | ) | |
(a) The closing of the sale of the Appalachia Properties occurred on February 27, 2017, but as emergence was contingent on such closing, the effects of the transaction are reflected as reorganization adjustments. See Note 4 – Divestiture for additional details on the sale. Total consideration received for the sale of the Appalachia Properties of $522.5 million included cash consideration of $512.5 million received at closing and a $10.0 million indemnity escrow which was released subsequent to emergence from bankruptcy (see Reorganization Adjustments item number 2 below).
(b) Reflects the movement of $75.0 million of cash held in a restricted account to satisfy near-term plugging and abandonment liabilities, pursuant to the provisions of the Amended Credit Agreement (as defined in Note 13 – Debt), and $0.5 million held in a restricted cash account for certain cure amounts in connection with the Chapter 11 proceedings.
(c) | Other fees and expenses include approximately $15.2 million of emergence and success fees, $2.7 million of professional fees and $2.4 million of payments made to seismic providers in settlement of their bankruptcy claims. |
2. | Reflects a receivable for a $10.0 million indemnity escrow with release delayed until emergence from bankruptcy, net of a $0.7 million reimbursement to Tug Hill in connection with the sale of the Appalachia Properties (see Note 4 – Divestiture). |
3. | Reflects the payment of a claim to a seismic provider as a prepayment/deposit. |
4. | Reflects the sale of vehicles in connection with the sale of the Appalachia Properties. |
5. | Reflects the write-off of $2.6 million of unamortized debt issuance costs related to the Pre-Emergence Credit Agreement and the reversal of a $1.8 million prepayment made to Tug Hill in October 2016. |
6. | Reflects the accrual of $2.0 million in expected bonus payments under the KEIP (as defined in Note 15 – Employee Benefit Plans) and a $0.4 million termination fee in connection with the early termination of an office lease, less the settlement of a property tax accrual of $2.6 million in connection with the sale of the Appalachia Properties. |
7. | Reflects the repayment of $341.5 million of outstanding borrowings under the Pre-Emergence Credit Agreement and the issuance of $225 million of 2022 Second Lien Notes as part of the settlement of the Predecessor Company 2017 Convertible Notes and 2022 Notes. |
8. | Liabilities subject to compromise were settled as follows in accordance with the Plan (in thousands): |
F-17
1 ¾% Senior Convertible Notes due 2017 | $ | 300,000 | ||
7 ½% Senior Notes due 2022 | 775,000 | |||
Accrued interest | 35,182 | |||
Liabilities subject to compromise of the Predecessor Company | 1,110,182 | |||
Cash payment to senior noteholders | (100,000 | ) | ||
Issuance of 2022 Second Lien Notes to former holders of the senior notes | (225,000 | ) | ||
Fair value of equity issued to unsecured creditors | (539,089 | ) | ||
Fair value of warrants issued to unsecured creditors | (15,648 | ) | ||
Gain on settlement of liabilities subject to compromise | $ | 230,445 | ||
9. | Reflects the cancellation of the Predecessor Company’s common stock, treasury stock and additional paid-in capital. |
10. | Reflects the issuance of Successor Company equity. In accordance with the Plan, the Successor Company issued 19.0 million shares of New Common Stock to the former holders of the 2017 Convertible Notes and the 2022 Notes and 1.0 million shares of New Common Stock to the Predecessor Company’s common stockholders. These amounts are subject to dilution by warrants issued to the Predecessor Company common stockholders, totaling approximately 3.5 million shares, with an exercise price of $42.04 per share and a term of four years. The fair value of the warrants was estimated at $4.43 per share using a Black-Scholes-Merton valuation model. |
11.Reflects the cumulative impact of the reorganization adjustments discussed above (in thousands):
Gain on settlement of liabilities subject to compromise | $ | 230,445 | ||
Professional and other fees paid at emergence | (10,648 | ) | ||
Write-off of unamortized debt issuance costs | (2,577 | ) | ||
Other reorganization adjustments | (1,915 | ) | ||
Net impact to reorganization items | 215,305 | |||
Gain on sale of Appalachia Properties | 213,453 | |||
Cancellation of Predecessor Company equity | 1,662,282 | |||
Other adjustments to accumulated deficit | (17,165 | ) | ||
Net impact to accumulated deficit | $ | 2,073,875 | ||
Fresh Start Adjustments
12. | Fair value adjustments to oil and gas properties, associated inventory and unproved acreage. See above for a detailed discussion of the fair value methodology. |
13. | Fair value adjustment for an office building owned by the Company. The income and sales comparison approaches were used in determining the fair value, using anticipated future earnings and an appropriate expected rate of return, as well as relying upon recent sales or offerings of similar assets. |
14. | Fair value adjustments to the Company’s asset retirement obligations using estimated plugging and abandonment costs as of the Effective Date, adjusted for inflation and discounted at the Successor Company’s credit-adjusted risk free rate. |
15. | Reflects the cumulative effect of the fresh start accounting adjustments discussed above. |
Reorganization Items
Reorganization items represent liabilities settled, net of amounts incurred subsequent to the Chapter 11 filing as a direct result of the Plan and are classified as “Reorganization items, net” in the Company’s consolidated statement of operations. The following table summarizes reorganization items, net (in thousands):
F-18
Predecessor | ||||||
Period from January 1, 2017 through February 28, 2017 | ||||||
Gain on settlement of liabilities subject to compromise | $ | 230,445 | ||||
Fresh start valuation adjustments | 235,804 | |||||
Reorganization professional fees and other expenses | (20,403 | ) | ||||
Write-off of unamortized debt issuance costs | (2,577 | ) | ||||
Other reorganization items | (5,525 | ) | ||||
Gain on reorganization items, net | $ | 437,744 | ||||
The cash payments for reorganization items for the period from January 1, 2017 through February 28, 2017 include approximately $10.6 million of emergence and success fees and approximately $8.9 million of other reorganization professional fees and expenses paid on the Effective Date.
NOTE 4 — DIVESTITURE
On February 27, 2017, we completed the sale of the Appalachia Properties to EQT for net cash consideration of approximately $522.5 million, representing gross proceeds of $527.0 million adjusted downward by approximately $4.5 million for purchase price adjustments for operations related to the Appalachia Properties after June 1, 2016, the effective date of the transaction. A portion of the consideration received from the sale of the Appalachia Properties was used to fund the Company’s cash payment obligations under the Plan. See Note 2 – Reorganization.
At December 31, 2016, the estimated proved oil and natural gas reserves associated with these assets totaled 18 MMBoe (million barrels of oil equivalent), which represented approximately 34% of the Predecessor Company’s total estimated proved oil and natural gas reserves, on a volume equivalent basis. We no longer have assets or operations in Appalachia. Since accounting for the sale of these oil and gas properties as a reduction of the capitalized costs of oil and gas properties would have significantly altered the relationship between capitalized costs and proved reserves, we recognized a gain on the sale of $213.5 million during the period from January 1, 2017 through February 28, 2017 (Predecessor). The gain on the sale of the Appalachia Properties is computed as follows (in thousands):
Net consideration received for sale of Appalachia Properties | $ | 522,472 | |||
Add: | Release of funds held in suspense | 4,139 | |||
Transfer of asset retirement obligations | 8,672 | ||||
Other adjustments, net | 2,597 | ||||
Less: | Transaction costs | (7,087 | ) | ||
Carrying value of properties sold | (317,340 | ) | |||
Gain on sale | $ | 213,453 | |||
The carrying value of the properties sold was determined by allocating total capitalized costs within the U.S. full cost pool between properties sold and properties retained based on their relative fair values.
NOTE 5 — STOCKHOLDERS’ EQUITY
Common Stock
As discussed in Note 2 – Reorganization, upon emergence from bankruptcy, all existing shares of Predecessor common stock were cancelled, and the Successor Company issued an aggregate of 20.0 million shares of New Common Stock, par value $0.01 per share, to the Predecessor Company’s existing common stockholders and holders of the 2017 Convertible Notes and the 2022 Notes pursuant to the Plan.
F-19
Warrants
As discussed in Note 2 – Reorganization, the Predecessor Company’s existing common stockholders received warrants to purchase approximately 3.5 million shares of New Common Stock. The warrants have an exercise price of $42.04 per share and a term of four years, unless terminated earlier by their terms upon the consummation of certain business combinations or sale transactions involving the Company. The Company allocated $15.6 million of the enterprise value to the warrants which is reflected in “Successor additional paid-in capital” on the audited consolidated balance sheet at December 31, 2017 (Successor).
NOTE 6 — EARNINGS PER SHARE
On February 28, 2017, upon emergence from Chapter 11 bankruptcy, the Company’s Predecessor equity was cancelled and new equity was issued. Additionally, the Predecessor Company’s 2017 Convertible Notes were cancelled. See Note 2 – Reorganization and Note 5 – Stockholders’ Equity for further details.
The following table sets forth the calculation of basic and diluted weighted average shares outstanding and earnings per share for the indicated periods (in thousands, except per share amounts):
Successor | Predecessor | |||||||||||||||
Period from March 1, 2017 through December 31, 2017 | Period from January 1, 2017 through February 28, 2017 | Year Ended December 31, | ||||||||||||||
2016 | 2015 | |||||||||||||||
Income (numerator): | ||||||||||||||||
Basic: | ||||||||||||||||
Net income (loss) | $ | (247,639 | ) | $ | 630,317 | $ | (590,586 | ) | $ | (1,090,915 | ) | |||||
Net income attributable to participating securities | — | (4,995 | ) | — | — | |||||||||||
Net income (loss) attributable to common stock - basic | $ | (247,639 | ) | $ | 625,322 | $ | (590,586 | ) | $ | (1,090,915 | ) | |||||
Diluted: | ||||||||||||||||
Net income (loss) | $ | (247,639 | ) | $ | 630,317 | $ | (590,586 | ) | $ | (1,090,915 | ) | |||||
Net income attributable to participating securities | — | (4,995 | ) | — | — | |||||||||||
Net income (loss) attributable to common stock - diluted | $ | (247,639 | ) | $ | 625,322 | $ | (590,586 | ) | $ | (1,090,915 | ) | |||||
Weighted average shares (denominator): | ||||||||||||||||
Weighted average shares - basic | 19,997 | 5,634 | 5,591 | 5,525 | ||||||||||||
Dilutive effect of stock options | — | — | — | — | ||||||||||||
Dilutive effect of warrants | — | — | — | — | ||||||||||||
Dilutive effect of convertible notes | — | — | — | — | ||||||||||||
Weighted average shares - diluted | 19,997 | 5,634 | 5,591 | 5,525 | ||||||||||||
Basic income (loss) per share | $ | (12.38 | ) | $ | 110.99 | $ | (105.63 | ) | $ | (197.45 | ) | |||||
Diluted income (loss) per share | $ | (12.38 | ) | $ | 110.99 | $ | (105.63 | ) | $ | (197.45 | ) | |||||
All outstanding stock options were considered antidilutive during the period from January 1, 2017 through February 28, 2017 (Predecessor) (10,400 shares) because the exercise price of the options exceeded the average price of our common stock for the applicable period. During the years ended December 31, 2016 (Predecessor) (12,900 shares) and December 31, 2015 (Predecessor) (14,400 shares) all outstanding stock options were considered antidilutive because we had net losses for such years. On February 28, 2017, upon emergence from bankruptcy, all outstanding stock options were cancelled. See Note 16 – Share-Based Compensation.
On February 28, 2017, upon emergence from bankruptcy, the Predecessor Company’s existing common stockholders received warrants to purchase common stock of the Successor Company. See Note 2 – Reorganization. For the period of March 1, 2017 through December 31, 2017 (Successor), all outstanding warrants (approximately 3.5 million) were considered antidilutive because we had a net loss for such period.
The Predecessor Company had no outstanding restricted stock units. The board of directors of the Successor Company (the “Board”) received grants of restricted stock units on March 1, 2017. See Note 16 – Share-Based Compensation. For the period
F-20
from March 1, 2017 through December 31, 2017 (Successor), all outstanding restricted stock units (62,137) were considered antidilutive because we had a net loss for such period.
For the period from January 1, 2017 through February 28, 2017 (Predecessor), the average price of our common stock was less than the effective conversion price for the 2017 Convertible Notes, resulting in no dilutive effect on the diluted earnings per share computation for such period. For the years ended December 31, 2016 and 2015 (Predecessor), the 2017 Convertible Notes had no dilutive effect on the diluted earnings per share computation as we had net losses for such years. On February 28, 2017, upon emergence from bankruptcy, the 2017 Convertible Notes were cancelled. See Note 2 – Reorganization.
During the period from March 1, 2017 through December 31, 2017 (Successor), 1,195 shares of common stock of the Successor Company were issued from authorized shares upon the lapsing of forfeiture restrictions of restricted stock for employees. During the period from January 1, 2017 through February 28, 2017 (Predecessor) and the years ended December 31, 2016 and 2015 (Predecessor), 47,390, 79,621 and 41,375 shares of our common stock, respectively, were issued from authorized shares upon the lapsing of forfeiture restrictions of restricted stock and granting of stock awards for employees and nonemployee directors.
NOTE 7 — ACCOUNTS RECEIVABLE
In our capacity as operator for our co-venturers, we incur drilling and other costs that we bill to the respective parties based on their working interests. We also receive payments for these billings and, in some cases, for billings in advance of incurring costs. Our accounts receivable are comprised of the following amounts (in thousands):
Successor | Predecessor | |||||||
As of December 31, | As of December 31, | |||||||
2017 | 2016 | |||||||
Other co-venturers | $ | 2,656 | $ | 3,532 | ||||
Trade | 34,980 | 42,944 | ||||||
Unbilled accounts receivable | 820 | 591 | ||||||
Other | 802 | 1,397 | ||||||
Total accounts receivable | $ | 39,258 | $ | 48,464 | ||||
NOTE 8 — CONCENTRATIONS
Sales to Major Customers
Our production is sold on month-to-month contracts at prevailing prices. We obtain credit protections, such as parental guarantees, from certain of our purchasers. The following table identifies customers from whom we derived 10% or more of our total oil and natural gas revenue during the indicated periods:
Successor | Predecessor | |||||||||||
Period from March 1, 2017 through December 31, 2017 | Period from January 1, 2017 through February 28, 2017 | Year Ended December 31, | ||||||||||
2016 | 2015 | |||||||||||
Phillips 66 Company | 74 | % | 56 | % | 68 | % | 53 | % | ||||
Shell Trading (US) Company | 15 | % | 7 | % | 10 | % | 13 | % | ||||
Williams Ohio Valley Midstream LLC | — | % | 12 | % | 2 | % | 9 | % | ||||
Conoco | — | % | 11 | % | 5 | % | 2 | % | ||||
The maximum amount of credit risk exposure at December 31, 2017 (Successor) relating to these customers was $30.5 million.
We believe that the loss of any of these purchasers would not result in a material adverse effect on our ability to market future oil and natural gas production.
F-21
Production and Reserve Volumes – Unaudited
All of our estimated proved reserve volumes at December 31, 2017 (Successor) and approximately 88% of our production during 2017 were associated with our GOM deep water, conventional shelf and deep gas properties. We closed the sale of the Appalachia Properties on February 27, 2017 and no longer have assets or operations in Appalachia (see Note 4 – Divestiture).
Cash and Cash Equivalents
A substantial portion of our cash balances are not federally insured.
NOTE 9 — DERIVATIVE INSTRUMENTS AND HEDGING ACTIVITIES
Our hedging strategy is designed to protect our near and intermediate term cash flows from future declines in oil and natural gas prices. This protection is essential to capital budget planning, which is sensitive to expenditures that must be committed to in advance, such as rig contracts and the purchase of tubular goods. We enter into derivative transactions to secure a commodity price for a portion of our expected future production that is acceptable at the time of the transaction. We do not enter into derivative transactions for trading purposes.
All derivatives are recognized as assets or liabilities on the balance sheet and are measured at fair value. At the end of each quarterly period, these derivatives are marked-to-market. If the derivative does not qualify or is not designated as a cash flow hedge, subsequent changes in the fair value of the derivative are recognized in earnings through derivative income (expense) in the statement of operations. If the derivative qualifies and is designated as a cash flow hedge, subsequent changes in the fair value of the derivative are recognized in stockholders’ equity through other comprehensive income (loss), net of related taxes, to the extent the hedge is considered effective. Monthly settlements of effective cash flow hedges are reflected in revenue from oil and natural gas production. Monthly settlements of ineffective hedges and derivatives not designated or that do not qualify for hedge accounting are recognized in earnings through derivative income (expense). The resulting cash flows from all monthly settlements are reported as cash flows from operating activities.
Through December 31, 2016, we designated our commodity derivatives as cash flow hedges for accounting purposes upon entering into the contracts. A small portion of our cash flow hedges were typically determined to be ineffective because oil and natural gas price changes in the markets in which we sell our products were not 100% correlative to changes in the underlying price basis indicative in the derivative contract. We had no outstanding derivatives at December 31, 2016. With respect to our 2017, 2018 and 2019 commodity derivative contracts, we have elected to not designate these contracts as cash flow hedges for accounting purposes. Accordingly, the net changes in the mark-to-market valuations and the monthly settlements of these derivative contracts will be recorded in earnings through derivative income (expense).
We have entered into put contracts, fixed-price swaps and collar contracts with various counterparties for a portion of our expected 2018 and 2019 oil and natural gas production from the Gulf Coast Basin. All of our derivative transactions have been carried out in the over-the-counter market and are not typically subject to margin-deposit requirements. The use of derivative instruments involves the risk that the counterparties will be unable to meet the financial terms of such transactions. The counterparties to all of our derivative instruments have an “investment grade” credit rating. We monitor the credit ratings of our derivative counterparties on an ongoing basis. Although we typically enter into derivative contracts with multiple counterparties to mitigate our exposure to any individual counterparty, if any of our counterparties were to default on its obligations to us under the derivative contracts or seek bankruptcy protection, we may not realize the benefit of some of our derivative instruments and incur a loss. At March 9, 2018, our derivative instruments were with four counterparties, two of which accounted for approximately 64% of our contracted volumes. Currently, all of our outstanding derivative instruments are with lenders under our current bank credit facility.
Put contracts are purchased at a rate per unit of hedged production that fluctuates with the commodity futures market. The historical cost of the put contract represents our maximum cash exposure. We are not obligated to make any further payments under the put contract regardless of future commodity price fluctuations. Under put contracts, monthly payments are made to us if the New York Mercantile Exchange (“NYMEX”) prices fall below the agreed upon floor price, while allowing us to fully participate in commodity prices above the floor. Swaps typically provide for monthly payments by us if prices rise above the swap price or monthly payments to us if prices fall below the swap price. Collar contracts typically require payments by us if the NYMEX average closing price is above the ceiling price or payments to us if the NYMEX average closing price is below the floor price. Settlements for our oil put contracts, oil collar contracts and fixed-price oil swaps are based on an average of the NYMEX closing price for West Texas Intermediate crude oil during the entire calendar month. Settlements for our natural gas collar contracts and fixed-price natural gas swaps are based on the NYMEX price for the last day of a respective contract month.
F-22
The following tables illustrate our derivative positions for calendar years 2018 and 2019 as of March 9, 2018:
Put Contracts (NYMEX) | |||||||
Oil | |||||||
Daily Volume | Price | ||||||
(Bbls/d) | ($ per Bbl) | ||||||
2018 | January - December | 1,000 | $ | 54.00 | |||
2018 | January - December | 1,000 | 45.00 | ||||
Fixed-Price Swaps (NYMEX) | |||||||
Oil | |||||||
Daily Volume | Swap Price | ||||||
(Bbls/d) | ($ per Bbl) | ||||||
2018 | January - December | 1,000 | $ | 52.50 | |||
2018 | January - December | 1,000 | 51.98 | ||||
2018 | January - December | 1,000 | 53.67 | ||||
2019 | January - December | 1,000 | 51.00 | ||||
2019 | January - December | 1,000 | 51.57 | ||||
2019 | January - December | 2,000 | 56.13 | ||||
Collar Contracts (NYMEX) | ||||||||||||||||||||||
Natural Gas | Oil | |||||||||||||||||||||
Daily Volume (MMBtus/d) | Floor Price ($ per MMBtu) | Ceiling Price ($ per MMBtu) | Daily Volume (Bbls/d) | Floor Price ($ per Bbl) | Ceiling Price ($ per Bbl) | |||||||||||||||||
2018 | January - December | 6,000 | $ | 2.75 | $ | 3.24 | 1,000 | $ | 45.00 | $ | 55.35 | |||||||||||
Derivatives not designated or not qualifying as hedging instruments
The following table discloses the location and fair value amounts of derivatives not designated or not qualifying as hedging instruments, as reported in our balance sheet, at December 31, 2017 (Successor) (in thousands). We had no outstanding hedging instruments at December 31, 2016 (Predecessor).
Fair Value of Derivatives Not Designated or Not Qualifying as Hedging Instruments at | |||||||||||
December 31, 2017 | |||||||||||
(Successor) | |||||||||||
Asset Derivatives | Liability Derivatives | ||||||||||
Description | Balance Sheet Location | Fair Value | Balance Sheet Location | Fair Value | |||||||
Commodity contracts | Current assets: Fair value of derivative contracts | $ | 879 | Current liabilities: Fair value of derivative contracts | $ | 8,969 | |||||
Long-term assets: Fair value of derivative contracts | — | Long-term liabilities: Fair value of derivative contracts | 3,085 | ||||||||
$ | 879 | $ | 12,054 | ||||||||
Gains or losses related to changes in fair value and cash settlements for derivatives not designated or not qualifying as hedging instruments are recorded as derivative income (expense) in the statement of operations. The following table discloses the before tax effect of our derivatives not designated or not qualifying as hedging instruments on the statement of operations for the indicated periods (in thousands):
F-23
Gain (Loss) Recognized in Derivative Income (Expense) | |||||||||||||||||
Successor | Predecessor | ||||||||||||||||
Period from March 1, 2017 through December 31, 2017 | Period from January 1, 2017 through February 28, 2017 | Year Ended | |||||||||||||||
Description | December 31, 2016 | December 31, 2015 | |||||||||||||||
Commodity contracts: | |||||||||||||||||
Cash settlements | $ | 2,161 | $ | — | $ | — | $ | 17,385 | |||||||||
Change in fair value | (15,549 | ) | (1,778 | ) | — | (12,146 | ) | ||||||||||
Total gains (losses) on derivatives not designated or not qualifying as hedging instruments | $ | (13,388 | ) | $ | (1,778 | ) | $ | — | $ | 5,239 | |||||||
Derivatives qualifying as hedging instruments
None of our derivative contracts outstanding as of December 31, 2017 (Successor) were designated as accounting hedges. We had no outstanding derivatives at December 31, 2016 (Predecessor). During 2016 and 2015, we had outstanding derivatives that were designated and qualified as hedging instruments. The following table discloses the before tax effect of derivatives qualifying as hedging instruments, as reported in the statement of operations, for the years ended December 31, 2016 and 2015 (Predecessor) (in thousands):
Effect of Derivatives Qualifying as Hedging Instruments on the Statement of Operations | ||||||||||||||||
for the Years Ended December 31, 2016 and 2015 | ||||||||||||||||
(Predecessor) | ||||||||||||||||
Derivatives in Cash Flow Hedging Relationships | Amount of Gain (Loss) Recognized in Other Comprehensive Income on Derivatives | Gain (Loss) Reclassified from Accumulated Other Comprehensive Income into Income (Effective Portion) (a) | Gain (Loss) Recognized in Income on Derivatives (Ineffective Portion) | |||||||||||||
Location | Location | |||||||||||||||
2016 | 2016 | 2016 | ||||||||||||||
Commodity contracts | $ | (1,648 | ) | Operating revenue - oil/natural gas production | $ | 35,457 | Derivative income (expense), net | $ | (810 | ) | ||||||
Total | $ | (1,648 | ) | $ | 35,457 | $ | (810 | ) | ||||||||
2015 | 2015 | 2015 | ||||||||||||||
Commodity contracts | $ | 52,630 | Operating revenue - oil/natural gas production | $ | 149,955 | Derivative income (expense), net | $ | 2,713 | ||||||||
Total | $ | 52,630 | $ | 149,955 | $ | 2,713 | ||||||||||
(a) | For the year ended December 31, 2016, effective hedging contracts increased oil revenue by $23,747 and increased natural gas revenue by $11,710. For the year ended December 31, 2015, effective hedging contracts increased oil revenue by $135,617 and increased natural gas revenue by $14,338. |
Offsetting of derivative assets and liabilities
Our derivative contracts are subject to netting arrangements. It is our policy to not offset our derivative contracts in presenting the fair value of these contracts as assets and liabilities in our balance sheet. The following table presents the potential impact of the offset rights associated with our recognized assets and liabilities at December 31, 2017 (Successor) (in thousands):
As Presented Without Netting | Effects of Netting | With Effects of Netting | ||||||||||
Current assets: Fair value of derivative contracts | $ | 879 | $ | (879 | ) | $ | — | |||||
Long-term assets: Fair value of derivative contracts | — | — | — | |||||||||
Current liabilities: Fair value of derivative contracts | (8,969 | ) | 879 | (8,090 | ) | |||||||
Long-term liabilities: Fair value of derivative contracts | (3,085 | ) | — | (3,085 | ) | |||||||
We had no outstanding derivative contracts at December 31, 2016 (Predecessor).
F-24
NOTE 10 — FAIR VALUE MEASUREMENTS
U.S. GAAP establishes a fair value hierarchy that has three levels based on the reliability of the inputs used to determine the fair value. These levels include: Level 1, defined as inputs such as unadjusted quoted prices in active markets for identical assets or liabilities; Level 2, defined as inputs other than quoted prices in active markets that are either directly or indirectly observable; and Level 3, defined as unobservable inputs for use when little or no market data exists, therefore requiring an entity to develop its own assumptions.
As of December 31, 2017 (Successor) and 2016 (Predecessor), we held certain financial assets that are required to be measured at fair value on a recurring basis, including our commodity derivative instruments and our investments in marketable securities. We utilize the services of an independent third party to assist us in valuing our derivative instruments. The income approach is used in this determination utilizing the third party’s proprietary pricing model. The model accounts for our credit risk and the credit risk of our counterparties in the discount rate applied to estimated future cash inflows and outflows. Our swap contracts are included within the Level 2 fair value hierarchy, and our collar and put contracts are included within the Level 3 fair value hierarchy. Significant unobservable inputs used in establishing fair value for the collars and puts are the volatility impacts in the pricing model as it relates to the call portion of the collar and the floor of the put. For a more detailed description of our derivative instruments, see Note 9 – Derivative Instruments and Hedging Activities. We used the market approach in determining the fair value of our investments in marketable securities, which are included within the Level 1 fair value hierarchy.
The following tables present our assets and liabilities that are measured at fair value on a recurring basis at December 31, 2017 (Successor) (in thousands):
Fair Value Measurements | ||||||||||||||||
Successor as of | ||||||||||||||||
December 31, 2017 | ||||||||||||||||
Assets | Total | Quoted Prices in Active Markets for Identical Assets (Level 1) | Significant Other Observable Inputs (Level 2) | Significant Unobservable Inputs (Level 3) | ||||||||||||
Marketable securities (Other assets) | $ | 5,081 | $ | 5,081 | $ | — | $ | — | ||||||||
Derivative contracts | 879 | — | — | 879 | ||||||||||||
Total | $ | 5,960 | $ | 5,081 | $ | — | $ | 879 | ||||||||
Fair Value Measurements | ||||||||||||||||
Successor as of | ||||||||||||||||
December 31, 2017 | ||||||||||||||||
Liabilities | Total | Quoted Prices in Active Markets for Identical Liabilities (Level 1) | Significant Other Observable Inputs (Level 2) | Significant Unobservable Inputs (Level 3) | ||||||||||||
Derivative contracts | $ | 12,054 | $ | — | $ | 10,110 | $ | 1,944 | ||||||||
Total | $ | 12,054 | $ | — | $ | 10,110 | $ | 1,944 | ||||||||
We had no liabilities measured at fair value on a recurring basis at December 31, 2016. The following table presents our assets that are measured at fair value on a recurring basis at December 31, 2016 (Predecessor) (in thousands):
Fair Value Measurements | ||||||||||||||||
Predecessor as of | ||||||||||||||||
December 31, 2016 | ||||||||||||||||
Assets | Total | Quoted Prices in Active Markets for Identical Assets (Level 1) | Significant Other Observable Inputs (Level 2) | Significant Unobservable Inputs (Level 3) | ||||||||||||
Marketable securities (Other assets) | $ | 8,746 | $ | 8,746 | $ | — | $ | — | ||||||||
Total | $ | 8,746 | $ | 8,746 | $ | — | $ | — | ||||||||
F-25
The table below presents a reconciliation for assets and liabilities measured at fair value on a recurring basis using significant unobservable inputs (Level 3) during the period from March 1, 2017 through December 31, 2017 (Successor) and the period from January 1, 2017 through February 28, 2017 (Predecessor) (in thousands):
Hedging Contracts, net | |||||||||
Successor | Predecessor | ||||||||
Period from March 1, 2017 through December 31, 2017 | Period from January 1, 2017 through February 28, 2017 | ||||||||
Beginning balance | $ | 3,087 | $ | — | |||||
Total gains/(losses) (realized or unrealized): | |||||||||
Included in earnings | (5,201 | ) | (649 | ) | |||||
Included in other comprehensive income | — | — | |||||||
Purchases, sales, issuances and settlements | 1,049 | 3,736 | |||||||
Transfers in and out of Level 3 | — | — | |||||||
Ending balance | $ | (1,065 | ) | $ | 3,087 | ||||
The amount of total gains/(losses) for the period included in earnings (derivative income) attributable to the change in unrealized gain/(losses) relating to derivatives still held at December 31, 2017 | $ | (4,699 | ) | ||||||
The fair value of cash and cash equivalents approximated book value at December 31, 2017 and 2016. Upon emergence from bankruptcy on February 28, 2017, the 2017 Convertible Notes and 2022 Notes were cancelled, and the Company issued the 2022 Second Lien Notes. As of December 31, 2016, the fair value of the liability component of the 2017 Convertible Notes was approximately $293.5 million. As of December 31, 2016, the fair value of the 2022 Notes was approximately $465.0 million. As of December 31, 2017, the fair value of the 2022 Second Lien Notes was approximately $227.3 million.
The fair values of the 2022 Notes and the 2022 Second Lien Notes were determined based on quotes obtained from brokers, which represent Level 1 inputs. We applied fair value concepts in determining the liability component of the 2017 Convertible Notes at inception and at December 31, 2016. The fair value of the liability was estimated using an income approach. The significant inputs in these determinations were market interest rates based on quotes obtained from brokers and represent Level 2 inputs.
On February 28, 2017, the Company emerged from bankruptcy and adopted fresh start accounting, which resulted in the Company becoming a new entity for financial reporting purposes. Upon the adoption of fresh start accounting, the Company’s assets and liabilities were recorded at their fair values as of the fresh start reporting date, February 28, 2017. See Note 3 – Fresh Start Accounting for a detailed discussion of the fair value approaches used by the Company. The inputs utilized in the valuation of our most significant asset, our oil and gas properties, included mostly unobservable inputs, which fall within Level 3 of the fair value hierarchy.
F-26
NOTE 11 — ASSET RETIREMENT OBLIGATIONS
Upon emergence from bankruptcy, as discussed in Note 3 – Fresh Start Accounting, the Company adopted fresh start accounting which included the adjustment of asset retirement obligations to estimated fair values at February 28, 2017. The following table presents the change in our asset retirement obligations during the indicated periods (in thousands, inclusive of current portion):
Successor | Predecessor | ||||||||||||||||
Period from March 1, 2017 through December 31, 2017 | Period from January 1, 2017 through February 28, 2017 | Year Ended December 31, | |||||||||||||||
2016 | 2015 | ||||||||||||||||
Beginning balance | $ | 290,067 | $ | 242,019 | $ | 225,866 | $ | 316,409 | |||||||||
Liabilities incurred | 2,280 | — | 2,338 | 15,933 | |||||||||||||
Liabilities settled | (81,197 | ) | (3,641 | ) | (19,630 | ) | (72,713 | ) | |||||||||
Divestment of properties | — | (8,672 | ) | — | (248 | ) | |||||||||||
Accretion expense | 21,151 | 5,447 | 40,229 | 25,988 | |||||||||||||
Revision of estimates | (19,200 | ) | — | (6,784 | ) | (59,503 | ) | ||||||||||
Fair value fresh start adjustment | — | 54,914 | — | — | |||||||||||||
Asset retirement obligations, end of period | $ | 213,101 | $ | 290,067 | $ | 242,019 | $ | 225,866 | |||||||||
NOTE 12 — INCOME TAXES
An analysis of our deferred taxes follows (in thousands):
Successor | Predecessor | |||||||
As of December 31, | As of December 31, | |||||||
2017 | 2016 | |||||||
Tax effect of temporary differences: | ||||||||
Net operating loss carryforwards | $ | 66,304 | $ | 201,557 | ||||
Oil and gas properties | 12,035 | 85,772 | ||||||
Asset retirement obligations | 44,751 | 85,312 | ||||||
Stock compensation | 278 | 3,294 | ||||||
Derivatives | 3,110 | — | ||||||
Accrued incentive compensation | 2,269 | 954 | ||||||
Debt issuance costs | 644 | 7,480 | ||||||
Other | 1,600 | 441 | ||||||
Total deferred tax assets (liabilities) | 130,991 | 384,810 | ||||||
Valuation allowance | (130,991 | ) | (384,810 | ) | ||||
Net deferred tax assets (liabilities) | $ | — | $ | — | ||||
Upon our emergence from bankruptcy, pursuant to the terms of the Plan, a substantial portion of the Company’s pre-petition debt was extinguished (see Note 2 – Reorganization). For tax purposes, absent an exception, a debtor recognizes cancellation of indebtedness income (“CODI”) upon discharge of its outstanding indebtedness for an amount of consideration that is less than its adjusted issue price. The IRC provides that a debtor in a bankruptcy case may exclude CODI from taxable income but must reduce certain of its tax attributes by the amount of any CODI realized as a result of the consummation of a plan of reorganization. The amount of CODI realized by a taxpayer is the adjusted issue price of any indebtedness discharged less the sum of (i) the amount of cash paid, (ii) the issue price of any new indebtedness issued and (iii) the fair market value of any other consideration, including equity, issued. After consideration of the market value of the Company’s equity upon emergence from Chapter 11 bankruptcy proceedings, the estimated amount of U.S. CODI is approximately $257 million, which will reduce the value of the Company’s U.S. net operating losses. The actual reduction in tax attributes does not occur until the first day of the Company’s tax year subsequent to the date of emergence, or January 1, 2018. The estimated results of the attribute reduction have been reflected in the Company’s ending balance of deferred tax assets for the year ended December 31, 2017 (Successor). The Successor Company
F-27
also has various state net operating loss carryforwards that are subject to reduction as a result of the CODI being excluded from taxable income, however, subsequent to the sale of the Appalachia Properties, our state income tax exposure is not expected to be material.
On December 22, 2017, the U.S. government enacted comprehensive tax legislation commonly referred to as the Tax Cuts and Jobs Act (the “Tax Act”). Generally effective for tax years 2018 and beyond, the Tax Act makes broad and complex changes to the IRC, including, but not limited to, (i) reducing the U.S. federal corporate tax rate from 35% to 21%; (ii) eliminating the corporate alternative minimum tax (“AMT”) and changing how existing AMT credits are realized; (iii) creating a new limitation on deductible interest expense; and (iv) changing rules related to uses and limitation of net operating loss carryforwards created in tax years beginning after December 31, 2017. As of December 31, 2017, we have not completed our accounting for the tax effects of enactment of the Tax Act. However, we have made a reasonable estimate of the effects on our existing deferred tax balances and recognized a provisional amount of $87.3 million to remeasure our deferred tax assets and liabilities based on the rates at which they are expected to reverse in the future, which is generally 21%. This amount is included as a component of income tax expense (benefit) from continuing operations and is fully offset by the related adjustment to our valuation allowance. We are still analyzing certain aspects of the Tax Act and refining our calculations, which could potentially affect the measurement of these balances or potentially give rise to new deferred tax amounts.
We estimate that we had ($18.3) million and $3.6 million, respectively, of current federal income tax expense (benefit) for the periods of March 1, 2017 through December 31, 2017 (Successor) and the period of January 1, 2017 through February 28, 2017 (Predecessor). For the years ended December 31, 2016 and 2015 (Predecessor) we had ($5.7) million and ($44.1) million, respectively, of current federal income tax (benefits). There was no deferred income tax expense (benefit) recorded for the periods of March 1, 2017 through December 31, 2017 (Successor) and the period of January 1, 2017 through February 28, 2017 (Predecessor). For the years ended December 31, 2016 and 2015 (Predecessor), we recorded a deferred income tax expense (benefit) of $13.1 million and ($272.3) million, respectively. The deferred income tax benefit in 2015 was a result of our losses before income taxes attributable primarily to ceiling test write-downs of our oil and gas properties (see Note 22 – Supplemental Information on Oil and Natural Gas Operations – Unaudited). We had current income tax receivables of $36.3 million and $26.1 million at December 31, 2017 (Successor) and 2016 (Predecessor), respectively, both of which related to expected tax refunds from the carryback of net operating losses to previous tax years. We received $20.6 million of the tax refund subsequent to December 31, 2017.
For tax reporting purposes, our net operating loss carryforwards totaled approximately $315.7 million at December 31, 2017 (net of the aforementioned CODI reduction). If not utilized, such carryforwards would begin to expire in 2035 and would fully expire in 2036. Additionally, IRC Section 382 provides an annual limitation with respect to the ability of a corporation to utilize its tax attributes, as well as certain built-in-losses, against future U.S. taxable income in the event of a change in ownership. The Company’s emergence from Chapter 11 bankruptcy proceedings resulted in a change in ownership for purposes of IRC Section 382. Accordingly, we estimate that approximately $127 million of our net operating loss carryforwards will be subject to the annual IRC Section 382 limitation, with the remaining $189 million of net operating loss carryforwards being unlimited.
In addition, we had approximately $1.2 million in statutory depletion deductions available for tax reporting purposes that may be carried forward indefinitely. Recognition of a deferred tax asset associated with these and other carryforwards is dependent upon our evaluation that it is more likely than not that the asset will ultimately be realized. As a result of the significant declines in commodity prices and the resulting ceiling test write-downs and net losses incurred, we determined during 2015 that it was more likely than not that a portion of our deferred tax assets will not be realized in the future. Accordingly, we established a valuation allowance against a portion of our deferred tax assets. As of December 31, 2017 (Successor), our valuation allowance totaled $131.0 million. Our assessment of the realizability of our deferred tax assets is based on the weight of all available evidence, both positive and negative, including future reversals of deferred tax liabilities.
F-28
The following table provides a reconciliation of the statutory federal income tax rate to the Company’s effective income tax rate as a percentage of income before income taxes for the indicated periods:
Successor | Predecessor | |||||||
Period from March 1, 2017 through December 31, 2017 | Period from January 1, 2017 through February 28, 2017 | Year Ended December 31, | ||||||
2016 | 2015 | |||||||
Income tax expense computed at the statutory federal income tax rate | 35.0% | 35.0% | 35.0% | 35.0% | ||||
Tax Act rate change | (32.8) | — | — | — | ||||
State taxes | (0.7) | 0.3 | 0.2 | 0.6 | ||||
Change in valuation allowance | 5.3 | (37.8) | (35.0) | (12.8) | ||||
IRC Sec. 162(m) limitation | 0.4 | — | (0.3) | (0.1) | ||||
Tax deficits on stock compensation | (0.6) | 0.6 | (0.7) | (0.1) | ||||
Reorganization fees | 0.3 | 2.5 | (0.3) | — | ||||
Other | — | — | (0.2) | (0.1) | ||||
Effective income tax rate | 6.9% | 0.6% | (1.3)% | 22.5% | ||||
There were no income taxes allocated to accumulated other comprehensive income for the periods of March 1, 2017 through December 31, 2017 (Successor) and January 1, 2017 through February 28, 2017 (Predecessor). Income taxes allocated to accumulated other comprehensive income related to oil and gas hedges amounted to ($13.1) million, ($35.7) million for the years ended December 31, 2016 and 2015 (Predecessor), respectively.
As of December 31, 2017 (Successor), we had unrecognized tax benefits of $491 thousand. If recognized, all of our unrecognized tax benefits would impact our effective tax rate. A reconciliation of the total amounts of unrecognized tax benefits follows (in thousands):
Successor | Predecessor | |||||||
Period from March 1, 2017 through December 31, 2017 | Period from January 1, 2017 through February 28, 2017 | |||||||
Total unrecognized tax benefits, beginning balance | $ | 491 | $ | 491 | ||||
Increases (decreases) in unrecognized tax benefits as a result of: | ||||||||
Tax positions taken during a prior period | — | — | ||||||
Tax positions taken during the current period | — | — | ||||||
Settlements with taxing authorities | — | — | ||||||
Lapse of applicable statute of limitations | — | — | ||||||
Total unrecognized tax benefits, ending balance | $ | 491 | $ | 491 | ||||
Our unrecognized tax benefits pertain to a proposed state income tax audit adjustment. We believe that our unrecognized tax benefits may be reduced to zero within the next 12 months upon completion and ultimate settlement of the examination.
It is our policy to classify interest and penalties associated with underpayment of income taxes as interest expense and general and administrative expenses, respectively. We recognized $33 thousand and $7 thousand, respectively, of interest expense and no penalties related to uncertain tax positions for the periods of March 1, 2017 through December 31, 2017 (Successor) and January 1, 2017 through February 28, 2017 (Predecessor). We recognized $46 thousand of interest expense and no penalties related to uncertain tax positions for the year ended December 31, 2016 (Predecessor). We recognized $131 thousand of interest expense and no penalties related to uncertain tax positions for the year ended December 31, 2015 (Predecessor). The liabilities for unrecognized tax benefits and accrued interest payable are components of other current liabilities on our balance sheet.
The tax years 2014 through 2017 remain subject to examination by major tax jurisdictions.
F-29
NOTE 13 — DEBT
Our debt balances (net of related unamortized discounts and debt issuance costs) as of December 31, 2017 and 2016 were as follows (in thousands):
Successor | Predecessor | |||||||
December 31, | December 31, | |||||||
2017 | 2016 | |||||||
7 1⁄2% Senior Second Lien Notes due 2022 | $ | 225,000 | $ | — | ||||
1 3⁄4% Senior Convertible Notes due 2017 | — | 300,000 | ||||||
7 1⁄2% Senior Notes due 2022 | — | 775,000 | ||||||
Predecessor revolving credit facility | — | 341,500 | ||||||
4.20% Building Loan | 10,927 | 11,284 | ||||||
Total debt | $ | 235,927 | $ | 1,427,784 | ||||
Less: current portion of long-term debt | (425 | ) | (408 | ) | ||||
Less: liabilities subject to compromise | — | (1,075,000 | ) | |||||
Long-term debt | $ | 235,502 | $ | 352,376 | ||||
Reorganization
On December 14, 2016, the Debtors filed Bankruptcy Petitions seeking relief under Chapter 11 of the Bankruptcy Code to pursue a prepackaged plan of reorganization. The 2017 Convertible Notes and 2022 Notes were impacted by the Chapter 11 process and were classified in the accompanying consolidated balance sheet at December 31, 2016 as liabilities subject to compromise under the provisions of ASC 852, “Reorganizations”. On February 15, 2017, the Bankruptcy Court entered an order confirming the Plan, and on February 28, 2017, the Plan became effective and the Debtors emerged from bankruptcy. Upon emergence from bankruptcy, pursuant to the terms of the Plan, the Predecessor Company’s 2017 Convertible Notes and 2022 Notes were cancelled, the Predecessor Company’s Pre-Emergence Credit Agreement was amended and restated, and the Company issued the 2022 Second Lien Notes.
Current Portion of Long-Term Debt
As of December 31, 2017 (Successor), the current portion of long-term debt of $0.4 million represented principal payments due within one year on the 4.20% Building Loan (the “Building Loan”).
Reclassification of Debt
The face values of the 2017 Convertible Notes of $300 million and the 2022 Notes of $775 million were reclassified as liabilities subject to compromise in the accompanying consolidated balance sheet at December 31, 2016 (Predecessor). See Note 1 – Organization and Summary of Significant Accounting Policies.
Successor Revolving Credit Facility
On the Effective Date, pursuant to the terms of the Plan, the Company entered into the Fifth Amended and Restated Credit Agreement with the lenders party thereto and Bank of America, N.A. (as amended from time to time, the “Amended Credit Agreement”), as administrative agent and issuing lender, which amended and replaced the Company’s Pre-Emergence Credit Agreement. The Amended Credit Agreement provides for a reserve-based revolving credit facility and matures on February 28, 2021.
The Company’s available borrowings under the Amended Credit Agreement were initially set at $150 million until the first borrowing base redetermination in November 2017. On November 8, 2017, the borrowing base under the Amended Credit Agreement was redetermined to $100 million. On December 31, 2017, the Company had no outstanding borrowings and $12.6 million of outstanding letters of credit, leaving $87.4 million of availability under the Amended Credit Agreement. Interest on loans under the Amended Credit Agreement is calculated using the London Interbank Offering Rate (“LIBOR”) or the base rate, at the election of the Company, plus, in each case, an applicable margin. The applicable margin is determined based on borrowing base utilization and ranges from 2.00% to 3.00% per annum for base rate loans and 3.00% to 4.00% per annum for LIBOR loans.
The borrowing base under the Amended Credit Agreement is redetermined semi-annually, in May and November, by the lenders, in accordance with the lenders’ customary practices for oil and gas loans. In addition, we and the lenders each have
F-30
discretion at any time, but not more than two additional times each in any calendar year, to have the borrowing base redetermined. Subject to certain exceptions, the Amended Credit Agreement is required to be guaranteed by all of the material domestic direct and indirect subsidiaries of the Company. As of December 31, 2017, the Amended Credit Agreement is guaranteed by Stone Offshore. The Amended Credit Agreement is secured by substantially all of the Company’s and its subsidiaries’ assets.
The Amended Credit Agreement provides for customary optional and mandatory prepayments, affirmative and negative covenants and events of default, including limitations on the incurrence of debt, liens, restrictive agreements, mergers, asset sales, dividends, investments, affiliate transactions and restrictions on commodity hedging. During the continuance of certain events of default, the lenders may take a number of actions, including declaring the entire amount then outstanding under the Amended Credit Agreement due and payable (in the event of certain insolvency-related events, the entire amount then outstanding under the Amended Credit Agreement will become automatically due and payable). The Amended Credit Agreement also requires maintenance of certain financial covenants, including (i) a consolidated funded debt to EBITDA ratio of not more than 2.75x for the test period ending March 31, 2017, 2.50x for the test period ending June 30, 2017, 3.00x for the test period ending September 30, 2017, 2.75x for the test period ending December 31, 2017, 2.50x for the test periods ending March 31, 2018, June 30, 2018, September 30, 2018 and December 31, 2018, respectively, 2.75x for the test period ending March 31, 2019, 3.00x for the test period ending June 30, 2019, 3.50x for the test periods ending September 30, 2019 and December 31, 2019, respectively, 3.00x for the test period ending March 31, 2020, 2.75x for the test periods ending June 30, 2020 and September 30, 2020, respectively, and 2.50x for the test periods ending December 31, 2020 and March 31, 2021, respectively, (ii) a consolidated interest coverage ratio of not less than 2.75 to 1.00, and (iii) a requirement to maintain minimum liquidity of at least 20% of the borrowing base. We were in compliance with all covenants under the Amended Credit Agreement as of December 31, 2017.
Predecessor Revolving Credit Facility
On June 24, 2014, the Predecessor Company entered into the Pre-Emergence Credit Agreement with the lenders party thereto and Bank of America, N.A., as administrative agent and issuing lender, with commitments totaling $900 million (subject to borrowing base limitations). The borrowing base under the Pre-Emergence Credit Agreement prior to its amendment and restatement as the Amended Credit Agreement was $150 million. Interest on loans under the Pre-Emergence Credit Agreement was calculated using the LIBOR rate or the base rate, at our election. The margin for loans at the LIBOR rate was determined based on borrowing base utilization and ranged from 1.500% to 2.500%.
Prior to emergence from bankruptcy, the Predecessor Company had $341.5 million of outstanding borrowings and $12.5 million of outstanding letters of credit under the Pre-Emergence Credit Agreement. At emergence, the outstanding borrowings were paid in full and the $12.5 million of outstanding letters of credit were converted to obligations under the Amended Credit Agreement.
Building Loan
On November 20, 2015, we entered into an approximately $11.8 million term loan agreement, the Building Loan, maturing on November 20, 2030. There were no changes to the terms of the Building Loan pursuant to the Plan. The Building Loan bears interest at a rate of 4.20% per annum and is to be repaid in 180 equal monthly installments of approximately $73,000 commencing on December 20, 2015. As of December 31, 2017, the outstanding balance under the Building Loan totaled $10.9 million.
The Building Loan is collateralized by our two Lafayette, Louisiana office buildings. Under the financial covenants of the Building Loan, we must maintain a ratio of EBITDA to Net Interest Expense of not less than 2.00 to 1.00. In addition, the Building Loan contains certain customary restrictions or requirements with respect to change of control and reporting responsibilities. We were in compliance with all covenants under the Building Loan as of December 31, 2017.
Successor 2022 Second Lien Notes
On the Effective Date, pursuant to the terms of the Plan, the Successor Company entered into an indenture by and among the Company, Stone Offshore, as guarantor (the “Guarantor”), and The Bank of New York Mellon Trust Company, N.A., as trustee and collateral agent (the “2022 Second Lien Notes Indenture”), and issued $225 million of the Company’s 2022 Second Lien Notes pursuant thereto.
Interest on the 2022 Second Lien Notes accrues at a rate of 7.50% per annum payable semi-annually in arrears on May 31 and November 30 of each year in cash, beginning November 30, 2017. At December 31, 2017, $1.4 million had been accrued in connection with the May 31, 2018 interest payment. The 2022 Second Lien Notes are secured on a second lien priority basis by the same collateral that secures the Amended Credit Agreement, including the Company’s oil and natural gas properties, and are guaranteed by the Guarantor. The 2022 Second Lien Notes mature on May 31, 2022. Pursuant to the terms of the Intercreditor Agreement (as defined below), the security interest in those assets that secure the 2022 Second Lien Notes and the related guarantee
F-31
are contractually subordinated to liens thereon that secure the Company’s Amended Credit Agreement and certain other permitted obligations as set forth in the 2022 Second Lien Notes Indenture. Consequently, the 2022 Second Lien Notes and the related guarantee are effectively subordinated to the Amended Credit Agreement and such other permitted secured indebtedness to the extent of the value of such assets.
At any time prior to May 31, 2020, the Company may, at its option, on any one or more occasions redeem up to 35% of the aggregate principal amount of the 2022 Second Lien Notes issued under the 2022 Second Lien Notes Indenture at a redemption price of 107.5% of the principal amount of the 2022 Second Lien Notes, plus accrued and unpaid interest to the redemption date, with an amount of cash equal to the net cash proceeds of certain equity offerings; provided that at least 65% of the aggregate principal amount of the 2022 Second Lien Notes as of the Effective Date remains outstanding after each such redemption. On or after May 31, 2020, the Company may redeem all or part of the 2022 Second Lien Notes at redemption prices (expressed as percentages of the principal amount) equal to (i) 105.625% for the twelve-month period beginning on May 31, 2020; (ii) 105.625% for the twelve-month period beginning on May 31, 2021; and (iii) 100.000% for the twelve-month period beginning on May 31, 2022 and at any time thereafter, in each case, plus accrued and unpaid interest at the redemption date. In addition, at any time prior to May 31, 2020, the Company may redeem all or a part of the 2022 Second Lien Notes at a redemption price equal to 100% of the principal amount of the 2022 Second Lien Notes to be redeemed plus a make-whole premium, plus accrued and unpaid interest to the redemption date.
The 2022 Second Lien Notes Indenture contains covenants that restrict the Company’s ability and the ability of certain of its subsidiaries to: (i) incur additional debt and issue preferred stock; (ii) make payments or distributions on account of the Company’s or its restricted subsidiaries’ capital stock; (iii) sell assets; (iv) restrict dividends or other payments of the Company’s restricted subsidiaries; (v) create liens that secure debt; (vi) enter into transactions with affiliates, and (vii) merge or consolidate with another company. These covenants are subject to a number of important exceptions and qualifications. At any time when the 2022 Second Lien Notes are rated investment grade by both Moody’s Investors Service, Inc. and Standard & Poor’s Ratings Services, a division of The McGraw-Hill Companies, Inc., and no Default (as defined in the 2022 Second Lien Notes Indenture) has occurred and is continuing, many of these covenants will terminate.
The 2022 Second Lien Notes Indenture also provides for certain events of default. In the case of an event of default arising from certain events of bankruptcy, insolvency or reorganization with respect to the Company or any of the Company’s restricted subsidiaries that is a significant subsidiary, or any group of the Company’s restricted subsidiaries that, taken as a whole, would constitute a significant subsidiary of the Company, all outstanding 2022 Second Lien Notes will become due and immediately payable without further action or notice. If any other event of default occurs and is continuing, the trustee of the 2022 Second Lien Notes or the holders of at least 25% in aggregate principal amount of the then outstanding 2022 Second Lien Notes may declare all the 2022 Second Lien Notes to be due and payable immediately.
Intercreditor Agreement
On the Effective Date, Bank of America, N.A., as priority lien agent, The Bank of New York Mellon Trust Company, N.A., as second lien collateral agent, and The Bank of New York Mellon Trust Company, N.A., as the 2022 Second Lien Notes trustee, entered into an intercreditor agreement, which was acknowledged and agreed to by the Company and the Guarantor (the “Intercreditor Agreement”) to govern the relationship of holders of the 2022 Second Lien Notes, the lenders under the Amended Credit Agreement and holders of other priority lien obligations, with respect to collateral and certain other matters.
Predecessor Senior Notes
2017 Convertible Notes. On March 6, 2012, the Predecessor Company issued in a private offering $300 million in aggregate principal amount of the 2017 Convertible Notes to qualified institutional buyers pursuant to Rule 144A under the Securities Act of 1933, as amended. The 2017 Convertible Notes were convertible into cash, shares of our common stock or a combination of cash and shares of our common stock, based on an initial conversion rate of 23.4449 shares of our common stock per $1,000 principal amount of 2017 Convertible Notes, which corresponded to an initial conversion price of approximately $42.65 per share of our common stock at the time of the issuance of the 2017 Convertible Notes. On June 10, 2016, we completed a 1-for-10 reverse stock split with respect to our common stock and proportional adjustments were made to the conversion price and shares as they relate to the 2017 Convertible Notes, resulting in a conversion rate of 2.34449 shares of our common stock with a corresponding conversion price of $426.50 per share.
The 2017 Convertible Notes were due on March 1, 2017. Upon emergence from bankruptcy on February 28, 2017, pursuant to the Plan, the $300 million of debt related to the 2017 Convertible Notes was cancelled. See Note 2 – Reorganization for additional details.
F-32
During the year ended December 31, 2016 (Predecessor), we recognized $15.4 million of interest expense for the amortization of the discount and $1.5 million of interest expense for the amortization of debt issuance costs related to the 2017 Convertible Notes. During the year ended December 31, 2015 (Predecessor), we recognized $15.0 million of interest expense for the amortization of the discount and $1.4 million of interest expense for the amortization of debt issuance costs related to the 2017 Convertible Notes.
2022 Notes. On November 8, 2012 and November 27, 2013, respectively, the Predecessor Company completed the public offering of $300 million and $475 million aggregate principal amount of the 2022 Notes. The 2022 Notes were scheduled to mature on November 15, 2022. Upon emergence from bankruptcy, pursuant to the Plan, the $775 million of debt related to the 2022 Notes was cancelled. See Note 2 – Reorganization for additional details.
Deferred Financing Cost and Interest Cost
In accordance with the provisions of ASC 852, we recognized a charge of approximately $8.3 million to write-off the remaining unamortized debt issuance costs, discounts and premiums related to the 2017 Convertible Notes and 2022 Notes, which is included in reorganization items in the accompanying consolidated statement of operations for the year ended December 31, 2016 (Predecessor). Additionally, we recognized a charge of approximately $2.6 million to write-off the remaining unamortized debt issuance costs related to the Pre-Emergence Credit Agreement as of the Petition Date, which is included in reorganization items in the consolidated statement of operations during the period from January 1, 2017 through February 28, 2017 (Predecessor). See Note 1 – Organization and Summary of Significant Accounting Policies and Note 3 – Fresh Start Accounting for additional details.
At December 31, 2017 (Successor) and December 31, 2016 (Predecessor), approximately $59 thousand and $63 thousand, respectively, of unamortized debt issuance costs were deducted from the carrying amount of the Building Loan. At December 31, 2016 (Predecessor), approximately $2.8 million of debt issuance costs related to the Pre-Emergence Credit Agreement were classified as other assets.
Prior to the filing of the Bankruptcy Petitions, the costs associated with the 2017 Convertible Notes were being amortized over the life of the notes using a method that applied an effective interest rate of 7.51%. The costs associated with the November 2012 issuance and November 2013 issuance of the 2022 Notes were being amortized over the life of the notes using a method that applied effective interest rates of 7.75% and 7.04%, respectively. The costs associated with the Pre-Emergence Credit Agreement were being amortized on a straight-line basis over the term of the facility. The costs associated with the issuance of the Building Loan are being amortized using the effective interest method over the term of the Building Loan.
Total interest cost incurred, before capitalization, on all obligations for the period from March 1, 2017 through December 31, 2017 (Successor) was $15.7 million. Total interest cost incurred, before capitalization, on all obligations for the years ended December 31, 2016 and 2015 (Predecessor) was $91.1 million and $85.3 million, respectively. In accordance with the accounting guidance in ASC 852, we accrued interest on the 2017 Convertible Notes and 2022 Notes only up to the Petition Date, and such amounts were included as liabilities subject to compromise in our consolidated balance sheet at December 31, 2016 (Predecessor). Accordingly, there was no interest expense recognized on the 2017 Convertible Notes or the 2022 Notes after the Bankruptcy Petitions were filed.
NOTE 14 — ACCUMULATED OTHER COMPREHENSIVE INCOME (LOSS)
Through December 31, 2016, we designated our commodity derivatives as cash flow hedges for accounting purposes upon entering into the contracts, and accordingly, changes in the fair value of the derivative were recognized in stockholders’ equity through other comprehensive income (loss), net of related taxes, to the extent the hedge was considered effective. We had no outstanding derivative contracts at December 31, 2016.
During the periods from March 1, 2017 through December 31, 2017 (Successor) and January 1, 2017 through February 28, 2017 (Predecessor), we entered into various commodity derivative contracts (see Note 9 – Derivative Instruments and Hedging Activities). With respect to our 2017, 2018 and 2019 commodity derivative contracts, we have elected to not designate these contracts as cash flow hedges for accounting purposes. Accordingly, the net changes in the mark-to-market valuations and the monthly settlements of these derivative contracts will be recorded in earnings through derivative income (expense).
During the year ended December 31, 2016, we reclassified a $6.1 million loss related to cumulative foreign currency translation adjustments from accumulated other comprehensive income into other operational expenses upon the liquidation of our former foreign subsidiary, Stone Energy Canada, ULC.
F-33
The following tables include the changes in accumulated other comprehensive income (loss) by component for the years ended December 31, 2016 and 2015 (Predecessor) (in thousands):
Cash Flow Hedges | Foreign Currency Items | Total | |||||||||
For the Year Ended December 31, 2016 (Predecessor) | |||||||||||
Beginning balance, net of tax | $ | 24,025 | $ | (6,073 | ) | $ | 17,952 | ||||
Other comprehensive income (loss) before reclassifications: | |||||||||||
Change in fair value of derivatives | (1,648 | ) | — | (1,648 | ) | ||||||
Foreign currency translations | — | (8 | ) | (8 | ) | ||||||
Income tax effect | 581 | — | 581 | ||||||||
Net of tax | (1,067 | ) | (8 | ) | (1,075 | ) | |||||
Amounts reclassified from accumulated other comprehensive income: | |||||||||||
Operating revenue: oil/natural gas production | 35,457 | — | 35,457 | ||||||||
Other operational expenses | — | (6,081 | ) | (6,081 | ) | ||||||
Income tax effect | (12,499 | ) | — | (12,499 | ) | ||||||
Net of tax | 22,958 | (6,081 | ) | 16,877 | |||||||
Other comprehensive income (loss), net of tax | (24,025 | ) | 6,073 | (17,952 | ) | ||||||
Ending balance, net of tax | $ | — | $ | — | $ | — | |||||
Cash Flow Hedges | Foreign Currency Items | Total | |||||||||
For the Year Ended December 31, 2015 (Predecessor) | |||||||||||
Beginning balance, net of tax | $ | 86,783 | $ | (3,468 | ) | $ | 83,315 | ||||
Other comprehensive income (loss) before reclassifications: | |||||||||||
Change in fair value of derivatives | 52,630 | — | 52,630 | ||||||||
Foreign currency translations | — | (2,605 | ) | (2,605 | ) | ||||||
Income tax effect | (19,096 | ) | — | (19,096 | ) | ||||||
Net of tax | 33,534 | (2,605 | ) | 30,929 | |||||||
Amounts reclassified from accumulated other comprehensive income: | |||||||||||
Operating revenue: oil/natural gas production | 149,955 | — | 149,955 | ||||||||
Derivative income, net | 1,170 | — | 1,170 | ||||||||
Income tax effect | (54,833 | ) | — | (54,833 | ) | ||||||
Net of tax | 96,292 | — | 96,292 | ||||||||
Other comprehensive loss, net of tax | (62,758 | ) | (2,605 | ) | (65,363 | ) | |||||
Ending balance, net of tax | $ | 24,025 | $ | (6,073 | ) | $ | 17,952 | ||||
NOTE 15 — EMPLOYEE BENEFIT PLANS
We entered into deferred compensation and disability agreements with certain of our former officers. The benefits under the deferred compensation agreements vested after certain periods of employment, and at December 31, 2017 (Successor), the liability for such vested benefits was approximately $0.9 million and is recorded in current and other long-term liabilities. The deferred compensation plan is described further below.
The following is a brief description of each incentive compensation plan applicable to our employees:
Annual Incentive Cash Compensation Plans
In 2016, we replaced our historical long-term cash and equity-based incentive compensation programs with the 2016 Performance Incentive Compensation Plan (the “2016 Annual Incentive Plan”), pursuant to which incentive cash bonuses were
F-34
calculated based on the achievement of certain strategic objectives for each quarter of 2016. On July 25, 2017, the Board approved the Stone Energy Corporation 2017 Annual Incentive Compensation Plan (the “2017 Annual Incentive Plan”) for all salaried employees (other than the interim chief executive officer) of the Company. The 2017 Annual Incentive Plan is a performance-based short-term cash incentive program that provides award opportunities based on the Company’s annual performance in certain performance measures as defined by the Board. The 2017 Annual Incentive Plan replaced the Company’s Amended and Restated Revised Annual Incentive Compensation Plan, which was adopted in November 2007, and the 2016 Annual Incentive Plan.
For the period from March 1, 2017 through December 31, 2017 (Successor), Stone incurred expenses of $7.0 million, net of amounts capitalized, related to incentive compensation cash bonuses. Stone incurred expenses of $13.5 million and $2.2 million, net of amounts capitalized, for each of the years ended December 31, 2016 and 2015 (Predecessor), respectively, related to incentive compensation cash bonuses. These charges are reflected in incentive compensation expense on the statement of operations.
Key Executive Incentive Plan
Pursuant to the terms of the Executive Claims Settlement Agreement, the Company’s executives agreed to waive their claims related to the Company’s 2016 Annual Incentive Plan, and in exchange therefor, the Company adopted the Stone Energy Corporation Key Executive Incentive Plan (“KEIP”), in which the Company’s executives were allowed to participate. Payments to the Company’s executives under the KEIP were limited to $2.0 million, or the equivalent of the target bonus under the 2016 Annual Incentive Plan for the fourth quarter of 2016. The KEIP payments of $2.0 million are reflected in incentive compensation expense on the statement of operations for the period from January 1, 2017 through February 28, 2017 (Predecessor).
Retention Award Agreement
On July 25, 2017, the Board approved retention awards and the form of Stone Energy Corporation Retention Award Agreement (the “Retention Award Agreement”) and authorized the Company to enter into Retention Award Agreements with certain executive officers and employees of the Company. The Retention Award Agreement provides for a retention award to certain individuals to be paid in a lump sum cash payment within 30 days of the earliest to occur of (i) the first anniversary (June 1, 2018) of the effective date of the Retention Award Agreement, subject to the individual remaining employed by the Company or a subsidiary of the Company on such date, (ii) a change in control of the Company or (iii) a termination of the individual’s employment with the Company (a) due to death, (b) by the Company without “cause” or (c) by the individual for “good reason.” We recognized a charge of $1.0 million for the period from March 1, 2017 through December 31, 2017 (Successor), representing a prorated portion of estimated retention awards through December 31, 2017. This charge is reflected in incentive compensation expense on the statement of operations.
Transaction Bonus Agreement
On November 21, 2017, the Board approved transaction bonuses and the form of Stone Energy Corporation Transaction Bonus Agreement (the “Transaction Bonus Agreement”) and authorized the Company to enter into Transaction Bonus Agreements with certain of our executive officers and other employees of the Company. The Transaction Bonus Agreements provide for a lump sum cash payment within 30 days of a “change in control” (as defined in the Transaction Bonus Agreement) if the individual remains employed with the Company through the date of the “change in control” or is terminated prior to the change in control (i) due to death, (ii) by the Company without “cause” (as defined below) (including due to disability), or (iii) by the individual for “good reason” (as defined in the Transaction Bonus Agreement). The Transaction Bonus Agreements were entered into in connection with the Talos combination.
2017 Long-Term Incentive Plan
On the Effective Date, pursuant to the Plan, the Stone Energy Corporation 2017 Long-Term Incentive Plan (the “2017 LTIP”) became effective, replacing the Stone Energy Corporation 2009 Amended and Restated Stock Incentive Plan (As Amended and Restated December 17, 2015). The types of awards that may be granted under the 2017 LTIP include stock options, restricted stock, restricted stock units, dividend equivalents and other forms of awards granted or denominated in shares of New Common Stock, as well as certain cash-based awards. The maximum number of shares of New Common Stock that may be issued or transferred pursuant to awards under the 2017 LTIP is 2,614,379. As of March 9, 2018, other than the grant of 62,137 restricted stock units to the Board (see Note 16 – Share-Based Compensation), there have been no other issuances or awards of stock under the 2017 LTIP.
F-35
401(k) and Deferred Compensation Plans
The Stone Energy 401(k) Profit Sharing Plan provides eligible employees with the option to defer receipt of a portion of their compensation and we may, at our discretion, match a portion or all of the employee’s deferral. The amounts held under the plan are invested in various investment funds maintained by a third party in accordance with the direction of each employee. An employee is 20% vested in matching contributions (if any) for each year of service and is fully vested upon five years of service. For the period from March 1, 2017 through December 31, 2017 (Successor) and the period of January 1, 2017 through February 28, 2017 (Predecessor), Stone contributed $0.6 million and $0.3 million, respectively, to the plan. For the years ended December 31, 2016 and 2015 (Predecessor), Stone contributed $1.2 million and $1.6 million, respectively, to the plan.
The Stone Energy Corporation Deferred Compensation Plan (the “Deferred Compensation Plan”) provides eligible executives and employees with the option to defer up to 100% of their eligible compensation for a calendar year. Historically, we could, at our discretion, match a portion or all of the participant’s deferral based upon a percentage determined by our Board. In 2016, the compensation committee of the Predecessor board adopted an amendment to the Deferred Compensation Plan that removed our ability to make matching contributions under such plan. Our Board may still elect to make discretionary profit sharing contributions to the plan. To date, there have been no matching or discretionary profit sharing contributions made by Stone under the Deferred Compensation Plan. The amounts held under the plan are invested in various investment funds maintained by a third party in accordance with the direction of each participant. At December 31, 2017 (Successor) and December 31, 2016 (Predecessor), plan assets of $5.1 million and $8.7 million, respectively, were included in other assets. An equal amount of plan liabilities were included in other long-term liabilities.
Change of Control and Severance Plans
On July 25, 2017, the Board approved the Stone Energy Corporation Executive Severance Plan (the “Executive Severance Plan”), which provides for the payment of severance and change in control benefits to the executive officers (other than the interim chief executive officer) of the Company. The Executive Severance Plan replaced the Stone Energy Corporation Executive Severance Plan dated December 13, 2016. Pursuant to the Executive Severance Plan, if a covered executive officer is terminated (i) by the Company without “cause” or (ii) by the executive officer for “good reason” (each, an “Involuntary Termination”), the executive officer will receive (i) a lump sum cash payment in an amount equal to 1.0x or 1.5x the executive officer’s annual base salary, (ii) a lump sum cash payment equal to 100% of the executive officer’s annual bonus opportunity, at target, prorated by the number of days that have elapsed from January 1 of that calendar year, (iii) six months of health benefit continuation for the executive officer and the executive officer’s dependents, at a cost to the participant that is equal to the cost for an active employee for similar coverage, (iv) accelerated vesting of any outstanding and unvested equity awards, (v) certain outplacement services and (vi) any unpaid portion of the executive officer’s annual pay as of the date of the Involuntary Termination. The Executive Severance Plan was amended on November 21, 2017 in connection with the proposed Talos combination to provide, among other things, that if a participant in the plan experiences a qualifying termination of employment during the twelve month period following Closing, such participant’s target bonus will be no less than such participant’s target bonus for the 2017 calendar year.
On July 25, 2017, the Board approved the Stone Energy Corporation Employee Severance Plan (the “2017 Employee Severance Plan”). The 2017 Employee Severance Plan covers all full-time employees other than officers. Severance is triggered by an involuntary termination of employment on and during the twelve-month period following a change of control. Employees who are terminated within the scope of the 2017 Employee Severance Plan will be entitled to certain payments and benefits including the following: (i) a lump sum equal to (1) weekly pay times full years of service, plus (2) one week’s pay for each full $10 thousand of annual pay, but the sum of (1) and (2) cannot be less than 12 weeks of pay or greater than 52 weeks of pay, (ii) continued health plan coverage for 6 months at a cost to the participant that is equal to the cost for an active employee for similar coverage, (iii) a prorated portion of the employee’s targeted bonus for the year, and (iv) reasonable outplacement services consistent with current HR practices. The 2017 Employee Severance Plan was amended on November 21, 2017 in connection with the proposed Talos combination to provide, among other things, that if a participant in the plan experiences a qualifying termination of employment during the twelve month period following Closing, such participant’s target bonus will be no less than such participant’s target bonus for the 2017 calendar year. The 2017 Employee Severance Plan replaced the Stone Energy Corporation Employee Change of Control Severance Plan, dated December 7, 2007.
NOTE 16 — SHARE-BASED COMPENSATION
On the Effective Date, pursuant to the Plan, the 2017 LTIP became effective. As discussed in Note 15 – Employee Benefit Plans, the types of awards that may be granted under the 2017 LTIP include stock options, restricted stock, restricted stock units, dividend equivalents and other forms of awards granted or denominated in shares of New Common Stock, as well as certain cash-based awards.
F-36
We record share-based compensation expense for share-based compensation awards based on the fair value on the date of grant. Compensation expense for share-based compensation awards is recognized in our statement of operations on a straight-line basis over the vesting period of the award. Under the full cost method of accounting, we capitalize a portion of employee and general and administrative costs (including share-based compensation). Because of the non-cash nature of share-based compensation, the expensed portion of share-based compensation is added back to net income in arriving at net cash provided by operating activities in our statement of cash flows. The capitalized portion is not included in net cash used in investing activities.
Under U.S. GAAP, if tax deductions exceed book compensation expense, then excess tax benefits are credited to additional paid-in capital to the extent realized. If book compensation expense exceeds tax deductions, the tax deficit results in either a reduction in additional paid-in capital and/or an increase in income tax expense, depending on the pool of available excess tax benefits to offset such deficit. There were no adjustments to additional paid-in capital related to the net tax effect of stock option exercises and restricted stock vesting in 2017, 2016 or 2015. During the period from March 1, 2017 through December 31, 2017 (Successor), the period from January 1, 2017 through February 28, 2017 (Predecessor) and the years ended December 31, 2016 and 2015 (Predecessor), respectively, $2.5 million, $2.7 million, $4.1 million and $1.3 million of tax deficits were charged to income tax expense.
Predecessor Share-Based Compensation
For the period from January 1, 2017 through February 28, 2017 (Predecessor), we incurred $3.5 million of share-based compensation expense, all of which related to stock awards and restricted stock issuances, and of which a total of approximately $0.9 million was capitalized into oil and gas properties. For the year ended December 31, 2016 (Predecessor), we incurred $11.6 million of share-based compensation, all of which related to restricted stock issuances, and of which a total of approximately $3.1 million was capitalized into oil and gas properties. For the year ended December 31, 2015 (Predecessor), we incurred $17.9 million of share-based compensation, all of which related to restricted stock issuances, and of which a total of approximately $5.6 million was capitalized into oil and gas properties.
Stock Options. All outstanding stock options at December 31, 2016 related to executive share-based awards that were cancelled upon emergence from bankruptcy. There were no stock option grants during the period from January 1, 2017 through February 28, 2017. The following tables include Predecessor Company stock option activity during the years ended December 31, 2016 and 2015:
Year Ended December 31, 2016 (Predecessor) | |||||||||||||
Number of Options | Wgtd. Avg. Exercise Price | Wgtd. Avg. Term | Aggregate Intrinsic Value | ||||||||||
Options outstanding, beginning of period | 14,447 | $ | 269.25 | ||||||||||
Granted | — | — | |||||||||||
Exercised | — | — | |||||||||||
Forfeited | — | — | |||||||||||
Expired | (1,500 | ) | 477.45 | ||||||||||
Options outstanding, end of period | 12,947 | 245.13 | 1.4 years | $ | — | ||||||||
Options exercisable, end of period | 12,947 | 245.13 | 1.4 years | — | |||||||||
Options unvested, end of period | — | — | — | — | |||||||||
F-37
Year Ended December 31, 2015 (Predecessor) | |||||||||||||
Number of Options | Wgtd. Avg. Exercise Price | Wgtd. Avg. Term | Aggregate Intrinsic Value | ||||||||||
Options outstanding, beginning of period | 20,497 | $ | 339.36 | ||||||||||
Granted | — | — | |||||||||||
Exercised | — | — | |||||||||||
Forfeited | — | — | |||||||||||
Expired | (6,050 | ) | 506.76 | ||||||||||
Options outstanding, end of period | 14,447 | 269.25 | 2.1 years | $ | — | ||||||||
Options exercisable, end of period | 14,447 | 269.25 | 2.1 years | — | |||||||||
Options unvested, end of period | — | — | — | — | |||||||||
Restricted Stock and Other Stock Awards. Immediately prior to emergence, the vesting of all Predecessor outstanding, unvested share-based awards for non-executive employees was accelerated and, as a result, all unrecognized compensation cost related to such awards was recognized. Upon emergence from bankruptcy, all Predecessor outstanding, unvested restricted shares held by the Company’s executives were cancelled and exchanged for a proportionate share of the 5% of New Common Stock, plus a proportionate share of the warrants for ownership of up to 15% of the Successor Company’s common equity. Vesting continued in accordance with the applicable vesting provisions of the original awards (see Successor Share-Based Compensation below).
During the period from January 1, 2017 through February 28, 2017, 10,404 shares (valued at $69 thousand) of Predecessor Company stock were issued, representing grants of stock to the board of directors of the Predecessor Company. During the years ended December 31, 2016 and 2015, we issued 31,313 shares (valued at $0.3 million) and 141,872 shares (valued at $23.7 million), respectively, of Predecessor Company restricted stock or stock awards.
The following table includes Predecessor Company restricted stock and stock award activity during the period from January 1, 2017 through February 28, 2017 and the years ended December 31, 2016 and 2015:
Predecessor | |||||||||||||||||||||
Period from January 1, 2017 through February 28, 2017 | Year Ended December 31, | ||||||||||||||||||||
2016 | 2015 | ||||||||||||||||||||
Number of Restricted Shares | Wgtd. Avg. Fair Value Per Share | Number of Restricted Shares | Wgtd. Avg. Fair Value Per Share | Number of Restricted Shares | Wgtd. Avg. Fair Value Per Share | ||||||||||||||||
Restricted stock outstanding, beginning of period | 81,090 | $ | 205.34 | 180,239 | $ | 208.17 | 129,848 | $ | 299.45 | ||||||||||||
Issuances | 10,404 | 6.67 | 31,313 | 8.93 | 141,872 | 167.21 | |||||||||||||||
Lapse of restrictions or granting of stock awards | (73,276 | ) | 186.37 | (117,406 | ) | 158.79 | (63,745 | ) | 296.00 | ||||||||||||
Forfeitures | (194 | ) | 169.40 | (13,056 | ) | 200.06 | (27,736 | ) | 223.80 | ||||||||||||
Restricted stock outstanding, end of period | 18,024 | $ | 169.42 | 81,090 | $ | 205.34 | 180,239 | $ | 208.17 | ||||||||||||
Successor Share-Based Compensation
Restricted Stock and Other Stock Awards. As discussed above, upon emergence from bankruptcy, all Predecessor outstanding, unvested restricted shares held by the Company’s executives were cancelled and exchanged for proportionate shares of New Common Stock. Vesting continued in accordance with the applicable vesting provisions of the original awards, with remaining compensation expense based on the fresh start fair value of $26.95 per share (see Note 3 – Fresh Start Accounting). For the period from March 1, 2017 through December 31, 2017 (Successor), we incurred approximately $0.1 million of share-based compensation expense related to these restricted shares. The restricted stock outstanding on December 31, 2017 became fully vested on January 15, 2018. The following table includes Successor Company restricted stock and stock award activity during the period from March 1, 2017 through December 31, 2017:
F-38
Period from March 1, 2017 through December 31, 2017 | |||||||
Number of Restricted Shares | Wgtd. Avg. Fair Value Per Share | ||||||
Restricted stock outstanding at February 28, 2017 (Predecessor) | 18,024 | $ | 169.42 | ||||
Restricted stock outstanding at March 1, 2017 (Successor) | 3,176 | $ | 26.95 | ||||
Issuances | — | — | |||||
Lapse of restrictions | (2,083 | ) | 21.78 | ||||
Forfeitures | — | — | |||||
Restricted stock outstanding at December 31, 2017 (Successor) | 1,093 | $ | 26.95 | ||||
Restricted Stock Units. On March 1, 2017, the Board received grants of restricted stock units under the 2017 LTIP. The restricted stock units are scheduled to vest in full on the day prior to the annual meeting of the Company’s stockholders in May 2018, subject to: (i) the director’s continued service on the board through the vesting date, and (ii) earlier vesting upon the occurrence of a change of control event or the termination of the director’s service due to death or removal from the board without cause. A total of 62,137 restricted stock units were granted with an aggregate grant date fair value of $1.7 million, based on a per share grant date fair value of $26.95. During the period from March 1, 2017 through December 31, 2017 (Successor), we incurred approximately $1.2 million of share-based compensation expense related to these restricted stock units. As of December 31, 2017, there was $0.5 million of unrecognized compensation cost related to such restricted stock units, with a current weighted average remaining vesting period of approximately four months.
NOTE 17 — REDUCTION IN WORKFORCE
During the second quarter of 2017, we implemented workforce reduction plans to better align our employee base with current business needs, resulting in a reduction of approximately 20% of our total workforce. The workforce reductions were complete as of July 31, 2017. In connection with the reductions, we recognized a charge of $5.7 million, consisting primarily of severance payments to affected employees and payment of related employer payroll taxes. This charge is reflected in SG&A expenses on the statement of operations for the period from March 1, 2017 through December 31, 2017 (Successor).
In addition to the workforce reduction costs, during the second quarter of 2017, we recognized a charge of $3.0 million for severance costs related to the sale of the Appalachia Properties and the retirement of the prior chief executive officer of the Company. These severance costs are reflected in SG&A expenses on the statement of operations for the period from March 1, 2017 through December 31, 2017 (Successor).
NOTE 18 — FEDERAL ROYALTY RECOVERY
In July 2017, we received a federal royalty recovery totaling $14.1 million as part of a multi-year federal royalty refund claim. Approximately $9.6 million of the refund was recognized as other operational income and $4.5 million as a reduction of lease operating expenses during the period from March 1, 2017 through December 31, 2017 (Successor). Included in SG&A expenses for the period from March 1, 2017 through December 31, 2017 (Successor) is a $3.9 million success-based consulting fee incurred in connection with the federal royalty recovery.
NOTE 19 — OTHER OPERATIONAL EXPENSES
Other operational expenses for the period of March 1, 2017 through December 31, 2017 (Successor) of $3.4 million included approximately $2.1 million of stacking charges for the Pompano platform rig. For the year ended December 31, 2016 (Predecessor), other operational expenses of $55.5 million included approximately $17.7 million of rig subsidy and stacking charges related to the ENSCO 8503 deep water drilling rig, an Appalachian drilling rig and the platform rig at Pompano, a $20.0 million charge related to the termination of our deep water drilling rig contract with Ensco and $9.9 million in charges related to the terminations of offshore vessel and Appalachian drilling rig contracts. Also included in other operational expenses for the year ended December 31, 2016 (Predecessor) is a $6.1 million loss on the liquidation of our former foreign subsidiary, Stone Energy Canada, ULC, representing cumulative foreign currency translation adjustments, which were reclassified from accumulated other comprehensive income. See Note 14 – Accumulated Other Comprehensive Income (Loss).
F-39
NOTE 20 — COMBINATION TRANSACTION COSTS
In connection with the pending combination with Talos, we have incurred approximately $6.2 million in transaction costs, consisting primarily of legal and financial advisor costs. These costs are included in SG&A expense on our statement of operations for the period from March 1, 2017 through December 31, 2017 (Successor). Additionally, we have incurred approximately $0.2 million of direct costs for purposes of registering equity securities to effect the Talos combination. These direct costs are recorded as a reduction of additional paid-in-capital during the period from March 1, 2017 through December 31, 2017 (Successor). See Note 1 – Organization and Summary of Significant Accounting Policies for more information on the pending combination.
NOTE 21 — COMMITMENTS AND CONTINGENCIES
Legal Proceedings
We are named as a party in certain lawsuits and regulatory proceedings arising in the ordinary course of business. We do not expect that these matters, individually or in the aggregate, will have a material adverse effect on our financial condition.
Leases
We lease office facilities in Lafayette and New Orleans, Louisiana under the terms of non-cancelable leases expiring on various dates in 2018. We also lease certain equipment on our oil and gas properties typically on a month-to-month basis. The minimum net commitment for 2018 under our leases, subleases and contracts at December 31, 2017 totaled $0.3 million.
Payments related to our lease obligations were $0.5 million for the period from March 1, 2017 through December 31, 2017 (Successor) and $0.1 million for the period of January 1, 2017 through February 28, 2017 (Predecessor). Payments related to our lease obligations for the years ended December 31, 2016 and 2015 (Predecessor) were approximately $0.7 million and $3.1 million, respectively.
Other Commitments and Contingencies
On March 21, 2016, we received notice letters from the Bureau of Ocean Energy Management (“BOEM”) stating that BOEM had determined that we no longer qualified for a supplemental bonding waiver under the financial criteria specified in BOEM’s guidance to lessees at such time. In late March 2016, we proposed a tailored plan to BOEM for financial assurances relating to our abandonment obligations, which provides for posting some incremental financial assurances in favor of BOEM. On May 13, 2016, we received notice letters from BOEM rescinding its demand for supplemental bonding with the understanding that we will continue to make progress with BOEM towards finalizing and implementing our long-term tailored plan. Currently, we have posted an aggregate of approximately $115 million in surety bonds in favor of BOEM, third-party bonds, and letters of credit, all relating to our offshore abandonment obligations.
In July 2016, BOEM issued a Notice to Lessees (the “NTL”), with an effective date of September 12, 2016, that augments requirements for the posting of additional financial assurances by offshore lessees. The NTL details procedures to determine a lessee’s ability to carry out its lease obligations (primarily the decommissioning of OCS facilities) and whether to require lessees to furnish additional financial assurances to meet BOEM’s estimate of the lessees decommissioning obligations. The NTL supersedes the agency’s prior practice of allowing operators of a certain net worth to waive the need for supplemental bonds and provides updated criteria for determining a lessee’s ability to self-insure only a small portion of its OCS liabilities based upon the lessee’s financial capacity and financial strength. The NTL also allows lessees to meet their additional financial security requirements pursuant to an individually approved tailored plan, whereby an operator and BOEM agree to set a timeframe for the posting of additional financial assurances.
We received a self-insurance letter from BOEM dated September 30, 2016 stating that we were not eligible to self-insure any of our additional security obligations. We received a proposal letter from BOEM dated October 20, 2016 indicating that additional security may be required. The September 30, 2016 self-insurance determination letter was rescinded by BOEM on March 24, 2017.
In the first quarter of 2017, BOEM announced that it would extend the implementation timeline for the July 2016 NTL by an additional six months. Furthermore, on April 28, 2017, President Trump issued an executive order directing the Secretary of the Interior to review the NTL to determine whether modifications are necessary to ensure operator compliance with lease terms while minimizing unnecessary regulatory burdens. On June 22, 2017, BOEM announced that, pending its review of the NTL, the implementation timeline would be indefinitely extended, subject to certain exceptions. At this time, it is uncertain when, or if, the July 2016 NTL will be implemented or whether a revised NTL might be proposed. A revised tailored plan may require incremental financial assurance or bonding for non-sole liability properties, dependent on adjustments following ongoing discussions with
F-40
BOEM and the Bureau of Safety and Environmental Enforcement, and any modifications to the proposed NTL. There is no assurance that our current tailored plan will be approved by BOEM, and BOEM may require further revisions to our plan.
In connection with our exploration and development efforts, we are contractually committed to the acquisition of seismic data in the amount of $8.6 million to be incurred over the next two years.
The Oil Pollution Act (“OPA”) imposes ongoing requirements on a responsible party, including the preparation of oil spill response plans and proof of financial responsibility to cover environmental cleanup and restoration costs that could be incurred in connection with an oil spill. Under the OPA and a final rule adopted by BOEM in August 1998, responsible parties of covered offshore facilities that have a worst case oil spill of more than 1,000 barrels must demonstrate financial responsibility in amounts ranging from at least $10 million in specified state waters to at least $35 million in Outer Continental Shelf waters, with higher amounts of up to $150 million in certain limited circumstances where BOEM believes such a level is justified by the risks posed by the operations, or if the worst case oil-spill discharge volume possible at the facility may exceed the applicable threshold volumes specified under BOEM’s final rule. In addition, BOEM has finalized rules that raise OPA’s damages liability cap from $75 million to $133.7 million.
NOTE 22 — SUPPLEMENTAL INFORMATION ON OIL AND NATURAL GAS OPERATIONS – UNAUDITED
At December 31, 2017 and 2016, our oil and gas properties were located in the United States (onshore and offshore). On February 27, 2017, we completed the sale of the Appalachia Properties in connection with our restructuring (see Note 4 – Divestiture). During 2015, we discontinued our business development effort in Canada.
With the adoption of fresh start accounting, the Company recorded its oil and gas properties at fair value as of February 28, 2017. The Company’s proved, probable and possible reserves and unevaluated properties (including inventory) were assigned values of $380.8 million, $16.8 million and $80.2 million, respectively. See Note 3 – Fresh Start Accounting for a discussion of the valuation approach used.
Costs Incurred
United States. The following table discloses the total amount of capitalized costs and accumulated DD&A relative to our proved and unevaluated oil and natural gas properties located in the United States (in thousands):
Successor | Predecessor | |||||||
December 31, 2017 | December 31, 2016 | |||||||
Proved properties | $ | 713,157 | $ | 9,572,082 | ||||
Unevaluated properties | 102,187 | 373,720 | ||||||
Total proved and unevaluated properties | 815,344 | 9,945,802 | ||||||
Less accumulated depreciation, depletion and amortization | (353,462 | ) | (9,134,288 | ) | ||||
Balance, end of year | $ | 461,882 | $ | 811,514 | ||||
The following table sets forth certain information regarding the costs incurred in our acquisition, exploratory and development activities in the United States during the periods indicated (in thousands):
F-41
Successor | Predecessor | |||||||||||||||
Period from March 1, 2017 through December 31, 2017 | Period from January 1, 2017 through February 28, 2017 | Year Ended December 31, | ||||||||||||||
2016 | 2015 | |||||||||||||||
Costs incurred during the period (capitalized): | ||||||||||||||||
Acquisition costs, net of sales of unevaluated properties | $ | (8,371 | ) | $ | (324 | ) | $ | 3,923 | $ | (14,158 | ) | |||||
Exploratory costs | 12,079 | 2,055 | 17,891 | 104,169 | ||||||||||||
Development costs (1) | 33,356 | 12,547 | 102,665 | 266,982 | ||||||||||||
Salaries, general and administrative costs | 7,495 | 2,976 | 21,753 | 27,984 | ||||||||||||
Interest | 3,927 | 2,524 | 26,634 | 41,339 | ||||||||||||
Less: overhead reimbursements | (1,004 | ) | — | (521 | ) | (913 | ) | |||||||||
Total costs incurred during the period, net of divestitures | $ | 47,482 | $ | 19,778 | $ | 172,345 | $ | 425,403 | ||||||||
(1) Includes net changes in capitalized asset retirement costs of ($17,446), $0, ($4,461) and ($43,901), respectively.
The following table discloses operational expenses incurred during the periods indicated relative to our oil and natural gas producing activities located in the United States (in thousands):
Successor | Predecessor | |||||||||||||||
Period from March 1, 2017 through December 31, 2017 | Period from January 1, 2017 through February 28, 2017 | Year Ended December 31, | ||||||||||||||
2016 | 2015 | |||||||||||||||
Lease operating expenses | $ | 49,800 | $ | 8,820 | $ | 79,650 | $ | 100,139 | ||||||||
Transportation, processing and gathering expenses | 4,084 | 6,933 | 27,760 | 58,847 | ||||||||||||
Production taxes | 629 | 682 | 3,148 | 6,877 | ||||||||||||
Accretion expense | 21,151 | 5,447 | 40,229 | 25,988 | ||||||||||||
Expensed costs – United States | $ | 75,664 | $ | 21,882 | $ | 150,787 | $ | 191,851 | ||||||||
The following table sets forth certain information relative to the amortization of our investment in oil and gas properties and the impairment of our oil and gas properties in the United States for the periods indicated (in thousands, except per unit amounts):
Successor | Predecessor | |||||||||||||||
Period from March 1, 2017 through December 31, 2017 | Period from January 1, 2017 through February 28, 2017 | Year Ended December 31, | ||||||||||||||
2016 | 2015 | |||||||||||||||
Provision for DD&A | $ | 97,027 | $ | 36,751 | $ | 215,737 | $ | 277,088 | ||||||||
Write-down of oil and gas properties | $ | 256,435 | $ | — | $ | 357,079 | $ | 1,314,817 | ||||||||
DD&A per Boe | $ | 16.61 | $ | 17.05 | $ | 16.10 | $ | 19.15 | ||||||||
At March 31, 2017 (Successor), our ceiling test computation resulted in a write-down of our U.S. oil and gas properties of $256.4 million based on twelve-month average prices, net of applicable differentials, of $45.40 per Bbl of oil, $2.24 per Mcf of natural gas and $19.18 per Bbl of NGLs. The write-down at March 31, 2017 is reflected in the statement of operations of the Successor Company for the period from March 1, 2017 through December 31, 2017 and was primarily due to differences between the trailing twelve-month average pricing assumption used in calculating the ceiling test and the forward prices used in fresh start accounting to estimate the fair value of our oil and gas properties on the fresh start reporting date of February 28, 2017. Weighted average commodity prices used in the determination of the fair value of our oil and gas properties for purposes of fresh start accounting were $56.01 per Bbl of oil, $2.52 per Mcf of natural gas and $14.18 per Bbl of NGLs, net of applicable differentials.
F-42
Since none of our derivatives as of March 31, 2017 were designated as cash flow hedges (see Note 9 – Derivative Instruments and Hedging Activities), the write-down at March 31, 2017 was not affected by hedging. The 2016 and 2015 write-downs were decreased by $50.7 million and $143.9 million, respectively, as a result of hedges.
The following table discloses net costs incurred (evaluated) on our unevaluated properties located in the United States for the periods indicated (in thousands):
Successor | Predecessor | |||||||||||||||
Period from March 1, 2017 through December 31, 2017 | Period from January 1, 2017 through February 28, 2017 | Year Ended December 31, | ||||||||||||||
2016 | 2015 | |||||||||||||||
Net costs incurred (evaluated) during period: | ||||||||||||||||
Acquisition costs | $ | (9,155 | ) | $ | 959 | $ | (71,378 | ) | $ | (115,767 | ) | |||||
Exploration costs | 10,405 | (6,063 | ) | (21,579 | ) | (16,315 | ) | |||||||||
Capitalized interest | 3,927 | 2,524 | 26,634 | 41,339 | ||||||||||||
$ | 5,177 | $ | (2,580 | ) | $ | (66,323 | ) | $ | (90,743 | ) | ||||||
Under fresh start accounting, our oil and gas properties were recorded at fair value as of February 28, 2017. The following table discloses financial data associated with unevaluated costs (United States) for the Successor Company at December 31, 2017 (in thousands):
Successor | Net Costs Incurred During the Period from March 1, 2017 through December 31, 2017 | Successor | |||||||||
March 1, 2017 | December 31, 2017 | ||||||||||
Acquisition costs | $ | 58,359 | $ | (9,155 | ) | $ | 49,204 | ||||
Exploration costs | 38,651 | 10,405 | 49,056 | ||||||||
Capitalized interest | — | 3,927 | 3,927 | ||||||||
Total unevaluated costs | $ | 97,010 | $ | 5,177 | $ | 102,187 | |||||
Approximately 34 specifically identified drilling projects are included in unevaluated costs at December 31, 2017 and are expected to be evaluated in the next four years. The excluded costs will be included in the amortization base as the properties are evaluated and proved reserves are established or impairment is determined.
F-43
Canada. During 2013, we entered into an agreement to participate in the drilling of exploratory wells in Canada. Upon a more complete evaluation of this project and in response to the significant decline in commodity prices, we discontinued our business development effort in Canada during 2015 and recognized a full impairment of our Canadian oil and gas properties. The following table discloses certain financial data relative to our oil and gas activities located in Canada (in thousands):
Predecessor | ||||||||
Year Ended December 31, | ||||||||
2016 | 2015 | |||||||
Oil and gas properties – Canada: | ||||||||
Balance, beginning of year | $ | 42,484 | $ | 36,579 | ||||
Costs incurred during the year (capitalized): | ||||||||
Acquisition costs | (498 | ) | (2,862 | ) | ||||
Exploratory costs | 2,168 | 8,767 | ||||||
Total costs incurred during the year | 1,670 | 5,905 | ||||||
Balance, end of year (fully evaluated at December 31, 2016 and 2015) | $ | 44,154 | $ | 42,484 | ||||
Accumulated DD&A: | ||||||||
Balance, beginning of year | $ | (42,484 | ) | $ | — | |||
Foreign currency translation adjustment | (1,318 | ) | 5,146 | |||||
Write-down of oil and gas properties | (352 | ) | (47,630 | ) | ||||
Balance, end of year | $ | (44,154 | ) | $ | (42,484 | ) | ||
Net capitalized costs – Canada | $ | — | $ | — | ||||
Proved Oil and Natural Gas Quantities
Our estimated net proved oil and natural gas reserves at December 31, 2017 have been prepared in accordance with guidelines established by the Securities and Exchange Commission (“SEC”). Accordingly, the following reserve estimates are based upon existing economic and operating conditions at the respective dates. There are numerous uncertainties inherent in estimating quantities of proved reserves and in providing the future rates of production and timing of development expenditures. The following reserve data represents estimates only and should not be construed as being exact. In addition, the present values should not be construed as the market value of the oil and gas properties or the cost that would be incurred to obtain equivalent reserves.
The following table sets forth an analysis of the estimated quantities of net proved oil (including condensate), natural gas and NGL reserves, all of which are located onshore and offshore the continental United States. Estimated proved oil, natural gas and NGL reserves are prepared in accordance with the SEC’s rule, “Modernization of Oil and Gas Reporting,” using a historical twelve-month average pricing assumption.
F-44
Oil (MBbls) | NGLs (MBbls) | Natural Gas (MMcf) | Oil, Natural Gas and NGLs (MBoe) | |||||||||
Estimated proved developed and undeveloped reserves: | ||||||||||||
As of December 31, 2014 (Predecessor) | 42,397 | 27,817 | 493,843 | 152,520 | ||||||||
Revisions of previous estimates | (6,818 | ) | (20,777 | ) | (362,102 | ) | (87,945 | ) | ||||
Extensions, discoveries and other additions | 862 | 11 | 1,499 | 1,123 | ||||||||
Purchase of producing properties | 685 | 1,808 | 26,136 | 6,849 | ||||||||
Sale of reserves | (859 | ) | — | (1,061 | ) | (1,036 | ) | |||||
Production | (5,991 | ) | (2,401 | ) | (36,457 | ) | (14,468 | ) | ||||
As of December 31, 2015 (Predecessor) | 30,276 | 6,458 | 121,858 | 57,043 | ||||||||
Revisions of previous estimates | (751 | ) | 6,352 | 24,858 | 9,744 | |||||||
Extensions, discoveries and other additions | 63 | 2 | 45 | 73 | ||||||||
Production | (6,308 | ) | (2,183 | ) | (29,441 | ) | (13,398 | ) | ||||
As of December 31, 2016 (Predecessor) | 23,280 | 10,629 | 117,320 | 53,462 | ||||||||
Revisions of previous estimates | 730 | (2 | ) | 1,242 | 935 | |||||||
Sale of reserves | (826 | ) | (7,417 | ) | (52,992 | ) | (17,075 | ) | ||||
Production | (908 | ) | (408 | ) | (5,037 | ) | (2,156 | ) | ||||
As of February 28, 2017 (Predecessor) | 22,276 | 2,802 | 60,533 | 35,166 | ||||||||
Revisions of previous estimates | 3,769 | (94 | ) | (2,801 | ) | 3,208 | ||||||
Production | (4,169 | ) | (403 | ) | (7,616 | ) | (5,841 | ) | ||||
As of December 31, 2017 (Successor) | 21,876 | 2,305 | 50,116 | 32,533 | ||||||||
Estimated proved developed reserves: | ||||||||||||
As of December 31, 2015 (Predecessor) | 21,734 | 4,784 | 90,262 | 41,562 | ||||||||
As of December 31, 2016 (Predecessor) | 18,269 | 9,255 | 90,741 | 42,647 | ||||||||
As of February 28, 2017 (Predecessor) | 18,344 | 1,515 | 35,865 | 25,836 | ||||||||
As of December 31, 2017 (Successor) | 20,275 | 1,689 | 37,946 | 28,288 | ||||||||
Estimated proved undeveloped reserves: | ||||||||||||
As of December 31, 2015 (Predecessor) | 8,542 | 1,674 | 31,596 | 15,481 | ||||||||
As of December 31, 2016 (Predecessor) | 5,011 | 1,374 | 26,579 | 10,815 | ||||||||
As of February 28, 2017 (Predecessor) | 3,932 | 1,287 | 24,668 | 9,330 | ||||||||
As of December 31, 2017 (Successor) | 1,601 | 616 | 12,170 | 4,245 | ||||||||
The following narrative provides the reasons for the significant changes in the quantities of our estimated proved reserves by year.
2017 Periods. Revisions of previous estimates were primarily the result of positive well performance (4 MMBoe). The sale of reserves represents the sale of the Appalachia Properties (17 MMBoe) in connection with our restructuring (see Note 4 – Divestiture).
Year Ended December 31, 2016. Revisions of previous estimates were primarily the result of positive reserve report gas pricing changes extending the economic limits of the reservoirs (15 MMBoe) primarily in Appalachia, slightly offset by negative well performance (6 MMBoe).
Year Ended December 31, 2015. Revisions of previous estimates were primarily the result of the significant decline in commodity prices resulting in uneconomic reserves (95 MMBoe) primarily in Appalachia, slightly offset by positive well performance (7 MMBoe). Purchase of producing properties related to increases in our net revenue and working interests in multiple
F-45
wells in the Mary field in Appalachia resulting from the finalization of participation elections made by partners and potential partners in certain units.
Standardized Measure of Discounted Future Net Cash Flows
The following tables present the standardized measure of discounted future net cash flows related to estimated proved oil, natural gas and NGL reserves together with changes therein, including a reduction for estimated plugging and abandonment costs that are also reflected as a liability on the balance sheet at December 31, 2017. You should not assume that the future net cash flows or the discounted future net cash flows, referred to in the tables below, represent the fair value of our estimated oil, natural gas and NGL reserves. Prices are based on either the historical twelve-month average price based on closing prices on the first day of each month, or prices defined by existing contractual arrangements. Future production and development costs are based on current costs with no escalations. Estimated future cash flows net of future income taxes have been discounted to their present values based on a 10% annual discount rate. Our GOM Basin properties represented 100% of our estimated proved oil and natural gas reserves and standardized measure of discounted future net cash flows at December 31, 2017. The standardized measure of discounted future net cash flows and changes therein are as follows (in thousands, except average prices):
Standardized Measure | ||||||||||||
Successor | Predecessor | |||||||||||
December 31, | December 31, | |||||||||||
2017 | 2016 | 2015 | ||||||||||
Future cash inflows | $ | 1,264,809 | $ | 1,236,097 | $ | 1,921,329 | ||||||
Future production costs | (497,538 | ) | (480,815 | ) | (651,396 | ) | ||||||
Future development costs | (431,752 | ) | (638,988 | ) | (679,355 | ) | ||||||
Future income taxes | — | — | — | |||||||||
Future net cash flows | 335,519 | 116,294 | 590,578 | |||||||||
10% annual discount | 57,591 | 109,628 | 13,259 | |||||||||
Standardized measure of discounted future net cash flows | $ | 393,110 | $ | 225,922 | $ | 603,837 | ||||||
Average prices related to proved reserves: | ||||||||||||
Oil (per Bbl) | $ | 50.05 | $ | 40.15 | $ | 51.16 | ||||||
NGLs (per Bbl) | 22.90 | 9.46 | 16.40 | |||||||||
Natural gas (per Mcf) | 2.34 | 1.71 | 2.19 | |||||||||
F-46
Changes in Standardized Measure | ||||||||||||||||
Successor | Predecessor | |||||||||||||||
Period from March 1, 2017 through December 31, 2017 | Period From January 1, 2017 through February 28, 2017 | Year Ended December 31, | ||||||||||||||
2016 | 2015 | |||||||||||||||
Standardized measure at beginning of period | $ | 303,086 | $ | 225,922 | $ | 603,837 | $ | 1,418,792 | ||||||||
Sales and transfers of oil, natural gas and NGLs produced, net of production costs | (164,612 | ) | (46,137 | ) | (223,948 | ) | (340,477 | ) | ||||||||
Changes in price, net of future production costs | 66,192 | 17,455 | (448,861 | ) | (237,747 | ) | ||||||||||
Extensions and discoveries, net of future production and development costs | — | — | 5,243 | 1,573 | ||||||||||||
Changes in estimated future development costs, net of development costs incurred during the period | 88,111 | 20,756 | 54,406 | 731,115 | ||||||||||||
Revisions of quantity estimates | 96,454 | 36,557 | 139,759 | (1,458,652 | ) | |||||||||||
Accretion of discount | 30,309 | 22,592 | 60,384 | 174,456 | ||||||||||||
Net change in income taxes | — | — | — | 325,768 | ||||||||||||
Purchases of reserves in-place | — | — | — | 3,493 | ||||||||||||
Sales of reserves in-place | — | 14,584 | — | — | ||||||||||||
Changes in production rates due to timing and other | (26,430 | ) | 11,357 | 35,102 | (14,484 | ) | ||||||||||
Net change in standardized measure | 90,024 | 77,164 | (377,915 | ) | (814,955 | ) | ||||||||||
Standardized measure at end of period | $ | 393,110 | $ | 303,086 | $ | 225,922 | $ | 603,837 | ||||||||
NOTE 23 — SUMMARIZED QUARTERLY FINANCIAL INFORMATION – UNAUDITED
The Company’s results of operations by quarter are as follows (in thousands, except per share amounts):
Predecessor | Successor | |||||||||||||||||||
Period from January 1, 2017 through February 28, 2017 | Period from March 1, 2017 through March 31, 2017 | 2017 Quarter Ended | ||||||||||||||||||
June 30 | Sept. 30 | Dec. 31 | ||||||||||||||||||
Operating revenue | $ | 68,922 | $ | 25,809 | $ | 76,722 | $ | 79,525 | $ | 76,327 | ||||||||||
Income (loss) from operations | $ | 209,119 | $ | (258,594 | ) | $ | (4,519 | ) | $ | 2,653 | $ | 5,302 | ||||||||
Net income (loss) | $ | 630,317 | $ | (259,613 | ) | $ | (6,461 | ) | $ | 1,297 | $ | 17,138 | ||||||||
Basic income (loss) per share | $ | 110.99 | $ | (12.98 | ) | $ | (0.32 | ) | $ | 0.06 | $ | 0.86 | ||||||||
Diluted income (loss) per share | $ | 110.99 | $ | (12.98 | ) | $ | (0.32 | ) | $ | 0.06 | $ | 0.86 | ||||||||
Write-down of oil and gas properties | $ | — | $ | 256,435 | $ | — | $ | — | $ | — | ||||||||||
Gain (loss) on Appalachia Properties divestiture | $ | 213,453 | $ | — | $ | 27 | $ | (132 | ) | $ | — | |||||||||
Reorganization items (1) | $ | (437,744 | ) | $ | — | $ | — | $ | — | $ | — | |||||||||
Other expense | $ | 13,336 | $ | — | $ | 814 | $ | 47 | $ | 369 | ||||||||||
(1) See Note 3 – Fresh Start Accounting for additional details.
F-47
Predecessor | |||||||||||||||
2016 Quarter Ended | |||||||||||||||
March 31 | June 30 | Sept. 30 | Dec. 31 | ||||||||||||
Operating revenue | $ | 80,677 | $ | 89,319 | $ | 94,427 | $ | 113,107 | |||||||
Loss from operations | $ | (172,150 | ) | $ | (174,656 | ) | $ | (72,128 | ) | $ | (90,234 | ) | |||
Net loss | $ | (188,784 | ) | $ | (195,761 | ) | $ | (89,635 | ) | $ | (116,406 | ) | |||
Basic loss per share | $ | (33.89 | ) | $ | (35.05 | ) | $ | (16.01 | ) | $ | (20.76 | ) | |||
Diluted loss per share | $ | (33.89 | ) | $ | (35.05 | ) | $ | (16.01 | ) | $ | (20.76 | ) | |||
Write-down of oil and gas properties | $ | 129,204 | $ | 118,649 | $ | 36,484 | $ | 73,094 | |||||||
Restructuring fees | $ | 953 | $ | 9,436 | $ | 5,784 | $ | 13,424 | |||||||
Other operational expenses (1) | $ | 12,527 | $ | 27,680 | $ | 9,059 | $ | 6,187 | |||||||
Reorganization items | $ | — | $ | — | $ | — | $ | 10,947 | |||||||
(1) See Note 19 – Other Operational Expenses for additional details.
NOTE 24 — NEW YORK STOCK EXCHANGE COMPLIANCE
On May 17, 2016, we were notified by the New York Stock Exchange (the “NYSE”) that our average global market capitalization had been less than $50 million over a consecutive 30 trading-day period at the same time that our stockholders’ equity was less than $50 million, which is non-compliant with Section 802.01B of the NYSE Listed Company Manual. On June 30, 2016, we submitted our 18-month business plan for curing the average market capitalization and stockholders’ equity deficiencies to the NYSE, and on August 4, 2016, the NYSE accepted the Plan. All of our quarterly updates to the business plan were accepted by the NYSE. Since March 1, 2017, the first day of trading subsequent to the effective date of the Company’s plan of reorganization, the Successor Company has maintained a market capitalization above $50 million.
On August 24, 2017, we were notified by the NYSE that we are back in compliance with their continued listing standards as a result of the Company’s consistent positive performance with respect to the original business plan submission and the achievement of compliance with the average global market capitalization and stockholders’ equity listing requirements over the past two quarters. In accordance with the NYSE’s Listed Company Manual, we will be subject to a 12-month follow up period within which the Company will be reviewed to ensure that the Company does not fall below any of the NYSE’s continued listing standards.
F-48
GLOSSARY OF CERTAIN INDUSTRY TERMS
The following is a description of the meanings of some of the oil and gas industry terms used in this Form 10-K. The revisions and additions to the definition section in Rule 4-10(a) of Regulation S-X contained in the SEC’s rule, “Modernization of Oil and Gas Reporting”, are included. The definitions of proved developed reserves, proved reserves and proved undeveloped reserves have been abbreviated from the rule.
Bbl. One stock tank barrel, or 42 U.S. gallons of liquid volume, used herein in reference to crude oil or other liquid hydrocarbons.
Bcf. One billion cubic feet of gas.
Boe. Barrels of oil equivalent. Determined using the ratio of six mcf of natural gas to one barrel of crude oil.
Btu. British thermal unit, which is the heat required to raise the temperature of a one-pound mass of water from 58.5 to 59.5 degrees Fahrenheit.
Development well. A well drilled within the proved area of an oil or gas reservoir to the depth of a stratigraphic horizon known to be productive.
Exploratory well. A well drilled to find a new field or to find a new reservoir in a field previously found to be productive of oil or gas in another reservoir.
Field. An area consisting of a single reservoir or multiple reservoirs all grouped on or related to the same individual geological structural feature and/or stratigraphic condition. There may be two or more reservoirs in a field that are separated vertically by intervening impervious, strata, or laterally by local geologic barriers, or by both. Reservoirs that are associated by being in overlapping or adjacent fields may be treated as a single or common operational field. The geological terms structural feature and stratigraphic condition are intended to identify localized geological features as opposed to the broader terms of basins, trends, provinces, plays, areas-of-interest, etc.
Gross acreage or gross wells. The total acres or wells, as the case may be, in which a working interest is owned.
Liquidity. The ability to obtain cash quickly either through the conversion of assets or the incurrence of liabilities.
MBbls. One thousand barrels of crude oil or other liquid hydrocarbons.
Mcf. One thousand cubic feet of gas.
Mcfe. One thousand cubic feet of gas equivalent. Determined using the ratio of one barrel of crude oil to six Mcf of natural gas.
MMBbls. One million barrels of crude oil or other liquid hydrocarbons.
MMBoe. One million barrels of oil equivalent. Determined using the ratio of six mcf of natural gas to one barrel of crude oil.
MMBtu. One million Btus.
MMcf. One million cubic feet of gas.
Net acres or net wells. The sum of the fractional working interests owned in gross acres or gross wells expressed as whole numbers and fractions of whole numbers.
Primary term lease. An oil and gas property with no existing production, in which Stone has a specific time frame to establish production without losing the rights to explore the property.
Productive well. A well that is found to be mechanically capable of producing hydrocarbons in sufficient quantities that proceeds from the sale of such production exceeds production expenses and taxes.
Proved developed reserves. Proved reserves that can be expected to be recovered (i) through existing wells with existing equipment and operating methods or in which the cost of the required equipment is relatively minor compared to the cost of a new well; and (ii) through installed extraction technology equipment and infrastructure operational at the time of the reserves estimate if the extraction is by means not involving a well.
G-1
Proved oil and natural gas reserves. Those quantities of oil and gas, which, by analysis of geoscience and engineering data, can be estimated with reasonable certainty to be economically producible—from a given date forward, from known reservoirs, and under existing economic conditions, operating methods, and government regulations—prior to the time at which contracts providing the right to operate expire, unless evidence indicates that renewal is reasonably certain, regardless of whether deterministic or probabilistic methods are used for the estimation. The project to extract hydrocarbons must have commenced or the operator must be reasonably certain that it will commence the project within a reasonable time. Reasonable certainty is defined as “much more likely to be achieved than not”.
Proved undeveloped reserves (“PUDs”). Proved reserves that are expected to be recovered from new wells on undrilled acreage, or from existing wells where a relatively major expenditure is required for recompletion.
Standardized measure of discounted future net cash flows. The standardized measure represents value-based information about an enterprise’s proved oil and natural gas reserves based on estimates of future cash flows, including income taxes, from production of proved reserves assuming continuation of certain economic and operating conditions. Future cash flows are based on a twelve-month average price, calculated as the unweighted arithmetic average of the first-day-of-the-month price for each month within the twelve-month period prior to the end of the reporting period.
Undeveloped acreage. Lease acreage on which wells have not been drilled or completed to a point that would permit the production of economic quantities of oil and gas regardless of whether such acreage contains proved reserves.
Working interest. An operating interest that gives the owner the right to drill, produce and conduct operating activities on the property and to receive a share of production.
G-2