Attached files
| file | filename |
|---|---|
| EX-32.1 - EXHIBIT 32.1 - CIFC LLC | cifc93016ex321.htm |
| EX-31.2 - EXHIBIT 31.2 - CIFC LLC | cifc93016ex312.htm |
| EX-31.1 - EXHIBIT 31.1 - CIFC LLC | cifc93016ex311.htm |
UNITED STATES
SECURITIES AND EXCHANGE COMMISSION
Washington, D.C. 20549
FORM 10-Q
x | QUARTERLY REPORT PURSUANT TO SECTION 13 OR 15(d) OF THE SECURITIES EXCHANGE ACT OF 1934 |
For the quarterly period ended September 30, 2016
OR
o | TRANSITION REPORT PURSUANT TO SECTION 13 OR 15(d) OF THE SECURITIES EXCHANGE ACT OF 1934 |
For the transition period from to
Commission file number: 1-37674
CIFC LLC
(Exact name of registrant as specified in its charter)
Delaware (State or other jurisdiction of incorporation or organization) | 36-4814372 (I.R.S. Employer Identification No.) | |
250 Park Avenue, 4th Floor, New York, New York (Address of principal executive offices) | 10177 (Zip code) | |
Registrant’s telephone number, including area code: 212-624-1200
Indicate by check mark whether the registrant (1) has filed all reports required to be filed by Section 13 or 15(d) of the Securities Exchange Act of 1934 during the preceding 12 months (or for such shorter period that the registrant was required to file such reports), and (2) has been subject to such filing requirements for the past 90 days. Yes x No o
Indicate by check mark whether the registrant has submitted electronically and posted on its corporate Web site, if any, every Interactive Data File required to be submitted and posted pursuant to Rule 405 of Regulation S-T (§232.405 of this chapter) during the preceding 12 months (or for such shorter period that the registrant was required to submit and post such files). Yes x No o
Indicate by check mark whether the registrant is a large accelerated filer, an accelerated filer, a non-accelerated filer, or a smaller reporting company. See the definitions of “large accelerated filer,” “accelerated filer” and “smaller reporting company” in Rule 12b-2 of the Exchange Act.
Large accelerated filer o | Accelerated filer o | |
Non-accelerated filer o | Smaller reporting company x | |
(Do not check if a smaller reporting company) | ||
Indicate by check mark whether the registrant is a shell company (as defined in Rule 12b-2 of the Exchange Act). Yes o No x
There were 23,702,444 shares of the registrant's common shares outstanding as of November 1, 2016. Total outstanding common shares excludes 2,026,315 common shares which are no longer outstanding due to an appraisal petition that was filed with the Delaware Court of Chancery on April 28, 2016.
1
CIFC LLC
Index to Form 10-Q
Page | |
2
SPECIAL NOTE REGARDING FORWARD-LOOKING STATEMENTS
Certain statements in this quarterly report on Form 10-Q (this "Quarterly Report"), and the information incorporated by reference into this Quarterly Report are forward-looking statements, as permitted by the Private Securities Litigation Reform Act of 1995. These include, but are not limited to, statements regarding future results or expectations. Forward-looking statements can be identified by forward-looking language, including words such as "believes," "anticipates," "expects," "estimates," "intends," "may," "plans," "projects," "will" and similar expressions, or the negative of these words. Such forward-looking statements are based on facts and conditions as they exist at the time such statements are made, various operating assumptions and predictions as to future facts and conditions, which may be difficult to accurately make and involve the assessment of events beyond our control. Caution must be exercised in relying on forward-looking statements. Our actual results may differ materially from the forward-looking statements contained in this Quarterly Report. We believe these factors include but are not limited to those described under the section entitled Item 1A —“Risk Factors” in our Annual Report on Form 10-K for the year ended December 31, 2015 (the "2015 Annual Report") as such factors may be updated from time to time in our periodic filings with the United States Securities and Exchange Commission ("SEC"), which are accessible on the SEC’s website at www.sec.gov.
The forward-looking statements contained in this Quarterly Report are made as of the date hereof, and we do not undertake any obligation to update any forward-looking statement to reflect subsequent events, new information or circumstances arising after the date of this Quarterly Report. All future written and oral forward-looking statements attributable to us or any person acting on our behalf are expressly qualified in their entirety by the cautionary statements contained or referenced above. In addition, it is our policy generally not to make any specific projections as to future earnings, and we do not endorse any projections regarding future performance that may be made by third parties.
3
PART I. Financial Information
Item 1. Condensed Consolidated Financial Statements and Notes (Unaudited)
CIFC LLC AND ITS SUBSIDIARIES
Condensed Consolidated Balance Sheets
(Unaudited)
September 30, 2016 | December 31, 2015 | ||||||
(In thousands, except share and per share amounts) | |||||||
ASSETS | |||||||
Cash and cash equivalents | $ | 38,843 | $ | 57,968 | |||
Restricted cash and cash equivalents | 1,694 | 1,694 | |||||
Investments | 111,906 | 70,696 | |||||
Receivables | 11,373 | 7,075 | |||||
Prepaid and other assets | 875 | 1,973 | |||||
Deferred tax asset, net | 41,404 | 44,425 | |||||
Equipment and improvements, net | 4,031 | 4,866 | |||||
Intangible assets, net | 4,141 | 6,857 | |||||
Goodwill | 76,000 | 76,000 | |||||
Subtotal | 290,267 | 271,554 | |||||
Assets of Consolidated Entities: | |||||||
Restricted cash and cash equivalents | 108,681 | 94,018 | |||||
Due from brokers | 33,990 | 25,910 | |||||
Investments | 1,843,268 | 1,351,403 | |||||
Receivables | 6,118 | 4,109 | |||||
Prepaid and other assets | 147 | 209 | |||||
Total assets of Consolidated Entities (1) | 1,992,204 | 1,475,649 | |||||
TOTAL ASSETS | $ | 2,282,471 | $ | 1,747,203 | |||
LIABILITIES | |||||||
Due to brokers | $ | — | $ | 61 | |||
Accrued and other liabilities | 37,938 | 18,397 | |||||
Contingent liabilities | 7,694 | 8,338 | |||||
Long-term debt | 156,234 | 156,161 | |||||
Subtotal | 201,866 | 182,957 | |||||
Non-Recourse Liabilities of Consolidated Entities: | |||||||
Due to brokers | 80,054 | 71,603 | |||||
Accrued and other liabilities | 150 | 193 | |||||
Interest payable | 4,903 | 5,090 | |||||
Long-term debt | 1,798,669 | 1,308,558 | |||||
Total Non-Recourse Liabilities of Consolidated Entities (1) | 1,883,776 | 1,385,444 | |||||
TOTAL LIABILITIES | 2,085,642 | 1,568,401 | |||||
EQUITY (Note 10) | |||||||
Common shares, par value $0.001: 500,000,000 shares authorized, 23,641,036 and 25,314,756 issued and outstanding as of September 30, 2016 and December 31, 2015, respectively. | 24 | 25 | |||||
Additional paid-in capital | 986,520 | 992,419 | |||||
Retained earnings (deficit) | (798,160 | ) | (821,491 | ) | |||
TOTAL CIFC LLC SHAREHOLDERS’ EQUITY | 188,384 | 170,953 | |||||
Noncontrolling interests in Consolidated Funds (Note 2) | 8,445 | 7,849 | |||||
TOTAL EQUITY | 196,829 | 178,802 | |||||
TOTAL LIABILITIES AND EQUITY | $ | 2,282,471 | $ | 1,747,203 | |||
4
CIFC LLC AND ITS SUBSIDIARIES
Condensed Consolidated Balance Sheets (continued)
(Unaudited)
Included in the Company's Condensed Consolidated Balance Sheets are balances from Consolidated Variable Interest Entities ("Consolidated VIEs") (1). See Notes 2 and 4.
September 30, 2016 | December 31, 2015 | ||||||
(In thousands) | |||||||
ASSETS | |||||||
Assets of Consolidated VIEs: | |||||||
Restricted cash and cash equivalents | $ | 108,681 | $ | 94,018 | |||
Due from brokers | 33,990 | 25,910 | |||||
Investments | 1,843,268 | 1,351,403 | |||||
Receivables | 6,118 | 4,109 | |||||
Prepaid and other assets | 147 | 209 | |||||
Total assets of Consolidated VIEs | $ | 1,992,204 | $ | 1,475,649 | |||
LIABILITIES | |||||||
Non-Recourse Liabilities of Consolidated VIEs: | |||||||
Due to brokers | $ | 80,054 | $ | 71,603 | |||
Accrued and other liabilities | 150 | 193 | |||||
Interest payable | 4,903 | 5,090 | |||||
Long-term debt | 1,798,669 | 1,308,558 | |||||
Total Non-Recourse Liabilities of Consolidated VIEs | $ | 1,883,776 | $ | 1,385,444 | |||
Explanatory Note:
________________________________
(1) | The assets of the Consolidated Entities are not available to the Company's general creditors, and as a result, the Company does not consider them its assets. Additionally, the investors in the debt and residual interests of the Consolidated Entities have no recourse to the Company's general assets. Therefore, debt of the Consolidated Entities is not the Company's obligation. |
See notes to Condensed Consolidated Financial Statements.
5
CIFC LLC AND ITS SUBSIDIARIES
Condensed Consolidated Statements of Operations
(Unaudited)
For the Three Months Ended September 30, | For the Nine Months Ended September 30, | ||||||||||||||
2016 | 2015 | 2016 | 2015 | ||||||||||||
(In thousands, except share and per share amounts) | |||||||||||||||
Revenues | |||||||||||||||
Management and incentive fees | $ | 14,609 | $ | 19,254 | $ | 55,701 | $ | 61,466 | |||||||
Interest income from investments | 1,299 | 1,115 | 3,394 | 5,949 | |||||||||||
Interest income - Consolidated Entities | 24,799 | 4,143 | 68,598 | 9,934 | |||||||||||
Total net revenues | 40,707 | 24,512 | 127,693 | 77,349 | |||||||||||
Expenses | |||||||||||||||
Employee compensation and benefits | 10,472 | 7,513 | 29,449 | 23,547 | |||||||||||
Share-based compensation | 1,505 | 1,166 | 5,630 | 3,834 | |||||||||||
Professional services | 5,228 | 2,912 | 8,985 | 6,634 | |||||||||||
General and administrative expenses | 2,434 | 2,413 | 7,494 | 7,226 | |||||||||||
Depreciation and amortization | 917 | 1,769 | 3,295 | 6,259 | |||||||||||
Impairment of intangible assets | — | 461 | 531 | 1,203 | |||||||||||
Corporate interest expense | 2,004 | 962 | 5,960 | 2,256 | |||||||||||
Expenses - Consolidated Entities | 708 | 8,565 | 1,705 | 10,268 | |||||||||||
Interest expense - Consolidated Entities | 11,830 | 1,587 | 31,852 | 3,254 | |||||||||||
Total expenses | 35,098 | 27,348 | 94,901 | 64,481 | |||||||||||
Other Gain (Loss) | |||||||||||||||
Net gain (loss) on investments | 12,321 | (2,615 | ) | 16,455 | 45 | ||||||||||
Net gain (loss) on contingent liabilities | (237 | ) | (502 | ) | (451 | ) | (1,792 | ) | |||||||
Net gain (loss) on investments - Consolidated Entities | 28,954 | (4,642 | ) | 55,657 | (529 | ) | |||||||||
Net gain (loss) on liabilities - Consolidated Entities | (29,888 | ) | 11,178 | (61,135 | ) | 8,512 | |||||||||
Net gain (loss) on other investments and derivatives - Consolidated Entities | — | 1,228 | — | 2,970 | |||||||||||
Net other gain (loss) | 11,150 | 4,647 | 10,526 | 9,206 | |||||||||||
Income (loss) before income taxes | 16,759 | 1,811 | 43,318 | 22,074 | |||||||||||
Income tax (expense) benefit | 1,267 | (526 | ) | (2,879 | ) | (13,441 | ) | ||||||||
Net income (loss) | 18,026 | 1,285 | 40,439 | 8,633 | |||||||||||
Net (income) loss attributable to noncontrolling interests in Consolidated Entities | (355 | ) | 184 | (679 | ) | (633 | ) | ||||||||
Net income (loss) attributable to CIFC LLC | $ | 17,671 | $ | 1,469 | $ | 39,760 | $ | 8,000 | |||||||
Earnings (loss) per share (Note 11) — | |||||||||||||||
Basic | $ | 0.75 | $ | 0.06 | $ | 1.63 | $ | 0.32 | |||||||
Diluted | $ | 0.67 | $ | 0.06 | $ | 1.52 | $ | 0.30 | |||||||
Weighted-average number of shares outstanding (Note 11)— | |||||||||||||||
Basic | 23,620,492 | 25,367,832 | 24,354,474 | 25,316,796 | |||||||||||
Diluted | 26,200,942 | 26,464,883 | 26,087,936 | 26,493,549 | |||||||||||
Distributions declared per share | $ | 0.10 | $ | 0.10 | $ | 0.69 | $ | 0.30 | |||||||
See notes to Condensed Consolidated Financial Statements.
6
CIFC LLC AND ITS SUBSIDIARIES
Condensed Consolidated Statements of Comprehensive Income (Loss)
(Unaudited)
For the Three Months Ended September 30, | For the Nine Months Ended September 30, | |||||||||||||||
2016 | 2015 | 2016 | 2015 | |||||||||||||
(In thousands) | ||||||||||||||||
Net income (loss) | $ | 18,026 | $ | 1,285 | $ | 40,439 | $ | 8,633 | ||||||||
Other comprehensive income (loss) | — | — | — | — | ||||||||||||
Comprehensive income (loss) | 18,026 | 1,285 | 40,439 | 8,633 | ||||||||||||
Comprehensive (income) loss attributable to noncontrolling interests in Consolidated Entities | (355 | ) | 184 | (679 | ) | (633 | ) | |||||||||
Comprehensive income (loss) attributable to CIFC LLC | $ | 17,671 | $ | 1,469 | $ | 39,760 | $ | 8,000 | ||||||||
See notes to Condensed Consolidated Financial Statements.
7
CIFC LLC AND ITS SUBSIDIARIES
Condensed Consolidated Statements of Equity (Unaudited)
CIFC LLC Shareholders' Equity | Consolidated Entities (Note 2) | ||||||||||||||||||||||||||||||||||||
Common Shares | Treasury Shares | ||||||||||||||||||||||||||||||||||||
Shares Outstanding | Par Value | Shares | Amount | Additional paid-in capital | Retained earnings (deficit) | Total CIFC LLC Shareholders' Equity | Noncontrolling Interests in Consolidated Funds | Appropriated retained earnings (deficit) of Consolidated VIEs | Total Shareholders' Equity | ||||||||||||||||||||||||||||
(In thousands) | |||||||||||||||||||||||||||||||||||||
Balance—December 31, 2014 | 25,193 | $ | 25 | 130 | $ | (914 | ) | $ | 988,904 | $ | (811,695 | ) | $ | 176,320 | $ | 210,818 | $ | 134,764 | $ | 521,902 | |||||||||||||||||
Deconsolidation of CLOs and funds on adoption of ASU 2015-02 | — | — | — | — | — | — | (204,393 | ) | (127,877 | ) | (332,270 | ) | |||||||||||||||||||||||||
Valuation of financial assets and liabilities of Consolidated CLOs on adoption of ASU 2014-13 | — | — | — | — | — | — | — | — | (6,887 | ) | (6,887 | ) | |||||||||||||||||||||||||
Net income (loss) | — | — | — | — | — | 8,000 | 8,000 | 633 | — | 8,633 | |||||||||||||||||||||||||||
Extension of warrants | — | — | — | — | 350 | — | 350 | — | — | 350 | |||||||||||||||||||||||||||
Share-based compensation, net of taxes | 168 | — | — | — | 3,570 | — | 3,570 | — | — | 3,570 | |||||||||||||||||||||||||||
Exercise of options | 25 | — | — | — | 128 | — | 128 | — | — | 128 | |||||||||||||||||||||||||||
Repurchases of common shares | (35 | ) | — | 35 | (246 | ) | — | — | (246 | ) | — | — | (246 | ) | |||||||||||||||||||||||
Contribution from noncontrolling interests | — | — | — | — | — | — | — | 16,100 | — | 16,100 | |||||||||||||||||||||||||||
Distributions to noncontrolling interests | — | — | — | — | — | — | — | (13,470 | ) | — | (13,470 | ) | |||||||||||||||||||||||||
Distributions declared | — | — | — | — | — | (7,598 | ) | (7,598 | ) | — | — | (7,598 | ) | ||||||||||||||||||||||||
Balance—September 30, 2015 | 25,351 | $ | 25 | 165 | $ | (1,160 | ) | $ | 992,952 | $ | (811,293 | ) | $ | 180,524 | $ | 9,688 | $ | — | $ | 190,212 | |||||||||||||||||
Balance—December 31, 2015 | 25,315 | $ | 25 | — | $ | — | $ | 992,419 | $ | (821,491 | ) | $ | 170,953 | $ | 7,849 | $ | — | $ | 178,802 | ||||||||||||||||||
Net income (loss) | — | — | — | — | — | 39,760 | 39,760 | 679 | — | 40,439 | |||||||||||||||||||||||||||
Dissenting Shareholders (Note 10) | (2,026 | ) | (2 | ) | — | — | (11,305 | ) | — | (11,307 | ) | — | — | (11,307 | ) | ||||||||||||||||||||||
Share-based compensation, net of taxes | 327 | 1 | — | — | 5,394 | (218 | ) | 5,177 | — | — | 5,177 | ||||||||||||||||||||||||||
Exercise of options | 100 | — | — | — | 447 | — | 447 | — | — | 447 | |||||||||||||||||||||||||||
Repurchases of common shares | — | — | 75 | (435 | ) | — | — | (435 | ) | — | — | (435 | ) | ||||||||||||||||||||||||
Retirement of treasury stock | (75 | ) | — | (75 | ) | 435 | (435 | ) | — | — | — | — | — | ||||||||||||||||||||||||
Distributions to noncontrolling interests | — | — | — | — | — | — | — | (83 | ) | — | (83 | ) | |||||||||||||||||||||||||
Distributions declared | — | — | — | — | (16,211 | ) | (16,211 | ) | — | — | (16,211 | ) | |||||||||||||||||||||||||
Balance—September 30, 2016 | 23,641 | $ | 24 | — | $ | — | $ | 986,520 | $ | (798,160 | ) | $ | 188,384 | $ | 8,445 | $ | — | $ | 196,829 | ||||||||||||||||||
See notes to Condensed Consolidated Financial Statements.
8
CIFC LLC AND ITS SUBSIDIARIES
Condensed Consolidated Statements of Cash Flows
(Unaudited)
For the Nine Months Ended September 30, | |||||||
2016 | 2015 | ||||||
(In thousands) | |||||||
CASH FLOWS FROM OPERATING ACTIVITIES: | |||||||
Net income (loss) | $ | 40,439 | $ | 8,633 | |||
Adjustments to reconcile net income (loss) to net cash provided by (used in) operating activities: | |||||||
Amortization of debt issuance costs and other | 240 | 67 | |||||
Share-based compensation | 5,630 | 3,834 | |||||
Net (gain) loss on investments and contingent liabilities / other (gain) loss | (16,004 | ) | 1,747 | ||||
Depreciation and amortization | 3,295 | 6,259 | |||||
Impairment of intangible assets | 531 | 1,203 | |||||
Deferred income tax expense (benefit) | 3,021 | 7,296 | |||||
Excess tax benefits from share-based payment arrangements | 220 | (7 | ) | ||||
Consolidated Entities: | |||||||
Net (gain) loss on investments | (55,657 | ) | 529 | ||||
Net (gain) loss on liabilities | 61,135 | (8,512 | ) | ||||
Net other (gain) loss | — | (2,970 | ) | ||||
Changes in operating assets and liabilities: | |||||||
Due from brokers | — | (62 | ) | ||||
Receivables | (4,442 | ) | (5,253 | ) | |||
Prepaid and other assets | 1,098 | 991 | |||||
Due to brokers | (61 | ) | 2,692 | ||||
Accrued and other liabilities | 8,502 | (11 | ) | ||||
Consolidated Entities: | |||||||
Due from brokers | 2,942 | (15,264 | ) | ||||
Purchase of investments | (610,716 | ) | (809,811 | ) | |||
Sales of investments | 615,484 | 336,749 | |||||
Receivables | (833 | ) | (4,137 | ) | |||
Due to brokers | (13 | ) | 100,650 | ||||
Accrued and other liabilities | (142 | ) | (114 | ) | |||
Interest payable | (2,425 | ) | 894 | ||||
Net cash provided by (used in) operating activities | 52,244 | (374,597 | ) | ||||
CASH FLOWS FROM INVESTING ACTIVITIES: | |||||||
Purchases of investments | (92,711 | ) | (66,256 | ) | |||
Sales of investments | 62,677 | 71,662 | |||||
Purchases of equipment and improvements | (277 | ) | (802 | ) | |||
Consolidated Entities: | |||||||
Change in restricted cash and cash equivalents | 32,604 | (210,905 | ) | ||||
Net cash provided by (used in) investing activities | 2,293 | (206,301 | ) | ||||
CASH FLOWS FROM FINANCING ACTIVITIES: | |||||||
Repurchases of common shares | (435 | ) | (246 | ) | |||
Payments of share and debt issuance cost | (167 | ) | (75 | ) | |||
Distributions paid | (16,211 | ) | (7,598 | ) | |||
Proceeds from extension of warrants | — | 350 | |||||
Proceeds from the exercise of options | 483 | 121 | |||||
Payments for tax from the net delivery of restricted share units | (270 | ) | (265 | ) | |||
Payments on contingent liabilities | (1,534 | ) | (3,599 | ) | |||
Excess tax benefits from share-based payment arrangements | (220 | ) | 7 | ||||
Consolidated Entities: | |||||||
Contributions from noncontrolling interests | — | 16,100 | |||||
Distributions to noncontrolling interests | (83 | ) | (13,470 | ) | |||
Proceeds from issuance of long-term debt | 68 | 569,753 | |||||
Payments made on long-term debt | (55,293 | ) | (8,387 | ) | |||
Net cash provided by (used in) financing activities | (73,662 | ) | 552,691 | ||||
Net increase (decrease) in cash and cash equivalents | (19,125 | ) | (28,207 | ) | |||
Cash and cash equivalents at beginning of period | 57,968 | 59,290 | |||||
Cash and cash equivalents at end of period | $ | 38,843 | $ | 31,083 | |||
9
CIFC LLC AND ITS SUBSIDIARIES
Condensed Consolidated Statements of Cash Flows (continued)
(Unaudited)
For the Nine Months Ended September 30, | |||||||
2016 | 2015 | ||||||
(In thousands) | |||||||
SUPPLEMENTAL DISCLOSURE: | |||||||
Cash paid for interest | $ | 4,733 | $ | 1,879 | |||
Net cash paid for income taxes | $ | 4,620 | $ | 9,400 | |||
Consolidated Entities: | |||||||
Cash paid for interest | $ | 52,143 | $ | 5,257 | |||
Non-cash disclosures: | |||||||
Dissenting Shareholders (Note 10) | $ | 11,305 | $ | — | |||
Exercise of share options and RSUs | $ | 263 | $ | — | |||
Consolidated Entities: | |||||||
Consolidation of net assets | $ | 13,696 | $ | — | |||
Deconsolidation of net assets | $ | (8,236 | ) | $ | (22,578 | ) | |
Non-cash settlement of interest receivables with increases in principal | $ | 55 | $ | 89 | |||
See notes to Condensed Consolidated Financial Statements.
10
CIFC LLC AND ITS SUBSIDIARIES
NOTES TO CONDENSED CONSOLIDATED FINANCIAL STATEMENTS (Unaudited)
Note 1—Organization and Business
Organization—CIFC LLC (together with its subsidiaries, "CIFC" or the "Company") is a Delaware limited liability company headquartered in New York City. The Company is a private debt manager specializing in secured U.S. corporate loan strategies. The Company's primary business is to provide investment management services for institutional investors, including pension funds, hedge funds, asset management firms, banks, insurance companies and other types of institutional investors around the world.
On December 31, 2015, CIFC Corp., the Company's former publicly traded entity, completed a series of transactions (the "Reorganization Transaction") to become a subsidiary of CIFC LLC, the current publicly traded entity. The series of transactions changed the Company's top-level form of organization from a corporation to a limited liability company. As of January 1, 2016, the Company is taxed as a partnership.
Fee Earning Assets Under Management (“Fee Earning AUM” or “AUM”) refers to the principal balance, net asset value or value of assets managed by the Company on which the Company earns management and/or incentive fees. The Company's AUM is primarily comprised of Collateralized Loan Obligations ("CLOs"). In addition, the Company manages credit funds and other loan-based products (together, "Non-CLO products" and together with CLOs, "Funds"). The Company manages these credit products through opportunistic investment strategies where the Company seeks to generate current income and/or capital appreciation, primarily through senior secured corporate loan investments (“SSCLs”) and, to a lesser extent, other investments. The Company also manages Collateralized Debt Obligations (“CDOs”), which it does not expect to issue in the future.
The Company has three primary sources of revenue: management fees, incentive fees and investment income. Management fees are generally earned based on a percentage of AUM of the Funds. Incentive fees are earned based on the performance of the Funds. Investment income represents interest income and realized/unrealized gains and losses on investments in the products sponsored by the Company and third parties.
Pending Strategic Transaction—On August 19, 2016, the Company entered into an Agreement and Plan of Merger (the “Merger Agreement”) with F.A.B. Holdings I LP, a limited partnership organized and existing under the laws of Delaware (“Parent”), and CIFC Acquisition, LLC, a Delaware limited liability company and a wholly owned subsidiary of Parent (“Merger Sub”), providing for the merger of Merger Sub with and into the Company (the “Merger”), with the Company surviving the Merger as a wholly owned subsidiary of Parent. The Merger Agreement and the consummation of the transactions contemplated by the Merger Agreement have been approved by the Company’s board of directors.
At the effective time of the Merger (the “Effective Time”), each common share, par value $0.001 per share, of the Company issued and outstanding immediately prior to the Effective Time, will be converted into the right to receive $11.36 in cash, without interest (the “Merger Consideration”), other than (i) common shares held by Parent, Merger Sub or the Company or any of their respective direct or indirect wholly owned subsidiaries (other than shares held by any subsidiary of the Company, which shall remain outstanding with appropriate adjustment to the number thereof to preserve its relative interest in the Company), (ii) common shares held by a holder who has properly exercised dissenters’ rights with respect to such common shares in accordance with Section 262 of the General Corporation Law of the State of Delaware and (iii) the Rollover Shares (as defined below).
Pursuant to the Merger Agreement, each option to purchase common shares granted under the Company’s compensation plans that is outstanding, or by the terms of the award agreement is being treated as outstanding, immediately prior to the Effective Time, will, as of the Effective Time, become fully vested and will be cancelled and converted into the right to receive an amount in cash, without interest, equal to the product of (i) the aggregate number of common shares subject to such option and (ii) the excess, if any, of the Merger Consideration over the per share exercise price of such option. In addition, each award of restricted share units relating to common shares that is outstanding, or by the terms of the award agreement is being treated as outstanding, immediately prior to the Effective Time, will, as of the Effective Time, become fully vested, free of restrictions and will be cancelled and converted into the right to receive an amount in cash, without interest, equal to the product of (i) the aggregate number of common shares subject to such award and (ii) the Merger Consideration. Any such restricted share unit award that becomes vested based on the achievement of performance goals will be treated as if the maximum level of performance was achieved for purposes of determining the number of common shares subject to such award (other than performance goals based on the amount of the Merger Consideration, in which case the level of achievement will be based on the amount of the Merger Consideration). Furthermore, the warrant to acquire common shares shall, as of the Effective Time, be redeemed or canceled in exchange for the right to receive (a) an amount in cash, without interest, equal to the product of (i) the aggregate number of common shares such warrant is exercisable
11
into (the "Warrant Shares"), multiplied by (ii) the excess, if any, of the Merger Consideration over the per share exercise price of such warrant and (b) accrued dividends, and future dividends made prior to the closing, in respect of the Warrant Shares.
Notwithstanding the foregoing, certain of our employees have entered into rollover agreements with Parent pursuant to which certain of their equity will be rolled over into Parent (the “Rollover Shares”), including that certain of their restricted share units that are scheduled to vest on or after January 1, 2017 will not become vested or settled in connection with the Merger and instead will be assumed by Parent and will continue to vest in accordance with such restricted share units' regular vesting schedule (subject to acceleration or forfeiture upon certain terminations of employment).
The Merger Agreement contains certain customary termination rights for the Company and Parent including, among others, the right to terminate in the event that the Merger has not been consummated on or before January 31, 2017. Additionally, the Company has agreed to pay Parent a termination fee of 13,332,000 in cash upon termination of the Merger Agreement under certain specified circumstances, including in connection with a termination of the Merger Agreement by the Company to enter into a Superior Proposal, as defined in the Merger Agreement, or a change in the Company’s board of director’s recommendation that the Company’s shareholders vote for the Merger.
As of October 31, 2016, the Company has obtained sufficient consents under its investment advisory agreements to the deemed assignment of those agreements resulting from the change in control that will take place upon the closing of the Merger from the Company's fund clients and other clients, as required by the Merger Agreement. Consummation of the Merger is subject to certain other conditions, including the receipt of the necessary approval from the Company’s shareholders and other customary closing conditions. The Merger is expected to close shortly after the annual meeting of the Company's shareholders, which is scheduled for November 16, 2016, at 10:00 a.m. Eastern time.
The Merger Agreement contains representations and warranties customary for transactions of this type. The Company has agreed to various customary covenants and agreements, including, among others, agreements to conduct its business in the ordinary course during the period between the execution of the Merger Agreement and the Effective Time, not to engage in certain kinds of transactions during this period, and to convene and hold a meeting of its shareholders for the purpose of approving the Merger Agreement.
Concurrent with and as a condition to Parent entering into the Merger Agreement and incurring the obligations set forth therein, DFR Holdings, LLC (“DRF Holdings”) entered into a Voting Agreement with Parent and the Company with respect to all common shares beneficially owned by DFR Holdings, together with any other voting securities of the Company and any securities convertible into or exercisable or exchangeable for common shares or other voting securities of the Company, pursuant to which DFR Holdings agrees, inter alia, to vote in favor of the Merger and the approval of the Merger Agreement, subject to certain exceptions. DFR Holdings beneficially owns approximately 80% of the outstanding common shares of the Company.
Note 2—Basis of Presentation and Principles of Consolidation
Basis of Presentation—The accompanying unaudited Condensed Consolidated Financial Statements have been prepared in conformity with the instructions to Form 10-Q and Article 10-01 of Regulation S-X for interim financial statements. Accordingly, they do not include all information and footnotes required by generally accepted accounting principles in the United States of America ("GAAP") for complete financial statements. The preparation of financial statements requires management to make estimates and assumptions that affect the amounts reported in the Condensed Consolidated Financial Statements and accompanying notes. Management believes that estimates utilized in the preparation of the Condensed Consolidated Financial Statements are prudent and reasonable.
Actual results could differ from those estimates and such differences could be material. These accompanying unaudited Condensed Consolidated Financial Statements and related Notes should be read in conjunction with the Consolidated Financial Statements and related Notes included in the 2015 Annual Report.
In the opinion of management, the accompanying Condensed Consolidated Financial Statements contain all adjustments, consisting of normal recurring adjustments, necessary for a fair statement of the results for the interim periods presented. Such operating results may not be indicative of the expected results for any other interim periods or the entire year.
12
CIFC LLC AND ITS SUBSIDIARIES
NOTES TO CONDENSED CONSOLIDATED FINANCIAL STATEMENTS (Unaudited)
The Reorganization Transaction was a transaction between entities under common control; therefore, the prior year comparative Condensed Consolidated Financial Statements include the Consolidated Balance Sheet, Statement of Operations, Comprehensive Income (Loss), Equity and Cash Flows as of December 31, 2015 and for the three and nine months ended September 30, 2015 of CIFC Corp. During the third quarter of 2015, we adopted certain Accounting Standard Updates ("ASU") issued by the Financial Accounting Standards Board ("FASB") such as the deconsolidation of certain CLOs and Funds (or ASU 2015-02) and the valuation of financial assets and liabilities of Consolidated CLOs (or ASU 2014-13) which were applied on a modified retroactive basis (or January 1, 2015). Further, the Condensed Consolidated Financial Statements and the related notes for the three and nine months ended September 30, 2015 have been re-presented to reflect a detailed break-out of line items previously included within Net results of Consolidated Entities on the Condensed Consolidated Statements of Operations.
Principles of Consolidation—The Condensed Consolidated Financial Statements include the financial statements of CIFC and its wholly owned subsidiaries, the entities in which the Company has a controlling interest ("Consolidated Funds") and VIEs for which the Company is deemed to be the primary beneficiary (together with Consolidated Funds and VIEs, the "Consolidated Entities").
All intercompany balances and transactions have been eliminated upon consolidation. This consolidation, particularly with respect to the Consolidated Entities, significantly impacts the Company's Condensed Consolidated Financial Statements.
Consolidated Entities—Consolidated Entities includes the operating results of the Consolidated Funds and the Consolidated VIEs. As of September 30, 2016 and December 31, 2015, the Company held $99.6 million and $81.8 million of investments in its Consolidated Entities, respectively.
Consolidated VIEs—The Company consolidates variable interest entities in which it is deemed the primary beneficiary. These Consolidated VIEs generally include certain CLOs (collectively, the "Consolidated CLOs"), warehouses, loan investment products, and other similar legal entities.
The Company holds interests in and manages an open-end credit fund that invests primarily in second-lien loans. The Company consolidated the fund as it was deemed the primary beneficiary. As the investment manager, the Company cannot be removed and held a significant financial interest in the fund. As of September 30, 2016 and December 31, 2015, the Company held an investment of $36.7 million and $33.2 million, respectively, and the limited partners held $8.4 million and $7.8 million, respectively, which is reported in "Noncontrolling interests in Consolidated Funds" on the Condensed Consolidated Balance Sheets.
During the nine months ended September 30, 2016, the Company purchased and sold residual interests in certain CLOs. As a result of these transactions, the Company deemed the expected potential returns on 2 CLOs significant while 1 CLO was no longer potentially significant. As such, during the nine months ended September 30, 2016, the Company consolidated 2 additional CLOs and deconsolidated 1 CLO. As of September 30, 2016 and December 31, 2015, the Company consolidated 3 CLOs and 2 credit funds and 2 CLOs and 2 credit funds, respectively. During the three months ended September 30, 2016, the Company consolidated 3 CLOs and 2 credit funds and during the nine months ended September 30, 2016, the Company consolidated 4 CLOs (of which 1 was deconsolidated as of June 30, 2016) and 2 credit funds. During the three and nine months ended September 30, 2015, the Company consolidated 2 CLOs and 2 credit funds.
Unconsolidated VOEs—The Company holds interests in and manages two closed-end structured credit funds that invest primarily in CLOs and warehouses. As of September 30, 2016 and December 31, 2015, the aggregate carrying value of the Company's investments, as the general partner of these funds, was $19.1 million and $26.0 million, respectively. The limited partners of the Funds may remove the general partner's presumption of control, and as such, the Company did not consolidate these Funds. The Company's investments in these Funds is recorded in "Investments" on the Company's Condensed Consolidated Balance Sheets.
Unconsolidated VIEs—As of September 30, 2016, the Company had variable interests in 24 CLOs, 8 CDOs, 2 warehouses (see below), and 2 Non-CLO products, which the Company managed, that were not consolidated (collectively the "Unconsolidated VIEs") as the Company was not deemed to be the primary beneficiary. As of December 31, 2015, the Company's Unconsolidated VIEs included 28 CLOs, 8 CDOs and 2 Non-CLO products.
13
CIFC LLC AND ITS SUBSIDIARIES
NOTES TO CONDENSED CONSOLIDATED FINANCIAL STATEMENTS (Unaudited)
The Company's maximum exposure to loss on Unconsolidated VIEs includes its investment, management fee receivables and future management fees collectible by the Company. As of September 30, 2016 and December 31, 2015 the Company invested $91.2 million and $29.0 million, respectively, in Unconsolidated VIEs and the Company's management fee receivables were $3.8 million and $4.1 million, respectively.
Warehouses—From time to time, the Company will create special purpose vehicles ("SPVs") to warehouse SSCLs in advance of sponsoring new CLOs or other Funds. The Company may contribute equity to the new SPVs, which are typically levered three to five times depending on the terms agreed to with the warehousing counterparties. When the related CLO or Fund is sponsored, typically around three to nine months later, the warehouse is “terminated,” with it concurrently repaying the related financing and returning to the Company its equity contribution, net of gains and losses, if any. As of September 30, 2016 and December 31, 2015, the Company did not consolidate any warehouses. As of September 30, 2016, the Company held variable interests in 2 warehouses for which it was not deemed to be the primary beneficiary.
The Company holds interests in and manages an open-end credit fund that invests in performing U.S. SSCLs to provide capital appreciation and risk-adjusted returns to its investors. The Company does not consolidate this fund as it does not have a significant financial interest in the fund and was not deemed the primary beneficiary of the fund. As of September 30, 2016 and December 31, 2015, the carrying value of the Company's investment, as the general partner of this fund, was $5.8 million and $5.4 million, respectively.
Note 3—Summary of Significant Accounting Policies and Recent Accounting Updates
As of September 30, 2016, the Company's significant accounting policies, which are detailed in the 2015 Annual Report have not changed materially.
Recent Accounting Updates
In March 2016, the FASB issued ASU 2016-09, Compensation—Stock Compensation (Topic 718) ("ASU 2016-09"), which is intended to simplify several aspects of the accounting for share-based payment award transactions. Specifically, ASU 2016-09 aims to simplify the accounting for share-based payment transactions, including the income tax consequences, classification of awards as either equity or liabilities and classification on the statement of cash flows. The guidance will be effective for fiscal years beginning after December 15, 2016, including interim periods within that year. The Company is currently evaluating the impact of this ASU on its Consolidated Financial Statements.
In February 2016, the FASB issued ASU 2016-02, Leases (Topic 842) ("ASU 2016-02"), to increase transparency and comparability among organizations by recognizing all lease transactions (with terms in excess of 12 months) on the balance sheet as a lease liability and a right-of-use asset (as defined). ASU 2016-02 is effective for fiscal years beginning after December 15, 2018, including interim periods within those fiscal years, with earlier application permitted. Upon adoption, the lessee will apply the new standard retrospectively to all periods presented or retrospectively using a cumulative effect adjustment in the year of adoption. The Company is currently evaluating the impact of this ASU on its Consolidated Financial Statements.
In August 2015, the FASB issued ASU 2015-14, Revenue from Contracts with Customers (Topic 606), Deferral of the Effective Date ("ASU 2015-14"). The ASU amends the effective date of ASU 2014-09 for all entities by one year. In May 2014, the FASB issued ASU 2014-09, Revenue from Contracts with Customers (Topic 606) ("ASU 2014-09"), which outlines a single comprehensive model for entities to use in accounting for revenue arising from contracts with customers and supersedes most current revenue recognition guidance, including industry-specific guidance. The standard clarifies the required factors that an entity must consider when recognizing revenue and also requires additional disclosures. With the issuance of ASU 2015-14 the new effective date for the Company is January 1, 2018. The new revenue standard may be applied retrospectively to each prior period presented or retrospectively with the cumulative effect recognized as of the date of adoption. The Company is currently evaluating the impact of this ASU on its Consolidated Financial Statements.
14
CIFC LLC AND ITS SUBSIDIARIES
NOTES TO CONDENSED CONSOLIDATED FINANCIAL STATEMENTS (Unaudited)
Note 4—Consolidated VIEs
Although the Company consolidates all the assets and liabilities of the Consolidated VIEs (including the Consolidated CLOs, warehouses and other investment products), its maximum exposure to loss is limited to its investments and beneficial interests in the Consolidated VIEs and the receivables of management fees from the Consolidated VIEs. All of these items are eliminated upon consolidation. The assets of each of the Consolidated VIEs are administered by the trustee of each fund solely as collateral to satisfy the obligations of the Consolidated VIEs. If the Company were to liquidate, the assets of the Consolidated VIEs would not be available to the Company's general creditors, and, as a result, the Company does not consider them its assets. Additionally, the investors in the debt and residual interests of the Consolidated VIEs have no recourse to the Company's general assets. Therefore, this debt is not the Company's obligation.
The following table summarizes the Company's total maximum exposure to loss on these Consolidated VIEs, as follows (1):
September 30, 2016 | December 31, 2015 | |||||||
(In thousands) | ||||||||
Maximum exposure to loss: | ||||||||
Investments and beneficial interests (2) | $ | 99,568 | $ | 81,752 | ||||
Receivables | 406 | 605 | ||||||
Total maximum exposure to loss | $ | 99,974 | $ | 82,357 | ||||
Explanatory Notes:
________________________________
(1) | In addition, exposure to loss includes future management fees on the Consolidated VIEs, which are not included in the table. |
(2) | Investments made in our Consolidated VIEs are eliminated in consolidation. |
Note 5—Fair Value
Assets and Liabilities Measured at Fair Value on a Recurring Basis
Fair Value Hierarchy—The following table summarizes the assets and liabilities carried at fair value on a recurring basis, by class and level:
September 30, 2016 | December 31, 2015 | ||||||||||||||||||||||||||||||||||||||
Level 1 | Level 2 | Level 3 | NAV | Estimated Fair Value | Level 1 | Level 2 | Level 3 | NAV | Estimated Fair Value | ||||||||||||||||||||||||||||||
(In thousands) | (In thousands) | ||||||||||||||||||||||||||||||||||||||
Assets | |||||||||||||||||||||||||||||||||||||||
Investments: | |||||||||||||||||||||||||||||||||||||||
Credit Funds | $ | — | $ | — | $ | — | $ | 24,845 | $ | 24,845 | $ | — | $ | — | $ | — | $ | 31,411 | $ | 31,411 | |||||||||||||||||||
Warehouses | — | — | 68,635 | — | 68,635 | — | — | — | — | — | |||||||||||||||||||||||||||||
Structured products & other | — | 138 | 18,288 | — | 18,426 | — | 1,768 | 37,517 | — | 39,285 | |||||||||||||||||||||||||||||
Subtotal | — | 138 | 86,923 | 24,845 | 111,906 | — | 1,768 | 37,517 | 31,411 | 70,696 | |||||||||||||||||||||||||||||
Consolidated Entities: | |||||||||||||||||||||||||||||||||||||||
Loans | — | 1,453,866 | 388,613 | — | 1,842,479 | — | 1,067,539 | 281,868 | — | 1,349,407 | |||||||||||||||||||||||||||||
Structured products & other | — | 789 | — | — | 789 | — | 840 | 1,156 | — | 1,996 | |||||||||||||||||||||||||||||
Total Consolidated Entities | — | 1,454,655 | 388,613 | — | 1,843,268 | — | 1,068,379 | 283,024 | — | 1,351,403 | |||||||||||||||||||||||||||||
Total Assets | $ | — | $ | 1,454,793 | $ | 475,536 | $ | 24,845 | $ | 1,955,174 | $ | — | $ | 1,070,147 | $ | 320,541 | $ | 31,411 | $ | 1,422,099 | |||||||||||||||||||
Liabilities | |||||||||||||||||||||||||||||||||||||||
Contingent liabilities | $ | — | $ | — | $ | 7,694 | $ | — | $ | 7,694 | $ | — | $ | — | $ | 8,338 | $ | — | $ | 8,338 | |||||||||||||||||||
Total Liabilities | $ | — | $ | — | $ | 7,694 | $ | — | $ | 7,694 | $ | — | $ | — | $ | 8,338 | $ | — | $ | 8,338 | |||||||||||||||||||
15
CIFC LLC AND ITS SUBSIDIARIES
NOTES TO CONDENSED CONSOLIDATED FINANCIAL STATEMENTS (Unaudited)
Changes in Level 3 Recurring Fair Value Measurements—The following tables summarize by class the changes in financial assets and liabilities measured at fair value classified within Level 3 of the valuation hierarchy. Net realized and unrealized gains (losses) for Level 3 financial assets and liabilities measured at fair value are included in the Consolidated Statements of Operations.
Level 3 Financial Assets | |||||||||||||||||||||||
For the Three Months Ended September 30, 2016 | |||||||||||||||||||||||
Investments | Investment Assets of Consolidated Entities | ||||||||||||||||||||||
Structured Products & Other | Warehouses | Total | Loans | Structured Products & Other | Total | ||||||||||||||||||
(In thousands) | |||||||||||||||||||||||
Estimated fair value, beginning of period | $ | 24,462 | $ | 44,990 | $ | 69,452 | $ | 426,967 | $ | 321 | $ | 427,288 | |||||||||||
Transfers into Level 3 (1) | 1,475 | — | 1,475 | 96,509 | — | 96,509 | |||||||||||||||||
Transfers out of Level 3 (2) | — | — | — | (126,116 | ) | — | (126,116 | ) | |||||||||||||||
Net realized/unrealized gains (losses) | 3,306 | 6,645 | 9,951 | 5,822 | 60 | 5,882 | |||||||||||||||||
Purchases | 4,101 | 17,000 | 21,101 | 30,502 | — | 30,502 | |||||||||||||||||
Sales | (14,222 | ) | — | (14,222 | ) | (19,444 | ) | (381 | ) | (19,825 | ) | ||||||||||||
Settlements | (834 | ) | — | (834 | ) | (25,627 | ) | — | (25,627 | ) | |||||||||||||
Estimated fair value, end of period | $ | 18,288 | $ | 68,635 | $ | 86,923 | $ | 388,613 | $ | — | $ | 388,613 | |||||||||||
Change in unrealized gains (losses) for the period for the assets held as of the end of the period | $ | 2,142 | $ | 6,645 | $ | 8,787 | $ | 5,346 | $ | — | $ | 5,346 | |||||||||||
For the Nine Months Ended September 30, 2016 | |||||||||||||||||||||||
Investments | Investment Assets of Consolidated Entities | ||||||||||||||||||||||
Structured Products & Other | Warehouses | Total | Loans | Structured Products & Other | Total | ||||||||||||||||||
(In thousands) | |||||||||||||||||||||||
Estimated fair value, beginning of period | $ | 37,517 | $ | — | $ | 37,517 | $ | 281,868 | $ | 1,156 | $ | 283,024 | |||||||||||
Transfers into Level 3 (1) | 1,475 | — | 1,475 | 299,292 | — | 299,292 | |||||||||||||||||
Transfers out of Level 3 (2) | — | — | — | (319,936 | ) | — | (319,936 | ) | |||||||||||||||
Transfers in(out) due to consolidation or acquisition | (23,443 | ) | — | (23,443 | ) | 205,361 | — | 205,361 | |||||||||||||||
Transfers out due to deconsolidation | — | — | — | (75,327 | ) | — | (75,327 | ) | |||||||||||||||
Net realized/unrealized gains (losses) | 4,259 | 7,513 | 11,772 | 7,907 | 35 | 7,942 | |||||||||||||||||
Purchases | 39,222 | 61,122 | 100,344 | 83,492 | — | 83,492 | |||||||||||||||||
Sales | (38,195 | ) | — | (38,195 | ) | (41,425 | ) | (1,191 | ) | (42,616 | ) | ||||||||||||
Settlements | (2,547 | ) | — | (2,547 | ) | (52,619 | ) | — | (52,619 | ) | |||||||||||||
Estimated fair value, end of period | $ | 18,288 | $ | 68,635 | $ | 86,923 | $ | 388,613 | $ | — | $ | 388,613 | |||||||||||
Change in unrealized gains (losses) for the period for the assets held as of the end of the period | $ | 2,104 | $ | 7,513 | $ | 9,617 | $ | 10,226 | $ | — | $ | 10,226 | |||||||||||
For the Three Months Ended September 30, 2015 | |||||||||||||||||||||||
Investments | Investment Assets of Consolidated Entities | ||||||||||||||||||||||
Loans | Structured Products & Other | Total | Loans | Structured Products & Other | Total | ||||||||||||||||||
(In thousands) | |||||||||||||||||||||||
Estimated fair value, beginning of period | $ | 1,996 | $ | 43,439 | $ | 45,435 | $ | 73,151 | $ | 3,494 | $ | 76,645 | |||||||||||
Transfers into Level 3 (1) | — | — | — | 4,717 | — | 4,717 | |||||||||||||||||
Transfers out of Level 3 (2) (3) | — | — | — | (15,930 | ) | — | (15,930 | ) | |||||||||||||||
Net realized/unrealized gains (losses) (3) | 4 | (2,459 | ) | (2,455 | ) | (726 | ) | (209 | ) | (935 | ) | ||||||||||||
Purchases (3) | — | 11,870 | 11,870 | 85,147 | — | 85,147 | |||||||||||||||||
Sales (3) | (2,000 | ) | (5,484 | ) | (7,484 | ) | (20,400 | ) | (1,987 | ) | (22,387 | ) | |||||||||||
Settlements (3) | — | — | — | (1,282 | ) | — | (1,282 | ) | |||||||||||||||
Estimated fair value, end of period | $ | — | $ | 47,366 | $ | 47,366 | $ | 124,677 | $ | 1,298 | $ | 125,975 | |||||||||||
Change in unrealized gains (losses) for the period for the assets held as of the end of the period | $ | — | $ | (3,806 | ) | $ | (3,806 | ) | $ | (370 | ) | $ | (69 | ) | $ | (439 | ) | ||||||
16
CIFC LLC AND ITS SUBSIDIARIES
NOTES TO CONDENSED CONSOLIDATED FINANCIAL STATEMENTS (Unaudited)
For the Nine Months Ended September 30, 2015 | |||||||||||||||||||||||||||
Investments | Investment Assets of Consolidated Entities | ||||||||||||||||||||||||||
Loans | Structured Products & Other | Total | Loans | Corporate Bonds | Structured Products & Other | Total | |||||||||||||||||||||
(In thousands) | |||||||||||||||||||||||||||
Estimated fair value, beginning of period | $ | 967 | $ | 7,604 | $ | 8,571 | $ | 2,517,887 | $ | 478 | $ | 69,973 | $ | 2,588,338 | |||||||||||||
Transfers into Level 3 (1) | — | — | — | 11,237 | — | — | 11,237 | ||||||||||||||||||||
Transfers out of Level 3 (2) (3) | — | — | — | (21,758 | ) | — | (1,803 | ) | (23,561 | ) | |||||||||||||||||
Transfers in (out) due to deconsolidation (3) | — | — | — | (2,476,625 | ) | (478 | ) | (67,383 | ) | (2,544,486 | ) | ||||||||||||||||
Net realized/unrealized gains (losses) (3) | 33 | (2,212 | ) | (2,179 | ) | (1,352 | ) | — | (2 | ) | (1,354 | ) | |||||||||||||||
Purchases (3) | 2,971 | 76,192 | 79,163 | 201,860 | — | 3,742 | 205,602 | ||||||||||||||||||||
Sales (3) | (3,971 | ) | (34,218 | ) | (38,189 | ) | (91,240 | ) | — | (3,229 | ) | (94,469 | ) | ||||||||||||||
Settlements (3) | — | — | — | (15,332 | ) | — | — | (15,332 | ) | ||||||||||||||||||
Estimated fair value, end of period | $ | — | $ | 47,366 | $ | 47,366 | $ | 124,677 | $ | — | $ | 1,298 | $ | 125,975 | |||||||||||||
Change in unrealized gains (losses) for the period for the assets held as of the end of the period | $ | — | $ | (4,028 | ) | $ | (4,028 | ) | $ | (369 | ) | $ | — | $ | (21 | ) | $ | (390 | ) | ||||||||
Explanatory Notes:
______________________________
(1) | Transfers in represent investments currently valued by a third-party pricing service using composite prices determined using less than two quotes, an internally developed pricing model or broker quotes and that were previously marked by a third-party pricing service using composite prices determined from two or more quotes. |
(2) | Transfers out represent investments previously valued by an internally developed pricing model, broker quotes, or a third-party pricing service using composite prices determined using less than two quotes and are now being marked by a third-party pricing service using composite prices determined from two or more quotes. |
(3) | The adoption of ASU 2015-02 was applied on a modified retrospective basis. Transfers out, net realized/unrealized gains (losses), purchases, sales and settlements for the three and nine months ended September 30, 2015 reflect the deconsolidation of CLOs as of January 1, 2015. |
For the Three Months Ended September 30, | |||||||
2016 | 2015 | ||||||
Contingent Liabilities | |||||||
(In thousands) | |||||||
Estimated fair value, beginning of period | $ | 7,680 | $ | 11,054 | |||
Net realized/unrealized (gains) losses (1) | 237 | 502 | |||||
Settlements (1) (2) | (223 | ) | (695 | ) | |||
Estimated fair value, end of period | $ | 7,694 | $ | 10,861 | |||
Change in Net realized/unrealized (gains) losses for the period for the liabilities outstanding as of the end of the period | $ | (237 | ) | $ | (502 | ) | |
For the Nine Months Ended September 30, 2016 | For the Nine Months Ended September 30, 2015 | ||||||||||||||
Contingent Liabilities | Contingent Liabilities | Long-term Debt of Consolidated Entities | Total | ||||||||||||
(In thousands) | |||||||||||||||
Estimated fair value, beginning of period | $ | 8,338 | $ | 12,668 | $ | 12,049,034 | $ | 12,061,702 | |||||||
Transfer in (out) due to deconsolidation (1)(3) | — | — | (12,049,034 | ) | (12,049,034 | ) | |||||||||
Net realized/unrealized (gains) losses (1) | 451 | 1,792 | — | 1,792 | |||||||||||
Settlements (1)(2) | (1,095 | ) | (3,599 | ) | — | (3,599 | ) | ||||||||
Estimated fair value, end of period | $ | 7,694 | $ | 10,861 | $ | — | $ | 10,861 | |||||||
Change in unrealized (gains) losses for the period for the liabilities outstanding as of the end of the period | $ | 451 | $ | (1,792 | ) | $ | — | $ | (1,792 | ) | |||||
Explanatory Notes:
__________________________
(1) | The adoption of ASU 2015-02 was applied on a modified retrospective basis. Transfers out, net realized/unrealized gains (losses), and settlements for the three and nine months ended September 30, 2015 reflect the deconsolidation of CLOs as of January 1, 2015. |
(2) | For Contingent Liabilities, amount represents payments made and due related to the contingent liabilities from the merger with Legacy CIFC (Note 8). |
(3) | Pursuant to the adoption of ASU 2014-13, the Long-term Debt of Consolidated Entities have been remeasured in accordance with the new guidance. |
17
CIFC LLC AND ITS SUBSIDIARIES
NOTES TO CONDENSED CONSOLIDATED FINANCIAL STATEMENTS (Unaudited)
Fair Value Methodologies of Financial Instruments
The following is a description of the Company's valuation methodologies for financial instruments measured at fair value by class as required by ASC Topic 820, including the general classification of such instruments pursuant to the valuation hierarchy.
Credit Funds—Amounts include the Company's investment in unconsolidated credit funds where the Company co-invests with third-party investors. The fair value of investments in credit funds are generally determined based on the Company's proportionate share of the net asset value ("NAV") of the fund. Investors in the Company’s open-ended credit funds may redeem their interests, at any time, within 30 days after notice. Investors in the Company’s closed-end credit funds generally cannot redeem. The Company estimates that closed-end funds are expected to liquidate over 2 to 6 years. The Company has no unfunded commitments in its open-ended and closed-end credit funds. The Company's investments in credit funds have been excluded from the fair value hierarchy table.
Loans—Loans are generally valued via a third-party pricing service. The value represents a composite of the mid-point in the bid-ask spread of broker quotes or is based on the composite price of a different tranche of the same or similar security if broker quotes are unavailable for the specific tranche the Company owns. The third-party pricing service provides the number of quotes used in determining the composite price, a factor that the Company uses in determining the observability level of the inputs to the composite price. When the fair value of the loan investments is based on a composite price determined using two or more quotes the composite price is considered to be based on significant observable inputs and classified as Level 2 within the fair value hierarchy. When the fair value of certain loan investments is based on a composite price determined using less than two quotes, the composite price is considered to be based on significant unobservable inputs. In these instances, the Company performs certain procedures on a sample basis to determine that composite prices approximate fair market value. Alternative methodologies are used to value the loans such as a comparable company pricing model (an internally developed model using composite or other observable comparable market inputs) or an internally developed model using data including unobservable market inputs. Accordingly, loans valued using alternative methodologies are classified as Level 3 within the fair value hierarchy.
Warehouses—Warehouse investments consist of investments in loans using leverage from a third-party financial institution. Loans are generally valued via a third-party pricing service. The quoted value represents a composite of the mid-point in the bid-ask spread of broker quotes or, in circumstances where broker quotes are unavailable, the value is based on the composite price of a different tranche of the same or similar security. Calculation of fair value on warehouse investments is based on the quoted mid-price of the underlying securities less the associated warehouse debt and accrued expenses, including interest expense. However, market participants may use different assumptions to price the warehouse investments; accordingly, warehouse investments are classified as Level 3 within the fair value hierarchy.
Structured Products & Other—Structured Products and Other primarily represents the fair value of investments in CIFC and third-party managed CLOs and warehouses. These assets are generally valued via a third-party pricing service. The inputs to the valuation include recent trade information, discount rates, forward yield curves, and loan level information (including loan loss, recovery and default rates, prepayment speeds and other security specific information obtained from the trustee and other service providers related to the product being valued). Although the inputs used in the third-party pricing service's valuation model are generally obtained from active markets, the third-party pricing service does not provide a detailed analysis for each security valued. The Company performs certain procedures on a sample basis to determine that prices approximate fair market value. When a value from a third-party pricing service is unavailable, the value may be based on an internally developed discounted cash flow model which includes unobservable market inputs or by broker quote. Inputs to the internally developed model include the structure of the product being valued, estimates related to loan default, recovery and discount rates. Accordingly these assets are classified as Level 3 within the fair value hierarchy.
In addition, included in Structured Products and Other are (i) equity securities not listed for trading on a national exchange ("Non-listed Equity Securities") received on certain loan restructurings within our portfolio and (ii) on occasion, warehouse total return swaps ("TRS," Note 6). Similar to the fair value of loans, Non-listed Equity Securities are valued using a third-party pricing service. When the fair value of a Non-listed Equity Security is determined using two or more quotes, it is classified as Level 2 within the fair value hierarchy, and when the fair value is determined using less than two quotes, it is classified as Level 3 within the fair value hierarchy. The fair value of a warehouse TRS is calculated as the sum of (i) the change in fair value of the reference obligations (SSCLs are valued at a composite of the mid-point in the bid-ask spread of broker quotes) since they became reference obligations, (ii) net realized gains (losses) on reference obligations sold during the period and (iii) interest income earned on the reference obligations, less an amount equal to the London Interbank Offered Rate (or "LIBOR") plus an agreed upon margin on
18
CIFC LLC AND ITS SUBSIDIARIES
NOTES TO CONDENSED CONSOLIDATED FINANCIAL STATEMENTS (Unaudited)
the outstanding notional amount of the reference obligations. The warehouse TRS values are classified as Level 2 within the fair value hierarchy.
Contingent Liabilities—The fair value of contingent liabilities is based on a discounted cash flow model. The model is based on projections of the relevant future management fee cash flows and utilizes both observable and unobservable inputs in the determination of fair value. Significant inputs to the valuation model include the structure of the underlying CLO and estimates related to loan default, recovery and discount rates. Contingent liabilities are classified as Level 3 within the fair value hierarchy.
Long-Term Debt of the Consolidated CLOs & Warehouses—Long-term debt of the Consolidated CLOs and warehouses consists of debt and subordinated notes of the Consolidated CLOs and warehouses. Financial liabilities are measured as: (1) the sum of the fair value of the financial assets and the carrying value of any non-financial assets that are incidental to the operations of the CLOs less (2) the sum of the fair value of any beneficial interests retained by the reporting entity (other than those that represent compensation for services) and the Company’s carrying value of any beneficial interests that represent compensation for services.
Quantitative Information about Level 3 Assets & Liabilities
The disclosure provided below provides quantitative information about the significant unobservable inputs used in the valuation of the contingent liabilities of Legacy CLOs (see Note 8).
September 30, 2016 | September 30, 2016 | December 31, 2015 | Impact of Increase in Input on Fair Value Measurement (1) | ||||||||
Financial Liabilities | Fair Value (In thousands) | Valuation Technique | Significant Unobservable Input | Range | Range | ||||||
Contingent Liabilities | $ | 7,694 | Discounted cash flows | Discount rate (2) | 6.0% - 12.0% | 6.7% - 12.0% | Decrease | ||||
Default rate (3) | 2% | 2% | Decrease | ||||||||
Recovery rate (3) | 70% | 70% | Increase | ||||||||
Pre-payment rate (3) | 25% | 40% | Decrease | ||||||||
Reinvestment spread of assets above LIBOR | 3.3% - 4.0% | 3.0 - 3.8% | Increase | ||||||||
Reinvestment price of assets | 100.0 | 100.0 | Increase | ||||||||
Explanatory Notes:
____________________________
(1) | The impact of a decrease in input would have the opposite impact to the fair value as that presented in the table. |
(2) | The discount rate varies by type of management fee (senior management fee, subordinated management fee, or incentive fee), the priority of that management fee in the waterfall of the CLO and the relative risk associated with the respective management fee cash flow projections. Amounts are presented as a spread over LIBOR. |
(3) | Generally an increase in the default rate would be accompanied by a directionally opposite change in assumption for the recovery and pre-payment rates. |
19
CIFC LLC AND ITS SUBSIDIARIES
NOTES TO CONDENSED CONSOLIDATED FINANCIAL STATEMENTS (Unaudited)
Carrying Value and Estimated Fair Value of Financial Assets and Liabilities
The Company has not elected the fair value option for certain financial liabilities. A summary of the carrying value and estimated fair value of those liabilities are as follows:
As of September 30, 2016 | As of December 31, 2015 | ||||||||||||||
Carrying Value | Estimated Fair Value | Carrying Value | Estimated Fair Value | ||||||||||||
(In thousands) | |||||||||||||||
Financial liabilities: | |||||||||||||||
Long-term debt: | |||||||||||||||
Junior Subordinated Notes (1) | $ | 118,327 | $ | 51,983 | $ | 118,259 | $ | 57,371 | |||||||
Senior Notes (2) | $ | 37,907 | $ | 41,871 | $ | 37,902 | $ | 40,000 | |||||||
Explanatory Note:
________________________________
(1) | The Junior Subordinated Notes include both the March and October Junior Subordinated Notes (Note 9). The estimated fair values were determined using a discounted cash flow model which utilizes significant unobservable inputs, including discount rates, yield and forward LIBOR curve assumptions. This methodology is classified as Level 3 within the fair value hierarchy. |
(2) | On November 2, 2015, the Company issued $40.0 million par value of Senior Notes which are publicly registered. The estimated fair value was determined using a discounted cash flow valuation model, utilizing significant unobservable inputs such as a discount rate and credit spread over the BB High Yield Index. As the unobservable inputs in isolation can cause significant increases or decreases in fair value, this methodology is classified as Level 3 within the fair value hierarchy. |
The carrying value of all of the following approximate the fair value of the financial instruments and are considered Level 1 in the fair value hierarchy: cash and cash equivalents, restricted cash and cash equivalents, receivables and due to brokers. In addition, amounts in the Consolidated Entities related to restricted cash and cash equivalents, due from brokers, receivables and due to brokers also approximate the fair value of the instruments and are all considered Level 1 in the fair value hierarchy.
Investments of the Consolidated Entities are diversified over multiple industries. In addition, applicable agreements governing CLOs and warehouses outline industry concentration limits. Management does not believe the Company has any significant industry concentration risks.
Note 6—Derivative Instruments and Hedging Activities
Total Return Swap—During the nine months ended September 30, 2015, the Company, through a warehouse SPV, entered into a TRS agreement with a third-party bank, in lieu of financing. Under the TRS agreement, the Company received the income on the reference obligations (including gains on terminated reference obligations) and paid the counterparty an amount equal to three month LIBOR plus a margin on the outstanding notional amount of the reference obligations and losses on terminated reference obligations. The Company also consolidated this warehouse SPV as it was a VIE in which the Company was deemed the primary beneficiary (Note 2). During the nine months ended September 30, 2015 the warehouse agreement was terminated in conjunction with the issuance of a CLO.
Net gain (loss) related to other derivative instruments for the three and nine months ended September 30, 2016 was $(0.2) million and $(0.5) million, respectively, and for the three and nine months ended September 30, 2015, the Company recognized net gain (loss) of $2.4 million and $4.1 million, respectively, related to the TRS agreement and other derivative instruments.
20
CIFC LLC AND ITS SUBSIDIARIES
NOTES TO CONDENSED CONSOLIDATED FINANCIAL STATEMENTS (Unaudited)
Note 7—Intangible Assets
Intangible assets are comprised of the following:
Weighted-Average Remaining Estimated Useful Life | Gross Carrying Amount (1) | Accumulated Amortization (2) | Net Carrying Amount | ||||||||||
(In years) | (In thousands) | ||||||||||||
September 30, 2016: | |||||||||||||
Investment management contracts | 1.6 | $ | 40,405 | $ | 38,244 | $ | 2,161 | ||||||
Referral arrangement | 3.0 | 3,810 | 2,667 | 1,143 | |||||||||
Non-compete agreements | 1.5 | 1,284 | 1,009 | 275 | |||||||||
Trade name | 4.5 | 1,250 | 688 | 562 | |||||||||
Total intangible assets | $ | 46,749 | $ | 42,608 | $ | 4,141 | |||||||
December 31, 2015: | |||||||||||||
Investment management contracts | 2.4 | $ | 71,113 | $ | 67,040 | $ | 4,073 | ||||||
Referral arrangement | 3.8 | 3,810 | 2,096 | 1,714 | |||||||||
Non-compete agreements | 2.2 | 1,535 | 1,122 | 413 | |||||||||
Trade name | 5.2 | 1,250 | 593 | 657 | |||||||||
Total intangible assets | $ | 77,708 | $ | 70,851 | $ | 6,857 | |||||||
Explanatory Notes:
_________________________________
(1) | Gross carrying amounts as of September 30, 2016 have been reduced to reflect fully impaired and amortized assets. |
(2) | The Company recorded amortization expense on its intangible assets of $0.5 million and $2.2 million for the three and nine months ended September 30, 2016, respectively, and $1.4 million and $5.2 million for the three and nine months ended September 30, 2015, respectively. |
The following table presents expected amortization expense of the existing intangible assets:
(In thousands) | |||
2016 (three months remaining) | $ | 399 | |
2017 | 1,726 | ||
2018 | 1,449 | ||
2019 | 411 | ||
2020 | 125 | ||
Thereafter | 31 | ||
$ | 4,141 | ||
The Company received notice from holders of certain CLOs exercising their right to call the CLOs for redemption. As a result of these calls, the Company recorded impairment charges of $0.5 million for the nine months ended September 30, 2016 and $0.5 million and $1.2 million for the three and nine and months ended September 30, 2015, respectively, to fully impair intangible assets associated with these management contracts.
21
CIFC LLC AND ITS SUBSIDIARIES
NOTES TO CONDENSED CONSOLIDATED FINANCIAL STATEMENTS (Unaudited)
Note 8—Contingent Liabilities
Contingent Liabilities—In addition to the consideration paid in connection with the merger with Commercial Industrial Finance Corp. ("Legacy CIFC") (the "Legacy Merger"), the Company was required to pay CIFC Parent Holdings LLC ("CIFC Parent") a portion of incentive fees earned on six CLOs managed by CIFC Asset Management LLC (the "Legacy CIFC CLOs"). The terms of these payments were as follows: (i) the first $15.0 million of incentive fees received (which was fulfilled in 2013), (ii) 50% of any incentive fees in excess of $15.0 million in aggregate received from the Legacy CIFC CLOs by the combined company over ten years from April 13, 2011 (the "Legacy Merger Closing Date") and (iii) payments relating to the present value of any such incentive fees from the Legacy CIFC CLOs that remain payable to the combined company after the tenth anniversary of the Legacy Merger Closing Date. The Company made total payments of $0.2 million and $1.5 million for the three and nine months ended September 30, 2016, respectively, and $0.7 million and $2.5 million for the three and nine months ended September 30, 2015, respectively, related to these contingent liabilities. As of September 30, 2016, there are no remaining payments under item (i) and the Company made cumulative payments of $17.1 million under (ii) to date.
In addition, the Company also assumed contingent liabilities during the Legacy Merger that primarily represent contingent consideration related to Legacy CIFC’s acquisition of CypressTree Investment Management, LLC ("CypressTree") in December 2010. The assumed contingent liabilities are based on a fixed percentage of certain management fees from the CypressTree CLOs. These fixed percentages vary by CLO. The minimum fixed percentage was 39% since July 2013. As of September 30, 2016, there were no payments due. During the nine months ended September 30, 2015, the Company made its final payments of $1.1 million satisfying its contingent obligation.
Note 9—Long-Term Debt
The following table summarizes the long-term debt:
September 30, 2016 | December 31, 2015 | |||||||||||||||||||||||||
Par | Carrying Value | Weighted Average Borrowing Rate | Weighted Average Remaining Maturity | Par | Carrying Value | Weighted Average Borrowing Rate | Weighted Average Remaining Maturity | |||||||||||||||||||
(In thousands) | (In years) | (In thousands) | (In years) | |||||||||||||||||||||||
Recourse Debt: | ||||||||||||||||||||||||||
March Junior Subordinated Notes (1) | $ | 95,000 | $ | 93,516 | 3.34 | % | 19.1 | $ | 95,000 | $ | 93,456 | 2.90 | % | 19.8 | ||||||||||||
October Junior Subordinated Notes (2) | 25,000 | 24,811 | 4.26 | % | 19.1 | 25,000 | 24,803 | 3.82 | % | 19.8 | ||||||||||||||||
Senior Notes (3) | 40,000 | 37,907 | 8.50 | % | 9.1 | 40,000 | 37,902 | 8.50 | % | 9.8 | ||||||||||||||||
Total Recourse Debt | $ | 160,000 | $ | 156,234 | 4.77 | % | 16.6 | $ | 160,000 | $ | 156,161 | 4.44 | % | 17.3 | ||||||||||||
Non-Recourse Consolidated Entities' debt: | ||||||||||||||||||||||||||
Consolidated CLOs and Other (4) | $ | 1,848,644 | $ | 1,798,669 | 0.03 | % | 8.1 | $ | 1,385,226 | $ | 1,308,558 | 0.02 | % | 9.1 | ||||||||||||
Total Non-recourse Debt | $ | 1,848,644 | $ | 1,798,669 | 0.03 | % | 8.1 | $ | 1,385,226 | $ | 1,308,558 | 0.02 | % | 9.1 | ||||||||||||
Explanatory Notes:
_______________________________
(1) | March Junior Subordinated Notes bear interest at an annual rate of three month LIBOR plus 2.58% until maturity on October 30, 2035. Prior to April 30, 2015, these notes bore interest at an annual rate of 1%. |
(2) | October Junior Subordinated Notes bear interest at an annual rate of three month LIBOR plus 3.50% and mature on October 30, 2035. |
(3) | The Senior Notes bear interest at 8.5% and mature on October 30, 2025. As of January 1, 2016, the Company temporarily did not meet certain registration requirements under the indenture (and associated agreements) and incurred additional interest of 25 to 75 basis points per annum for the three and nine months ended September 30, 2016. On July 19, 2016, the Company cured these conditions and the additional interest no longer applied. |
(4) | The subordinated notes of the Consolidated CLOs do not have a stated interest rate and have been excluded from the calculation of the weighted average borrowing rate. As of September 30, 2016 and December 31, 2015, long-term debt of the Consolidated CLOs and Other includes $152.2 million and $153.1 million of credit fund debt, respectively. |
Non-Recourse Consolidated Entities' Debt—The debt and equity holders only have recourse to the total assets of the respective Consolidated Entity's assets.
22
CIFC LLC AND ITS SUBSIDIARIES
NOTES TO CONDENSED CONSOLIDATED FINANCIAL STATEMENTS (Unaudited)
Consolidated Entities— During the nine months ended September 30, 2016, the Company consolidated 4 CLOs (of which 1 was deconsolidated as of June 30, 2016) and 2 credit funds (Note 2). The Consolidated Entities distributed $17.9 million to the holders of their subordinated notes and paid down $37.4 million of their outstanding debt.
During the nine months ended September 30, 2015, the Company consolidated 2 CLOs and 2 credit funds . The Consolidated Entities issued $484.4 million of debt, paid down $57.4 million of their outstanding debt, made net borrowings under revolving credit facilities of $140.7 million and distributed $2.0 million to the holders of their subordinated notes.
The carrying value of the assets of the Consolidated CLOs, which are the only assets to which the Consolidated CLO debt holders have recourse for repayment was $1.8 billion and $1.2 billion as of September 30, 2016 and December 31, 2015, respectively.
Note 10—Equity
Common Shares— The Company declared aggregate distributions of $0.10 and $0.69 per common share for the three and nine months ended September 30, 2016, respectively, and $0.10 and $0.30 per common share for the three and nine months ended September 30, 2015, respectively.
On April 28, 2016, in connection with the Reorganization Transaction, two holders of record (the “Dissenting Shareholders”) with a total of 2,026,315 shares of common stock of CIFC Corp. (“Dissenting Shares”) filed petitions for appraisal with the Delaware Court of Chancery ("Delaware Court"). These shares are no longer outstanding. The Dissenting Shareholders will be entitled to receive a cash amount from CIFC Corp. equal to the fair value of the Dissenting Shares as of December 31, 2015, as determined by the Delaware Court. The Company recorded a liability of $11.3 million based on the closing stock price as of December 31, 2015. The liability is based on management's estimate of the value of the Dissenting Shares, and there can be no assurance that the amounts accrued will be the same amount determined by the Delaware Court. Further, the Dissenting Shareholders were no longer entitled to dividends declared after December 31, 2015.
Treasury Share/Share Repurchases—During the nine months ended September 30, 2016, the Company repurchased 75,296 common shares in open-market transactions for an aggregate cost (including transaction costs) of $0.4 million with an average price per share of $5.75. The Board authorized the constructive retirement of all of these shares and the cost of these shares was reclassified from Treasury shares to Additional paid-in capital on the Condensed Consolidated Balance Sheet.
During the three and nine months ended September 30, 2015, the Company repurchased 31,276 and 34,753 common shares respectively, in open-market transactions. The aggregate cost (including transaction costs) for both the three and nine months ended September 30, 2015 was $0.2 million, with an average price per share of $7.09 and $7.10, respectively. As of September 30, 2016, the Company was authorized to repurchase up to $3.8 million of its common shares under the share repurchase program.
Share-based Compensation— As of September 30, 2016, there was $12.9 million of estimated unrecognized compensation expense related to unvested share options and Restricted Stock Unit ("RSU") awards, net of estimated forfeitures. The remaining weighted average vesting periods of RSUs and options are 2.27 and 0.13 years, respectively.
RSUs—During the nine months ended September 30, 2016, the Company granted to executives, employees and directors 1,392,562 RSUs. Employee awards generally vest over 3 years, with 33% vesting at the end of the grant year and the remainder of the award vesting ratably on a quarterly basis for the remaining 2 years (until the last vesting date as stated in the award agreement). These awards include RSUs with performance conditions that affect the number of shares granted. As such, for the three and nine months ended September 30, 2016, total shares granted and compensation expense recognized were based on a determination of the most probable outcome of the performance conditions. Further, director awards are service-based RSUs that vest one year after grant.
For all 2016 RSU grants, awards are entitled to distribution equivalent rights. As such, the fair value of the awards was determined using the Company's grant date common share price. For RSU awards that were not entitled to distribution equivalent rights, the fair value of the awards was determined using the Company's grant date common share price less the present value of the expected distributions forgone during the vesting period.
23
CIFC LLC AND ITS SUBSIDIARIES
NOTES TO CONDENSED CONSOLIDATED FINANCIAL STATEMENTS (Unaudited)
The following table summarizes restricted share unit activity:
For the Nine Months Ended September 30, 2016 | Weighted Average Grant Date Fair Value | |||||
Restricted share units outstanding, beginning of period (1) | 2,033,510 | $ | 7.69 | |||
Granted (1)(2) | 1,392,562 | $ | 5.84 | |||
Vested | (370,870 | ) | $ | 7.91 | ||
Forfeited (3) | (104,040 | ) | $ | 5.93 | ||
Restricted share units outstanding, end of period | 2,951,162 | $ | 6.64 | |||
Explanatory Notes:
_________________________________
(1) | Beginning balance weighted average grant date fair value excludes 540,000 of performance based RSUs of which 180,000 have been included in the weighted average grant date fair value for RSUs granted during the nine months ended September 30, 2016. |
(2) | Shareholder approval is required to increase the number of shares available under the Company’s 2011 Stock and Incentive Plan to accommodate these new grants. |
(3) | The forfeited share-based awards are returned to the grant pool for reissuance under the 2011 Stock Plan. |
Share Options—The following table summarizes certain share options activity:
Number of Shares Underlying Share Options | Weighted Average Exercise Price | Weighted Average Remaining Contractual Term | Aggregate Intrinsic Value | |||||||||
(In years) | (In thousands) | |||||||||||
Outstanding at December 31, 2015 | 3,285,313 | $ | 6.69 | 4.64 | $ | 788 | ||||||
Exercised (1) | (100,000 | ) | $ | 4.83 | ||||||||
Outstanding at September 30, 2016 | 3,185,313 | $ | 6.75 | 3.93 | $ | 14,081 | ||||||
Exercisable at September 30, 2016 | 3,037,787 | $ | 6.66 | 3.77 | $ | 13,709 | ||||||
Vested and Expected to vest at September 30, 2016 (2) | 3,177,547 | $ | 6.74 | 3.93 | $ | 14,061 | ||||||
Explanatory Notes:
________________________________
(1) | During the nine months ended September 30, 2016 and 2015, the total intrinsic value of options exercised was $132.0 thousand and $78.3 thousand, respectively. |
(2) | Includes a reduction to outstanding options at period end for expected forfeiture rate over the life of the options. |
Note 11 —Earnings (Loss) Per Share
The following table presents the calculation of basic and diluted earnings (loss) per share ("EPS"):
For the Three Months Ended September 30, | For the Nine Months Ended September 30, | ||||||||||||||
2016 | 2015 | 2016 | 2015 | ||||||||||||
(In thousands, except per share data) | |||||||||||||||
Net income (loss) attributable to the Company - basic & diluted | $ | 17,671 | $ | 1,469 | $ | 39,760 | $ | 8,000 | |||||||
Weighted-average shares - basic (1) | 23,620 | 25,368 | 24,354 | 25,317 | |||||||||||
Share options (2) | 818 | 633 | 508 | 660 | |||||||||||
Warrants | 927 | 275 | 698 | 365 | |||||||||||
Unvested RSUs | 836 | 189 | 528 | 152 | |||||||||||
Weighted-average shares - diluted (1) | 26,201 | 26,465 | 26,088 | 26,494 | |||||||||||
Earnings (loss) per share | |||||||||||||||
Basic (1) | $ | 0.75 | $ | 0.06 | $ | 1.63 | $ | 0.32 | |||||||
Diluted (1) | $ | 0.67 | $ | 0.06 | $ | 1.52 | $ | 0.30 | |||||||
24
CIFC LLC AND ITS SUBSIDIARIES
NOTES TO CONDENSED CONSOLIDATED FINANCIAL STATEMENTS (Unaudited)
Explanatory Notes:
________________________________
(1) | Weighted-average number of shares outstanding basic and diluted excludes Dissenting Shares as of April 28, 2016 (Note 10). Excluding the Dissenting Shares as of January 1, 2016 (Reorganization Transaction), total weighted average shares basic and diluted for the nine months ended September 30, 2016, would be 23,474,432 and 25,207,793, respectively, and earnings per share basic and diluted would be $1.69 and $1.58, respectively (Note 10). |
(2) | The Company excluded anti-dilutive share options from the calculation of diluted EPS of $0.4 million and $1.4 million for the three and nine months ended September 30, 2016, respectively, and $0.8 million for both the three and nine months ended September 30, 2015. |
Note 12—Income Taxes
As a result of the Reorganization Transaction, investment income earned by the Company is not subject to tax at the entity level. The difference between the statutory tax rate and the effective tax rate, as well as the change in the effective tax rate compared to the prior year, was primarily attributable to the Reorganization Transaction and to income (loss) from non-controlling interests of Consolidated VIEs. The income (loss) from non-controlling interests of Consolidated VIEs are included in book income (loss) before income taxes but are not taxable income (loss) to the Company. During the nine months ended September 30, 2015, the Company recorded a non-recurring tax expense of approximately $6.3 million attributable to the write-down of deferred tax assets impacted by the New York City law change.
The following table summarizes the Company's tax provision:
For the Three Months Ended September 30, | For the Nine Months Ended September 30, | ||||||||||||||
2016 | 2015 | 2016 | 2015 | ||||||||||||
(In thousands) | |||||||||||||||
Income (loss) before income taxes | $ | 16,759 | $ | 1,811 | $ | 43,318 | $ | 22,074 | |||||||
Income tax expense (benefit) | $ | (1,267 | ) | $ | 526 | $ | 2,879 | $ | 13,441 | ||||||
Effective income tax rate (1) | (7.6 | )% | 29.0 | % | 6.6 | % | 60.9 | % | |||||||
Explanatory Note:
________________________________
(1) | Deferred income tax expense (benefit) was $0.2 million and $3.0 million for the three and nine months ended September 30, 2016, respectively, and $(0.1) million and $7.3 million for the three and nine months ended September 30, 2015, respectively. |
During the three and nine months ended September 30, 2016, there were no material changes to the Company’s uncertain tax positions and the Company believes there will be no significant increases or decreases to the uncertain tax positions within 12 months of the reporting date.
Note 13—Related Party Transactions
DFR Holdings—As of September 30, 2016 and December 31, 2015, DFR Holdings owned approximately 18.8 million of the Company’s shares, which was approximately 80% of the Company's outstanding shares. Accordingly, related party transactions include cash distributions received from the Company (Note 10) from the shares held. In addition, DFR Holdings also holds warrants that provide DFR Holdings the right to purchase 2.0 million voting common shares. These warrants are scheduled to expire on January 24, 2017.
Under the Company's consulting agreement with DFR Holdings, DFR Holdings provides CIFC with ongoing advisory services such as the participation in financial, tax and strategic planning/budgeting, investor interface, new product initiatives, fund raising and recruiting. During the nine months ended September 30, 2016, the Company paid $2.0 million in connection with the consulting agreement and expensed $0.5 million and $1.5 million, for the both three and nine months ended September 30, 2016 and 2015, respectively.
25
CIFC LLC AND ITS SUBSIDIARIES
NOTES TO CONDENSED CONSOLIDATED FINANCIAL STATEMENTS (Unaudited)
In addition, pursuant to the Third Amended and Restated Stockholders Agreement with DFR Holdings dated December 2, 2013, the Company agreed to nominate to the Company's Board of Directors six directors designated by DFR Holdings (the "DFR Designees"). The DFR Designees will be reduced in the event that DFR Holdings decreases its ownership (on a diluted basis) in CIFC. If DFR Holdings' ownership falls below 5%, it will lose the right to designate any director. The DFR Designees earned an aggregate of $0.1 million and $0.4 million for the three and nine months ended September 30, 2016, respectively, and $0.2 million and $0.5 million for the three and nine months ended September 30, 2015, respectively, related to their service as directors of CIFC.
Other—As of September 30, 2016 and December 31, 2015, a board member held $1.0 million of income notes in one of the Company's sponsored CLOs, CIFC Funding 2013-II, Ltd., through an entity in which he is a 50% equity holder.
Funds—All CIFC investments in credit funds are related party transactions (Note 2). As of September 30, 2016 and December 31, 2015, key employees and directors of the Company (including related entities) invested an aggregate of $3.5 million and $4.7 million, respectively, in 4 credit funds. Key employees are not charged management or incentive fees, where applicable, on their investments. Directors were charged management and/or incentive fees, where applicable, similar to certain other investors. For all periods presented in 2016 and 2015, these fees were de minimis.
Note 14—Commitments and Contingencies
Legal Proceedings—In the ordinary course of business, the Company may be subject to legal and regulatory proceedings and examinations that are generally incidental to the Company's ongoing operations. While there can be no assurance of the ultimate disposition of any such proceedings or examinations, the Company does not believe their disposition will have a material adverse effect on the Company's Condensed Consolidated Financial Statements.
Lease Commitments—During both the three and nine months ended September 30, 2016 and 2015, total occupancy expense was $0.5 million and $1.3 million, respectively.
Unfunded Loan Commitments— Certain of the Consolidated Entities have assets which include delayed draw term loans and unfunded revolvers. Unfunded loan commitments represent the estimated fair value of those delayed draw term loans and unfunded revolvers. As of September 30, 2016 and December 31, 2015, the Consolidated Entities had unfunded loan commitments of $1.7 million and $1.0 million, respectively. The timing and amount of additional funding on these loans are at the discretion of the borrower, to the extent the borrower satisfies certain requirements and provides certain documentation.
Note 15—Financial Information for Subsidiary Guarantors and Non-Guarantor Subsidiaries under the Company's Senior Notes
CIFC Corp. issued Senior Notes which are publicly registered notes. As such, the Company is required to present condensed consolidating financial information for CIFC and its consolidated subsidiaries within the notes to the consolidated financial statements in accordance with the criteria established for parent companies in the SEC’s Regulation S-X, Rule 3-10(d).
Obligations under the Senior Notes are fully and unconditionally guaranteed by CIFC and named guarantors (the “Guarantor”). Under the terms of the indenture, certain consolidated entities such as consolidated CLOs, warehouses and funds ("Investment Vehicles") do not guarantee the notes. Further, the indenture provides that so long as entities representing at least 90% of the Company’s consolidated total assets (other than assets represented by Investment Vehicles) are guarantors, the Company may designate entities within its corporate structure as non-guarantor entities ("Unrestricted Entities" and together with Investment Vehicles, "Non-Guarantors").
The following condensed consolidating financial information presents the Consolidating Balance Sheets, Statement of Operations, Comprehensive Income (Loss) and Cash Flows of the Guarantor, Non-Guarantor subsidiaries (or Investment Vehicles) and the eliminations necessary to arrive at the information for the Company on a consolidated basis as of September 30, 2016 and December 31, 2015, and for each of the three and nine months ended September 30, 2016 and 2015. The principal elimination entries eliminate investments in subsidiaries and intercompany balances and transactions. Certain immaterial balances have been reclassified in the prior year financial statements to conform to the current year presentation (Note 2). The condensed consolidating financial information below assumes that the Senior Notes were guaranteed by CIFC as of January 1, 2015. Further, all Consolidated Entities are considered Non-Guarantor subsidiaries.
26
CIFC LLC AND ITS SUBSIDIARIES
NOTES TO CONDENSED CONSOLIDATED FINANCIAL STATEMENTS (Unaudited)
Condensed Consolidating Balance Sheets (Unaudited)
September 30, 2016
Parent/ CIFC LLC | Subsidiary Issuer/ CIFC Corp. | Subsidiary Guarantors | Non Guarantors | Eliminations | CIFC LLC Consolidated | ||||||||||||||||||
(In thousands) | |||||||||||||||||||||||
ASSETS | |||||||||||||||||||||||
Cash and cash equivalents | $ | 75 | $ | 4,827 | $ | 33,941 | $ | — | $ | — | $ | 38,843 | |||||||||||
Restricted cash and cash equivalents | — | — | 1,694 | — | — | 1,694 | |||||||||||||||||
Investments | — | — | 211,474 | — | (99,568 | ) | 111,906 | ||||||||||||||||
Intercompany investments in subsidiaries | 203,417 | 105,856 | 69,992 | — | (379,265 | ) | — | ||||||||||||||||
Receivables | — | 7,301 | 7,018 | — | (2,946 | ) | 11,373 | ||||||||||||||||
Prepaid and other assets | — | 272 | 603 | — | — | 875 | |||||||||||||||||
Deferred tax asset, net | — | 41,404 | — | — | — | 41,404 | |||||||||||||||||
Equipment and improvements, net | — | — | 4,031 | — | — | 4,031 | |||||||||||||||||
Intangible assets, net | — | 4,141 | — | — | — | 4,141 | |||||||||||||||||
Goodwill | — | 66,549 | 9,451 | — | — | 76,000 | |||||||||||||||||
Subtotal | 203,492 | 230,350 | 338,204 | — | (481,779 | ) | 290,267 | ||||||||||||||||
Assets of Consolidated Entities: | |||||||||||||||||||||||
Restricted cash and cash equivalents | — | — | — | 108,681 | — | 108,681 | |||||||||||||||||
Due from brokers | — | — | — | 33,990 | — | 33,990 | |||||||||||||||||
Investments | — | — | — | 1,843,268 | — | 1,843,268 | |||||||||||||||||
Receivables | — | — | — | 6,118 | — | 6,118 | |||||||||||||||||
Prepaid and other assets | — | — | — | 147 | — | 147 | |||||||||||||||||
Total assets of Consolidated Entities | — | — | — | 1,992,204 | — | 1,992,204 | |||||||||||||||||
TOTAL ASSETS | $ | 203,492 | $ | 230,350 | $ | 338,204 | $ | 1,992,204 | $ | (481,779 | ) | $ | 2,282,471 | ||||||||||
LIABILITIES | |||||||||||||||||||||||
Due to brokers | $ | — | $ | — | $ | — | $ | — | $ | — | $ | — | |||||||||||
Accrued and other liabilities | 15,108 | 4,124 | 21,237 | — | (2,531 | ) | 37,938 | ||||||||||||||||
Contingent liabilities | — | — | 7,694 | — | — | 7,694 | |||||||||||||||||
Long-term debt | — | 156,234 | — | — | — | 156,234 | |||||||||||||||||
Subtotal | 15,108 | 160,358 | 28,931 | — | (2,531 | ) | 201,866 | ||||||||||||||||
Non-Recourse Liabilities of Consolidated Entities: | |||||||||||||||||||||||
Due to brokers | — | — | — | 80,054 | — | 80,054 | |||||||||||||||||
Accrued and other liabilities | — | — | — | 556 | (406 | ) | 150 | ||||||||||||||||
Interest payable | — | — | — | 4,903 | — | 4,903 | |||||||||||||||||
Long-term debt | — | — | — | 1,861,564 | (62,895 | ) | 1,798,669 | ||||||||||||||||
Total Non-Recourse Liabilities of Consolidated Entities | — | — | — | 1,947,077 | (63,301 | ) | 1,883,776 | ||||||||||||||||
TOTAL LIABILITIES | 15,108 | 160,358 | 28,931 | 1,947,077 | (65,832 | ) | 2,085,642 | ||||||||||||||||
EQUITY | |||||||||||||||||||||||
Common shares | 24 | 1 | — | — | (1 | ) | 24 | ||||||||||||||||
Intercompany Preferred Units (1) | — | — | 86,489 | — | (86,489 | ) | — | ||||||||||||||||
Additional paid-in capital | 986,520 | 888,830 | 588,747 | — | (1,477,577 | ) | 986,520 | ||||||||||||||||
Retained earnings (deficit) | (798,160 | ) | (818,839 | ) | (365,963 | ) | — | 1,184,802 | (798,160 | ) | |||||||||||||
TOTAL CIFC LLC SHAREHOLDERS’ EQUITY | 188,384 | 69,992 | 309,273 | — | (379,265 | ) | 188,384 | ||||||||||||||||
Consolidated Fund Equity/Noncontrolling interests | — | — | — | 45,127 | (36,682 | ) | 8,445 | ||||||||||||||||
TOTAL EQUITY | 188,384 | 69,992 | 309,273 | 45,127 | (415,947 | ) | 196,829 | ||||||||||||||||
TOTAL LIABILITIES AND EQUITY | $ | 203,492 | $ | 230,350 | $ | 338,204 | $ | 1,992,204 | $ | (481,779 | ) | $ | 2,282,471 | ||||||||||
Explanatory Note:
_________________________________
(1) | CIFC Corp. holds 85.0 million of intercompany non-voting series A preferred units that bear an annual rate of 3.5%. |
27
CIFC LLC AND ITS SUBSIDIARIES
NOTES TO CONDENSED CONSOLIDATED FINANCIAL STATEMENTS (Unaudited)
Consolidating Balance Sheets (Unaudited)
December 31, 2015
Parent/ CIFC LLC | Subsidiary Issuer/ CIFC Corp. | Subsidiary Guarantors | Non Guarantors | Eliminations | CIFC LLC Consolidated | ||||||||||||||||||
(In thousands) | |||||||||||||||||||||||
ASSETS | |||||||||||||||||||||||
Cash and cash equivalents | $ | — | $ | 1,392 | $ | 56,576 | $ | — | $ | — | $ | 57,968 | |||||||||||
Restricted cash and cash equivalents | — | — | 1,694 | — | — | 1,694 | |||||||||||||||||
Investments | — | — | 152,455 | — | (81,759 | ) | 70,696 | ||||||||||||||||
Intercompany investments in subsidiaries | 170,174 | 120,896 | 61,004 | — | (352,074 | ) | — | ||||||||||||||||
Receivables | 785 | 295 | 27,242 | — | (21,247 | ) | 7,075 | ||||||||||||||||
Prepaid and other assets | — | 1,621 | 352 | — | — | 1,973 | |||||||||||||||||
Deferred tax asset, net | — | 44,425 | — | — | — | 44,425 | |||||||||||||||||
Equipment and improvements, net | — | — | 4,866 | — | — | 4,866 | |||||||||||||||||
Intangible assets, net | — | 6,232 | 625 | — | — | 6,857 | |||||||||||||||||
Goodwill | — | 66,549 | 9,451 | — | — | 76,000 | |||||||||||||||||
Subtotal | 170,959 | 241,410 | 314,265 | — | (455,080 | ) | 271,554 | ||||||||||||||||
Assets of Consolidated Entities: | |||||||||||||||||||||||
Restricted cash and cash equivalents | — | — | — | 94,018 | — | 94,018 | |||||||||||||||||
Due from brokers | — | — | — | 25,910 | — | 25,910 | |||||||||||||||||
Investments | — | — | — | 1,351,403 | — | 1,351,403 | |||||||||||||||||
Receivables | — | — | — | 4,109 | — | 4,109 | |||||||||||||||||
Prepaid and other assets | — | — | — | 209 | — | 209 | |||||||||||||||||
Total assets of Consolidated Entities | — | — | — | 1,475,649 | — | 1,475,649 | |||||||||||||||||
TOTAL ASSETS | $ | 170,959 | $ | 241,410 | $ | 314,265 | $ | 1,475,649 | $ | (455,080 | ) | $ | 1,747,203 | ||||||||||
LIABILITIES | |||||||||||||||||||||||
Due to brokers | $ | — | $ | 61 | $ | — | $ | — | $ | — | $ | 61 | |||||||||||
Accrued and other liabilities | 50 | 24,185 | 14,808 | — | (20,646 | ) | 18,397 | ||||||||||||||||
Contingent liabilities | — | — | 8,338 | — | — | 8,338 | |||||||||||||||||
Long-term debt | — | 156,161 | — | — | — | 156,161 | |||||||||||||||||
Subtotal | 50 | 180,407 | 23,146 | — | (20,646 | ) | 182,957 | ||||||||||||||||
Non-Recourse Liabilities of Consolidated Entities: | |||||||||||||||||||||||
Due to brokers | — | — | — | 71,603 | — | 71,603 | |||||||||||||||||
Accrued and other liabilities | — | — | — | 631 | (438 | ) | 193 | ||||||||||||||||
Interest payable | — | — | — | 5,257 | (167 | ) | 5,090 | ||||||||||||||||
Long-term debt | — | — | — | 1,357,095 | (48,537 | ) | 1,308,558 | ||||||||||||||||
Total Non-Recourse Liabilities of Consolidated Entities | — | — | — | 1,434,586 | (49,142 | ) | 1,385,444 | ||||||||||||||||
TOTAL LIABILITIES | 50 | 180,407 | 23,146 | 1,434,586 | (69,788 | ) | 1,568,401 | ||||||||||||||||
EQUITY | |||||||||||||||||||||||
Common shares | 25 | 25 | — | — | (25 | ) | 25 | ||||||||||||||||
Intercompany Preferred Units (1) | — | — | 85,000 | — | (85,000 | ) | — | ||||||||||||||||
Additional paid-in capital | 992,425 | 992,419 | 528,946 | — | (1,521,371 | ) | 992,419 | ||||||||||||||||
Retained earnings (deficit) | (821,541 | ) | (931,441 | ) | (322,827 | ) | — | 1,254,318 | (821,491 | ) | |||||||||||||
TOTAL CIFC LLC SHAREHOLDERS’ EQUITY | 170,909 | 61,003 | 291,119 | — | (352,078 | ) | 170,953 | ||||||||||||||||
Consolidated Fund Equity / Noncontrolling interests | — | — | — | 41,063 | (33,214 | ) | 7,849 | ||||||||||||||||
TOTAL EQUITY | 170,909 | 61,003 | 291,119 | 41,063 | (385,292 | ) | 178,802 | ||||||||||||||||
TOTAL LIABILITIES AND EQUITY | $ | 170,959 | $ | 241,410 | $ | 314,265 | $ | 1,475,649 | $ | (455,080 | ) | $ | 1,747,203 | ||||||||||
Explanatory Note:
_________________________________
(1) | CIFC Corp. holds 85.0 million of intercompany non-voting series A preferred units that bear an annual rate of 3.5%. |
28
CIFC LLC AND ITS SUBSIDIARIES
NOTES TO CONDENSED CONSOLIDATED FINANCIAL STATEMENTS (Unaudited)
Consolidating Statements of Operations (Unaudited)
For the Three Months Ended September 30, 2016
Parent/ CIFC LLC | Subsidiary Issuer/ CIFC Corp. | Subsidiary Guarantors | Non Guarantors | Eliminations | CIFC LLC Consolidated | ||||||||||||||||||
(In thousands) | |||||||||||||||||||||||
Revenues | |||||||||||||||||||||||
Management and incentive fees | $ | — | $ | — | $ | 17,120 | $ | — | $ | (2,511 | ) | $ | 14,609 | ||||||||||
Interest income from investments | — | — | 4,573 | — | (3,274 | ) | 1,299 | ||||||||||||||||
Intercompany - preferred units dividend income | — | 756 | — | — | (756 | ) | — | ||||||||||||||||
Interest income - Consolidated Entities | — | — | — | 24,799 | — | 24,799 | |||||||||||||||||
Total net revenues | — | 756 | 21,693 | 24,799 | (6,541 | ) | 40,707 | ||||||||||||||||
Expenses | |||||||||||||||||||||||
Employee compensation and benefits | — | — | 10,472 | — | — | 10,472 | |||||||||||||||||
Share-based compensation | 46 | 46 | 1,413 | — | — | 1,505 | |||||||||||||||||
Professional services | 2,267 | 2,140 | 821 | — | — | 5,228 | |||||||||||||||||
General and administrative expenses | 409 | 518 | 1,507 | — | — | 2,434 | |||||||||||||||||
Depreciation and amortization | — | 539 | 378 | — | — | 917 | |||||||||||||||||
Corporate interest expense | — | 2,004 | — | — | — | 2,004 | |||||||||||||||||
Expenses - Consolidated Entities | — | — | — | 3,216 | (2,508 | ) | 708 | ||||||||||||||||
Interest expense - Consolidated Entities | — | — | — | 11,830 | — | 11,830 | |||||||||||||||||
Total expenses | 2,722 | 5,247 | 14,591 | 15,046 | (2,508 | ) | 35,098 | ||||||||||||||||
Other Gain (Loss) | |||||||||||||||||||||||
Net gain (loss) on investments | — | — | 17,508 | — | (5,187 | ) | 12,321 | ||||||||||||||||
Net gain (loss) on contingent liabilities | — | — | (237 | ) | — | — | (237 | ) | |||||||||||||||
Net gain (loss) on investments - Consolidated Entities | — | — | — | 28,954 | — | 28,954 | |||||||||||||||||
Net gain (loss) on liabilities - Consolidated Entities | — | — | — | (36,692 | ) | 6,804 | (29,888 | ) | |||||||||||||||
Intercompany net gain (loss) on investments in subsidiaries | 21,149 | 2,799 | (417 | ) | — | (23,531 | ) | — | |||||||||||||||
Net other gain (loss) | 21,149 | 2,799 | 16,854 | (7,738 | ) | (21,914 | ) | 11,150 | |||||||||||||||
Income (loss) before income taxes | 18,427 | (1,692 | ) | 23,956 | 2,015 | (25,947 | ) | 16,759 | |||||||||||||||
Income tax (expense) benefit | — | 1,267 | — | — | — | 1,267 | |||||||||||||||||
Net income (loss) | 18,427 | (425 | ) | 23,956 | 2,015 | (25,947 | ) | 18,026 | |||||||||||||||
Net (income) loss attributable to noncontrolling interests in Consolidated Entities | — | — | — | (2,015 | ) | 1,660 | (355 | ) | |||||||||||||||
Net income (loss) attributable to CIFC LLC | $ | 18,427 | $ | (425 | ) | $ | 23,956 | $ | — | $ | (24,287 | ) | $ | 17,671 | |||||||||
29
CIFC LLC AND ITS SUBSIDIARIES
NOTES TO CONDENSED CONSOLIDATED FINANCIAL STATEMENTS (Unaudited)
Consolidating Statements of Operations (Unaudited)
For the Nine Months Ended September 30, 2016
Parent/ CIFC LLC | Subsidiary Issuer/ CIFC Corp. | Subsidiary Guarantors | Non Guarantors | Eliminations | CIFC LLC Consolidated | ||||||||||||||||||
(In thousands) | |||||||||||||||||||||||
Revenues | |||||||||||||||||||||||
Management and incentive fees | $ | — | $ | — | $ | 62,171 | $ | — | $ | (6,470 | ) | $ | 55,701 | ||||||||||
Interest income from investments | — | — | 11,348 | — | (7,954 | ) | 3,394 | ||||||||||||||||
Intercompany - preferred units dividend income | — | 2,244 | — | — | (2,244 | ) | — | ||||||||||||||||
Interest income - Consolidated Entities | — | — | — | 68,598 | — | 68,598 | |||||||||||||||||
Total net revenues | — | 2,244 | 73,519 | 68,598 | (16,668 | ) | 127,693 | ||||||||||||||||
Expenses | |||||||||||||||||||||||
Employee compensation and benefits | — | — | 29,449 | — | — | 29,449 | |||||||||||||||||
Share-based compensation | 325 | 325 | 4,980 | — | — | 5,630 | |||||||||||||||||
Professional services | 2,933 | 3,356 | 2,696 | — | — | 8,985 | |||||||||||||||||
General and administrative expenses | 704 | 1,789 | 5,001 | — | — | 7,494 | |||||||||||||||||
Depreciation and amortization | — | 2,090 | 1,205 | — | — | 3,295 | |||||||||||||||||
Impairment of intangible assets | — | — | 531 | — | — | 531 | |||||||||||||||||
Corporate interest expense | — | 5,960 | — | — | — | 5,960 | |||||||||||||||||
Expenses - Consolidated Entities | — | — | — | 8,175 | (6,470 | ) | 1,705 | ||||||||||||||||
Interest expense - Consolidated Entities | — | — | — | 32,047 | (195 | ) | 31,852 | ||||||||||||||||
Total expenses | 3,962 | 13,520 | 43,862 | 40,222 | (6,665 | ) | 94,901 | ||||||||||||||||
Other Gain (Loss) | |||||||||||||||||||||||
Net gain (loss) on investments | — | — | 30,915 | — | (14,460 | ) | 16,455 | ||||||||||||||||
Net gain (loss) on contingent liabilities | — | — | (451 | ) | — | — | (451 | ) | |||||||||||||||
Net gain (loss) on investments - Consolidated Entities | — | — | — | 55,657 | — | 55,657 | |||||||||||||||||
Net gain (loss) on liabilities - Consolidated Entities | — | — | — | (79,891 | ) | 18,756 | (61,135 | ) | |||||||||||||||
Intercompany net gain (loss) on investments in subsidiaries | 45,966 | 17,784 | 3,628 | — | (67,378 | ) | — | ||||||||||||||||
Net other gain (loss) | 45,966 | 17,784 | 34,092 | (24,234 | ) | (63,082 | ) | 10,526 | |||||||||||||||
Income (loss) before income taxes | 42,004 | 6,508 | 63,749 | 4,142 | (73,085 | ) | 43,318 | ||||||||||||||||
Income tax (expense) benefit | — | (2,879 | ) | — | — | — | (2,879 | ) | |||||||||||||||
Net income (loss) | 42,004 | 3,629 | 63,749 | 4,142 | (73,085 | ) | 40,439 | ||||||||||||||||
Net (income) loss attributable to noncontrolling interests in Consolidated Entities | — | — | — | (4,142 | ) | 3,463 | (679 | ) | |||||||||||||||
Net income (loss) attributable to CIFC LLC | $ | 42,004 | $ | 3,629 | $ | 63,749 | $ | — | $ | (69,622 | ) | $ | 39,760 | ||||||||||
30
CIFC LLC AND ITS SUBSIDIARIES
NOTES TO CONDENSED CONSOLIDATED FINANCIAL STATEMENTS (Unaudited)
Consolidating Statements of Operations (Unaudited)
For the Three Months Ended September 30, 2015
Parent/ CIFC LLC | Subsidiary Issuer/ CIFC Corp. | Subsidiary Guarantors | Non Guarantors | Eliminations | CIFC LLC Consolidated | ||||||||||||||||||
(In thousands) | |||||||||||||||||||||||
Revenues | |||||||||||||||||||||||
Management and incentive fees | $ | — | $ | — | $ | 19,634 | $ | — | $ | (380 | ) | $ | 19,254 | ||||||||||
Interest income from investments | — | — | 3,219 | — | (2,104 | ) | 1,115 | ||||||||||||||||
Interest income - Consolidated Entities | — | — | — | 4,143 | — | 4,143 | |||||||||||||||||
Total net revenues | — | — | 22,853 | 4,143 | (2,484 | ) | 24,512 | ||||||||||||||||
Expenses | |||||||||||||||||||||||
Employee compensation and benefits | — | — | 7,513 | — | — | 7,513 | |||||||||||||||||
Share-based compensation | — | — | 1,166 | — | — | 1,166 | |||||||||||||||||
Professional services | — | 1,916 | 996 | — | — | 2,912 | |||||||||||||||||
General and administrative expenses | — | 813 | 1,600 | — | — | 2,413 | |||||||||||||||||
Depreciation and amortization | — | 1,217 | 552 | — | — | 1,769 | |||||||||||||||||
Impairment of intangible assets | — | 461 | — | — | — | 461 | |||||||||||||||||
Corporate interest expense | — | 962 | — | — | — | 962 | |||||||||||||||||
Expenses - Consolidated Entities | — | — | — | 8,947 | (382 | ) | 8,565 | ||||||||||||||||
Interest expense - Consolidated Entities | — | — | — | 1,606 | (19 | ) | 1,587 | ||||||||||||||||
Total expenses | — | 5,369 | 11,827 | 10,553 | (401 | ) | 27,348 | ||||||||||||||||
Other Gain (Loss) | |||||||||||||||||||||||
Net gain (loss) on investments | — | — | (3,160 | ) | — | 545 | (2,615 | ) | |||||||||||||||
Net gain (loss) on contingent liabilities | — | — | (502 | ) | — | — | (502 | ) | |||||||||||||||
Net gain (loss) on investments - Consolidated Entities | — | — | — | (4,642 | ) | — | (4,642 | ) | |||||||||||||||
Net gain (loss) on liabilities - Consolidated Entities | — | — | — | 9,572 | 1,606 | 11,178 | |||||||||||||||||
Net gain (loss) on other investments and derivatives - Consolidated Entities | — | — | — | 1,228 | — | 1,228 | |||||||||||||||||
Intercompany net gain (loss) on investments in subsidiaries | — | 7,364 | — | — | (7,364 | ) | — | ||||||||||||||||
Net other gain (loss) | — | 7,364 | (3,662 | ) | 6,158 | (5,213 | ) | 4,647 | |||||||||||||||
Income (loss) before income taxes | — | 1,995 | 7,364 | (252 | ) | (7,296 | ) | 1,811 | |||||||||||||||
Income tax (expense) benefit | — | (526 | ) | — | — | — | (526 | ) | |||||||||||||||
Net income (loss) | — | 1,469 | 7,364 | (252 | ) | (7,296 | ) | 1,285 | |||||||||||||||
Net (income) loss attributable to noncontrolling interests in Consolidated Entities | — | — | — | 252 | (68 | ) | 184 | ||||||||||||||||
Net income (loss) attributable to CIFC LLC | $ | — | $ | 1,469 | $ | 7,364 | $ | — | $ | (7,364 | ) | $ | 1,469 | ||||||||||
31
CIFC LLC AND ITS SUBSIDIARIES
NOTES TO CONDENSED CONSOLIDATED FINANCIAL STATEMENTS (Unaudited)
Consolidating Statements of Operations (Unaudited)
For the Nine Months Ended September 30, 2015
Parent/ CIFC LLC | Subsidiary Issuer/ CIFC Corp. | Subsidiary Guarantors | Non Guarantors | Eliminations | CIFC LLC Consolidated | ||||||||||||||||||
(In thousands) | |||||||||||||||||||||||
Revenues | |||||||||||||||||||||||
Management and incentive fees | $ | — | $ | — | $ | 62,284 | $ | — | $ | (818 | ) | $ | 61,466 | ||||||||||
Interest income from investments | — | — | 8,058 | — | (2,109 | ) | 5,949 | ||||||||||||||||
Interest income - Consolidated Entities | — | — | 823 | 9,111 | — | 9,934 | |||||||||||||||||
Total net revenues | — | — | 71,165 | 9,111 | (2,927 | ) | 77,349 | ||||||||||||||||
Expenses | |||||||||||||||||||||||
Employee compensation and benefits | — | — | 23,547 | — | — | 23,547 | |||||||||||||||||
Share-based compensation | — | 269 | 3,565 | — | — | 3,834 | |||||||||||||||||
Professional services | — | 3,917 | 2,717 | — | — | 6,634 | |||||||||||||||||
General and administrative expenses | — | 2,635 | 4,591 | — | — | 7,226 | |||||||||||||||||
Depreciation and amortization | — | 4,547 | 1,712 | — | — | 6,259 | |||||||||||||||||
Impairment of intangible assets | — | 1,203 | — | — | — | 1,203 | |||||||||||||||||
Corporate interest expense | — | 2,256 | — | — | — | 2,256 | |||||||||||||||||
Expenses - Consolidated Entities | — | — | 16 | 11,072 | (820 | ) | 10,268 | ||||||||||||||||
Interest expense - Consolidated Entities | — | — | 231 | 3,042 | (19 | ) | 3,254 | ||||||||||||||||
Total expenses | — | 14,827 | 36,379 | 14,114 | (839 | ) | 64,481 | ||||||||||||||||
Other Gain (Loss) | |||||||||||||||||||||||
Net gain (loss) on investments | — | — | 2,478 | — | (2,433 | ) | 45 | ||||||||||||||||
Net gain (loss) on contingent liabilities | — | — | (1,792 | ) | — | — | (1,792 | ) | |||||||||||||||
Net gain (loss) on investments - Consolidated Entities | — | — | 796 | (1,325 | ) | — | (529 | ) | |||||||||||||||
Net gain (loss) on liabilities - Consolidated Entities | — | — | — | 4,647 | 3,865 | 8,512 | |||||||||||||||||
Net gain (loss) on other investments and derivatives - Consolidated Entities | — | — | — | 2,970 | — | 2,970 | |||||||||||||||||
Intercompany net gain (loss) on investments in subsidiaries | — | 36,268 | — | — | (36,268 | ) | — | ||||||||||||||||
Net other gain (loss) | — | 36,268 | 1,482 | 6,292 | (34,836 | ) | 9,206 | ||||||||||||||||
Income (loss) before income taxes | — | 21,441 | 36,268 | 1,289 | (36,924 | ) | 22,074 | ||||||||||||||||
Income tax (expense) benefit | — | (13,441 | ) | — | — | — | (13,441 | ) | |||||||||||||||
Net income (loss) | — | 8,000 | 36,268 | 1,289 | (36,924 | ) | 8,633 | ||||||||||||||||
Net (income) loss attributable to noncontrolling interests in Consolidated Entities | — | — | — | (1,289 | ) | 656 | (633 | ) | |||||||||||||||
Net income (loss) attributable to CIFC LLC | $ | — | $ | 8,000 | $ | 36,268 | $ | — | $ | (36,268 | ) | $ | 8,000 | ||||||||||
32
CIFC LLC AND ITS SUBSIDIARIES
NOTES TO CONDENSED CONSOLIDATED FINANCIAL STATEMENTS (Unaudited)
Consolidating Statement of Comprehensive Income (Loss) (Unaudited)
For the Three Months Ended September 30, 2016
Parent/ CIFC LLC | Subsidiary Issuer/ CIFC Corp. | Subsidiary Guarantors | Non Guarantors | Eliminations | CIFC LLC Consolidated | ||||||||||||||||||
(In thousands) | |||||||||||||||||||||||
Net income (loss) | $ | 18,427 | $ | (425 | ) | $ | 23,956 | $ | 2,015 | $ | (25,947 | ) | $ | 18,026 | |||||||||
Other comprehensive income (loss) | — | — | — | — | — | — | |||||||||||||||||
Comprehensive income (loss) | 18,427 | (425 | ) | 23,956 | 2,015 | (25,947 | ) | 18,026 | |||||||||||||||
Comprehensive (income) loss attributable to noncontrolling interests in Consolidated Entities | — | — | — | (2,015 | ) | 1,660 | (355 | ) | |||||||||||||||
Comprehensive income (loss) attributable to CIFC LLC | $ | 18,427 | $ | (425 | ) | $ | 23,956 | $ | — | $ | (24,287 | ) | $ | 17,671 | |||||||||
Consolidating Statement of Comprehensive Income (Loss) (Unaudited)
For the Nine Months Ended September 30, 2016
Parent/ CIFC LLC | Subsidiary Issuer/ CIFC Corp. | Subsidiary Guarantors | Non Guarantors | Eliminations | CIFC LLC Consolidated | ||||||||||||||||||
(In thousands) | |||||||||||||||||||||||
Net income (loss) | $ | 42,004 | $ | 3,629 | $ | 63,749 | $ | 4,142 | $ | (73,085 | ) | $ | 40,439 | ||||||||||
Other comprehensive income (loss) | — | — | — | — | — | — | |||||||||||||||||
Comprehensive income (loss) | 42,004 | 3,629 | 63,749 | 4,142 | (73,085 | ) | 40,439 | ||||||||||||||||
Comprehensive (income) loss attributable to noncontrolling interests in Consolidated Entities | — | — | — | (4,142 | ) | 3,463 | (679 | ) | |||||||||||||||
Comprehensive income (loss) attributable to CIFC LLC | $ | 42,004 | $ | 3,629 | $ | 63,749 | $ | — | $ | (69,622 | ) | $ | 39,760 | ||||||||||
Consolidating Statement of Comprehensive Income (Loss) (Unaudited)
For the Three Months Ended September 30, 2015
Parent/ CIFC LLC | Subsidiary Issuer/ CIFC Corp. | Subsidiary Guarantors | Non Guarantors | Eliminations | CIFC LLC Consolidated | ||||||||||||||||||
(In thousands) | |||||||||||||||||||||||
Net income (loss) | $ | — | $ | 1,469 | $ | 7,364 | $ | (252 | ) | $ | (7,296 | ) | $ | 1,285 | |||||||||
Other comprehensive income (loss) | — | — | — | — | — | — | |||||||||||||||||
Comprehensive income (loss) | — | 1,469 | 7,364 | (252 | ) | (7,296 | ) | 1,285 | |||||||||||||||
Comprehensive (income) loss attributable to noncontrolling interests in Consolidated Entities | — | — | — | 252 | (68 | ) | 184 | ||||||||||||||||
Comprehensive income (loss) attributable to CIFC LLC | $ | — | $ | 1,469 | $ | 7,364 | $ | — | $ | (7,364 | ) | $ | 1,469 | ||||||||||
Consolidating Statement of Comprehensive Income (Loss) (Unaudited)
For the Nine Months Ended September 30, 2015
Parent/ CIFC LLC | Subsidiary Issuer/ CIFC Corp. | Subsidiary Guarantors | Non Guarantors | Eliminations | CIFC LLC Consolidated | ||||||||||||||||||
(In thousands) | |||||||||||||||||||||||
Net income (loss) | $ | — | $ | 8,000 | $ | 36,268 | $ | 1,289 | $ | (36,924 | ) | $ | 8,633 | ||||||||||
Other comprehensive income (loss) | — | — | — | — | — | — | |||||||||||||||||
Comprehensive income (loss) | — | 8,000 | 36,268 | 1,289 | (36,924 | ) | 8,633 | ||||||||||||||||
Comprehensive (income) loss attributable to noncontrolling interests in Consolidated Entities | — | — | — | (1,289 | ) | 656 | (633 | ) | |||||||||||||||
Comprehensive income (loss) attributable to CIFC LLC | $ | — | $ | 8,000 | $ | 36,268 | $ | — | $ | (36,268 | ) | $ | 8,000 | ||||||||||
33
CIFC LLC AND ITS SUBSIDIARIES
NOTES TO CONDENSED CONSOLIDATED FINANCIAL STATEMENTS (Unaudited)
Consolidating Statement of Cash Flows (Unaudited)
For the Nine Months Ended September 30, 2016
Parent/ CIFC LLC | Subsidiary Issuer/ CIFC Corp. | Subsidiary Guarantors | Non Guarantors | Eliminations | CIFC LLC Consolidated | ||||||||||||||||||
(In Thousands) | |||||||||||||||||||||||
CASH FLOWS FROM OPERATING ACTIVITIES: | |||||||||||||||||||||||
Net income (loss) | $ | 42,004 | $ | 3,629 | $ | 63,749 | $ | 4,142 | $ | (73,085 | ) | $ | 40,439 | ||||||||||
Adjustments to reconcile net income (loss) to net cash provided by (used in) operating activities: | |||||||||||||||||||||||
Amortization of debt issuance costs and other | — | 240 | — | — | — | 240 | |||||||||||||||||
Share-based compensation | 325 | 325 | 4,980 | — | — | 5,630 | |||||||||||||||||
Net (gain) loss on investments and contingent liabilities / other (gain) loss | — | — | (30,464 | ) | — | 14,460 | (16,004 | ) | |||||||||||||||
Intercompany- preferred units dividend | (2,244 | ) | — | — | — | 2,244 | — | ||||||||||||||||
Intercompany net (gain) loss on investments in subsidiaries | (45,966 | ) | (17,784 | ) | (3,628 | ) | — | 67,378 | — | ||||||||||||||
Depreciation and amortization | — | 2,090 | 1,205 | — | — | 3,295 | |||||||||||||||||
Impairment of intangible assets | — | — | 531 | — | — | 531 | |||||||||||||||||
Deferred income tax expense (benefit) | — | 3,021 | — | — | — | 3,021 | |||||||||||||||||
Tax benefit (shortfall) from share-based payment arrangements | — | 220 | — | — | — | 220 | |||||||||||||||||
Consolidated Entities: | |||||||||||||||||||||||
Net (gain) loss on investments | — | — | — | (55,657 | ) | — | (55,657 | ) | |||||||||||||||
Net (gain) loss on liabilities | — | — | — | 79,891 | (18,756 | ) | 61,135 | ||||||||||||||||
Changes in operating assets and liabilities: | |||||||||||||||||||||||
Receivables | 785 | (6,684 | ) | 20,287 | — | (18,830 | ) | (4,442 | ) | ||||||||||||||
Prepaid and other assets | — | 1,355 | (257 | ) | — | — | 1,098 | ||||||||||||||||
Due to brokers | — | (61 | ) | — | — | — | (61 | ) | |||||||||||||||
Accrued and other liabilities | 3,425 | (20,284 | ) | 6,919 | — | 18,442 | 8,502 | ||||||||||||||||
Consolidated Entities: | |||||||||||||||||||||||
Due from brokers | — | — | — | 2,942 | — | 2,942 | |||||||||||||||||
Purchase of investments | — | — | — | (610,716 | ) | — | (610,716 | ) | |||||||||||||||
Sales of investments | — | — | — | 615,484 | — | 615,484 | |||||||||||||||||
Receivables | — | — | — | (833 | ) | — | (833 | ) | |||||||||||||||
Due to brokers | — | — | — | (13 | ) | — | (13 | ) | |||||||||||||||
Accrued and other liabilities | — | — | — | (250 | ) | 108 | (142 | ) | |||||||||||||||
Interest payable | — | — | — | (2,654 | ) | 229 | (2,425 | ) | |||||||||||||||
Net cash provided by (used in) operating activities | (1,671 | ) | (33,933 | ) | 63,322 | 32,336 | (7,810 | ) | 52,244 | ||||||||||||||
CASH FLOWS FROM INVESTING ACTIVITIES: | |||||||||||||||||||||||
Purchases of investments | — | — | (108,933 | ) | — | 16,222 | (92,711 | ) | |||||||||||||||
Sales of investments | — | — | 80,770 | — | (18,093 | ) | 62,677 | ||||||||||||||||
Intercompany investments in subsidiaries | 18,179 | 32,825 | (5,409 | ) | — | (45,595 | ) | — | |||||||||||||||
Purchases of equipment and improvements | — | — | (277 | ) | — | — | (277 | ) | |||||||||||||||
Consolidated Entities: | |||||||||||||||||||||||
Change in restricted cash and cash equivalents | — | — | — | 32,604 | — | 32,604 | |||||||||||||||||
Net cash provided by (used in) investing activities | 18,179 | 32,825 | (33,849 | ) | 32,604 | (47,466 | ) | 2,293 | |||||||||||||||
CASH FLOWS FROM FINANCING ACTIVITIES: | |||||||||||||||||||||||
Repurchases of common shares | (435 | ) | — | — | — | — | (435 | ) | |||||||||||||||
Payments of share and debt issuance cost | — | (167 | ) | — | — | — | (167 | ) | |||||||||||||||
Distributions paid | (16,211 | ) | — | — | — | — | (16,211 | ) | |||||||||||||||
Intercompany contributions | — | 4,930 | 32,111 | — | (37,041 | ) | — | ||||||||||||||||
Intercompany distributions | — | — | (80,441 | ) | — | 80,441 | — | ||||||||||||||||
Intercompany- preferred units dividend | — | — | (2,244 | ) | — | 2,244 | — | ||||||||||||||||
Proceeds from the exercise of options | 483 | — | — | — | — | 483 | |||||||||||||||||
Payments for tax from the net delivery of restricted share units | (270 | ) | — | — | — | — | (270 | ) | |||||||||||||||
Payments on contingent liabilities | — | — | (1,534 | ) | — | — | (1,534 | ) | |||||||||||||||
Tax (benefit) shortfall from share-based payment arrangements | — | (220 | ) | — | — | — | (220 | ) | |||||||||||||||
Consolidated Entities: | |||||||||||||||||||||||
Distributions to noncontrolling interests | — | — | — | (83 | ) | — | (83 | ) | |||||||||||||||
Proceeds from issuance of long-term debt | — | — | — | 68 | — | 68 | |||||||||||||||||
Payments made on long-term debt | — | — | — | (64,925 | ) | 9,632 | (55,293 | ) | |||||||||||||||
Net cash provided by (used in) financing activities | (16,433 | ) | 4,543 | (52,108 | ) | (64,940 | ) | 55,276 | (73,662 | ) | |||||||||||||
Net increase (decrease) in cash and cash equivalents | 75 | 3,435 | (22,635 | ) | — | — | (19,125 | ) | |||||||||||||||
Cash and cash equivalents at beginning of period | — | 1,392 | 56,576 | — | — | 57,968 | |||||||||||||||||
Cash and cash equivalents at end of period | $ | 75 | $ | 4,827 | $ | 33,941 | $ | — | $ | — | $ | 38,843 | |||||||||||
34
CIFC LLC AND ITS SUBSIDIARIES
NOTES TO CONDENSED CONSOLIDATED FINANCIAL STATEMENTS (Unaudited)
Consolidating Statement of Cash Flows (Unaudited)
For the Nine Months Ended September 30, 2015
Parent/ CIFC LLC | Subsidiary Issuer/ CIFC Corp. | Subsidiary Guarantors | Non Guarantors | Eliminations | CIFC LLC Consolidated | ||||||||||||||||||
(In thousands) | |||||||||||||||||||||||
CASH FLOWS FROM OPERATING ACTIVITIES: | |||||||||||||||||||||||
Net income (loss) | $ | — | $ | 8,000 | $ | 36,268 | $ | 1,289 | $ | (36,924 | ) | $ | 8,633 | ||||||||||
Adjustments to reconcile net income (loss) to net cash provided by (used in) operating activities: | |||||||||||||||||||||||
Amortization of debt issuance costs and other | — | 67 | — | — | — | 67 | |||||||||||||||||
Share-based compensation | — | 269 | 3,565 | — | — | 3,834 | |||||||||||||||||
Net (gain) loss on investments and contingent liabilities / other (gain) loss | — | — | (686 | ) | — | 2,433 | 1,747 | ||||||||||||||||
Intercompany net (gain) loss on investments in subsidiaries | — | (36,268 | ) | — | — | 36,268 | — | ||||||||||||||||
Depreciation and amortization | — | 4,547 | 1,712 | — | — | 6,259 | |||||||||||||||||
Impairment of intangible assets | — | 1,203 | — | — | — | 1,203 | |||||||||||||||||
Deferred income tax expense (benefit) | — | 7,296 | — | — | — | 7,296 | |||||||||||||||||
Tax benefit (shortfall) from share-based payment arrangements | — | (7 | ) | — | — | — | (7 | ) | |||||||||||||||
Consolidated Entities: | |||||||||||||||||||||||
Net (gain) loss on investments | — | — | (796 | ) | 1,325 | — | 529 | ||||||||||||||||
Net (gain) loss on liabilities | — | — | — | (4,647 | ) | (3,865 | ) | (8,512 | ) | ||||||||||||||
Net other (gain) loss | — | — | — | (2,970 | ) | — | (2,970 | ) | |||||||||||||||
Changes in operating assets and liabilities: | |||||||||||||||||||||||
Due from brokers | — | — | (62 | ) | — | — | (62 | ) | |||||||||||||||
Receivables | — | (3,262 | ) | (7,940 | ) | — | 5,949 | (5,253 | ) | ||||||||||||||
Prepaid and other assets | — | 1,459 | (468 | ) | — | — | 991 | ||||||||||||||||
Due to brokers | — | 67 | 2,625 | — | — | 2,692 | |||||||||||||||||
Accrued and other liabilities | — | 7,165 | (1,366 | ) | — | (5,810 | ) | (11 | ) | ||||||||||||||
Consolidated Entities: | |||||||||||||||||||||||
Due from brokers | — | — | 14,459 | (29,723 | ) | — | (15,264 | ) | |||||||||||||||
Purchase of investments | — | — | (55,016 | ) | (754,795 | ) | — | (809,811 | ) | ||||||||||||||
Sales of investments | — | — | 47,462 | 289,287 | — | 336,749 | |||||||||||||||||
Receivables | — | — | (352 | ) | (3,787 | ) | 2 | (4,137 | ) | ||||||||||||||
Due to brokers | — | — | (7,882 | ) | 108,532 | — | 100,650 | ||||||||||||||||
Accrued and other liabilities | — | — | 6 | (4 | ) | (116 | ) | (114 | ) | ||||||||||||||
Interest payable | — | — | (8 | ) | 924 | (22 | ) | 894 | |||||||||||||||
Net cash provided by (used in) operating activities | — | (9,464 | ) | 31,521 | (394,569 | ) | (2,085 | ) | (374,597 | ) | |||||||||||||
CASH FLOWS FROM INVESTING ACTIVITIES: | |||||||||||||||||||||||
Purchases of investments | — | — | (176,893 | ) | — | 110,637 | (66,256 | ) | |||||||||||||||
Sales of investments | — | — | 137,981 | — | (66,319 | ) | 71,662 | ||||||||||||||||
Intercompany investments in subsidiaries | — | (98,222 | ) | — | — | 98,222 | — | ||||||||||||||||
Intercompany distributions from subsidiaries | — | 113,984 | — | — | (113,984 | ) | — | ||||||||||||||||
Purchases of equipment and improvements | — | — | (802 | ) | — | — | (802 | ) | |||||||||||||||
Consolidated Entities: | |||||||||||||||||||||||
Change in restricted cash and cash equivalents | — | — | 755 | (211,660 | ) | — | (210,905 | ) | |||||||||||||||
Net cash provided by (used in) investing activities | — | 15,762 | (38,959 | ) | (211,660 | ) | 28,556 | (206,301 | ) | ||||||||||||||
CASH FLOWS FROM FINANCING ACTIVITIES: | |||||||||||||||||||||||
Repurchases of common shares | — | (246 | ) | — | — | — | (246 | ) | |||||||||||||||
Payments of share and debt issuance cost | — | (75 | ) | — | — | — | (75 | ) | |||||||||||||||
Distributions paid | — | (7,598 | ) | — | — | — | (7,598 | ) | |||||||||||||||
Intercompany contributions | — | — | 98,222 | — | (98,222 | ) | — | ||||||||||||||||
Intercompany distributions | — | — | (113,984 | ) | — | 113,984 | — | ||||||||||||||||
Proceeds from extension of warrants | — | 350 | — | — | — | 350 | |||||||||||||||||
Proceeds from the exercise of options | — | 121 | — | — | — | 121 | |||||||||||||||||
Payments for tax from the net delivery of restricted share units | — | (265 | ) | — | — | — | (265 | ) | |||||||||||||||
Payments on contingent liabilities | — | — | (3,599 | ) | — | — | (3,599 | ) | |||||||||||||||
Tax (benefits) shortfall from share-based payment arrangements | — | 7 | — | — | — | 7 | |||||||||||||||||
Consolidated Entities: | |||||||||||||||||||||||
Contributions from noncontrolling interests | — | — | — | 18,713 | (2,613 | ) | 16,100 | ||||||||||||||||
Distributions to noncontrolling interests | — | — | — | (13,470 | ) | — | (13,470 | ) | |||||||||||||||
Proceeds from issuance of long-term debt | — | — | — | 684,699 | (114,946 | ) | 569,753 | ||||||||||||||||
Payments made on long-term debt | — | — | — | (83,713 | ) | 75,326 | (8,387 | ) | |||||||||||||||
Net cash provided by (used in) financing activities | — | (7,706 | ) | (19,361 | ) | 606,229 | (26,471 | ) | 552,691 | ||||||||||||||
Net increase (decrease) in cash and cash equivalents | — | (1,408 | ) | (26,799 | ) | — | — | (28,207 | ) | ||||||||||||||
Cash and cash equivalents at beginning of period | — | 2,157 | 57,133 | — | — | 59,290 | |||||||||||||||||
Cash and cash equivalents at end of period | $ | — | $ | 749 | $ | 30,334 | $ | — | $ | — | $ | 31,083 | |||||||||||
35
Item 2. Management's Discussion and Analysis of Financial Condition and Results of Operations
You should read the following discussion together with our Condensed Consolidated Financial Statements and notes thereto included in Part I—Item 1. Condensed Consolidated Financial Statements and Notes (Unaudited) of this Quarterly Report on Form 10-Q (this “Quarterly Report”). The statements in this discussion regarding the industry outlook and our expectations regarding the future performance of our business and the other non-historical statements are forward-looking statements. These forward-looking statements are subject to numerous risks and uncertainties, including, but not limited to, the risks and uncertainties described in Special Note Regarding Forward-Looking Statements and Part I—Item 1A. Risk Factors in this Quarterly Report on Form 10-Q. Unless otherwise noted or the context otherwise requires, we refer to CIFC LLC as “CIFC,” and to CIFC and its subsidiaries as “we,” “us,” “our,” “our company,” or “the Company.”
Overview
CIFC is a Delaware limited liability company headquartered in New York City. We are a private debt manager specializing in secured U.S. corporate loan strategies. Our primary business is to provide investment management services for institutional investors, including pension funds, hedge funds, asset management firms, banks, insurance companies and other types of investors around the world.
Fee Earning Assets Under Management (“Fee Earning AUM” or “AUM”) refers to principal balance, net asset value or value of assets managed by us on which we earn management and/or incentive fees. Our AUM is primarily comprised of Collateralized Loan Obligations ("CLOs"). In addition, we manage credit funds and other loan-based products (together, "Non-CLO products" and together with CLOs, "Funds"). We manage these credit products through opportunistic investment strategies where we seek to generate current income and/or capital appreciation, primarily through senior secured corporate loan investments (“SSCLs”) and, to a lesser extent, other investments. We also manage Collateralized Debt Obligations (“CDOs”), which we do not expect to issue in the future.
We have three primary sources of revenue: management fees, incentive fees and investment income. Management fees are generally earned based on a percentage of AUM of the Funds. Incentive fees are earned based on the performance of the Funds. Investment income represents interest income and realized/unrealized gains and losses on investments in the products sponsored by us and third parties.
On December 31, 2015, CIFC Corp., the Company's former publicly traded entity, completed a series of transactions (the "Reorganization Transaction") to become a subsidiary of CIFC LLC, the current publicly traded entity. The series of transactions changed the Company's top-level form of organization from a corporation to a limited liability company. As of January 1, 2016, we are taxed as a partnership. The Reorganization Transaction was a transaction between entities under common control; therefore, the prior year comparative Condensed Consolidated Financial Statements include the Consolidated Balance Sheet, Statement of Operations, Comprehensive Income (Loss), Equity and Cash Flows as of December 31, 2015 and for the three and nine months ended September 30, 2015 of CIFC Corp.
Pending Strategic Transaction
On August 19, 2016, we entered into an Agreement and Plan of Merger (the “Merger Agreement”) (see Note 1 to the unaudited consolidated financial statements in Part I, Item 1 of this Quarterly Report on Form 10-Q) to be acquired by an affiliate of F.A.B. Partners, a global alternative investment platform that focuses on originating, structuring and actively managing investments across geographies and asset classes, for $11.36 in cash per outstanding common share (the “Strategic Transaction”).
For additional information related to the Strategic Transaction, please refer to our Definitive Proxy Statement on Schedule 14A filed with the Securities and Exchange Commission ("SEC") on October 17, 2016, which includes the full text of the Merger Agreement included as Annex A.
Executive Overview
Strong performance in credit assets continued in the third quarter driven by an increased appetite for risk from investors. The U.S. leveraged loan market posted a 3.08% return over the quarter for a 7.72% return year-to-date (source: S&P/LSTA Leveraged Loan Index). Net investment income was $22.1 million and $42.3 million for the third quarter and year to date, respectively. Our Credit Funds continued to see inflows, pushing Credit Fund AUM to $1.5 billion. Fee income related to Credit Funds increased by 53% to $4.4 million for the year. As expected, the new issue CLO market improved during the third quarter with $19.9 billion of new issuance. We are managing two warehouses and expect to issue two CLOs in the near future. We continue to be well capitalized to issue risk retention compliant CLOs in the future.
36
Fee Earning AUM
Fee Earning AUM refers to the assets managed by the Company on which we receive management fees and/or incentive based fees. Generally, with respect to CLOs, management fees are paid to the Company based on the aggregate collateral balance at par plus principal cash, and with respect to Non-CLO funds, the value of the assets in such funds. We believe this measure is useful to investors as it is an additional performance measure providing insight into the overall investment activities of the Company's managed Funds (or core business). The following table summarizes Fee Earning AUM:
September 30, 2016 | December 31, 2015 | September 30, 2015 | |||||||||||||||||||
(In thousands, except # of Accounts) (1)(2) | Number of Accounts | Fee Earning AUM | Number of Accounts | Fee Earning AUM | Number of Accounts | Fee Earning AUM | |||||||||||||||
Post 2011 CLOs | 18 | $ | 9,612,489 | 18 | $ | 9,860,519 | 17 | $ | 9,388,022 | ||||||||||||
Legacy CLOs (3) | 9 | 1,528,631 | 10 | 2,559,066 | 14 | 3,253,869 | |||||||||||||||
Total CLOs | 27 | 11,141,120 | 28 | 12,419,585 | 31 | 12,641,891 | |||||||||||||||
Credit Funds (4) | 16 | 1,537,501 | 12 | 1,062,712 | 10 | 941,035 | |||||||||||||||
Other Loan-Based Products (4) | 2 | 528,843 | 2 | 573,190 | 2 | 633,290 | |||||||||||||||
Total Non-CLOs (4) | 18 | 2,066,344 | 14 | 1,635,902 | 12 | 1,574,325 | |||||||||||||||
Total Loan-Based AUM | 45 | 13,207,464 | 42 | 14,055,487 | 43 | 14,216,216 | |||||||||||||||
ABS and Corporate Bond CDOs | 8 | 500,126 | 8 | 592,798 | 8 | 621,888 | |||||||||||||||
Total Fee Earning AUM | 53 | $ | 13,707,590 | 50 | $ | 14,648,285 | 51 | $ | 14,838,104 | ||||||||||||
Explanatory Notes:
_________________________________
(1) | Fee Earning AUM attributable to ABS and Corporate Bond CDO products is expected to continue to decline as these funds run-off per their contractual terms. |
(2) | Fee Earning AUM is based on the latest available monthly report issued by the trustee or fund administrator prior to the end of the period, and may not tie back to the Consolidated GAAP financial statements. |
(3) | Legacy CLOs represent all managed CLOs issued prior to 2011, including CLOs acquired since 2011 but issued prior to 2011. |
(4) | Management fees for Non-CLO products vary by fund and may not be similar to a CLO. |
Fee Earning AUM activities are as follows:
For the Three Months Ended | For the Nine Months Ended | Last Twelve Months Ended | |||||||||
September 30, 2016 | |||||||||||
(In thousands) | |||||||||||
Total loan-based AUM - Beginning Balance | $ | 13,617,299 | $ | 14,055,487 | $ | 14,216,216 | |||||
CLO New Issuances | — | — | 498,360 | ||||||||
CLO Paydowns | (570,796 | ) | (1,280,765 | ) | (2,006,984 | ) | |||||
Net Subscriptions to Credit Funds | 94,382 | 361,691 | 488,505 | ||||||||
Net Redemptions from Other Loan-Based Products | (13,397 | ) | (44,346 | ) | (104,446 | ) | |||||
Other (1) | 79,976 | 115,397 | 115,813 | ||||||||
Total loan-based AUM - Ending Balance | 13,207,464 | 13,207,464 | 13,207,464 | ||||||||
Total CDOs - Ending Balance | 500,126 | 500,126 | 500,126 | ||||||||
Total Fee Earning AUM - Ending Balance | $ | 13,707,590 | $ | 13,707,590 | $ | 13,707,590 | |||||
Explanatory Note:
_________________________________
(1) Includes changes in collateral balances of CLOs between periods and market value or portfolio value changes in certain Non-CLO products.
37
During the three months ended September 30, 2016, we entered into an investment management agreement for a new separately managed account ("SMA") and increased subscriptions to existing funds for an aggregate of $94.4 million of new Fee Earning AUM. Certain CLOs and all CDOs we manage have passed their reinvestment periods (see table below). Therefore, proceeds from paydowns are required to repay the CLO's or CDO's liabilities. As expected, AUM on these CLOs and CDOs continued to decline during the three months ended September 30, 2016. Total AUM decreased by $434.7 million from June 30, 2016 to September 30, 2016.
During the nine months ended September 30, 2016, we entered into investment management agreements for 4 new SMAs and increased subscriptions to existing funds for an aggregate of $361.7 million of new Fee Earning AUM. CLO and CDO paydowns, along with other loan-based product run-off reduced AUM, resulting in an overall net decrease in AUM of $940.7 million from December 31, 2015 to September 30, 2016.
Loan-based AUM
Since 2012, CIFC has raised $11.6 billion of new AUM through organic growth (i.e. excluding mergers and acquisition related transactions) which has more than offset the run-off from Legacy CLOs (including acquired CLOs). Our Legacy CLO AUM of $1.5 billion is approximately a tenth of our total loan-based AUM of $13.2 billion, and we anticipate it will run off over the next two years.
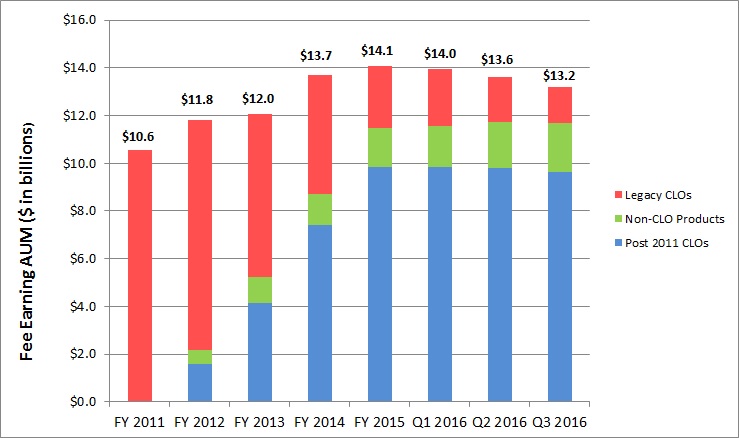
38
The structure of the CLOs we manage affects the management fees paid to us. The following table summarizes select details of the structure of each of the CLOs we manage:
Issuance Date | September 30, 2016 Fee Earning AUM | First Optional Call Date (1) | Termination of Reinvestment Period (2) | Maturity Year (3) | ||||||||
Month/Year | (In thousands) | Month/Year | ||||||||||
Post 2011 CLOs | ||||||||||||
CIFC Funding 2011-I, Ltd. (4) | 01/12 | $ | 4,468 | 01/14 | 01/15 | 2023 | ||||||
CIFC Funding 2012-I, Ltd. | 07/12 | 453,277 | 08/14 | 08/16 | 2024 | |||||||
CIFC Funding 2012-II, Ltd. | 11/12 | 733,004 | 12/14 | 12/16 | 2024 | |||||||
CIFC Funding 2012-III, Ltd. | 01/13 | 504,376 | 01/15 | 01/17 | 2025 | |||||||
CIFC Funding 2013-I, Ltd. | 03/13 | 504,431 | 04/15 | 04/17 | 2025 | |||||||
CIFC Funding 2013-II, Ltd. | 06/13 | 626,532 | 07/15 | 07/17 | 2025 | |||||||
CIFC Funding 2013-III, Ltd. | 09/13 | 401,427 | 10/15 | 10/17 | 2025 | |||||||
CIFC Funding 2013-IV, Ltd. | 11/13 | 505,548 | 11/15 | 11/17 | 2024 | |||||||
CIFC Funding 2014, Ltd. | 03/14 | 603,580 | 04/16 | 04/18 | 2025 | |||||||
CIFC Funding 2014-II, Ltd. | 05/14 | 807,729 | 05/16 | 05/18 | 2026 | |||||||
CIFC Funding 2014-III, Ltd. | 07/14 | 704,265 | 07/16 | 07/18 | 2026 | |||||||
CIFC Funding 2014-IV, Ltd. | 09/14 | 602,655 | 10/16 | 10/18 | 2026 | |||||||
CIFC Funding 2014-V, Ltd. | 12/14 | 554,438 | 10/16 | 01/19 | 2027 | |||||||
CIFC Funding 2015-I, Ltd. | 03/15 | 601,792 | 09/16 | 04/19 | 2027 | |||||||
CIFC Funding 2015-II, Ltd. | 05/15 | 501,641 | 10/16 | 04/19 | 2027 | |||||||
CIFC Funding 2015-III, Ltd. | 07/15 | 501,528 | 10/17 | 10/19 | 2027 | |||||||
CIFC Funding 2015-IV, Ltd. | 09/15 | 500,958 | 10/18 | 10/20 | 2027 | |||||||
CIFC Funding 2015-V, Ltd. | 11/15 | 500,840 | 04/18 | 04/20 | 2027 | |||||||
Total Post 2011 CLOs | 9,612,489 | |||||||||||
Legacy CLOs | ||||||||||||
Bridgeport CLO Ltd. | 06/06 | 163,252 | 10/09 | 07/13 | 2020 | |||||||
Burr Ridge CLO Plus Ltd. | 12/06 | 126,966 | 06/12 | 03/13 | 2023 | |||||||
CIFC Funding 2006-II, Ltd. | 12/06 | 94,462 | 03/11 | 03/13 | 2021 | |||||||
CIFC Funding 2007-I, Ltd. | 02/07 | 121,439 | 05/11 | 11/13 | 2021 | |||||||
CIFC Funding 2007-II, Ltd. | 03/07 | 205,307 | 04/11 | 04/14 | 2021 | |||||||
Schiller Park CLO Ltd. | 05/07 | 178,191 | 07/11 | 04/13 | 2021 | |||||||
Bridgeport CLO II Ltd. | 06/07 | 289,431 | 12/10 | 09/14 | 2021 | |||||||
CIFC Funding 2007-III, Ltd. | 07/07 | 186,028 | 07/10 | 07/14 | 2021 | |||||||
Primus CLO II, Ltd. | 07/07 | 163,555 | 10/11 | 07/14 | 2021 | |||||||
Total Legacy CLOs | 1,528,631 | |||||||||||
Total CLOs | $ | 11,141,120 | ||||||||||
Explanatory Notes:
_________________________________
(1) | CLOs are generally callable by equity holders (or the subordinated note holders) of the CLO once per quarter beginning on the "first optional call date" and subject to satisfaction of certain conditions. |
(2) | Termination of Reinvestment Period refers to the date after which we can no longer use certain principal collections to purchase additional collateral, and such collections are instead used to repay the outstanding amounts of certain debt securities issued by the CLO. |
(3) | Represents the contractual maturity of the CLO. Generally, the actual maturity of the deal is expected to occur before the contractual maturity. |
(4) | CLO was called during the nine months ended September 30, 2016. |
39
Results of Consolidated Operations
The Consolidated Financial Statements include the financial statements of our wholly owned subsidiaries, the entities in which we have a controlling interest ("Consolidated Funds") and variable interest entities ("VIEs" or "Consolidated VIEs") for which we are deemed to be the primary beneficiary (together with the Consolidated Funds, the "Consolidated Entities"). Consolidated VIEs include certain CLOs and warehouses we manage.
The following table presents our comparative Consolidated Statements of Operations for the three months ended September 30, 2016 and 2015:
For the Three Months Ended September 30, | 2016 vs. 2015 | |||||||||||||
2016 | 2015 | Change | % | |||||||||||
(In thousands, except share and per share amounts) | ||||||||||||||
Revenues | ||||||||||||||
Management and incentive fees | $ | 14,609 | $ | 19,254 | $ | (4,645 | ) | (24 | )% | |||||
Interest income from investments | 1,299 | 1,115 | 184 | 17 | % | |||||||||
Interest income - Consolidated Entities | 24,799 | 4,143 | 20,656 | 499 | % | |||||||||
Total net revenues | 40,707 | 24,512 | 16,195 | 66 | % | |||||||||
Expenses | ||||||||||||||
Employee compensation and benefits | 10,472 | 7,513 | 2,959 | 39 | % | |||||||||
Share-based compensation | 1,505 | 1,166 | 339 | 29 | % | |||||||||
Professional services | 5,228 | 2,912 | 2,316 | 80 | % | |||||||||
General and administrative expenses | 2,434 | 2,413 | 21 | 1 | % | |||||||||
Depreciation and amortization | 917 | 1,769 | (852 | ) | (48 | )% | ||||||||
Impairment of intangible assets | — | 461 | (461 | ) | (100 | )% | ||||||||
Corporate interest expense | 2,004 | 962 | 1,042 | 108 | % | |||||||||
Expenses - Consolidated Entities | 708 | 8,565 | (7,857 | ) | (92 | )% | ||||||||
Interest expense - Consolidated Entities | 11,830 | 1,587 | 10,243 | 645 | % | |||||||||
Total expenses | 35,098 | 27,348 | 7,750 | 28 | % | |||||||||
Other Gain (Loss) | ||||||||||||||
Net gain (loss) on investments | 12,321 | (2,615 | ) | 14,936 | (571 | )% | ||||||||
Net gain (loss) on contingent liabilities | (237 | ) | (502 | ) | 265 | (53 | )% | |||||||
Net gain (loss) on investments - Consolidated Entities | 28,954 | (4,642 | ) | 33,596 | (724 | )% | ||||||||
Net gain (loss) on liabilities - Consolidated Entities | (29,888 | ) | 11,178 | (41,066 | ) | (367 | )% | |||||||
Net gain (loss) on other investments and derivatives - Consolidated Entities | — | 1,228 | (1,228 | ) | (100 | )% | ||||||||
Net other gain (loss) | 11,150 | 4,647 | 6,503 | 140 | % | |||||||||
Income (loss) before income taxes | 16,759 | 1,811 | 14,948 | 825 | % | |||||||||
Income tax (expense) benefit | 1,267 | (526 | ) | 1,793 | (341 | )% | ||||||||
Net income (loss) | 18,026 | 1,285 | 16,741 | 1,303 | % | |||||||||
Net (income) loss attributable to noncontrolling interests in Consolidated Entities | (355 | ) | 184 | (539 | ) | (293 | )% | |||||||
Net income (loss) attributable to CIFC LLC | $ | 17,671 | $ | 1,469 | $ | 16,202 | 1,103 | % | ||||||
Earnings (loss) per share (1): | ||||||||||||||
Basic | $ | 0.75 | $ | 0.06 | $ | 0.69 | 1,150 | % | ||||||
Diluted | $ | 0.67 | $ | 0.06 | $ | 0.61 | 1,017 | % | ||||||
Weighted-average number of shares outstanding (1): | ||||||||||||||
Basic | 23,620,492 | 25,367,832 | (1,747,340 | ) | (7 | )% | ||||||||
Diluted | 26,200,942 | 26,464,883 | (263,941 | ) | (1 | )% | ||||||||
Explanatory Note:
_________________________________
(1) | Weighted-average number of shares outstanding basic and diluted includes the Dissenting Shares from January 1, 2016 to April 28, 2016 ("Part 1. Item 1. Condensed Consolidated Financial Statements and Notes (Unaudited)—(Note 10)". |
Total Net Revenues—GAAP net revenues include management and incentive fees from unconsolidated CLOs, CDOs and Non-CLO products and net investment income from investments in unconsolidated entities.
40
Management and incentive fees—Quarter over quarter, senior and subordinated management fees were lower as a result of declining CLO AUM on Legacy CLOs. Legacy CLOs have passed their reinvestment periods and continued to run-off. Further, we did not issue any new CLOs during the first nine months of the year due to market conditions and the Strategic Transaction process.
Incentive fees were lower during the third quarter of 2016 primarily related to the timing of CLOs being called.
These decreases were partially offset by higher fees from non-CLO products as we continued to raise AUM.
Interest income - Consolidated Entities—See Net results of Consolidated Entities below.
Total Expenses
Employee compensation and benefits—Quarter over quarter, the Company accrued higher employee incentive based compensation costs as a result of better performance in 2016 compared to 2015.
Professional services—On August 19, 2016, the Company announced the Strategic Transaction with F.A.B. Holdings I LP resulting in a significant increase in fees paid to lawyers and investment bankers. In addition, we incurred higher tax preparation fees as the Reorganization Transaction increased our tax compliance and filing requirements.
Depreciation and amortization—In 2016, we had lower amortization expense from intangible assets as certain management contracts were either impaired or fully amortized in the prior year.
Corporate Interest Expense—The current year increases in corporate interest expense is related to the issuance of $40.0 million in aggregate principal amount of 8.5% unsecured senior notes in November 2015.
Consolidated Entities - Expenses—See Net results of Consolidated Entities below.
Consolidated Entities - Interest Expense—See Net results of Consolidated Entities below.
Net other income (expense) and gain (loss)
Net gain (loss) on investments—Net gain (loss) on investments includes the unrealized appreciation or depreciation and realized gains and losses on the investments in CLOs, warehouses and credit funds which we are not required to consolidate. The increase primarily relates to higher income as the Company held more investments period over period and the increase in market value of loans and CLO securities were higher period over period.
Consolidated Entities - Net gain (loss) on investments—See Net results of Consolidated Entities below.
Consolidated Entities - Net gain (loss) on liabilities—See Net results of Consolidated Entities below.
Consolidated Entities - Net gain (loss) on other investments and derivatives—See Net results of Consolidated Entities below.
Income tax expense/benefit—As a result of the Reorganization Transaction, investment income earned by us is not subject to tax at the entity level. The difference between the statutory tax rate and the effective tax rate, as well as the change in the effective tax rate compared to the prior year, was primarily attributable to the Reorganization Transaction and to income (loss) from non-controlling interests of Consolidated VIEs. The income (loss) from non-controlling interests of Consolidated VIEs is included in book income (loss) before income taxes but is not taxable income (loss) to us.
Net results of Consolidated Entities—During the three months ended September 30, 2016, the Company consolidated 3 CLOs and 2 credit funds. During the three months ended September 30, 2015, the Company consolidated 2 CLOs and 2 credit funds.
As such, revenues and expenses in the current period include the operating results of one additional Consolidated Entity.
41
The following table presents our comparative Consolidated Statements of Operations for the nine months ended September 30, 2016 and 2015:
For the Nine Months Ended September 30, | 2016 vs. 2015 | |||||||||||||
2016 | 2015 | Change | % | |||||||||||
(In thousands, except share and per share amounts) | ||||||||||||||
Revenues | ||||||||||||||
Management and incentive fees | $ | 55,701 | $ | 61,466 | $ | (5,765 | ) | (9 | )% | |||||
Interest income from investments | 3,394 | 5,949 | (2,555 | ) | (43 | )% | ||||||||
Interest income - Consolidated Entities | 68,598 | 9,934 | 58,664 | 591 | % | |||||||||
Total net revenues | 127,693 | 77,349 | 50,344 | 65 | % | |||||||||
Expenses | ||||||||||||||
Employee compensation and benefits | 29,449 | 23,547 | 5,902 | 25 | % | |||||||||
Share-based compensation | 5,630 | 3,834 | 1,796 | 47 | % | |||||||||
Professional services | 8,985 | 6,634 | 2,351 | 35 | % | |||||||||
General and administrative expenses | 7,494 | 7,226 | 268 | 4 | % | |||||||||
Depreciation and amortization | 3,295 | 6,259 | (2,964 | ) | (47 | )% | ||||||||
Impairment of intangible assets | 531 | 1,203 | (672 | ) | (56 | )% | ||||||||
Corporate interest expense | 5,960 | 2,256 | 3,704 | 164 | % | |||||||||
Expenses - Consolidated Entities | 1,705 | 10,268 | (8,563 | ) | (83 | )% | ||||||||
Interest expense - Consolidated Entities | 31,852 | 3,254 | 28,598 | 879 | % | |||||||||
Total expenses | 94,901 | 64,481 | 30,420 | 47 | % | |||||||||
Other Gain (Loss) | ||||||||||||||
Net gain (loss) on investments | 16,455 | 45 | 16,410 | 36,467 | % | |||||||||
Net gain (loss) on contingent liabilities | (451 | ) | (1,792 | ) | 1,341 | (75 | )% | |||||||
Net gain (loss) on investments - Consolidated Entities | 55,657 | (529 | ) | 56,186 | (10,621 | )% | ||||||||
Net gain (loss) on liabilities - Consolidated Entities | (61,135 | ) | 8,512 | (69,647 | ) | (818 | )% | |||||||
Net gain (loss) on other investments and derivatives - Consolidated Entities | — | 2,970 | (2,970 | ) | (100 | )% | ||||||||
Net other gain (loss) | 10,526 | 9,206 | 1,320 | 14 | % | |||||||||
Income (loss) before income taxes | 43,318 | 22,074 | 21,244 | 96 | % | |||||||||
Income tax (expense) benefit | (2,879 | ) | (13,441 | ) | 10,562 | (79 | )% | |||||||
Net income (loss) | 40,439 | 8,633 | 31,806 | 368 | % | |||||||||
Net (income) loss attributable to noncontrolling interests in Consolidated Entities | (679 | ) | (633 | ) | (46 | ) | 7 | % | ||||||
Net income (loss) attributable to CIFC LLC | $ | 39,760 | $ | 8,000 | $ | 31,760 | 397 | % | ||||||
Earnings (loss) per share (1): | ||||||||||||||
Basic | $ | 1.63 | $ | 0.32 | $ | 1.31 | 409 | % | ||||||
Diluted | $ | 1.52 | $ | 0.30 | $ | 1.22 | 407 | % | ||||||
Weighted-average number of shares outstanding (1): | ||||||||||||||
Basic | 24,354,474 | 25,316,796 | (962,322 | ) | (4 | )% | ||||||||
Diluted | 26,087,936 | 26,493,549 | (405,613 | ) | (2 | )% | ||||||||
Explanatory Note:
_________________________________
(1) | Earnings per share basic and diluted includes the Dissenting Shares from January 1, 2016 to April 28, 2016 ("Part 1. Item 1. Condensed Consolidated Financial Statements and Notes (Unaudited)—(Note 10)". |
Total Net Revenues—GAAP net revenues include management and incentive fees from unconsolidated CLOs, CDOs and Non-CLO products and net investment income from investments in unconsolidated entities.
Management and incentive fees—Year over year, senior and subordinated management fees decreased due to the following: (i) during the first half of 2016, we consolidated 2 additional CLOs compared to the same period in the prior year reducing our management fees and (ii) we managed lower CLO AUM as we did not issue any new CLOs during the first nine months of the year due to market conditions and the Strategic Transaction process to offset the run-off in certain Legacy CLOs.
These decreases were slightly offset by (i) higher incentive fees related to the timing of CLOs being called and (ii) increase in management fees from non-CLO products, primarily related to new Funds launched since the fourth quarter of 2015, as well as increases in AUM of existing Funds.
42
Interest income from investments—During the nine months ended September 30, 2016, the Company consolidated 4 CLOs (of which 1 was deconsolidated as of June 30, 2016) and 2 credit funds. As a result of consolidation, interest income from investments excluded $8.0 million from the Consolidated Entities.
During the nine months ended September 30, 2015, the Company consolidated 2 CLOs and 2 credit funds. The Consolidated Entities did not have any interest income from investments that was excluded due to the consolidation.
Interest income - Consolidated Entities—See Net results of Consolidated Entities below.
Total Expenses
Employee compensation and benefits—Year over year, the Company accrued higher employee incentive based compensation costs as a result of better performance in 2016 compared to 2015. In addition, we have contractual fee sharing arrangements that required the Company to pay certain former employees a portion of incentive fees collected on CLOs acquired from Columbus Nova Credit Investments Management, LLC ("CNCIM"). During the nine months of 2016, we received higher incentive fees on such CLOs and paid related compensation.
Share based compensation—During the nine months ended September 30, 2016, we expensed nine months of amortization on RSUs granted since the third quarter of 2015 partially offset by the reduction of RSU and option amortization expense from awards that have fully vested since the third quarter of 2015.
Professional Services—On August 19, 2016, the Company announced the Strategic Transaction with an affiliate of F.A.B. Holdings I LP resulting in a significant increase in fees to lawyers and investment bankers. In addition, we incurred higher (i) tax preparation fees as the Reorganization Transaction increased our tax compliance and filing requirements, (ii) consulting fees from new fund raising initiatives and (iii) fund setup costs.
Depreciation and amortization—In 2016, we had lower amortization expense from intangible assets as certain management contracts were either impaired or fully amortized in the prior year.
Impairment of intangibles—During the nine months ended September 30, 2016 and 2015, we received notice from holders of certain CLOs exercising their right to call those CLOs for redemption. As a result of these calls, we recorded impairment charges of $0.5 million and $1.2 million, respectively, to fully impair intangible assets associated with these management contracts.
Corporate Interest Expense—The current year increases in corporate interest expense are related to (i) the issuance of $40.0 million in aggregate principal amount of 8.5% unsecured senior notes in November 2015 and (ii) the increase in the interest rate on the March Junior Subordinated Notes from an annual rate of 1% to LIBOR plus 2.58% in April 2015.
Consolidated Entities - Expenses—See Net results of Consolidated Entities below.
Consolidated Entities - Interest Expense—See Net results of Consolidated Entities below.
Net other income (expense) and gain (loss)
Net gain (loss) on investment—Net gain (loss) on investment includes the unrealized appreciation or depreciation and realized gains and losses on the investments in CLOs, warehouses and credit funds which we are not required to consolidate. The increase primarily relates to higher income as the Company held more investments period over period and the increase in market value of loans and CLO securities were higher year over year.
Net gain (loss) on contingent liabilities—For management contracts where we are subject to fee sharing arrangements, we record net gains (losses) on the change in the fair value period over period. As these Funds are nearing the end of their reinvestment periods, we will collect incentive fees and pay down our contingent liabilities. Year over year, the fair value of our contingent liabilities have decreased as we are expecting to collect less incentive fees over time.
Consolidated Entities - Net gain (loss) on investments—See Net results of Consolidated Entities below.
Consolidated Entities - Net gain (loss) on liabilities—See Net results of Consolidated Entities below.
Consolidated Entities - Net gain (loss) on other investments and derivatives—See Net results of Consolidated Entities below.
43
Income tax expense/benefit—As a result of the Reorganization Transaction, investment income earned by us is not subject to tax at the entity level. The difference between the statutory tax rate and the effective tax rate, as well as the change in the effective tax rate compared to the prior year, was primarily attributable to the Reorganization Transaction and to income (loss) from non-controlling interests of Consolidated VIEs. The income (loss) from non-controlling interests of Consolidated VIEs is included in book income (loss) before income taxes but is not taxable income (loss) to us.
In addition, during the nine months ended September 30, 2015, we recorded a non-recurring tax expense of approximately $6.3 million attributable to the write-down of deferred tax assets impacted by the New York City law change.
Net results of Consolidated Entities—During the nine months ended September 30, 2016, the Company consolidated 4 CLOs (of which 1 was deconsolidated as of June 30, 2016) and 2 credit funds. During the nine months ended September 30, 2015, the Company consolidated 2 CLOs and 2 credit funds. As such, revenues and expenses in the current year include the operating results of 2 additional Consolidated Entities.
ENI and Deconsolidated Non-GAAP Statements (Non-GAAP Measures)
ENI and ENI EBITDA
ENI and ENI EBITDA are non-GAAP financial measures of performance that management uses in addition to GAAP Net income (loss) attributable to CIFC to measure the performance of our core business (excluding non-core products). We believe ENI and ENI EBITDA are helpful to investors as they reflect the nature and substance of the business, the economic results achieved by management fee revenues from the management of client funds and earnings on our investments.
ENI represents GAAP Net income (loss) attributable to CIFC, prior to the consolidation of Funds (or the "Management Company") as required under Accounting Standard Codification ASC Topic 810, Consolidation, excluding (i) current and deferred income taxes, (ii) merger and acquisition related items, including fee-sharing arrangements, amortization and impairments of intangible assets and gain (loss) on contingent consideration for earn-outs, (iii) non-cash compensation related to profits interests granted by CIFC Parent Holdings LLC in June 2011, (iv) revenues attributable to non-core investment products, (v) advances for fund organizational expenses and (vi) certain other items as detailed.
In addition to the pre-consolidation impact, the following adjustments were made to arrive at ENI Revenues and ENI Expenses (Refer to Summary of Reconciliation of GAAP to Net Income (loss) attributable to CIFC to Non-GAAP Measures for more detail):
• | ENI Revenues represent GAAP revenues excluding management fee sharing arrangements and fees attributable to non-core investment products. Further GAAP net (gain)/loss on contingent liabilities and other have been reclassed to ENI Revenues. |
• | ENI Expenses represent GAAP expenses excluding amortization and impairment of intangibles, employee compensation costs from non-cash compensation related to profits interests granted by CIFC Parent Holdings LLC in June 2011, other (such as advances for fund organizational expenses and certain other items as detailed), and current and deferred income taxes. |
Further ENI EBITDA represents ENI before corporate interest expense and depreciation of fixed assets, a non-cash item.
ENI and ENI EBITDA may not be comparable to similar measures presented by other companies, as they are non-GAAP financial measures that are not based on a comprehensive set of accounting rules or principles and therefore may be defined differently by other companies. In addition, ENI and ENI EBITDA should be considered as an addition to, not as a substitute for, or superior to, financial measures determined in accordance with GAAP.
44
The following table presents our components of ENI for the three and nine months ended September 30, 2016 and 2015 (1):
For the Three Months Ended September 30, | 2016 vs. 2015 | For the Nine Months Ended September 30, | 2016 vs. 2015 | ||||||||||||||||||||||||||
2016 | 2015 | Change | % Change | 2016 | 2015 | Change | % Change | ||||||||||||||||||||||
(In thousands, except per share amounts) | (In thousands, except per share amounts) | ||||||||||||||||||||||||||||
ENI revenues | |||||||||||||||||||||||||||||
Management Fees from CLOs | 13,033 | 14,407 | (1,374 | ) | (10 | )% | 40,711 | 43,347 | (2,636 | ) | (6 | )% | |||||||||||||||||
Management Fees from Non-CLO products | 1,770 | 1,069 | 701 | 66 | % | 4,440 | 2,907 | 1,533 | 53 | % | |||||||||||||||||||
Total Management Fees | 14,803 | 15,476 | (673 | ) | (4 | )% | 45,151 | 46,254 | (1,103 | ) | (2 | )% | |||||||||||||||||
Incentive Fees | 1,964 | 3,101 | (1,137 | ) | (37 | )% | 14,108 | 11,167 | 2,941 | 26 | % | ||||||||||||||||||
Investment Income (2) | |||||||||||||||||||||||||||||
Interest income | 8,736 | 4,391 | 4,345 | 99 | % | 20,193 | 9,981 | 10,212 | 102 | % | |||||||||||||||||||
Realized gains (losses) | 1,629 | 1,521 | 108 | 7 | % | (3,585 | ) | 5,296 | (8,881 | ) | (168 | )% | |||||||||||||||||
Unrealized gains (losses) | 11,709 | (5,854 | ) | 17,563 | (300 | )% | 25,650 | (3,369 | ) | 29,019 | (861 | )% | |||||||||||||||||
Net investment income | 22,074 | 58 | 22,016 | 37,959 | % | 42,258 | 11,908 | 30,350 | 255 | % | |||||||||||||||||||
Total ENI revenues | 38,841 | 18,635 | 20,206 | 108 | % | 101,517 | 69,329 | 32,188 | 46 | % | |||||||||||||||||||
ENI expenses | |||||||||||||||||||||||||||||
Employee compensation and benefits | 10,472 | 7,309 | 3,163 | 43 | % | 27,965 | 22,780 | 5,185 | 23 | % | |||||||||||||||||||
Share-based compensation | 1,498 | 1,146 | 352 | 31 | % | 5,642 | 3,775 | 1,867 | 49 | % | |||||||||||||||||||
Other operating expenses | 5,049 | 4,743 | 306 | 6 | % | 14,487 | 13,441 | 1,046 | 8 | % | |||||||||||||||||||
Corporate interest expense | 2,004 | 962 | 1,042 | 108 | % | 5,960 | 2,256 | 3,704 | 164 | % | |||||||||||||||||||
Total ENI expenses | 19,023 | 14,160 | 4,863 | 34 | % | 54,054 | 42,252 | 11,802 | 28 | % | |||||||||||||||||||
ENI | $ | 19,818 | $ | 4,475 | $ | 15,343 | 343 | % | $ | 47,463 | $ | 27,077 | $ | 20,386 | 75 | % | |||||||||||||
ENI per share - basic (3) | $ | 0.84 | $ | 0.18 | $ | 0.66 | 367 | % | $ | 1.95 | $ | 1.07 | $ | 0.88 | 82 | % | |||||||||||||
ENI per share - diluted (3) | $ | 0.76 | $ | 0.17 | $ | 0.59 | 347 | % | $ | 1.82 | $ | 1.02 | $ | 0.80 | 78 | % | |||||||||||||
Explanatory Notes:
______________________________
(1) | Further below is a detailed description of these non-GAAP measures and reconciliations from GAAP net income (loss) attributable to the Company to non-GAAP measures. |
(2) | For ENI purposes, we use the historical cost basis on all of our CLO and equity investments in determining the application of the effective interest method on all distributions received. |
(3) | GAAP weighted average shares outstanding is used to calculate ENI per share - basic and diluted. Earnings per share basic and diluted has been calculated assuming that the Dissenting Shares were outstanding from January 1, 2016 to April 28, 2016 (Note 10). Excluding the Dissenting Shares as of January 1, 2016 (Reorganization Transaction), total weighted average shares basic and diluted for the for the nine months ended September 30, 2016, would be 23,474,432 and 25,207,793, respectively, and earnings per share basic and diluted would be $2.02 and $1.88, respectively ("Part 1. Item 1. Condensed Consolidated Financial Statements and Notes (Unaudited)"—Note 10). |
For the three months ended September 30, 2016 and 2015:
ENI revenues—Quarter over quarter net investment income increased by $22.0 million, as the Company held more investments and the market value of loans and CLO securities was higher period over period. These increases were offset by decreases in (i) management fees by $0.7 million, or 4%, primarily related to declining AUM of CLOs which passed their reinvestment periods and (ii) incentive fees by $1.1 million, or 37%, primarily related to period over period timing of CLOs being called.
ENI expenses—Total ENI expenses increased by $4.9 million, or 34%, primarily due to increases in ENI employee compensation and benefits and ENI corporate interest expense.
ENI employee compensation and benefits—Quarter over quarter, the Company accrued higher employee incentive based compensation costs as a result of better performance in 2016 compared to 2015.
ENI corporate interest expense—Current year increases in ENI corporate interest expense is related to the issuance of $40.0 million in aggregate principal amount of 8.5% unsecured senior notes in November of 2015.
45
For the nine months ended September 30, 2016 and 2015:
ENI revenues—Year over year net investment income increased by $30.4 million, or 255% as the Company held more investments and the market value of loans and CLO securities was higher year over year. In addition, (i) incentive fees increased by $2.9 million, or 26%, primarily related to the timing of CLOs being called and (ii) management fees from non-CLO products increased by $1.5 million, or 53%, primarily related to new Funds launched since the fourth quarter of 2015 and increased AUM of existing Funds. Slightly offsetting these increases were decreases in senior and subordinated management fees of $2.6 million, or 6%. We managed lower CLO AUM as a result not issuing any new CLOs during the first nine months of the year due to market conditions and the Strategic Transaction to offset the run-off in certain Legacy CLOs.
ENI expenses—Total ENI expenses increased by $11.8 million, or 28%, primarily due to increases in ENI employee compensation and benefits, ENI corporate interest expense, ENI share-based compensation and ENI other operating expenses.
ENI employee compensation and benefits—Year over year, the Company accrued higher employee incentive based compensation costs as a result of better performance in 2016 compared to 2015.
ENI corporate interest expense—Current year increases in ENI corporate interest expense is related to (i) the issuance of $40.0 million in aggregate principal amount of 8.5% unsecured senior notes in November of 2015 and (ii) the increase in the interest rate on the March Junior Subordinated Notes from an annual rate of 1% to three-month LIBOR plus 2.58% in April 2015.
ENI share based compensation—Total ENI share based compensation increased in the current year as we recognized a full nine months of amortization on equity awards granted since the fourth quarter of 2015 partially offset by the reduction of RSU and option amortization expense from awards that have fully vested since the fourth quarter of 2015.
ENI other operating expenses—Year over year, we incurred higher (i) tax preparation fees as the Reorganization Transaction increased our tax compliance filing requirements, (ii) consulting fees from new fund raising initiatives and (iii) fund setup costs.
The following is a reconciliation of GAAP Net income (loss) attributable to CIFC LLC to ENI:
For the Three Months Ended September 30, | For the Nine Months Ended September 30, | |||||||||||||||
2016 | 2015 | 2016 | 2015 | |||||||||||||
(In thousands) | ||||||||||||||||
GAAP Net income (loss) attributable to CIFC LLC | $ | 17,671 | $ | 1,469 | $ | 39,760 | $ | 8,000 | ||||||||
Reconciling and other items: | ||||||||||||||||
Income tax expense (benefit) - deferred & current (1) | (1,267 | ) | 526 | 2,879 | 13,441 | |||||||||||
Amortization and impairment of intangibles | 540 | 1,884 | 2,715 | 6,433 | ||||||||||||
Management fee sharing arrangements (2) | (223 | ) | (898 | ) | (2,537 | ) | (4,364 | ) | ||||||||
Net (gain)/loss on contingent liabilities and other | 237 | 502 | 452 | 1,792 | ||||||||||||
Employee compensation costs (3) | 6 | 224 | 1,472 | 827 | ||||||||||||
Management fees attributable to non-core funds | (127 | ) | (163 | ) | (372 | ) | (503 | ) | ||||||||
Other (4) | 2,981 | 931 | 3,094 | 1,451 | ||||||||||||
Total reconciling and other items | 2,147 | 3,006 | 7,703 | 19,077 | ||||||||||||
ENI | 19,818 | 4,475 | 47,463 | 27,077 | ||||||||||||
Add: Corporate interest expense | 2,004 | 962 | 5,960 | 2,256 | ||||||||||||
Add: Depreciation of fixed assets | 377 | 347 | 1,111 | 1,029 | ||||||||||||
ENI EBITDA | $ | 22,199 | $ | 5,784 | $ | 54,534 | $ | 30,362 | ||||||||
Explanatory Notes:
______________________________
(1) | Includes current taxes of $(1.4) million and $(0.1) million for the three and nine months ended September 30, 2016 respectively, and $0.7 million and $6.1 million for the three and nine months ended September 30, 2015, respectively, and deferred taxes of $0.2 million and $3.0 million for the three and nine months ended September 30, 2016, respectively, and $(0.1) million and $7.3 million for the three and nine months ended September 30, 2015, respectively. |
(2) | We share management fees on certain of the acquired CLOs we manage with the party that sold the funds to CIFC, or an affiliate thereof. Management fees are presented on a gross basis for GAAP and on a net basis for ENI. |
(3) | Employee compensation and benefits has been adjusted for sharing of incentive fees with certain former employees in connection with our acquisition of certain CLOs from CNCIM and non-cash compensation related to profits interests granted to CIFC employees by CIFC Parent. |
(4) | In 2016, Other primarily represents professional services and general and administrative fees incurred in relation to the Strategic Transaction. In 2015, Other primarily represents professional services in relation to the Reorganization Transaction and litigation expenses. |
46
The Condensed Consolidated Financial Statements include the financial statements of CIFC LLC & Subsidiaries, or the Company’s core asset management business ("Management Company") and certain managed Funds ("Consolidated Entities"). The supplemental financial information provided below illustrates the consolidating effects of the Management Company, and the Consolidated Entities which we are required to consolidate under ASC 810. Further, management internally views and manages the business as one reportable segment.
For the Three Months Ended September 30, 2016 | For the Three Months Ended September 30, 2015 | |||||||||||||||||||||||||||||||
(In thousands) | Management Company | Consolidated Entities | Eliminations | CIFC LLC Consolidated | Management Company | Consolidated Entities | Eliminations | CIFC LLC Consolidated | ||||||||||||||||||||||||
Revenues | ||||||||||||||||||||||||||||||||
Management and incentive fees | $ | 17,120 | $ | — | $ | (2,511 | ) | $ | 14,609 | $ | 19,634 | $ | — | $ | (380 | ) | $ | 19,254 | ||||||||||||||
Net interest income from investments | 4,573 | — | (3,274 | ) | 1,299 | 3,219 | — | (2,104 | ) | 1,115 | ||||||||||||||||||||||
Interest income - Consolidated Entities | — | 24,799 | — | 24,799 | — | 4,143 | — | 4,143 | ||||||||||||||||||||||||
Total net revenues | 21,693 | 24,799 | (5,785 | ) | 40,707 | 22,853 | 4,143 | (2,484 | ) | 24,512 | ||||||||||||||||||||||
Expenses | ||||||||||||||||||||||||||||||||
Employee compensation and benefits | 10,472 | — | — | 10,472 | 7,513 | — | — | 7,513 | ||||||||||||||||||||||||
Share-based compensation | 1,505 | — | — | 1,505 | 1,166 | — | — | 1,166 | ||||||||||||||||||||||||
Other operating expenses | 8,579 | — | — | 8,579 | 7,555 | — | — | 7,555 | ||||||||||||||||||||||||
Corporate interest expense | 2,004 | — | — | 2,004 | 962 | — | — | 962 | ||||||||||||||||||||||||
Expenses - Consolidated Entities | — | 15,046 | (2,508 | ) | 12,538 | — | 10,553 | (401 | ) | 10,152 | ||||||||||||||||||||||
Total expenses | 22,560 | 15,046 | (2,508 | ) | 35,098 | 17,196 | 10,553 | (401 | ) | 27,348 | ||||||||||||||||||||||
Other Gain (Loss) | ||||||||||||||||||||||||||||||||
Net gain (loss) on investments | 17,508 | — | (5,187 | ) | 12,321 | (3,160 | ) | — | 545 | (2,615 | ) | |||||||||||||||||||||
Net gain (loss) on contingent liabilities | (237 | ) | — | — | (237 | ) | (502 | ) | — | — | (502 | ) | ||||||||||||||||||||
Net gain (loss) - Consolidated Entities | — | (7,738 | ) | 6,804 | (934 | ) | — | 6,158 | 1,606 | 7,764 | ||||||||||||||||||||||
Net other gain (loss) | 17,271 | (7,738 | ) | 1,617 | 11,150 | (3,662 | ) | 6,158 | 2,151 | 4,647 | ||||||||||||||||||||||
Income (loss) before income taxes | 16,404 | 2,015 | (1,660 | ) | 16,759 | 1,995 | (252 | ) | 68 | 1,811 | ||||||||||||||||||||||
Income tax (expense) benefit | 1,267 | — | — | 1,267 | (526 | ) | — | — | (526 | ) | ||||||||||||||||||||||
Net income (loss) | 17,671 | 2,015 | (1,660 | ) | 18,026 | 1,469 | (252 | ) | 68 | 1,285 | ||||||||||||||||||||||
Net (income) loss attributable to noncontrolling interest in Consolidated Entities | — | (2,015 | ) | 1,660 | (355 | ) | — | 252 | (68 | ) | 184 | |||||||||||||||||||||
Net income (loss) attributable to CIFC LLC | $ | 17,671 | $ | — | $ | — | $ | 17,671 | $ | 1,469 | $ | — | $ | — | $ | 1,469 | ||||||||||||||||
47
For the Nine Months Ended September 30, 2016 | For the Nine Months Ended September 30, 2015 | |||||||||||||||||||||||||||||||||||
(In thousands) | Management Company | Consolidated Entities | Eliminations | CIFC LLC Consolidated | Management Company | Consolidated Entities | Eliminations | CIFC LLC Consolidated | ||||||||||||||||||||||||||||
Revenues | ||||||||||||||||||||||||||||||||||||
Management and incentive fees | $ | 62,171 | $ | — | $ | (6,470 | ) | $ | 55,701 | $ | 62,284 | $ | — | $ | (818 | ) | $ | 61,466 | ||||||||||||||||||
Net interest income from investments | 11,348 | — | (7,954 | ) | 3,394 | 8,058 | — | (2,109 | ) | 5,949 | ||||||||||||||||||||||||||
Interest income - Consolidated Entities | — | 68,598 | — | 68,598 | — | 9,934 | — | 9,934 | ||||||||||||||||||||||||||||
Total net revenues | 73,519 | 68,598 | (14,424 | ) | 127,693 | 70,342 | 9,934 | (2,927 | ) | 77,349 | ||||||||||||||||||||||||||
Expenses | ||||||||||||||||||||||||||||||||||||
Employee compensation and benefits | 29,449 | — | — | 29,449 | 23,547 | — | — | 23,547 | ||||||||||||||||||||||||||||
Share-based compensation | 5,630 | — | — | 5,630 | 3,834 | — | — | 3,834 | ||||||||||||||||||||||||||||
Other operating expenses | 20,305 | — | — | 20,305 | 21,322 | — | — | 21,322 | ||||||||||||||||||||||||||||
Corporate interest expense | 5,960 | — | — | 5,960 | 2,256 | — | — | 2,256 | ||||||||||||||||||||||||||||
Expenses - Consolidated Entities | — | 40,222 | (6,665 | ) | 33,557 | — | 14,361 | (839 | ) | 13,522 | ||||||||||||||||||||||||||
Total expenses | 61,344 | 40,222 | — | (6,665 | ) | — | 94,901 | 50,959 | 14,361 | (839 | ) | 64,481 | ||||||||||||||||||||||||
Other Gain (Loss) | ||||||||||||||||||||||||||||||||||||
Net gain (loss) on investments | 30,915 | — | (14,460 | ) | 16,455 | 3,850 | — | (3,805 | ) | 45 | ||||||||||||||||||||||||||
Net gain (loss) on contingent liabilities | (451 | ) | — | — | (451 | ) | (1,792 | ) | — | — | (1,792 | ) | ||||||||||||||||||||||||
Net gain (loss) - Consolidated Entities | — | (24,234 | ) | 18,756 | (5,478 | ) | — | 7,088 | 3,865 | 10,953 | ||||||||||||||||||||||||||
Net other gain (loss) | 30,464 | (24,234 | ) | — | 4,296 | — | 10,526 | 2,058 | 7,088 | 60 | 9,206 | |||||||||||||||||||||||||
Income (loss) before income taxes | 42,639 | 4,142 | — | (3,463 | ) | — | 43,318 | 21,441 | 2,661 | — | (2,028 | ) | — | 22,074 | ||||||||||||||||||||||
Income tax (expense) benefit | (2,879 | ) | — | — | (2,879 | ) | (13,441 | ) | — | — | (13,441 | ) | ||||||||||||||||||||||||
Net income (loss) | 39,760 | 4,142 | (3,463 | ) | 40,439 | 8,000 | 2,661 | — | (2,028 | ) | — | 8,633 | ||||||||||||||||||||||||
Net (income) loss attributable to noncontrolling interest in Consolidated Entities | — | (4,142 | ) | 3,463 | (679 | ) | — | (1,289 | ) | 656 | (633 | ) | ||||||||||||||||||||||||
Net income (loss) attributable to CIFC LLC | $ | 39,760 | $ | — | $ | — | $ | 39,760 | $ | 8,000 | $ | 1,372 | $ | (1,372 | ) | $ | 8,000 | |||||||||||||||||||
48
September 30, 2016 | December 31, 2015 | |||||||||||||||||||||||||||||||||
($ in thousands) | Management Company | Consolidated Entities | Eliminations | CIFC LLC Consolidated | Management Company | Consolidated Entities | Eliminations | CIFC LLC Consolidated | ||||||||||||||||||||||||||
ASSETS | ||||||||||||||||||||||||||||||||||
Cash and cash equivalents | $ | 38,843 | $ | — | $ | — | $ | 38,843 | $ | 57,968 | $ | — | $ | — | $ | 57,968 | ||||||||||||||||||
Restricted cash and cash equivalents | 1,694 | — | — | 1,694 | 1,694 | — | — | 1,694 | ||||||||||||||||||||||||||
Investments | 211,474 | — | (99,568 | ) | 111,906 | 152,455 | — | (81,759 | ) | 70,696 | ||||||||||||||||||||||||
Receivables | 11,788 | — | (415 | ) | 11,373 | 7,672 | — | (597 | ) | 7,075 | ||||||||||||||||||||||||
Other Assets | 126,451 | — | — | 126,451 | 134,121 | — | — | 134,121 | ||||||||||||||||||||||||||
Subtotal | 390,250 | — | (99,983 | ) | 290,267 | 353,910 | — | (82,356 | ) | 271,554 | ||||||||||||||||||||||||
Total assets of Consolidated Entities | — | 1,992,204 | — | 1,992,204 | — | 1,475,649 | — | 1,475,649 | ||||||||||||||||||||||||||
TOTAL ASSETS | $ | 390,250 | $ | 1,992,204 | $ | (99,983 | ) | $ | 2,282,471 | $ | 353,910 | $ | 1,475,649 | $ | (82,356 | ) | $ | 1,747,203 | ||||||||||||||||
LIABILITIES | ||||||||||||||||||||||||||||||||||
Long-term debt | $ | 156,234 | $ | — | $ | — | $ | 156,234 | $ | 156,161 | $ | — | $ | — | $ | 156,161 | ||||||||||||||||||
Other liabilities | 45,632 | — | — | 45,632 | 26,796 | — | — | 26,796 | ||||||||||||||||||||||||||
Subtotal | 201,866 | — | — | 201,866 | 182,957 | — | — | — | — | 182,957 | ||||||||||||||||||||||||
Total Non-Recourse Liabilities of Consolidated Entities | — | 1,947,077 | (63,301 | ) | 1,883,776 | — | 1,434,586 | (49,142 | ) | 1,385,444 | ||||||||||||||||||||||||
TOTAL LIABILITIES | 201,866 | 1,947,077 | (63,301 | ) | 2,085,642 | 182,957 | 1,434,586 | (49,142 | ) | 1,568,401 | ||||||||||||||||||||||||
EQUITY | ||||||||||||||||||||||||||||||||||
TOTAL CIFC LLC SHAREHOLDERS’ EQUITY | 188,384 | — | — | 188,384 | 170,953 | — | — | 170,953 | ||||||||||||||||||||||||||
Noncontrolling interest in Consolidated Funds | — | 45,127 | (36,682 | ) | 8,445 | — | 41,063 | (33,214 | ) | 7,849 | ||||||||||||||||||||||||
TOTAL EQUITY | 188,384 | 45,127 | (36,682 | ) | 196,829 | 170,953 | 41,063 | (33,214 | ) | 178,802 | ||||||||||||||||||||||||
TOTAL LIABILITIES AND EQUITY | $ | 390,250 | $ | 1,992,204 | $ | (99,983 | ) | $ | 2,282,471 | $ | 353,910 | 1,475,649 | $ | (82,356 | ) | $ | 1,747,203 | |||||||||||||||||
49
Liquidity and Capital Resources
Our Management Company operating cash flows are composed of revenues from management fees, incentive fees and investment income net of compensation expense, general and administrative expense and income taxes. During the nine months ended September 30, 2016, our primary use of cash included $28.4 million of net investments, primarily in warehouses. As of September 30, 2016, we held cash and investments of $250.3 million composed of cash of $38.8 million and investments of $211.5 million with no debt maturing until October 2025.
During the nine months ended September 30, 2016, we also paid down contingent liabilities (related to fee sharing arrangements) of $1.5 million and paid dividends of $16.2 million.
Below are the Management Company cash flows and the effects of the Consolidated Entities for selected cash flow data for the nine months ended September 30, 2016 :
For the Nine Months Ended September 30, 2016 | |||||||||||||||
(In thousands) | Management Company | Consolidated Entities | Eliminations | CIFC LLC Consolidated | |||||||||||
Cash and Cash Equivalents, Beginning | $ | 57,968 | $ | — | $ | — | $ | 57,968 | |||||||
Net cash provided by/(used in) Operating Activities | 27,671 | 32,336 | (7,763 | ) | 52,244 | ||||||||||
Net cash provided by/(used in) Investing Activities | (28,440 | ) | 32,604 | (1,871 | ) | 2,293 | |||||||||
Net cash provided by/(used in) Financing Activities | (18,356 | ) | (64,940 | ) | 9,634 | (73,662 | ) | ||||||||
Net change in Cash and Cash Equivalents | (19,125 | ) | — | — | (19,125 | ) | |||||||||
Cash and Cash Equivalents, End | $ | 38,843 | $ | — | $ | — | $ | 38,843 | |||||||
Our cash and investments as of September 30, 2016 and December 31, 2015 are as follows ($ in thousands)(1):
(In thousands) | September 30, 2016 | December 31, 2015 | Change | % Change | |||||||||||||||||||
Cash and Cash Equivalents | $ | 38,843 | $ | 57,968 | $ | (19,125 | ) | (33 | )% | ||||||||||||||
Investments (1) | |||||||||||||||||||||||
CIFC CLO Equity | $ | 73,473 | $ | 53,912 | 19,561 | 36 | % | ||||||||||||||||
Warehouses | 68,635 | — | 68,635 | 100 | % | ||||||||||||||||||
Fund Coinvestments | 34,837 | 41,401 | (6,564 | ) | (16 | )% | |||||||||||||||||
CLO Debt | 6,232 | 32,140 | (25,908 | ) | (81 | )% | |||||||||||||||||
Other (2) | 28,297 | 24,946 | 3,351 | 13 | % | ||||||||||||||||||
Total Investments | $ | 211,474 | $ | 152,399 | $ | 59,075 | 39 | % | |||||||||||||||
Total Cash and Investments | $ | 250,317 | $ | 210,367 | $ | 39,950 | 19 | % | |||||||||||||||
Long Term Debt (Par) | |||||||||||||||||||||||
Junior Subordinated Notes due 2035 | $ | 120,000 | $ | 120,000 | — | — | % | ||||||||||||||||
Senior Notes due 2025 | 40,000 | 40,000 | — | — | % | ||||||||||||||||||
Total Long Term Debt (Par) | $ | 160,000 | $ | 160,000 | $ | — | — | % | |||||||||||||||
Explanatory Notes:
________________________________
(1) | Pursuant to GAAP, investments in consolidated CLOs, warehouses and certain Non-CLO products are eliminated from "Investments" on our Consolidated Balance Sheets. |
(2) | Primarily includes investment in CIFC's Tactical Income Fund, which may be redeemed with 60 days' notice on the last day of each calendar quarter. |
Other Sources and Uses of Funds
Long-Term Debt— For a table summarizing long-term debt of the Company, see "Part 1. Item 1. Condensed Consolidated Financial Statements and Notes (Unaudited)—Note 9" of the Notes to the Condensed Consolidated Financial Statements.
50
Covenants—Junior Subordinated Notes—The Junior Subordinated Notes contain certain restrictive covenants including a restricted payments covenant that restricts our ability to make distributions in respect of our equity securities, subject to a number of exceptions and conditions. These covenants also limit CIFC Corp.'s ability to make distributions to its related parties, including CIFC LLC.
Covenants—Senior Notes—On November 2, 2015, CIFC Corp. issued $40.0 million in aggregate principal amount of 8.5% unsecured senior notes due October 30, 2025 (the “Senior Notes”) that are guaranteed by CIFC LLC and certain subsidiaries. Under the terms of the related indenture, certain consolidated entities such as consolidated CLOs, Warehouses and Funds ("Investment Vehicles") do not guarantee the notes. Further, the indenture provides that so long as entities holding at least 90% of the Company’s consolidated total assets are guarantors, the Company may designate entities within its corporate structure as non-guarantor entities ("Unrestricted Entities" and together with Investment Vehicles, "Non-Guarantor"). The Senior Notes indenture contains certain restrictive covenants including a restricted payments covenant that restricts the Company's ability to make distributions in respect of our equity securities, subject to a number of exceptions and conditions.
Consolidated VIEs—Although we consolidate all the assets and liabilities of the Consolidated VIEs (including the Consolidated CLOs, warehouses and other investment products), our maximum exposure to loss is limited to our investments and beneficial interests in the Consolidated VIEs and the receivables of management fees from the Consolidated VIEs. All of these items are eliminated upon consolidation. The assets of each of the Consolidated VIEs are administered by the trustee of each fund solely as collateral to satisfy the obligations of the Consolidated VIEs. If we were to liquidate, the assets of the Consolidated VIEs would not be available to our general creditors, and, as a result, we do not consider them our assets. Additionally, the investors in the debt and residual interests of the Consolidated VIEs have no recourse to our general assets. Therefore, this debt is not our obligation.
Related Party Transactions
For a summary of our related party transactions, see "Part 1. Item 1. Condensed Consolidated Financial Statements and Notes (Unaudited)—Note 13" of the Notes to the Condensed Consolidated Financial Statements.
Off-Balance Sheet Arrangements
As of September 30, 2016 and December 31, 2015, we did not maintain any relationships with unconsolidated entities or financial partnerships, such as entities often referred to as structured finance, special purpose or VIEs, established for the purpose of facilitating off-balance sheet arrangements or other contractually narrow or limited purposes. Further, as of September 30, 2016 and 2015, we did not guarantee any obligations of unconsolidated entities, enter into any commitments or express intent to provide additional funding to any such entities.
Critical Accounting Policies and Estimates
The preparation of financial statements in accordance with GAAP requires management to make estimates and judgments in certain circumstances that affect amounts reported as assets, liabilities, revenues and expenses. We have established detailed policies and control procedures intended to ensure that valuation methods, including any judgments made as part of such methods, are well controlled, reviewed and applied consistently from period to period. We base our estimates on corporate and industry experience and various other assumptions that we believe to be appropriate under the circumstances.
A summary of our critical accounting estimates is included in our 2015 Annual Report, in Management's Discussion and Analysis of Financial Condition. There have been no significant changes to our critical accounting estimates as of September 30, 2016.
Recent Accounting Updates
For a discussion of the impact of new accounting pronouncements on our financial condition or results of operations, see "Part 1. Item 1. Condensed Consolidated Financial Statements and Notes (Unaudited)—Note 3" of the Notes to the Condensed Consolidated Financial Statements.
Item 3. Quantitative and Qualitative Disclosures about Market Risk
As a smaller reporting company, we are not required to provide the information required by Item 3.
51
Item 4. Controls and Procedures.
Evaluation of Disclosure Controls and Procedures
Pursuant to Rule 13a-15(b) under the Securities Exchange Act of 1934, as amended (the "Exchange Act"), we carried out an evaluation, with the participation of our management, including our Principal Executive Officers and our Chief Financial Officer, of the effectiveness of our disclosure controls and procedures (as defined under Rule 13a-15(e) under the Exchange Act), as of the end of the period covered by this Quarterly Report. Based upon that evaluation, our Principal Executive Officers and our Chief Financial Officer concluded that our disclosure controls and procedures are effective.
Change in Internal Control Over Financial Reporting
There have been no changes in our internal control over financial reporting as of the end of the reporting period covered by this report that have materially affected, or are reasonably likely to materially affect, our internal control over financial reporting.
Inherent Limitations on Effectiveness of Controls
There are inherent limitations in the effectiveness of any control system, including the potential for human error and the circumvention or overriding of the controls and procedures. Additionally, judgments in decision-making can be faulty and breakdowns can occur because of simple error or mistake. An effective control system can provide only reasonable, not absolute, assurance that the control objectives of the system are adequately met. Accordingly, our management, including our Principal Executive Officers and our Chief Financial Officer do not expect that our control system can prevent or detect all errors or fraud. Finally, projections of any evaluation or assessment of effectiveness of a control system for future periods are subject to the risks that, over time, controls may become inadequate because of changes in an entity's operating environment or deterioration in the degree of compliance with policies or procedures.
52
PART II. Other Information
Item 1. Legal Proceedings
On April 28, 2016, Joseph A. Jolson, as Trustee on behalf of the Joseph A Jolson 1991 Trust, U/A 6/4/91, and Richard A. Jolson (together, the "Petitioners") filed a petition for appraisal (the "Petition") in the Court of Chancery of the State of Delaware against CIFC Corp. in connection with the Reorganization Transaction. The case is captioned Jolson, et al. v. CIFC Corp., Civil Action No. 12275-VCMR. According to the Petition, the Petitioners were the beneficial owners of a total of 2,026,315 shares of CIFC Corp. common stock on the date the Reorganization Transaction was consummated. The Petitioners have demanded and continue to demand an appraisal of their shares and payment of the fair value thereof under Delaware law, together with interest from the date of the Reorganization Transaction, costs and other appropriate relief.
In view of the inherent difficulty of predicting the outcome of such litigation, we cannot predict or reasonably estimate what the eventual outcome of the pending matter described above will be, what the timing of the ultimate resolution of this matter will be, or what any loss or range of loss related to the pending matter may be.
Item 1A. Risk Factors.
There have been no material changes in our risk factors from those disclosed in Part I-Item 1A. Risk Factors of our Annual Report on Form 10-K for the year ended December 31, 2015 and our Quarterly Reports on Form 10-Q for the periods ended March 31, 2016 and June 30, 2016, except as follows:
The announcement and pendency of the proposed Strategic Transaction may adversely affect our business, financial condition and results of operations.
Uncertainty about the effect of the proposed Strategic Transaction on our employees, fund clients and other parties may have an adverse effect on our business, financial condition and results of operation regardless of whether the Strategic Transaction is completed. These risks to our business include the following, all of which could be exacerbated by a delay in the completion of the proposed Strategic Transaction:
• | the impairment of our ability to attract, retain and motivate our employees, including key personnel; |
• | the diversion of significant management time and resources towards the completion of the proposed Strategic Transaction; |
• | difficulties maintaining relationships with fund clients and other business partners; |
• | delays or deferments of certain business decisions by our fund clients and other business partners; |
• | the inability to pursue alternative business opportunities or make appropriate changes to our business because of requirements in the Merger Agreement that we conduct our business in the ordinary course of business consistent with past practice and not engage in certain kinds of transactions prior to the completion of the proposed Strategic Transaction; |
• | litigation relating to the proposed Strategic Transaction and the costs related thereto; and |
• | the incurrence of significant costs, expenses and fees for professional services and other transaction costs in connection with the proposed Strategic Transaction. |
Failure to consummate the proposed Strategic Transaction within the expected timeframe or at all could have a material adverse impact on our business, financial condition and results of operations.
There can be no assurance that the proposed Strategic Transaction will occur. Consummation of the Strategic Transaction is subject to certain conditions, including, among others, (i) approval by our shareholders; (ii) the absence of any law, injunction or similar order prohibiting or making illegal the consummation of the Merger; and (iii) the absence of a material adverse effect on us. There can be no assurance that these and other conditions to closing will be satisfied in a timely manner or at all.
The Merger Agreement also contains certain termination rights for both us and F.A.B. Holdings I LP (the “Parent”), and in certain specified circumstances upon termination of the Merger Agreement we will be required to pay Parent a termination fee of
53
$13,332,000. If we are required to make this payment, doing so may materially adversely affect our business, financial condition and results of operations.
There can be no assurance that a remedy will be available to us in the event of a breach of the Merger Agreement by Parent or its affiliates or that we will wholly or partially recover any damages incurred by us in connection with the Strategic Transaction. A failed transaction may result in negative publicity and a negative impression of us in the investment community. Further, any disruptions to our business resulting from the announcement and pendency of the Strategic Transaction, including any adverse changes in our relationships with our fund clients, partners and employees, could continue or accelerate in the event of a failed transaction. In addition, if the Strategic Transaction is not completed, and there are no other parties willing and able to acquire the Company at a price of $11.36 per share or higher, on terms acceptable to us, the share price of our common shares will likely decline to the extent that the current market price of our common shares reflects an assumption that the Strategic Transaction will be completed. Also, we have incurred, and will continue to incur, significant costs, expenses and fees for professional services and other transaction costs in connection with the proposed Strategic Transaction, for which we will have received little or no benefit if the Strategic Transaction is not completed. Many of these fees and costs will be payable by us even if the Strategic Transaction is not completed and may relate to activities that we would not have undertaken other than to complete the Strategic Transaction.
Item 2. Unregistered Sales of Equity Securities and Use of Proceeds
None.
Item 3. Defaults upon Senior Securities
None.
Item 4. Mine Safety Disclosures
None.
Item 5. Other Information.
None.
54
Item 6. Exhibits
Ex. No. | Description of Exhibit | |
2.1 | Agreement and Plan of Merger, dated as of August 19, 2016, by and among CIFC LLC, F.A.B. Holdings I LP and CIFC Acquisition, LLC (incorporated by reference to the Company's Current Report on Form 8-K filed with the SEC on August 19, 2016). | |
31.1 | Certification of Principal Executive Officer Pursuant to Rule 13a-14(a) under the Securities Exchange Act of 1934, as adopted pursuant to Section 302 of the Sarbanes-Oxley Act of 2002.* | |
31.2 | Certification of Principal Financial Officer Pursuant to Rule 13a-14(a) under the Securities Exchange Act of 1934, as adopted pursuant to Section 302 of the Sarbanes-Oxley Act of 2002.* | |
32.1 | Certification of Principal Executive Officer and Principal Financial Officer pursuant to 18 U.S.C. Section 1350, as adopted pursuant to Section 906 of the Sarbanes-Oxley Act of 2002.** | |
101.0 | Financial statements from the Company's Quarterly Report on Form 10-Q for the period ended September 30, 2016, formatted in XBRL: (i) the Condensed Consolidated Balance Sheets (unaudited); (ii) the Condensed Consolidated Statements of Operations (unaudited); (iii) the Condensed Consolidated Statements of Comprehensive Income (Loss) (unaudited); (iv) the Condensed Consolidated Statements of Equity (unaudited); (v) the Condensed Consolidated Statements of Cash Flows (unaudited); and (vi) the Notes to Condensed Consolidated Financial Statements (unaudited) furnished herewith. | |
Explanatory Notes:
_________________________________________________________________________
* | Filed herewith. |
** | Furnished herewith. |
55
SIGNATURES
Pursuant to the requirements of the Securities Exchange Act of 1934, the registrant has duly caused this report to be signed on its behalf by the undersigned thereunto duly authorized.
CIFC LLC | |||
(Registrant) | |||
Date: | November 9, 2016 | By: | /s/ STEPHEN J. VACCARO |
Stephen J. Vaccaro, Co-President | |||
(Principal Executive Officer) | |||
Date: | November 9, 2016 | By: | /s/ OLIVER E. WRIEDT |
Oliver E. Wriedt, Co-President | |||
(Principal Executive Officer) | |||
Date: | November 9, 2016 | By: | /s/ RAHUL N. AGARWAL |
Rahul N. Agarwal, Chief Financial Officer | |||
(Principal Financial and Accounting Officer) | |||
56