Attached files
| file | filename |
|---|---|
| EX-99.1 - EXHIBIT 99.1 - AVADEL PHARMACEUTICALS PLC | ex991earningsrelease.htm |
| 8-K - 8-K - AVADEL PHARMACEUTICALS PLC | a8-kpressrelease.htm |

November 7, 2016 Third Quarter 2016 Earnings Conference Call 1
Third Quarter 2016 Earnings
Conference Call
November 7, 2016 Third Quarter 2016 Earnings Conference Call 2
Forward Looking Statements
This presentation may include "forward-looking statements" within the meaning of the Private Securities Litigation Reform Act of
1995. All statements herein that are not clearly historical in nature are forward-looking, and the words "anticipate," "assume,"
"believe," "expect," "estimate," "plan," "will," "may," and the negative of these and similar expressions generally identify forward-
looking statements. All forward-looking statements involve risks, uncertainties and contingencies, many of which are beyond
Flamel's control and could cause actual results to differ materially from the results contemplated in such forward-looking
statements. These risks, uncertainties and contingencies include the risks relating to: our dependence on a small number of
products and customers for the majority of our revenues; the possibility that our Bloxiverz® and Vazculep® products, which are not
patent protected, could face substantial competition resulting in a loss of market share or forcing us to reduce the prices we charge
for those products; the possibility that we could fail to successfully complete the research and development for the two pipeline
products we are evaluating for potential application to the FDA pursuant to our "unapproved-to-approved" strategy, or that
competitors could complete the development of such products and apply for FDA approval of such products before us; our
dependence on the performance of third parties in partnerships or strategic alliances for the commercialization of some of our
products; the possibility that our products may not reach the commercial market or gain market acceptance; our need to invest
substantial sums in research and development in order to remain competitive; our dependence on certain single providers for
development of several of our drug delivery platforms and products; our dependence on a limited number of suppliers to
manufacture our products and to deliver certain raw materials used in our products; the possibility that our competitors may
develop and market technologies or products that are more effective or safer than ours, or obtain regulatory approval and market
such technologies or products before we do; the challenges in protecting the intellectual property underlying our drug delivery
platforms and other products; our dependence on key personnel to execute our business plan; the amount of additional costs we
will incur to comply with U.S. securities laws as a result of our ceasing to qualify as a foreign private issuer; and the other risks,
uncertainties and contingencies described in the Company's filings with the U.S. Securities and Exchange Commission, including our
annual report on Form 10-K for the year ended December 31, 2015, all of which filings are also available on the Company's
website. Flamel undertakes no obligation to update its forward-looking statements as a result of new information, future events or
otherwise, except as required by law.
November 7, 2016 Third Quarter 2016 Earnings Conference Call 3
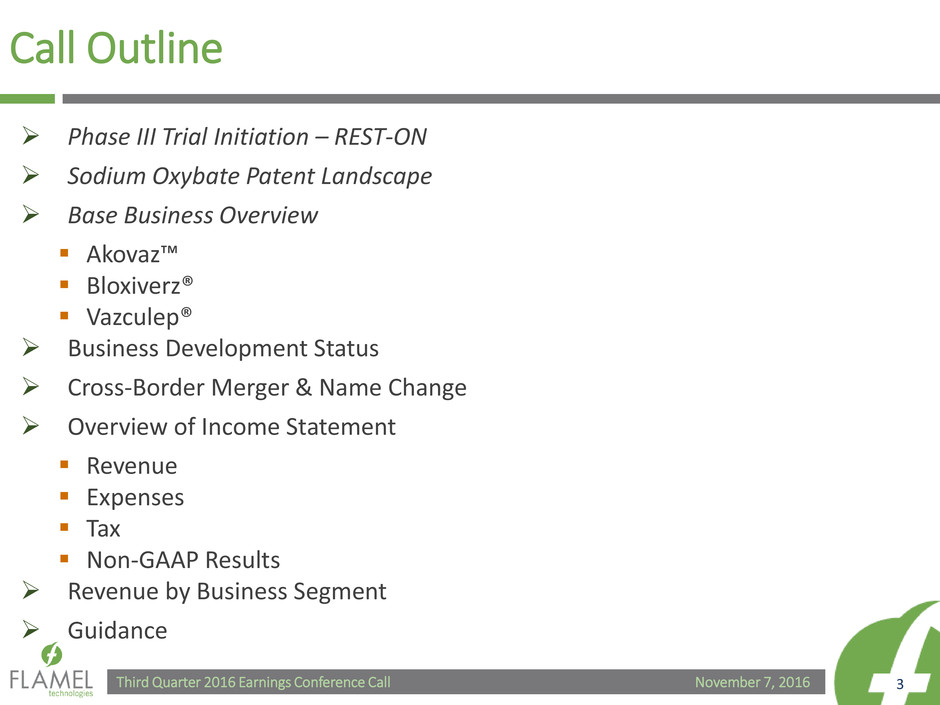
Call Outline
Phase III Trial Initiation – REST-ON
Sodium Oxybate Patent Landscape
Base Business Overview
Akovaz™
Bloxiverz®
Vazculep®
Business Development Status
Cross-Border Merger & Name Change
Overview of Income Statement
Revenue
Expenses
Tax
Non-GAAP Results
Revenue by Business Segment
Guidance

November 7, 2016 Third Quarter 2016 Earnings Conference Call 4
REST-ON Phase III Trial
Initiation of Phase III Pivotal Trial (REST-ON) announced (Sept 26th)
Special Protocol Assessment process completed (Oct 6th)
Sites in Canada and Germany have started screening and enrollment
Expect to dose first patient before year end
First U.S. site expected to initiate patient enrollment January 2017
Goal to complete patient enrollment by 4Q 2017

November 7, 2016 Third Quarter 2016 Earnings Conference Call 5
Sodium Oxybate IP Landscape
JAZZ – 6 of 7 REMS patents overturned by PTAB
Settled with Wockhardt & Ranbaxy for 2026 generic entry
Yet to settle with other filers – including first to file, Roxane (Hikma)
‘306 patent for concomitant dosing of sodium oxybate and valproate /
divalproex sodium still in place (exp. 2033)
‘306 patent to be evaluated again during trial with Roxane
Label requirements for NDA filers are not the same as for ANDAs, even
through 505(b)(2)
Flamel will have unique REMS & strong patent strategy for ‘306

November 7, 2016 Third Quarter 2016 Earnings Conference Call 6
Base Business
• Akovaz launched Aug
2016
• $5.6 million in revenues
3Q 2016
• On target to exit 2016 with
20-30% market share
• Averaged 40% neostigmine
market during 3Q 2016
• $15.6 million in revenues 3Q
2016
• Smaller overall market volume
and increased competition
resulted in lower revenues –
anticipate stable market Q4
• Share remained stable in 3Q
2016
• $9.3 million in revenues 3Q
2016
• Expect market to remain
stable going forward
Akovaz™ Bloxiverz® Vazculep®

November 7, 2016 Third Quarter 2016 Earnings Conference Call 7
Business Development
4th Unapproved Marketed Drug identified – awaiting
feedback from FDA on potential clinical work
Looking to grow inorganically – searching for accretive
commercial stage products to fold into FSC
Actively seeking licensing deal for Trigger Lock™
Actively seeking licensing or sale of Medusa™

November 7, 2016 Third Quarter 2016 Earnings Conference Call 8
Coming soon…
Avadel Pharmaceuticals plc (NASDAQ: AVDL)
“AdVAnced DELivery”
Cross-border merger from France to Ireland effective January
1, 2017
No changes to capital structure or share count
COMPANY WILL CONTINUE TO OPERATE AS FLAMEL TECHNOLOGIES SA
UNTIL JANUARY 1, 2017

November 7, 2016 Third Quarter 2016 Earnings Conference Call 9
GAAP Financial Results
(in $000s)
Q3 2016 Q2 2016 Q3 2015
Q3 2016
vs.
Q2 2016
Q3 2016
vs.
Q3 2015
Revenue 32,087$ 38,858$ 47,313$ (6,771)$ (15,226)$
Cost of products and services sold 2,844 3,907 2,087 (1,063) 757
Research and development expenses 8,143 7,604 7,221 539 922
Selling, general and admin expenses 12,740 11,290 4,568 1,450 8,172
Intangible asset amortization 3,702 3,702 3,141 - 561
Fair value adjustments of contingent consideration 20,848 23,898 44,782 (3,050) (23,934)
Operating Expenses 48,277 50,401 61,799 (2,124) (13,522)
Operating income (loss) (16,190) (11,543) (14,486) (4,647) (1,704)
Interest & Other Expense (net) (2,656) (966) (6,287) (1,690) 3,631
Income (loss) before income taxes (18,846) (12,509) (20,773) (6,337) 1,927
Income tax provision 3,451 7,449 7,302 (3,998) (3,851)
Net loss (22,297)$ (19,958)$ (28,075)$ (2,339)$ 5,778$
Diluted loss per share (0.54)$ (0.48)$ (0.69)$ (0.06)$ 0.15$
Difference - Inc./(Dec.)

November 7, 2016 Third Quarter 2016 Earnings Conference Call 10
Non-GAAP Financial Results
(in $000s)
Q3 2016 Q2 2016 Q3 2015
Q3 2016
vs.
Q2 2016
Q3 2016
vs.
Q3 2015
Revenue 32,087$ 38,858$ 47,313$ (6,771)$ (15,226)$
Cost of products and services sold 2,844 3,145 2,087 (301) 757
Research and development expenses 8,143 7,604 7,221 539 922
Selling, general and admin expenses 12,740 11,290 4,568 1,450 8,172
Intangible asset amortization - - - - -
Fair value adjustments of contingent consideration 5,884 6,992 9,027 (1,108) (3,143)
Operating Expenses 29,611 29,031 22,903 580 6,708
Operating income (loss) 2,476 9,827 24,410 (7,351) (21,934)
Interest & Other Expense (net) (559) (814) (1,014) 255 455
Income (loss) before income taxes 1,917 9,013 23,397 (7,096) (21,480)
Income tax provision 5,416 9,998 10,255 (4,581) (4,839)
Net loss (3,499)$ (985)$ 13,142$ (2,515)$ (16,641)$
Diluted loss per share (0.08)$ (0.02)$ 0.32$ (0.06)$ (0.40)$
Difference - Inc./(Dec.)
*Reconciliations from GAAP to Non-GAAP can be found in the appendix

November 7, 2016 Third Quarter 2016 Earnings Conference Call 11
(in $000s)
Q3 2016 Q2 2016 Q3 2015
Q3 2016
vs.
Q2 2016
Q3 2016
vs.
Q3 2015
Bloxiverz 15,591$ 25,620$ 41,243$ (10,029)$ (25,652)$
Vazculep 9,340 10,421 5,605 (1,081) 3,735
Akovaz 5,568 - - 5,568 5,568
Other 841 2,124 465 (1,283) 376
Total product sales and services 31,340$ 38,165$ 47,313$ (6,825)$ (15,973)$
License and research revenue 747$ 693$ -$ 54$ 747$
Total revenues 32,087$ 38,858$ 47,313$ (6,771)$ (15,226)$
Difference - Inc./(Dec.)
Product Sales
November 7, 2016 Third Quarter 2016 Earnings Conference Call 12
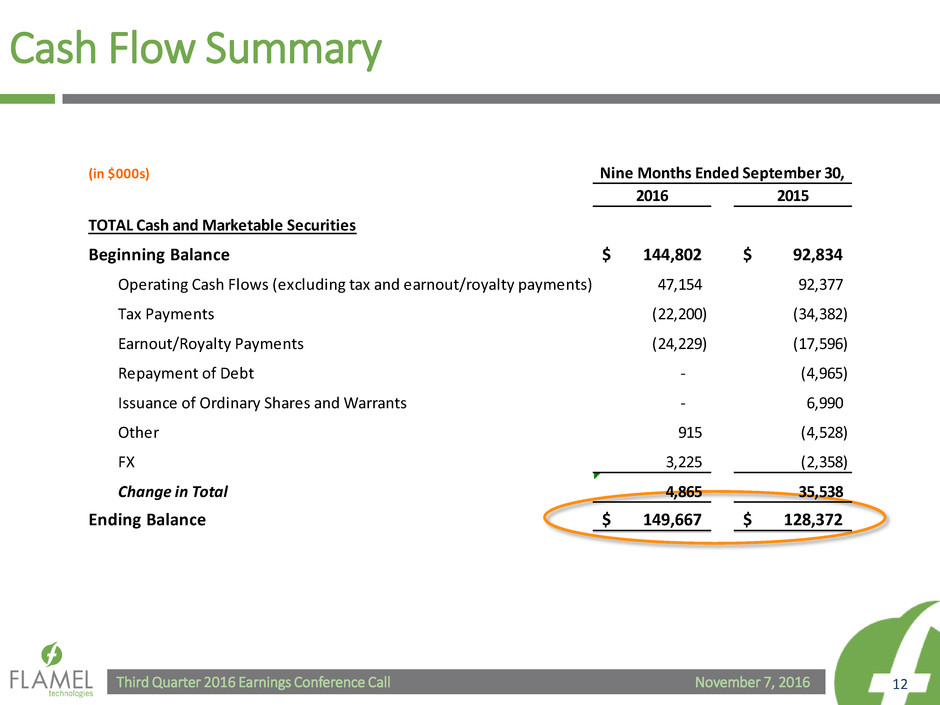
Cash Flow Summary
(in $000s)
2016 2015
TOTAL Cash and Marketable Securities
Beginning Balance 144,802$ 92,834$
Operating Cash Flows (excluding tax and earnout/royalty payments) 47,154 92,377
Tax Payments (22,200) (34,382)
Earnout/Royalty Payments (24,229) (17,596)
Repayment of Debt - (4,965)
Issuance of Ordinary Shares and Warrants - 6,990
Other 915 (4,528)
FX 3,225 (2,358)
Change in Total 4,865 35,538
Ending Balance 149,667$ 128,372$
Nine Months Ended September 30,
November 7, 2016 Third Quarter 2016 Earnings Conference Call 13
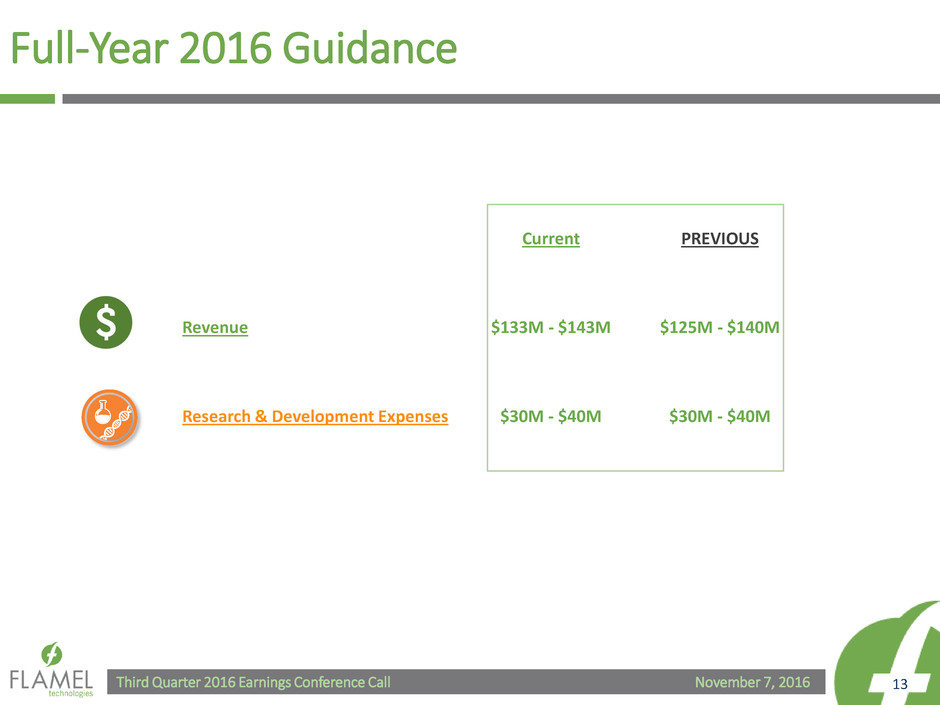
Full-Year 2016 Guidance
Current PREVIOUS
Revenue $133M - $143M $125M - $140M
Research & Development Expenses $30M - $40M $30M - $40M

November 7, 2016 Third Quarter 2016 Earnings Conference Call 14
Question & Answer

November 7, 2016 Third Quarter 2016 Earnings Conference Call 15
Appendix

November 7, 2016 Third Quarter 2016 Earnings Conference Call 16
GAAP to Non-GAAP Reconciliations
Three Months Ended September 30, 2016:
(in thousands - USD$) Include
GAAP
Intangible asset
amortization
Foreign
exchange
(gain)/loss
Contingent
related party
payable
fair value
remeasurements
Contingent
related party
payable
paid/accrued
Total
Adjustments NON-GAAP
Product sales and services 31,340$ -$ -$ -$ -$ -$ 31,340$
License and research revenue 747 - - - - - 747
Total revenue 32,087 - - - - - 32,087
Cost of products and services sold 2,844 - - - - - 2,844
Research and development expenses 8,143 - - - - - 8,143
Selling, general and administrative expenses 12,740 - - - - - 12,740
Intangible asset amortization 3,702 (3,702) - - - (3,702) -
Changes in fair value of related party contingent
consideration 20,848 - - (20,848) 5,884 (14,964) 5,884
Total operating expenses 48,277 (3,702) - (20,848) 5,884 (18,666) 29,611
Operating income (loss) (16,190) 3,702 - 20,848 (5,884) 18,666 2,476
Investment Income 490 - - - - - 490
Interest Expense (264) - - - - - (264)
Other Expense - changes in fair value of related party
payable (1,828) - - 1,828 (785) 1,043 (785)
Foreign exchange gain (loss) (1,054) - 1,054 - - 1,054 -
Income (loss) before income taxes (18,846) 3,702 1,054 22,676 (6,669) 20,763 1,917
I come tax provision 3,451 1,329 - 1,021 (385) 1,965 5,416
Income Tax Rate (18%) 36% - 5% 6% 9% 283%
Net Loss (22,297)$ 2,373$ 1,054$ 21,655$ (6,284)$ 18,798$ (3,499)$
Net loss per share - Diluted (0.54)$ 0.06$ 0.03$ 0.52$ (0.15)$ 0.46$ (0.08)$
Weighted average number of shares outstanding - Diluted 41,241 41,241 41,241 41,241 41,241 41,241 41,241
Adjustments
Exclude
November 7, 2016 Third Quarter 2016 Earnings Conference Call 17
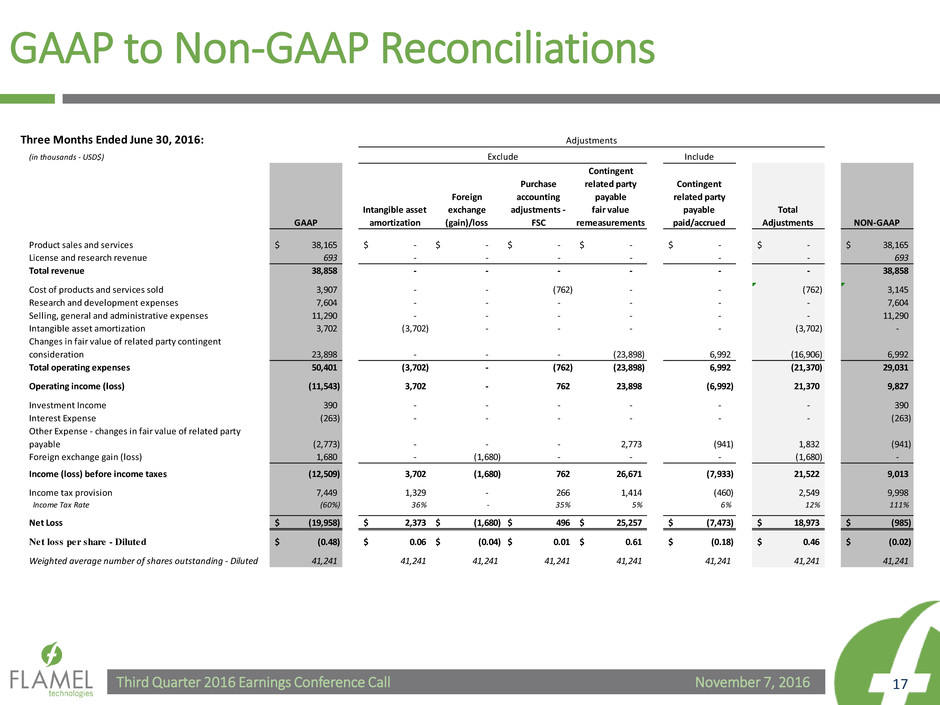
GAAP to Non-GAAP Reconciliations
Three Months Ended June 30, 2016:
(in thousands - USD$) Include
GAAP
Intangible asset
amortization
Foreign
exchange
(gain)/loss
Purchase
accounting
adjustments -
FSC
Contingent
related party
payable
fair value
remeasurements
Contingent
related party
payable
paid/accrued
Total
Adjustments NON-GAAP
Product sales and services 38,165$ -$ -$ -$ -$ -$ -$ 38,165$
License and research revenue 693 - - - - - - 693
Total revenue 38,858 - - - - - - 38,858
Cost of products and services sold 3,907 - - (762) - - (762) 3,145
Research and development expenses 7,604 - - - - - - 7,604
Selling, general and administrative expenses 11,290 - - - - - - 11,290
Intangible asset amortization 3,702 (3,702) - - - - (3,702) -
Changes in fair value of related party contingent
consideration 23,898 - - - (23,898) 6,992 (16,906) 6,992
Total operating expenses 50,401 (3,702) - (762) (23,898) 6,992 (21,370) 29,031
Operating income (loss) (11,543) 3,702 - 762 23,898 (6,992) 21,370 9,827
Investment Income 390 - - - - - - 390
Interest Expense (263) - - - - - - (263)
Other Expense - changes in fair value of related party
payable (2,773) - - - 2,773 (941) 1,832 (941)
Foreign exchange gain (loss) 1,680 - (1,680) - - - (1,680) -
Income (loss) before income taxes (12,509) 3,702 (1,680) 762 26,671 (7,933) 21,522 9,013
I come tax provision 7,449 1,329 - 266 1,414 (460) 2,549 9,998
Income Tax Rate (60%) 36% - 35% 5% 6% 12% 111%
Net Loss (19,958)$ 2,373$ (1,680)$ 496$ 25,257$ (7,473)$ 18,973$ (985)$
Net loss per share - Diluted (0.48)$ 0.06$ (0.04)$ 0.01$ 0.61$ (0.18)$ 0.46$ (0.02)$
Weighted average number of shares outstanding - Diluted 41,241 41,241 41,241 41,241 41,241 41,241 41,241 41,241
Adjustments
Exclude

November 7, 2016 Third Quarter 2016 Earnings Conference Call 18
GAAP to Non-GAAP Reconciliations
Three Months Ended September 30, 2015:
(in thousands - USD$) Include
GAAP
Intangible asset
amortization
Foreign
exchange
(gain)/loss
Contingent
related party
payable
fair value
remeasurements
Contingent
related party
payable
paid/accrued
Total
Adjustments NON-GAAP
Product sales and services 47,313$ -$ -$ -$ -$ -$ 47,313$
License and research revenue - - - - - - -
Total revenue 47,313 - - - - - 47,313
Cost of products and services sold 2,087 - - - - - 2,087
Research and development expenses 7,221 - - - - - 7,221
Selling, general and administrative expenses 4,568 - - - - - 4,568
Intangible asset amortization 3,141 (3,141) - - - (3,141) -
Changes in fair value of related party contingent
consideration 44,782 - - (44,782) 9,027 (35,755) 9,027
Total operating expenses 61,799 (3,141) - (44,782) 9,027 (38,896) 22,903
Operating income (loss) (14,486) 3,141 - 44,782 (9,027) 38,896 24,410
Investment Income 197 - - - - - 197
Interest Expense - - - - - - -
Other Expense - changes in fair value of related party
payable (6,644) - - 6,644 (1,211) 5,433 (1,211)
Foreign exchange gain (loss) 160 - (160) - - (160) -
Income (loss) before income taxes (20,773) 3,141 (160) 51,426 (10,237) 44,170 23,397
I come tax provision 7,302 1,099 (48) 2,325 (424) 2,953 10,255
Income Tax Rate (35%) 35% 30% 5% 4% 7% 44%
Net Loss (28,075)$ 2,042$ (112)$ 49,101$ (9,814)$ 41,217$ 13,142$
Net loss per share - Diluted (0.69)$ 0.05$ -$ 1.20$ (0.24)$ 1.01$ 0.32$
Weighted average number of shares outstanding - Diluted 40,625 40,625 40,625 40,625 40,625 40,625 40,625
Adjustments
Exclude
