Attached files
| file | filename |
|---|---|
| EX-31.1 - EXHIBIT 31.1 - UCP, Inc. | ex311_09x30x16-bogue.htm |
| EX-32.2 - EXHIBIT 32.2 - UCP, Inc. | ex322_09x30x16-pirrello.htm |
| EX-32.1 - EXHIBIT 32.1 - UCP, Inc. | ex321_09x30x16-bogue.htm |
| EX-31.2 - EXHIBIT 31.2 - UCP, Inc. | ex312_09x30x16-pirrello.htm |
UNITED STATES SECURITIES AND EXCHANGE COMMISSION
Washington, D.C. 20549
______________________
FORM 10-Q
SQUARTERLY REPORT PURSUANT TO SECTION 13 OR 15(d) OF THE SECURITIES EXCHANGE ACT OF 1934
For the quarterly period ended September 30, 2016
OR
£TRANSITION REPORT PURSUANT TO SECTION 13 OR 15(d) OF THE SECURITIES EXCHANGE ACT OF 1934
For the transition period from _____ to _____
Commission file number 001-36001

UCP, Inc.
(Exact name of registrant as specified in its charter)
Delaware (State or other jurisdiction of incorporation) | 90-0978085 (IRS Employer Identification No.) |
99 Almaden Blvd., Suite 400, San Jose, CA 95113
(Address of principal executive offices, including Zip Code)
(408) 207-9499
(Registrant’s telephone number, including area code)
Indicate by check mark whether the registrant: (1) has filed all reports required to be filed by Section 13 or 15(d) of the Securities Exchange Act of 1934 during the preceding 12 months (or for such shorter period that the registrant was required to file such reports), and (2) has been subject to such filing requirements for the past 90 days. Yes S No £
Indicate by check mark whether the registrant has submitted electronically and posted on its corporate web site, if any, every Interactive Data File required to be submitted and posted pursuant to Rule 405 of Regulation S-T (§ 232.405 of this chapter) during the preceding 12 months (or for such shorter period that the registrant was required to submit and post such files).
Yes S No £
Indicate by check mark whether the registrant is a large accelerated filer, an accelerated filer, a non-accelerated filer, or a smaller reporting company. See definitions of “large accelerated filer,” “accelerated filer” and “smaller reporting company” in Rule 12b-2 of the Exchange Act.
Large accelerated filer | £ | Accelerated filer | S | ||
Non-accelerated filer | £ | Smaller reporting company | £ | ||
(Do not check if a smaller reporting company) | |||||
Indicate by check mark whether the registrant is a shell company (as defined in Rule 12b-2 of the Exchange Act).
Yes £ No S
On October 27, 2016, the registrant had 7,911,195 shares of Class A common stock, par value $0.01 per share outstanding and 100 shares of Class B common stock, par value $0.01 per share outstanding.
UCP, Inc.
FORM 10-Q
For the Three and Nine Months Ended September 30, 2016
TABLE OF CONTENTS
Page No.
Part I - Financial Information | ||
Item 1. | Financial Statements (Unaudited) | |
Condensed Consolidated Balance Sheets as of September 30, 2016 and December 31, 2015 | ||
Condensed Consolidated Statements of Operations and Comprehensive Income or Loss for the Three and Nine Months Ended September 30, 2016 and 2015 | ||
Condensed Consolidated Statements of Equity for the Nine Months Ended September 30, 2016 and 2015 | ||
Condensed Consolidated Statements of Cash Flows for the Nine Months Ended September 30, 2016 and 2015 | ||
Notes to Condensed Consolidated Financial Statements | ||
Item 2. | Management’s Discussion and Analysis of Financial Condition and Results of Operations | |
Item 3. | Quantitative and Qualitative Disclosure About Market Risk | |
Item 4. | Controls and Procedures | |
Part II - Other Information | ||
Item 1. | Legal Proceedings | |
Item 1A. | Risk Factors | |
Item 2. | Unregistered Sales of Equity Securities and Use of Proceeds | |
Item 3. | Defaults Upon Senior Securities | |
Item 4. | Mine Safety Disclosures | |
Item 5. | Other Information | |
Item 6. | Exhibits | |
Signatures | ||
2
UCP, INC.
CONDENSED CONSOLIDATED BALANCE SHEETS
(Unaudited)
(In thousands, except shares and per share data)
September 30, 2016 | December 31, 2015 | ||||||
Assets | |||||||
Cash and cash equivalents | $ | 27,586 | $ | 39,829 | |||
Restricted cash | 900 | 900 | |||||
Real estate inventories | 381,703 | 360,989 | |||||
Fixed assets, net | 966 | 1,314 | |||||
Intangible assets, net | 122 | 236 | |||||
Goodwill | — | 4,223 | |||||
Receivables | 4,512 | 1,317 | |||||
Other assets | 6,403 | 5,889 | |||||
Total assets | $ | 422,192 | $ | 414,697 | |||
Liabilities and equity | |||||||
Accounts payable | $ | 21,714 | $ | 14,882 | |||
Accrued liabilities | 22,719 | 24,616 | |||||
Customer deposits | 2,502 | 1,825 | |||||
Notes payable, net | 83,663 | 82,486 | |||||
Senior notes, net | 74,122 | 73,480 | |||||
Total liabilities | 204,720 | 197,289 | |||||
Commitments and contingencies (Note 11) | |||||||
Equity | |||||||
Preferred stock, par value $0.01 per share, 50,000,000 authorized, no shares issued and outstanding as of September 30, 2016; no shares issued and outstanding as of December 31, 2015 | — | — | |||||
Class A common stock, $0.01 par value; 500,000,000 authorized, 8,034,831 issued and 7,911,195 outstanding as of September 30, 2016; 8,014,434 issued and outstanding as of December 31, 2015 | 80 | 80 | |||||
Class B common stock, $0.01 par value; 1,000,000 authorized, 100 issued and outstanding as of September 30, 2016; 100 issued and outstanding as of December 31, 2015 | — | — | |||||
Additional paid-in capital | 96,892 | 94,683 | |||||
Treasury stock at cost; 123,636 shares as of September 30, 2016; none as of December 31, 2015 | (1,000 | ) | — | ||||
Accumulated deficit | (2,476 | ) | (4,563 | ) | |||
Total UCP, Inc. stockholders’ equity | 93,496 | 90,200 | |||||
Noncontrolling interest | 123,976 | 127,208 | |||||
Total equity | 217,472 | 217,408 | |||||
Total liabilities and equity | $ | 422,192 | $ | 414,697 | |||
See accompanying notes to condensed consolidated financial statements.
3
UCP, INC.
CONDENSED CONSOLIDATED STATEMENTS OF OPERATIONS AND COMPREHENSIVE INCOME OR LOSS
(Unaudited)
(In thousands, except shares and per share data)
Three Months Ended September 30, | Nine months ended September 30, | ||||||||||||||
2016 | 2015 | 2016 | 2015 | ||||||||||||
REVENUE: | |||||||||||||||
Homebuilding | $ | 89,840 | $ | 70,284 | $ | 239,480 | $ | 163,705 | |||||||
Land development | 3,900 | 1,116 | 5,322 | 3,156 | |||||||||||
Other revenue | — | 2,272 | — | 5,060 | |||||||||||
Total revenue: | 93,740 | 73,672 | 244,802 | 171,921 | |||||||||||
COSTS AND EXPENSES: | |||||||||||||||
Cost of sales - homebuilding | 72,984 | 57,006 | 195,561 | 134,744 | |||||||||||
Cost of sales - land development | 3,834 | 716 | 4,519 | 2,264 | |||||||||||
Cost of sales - other revenue | — | 1,958 | — | 4,363 | |||||||||||
Impairment on real estate | 192 | — | 2,589 | — | |||||||||||
Total cost of sales | 77,010 | 59,680 | 202,669 | 141,371 | |||||||||||
Gross margin - homebuilding | 16,856 | 13,278 | 43,919 | 28,961 | |||||||||||
Gross margin - land development | 66 | 400 | 803 | 892 | |||||||||||
Gross margin - other revenue | — | 314 | — | 697 | |||||||||||
Gross margin - impairment on real estate | (192 | ) | — | (2,589 | ) | — | |||||||||
Total gross margin | 16,730 | 13,992 | 42,133 | 30,550 | |||||||||||
Sales and marketing | 4,853 | 4,692 | 13,595 | 13,246 | |||||||||||
General and administrative | 4,592 | 5,539 | 19,101 | 19,311 | |||||||||||
Goodwill impairment | 4,223 | — | 4,223 | — | |||||||||||
Total costs and expenses | 90,678 | 69,911 | 239,588 | 173,928 | |||||||||||
Income (loss) from operations | 3,062 | 3,761 | 5,214 | (2,007 | ) | ||||||||||
Other income, net | 204 | 45 | 253 | 177 | |||||||||||
Net income (loss) before income taxes | $ | 3,266 | $ | 3,806 | $ | 5,467 | $ | (1,830 | ) | ||||||
Provision for income taxes | (124 | ) | — | (271 | ) | — | |||||||||
Net income (loss) | $ | 3,142 | $ | 3,806 | $ | 5,196 | $ | (1,830 | ) | ||||||
Net income (loss) attributable to noncontrolling interest | $ | 1,857 | $ | 2,167 | $ | 3,109 | $ | (961 | ) | ||||||
Net income (loss) attributable to UCP, Inc. | 1,285 | 1,639 | 2,087 | (869 | ) | ||||||||||
Other comprehensive income (loss), net of tax | — | — | — | — | |||||||||||
Comprehensive income (loss) | $ | 3,142 | $ | 3,806 | $ | 5,196 | $ | (1,830 | ) | ||||||
Comprehensive income (loss) attributable to noncontrolling interest | $ | 1,857 | $ | 2,167 | $ | 3,109 | $ | (961 | ) | ||||||
Comprehensive income (loss) attributable to UCP, Inc. | $ | 1,285 | $ | 1,639 | $ | 2,087 | $ | (869 | ) | ||||||
Earnings (loss) per share of Class A common stock: | |||||||||||||||
Basic | $ | 0.16 | $ | 0.21 | $ | 0.26 | $ | (0.11 | ) | ||||||
Diluted | $ | 0.16 | $ | 0.20 | $ | 0.26 | $ | (0.11 | ) | ||||||
Weighted average shares of Class A common stock: | |||||||||||||||
Basic | 7,948,268 | 7,995,934 | 7,993,371 | 7,950,700 | |||||||||||
Diluted | 7,986,416 | 8,017,768 | 8,043,830 | 7,950,700 | |||||||||||
See accompanying notes to condensed consolidated financial statements.
4
UCP, INC.
CONDENSED CONSOLIDATED STATEMENTS OF EQUITY
(Unaudited)
(In thousands, except number of shares)
Shares of common stock outstanding | Common stock | Additional paid-in capital | Treasury stock | Accumulated deficit | Noncontrolling interest | Total equity | |||||||||||||||||||||||||||
Class A | Class B | Class A | Class B | ||||||||||||||||||||||||||||||
Balance as of December 31, 2014 | 7,922,216 | 100 | $ | 79 | $ | — | $ | 94,110 | $ | — | $ | (6,934 | ) | $ | 124,012 | $ | 211,267 | ||||||||||||||||
Class A - Issuance of common stock for RSUs, net of withholding taxes paid for vested RSUs | 92,218 | 1 | (160 | ) | (211 | ) | (370 | ) | |||||||||||||||||||||||||
Stock-based compensation expense | 674 | 898 | 1,572 | ||||||||||||||||||||||||||||||
Distribution to noncontrolling interest | (981 | ) | (981 | ) | |||||||||||||||||||||||||||||
Net loss | (869 | ) | (961 | ) | (1,830 | ) | |||||||||||||||||||||||||||
Balance as of September 30, 2015 | 8,014,434 | 100 | $ | 80 | $ | — | $ | 94,624 | $ | — | $ | (7,803 | ) | $ | 122,757 | $ | 209,658 | ||||||||||||||||
Balance as of December 31, 2015 | 8,014,434 | 100 | $ | 80 | $ | — | $ | 94,683 | $ | — | $ | (4,563 | ) | $ | 127,208 | $ | 217,408 | ||||||||||||||||
Class A - Issuance of common stock for RSUs, net of withholding taxes paid for vested RSUs | 20,397 | (20 | ) | (25 | ) | (45 | ) | ||||||||||||||||||||||||||
Repurchase of common stock | (123,636) | (1,000 | ) | (1,000 | ) | ||||||||||||||||||||||||||||
Re-allocation from stock issuances | 1,909 | (1,909 | ) | — | |||||||||||||||||||||||||||||
Stock-based compensation expense | 320 | 423 | 743 | ||||||||||||||||||||||||||||||
Distribution to noncontrolling interest | (4,830 | ) | (4,830 | ) | |||||||||||||||||||||||||||||
Net income | 2,087 | 3,109 | 5,196 | ||||||||||||||||||||||||||||||
Balance as of September 30, 2016 | 7,911,195 | 100 | $ | 80 | $ | — | $ | 96,892 | $ | (1,000 | ) | $ | (2,476 | ) | $ | 123,976 | $ | 217,472 | |||||||||||||||
See accompanying notes to condensed consolidated financial statements.
5
UCP, INC.
CONDENSED CONSOLIDATED STATEMENTS OF CASH FLOWS
(Unaudited)
(In thousands)
Nine months ended September 30, | |||||||
2016 | 2015 | ||||||
Operating activities | |||||||
Net income (loss) | $ | 5,196 | $ | (1,830 | ) | ||
Adjustments to reconcile net income (loss) to net cash used in operating activities: | |||||||
Stock-based compensation | 743 | 1,572 | |||||
Abandonment charges | 505 | 146 | |||||
Impairment on real estate inventories | 2,589 | — | |||||
Depreciation and amortization | 492 | 463 | |||||
Goodwill impairment | 4,223 | — | |||||
Fair value adjustment of contingent consideration | (2,400 | ) | (818 | ) | |||
Changes in operating assets and liabilities: | |||||||
Real estate inventories | (23,067 | ) | (60,715 | ) | |||
Receivables | (3,195 | ) | 307 | ||||
Other assets | (411 | ) | (2,389 | ) | |||
Accounts payable | 6,832 | 14,732 | |||||
Accrued liabilities | 302 | (4,360 | ) | ||||
Customer deposits | 677 | 1,125 | |||||
Income taxes payable | 202 | — | |||||
Net cash used in operating activities | (7,312 | ) | (51,767 | ) | |||
Investing activities | |||||||
Purchases of fixed assets | (117 | ) | (311 | ) | |||
Net cash used in investing activities | (117 | ) | (311 | ) | |||
Financing activities | |||||||
Distribution to noncontrolling interest | (4,830 | ) | (981 | ) | |||
Proceeds from notes payable | 106,663 | 112,595 | |||||
Repayment of notes payable | (105,488 | ) | (77,895 | ) | |||
Debt issuance costs | (114 | ) | (698 | ) | |||
Repurchase of common stock | (1,000 | ) | — | ||||
Withholding taxes paid for vested RSUs | (45 | ) | (370 | ) | |||
Net cash (used by) provided by financing activities | (4,814 | ) | 32,651 | ||||
Net decrease in cash and cash equivalents | (12,243 | ) | (19,427 | ) | |||
Cash and cash equivalents – beginning of period | 39,829 | 42,033 | |||||
Cash and cash equivalents – end of period | $ | 27,586 | $ | 22,606 | |||
Non-cash investing and financing activity | |||||||
Exercise of land purchase options acquired with acquisition of business | $ | 74 | $ | 160 | |||
Issuance of Class A common stock for vested restricted stock units | $ | 189 | $ | 680 | |||
Supplemental cash flow information | |||||||
Income taxes paid | $ | 69 | $ | — | |||
See accompanying notes to condensed consolidated financial statements.
6
UCP, INC.
NOTES TO CONDENSED CONSOLIDATED FINANCIAL STATEMENTS
(Unaudited)
1. ORGANIZATION, BASIS OF PRESENTATION AND SUMMARY OF SIGNIFICANT ACCOUNTING POLICIES
As used in this report, unless the context otherwise requires or indicates, references to “the Company,” “we,” “our” and “UCP” refer to UCP, Inc. and its consolidated subsidiaries, including UCP, LLC.
Business Description and Organizational Structure of the Company:
The Company is a homebuilder and land developer with expertise in residential land acquisition, development and entitlement, as well as home design, construction and sales. We operate in the states of California, Washington, North Carolina, South Carolina and Tennessee.
The Company’s operations began in 2004 and principally focused on acquiring land, and entitling and developing it for residential construction. In 2010, the Company formed Benchmark Communities, LLC, its wholly-owned homebuilding subsidiary, to design, construct and sell high quality single-family homes. In 2014, the Company completed the acquisition of the assets and liabilities of Citizens Homes, Inc. (“Citizens Acquisition”) to expand its operations for the purchase of real estate and the construction and marketing of residential homes in the Southeast.
The Company is a holding company, whose principal asset is its interest in UCP, LLC, the subsidiary through which it directly and indirectly conducts its business. As of September 30, 2016, the Company held a 43.1% economic interest in UCP, LLC and PICO Holdings, Inc. (“PICO”), a NASDAQ-listed, diversified holding company, held the remaining 56.9% economic interest in UCP, LLC.
Basis of Presentation:
The accompanying unaudited condensed consolidated financial statements include the accounts of the Company and its subsidiaries. All intercompany accounts have been eliminated in consolidation.
The accompanying unaudited condensed consolidated financial statements have been prepared in accordance with the accounting principles generally accepted in the United States of America (“GAAP”) for interim financial information and the instructions to Form 10-Q and Article 10 of Regulation S-X. These financial statements should be read in conjunction with the Company's audited financial statements for the year ended December 31, 2015, which are included in the Company’s Annual Report on Form 10-K that was filed with the Securities and Exchange Commission on March 14, 2016. The accompanying unaudited condensed consolidated financial statements include all adjustments (consisting of normal recurring adjustments) necessary for the fair presentation of the Company’s results for the interim periods presented. These consolidated and segment results are not necessarily indicative of the Company’s future performance.
As an “emerging growth company,” as defined in the Jumpstart Our Business Startups Act of 2012, the Company has taken advantage of certain temporary exemptions from various reporting requirements, including, but not limited to, not being required to comply with the auditor attestation requirements of Section 404 of the Sarbanes-Oxley Act and reduced disclosure obligations regarding executive compensation in its periodic reports and proxy statements. The Company could be an emerging growth company until the last day of the fiscal year following the fifth anniversary of the July 23, 2013 completion of its initial public offering, although a variety of circumstances can cause it to lose this status earlier.
Use of Estimates in Preparation of Financial Statements:
The preparation of condensed consolidated financial statements in accordance with GAAP requires management to make estimates and assumptions that affect the reported amounts of assets and liabilities and disclosure of contingent liabilities at the date of the financial statements and the reported amounts of revenues and expenses for each reporting period. The significant estimates made in the preparation of the Company’s accompanying unaudited condensed consolidated financial statements relate to the assessment of real estate impairments, valuation of assets and liabilities acquired, warranty reserves, income taxes and contingent liabilities. While management believes that the carrying value of such assets and liabilities are appropriate as of September 30, 2016 and December 31, 2015, it is reasonably possible that actual results could differ from the estimates upon which the carrying values were based.
7
Related Party Transactions:
As of September 30, 2016, PICO holds an economic and voting interest in our Company equal to approximately 56.9%. The Company is party to certain agreements with PICO, including an Exchange Agreement (pursuant to which PICO has the right to cause the Company to exchange PICO’s interests in UCP, LLC for shares of the Company’s Class A common stock on a one-for-one basis, subject to equitable adjustments for stock splits, stock dividends, reclassifications and repurchases by UCP of Class A common stock), an Investor Rights Agreement (pursuant to which PICO has certain rights, including the right to select two individuals for nomination for election to the Company’s board of directors for as long as PICO owns at least a 25% voting interest in the Company), a Tax Receivable Agreement (pursuant to which PICO is entitled to 85% of any cash savings in U.S. federal, state and local income tax that the Company actually realizes as a result of any increase in tax basis caused by PICO’s exchange of UCP, LLC interests for shares of the Company’s Class A common stock) and a Registration Rights Agreement, with respect to the shares of Class A common stock that PICO may receive in exchanges made pursuant to the Exchange Agreement.
Segment Reporting:
The Company has two operating segments, West and Southeast, and two reportable segments, Homebuilding and Land development. Each reportable segment includes real estate with similar economic characteristics, including similar historical and expected long-term gross margin percentages, product types, geography, production processes and methods of distribution.
Cash and Cash Equivalents and Restricted Cash:
Cash and cash equivalents include highly liquid instruments purchased with original maturities of three months or less.
Cash items that are restricted as to withdrawal or usage include deposits of $0.9 million as of September 30, 2016 and December 31, 2015, related to a construction loan, credit card agreements and a contractor’s license.
Capitalization of Interest:
The Company capitalizes interest to real estate inventories during the period that real estate is undergoing development. Interest capitalized as a cost of real estate inventories is included in cost of sales-homebuilding or cost of sales-land development as related homes or real estate are delivered.
Advertising Expenses:
The Company expenses advertising costs as incurred. Advertising expenses for the three months ended September 30, 2016 and 2015 were $0.5 million and $0.6 million, respectively, and for the nine months ended September 30, 2016 and 2015 were $1.5 million and $2.0 million, respectively.
Real Estate Inventories and Cost of Sales:
The Company capitalizes pre-acquisition costs, the purchase price of real estate, development costs and other allocated costs, including interest, during development and home construction. Pre-acquisition costs, including non-refundable land deposits, are expensed to cost of sales when the Company determines continuation of the related project is not probable. Applicable costs incurred after development or construction is substantially complete are charged to sales and marketing or general and administrative, as appropriate.
Land, development and other common costs are typically allocated to real estate inventories based on the number of homes to be constructed. Direct home construction costs are recorded using the specific identification method. Cost of sales-homebuilding includes the construction costs of each home and all applicable land acquisition, real estate development, capitalized interest and related allocated common costs. Changes to estimated total development costs subsequent to initial home closings in a community are allocated to remaining homes in the community. Cost of sales-land development includes land acquisition and development costs, capitalized interest, impairment charges, abandonment charges for projects that are no longer economically viable, and real estate taxes.
Real estate inventories are stated at cost, unless the carrying amount is determined not to be recoverable, in which case real estate inventories are written down to fair value.
All real estate inventories are classified as held until the Company commits to a plan to sell the real estate, the real estate can be sold in its present condition, the real estate is being actively marketed for sale and it is probable that the real estate will be sold within
8
twelve months. Homes completed or under construction are included in real estate inventories in the accompanying unaudited condensed consolidated balance sheets at the lower of cost or net realizable value.
Impairment and Abandonment of Real Estate Inventories:
The Company evaluates real estate inventories for impairment when conditions exist suggesting that the carrying amount of real estate inventories is not fully recoverable and may exceed its fair value. Indicators of impairment include, but are not limited to, significant decreases in local housing market values, decreases in the selling prices of comparable homes, significant decreases in gross margins and sales absorption rates, costs in excess of budget, and actual or projected cash flow losses. The Company prepares and analyzes cash flows at the lowest level for which there are identifiable cash flows that are independent of the cash flows of other groups of assets.
When estimating future cash flows of its real estate assets, the Company makes various assumptions, including: (i) expected sales prices and sales incentives (based on, among other things, an estimate of the number of homes available in the market, pricing and incentives, and potential sales price adjustments based on market and economic trends); (ii) expected sales pace and cancellation rates (based on local housing market conditions, competition and historical trends); (iii) costs incurred to date and expected to be incurred (including, but not limited to, land and land development costs, home construction costs, indirect construction costs, and selling and marketing costs); (iv) alternative product offerings that may be offered that could have an impact on sales pace, sales price and/or building costs; and (v) alternative uses for the property.
If events or circumstances indicate that the carrying amount of real estate inventories may be impaired, such impairment will be measured based upon the difference between the carrying amount and the fair value of such asset(s) determined using the estimated future discounted cash flows, excluding interest charges, generated from the use and ultimate disposition of such
asset(s). Such losses, if any, are reported within cost of sales for the period.
We estimate the fair value of each impaired community by determining the present value of the estimated future cash flows at a discount rate commensurate with the risk of the respective community. In determining the fair value of land held for sale, management considers, among other things, prices for land in recent comparable sale transactions, market analysis studies, which include the estimated price a willing buyer would pay for the land, and recent bona fide offers received from third parties.
During the three and nine months ended September 30, 2016, approximately $0.2 million and $2.6 million, respectively, of impairment losses were recorded. For the three months ended September 30, 2016, the impairment loss was recorded with respect to the Company’s real estate inventories at its Heathers at Westport community, located in Charlotte, North Carolina (“Heathers at Westport”). As of September 30, 2016, the four remaining completed homes at the Heathers at Westport project had a carrying value that exceeded their estimated undiscounted cash flow. As a result, the carrying values of those remaining homes were adjusted to their estimated fair values, resulting in an impairment loss of approximately $0.2 million.
For the nine months ended September 30, 2016, an additional $2.4 million of real estate impairment loss was recorded during the second quarter of 2016 with respect to the Company’s real estate inventories at its Sundance community, located in Bakersfield, California (“Sundance”). The 65 lots at our Sundance project resulted in an impairment loss of $2.1 million during the second quarter of 2016, as the carrying value of these lots was written down to the contractual sales price less costs to sell. In addition, as of June 30, 2016, homes under construction and completed homes at the Sundance project had a carrying value that exceeded their estimated undiscounted cash flows. As a result, the carrying values of those remaining homes not currently under contract were adjusted to their estimated fair values resulting in an impairment loss of approximately $0.3 million during the second quarter of 2016. See Note 8, “Fair Value Disclosures--Non-Financial Instruments Carried at Fair Value--Non-Recurring Estimated Fair Value of Real Estate Inventories” for a further discussion of the impairment of the real estate asset.
No such real estate impairment losses were recorded for the three and nine months ended September 30, 2015.
Abandonment charges during the three months ended September 30, 2016 and 2015 were $31,000 and $144,000, respectively, and were $505,000 and $146,000 during the nine months ended September 30, 2016 and 2015, respectively. Abandonment charges are included in cost of sales in the accompanying unaudited condensed consolidated statements of operations and comprehensive income or loss for the period in which they were recorded. These charges were related to the Company electing not to proceed with one or more land acquisitions after the incurrence of costs during due diligence.
9
Goodwill and Other Intangible Assets:
The purchase price of an acquired business is allocated between the net tangible assets and intangible assets of the acquired business, with any residual purchase price recorded as goodwill. The determination of the value of the assets acquired and liabilities assumed involves certain judgments and estimates. These judgments can include, but are not limited to, the cash flows that an asset is expected to generate in the future and the appropriate weighted average cost of capital.
Intangible assets with determinable useful lives are amortized on a straight-line basis over the estimated remaining useful lives (ranging from six months to five years), added to the value of land when an intangible option is used to purchase the land, or expensed in the period when the option is cancelled. Acquired intangible assets with contractual terms are generally amortized over their respective contractual lives. When certain events or changes in operating conditions occur, an impairment assessment is performed for the intangible assets. Goodwill is not amortized, but is evaluated annually for impairment or more frequently if events or circumstances indicate that goodwill may be impaired.
Impairment of Goodwill:
All goodwill has been attributed to the Southeast homebuilding reporting segment as part of the Citizens Acquisition, which was completed in 2014. In accordance with Financial Accounting Standards Board (“FASB”) issued Accounting Standards Codification (“ASC”) Topic 350 - Goodwill, the Company evaluates goodwill for impairment annually or when conditions exist suggesting that the carrying amount of goodwill will more likely than not exceed its fair value. Indicators of impairment include, but are not limited to, significant decreases in economic conditions and market valuations, limitations on access to capital, and actual or projected cash flow losses or increases in cost factors that have a negative effect on earnings and cash flows. The Company prepares and analyzes cash flows at the project level for which there are identifiable cash flows.
If events or circumstances indicate that the carrying amount of goodwill may be impaired, such impairment will be measured based upon the difference between the carrying amount and the fair value and determined using the estimated future discounted cash flows, excluding interest charges. Such losses, if any, are reported as an expense in the accompanying unaudited condensed consolidated statements of operations and comprehensive income or loss for the period.
We estimate the fair value of goodwill by applying the income approach and determining the present value of the estimated future cash flows at a discount rate. When estimating future cash flows, the Company makes various assumptions, including, but not limited to: (i) forecasted adjusted pre-tax net income over a ten-year period; (ii) weighted average cost of capital; (iii) terminal growth; and (iv) revenue growth and operating profit margin.
Based on the above factors, the Company determined that the carrying value of goodwill exceeded its fair value. As a result, the Company recorded goodwill impairment of $4.2 million during the three months ended September 30, 2016 related to its Southeast operating segment. For the year ended December 31, 2015, there was no impairment of goodwill. See Note 5, “Intangible Assets--Goodwill” for a further discussion of the impairment of goodwill.
Fixed Assets, Net:
Fixed assets are carried at cost, net of accumulated depreciation. Depreciation is computed using the straight-line method over the estimated remaining useful lives of the assets. Computer software and hardware are depreciated over three to five years, office furniture and fixtures are depreciated over five years, vehicles are depreciated over five years and leasehold improvements are depreciated over the shorter of their useful life or lease term and range from one to five years. Maintenance and repairs are charged to expense as incurred, while significant improvements are capitalized. Depreciation expense is included in general and administrative (“G&A”) expenses in the accompanying unaudited condensed consolidated statements of operations and comprehensive income or loss.
Receivables:
Receivables include amounts recoverable from warranty insurance, amounts due from utility companies for reimbursement of costs, manufacturer rebates and reimbursable land development costs for general contracting services under a fixed price contract. As of September 30, 2016, approximately $1.1 million of estimated recoverable from warranty insurance was included in receivables. In addition, approximately $2.8 million of reimbursable land development costs under an option and development agreement executed during the third quarter of 2016 was recorded as a receivable. See Note 11, “Commitments and Contingencies--Purchase Commitments” for a further discussion of the option and development agreement.
10
As of September 30, 2016 and December 31, 2015, the Company had no allowance for doubtful accounts recorded.
Other Assets:
The detail of other assets is set forth below (in thousands):
September 30, 2016 | December 31, 2015 | ||||||
Customer deposits in escrow | $ | 2,479 | $ | 1,834 | |||
Prepaid expenses | 823 | 2,099 | |||||
Other deposits and prepaid interest | 1,281 | 466 | |||||
Funds held in escrow | 1,490 | 1,490 | |||||
Other assets | 330 | — | |||||
Total | $ | 6,403 | $ | 5,889 | |||
As part of the Company’s adoption of Accounting Standards Update (“ASU”) 2015-03, approximately $1.5 million of unamortized debt issuance costs that were included in the prepaid expenses category of other assets as of December 31, 2015 have been reclassified from other assets to notes payable and senior notes in the accompanying unaudited condensed consolidated balance sheets. See Note 7, “Notes Payable and Senior Notes, net” for a further discussion of the change in accounting principle.
Homebuilding, Land Development Sales and Other Revenues and Profit Recognition:
In accordance with applicable guidance under ASC Topic 360 - Property, Plant, and Equipment, revenue from home sales and other real estate sales is recorded and any profit is recognized when the respective sales are closed. Sales are closed when all conditions of escrow are met, title passes to the buyer, appropriate consideration is received and collection of associated receivables, if any, is reasonably assured and the Company has no continuing involvement with the sold asset. The Company does not offer financing to buyers. Sales price incentives are accounted for as a reduction of revenues when the sale is recorded. If the earnings process is not complete, the sale and any related profits are deferred for recognition in future periods. Any profit recorded is based on the calculation of cost of sales, which is dependent on an allocation of costs.
In addition to homebuilding and land development, the Company previously provided construction management services, pursuant to which it built homes on behalf of third-party property owners. The business was acquired in connection with the Citizens Acquisition and it was sold during the fourth quarter of 2015 and we no longer provide construction management services to third parties. Revenue and costs from providing these services for the three and nine months ended September 30, 2015 is included in other revenue and cost of sales-other revenue in the accompanying unaudited condensed consolidated statements of operations and comprehensive income or loss.
Stock-Based Compensation:
Stock-based compensation expense is measured at the grant date based on the fair value of the award and is recognized as expense over the period during which the award vests in accordance with applicable guidance under ASC Topic 718 - Compensation - Stock Compensation.
Stock Repurchase Program:
On June 6, 2016, our Board of Directors authorized the repurchase of up to $5.0 million of the Company’s Class A common stock between June 7, 2016 and June 1, 2018 (the “Stock Repurchase Program”). Treasury stock represents shares repurchased under the Stock Repurchase Program, which are reflected as a reduction in Stockholders’ Equity in accordance with ASC Topic 505-30 - Equity - Treasury Stock. The number of shares repurchased is based on the settlement date and factored into our weighted average calculation for earnings per share. See Note 9, “Equity--Stock Repurchase Program” for additional information regarding the Stock Repurchase Program. See Note 2, “Income or Loss Per Share” for details regarding the impact of treasury shares on earnings per share.
Warranty Reserves:
Estimated future direct warranty costs are accrued and charged to cost of sales-homebuilding in the period in which the related homebuilding revenue is recognized. Amounts accrued are based upon estimates of the amount the Company expects to pay for warranty work. Warranty reserves include insurance receivables for costs the Company expects to be reimbursed for from insurance. The Company assesses the adequacy of its warranty reserves on a quarterly basis and adjusts the amounts recorded, if necessary, in the
11
period in which the change in estimate occurs. The Company engaged a third-party actuary during the third quarter of 2016 to assist in the analysis of warranty reserves based on historical data and industry trends for our communities. Warranty reserves are included in accrued liabilities in the accompanying unaudited condensed consolidated balance sheets.
Changes in warranty reserves are detailed in the table set forth below (in thousands):
Three months ended September 30, | Nine months ended September 30, | ||||||||||||||
2016 | 2015 | 2016 | 2015 | ||||||||||||
Warranty reserves, beginning of period | $ | 3,662 | $ | 2,149 | $ | 2,852 | $ | 1,509 | |||||||
Warranty reserves accrued | 611 | 214 | 1,655 | 888 | |||||||||||
Warranty expenditures | (209 | ) | (51 | ) | (443 | ) | (85 | ) | |||||||
Additional reserves where corresponding amounts are recorded as receivables from insurance carriers | 1,118 | — | 1,118 | — | |||||||||||
Warranty reserves, end of period | $ | 5,182 | $ | 2,312 | $ | 5,182 | $ | 2,312 | |||||||
Consolidation of Variable Interest Entities:
The Company enters into purchase and option agreements for the purchase of real estate as part of the normal course of business. These purchase and option agreements enable the Company to acquire real estate at one or more future dates at pre-determined prices. The Company believes these acquisition structures reduce its financial risk associated with real estate acquisitions and holdings and allow the Company to better manage its cash position and return metrics.
In February 2015, the FASB issued ASU No. 2015-02, Consolidation (Topic 810): Amendments to the Consolidation Analysis (“ASU 2015-02”), to simplify consolidation accounting. ASU 2015-02 amends current consolidation guidance by modifying the evaluation of whether limited partnerships and similar legal entities are variable interest entities or voting interest entities, eliminating the presumption that a general partner should consolidate a limited partnership, and affects the consolidation analysis of reporting entities that are involved with variable interest entities. All legal entities are subject to reevaluation under the revised consolidation model. ASU 2015-02 was effective for the Company for interim and annual reporting periods beginning after December 15, 2015.
The Company adopted the provisions of ASU 2015-02 as of the effective date on January 1, 2016. The adoption of ASU 2015-02 did not have an impact on the Company's accompanying unaudited condensed consolidated balance sheet, results of operations or cash flows.
Based on the provisions of the relevant accounting guidance, the Company concluded that when it enters into a purchase agreement to acquire real estate from an entity, a variable interest entity (“VIE”) may be created. The Company evaluates all purchase and option agreements for real estate to determine whether a potential VIE has been formed. The applicable accounting guidance requires that for each potential VIE, the Company assess whether it is the primary beneficiary and, if it is, the Company would consolidate the VIE in its accompanying unaudited condensed consolidated financial statements in accordance with ASC Topic 810 - Consolidations, and reflect such assets and liabilities as “Real estate inventories not owned.”
In order to determine if the Company is the primary beneficiary, it must first assess whether it has the ability to control the activities of the VIE that most significantly impact its economic performance. Such activities include, but are not limited to: the ability to determine the budget and scope of land development work, if any; the ability to control financing decisions for the VIE; the ability to acquire additional land into the VIE or dispose of land in the VIE not under contract with the Company; and the ability to change or amend the existing option contract with the VIE. If the Company is not determined to control such activities, the Company is not considered the primary beneficiary of the VIE. If the Company does have the ability to control such activities, the Company will continue its analysis by determining if it is also expected to absorb a potentially significant amount of the VIE’s losses or, if no party absorbs the majority of such losses, if the Company will receive a disproportionate benefit from a potentially significant amount of the VIE’s expected gains.
In substantially all cases, land owners with which the Company has option agreements have no recourse against the Company and the maximum exposure to loss on the applicable option or purchase agreement is limited to non-refundable option deposits and any capitalized pre-acquisition costs. Some of the Company’s option or purchase deposits may be refundable to the Company if certain contractual conditions are not performed by the party selling the lots. The Company did not identify any VIEs from its evaluation of its purchase and option agreements for real estate. Therefore, the Company did not consolidate any land under option as of September 30, 2016 or December 31, 2015.
12
Income Taxes:
The Company’s provision for income tax expense includes federal and state income taxes currently payable and those deferred because of temporary differences between the income tax and financial reporting basis of the Company’s assets and liabilities. The asset and liability method of accounting for income taxes also requires the Company to reflect the effect of a tax rate change on accumulated deferred income taxes in income during the period in which the change is enacted.
In assessing the realization of deferred income taxes, the Company considered whether it is more likely than not that any deferred income tax assets will be realized. The realization of deferred tax assets is subject to the Company generating sufficient taxable income during the periods in which the deferred tax assets become realizable. Due to the Company's cumulative pre-tax operating losses generated prior to 2015, the Company has recorded a valuation allowance against its U.S. deferred tax assets. As of September 30, 2016, the valuation allowance against the Company’s deferred tax assets was approximately $6.3 million. So long as the valuation allowance exists, income tax expense related to deferred tax assets will be offset by the associated valuation allowance, resulting in an effective U.S. income tax rate substantially different than statutory rates. The Company continues to evaluate all available evidence of sustained profitability in the business. The Company’s business was profitable in 2015 and for the first nine months in 2016. During the fourth quarter of 2016, the Company will again evaluate all available evidence in determining the likelihood that it will be able to realize all or some portion of its deferred tax assets prior to their expiration. If, upon completing this evaluation, the Company concludes that it is more likely than not that the Company will be able to realize its deferred tax assets, the valuation allowance may be reversed at or before the end of the current year. If the Company were to reverse the valuation allowance, the Company would realize a one-time, non-cash tax benefit in the period of reversal. Prospectively, the Company would then expect to report an effective U.S. income tax rate that is closer to its statutory rates.
The Company recognizes any uncertain income tax positions on income tax returns at the largest amount that is more-likely-than-not to be sustained upon audit by the relevant taxing authority. An uncertain income tax position will not be recognized unless it has a greater than 50% likelihood of being sustained. The Company recognizes any interest and penalties related to uncertain tax positions in income tax expense. For each of the periods presented, the Company did not record any interest or penalties related to uncertain tax positions. See Note 12, “Income Taxes” for a further discussion of the Company’s income taxes for the applicable period.
Noncontrolling Interest:
The Company reports the share of its results of operations that is attributable to other owners of its consolidated subsidiaries that are less than wholly-owned as noncontrolling interest in the accompanying unaudited condensed consolidated financial statements. In the accompanying unaudited condensed consolidated statements of operations and comprehensive income or loss, the income or loss attributable to the noncontrolling interest is reported separately, and the accumulated income or loss attributable to the noncontrolling interest, along with any changes in ownership of the subsidiary, is reported as a component of total equity.
Recently Issued Accounting Standards:
The following recently issued accounting standards are not yet required to be adopted by the Company as of September 30, 2016:
Standard | Description | Date of Adoption | Application | Effect on the Consolidated Financial Statements (or Other Significant Matters) | ||||
Statement of Cash Flows (Topic 230): Classification of Certain Cash Receipts and Cash Payments (ASU 2016-15) | Provides guidance on eight specific cash flow classification issues that are currently not clear or included under GAAP: (1) debt prepayment or debt extinguishment costs; (2) settlement of zero-coupon debt instruments or other debt instruments with coupon interest rates that are insignificant in relation to the effective interest rate of the borrowing; (3) contingent consideration payments made after a business combination; (4) proceeds from the settlement of insurance claims; (5) proceeds from the settlement of corporate-owned life insurance policies, including bank-owned life insurance policies; (6) distributions received from equity method investees; (7) beneficial interests in securitization transactions; and (8) separately identifiable cash flows and application of the predominance principle. | January 1, 2018; early adoption permitted | Retrospective | The Company is evaluating the method of adoption and the effect on its consolidated financial statements and related disclosures. | ||||
Other than as described above, no new accounting pronouncement has had or is expected to have a material impact on the Company’s accompanying unaudited condensed consolidated financial statements.
13
2. INCOME OR LOSS PER SHARE
Basic income or loss per share of Class A common stock is computed by dividing net income or loss attributable to UCP, Inc. by the weighted average number of shares of Class A common stock outstanding during the period. Diluted income or loss per share of Class A common stock is computed similarly to basic income or loss per share except that the weighted average number of shares of Class A common stock outstanding during the period is increased to include additional shares from the assumed exercise of any Class A common stock equivalents using the treasury method, if dilutive. The Company’s restricted stock units (“RSUs”) and stock options (“Options”) are considered Class A common stock equivalents for this purpose. For the three and nine months ended September 30, 2016 and three months ended September 30, 2015, incremental Class A common stock equivalents were included in calculating diluted income per share. No incremental Class A common stock equivalents were included in calculating diluted loss per share for the nine months ended September 30, 2016 because such inclusion would be anti-dilutive given the net loss attributable to UCP, Inc. during such period.
Basic and diluted net income or loss per share of Class A common stock for the three and nine months ended September 30, 2016 and 2015 have been computed as follows (in thousands, except share and per share amounts):
Three months ended September 30, | Nine months ended September 30, | ||||||||||||||
2016 | 2015 | 2016 | 2015 | ||||||||||||
Numerator | |||||||||||||||
Net income (loss) attributable to UCP, Inc. | $ | 1,285 | $ | 1,639 | $ | 2,087 | $ | (869 | ) | ||||||
Denominator | |||||||||||||||
Weighted average number of shares of Class A common stock outstanding - basic | 7,948,268 | 7,995,934 | 7,993,371 | 7,950,700 | |||||||||||
Effect of dilutive securities: | |||||||||||||||
RSUs | 38,148 | 21,834 | 50,459 | — | |||||||||||
Total shares for purpose of calculating diluted net income (loss) per share | 7,986,416 | 8,017,768 | 8,043,830 | 7,950,700 | |||||||||||
Earnings (loss) per share: | |||||||||||||||
Net income (loss) per share of Class A common stock - basic | $ | 0.16 | $ | 0.21 | $ | 0.26 | $ | (0.11 | ) | ||||||
Net income (loss) per share of Class A common stock - diluted | $ | 0.16 | $ | 0.20 | $ | 0.26 | $ | (0.11 | ) | ||||||
The following RSUs and Options issued were excluded in the computation of diluted earnings per share for the three and nine months ended September 30, 2016 and 2015 because the effect would be anti-dilutive:
Three months ended September 30, | Nine months ended September 30, | ||||||||||
2016 | 2015 | 2016 | 2015 | ||||||||
Anti-dilutive securities | 361,774 | 280,148 | 274,544 | 340,074 | |||||||
14
3. REAL ESTATE INVENTORIES
Real estate inventories consisted of the following (in thousands):
September 30, 2016 | December 31, 2015 | ||||||
Deposits and pre-acquisition costs | $ | 7,730 | $ | 3,836 | |||
Land held and land under development | 133,386 | 128,059 | |||||
Finished lots | 113,555 | 117,335 | |||||
Homes completed or under construction | 102,606 | 89,866 | |||||
Model homes | 24,426 | 21,893 | |||||
Total | $ | 381,703 | $ | 360,989 | |||
Deposits and pre-acquisition costs include costs relating to land purchase or option contracts. Land held and land under development includes costs incurred during site development, such as land, development, indirect costs and permits. Homes completed or under construction and model homes include all costs associated with home construction, including land, development, indirect costs, permits and fees, and vertical construction.
As of September 30, 2016, the Company had $7.7 million of deposits and pre-acquisition costs for 1,123 lots with an aggregate purchase price of approximately $49.1 million, net of deposits. As of December 31, 2015, the Company had $3.8 million of deposits and pre-acquisition costs for 1,127 lots with an aggregate purchase price of approximately $80.1 million, net of deposits.
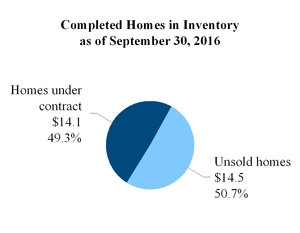
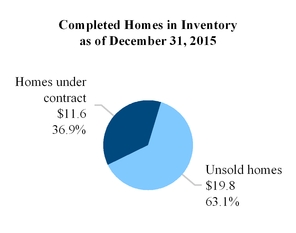
As of September 30, 2016 and December 31, 2015, the Company had completed homes included in inventories of approximately $28.6 million and $31.4 million, respectively, as shown in the charts below ($ in millions):
15
Interest Capitalization
Interest is capitalized on real estate inventories during construction and development. Interest capitalized is included in cost of sales in the Company’s accompanying unaudited condensed consolidated statements of operations and comprehensive income or loss as related sales are recognized. Amounts capitalized to home inventory and land inventory were as follows (in thousands):
Three months ended September 30, | Nine months ended September 30, | ||||||||||||||
2016 | 2015 | 2016 | 2015 | ||||||||||||
Interest expense capitalized as cost of home inventory | $ | 2,573 | $ | 2,442 | $ | 7,748 | $ | 6,877 | |||||||
Interest expense capitalized as cost of land inventory | 606 | 628 | 1,551 | 1,620 | |||||||||||
Total interest expense capitalized | 3,179 | 3,070 | 9,299 | 8,497 | |||||||||||
Previously capitalized interest expense included in cost of sales - homebuilding | (1,990 | ) | (1,443 | ) | (5,319 | ) | (3,367 | ) | |||||||
Previously capitalized interest expense included in cost of sales - land development | (224 | ) | — | (370 | ) | (49 | ) | ||||||||
Net activity of capitalized interest | 965 | 1,627 | 3,610 | 5,081 | |||||||||||
Capitalized interest expense in beginning inventory | 15,919 | 10,753 | 13,274 | 7,299 | |||||||||||
Capitalized interest expense in ending inventory | $ | 16,884 | $ | 12,380 | $ | 16,884 | $ | 12,380 | |||||||
4. FIXED ASSETS, NET
Net fixed assets consisted of the following (in thousands):
September 30, 2016 | December 31, 2015 | ||||||
Computer hardware and software | $ | 2,018 | $ | 1,954 | |||
Office furniture and equipment and leasehold improvements | 888 | 834 | |||||
Vehicles | 83 | 83 | |||||
Total | 2,989 | 2,871 | |||||
Accumulated depreciation | (2,023 | ) | (1,557 | ) | |||
Fixed assets, net | $ | 966 | $ | 1,314 | |||
Depreciation expense for the three months ended September 30, 2016 and 2015 was $131,000 and $151,000, respectively, and for the nine months ended September 30, 2016 and 2015 was $466,000 and $438,000, respectively. Depreciation expense is recorded in G&A expenses in the accompanying unaudited condensed consolidated statements of operations and comprehensive income or loss.
16
5. INTANGIBLE ASSETS
Other purchased intangible assets consisted of the following (in thousands):
September 30, 2016 | December 31, 2015 | ||||||||||||||||||||||
Gross Carrying Amount | Accumulated Amortization (Used) | Ending Balance | Gross Carrying Amount | Accumulated Amortization (Used) | Ending Balance | ||||||||||||||||||
Architectural plans | $ | 170 | $ | (86 | ) | $ | 84 | $ | 170 | $ | (60 | ) | $ | 110 | |||||||||
Land options | 583 | (545 | ) | 38 | 583 | (457 | ) | 126 | |||||||||||||||
Trademarks and trade names | 110 | (110 | ) | — | 110 | (110 | ) | — | |||||||||||||||
$ | 863 | $ | (741 | ) | $ | 122 | $ | 863 | $ | (627 | ) | $ | 236 | ||||||||||
Amortization expense for the three months ended September 30, 2016 and 2015 related to the architectural plans and trademarks and trade names intangibles was approximately $8,500 for both periods and for the nine months ended September 30, 2016 and 2015 was $26,000 for both periods. The architectural plans intangible amortization period is 5 years. Amortization expense is recorded in G&A expenses in the accompanying unaudited condensed consolidated statements of operations and comprehensive income or loss. Future estimated amortization expense related to the architectural plans intangibles over the next five years is as follows (in thousands):
December 31, | |||
2016 | $ | 8 | |
2017 | 34 | ||
2018 | 34 | ||
2019 | 8 | ||
Total | $ | 84 | |
Additionally, $40,000 and $74,000 related to land options was capitalized to real estate inventories during the three and nine months ended September 30, 2016, respectively, as compared to $196,000 and $279,000 for the three and nine months ended September 30, 2015, respectively.
Goodwill
The changes in the carrying amount of goodwill for the nine months ended September 30, 2016 and 2015 were as follows (in thousands):
Goodwill | ||||
Balance at December 31, 2014 | $ | 4,223 | ||
Goodwill impairment | — | |||
Balance as of September 30, 2015 | $ | 4,223 | ||
Goodwill | ||||
Balance at December 31, 2015 | $ | 4,223 | ||
Goodwill impairment | (4,223 | ) | ||
Balance as of September 30, 2016 | $ | — | ||
All goodwill has been attributed to the Southeast homebuilding reporting segment as part of the Citizens Acquisition, which was completed in 2014. For the three months ended September 30, 2016, the Company evaluated goodwill for impairment in light of qualitative indicators. These indicators included revised financial forecasts for the Southwest operating segment as a result of items including weather that delayed new community openings, abandonment of certain opportunities to open new communities as the opportunities did not meet our underwriting criteria, and lower margins on older communities still in existence from the land purchased as part of the acquisition. The Company determined as a result of these qualitative factors, that it should conduct a Step One Test analysis of goodwill. As a result of the Step One Test and subsequent Step Two Test, the Company determined that the carrying valu
17
e of goodwill exceeded its fair value, resulting in an impairment of goodwill. The fair value of goodwill was estimated by applying the income approach and determining the present value of the estimated future cash flows at a discount rate. When estimating future cash flows, the Company used key assumptions, including, but not limited to: (i) forecasted adjusted pre-tax net income over a ten-year period; (ii) weighted average cost of capital; (iii) terminal growth; and (iv) revenue growth and operating profit margin. The risk adjusted discount rate of 14.5% and terminal growth rate of 2.0% were applied to forecast adjusted pre-tax net income.
During the third quarter of 2016, the Company recorded goodwill impairment of $4.2 million. There was no goodwill impairment for the three and nine months ended September 30, 2015.
6. ACCRUED LIABILITIES
Accrued liabilities consisted of the following (in thousands):
7. NOTES PAYABLE AND SENIOR NOTES, NET
The Company obtains various types of debt financing in connection with its acquisition, development and construction of real estate inventories and its construction of homes. Often, these debt obligations are secured by the underlying real estate. Certain loans are funded in full at the initial loan closing and others are revolving facilities under which the Company may borrow, repay and reborrow up to a specified amount during the term of the loan. Acquisition indebtedness matures on various dates, but is generally repaid when lots are released from the lien securing the relevant loan based upon a specific release price, as defined in the relevant loan agreement, or the loan is refinanced. Construction and development debt is required to be repaid with proceeds from home closings based upon a specific release price, as defined in the relevant loan agreement.
Certain construction and development debt agreements include provisions that require minimum tangible net worth and liquidity; limit leverage and risk asset ratios; specify maximum loan-to-cost or loan-to-value ratios (whichever is lower). During the term of the loan, the lender may require the Company to obtain a third-party written appraisal of the fair value of the underlying real estate collateral. If the appraised fair value of the collateral securing the loan is below the specified minimum, the Company may be required to make principal payments in order to maintain the required loan-to-value ratios. As of September 30, 2016, the Company had approximately $228.2 million of loan commitments of which approximately $69.6 million was available to us. As of September 30, 2016 and December 31, 2015, the weighted average interest rate on the Company’s outstanding debt was 6.48% and 6.35%, respectively. Interest rates charged under the Company’s variable rate debt are based on the 30-day London Interbank Offered Rate (“LIBOR”) plus a spread ranging from 3.00% to 3.75% or the U.S. Prime rate (“Prime”) plus a spread of 1.75%.
On October 21, 2014, the Company completed the private offering of $75.0 million in aggregate principal amount of 8.5% Senior Notes due 2017 (the “2017 Notes”). The net proceeds from the offering were approximately $72.5 million, after paying the debt issuance costs and offering expenses. The net proceeds from the offering were used for general corporate purposes, including financing construction of homes, acquisition of entitled land, development of lots and working capital. As of September 30, 2016, the Company was in compliance with the applicable financial covenants under the indenture pursuant to which the 2017 Notes were issued and all of its other loan agreements.
The Senior Notes were issued under an Indenture, dated as of October 21, 2014 (the “Indenture”), among the Company, certain subsidiary guarantors and Wilmington Trust, National Association, as trustee. The Senior Notes bear interest at 8.5% per annum,
18
payable on March 31, June 30, September 30 and December 31 of each year. The Senior Notes mature on October 21, 2017, unless earlier redeemed or repurchased.
As of September 30, 2016, the Company was in compliance with the applicable financial covenants under the Indenture and all of its loan agreements.
Notes payable and 2017 Notes consisted of the following (in thousands):
September 30, 2016 | December 31, 2015 | ||||||
Variable Interest Rate: | |||||||
LIBOR + 3.75% through 2016 (a) | $ | 4,856 | $ | 30,132 | |||
Prime + 1.75% through 2016 (b) | — | 717 | |||||
LIBOR + 3.00% through 2016 (a) | — | 4,832 | |||||
LIBOR + 3.50% through 2017 (a) | 5,256 | 9,785 | |||||
LIBOR + 3.75% through 2017 (a) | 35,661 | 21,732 | |||||
LIBOR + 3.75% through 2018 (a) | 23,086 | 1,120 | |||||
5.50% through 2016 | 3,350 | 2,342 | |||||
5.00% through 2017 | 6,021 | 4,581 | |||||
Total variable notes payable | $ | 78,230 | $ | 75,241 | |||
Fixed Interest Rate: | |||||||
10.00% through 2017 | $ | 1,604 | $ | 1,604 | |||
0.00% through 2017 | — | 1,935 | |||||
8.00% through 2018 | 4,000 | 4,000 | |||||
Total fixed notes payable | $ | 5,604 | $ | 7,539 | |||
Senior Notes, net | 74,831 | 74,710 | |||||
Total notes payable and senior notes | $ | 158,665 | $ | 157,490 | |||
Debt issuance costs | (880 | ) | (1,524 | ) | |||
Total notes payable and senior notes, net | $ | 157,785 | $ | 155,966 | |||
(a) LIBOR is the 30-day London Interbank Offered Rate. As of September 30, 2016, LIBOR was 0.53111%; loans bear interest at LIBOR plus a spread ranging from 3.00% to 3.75%.
(b) Prime is the U.S Prime Rate. At December 31, 2015, Prime was 3.50% plus 1.75%.
As of September 30, 2016, principal maturities of notes payable and 2017 Notes for the years ending December 31 are as follows (in thousands):
2016 | $ | 8,206 | |
2017 | 123,373 | ||
2018 | 27,086 | ||
2019 and thereafter | — | ||
Total | $ | 158,665 | |
19
8. FAIR VALUE DISCLOSURES
The accounting guidance regarding fair value disclosures defines fair value as the price that would be received for selling an asset or the price paid to transfer a liability in an orderly transaction between market participants at the measurement date under current market conditions.
The Company determines the fair values of its financial instruments based on the fair value hierarchy established in accordance with ASC Topic 820 - Fair Value Measurements, which requires an entity to maximize the use of observable inputs and minimize the use of unobservable inputs when measuring fair value. The classification of a financial asset or liability within the hierarchy is based upon the lowest level input that is significant to the fair value measurement. The fair value hierarchy prioritizes the inputs into three levels that may be used to measure fair value:
• | Level 1—Quoted prices for identical instruments in active markets |
• | Level 2—Quoted prices for similar instruments in active markets; quoted prices for identical or similar instruments in markets that are inactive; and model-derived valuations in which all significant inputs and significant value drivers are observable in active markets at measurement date |
• | Level 3—Valuations derived from techniques where one or more significant inputs or significant value drivers are unobservable in active markets at measurement date |
Estimated Fair Value of Financial Instruments Not Carried at Fair Value
As of September 30, 2016 and December 31, 2015, the fair values of cash and cash equivalents, accounts payable and receivable approximated their carrying values because of the short-term nature of these assets and liabilities. The estimated fair value of the Company’s debt is based on cash flow models discounted at current market interest rates for similar instruments, which are based on Level 3 inputs. There were no transfers between fair value hierarchy levels during the nine months ended September 30, 2016 or the year ended December 31, 2015.
The following presents the carrying value and fair value of the Company’s financial instruments which are not carried at fair value (in thousands):
September 30, 2016 | December 31, 2015 | ||||||||||||||||
Level in Fair Value Hierarchy | Carrying Value | Estimated Fair Value | Carrying Value | Estimated Fair Value | |||||||||||||
Notes Payable | Level 3 | $ | 83,834 | $ | 86,671 | $ | 82,780 | $ | 84,712 | ||||||||
2017 Notes | Level 3 | 74,831 | 80,705 | 74,710 | 82,057 | ||||||||||||
Total Debt | $ | 158,665 | $ | 167,376 | $ | 157,490 | $ | 166,769 | |||||||||
The estimated fair value of the Company's debt is the present value of the contractual debt payments, based on cash flow models, discounted at the then-current interest rates, plus an estimate of the then-current credit spread, which is an estimate of the rate at which the Company could obtain replacement debt. These parameters are Level 3 inputs in the fair value hierarchy. To estimate the contractual cash flows, discount rates, and thereby the debt fair value, the Company considers various internal and external factors including: (1) loan economic data, (2) collateral performance, (3) market interest rate data, (4) the discount curve and implied forward rate curve, and (5) other factors, which may include market, region and asset type evaluations.
20
Recurring Financial Instruments Carried at Fair Value
The following presents the Company’s recurring financial instruments that are carried at fair value (in thousands):
Description | Level 1 | Level 2 | Level 3 | Balance as of September 30, 2016 | ||||||||||
Contingent consideration | — | — | $ | 307 | $ | 307 | ||||||||
Description | Level 1 | Level 2 | Level 3 | Balance as of December 31, 2015 | ||||||||||
Contingent consideration | — | — | $ | 2,707 | $ | 2,707 | ||||||||
Estimated Fair Value of Contingent Consideration
The change in estimated fair value of the contingent consideration for the nine months ended September 30, 2016 and 2015 consisted of the following (in thousands):
Contingent Consideration | ||||
Balance as of December 31, 2014 | $ | 3,525 | ||
Change in fair value | (818 | ) | ||
Balance as of September 30, 2015 | $ | 2,707 | ||
Contingent Consideration | ||||
Balance as of December 31, 2015 | $ | 2,707 | ||
Change in fair value | (2,400 | ) | ||
Balance as of September 30, 2016 | $ | 307 | ||
The fair value of the contingent consideration of $0.3 million as of September 30, 2016 was estimated based on significant inputs that are not observable in the market, which ASC Topic 820 - Fair Value Measurements, refers to as Level 3 inputs. Key assumptions include: (1) forecast adjusted pre-tax net income over the contingent consideration period; (2) revenue appreciation; (3) cost inflation; and (4) sales and marketing and general and administrative (“SG&A”) expenses. The estimated revenue appreciation of 4.5%, cost inflation of 1.5%, and SG&A expenses were applied to forecast adjusted net income over the contingent consideration period. See Note 11, “Commitments and Contingencies” for further discussion of contingent consideration.
Non-Financial Instruments Carried at Fair Value
Non-financial assets and liabilities include items such as inventory and long lived assets that are measured at fair value, on a nonrecurring basis, when events and circumstances indicate the carrying value is not recoverable. See Note 11, "Commitments and Contingencies" for a discussion of the non-financial measurements applied to the Citizens Acquisition included elsewhere in this report.
Non-Recurring Estimated Fair Value of Real Estate Inventories
During the third quarter of 2016, the Company had a non-recurring fair value measurement for the construction of Heathers at Westport. The Company recorded an impairment loss of $0.2 million with respect to the Company’s real estate inventories at Heathers at Westport for the remaining four homes and the carrying value of these homes was written down to their fair value. For the three and nine months ended September 30, 2016, impairment losses of $0.2 million and $2.6 million, respectively, were recorded to real estate inventories.
21
The following presents the Company’s non-financial instruments that are carried at fair value (in thousands):
Description | Level 1 | Level 2 | Level 3 | Balance as of September 30, 2016 | Total Impairment During the Nine Months Ended September 30, 2016 | |||||||||||
Real estate and development costs - Heathers at Westport project | $ | 1,066 | $ | 1,066 | $ | 192 | ||||||||||
Real estate and development costs - Sundance project | $ | 1,128 | $ | 1,128 | $ | 2,397 | ||||||||||
Real estate and development costs - River Run project | $ | 3,300 | $ | 3,300 | $ | — | ||||||||||
Description | Level 1 | Level 2 | Level 3 | Balance as of December 31, 2015 | Total Impairment During the Twelve Months Ended December 31, 2015 | |||||||||||
Real estate and development costs - Heathers at Westport project | $ | 975 | $ | 975 | $ | — | ||||||||||
Real estate and development costs - Sundance project | $ | 9,448 | $ | 9,448 | $ | — | ||||||||||
Real estate and development costs - River Run project | $ | 5,960 | $ | 5,960 | $ | 923 | ||||||||||
There were no such real estate impairment losses recorded for the three and nine months ended September 30, 2015. For the year ended December 31, 2015, an impairment of $923,000 was recorded to homebuilding real estate inventory in the River Run project, located in Bakersfield, California, to adjust its carrying value to its estimated fair value as of the date of the impairment.
9. EQUITY
Noncontrolling Interest
As of September 30, 2016, the Company holds an approximately 43.1% economic interest in UCP, LLC and is its sole managing member; UCP, LLC is fully consolidated.
The carrying value and ending balance as of September 30, 2016 of the noncontrolling interest was calculated as follows (in thousands):
Beginning balance of noncontrolling interest as of December 31, 2015 | $ | 127,208 | |
Net income attributable to noncontrolling interest | 3,109 | ||
Re-allocation of stock issuances | (1,909 | ) | |
Stock-based compensation attributable to noncontrolling interest | 423 | ||
Stock issuance attributable to noncontrolling interest | (25 | ) | |
Distribution to noncontrolling interest | (4,830 | ) | |
Ending balance of noncontrolling interest as of September 30, 2016 | $ | 123,976 | |
The distribution to the noncontrolling interest relates to cash distributions, which we refer to as “tax distributions,” that UCP, LLC is obligated to make as noted in the Company’s Annual Report on Form 10-K that was filed with the Securities and Exchange Commission on March 14, 2016.
Stock Repurchase Program
As part of the Board approved Stock Repurchase Program, between June 7, 2016 and June 1, 2018, management is authorized to repurchase up to $5.0 million of the Company’s Class A common stock in open market purchases, privately negotiated transactions or other transactions. The Stock Repurchase Program is subject to prevailing market conditions and other considerations, including our liquidity, the terms of our debt instruments, planned land investment and development spending, acquisition and other investment opportunities and ongoing capital requirements.
22
Since inception of the program through September 30, 2016, the Company repurchased an aggregate of 123,636 shares of Class A common stock for total consideration of $1.0 million, inclusive of commissions. The remaining value of shares that may be repurchased under the Stock Repurchase Program as of September 30, 2016 is approximately $4.0 million. The Company previously did not have a stock repurchase program, therefore there were no stock repurchases for the year ended December 31, 2015.
Re-Allocation from Stock Issuances
The Company allocates Class A common stock issued in connection with the vesting of RSUs issued under the UCP, Inc. 2013 Long-Term Incentive Plan (the “LTIP”) and stock-based compensation expense between additional paid-in-capital and noncontrolling interest within its condensed consolidated statements of equity. The equity allocations for the noncontrolling interest are based on the economic and voting interest percentages of the Company and its noncontrolling interest holder, PICO. Issuances of Class A common stock for RSUs affect the economic and voting interest percentages, which accordingly are adjusted at the end of each issuance period. The economic and voting interest percentages prevailing during the period are used to determine the current period equity allocations for the noncontrolling interest.
Stock-Based Compensation
The LTIP was adopted in July 2013 and provides for the grant of equity-based awards, including options to purchase shares of Class A common stock, Class A stock appreciation rights, Class A restricted stock, Class A RSUs and performance awards. The LTIP automatically expires on the tenth anniversary of its effective date. The Company’s board of directors may terminate or amend the LTIP at any time, subject to any stockholder approval required by applicable law, rule or regulation.
The number of shares of the Company’s Class A common stock authorized under the LTIP was 1,834,300 shares. To the extent that shares of the Company’s Class A common stock subject to an outstanding option, stock appreciation right, stock award or performance award granted under the LTIP are not issued or delivered by reason of the expiration, termination, cancellation or forfeiture of such award or the settlement of such award in cash, then such shares of the Company’s Class A common stock generally shall again be available under the LTIP, subject to certain exceptions.
The RSUs and Options granted to the Company’s employees during the year ended December 31, 2014 are subject to the following vesting schedule: a) 10% vested on the first anniversary of the grant date, b) 20% vest on second anniversary of the grant date, c) 30% vest on the third anniversary of the grant date, and d) 40% vest on the fourth anniversary of the grant date. The RSUs granted to the Company’s employees and certain members of the Company’s board of directors during the three months ended June 30, 2016 are subject to the following vesting schedule: a) 20% vest on the first anniversary of the grant date, b) 20% vest on second anniversary of the grant date, c) 20% vest on the third anniversary of the grant date, d) 20% vest on the fourth anniversary of the grant date, and e) 20% vest on the fifth anniversary of the grant date. The RSUs granted to the Company’s board of directors during the three months ended September 30, 2016 are subject to the following vesting schedule: a) 25% vested on August 5, 2016, b) 25% vest on November 4, 2016, c) 25% vest on February 3, 2017, and d) 25% vest on May 4, 2017.
During the three and nine months ended September 30, 2016, the Company recognized $0.3 million and $0.7 million of stock-based compensation expense, respectively, which was included in G&A expenses in the accompanying unaudited condensed consolidated statements of operations and other comprehensive income or loss. For the three and nine months ended September 30, 2015, the Company recognized $0.3 million and $1.6 million of stock-based compensation expense, respectively.
23
The following table summarizes the Options activity for the nine months ended September 30, 2016:
Shares | Weighted Average Exercise Price | Weighted Average Remaining Contractual Term (in years) | Aggregate Intrinsic Value (in thousands)(1) | |||||||
Outstanding as of December 31, 2015 | 149,605 | $ | 16.20 | 8.20 | — | |||||
Options granted | — | — | — | — | ||||||
Options exercised | — | — | — | — | ||||||
Options forfeited | — | — | — | — | ||||||
Options expired | (32,953 | ) | — | — | — | |||||
Outstanding as of September 30, 2016 | 116,652 | $ | 16.20 | 7.40 | — | |||||
Options vested and exercisable as of September 30, 2016 | 34,996 | $ | 16.20 | — | — | |||||
Options vested and expected to vest as of September 30, 2016 | 108,486 | |||||||||
(1) The aggregate intrinsic value is calculated as the amount by which the fair value of the underlying stock exceeds the exercise price of the Option. The fair value of the Company’s Class A common stock as of September 30, 2016 was $8.81 per share.
The Company uses the Black-Scholes option pricing model to determine the fair value of Options. During the nine months ended September 30, 2016, the Company had 32,953 vested Options that expired in the second quarter of 2016 based on the Resignation Agreement with the Company’s former Chief Financial Officer and Treasurer.
The following table summarizes the RSU activity for the nine months ended September 30, 2016:
Number of Shares | Weighted Average Grant Date Fair Value (per share) | ||||
Outstanding and unvested as of December 31, 2015 | 48,531 | $15.99 | |||
Granted | 271,635 | 8.04 | |||
Vested | (27,850 | ) | 13.42 | ||
Forfeited | — | — | |||
Outstanding and unvested as of September 30, 2016 | 292,316 | $8.85 | |||
Unrecognized compensation cost for RSUs and Options issued under the LTIP was $2.4 million (net of estimated forfeitures) as of September 30, 2016; approximately $2.0 million of the unrecognized compensation costs related to RSUs and $0.4 million related to Options. The compensation expense is expected to be recognized over a weighted average period of 3.5 years for the RSUs and 1.4 years for the Options.
10. SEGMENT INFORMATION
The Company has two operating segments, West and Southeast, and two reportable segments, Homebuilding and Land development.
Operating Segments | Reportable Segments | State | ||
West | Homebuilding | California, Washington | ||
Land development | California, Washington | |||
Southeast | Homebuilding | North Carolina, South Carolina, Tennessee | ||
Land development | North Carolina, South Carolina, Tennessee | |||
Each reportable segment includes real estate with similar economic characteristics, including similar historical and expected long-term gross margin percentages, product types, geography, production processes and methods of distribution.
24
The reportable segments follow the same accounting policies described in Note 1, “Organization, Basis of Presentation and Summary of Significant Accounting Policies.” Operating results of each reportable segment are not necessarily indicative of the results that would have been achieved had the reportable segment been an independent, stand-alone entity during the periods presented.
The Company evaluates the performance of the operating segments based upon gross margin. “Gross Margin” is defined as operating revenues less cost of sales (cost of construction and acquisition, interest, abandonment, impairment and other cost of sales related expenses). Corporate sales, G&A expense and gains or losses are reflected within overall corporate expenses as this constitutes the Company’s primary business objective, supporting all segments. Corporate expenses are not particularly identifiable to any one segment.
Financial information relating to reportable segments is as follows (in thousands):
Three months ended September 30, | Nine months ended September 30, | ||||||||||||||||||||||||||||||
2016 | 2015 | 2016 | 2015 | ||||||||||||||||||||||||||||
Revenues | Gross Margin | Revenues | Gross Margin | Revenues | Gross Margin | Revenues | Gross Margin | ||||||||||||||||||||||||
Homebuilding | |||||||||||||||||||||||||||||||
West | $ | 79,500 | $ | 15,129 | $ | 51,464 | $ | 10,477 | $ | 204,273 | $ | 38,149 | $ | 120,438 | $ | 22,589 | |||||||||||||||
Southeast | 10,340 | 1,535 | 18,820 | 2,801 | 35,207 | 5,313 | 43,267 | 6,372 | |||||||||||||||||||||||
Total homebuilding | 89,840 | 16,664 | 70,284 | 13,278 | 239,480 | 43,462 | 163,705 | 28,961 | |||||||||||||||||||||||
Land development | |||||||||||||||||||||||||||||||
West | 3,900 | 66 | 1,116 | 400 | 5,322 | (940 | ) | 3,156 | 892 | ||||||||||||||||||||||
Southeast | — | — | — | — | — | (389 | ) | — | — | ||||||||||||||||||||||
Total land development | 3,900 | 66 | 1,116 | 400 | 5,322 | (1,329 | ) | 3,156 | 892 | ||||||||||||||||||||||
Other (a) | — | — | 2,272 | 314 | — | — | 5,060 | 697 | |||||||||||||||||||||||
Total | $ | 93,740 | $ | 16,730 | $ | 73,672 | $ | 13,992 | $ | 244,802 | $ | 42,133 | $ | 171,921 | $ | 30,550 | |||||||||||||||
(a) Other includes revenues from construction management services the Company acquired as part of the Citizens Acquisition and are not attributable to the homebuilding and land development operations. The business was sold in the fourth quarter of 2015 and the Company no longer provides construction management services to third parties.
Reconciliation of gross margin to net income (loss) is as follows (in thousands):
Three months ended September 30, | Nine months ended September 30, | ||||||||||||||
2016 | 2015 | 2016 | 2015 | ||||||||||||
Gross margin | $ | 16,730 | $ | 13,992 | $ | 42,133 | $ | 30,550 | |||||||
Sales and marketing | 4,853 | 4,692 | 13,595 | 13,246 | |||||||||||
General and administrative | 4,592 | 5,539 | 19,101 | 19,311 | |||||||||||
Goodwill impairment | 4,223 | — | 4,223 | — | |||||||||||
Income (loss) from operations | 3,062 | 3,761 | 5,214 | (2,007 | ) | ||||||||||
Other income, net | 204 | 45 | 253 | 177 | |||||||||||
Net income (loss) before income taxes | 3,266 | 3,806 | 5,467 | (1,830 | ) | ||||||||||
Provision for income taxes | (124 | ) | — | (271 | ) | — | |||||||||
Net income (loss) | $ | 3,142 | $ | 3,806 | $ | 5,196 | $ | (1,830 | ) | ||||||
25
Total assets for each reportable and operating segment as of September 30, 2016 and December 31, 2015, are shown in the table below (in thousands):
September 30, 2016 | December 31, 2015 | ||||||
Homebuilding | |||||||
West | $ | 232,904 | $ | 231,624 | |||
Southeast | 54,168 | 49,464 | |||||
Total homebuilding | 287,072 | 281,088 | |||||
Land development | |||||||
West | 94,631 | 79,901 | |||||
Southeast | — | — | |||||
Total land development | 94,631 | 79,901 | |||||
Other (a) | 40,489 | 53,708 | |||||
Total | $ | 422,192 | $ | 414,697 | |||
(a) Other assets primarily include cash and cash equivalents, deposits and fixed assets which are maintained centrally and used according to the cash flow requirements of all reportable segments.
11. COMMITMENTS AND CONTINGENCIES
Legal and Regulatory Matters
Lawsuits, claims and proceedings have been or may be instituted or asserted against the Company in the normal course of business, including actions brought on behalf of various classes of claimants. The Company is also subject to local, state and federal laws and regulations related to land development activities, home construction standards, sales practices, employment practices and environmental protection. As a result, the Company is subject to periodic examinations or inquiries by agencies administering these laws and regulations.
The Company records a reserve for potential legal claims and regulatory matters when they are probable of occurring and a potential loss is reasonably estimable. The accrual for these matters is based on facts and circumstances specific to each matter and the Company revises these estimates when necessary.
In view of the inherent difficulty of predicting outcomes of legal claims and related contingencies, the Company generally cannot predict their ultimate resolution, related timing or any eventual loss. If the evaluations indicate loss contingencies that could be material are not probable, but are reasonably possible, disclosure of the nature with an estimate of possible range of losses or a statement that such loss is not reasonably estimable is made. The Company is not involved in any material litigation nor, to the Company's knowledge, is any material litigation threatened against it. As of September 30, 2016 and December 31, 2015, the Company did not have any accruals for asserted or unasserted matters.
Purchase Commitments
In the ordinary course of business, we may enter into purchase or option contracts to procure lots for development and construction of homes. We are subject to customary obligations associated with entering into contracts for the purchase of land. These contracts to purchase properties typically require a cash deposit and are generally contingent upon satisfaction of certain requirements by the sellers, including obtaining applicable property and development entitlements.
We may also utilize purchase or option contracts with land sellers as a method of acquiring land in staged takedowns to help us manage the financial and market risks associated with land holdings and to reduce the use of funds from corporate financing sources. Purchase or option contracts generally require a non-refundable deposit for the right to acquire lots over a specified period of time at pre-determined prices. We generally have the right to terminate obligations under both purchase or option contracts by forfeiting the cash deposit with no further financial responsibility to the land seller.
Purchase contracts provide the Company with an option to purchase land. The ability to enter into option purchase agreements depends on the availability of land that sellers are willing to sell under option takedown arrangements, the availability of capital from financial intermediaries to finance the development of land, general housing market conditions and local market dynamics.
26
On September 9, 2016, we entered into an Option and Development Agreement whereby we assigned the purchase of a land parcel in Hollister, California, located in San Benito County. Under the agreement, we will develop the land into finished lots with an option to purchase 241 finished lots on a monthly takedown basis that expires on April 25, 2020, subject to an extension. Land development costs we incur are reimbursable under a fixed price contract. As part of the agreement, we made a non-refundable deposit of $6.1 million in consideration of the purchase option. Because we do not own the land, costs that we incur up to the fixed price amount, for developing the finished lots will be treated as a receivable for the amounts due. As of September 30, 2016, approximately $2.8 million of reimbursable land development costs under an option and development agreement executed during the third quarter of 2016 was recorded as a receivable.
As of September 30, 2016, we had outstanding $7.7 million of cash deposits pertaining to purchase or option contracts for 1,123 lots with an aggregate remaining purchase price of approximately $49.1 million. As of December 31, 2015, we had outstanding $3.8 million of cash deposits pertaining to purchase or option contracts for 1,127 lots with an aggregate remaining purchase price of approximately $80.1 million.
Endangered Species Act
The U.S. Fish and Wildlife Service (“USFWS”) has listed the pocket gopher as a threatened species under the Federal Endangered Species Act. This species is present on land owned by UCP in Washington State. The Company believes that this project will incur additional costs relating to the listing of the pocket gopher by USFWS, including potential costs related to (i) acquiring offsite mitigation property, (ii) redesigning the project to incorporate onsite mitigation, and (iii) processing the required approvals with USFWS and the city.
During meetings with USFWS earlier in the year, the Company discussed acquiring additional land in the same county to satisfy the mitigation requirements through the purchase and dedication of offsite property. Two specific pieces of agricultural property were identified, and the local USFWS office has informally indicated these properties appear to be suitable to satisfy the mitigation requirements. Based on these discussions, the Company is currently under contract to purchase approximately $955,000. However, the Company is unable to completely quantify the costs until the mitigation requirements are established by USFWS, either through its general modeling tool, or the approval of an individual habitat conservation plan for the project. The purchase costs of mitigation property are included in the appropriate project budgets.
Surety Bonds
The Company obtains surety bonds from third parties in the normal course of business to ensure completion of certain infrastructure improvements at its projects. The performance bonds secure the completion of projects and/or support of obligations to build community improvements, such as roads, sewers, water systems and other utilities. As of September 30, 2016 and December 31, 2015, the Company had outstanding surety bonds totaling $39.6 million and $37.1 million, respectively. In the event that any such surety bond issued by a third party is called because the required improvements are not completed, the Company could be obligated to reimburse the issuer of the bond. Performance bonds do not have stated expiration dates. Rather, the Company is released from a performance bond as the underlying performance is completed. We do not expect that a material amount of any currently outstanding performance bonds will be called.
Operating Leases
The Company leases some of its offices under non-cancellable operating leases that expire at various dates through 2020 and thereafter. Rent expense for the three and nine months ended September 30, 2016 for office space was approximately $0.3 million and $1.0 million, respectively. For the three and nine months ended September 30, 2015, rent expense for office space was approximately $0.3 million and $0.9 million, respectively.
27
Future minimum payments under all operating leases for the years ending December 31 are as follows (in thousands):
2016 | $ | 256 | |
2017 | 1,029 | ||
2018 | 937 | ||
2019 | 413 | ||
2020 | 213 | ||
Thereafter | 18 | ||
Total | $ | 2,866 | |
Contingent Consideration
The change in estimated fair value of the contingent consideration relating to the Citizens Acquisition consisted of the following (in thousands):
Contingent Consideration | |||
Balance as of December 31, 2014 | $ | 3,525 | |
Change in fair value | (818 | ) | |
Balance as of September 30, 2015 | $ | 2,707 | |
Contingent Consideration | |||
Balance as of December 31, 2015 | $ | 2,707 | |
Change in fair value | (2,400 | ) | |
Balance as of September 30, 2016 | $ | 307 | |
The contingent consideration arrangement relating to the Citizens Acquisition requires the Company to pay up to a maximum of $6.0 million of additional consideration based upon the achievement of various pre-tax net income performance milestones (“performance milestones”) by the assets acquired in the Citizens Acquisition over a five-year period that commenced on April 1, 2014. Payout calculations are made based on calendar year performance except for the sixth payout calculation which will be calculated based on the achievement of performance milestones from January 1, 2019 through March 25, 2019. Payouts are made on an annual basis. The potential undiscounted amount of all future payments that the Company could be required to make under the contingent consideration arrangement is between $0 and $6 million. The fair value of the contingent consideration of $0.3 million as of September 30, 2016 was estimated based on applying the weighted probability of achievement of the performance milestones. See Note 8, “Fair Value Disclosures” for a further discussion of the fair value measurement of contingent consideration.
12. INCOME TAXES
For the three and nine months ended September 30, 2016, a provision for income taxes of $124,000 and $271,000, respectively, was recorded. No tax provision was recorded for the three and nine months ended September 30, 2015. The increase in the year over year income tax provision is primarily related to Alternative Minimum Tax as a result of the Company’s increase in earnings for the three and nine months ended September 30, 2016, as compared to the same periods in 2015.
As a result of the analysis of all available evidence as of September 30, 2016 and December 31, 2015, the Company continued to record a full valuation allowance on its net deferred tax assets. If the Company’s assumptions change and the Company believes that it will be able to realize these deferred tax assets, the tax benefits relating to any reversal of the valuation allowance on deferred tax assets will be recognized as a reduction of future income tax expense. If the assumptions do not change, each period the Company could record an additional valuation allowance on any increases in the deferred tax assets. See Note 1, “Organization, Basis of Presentation and Summary of Significant Accounting Policies--Income Taxes” for a further discussion of income taxes.
28
Item 2. Management’s Discussion and Analysis of Financial Condition and Results of Operations (“MD&A”)
SPECIAL NOTE REGARDING FORWARD-LOOKING STATEMENTS
We make forward-looking statements in this Management's Discussion and Analysis of Financial Condition and Results of Operations and in other sections of this report that are subject to risks, uncertainties and assumptions. All statements other than statements of historical fact included in this report are forward-looking statements. You can identify forward-looking statements by the fact that they do not relate strictly to historical facts. These statements may include words such as “may,” “might,” “will,” “should,” “expects,” “plans,” “anticipates,” “believes,” “estimates,” “predicts,” “potential,” “project,” “goal,” “intend” or “continue,” the negative of these terms and other comparable terminology. These forward-looking statements may include projections of our future financial or operating performance, our anticipated growth strategies, anticipated trends in our business and other future events or circumstances. These statements are based on our current expectations and projections about future events and may prove to be inaccurate.
Forward-looking statements involve numerous risks and uncertainties and you should not rely on them as predictions of future events. Forward-looking statements depend on assumptions, data or methods which may prove to be incorrect or imprecise and may prove to be inaccurate. We do not guarantee that the transactions and events described in any forward-looking statements will happen as described (or that they will happen at all). The following factors, among others, could cause actual results and future events to differ materially from those set forth or contemplated in the forward-looking statements:
• | economic changes, either nationally or in the markets in which we operate, including declines in employment, volatility of mortgage interest rates, declines in consumer sentiment and an increase in inflation; |
• | downturns in the homebuilding industry, either nationally or in the markets in which we operate; |
• | continued volatility and uncertainty in the credit markets and broader financial markets; |
• | the operating performance of our business; |
• | changes in our business and investment strategy; |
• | availability of land to acquire and our ability to acquire land on favorable terms or at all; |
• | availability, terms and deployment of capital; |
• | disruptions in the availability of mortgage financing or increases in the number of foreclosures in our markets; |
• | shortages of or increased prices for labor, land or raw materials used in housing construction; |
• | delays or restrictions in land development or home construction, or reduced consumer demand resulting from adverse weather and geological conditions or other events outside our control; |
• | the cost and availability of insurance and surety bonds; |
• | changes in, or the failure or inability to comply with, governmental laws and regulations; |
• | the timing of receipt of regulatory approvals and the opening of communities; |
• | the degree and nature of our competition; |
• | our leverage and debt service obligations; |
• | our future operating expenses, which may increase disproportionately to our revenue; |
• | our ability to achieve operational efficiencies with future revenue growth; |
• | our relationship, and actual and potential conflicts of interest, with PICO, which owns a 56.9% economic interest in our primary operating subsidiary, UCP, LLC, as of September 30, 2016 and has commensurate voting power in UCP, Inc.; and |
29
• | availability of, and our ability to retain, qualified personnel. |
For a further discussion of these and other factors, see the “Risk Factors” disclosed in our Annual Report on Form 10-K for the year ended December 31, 2015. In light of these risks and uncertainties, the forward-looking statements discussed in this report might not occur. You are cautioned not to place undue reliance on forward-looking statements, which speak only as of the date of this report. While forward-looking statements reflect our good faith beliefs, they are not guarantees of future performance, and our actual results could differ materially from those expressed in any forward-looking statement. We disclaim any obligation to publicly update or revise any forward-looking statement to reflect changes in underlying assumptions or factors, new information, data or methods, future events or other changes, except as required by law.
30
OVERVIEW
Select Operating Metrics
For the three months ended September 30, 2016, as compared to the same period during 2015:
•Consolidated net income decreased to $3.1 million as compared to $3.8 million;
•Basic earnings per share of Class A common stock (“EPS”) for the quarter was $0.16 as compared to $0.21;
•Net new home orders increased 14.4% to 247;
•Backlog value increased 30.1% to $157.2 million;
•Home deliveries decreased 1.5% to 199;
•Average sales price of a home closed increased 29.6% to $451,000 per home;
•Homebuilding revenue increased by $19.6 million, or 27.8%, to $89.8 million;
•Consolidated gross margin decreased by 120 basis points to 17.8%;
•Homebuilding gross margin decreased by 40 basis points to 18.5%;
•As a percentage of total revenue, Sales and Marketing expenses decreased to 5.2% from 6.4%; and
• | As a percentage of total revenue, G&A expenses decreased to 4.9% from 7.5%. |
For the nine months ended September 30, 2016 as compared to the same period during 2015:
•Consolidated net income increased to $5.2 million as compared to a net loss of $1.8 million;
•Basic EPS for the nine months was $0.26 as compared to negative $0.11;
•Net new home orders increased 3.7% to 701;
•Home deliveries increased 17.8% to 563;
•Homebuilding revenue increased by $75.8 million, or 46.3%, to $239.5 million;
•Consolidated gross margin decreased by 60 basis points to 17.2%;
•Homebuilding gross margin increased by 40 basis points to 18.1%;
•As a percentage of total revenue, Sales and Marketing expenses decreased to 5.6% from 7.7%; and
•As a percentage of total revenue, G&A expenses decreased to 7.8% from 11.2%.
As of September 30, 2016, we recorded a $4.2 million impairment to goodwill, partially offset by a $2.4 million reduction in our contingent consideration obligation.
During the three months ended September 30, 2016, our homebuilding revenues increased by $19.6 million, or 27.8%, to $89.8 million, as compared to $70.3 million for the three months ended September 30, 2015. The growth in homebuilding revenue was due to the increase in our average selling price (“ASP”) of homes delivered during the three months ended September 30, 2016 to $451,000 as compared to $348,000 during the three months ended September 30, 2015.
As a result of strong market demand, we have been able to reduce our use of sales incentives. For the three months ended September 30, 2016, sales incentives accounted for 1.6% of revenues down from 2.4% for the three months ended September 30, 2015. The most significant decline in the use of sales incentives was in our Central Valley, North Carolina, the Pacific Northwest and Tennessee divisions partially offset by increases in our Southern California, and South Carolina divisions. The Bay Area division remained relatively flat, with only a small increase. Sales incentives are a reduction to revenue as we record sales incentives as a reduction in the sales price of a home.
31
During the nine months ended September 30, 2016, our homebuilding revenues increased by $75.8 million, or 46.3%, to $239.5 million, as compared to $163.7 million for the nine months ended September 30, 2015. The growth in homebuilding revenue was primarily due to the 17.8% increase in homes delivered and the 24.3% increase in ASP of homes delivered during the nine months ended September 30, 2016 to $425,000 as compared to $342,000 during the nine months ended September 30, 2015.
Our land development segment revenues, given our opportunistic strategy towards this business segment, increased by $2.8 million, or 249.5%, to $3.9 million during the three months ended September 30, 2016, as compared to $1.1 million during the three months ended September 30, 2015.
Consolidated net income was $3.1 million for the three months ended September 30, 2016, as compared to $3.8 million for the three months ended September 30, 2015. For the nine months ended September 30, 2016, consolidated net income was $5.2 million, as compared to a net loss of $1.8 million for the nine months ended September 30, 2015.
As of September 30, 2016, we had $27.6 million of cash and cash equivalents, excluding restricted cash, on hand. We had outstanding debt of $157.8 million and equity of $217.5 million. As a result, our Debt-to-Capital and Net Debt-to-Capital was 42.0% and 40.0%, respectively. Our Net Debt-to-Capital is a non-GAAP financial measure. See “Liquidity and Capital Resources-Debt-to-Capital and Net Debt-to-Capital Ratios” below for a reconciliation of this non-GAAP financial measure to the most directly comparable financial measure calculated and presented in accordance with GAAP.
Backlog consists of homes under contract that have not yet been delivered. Our backlog value as of September 30, 2016 was $157.2 million, representing approximately a $36.3 million increase, or 30.1%, as compared to our September 30, 2015 backlog of $120.8 million. In units, our backlog as of September 30, 2016 was 387 homes, representing an increase of 34.4%, as compared to 288 homes in backlog as of September 30, 2015.
As of September 30, 2016, we owned or controlled a total of 5,484 residential lots, representing a 7.0 year supply based on our delivery of 786 homes for the twelve months ended September 30, 2016.
As of September 30, 2016, we had 559 homes in inventory, which included 421 homes under construction and 138 completed homes as shown in the charts below:
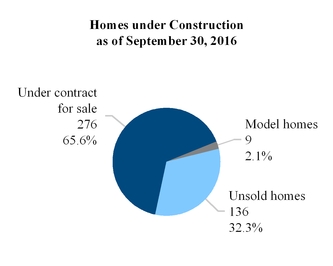
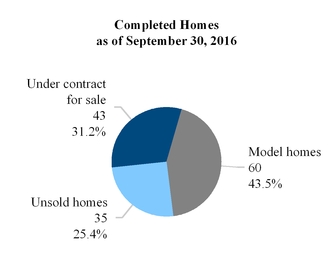
32
Our Business Environment and Current Outlook
During the three and nine months ended September 30, 2016, the overall U.S. housing market continued to show signs of improvement, driven by factors such as continued supply and demand imbalance, low mortgage rates and employment growth. Individual markets continue to experience varying results, as local home inventories, affordability and employment factors strongly influence local markets.
Homebuilding and land development are local businesses. As a result, we expect local market conditions will affect our community count, revenue and operating performance. Local market trends are the principal factors that impact our revenue and our revenue-related expenses. For example, when these trends are favorable, we expect our revenues from homebuilding and land development, as well as the expenses that vary with revenue, to generally increase; conversely, when these trends are negative, we expect our revenue and expenses that vary with revenue to generally decline, although in each case the impact may not be immediate or directly proportional. When trends are favorable, we expect to increase our community count by opening additional communities and expanding existing communities; conversely, when these trends are negative, we expect to reduce or maintain our community count or decrease the pace at which we open additional communities and expand existing communities.
Our operations for the three and nine months ended September 30, 2016 reflect our continued focus on a number of initiatives, including growing our homebuilding operations and revenues (by seeking increased home sales at our existing communities), improving our gross margin percentage, improving our operating efficiency (by seeking to reduce non-revenue-related expenses as a percentage of revenue), and managing our balance sheet (by maintaining appropriate cash balances, real estate inventories and leverage).
We believe that our land position in markets where the approval process for land development and home construction is stringent and time consuming gives us a competitive advantage. We believe that by serving diverse market segments, including first-time, move-up, empty-nester, active-adult, and second-home buyers, mitigates the risk associated with any one market segment. We also believe that we operate in geographic markets that currently have strong housing fundamentals. These markets include the San Francisco Bay area, the San Jose and the South Bay areas, Monterey and the Central Valley areas of California, the Seattle area of Washington, Charlotte, North Carolina, Myrtle Beach, South Carolina and Nashville, Tennessee.
During the remainder of 2016, we intend to seek revenue growth and increased productivity from our homebuilding operations in both our West and Southeast operating segments. We also intend to continue our strategy of selectively buying and selling land when we believe that it is opportunistic to do so. We also intend to seek additional regional and corporate-level operating efficiencies. Additionally, we intend to maintain appropriate cash balances and liquidity in order to meet our obligations and provide growth capital to our operations.
33
RESULTS OF OPERATIONS
Consolidated Financial Data - Three and Nine Months Ended September 30, 2016 and 2015
Three months ended September 30, | Nine months ended September 30, | ||||||||||||||||||||||
2016 | 2015 | Change | 2016 | 2015 | Change | ||||||||||||||||||
($ in thousands) | ($ in thousands) | ||||||||||||||||||||||
Revenue: | |||||||||||||||||||||||
Homebuilding | $ | 89,840 | $ | 70,284 | $ | 19,556 | $ | 239,480 | $ | 163,705 | $ | 75,775 | |||||||||||
Land development | 3,900 | 1,116 | 2,784 | 5,322 | 3,156 | 2,166 | |||||||||||||||||
Other | — | 2,272 | (2,272 | ) | — | 5,060 | (5,060 | ) | |||||||||||||||
Total revenue | 93,740 | 73,672 | 20,068 | 244,802 | 171,921 | 72,881 | |||||||||||||||||
Cost of Sales: | |||||||||||||||||||||||
Homebuilding | 72,984 | 57,006 | 15,978 | 195,561 | 134,744 | 60,817 | |||||||||||||||||
Land development | 3,834 | 716 | 3,118 | 4,519 | 2,264 | 2,255 | |||||||||||||||||
Other | — | 1,958 | (1,958 | ) | — | 4,363 | (4,363 | ) | |||||||||||||||
Impairment on real estate | 192 | — | 192 | 2,589 | — | 2,589 | |||||||||||||||||
Gross Margin | 16,730 | 13,992 | 2,738 | 42,133 | 30,550 | 11,583 | |||||||||||||||||
Expenses: | |||||||||||||||||||||||
Sales and marketing | 4,853 | 4,692 | 161 | 13,595 | 13,246 | 349 | |||||||||||||||||
General and administrative | 4,592 | 5,539 | (947 | ) | 19,101 | 19,311 | (210 | ) | |||||||||||||||
Goodwill impairment | 4,223 | — | 4,223 | 4,223 | — | 4,223 | |||||||||||||||||
Total expenses | 13,668 | 10,231 | 3,437 | 36,919 | 32,557 | 4,362 | |||||||||||||||||
Income (loss) from operations | 3,062 | 3,761 | (699 | ) | 5,214 | (2,007 | ) | 7,221 | |||||||||||||||
Other income | 204 | 45 | 159 | 253 | 177 | 76 | |||||||||||||||||
Net income (loss) before tax | $ | 3,266 | $ | 3,806 | $ | (540 | ) | $ | 5,467 | $ | (1,830 | ) | $ | 7,297 | |||||||||
Provision for income taxes | (124 | ) | — | (124 | ) | (271 | ) | — | (271 | ) | |||||||||||||
Net income (loss) | $ | 3,142 | $ | 3,806 | $ | (664 | ) | $ | 5,196 | $ | (1,830 | ) | $ | 7,026 | |||||||||
Non-GAAP Financial Measures
In addition to the results reported in accordance with GAAP, we have provided information in this quarterly report derived from our unaudited condensed consolidated financial statements but not prepared in accordance with GAAP. These are considered non-GAAP measures in which we have identified and reconciled the information to the most directly comparable GAAP financial measure. Specifically, we refer to the following non-GAAP financial measures in various sections of this report:
•Adjusted gross margin
•Net debt-to-capital ratio
Reasons for the use of non-GAAP financial measures and the reconciliations to their most directly comparable GAAP financial measures are included in the relevant sections within the MD&A.
34
Select Operating Metrics - Three and Nine Months Ended September 30, 2016 and 2015
Net New Home Orders and Cancellation Rate
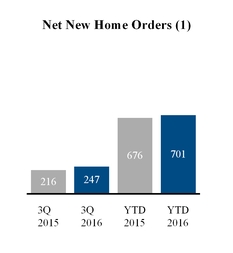
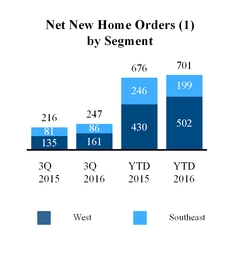
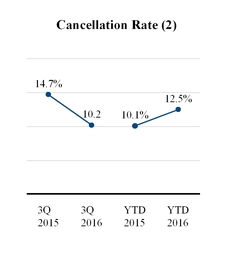
(1) “Net new home orders” refers to new home sales contracts reduced by the number of sales contracts canceled during the relevant period. | (2) “Cancellation rate” refers to sales contracts canceled divided by sales contracts executed during the relevant period. | |
For the three and nine months ended September 30, 2016, our net new home orders increased by 31 and 25 homes, or 14.4% and 3.7%, respectively, as compared to the same periods in 2015. Net new home orders for the three and nine months ended September 30, 2016 in our West operating segment grew 19.3% and 16.7%, respectively, as compared to the same periods in 2015. Our West operating segment continues to experience strong demand that is exceeding building capacity in many communities. As a result, we continue to limit sales to approximately a six month supply of backlog. In our West operating segment, net new orders grew most dramatically in our Bay Area division for the three months ended September 30, 2016. This dramatic growth in our Bay Area division was a result of strong demand coupled with an increase in active selling communities in our Bay Area division to seven, as of September 30, 2016, from six active selling communities as of September 30, 2015. Net new home orders in our West operating segment for the nine months ended September 30, 2016 increased in our Central Valley, Bay Area and Pacific Northwest divisions.
Net new home orders in our Southeast operating segment grew 6.2% during the three months ended September 30, 2016 and declined 19.1% during the nine months ended September 30, 2016, as compared to the same periods in 2015. The growth in the Southeast operating segment for the three month period was driven by 240.0% growth in our Nashville division on a year-over-year basis. For the nine months ended September 30, 2016, our Southeast operating segment experienced a decline in net new home orders across all divisions. During the nine months ended September 30, 2016, new order activity in our Southeast operating segment has been adversely impacted by weather that has delayed community openings and the abandonment of a number of land positions, earlier in the year, that did not meet our underwriting criteria.
35
Active Selling Communities and Absorption
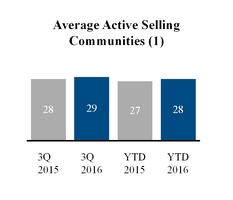
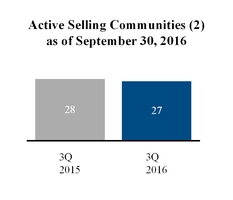
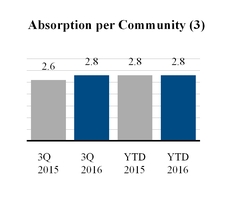
(1) “Average Active Selling Communities during the period” refers to the average number of open selling communities at the end of each month during the period. | (2) “Active Selling Communities” consists of those communities where we have more than 15 or more homes remaining to deliver. | (3) “Absorption per Community” refers to the number of net new home orders sold in each active selling community for the period. | ||
The number of average active selling communities for both the three and nine months ended September 30, 2016 increased by one, as compared to the same periods in 2015. During the three months ended September 30, 2016, we closed-out five communities, three in our Central Valley division and two in our Tennessee division. During the three months ended September 30, 2016 we opened three new communities, two in our Central Valley division and one in our Tennessee division. In addition to the communities closed-out and opened during the three months ended September 30, 2016, we closed-out an additional four communities (one in each of our SF Bay, Central Valley, Washington and South Carolina divisions) and opened five new communities (two in our SF Bay division, and one in each of our Central Valley, North Carolina and South Carolina divisions) for the nine months ended September 30, 2016.
Absorption per community per month increased by 0.2 homes to 2.8 homes per community per month and remained level at 2.8 homes per community per month for the three and nine months ended September 30, 2016, respectively, as compared to the same periods in 2015. This was primarily due to growth in our absorption in our West operating segment to 3.0 homes per community per month during the three months ended September 30, 2016 as compared to 2.4 homes per community per month during the same period in 2015.
36
Backlog - As of September 30, 2016
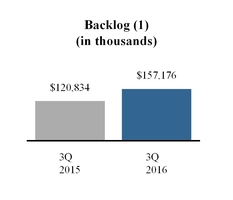
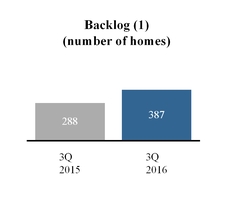
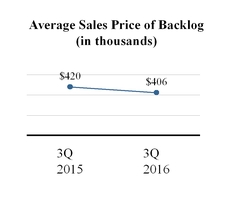
Our backlog value of $157.2 million as of September 30, 2016 represented an increase of approximately $36.3 million, or 30.1%, as compared to our backlog value of $120.8 million as of September 30, 2015. The increase was due to an increase of 99 unit homes in backlog, partially offset by a decrease of $14,000 in the ASP of homes in backlog to $406,000 as of September 30, 2016, as compared to September 30, 2015. The increase in the number of homes in backlog was a result of an increase of 66 homes in backlog in our West operating segment and an increase of 33 homes in backlog in our Southeast operating segment as of September 30, 2016, as compared to September 30, 2015. The mix of homes in backlog between our two operating segments remained fairly constant as of September 30, 2016 and September 30, 2015 (as shown in the charts below).
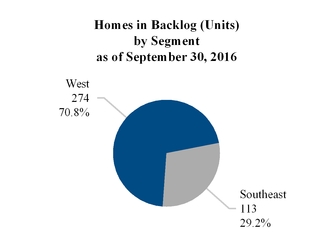
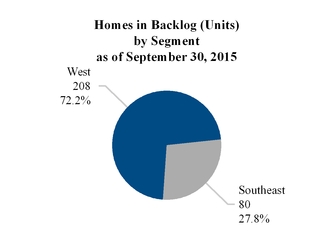
(1) | “Backlog” refers to homes under sales contracts that have not yet closed at the end of the relevant period. Sales contracts relating to homes in backlog may be canceled by the purchaser for a number of reasons, such as the prospective purchaser's inability to obtain mortgage financing. Upon a cancellation, the escrow deposit is returned to the prospective purchaser (other than with respect to certain design-related deposits, which we retain). Accordingly, backlog may not be indicative of our future revenue. |
37
Owned and Controlled Lots - As of September 30, 2016 and December 31, 2015
As of September 30, 2016 and December 31, 2015, we owned or controlled, pursuant to purchase or option contracts, an aggregate of 5,484 and 5,878 lots, respectively, as set forth in the graphs below:
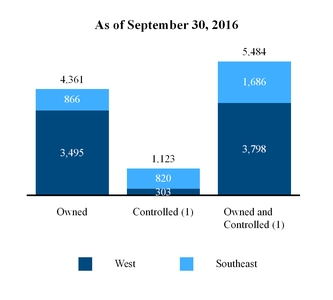
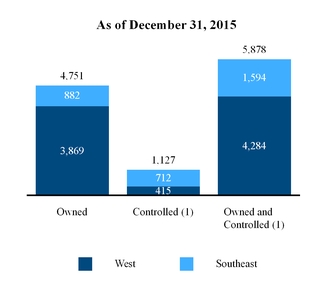
(1) | Controlled lots are those subject to a purchase or option contract. |
As of September 30, 2016, our total lots owned decreased by 390 lots and total lots controlled decreased by four lots since December 31, 2015. This reflects our continued emphasis during 2016 on managing our existing communities across our geographies and seeking regional and corporate-level operating efficiencies, as opposed to increasing our inventory of owned and controlled lots.
Revenue
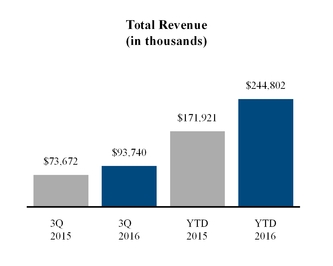
For the three months ended September 30, 2016, total revenue increased by $20.1 million, or 27.2%, as compared to the same period in 2015. The increase in total revenue was the result of an increase of $20.5 million in the ASP of homes delivered during the 2016 period and an increase in land development revenue of $2.8 million, which were partially offset by a decrease of three homes in the number of home deliveries, as compared to the same period in 2015.
For the nine months ended September 30, 2016, total revenue increased by $72.9 million, or 42.4%, as compared to the same period in 2015. The increase in total revenue was the result of an increase of 85 homes in home deliveries, an increase of $46.7 million in the ASP of homes delivered during the 2016 period, coupled with an increase in land development revenue, as compared to the same period in 2015.
38
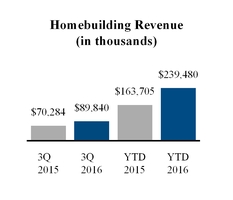
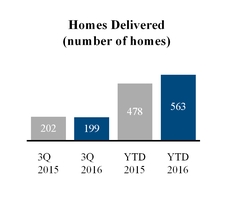
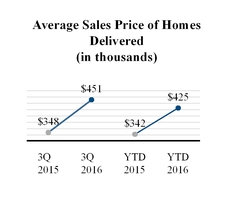
For the three months ended September 30, 2016, homebuilding revenue increased by $19.6 million, or 27.8%, as compared to the same period in 2015. The increase was as a result of a 29.6% increase in the ASP of homes delivered, to $451,000, during the 2016 period, as compared to the same period in 2015. This revenue increase was attributable to approximately $20.5 million of additional revenue related to an increase in ASP partially offset by approximately $1.0 million related to a 1.5% decrease in home deliveries in the 2016 period as compared to the 2015 period. The increase in our ASP during the three months ended September 30, 2016 was attributable to an increase in ASP across most of the divisions in our West and Southeast operating segments, as compared to the same period in 2015.
For the nine months ended September 30, 2016, homebuilding revenue increased by $75.8 million, or 46.3%, as compared to the same period in 2015. The increase was primarily the result of a 17.8% increase in home deliveries and a 24.3% increase in the ASP of homes delivered to $425,000 during the 2016 period, as compared to the same period in 2015. Of this revenue increase, $46.7 million was related to the increase in ASP and $29.1 million was related to the increase in the number of homes delivered. The increase in the ASP during the 2016 period was primarily the result of an increase in the number of homes delivered in our West operating segment, which accounted for 73.4% of deliveries, or a 45.9% increase, during the nine months ended September 30, 2015, as compared to the same period in 2015.
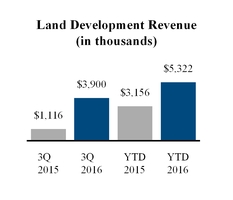
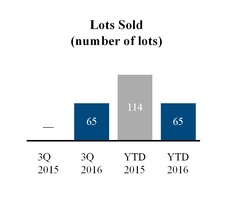
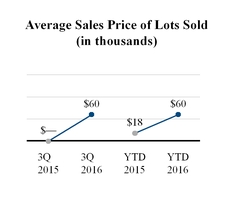
For the three months ended September 30, 2016, revenue from land development increased by $2.8 million, or 249.5%, as compared to same period in 2015. The $3.9 million in land development revenue during the third quarter of 2016 was related to the sale of 65 Sundance lots, as previously impaired and disclosed. For nine months ended September 30, 2016, land development revenue increased by $2.2 million, or 68.6%, as compared to same period in 2015.
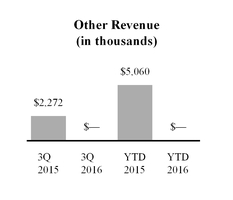
Other revenue for the three and nine months ended September 30, 2016 was zero and approximately $2.3 million and $5.1 million for the three and nine months ended September 30, 2015, respectively. Other revenue during 2015 was related to construction management services provided to third-party property owners primarily under “cost plus fee” contracts, which was conducted in our Southeast operations. We sold this business in the fourth quarter of 2015, and we no longer provide construction management services to third parties.
39
Non-GAAP Financial Measures
In addition to the results reported in accordance with GAAP, we have provided information in this report relating to “adjusted gross margin” which is a non-GAAP financial measure. The most directly comparable GAAP financial measure is gross margin. We calculate adjusted gross margin from GAAP gross margin by adding back capitalized interest, and impairment and abandonment charges. We use adjusted gross margin information as a supplemental measure when evaluating our operating performance. We believe this information is meaningful, because it isolates the impact that leverage and non-cash impairment and abandonment charges have on gross margin. However, because adjusted gross margin information excludes interest expense, and impairment and abandonment charges, all of which have real economic effects and could materially impact our results, the utility of adjusted gross margin information as a measure of our operating performance is limited.
In addition, other companies may not calculate adjusted gross margin information in the same manner that we do. Accordingly, adjusted gross margin information should be considered only as a supplement to gross margin information as a measure of our performance.
Gross Margin (“GM”) and Adjusted Gross Margin (“Adjusted GM”)
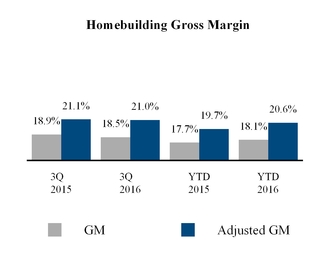
For the three months ended September 30, 2016, our homebuilding gross margin percentage decreased 0.4%, as compared to the same period in 2015, partially due to the $0.2 million real estate impairment charge that occurred during the third quarter of 2016 related to the last four completed homes available for sale, in our North Carolina community, Heathers at Westport. Additionally, during the three months ended September 30, 2015, we reduced cost of sales expense and therefore increased homebuilding gross margin by $744,000 or 1.0% as a result of reducing accrued expenses associated with warranty reserves and other accrued construction costs related to prior years. Removing the real estate impairment and reversal of accrued expenses the homebuilding gross margin as a percentage of revenue would have been 18.8% and 17.9% for the three months ended September 30, 2016 and 2015, respectively.
For the nine months ended September 30, 2016, our homebuilding gross margin percentage increased 0.4%, as compared to the same period in 2015, primarily due to an increase in ASP that was partially offset by impairments of home inventory of $0.5 million and cost increases during the 2016 period as compared to the 2015 period.
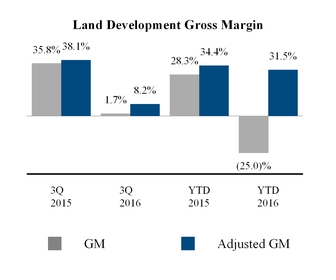
For the three months ended September 30, 2016, our land development gross margin percentage decreased 34.1%, as compared to the same period in 2015, primarily due to the $2.1 million real estate impairment charge that occurred during the second quarter of 2016 related to a proposed land sale at Sundance. This land sale closed in the third quarter and, as a result of the previous impairment, this land sale did not result in a significant gross margin.
For the nine months ended September 30, 2016, our land development gross margin percentage decreased 53.3%, as compared to the same period in 2015, primarily due to the $2.1 million real estate impairment charge on Sundance during the second quarter of 2016 coupled with a decision to abandon a number of land acquisition opportunities resulting in $0.5 million in abandonment charges.
40
The following table provides a reconciliation of adjusted gross margin information to gross margin information the most comparable GAAP financial measure:
($ in thousands) | Three months ended September 30, | Nine months ended September 30, | |||||||||||||||||||||||||
2016 | % | 2015 | % | 2016 | % | 2015 | % | ||||||||||||||||||||
Consolidated Gross Margin & Adjusted Gross Margin | |||||||||||||||||||||||||||
Revenue | $ | 93,740 | 100.0 | % | $ | 73,672 | 100.0 | % | $ | 244,802 | 100.0 | % | $ | 171,921 | 100.0 | % | |||||||||||
Cost of Sales | 77,010 | 82.2 | % | 59,680 | 81.0 | % | 202,669 | 82.8 | % | 141,371 | 82.2 | % | |||||||||||||||
Gross Margin | 16,730 | 17.8 | % | 13,992 | 19.0 | % | 42,133 | 17.2 | % | 30,550 | 17.8 | % | |||||||||||||||
Add: interest in cost of sales | 2,214 | 2.4 | % | 1,443 | 2.0 | % | 5,689 | 2.3 | % | 3,416 | 2.0 | % | |||||||||||||||
Add: impairment and abandonment charges | 223 | 0.2 | % | 144 | 0.2 | % | 3,094 | 1.3 | % | 146 | 0.1 | % | |||||||||||||||
Adjusted Gross Margin(1) | $ | 19,167 | 20.4 | % | $ | 15,579 | 21.1 | % | $ | 50,916 | 20.8 | % | $ | 34,112 | 19.8 | % | |||||||||||
Consolidated Gross margin percentage | 17.8 | % | 19.0 | % | 17.2 | % | 17.8 | % | |||||||||||||||||||
Consolidated Adjusted gross margin percentage(1) | 20.4 | % | 21.1 | % | 20.8 | % | 19.8 | % | |||||||||||||||||||
Homebuilding Gross Margin & Adjusted Gross Margin | |||||||||||||||||||||||||||
Homebuilding revenue | $ | 89,840 | 100.0 | % | $ | 70,284 | 100.0 | % | $ | 239,480 | 100.0 | % | $ | 163,705 | 100.0 | % | |||||||||||
Cost of home sales | 73,176 | 81.5 | % | 57,006 | 81.1 | % | 196,019 | 81.9 | % | 134,744 | 82.3 | % | |||||||||||||||
Homebuilding gross margin | 16,664 | 18.5 | % | 13,278 | 18.9 | % | 43,461 | 18.1 | % | 28,961 | 17.7 | % | |||||||||||||||
Add: interest in cost of home sales | 1,990 | 2.2 | % | 1,443 | 2.1 | % | 5,319 | 2.2 | % | 3,367 | 2.1 | % | |||||||||||||||
Add: impairment and abandonment charges | 192 | 0.2 | % | 119 | 0.2 | % | 458 | 0.2 | % | — | — | % | |||||||||||||||
Adjusted homebuilding gross margin(1) | $ | 18,846 | 21.0 | % | $ | 14,840 | 21.1 | % | $ | 49,238 | 20.6 | % | $ | 32,328 | 19.7 | % | |||||||||||
Homebuilding gross margin percentage | 18.5 | % | 18.9 | % | 18.1 | % | 17.7 | % | |||||||||||||||||||
Adjusted homebuilding gross margin percentage(1) | 21.0 | % | 21.1 | % | 20.6 | % | 19.7 | % | |||||||||||||||||||
Land Development Gross Margin & Adjusted Gross Margin | |||||||||||||||||||||||||||
Land development revenue | $ | 3,900 | 100.0 | % | $ | 1,116 | 100.0 | % | $ | 5,322 | 100.0 | % | $ | 3,156 | 100.0 | % | |||||||||||
Cost of land development | 3,834 | 98.3 | % | 716 | 64.2 | % | 6,650 | 125.0 | % | 2,264 | 71.7 | % | |||||||||||||||
Land development gross margin | 66 | 1.7 | % | 400 | 35.8 | % | (1,328 | ) | (25.0 | )% | 892 | 28.3 | % | ||||||||||||||
Add: interest in cost of land development | 224 | 5.7 | % | — | — | % | 370 | 7.0 | % | 49 | 1.6 | % | |||||||||||||||
Add: Impairment and abandonment charges | 31 | 0.8 | % | 25 | 2.2 | % | 2,636 | 49.5 | % | 146 | 4.6 | % | |||||||||||||||
Adjusted land development gross margin(1) | $ | 321 | 8.2 | % | $ | 425 | 38.1 | % | $ | 1,678 | 31.5 | % | $ | 1,087 | 34.4 | % | |||||||||||
Land development gross margin percentage | 1.7 | % | 35.8 | % | (25.0 | )% | 28.3 | % | |||||||||||||||||||
Adjusted land development gross margin percentage(1) | 8.2 | % | 38.1 | % | 31.5 | % | 34.4 | % | |||||||||||||||||||
Other Revenue Gross and Adjusted Margin | |||||||||||||||||||||||||||
Revenue | $ | — | — | % | $ | 2,272 | 100.0 | % | $ | — | — | % | $ | 5,060 | 100.0 | % | |||||||||||
Cost of revenue | — | — | % | 1,958 | 86.2 | % | — | — | % | 4,363 | 86.2 | % | |||||||||||||||
Other revenue gross and adjusted margin | $ | — | — | % | $ | 314 | 13.8 | % | $ | — | — | % | $ | 697 | 13.8 | % | |||||||||||
Other revenue gross and adjusted margin percentage | — | % | 13.8 | % | — | % | 13.8 | % | |||||||||||||||||||
* | Percentages may not add due to rounding. |
(1) | Adjusted gross margin, adjusted homebuilding gross margin and adjusted land development gross margin are non-GAAP financial measures. |
41
Sales and Marketing, and General and Administrative Expenses (“SG&A”)
Our operating expenses for the three and nine months ended September 30, 2016 and 2015 were as follows:
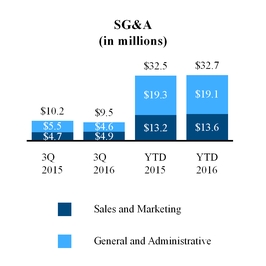
As a percentage of total revenue | ||||||||||||
Three months ended September 30, | Nine months ended September 30, | |||||||||||
2016 | 2015 | 2016 | 2015 | |||||||||
Sales and marketing | 5.2 | % | 6.4 | % | 5.6 | % | 7.7 | % | ||||
General and administrative | 4.9 | % | 7.5 | % | 7.8 | % | 11.2 | % | ||||
Total sales and marketing and general and administrative | 10.1 | % | 13.9 | % | 13.4 | % | 18.9 | % | ||||
Sales and marketing expense for the three and nine months ended September 30, 2016 increased approximately $0.2 million and $0.3 million, respectively. The increase in sales and marketing expense was primarily attributable to the increase in homebuilding revenue of 27.8% and 46.3%, in each respective period, impacting variable sales expenses including commissions and closings costs, partially offset by a decrease in fixed sales and marketing expenses, during the three and nine months ended September 30, 2016, as compared to the same periods in 2015.
G&A expenses for the three and nine months ended September 30, 2016 decreased by approximately $0.9 million and $0.2 million, respectively, as compared to the same periods in 2015. The primary reason for the decrease in G&A expense during the quarter was the $2.4 million reduction in contingent consideration recorded in the current quarter as compared to a $1.0 million reduction in contingent consideration recorded in the same quarter of 2015. Contingent consideration is associated with the Citizens Acquisition. In addition, we recorded bonus expense for divisional and executive personnel in the current quarter when there was no such expense in the same period last year. We continued to reduce G&A expense as a percentage of revenue primarily due to revenue growth and our ability to continue to manage G&A expenses tightly.
Provision for Income Taxes
As a result of the analysis of all available evidence as of September 30, 2016 and 2015, we continued to record a full valuation allowance on our net deferred tax assets. If our assumptions change and we believe we will be able to realize these deferred tax assets, the tax benefits relating to any reversal of the valuation allowance on our deferred tax assets will be recognized as a reduction of future income tax expense. If the assumptions do not change, in each period we could record an additional valuation allowance on any increases in the deferred tax assets.
For the three and nine months ended September 30, 2016, a provision for income taxes of $124,000 and $271,000, respectively, was recorded. No provision for income taxes was recorded for either the three or nine months ended September 30, 2015. See Note 12, “Income Taxes” and Note 1, “Organization, Basis of Presentation and Summary of Significant Accounting Policies--Income Taxes” to the accompanying unaudited condensed consolidated financial statements included elsewhere in this report for a further discussion of income taxes.
42
Net Income or Loss and Income or Loss per Share of Class A Common Stock
Our net income (or loss) and income (or loss) per share of Class A Common Stock for the three and nine months ended September 30, 2016 and 2015 were as follows:
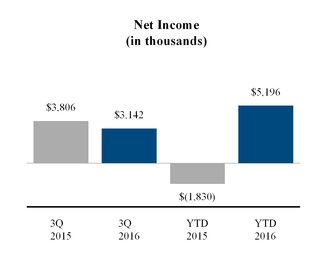
Our net income for the three months ended September 30, 2016 decreased $0.7 million, as compared to same period in 2015. The net income attributable to UCP, Inc. for the three months ended September 30, 2016 was $1.3 million, as compared to $1.6 million for the three months ended September 30, 2015.
For the nine months ended September 30, 2016, our net income increased $7.0 million, as compared to the same period in 2015. The net income attributable to UCP, Inc. was $2.1 million for the nine months ended September 30, 2016, as compared to the net loss attributable to UCP, Inc. of $0.9 million for the nine months ended September 30, 2015.
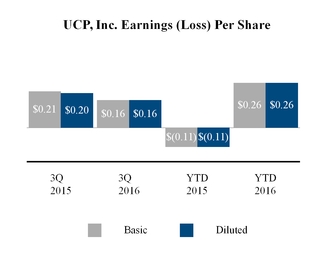
EPS of UCP, Inc. Class A common stock for the three months ended September 30, 2016 was $0.16 per basic and diluted share, as compared to $0.21 per basic share and $0.20 per diluted share for the three months ended September 30, 2015.
For the nine months ended September 30, 2016, EPS of UCP, Inc. Class A common stock was $0.26 per basic and diluted share, as compared to the $0.11 loss per basic and diluted share for the nine months ended September 30, 2015.
43
REPORTING SEGMENTS
The Company periodically evaluates its homebuilding and land development operations in an effort to allocate resources properly. Based on this evaluation, the Company has classified its operating activities into two operating segments, West and Southeast. See Note 10, “Segment Information” to the accompanying unaudited condensed consolidated financial statements included elsewhere in this report. The following table presents financial information related to our homebuilding and land development reporting segments for the periods indicated ($ in thousands):
Three months ended September 30, | Nine months ended September 30, | ||||||||||||||||||||||||||||||||||||||||||
2016 | 2015 | 2016 | 2015 | ||||||||||||||||||||||||||||||||||||||||
Revenues | Gross Margin | GM % | Revenues | Gross Margin | GM % | Revenues | Gross Margin | GM % | Revenues | Gross Margin | GM % | ||||||||||||||||||||||||||||||||
Homebuilding | |||||||||||||||||||||||||||||||||||||||||||
West | $ | 79,500 | $ | 15,129 | 19.0 | % | $ | 51,464 | $ | 10,477 | 20.4 | % | $ | 204,273 | $ | 38,149 | 18.7 | % | $ | 120,438 | $ | 22,589 | 18.8 | % | |||||||||||||||||||
Southeast | 10,340 | 1,535 | 14.8 | % | 18,820 | 2,801 | 14.9 | % | 35,207 | 5,313 | 15.1 | % | 43,267 | 6,372 | 14.7 | % | |||||||||||||||||||||||||||
Total homebuilding | 89,840 | 16,664 | 18.5 | % | 70,284 | 13,278 | 18.9 | % | 239,480 | 43,462 | 18.1 | % | 163,705 | 28,961 | 17.7 | % | |||||||||||||||||||||||||||
Land development | |||||||||||||||||||||||||||||||||||||||||||
West | 3,900 | 66 | 1.7 | % | 1,116 | 400 | 35.8 | % | 5,322 | (940 | ) | (17.7 | )% | 3,156 | 892 | 28.3 | % | ||||||||||||||||||||||||||
Southeast | — | — | — | % | — | — | — | % | — | (389 | ) | — | % | — | — | — | % | ||||||||||||||||||||||||||
Total land development | 3,900 | 66 | 1.7 | % | 1,116 | 400 | 35.8 | % | 5,322 | (1,329 | ) | (25.0 | )% | 3,156 | 892 | 28.3 | % | ||||||||||||||||||||||||||
Other (a) | — | — | — | % | 2,272 | 314 | 13.8 | % | — | — | — | % | 5,060 | 697 | 13.8 | % | |||||||||||||||||||||||||||
Total | $ | 93,740 | $ | 16,730 | 17.8 | % | $ | 73,672 | $ | 13,992 | 19.0 | % | $ | 244,802 | $ | 42,133 | 17.2 | % | $ | 171,921 | $ | 30,550 | 17.8 | % | |||||||||||||||||||
(a) Other includes revenues from construction management services the Company acquired as part of the Citizens Acquisition and are not attributable to the homebuilding or land development operations. The business was sold in the fourth quarter of 2015, and the Company no longer provides construction management services to third parties.
The homebuilding gross margin percentage in our West operating segment for the three months ended September 30, 2016 decreased to 19.0% from 20.4% during the same period in 2015. The difference in gross margin from year to year is a result of the reversal of accrued expenses, including accrued warranty and construction costs in the amount of $744,000. All of this was recorded in our West operating segment during the three months ended September 30, 2015. If not for this reduction in costs, the homebuilding gross margin as a percentage of revenue would have been 18.9% for the three months ended September 30, 2015, as compared to 19.0% for the three months ended September 30, 2016.
As previously discussed, the lower gross margin in our West land development segment for the three months ended September 30, 2016, as compared to the same period in 2015, was the result of the land sale in Bakersfield, California. These 65 lots were previously impaired and written down to fair value in the prior quarter. As a result, the gross margin recorded related to this sale was minimal.
44
Homebuilding Operations
The following charts present information concerning homes delivered, ASP and revenue for our homebuilding operations by our West and Southeast operating segments ($ in thousands):
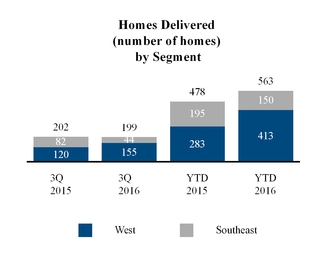
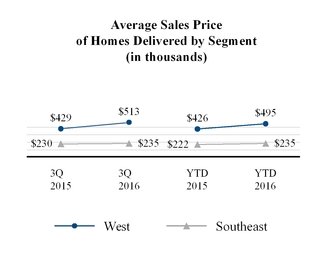
The increase in the ASP of a home delivered in our West operating segment during the three months ended September 30, 2016 was largely a result of product mix with more expensive homes providing a higher percentage of home closings during this period.
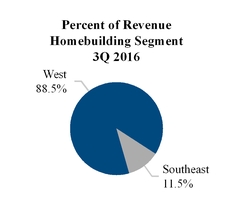
Three Months Ended September 30, 2016 | |||||||||||||||||
Segment | Homebuilding Revenue (in thousands) | % of Total Homebuilding Revenue | Homes Delivered | % of Total Homes Delivered | ASP (in thousands) | ||||||||||||
West | $ | 79,500 | 88.5 | % | 155 | 77.9 | % | $ | 513 | ||||||||
Southeast | 10,340 | 11.5 | % | 44 | 22.1 | % | 235 | ||||||||||
Total | $ | 89,840 | 100.0 | % | 199 | 100.0 | % | $ | 451 | ||||||||
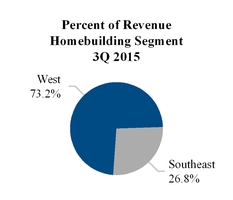
Three Months Ended September 30, 2015 | |||||||||||||||||
Segment | Homebuilding Revenue (in thousands) | % of Total Homebuilding Revenue | Homes Delivered | % of Total Homes Delivered | ASP (in thousands) | ||||||||||||
West | $ | 51,464 | 73.2 | % | 120 | 59.4 | % | $ | 429 | ||||||||
Southeast | 18,820 | 26.8 | % | 82 | 40.6 | % | 230 | ||||||||||
Total | $ | 70,284 | 100.0 | % | 202 | 100.0 | % | $ | 348 | ||||||||
45
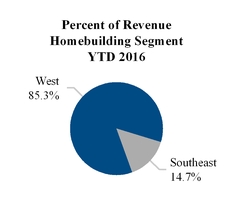
Nine Months Ended September 30, 2016 | |||||||||||||||||
Segment | Homebuilding Revenue (in thousands) | % of Total Homebuilding Revenue | Homes Delivered | % of Total Homes Delivered | ASP (in thousands) | ||||||||||||
West | $ | 204,273 | 85.3 | % | 413 | 73.4 | % | $ | 495 | ||||||||
Southeast | 35,207 | 14.7 | % | 150 | 26.6 | % | 235 | ||||||||||
Total | $ | 239,480 | 100.0 | % | 563 | 100.0 | % | $ | 425 | ||||||||
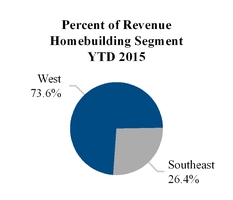
Nine Months Ended September 30, 2015 | |||||||||||||||||
Segment | Homebuilding Revenue (in thousands) | % of Total Homebuilding Revenue | Homes Delivered | % of Total Homes Delivered | ASP (in thousands) | ||||||||||||
West | $ | 120,438 | 73.6 | % | 283 | 59.2 | % | $ | 426 | ||||||||
Southeast | 43,267 | 26.4 | % | 195 | 40.8 | % | 222 | ||||||||||
Total | $ | 163,705 | 100.0 | % | 478 | 100.0 | % | $ | 348 | ||||||||
For both the three and nine months ended September 30, 2016, the increase in the percentage of homes closed in the West operating segment reflects strong demand in our West operating segment throughout 2016 coupled with delays in opening new communities as a result of wet weather that delayed land development efforts in our Southeast operating segment during late 2015 and that has continued through 2016.
46
Land Development Operations
The following tables present information concerning revenues and lots sold for our land development operations by our West and Southeast operating segments:
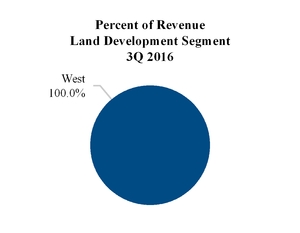
Three months ended September 30, | ||||||||||||||
2016 | 2015 | |||||||||||||
Segment | Land Development Revenue (in thousands) | Lots Sold | Land Development Revenue (in thousands) | Lots Sold | ||||||||||
West | $ | 3,900 | 65 | $ | 1,116 | — | ||||||||
Southeast | — | — | — | — | ||||||||||
Total | $ | 3,900 | 65 | $ | 1,116 | — | ||||||||
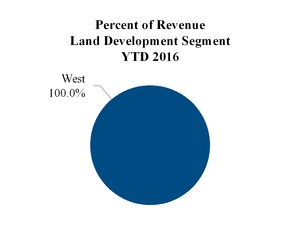
Nine months ended September 30, | ||||||||||||||
2016 | 2015 | |||||||||||||
Segment | Land Development Revenue (in thousands) | Lots Sold | Land Development Revenue (in thousands) | Lots Sold | ||||||||||
West | $ | 5,322 | 65 | $ | 3,156 | 114 | ||||||||
Southeast | — | — | — | — | ||||||||||
Total | $ | 5,322 | 65 | $ | 3,156 | 114 | ||||||||
47
LIQUIDITY AND CAPITAL RESOURCES
Our principal uses of capital are funding our operating expenses, investing activities (principally acquiring and developing land, and building homes) and repaying liabilities. Our principal sources of liquidity are cash on hand, cash provided by operations and cash provided by financing activities (such as acquisition, development and construction financing). As of September 30, 2016, we had approximately $28.5 million of cash and cash equivalents, which includes $0.9 million of restricted cash.
For the foreseeable future, we expect our principal uses of cash to be similar to what they have been in the past. We anticipate funding future capital requirements in a manner similar to our historical funding. For a description of our outstanding indebtedness as of September 30, 2016, see Note 7, “Notes Payable and Senior Notes, net” to the accompanying unaudited condensed consolidated financial statements included elsewhere in this report.
We believe that we have access to sufficient capital resources to fund our business for at least the next twelve months, including the repayment of our debt obligation. We generally have the ability to defer future investment activity, such as acquiring and developing land or building additional homes for sale, until such time as we have adequate capital resources available to us. We also have the ability to sell land as an ordinary part of our business, which is influenced by supply and demand, and other factors in the markets where we own land. As of September 30, 2016, our Debt to Total Capital and Net Debt to Total Capital, was 42.0% and 40.0%, respectively, providing us with significant financial flexibility.
Though our Senior Notes do not mature until October 2017, we are actively considering three primary alternatives to meet our obligations with respect to our Senior Notes. We may seek to extend the maturity of the Senior Notes or refinance the Senior Notes with new senior notes, including the option to arrange new senior notes in the public or private capital markets if conditions are favorable. We may also seek to refinance this indebtedness on a leverage neutral basis, by seeking to increase the amount of borrowings available under our acquisition, development and construction loans, which are secured by our real estate inventories. Finally, our cash position, which we believe we will continue to grow prior to maturity of the Senior Notes, may be used to meet a portion of our obligations with respect to the Senior Notes. Alternatively, we may choose to combine some or all of these, or other, potential sources of capital to meet our obligations with respect to the Senior Notes. Our determination of how to meet our obligations with respect to the Senior Notes and our success in so doing will depend upon various factors, including general market conditions, conditions in the credit markets, our financial position, operating performance, the value of our land inventories and prospects.
Our funding strategy contemplates the use of debt and equity financing and the reinvestment of cash from operations. We generally attempt to match the duration of our real estate assets with the duration of the capital that finances each real estate asset. We generally look to finance our homes under construction, which have a short duration, with a combination of long-term capital (equity and long-term debt) and short-term bank financing. We generally look to finance our finished lots that will be put in production within one year, and therefore have a short duration, with a combination of long-term capital (equity and long-term debt) and short-term bank financing. We generally look to finance our assets with a long duration, such as land held for future development or finished lots that will not be put into production for more than one year, with long-term capital (equity and long-term debt).
Senior Notes
The Senior Notes are guaranteed on an unsecured senior basis by each of our subsidiaries (the “Subsidiary Guarantors”). The Senior Notes and the guarantees are the Company’s, and the Subsidiary Guarantors’, senior unsecured obligations and rank equally in right of payment with all of our and the Subsidiary Guarantors’ existing and future senior unsecured debt and senior in right of payment to all of our and the Subsidiary Guarantors’ future subordinated debt. The Senior Notes and the guarantees are effectively subordinated to any of our and the Subsidiary Guarantors’ existing and future secured debt, to the extent of the value of the assets securing such debt.
We may redeem the Senior Notes, in whole but not in part, at any time at a price equal to 100% of the principal amount, plus accrued and unpaid interest, plus a “make-whole” premium. Upon the occurrence of a change of control, we must offer to repurchase the Senior Notes for cash at a price equal to 101% of the principal amount of the Senior Notes to be repurchased plus accrued and unpaid interest to, but excluding, the repurchase date. Under the Indenture, a “change of control” generally means (i) any person or group of related persons acquires more than 35% of our voting stock or (ii) we transfer all or substantially all of our consolidated assets to any person or group of related persons, in each case other than PICO and its affiliates.
The Indenture provides for customary “events of default” which could cause, or permit, the acceleration of the Senior Notes. Such events of default include: (i) a default in any payment of principal or interest on the Senior Notes; (ii) failure to comply with certain
48
covenants contained in the Indenture; (iii) defaults under certain other indebtedness or the acceleration of certain other indebtedness prior to maturity; (iv) the failure to pay certain final judgments; and (vi) certain events of bankruptcy or insolvency.
The Indenture limits our and our subsidiaries’ ability to, among other things, incur or guarantee additional unsecured and secured indebtedness (provided that we may incur indebtedness so long as our ratio of indebtedness to consolidated tangible assets (on a pro forma basis) would be equal to or less than 45% and provided that the aggregate amount of secured debt may not exceed the greater of $75 million or 30% of our consolidated tangible assets); pay dividends and make certain investments and other restricted payments, including purchase of our stock; acquire unimproved real property in excess of $75 million per fiscal year or in excess of $150 million over the term of the Senior Notes, except to the extent funded with subordinated obligations or the proceeds of equity issuances; create or incur certain liens; transfer or sell certain assets; and merge or consolidate with other companies or transfer or sell all or substantially all of our consolidated assets.
Additionally, the Indenture requires us to: (i) maintain at least $50 million of consolidated tangible assets not subject to liens securing indebtedness (the “Minimum Unlevered Asset Pool Test”); (ii) maintain a minimum net worth of at least $175 million (the “Minimum Net Worth Test”); (iii) maintain a minimum of $15 million of unrestricted cash and/or cash equivalents (the “Minimum Liquidity Test”); and (iv) not permit decreases in the amount of consolidated tangible assets by more than $25 million in any fiscal year or more than $50 million at any time after the issuance of the Senior Notes (the “Consolidated Tangible Assets Test”).
The foregoing is only a brief description of the Senior Notes and is qualified in its entirety by reference to the Indenture.
As set forth below, as of September 30, 2016, we were in compliance with each of the Minimum Unlevered Asset Pool Test, the Minimum Net Worth Test, the Minimum Liquidity Test and the Consolidated Tangible Assets Test. Capitalized terms used in the following table shall have the meanings assigned thereto in the Indenture.
49
As of September 30, 2016 | Requirement | ||||
(In thousands) | |||||
Minimum Unlevered Asset Pool Test | |||||
Consolidated Tangible Assets | $ | 409,289 | |||
Consolidated Tangible Assets subject to Liens (1) | 206,261 | ||||
Consolidated Tangible Assets not subject to Liens (1) | $ | 203,028 | ≥ $ 50,000 | ||
Minimum Net Worth Test | |||||
Consolidated Tangible Assets | $ | 409,289 | |||
Total Indebtedness | 157,785 | ||||
Net Worth | $ | 251,504 | ≥ $ 175,000 | ||
Minimum Liquidity Test | |||||
Cash and Cash Equivalents | $ | 28,486 | |||
Restricted Cash (2) | 900 | ||||
Unrestricted Cash and Cash Equivalents (2) | $ | 27,586 | ≥ $ 15,000 | ||
(In thousands) | |||||
Consolidated Tangible Assets Test | Requirement | ||||
Consolidated Tangible Assets as of September 30, 2016 | $ | 409,289 | |||
Consolidated Tangible Assets as of January 1, 2016 | 400,818 | ||||
Increase in Consolidated Tangible Assets during 2016 (3) | $ | 8,471 | Δ ≥ ( $25,000) | ||
Consolidated Tangible Assets as of September 30, 2016 | $ | 409,289 | |||
Consolidated Tangible Assets as of October 21, 2014 | 293,784 | ||||
Increase in Consolidated Tangible Assets since October 21, 2014 (3)(4) | $ | 115,505 | Δ ≥ ($50,000) | ||
Funded Debt to Tangible Assets Ratio Test | |||||
Funded Debt as of September 30, 2016 | $ | 157,785 | |||
Consolidated Tangible Assets as of September 30, 2016 | 409,289 | ||||
Funded Debt to Tangible Assets Ratio | 39 | % | ≤ 45% | ||
(1) | “Liens,” as used in this table, means Liens other than Liens of the type described in clauses (b), (c), (e), (f), (h), (i), (j), (t), (v), (w), (x) and (y) of the definition of “Permitted Liens” under the Indenture. In general, this excludes certain Liens securing obligations that are not indebtedness for money borrowed. |
(2) | Unrestricted cash and cash equivalents excludes restricted cash and other restricted cash balance requirements. Restricted cash excludes the $15 million requirement under the Indenture for purposes of the tests shown above. |
(3) We may not permit our Consolidated Tangible Assets to decrease by more than $25 million in any fiscal year or more than $50 million in the aggregate at any time after October 21, 2014 (i.e. the date of the issue of the Senior Notes).
(4) | Based on Consolidated Tangible Assets as of September 30, 2014, the end of the quarter immediately preceding the issue of the Senior Notes. |
In addition, (i) as of September 30, 2016 no Default or Event of Default (as such terms are defined in the Indenture) had occurred under the Indenture; (ii) all Asset Dispositions (as defined in the Indenture) made under the “Asset Disposition” covenant contained in the Indenture (Section 3.10) during the three months ended September 30, 2016 were made in compliance with such covenant; and (iii) any Restricted Payments (as defined in the Indenture) made during the three months ended September 30, 2016 complied in all respects with the requirements of the “Restricted Payments” covenant contained in the Indenture (Section 3.19).
Non-GAAP Financial Measure
In addition to the results reported in accordance with GAAP, we have provided information in this report relating to “net debt-to-capital ratio” which is a non-GAAP financial measure. The most directly comparable GAAP financial measure is the ratio of debt-to-capital. We believe that our leverage ratios provide useful information to the users of our financial statements regarding our financial position and cash and debt management.
50
The ratio of net debt-to-capital is computed as the quotient obtained by dividing net debt (which is debt less unrestricted cash and cash equivalents) by the sum of net debt plus stockholders’ and member's equity. We believe the ratio of net debt-to-capital is a relevant financial measure for investors to understand the leverage employed in our operations and as an indicator of our ability to obtain financing. We reconcile this non-GAAP financial measure to the ratio of debt-to-capital in the table above.
In addition, other companies may not calculate net debt-to-capital ratios in the same manner that we do. Accordingly, the net debt-to-capital ratio should be considered only as a supplement to the ratio of debt-to-capital information as a measure of our financial leverage.
Debt-to-Capital and Net Debt-to-Capital Ratios
The following table provides a reconciliation of our net debt-to-capital ratio to the most comparable GAAP financial measure ($ in thousands):
As of September 30, 2016 | As of December 31, 2015 | ||||||
Debt | $ | 157,785 | $ | 155,966 | |||
Equity | 217,472 | 217,408 | |||||
Total capital | $ | 375,257 | $ | 373,374 | |||
Ratio of debt-to-capital | 42.0 | % | 41.8 | % | |||
Debt | $ | 157,785 | $ | 155,966 | |||
Net cash and cash equivalents | $ | 28,486 | $ | 40,729 | |||
Less: restricted cash and minimum liquidity requirement | 15,900 | 15,900 | |||||
Unrestricted cash and cash equivalents | $ | 12,586 | $ | 24,829 | |||
Net debt | $ | 145,199 | $ | 131,137 | |||
Equity | 217,472 | 217,408 | |||||
Total adjusted capital | $ | 362,671 | $ | 348,545 | |||
Ratio of net debt-to-capital (1) | 40.0 | % | 37.6 | % | |||
(1) | The ratio of net debt-to-capital is a non-GAAP financial measure. |
51
Cash Flows - Nine Months Ended September 30, 2016 Compared to Nine Months Ended September 30, 2015
Our comparison of cash flows for the nine months ended September 30, 2016, as compared to the nine months ended September 30, 2015, is as follows ($ in thousands):
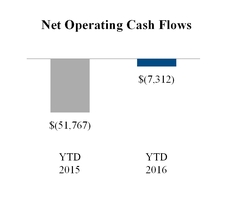
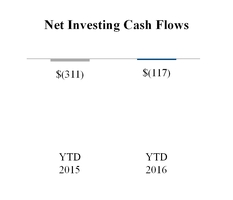
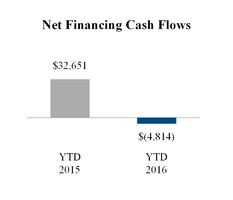
Cash flows used in operating activities were reduced by $44.5 million primarily due to the following:
• | We generated $11.3 million of net income before non-cash expenses of stock-based compensation, impairment and abandonment charges on real estate inventories, depreciation and amortization, goodwill impairment, bad debt expense, as well as, an adjustment to the fair value of our contingent consideration as compared to a net loss before non-cash expenses of $0.5 million for the same period during 2015. |
• | We used $23.1 million to finance an increase in real estate inventories, a decrease of $37.6 million as compared to the same period during 2015. The increase in inventories during the September 30, 2016 period was primarily attributable to a $5.3 million increase in the amount of land held and land under development. As of September 30, 2016, we had 559 homes in inventory as compared to 475 homes in inventory as of September 30, 2015. |
• | We generated $3.6 million in other assets and receivables during the nine months ended September 30, 2016, as compared to $2.1 million we used to finance growth in other assets and receivables during the same period in 2015. |
Cash flows used in investing activities increased $0.2 million primarily due to the following:
• | We decreased our purchases of fixed assets by during the nine months ended September 30, 2016, as compared to the same period in 2015. |
Cash flows from financing activities decreased $37.5 million primarily due to the following:
• | We decreased our net borrowings by $33.5 million as compared to the same period in 2015. The net borrowings during the nine months ended September 30, 2016 were proceeds from acquisition, development and construction loans which totaled $106.7 million while repayments on these loans totaled $105.5 million. |
• | We incurred $0.1 million in debt issuance costs for the nine months ended September 30, 2016, as compared to $0.7 million for the same period during 2015. |
• | We paid $4.8 million in a cash tax distribution to our noncontrolling interest (i.e. PICO) during the nine months ended September 30, 2016. For the same period in 2015, we paid a cash tax distribution to noncontrolling interest (i.e. PICO) of $1.0 million. |
As of September 30, 2016, our cash and cash equivalents balance, excluding restricted cash, was $27.6 million.
52
OFF-BALANCE SHEET ARRANGEMENTS AND CONTRACTUAL OBLIGATIONS
Our off-balance sheet arrangements and contractual obligations have been disclosed in the accompanying unaudited condensed consolidated financial statements as noted below:
Land Purchase and Land Option Contracts
For information regarding our land purchase and land option contracts, see Note 11, “Commitments and Contingencies--Purchase Commitments” to the accompanying unaudited condensed consolidated financial statements included elsewhere in this report.
Loan Commitments
For information regarding our debt, see Note 7, “Notes Payable and Senior Notes, net” to the accompanying unaudited condensed consolidated financial statements included elsewhere in this report.
Surety Bonds
For information regarding our surety bonds, see Note 11, “Commitments and Contingencies--Surety Bonds” to the accompanying unaudited condensed consolidated financial statements included elsewhere in this report.
INFLATION AND SEASONALITY
Inflation
Our business can be adversely impacted by inflation, primarily from higher land, financing, labor, material and construction costs. In addition, inflation can lead to higher mortgage rates, which can significantly affect the affordability of mortgage financing to home buyers. While we attempt to pass on cost increases to customers through increased prices, when weak housing market conditions exist, we are often unable to offset cost increases with higher selling prices. Additionally, rising mortgage rates may result in a decrease in the number of homes we sell and a reduction in selling prices.
Seasonality
Historically, the homebuilding industry experiences seasonal fluctuations in quarterly operating results and capital requirements. We typically experience the highest new home order activity in spring and summer, although this activity is also highly dependent on the number of active selling communities, the timing of new community openings and other market factors. Since it typically takes four to six months to construct a new home, we generally deliver more homes in the second half of the year as spring and summer home orders convert to home deliveries. Because of this seasonality, home starts, construction costs and related cash outflows have historically been highest in the second and third quarters, and the majority of cash receipts from home deliveries occur during the second half of the year. We expect this seasonal pattern to continue over the long-term, although it may be affected by volatility in the homebuilding industry.
RECENT ACCOUNTING PRONOUNCEMENTS
See Note 1, “Organization, Basis of Presentation and Summary of Significant Accounting Policies” to the accompanying unaudited condensed consolidated financial statements included elsewhere in this report regarding the impact of certain recent accounting pronouncements on our accompanying unaudited condensed consolidated financial statements.
53
Item 3. Quantitative and Qualitative Disclosure about Market Risk
We are exposed to market risks related to fluctuations in interest rates on our outstanding variable interest rate debt, which consists of our secured acquisition, construction and development loans. As of September 30, 2016, we had approximately $78.2 million of variable interest rate debt outstanding (or 49.3% of total indebtedness). If interest rates on our variable interest rate debt increase or decrease by 0.1 percent, our interest expense will increase or decrease by approximately $78,000. We did not hedge our exposure to changes in interest rates with swaps, forward or option contracts on interest rates, or other types of derivative financial instruments during the three months ended September 30, 2016. However, we may choose to hedge our exposure to changes in interest rates with these or other types of instruments in the future if, for example, we incur significant amounts of additional variable rate debt. We have not entered into and currently do not hold derivatives for trading or speculative purposes.
Based on the current amount and terms of our variable interest rate debt, we do not believe that the future changes in interest rates will have a material adverse impact on our financial position, results of operations or liquidity.
Item 4. Controls and Procedures
Evaluation of Disclosure Controls and Procedures
With the participation of our principal executive officer and principal financial officer, our management evaluated the effectiveness of our disclosure controls and procedures, as such term is defined in Rules 13a-15(e) and 15(d)- 15(e) under the Securities Exchange Act of 1934, as amended (the “Exchange Act”), as of September 30, 2016. Based on this evaluation, our principal executive officer and principal financial officer concluded that our disclosure controls and procedures were effective as of September 30, 2016.
Changes in Internal Control over Financial Reporting
There were no changes in our internal control over financial reporting (as defined in Rule 13a-15(f) under the Exchange Act) during the quarter ended September 30, 2016, that have materially affected, or are reasonably likely to materially affect, the Company’s internal control over financial reporting.
PART II: OTHER INFORMATION
Item 1. Legal Proceedings
We are not currently a party to any material litigation; however, the nature of our business exposes us to the risk of claims and litigation in the normal course of business. Other than routine litigation arising in the normal course of business, we are not presently subject to any material litigation, nor, to our knowledge, is any material litigation threatened against us. Although we are not currently involved in any material litigation, legal proceedings, regardless of outcome, can have an adverse impact on us because of defense and settlement costs, diversion of management resources and other factors. See Note 11, “Commitments and Contingencies,” to the accompanying unaudited condensed consolidated financial statements included elsewhere in this report.
Item 1A. Risk Factors
There have been no material changes in our assessment of our risk factors from those set forth in our Annual Report Form 10-K for the year ended December 31, 2015.
54
Item 2. Unregistered Sales of Equity Securities and Use of Proceeds
Issuer Purchases of Equity Securities
The following table summarizes repurchases of our Class A common stock made during the three months ended September 30, 2016:
Period | Total number of shares of Class A common stock purchased (a) | Average price paid per share of Class A common stock | Total number of shares of Class A common stock purchased as part of publicly announced plans or programs (a) | Maximum dollar value of shares of Class A common stock that may yet be purchased under the plans or programs (b) | |||||||||
July 1 to July 30, 2016 | 25,620 | $ | 8.08 | 25,620 | $ | 4,633,473 | |||||||
August 1 to August 31, 2016 | 76,951 | $ | 8.23 | 76,951 | $ | 4,000,006 | |||||||
September 1 to September 30, 2016 | — | $ | — | — | $ | 4,000,006 | |||||||
Total | 102,571 | $ | 8.19 | 102,571 | $ | 4,000,006 | |||||||
(a) These amounts represent shares repurchased by the Company under its Stock Repurchase Program. For additional information regarding stock repurchases, see Note 9, “Equity,” to the accompanying unaudited condensed consolidated financial statements included elsewhere in this report.
(b) Under the Stock Repurchase Program, which was established on June 6, 2016, management is authorized to purchase up to $5.0 million of Class A common stock through June 1, 2018. During the three months ended September 30, 2016, there were an aggregate of 102,571 shares of Class A common stock repurchased for $840,000, inclusive of commissions.
Item 3. Defaults Upon Senior Securities
None.
Item 4. Mine Safety Disclosures
Not applicable.
Item 5. Other Information
None.
55
Item 6. Exhibits
Exhibit Number | Description | |
31.1 | Certification of Dustin L. Bogue, Chief Executive Officer, pursuant to Rule 13a-14(a)/15d-14(a) of the Securities Exchange Act of 1934, as amended, as adopted pursuant to Section 302 of the Sarbanes-Oxley Act of 2002 | |
31.2 | Certification of James M. Pirrello, Chief Financial Officer, pursuant to Rule 13a-14(a)/15d-14(a) of the Securities Exchange Act of 1934, as amended, as adopted pursuant to Section 302 of the Sarbanes-Oxley Act of 2002 | |
32.1 | Certification of Dustin L. Bogue, Chief Executive Officer, pursuant to 18 U.S.C. Section 1350, as adopted pursuant to Section 906 of the Sarbanes-Oxley Act of 2002 | |
32.2 | Certification of James M. Pirrello, Chief Financial Officer, pursuant to 18 U.S.C. Section 1350 as adopted pursuant to Section 906 of the Sarbanes-Oxley Act of 2002 | |
101.INS | XBRL Instance Document | |
101.SCH | XBRL Taxonomy Extension Schema Document | |
101.CAL | XBRL Taxonomy Extension Calculation Linkbase Document | |
101.DEF | XBRL Taxonomy Extension Definition Linkbase Document | |
101.LAB | XBRL Taxonomy Extension Label Linkbase Document | |
101.PRE | XBRL Taxonomy Extension Presentation Linkbase Document | |
56
SIGNATURES
Pursuant to the requirements of the Securities Exchange Act of 1934, the Registrant has duly caused this report to be signed on its behalf by the undersigned thereunto duly authorized.
UCP, Inc. | |||||
Date: | October 31, 2016 | By: | /s/ | James M. Pirrello | |
James M. Pirrello | |||||
Chief Financial Officer, Chief Accounting Officer & Treasurer | |||||
(Principal Financial Officer and Authorized Signatory) | |||||
57