Attached files
| file | filename |
|---|---|
| EX-99.1 - EXHIBIT 99.1 - SCHULMAN A INC | shlmq416newsrelease.htm |
| 8-K - 8-K - SCHULMAN A INC | shlm161026pressrelease.htm |

A. Schulman Fiscal 2016 Fourth Quarter &
Full Year Earnings Call Supplemental Slides
Joe Gingo – Chairman, President and CEO
Joe Levanduski – EVP and CFO
John Richardson – EVP, Finance (CFO as of Nov. 1, 2016)
October 26, 2016
Exhibit 99.2
A number of the matters discussed in this document that are not historical or current facts deal with potential future circumstances and developments and August constitute "forward-looking
statements" within the meaning of the Private Securities Litigation Reform Act of 1995. Forward-looking statements can be identified by the fact that they do not relate strictly to historic or
current facts and relate to future events and expectations. Forward-looking statements contain such words as "anticipate,” "estimate," "expect," "project," "intend," "plan," "believe," and
other words and terms of similar meaning in connection with any discussion of future operating or financial performance. Forward-looking statements are based on management's current
expectations and include known and unknown risks, uncertainties and other factors, many of which management is unable to predict or control, that August cause actual results,
performance or achievements to differ materially from those expressed or implied in the forward-looking statements. Important factors that could cause actual results to differ materially from
those suggested by these forward-looking statements, and that could adversely affect the Company's future financial performance, include, but are not limited to, the following:
– worldwide and regional economic, business and political conditions, including continuing economic uncertainties in some or all of the Company's major product markets or countries
where the Company has operations;
– the effectiveness of the Company's efforts to improve operating margins through sales growth, price increases, productivity gains, and improved purchasing techniques;
– competitive factors, including intense price competition;
– fluctuations in the value of currencies in areas where the Company operates;
– volatility of prices and availability of the supply of energy and raw materials that are critical to the manufacture of the Company's products, particularly plastic resins derived from oil
and natural gas;
– changes in customer demand and requirements;
– effectiveness of the Company to achieve the level of cost savings, productivity improvements, growth and other benefits anticipated from acquisitions, joint ventures and
restructuring initiatives;
– escalation in the cost of providing employee health care;
– uncertainties and unanticipated developments regarding contingencies, such as pending and future litigation and other claims, including developments that would require increases
in our costs and/or reserves for such contingencies;
– the performance of the global automotive market as well as other markets served;
– further adverse changes in economic or industry conditions, including global supply and demand conditions and prices for products;
– operating problems with our information systems as a result of system security failures such as viruses, cyber-attacks or other causes;
– our current debt position could adversely affect our financial health and prevent us from fulfilling our financial obligations;
– integration of acquisitions, including most recently Citadel, with our existing business, including the risk that the integration will be more costly or more time consuming and complex
or simply less effective than anticipated;
– our ability to achieve the anticipated synergies, cost savings and other benefits from the Citadel acquisition;
– substantial time devoted by management to the integration of the Citadel acquisition; and
– failure of counterparties to perform under the terms and conditions of contractual arrangements, including suppliers, customers, buyers and sellers of a business and other third
parties with which the Company contracts.
The risks and uncertainties identified above are not the only risks the Company faces. Additional risk factors that could affect the Company's performance are
set forth in the Company's Annual Report on Form 10-K for the fiscal year ended August 31, 2016. In addition, risks and uncertainties not presently known to
the Company or that it believes to be immaterial also may adversely affect the Company. Should any known or unknown risks or uncertainties develop into
actual events, or underlying assumptions prove inaccurate, these developments could have material adverse effects on the Company's business, financial
condition and results of operations.
2
Cautionary Note

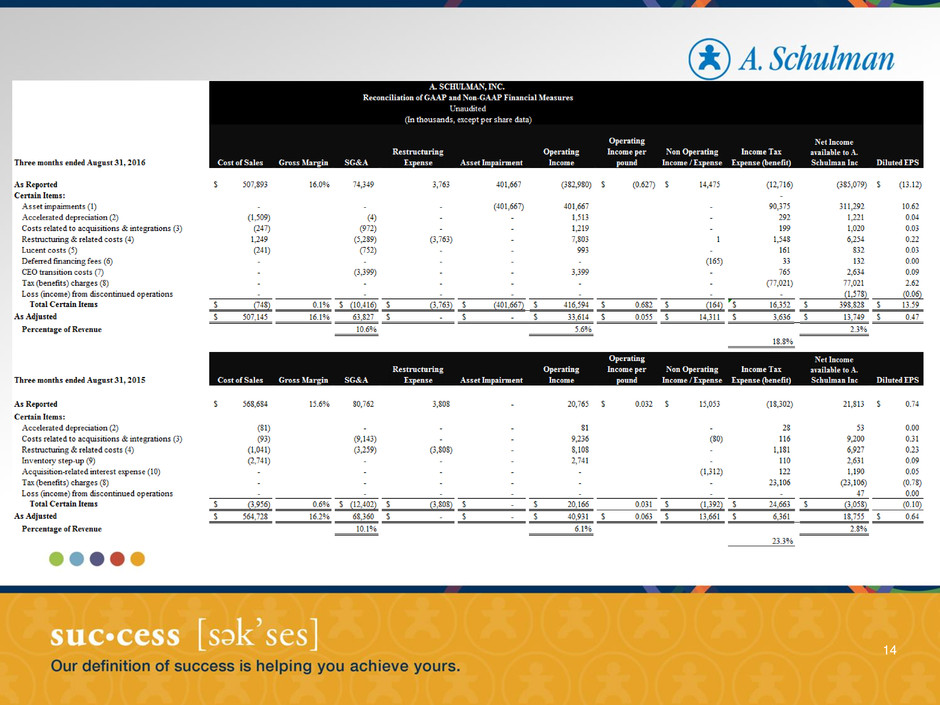
This presentation includes certain financial information determined by methods other than in accordance with
accounting principles generally accepted in the United States (“GAAP”). These non-GAAP financial measures include
segment gross profit, SG&A expenses excluding certain items, segment operating income, operating income before
certain items, net income excluding certain items, net income per diluted share excluding certain items and adjusted
EBITDA, free cash flow as discussed further in the Reconciliation of GAAP and Non-GAAP Financial Measures below.
These non-GAAP financial measures are considered relevant to aid analysis and understanding of the Company’s
results and business trends. However, non-GAAP measures are not in accordance with, nor are they a substitute for,
GAAP measures, and tables included in this release reconcile each non-GAAP financial measure with the most
directly comparable GAAP financial measure. The most directly comparable GAAP financial measures for these
purposes are gross profit, SG&A expenses, operating income, net income and net income per diluted share. The
Company's non-GAAP financial measures are not meant to be considered in isolation or as a substitute for
comparable GAAP financial measures, and should be read only in conjunction with the Company's consolidated
financial statements prepared in accordance with GAAP.
While the Company believes that these non-GAAP financial measures provide useful supplemental information to
investors, there are very significant limitations associated with their use. These non-GAAP financial measures are not
prepared in accordance with GAAP, may not be reported by all of the Company’s competitors and may not be directly
comparable to similarly titled measures of the Company’s competitors due to potential differences in the exact method
of calculation. The Company compensates for these limitations by using these non-GAAP financial measures as
supplements to GAAP financial measures and by reviewing the reconciliations of the non-GAAP financial measures to
their most comparable GAAP financial measures.
3
Use of Non-GAAP Financial Measures

Change of Pace at A. Schulman
4
• On 8/18/16 Board of Directors asked Joe Gingo to return as president and chief
executive officer
• On 8/22/16 Gary Miller was appointed Chief Operating Officer and Frank Roederer was
appointed SVP, GM of U.S. and Canada (“USCAN”) in addition to his role as GM of
Engineered Composites (“EC”)
• On 9/13/16 Company partnered with Citi for comprehensive review of Company’s 2017
budget, forward plan, as well as near- and longer-term global market trends. The goal
was to verify our market intelligence, refine our vision and improve our execution.
• On 10/1/16 John Richardson was named Executive Vice President – Finance and will
succeed Joe Levanduski as Chief Financial Officer on November 1, 2016
WE WILL FOCUS, SIMPLIFY AND EXECUTE WITH A SENSE OF URGENCY

5
(1) Reflects Non-GAAP results. Refer to the Appendix for a reconciliation between GAAP and Non-GAAP results.
Financial Highlights – 4Q16
4Q16 FINANCIAL HIGHLIGHTS ($M)
4Q16 4Q15
REVENUE $604.6 $674.0
GAAP EPS – per diluted share ($13.12) $0.74
ADJ EPS – per diluted share1 $0.47 $0.64
ADJ GROSS PROFIT1 $97.4 $109.3
ADJ OP INCOME1 $33.6 $40.9
ADJ EBITDA1 $53.9 $61.7
4Q16 Revenue Bridge ($M)
4Q15 FX Volume Price/Mix 4Q16
674
605 (13) (17) (39)
700
600
400
500
• USCAN EP lost business with a major
customer due to the unwillingness to
follow low-margin business
• Lucent distraction impact on USCAN
results
• EMEA masterbatch lost market share due
to competition/aggressive pricing
• Supply chain was disrupted in EMEA SP
business due to the inability of a major
long-time supplier to provide critical raw
materials
• EMEA DS suffered from buyer hesitation
given uncertainty in the macro
environment

• A $401.7 million non-cash impairment charge was recorded in 4Q largely due to the
fraudulent activity discovered at Citadel’s Lucent subsidiary, sharply lower outlook for oil
field service activity and other factors that reduced the long-term outlook for these
businesses.
• Intangibles impairment reduced amortization expense in 4Q by $1.2 million, or $0.03 per
share, and will reduce amortization expense in fiscal 2017 by $4.8 million or $0.12 cents
per share.
• In FY16, Company had $12 million of total Lucent costs
• $4.7 million are recurring costs
• $7.3 million of certain costs are reported as a non-GAAP adjustment
6
Citadel Wrap Up
LUCENT MATTER ADDRESSED OPERATIONALLY; LAWSUIT FILED AGAINST SELLERS

Citadel Wrap Up
7
• Company continues to integrate Citadel business into legacy portfolio;
however, challenges with Evansville plant consolidations will prevent the
achievement of operational synergies in the original time frame.
• Implementing strategy to expand and grow engineered composites business
while continuing to integrate Citadel’s engineered plastics business into our
product portfolio.
• Major investment in Germany to add capabilities to service
customers demanding an entire range of glass & carbon fiber sheet
molding compounds.

Segment Financial Highlights – 4Q16
8
1 - Reflects Non-GAAP results. Refer to the Appendix for a reconciliation between GAAP and Non-GAAP results.
• Lucent distraction impact
• Lost business with a major customer due
to the unwillingness to follow low-margin
business
• SG&A down >10% including significant
reduction in variable compensation
expense
USCAN ($M)
4Q15 4Q16
Revenue $195.3 $158.9
Adj Gross
Margin1
17.4% 15.9%
Adj Operating
Margin1
7.9% 5.6%
LATAM ($M)
4Q15 4Q16
Revenue $45.3 $44.9
Adj Gross
Margin1
21.8% 21.5%
Adj Operating
Margin1
12.2% 12.7%
EC ($M)
4Q15 4Q16
Revenue $57.1 $52.3
Adj Gross
Margin1
25.4% 23.9%
Adj Operating
Margin1
9.5% 8.2%
• Growth across all BUs
• SG&A spend flat despite
revenue growth
• 5th consecutive quarter of
growth
• Weak oil field services
customer demand persists
• Some price pressure due to
slow demand
• Raw material costs down –
sourcing synergies emerging

Segment Financial Highlights – 4Q16
9
1 - Reflects Non-GAAP results. Refer to the Appendix for a reconciliation between GAAP and Non-GAAP results.
• Masterbatch lost market share due to
competition/aggressive pricing
• Supply chain was disrupted in SP business due to the
inability of a major long-time supplier to provide critical
raw materials
• DS suffered from buyer hesitation given uncertainty in
the macro economic environment
• Despite revenue decline, SG&A steady on % sales
basis
EMEA ($M)
4Q15 4Q16
Revenue $326.8 $299.2
Adj Gross Margin1 13.5% 14.0%
Adj Operating Margin1 5.3% 5.8%
APAC ($M)
4Q15 4Q16
Revenue $49.5 $49.3
Adj Gross Margin1 13.8% 16.5%
Adj Operating Margin1 7.1% 9.0%
• Growth led by Masterbatch
• Positive mix shift drove margin
• SG&A increased to pursue new regional
opportunities

10
• 4Q16 debt reduction was $31M
driven by $36M of free cash flow1
generation
• Working capital improvement mostly
attributed to effective inventory
management efforts and favorable
seasonality impact
Balance Sheet / Cash Flow
(1) Reflects free cash flow calculated as operating cash flow less capital expenditures
$175 M Gross Debt Reduction Since June 1, 2015 Citadel Purchase
860
880
900
920
940
960
980
1,000
Aug-15 Nov-15 Feb-16 May-16 Aug-16
NET DEBT ($M)
35
45
55
Aug-15 Nov-15 Feb-16 May-16 Aug-16
WORKING CAPITAL AND INVENTORY (DAYS)
Inventory Days Net WC Days
Global Raw Materials Outlook
Oil – Oil expected to remain around $45-$50/bbl with global supply continuing
to exceed demand.
Polyolefin Resins – Polyethylene and Polypropylene both expected to stay
relatively stable.
Other Materials – Ti02 pricing pressure persists due to tighter supply.
Producers are implementing price increases in all regions; Majority of other
compounding ingredients including pigments, additives and fillers are expected
to remain stable in near term
11
Continue to be sharply focused on material cost-down and inventory reduction

Fiscal 2017 Adjusted Earnings Guidance
$2.08 - $2.18 per diluted share
12
FY16A FY17E
Actual / Guidance Range $2.08 $2.08 - $2.18
Variable Comp Change ($0.36)
Amortization Reduction ($0.03) ($0.12)
Operational
Performance
$1.69 $1.96 - $2.06
Mid-point of operational performance guidance range for FY17 is up roughly 20%
Appendix
13
14

15
Explanation of Adjustments
1 - Asset impairments are related to goodwill and intangible assets, and also include information technology assets, in the Company's USCAN, EC
and EMEA segments. Refer to Note 4 and Note 19 of the 2016 Annual Report on Form 10-K for further discussion.
2 - Accelerated depreciation is related to restructuring plans in the Company's USCAN, LATAM and EMEA segments. Refer to Note 14 of the 2016
Annual Report on Form 10-K for further discussion.
3 - Costs related to acquisitions and integrations primarily include third party professional, legal, IT and other expenses associated with successful
and unsuccessful full or partial acquisition and divestiture/dissolution transactions, as well as certain employee-related expenses such as travel,
bonuses and post-acquisition severance separate from a formal restructuring plan.
4 - Restructuring and related costs include items such as employee severance charges, lease termination charges, curtailment gains/losses, other
employee termination costs, and professional fees related to the reorganization of the Company’s legal entity structure and facility operations. Refer
to Note 16 of the 2016 Annual Report on Form 10-K for further discussion.
5 - Lucent costs primarily represent legal and investigation costs related to resolving the Lucent matter, product manufacturing costs for reworking
existing Lucent inventory, obsolete Lucent inventory reserve costs, and dedicated internal personnel costs that would have otherwise been focused
on normal operations.
6 - Accelerated amortization of deferred financing costs related to the €108.6 million prepayment of the Euro Term Loan B.
7 - CEO transition costs in 2016 represent charges for deferred compensation granted to Bernard Rzepka.
8 - Tax (benefits) charges represent the Company's adjustment of reported tax expense to non-GAAP tax based on the overall estimated annual
non-GAAP effective tax rates.
9 - Inventory step-up costs represent the amortization of adjustments to fair value of inventory acquired for acquisition purchase accounting.
10 - Primarily relates to the write-off of $1.5 million of deferred debt costs. Refer to Note 5 of the 2016 Annual Report on Form 10-K for further
discussion.
.
16
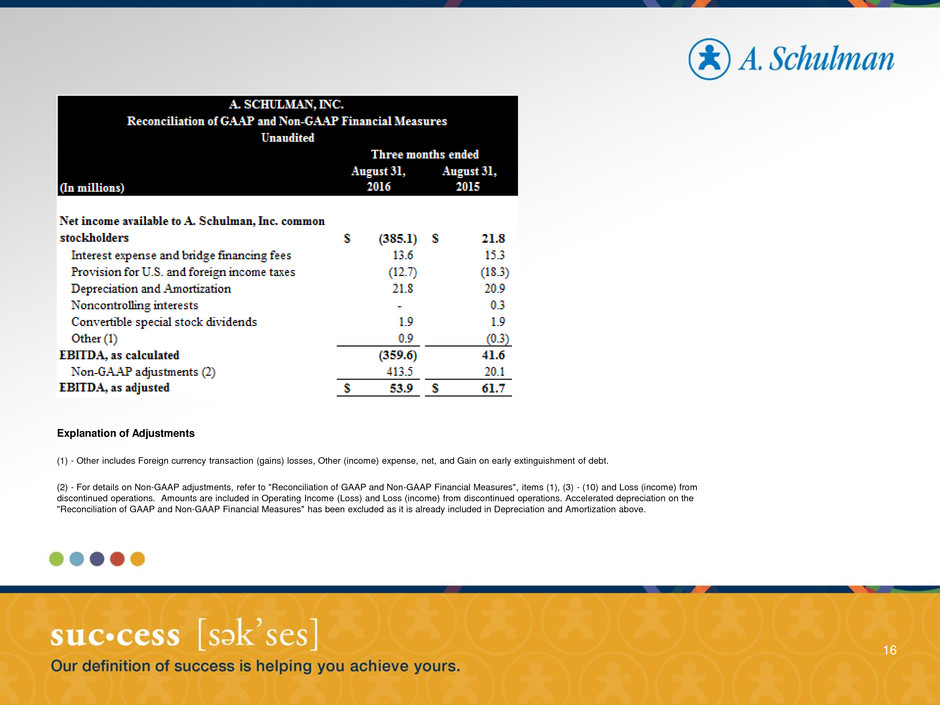
Explanation of Adjustments
(1) - Other includes Foreign currency transaction (gains) losses, Other (income) expense, net, and Gain on early extinguishment of debt.
(2) - For details on Non-GAAP adjustments, refer to "Reconciliation of GAAP and Non-GAAP Financial Measures", items (1), (3) - (10) and Loss (income) from
discontinued operations. Amounts are included in Operating Income (Loss) and Loss (income) from discontinued operations. Accelerated depreciation on the
"Reconciliation of GAAP and Non-GAAP Financial Measures" has been excluded as it is already included in Depreciation and Amortization above.
