Attached files
| file | filename |
|---|---|
| 8-K - 8-K - AAR CORP | a16-20059_18k.htm |
Exhibit 99.1
2016 Investor Day New York City October 19, 2016 1

Forward-Looking Statements This presentation includes certain statements relating to future results, which are forward-looking statements as that term is defined in the Private Securities Litigation Reform Act of 1995. These forward-looking statements are based on beliefs of Company management, as well as assumptions and estimates based on information currently available to the Company, and are subject to certain risks and uncertainties that could cause actual results to differ materially from historical results or those anticipated, including those factors discussed under Item 1A, entitled “Risk Factors,” included in the Company’s Form 10-K for the fiscal year ended May 31, 2016. Should one or more of these risks or uncertainties materialize adversely, or should underlying assumptions or estimates prove incorrect, actual results may vary materially from those described. These events and uncertainties are difficult or impossible to predict accurately and many are beyond the Company’s control. The Company assumes no obligation to update any forward-looking statements to reflect events or circumstances after the date of such statements or to reflect the occurrence of anticipated or unanticipated events. For additional information, see the comments included in AAR’s filings with the Securities and Exchange Commission. 2
Agenda Company Overview David P. Storch – Chairman, President and Chief Executive Officer Aviation Services John M. Holmes – Chief Operating Officer, Aviation Services Airlift Steven B. Harrison – President, AAR Airlift Group Financial Update Timothy J. Romenesko – Vice Chairman & Chief Financial Officer Closing Comments David P. Storch – Chairman, President and Chief Executive Officer 3
DAVID P. STORCH Chairman, President and Chief Executive Officer Chairman of AAR CORP (2005-Current) Chief Executive Officer (1996-Current) President and Chief Operating Officer (1989-1996) President of AAR Trading Group (1987-1989) Education: BA from Ithaca College Company Overview 4
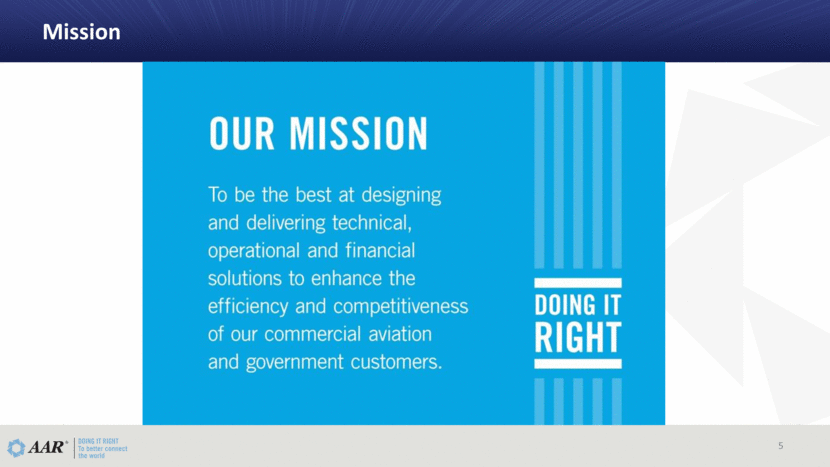
Mission 5
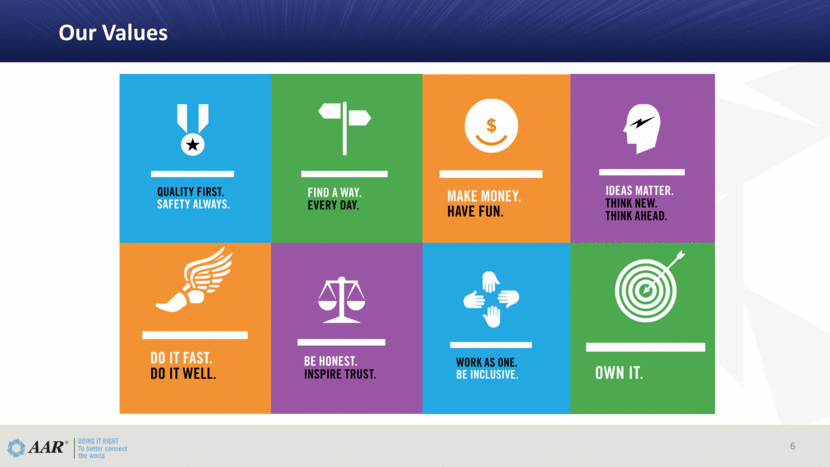
6 Our Values
AAR Transformation Focus on being an industry-leading Aviation Services company Monetize Cargo to fund growth (net proceeds of approximately $600 million after tax) Optimize Core Portfolio Achieve financial flexibility Net Debt to EBITDA multiple improved from 3.2x to 1.3x Debt to equity reduced from 68% to 18% Improved credit ratings – S&P upgraded AAR CORP to BB+ with stable outlook Purchased 6.1 million shares at average price of $29.78 or $182 million since April 2015 (Approximately 14% of outstanding shares) 4.7 million shares within 60 days of sale at average purchase price of $31.75 1.4 million shares since June 2015 at average purchase price of $23.35 7

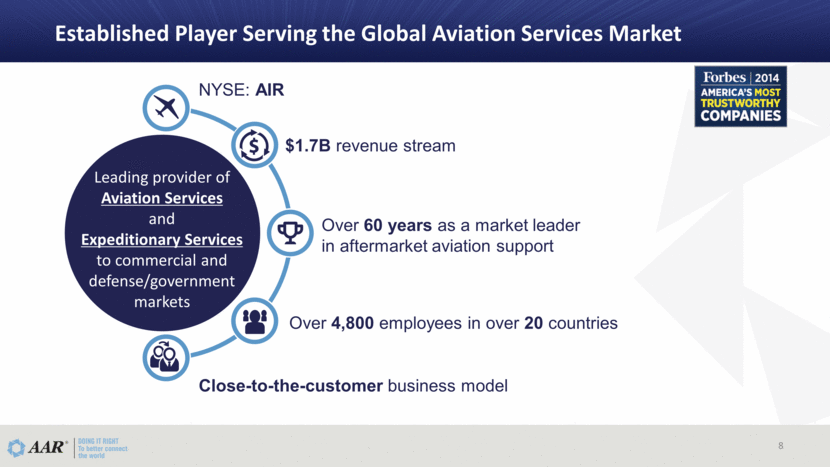
Established Player Serving the Global Aviation Services Market Leading provider of Aviation Services and Expeditionary Services to commercial and defense/government markets NYSE: AIR $1.7B revenue stream Over 60 years as a market leader in aftermarket aviation support Over 4,800 employees in over 20 countries Close-to-the-customer business model 8
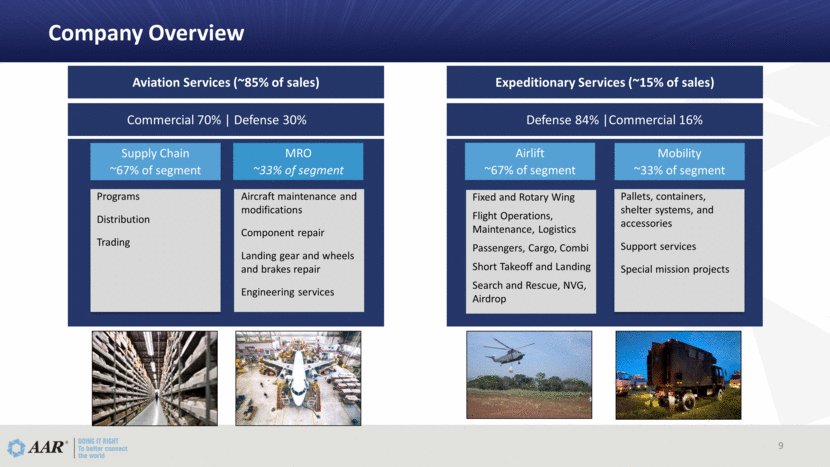
Company Overview Supply Chain ~67% of segment Aviation Services (~85% of sales) Airlift ~67% of segment Mobility ~33% of segment Expeditionary Services (~15% of sales) Fixed and Rotary Wing Flight Operations, Maintenance, Logistics Passengers, Cargo, Combi Short Takeoff and Landing Search and Rescue, NVG, Airdrop MRO ~33% of segment Aircraft maintenance and modifications Component repair Landing gear and wheels and brakes repair Engineering services Programs Distribution Trading Pallets, containers, shelter systems, and accessories Support services Special mission projects Commercial 70% Defense 30% Defense 84% Commercial 16% 9
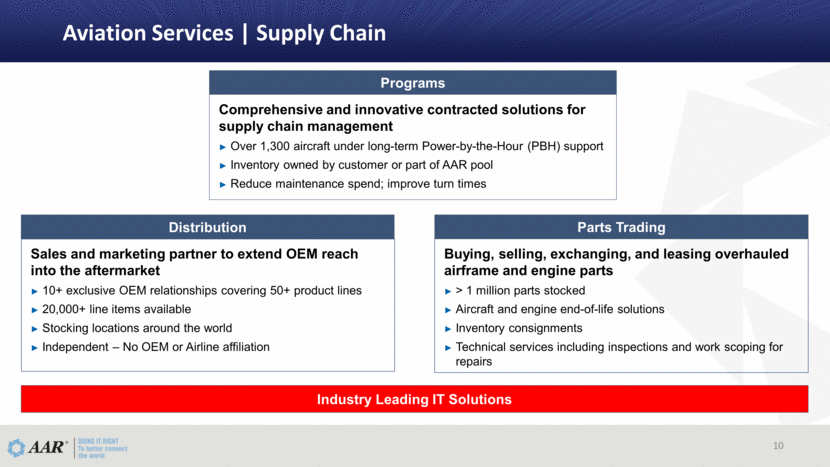
Aviation Services Supply Chain Buying, selling, exchanging, and leasing overhauled airframe and engine parts > 1 million parts stocked Aircraft and engine end-of-life solutions Inventory consignments Technical services including inspections and work scoping for repairs Parts Trading Sales and marketing partner to extend OEM reach into the aftermarket 10+ exclusive OEM relationships covering 50+ product lines 20,000+ line items available Stocking locations around the world Independent – No OEM or Airline affiliation Distribution Comprehensive and innovative contracted solutions for supply chain management Over 1,300 aircraft under long-term Power-by-the-Hour (PBH) support Inventory owned by customer or part of AAR pool Reduce maintenance spend; improve turn times Programs 10 Industry Leading IT Solutions
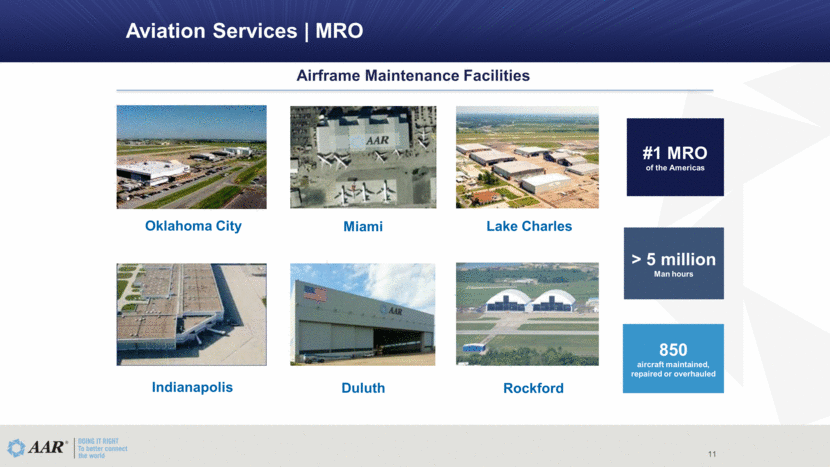
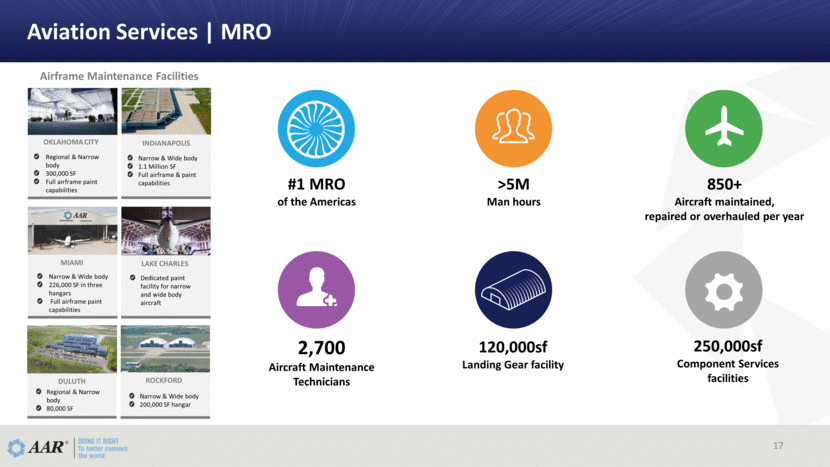
Aviation Services MRO 11 Oklahoma City Miami Indianapolis Duluth Lake Charles Airframe Maintenance Facilities 850 aircraft maintained, repaired or overhauled > 5 million Man hours #1 MRO of the Americas Rockford
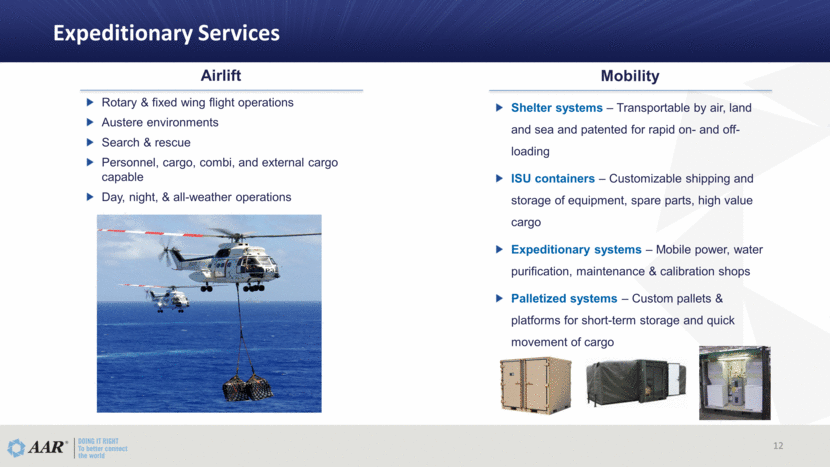
Expeditionary Services Airlift Mobility Rotary & fixed wing flight operations Austere environments Search & rescue Personnel, cargo, combi, and external cargo capable Day, night, & all-weather operations Shelter systems – Transportable by air, land and sea and patented for rapid on- and off-loading ISU containers – Customizable shipping and storage of equipment, spare parts, high value cargo Expeditionary systems – Mobile power, water purification, maintenance & calibration shops Palletized systems – Custom pallets & platforms for short-term storage and quick movement of cargo 12
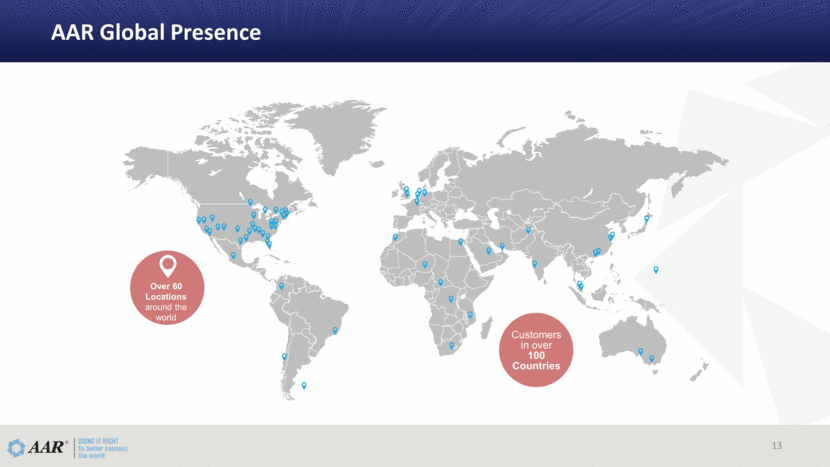
Customers in over 100 Countries Over 60 Locations around the world AAR Global Presence 13
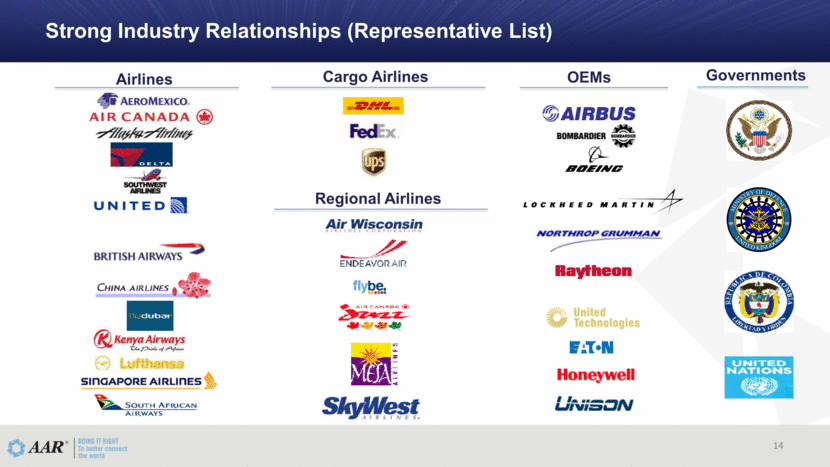
Strong Industry Relationships (Representative List) Airlines Cargo Airlines OEMs Governments 14 Regional Airlines
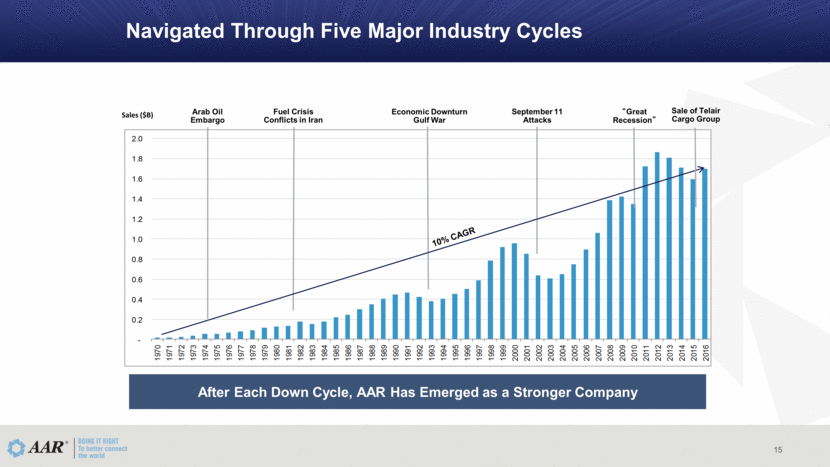
Navigated Through Five Major Industry Cycles 15 Arab Oil Embargo Fuel Crisis Conflicts in Iran Economic Downturn Gulf War September 11 Attacks “Great Recession” 10% CAGR Sales ($B) After Each Down Cycle, AAR Has Emerged as a Stronger Company Sale of Telair Cargo Group - 0.2 0.4 0.6 0.8 1.0 1.2 1.4 1.6 1.8 2.0 1970 1971 1972 1973 1974 1975 1976 1977 1978 1979 1980 1981 1982 1983 1984 1985 1986 1987 1988 1989 1990 1991 1992 1993 1994 1995 1996 1997 1998 1999 2000 2001 2002 2003 2004 2005 2006 2007 2008 2009 2010 2011 2012 2013 2014 2015 2016
JOHN M. HOLMES Chief Operating Officer, Aviation Services (15 years with AAR CORP) Chief Operating Officer, Aviation Service (2015-Current) Group Vice President, Aviation Supply Chain (2012-2015) General Manager AAR Allen Asset Management (2003-2012) Director of Mergers and Acquisitions (2001-2003) Prior to AAR, investment banking and private equity Education: MBA from University of Chicago BS, Finance from University of Illinois AAR Aviation Services Group 16
Aviation Services MRO Narrow & Wide body 200,000 SF hangar ROCKFORD Narrow & Wide body 226,000 SF in three hangars Full airframe paint capabilities MIAMI OKLAHOMA CITY Regional & Narrow body 300,000 SF Full airframe paint capabilities Regional & Narrow body 80,000 SF DULUTH Dedicated paint facility for narrow and wide body aircraft LAKE CHARLES Narrow & Wide body 1.1 Million SF Full airframe & paint capabilities INDIANAPOLIS Airframe Maintenance Facilities #1 MRO of the Americas >5M Man hours 850+ Aircraft maintained, repaired or overhauled per year 2,700 Aircraft Maintenance Technicians 120,000sf Landing Gear facility 250,000sf Component Services facilities 17
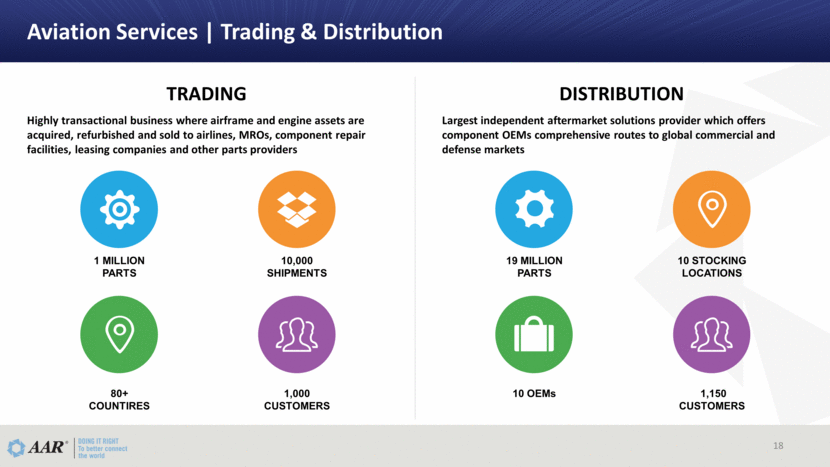
Highly transactional business where airframe and engine assets are acquired, refurbished and sold to airlines, MROs, component repair facilities, leasing companies and other parts providers Aviation Services Trading & Distribution 80+ COUNTIRES TRADING Largest independent aftermarket solutions provider which offers component OEMs comprehensive routes to global commercial and defense markets 10 STOCKING LOCATIONS 10 OEMs DISTRIBUTION 10,000 SHIPMENTS 1 MILLION PARTS 1,000 CUSTOMERS 19 MILLION PARTS 1,150 CUSTOMERS 18
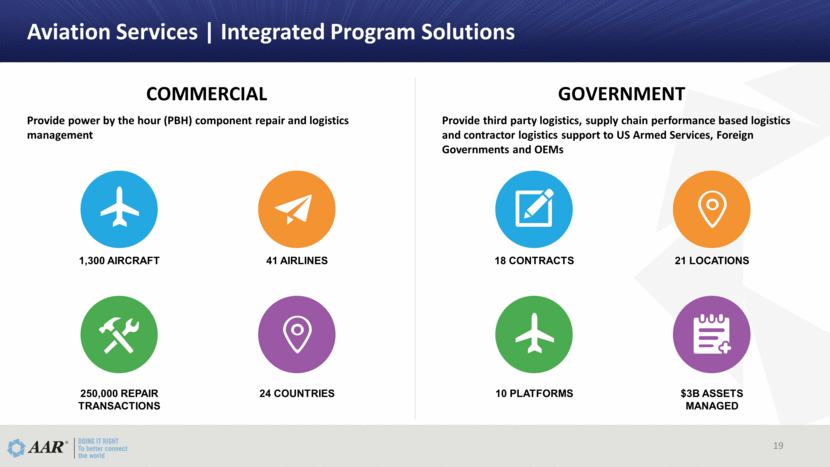
Provide power by the hour (PBH) component repair and logistics management Aviation Services Integrated Program Solutions 1,300 AIRCRAFT 41 AIRLINES 250,000 REPAIR TRANSACTIONS 24 COUNTRIES COMMERCIAL Provide third party logistics, supply chain performance based logistics and contractor logistics support to US Armed Services, Foreign Governments and OEMs 18 CONTRACTS 21 LOCATIONS 10 PLATFORMS $3B ASSETS MANAGED GOVERNMENT 19
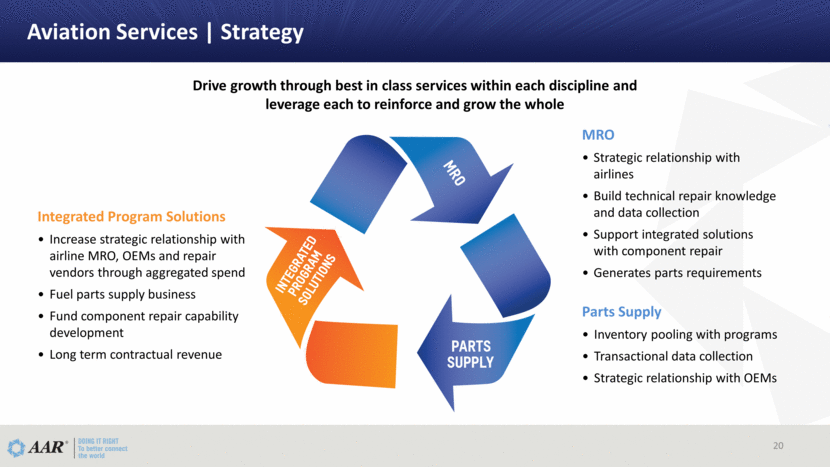
Aviation Services Strategy Parts Supply Inventory pooling with programs Transactional data collection Strategic relationship with OEMs MRO Strategic relationship with airlines Build technical repair knowledge and data collection Support integrated solutions with component repair Generates parts requirements Integrated Program Solutions Increase strategic relationship with airline MRO, OEMs and repair vendors through aggregated spend Fuel parts supply business Fund component repair capability development Long term contractual revenue Drive growth through best in class services within each discipline and leverage each to reinforce and grow the whole 20
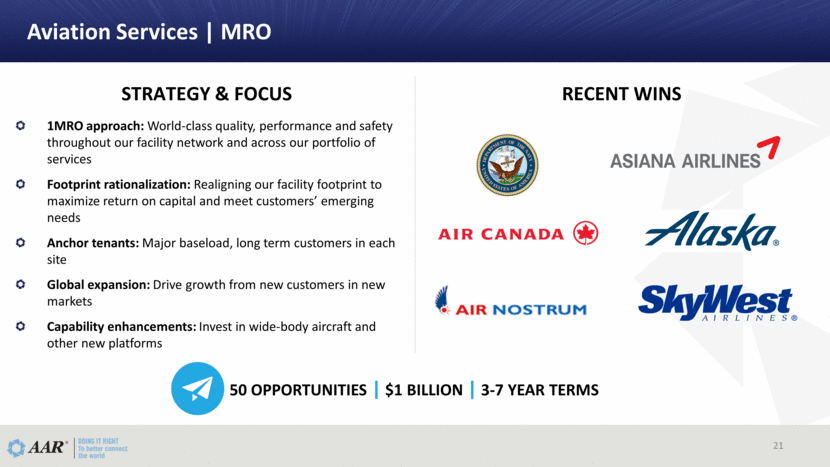
1MRO approach: World-class quality, performance and safety throughout our facility network and across our portfolio of services Footprint rationalization: Realigning our facility footprint to maximize return on capital and meet customers’ emerging needs Anchor tenants: Major baseload, long term customers in each site Global expansion: Drive growth from new customers in new markets Capability enhancements: Invest in wide-body aircraft and other new platforms Aviation Services MRO STRATEGY & FOCUS RECENT WINS 50 OPPORTUNITIES $1 BILLION 3-7 YEAR TERMS 21
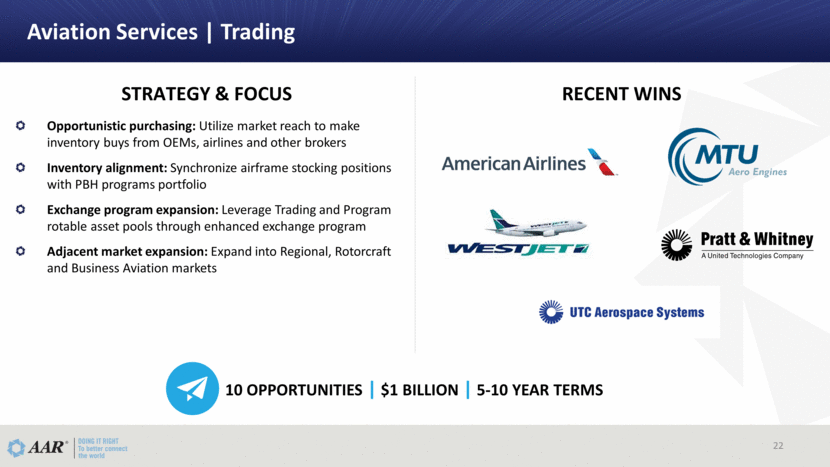
Opportunistic purchasing: Utilize market reach to make inventory buys from OEMs, airlines and other brokers Inventory alignment: Synchronize airframe stocking positions with PBH programs portfolio Exchange program expansion: Leverage Trading and Program rotable asset pools through enhanced exchange program Adjacent market expansion: Expand into Regional, Rotorcraft and Business Aviation markets Aviation Services Trading STRATEGY & FOCUS RECENT WINS 10 OPPORTUNITIES $1 BILLION 5-10 YEAR TERMS 22
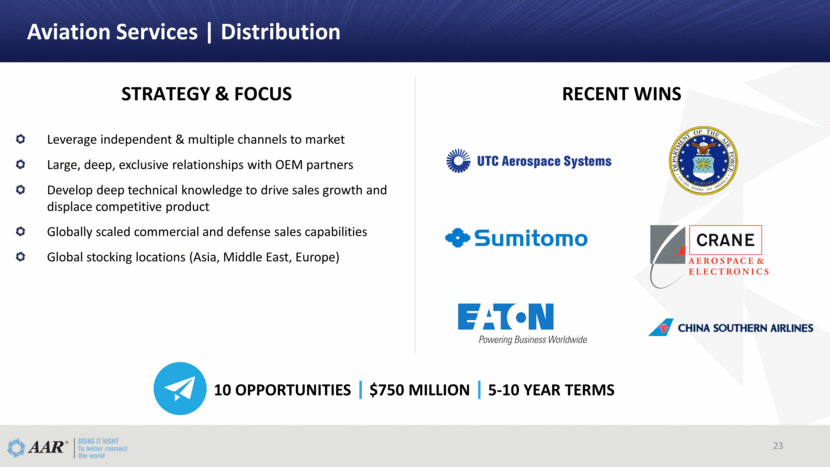
Leverage independent & multiple channels to market Large, deep, exclusive relationships with OEM partners Develop deep technical knowledge to drive sales growth and displace competitive product Globally scaled commercial and defense sales capabilities Global stocking locations (Asia, Middle East, Europe) Aviation Services Distribution STRATEGY & FOCUS RECENT WINS 10 OPPORTUNITIES $750 MILLION 5-10 YEAR TERMS 23
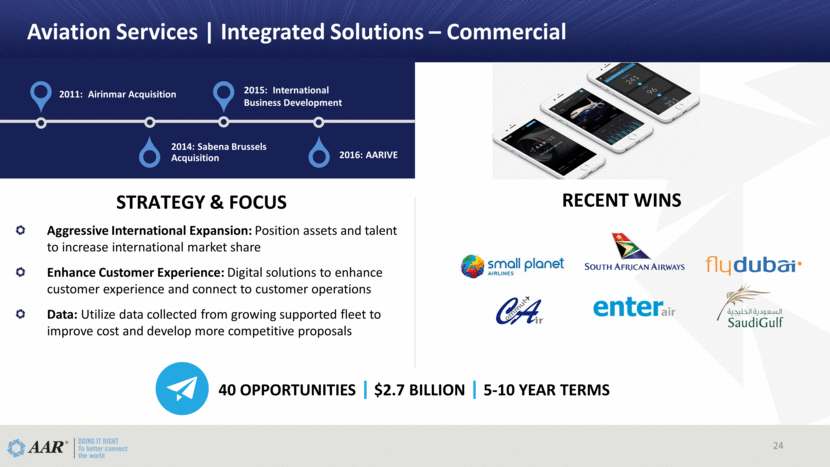
Aggressive International Expansion: Position assets and talent to increase international market share Enhance Customer Experience: Digital solutions to enhance customer experience and connect to customer operations Data: Utilize data collected from growing supported fleet to improve cost and develop more competitive proposals Aviation Services Integrated Solutions – Commercial STRATEGY & FOCUS RECENT WINS 40 OPPORTUNITIES $2.7 BILLION 5-10 YEAR TERMS 2011: Airinmar Acquisition 2014: Sabena Brussels Acquisition 2015: International Business Development 2016: AARIVE 24
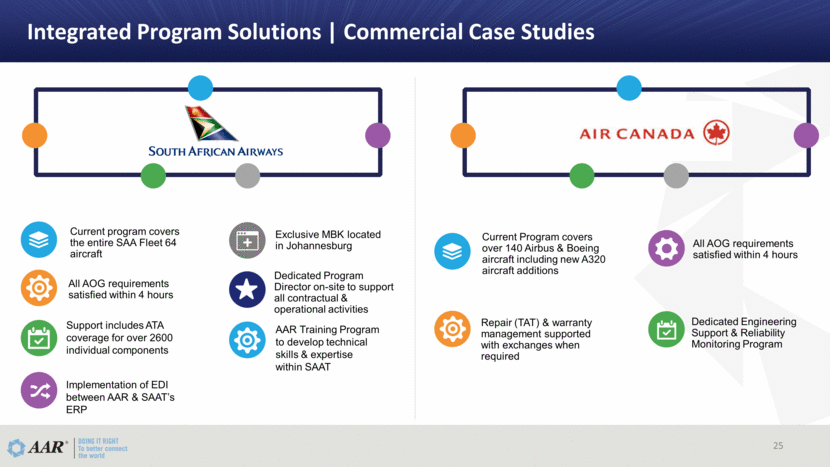
Integrated Program Solutions Commercial Case Studies Current Program covers over 140 Airbus & Boeing aircraft including new A320 aircraft additions Dedicated Engineering Support & Reliability Monitoring Program All AOG requirements satisfied within 4 hours Repair (TAT) & warranty management supported with exchanges when required Current program covers the entire SAA Fleet 64 aircraft AAR Training Program to develop technical skills & expertise within SAAT All AOG requirements satisfied within 4 hours Dedicated Program Director on-site to support all contractual & operational activities Support includes ATA coverage for over 2600 individual components Implementation of EDI between AAR & SAAT’s ERP Exclusive MBK located in Johannesburg 25
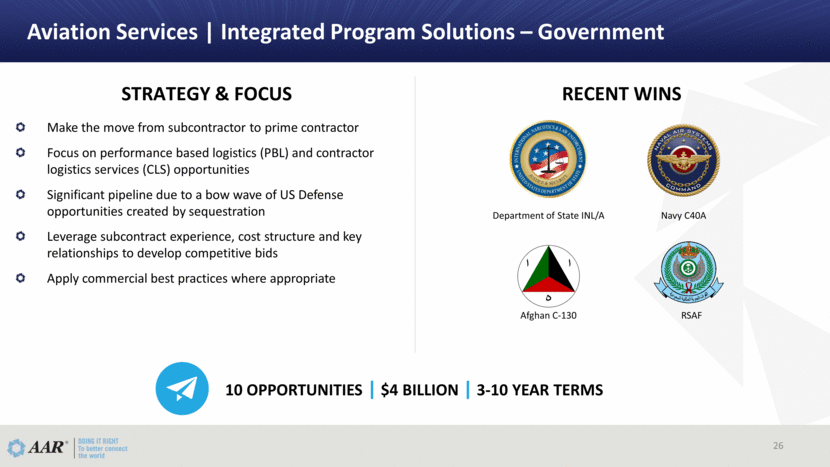
Make the move from subcontractor to prime contractor Focus on performance based logistics (PBL) and contractor logistics services (CLS) opportunities Significant pipeline due to a bow wave of US Defense opportunities created by sequestration Leverage subcontract experience, cost structure and key relationships to develop competitive bids Apply commercial best practices where appropriate Aviation Services Integrated Program Solutions – Government STRATEGY & FOCUS RECENT WINS 10 OPPORTUNITIES $4 BILLION 3-10 YEAR TERMS Department of State INL/A Navy C40A Afghan C-130 RSAF 26
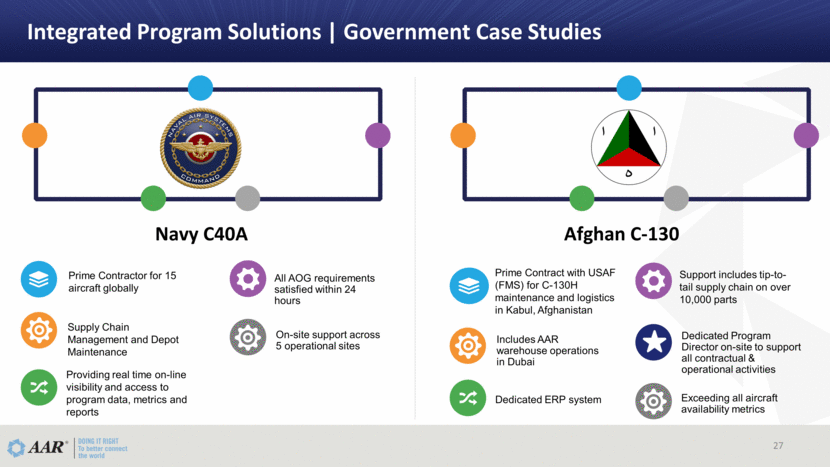
Integrated Program Solutions Government Case Studies Prime Contractor for 15 aircraft globally All AOG requirements satisfied within 24 hours On-site support across 5 operational sites Supply Chain Management and Depot Maintenance Providing real time on-line visibility and access to program data, metrics and reports Prime Contract with USAF (FMS) for C-130H maintenance and logistics in Kabul, Afghanistan Support includes tip-to-tail supply chain on over 10,000 parts Includes AAR warehouse operations in Dubai Dedicated ERP system Exceeding all aircraft availability metrics Dedicated Program Director on-site to support all contractual & operational activities Navy C40A Afghan C-130 27
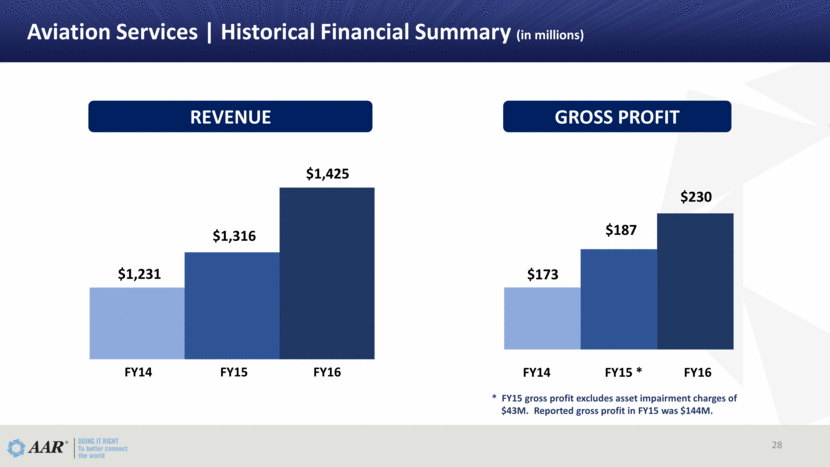
Aviation Services Historical Financial Summary (in millions) FY14 FY15 FY16 $1,231 $1,316 $1,425 FY14 FY15 * FY16 $173 $187 $230 REVENUE GROSS PROFIT 28 * FY15 gross profit excludes asset impairment charges of $43M. Reported gross profit in FY15 was $144M.
STEVEN B. HARRISON President, AAR Airlift Group (5 Years with AAR CORP) President, AAR Airlift Group (2015-Current) Chief Commercial Officer (2012-2015) President and CEO of National Airlines Retired as Colonel after 22 years in U.S. Air Force Education: Masters Degree in Engineering Science; Politics, Philosophy, and Economics from Oxford University BS, Aeronautical Engineering and Rhodes Scholar at U.S. Air Force Academy AAR Airlift Group 29
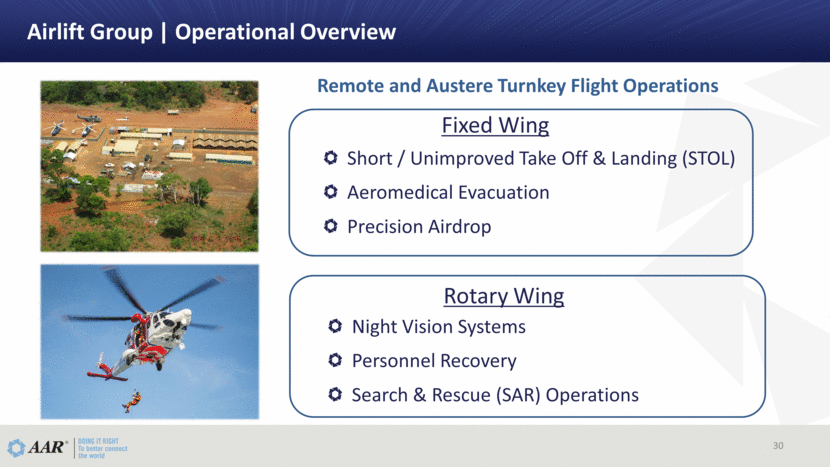
Airlift Group Operational Overview Flight Operations Night Vision Systems Personnel Recovery Search & Rescue (SAR) Operations 30 Rotary Wing Short / Unimproved Take Off & Landing (STOL) Aeromedical Evacuation Precision Airdrop Fixed Wing Remote and Austere Turnkey Flight Operations
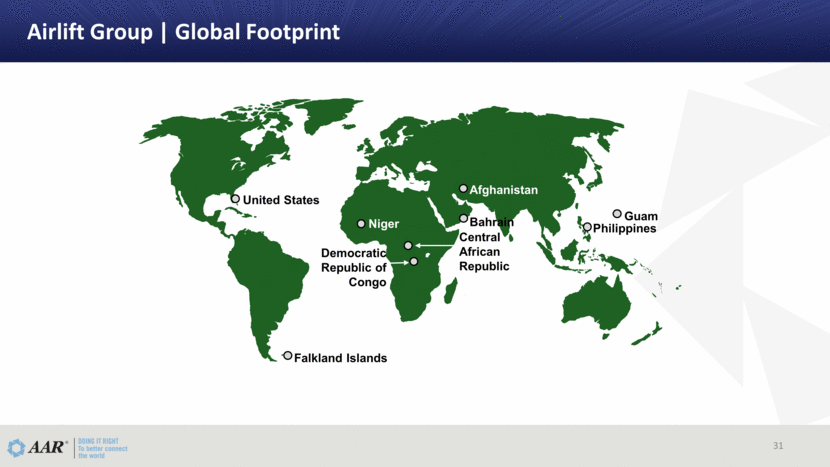
Airlift Group Global Footprint United States Guam Philippines Afghanistan Central African Republic Niger Falkland Islands Democratic Republic of Congo Bahrain 31
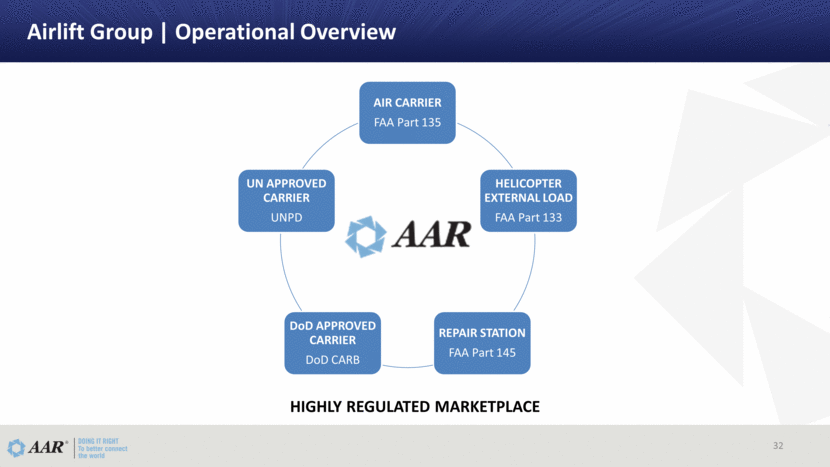
Airlift Group Operational Overview 32 HIGHLY REGULATED MARKETPLACE AIR CARRIER FAA Part 135 HELICOPTER EXTERNAL LOAD FAA Part 133 REPAIR STATION FAA Part 145 DoD APPROVED CARRIER DoD CARB UN APPROVED CARRIER UNPD
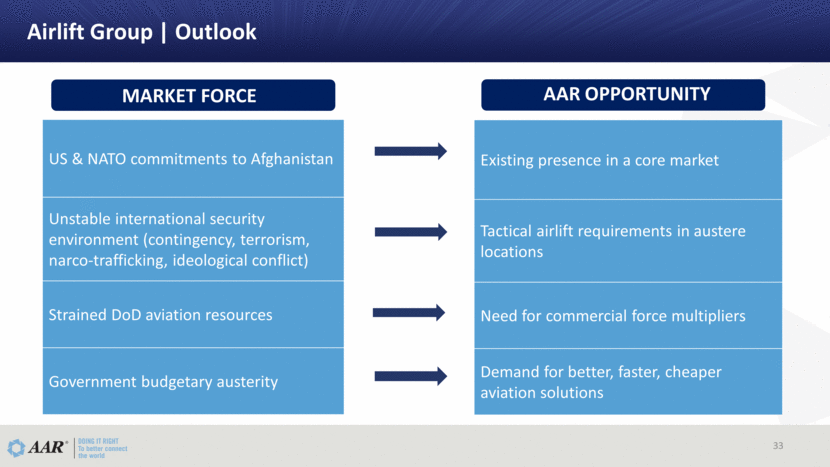
Airlift Group Outlook MARKET FORCE AAR OPPORTUNITY 33 US & NATO commitments to Afghanistan Unstable international security environment (contingency, terrorism, narco-trafficking, ideological conflict) Strained DoD aviation resources Government budgetary austerity Existing presence in a core market Tactical airlift requirements in austere locations Need for commercial force multipliers Demand for better, faster, cheaper aviation solutions
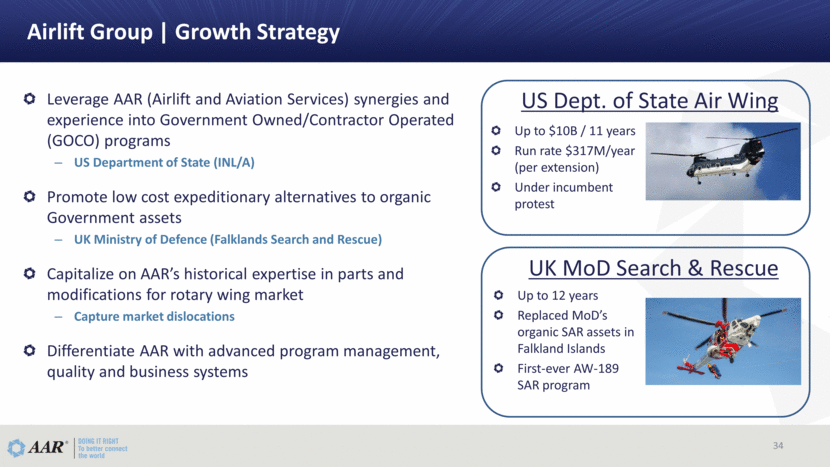
Airlift Group Growth Strategy Leverage AAR (Airlift and Aviation Services) synergies and experience into Government Owned/Contractor Operated (GOCO) programs US Department of State (INL/A) Promote low cost expeditionary alternatives to organic Government assets UK Ministry of Defence (Falklands Search and Rescue) Capitalize on AAR’s historical expertise in parts and modifications for rotary wing market Capture market dislocations Differentiate AAR with advanced program management, quality and business systems US Dept. of State Air Wing UK MoD Search & Rescue Up to $10B / 11 years Run rate $317M/year (per extension) Under incumbent protest Up to 12 years Replaced MoD’s organic SAR assets in Falkland Islands First-ever AW-189 SAR program 34
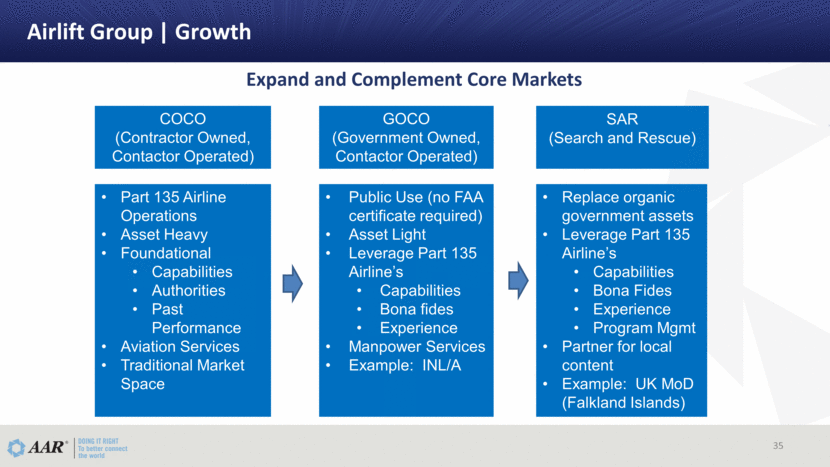
Airlift Group Growth Expand and Complement Core Markets 35 COCO (Contractor Owned, Contactor Operated) GOCO (Government Owned, Contactor Operated) SAR (Search and Rescue) Part 135 Airline Operations Asset Heavy Foundational Capabilities Authorities Past Performance Aviation Services Traditional Market Space Public Use (no FAA certificate required) Asset Light Leverage Part 135 Airline’s Capabilities Bona fides Experience Manpower Services Example: INL/A Replace organic government assets Leverage Part 135 Airline’s Capabilities Bona Fides Experience Program Mgmt Partner for local content Example: UK MoD (Falkland Islands)
TIMOTHY J. ROMENESKO Vice Chairman & Chief Financial Officer (35 years with AAR CORP) Vice Chairman & Chief Operating Officer Expeditionary Services (2015-2016) President and Chief Operating Officer (2007-2015) Elected to AAR CORP Board of Directors in 2007 Vice President & Chief Financial Officer (1994-2007) Education: MBA from DePaul University BA from St. Norbert College CPA designation in Illinois Financial Performance 36
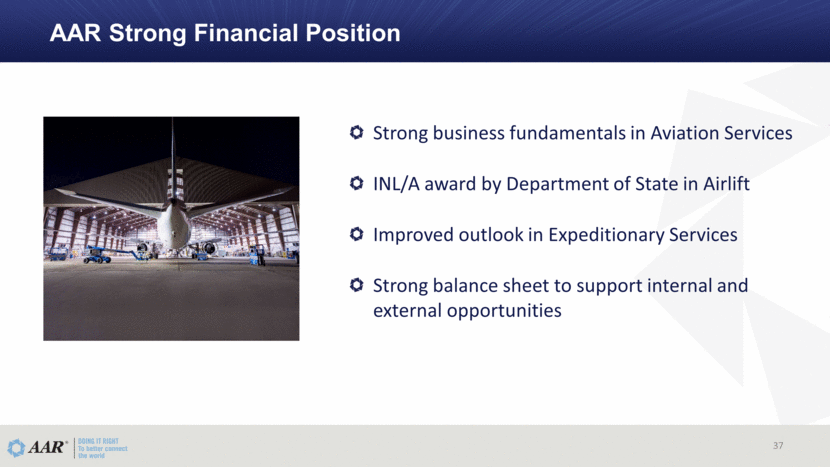
AAR Strong Financial Position Strong business fundamentals in Aviation Services INL/A award by Department of State in Airlift Improved outlook in Expeditionary Services Strong balance sheet to support internal and external opportunities 37
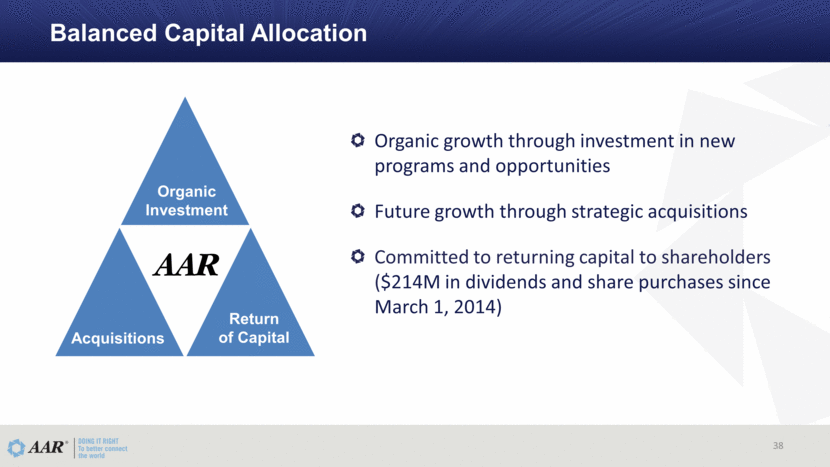
Balanced Capital Allocation Organic growth through investment in new programs and opportunities Future growth through strategic acquisitions Committed to returning capital to shareholders ($214M in dividends and share purchases since March 1, 2014) Organic Investment Acquisitions Return of Capital 38
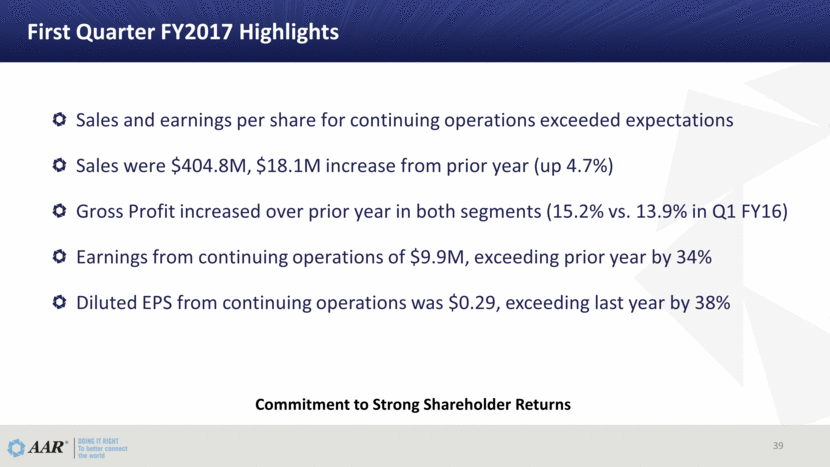
First Quarter FY2017 Highlights Sales and earnings per share for continuing operations exceeded expectations Sales were $404.8M, $18.1M increase from prior year (up 4.7%) Gross Profit increased over prior year in both segments (15.2% vs. 13.9% in Q1 FY16) Earnings from continuing operations of $9.9M, exceeding prior year by 34% Diluted EPS from continuing operations was $0.29, exceeding last year by 38% Commitment to Strong Shareholder Returns 39
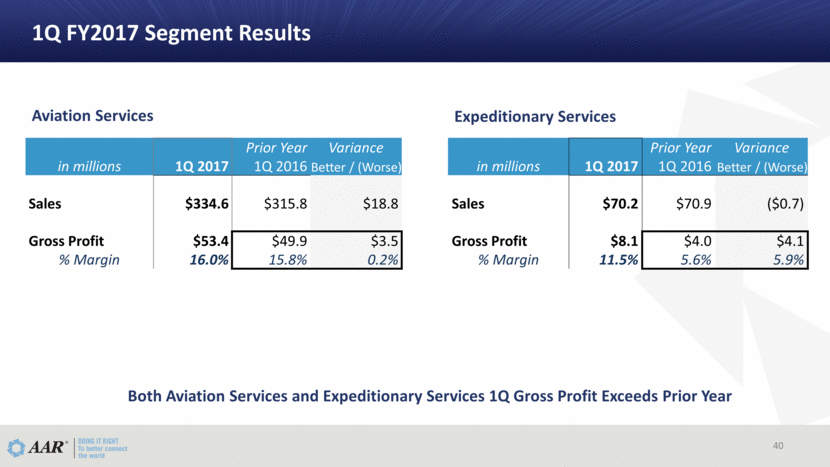
1Q FY2017 Segment Results Prior Year Variance in millions 1Q 2017 1Q 2016 Better / (Worse) Sales $334.6 $315.8 $18.8 Gross Profit $53.4 $49.9 $3.5 % Margin 16.0% 15.8% 0.2% Aviation Services Both Aviation Services and Expeditionary Services 1Q Gross Profit Exceeds Prior Year Prior Year Variance in millions 1Q 2017 1Q 2016 Better / (Worse) Sales $70.2 $70.9 ($0.7) Gross Profit $8.1 $4.0 $4.1 % Margin 11.5% 5.6% 5.9% Expeditionary Services 40
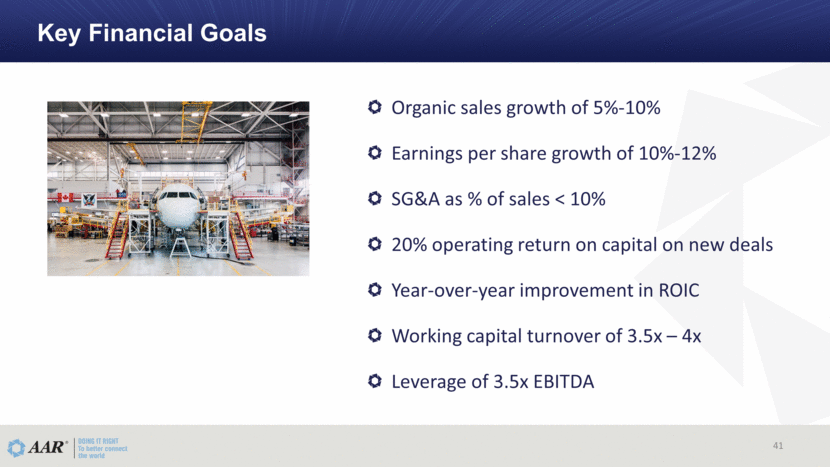
Key Financial Goals Organic sales growth of 5%-10% Earnings per share growth of 10%-12% SG&A as % of sales < 10% 20% operating return on capital on new deals Year-over-year improvement in ROIC Working capital turnover of 3.5x – 4x Leverage of 3.5x EBITDA 41
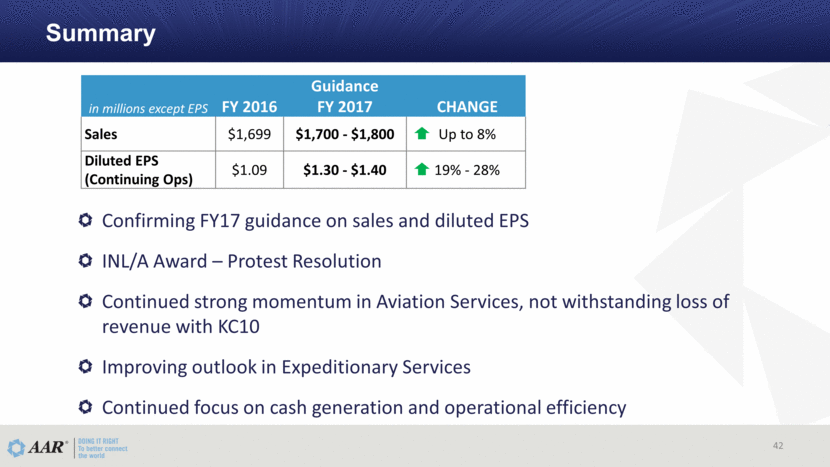
Summary Confirming FY17 guidance on sales and diluted EPS INL/A Award – Protest Resolution Continued strong momentum in Aviation Services, not withstanding loss of revenue with KC10 Improving outlook in Expeditionary Services Continued focus on cash generation and operational efficiency in millions except EPS FY 2016 Guidance FY 2017 CHANGE Sales $1,699 $1,700 - $1,800 Up to 8% Diluted EPS (Continuing Ops) $1.09 $1.30 - $1.40 19% - 28% 42
David P. Storch Chairman, President and Chief Executive Officer Closing Comments 43
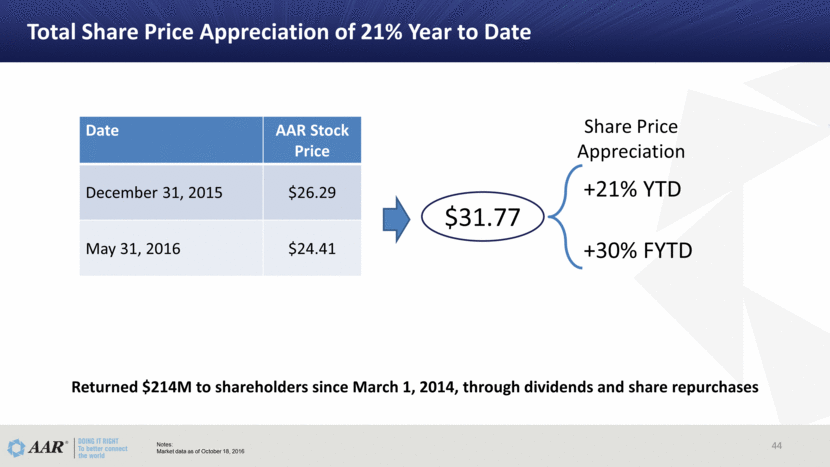
Total Share Price Appreciation of 21% Year to Date Returned $214M to shareholders since March 1, 2014, through dividends and share repurchases Date AAR Stock Price December 31, 2015 $26.29 May 31, 2016 $24.41 $31.77 +21% YTD +30% FYTD Share Price Appreciation Notes: Market data as of October 18, 2016 44
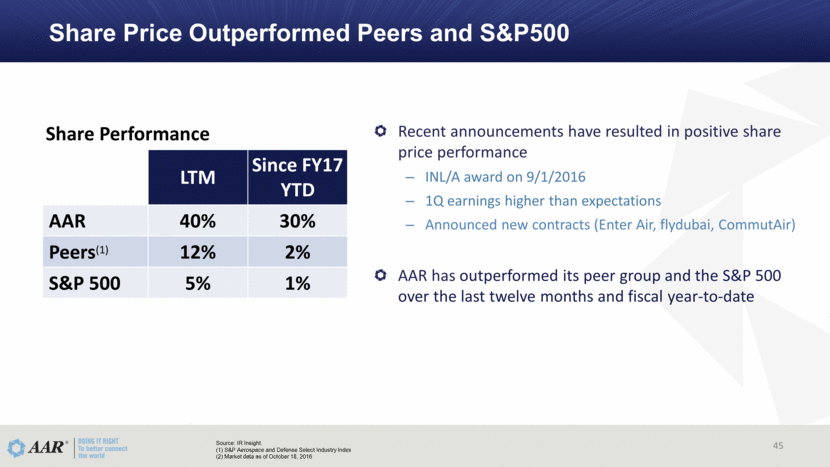
Share Price Outperformed Peers and S&P500 Source: IR Insight. (1) S&P Aerospace and Defense Select Industry Index (2) Market data as of October 18, 2016 Recent announcements have resulted in positive share price performance INL/A award on 9/1/2016 1Q earnings higher than expectations Announced new contracts (Enter Air, flydubai, CommutAir) AAR has outperformed its peer group and the S&P 500 over the last twelve months and fiscal year-to-date Share Performance LTM Since FY17 YTD AAR 40% 30% Peers(1) 12% 2% S&P 500 5% 1% 45