Attached files
UNITED STATES
SECURITIES AND EXCHANGE
Washington, D.C. 20549
__________________________
FORM 10-K
__________________________
x | ANNUAL REPORT PURSUANT TO SECTION 13 OR 15(d) OF THE SECURITIES EXCHANGE ACT OF 1934 |
For the fiscal year ended May 31, 2016
OR
¨ | TRANSITION REPORT PURSUANT TO SECTION 13 OR 15(d) OF THE SECURITIES EXCHANGE ACT OF 1934 |
For the transition period from to
Commission File Number: 1-7102
__________________________
NATIONAL RURAL UTILITIES COOPERATIVE FINANCE CORPORATION
(Exact name of registrant as specified in its charter)
__________________________
District of Columbia | 52-0891669 | |
(State or other jurisdiction of incorporation or organization) | (I.R.S. employer identification no.) | |
20701 Cooperative Way, Dulles, Virginia, 20166 |
(Address of principal executive offices) (Zip Code) |
Registrant’s telephone number, including area code: (703) 467-1800
__________________________
Securities registered pursuant to Section 12(b) of the Act:
Title of Each Class | Name of Each Exchange on Which Registered | |
6.55% Collateral Trust Bonds, due 2018 | New York Stock Exchange | |
7.35% Collateral Trust Bonds, due 2026 | New York Stock Exchange | |
Securities Registered Pursuant to Section 12(g) of the Act: None
Indicate by check mark if the registrant is a well-known seasoned issuer, as defined in Rule 405 of the Securities Act. Yes x No ¨
Indicate by check mark if the registrant is not required to file reports pursuant to Section 13 or 15(d) of the Act. Yes ¨ No x
Indicate by check mark whether the registrant (1) has filed all reports required to be filed by Section 13 or 15(d) of the Securities Exchange Act of 1934 during the preceding 12 months (or for such shorter period that the registrant was required to file such reports), and (2) has been subject to such filing requirements for the past 90 days. Yes x No ¨
Indicate by check mark whether the registrant has submitted electronically and posted on its corporate Web site, if any, every Interactive Data File required to be submitted and posted pursuant to Rule 405 of Regulation S-T (§232.405 of this chapter) during the preceding 12 months (or for such shorter period that the registrant was required to submit and post such files). Yes x No ¨
Indicate by check mark if disclosure of delinquent filers pursuant to Item 405 of Regulation S-K (§229.405 of this chapter) is not contained herein, and will not be contained, to the best of the registrant’s knowledge, in definitive proxy or information statements incorporated by reference in Part III of this Form 10-K or any amendment to this Form 10-K. x
Indicate by check mark whether the registrant is a large accelerated filer, an accelerated filer, a non-accelerated filer, or a smaller reporting company. See the definitions of “large accelerated filer”, “accelerated filer,” and “smaller reporting company” in Rule 12b-2 of the Exchange Act. (Check one): Large accelerated filer ¨ Accelerated filer ¨ Non-accelerated filer x Smaller reporting company ¨
Indicate by check mark whether the registrant is a shell company (as defined in Rule 12b-2 of the Exchange Act). Yes ¨ No x
The Registrant does not issue capital stock because it is a tax-exempt cooperative.
TABLE OF CONTENTS
Page | ||||
i
ii
INDEX OF MD&A TABLES
Table | Description | Page | |||
— | MD&A Tables: | ||||
1 | Average Balances, Interest Income/Interest Expense and Average Yield/Cost | 30 | |||
2 | Rate/Volume Analysis of Changes in Interest Income/Interest Expense | 32 | |||
3 | Derivative Average Notional Balances and Average Interest Rates | 34 | |||
4 | Derivative Gains (Losses) | 35 | |||
5 | Loans Outstanding by Type and Member Class | 38 | |||
6 | Long-Term Loan Scheduled Repayments | 38 | |||
7 | Historical Retention Rate and Repricing Selection | 39 | |||
8 | Debt Product Types | 40 | |||
9 | Total Debt Outstanding and Weighted-Average Interest Rates | 41 | |||
10 | Member Investments | 42 | |||
11 | Unencumbered Loans | 43 | |||
12 | Collateral Pledged or on Deposit | 44 | |||
13 | Equity | 45 | |||
14 | Guarantees Outstanding | 46 | |||
15 | Maturities of Guarantee Obligations | 47 | |||
16 | Unadvanced Loan Commitments | 47 | |||
17 | Notional Maturities of Unadvanced Loan Commitments | 48 | |||
18 | Maturities of Notional Amount of Unconditional Committed Lines of Credit | 49 | |||
19 | Loan Portfolio Security Profile | 50 | |||
20 | Loan Concentration | 52 | |||
21 | Credit Exposure to 20 Largest Borrowers | 53 | |||
22 | TDR Loans | 54 | |||
23 | Nonperforming Loans | 55 | |||
24 | Allowance for Loan Losses | 55 | |||
25 | Rating Triggers for Derivatives | 57 | |||
26 | Short-Term Borrowings | 58 | |||
27 | Liquidity Reserve | 59 | |||
28 | Bank Revolving Credit Agreements | 60 | |||
29 | Issuances and Maturities of Long-Term and Subordinated Debt | 62 | |||
30 | Credit Ratings | 62 | |||
31 | Projected Sources and Uses of Liquidity | 63 | |||
32 | Contractual Obligations | 64 | |||
33 | Financial Covenant Ratios Under Bank Revolving Line of Credit Agreements | 65 | |||
34 | Financial Ratios Under Debt Indentures | 65 | |||
35 | Interest Rate Gap Analysis | 67 | |||
36 | Financial Instruments | 68 | |||
37 | Loan Repricing | 69 | |||
38 | Adjusted Financial Measures — Income Statement | 71 | |||
39 | TIER and Adjusted TIER | 71 | |||
40 | Adjusted Financial Measures — Balance Sheet | 73 | |||
41 | Leverage and Debt-to-Equity Ratios | 73 | |||
iii
FORWARD-LOOKING STATEMENTS
This Annual Report on Form 10-K contains certain statements that are considered “forward-looking statements” within the Securities Act of 1933, as amended, and the Exchange Act of 1934, as amended. Forward-looking statements, which are based on certain assumptions and describe our future plans, strategies and expectations, are generally identified by our use of words such as “intend,” “plan,” “may,” “should,” “will,” “project,” “estimate,” “anticipate,” “believe,” “expect,” “continue,” “potential,” “opportunity” and similar expressions, whether in the negative or affirmative. All statements about future expectations or projections, including statements about loan volume, the appropriateness of the allowance for loan losses, operating income and expenses, leverage and debt-to-equity ratios, borrower financial performance, impaired loans, and sources and uses of liquidity, are forward-looking statements. Although we believe that the expectations reflected in our forward-looking statements are based on reasonable assumptions, actual results and performance may differ materially from our forward-looking statements due to several factors. Factors that could cause future results to vary from our forward-looking statements include, but are not limited to, general economic conditions, legislative changes including those that could affect our tax status, governmental monetary and fiscal policies, demand for our loan products, lending competition, changes in the quality or composition of our loan portfolio, changes in our ability to access external financing, changes in the credit ratings on our debt, valuation of collateral supporting impaired loans, charges associated with our operation or disposition of foreclosed assets, regulatory and economic conditions in the rural electric industry, nonperformance of counterparties to our derivative agreements, the costs and effects of legal or governmental proceedings involving us or our members and the factors listed and described under “Item 1A. Risk Factors” of this Report. Except as required by law, we undertake no obligation to update or publicly release any revisions to forward-looking statements to reflect events, circumstances or changes in expectations after the date on which the statement is made.
PART I
Item 1. | Business |
OVERVIEW |
National Rural Utilities Cooperative Finance Corporation (“CFC”) is a member-owned cooperative association incorporated under the laws of the District of Columbia in April 1969. CFC’s principal purpose is to provide its members with financing to supplement the loan programs of the Rural Utilities Service (“RUS”) of the United States Department of Agriculture (“USDA”). CFC makes loans to its rural electric members so they can acquire, construct and operate electric distribution, generation, transmission and related facilities. CFC also provides its members with credit enhancements in the form of letters of credit and guarantees of debt obligations. As a cooperative, CFC is owned by and exclusively serves its membership, which consists of not-for-profit entities or subsidiaries or affiliates of not-for-profit entities. CFC is exempt from federal income taxes under Section 501(c)(4) of the Internal Revenue Code. As a member-owned cooperative, CFC’s objective is not to maximize profit, but rather to offer its members cost-based financial products and services consistent with sound financial management. As described below under “Allocation and Retirement of Patronage Capital,” CFC annually allocates its net earnings, which consist of net income excluding the effect of certain noncash accounting entries, to (i) a cooperative educational fund; (ii) a general reserve, if necessary; (iii) members based on each member’s patronage of CFC’s loan programs during the year; and (iv) a members’ capital reserve. CFC funds its activities primarily through a combination of public and private issuances of debt securities, member investments and retained equity. As a tax-exempt, member-owned cooperative, we cannot issue equity securities.
Our financial statements include the consolidated accounts of CFC, Rural Telephone Finance Cooperative (“RTFC”), National Cooperative Services Corporation (“NCSC”) and subsidiaries created and controlled by CFC to hold foreclosed assets resulting from defaulted loans or bankruptcy. Unless stated otherwise, references to “we,” “our” or “us” relate to CFC and its consolidated entities. All references to members within this document include members, associates and affiliates of CFC and its consolidated entities.
RTFC is a taxable Subchapter T cooperative association originally incorporated in South Dakota in 1987 and reincorporated as a member-owned cooperative association in the District of Columbia in 2005. RTFC’s principal purpose is to provide financing for its rural telecommunications members and their affiliates. RTFC’s membership consists of a combination of not-for-profit and for-profit entities. CFC is the sole lender to and manages the business operations of RTFC through a management agreement in effect until December 1, 2016, which is automatically renewed for one-year terms thereafter
1
unless terminated by either party. Under a guarantee agreement, RTFC pays CFC a fee and, in exchange, CFC reimburses RTFC for loan losses. As permitted under Subchapter T of the Internal Revenue Code, RTFC pays income tax based on its taxable income, excluding patronage-sourced earnings allocated to its patrons. RTFC is headquartered with CFC in Dulles, Virginia.
NCSC is a taxable cooperative incorporated in 1981 in the District of Columbia as a member-owned cooperative association. The principal purpose of NCSC is to provide financing to its members, entities eligible to be members of CFC and the for-profit and nonprofit entities that are owned, operated or controlled by, or provide significant benefit to Class A, B and C members of CFC. See “Members” below for a description of our member classes. NCSC’s membership consists of distribution systems, power supply systems and statewide and regional associations that were members of CFC as of May 31, 2016. CFC, which is the primary source of funding for NCSC, manages NCSC’s business operations under a management agreement that is automatically renewable on an annual basis unless terminated by either party. NCSC pays CFC a fee and, in exchange, CFC reimburses NCSC for loan losses under a guarantee agreement. As a taxable cooperative, NCSC pays income tax based on its reported taxable income and deductions. NCSC is headquartered with CFC in Dulles, Virginia.
CFC held foreclosed assets through one entity, Caribbean Asset Holdings, LLC (“CAH”), as of May 31, 2016. CAH was established as a holding company for various U.S. Virgin Islands, British Virgin Islands and St. Maarten-based telecommunications operating entities that were transferred in fiscal year 2011 to CAH as a result of a loan default by an RTFC borrower and subsequent bankruptcy proceedings. These operating entities provide local, long-distance and wireless telephone, cable television and Internet services to residential and commercial customers. On September 30, 2015, CFC entered into a Purchase Agreement (as amended, the “Purchase Agreement”) with CAH, ATN VI Holdings, LLC (“Buyer”) and ATN International, Inc. (formerly Atlantic Tele-Network, Inc.), the parent corporation of Buyer, to sell all of the issued and outstanding membership interests of CAH to Buyer for a purchase price of $145 million, subject to certain adjustments described in the Purchase Agreement.
On July 1, 2016, the Purchase Agreement was amended and the sale of CAH was completed for a purchase price of approximately $144 million. Our net proceeds at closing totaled $109 million, which represents the purchase price of $144 million less agreed-upon purchase price adjustments and transaction costs as of the closing date. The net proceeds are subject to post-closing adjustments, which are due from Buyer within 60 days of the closing date for review by us. CFC also remains subject to potential indemnification claims, as specified in the Purchase Agreement. Upon closing, $16 million of the sale proceeds were deposited into escrow to fund potential indemnification claims for a period of 15 months following the closing. In connection with the sale, RTFC provided a loan in the amount of $60 million to Buyer to finance a portion of the transaction. ATN International has provided a guarantee on an unsecured basis of Buyer’s obligations to RTFC pursuant to the financing. See “Note 5—Foreclosed Assets” for additional information on the sale of CAH. See “Item 7. Management’s Discussion and Analysis of Financial Condition and Results of Operations (“MD&A”)—Executive Summary,” “MD&A—Consolidated Results of Operations—Non-Interest Income” and “Note 5—Foreclosed Assets” for additional information on the sale of CAH, including the impact on our financial statements.
Our principal operations are currently organized for management reporting purposes into three business segments: CFC, RTFC and NCSC. We provide information on the financial performance of our business segments in “Note 15—Business Segments.”
Our annual reports on Form 10-K, quarterly reports on Form 10-Q, current reports on Form 8-K, and any amendments to those reports, are available for free at www.nrucfc.coop as soon as reasonably practicable after they are electronically filed with or furnished to the U.S. Securities and Exchange Commission (“SEC”). These reports also are available for free on the SEC’s website at www.sec.gov. Information posted on our website is not incorporated by reference into this Form 10-K.
OUR BUSINESS |
Our business strategy and policies are set by our board of directors and may be amended or revised from time to time by the board of directors. We are a not-for-profit tax-exempt cooperative finance organization, whose primary focus is to provide our members with the credit products they need to fund their operations. As such, our business focuses on lending to electric systems and securing access to capital through diverse funding sources at rates that allow us to offer competitively priced credit products to our members.
2
Focus on Electric Lending
CFC focuses on lending to electric utility cooperatives. Most of our electric cooperative borrowers continue to demonstrate stable operating performance and strong financial ratios because electricity is considered an essential service for the substantial majority of our electric cooperatives’ customers. Our electric cooperative members experience limited competition as they generally operate in exclusive territories, the majority of which are not rate regulated. Loans to electric utility organizations represented approximately 99% of the outstanding loan portfolio as of May 31, 2016. Over the last five years, outstanding loans to electric utility organizations have increased by approximately 24%.
Maintain Diversified Funding Sources
We strive to maintain diversified funding sources beyond capital market offerings of debt securities. We offer various short- and long-term unsecured debt securities to our members and affiliates, including commercial paper, select notes, daily liquidity fund notes, medium-term notes and subordinated certificates. While we continue to issue debt securities such as collateral trust bonds and medium-term notes in the capital markets and offer investments in commercial paper to non-members, we also have access to funds through bank revolving line of credit arrangements, government-guaranteed funding programs such as the Guaranteed Underwriter Program of the Rural Utilities Service (“RUS ”), an agency of the USDA, as well as private placement note purchase agreements with the Federal Agricultural Mortgage Corporation (“Farmer Mac”). We provide additional information on our funding sources in “Item 7. MD&A—Consolidated Balance Sheet Analysis,” “Item 7. MD&A—Liquidity Risk,” “Note 6—Short-Term Borrowings,” “Note 7—Long-Term Debt,” “Note 8—Subordinated Deferrable Debt” and “Note 9—Members’ Subordinated Certificates.”
LOAN PROGRAMS |
CFC lends to its members and associates. RTFC lends to its members, organizations affiliated with its members and associates. NCSC lends to its members and associates. See “Item 1. Business—Members” for additional information on the entities that comprise our membership. Loans to NCSC associates may require a guarantee of repayment to NCSC from the CFC member cooperative with which it is affiliated. CFC, RTFC and NCSC loans generally contain provisions that restrict further borrower advances or trigger an event of default if there is any material adverse change in the business or condition, financial or otherwise, of the borrower.
CFC Loan Programs
Long-Term Loans
CFC’s long-term loans generally have the following characteristics:
• | terms of up to 35 years on a senior secured basis; |
• | amortizing or bullet maturity loans with serial payment structures; |
• | the property, plant and equipment financed by and securing the long-term loan has a useful life equal to or in excess of the loan maturity; |
• | flexibility for the borrower to select a fixed interest rate for periods of one to 35 years or a variable interest rate; and |
• | the ability for the borrower to select various tranches with either a fixed or variable interest rate for each tranche. |
Borrowers typically have the option of selecting a fixed or variable interest rate at the time of each advance on long-term loan facilities. When selecting a fixed rate, the borrower has the option to choose a fixed rate for a term of one year through the final maturity of the loan. When the selected fixed interest rate term expires, the borrower may select another fixed rate for a term of one year through the loan maturity or the current variable rate. Long-term fixed rates are set daily for new loan advances and loans that reprice. The fixed rate on each loan is determined on the day the loan is advanced or repriced based on the term selected. The variable rate is set on the first day of each month.
To be in compliance with the covenants in the loan agreement and eligible for loan advances, distribution systems generally must maintain an average modified debt service coverage ratio, as defined in the loan agreement, of 1.35 or greater. CFC may make long-term loans to distribution systems, on a case-by-case basis, that do not meet these general criteria. Power
3
supply systems generally are required either (i) to maintain an average modified debt service coverage ratio, as defined in the loan agreement, of 1.00 or greater or (ii) to establish and collect rates and other revenue in an amount to yield margins for interest, as defined in an indenture, in each fiscal year sufficient to equal at least 1.00 or (iii) both. CFC may make long-term loans to power supply systems, on a case-by-case basis, that may include other requirements, such as maintenance of a minimum equity level.
Line of Credit Loans
Line of credit loans are generally unsecured and may be committed or uncommitted facilities. Line of credit loans are designed primarily to assist borrowers with liquidity and cash management and are generally advanced at variable interest rates. Line of credit loans also are made available as interim financing when a member either receives RUS approval to obtain a loan and is awaiting its initial advance of funds or submits a loan application that is pending approval from RUS (sometimes referred to as “bridge loans”). These bridge loans are not required to be paid down for five consecutive business days. In these cases, when the borrower receives the RUS loan advance, the funds must be used to repay the bridge facilities.
Line of credit loans are typically revolving facilities. Certain line of credit loans require the borrower to pay off the principal balance for at least five consecutive business days at least once during each 12-month period. Under the provisions of our uncommitted lines of credit, we have the option, at our discretion, not to fund advances regardless of whether the borrower is in compliance with the terms and conditions of the facility.
Syndicated Line of Credit Loans
A syndicated line of credit loan is typically a large financing offered by a group of lenders that work together to provide funds for a single borrower. Syndicated loans are generally unsecured, floating-rate loans that can be provided on a revolving or term basis for tenors that range from several months to five years. Syndicated financings are arranged for borrowers on a case-by-case basis. CFC may act as lead lender, arranger and administrative agent for the syndicated facilities. CFC uses its best efforts to syndicate the loan requirements of certain borrowers. The success of such efforts depends on the financial position and credit quality of the borrower as well as market conditions.
RTFC Loan Programs
Loans to rural local exchange carriers or holding companies of rural local exchange carriers represented 97% and 94% of RTFC’s total outstanding loans as of May 31, 2016 and 2015, respectively. Most of these rural telecommunications companies have diversified their operations and also provide broadband services.
Long-Term Loans
RTFC makes long-term loans to rural telecommunications systems for debt refinancing, construction or upgrades of infrastructure, acquisitions and other corporate purposes.
RTFC’s long-term loans generally have the following characteristics:
• | terms not exceeding 10 years on a senior secured basis; |
• | the property, plant and equipment financed by and securing the long-term loan has a useful life equal to or in excess of the loan maturity; |
• | flexibility for the borrower to select a fixed interest rate for periods from one year to the final loan maturity or a variable interest rate; and |
• | the ability for the borrower to select various tranches with either a fixed or variable interest rate for each tranche. |
When a selected fixed interest rate term expires, generally the borrower may select another fixed-rate term or a variable rate. The fixed rate on a loan is determined on the day the loan is advanced or converted to a fixed rate based on the term selected. The long-term variable rate is set on the first day of each month.
4
To borrow from RTFC, a rural telecommunication system generally must be able to demonstrate the ability to achieve and maintain an annual debt service coverage ratio of 1.25. RTFC may make long-term loans to rural telecommunication systems, on a case-by-case basis, that do not meet these general criteria.
Line of Credit Loans
Line of credit loans are generally unsecured. Line of credit loans are designed primarily to assist borrowers with liquidity and cash management and are generally advanced at variable interest rates. Line of credit loans are typically revolving facilities and generally require the borrower to pay off the principal balance for at least five consecutive business days at least once during each 12-month period. Line of credit loans also are made available as interim financing, or bridge loans, when a borrower either receives RUS approval to obtain a loan and is awaiting its initial advance of funds or submits a loan application that is pending approval from RUS. RUS loan advances, when received, must be used to repay these bridge facilities.
NCSC Loan Programs
Long-Term Loans
NCSC’s long-term loans generally have the following characteristics:
• | terms of up to 35 years on a senior secured or unsecured basis; |
• | amortizing or bullet maturity loans with serial payment structures; |
• | the property, plant and equipment financed by and securing the long-term loan has a useful life equal to or in excess of the loan maturity; |
• | flexibility for the borrower to select a fixed interest rate for periods of one to 35 years or a variable interest rate; and |
• | the ability for the borrower to select various tranches with either a fixed or variable interest rate for each tranche. |
NCSC allows borrowers to select a fixed interest rate or a variable interest rate at the time of each advance on long-term loan facilities. When selecting a fixed rate, the borrower has the option to choose a fixed rate for a term of one year through the final maturity of the loan. When the selected fixed interest rate term expires, the borrower may select another fixed rate for a term of one year through the loan maturity or the current variable rate. The fixed rate on a loan is determined on the day the loan is advanced or repriced based on the term selected. The variable rate is set on the first day of each month.
Line of Credit Loans
NCSC also provides unsecured revolving line of credit loans to assist borrowers with liquidity and cash management on terms similar to those provided by CFC and RTFC as described above.
Loan Features and Options
Interest Rates
As a member-owned cooperative finance organization, we are a cost-based lender. As such, our interest rates are set based on a yield that we believe will generate a reasonable level of earnings to cover our cost of funding, general and administrative expenses and loan loss provision. Various standardized discounts may reduce the stated interest rates for Class A and Class B borrowers meeting certain criteria related to performance, volume, collateral and equity requirements.
Conversion Option
Generally, a borrower may convert a long-term loan from a variable interest rate to a fixed interest rate at any time without a fee and convert a long-term loan from a fixed rate to another fixed rate or to a variable rate at any time upon payment of a conversion fee, if applicable, based on current loan policies.
5
Prepayment Option
Generally, borrowers may prepay long-term fixed-rate loans at any time, subject to payment of an administrative fee and a make-whole premium and prepay long-term variable-rate loans at any time, subject to payment of an administrative fee. Line of credit loans may be prepaid at any time without a fee, unless the interest rate on the loan is fixed or based on a London Interbank Offered Rate (“LIBOR”) index.
Loan Security
Long-term loans are typically senior secured on parity with other secured lenders (primarily RUS), if any, by all assets and revenue of the borrower, subject to standard liens typical in utility mortgages such as those related to taxes, worker’s compensation awards, mechanics’ and similar liens, rights-of-way and governmental rights. We are able to obtain liens on parity with liens for the benefit of RUS because RUS’ form of mortgage expressly provides for other lenders such as CFC to have a parity lien position if the borrower satisfies certain conditions or obtains a written lien accommodation from RUS. When we make loans to borrowers that have existing loans from RUS, we generally require those borrowers to either obtain such a lien accommodation or satisfy the conditions necessary for our loan to be secured on parity under the mortgage with the loan from RUS.
As noted above, our line of credit loans are generally unsecured.
GUARANTEE PROGRAMS |
When we guarantee debt obligations of our members, we use the same credit policies and monitoring procedures for guarantees as for loans. If a member system defaults in its obligation to pay debt service, then we are obligated to pay any required amounts under our guarantees. Meeting our guarantee obligations satisfies the underlying obligation of our member systems and prevents the exercise of remedies by the guarantee beneficiary based upon a payment default by a member system. In general, the member system is required to repay any amount advanced by us with interest pursuant to the documents evidencing the member system’s reimbursement obligation. We were not required to perform pursuant to any of our guarantee obligations during the year ended May 31, 2016.
Guarantees of Long-Term Tax-Exempt Bonds
We guarantee debt issued for our members’ construction or acquisition of pollution control, solid waste disposal, industrial development and electric distribution facilities. Governmental authorities issue such debt on a non-recourse basis and the interest thereon is exempt from federal taxation. The proceeds of the offering are made available to the member system, which in turn is obligated to pay the governmental authority amounts sufficient to service the debt.
If a system defaults for failure to make the debt payments, we are obligated to pay, after available debt service reserve funds have been exhausted, scheduled debt service under our guarantee. Such payment will prevent the occurrence of an event of default that would otherwise permit acceleration of the bond issue. The system is required to repay any amount that we advance pursuant to our guarantee plus interest on that advance. This repayment obligation, together with the interest thereon, is typically senior secured on parity with other lenders (including, in most cases, RUS), by a lien on substantially all of the system’s assets. If the security instrument is a common mortgage with RUS, then in general, we may not exercise remedies for up to two years following default. However, if the debt is accelerated under the common mortgage because of a determination that the related interest is not tax-exempt, the system’s obligation to reimburse us for any guarantee payments will be treated as a long-term loan. The system is required to pay us initial and/or ongoing guarantee fees in connection with these transactions.
Certain guaranteed long-term debt bears interest at variable rates that are adjusted at intervals of one to 270 days including weekly, every five weeks or semi-annually to a level favorable to their resale or auction at par. If funding sources are available, the member that issued the debt may choose a fixed interest rate on the debt. When the variable rate is reset, holders of variable-rate debt have the right to tender the debt for purchase at par. In some transactions, we have committed to purchase this debt as liquidity provider if it cannot otherwise be re-marketed. If we hold the securities, the cooperative pays us the interest earned on the bonds or interest calculated based on our short-term variable interest rate, whichever is greater. The system is required to pay us stand-by liquidity fees in connection with these transactions.
6
Letters of Credit
In exchange for a fee, we issue irrevocable letters of credit to support members’ obligations to energy marketers, other third parties and to the USDA Rural Business and Cooperative Development Service. Each letter of credit is supported by a reimbursement agreement with the member on whose behalf the letter of credit was issued. In the event a beneficiary draws on a letter of credit, the agreement generally requires the member to reimburse us within one year from the date of the draw, with interest accruing from that date at our line of credit variable interest rate.
The Federal Communications Commission (“FCC”) issued an order in May 2016 that designated CFC as an acceptable source for letters of credit in support of FCC programs that encourage deployment of high-speed broadband throughout rural America. The designation will allow CFC to provide credit support for rural electric and telecommunication cooperatives that participate in programs designed to increase deployment of broadband services to underserved rural areas.
Other Guarantees
We may provide other guarantees as requested by our members. These guarantees may be made on a secured or unsecured basis with guarantee fees set to cover our general and administrative expenses, a provision for losses and a reasonable margin.
We provide additional information on our guarantee programs and outstanding guarantee amounts as of May 31, 2016 and 2015 in “Item 7. MD&A—Off-Balance Sheet Arrangements,” “Item 7. MD&A—Credit Risk—Loan and Guarantee Portfolio Credit Risk” and “Note 13—Guarantees.”
INVESTMENT POLICY |
We invest funds in accordance with policies adopted by our board of directors. Under our current investment policy, funds may be invested in direct obligations of, or guaranteed by, the United States or agencies thereof and investments in government-sponsored enterprises. Our policy also permits us to invest in certain financial institutions in the form of overnight investment products and Eurodollar deposits, bankers’ acceptances, certificates of deposit, working capital acceptances or other deposits. Other permitted investments include highly rated obligations, such as commercial paper, certain obligations of foreign governments and certain corporate bonds. In addition, we may invest in repurchase agreements secured by direct obligations of the United States or its agencies and highly rated commercial paper that is set aside in a segregated account. All of these investments are subject to certain limitations set forth in our investment policy.
INDUSTRY |
Overview
Since the enactment of the Rural Electrification Act in 1936, RUS has financed the construction of electric generating plants, transmission facilities and distribution systems to provide electricity to rural areas. Principally through the creation of local electric cooperatives originally financed under the Rural Electrification Act loan program in 47 states and three U.S. territories, the percentage of farms and residences in rural areas of the United States receiving central station electric service increased from 11% in 1934 to almost 100% currently.
RUS makes loan guarantees and provides other forms of financial assistance to rural electric system borrowers. Under the Rural Electrification Act, RUS is authorized to make direct loans to systems that qualify for the hardship program (5% interest rate), the municipal rate program (based on a municipal government obligation index) and a Treasury rate program (at Treasury plus 0.125%). RUS also is authorized to guarantee loans that bear interest at a rate agreed upon by the borrower and the lender (which generally has been the Federal Financing Bank (“FFB”)). RUS exercises oversight over borrowers’ operations. Its loans and guarantees are secured by a mortgage or indenture on substantially all of the system’s assets and revenue.
7
Leading up to CFC’s formation in 1969, there was a growing need for capital for electric cooperatives to build new electric facilities due to growth in rural America. The electric cooperatives formed CFC so a source of financing would be available to them to supplement the RUS loan programs and to mitigate uncertainty related to government funding.
CFC aggregates the combined strength of its rural electric member cooperatives to access the public capital markets. CFC works cooperatively with RUS; however, CFC is not a federal agency or a government-sponsored enterprise, and is not owned or controlled by any federal agency or government-sponsored enterprise. Our members are not required to have outstanding loans from RUS as a condition of borrowing from CFC. CFC meets the financial needs of its rural members by:
• | providing bridge loans required by borrowers in anticipation of receiving RUS funding; |
• | providing financial products not otherwise available from RUS including lines of credit, letters of credit, guarantees on tax-exempt financing, weather-related disaster recovery lines of credit, unsecured loans and investment products such as commercial paper, member capital securities, select notes and medium-term notes; |
• | meeting the financing needs of those rural electric systems that repay or prepay their RUS loans and replace the government loans with private capital; and |
• | providing financing to RUS-eligible rural electric systems for facilities that are not eligible for financing from RUS. |
Electric Member Competition
The movement toward electric competition at the retail level has largely ceased. The electric utility industry has evolved into a “hybrid” model in which there are significant differences in the retail regulatory approaches followed in different states and regions.
Customer choice regulation, where customers have a choice of alternative energy suppliers, has had little impact on distribution and power supply cooperatives, and we do not expect a material impact going forward. Retail customer choice existed in 14 states as of May 31, 2016. Those states were Connecticut, Delaware, Illinois, Maine, Maryland, Massachusetts, Michigan, New Hampshire, New Jersey, New York, Ohio, Pennsylvania, Rhode Island and Texas. In general, even in those states, very few consumers served by CFC members have switched to other suppliers.
Many factors restrict the choices customers have available to them and, therefore, mitigate the effect of customer choice and competition in areas served by cooperatives. These factors include, but are not limited to, the following:
• | utilities in many states may still be regulated regarding rates on noncompetitive services, such as distribution; |
• | 20 states regulate the debt securities issued by utilities, including cooperatives, which could affect funding costs and, therefore, the electric rates charged to customers; |
• | Federal Energy Regulatory Commission regulation of rates as well as terms and conditions of transmission service; |
• | the fact that few competitors demonstrated much interest in providing electric energy to residential or rural customers; and |
• | distribution systems own the lines to the customer and it would not be feasible for a competitor to build a second line to serve the same customers in almost all situations. Therefore, the distribution systems still charge a fee or access tariff for the service of delivering power, regardless of who supplies the power. |
Electric Member Regulation
There were 12 states in which some or all electric cooperatives are subject to state regulation over the rates they charge as of May 31, 2016. Electric cooperatives are subject to full or partial state regulation over their electric rates, and the cooperatives in these states do not have a right to opt out of regulation. Those states are Arizona, Arkansas, Georgia, Hawaii, Kentucky, Louisiana, Maine, Maryland, New Mexico, Vermont, Virginia and West Virginia. The Federal Energy Regulatory Commission also has jurisdiction to regulate transmission rates, terms and conditions of service, and the issuance of securities by public utilities within its jurisdiction.
Our distribution and power supply members are subject to regulation by various federal, regional, state and local authorities with respect to the environmental effects of their operations. At the federal level, the U.S. Environmental Protection Agency (“EPA”) has proposed a number of rulemakings, including cooling water intake structures, coal ash disposal, hazardous air pollutants and interstate transport of air pollutants, that could force the electric utility industry to incur capital costs to comply with these regulations and possibly retire coal-fired generating capacity. On August 3, 2015, the EPA issued its final
8
Clean Power Plan Rule for regulating greenhouse gas emissions from existing fossil fuel-fired power plants. The regulation, falling under Section 111(d) of the federal Clean Air Act, is designed to cut carbon emissions (from 2005 levels) from affected facilities by 32% by 2030. The regulation has the potential to raise the cost of electricity from fossil fuel generation and accelerate the retirement of some existing plants. Numerous parties, including many of our members, have appealed the Clean Power Plan Rule to the United States Court of Appeals for the District of Columbia Circuit. The United States Supreme Court has stayed the Clean Power Plan Rule pending disposition of this appeal. In most cases, any associated costs of compliance can be passed on to cooperative consumers without additional regulatory approval.
LENDING COMPETITION |
RUS is the largest lender to electric cooperatives. RUS provides long-term secured loans. CFC provides financial products and services, primarily in the form of long-term and short-term loans, to its electric cooperative members to supplement RUS financing, to provide loans to members that have elected not to borrow from RUS, and to bridge long-term financing provided by RUS.
CFC’s primary competitor is CoBank, ACB, a federally chartered instrumentality of the United States that is a member of the Farm Credit System. CFC also competes with banks, other financial institutions and the capital markets to provide loans and other financial products to our members. As a result, we are competing with the customer service, pricing and funding options the member is able to obtain from these sources. We attempt to minimize the effect of competition by offering a variety of loan options and value-added services and by leveraging the working relationships developed with the majority of our members over the past 47 years. Further, on an annual basis, we allocate substantially all net earnings to members (i) in the form of patronage capital, which reduces our members’ effective cost of borrowing and (ii) through the members’ capital reserve. The value-added services that we provide include, but are not limited to, benchmarking tools, financial models, and various conferences, meetings and training workshops.
In order to meet other financing needs of our members, we offer options that include credit support in the form of letters of credit and guarantees, loan syndications and loan participations. Our credit products are tailored to meet the specific needs of each cooperative, and we often offer specific transaction structures that our competitors do not provide. CFC also offers certain risk mitigation products and interest rate discounts on secured, long-term loans for its members that meet certain criteria, including performance, volume, collateral and equity requirements.
CFC has established certain funds to benefit its members. Since 1981, CFC has set aside a portion of its annual net earnings in a cooperative educational fund to promote awareness and appreciation of the cooperative principles. As directed by the CFC Board of Directors, a portion of the contributions to the funds are distributed through the electric cooperative statewide associations. Since 1986, CFC has supported its members’ efforts to protect their service territories from erosion or takeover by other utilities through assistance from the Cooperative System Integrity Fund, which is funded through voluntary contributions from members. Amounts from the Integrity Fund are distributed to applicants who establish that (i) all or a significant portion of their consumers, services or facilities face a hostile threat of acquisition or annexation by a competing entity; (ii) they face a significant threat in their ability to continue to provide non-electric energy services to customers; or (iii) they are facing regulatory, judicial or legislative challenges that threaten their existence under the cooperative business model.
Our rural electric borrowers are mostly private companies; thus, the overall size of the rural electric lending market cannot be determined from public information. We estimate the size of the overall rural electric lending market from the annual financial and statistical reports filed with us by our members using calendar year data; however, there are certain limitations with regard to these estimates, including the following:
• | while the underlying data included in the financial and statistical reports may be audited, the preparation of the financial and statistical reports is not audited; |
• | in some cases, not all members provide the annual financial and statistical reports on a timely basis to be included in summarized results; and |
• | the financial and statistical reports do not include comprehensive data on indebtedness by lenders other than RUS. |
According to financial data provided to us by our 806 reporting distribution systems and 56 reporting power supply systems as of December 31, 2015, and our 808 reporting electric cooperative distribution systems and 58 reporting power supply
9
systems as of December 31, 2014, long-term debt outstanding to CFC, RUS and other lenders in the electric cooperative industry by those entities was as follows as of December 31, 2015 and 2014:
December 31, | ||||||||||||||
2015 | 2014 | |||||||||||||
(Dollars in thousands) | Debt Outstanding | % of Total | Debt Outstanding | % of Total | ||||||||||
Total long-term debt reported by members:(1) | ||||||||||||||
Distribution | $ | 45,899,178 | $ | 44,399,581 | ||||||||||
Power supply | 42,302,998 | 45,264,091 | ||||||||||||
Less: long-term debt funded by RUS | (39,070,188 | ) | (42,749,636 | ) | ||||||||||
Members’ non-RUS long-term debt | $ | 49,131,988 | $ | 46,914,036 | ||||||||||
Funding source of member’s long-term debt: | ||||||||||||||
Long-term debt funded by CFC | $ | 20,986,659 | 43 | % | $ | 19,110,899 | 41 | % | ||||||
Long-term debt funded by other lenders | 28,145,329 | 57 | 27,803,137 | 59 | ||||||||||
Members’ non-RUS long-term debt | $ | 49,131,988 | 100 | % | $ | 46,914,036 | 100 | % | ||||||
____________________________
(1) Reported amounts are based on member-provided information, which may not have been subject to audit by an independent accounting firm.
Members’ long-term debt funded by CFC, by type, as of December 31, 2015 and 2014 is summarized further below.
December 31, | ||||||||||||||
2015 | 2014 | |||||||||||||
(Dollars in thousands) | Debt Outstanding | % of Total | Debt Outstanding | % of Total | ||||||||||
Distribution | $ | 16,822,651 | 80 | % | $ | 15,055,933 | 79 | % | ||||||
Power supply | 4,164,008 | 20 | 4,054,966 | 21 | ||||||||||
Long-term debt funded by CFC | $ | 20,986,659 | 100 | % | $ | 19,110,899 | 100 | % | ||||||
We are not able to specifically identify the amount of debt our members have outstanding to CoBank, ACB, from either the annual financial and statistical reports our members file with us or from CoBank, ACB’s public disclosure, but we believe that CoBank, ACB, is the lender other than CFC and RUS with significant long-term debt outstanding to the rural electric cooperatives.
REGULATION |
CFC, RTFC and NCSC are not subject to federal regulatory oversight or compliance with regard to lending. CFC, RTFC and NCSC are subject to state laws that pertain to the business conducted in each state, including but not limited to lending laws, usury laws and laws governing mortgages.
The Dodd-Frank Wall Street Reform and Consumer Protection Act (the “Dodd-Frank Act”) imposes requirements on certain entities that use derivatives such as clearing trades through a central organization, posting margin and recordkeeping. CFC does not participate in the derivatives markets for speculative, trading or investing purposes and does not make a market in derivatives. CFC is an end user of derivative financial instruments. CFC engages in over-the-counter derivative transactions to hedge the interest rate risks associated with lending to its members.
The U.S. Commodities Futures Trading Commission (“CFTC”) is the lead federal agency responsible for promulgation of certain rules implementing the Dodd-Frank Act requirements related to the utilization of swaps and derivative products. In August 2013, the CFTC issued a final rule “Clearing Exemption for Certain Swaps Entered into by Cooperatives,” which created an exemption from clearing for cooperatives. In April 2016, the CFTC issued a final rule “Margin Requirements for
10
Uncleared Swaps for Swap Dealers and Major Swap Participants, ” which includes an exemption from margin requirements for uncleared swaps for cooperatives that are financial end users. The exemption under each of these rules is applicable to CFC.
The Dodd-Frank Act requires the SEC to promulgate rules related to executive compensation and compensation clawbacks, which may require us to make additional disclosures or alter controls and/or risk management practices. We will continue to monitor and, where appropriate, advocate with respect to the implementation of the Dodd-Frank Act and its impact on us until all final rules become effective.
MEMBERS |
Our consolidated membership, after taking into consideration systems that are members of both CFC and NCSC and eliminating memberships between CFC, RTFC and NCSC, totaled 1,463 members and 230 associates as of May 31, 2016.
CFC
CFC’s bylaws provide that cooperative or nonprofit corporations, public corporations, utility districts and other public bodies that received or are eligible to receive a loan or commitment for a loan from RUS or any successor agency (as well as subsidiaries, federations or statewide and regional associations that are wholly owned or controlled by such entities) are eligible for membership. One of the criteria for eligibility for RUS financing is a “rural area” test. CFC relies on the definition of “rural” as specified in the Rural Electrification Act, as amended. “Rural” is defined in the Rural Electrification Act as any area other than a city, town or unincorporated area that has a population of less than 20,000, or any area within the service area of a borrower who, at the date of enactment of the Food, Conservation and Energy Act of 2008, had an outstanding RUS electric loan. The definition of “rural” under the act permits an area to be defined as “rural” regardless of the development of such area subsequent to the approval of the outstanding loan. Thus, those entities that received or qualify for financing from RUS are eligible to apply for membership, upon approval of membership by the CFC Board of Directors,
and subsequently borrow from CFC regardless of whether there is an outstanding loan with RUS. There are no requirements to maintain membership, although the board has the authority to suspend a member under certain circumstances. CFC has not suspended a member to date.
CFC has the following types of members, all of which are not-for-profit entities or subsidiaries or affiliates of not-for-profit entities.
Class A – Distribution Systems
Cooperative or nonprofit corporations, public corporations, utility districts and other public bodies, which received or are eligible to receive a loan or commitment for a loan from RUS or any successor agency, and that are engaged or planning to engage in furnishing utility services to their members and patrons for their use as ultimate consumers. The majority of our distribution system members are consumer-owned electric cooperatives.
Distribution systems are utilities engaged in retail sales of electricity to residential and commercial consumers in their defined service areas. Such sales are generally on an exclusive basis using the distribution system’s infrastructure, including substations, wires and related support systems. Distribution systems vary in size from small systems that serve a few thousand customers to large systems that serve more than 200,000 customers. Thus, the amount of loan funding required by different distribution systems varies significantly. Distribution systems may serve customers in more than one state.
Most distribution systems have all-requirements power purchase contracts with their power supply systems, which are owned and controlled by the member distribution systems. Wholesale power for resale also comes from other sources, including power supply’ contracts with government agencies, investor-owned utilities and other entities, and, in some cases, the distribution systems own generating facilities.
Class B – Power Supply Systems
Cooperative or nonprofit corporations that are federations of Class A members or of other Class B members, or both, or that are owned and controlled by Class A members or by other Class B members, or both, and that are engaged or planning to
11
engage in furnishing utility services primarily to Class A members or other Class B members. Our power supply system members are member-owned electric cooperatives.
The power supply systems vary in size from one with thousands of megawatts of power generation capacity to systems that have no generating capacity, which generally operate transmission lines to supply certain distribution systems or manage power supply purchase arrangements for the benefit of their distribution system members. Thus, the amount of loan funding required by different power supply systems varies significantly. Power supply members may serve distribution systems located in more than one state.
The wholesale power supply contracts with their distribution system members permit the power supply system, subject to regulatory approval in certain instances, to establish rates to produce revenue sufficient to cover debt service, to meet the cost of operation and maintenance of all generation, transmission and related facilities and to pay the cost of any power and energy purchased for resale.
Class C – Statewide and Regional Associations
Statewide and regional associations that are wholly owned or controlled by Class A members or Class B members, or both, or that are wholly owned subsidiaries of a CFC member, and that do not furnish utility services but supply other forms of service to their members. Such statewide organizations provide training and legislative, regulatory, media and related services. Certain states have an organization that represents and serves the distribution systems and power supply systems located in the state.
Class D – National Associations of Cooperatives
National associations of cooperatives that are Class A, Class B and Class C members, provided said national associations have, at the time of admission to membership in CFC, members domiciled in at least 80% of the states in the United States. National Rural Electric Cooperative Association (“NRECA”) is our sole Class D member. NRECA provides training, sponsors regional and national meetings, and provides legislative, regulatory, media and related services for nearly all rural electric cooperatives.
CFC Class A, B, C and D members are eligible to vote on matters put to a vote of the membership. Associates are not eligible to vote on matters put to a vote of the membership.
CFC’s membership as of May 31, 2016 was comprised of:
• | 839 Class A distribution systems; |
• | 71 Class B power supply systems; |
• | 66 Class C statewide and regional associations, including NCSC; and |
• | 1 Class D national association of cooperatives. |
In addition, CFC has associates that are nonprofit groups or entities organized on a cooperative basis that are owned, controlled or operated by Class A, B, C or D members and are engaged in or plan to engage in furnishing non-electric services primarily for the benefit of the ultimate consumers of CFC members. CFC had 49 associates, including RTFC, as of May 31, 2016.
RTFC
Membership in RTFC is limited to cooperative corporations, private corporations, public corporations, nonprofit corporations, utility districts and other public bodies that are approved by the RTFC Board of Directors and are actively borrowing or are eligible to borrow from RUS. These companies must be engaged directly or indirectly in furnishing telephone or telecommunications services. Holding companies, subsidiaries and other organizations that are owned, controlled or operated by members are referred to as affiliates, and are eligible to borrow from RTFC. Associates are organizations that provide non-telecommunications services to rural telecommunications companies that are approved by the RTFC Board of Directors. Neither affiliates nor associates are eligible to vote at meetings of the members.
12
RTFC’s membership was comprised of 487 members as of May 31, 2016. RTFC also had five associates as of May 31, 2016. CFC is not a member of RTFC. RTFC’s members and associates consisted of 93 not-for-profit entities and 299 for-profit entities as of May 31, 2016.
NCSC
Membership in NCSC includes organizations that are Class A, B or C members of CFC, or eligible for such membership and are approved for membership by the NCSC Board of Directors.
NCSC’s membership was comprised of 399 distribution systems, one power supply system and two statewide association as of May 31, 2016. All of NCSC’s members also were CFC members. CFC, however, is not a member of NCSC. In addition to members, NCSC had 177 associates as of May 31, 2016. NCSC’s associates may include members of CFC, entities eligible to be members of CFC and for-profit and not-for-profit entities that are owned, controlled or operated by or provide significant benefit to Class A, B and C members of CFC.
The business affairs of CFC, RTFC and NCSC are governed by separate boards of directors for each entity. We provide additional information on CFC’s corporate governance in “Item 10. Directors, Executive Officers and Corporate Governance.”
TAX STATUS |
In 1969, CFC obtained a ruling from the Internal Revenue Service recognizing CFC’s exemption from the payment of federal income taxes as an organization described under Section 501(c)(4) of the Internal Revenue Code.
In order for CFC to maintain its exemption under Section 501(c)(4) of the Internal Revenue Code, CFC must be “not organized for profit” and must be “operated exclusively for the promotion of social welfare” within the meaning of that section of the tax code. The Internal Revenue Service determined that CFC is an organization that is “operated exclusively for the promotion of social welfare” because the ultimate beneficiaries of its lending activities, like those of the RUS loan program, are the consumers of electricity produced by rural electric systems, the communities served by these systems and the nation as a whole.
As an organization described under Section 501(c)(4) of the Internal Revenue Code, no part of CFC’s net earnings can inure to the benefit of any private shareholder or individual. This requirement is referred to as the private inurement prohibition and was added to Section 501(c)(4) of the Internal Revenue Code in 1996. A legislative exception allows organizations like CFC to continue to make allocations of net earnings to members in accordance with its cooperative status.
CFC believes its operations have not changed materially from those described to the Internal Revenue Service in its exemption filing. CFC reviews the impact on operations of any new activity or potential change in product offerings or business in general to determine whether such change in activity or operations would be inconsistent with its status as an organization described under Section 501(c)(4).
RTFC is a taxable cooperative under Subchapter T of the Internal Revenue Code and is not subject to income taxes on income from patronage sources that is allocated to its borrowers, as long as the allocation is properly noticed and at least 20% of the amount allocated is retired in cash prior to filing the applicable tax return. RTFC pays income tax based on its taxable income and deductions, excluding amounts allocated to its borrowers.
NCSC is a taxable cooperative that pays income tax based on its taxable income and deductions.
ALLOCATION AND RETIREMENT OF PATRONAGE CAPITAL |
District of Columbia cooperative law requires cooperatives to allocate net earnings to patrons, to a general reserve in an amount sufficient to maintain a balance of at least 50% of paid-up capital, and to a cooperative educational fund, as well as permits additional allocations to board-approved reserves. District of Columbia cooperative law also requires that a
13
cooperative’s net earnings be allocated to all patrons in proportion to their individual patronage and each patron’s allocation be distributed to the patron unless the patron agrees that the cooperative may retain its share as additional capital.
CFC
Annually, the CFC Board of Directors allocates its net earnings to its patrons in the form of patronage capital, to a cooperative educational fund, to a general reserve, if necessary, and to other board-approved reserves. Net earnings are calculated by adjusting net income to exclude the noncash effects of the accounting for derivative financial instruments. Patronage capital is not allocated to members if CFC has an adjusted net loss. Net losses, if any, do not affect amounts previously allocated as patronage capital or to the reserves. Net earnings are first applied against prior-period losses, if any, before an allocation of patronage capital is made. CFC has not experienced an adjusted net loss during the past 10 years and has allocated patronage capital to members for each such year.
An allocation to the general reserve is made, if necessary, to maintain the balance of the general reserve at 50% of the membership fees collected. CFC’s bylaws require the allocation to the cooperative educational fund to be at least 0.25% of its net earnings. Funds from the cooperative educational fund are disbursed annually to statewide cooperative organizations to fund the teaching of cooperative principles and for other cooperative education programs.
Currently, CFC has one additional board-approved reserve, the members’ capital reserve. The CFC Board of Directors determines the amount of net earnings that is allocated to the members’ capital reserve, if any. The members’ capital reserve represents net earnings that CFC holds to increase equity retention. The net earnings held in the members’ capital reserve have not been specifically allocated to members, but may be allocated to individual members in the future as patronage capital if authorized by the CFC Board of Directors.
All remaining net earnings are allocated to CFC’s members in the form of patronage capital. The amount of net earnings allocated to each member is based on the member’s patronage of CFC’s lending programs during the year. No interest is earned by members on allocated patronage capital. There is no effect on CFC’s total equity as a result of allocating net earnings to members in the form of patronage capital or to board-approved reserves. The CFC Board of Directors has voted annually to retire a portion of the patronage capital allocation. Upon retirement, patronage capital is paid out in cash to the members to which it was allocated. CFC’s total equity is reduced by the amount of patronage capital retired to its members and by amounts disbursed from board-approved reserves.
Pursuant to CFC’s bylaws, the CFC Board of Directors determines the method, basis, priority and order of retirement of amounts allocated. The current policy of the CFC Board of Directors is to retire 50% of the prior fiscal year’s allocated net earnings following the end of each fiscal year and to hold the remaining 50% for 25 years to fund operations. The amount and timing of future retirements remains subject to annual approval by the CFC Board of Directors, and may be affected by CFC’s financial condition and other factors. The CFC Board of Directors has the authority to change the current practice for allocating and retiring net earnings at any time, subject to applicable cooperative law.
RTFC
In accordance with District of Columbia cooperative law and its bylaws and board policies, RTFC allocates its net earnings to its patrons, a cooperative educational fund and a general reserve, if necessary. Net losses are not allocated to members and do not affect amounts previously allocated as patronage capital or to the reserves. Current period earnings are first applied against any prior year losses before allocating patronage capital.
Pursuant to RTFC’s bylaws, the RTFC Board of Directors shall determine the method, basis, priority and order of retirement of amounts allocated. RTFC’s bylaws require that it allocate at least 1% of net earnings to a cooperative educational fund. Funds from the cooperative educational fund are disbursed annually to fund the teaching of cooperative principles and for other cooperative education programs. An allocation to the general reserve is made, if necessary, to maintain the balance of the general reserve at 50% of the membership fees collected. The remainder is allocated to borrowers in proportion to their patronage. RTFC provides notice to its members of the amount allocated and retires 20% of the allocation for that year in cash prior to the filing of the applicable tax return. Any additional amounts are retired as determined by the RTFC Board of Directors with due regard for RTFC’s financial condition. There is no effect on the balance of equity due to the allocation of
14
net earnings to members or board-approved reserves. The retirement of amounts previously allocated to members or amounts disbursed from board-approved reserves reduces the balance of RTFC equity.
NCSC
In accordance with District of Columbia cooperative law and its bylaws and board policies, NCSC allocates its net earnings to a cooperative educational fund, to a general reserve, if necessary, and to other board-approved reserves. Net earnings are calculated by adjusting net income to exclude the noncash effects of the accounting for derivative financial instruments. Net losses, if any, do not affect amounts previously allocated to the reserves.
Pursuant to NCSC’s bylaws, the NCSC Board of Directors shall determine the method, basis, priority and order of amounts allocated. An allocation to the general reserve is made, if necessary, to maintain the balance of the general reserve at 50% of the membership fees collected. There is no effect on the balance of equity due to the allocation of net earnings to board-approved reserves. NCSC’s bylaws require the allocation to the cooperative educational fund to be at least 0.25% of its net earnings. Funds from the cooperative educational fund are disbursed annually to fund the teaching of cooperative principles and for other cooperative education programs.
EMPLOYEES |
We had 243 employees as of May 31, 2016. We believe that our relations with our employees are good.
Item 1A. | Risk Factors |
Our financial condition, results of operations and liquidity are subject to various risks and uncertainties inherent in our business. The risks described below are the risks we consider to be material to our business. Other risks may prove to be material or important in the future. If any of the events or circumstances described in the following risks actually occur, our business, financial condition or results of operations could suffer adversely. You should consider all of the following risks together with all of the other information in this Annual Report on Form 10-K.
RISK FACTORS |
Our business depends on access to external financing.
We depend on access to the capital markets and other sources of financing, such as our revolving credit agreements, investment from our members, private debt issuances through Farmer Mac and funding from the FFB through the Guaranteed Underwriter Program to fund new loan advances and refinance our long- and short-term debt and, if necessary, to fulfill our obligations under our guarantee and repurchase agreements. Market disruptions, downgrades to our long-term and/or short-term debt ratings, adverse changes in our business or performance, downturns in the electric industry and other events over which we have no control may deny or limit our access to the capital markets and/or subject us to higher costs for such funding. Our access to other sources of funding also could be limited by the same factors, by adverse changes in the business or performance of our members, by the banks committed to our revolving credit agreements or Farmer Mac, or by changes in federal law or the Guaranteed Underwriter Program.
Our funding needs are determined primarily by scheduled short- and long-term debt maturities and the amount of our loan advances to our borrowers relative to the scheduled payment amortization of loans previously made by us. If we are unable to timely issue debt into the capital markets or obtain funding from other sources, we may not have the funds to meet all of our obligations as they become due.
A reduction in the credit ratings for our debt could adversely affect our liquidity and/or cost of debt.
Our credit ratings are important to our liquidity. We currently contract with three nationally recognized statistical rating organizations to receive ratings for our secured and unsecured debt and our commercial paper. In order to access the commercial paper markets at current levels, we believe that we need to maintain our current ratings for commercial paper of P1 from Moody’s Investors Service (“Moody’s”), A-1 from S&P Global (“S&P”) and F-1 from Fitch Ratings Inc. (“Fitch”).
15
Changes in rating agencies’ rating methodology, actions by governmental entities or others, additional losses from impaired loans and other factors could adversely affect the credit ratings on our debt. A reduction in our credit ratings could adversely affect our liquidity and competitive position, increase our borrowing costs or limit our access to the capital markets and the sources of financing available to us. A significant increase in our cost of borrowings and interest expense could cause us to sustain losses or impair our liquidity by requiring us to seek other sources of financing, which may be difficult to obtain.
Fluctuating interest rates could adversely affect our income, margin and cash flow.
We set our interest rates on loans based on our cost of funding. We set our line of credit interest rate and long-term variable interest rate monthly. We do not match fund the majority of our long-term fixed-rate loans with a specific debt issuance at the time the loans are advanced. Instead, long-term fixed-rate loans are aggregated until the volume reaches a level that will allow an economically efficient issuance of long-term debt to fund long-term fixed-rate loans. As such, we are exposed to interest rate risk on our long-term fixed-rate loans during the period from which we have set a fixed rate on the loan until the time we obtain the long-term funding. Fixed-rate loans funded with variable-rate debt totaled $446 million, or 2%, of both total assets and total assets excluding derivative assets as of May 31, 2016.
A decrease in long-term fixed interest rates provided by other lenders could result in an increase in prepayments on long-term fixed-rate loans scheduled to reprice. Borrowers are able to prepay the long-term fixed-rate loan without a make-whole fee at the time the fixed-rate term expires. An increase in loan prepayments due to repricings could cause a decrease to earnings for the period of time it takes to use cash from such prepayments to repay maturing debt or make new loan advances. Loans with a fixed-rate term scheduled to reprice during the next 12 months totaled $993 million as of May 31, 2016.
Competition from other lenders could adversely impact our financial results.
We compete with other lenders for the portion of the rural utility loan demand for which RUS will not lend and for loans to members that have elected not to borrow from RUS. The primary competition for the non-RUS loan volume is from CoBank, ACB, a federally chartered instrumentality of the United States that is a member of the Farm Credit System. As a government-sponsored enterprise, CoBank, ACB, has the benefit of an implied government guarantee with respect to its funding. Competition may limit our ability to raise rates to adequately cover increases in costs, which could have an adverse impact on our results of operations, and increasing interest rates to cover costs could cause a reduction in new lending business.
Our elected directors also serve as officers or directors of certain of our individual member cooperatives, which may result in a potential conflict of interest with respect to loans, guarantees and extensions of credit that we may make to or on behalf of such member cooperatives.
In accordance with our charter documents and the purpose for which we were formed, we lend only to our members and associates. CFC’s directors are elected or appointed from our membership, with 10 director positions filled by directors of members, 10 director positions filled by general managers or chief executive officers of members, two positions appointed by NRECA and one at-large position that must, among other things, be a director, financial officer, general manager or chief executive of one of our members. CFC currently has loans outstanding to members that are affiliated with CFC directors and may periodically extend new loans to such members. The relationship of CFC’s directors to our members may give rise to conflicts of interests from time to time. See “Item 13. Certain Relationships and Related Transactions, and Director Independence—Review and Approval of Transactions with Related Persons” for a description of our policies with regard to approval of loans to members affiliated with CFC directors.
We are subject to credit risks related to collecting the amounts owed to us on our outstanding loans. Increased credit risk related to our loans or actual losses that exceed our allowance for loan losses could impair our financial results.
Our allowance for loan losses, which is established through a provision charged to expense, represents management’s best estimate of probable losses that have been incurred within the existing loan portfolio. The level of the allowance reflects management’s continuing evaluation of credit risk related to industry concentrations; economic conditions; specific credit risks; loan loss experience; current loan portfolio quality; present economic, political and regulatory conditions; and unidentified losses and risks inherent in the current loan portfolio. The determination of the appropriate level of the allowance for loan losses involves a high degree of subjectivity and requires us to make significant estimates of current credit risks and future trends, all of which may undergo material changes. Changes in economic conditions affecting
16
borrowers, new information regarding existing loans, identification of additional problem loans and other factors, both within and outside of our control, may require an increase in the allowance for loan losses. In addition, if actual losses incurred exceed current estimates of probable losses included in the allowance for loan losses, we will need additional provisions to increase the allowance for loan losses. Material increases in the allowance for loan losses will result in a decrease in net income and may have a material adverse effect on our financial results.
We have been and may in the future be in litigation with borrowers related to enforcement or collection actions pursuant to loan documents. In such cases, the borrower or others may assert counterclaims against us or initiate actions against us related to the loan documents. Unfavorable rulings could have a material adverse effect on our financial results.
We may obtain entities or other assets through foreclosure, which would subject us to the same performance and financial risks as any other owner or operator of similar businesses or assets.
As a financial institution, from time to time we may obtain entities and assets of borrowers in default through foreclosure proceedings. If we become the owner and operator of entities or assets obtained through foreclosure, we are subject to the same performance and financial risks as any other owner or operator of similar assets or entities. In particular, the value of the foreclosed assets or entities may deteriorate and have a negative impact on our results of operations. We assess foreclosed assets, if any, for impairment periodically as required under generally accepted accounting principles in the United States (“GAAP”). Impairment charges, if required, represent a reduction to earnings in the period of the charge. There may be substantial judgment used in the determination of whether such assets are impaired and in the calculation of the amount of the impairment. In addition, when foreclosed assets are sold to a third party, the sale price we receive may be below the amount previously recorded in our financial statements, which will result in a loss being recorded in the period of the sale.
The nonperformance of counterparties to our derivative agreements could impair our financial results.
We use interest rate swaps to manage our interest rate risk. There is a risk that the counterparties to these agreements will not perform as agreed, which could adversely affect our results of operations. The nonperformance of a counterparty on an agreement would result in the derivative no longer being an effective risk management tool, which could negatively affect our overall interest rate risk position. In addition, if a counterparty fails to perform on our derivative obligation, we could incur a financial loss to replace the derivative with another counterparty and/or a loss through the failure of the counterparty to pay us amounts owed.
A decline in our credit rating could trigger payments under our derivative agreements, which could impair our financial results.
We have certain interest rate swaps that contain credit risk-related contingent features referred to as rating triggers. Under certain rating triggers, if the credit rating for either counterparty falls to the level specified in the agreement, the other counterparty may, but is not obligated to, terminate the agreement. If either counterparty terminates the agreement, a net payment may be due from one counterparty to the other based on the fair value, excluding credit risk, of the underlying derivative instrument. These rating triggers are based on our senior unsecured credit ratings by Moody’s and S&P. Based on the fair market value of our interest rate exchange agreements subject to rating triggers, we would have been required to make a payment of up to $368 million as of May 31, 2016, if all agreements for which we owe amounts were terminated as of that date and our senior unsecured ratings fell to or below Baa1 by Moody’s or to or below BBB+ by S&P. In calculating the required payments, we only considered agreements that, when netted for each counterparty pursuant to a master netting agreement, would require a payment upon termination. In the event that we are required to make a payment as a result of a rating trigger, it could have a material adverse impact on our financial results.
Our concentration of loans to borrowers within the rural electric industry could impair our revenue if that industry experiences economic difficulties.
Approximately 99% of our total outstanding loan exposure as of May 31, 2016 was to rural electric cooperatives. Factors that have a negative impact on our member rural electric cooperatives’ financial results could also impair their ability to make payments on our loans. If our members’ financial results materially deteriorate, we could be required to increase our allowance for loan losses through provisions for loan loss on our income statement that would reduce reported net income.
17
Advances in technology may change the way electricity is generated and transmitted prior to the maturity of our loans to rural electric systems.
Advances in technology could reduce demand for generation and transmission services. The development of alternative technologies that produce electricity, including solar cells, wind power and microturbines, has expanded due to environmental concerns and could ultimately provide affordable alternative sources of electricity and permit end users to adopt distributed generation systems that would allow them to generate electricity for their own use. As these and other technologies, including energy conservation measures, are created, developed and improved, the quantity and frequency of electricity usage by rural customers could decline. Advances in technology and conservation that cause our electric system members’ power supply, transmission and/or distribution facilities to become obsolete prior to the maturity of loans secured by these assets could have an adverse impact on the ability of our members to repay such loans, which could result in an increase in nonperforming or restructured loans. These conditions could increase our credit risk exposure and negatively impact our financial results.
Loss of our tax-exempt status could adversely affect our earnings.
CFC has been recognized by the Internal Revenue Service as an organization for which income is exempt from federal taxation under Section 501(c)(4) of the Internal Revenue Code (other than any net income from an unrelated trade or business). In order to maintain CFC’s tax-exempt status, it must continue to operate exclusively for the promotion of social welfare by operating on a cooperative basis for the benefit of its members by providing them cost-based financial products and services consistent with sound financial management, and no part of CFC’s net earnings may inure to the benefit of any private shareholder or individual other than the allocation or return of net earnings or capital to its members in accordance with CFC’s bylaws and incorporating statute in effect in 1996.
If CFC were to lose its status as a 501(c)(4) organization, we believe that it would be subject to the tax rules generally applicable to cooperatives under Subchapter T of the Internal Revenue Code. As a Subchapter T cooperative, CFC would be allowed to allocate its patronage-sourced income to its members and exclude the amount of such patronage dividends for which qualified written notices of allocation are provided to members and at least 20% of the amount allocated is returned in cash. However, CFC would be taxed as a regular corporation on income in excess of allowed deductions, if any.
Our ability to comply with covenants related to our revolving credit agreements, collateral trust bond and medium-term note indentures and debt agreements could affect our ability to retire patronage capital, may accelerate certain debt obligations and could affect our ability to obtain financing and maintain the current credit rating levels on our debt.
We must maintain compliance with all covenants and conditions related to our revolving credit agreements and debt indentures. We are required to maintain a minimum adjusted TIER for the six most recent fiscal quarters of 1.025, an adjusted leverage ratio of no more than 10-to-1 and we must maintain loans pledged as collateral for various debt issuances at or below 150% of the related secured debt outstanding as a condition to borrowing under our revolving credit agreements. Our revolving credit agreements also state that we must earn a minimum annual adjusted TIER of 1.05 in order to retire patronage capital to members. See “MD&A—Non-GAAP Financial Measures” for additional information on our adjusted measures and a reconciliation to the most comparable GAAP measures.
If we are unable to borrow under the revolving credit agreements, our short-term debt ratings would most likely decline, and our ability to issue commercial paper could become significantly impaired. As a member-owned cooperative, all of our retained equity belongs to our members. As such, a restriction on the retirement of patronage capital in any year would result in a delay in the return of such amounts to the members until we earn an annual TIER of at least 1.05 and our board approves the retirement of the amounts allocated from the year in which retirement was restricted. A patronage capital retirement in any one year reduces the effective cost of borrowing for a member’s loan from CFC. Thus, if CFC does not retire patronage capital to its members, it results in a higher effective interest rate on borrowings from CFC for that year.
Pursuant to our collateral trust bond indentures, we are required to maintain eligible collateral pledged at least equal to 100% of the principal amount of the bonds issued under the indenture. Pursuant to one of our collateral trust bond indentures and our medium-term note indenture, we are required to limit senior indebtedness to 20 times the sum of our members’ equity, subordinated deferrable debt and members’ subordinated certificates.
If we are in default under our collateral trust bond or medium-term note indentures, the existing holders of these securities have the right to accelerate the repayment of the full amount of the outstanding debt principal of the security before the
18
stated maturity of such debt. That acceleration of debt repayments poses a significant liquidity risk as we might not have enough cash or committed credit available to repay the debt. In addition, if we are not in compliance with the collateral trust bond and medium-term note covenants, we would be unable to issue new debt securities under such indentures. If we were unable to issue new collateral trust bonds and medium-term notes, our ability to fund new loan advances and refinance maturing debt would be impaired.
We are required to pledge eligible distribution system or power supply system loans as collateral equal to at least 100% of the outstanding balance of debt issued under a revolving note purchase agreement with Farmer Mac. We also are required to pledge distribution or power supply loans as collateral equal to at least 100% of the outstanding balance of debt under the Guaranteed Underwriter Program. Collateral coverage less than 100% for either of these debt programs constitutes an event of default, which if not cured within 30 days, could result in creditors accelerating the repayment of the outstanding debt principal before the stated maturity. This poses a liquidity risk of possibly not having enough cash or committed credit available to repay the debt. In addition, we would be unable to issue new debt securities under the applicable debt agreement, which could impair our ability to fund new loan advances and refinance maturing debt.
Breaches of our information technology systems may damage relationships with our members or subject us to reputational, financial, legal or operational consequences.
Cyber-related attacks pose a risk to the security of our members’ strategic business information and the confidentiality and integrity of our data. Security breaches may occur through the actions of third parties, employee error, malfeasance, technology failures or other irregularities. Any such breach or unauthorized access could result in a loss of this information, a delay or inability to provide service of affected products, damage to our reputation, including a loss of confidence in the security of our products and services, and significant legal and financial exposure. Because the techniques used to obtain unauthorized access, disable or degrade service or sabotage systems change frequently, we may be unable to anticipate these techniques or implement adequate preventative measures. While CFC maintains insurance coverage that, subject to policy terms and conditions, covers certain aspects of cyber risks, such insurance coverage may be insufficient to cover all losses. Data security and privacy continue to receive heightened legislative and regulatory focus in the United States. Many states have enacted legislation requiring notification to those affected by a security breach. Our failure to comply with these laws and regulations could result in fines, sanction and litigation. Additionally, new regulation in the areas of data security and privacy may increase our costs and our members’ costs.
As a tax-exempt cooperative and nonbank financial institution, our lending activities are not subject to the regulations and oversight of U.S. federal agencies such as the Federal Reserve, the Federal Deposit Insurance Corporation or the Office of Comptroller of Currency. Because we are not under the purview of such regulation, we could engage in activities that could expose us to greater credit, market and liquidity risk, reduce our safety and soundness and adversely affect our financial results.
Financial institutions subject to regulations, oversight and monitoring by U.S. federal agencies are required to maintain specified levels of capital and may be restricted from engaging in certain lending-related and other activities that could adversely affect the safety and soundness of the financial institution or are considered conflicts of interest. As a tax-exempt, nonbank financial institution, we are not required by law or regulation to adhere to these requirements. There is no regulatory agency to monitor compliance with our risk policies and practices and identify and address potential deficiencies that could adversely affect our financial results. Without regulatory oversight and monitoring, there is a greater potential for us to engage in activities that could pose a risk to our safety and soundness relative to regulated financial institutions.
Item 1B. | Unresolved Staff Comments |
None.
Item 2. | Properties |
CFC owns approximately 141,000 square feet of office, meeting and storage space that serves as its headquarters in Loudoun County, Virginia.
19
Item 3. | Legal Proceedings |
From time to time, CFC is subject to certain legal proceedings and claims in the ordinary course of business, including litigation with borrowers related to enforcement or collection actions. Management presently believes that the ultimate outcome of these proceedings, individually and in the aggregate, will not materially harm our financial position, liquidity or results of operations. CFC establishes reserves for specific legal matters when it determines that the likelihood of an unfavorable outcome is probable and the loss is reasonably estimable. Accordingly, no reserve has been recorded with respect to any legal proceedings at this time. In June 2015, RTFC received a notice of deficiency from the Virgin Islands Bureau of Internal Revenue (“BIR”) alleging that RTFC owes tax or other amounts, plus interest, in connection with tax years 1996 and 1997, and 1999 through 2005. On September 4, 2015, RTFC filed a petition with the District Court of the Virgin Islands in response to the BIR’s notice of deficiency. The BIR filed an answer to RTFC’s petition with the District Court of the Virgin Islands on December 11, 2015. The matter remains pending before the court. RTFC believes that these allegations are without merit and will continue to contest this determination.
Item 4. | Mine Safety Disclosures |
Not applicable.
PART II
Item 5. | Market for Registrant’s Common Equity, Related Stockholder Matters and Issuer Purchases of Equity Securities |
Not applicable.
20
Item 6. Selected Financial Data
The following table provides a summary of selected financial data for the five-year period ended May 31, 2016. In addition to financial measures determined in accordance with generally accepted accounting principles in the United States (“GAAP”), management also evaluates performance based on certain non-GAAP measures, which we refer to as “adjusted” measures. Our key non-GAAP metrics consist of adjusted times interest earned ratio (“adjusted TIER”) and adjusted debt-to-equity ratio. The most comparable GAAP measures are TIER and debt-to-equity ratio, respectively. The primary adjustments we make to calculate these non-GAAP measures consist of (i) adjusting interest expense and net interest income to include the impact of net periodic derivative cash settlements; (ii) adjusting net income, senior debt and total equity to exclude the noncash impact of the accounting for derivative financial instruments; (iii) adjusting senior debt to exclude the amount that funds CFC member loans guaranteed by RUS, subordinated deferrable debt and members’ subordinated certificates; and (iv) adjusting total equity to include subordinated deferrable debt and members’ subordinated certificates. See “Item 7. MD&A—Non-GAAP Financial Measures” for a detailed reconciliation of these adjusted measures to the most comparable GAAP measures. We believe our non-GAAP adjusted metrics, which are not a substitute for GAAP and may not be consistent with similarly titled non-GAAP measures used by other companies, provide meaningful information and are useful to investors because the financial covenants in our revolving credit agreements and debt indentures are based on these adjusted metrics.
Five-Year Summary of Selected Financial Data
Year Ended May 31, | Increase/(Decrease) | |||||||||||||||||||||||||
(Dollars in thousands) | 2016 | 2015 | 2014 | 2013 | 2012 | 2016 vs. 2015 | 2015 vs. 2014 | |||||||||||||||||||
Statement of operations | ||||||||||||||||||||||||||
Interest income | $ | 1,012,636 | $ | 952,976 | $ | 957,540 | $ | 955,753 | $ | 960,961 | 6 % | — | ||||||||||||||
Interest expense | (681,850 | ) | (635,684 | ) | (654,655 | ) | (692,025 | ) | (761,778 | ) | 7 | (3) | ||||||||||||||
Net interest income | 330,786 | 317,292 | 302,885 | 263,728 | 199,183 | 4 | 5 | |||||||||||||||||||
Benefit (provision) for loan losses | 646 | 21,954 | (3,498 | ) | 70,091 | 18,108 | (97) | (728) | ||||||||||||||||||
Fee and other income | 21,785 | 36,783 | 17,762 | 38,181 | 17,749 | (41) | 107 | |||||||||||||||||||
Derivative gains (losses) (1) | (309,841 | ) | (196,999 | ) | (34,421 | ) | 84,843 | (236,620 | ) | 57 | 472 | |||||||||||||||
Results of operations of foreclosed assets | (6,899 | ) | (120,148 | ) | (13,494 | ) | (897 | ) | (67,497 | ) | (94) | 790 | ||||||||||||||
Operating expenses(2) | (86,343 | ) | (76,530 | ) | (72,566 | ) | (84,182 | ) | (65,337 | ) | 13 | 5 | ||||||||||||||
Other non-interest expense | (1,593 | ) | (870 | ) | (1,738 | ) | (10,928 | ) | (16,990 | ) | 83 | (50) | ||||||||||||||
Income (loss) before income taxes | (51,459 | ) | (18,518 | ) | 194,930 | 360,836 | (151,404 | ) | 178 | (109) | ||||||||||||||||
Income tax (expense) benefit | (57 | ) | (409 | ) | (2,004 | ) | (2,749 | ) | 2,607 | (86) | (80) | |||||||||||||||
Net income (loss) | $ | (51,516 | ) | $ | (18,927 | ) | $ | 192,926 | $ | 358,087 | $ | (148,797 | ) | 172 % | (110) % | |||||||||||
Adjusted statement of operations | ||||||||||||||||||||||||||
Adjusted interest expense(3) | $ | (770,608 | ) | $ | (718,590 | ) | $ | (728,617 | ) | $ | (748,486 | ) | $ | (774,624 | ) | 7 % | (1) % | |||||||||
Adjusted net interest income(3) | 242,028 | 234,386 | 228,923 | 207,267 | 186,337 | 3 | 2 | |||||||||||||||||||
Adjusted net income(3) | 169,567 | 95,166 | 153,385 | 216,783 | 74,977 | 78 | (38) | |||||||||||||||||||
Ratios | ||||||||||||||||||||||||||
Fixed-charge coverage ratio/TIER (4) | 0.92 | 0.97 | 1.29 | 1.52 | 0.80 | (5) bps | (32) bps | |||||||||||||||||||
Adjusted TIER(3) | 1.22 | 1.13 | 1.21 | 1.29 | 1.10 | 9 | (8) | |||||||||||||||||||
21
May 31, | Increase/(Decrease) | |||||||||||||||||||||||||
2016 | 2015 | 2014 | 2013 | 2012 | 2016 vs. 2015 | 2015 vs. 2014 | ||||||||||||||||||||
Balance sheet | ||||||||||||||||||||||||||
Cash, investments and time deposits | $ | 632,480 | $ | 818,308 | $ | 943,892 | $ | 908,694 | $ | 250,212 | (23)% | (13)% | ||||||||||||||
Loans to members(5) | 23,162,696 | 21,469,017 | 20,476,642 | 20,305,874 | 18,919,612 | 8 | 5 | |||||||||||||||||||
Allowance for loan losses | (33,258 | ) | (33,690 | ) | (56,429 | ) | (54,325 | ) | (143,326 | ) | (1) | (40) | ||||||||||||||
Loans to members, net | 23,129,438 | 21,435,327 | 20,420,213 | 20,251,549 | 18,776,286 | 8 | 5 | |||||||||||||||||||
Total assets(6) | 24,270,200 | 22,846,059 | 22,190,685 | 22,032,702 | 19,907,820 | 6 | 3 | |||||||||||||||||||
Short-term borrowings | 2,938,848 | 3,127,754 | 4,099,331 | 4,557,434 | 3,449,593 | (6) | (24) | |||||||||||||||||||
Long-term debt | 17,473,603 | 16,244,794 | 14,475,635 | 13,787,254 | 13,141,033 | 8 | 12 | |||||||||||||||||||
Subordinated deferrable debt | 742,212 | 395,699 | 395,627 | 395,729 | 180,990 | 88 | — | |||||||||||||||||||
Members’ subordinated certificates | 1,443,810 | 1,505,420 | 1,612,191 | 1,765,776 | 1,739,454 | (4) | (7) | |||||||||||||||||||
Total debt outstanding(6) | 22,598,473 | 21,273,667 | 20,582,784 | 20,506,193 | 18,511,070 | 6 | 3 | |||||||||||||||||||
Total liabilities(6) | 23,452,822 | 21,934,273 | 21,220,311 | 21,221,441 | 19,417,065 | 7 | 3 | |||||||||||||||||||
Total equity | 817,378 | 911,786 | 970,374 | 811,261 | 490,755 | (10) | (6) | |||||||||||||||||||
Guarantees(7) | 909,208 | 986,500 | 1,064,822 | 1,112,771 | 1,249,330 | (8) | (7) | |||||||||||||||||||
Ratios | ||||||||||||||||||||||||||
Leverage ratio(8) | 29.81 | 25.14 | 22.97 | 27.53 | 42.11 | 467 | bps | 217 | bps | |||||||||||||||||
Adjusted leverage ratio(3) | 6.08 | 6.58 | 6.24 | 6.11 | 6.45 | (50) | 34 | |||||||||||||||||||
Debt-to-equity ratio(9) | 28.69 | 24.06 | 21.87 | 26.16 | 39.57 | 463 | 219 | |||||||||||||||||||
Adjusted debt-to-equity ratio(3) | 5.82 | 6.26 | 5.90 | 5.76 | 6.00 | (44) | 36 | |||||||||||||||||||
____________________________
— Change is less than 1% or not meaningful.
(1)Consists of derivative cash settlements and derivative forward value amounts. Derivative cash settlement amounts represent net periodic contractual interest accruals related to derivatives not designated for hedge accounting. Derivative forward value amounts represent changes in fair value during the period, excluding net periodic contractual accruals, related to derivatives not designated for hedge accounting and expense amounts reclassified into income related to the cumulative transition loss recorded in accumulated other comprehensive income (“AOCI”) as of June 1, 2001, as a result of adoption of the derivative accounting guidance that required derivatives to be reported at fair value on the balance sheet.
(2)Consists of the salaries and employee benefits and the other general and administrative expenses components of non-interest expense, each of which is presented separately on our consolidated statements of operations.
(3) See “Non-GAAP Financial Measures” for details on the calculation of these non-GAAP adjusted ratios and the reconciliation to the most comparable GAAP measures.
(4)Calculated based on net income (loss) plus interest expense for the period divided by interest expense for the period. The fixed-charge coverage ratios and TIER were the same during each period presented because we did not have any capitalized interest during these periods.
(5)Loans to members consist of the unpaid principal balance of member loans plus unamortized deferred loan origination costs, which totaled $10 million as of May 31, 2016, 2015, 2014 and 2013, and deferred loan origination costs of $8 million as of May 31, 2012.
(6)Total debt outstanding and total liabilities include debt issuance costs of $57 million as of May 31, 2016. Debt issuance costs were previously classified as an asset on our consolidated balance sheets. In the first quarter of fiscal year 2016, we early-adopted the Financial Accounting Standards Board (“FASB”) guidance that amends the presentation of debt issuance costs in the financial statements by requiring that debt issuance costs related to a recognized debt liability be presented in the balance sheet as a direct deduction from the carrying amount of that debt liability, consistent with debt discounts, rather than as an asset. We retrospectively applied this guidance, which resulted in the reclassification of unamortized debt issuance costs of $47 million, $42 million, $39 million and $44 million as of May 31, 2015, 2014, 2013 and 2012, respectively, from total assets on our consolidated balance sheet to total debt outstanding. Other than this reclassification, the adoption of the guidance did not impact our consolidated financial statements. See “Note 1—Summary of Significant Accounting Policies—Accounting Standards Adopted in Fiscal Year 2016” for additional information.
(7)Reflects the total amount of member obligations for which CFC has guaranteed payment to a third party as of the end of each period. This amount represents our maximum exposure to loss, which significantly exceeds the guarantee liability recorded on our consolidated balance sheets as the guarantee liability is determined based on anticipated losses. See “Note 13—Guarantees” for additional information.
(8)Calculated based on total liabilities and guarantees at period end divided by total equity at period end.
(9)Calculated based on total liabilities at period end divided by total equity at period end.
22
Item 7. | Management’s Discussion and Analysis of Financial Condition and Results of Operations |
INTRODUCTION |
Our financial statements include the consolidated accounts of National Rural Utilities Cooperative Finance Corporation (“CFC”), Rural Telephone Finance Cooperative (“RTFC”), National Cooperative Services Corporation (“NCSC”) and subsidiaries created and controlled by CFC to hold foreclosed assets. See “Item 1. Business—Overview” for information on the business activities of each of these entities. Unless stated otherwise, references to “we,” “our” or “us” relate to CFC and its consolidated entities. All references to members within this document include members, associates and affiliates of CFC and its consolidated entities.
Management monitors a variety of key indicators to evaluate our business performance. In addition to financial measures determined in accordance with GAAP, management also evaluates performance based on certain non-GAAP measures, which we refer to as “adjusted” measures. Our primary non-GAAP metrics include adjusted net income, adjusted net interest income and net interest yield, adjusted times interest earned ratio (“adjusted TIER”), adjusted debt-to-equity ratio and adjusted leverage ratio. The most comparable GAAP measures are net income, net interest income, TIER, debt-to-equity ratio and leverage ratio, respectively. We believe our non-GAAP adjusted metrics, which are not a substitute for GAAP and may not be consistent with similarly titled non-GAAP measures used by other companies, provide meaningful information and are useful to investors because management evaluates performance based on these metrics, and the financial covenants in our revolving credit agreements and debt indentures are based on adjusted TIER and the adjusted debt-to-equity ratio. See “Non-GAAP Financial Measures” for a detailed reconciliation of these adjusted measures to the most comparable GAAP measures.
The following MD&A is intended to provide the reader with an understanding of our results of operations, financial condition and liquidity by discussing the drivers of changes from period to period and the key measures used by management to evaluate performance, such as leverage ratios, growth and credit quality metrics. MD&A is provided as a supplement to, and should be read in conjunction with, our audited consolidated financial statements and related notes in this Annual Report on Form 10-K for the fiscal year ended May 31, 2016 (“2016 Form 10-K” ) and the information contained elsewhere in this Report, including the risk factors discussed under “Part I—Item 1A. Risk Factors.”
EXECUTIVE SUMMARY |
Our primary objective as a member-owned cooperative lender is to provide cost-based financial products to our rural electric members while maintaining a sound financial position required for investment-grade credit ratings on our debt instruments. Our objective is not to maximize net income; therefore, the rates we charge our member-borrowers reflect our adjusted interest expense plus a spread to cover our operating expenses, a provision for loan losses and earnings sufficient to achieve interest coverage to meet our financial objectives. Our goal is to earn an annual minimum adjusted TIER of 1.10 and to achieve and maintain an adjusted debt-to-equity ratio below 6.00-to-1.
We are subject to period-to-period volatility in our reported GAAP results due to changes in market conditions and differences in the way our financial assets and liabilities are accounted for under GAAP. Our financial assets and liabilities expose us to interest-rate risk. We use derivatives, primarily interest rate swaps, as part of our strategy in managing this risk. Our derivatives are intended to economically hedge and manage the interest-rate sensitivity mismatch between our financial assets and liabilities. We are required under GAAP to carry derivatives at fair value on our consolidated balance sheet; however, our other financial assets and liabilities are carried at amortized cost. Changes in interest rates and spreads result in periodic fluctuations in the fair value of our derivatives, which may cause volatility in our earnings because we do not apply hedge accounting. As a result, the mark-to-market changes in our derivatives are recorded in earnings. Based on the composition of our derivatives, we generally record derivative losses in earnings when interest rates decline and derivative gains when interest rates rise. This earnings volatility generally is not indicative of the underlying economics of our business, as the derivative forward fair value gains or losses recorded each period may or may not be realized over time, depending on future changes in market conditions and the terms of our derivative instruments. As such, management uses our adjusted non-GAAP results, which include realized net periodic derivative settlements but exclude the impact of unrealized derivative forward fair value gains and losses, to evaluate our operating performance. Because derivative forward
23
fair value gains and losses do not impact our cash flows, liquidity or ability to service our debt costs, our financial debt covenants are also based on our non-GAAP adjusted results.
Financial Performance
Reported Results
We reported a net loss of $52 million and a TIER of 0.92 for fiscal year ended May 31, 2016 (“fiscal year 2016”). In comparison, we reported a net loss of $19 million and a TIER of 0.97 for fiscal year 2015, and net income of $193 million and a TIER of 1.29 for fiscal year 2014. The variance in our results between fiscal years was largely attributable to derivative losses, which totaled $310 million, $197 million and $34 million in fiscal years 2016, 2015 and 2014, respectively. The increase in our reported net loss of $33 million in fiscal year 2016 from the prior year was driven by the significant increase in derivative losses of $113 million, stemming from a flattening of the yield curve, coupled with a reduction of $21 million in the benefit recorded for loan losses, a decrease in fee and other income of $15 million and an increase in operating expenses of $10 million, which together more than offset the favorable impact of the absence of an impairment charge related to Caribbean Asset Holdings, LLC (“CAH”) of $111 million recorded in fiscal year 2015 and an increase in net interest income of $13 million. The increase in net interest income resulted from an increase in average total loans of $1,669 million, or 8%, from the prior year. Our debt-to-equity ratio increased to 28.69 as of May 31, 2016, from 24.06 as of May 31, 2015, mainly due to increased borrowings to fund the growth in our loan portfolio and a decrease in equity resulting from our reported net loss and patronage capital retirement.
Adjusted Non-GAAP Results
Our adjusted net income totaled $170 million and our adjusted TIER was 1.22 for fiscal year 2016. In comparison, we had adjusted net income of $95 million and adjusted TIER of 1.13 for fiscal year 2015, and adjusted net income of $153 million and adjusted TIER of 1.21 for fiscal year 2014. The increase in adjusted net income of $74 million in fiscal year 2016 from the prior year was driven by the absence of the CAH impairment charge of $111 million recorded in fiscal year 2015 and an increase in adjusted net interest income of $8 million, resulting from the growth in average total loan balances, as noted above. The favorable impact of these items was partially offset by the reduction in the benefit recorded for loan losses, the decrease in fee and other income and higher operating expenses. Our adjusted debt-to-equity ratio decreased to 5.82 as of May 31, 2016, from 6.26 as of May 31, 2015, predominately due to an increase in adjusted equity resulting from the issuance of $350 million of subordinated deferrable debt in the fourth quarter of fiscal year 2016.
Lending Activity
Total loans outstanding, which consists of the unpaid principal balance and excludes deferred loan origination costs, was $23,153 million as of May 31, 2016, an increase of $1,693 million, or 8%, from May 31, 2015. The increase was primarily due to an increase in CFC distribution and power supply loans of $1,579 million and $220 million, respectively, which was largely attributable to members refinancing with us loans made by other lenders and member advances for capital investments. This increase was partially offset by a decrease in NCSC loans of $51 million and a decrease in RTFC loans of $44 million.
Long-term fixed-rate loans totaling $1,078 million repriced during fiscal year 2016. Of this total, $1,001 million repriced to a new long-term fixed rate; $55 million repriced to a long-term variable rate; $4 million repriced to a new rate offered as part of our loan sales program; and $18 million were repaid in full.
As part of our strategy in managing our credit risk exposure, we entered into a long-term standby purchase commitment agreement with Farmer Mac on August 31, 2015, as amended on May 31, 2016. Under this agreement, we may designate certain loans to be covered under the commitment, subject to approval by Farmer Mac, and in the event any such loan later goes into material default for at least 90 days, upon request by us, Farmer Mac must purchase such loan at par value. We designated, and Farmer Mac approved loans that had an aggregate outstanding principal balance of $926 million as of May 31, 2016. No loans had been put to Farmer Mac for purchase, pursuant to this agreement, as of May 31, 2016.
24
Financing Activity
Our outstanding debt volume generally increases and decreases in response to member loan demand. As outstanding loan balances increased during fiscal year 2016, our debt volume also increased. Total debt outstanding was $22,598 million as of May 31, 2016, an increase of $1,325 million, or 6%, from May 31, 2015. The increase was primarily attributable to an increase of $498 million in collateral trust bonds, an increase of $392 million under the note purchase agreement with Farmer Mac, an increase of $371 million under the Guaranteed Underwriter Program of USDA and an increase of $347 million in subordinated deferrable debt.
In July 2015, we executed a new three-year $300 million secured revolving note purchase agreement with Farmer Mac to provide an additional source of liquidity. In November 2015, we amended and restated our $1,665 million three-year and $1,645 million five-year bank revolving line of credit agreements with a syndicate of banks, which resulted in an extension of the maturity dates to November 19, 2018 and November 19, 2020, respectively, from October 28, 2017 and October 28, 2019, respectively. Commitments of $25 million under the three-year agreement will expire at the prior maturity date of October 28, 2017. Commitments of $45 million under the five-year agreement will expire at the prior maturity date of October 28, 2019.
On March 29, 2016, we closed on a $250 million committed loan facility (“Series K”) under the Guaranteed Underwriter Program. Under the Series K facility, we are able to borrow any time before January 15, 2019, with each advance having a final maturity no longer than 20 years from the advance date.
We provide additional information on our financing activities below under “Consolidated Balance Sheet Analysis—Debt” and “Liquidity Risk.”
Outlook for the Next 12 Months
We currently expect the amount of new long-term loan advances to exceed scheduled loan repayments over the next 12 months. However, we anticipate a decline in earnings from our core lending operations, which we refer to as our adjusted net interest income, over the next 12 months primarily due to a continued decline in the average yield of our loan portfolio, coupled with an expected increase in interest expense.
Long-term debt scheduled to mature over the next 12 months totaled $2,552 million as of May 31, 2016. We believe we have sufficient liquidity from the combination of existing cash and time deposits, member loan repayments, committed loan facilities and our ability to issue debt in the capital markets, to our members and in private placements to meet the demand for member loan advances and satisfy our obligations to repay long-term debt maturing over the next 12 months. We also may consider the early redemption of certain maturing debt to reduce large debt maturity amounts when it is economically feasible. As of May 31, 2016, we had access to liquidity reserves totaling $6,951 million, which consisted of $545 million in cash and cash equivalents and time deposits, up to $600 million available under committed loan facilities from the Federal Financing Bank under the Guaranteed Underwriter Program, $3,309 million available under committed bank revolving lines of credit, up to $300 million available under a note purchase agreement with Farmer Mac executed during fiscal year 2016 and, subject to market conditions, up to $2,197 million available under the previously existing revolving note purchase agreement with Farmer Mac.
We believe we can continue to roll over member outstanding short-term debt of $2,279 million as of May 31, 2016, based on our expectation that our members will continue to reinvest their excess cash in our commercial paper, daily liquidity fund and select notes. We expect to continue to roll over our outstanding dealer commercial paper of $660 million as of May 31, 2016. We intend to manage our short-term wholesale funding risk by maintaining outstanding dealer commercial paper at an amount below $1,250 million for the foreseeable future. We expect to continue to be in compliance with the covenants under our revolving credit agreements, which will allow us to mitigate our roll-over risk as we can draw on these facilities to repay dealer or member commercial paper that cannot be rolled over.
Our goal is to achieve and maintain an adjusted debt-to-equity ratio at or below 6.00. However, because of the significant increase in outstanding loan balances during the fiscal year 2016, it was necessary to increase our borrowings to fund the loan growth, which caused our adjusted debt-to-equity ratio to exceed our targeted ratio for an extended period. As discussed above, we issued $350 million of subordinated deferrable debt in the capital markets in the fourth quarter of fiscal
25
year 2016 to manage and reduce our adjusted debt-to-equity ratio below our targeted maximum ratio. As a result, our adjusted debt-to-equity ratio fell to 5.82 as of May 31, 2016. We expect to maintain our adjusted debt-to-equity ratio at a level of 6.00 or below over the next 12 months. As indicated below in “Non-GAAP Financial” measures, subordinated debt is treated in the same manner as equity in calculating our adjusted debt-to-equity ratio pursuant to the financial covenants under our revolving bank line of credit agreements.
Subsequent Event
On September 30, 2015, CFC entered into a Purchase Agreement (as amended, the “Purchase Agreement”) with CAH, ATN VI Holdings, LLC (“Buyer”) and ATN International, Inc. (formerly Atlantic Tele-Network, Inc.), the parent corporation of Buyer, to sell all of the issued and outstanding membership interests of CAH to Buyer for a purchase price of $145 million, subject to certain adjustments described in the Purchase Agreement.
On July 1, 2016, the Purchase Agreement was amended and the sale of CAH was completed for a purchase price of approximately $144 million. Our net proceeds at closing totaled $109 million, which represents the purchase price of $144 million less agreed-upon purchase price adjustments and transaction costs as of the closing date. The net proceeds are subject to post-closing adjustments, which are due from Buyer within 60 days of the closing date for review by us. CFC also remains subject to potential indemnification claims, as specified in the Purchase Agreement. Upon closing, $16 million of the sale proceeds were deposited into escrow to fund potential indemnification claims for a period of 15 months following the closing. In connection with the sale, RTFC provided a loan in the amount of $60 million to Buyer to finance a portion of the transaction. ATN International has provided a guarantee on an unsecured basis of Buyer’s obligations to RTFC pursuant to the financing. We provide additional information on the sale of CAH, including the impact on our financial statements, below under “MD&A—Consolidated Results of Operations—Non-Interest Income” and “Note 5—Foreclosed Assets.”
CRITICAL ACCOUNTING POLICIES AND ESTIMATES |
The preparation of financial statements in accordance with GAAP requires management to make a number of judgments, estimates and assumptions that affect the amount of assets, liabilities, income and expenses in the consolidated financial statements. Understanding our accounting policies and the extent to which we use management’s judgment and estimates in applying these policies is integral to understanding our financial statements. We provide a discussion of our significant accounting policies under “Note 1—Summary of Significant Accounting Policies.”
We have identified certain accounting policies as critical because they involve significant judgments and assumptions about highly complex and inherently uncertain matters, and the use of reasonably different estimates and assumptions could have a material impact on our results of operations or financial condition. Our most critical accounting policies and estimates involve the determination of the allowance for loan losses and fair value. We evaluate our critical accounting estimates and judgments required by our policies on an ongoing basis and update them as necessary based on changing conditions. There were no material changes in the assumptions used in our critical accounting policies and estimates during the current year.
Management has discussed significant judgments and assumptions in applying our critical accounting policies with the Audit Committee of our board of directors. See “Item 1A. Risk Factors” for a discussion of the risks associated with management’s judgments and estimates in applying our accounting policies and methods.
Allowance for Loan Losses
We maintain an allowance for loan losses that represents management’s estimate of probable losses inherent in our loan portfolio as of each balance sheet date. Our allowance for loan losses, which totaled $33 million and $34 million as of
May 31, 2016 and 2015, respectively, includes a collective allowance for all loans in our portfolio that are not individually impaired and a specific allowance for individually impaired loans.
Collective Allowance
As part of our credit risk management process, we regularly evaluate each borrower and loan in our loan portfolio and assign an internal risk rating. We engage an independent third party to perform an annual review of a sample of loans to corroborate the internally assigned risk ratings. The collective loss reserve is calculated using an internal model to estimate incurred losses for segments within our loan portfolio that have similar risk characteristics. Our loan segments, which are
26
based on member borrower type, are stratified further into loan pools based on the borrower risk rating. We then apply loss factors to the outstanding principal balance of each of these loan pools. The loss factors reflect the probability of default, or default rate, and the loss severity, or recovery rate, over an estimated loss emergence period of five years for each loan pool. We utilize third-party industry default data to estimate default rates. We utilize our historical loss experience for each borrower type, adjusted for management’s judgment, to estimate recovery rates. Management may also apply judgment to adjust the loss factors derived from our models, taking into consideration model imprecision and specific, known events, such as current credit conditions, that may affect the credit quality of our loan portfolio but are not yet reflected in our model-generated loss factors. We determine the collective allowance by applying the default rate and recovery rate to each loan pool.
Specific Allowance
The specific allowance for individually impaired loans that are not collateral dependent is calculated based on the difference between the recorded investment in the loan and the present value of the expected future cash flows, discounted at the loan’s effective interest rate. If the loan is collateral dependent, we measure the impairment based on the current fair value of the collateral less estimated selling costs.
Key Assumptions
Determining the appropriateness of the allowance for loan losses is a complex process subject to numerous estimates and assumptions requiring significant management judgment about matters that involve a high degree of subjectivity and are difficult to predict. The key assumptions in determining our collective allowance that require significant management judgment and may have a material impact on the amount of the allowance include our evaluation of the risk profile of various loan portfolio segments and the internally assigned borrower risk ratings; the estimated loss emergence period; the selection of third-party proxy data to determine the probability of default; our historical loss experience and assumptions regarding recovery rates; and management’s judgment in the selection and evaluation of qualitative factors to assess the overall current level of exposure within our loan portfolio. The key assumptions in determining our specific allowance that require significant management judgment and may have a material impact on the amount of the allowance include estimating the amount and timing of expected cash flows from impaired loans and estimating the value of underlying collateral, which impacts loss severity and certain cash flow assumptions. The degree to which any particular assumption affects the allowance for loan losses depends on the severity of the change and its relationship to the other assumptions.
We regularly evaluate the underlying assumptions we use in determining the allowance for loan losses and periodically update our assumptions to better reflect present conditions, including current trends in borrower risk and/or general economic trends, portfolio concentration risk, changes in risk management practices, changes in the regulatory environment and other environmental factors specific to our loan portfolio segments. We did not change the nature of the underlying assumptions and inputs used in determining our allowance for loan losses during fiscal year 2016. At the end of fiscal year 2015, we adjusted the recovery rate assumptions used in determining the collective allowance for loan losses for certain portfolio segments to reflect our most recent historical loss experience and made adjustments to certain qualitative factors that we consider in estimating losses. These changes in assumptions, which accounted for $18 million of the $23 million total reduction in the allowance for loan losses as of May 31, 2015, were a significant driver of the benefit for loan losses of $22 million recorded in fiscal year 2015. In comparison, we recorded a benefit for loan losses of $1 million for the current fiscal year 2016.
Sensitivity Analysis
As noted above, our allowance for credit losses is sensitive to numerous factors, depending on the portfolio segment. Changes in our assumptions or economic conditions could affect our estimate of probable credit losses inherent in the portfolio at the balance sheet date, which would also impact the related provision for loan losses recognized in our consolidated results of operations. For example, changes in the inputs below, without consideration of any offsetting or correlated effects of other inputs, would have the following effects on our total allowance of loan losses as of May 31, 2016.
• | A 10% increase or decrease in the default rates for all of our portfolio segments would result in a corresponding increase or decrease of $3 million. |
27
• | A 1% increase or decrease in the recovery rates for all of our portfolio segments would result in a corresponding decrease or increase of $3 million. |
• | A one-notch downgrade in the internal risk ratings for our entire loan portfolio would result in an increase of approximately $36 million, while a one-notch upgrade would result in a decrease of approximately $17 million. |
The purpose of these sensitivity analyses is to provide an indication of the isolated impacts of hypothetical alternative assumptions on modeled loss estimates. It is difficult to estimate how potential changes in a specific factor might affect the total allowance for loan losses because management evaluates a variety of factors and inputs in estimating the allowance for loan losses.
We provide additional information on the methodology for determining the allowance for loan losses in “Note 1—Summary of Significant Accounting Policies” and changes in our allowance for loan losses in “Note 4—Loans and Commitments.”
Fair Value
A portion of our assets and liabilities are carried at fair value on our consolidated balance sheet, with changes in fair value recorded either through earnings or other comprehensive income (loss) in accordance with applicable accounting standards. These include all available-for-sale investment securities and derivatives. The determination of fair value is important for certain other assets that are periodically evaluated for impairment using fair value, such as individually impaired loans and foreclosed assets.
Fair value is defined as the price that would be received for an asset or paid to transfer a liability in an orderly transaction between market participants on the measurement date (also referred to as an exit price). The fair value accounting guidance provides a three-level fair value hierarchy for classifying fair value measurement techniques. This hierarchy is based on the markets in which the assets or liabilities trade and whether the inputs to the valuation techniques used to measure fair value are observable or unobservable. Fair value measurement is assigned a level based on the lowest level of any input that is significant to the fair value measurement in its entirety. The three levels of the fair value hierarchy are summarized below:
Level 1: Quoted prices (unadjusted) in active markets for identical assets or liabilities
Level 2: Observable market-based inputs, other than quoted prices in active markets for identical assets or liabilities
Level 3: Unobservable inputs
The degree of management judgment involved in determining fair value is dependent upon the availability of quoted prices in active markets or observable market parameters. When quoted prices and observable data in active markets are not fully available, management’s judgment is necessary to estimate fair value. Changes in market conditions, such as reduced liquidity in the capital markets or changes in secondary market activities, may reduce the availability and reliability of quoted prices or observable data used to determine fair value.
Significant judgment may be required to determine whether certain assets and liabilities measured at fair value are classified as Level 2 or Level 3. In making this determination, we consider all available information that market participants use to measure fair value, including observable market data, indications of market liquidity and orderliness, and our understanding of the valuation techniques and significant inputs used. Based upon the specific facts and circumstances, judgments are made regarding the significance of Level 3 inputs used in determining the fair value of the asset or liability in its entirety. If Level 3 inputs are considered significant, the valuation technique is classified as Level 3. The process for determining fair value using unobservable inputs is generally more subjective and involves a high degree of management judgment and assumptions.
Assets and liabilities recorded at fair value on a recurring basis consisted primarily of financial instruments, including available-for-sale investment securities, deferred compensation investments and derivatives, represented 1% of our total assets as of both May 31, 2016 and 2015, and 3% and 2%, respectively, of total liabilities as of May 31, 2016 and 2015. The fair value of these financial instruments was determined using either Level 1 or 2 inputs. We did not have any financial instruments recorded at fair value on a recurring basis for which the fair value was determined using Level 3 inputs as of May 31, 2016 and 2015.
28
We discuss the valuation inputs and assumptions used in determining the fair value, including the extent to which we have relied on significant unobservable inputs to estimate fair value, in “Note 14—Fair Value Measurement.”
ACCOUNTING CHANGES AND DEVELOPMENTS |
See “Note 1—Summary of Significant Accounting Policies” for information on accounting standards adopted in fiscal year 2016, as well as recently issued accounting standards not yet required to be adopted and the expected impact of these accounting standards. To the extent we believe the adoption of new accounting standards has had or will have a material impact on our results of operations, financial condition or liquidity, we discuss the impacts in the applicable section(s) of MD&A.
CONSOLIDATED RESULTS OF OPERATIONS |
The section below provides a comparative discussion of our consolidated results of operations between fiscal year 2016 and 2015 and between fiscal year 2015 and 2014. Following this section, we provide a comparative analysis of our consolidated balance sheets as of May 31, 2016 and 2015. You should read these sections together with our “Executive Summary—Outlook for the Next 12 Months” where we discuss trends and other factors that we expect will affect our future results of operations.
Net Interest Income
Net interest income represents the difference between the interest income and applicable fees earned on our interest-earning assets, which include loans and investment securities, and the interest expense on our interest-bearing liabilities. Our net interest yield represents the difference between the yield on our interest-earning assets and the cost of our interest-bearing liabilities plus the impact from non-interest bearing funding. We expect net interest income and our net interest yield to fluctuate based on changes in interest rates and changes in the amount and composition of our interest-earning assets and interest-bearing liabilities. We do not fund each individual loan with specific debt. Rather, we attempt to minimize costs and maximize efficiency by funding large aggregated amounts of loans.
Table 1 presents our average balance sheets for fiscal years 2016, 2015 and 2014, and for each major category of our interest-earning assets and interest-bearing liabilities, the interest income earned or interest expense incurred, and the average yield or cost. Table 1 also presents non-GAAP adjusted interest expense, adjusted net interest income and adjusted net interest yield, which reflect the inclusion of net accrued periodic derivative cash settlements in interest expense. We provide reconciliations of our non-GAAP adjusted measures to the most comparable GAAP measures under “Non-GAAP Financial Measures.”
29
Table 1: Average Balances, Interest Income/Interest Expense and Average Yield/Cost
____________________________
Year Ended May 31, | |||||||||||||||||||||||||||||||||
(Dollars in thousands) | 2016 | 2015 | 2014 | ||||||||||||||||||||||||||||||
Assets: | Average Balance | Interest Income/Expense | Average Yield/Cost | Average Balance | Interest Income/Expense | Average Yield/Cost | Average Balance | Interest Income/Expense | Average Yield/Cost | ||||||||||||||||||||||||
Long-term fixed-rate loans(1) | $ | 20,734,387 | $ | 959,701 | 4.63 | % | $ | 18,990,768 | $ | 898,181 | 4.73 | % | $ | 18,377,834 | $ | 897,918 | 4.89 | % | |||||||||||||||
Long-term variable-rate loans | 708,801 | 19,858 | 2.80 | 702,397 | 20,184 | 2.87 | 737,186 | 20,388 | 2.77 | ||||||||||||||||||||||||
Line of credit loans | 1,031,548 | 24,864 | 2.41 | 1,119,647 | 26,411 | 2.36 | 1,278,549 | 31,376 | 2.45 | ||||||||||||||||||||||||
Restructured loans | 12,947 | 512 | 3.95 | 7,560 | 15 | 0.20 | 10,819 | 136 | 1.26 | ||||||||||||||||||||||||
Nonperforming loans | 3,164 | 142 | 4.49 | 1,572 | — | — | 7,952 | 236 | 2.97 | ||||||||||||||||||||||||
Interest-based fee income(2) | — | (1,088 | ) | — | — | 252 | — | — | 406 | — | |||||||||||||||||||||||
Total loans | 22,490,847 | 1,003,989 | 4.46 | 20,821,944 | 945,043 | 4.54 | 20,412,340 | 950,460 | 4.66 | ||||||||||||||||||||||||
Cash, investments and time deposits | 639,060 | 8,647 | 1.35 | 806,942 | 7,933 | 0.98 | 953,589 | 7,080 | 0.74 | ||||||||||||||||||||||||
Total interest-earning assets | $ | 23,129,907 | $ | 1,012,636 | 4.38 | % | $ | 21,628,886 | $ | 952,976 | 4.41 | % | $ | 21,365,929 | $ | 957,540 | 4.48 | % | |||||||||||||||
Other assets, less allowance for loan losses | 808,479 | 944,746 | 1,225,389 | ||||||||||||||||||||||||||||||
Total assets | $ | 23,938,386 | $ | 22,573,632 | $ | 22,591,318 | |||||||||||||||||||||||||||
Liabilities: | |||||||||||||||||||||||||||||||||
Short-term debt | $ | 2,995,530 | $ | 14,728 | 0.49 | % | $ | 3,586,509 | $ | 14,374 | 0.40 | % | $ | 4,282,107 | $ | 13,457 | 0.31 | % | |||||||||||||||
Medium-term notes | 3,412,061 | 86,270 | 2.53 | 2,926,721 | 71,739 | 2.45 | 2,804,289 | 85,502 | 3.05 | ||||||||||||||||||||||||
Collateral trust bonds | 6,917,265 | 333,338 | 4.82 | 6,288,187 | 315,106 | 5.01 | 5,898,955 | 305,760 | 5.18 | ||||||||||||||||||||||||
Subordinated deferrable debt | 435,488 | 21,245 | 4.88 | 400,000 | 19,143 | 4.79 | 395,661 | 19,118 | 4.83 | ||||||||||||||||||||||||
Subordinated certificates | 1,458,376 | 60,449 | 4.14 | 1,488,059 | 63,559 | 4.27 | 1,663,847 | 79,195 | 4.76 | ||||||||||||||||||||||||
Long-term notes payable | 6,818,705 | 165,820 | 2.43 | 5,988,964 | 151,763 | 2.53 | 5,502,370 | 151,623 | 2.76 | ||||||||||||||||||||||||
Total interest-bearing liabilities | $ | 22,037,425 | $ | 681,850 | 3.09 | % | $ | 20,678,440 | $ | 635,684 | 3.07 | % | $ | 20,547,229 | $ | 654,655 | 3.19 | % | |||||||||||||||
Other liabilities | 1,036,907 | 954,638 | 1,101,475 | ||||||||||||||||||||||||||||||
Total liabilities | 23,074,332 | 21,633,078 | 21,648,704 | ||||||||||||||||||||||||||||||
Total equity | 864,054 | 940,554 | 942,614 | ||||||||||||||||||||||||||||||
Total liabilities and equity | $ | 23,938,386 | $ | 22,573,632 | $ | 22,591,318 | |||||||||||||||||||||||||||
Net interest spread(3) | 1.29 | % | 1.34 | % | 1.29 | % | |||||||||||||||||||||||||||
Impact of non-interest bearing funding(4) | 0.14 | 0.13 | 0.13 | ||||||||||||||||||||||||||||||
Net interest income/net interest yield(5) | $ | 330,786 | 1.43 | % | $ | 317,292 | 1.47 | % | $ | 302,885 | 1.42 | % | |||||||||||||||||||||
Adjusted net interest income/adjusted net interest yield: | |||||||||||||||||||||||||||||||||
Interest income | $ | 1,012,636 | 4.38 | % | $ | 952,976 | 4.41 | % | $ | 957,540 | 4.48 | % | |||||||||||||||||||||
Interest expense | 681,850 | 3.09 | 635,684 | 3.07 | 654,655 | 3.19 | |||||||||||||||||||||||||||
Add: Net accrued periodic derivative cash settlements(6) | 88,758 | 0.89 | 82,906 | 0.94 | 73,962 | 0.88 | |||||||||||||||||||||||||||
Adjusted interest expense/adjusted average cost(7) | $ | 770,608 | 3.50 | % | $ | 718,590 | 3.48 | % | $ | 728,617 | 3.55 | % | |||||||||||||||||||||
Adjusted net interest spread(3) | 0.88 | % | 0.93 | % | 0.93 | % | |||||||||||||||||||||||||||
Impact of non-interest bearing funding | 0.17 | 0.15 | 0.14 | ||||||||||||||||||||||||||||||
Adjusted net interest income/adjusted net interest yield(8) | $ | 242,028 | 1.05 | % | $ | 234,386 | 1.08 | % | $ | 228,923 | 1.07 | % | |||||||||||||||||||||
30
(1)Interest income includes loan conversion fees, which are generally deferred and recognized in interest income using the effective interest method. A small portion of conversion fees that are intended to cover the administrative costs related to the loan conversion are recognized into interest income immediately at the date of conversion.
(2)Amounts primarily include the amortization of deferred loan origination costs and late payment fees. Up-front loan arranger fees, which are not
based on interest rates, are included in fee and other income for fiscal year 2016.
(3)Net interest spread represents the difference between the average yield on interest-earning assets and the average cost of interest-bearing funding. Adjusted net interest spread represents the difference between the average yield on interest-earning assets and the adjusted average cost of interest-bearing funding.
(4)Includes other liabilities and equity.
(5)Net interest yield is calculated based on net interest income for the period divided by average interest-earning assets for the period.
(6)Represents the impact of net accrued periodic derivative cash settlements during the period, which is added to interest expense to derive non-GAAP adjusted interest expense. The average (benefit)/cost associated with derivatives is calculated based on the net accrued periodic derivative cash settlements during the period divided by the average outstanding notional amount of derivatives during the period. The average outstanding notional amount of derivatives was $9,993 million, $8,811 million and $8,381 million for fiscal years 2016, 2015 and 2014, respectively.
(7)Adjusted interest expense represents interest expense plus net accrued derivative cash settlements during the period. Net accrued derivative cash settlements are reported on our consolidated statements of operations as a component of derivative gains (losses). Adjusted average cost is calculated based on adjusted interest expense for the period divided by average interest-bearing funding during the period.
(8)Adjusted net interest yield is calculated based on adjusted net interest income for the period divided by average interest-earning assets for the period.
Table 2 displays the change in our net interest income between periods and the extent to which the variance is attributable to (i) changes in the volume of our interest-earning assets and interest-bearing liabilities or (ii) changes in the interest rates of these assets and liabilities. The table also presents the change in adjusted net interest income between periods.
31
Table 2: Rate/Volume Analysis of Changes in Interest Income/Interest Expense
2016 vs. 2015 | 2015 vs. 2014 | |||||||||||||||||||||||
Variance due to:(1) | Variance due to:(1) | |||||||||||||||||||||||
(Dollars in thousands) | Total Variance | Volume | Rate | Total Variance | Volume | Rate | ||||||||||||||||||
Interest income: | ||||||||||||||||||||||||
Long-term fixed-rate loans | $ | 61,520 | $ | 82,466 | $ | (20,946 | ) | $ | 263 | $ | 29,947 | $ | (29,684 | ) | ||||||||||
Long-term variable-rate loans | (326 | ) | 184 | (510 | ) | (204 | ) | (962 | ) | 758 | ||||||||||||||
Line of credit loans | (1,547 | ) | (2,078 | ) | 531 | (4,965 | ) | (3,900 | ) | (1,065 | ) | |||||||||||||
Restructured loans | 497 | 11 | 486 | (121 | ) | (41 | ) | (80 | ) | |||||||||||||||
Nonperforming loans | 142 | — | 142 | (236 | ) | (189 | ) | (47 | ) | |||||||||||||||
Fee income | (1,340 | ) | — | (1,340 | ) | (154 | ) | — | (154 | ) | ||||||||||||||
Total loans | 58,946 | 80,583 | (21,637 | ) | (5,417 | ) | 24,855 | (30,272 | ) | |||||||||||||||
Cash, investments and time deposits | 714 | (1,650 | ) | 2,364 | 853 | (1,089 | ) | 1,942 | ||||||||||||||||
Interest income | $ | 59,660 | $ | 78,933 | $ | (19,273 | ) | $ | (4,564 | ) | $ | 23,766 | $ | (28,330 | ) | |||||||||
Interest expense: | ||||||||||||||||||||||||
Short-term debt | $ | 354 | $ | (2,369 | ) | $ | 2,723 | $ | 917 | $ | (2,186 | ) | $ | 3,103 | ||||||||||
Medium-term notes | 14,531 | 11,897 | 2,634 | (13,763 | ) | 3,733 | (17,496 | ) | ||||||||||||||||
Collateral trust bonds | 18,232 | 31,524 | (13,292 | ) | 9,346 | 20,175 | (10,829 | ) | ||||||||||||||||
Long-term notes payable | 14,057 | 21,026 | (6,969 | ) | 140 | 13,409 | (13,269 | ) | ||||||||||||||||
Subordinated deferrable debt | 2,102 | 1,698 | 404 | 25 | 210 | (185 | ) | |||||||||||||||||
Subordinated certificates | (3,110 | ) | (1,268 | ) | (1,842 | ) | (15,636 | ) | (8,367 | ) | (7,269 | ) | ||||||||||||
Interest expense | 46,166 | 62,508 | (16,342 | ) | (18,971 | ) | 26,974 | (45,945 | ) | |||||||||||||||
Net interest income | $ | 13,494 | $ | 16,425 | $ | (2,931 | ) | $ | 14,407 | $ | (3,208 | ) | $ | 17,615 | ||||||||||
Adjusted net interest income: | ||||||||||||||||||||||||
Interest income | $ | 59,660 | $ | 78,933 | $ | (19,273 | ) | $ | (4,564 | ) | $ | 23,766 | $ | (28,330 | ) | |||||||||
Interest expense | 46,166 | 62,508 | (16,342 | ) | (18,971 | ) | 26,974 | (45,945 | ) | |||||||||||||||
Net accrued periodic derivative cash settlements(2) | 5,852 | 11,122 | (5,270 | ) | 8,944 | 3,797 | 5,147 | |||||||||||||||||
Adjusted interest expense(3) | 52,018 | 73,630 | (21,612 | ) | (10,027 | ) | 30,771 | (40,798 | ) | |||||||||||||||
Adjusted net interest income | $ | 7,642 | $ | 5,303 | $ | 2,339 | $ | 5,463 | $ | (7,005 | ) | $ | 12,468 | |||||||||||
____________________________
(1)The changes for each category of interest income and interest expense are divided between the portion of change attributable to the variance in volume and the portion of change attributable to the variance in rate for that category. The amount attributable to the combined impact of volume and rate has been allocated to each category based on the proportionate absolute dollar amount of change for that category.
(2)For net accrued periodic derivative cash settlements, the variance due to average volume represents the change in derivative cash settlements resulting from the change in the average notional amount of derivative contracts outstanding. The variance due to average rate represents the change in derivative cash settlements resulting from the net difference between the average rate paid and the average rate received for interest rate swaps during the period.
(3) See “Non-GAAP Financial Measures” for additional information on our adjusted non-GAAP measures.
Net interest income of $331 million for fiscal year 2016 increased by $13 million, or 4%, from fiscal year 2015, driven by an increase in average interest-earning assets of 7%, which was partially offset by a decrease in the net interest yield of 3% (4 basis points) to 1.43%.
• | Average Interest-Earning Assets: The increase in average interest-earning assets during fiscal year 2016 was primarily attributable to growth in average total loans of $1,669 million, or 8%, over the prior year, as members refinanced with us loans made by other lenders and obtained advances to fund capital investments. |
32
• | Net Interest Yield: The decrease in the net interest yield in fiscal year 2016 reflects the combined impact of a slight increase in our average cost of funds and a modest decline in the average yield on interest-earning assets. Our average cost of funds increased by 2 basis points in fiscal year 2016 to 3.09%. This increase was largely due to our decision in the third quarter of fiscal year 2015 to significantly reduce the level of outstanding dealer commercial paper, which has a much lower cost than our other funding options. The decrease in the average yield on interest-earning assets of 3 basis points in fiscal year 2016 to 4.38% was largely attributable to reduced rates on fixed-rate loans, reflecting the repricing of higher-rate loans to lower interest rates and lower interest rates on new loan originations as a result of the overall low interest rate environment. |
Net interest income of $317 million in fiscal 2015 increased by $14 million, or 5%, from fiscal year 2014, driven by an increase in the net interest yield of 4% (5 basis points) to 1.47%, coupled with a 1% increase in average interest-earning assets.
• | Average Interest-Earning Assets: Average interest-earning assets increased modestly during fiscal year 2015, reflecting loan advances that exceeded loan payments as members refinanced with us loans issued by other lenders and obtained advances to fund capital investments. |
• | Net Interest Yield: The increase in the net interest yield in fiscal year 2015 was largely attributable to a reduction in our cost of funds from the refinancing of maturing higher-cost debt with lower-cost debt, which more than offset a decrease in the average yield on interest-earning assets. |
Adjusted net interest income of $242 million in fiscal year 2016 increased by $8 million, or 3%, from the prior year, driven by an increase in average interest-earning assets of 7%, which was partially offset by a decrease in the adjusted net interest yield of 3% (3 basis points) to 1.05%. The decrease in the adjusted net interest yield also reflected the combined impact of an increase in our average cost of funds resulting from actions taken in the third quarter of fiscal year 2015 to significantly reduce the level of lower-cost dealer commercial paper, coupled with the decline in the average yield on interest-earning assets.
Adjusted net interest income of $234 million in fiscal year 2015 increased by $5 million, or 2%, from the prior year, driven by an increase in the adjusted net interest yield of 1% (1 basis point) to 1.08%, coupled with a 1% increase in average interest-earning assets.
Our adjusted net interest income and adjusted net interest yield include the impact of net accrued periodic derivative cash settlements during the year. We recorded net periodic derivative cash settlement expense of $89 million, $83 million and $74 million in fiscal years 2016, 2015 and 2014, respectively. See “Non-GAAP Financial Measures” for additional information on our adjusted measures.
Provision for Loan Losses
Our provision for loan losses in each period is primarily driven by the level of allowance that we determine is necessary for probable incurred loan losses inherent in our loan portfolio as of each balance sheet date.
We recorded a benefit for loan losses of $1 million and $22 million in fiscal years 2016 and 2015, respectively, compared with a provision of $3 million in fiscal year 2014. The change in the provision for loan losses between fiscal years was primarily attributable to a reduction in the allowance for loan losses of $23 million during fiscal year 2015, which mainly resulted from an increase in recovery rates used in determining the allowance as of May 31, 2015. The increase in the recovery rates, which are based on historical data, accounted for $18 million of the $23 million reduction in the allowance for loan losses as of of May 31, 2015. See “Critical Accounting Policies and Estimates—Allowance for Loan Losses” for additional information on these changes in assumptions.
Excluding the impact of the change in the allowance attributable to the changes in assumptions made in fiscal year 2015, our provision for loan losses over the past three fiscal years has ranged from a benefit of $1 million and $4 million in fiscal year 2016 and 2015, respectively, and a provision of $3 million in fiscal year 2014, reflecting an overall improvement in the credit quality and risk profile of our loan portfolio.
33
We provide additional information on our allowance for loan losses under “Credit Risk—Allowance for Loan Losses” and “Note 4—Loans and Commitments” of this Report. For information on our allowance methodology, see “Critical Accounting Policies and Estimates” and “Note 1—Summary of Significant Accounting Policies” of this Report.
Non-Interest Income
Non-interest income consists of fee and other income, gains and losses on derivatives not accounted for in hedge accounting relationships and results of operations of foreclosed assets.
We recorded losses from non-interest income of $295 million and $280 million and $30 million in fiscal years 2016, 2015 and 2014, respectively. The variances in non-interest income between periods were primarily attributable to changes in net derivative losses recognized in our consolidated statements of operations and the results of operations of CAH, which we sold on July 1, 2016. In addition, prepayment fees on loans paid off prior to maturity may contribute to variances in non-interest income.
Derivative Gains (Losses)
Our derivative instruments are an integral part of our interest rate risk management strategy. Our principal purpose in using derivatives is to manage our aggregate interest rate risk profile within prescribed risk parameters. The derivative instruments we use primarily include interest rate swaps, which we typically hold to maturity. The primary factors affecting the fair value of our derivatives and derivative gains (losses) recorded in our results of operations include changes in interest rates, the shape of the yield curve and the composition of our derivative portfolio. We generally do not designate interest rate swaps, which presently account for all of our derivatives, for hedge accounting. Accordingly, changes in the fair value of interest rate swaps are reported in our consolidated statements of operations under derivative gains (losses). We did not have any derivatives designated as accounting hedges as of May 31, 2016 and 2015.
We currently use two types of interest rate swap agreements: (i) we pay a fixed rate and receive a variable rate (“pay-fixed swaps”) and (ii) we pay a variable rate and receive a fixed rate (“receive-fixed swaps”). The benchmark rate for the substantial majority of the floating rate payments under our swap agreements is the London Interbank Offered Rate (“LIBOR”). Table 3 displays the average notional amount outstanding, by swap agreement type, and the weighted-average interest rate paid and received for derivative cash settlements during fiscal years 2016, 2015 and 2014. As indicated in
Table 3, our derivative portfolio currently consists of a higher proportion of pay-fixed swaps than receive-fixed swaps. The profile of our derivative portfolio may change as a result of changes in market conditions and actions taken to manage interest rate risk.
Table 3: Derivative Average Notional Amounts and Average Interest Rates
Year Ended May 31, | ||||||||||||||||||||||||||||||
2016 | 2015 | 2014 | ||||||||||||||||||||||||||||
(Dollars in thousands) | Average Notional Balance | Weighted- Average Rate Paid | Weighted- Average Rate Received | Average Notional Balance | Weighted- Average Rate Paid | Weighted- Average Rate Received | Average Notional Balance | Weighted- Average Rate Paid | Weighted- Average Rate Received | |||||||||||||||||||||
Pay-fixed swaps | $ | 6,322,338 | 3.03 | % | 0.45 | % | $ | 5,583,647 | 3.25 | % | 0.25 | % | $ | 5,310,019 | 3.36 | % | 0.24 | % | ||||||||||||
Receive-fixed swaps | 3,670,585 | 0.88 | 2.97 | 3,227,288 | 0.83 | 3.45 | 3,070,679 | 0.94 | 3.95 | |||||||||||||||||||||
Total | $ | 9,992,923 | 2.24 | % | 1.38 | % | $ | 8,810,935 | 2.36 | % | 1.43 | % | $ | 8,380,698 | 2.47 | % | 1.60 | % | ||||||||||||
The average remaining maturity of our pay-fixed and receive-fixed swaps was 18 years and three years, respectively, as of May 31, 2016. In comparison, the average remaining maturity of our pay-fixed and receive-fixed swaps was 16 years and three years, respectively, as of May 31, 2015.
Pay-fixed swaps generally decrease in value as interest rates decline and increase in value as interest rates rise. In contrast, receive-fixed swaps generally increase in value as interest rates decline and decrease in value as interest rates rise. Because our pay-fixed and receive-fixed swaps are referenced to different maturity terms along the swap yield curve, different changes in the swap yield curve—parallel, flattening or steepening—will result in differences in the fair value of our
34
derivatives. See “Note 14—Fair Value Measurement” for information on how we estimate the fair value of our derivative instruments. The chart below provides comparative yield curves as of May 31, 2016, 2015 and 2014.
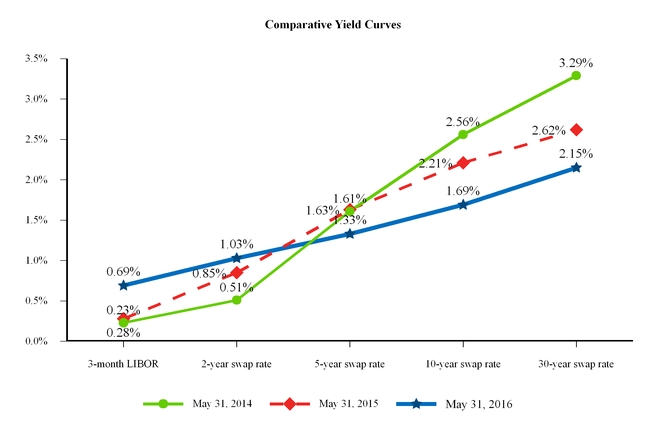 ____________________________
 Benchmark rates obtained from Bloomberg.
We recorded derivative losses of $310 million, $197 million and $34 million in fiscal years 2016, 2015 and 2014, respectively. Table 4 presents the components of net derivative gains (losses) recorded in our consolidated results of operations. Derivative cash settlements represent the net interest amount accrued during a period for interest-rate swap payments. The derivative forward value represents the change in fair value of our interest rate swaps during the reporting period due to changes in expected future interest rates over the remaining life of our derivative contracts.
Table 4: Derivative Gains (Losses)
Year Ended May 31, | ||||||||||||
(Dollars in thousands) | 2016 | 2015 | 2014 | |||||||||
Derivative gains (losses) attributable to: | ||||||||||||
Derivative cash settlements | $ | (88,758 | ) | $ | (82,906 | ) | $ | (73,962 | ) | |||
Derivative forward value gain (loss) | (221,083 | ) | (114,093 | ) | 39,541 | |||||||
Derivative losses | $ | (309,841 | ) | $ | (196,999 | ) | $ | (34,421 | ) | |||
The derivative losses of $310 million in fiscal year 2016 were primarily attributable to a net decrease in the fair value of our swaps due to a flattening of the swap yield curve resulting from an increase in short-term interest rates and a decline in long-term interest rates, as depicted in the chart of the comparative yield curves above. This flattening of the yield curve was more pronounced during the third quarter as the U.S. Federal Reserve raised the short-term federal funds rate by 25 basis points in December 2015, the first rate change since the federal funds rate was lowered to near zero seven years ago. As
35
shorter-term rates increased, longer-term rates declined to near record lows amid increased market volatility, a drop in oil prices and global market uncertainty.
The net derivative losses of $197 million in fiscal year 2015 were primarily attributable to a flattening of the swap yield
curve during the period as the overall level of interest rates on the longer end of the yield curve declined while short-term
interest rates rose. The decline in longer-term rates resulted in a net decrease in the fair value of our pay-fixed swaps and the
increase in shorter-term rates resulted in an overall decrease in the fair value of our receive-fixed swaps, which together
resulted in the net derivative losses during the year.
The derivative losses of $34 million in fiscal year 2014 were largely attributable to a decrease in swap interest rates on the longer end of the yield curve, which resulted in a net decrease in the fair value of our pay-fixed swaps.
See “Note 10—Derivative Instruments and Hedging Activities” for additional information on our derivative instruments.
Results of Operations of Foreclosed Assets
Results of operations of foreclosed assets consist of the operating results of entities controlled by CFC that hold foreclosed assets, impairment charges related to those entities and gains or losses related to the disposition of the entities. We previously had two entities, CAH and DRP, that held foreclosed assets. We dissolved DRP during the fourth quarter of fiscal 2015, following the sale of DRP’s remaining assets. We had only one entity, CAH, that held foreclosed assets as of May 31, 2016. CAH was classified as held for sale beginning with the quarter ended August 31, 2015. Since that date, we have assessed the fair value less cost to sell of CAH each reporting period, reported our investment in CAH at the lower of the carrying value, as of the date of transfer to held for sale, or fair value less cost to sell and recognized subsequent changes in fair value less cost to sell in earnings.
We recorded a loss in our consolidated statement of operations related to foreclosed assets of $7 million for fiscal year 2016, compared with losses of $120 million and $13 million in fiscal years 2015 and 2014, respectively. The loss of $7 million recorded in fiscal year 2016 was attributable to impairment of our investment in CAH due to a reduction in the fair value less estimated cost to sell. The loss of $120 million in fiscal year 2015 was driven by CAH impairment charges of $111 million, while the loss of $13 million in fiscal year 2014 was primarily attributable to results of operations of CAH.
As indicated above in “Executive Summary,” on September 30, 2015, CFC entered into a Purchase Agreement to sell to Buyer all of the issued and outstanding membership interests of CAH, which owns the telecommunications and cable television operations held by its operating subsidiaries, for a purchase price of $145 million, subject to certain adjustments as specified in the Purchase Agreement. On July 1, 2016, the Purchase Agreement was amended and the sale of CAH was completed for a purchase price of approximately $144 million, subject to certain adjustments.
Our reported investment in CAH totaled $103 million as of May 31, 2016, which represents the fair value less estimated cost to sell as of that date. The measurement of fair value takes into consideration the contractual purchase price less agreed-upon purchase price adjustments, including cash on hand, changes in working capital and settlement of CAH’s pension and other postretirement benefit plan obligations, as well as the unrecognized net loss of $10 million recorded in accumulated other comprehensive income (“AOCI”) attributable to actuarial-related changes in CAH’s pension and other postretirement benefit plan obligations. Upon closing of the sale of CAH, the unrecognized net loss of $10 million recorded in AOCI as of May 31, 2016 was derecognized as an offset against the sale proceeds, which will have no effect on our consolidated statement of operations for the first quarter of fiscal year 2017.
Our net proceeds at closing totaled $109 million, which represents the purchase price of $144 million less agreed-upon purchase price adjustments, as noted above, and transaction costs as of the closing date. The net proceeds at closing take into consideration the impact of CAH’s operating results subsequent to our May 31, 2016 fiscal year end and the July 1, 2016 closing date, and the impact of these results on CAH’s cash on hand and transaction costs as of the closing date. The net proceeds are subject to post-closing adjustments, which are due from Buyer within 60 days of the closing date for review by us. We expect to record any required post-closing adjustments in the first quarter of fiscal year 2017. CFC also remains subject to potential indemnification claims, as specified in the Purchase Agreement. Upon closing, $16 million of the sale proceeds were deposited into escrow to fund potential indemnification claims for a period of 15 months following the closing. In connection with the sale, RTFC provided a loan in the amount of $60 million to Buyer to finance a portion of the
36
transaction. ATN International has provided a guarantee on an unsecured basis of Buyer’s obligations to RTFC pursuant to the financing. See “Note 5—Foreclosed Assets” for additional information on the sale of CAH.
Non-Interest Expense
Non-interest expense consists of salaries and employee benefit expense, general and administrative expenses, losses on early extinguishment of debt and other miscellaneous expenses.
We recorded non-interest expense of $88 million, $77 million and $74 million in fiscal years 2016, 2015 and 2014, respectively. The increase in non-interest expense of $11 million in fiscal year 2016, from the prior fiscal year was primarily attributable to an increase in costs related to system infrastructure enhancements and higher legal fees. The increase in non-interest expense of $3 million in fiscal year 2015, from the prior year was due to modest increases in salaries and employee benefits and other general and administrative expenses.
Net Income (Loss) Attributable to Noncontrolling Interests
Net income (loss) attributable to noncontrolling interests represents 100% of the results of operations of RTFC and NCSC, as the members of RTFC and NCSC own or control 100% of the interest in their respective companies. The fluctuations in net income (loss) attributable to noncontrolling interests are primarily due to fluctuations in the fair value of NCSC’s derivative instruments.
We recorded a net loss attributable to noncontrolling interests of $2 million in fiscal year 2016, compared with net income of less than $1 million in fiscal year 2015 and net income of $3 million in fiscal year 2014.
CONSOLIDATED BALANCE SHEET ANALYSIS |
Total assets of $24,270 million as of May 31, 2016 increased by $1,424 million, or 6%, from May 31, 2015, primarily due to growth in our loan portfolio. Total liabilities of $23,453 million as of May 31, 2016 increased by $1,519 million, or 7%, from May 31, 2015, primarily due to debt issuances to fund our loan portfolio growth. Total equity decreased $94 million to $817 million as of May 31, 2016. The decrease in total equity was attributable to the net loss of $52 million in fiscal year 2016 and the patronage capital retirement of $39 million in September 2015.
Following is a discussion of changes in the major components of our assets and liabilities during fiscal year 2016. Period-end balance sheet amounts may vary from average balance sheet amounts due to liquidity and balance sheet management activities that are intended to manage liquidity requirements for the company and our customers, and our market risk exposure in accordance with our risk appetite.
Loan Portfolio
We offer long-term fixed- and variable-rate loans and line of credit variable-rate loans. Borrowers may choose a fixed or variable interest rate for periods of one to 35 years. When a selected fixed-rate term expires, the borrower may select either another fixed-rate term or a variable rate or elect to repay the loan in full. We also offer a conversion option to members with long-term loan agreements, which allows borrowers to change the rate and term prior to the repricing date. Borrowers are generally charged a conversion fee when converting from a fixed to a variable rate, or a fixed rate to another fixed rate.
Loans Outstanding
Loans outstanding consist of advances from either new approved loans or from the unadvanced portion of loans previously approved. Table 5 summarizes total loans outstanding, by type and by member class, for the five-year period ended May 31, 2016.
37
Table 5: Loans Outstanding by Type and Member Class
May 31, | |||||||||||||||||||||||||||||||||||
(Dollars in millions) | 2016 | 2015 | 2014 | 2013 | 2012 | ||||||||||||||||||||||||||||||
Loans by type: | Amount | % | Amount | % | Amount | % | Amount | % | Amount | % | |||||||||||||||||||||||||
Long-term loans: | |||||||||||||||||||||||||||||||||||
Long-term fixed-rate loans | $ | 21,217 | 92 | % | $ | 19,543 | 91 | % | $ | 18,176 | 88 | % | $ | 17,918 | 88 | % | $ | 16,743 | 89 | % | |||||||||||||||
Long-term variable-rate loans | 757 | 3 | 699 | 3 | 754 | 4 | 782 | 4 | 765 | 4 | |||||||||||||||||||||||||
Loans guaranteed by RUS | 174 | 1 | 179 | 1 | 202 | 1 | 211 | 1 | 219 | 1 | |||||||||||||||||||||||||
Total long-term loans | 22,148 | 96 | 20,421 | 95 | 19,132 | 93 | 18,911 | 93 | 17,727 | 94 | |||||||||||||||||||||||||
Line of credit loans | 1,005 | 4 | 1,038 | 5 | 1,335 | 7 | 1,385 | 7 | 1,185 | 6 | |||||||||||||||||||||||||
Total loans outstanding(1) | $ | 23,153 | 100 | % | $ | 21,459 | 100 | % | $ | 20,467 | 100 | % | $ | 20,296 | 100 | % | $ | 18,912 | 100 | % | |||||||||||||||
Loans by member class: | |||||||||||||||||||||||||||||||||||
CFC: | |||||||||||||||||||||||||||||||||||
Distribution | $ | 17,674 | 77 | % | $ | 16,095 | 75 | % | $ | 15,035 | 74 | % | $ | 14,941 | 74 | % | $ | 14,075 | 74 | % | |||||||||||||||
Power supply | 4,401 | 19 | 4,181 | 20 | 4,086 | 20 | 4,008 | 20 | 3,597 | 19 | |||||||||||||||||||||||||
Statewide and associate | 55 | — | 65 | — | 68 | — | 71 | — | 74 | 1 | |||||||||||||||||||||||||
CFC total | 22,130 | 96 | 20,341 | 95 | 19,189 | 94 | 19,020 | 94 | 17,746 | 94 | |||||||||||||||||||||||||
RTFC | 342 | 1 | 386 | 2 | 450 | 2 | 503 | 2 | 572 | 3 | |||||||||||||||||||||||||
NCSC | 681 | 3 | 732 | 3 | 828 | 4 | 773 | 4 | 594 | 3 | |||||||||||||||||||||||||
Total loans outstanding(1) | $ | 23,153 | 100 | % | $ | 21,459 | 100 | % | $ | 20,467 | 100 | % | $ | 20,296 | 100 | % | $ | 18,912 | 100 | % | |||||||||||||||
____________________________
(1) Total loans outstanding represents the outstanding unpaid principal balance of loans. Unamortized deferred loan origination costs, which totaled $10 million as of May 31, 2016, 2015, 2014 and 2013, and $8 million as of May 31, 2012 are excluded from total loans outstanding. These costs, however, are included in loans to members reported on the consolidated balance sheets.
Total loans outstanding of $23,153 million as of May 31, 2016 increased by $1,693 million, or 8%, from May 31, 2015. The increase was primarily due to an increase in CFC distribution and power supply loans of $1,579 million and $220 million, respectively, which was largely attributable to members refinancing with us loans made by other lenders and member advances for capital investments. This increase was partially offset by a decrease in NCSC loans of $51 million and a decrease in RTFC loans of $44 million.
We provide additional information on our loan product types in “Item 1. Business—Loan Programs” and “Note 4—Loans and Commitments.” See “Debt—Secured Borrowings” below for information on encumbered and unencumbered loans and “Credit Risk Management” for information on the credit risk profile of our loan portfolio.
Scheduled Loan Repayments
Table 6 displays the scheduled long-term loan principal repayments for each of the next five fiscal years and thereafter.
Table 6: Long-Term Loan Scheduled Repayments
Fixed Rate | Variable Rate | ||||||||||||||
(Dollars in thousands) | Loan Amortization(1) | Weighted-Average Interest Rate | Loan Amortization (1) | Total Loan Amortization (1) | |||||||||||
Fiscal year: | |||||||||||||||
2017 | $ | 1,138,826 | 4.25 | % | $ | 62,023 | $ | 1,200,849 | |||||||
2018 | 1,068,609 | 4.38 | 51,230 | 1,119,839 | |||||||||||
2019 | 1,049,365 | 4.44 | 114,897 | 1,164,262 | |||||||||||
2020 | 1,066,943 | 4.52 | 56,176 | 1,123,119 | |||||||||||
2021 | 1,061,905 | 4.56 | 33,536 | 1,095,441 | |||||||||||
Thereafter | 16,004,928 | 4.78 | 439,638 | 16,444,566 | |||||||||||
Total | $ | 21,390,576 | 4.69 | % | $ | 757,500 | $ | 22,148,076 | |||||||
____________________________
38
(1) Represents scheduled amortization loan payment amounts based on current rates without taking into consideration loans that may reprice.
Loan Retention Rate
Table 7 compares the historical retention rate of long-term fixed-rate loans that repriced during the past three years and provides information on the percentage of borrowers that selected either another fixed-rate term or a variable rate. The retention rate is calculated based on the election made by the borrower at the repricing date. As indicated in Table 7, the average retention rate of repriced loans has been 95% over the most recent three fiscal years.
Table 7: Historical Retention Rate and Repricing Selection
May 31, | |||||||||||||||||||||
2016 | 2015 | 2014 | |||||||||||||||||||
(Dollars in thousands) | Amount | % | Amount | % | Amount | % | |||||||||||||||
Loans retained: | |||||||||||||||||||||
Long-term fixed rate selected | $ | 1,001,118 | 93 | % | $ | 991,279 | 81 | % | $ | 983,754 | 84 | % | |||||||||
Long-term variable rate selected | 54,796 | 5 | 154,946 | 13 | 68,780 | 6 | |||||||||||||||
Loans repriced and sold by CFC | 4,459 | — | 3,904 | — | 21,464 | 2 | |||||||||||||||
Total loans retained | 1,060,373 | 98 | 1,150,129 | 94 | 1,073,998 | 92 | |||||||||||||||
Total loans repaid | 17,956 | 2 | 76,380 | 6 | 90,030 | 8 | |||||||||||||||
Total | $ | 1,078,329 | 100 | % | $ | 1,226,509 | 100 | % | $ | 1,164,028 | 100 | % | |||||||||
Debt
We utilize both short-term and long-term borrowings as part of our funding strategy and asset/liability management. We seek to maintain diversified funding sources across products, programs and markets to manage funding concentrations and reduce our liquidity or debt roll-over risk. Our funding sources include a variety of secured and unsecured debt securities in a wide range of maturities to our members and affiliates and in the capital markets.
Debt Product Types
We offer various short- and long-term unsecured debt securities to our members and affiliates, including commercial paper, select notes, daily liquidity fund notes, medium-term notes and subordinated certificates. We issue collateral trust bonds and medium-term notes in the capital markets and also offer investments in commercial paper to nonmembers. Additionally, we have access to borrowings from banks, private placements and U.S. government agencies. Table 8 displays our primary debt product types and selected key attributes for each product type.
39
Table 8: Debt Product Types
Debt Product Type | Maturity Range | Market | Secured/Unsecured | |||
Short-term funding programs: | ||||||
Commercial paper | 1 to 270 days | Capital markets, members and affiliates | Unsecured | |||
Select notes | 30 to 270 days | Members and affiliates | Unsecured | |||
Daily liquidity fund notes | Demand note | Members and affiliates | Unsecured | |||
Other funding programs: | ||||||
Revolving credit agreements | 3 to 5 years | Bank institutions | Unsecured | |||
Collateral trust bonds(1) | Up to 30 years | Capital markets | Secured | |||
Guaranteed Underwriter Program notes payable(2) | Up to 20 years | U.S. government | Secured | |||
Farmer Mac notes payable(3) | Up to 16 years | Private placement | Secured | |||
Medium-term notes | 9 months to 30 years | Capital markets, members and affiliates | Unsecured | |||
Other notes payable(4) | Up to 30 years | Private placement | Both | |||
Subordinated deferrable debt(5) | Up to 30 years | Capital markets | Unsecured | |||
Members’ subordinated certificates(6) | Up to 100 years | Members | Unsecured | |||
____________________________
(1)Collateral trust bonds are secured by the pledge of permitted investments and eligible mortgage notes from distribution system borrowers in an amount at least equal to the outstanding principal amount of collateral trust bonds.
(2) Represents notes payable under the Guaranteed Underwriter Program of the USDA, which supports the Rural Economic Development Loan and Grant program. The Federal Financing Bank provides the financing for these notes, and RUS provides a guarantee of repayment.We are required to pledge eligible mortgage notes from distribution and power supply system borrowers in an amount at least equal to the outstanding principal amount of the notes payable.
(3) We are required to pledge eligible mortgage notes from distribution and power supply system borrowers in an amount at least equal to the outstanding principal amount under note purchase agreements with Farmer Mac.
(4) Other notes payable consist of unsecured and secured Clean Renewable Energy Bonds and unsecured notes payable issued by NCSC. We are required to pledge eligible mortgage notes from distribution and power supply system borrowers in an amount at least equal to the outstanding principal amount under the Clean Renewable Energy Bonds Series 2009A note purchase agreement.
(5) Subordinated deferrable debt is subordinate and junior to senior debt and debt obligations we guarantee, but senior to subordinated certificates. We have the right at any time, and from time to time, during the term of the subordinated deferrable debt to suspend interest payments for a maximum period of 20 consecutive quarters. To date, we have not exercised our option to suspend interest payments. We have the right to call the subordinated deferrable debt, at par, any time after 10 years.
(6) Members’ subordinated certificates are subordinate and junior to senior debt, subordinated debt and debt obligations we guarantee. Members’ subordinated certificates generally mature 100 years subsequent to issuance. Loan and guarantee subordinated certificates have the same maturity as the related long-term loan. Some certificates also may amortize annually based on the outstanding loan balance. Member capital securities generally mature 30 years or 35 years subsequent to issuance. Member capital securities are callable at par beginning five or 10 years subsequent to the issuance and anytime thereafter.
Debt Outstanding
Table 9 displays the composition, by product type, of our outstanding debt and the weighted average interest rate as of May 31, 2016, 2015 and 2014. Table 9 also displays the composition of our debt based on several additional selected attributes.
40
Table 9: Total Debt Outstanding and Weighted-Average Interest Rates
May 31, | |||||||||||||||||||||
2016 | 2015 | 2014 | |||||||||||||||||||
(Dollars in thousands) | Outstanding Amount | Weighted- Average Interest Rate | Outstanding Amount | Weighted- Average Interest Rate | Outstanding Amount | Weighted- Average Interest Rate | |||||||||||||||
Debt product type: | |||||||||||||||||||||
Commercial paper: | |||||||||||||||||||||
Members, at par | $ | 848,007 | 0.45 | % | $ | 736,162 | 0.15 | % | $ | 858,389 | 0.13 | % | |||||||||
Dealer, net of discounts | 659,935 | 0.43 | 984,954 | 0.15 | 1,973,557 | 0.14 | |||||||||||||||
Total commercial paper | 1,507,942 | 0.44 | 1,721,116 | 0.15 | 2,831,946 | 0.14 | |||||||||||||||
Select notes to members | 701,849 | 0.62 | 671,635 | 0.29 | 548,610 | 0.27 | |||||||||||||||
Daily liquidity fund notes to members | 525,959 | 0.34 | 509,131 | 0.08 | 486,501 | 0.06 | |||||||||||||||
Bank bid notes | — | — | — | — | 20,000 | 0.60 | |||||||||||||||
Collateral trust bonds | 7,253,096 | 4.28 | 6,755,067 | 4.48 | 5,955,987 | 4.65 | |||||||||||||||
Guaranteed Underwriter Program notes payable | 4,777,111 | 2.98 | 4,406,465 | 3.14 | 4,298,645 | 3.15 | |||||||||||||||
Farmer Mac notes payable | 2,303,123 | 1.15 | 1,910,688 | 0.77 | 1,667,505 | 1.15 | |||||||||||||||
Medium-term notes: | |||||||||||||||||||||
Members, at par | 654,058 | 1.66 | 618,170 | 1.15 | 498,262 | 1.31 | |||||||||||||||
Dealer, net of discounts | 2,648,369 | 3.02 | 2,733,853 | 2.55 | 2,215,760 | 2.68 | |||||||||||||||
Total medium-term notes | 3,302,427 | 2.75 | 3,352,023 | 2.29 | 2,714,022 | 2.43 | |||||||||||||||
Other notes payable | 40,944 | 3.61 | 46,423 | 3.67 | 51,750 | 3.73 | |||||||||||||||
Subordinated deferrable debt | 742,212 | 4.98 | 395,699 | 4.75 | 395,627 | 4.75 | |||||||||||||||
Members’ subordinated certificates: | |||||||||||||||||||||
Membership subordinated certificates | 630,063 | 4.94 | 645,035 | 4.89 | 644,944 | 4.90 | |||||||||||||||
Loan and guarantee subordinated certificates | 593,701 | 2.99 | 640,889 | 2.94 | 699,723 | 3.01 | |||||||||||||||
Member capital securities | 220,046 | 5.00 | 219,496 | 5.00 | 267,524 | 6.12 | |||||||||||||||
Total members’ subordinated certificates | 1,443,810 | 4.14 | 1,505,420 | 4.08 | 1,612,191 | 4.28 | |||||||||||||||
Total debt outstanding | $ | 22,598,473 | 3.03 | % | $ | 21,273,667 | 2.93 | $ | 20,582,784 | 2.91 | % | ||||||||||
Security type: | |||||||||||||||||||||
Unsecured debt | 37 | % | 59 | % | 63 | % | |||||||||||||||
Secured debt | 63 | 41 | 37 | ||||||||||||||||||
Total | 100 | % | 100 | % | 100 | % | |||||||||||||||
Borrower type: | |||||||||||||||||||||
Members | 18 | % | 19 | % | 20 | % | |||||||||||||||
Private placement | 32 | 30 | 29 | ||||||||||||||||||
Capital markets | 50 | 51 | 51 | ||||||||||||||||||
Total | 100 | % | 100 | % | 100 | % | |||||||||||||||
Interest rate type including impact of swaps: | |||||||||||||||||||||
Fixed-rate debt(1) | 88 | % | 81 | % | 79 | % | |||||||||||||||
Variable-rate debt(2) | 12 | 19 | 21 | ||||||||||||||||||
Total | 100 | % | 100 | % | 100 | % | |||||||||||||||
Interest rate type: | |||||||||||||||||||||
Fixed-rate debt | 74 | % | 72 | % | 68 | % | |||||||||||||||
Variable-rate debt | 26 | 28 | 32 | ||||||||||||||||||
Total | 100 | % | 100 | % | 100 | % | |||||||||||||||
Original contractual maturity: | |||||||||||||||||||||
Short-term borrowings | 13 | % | 15 | % | 20 | % | |||||||||||||||
Long-term and subordinated debt(3) | 87 | 85 | 80 | ||||||||||||||||||
Total | 100 | % | 100 | % | 100 | % | |||||||||||||||
____________________________
(1) Includes variable-rate debt that has been swapped to a fixed rate net of any fixed-rate debt that has been swapped to a variable rate.
41
(2) Includes fixed-rate debt that has been swapped to a variable rate net of any variable-rate debt that has been swapped to a fixed rate. Also includes commercial paper notes, which generally have maturities of less than 90 days. The interest rate on commercial paper notes does not change once the note has been issued; however, the rates on new commercial paper notes change daily.
(3) Consists of long-term debt, subordinated deferrable debt and total members’ subordinated debt reported on the consolidated balance sheets.
Total debt outstanding of $22,598 million as of May 31, 2016 increased $1,325 million, or 6%, from May 31, 2015, primarily due to the issuance of debt to fund the growth in our loan portfolio. The increase reflected a net increase of $392 million under the note purchase agreement with Farmer Mac, a net increase of $371 million under the Guaranteed Underwriter Program of the USDA, a net increase of $498 million in collateral trust bonds and a net increase of $347 million in subordinated deferrable debt. Significant financing-related developments affecting the change in our debt outstanding during fiscal year 2016 are summarized below.
• | On July 7, 2015, we received an advance of $180 million under the revolving note purchase agreement with Farmer Mac. |
• | On July 31, 2015, we received an advance of $250 million with a 20-year final maturity under the Guaranteed Underwriter Program of the USDA. |
• | On October 27, 2015, we issued $350 million aggregate principal amount of 2.30% collateral trust bonds due 2020, and $400 million aggregate principal amount of 3.25% collateral trust bonds due 2025. |
• | On February 5, 2016, we received an advance of $150 million with a 20-year final maturity under the Guaranteed Underwriter Program of the USDA. |
• | On February 8, 2016, we issued $350 million aggregate principal amount of 1.65% collateral trust bonds due 2019, and $350 million aggregate principal amount of 2.70% collateral trust bonds due 2023. |
• | On February 16, 2016, we redeemed $300 million of 3.05% collateral trust bonds due March 1, 2016. The premium and unamortized issuance costs, which totaled less than $1.0 million, were recorded as a loss on early extinguishment of debt in the third quarter of fiscal year 2016. |
• | On February 18, 2016, we received an advance of $250 million under the revolving note purchase agreement with Farmer Mac. |
• | On April 20, 2016, we issued $350 million of 5.25% subordinated deferrable debt due 2046, callable at par on or after April 20, 2026. |
Member Investments
Debt securities issued to our members represent an important, stable source of funding. Table 10 displays outstanding member debt, by debt product type, as of May 31, 2016 and 2015.
Table 10: Member Investments
May 31, | Increase/(Decrease) | |||||||||||||||||
2016 | 2015 | |||||||||||||||||
(Dollars in thousands) | Amount | % of Total (1) | Amount | % of Total (1) | ||||||||||||||
Commercial paper | $ | 848,007 | 56 | % | $ | 736,162 | 43 | % | $ | 111,845 | ||||||||
Select notes | 701,849 | 100 | 671,635 | 100 | 30,214 | |||||||||||||
Daily liquidity fund notes | 525,959 | 100 | 509,131 | 100 | 16,828 | |||||||||||||
Medium-term notes | 654,058 | 20 | 618,170 | 18 | 35,888 | |||||||||||||
Members’ subordinated certificates | 1,443,810 | 100 | 1,505,420 | 100 | (61,610 | ) | ||||||||||||
Total | $ | 4,173,683 | $ | 4,040,518 | $ | 133,165 | ||||||||||||
Percentage of total debt outstanding | 18 | % | 19 | % | ||||||||||||||
____________________________
(1) Represents the percentage of each line item outstanding to our members.
Member investments accounted for 18% and 19% of total debt outstanding as of May 31, 2016 and 2015, respectively. Over the past three fiscal years, outstanding member investments have averaged $4,189 million.
42
Short-Term Borrowings
Short-term borrowings consist of borrowings with an original contractual maturity of one year or less and do not include the current portion of long-term debt. Short-term borrowings totaled $2,939 million and accounted for 13% of total debt outstanding as of May 31, 2016, compared with $3,128 million, or 15%, of total debt outstanding as of May 31, 2015.
Long-Term and Subordinated Debt
Long-term debt, defined as debt with an original contractual maturity date of greater than one year, primarily consists of medium-term notes, collateral trust bonds, notes payable under the Guaranteed Underwriter Program and notes payable under our note purchase agreement with Farmer Mac. Subordinated debt consists of subordinated deferrable debt and members’ subordinated certificates. Our subordinated deferrable debt and members’ subordinated certificates have original contractual dates of greater than one year. Long-term and subordinated debt totaled $19,660 million and accounted for 87% of total debt outstanding as of May 31, 2016, compared with $18,146 million, or 85%, of total debt outstanding as of May 31, 2015. As discussed above, the increase in total debt outstanding, including long-term and subordinated debt, was primarily due to the issuance of debt to fund loan portfolio growth.
Collateral Pledged and on Deposit
We are required to pledge loans as collateral in borrowing transactions under our collateral trust bond indentures, note purchase agreements with Farmer Mac and bond agreements under the Guaranteed Underwriter Program of the USDA. We are required to maintain pledged collateral equal to at least 100% of the outstanding amount of borrowings. However, we typically maintain pledged collateral in excess of the required percentage to ensure that required collateral levels are maintained and to facilitate the timely execution of debt issuances by reducing or eliminating the lead time to pledge additional collateral. Under the provisions of our bank revolving credit agreements, the excess collateral that we are allowed to pledge cannot exceed 150% of the outstanding borrowings under our collateral trust bond indentures, Farmer Mac or the Guaranteed Underwriter Program of the USDA. In certain cases, provided that all conditions of eligibility under the different programs are satisfied, we may withdraw excess pledged collateral or transfer collateral from one borrowing program to another to facilitate a new debt issuance.
On December 13, 2012, we entered into an amended, restated and consolidated pledge agreement with RUS and U.S. Bank National Association pursuant to the Guaranteed Underwriter Program, which consolidated all prior pledge agreements. Under this agreement, we were required to hold mortgage notes on deposit equal to at least 100% of our outstanding borrowings. On March 29, 2016, we entered into a second amended, restated and consolidated pledge agreement with RUS and U.S. Bank National Association, which requires that we pledge all mortgage notes previously held on deposit pursuant to the Guaranteed Underwriter Program. The March 29, 2016 agreement replaces the previous pledge agreement dated December 13, 2012, and governs all future collateral requirements under the Guaranteed Underwriter Program.
Of our total debt outstanding of $22,598 million as of May 31, 2016, $14,348 million, or 63%, was secured by pledged loans. In comparison, of our total debt outstanding of $21,274 million as of May 31, 2015, $13,088 million, or 62%, was secured by pledged loans or loans on deposit. Table 11 displays the unpaid principal balance of loans pledged or on deposit for secured debt, the excess collateral pledged and unencumbered loans as of May 31, 2016 and 2015.
Table 11: Unencumbered Loans
May 31, | ||||||||
(Dollars in thousands) | 2016 | 2015 | ||||||
Total loans outstanding (1) | $ | 23,152,517 | $ | 21,459,220 | ||||
Less: Total secured debt or debt requiring collateral on deposit | (14,643,108 | ) | (13,386,713 | ) | ||||
Excess collateral pledged or on deposit (2) | (1,673,404 | ) | (1,351,254 | ) | ||||
Unencumbered loans | $ | 6,836,005 | $ | 6,721,253 | ||||
Unencumbered loans as a percentage of total loans | 30 | % | 31 | % | ||||
____________________________
(1)Excludes unamortized deferred loan origination costs of $10 million as of May 31, 2016 and 2015.
(2)Excludes cash collateral pledged to secure debt. If there is an event of default under most of our indentures, we can only withdraw the excess collateral if we substitute cash or permitted investments of equal value.
43
The amounts and levels of collateral may fluctuate due to the following:
• | our distribution and power supply loans are typically amortizing loans that require scheduled principal payments over the life of the loan, whereas the debt securities issued under secured indentures and agreements typically have bullet maturities; |
• | distribution and power supply borrowers have the option to prepay their loans; and |
• | individual loans may become ineligible for various reasons, some of which may be temporary. |
Table 12 displays the collateral coverage ratios as of May 31, 2016 and 2015 for the debt agreements noted above that require us to either pledge collateral or maintain loans on deposit.
Table 12: Collateral Pledged or on Deposit
Requirement | Actual | |||||||||||
Debt Indenture Minimum | Revolving Credit Agreements Maximum | May 31, | ||||||||||
Debt Agreement | 2016 | 2015 | ||||||||||
Collateral trust bonds 1994 indenture | 100 | % | 150 | % | 121 | % | 106 | % | ||||
Collateral trust bonds 2007 indenture | 100 | 150 | 110 | 108 | ||||||||
Guaranteed Underwriter Program notes payable(1) | 100 | 150 | 110 | 112 | ||||||||
Farmer Mac notes payable | 100 | 150 | 117 | 113 | ||||||||
Clean Renewable Energy Bonds Series 2009A | 100 | 150 | 115 | 117 | ||||||||
____________________________
(1) Represents notes payable under the Guaranteed Underwriter Program of the USDA, which supports the Rural Economic Development Loan and Grant program. The Federal Financing Bank provides the financing for these notes, and RUS provides a guarantee of repayment.We are required to pledge collateral in an amount at least equal to the outstanding principal amount of the notes payable.
We provide additional information on our borrowings, including the maturity profile, below in “Liquidity Risk.” We provide a more detailed description of each of our debt product types in “Note 6—Short-Term Borrowings,” “Note 7—Long-Term Debt,” “Note 8—Subordinated Deferrable Debt” and “Note 9—Members’ Subordinated Certificates.” Refer to “Note 4—Loans and Commitments—Pledging of Loans and Loans on Deposit” for additional information related to pledged collateral.
Equity
Table 13 presents the components of total members’ equity, total CFC equity and total equity as of May 31, 2016 and 2015. As displayed in Table 13, total members’ equity excludes the cumulative unrealized derivative forward value gains (losses), which we record in earnings.
44
Table 13: Equity
May 31, | Increase/ (Decrease) | |||||||||||
(Dollars in thousands) | 2016 | 2015 | ||||||||||
Membership fees | $ | 974 | $ | 976 | $ | (2 | ) | |||||
Educational fund | 1,798 | 1,767 | 31 | |||||||||
Total membership fees and educational fund | 2,772 | 2,743 | 29 | |||||||||
Patronage capital allocated | 713,853 | 668,980 | 44,873 | |||||||||
Members’ capital reserve | 587,219 | 501,731 | 85,488 | |||||||||
Unallocated net income (loss) | (513,610 | ) | (293,212 | ) | (220,398 | ) | ||||||
Less: Cumulative derivative forward value losses(1) | (507,904 | ) | (287,077 | ) | (220,827 | ) | ||||||
Adjusted unallocated net income (loss)(2) | (5,706 | ) | (6,135 | ) | 429 | |||||||
Total members’ equity | 1,298,138 | 1,167,319 | 130,819 | |||||||||
Add: Prior-year cumulative derivative forward value losses | (287,077 | ) | (172,412 | ) | (114,665 | ) | ||||||
Current-year derivative forward value losses(3) | (220,827 | ) | (114,665 | ) | (106,162 | ) | ||||||
Cumulative derivative forward value losses(1) | (507,904 | ) | (287,077 | ) | (220,827 | ) | ||||||
CFC retained equity | 790,234 | 880,242 | (90,008 | ) | ||||||||
Accumulated other comprehensive income | 1,058 | 4,080 | (3,022 | ) | ||||||||
Total CFC equity | 791,292 | 884,322 | (93,030 | ) | ||||||||
Noncontrolling interests | 26,086 | 27,464 | (1,378 | ) | ||||||||
Total equity | $ | 817,378 | $ | 911,786 | $ | (94,408 | ) | |||||
____________________________
(1)Calculated based on the prior-year cumulative derivative forward gains (losses) plus the current-year derivative forward value gains (losses).
(2)Adjusted unallocated net income excludes cumulative unrealized derivative forward value gains (losses).
(3)Represents the unrealized derivative forward value gains (losses) recorded during the current fiscal year.
As noted above, the decrease in total equity of $94 million to $817 million as of May 31, 2016, was attributable to the net loss of $52 million and the patronage capital retirement of $39 million in September 2015. In July 2015, the CFC Board of Directors authorized the retirement of allocated net earnings totaling $39 million, which represented 50% of the patronage capital amount of $78 million allocated to members for fiscal year 2015. The $39 million was returned to members in cash in September 2015.
In July 2016, the CFC Board of Directors authorized the allocation of fiscal year 2016 adjusted net income as follows: $1 million to the Cooperative Educational Fund, $86 million to the members’ capital reserve and $84 million to members in the form of patronage capital. The amount of patronage capital allocated each year by CFC’s Board of Directors is based on adjusted non-GAAP net income, which excludes the impact of derivative forward value gains (losses). See “Non-GAAP Financial Measures” for information on adjusted net income.
In July 2016, the CFC Board of Directors also authorized the retirement of allocated adjusted net income totaling $42 million, which represented 50% of the fiscal year 2016 allocation. We expect to return this amount to members in cash in the second quarter of fiscal year 2017. The remaining portion of the allocated amount will be retained by CFC for 25 years under guidelines adopted by the CFC Board of Directors in June 2009.
The CFC Board of Directors is required to make annual allocations of net earnings, if any. CFC has made annual retirements of allocated net earnings in 36 of the last 37 fiscal years; however, future retirements of allocated amounts are determined based on CFC’s financial condition. The CFC Board of Directors has the authority to change the current practice for allocating and retiring net earnings at any time, subject to applicable cooperative laws. See “Item 1. Business—Allocation and Retirement of Patronage Capital” for additional information.
45
OFF-BALANCE SHEET ARRANGEMENTS |
In the ordinary course of business, we engage in financial transactions that are not presented on our consolidated balance sheets, or may be recorded on our consolidated balance sheets in amounts that are different from the full contract or notional amount of the transaction. Our off-balance sheet arrangements consist primarily of guarantees of member obligations and unadvanced loan commitments intended to meet the financial needs of our members.
Guarantees
We provide guarantees for certain contractual obligations of our members to assist them in obtaining various forms of financing. We use the same credit policies and monitoring procedures in providing guarantees as we do for loans and commitments. If a member defaults on its obligation, we are obligated to pay required amounts pursuant to our guarantees. Meeting our guarantee obligations satisfies the underlying obligation of our member systems and prevents the exercise of remedies by the guarantee beneficiary based upon a payment default by a member. In general, the member is required to repay any amount advanced by us with interest, pursuant to the documents evidencing the member’s reimbursement obligation. Table 14 displays our guarantees outstanding, by guarantee type and by company, as of May 31, 2016 and 2015.
Table 14: Guarantees Outstanding
May 31, | Increase/ (Decrease) | |||||||||||
(Dollars in thousands) | 2016 | 2015 | ||||||||||
Guarantee type: | ||||||||||||
Long-term tax-exempt bonds | $ | 475,965 | $ | 489,520 | $ | (13,555 | ) | |||||
Letters of credit | 319,596 | 382,233 | (62,637 | ) | ||||||||
Other guarantees | 113,647 | 114,747 | (1,100 | ) | ||||||||
Total | $ | 909,208 | $ | 986,500 | $ | (77,292 | ) | |||||
Company: | ||||||||||||
CFC | $ | 892,289 | $ | 952,875 | $ | (60,586 | ) | |||||
RTFC | 1,574 | 1,574 | — | |||||||||
NCSC | 15,345 | 32,051 | (16,706 | ) | ||||||||
Total | $ | 909,208 | $ | 986,500 | $ | (77,292 | ) | |||||
We recorded a guarantee liability of $17 million and $20 million, respectively, as of May 31, 2016 and 2015, related to the contingent and noncontingent exposures for guarantee and liquidity obligations associated with our members’ debt. Of our total guarantee amounts, 66% and 56% as of May 31, 2016 and 2015, respectively, were secured by a mortgage lien on substantially all of the system’s assets and future revenue of the borrowers.
We had outstanding letters of credit for the benefit of our members totaling $320 million as of May 31, 2016. Of this amount, $244 million was related to obligations for which we may be required to advance funds based on various trigger events specified in the letters of credit agreements. If we are required to advance funds, the member is obligated to repay the advance amount to us. The remaining $76 million of letters of credit are intended to provide liquidity for pollution control bonds.
In addition to the letters of credit presented above in Table 14, we had master letter of credit facilities in place as of May 31, 2016, under which we may be required to issue up to an additional $83 million in letters of credit to third parties for the benefit of our members. All of our master letter of credit facilities as of May 31, 2016 were subject to material adverse change clauses at the time of issuance. Prior to issuing a letter of credit under these facilities, we confirm that there has been no material adverse change in the business or condition, financial or otherwise, of the borrower since the time the loan was approved and that the borrower is currently in compliance with the letter of credit terms and conditions.
In addition to the guarantees described above, we were the liquidity provider for long-term, variable-rate, tax-exempt bonds issued for our member cooperatives totaling $482 million as of May 31, 2016. As liquidity provider on these tax-exempt
46
bonds, we may be required to purchase bonds that are tendered or put by investors. Investors provide notice to the remarketing agent that they will tender or put a certain amount of bonds at the next interest rate reset date. If the remarketing agent is unable to sell such bonds to other investors by the next interest rate reset date, we have unconditionally agreed to purchase such bonds. Our obligation as liquidity provider is in the form of a letter of credit on $76 million of the tax-exempt bonds, which is discussed above and included in Table 14 as a component of the letters of credit amount of $320 million as of May 31, 2016. We were not required to perform as liquidity provider pursuant to these obligations during the year ended May 31, 2016. In addition to being a liquidity provider, we also provided a guarantee of payment of principal and interest on $406 million of these bonds, included in the above table, as of May 31, 2016.
Table 15 presents the maturities for each of the next five fiscal years and thereafter of the notional amount of our outstanding guarantee obligations as of May 31, 2016.
Table 15: Maturities of Guarantee Obligations
Outstanding Balance | Maturities of Guaranteed Obligations | |||||||||||||||||||||||||||
(Dollars in thousands) | 2017 | 2018 | 2019 | 2020 | 2021 | Thereafter | ||||||||||||||||||||||
Guarantees | $ | 909,208 | $ | 164,607 | $ | 217,194 | $ | 14,561 | $ | 62,405 | $ | 112,622 | $ | 337,819 | ||||||||||||||
We provide additional information about our guarantee obligations in “Note 13—Guarantees.”
Unadvanced Loan Commitments
Unadvanced commitments represent approved and executed loan contracts for which funds have not been advanced to borrowers. Table 16 below displays the amount of unadvanced loan commitments, which consist of line of credit and long-term loan commitments, as of May 31, 2016 and 2015. Our line of credit commitments include both contracts that are not subject to material adverse change clauses and contracts that are subject to material adverse change clauses.
Table 16: Unadvanced Loan Commitments
May 31, | ||||||||||||||
(Dollars in thousands) | 2016 | % of Total | 2015 | % of Total | ||||||||||
Line of credit commitments: | ||||||||||||||
Conditional(1) | $ | 6,248,546 | 47 | % | $ | 6,529,159 | 46 | % | ||||||
Not conditional(2) | 2,447,902 | 19 | 2,764,968 | 20 | ||||||||||
Total line of credit unadvanced commitments | 8,696,448 | 66 | 9,294,127 | 66 | ||||||||||
Total long-term loan unadvanced commitments | 4,508,562 | 34 | 4,835,623 | 34 | ||||||||||
Total unadvanced loan commitments | $ | 13,205,010 | 100 | % | $ | 14,129,750 | 100 | % | ||||||
____________________________
(1)Represents amount related to facilities that are subject to material adverse change clauses.
(2)Represents amount related to facilities that are not subject to material adverse change clauses.
Unadvanced line of credit commitments are typically revolving facilities for periods not to exceed five years. Historically, borrowers have not drawn the full commitment amount for line of credit facilities, and we have experienced a very low utilization rate on line of credit loan facilities, regardless of whether or not a material adverse change clause exists at the time of advance. We believe this borrowing pattern is likely to continue because electric cooperatives generate a significant amount of cash from the collection of revenue from their customers and therefore generally do not need to draw down on loan commitments to supplement operating cash flow. In addition, the majority of the unadvanced line of credit commitments serve as a supplemental back-up liquidity to our borrowers.
Unadvanced long-term loan commitments generally expire five years from the date of the loan agreement. Borrowers historically have requested advances on commitments in multiple transactions over an extended period of time; however, they generally do not draw the full commitment amount. We also believe this borrowing pattern is likely to continue because (i) electric cooperatives generally execute loan contracts to cover multi-year work plans; as such, it is expected that
47
advances on such loans will occur over a multi-year period; (ii) electric cooperatives generate a significant amount of cash from the collection of revenue from their customers, which provides available operating cash flows to reduce the amount of additional funding needed for capital expenditures and maintenance; and (iii) we generally do not charge our borrowers a fee on long-term unadvanced commitments.
Table 17 presents the amount of unadvanced commitments, by loan type, as of May 31, 2016 and the maturities of the commitment amounts for each of the next five fiscal years and thereafter.
Table 17: Notional Maturities of Unadvanced Loan Commitments
Available Balance | Notional Maturities of Unadvanced Commitments | |||||||||||||||||||||||||||
(Dollars in thousands) | 2017 | 2018 | 2019 | 2020 | 2021 | Thereafter | ||||||||||||||||||||||
Line of credit | $ | 8,696,448 | $ | 5,036,881 | $ | 1,141,935 | $ | 974,918 | $ | 793,476 | $ | 613,838 | $ | 135,400 | ||||||||||||||
Long-term loans | 4,508,562 | 961,355 | 695,989 | 1,061,425 | 852,481 | 836,708 | 100,604 | |||||||||||||||||||||
Total | $ | 13,205,010 | $ | 5,998,236 | $ | 1,837,924 | $ | 2,036,343 | $ | 1,645,957 | $ | 1,450,546 | $ | 236,004 | ||||||||||||||
Based on our historical experience, we expect that the majority of the unadvanced commitments will expire without being fully drawn upon. Accordingly, the total unadvanced commitment amount of $13,205 million as of May 31, 2016 is not necessarily representative of future cash funding requirements.
Unadvanced Line of Credit Commitments—Conditional
The substantial majority of our line of credit commitments relate to contracts that include material adverse change clauses. The amount of unadvanced line of credit and long-term loan commitments subject to material adverse change clauses was $10,757 million and $11,365 million as of May 31, 2016 and 2015, respectively, and accounted for 81% and 80% of the combined total of unadvanced line of credit and long-term loan commitments as of May 31, 2016 and 2015, respectively. Prior to making advances on these facilities, we confirm that there has been no material adverse change in the borrower’s business or condition, financial or otherwise, since the time the loan was approved and confirm that the borrower is currently in compliance with loan terms and conditions. In some cases, the borrower’s access to the full amount of the facility is further constrained by use of proceeds restrictions, imposition of borrower-specific restrictions, or by additional conditions that must be met prior to advancing funds. Since we generally do not charge a fee for the borrower to have an unadvanced amount on a loan facility that is subject to a material adverse change clause, our borrowers tend to request amounts in excess of their immediate estimated loan requirements.
Unadvanced Line of Credit Commitments—Not Conditional
The amount of unadvanced line of credit commitments not subject to material adverse change clauses at the time of each advance totaled $2,448 million and $2,765 million as of May 31, 2016 and 2015, respectively. For contracts not subject to a material adverse change clause, we are generally required to advance amounts on the committed facilities as long as the borrower is in compliance with the terms and conditions of the facility. We record a liability for credit losses on our consolidated balance sheets for unadvanced commitments related to facilities that are not subject to a material adverse change clause because we do not consider these commitments to be conditional.
Loan syndications, where the pricing is set at a spread over a market index as agreed upon by all of the participating banks based on market conditions at the time of syndication, accounted for 78% of line of credit commitments as of May 31, 2016. New advances accounted for the remaining 22% of the committed line of credit loans as of May 31, 2016. Any new advance would be made at rates determined by us based on our cost, and we have the option to pass on to the borrower any cost increase related to the advance.
Table 18 presents the maturities for each of the next five fiscal years and thereafter of the notional amount of unconditional committed lines of credit not subject to a material adverse change clause as of May 31, 2016.
48
Table 18: Maturities of Notional Amount of Unconditional Committed Lines of Credit
Available Balance | Maturities of Notional Amount of Unconditional Committed Lines of Credit | |||||||||||||
(Dollars in thousands) | 2017 | 2018 | 2019 | 2020 | 2021 | Thereafter | ||||||||
Lines of credit | $2,447,902 | $148,240 | $601,353 | $610,442 | $613,059 | $423,621 | $51,187 | |||||||
RISK MANAGEMENT |
Overview
We face a variety of risks that can significantly affect our financial performance, liquidity, reputation and ability to meet the expectations of our members, investors and other stakeholders. As a financial services company, the major categories of risk exposures inherent in our business activities include credit risk, liquidity risk, market risk and operational risk. These risk categories are summarized below.
• | Credit risk is the risk that a borrower or other counterparty will be unable to meet its obligations in accordance with agreed-upon terms. |
• | Liquidity risk is the risk that we will be unable to fund our operations and meet our contractual obligations or that we will be unable to fund new loans to borrowers at a reasonable cost and tenor in a timely manner. |
• | Market risk is the risk that changes in market variables, such as movements in interest rates, may adversely affect the match between the timing of the contractual maturities, re-pricing and prepayments of our financial assets and the related financial liabilities funding those assets. |
• | Operational risk is the risk of loss resulting from inadequate or failed internal controls, processes, systems, human error or external events. Operational risk also includes compliance risk, fiduciary risk, reputational risk and litigation risk. |
Effective risk management is critical to our overall operations and in achieving our primary objective of providing cost-based financial products to our rural electric members while maintaining the sound financial results required for investment-grade credit ratings on our debt instruments. Accordingly, we have a risk management framework that is intended to govern the principal risks we assume in conducting our business and the aggregate amount of risk we are willing to accept, referred to as risk appetite, in the context of CFC’s mission and strategic objectives and initiatives.
Risk Management Framework
Our risk management framework consists of defined policies, procedures and risk tolerances that are intended to align with CFC’s mission. The CFC Board of Directors is responsible for risk governance by approving the enterprise risk management framework and providing oversight on risk policies, risk appetite and our performance against established goals. In fulfilling its risk governance responsibility, the CFC Board of Directors receives periodic reports on business activities from management. The CFC Board of Directors reviews CFC’s risk profile and management’s assessment of those risks throughout the year at its periodic meetings. The board also establishes CFC’s loan policies and has established a Loan Committee of the board comprising no fewer than 10 directors that reviews the performance of the loan portfolio in accordance with those policies. For additional information about the role of the CFC Board of Directors in risk governance and oversight, see “Item 10. Directors, Executive Officers and Corporate Governance.”
Management is responsible for execution of the risk management framework, risk policy formation and daily management of the risks associated with our business. Management executes its responsibility by establishing risk management processes for identifying, measuring, assessing, managing, monitoring and reporting risks. Management and operating groups maintain policies and procedures, specific to each major risk category, to identify and measure our primary risk exposures at the transaction, obligor and portfolio levels and ensure that our exposures remain within prescribed limits. Management also is responsible for establishing and maintaining internal controls to mitigate key risks. We have a number of management-level risk oversight committees across the organization that have a defined set of authorities and responsibilities specific to
49
one or more risk types, including the Corporate Credit Committee, Credit Risk Management group, Asset Liability Committee, Corporate Compliance group, Internal Audit group and Disclosure Committee. The risk oversight committees collectively help management facilitate enterprise-wide understanding and monitoring of CFC’s risk profile and the control processes with respect to our inherent risks. Management and the risk oversight committees periodically report actual results, significant current and emerging risks, initiatives and risk management concerns to the CFC Board of Directors.
CREDIT RISK |
Our loan portfolio, which represents the largest component of assets on our balance sheet, and guarantees account for the substantial majority of our credit risk exposure. We also engage in certain non-lending activities that may give rise to credit and counterparty settlement risk, including the purchase of investment securities and entering into derivative transactions to manage our interest rate risk.
Loan and Guarantee Portfolio Credit Risk
Below we provide information on the credit risk profile of our loan portfolio and guarantees, including security provisions, loan concentration, credit performance and our allowance for loan losses.
Security Provisions
Except when providing line of credit loans, we generally lend to our members on a senior secured basis. Long-term loans are generally secured on parity with other secured lenders (primarily RUS), if any, by all assets and revenue of the borrower with exceptions typical in utility mortgages. Line of credit loans are generally unsecured. In addition to the collateral pledged to secure our loans, borrowers also are required to set rates charged to customers to achieve certain financial ratios. Of our total loans outstanding, 92% were secured and 8% were unsecured as of May 31, 2016, compared with 91% and 9%, respectively, as of May 31, 2015. Table 19 presents, by loan type and by company, the amount and percentage of secured and unsecured loans in our loan portfolio as of May 31, 2016 and 2015.
Table 19 : Loan Portfolio Security Profile
May 31, 2016 | ||||||||||||||||||
(Dollars in thousands) | Secured | % of Total | Unsecured | % of Total | Total | |||||||||||||
Loan type: | ||||||||||||||||||
Long-term fixed-rate loans | $ | 20,437,784 | 96 | % | $ | 779,355 | 4 | % | $ | 21,217,139 | ||||||||
Long-term variable-rate loans | 688,495 | 91 | 68,928 | 9 | 757,423 | |||||||||||||
Loans guaranteed by RUS | 173,514 | 100 | — | — | 173,514 | |||||||||||||
Line of credit loans | 48,256 | 5 | 956,185 | 95 | 1,004,441 | |||||||||||||
Total loans outstanding (1) | $ | 21,348,049 | 92 | $ | 1,804,468 | 8 | $ | 23,152,517 | ||||||||||
Company: | ||||||||||||||||||
CFC | $ | 20,590,529 | 93 | % | $ | 1,539,344 | 7 | % | $ | 22,129,873 | ||||||||
RTFC | 330,696 | 97 | 11,146 | 3 | 341,842 | |||||||||||||
NCSC | 426,824 | 63 | 253,978 | 37 | 680,802 | |||||||||||||
Total loans outstanding (1) | $ | 21,348,049 | 92 | $ | 1,804,468 | 8 | $ | 23,152,517 | ||||||||||
50
May 31, 2015 | ||||||||||||||||||
(Dollars in thousands) | Secured | % of Total | Unsecured | % of Total | Total | |||||||||||||
Loan type: | ||||||||||||||||||
Long-term fixed-rate loans | $ | 18,526,068 | 95 | % | $ | 1,017,206 | 5 | % | $ | 19,543,274 | ||||||||
Long-term variable-rate loans | 628,115 | 90 | 70,380 | 10 | 698,495 | |||||||||||||
Loans guaranteed by RUS | 179,241 | 100 | — | — | 179,241 | |||||||||||||
Line of credit loans | 107,781 | 10 | 930,429 | 90 | 1,038,210 | |||||||||||||
Total loans outstanding (1) | $ | 19,441,205 | 91 | $ | 2,018,015 | 9 | $ | 21,459,220 | ||||||||||
Company: | ||||||||||||||||||
CFC | $ | 18,635,818 | 92 | % | $ | 1,706,172 | 8 | % | $ | 20,341,990 | ||||||||
RTFC | 370,924 | 96 | 14,785 | 4 | 385,709 | |||||||||||||
NCSC | 434,463 | 59 | 297,058 | 41 | 731,521 | |||||||||||||
Total loans outstanding (1) | $ | 19,441,205 | 91 | $ | 2,018,015 | 9 | $ | 21,459,220 | ||||||||||
____________________________
(1)Excludes deferred loan origination costs of $10 million as of May 31, 2016 and 2015.
As part of our strategy in managing our credit risk exposure, we entered into a long-term standby purchase commitment agreement with Farmer Mac on August 31, 2015, as amended on May 31, 2016. Under this agreement, we may designate certain loans to be covered under the commitment, as approved by Farmer Mac, and in the event any such loan later goes into material default for at least 90 days, upon request by us, Farmer Mac must purchase such loan at par value. We designated, and Farmer Mac approved loans that had an aggregate outstanding principal balance of $926 million as of May 31, 2016.
Loan Concentration
We serve electric and telecommunications members throughout the United States and its territories, including 49 states, the District of Columbia, American Samoa and Guam. Table 20 presents the number of CFC, RTFC and NCSC borrowers and the percentage of total loans outstanding by state or U.S. territory as of May 31, 2016 and 2015.
51
Table 20: Loan Concentration
May 31, | ||||||||||||
2016 | 2015 | |||||||||||
U.S. State/Territory | Number of Borrowers | % of Total Loans Outstanding(1) | Number of Borrowers | % of Total Loans Outstanding(1) | ||||||||
Texas | 73 | 14.83 | % | 73 | 14.92 | % | ||||||
Georgia | 46 | 5.89 | 46 | 5.79 | ||||||||
Missouri | 50 | 5.28 | 52 | 5.14 | ||||||||
Colorado | 26 | 5.02 | 27 | 5.37 | ||||||||
Kansas | 33 | 4.31 | 34 | 4.29 | ||||||||
Alaska | 17 | 3.87 | 19 | 4.18 | ||||||||
North Dakota | 16 | 3.60 | 14 | 2.26 | ||||||||
Illinois | 27 | 3.58 | 28 | 3.65 | ||||||||
Minnesota | 56 | 3.17 | 57 | 3.43 | ||||||||
South Carolina | 23 | 3.16 | 23 | 3.06 | ||||||||
Florida | 16 | 3.00 | 16 | 2.94 | ||||||||
Oklahoma | 27 | 2.92 | 27 | 2.96 | ||||||||
North Carolina | 28 | 2.84 | 29 | 2.46 | ||||||||
Indiana | 41 | 2.81 | 45 | 2.77 | ||||||||
Kentucky | 24 | 2.80 | 25 | 2.97 | ||||||||
Arkansas | 20 | 2.44 | 21 | 2.44 | ||||||||
Ohio | 30 | 2.44 | 32 | 2.28 | ||||||||
Alabama | 25 | 2.43 | 25 | 2.36 | ||||||||
Pennsylvania | 17 | 2.25 | 18 | 2.24 | ||||||||
Iowa | 40 | 2.02 | 40 | 2.03 | ||||||||
Maryland | 2 | 1.88 | 3 | 1.72 | ||||||||
Utah | 6 | 1.76 | 6 | 2.02 | ||||||||
Wisconsin | 26 | 1.72 | 25 | 1.86 | ||||||||
Mississippi | 18 | 1.58 | 19 | 2.09 | ||||||||
Oregon | 22 | 1.52 | 25 | 1.60 | ||||||||
Nevada | 5 | 1.47 | 5 | 1.49 | ||||||||
Virginia | 18 | 1.46 | 19 | 1.18 | ||||||||
Washington | 11 | 1.43 | 11 | 1.52 | ||||||||
Louisiana | 10 | 1.29 | 10 | 1.38 | ||||||||
Wyoming | 14 | 1.18 | 15 | 1.17 | ||||||||
South Dakota | 32 | 0.99 | 32 | 0.93 | ||||||||
Montana | 25 | 0.77 | 25 | 0.75 | ||||||||
Arizona | 11 | 0.59 | 12 | 0.70 | ||||||||
Michigan | 15 | 0.58 | 15 | 0.55 | ||||||||
Idaho | 13 | 0.57 | 13 | 0.64 | ||||||||
Delaware | 2 | 0.49 | 2 | 0.56 | ||||||||
New Hampshire | 1 | 0.41 | 2 | 0.44 | ||||||||
Tennessee | 19 | 0.40 | 19 | 0.31 | ||||||||
New Mexico | 16 | 0.27 | 16 | 0.32 | ||||||||
Hawaii | 2 | 0.19 | 2 | 0.32 | ||||||||
Vermont | 4 | 0.19 | 6 | 0.22 | ||||||||
California | 4 | 0.15 | 4 | 0.15 | ||||||||
Nebraska | 17 | 0.13 | 19 | 0.16 | ||||||||
New York | 5 | 0.13 | 6 | 0.15 | ||||||||
New Jersey | 2 | 0.07 | 3 | 0.10 | ||||||||
West Virginia | 2 | 0.07 | 2 | 0.08 | ||||||||
Maine | 4 | 0.05 | 4 | 0.05 | ||||||||
Total | 941 | 100.00 | % | 971 | 100.00 | % | ||||||
____________________________
(1)The percentage of total loans outstanding for each state or territory is based on the aggregate unpaid principal balance of loans to borrowers in the state or territory divided by total loans outstanding as of the end of each period.
52
Texas had the largest concentration of loans to borrowers in any one state, with 73 borrowers that accounted for approximately 15% of total loans outstanding as of May 31, 2016 and 2015. Texas has the largest concentration of borrowers because 10 of our 71 power supply system borrowers are located in Texas. Power supply system borrowers generally require significantly more capital than distribution and telecommunications systems.
Table 21 displays the outstanding exposure of the 20 largest borrowers, by exposure type and by company, as of May 31, 2016 and 2015. The 20 largest borrowers as of May 31, 2016 consisted of 11 distribution systems and 9 power supply systems. In comparison, the 20 largest borrowers as of May 31, 2015 consisted of 12 distribution systems and 8 power supply systems. The largest total outstanding exposure to a single borrower or controlled group accounted for approximately 2% of total loans and guarantees outstanding as of both May 31, 2016 and 2015.
Table 21: Credit Exposure to 20 Largest Borrowers
May 31, | Increase/ (Decrease) | |||||||||||||||||
2016 | 2015 | |||||||||||||||||
(Dollars in thousands) | Amount | % of Total | Amount | % of Total | ||||||||||||||
By exposure type: | ||||||||||||||||||
Loans | $ | 5,638,217 | 23 | % | $ | 5,478,977 | 24 | % | $ | 159,240 | ||||||||
Guarantees | 365,457 | 2 | 374,189 | 2 | (8,732 | ) | ||||||||||||
Total exposure to 20 largest borrowers | 6,003,674 | 25 | 5,853,166 | 26 | 150,508 | |||||||||||||
Less: Loans covered under Farmer Mac standby purchase commitment(1) | (402,244 | ) | (2 | ) | — | — | (402,244 | ) | ||||||||||
Net exposure to 20 largest borrowers | $ | 5,601,430 | 23 | % | $ | 5,853,166 | 26 | % | $ | (251,736 | ) | |||||||
By company: | ||||||||||||||||||
CFC(1) | $ | 5,991,674 | 25 | % | $ | 5,837,463 | 26 | % | $ | 154,211 | ||||||||
NCSC | 12,000 | — | 15,703 | — | (3,703 | ) | ||||||||||||
Total exposure to 20 largest borrowers | 6,003,674 | 25 | 5,853,166 | 26 | 150,508 | |||||||||||||
Less: Loans covered under Farmer Mac standby purchase commitment(1) | (402,244 | ) | (2 | ) | — | — | (402,244 | ) | ||||||||||
Net exposure to 20 largest borrowers | $ | 5,601,430 | 23 | % | $ | 5,853,166 | 26 | % | $ | (251,736 | ) | |||||||
____________________________
(1) The stand-by purchase commitment agreement with Farmer Mac entered into during fiscal year 2016 covered $402 million of this total as of May 31, 2016.
Credit Performance
As part of our credit risk management process, we monitor and evaluate each borrower and loan in our loan portfolio and assign numeric internal risk ratings based on quantitative and qualitative assessments. Our ratings are aligned to regulatory definitions of pass and criticized categories with criticized divided between special mention, substandard and doubtful. Internal risk rating and payment status trends are indicators, among others, of the level of credit risk in our loan portfolio. As displayed in “Note 4—Loans and Commitments,” 0.2% of the loans in our portfolio were classified as criticized as of
May 31, 2016 and 2015. Below we provide information on certain additional credit quality indicators, including modified loans classified as troubled debt restructurings (“TDRs”) and nonperforming loans.
Troubled Debt Restructurings
We actively monitor underperforming loans and, from time to time, attempt to work with borrowers to manage such exposures through loan workouts or modifications that better align with the borrower’s current ability to pay. Modified loans in which we grant one or more concessions to a borrower experiencing financial difficulty are accounted for and reported as a TDR. Loans modified in a TDR are generally initially placed on nonaccrual status, although in many cases such loans
53
were already on nonaccrual status prior to modification. Interest accrued but not collected at the date a loan is placed on nonaccrual status is reversed against earnings. These loans may be returned to performing status and the accrual of interest resumed if the borrower performs under the modified terms for an extended period of time, and we expect the borrower to continue to perform in accordance with the modified terms. In certain limited circumstances in which a modified loan is current at the modification date, the loan is not placed on nonaccrual status at the time of modification. Table 22 presents the carrying value of modified loans, all of which met the definition of a TDR, as of the end of each of the last five fiscal years. These loans were considered individually impaired as of the end of each period presented.
Table 22: TDR Loans
May 31, | |||||||||||||||||||||||||||||||||||
2016 | 2015 | 2014 | 2013 | 2012 | |||||||||||||||||||||||||||||||
(Dollars in thousands) | Amount | % of Total Loans | Amount | % of Total Loans | Amount | % of Total Loans | Amount | % of Total Loans | Amount | % of Total Loans | |||||||||||||||||||||||||
TDR loans: | |||||||||||||||||||||||||||||||||||
CFC | $ | 6,716 | 0.03 | % | $ | 7,221 | 0.03 | % | $ | 7,584 | 0.04 | % | $ | 46,953 | 0.23 | % | $ | 455,689 | 2.41 | % | |||||||||||||||
RTFC | 10,598 | 0.04 | 4,221 | 0.02 | — | — | — | — | — | — | |||||||||||||||||||||||||
NCSC | — | — | 294 | — | — | — | — | — | — | — | |||||||||||||||||||||||||
Total TDR loans | $ | 17,314 | 0.07 | % | $ | 11,736 | 0.05 | % | $ | 7,584 | 0.04 | % | $ | 46,953 | 0.23 | % | $ | 455,689 | 2.41 | % | |||||||||||||||
TDR loans performance status: | |||||||||||||||||||||||||||||||||||
Performing TDR loans | $ | 13,808 | 0.06 | % | $ | 11,736 | 0.05 | % | $ | 7,584 | 0.04 | % | $ | 46,953 | 0.23 | % | $ | 455,689 | 2.41 | % | |||||||||||||||
Nonperforming TDR loans | 3,506 | 0.01 | — | — | — | — | — | — | — | — | |||||||||||||||||||||||||
Total TDR loans | $ | 17,314 | 0.07 | % | $ | 11,736 | 0.05 | % | $ | 7,584 | 0.04 | % | $ | 46,953 | 0.23 | % | $ | 455,689 | 2.41 | % | |||||||||||||||
Loans classified as performing TDR loans as of each fiscal year end, as disclosed in Table 22, were performing in accordance with the terms of their respective restructured loan agreement as of the respective reported dates. All TDR loans classified as performing as of May 31, 2016 were on accrual status as of that date. Of the TDR loans classified as performing in Table 22 above, $12 million, $8 million, $8 million and $29 million as of May 31, 2015, 2014, 2013 and 2012, respectively, were on nonaccrual status as of that date.
All TDR loans classified as nonperforming as of May 31, 2016 were on nonaccrual status as of that date. As indicated in Table 22 above, there were no TDR loans classified as nonperforming as of May 31, 2015, 2014, 2013 or 2012.
Nonperforming Loans
In addition to nonperforming TDR loans, we also have nonperforming loans that have not been modified and classified as a TDR. We classify such loans as nonperforming at the earlier of the date when we determine: (i) interest or principal payments on the loan is past due 90 days or more; (ii) as a result of court proceedings, the collection of interest or principal payments based on the original contractual terms is not expected; or (iii) the full and timely collection of interest or principal is otherwise uncertain. Once a loan is classified as nonperforming, we generally place the loan on nonaccrual status. Interest accrued but not collected at the date a loan is placed on nonaccrual status is reversed against earnings.
54
Table 23 below presents nonperforming loans as of the end of each of the last five fiscal years.
Table 23: Nonperforming Loans
May 31, | |||||||||||||||||||||||||||||||||||
2016 | 2015 | 2014 | 2013 | 2012 | |||||||||||||||||||||||||||||||
(Dollars in thousands) | Amount | % of Total Loans | Amount | % of Total Loans | Amount | % of Total Loans | Amount | % of Total Loans | Amount | % of Total Loans | |||||||||||||||||||||||||
Nonperforming loans:(1) | |||||||||||||||||||||||||||||||||||
CFC | $ | — | — | % | $ | — | — | % | $ | — | — | % | $ | 5,000 | 0.02 | % | $ | 34,243 | 0.18 | % | |||||||||||||||
RTFC | — | — | — | — | 1,695 | 0.01 | 10,497 | 0.06 | 6,970 | 0.04 | |||||||||||||||||||||||||
NCSC | — | — | — | — | 400 | — | — | — | — | — | |||||||||||||||||||||||||
Total | $ | — | — | % | $ | — | — | % | $ | 2,095 | 0.01 | % | $ | 15,497 | 0.08 | % | $ | 41,213 | 0.22 | % | |||||||||||||||
____________________________
(1)Foregone interest on nonperforming loans, including nonperforming TDR loans presented above in Table 22, was less than $1 million for fiscal years 2016 , 2015 and 2014.
We provide additional information on the credit quality of our loan portfolio in “Note 4—Loans and Commitments.”
Allowance for Loan Losses
The allowance for loan losses is determined based upon evaluation of the loan portfolio, past loss experience, specific problem loans, economic conditions and other pertinent factors that, in management’s judgment, could affect the risk of loss in the loan portfolio. We review and adjust the allowance quarterly to cover estimated probable losses in the portfolio. All loans are written off in the period that it becomes evident that collectability is highly unlikely; however, our efforts to recover all charged-off amounts may continue. Management believes the allowance for loan losses is appropriate to cover estimated probable portfolio losses.
Table 24 summarizes activity in the allowance for loan losses for the last five fiscal years and a comparison of the allowance by company as of the end of each of those years.
Table 24: Allowance for Loan Losses
Year Ended May 31, | ||||||||||||||||||||
(Dollars in thousands) | 2016 | 2015 | 2014 | 2013 | 2012 | |||||||||||||||
Beginning balance | $ | 33,690 | $ | 56,429 | $ | 54,325 | $ | 143,326 | $ | 161,177 | ||||||||||
Provision (benefit) for loan losses | (646 | ) | (21,954 | ) | 3,498 | (70,091 | ) | (18,108 | ) | |||||||||||
Net (charge-offs) recoveries | 214 | (785 | ) | (1,394 | ) | (18,910 | ) | 257 | ||||||||||||
Ending balance | $ | 33,258 | $ | 33,690 | $ | 56,429 | $ | 54,325 | $ | 143,326 | ||||||||||
55
(Dollars in thousands) | May 31, | |||||||||||||||||||
Allowance for loan losses by company: | 2016 | 2015 | 2014 | 2013 | 2012 | |||||||||||||||
CFC | $ | 24,559 | $ | 23,716 | $ | 45,600 | $ | 41,246 | $ | 126,941 | ||||||||||
RTFC | 5,565 | 4,533 | 4,282 | 9,158 | 8,562 | |||||||||||||||
NCSC | 3,134 | 5,441 | 6,547 | 3,921 | 7,823 | |||||||||||||||
Total | $ | 33,258 | $ | 33,690 | $ | 56,429 | $ | 54,325 | $ | 143,326 | ||||||||||
Allowance coverage ratios: | ||||||||||||||||||||
Percentage of total loans outstanding | 0.14 | % | 0.16 | % | 0.28 | % | 0.27 | % | 0.76 | % | ||||||||||
Percentage of total nonperforming loans outstanding | — | — | 2,693.51 | 350.55 | 347.77 | |||||||||||||||
Percentage of total performing TDR loans outstanding | 240.86 | 287.07 | 744.05 | 115.70 | 31.45 | |||||||||||||||
Percentage of total nonperforming TDR loans outstanding | 948.60 | — | — | — | — | |||||||||||||||
Percentage of total loans on nonaccrual | 948.60 | 287.07 | 583.00 | 235.37 | 347.77 | |||||||||||||||
The allowance for loan losses decreased by a modest amount during fiscal year 2016 to $33 million as of May 31, 2016, from $34 million as of the prior fiscal year end. Although total loans outstanding increased by $1.7 billion, or 8%, from fiscal year-end 2015, the allowance coverage ratio decreased to 0.14% as of May 31, 2016, from 0.16% as of May 31, 2015. The decrease in the allowance coverage ratio was due in part to the Farmer Mac long-term standby purchase commitment agreement entered into during fiscal year 2016. The outstanding balance of loans covered under this agreement was $926 million as of May 31, 2016. This agreement resulted in a reduction in the collective allowance attributable to these loans because our exposure to loss has been substantially mitigated. In addition, there was an overall improvement in the historical default rates used in calculating our allowance, which contributed to the reduction in the allowance. The favorable impact of these items was partially offset by an increase in the specific reserve for loans individually evaluated for impairment. Loans designated as individually impaired totaled $17 million and $12 million, respectively, as of May 31, 2016 and 2015, and the specific allowance for these loans totaled $3 million and $0.4 million, respectively.
We discuss our methodology for determining the allowance for loan losses above in “Critical Accounting Policies and Estimates” and in “Note 1—Summary of Significant Accounting Policies.” Also see “Results of Operations—Provision for Loan Losses” and “Note 4—Loans and Commitments” for additional information on our allowance for loan losses.
Counterparty Credit Risk
We are exposed to counterparty risk related to the performance of the parties with which we entered into financial transactions, primarily for derivative instruments and cash and time deposits that we have with various financial institutions. To mitigate this risk, we only enter into these transactions with financial institutions with investment-grade ratings. Our cash and time deposits with financial institutions generally have an original maturity of less than one year.
We manage our derivative counterparty credit risk by requiring that derivative counterparties participate in one of our revolving credit agreements, monitoring the overall credit worthiness of each counterparty, using counterparty-specific credit risk limits, executing master netting arrangements and diversifying our derivative transactions among multiple counterparties. Our derivative counterparties had credit ratings ranging from Aa3 to Baa3 by Moody’s Investors Service (“Moody’s”) and from AA-to BBB+ by S&P Global Ratings (“S&P”) as of May 31, 2016. Our largest counterparty exposure, based on the outstanding notional amount, represented approximately 25% and 19% of the total outstanding notional amount of derivatives as of May 31, 2016 and 2015, respectively.
Credit Risk-Related Contingent Features
Our derivative contracts typically contain mutual early termination provisions, generally in the form of a credit rating trigger. Under the mutual credit rating trigger provisions, either counterparty may, but is not obligated to, terminate and settle the agreement if the credit rating of the other counterparty falls to a level specified in the agreement. If a derivative
56
contract is terminated, the amount to be received or paid by us would be equal to the mark-to-market value, as defined in the agreement, as of termination date.
Our senior unsecured credit ratings from Moody’s and S&P were A2 and A, respectively, as of May 31, 2016. Both Moody’s and S&P had our ratings on stable outlook as of May 31, 2016. Table 25 displays the notional amounts of our derivative contracts with rating triggers as of May 31, 2016 and the payments that would be required if the contracts were terminated as of that date because of a downgrade of our unsecured credit ratings or the counterparty’s unsecured credit ratings below A3/A-, below Baa1/BBB+ to or below Baa2/BBB, below Baa3/BBB- or to or below Ba2/BB+ by Moody’s or S&P, respectively. In calculating the payment amounts that would be required upon termination of the derivative contracts, we assumed that the amounts for each counterparty would be netted in accordance with the provisions of the master netting agreements for each counterparty. The net payment amounts are based on the fair value of the underlying derivative instrument, excluding the credit risk valuation adjustment, plus any unpaid accrued interest amounts.
Table 25: Rating Triggers for Derivatives
(Dollars in thousands) | Notional Amount(1) | Payable Due From CFC | Receivable Due to CFC | Net (Payable)/Receivable | ||||||||||||
Impact of rating downgrade trigger: | ||||||||||||||||
Falls below A3/A-(2) | $ | 63,295 | $ | (18,232 | ) | $ | — | $ | (18,232 | ) | ||||||
Falls below Baa1/BBB+ | 6,516,255 | (316,969 | ) | — | (316,969 | ) | ||||||||||
Falls to or below Baa2/BBB (3) | 160,467 | (2,930 | ) | — | (2,930 | ) | ||||||||||
Falls below Baa3/BBB- | 392,068 | (30,244 | ) | — | (30,244 | ) | ||||||||||
Total | $ | 7,132,085 | $ | (368,375 | ) | $ | — | $ | (368,375 | ) | ||||||
___________________________
(1) Excludes $40 million notional amount of forward starting swaps, with an effective start date of June 30, 2016, outstanding as of May 31, 2016.
(2) Rating trigger for CFC falls below A3/A-, while rating trigger for counterparty falls below Baa1/BBB+ by Moody’s or S&P, respectively.
(3) Rating trigger for CFC falls to or below Baa2/BBB, while rating trigger for counterparty falls to or below Ba2/BB+ by Moody’s or S&P, respectively.
The aggregate amount, excluding the credit risk valuation adjustment, of all derivatives with rating triggers that were in a net liability position was $368 million as of May 31, 2016. There were no interest rate swaps with rating triggers that were in a net asset position as of May 31, 2016. There were no counterparties that fell below the rating trigger levels in our interest swap contracts as of May 31, 2016. If a counterparty has a credit rating that falls below the rating trigger level specified in the interest swap contract, we have the option to terminate all derivatives with the counterparty. However, we generally do not terminate such agreements early because our interest rate swaps are critical to our matched funding strategy.
See “Item 1A. Risk Factors” for additional information about credit risk related to our business.
LIQUIDITY RISK |
Our liquidity risk management framework is designed to meet our liquidity objectives of providing a reliable source of funding to members, meet maturing debt and other obligations, issue new debt and fund our operations on a cost-effective basis under normal operating conditions as well as under CFC-specific and/or market stress conditions. We engage in various activities to manage liquidity risk and achieve our liquidity objectives. Our Asset Liability Committee establishes liquidity guidelines that are intended to ensure that we maintain sufficient, diversified sources of liquidity to cover potential funding requirements as well as unanticipated contingencies. Our Treasury group develops strategies to manage our targeted liquidity position, projects our funding needs under various scenarios, including adverse circumstances, and monitors our liquidity position on an ongoing basis.
Short-Term Borrowings
We rely primarily on cash flows from our operations along with short-term borrowings, which we refer to as our short-term funding portfolio, as quick sources of funding to meet our near-term, day-to-day liquidity needs. Our short-term funding portfolio consists of commercial paper, which we offer to members and dealers, select notes and daily liquidity fund notes to
57
members, bank-bid notes and medium-term notes to members and dealers. Table 26 presents the year-end, maximum month-end and average outstanding amounts, together with the weighted average interest rate and weighted average maturity, for each respective category of our short-term funding portfolio for fiscal years 2016, 2015 and 2014.
Table 26: Short-Term Borrowings
May 31, 2016 | |||||||||||||||||
(Dollars in thousands) | Amount Outstanding | Weighted- Average Interest Rate | Weighted-Average Maturity | Maximum Month-End Outstanding Amount | Average Outstanding Amount | ||||||||||||
Short-term borrowings: | |||||||||||||||||
Commercial paper | $ | 1,507,942 | 0.44 | % | 17 days | $ | 2,445,894 | $ | 1,734,651 | ||||||||
Select notes to members | 701,849 | 0.62 | 43 days | 845,805 | 709,285 | ||||||||||||
Daily liquidity fund notes to members | 525,959 | 0.34 | 1 day | 740,142 | 551,594 | ||||||||||||
Medium-term notes to members | 203,098 | 1.05 | 161 days | 213,260 | 199,078 | ||||||||||||
Total short-term borrowings | $ | 2,938,848 | 0.51 | % | 31 days | $ | 3,194,608 | ||||||||||
May 31, 2015 | |||||||||||||||||
(Dollars in thousands) | Amount Outstanding | Weighted- Average Interest Rate | Weighted-Average Maturity | Maximum Month-End Outstanding Amount | Average Outstanding Amount | ||||||||||||
Short-term borrowings: | |||||||||||||||||
Commercial paper | $ | 1,721,116 | 0.15 | % | 19 days | $ | 3,184,166 | $ | 2,493,040 | ||||||||
Select notes to members | 671,635 | 0.29 | 41 days | 671,635 | 587,971 | ||||||||||||
Daily liquidity fund notes to members | 509,131 | 0.08 | 1 day | 588,872 | 505,060 | ||||||||||||
Bank bid notes | — | — | — | — | 438 | ||||||||||||
Medium-term notes to members | 225,872 | 0.65 | 160 days | 229,160 | 216,335 | ||||||||||||
Total short-term borrowings | $ | 3,127,754 | 0.20 | % | 31 days | $ | 3,802,844 | ||||||||||
May 31, 2014 | |||||||||||||||||
(Dollars in thousands) | Amount Outstanding | Weighted- Average Interest Rate | Weighted-Average Maturity | Maximum Month-End Outstanding Amount | Average Outstanding Amount | ||||||||||||
Short-term borrowings: | |||||||||||||||||
Commercial paper | $ | 2,831,946 | 0.14 | % | 17 days | $ | 3,723,948 | $ | 3,083,849 | ||||||||
Select notes | 548,610 | 0.27 | 41 days | 605,536 | 485,839 | ||||||||||||
Daily liquidity fund notes | 486,501 | 0.06 | 1 day | 715,539 | 585,104 | ||||||||||||
Bank bid notes | 20,000 | 0.60 | 9 days | 150,000 | 127,315 | ||||||||||||
Medium-term notes sold to members | 212,274 | 0.63 | 135 days | 218,535 | 200,833 | ||||||||||||
Medium-term notes sold to dealers | — | — | — | 325,000 | 54,167 | ||||||||||||
Total short-term borrowings | $ | 4,099,331 | 0.17 | % | 25 days | $ | 4,537,107 | ||||||||||
Our short-term borrowings totaled $2,939 million and accounted for 13% of total debt outstanding as of May 31, 2016, compared with $3,128 million, or 15%, of total debt outstanding as of May 31, 2015. The weighted average maturity and weighted average cost of our short-term borrowings was 31 days and 0.51%, respectively, as of May 31, 2016, compared with 31 days and 0.20%, respectively, as of May 31, 2015. Commercial paper issued through dealers totaled $660 million and represented 3% of total debt outstanding as of May 31, 2016. During fiscal year 2015, we began reducing the level of dealer commercial paper to an amount below $1,250 million to manage our short-term wholesale funding risk. We expect to continue to maintain our outstanding dealer commercial paper at a level below this amount for the foreseeable future.
On June 15, 2016 we redeemed an aggregate principal amount of $87 million of our dealer medium-term notes at par plus accrued interest. The principal and accrued interest at the redemption date was paid with a combination of cash on hand and
58
other sources of liquidity, including the issuance of short-term debt. This early redemption was initiated by us for asset-liability management purposes.
Liquidity Reserve
As part of our strategy in meeting our liquidity objectives, we seek to maintain a liquidity reserve in the form of both on-balance sheet and off-balance sheet funding sources that are readily accessible for immediate liquidity needs. Table 27 below presents the components of our liquidity reserve and a comparison of the amounts available as of May 31, 2016 and 2015.
Table 27: Liquidity Reserve
May 31, | ||||||||||||||||||||||||
2016 | 2015 | |||||||||||||||||||||||
(Dollars in millions) | Total | Accessed | Available | Total | Accessed | Available | ||||||||||||||||||
Cash and cash equivalents and time deposits | $ | 545 | $ | — | $ | 545 | $ | 734 | $ | — | $ | 734 | ||||||||||||
Committed bank revolving line of credit agreements—unsecured(1) | 3,310 | 1 | '(2) | 3,309 | 3,420 | 1 | 3,419 | |||||||||||||||||
Guaranteed Underwriter Program committed facilities—secured | 600 | — | 600 | 750 | — | 750 | ||||||||||||||||||
Farmer Mac revolving note purchase agreement, dated March 24, 2011—secured(2) | 4,500 | 2,303 | 2,197 | 4,500 | 1,911 | 2,589 | ||||||||||||||||||
Farmer Mac revolving note purchase agreement, dated July 31, 2015—secured | 300 | — | 300 | — | — | — | ||||||||||||||||||
Total | $ | 9,255 | $ | 2,304 | $ | 6,951 | $ | 9,404 | $ | 1,912 | $ | 7,492 | ||||||||||||
____________________________
(1)The accessed amount of $1 million relates to a letter of credit issued pursuant to the line of credit agreement.
(2)Availability subject to market conditions.
Cash and time deposits are a source of liquidity available to support our operations. Cash and time deposits totaled $545 million as of May 31, 2016, compared with $734 million as of May 31, 2015. The interest rate earned on time deposits provides an overall benefit to our net interest yield.
Borrowing Capacity
In addition to cash and time deposits, our liquidity reserve includes access to funds under committed revolving line of credit agreements with banks, committed loan facilities under the Guaranteed Underwriter Program of the USDA and our revolving note purchase agreements with Farmer Mac. Below, we discuss our borrowing capacity under each of these facilities.
Committed Bank Revolving Line of Credit Agreements—Unsecured
Our bank revolving lines of credit may be used for general corporate purposes; however, we generally rely on them as a backup source of liquidity to our short-term funding portfolio. Our short-term funding portfolio consists of member and dealer commercial paper, select notes to members and daily liquidity fund investments by members. On November 19, 2015, we amended and restated the $1,665 million three-year and $1,645 million five-year revolving credit agreements to extend the maturity dates to November 19, 2018 and November 19, 2020, respectively, from October 28, 2017 and October 28, 2019, respectively. Commitments of $25 million under the three-year agreement will expire at the prior maturity date of October 28, 2017. Commitments of $45 million under the five-year agreement will expire at the prior maturity date of October 28, 2019. Also, as part of the amendment, the commitments from three banks were increased by $45 million.
Prior to this amendment, NCSC assumed $155 million in commitments from one of the banks, which was reduced to $110 million as part of the amendment on November 19, 2015. Although the total commitment amount under our new revolving credit agreements is unchanged from the previous total of $3,420 million, NCSC’s commitment amount is excluded from
59
the commitment amount from third parties of $3,310 million because NCSC receives all of its funding from CFC and NCSC’s financial results are consolidated with CFC. The NCSC assumption of $110 million of commitments under the revolving credit agreements also reduces the total letters of credit from third parties to $290 million.
Under our current bank revolving line of credit agreements, we have the ability to request up to $300 million of letters of credit, which would reduce the amount available under the facilities. Table 28 presents the total commitment, the net amount available for use and the outstanding letters of credit under our revolving credit agreements as of May 31, 2016. We did not have any outstanding borrowings under our bank revolving line of credit agreements as of May 31, 2016.
Table 28: Bank Revolving Credit Agreements
May 31, 2016 | ||||||||||||||||
(Dollars in millions) | Total Commitment | Letters of Credit Outstanding | Net Available for Advance (1) | Maturity | Annual Facility Fee (2) | |||||||||||
3-year agreement | $ | 25 | $ | — | $ | 25 | October 28, 2017 | 7.5 bps | ||||||||
3-year agreement | 1,640 | — | 1,640 | November 19, 2018 | 7.5 bps | |||||||||||
Total 3-year agreement | 1,665 | — | 1,665 | |||||||||||||
5-year agreement | 45 | — | 45 | October 28, 2019 | 10 bps | |||||||||||
5-year agreement | 1,600 | 1 | 1,599 | November 19, 2020 | 10 bps | |||||||||||
Total 5-year agreement | 1,645 | 1 | 1,644 | |||||||||||||
Total | $ | 3,310 | $ | 1 | $ | 3,309 | ||||||||||
___________________________
(1)Reflects amounts available from unaffiliated third parties that are not consolidated by CFC.
(2)Facility fee determined by CFC’s senior unsecured credit ratings based on the pricing schedules put in place at the inception of the related agreement.
The revolving credit agreements do not contain a material adverse change clause or rating triggers that would limit the banks’ obligations to provide funding under the terms of the agreements; however, we must be in compliance with the covenants to draw down on the facilities. We have been and expect to continue to be in compliance with the covenants under our revolving credit agreements. As such, we could draw on these facilities to repay dealer or member commercial paper that cannot be rolled over. See “Debt Covenants and Financial Ratios” below for additional information, including the specific financial ratio requirements under our bank revolving line of credit agreements.
Guaranteed Underwriter Program Committed Facilities—Secured
Under the Guaranteed Underwriter Program of the USDA, we can borrow from the Federal Financing Bank and use the proceeds to make loans to electric cooperatives or to refinance existing indebtedness. As part of the program, we pay fees, based on outstanding borrowings, that support the USDA Rural Economic Development Loan and Grant program. The borrowings under this program are guaranteed by RUS.
On March 29, 2016, we closed on a $250 million committed loan facility (“Series K”) under the Guaranteed Underwriter Program, with financing provided by the Federal Financing Bank and guaranteed by RUS. Under the Series K facility, we are able to borrow any time before January 15, 2019, with each advance having a final maturity no longer than 20 years from the advance date. We borrowed $400 million under these facilities during fiscal year 2016. The amount available for funding under these facilities was $600 million as of May 31, 2016. Of this amount, $100 million is available for advance through October 15, 2016, $250 million is available for advance through October 15, 2017 and $250 million is available for advance through January 15, 2019.
Prior to March 29, 2016, we were required to place mortgage notes on deposit equal to at least 100% of our outstanding borrowings under the Guaranteed Underwriter Program. As discussed above, on March 29, 2016, we entered into an amended, restated and consolidated pledge agreement that requires we pledge all mortgage notes previously held on deposit pursuant to the Guaranteed Underwriter Program. See “Consolidated Balance Sheet Analysis—Debt—Collateral Pledged and on Deposit” and “Note 4—Loans and Commitments” for additional information on pledged collateral.
60
Farmer Mac Revolving Note Purchase Agreements—Secured
As indicated above in table 27, we have two revolving note purchase agreements with Farmer Mac, which together allow us to borrow up to $4,800 million from Farmer Mac. Under the terms of the revolving note purchase agreement with Farmer Mac dated March 24, 2011, as amended, we can borrow up to $4,500 million at any time through January 11, 2020, and such date shall automatically extend on each anniversary date of the closing for an additional year, unless prior to any such anniversary date, Farmer Mac provides us with a notice that the draw period will not be extended beyond the remaining term. This revolving credit facility allows us to borrow, repay and re-borrow funds at any time through maturity, or from time to time, as market conditions permit, provided that the outstanding principal amount at any time does not exceed the total available under the agreement. Each borrowing under the note purchase agreement is evidenced by a secured note setting forth the interest rate, maturity date and other related terms as we may negotiate with Farmer Mac at the time of each such borrowing. We may select a fixed rate or variable rate at the time of each advance with a maturity as determined in the applicable pricing agreement. We borrowed $430 million under this agreement during fiscal year 2016. We had outstanding secured notes payable of $2,303 million and $1,911 million as of May 31, 2016 and 2015, respectively, under the Farmer Mac revolving note purchase agreement of $4,500 million. The available borrowing amount totaled $2,197 million as of May 31, 2016.
On July 31, 2015, we entered into a new revolving note purchase agreement with Farmer Mac totaling $300 million. Under the terms of this agreement, we can borrow up to $300 million at any time through July 31, 2018. This agreement also allows us to borrow, repay and re-borrow funds at any time through maturity, or from time to time, provided that the outstanding principal amount at any time does not exceed the total available under the agreement. We did not borrow any amounts under this note purchase agreement during fiscal year 2016; thus, the available borrowing amount was $300 million as of May 31, 2016.
Under the Farmer Mac revolving note purchase agreements, we are required to pledge eligible distribution system or power supply system loans as collateral in an amount at least equal to the total principal amount of notes outstanding. See “Consolidated Balance Sheet Analysis—Debt—Collateral Pledged and On Deposit” and “Note 4—Loans and Commitments” for additional information on pledged collateral.
Long-Term and Subordinated Debt
Long-term and subordinated debt represents the most significant component of our funding. The issuance of long-term debt allows us to reduce our reliance on short-term borrowings and manage our refinancing and interest rate rate risk, due in part to the multi-year contractual maturity structure of long-term debt. In addition to private debt issuances, we also issue debt in the public capital markets. Under the SEC rules, we are classified as a “well-known seasoned issuer.” Pursuant to our shelf registration statements with the SEC, we are permitted to offer and issue the following debt securities:
• | an unlimited amount of collateral trust bonds until September 2016; |
• | an unlimited amount of senior and subordinated debt securities, including medium-term notes, member capital securities and subordinated deferrable debt, until November 2017; and |
• | daily liquidity fund notes for a total of $20,000 million—with a $3,000 million limit on the aggregate principal amount outstanding at any time—until March 2019. |
Although we register member capital securities and the daily liquidity fund notes with the SEC, these securities are not available for sale to the general public. Medium-term notes are available for sale to both the general public and members. In September 2016, we intend to file a new shelf registration statement for our collateral trust bonds prior to the expiration of the current registration statement.
As discussed above in “Consolidated Balance Sheet Analysis—Debt,” long-term and subordinated debt totaled $19,660 million and accounted for 87% of total debt outstanding as of May 31, 2016, compared with $18,146 million, or 85%, of total debt outstanding as of May 31, 2015. The increase in total debt outstanding, including long-term and subordinated debt, was primarily due to the issuance of debt to fund loan portfolio growth. Table 29 summarizes long-term and subordinated debt issuances and maturities (including repurchases and redemptions) during fiscal years 2016 and 2015.
61
Table 29: Issuances and Maturities of Long-Term and Subordinated Debt
Year Ended May 31, | ||||||||||||||||
2016 | 2015 | |||||||||||||||
(Dollars in thousands) | Issuances | Maturities | Issuances | Maturities | ||||||||||||
Long-term and subordinated debt activity: | ||||||||||||||||
Collateral trust bonds | $ | 1,450,000 | $ | 955,000 | $ | 1,200,000 | 405,000 | |||||||||
Subordinated deferrable debt | 350,000 | — | — | — | ||||||||||||
Medium-term notes sold to members | 322,634 | 263,972 | 278,114 | 171,804 | ||||||||||||
Medium-term notes sold to dealers | 335,680 | 417,298 | 906,780 | 385,345 | ||||||||||||
Total | $ | 2,458,314 | $ | 1,636,270 | $ | 2,384,894 | $ | 962,149 | ||||||||
We issued collateral trust bonds totaling $1,450 million, with an average coupon of 2.50% and maturities ranging between 2019 and 2025, during fiscal year 2016, compared with the issuance of collateral trust bonds totaling $1,200 million, with an average coupon of 2.43% and maturities ranging between 2019 and 2025, during fiscal year 2015. We redeemed collateral trust bonds totaling $300 million, with a coupon of 3.05%, during fiscal year 2016, compared with the redemption of collateral trust bonds totaling $400 million, with a coupon of 1.0%, during fiscal year 2015.
Credit Ratings
Our funding and liquidity, borrowing capacity, ability to access capital markets and other sources of funds and the cost
of these funds are partially dependent on CFC’s credit ratings. Rating agencies base their ratings on numerous factors, including liquidity, capital adequacy, industry position, member support, management, asset quality, quality of earnings and the probability of systemic support. Significant changes in these factors could result in different ratings. Table 30 displays our credit ratings as of May 31, 2016.
Table 30: Credit Ratings
May 31, 2016 | ||||||
Moody’s | S&P | Fitch | ||||
Long-term issuer credit rating | — | A | A | |||
Senior secured debt(1) | A1 | A | A+ | |||
Senior unsecured debt(2) | A2 | A | A | |||
Commercial paper | P-1 | A-1 | F1 | |||
Outlook | Stable | Stable | Stable | |||
___________________________
(1)Applies to our collateral trust bonds.
(2)Applies to our medium-term notes.
On April 12, 2016, S&P announced that it had updated its assessment of our capital adequacy to eliminate the impact from unrealized gains and losses associated with interest rate hedges from total adjusted capital. With this change, S&P revised its outlook for CFC to stable from negative. Our credit ratings and outlook from Moody’s, S&P and Fitch as of the filing date of this Report were unchanged from May 31, 2016.
In order to access the commercial paper markets at attractive rates, we believe we need to maintain our current commercial paper credit ratings of P-1 by Moody’s, A-1 by S&P and F1 by Fitch. In addition, the notes payable to the Federal Financing Bank under the Guaranteed Underwriter Program of the USDA contain a provision that if during any portion of the fiscal year, our senior secured credit ratings do not have at least two of the following ratings: (i) A3 or higher from Moody’s, (ii) A- or higher from S&P, (iii) A- or higher from Fitch or (iv) an equivalent rating from a successor rating agency to any of the above rating agencies, we may not make cash patronage capital distributions in excess of 5% of total patronage capital. See “Credit Risk—Counterparty Credit Risk—Credit Risk-Related Contingent Features” above for information on credit rating provisions related to our derivative contracts.
62
Projected Near-Term Sources and Uses of Liquidity
As discussed above, our primary sources of liquidity include cash flows from operations, our short-term funding portfolio, our liquidity reserve and the issuance of long-term and subordinated debt, as well as loan principal and interest payments. Our primary uses of liquidity include loan advances to members, principal and interest payments on borrowings, periodic settlement payments related to derivative contracts, costs related to the disposition of foreclosed assets and operating expenses.
Table 31 below displays our projected sources and uses of cash, by quarter, over the next six quarters through the quarter ending November 30, 2017. In projecting our liquidity position, we assume that the amount of time deposit investments will remain consistent with current levels over the next six quarters. Our assumptions include the following: (i) the estimated issuance of long-term debt, including collateral trust bonds and private placement of term debt, is based on maintaining a matched funding position within our loan portfolio with our bank revolving lines of credit serving as a backup liquidity facility for commercial paper; (ii) long-term loan scheduled amortization payments represent the scheduled long-term loan payments for loans outstanding as of May 31, 2016, and our current estimate of long-term loan prepayments, which the amount and timing of are subject to change; (iii) other loan repayments and other loan advances primarily relate to line of credit repayments and advances; (iv) long-term debt maturities reflect scheduled maturities of outstanding term debt for the periods presented; (v) long-term loan advances reflect our current estimate of member demand for loans, which the amount and timing of are subject to change.
Table 31: Projected Sources and Uses of Liquidity (1)
Projected Sources of Liquidity | Projected Uses of Liquidity | |||||||||||||||||||||||||||||||||||||||
(Dollars in millions) | Commercial Paper Debt Issuance | Long-Term Debt Issuance | Long-Term Loan Scheduled Amortization Payments | Other Loan Repayments | Total Projected Sources of Liquidity | Long-Term Debt Maturities(3) | Long-Term Loan Advances | Other Loan Advances | Total Projected Uses of Liquidity | Cumulative Excess Sources/(Uses) of Liquidity (2) | ||||||||||||||||||||||||||||||
4Q16 | $ | 545 | ||||||||||||||||||||||||||||||||||||||
1Q17 | $ | 400 | $ | 250 | $ | 258 | $ | 70 | $ | 978 | $ | 240 | $ | 640 | $ | 43 | $ | 923 | 600 | |||||||||||||||||||||
2Q17 | 175 | 350 | 302 | — | 827 | 432 | 382 | 42 | 856 | 571 | ||||||||||||||||||||||||||||||
3Q17 | — | 730 | 335 | 17 | 1,082 | 458 | 597 | 27 | 1,082 | 571 | ||||||||||||||||||||||||||||||
4Q17 | — | 1,490 | 289 | — | 1,779 | 1,422 | 369 | — | 1,791 | 559 | ||||||||||||||||||||||||||||||
1Q18 | — | 150 | 307 | — | 457 | 56 | 400 | — | 456 | 560 | ||||||||||||||||||||||||||||||
2Q18 | — | 160 | 283 | — | 443 | 48 | 388 | — | 436 | 567 | ||||||||||||||||||||||||||||||
Totals | $ | 575 | $ | 3,130 | $ | 1,774 | $ | 87 | $ | 5,566 | $ | 2,656 | $ | 2,776 | $ | 112 | $ | 5,544 | ||||||||||||||||||||||
____________________________
(1)The dates presented represent the end of each quarterly period through the quarter ending November 30, 2017.
(2)Cumulative excess sources/(uses) of liquidity includes cash and time deposits.
(3)Long-term debt maturities also includes medium-term notes with an original maturity of one year or less.
As shown above in Table 31, we currently expect to make long-term loan advances to our members totaling approximately $1,988 million over the next 12 months. We project that long-term loan advances over the next six quarters of $2,776 million will exceed expected long-term loan repayments of $1,774 million by $1,002 million. The estimates presented above are developed at a particular point in time based on our expected future business growth and funding. Our actual results and future estimates may vary, perhaps significantly, from the current projections, as a result of changes in market conditions, management actions or other factors.
63
Contractual Obligations
Our contractual obligations affect our short- and long-term liquidity needs. Table 32 displays aggregated information about the listed categories of our contractual obligations as of May 31, 2016. The table provides information on the contractual maturity profile of our debt securities based on undiscounted future cash payment amounts due pursuant to these obligations, aggregated by type of contractual obligation. The table excludes certain obligations where the obligation is short-term, such as trade payables, or where the amount is not fixed and determinable, such as derivatives subject to valuation based on market factors. The timing of actual future payments may differ from those presented due to a number of factors, including discretionary debt redemptions.
Table 32: Contractual Obligations
(Dollars in millions) | 2017 | 2018 | 2019 | 2020 | 2021 | Thereafter | Total | |||||||||||||||||||||
Short-term debt | $ | 2,939 | $ | — | $ | — | $ | — | $ | — | $ | — | $ | 2,939 | ||||||||||||||
Long-term debt | 2,338 | 1,058 | 2,187 | 1,050 | 1,256 | 9,585 | 17,474 | |||||||||||||||||||||
Subordinated deferrable debt | — | — | — | — | — | 742 | 742 | |||||||||||||||||||||
Members’ subordinated certificates(1) | 8 | 11 | 11 | 11 | 50 | 1,252 | 1,343 | |||||||||||||||||||||
Total long-term and subordinated debt(2) | 2,346 | 1,069 | 2,198 | 1,061 | 1,306 | 11,579 | 19,559 | |||||||||||||||||||||
Contractual interest on long-term debt(3) | 667 | 611 | 507 | 437 | 406 | 4,927 | 7,555 | |||||||||||||||||||||
Total specified contractual obligations | $ | 5,952 | $ | 1,680 | $ | 2,705 | $ | 1,498 | $ | 1,712 | $ | 16,506 | $ | 30,053 | ||||||||||||||
____________________________
(1) Loan subordinated certificates totaling $101 million that amortize annually based on the outstanding balance of the related loan and $0.3 million in subscribed and unissued certificates for which a payment has been received are excluded because the future payment amounts are not fixed and readily determinable due to factors that impact the payment, such as loan conversions, loan repricing at the end of an interest rate term and prepayments. Amortization payments on these certificates totaled $16 million in fiscal year 2016 and represented 15% of amortizing loan subordinated certificates outstanding.
(2)The weighted-average interest rate for maturing total long-term and subordinated debt is 2.26%, 4.06%, 6.05%, 2.07%, 2.19% and 3.32% for fiscal years 2017, 2018, 2019, 2020, 2021 and thereafter, respectively.
(3) Represents the amounts of future interest payments on long-term debt securities outstanding as of May 31, 2016, based on the contractual terms of the securities. These amounts were determined based on certain assumptions, including that variable-rate debt continues to accrue interest at the contractual rates in effect as of May 31, 2016 until maturity and redeemable debt continues to accrue interest until its contractual maturity. The amounts of future interest payments on debt securities do not reflect certain factors that will change the amounts of interest payments on our debt securities after May 31, 2016, such as changes in interest rates, the early redemption of any debt securities or the issuance of new debt securities. Accordingly, the amounts presented in the table do not represent a forecast of our future cash interest payments or interest expense.
Debt Covenants and Financial Ratios
We were in compliance with all covenants and conditions under our bank revolving line of credit agreements and senior debt indentures as of and for the year ended May 31, 2016. As discussed above in “Introduction” and “Item 6. Selected Financial Data,” the financial covenants set forth in our bank revolving line of credit agreements and senior debt indentures are based on adjusted financial measures. These adjusted measures consist of adjusted TIER and adjusted senior debt-to-total equity ratio. We provide a reconciliation of these measurements to the most comparable GAAP measures and an explanation of the adjustments below in “Non-GAAP Financial Measures.”
Covenants—Bank Revolving Line of Credit Agreements
Table 33 presents the required and actual financial ratios under our bank revolving line of credit agreements as of or for the years ended May 31, 2016 and 2015. We were required to meet the minimum adjusted TIER ratio of 1.05 in fiscal year 2016 in order to retire patronage capital to our members.
64
Table 33: Financial Covenant Ratios Under Bank Revolving Line of Credit Agreements(1)
Actual | ||||||
May 31, | ||||||
Requirement | 2016 | 2015 | ||||
Minimum average adjusted TIER over the six most recent fiscal quarters | 1.025 | 1.26 | 1.28 | |||
Minimum adjusted TIER for the most recent fiscal year | 1.05 | 1.21 | 1.30 | |||
Maximum ratio of adjusted senior debt-to-total equity | 10.00 | 5.52 | 5.93 | |||
____________________________
(1) Adjusted TIER is calculated based on adjusted net income (loss) plus adjusted interest expense for the period, divided by adjusted interest expense for the period. In addition to the adjustments made to the leverage ratio set forth under “Non-GAAP Financial Measures,” adjusted senior debt excludes guarantees to member systems that have certain investment-grade credit ratings from Moody’s and S&P.
In addition to the financial covenants, our bank revolving line of credit agreements generally prohibit liens on loans to members except for the liens pursuant to the following:
• | under terms of our indentures, |
• | related to taxes that are being contested or are not delinquent, |
• | stemming from certain legal proceedings that are being contested in good faith, |
• | created by CFC to secure guarantees by CFC of indebtedness, the interest on which is excludable from the gross income of the recipient for federal income tax purposes, |
• | granted by any subsidiary to CFC and |
• | to secure other indebtedness of CFC of up to $10,000 million plus an amount equal to the incremental increase in CFC’s allocated Guaranteed Underwriter Program obligations, provided that the aggregate amount of such indebtedness may not exceed $12,500 million. The amount of our secured indebtedness under this provision for all three of our bank revolving line of credit agreements was $7,095 million as of May 31, 2016. |
The bank revolving line of credit agreements limit our total investment in foreclosed assets held by CAH to $275 million, without consent from each bank to exceed this limit. These investments totaled $103 million as of May 31, 2016, which was below this limit. The sale of CAH was completed on July 1, 2016; thus, there are no investments as of the filing date of this Report.
Covenants—Debt Indentures
Table 34 presents the required and actual financial ratios as defined under our 1994 collateral trust bonds indenture and our medium-term notes indentures in the U. S. markets as of May 31, 2016 and 2015.
Table 34: Financial Ratios Under Debt Indentures
Actual | ||||||
May 31, | ||||||
Requirement | 2016 | 2015 | ||||
Maximum ratio of adjusted senior debt to total equity (1) | 20.00 | 7.33 | 7.41 | |||
____________________________
(1) The ratio calculation includes the adjustments made to the leverage ratio under “Non-GAAP Financial Measures,” with the exception of the adjustments to exclude the noncash impact of derivative financial instruments and adjustments from total liabilities and total equity.
In addition to the above financial covenant requirement, we are required to pledge collateral pursuant to the provisions of certain of our borrowing agreements. We provide information on collateral pledged or on deposit above under “Consolidated Balance Sheet Analysis—Debt—Collateral Pledged and on Deposit.”
Debt Ratio Analysis
We provide the calculations for our primary debt ratios, which include the adjusted leverage and adjusted debt-to-equity
65
ratios, and a reconciliation to the most comparable GAAP measures (the leverage and debt-to-equity ratios) below in “Non-GAAP Financial Measures.” We also explain the basis for the adjustments made to derive the adjusted ratios.
Leverage Ratio
The leverage ratio was 29.81-to-1 as of May 31, 2016, compared with 25.14-to-1 as of May 31, 2015. The increase in the leverage ratio was due to an increase in total liabilities of $1,519 million, attributable to the increase in debt to fund our loan portfolio growth and an increase in our derivative liability resulting from changes in interest rates, and the decrease in total equity of $94 million, resulting from our net loss and retirement of patronage capital, partially offset by the decrease of $77 million in total guarantees.
The leverage ratio under the financial covenants of our bank revolving line of credit agreements is adjusted to exclude certain items, which are detailed below in Table 40. The adjusted leverage ratio was 6.08-to-1 as of as of May 31, 2016, compared with 6.58-to-1 as of May 31, 2015. The decrease in the adjusted leverage ratio was due to the increase of $412 million in adjusted equity, resulting from the issuance of $350 million of subordinated deferrable debt and the decrease of $77 million in total guarantees, partially offset by the increase of $1,053 million in adjusted liabilities, attributable to the increase in debt to fund our loan portfolio growth.
Debt-to-Equity Ratio
The debt-to-equity ratio was 28.69-to-1 as of May 31, 2016, compared with 24.06-to-1 as of May 31, 2015. The increase in the debt-to-equity ratio was attributable to the increase in total liabilities of $1,519 million and the decrease in total equity of $94 million.
The adjusted debt-to-equity ratio was 5.82-to-1 as of May 31, 2016, compared with 6.26-to-1 as of May 31, 2015. The decrease in the adjusted debt-to-equity ratio was attributable to the increase in adjusted equity of $412 million, partially offset by the increase in adjusted liabilities of $1,053 million.
MARKET RISK |
Interest rate risk represents our primary market risk. Interest rate risk is the risk arising from movements in interest
rates that may result in differences between the timing of contractual maturities, re-pricing characteristics and
prepayments on our assets and their related liabilities.
Interest Rate Risk
Our interest rate risk exposure is related to the funding of the fixed-rate loan portfolio. The Asset Liability Committee reviews a complete interest rate risk analysis, reviews proposed modifications, if any, to our interest rate risk management strategy and considers adopting strategy changes. Our Asset Liability Committee monitors interest rate risk and generally meets monthly to review and discuss information such as national economic forecasts, federal funds and interest rate forecasts, interest rate gap analysis, our liquidity position, loan and debt maturities, short-term and long-term funding needs, anticipated loan demands, credit concentration risk, derivative counterparty exposure and financial forecasts. The Asset Liability Committee also discusses the composition of fixed-rate versus variable-rate lending, new funding opportunities, changes to the nature and mix of assets and liabilities for structural mismatches, and interest rate swap transactions.
Matched Funding Practice
We provide our members with many options on loans with regard to interest rates, the term for which the selected interest rate is in effect and the ability to convert or prepay the loan. Long-term loans have maturities of up to 35 years. Borrowers may select fixed interest rates for periods of one year through the life of the loan. We do not match fund the majority of our fixed-rate loans with a specific debt issuance at the time the loans are advanced. To monitor and mitigate interest rate risk in the funding of fixed-rate loans, we perform a monthly interest rate gap analysis that provides a comparison between fixed-rate assets repricing or maturing by year and fixed-rate liabilities and members’ equity maturing by year, which is presented in Table 35 below. Fixed-rate liabilities include debt issued at a fixed rate as well as variable-rate debt swapped to a fixed rate using interest rate swaps. Fixed-rate debt swapped to a variable rate using interest rate swaps is excluded from the
66
analysis since it is used to match fund the variable-rate loan pool. With the exception of members’ subordinated certificates, which are generally issued with extended maturities, and commercial paper, our liabilities have average maturities that closely match the repricing terms (but not the maturities) of our fixed-interest-rate loans.
We fund the amount of fixed-rate assets that exceed fixed-rate debt and members’ equity with short-term debt, primarily commercial paper. We also have the option to enter into pay fixed-receive variable interest rate swaps. Our funding objective is to manage the matched funding of asset and liability repricing terms within a range of total assets (excluding derivative assets) deemed appropriate by the Asset Liability Committee based on the current environment and extended outlook for interest rates. Due to the flexibility we offer our borrowers, there is a possibility of significant changes in the composition of the fixed-rate loan portfolio, and the management of the interest rate gap is very fluid. We may use interest rate swaps to manage the interest rate gap based on our needs for fixed-rate or variable-rate funding as changes arise. We consider the interest rate risk on variable-rate loans to be minimal as the loans are eligible to be repriced at least monthly, which minimizes the variance to the cost of variable-rate debt used to fund the loans. Loans with variable interest rates accounted for 8% of our total loan portfolio as of May 31, 2016 and 2015.
Interest Rate Gap Analysis
Our interest rate gap analysis allows us to consider various scenarios in order to evaluate the impact on adjusted TIER of issuing certain amounts of debt with various maturities at a fixed rate. See “Non-GAAP Financial Measures” for further explanation and a reconciliation of the adjustments to TIER to derive adjusted TIER.
Table 35 shows the scheduled amortization and repricing of fixed-rate assets and liabilities outstanding as of May 31, 2016.
Table 35: Interest Rate Gap Analysis
(Dollars in millions) | Prior to 5/31/17 | Two Years 6/1/17 to 5/31/19 | Two Years 6/1/19 to 5/31/21 | Five Years 6/1/21 to 5/31/26 | 10 Years 6/1/26 to 5/31/36 | 6/1/36 and Thereafter | Total | |||||||||||||||||||||
Asset amortization and repricing | $ | 2,077 | $ | 3,588 | $ | 2,622 | $ | 4,952 | $ | 5,696 | $ | 2,456 | $ | 21,391 | ||||||||||||||
Liabilities and members’ equity: | ||||||||||||||||||||||||||||
Long-term debt | $ | 2,032 | $ | 4,014 | $ | 2,467 | $ | 4,601 | $ | 3,654 | $ | 1,043 | $ | 17,811 | ||||||||||||||
Subordinated certificates | 20 | 42 | 56 | 890 | 266 | 672 | 1,946 | |||||||||||||||||||||
Members’ equity | — | — | 26 | 89 | 331 | 742 | 1,188 | |||||||||||||||||||||
Total liabilities and members’ equity | $ | 2,052 | $ | 4,056 | $ | 2,549 | $ | 5,580 | $ | 4,251 | $ | 2,457 | $ | 20,945 | ||||||||||||||
Gap (2) | $ | 25 | $ | (468 | ) | $ | 73 | $ | (628 | ) | $ | 1,445 | $ | (1 | ) | $ | 446 | |||||||||||
Cumulative gap | 25 | (443 | ) | (370 | ) | (998 | ) | 447 | 446 | |||||||||||||||||||
Cumulative gap as a % of total assets | 0.10 | % | (1.83 | )% | (1.52 | )% | (4.11 | )% | 1.84 | % | 1.84 | % | ||||||||||||||||
Cumulative gap as a % of adjusted total assets (3) | 0.10 | (1.83 | ) | (1.53 | ) | (4.13 | ) | 1.85 | 1.84 | |||||||||||||||||||
____________________________
(1)Includes the portion of the allowance for loan losses and subordinated deferrable debt allocated to fund fixed-rate assets and excludes noncash adjustments from the accounting for derivative financial instruments.
(2)Calculated based on the amount of assets amortizing and repricing less total liabilities and members’ equity displayed in Table 35.
(3)Adjusted total assets represents total assets reported in our consolidated balance sheets less derivative assets.
We had $21,391 million of fixed-rate loans amortizing or repricing as of May 31, 2016. These assets were funded by $17,811 million of fixed-rate liabilities maturing during the next 30 years and $3,134 million of members’ equity and members’ subordinated certificates. A portion of members’ equity does not have a scheduled maturity. The difference, or gap, of $446 million reflects the amount of fixed-rate assets that are funded with short-term debt as of May 31, 2016. The gap of $446 million represented 1.84% of total assets and also 1.84% of adjusted total assets (total assets excluding derivative assets) as of May 31, 2016.
67
Our Asset Liability Committee provides oversight over maintaining our interest rate position within prescribed policy limits using approved strategies. Our primary strategies for managing our exposure to interest rate risk include the use of derivatives and limiting the amount of fixed-rate assets that can be funded by short-term debt to a specified percentage of adjusted total assets based on market conditions. Funding fixed-rate loans with short-term debt increases interest rate and liquidity risk, as the maturing debt would need to be replaced to fund the fixed-rate loans through their repricing or maturity date. We discuss how we manage our liquidity risk above under “Liquidity Risk.”
We maintain an unmatched position on our fixed-rate assets within a limited percentage of adjusted total assets. The limited unmatched position is intended to provide flexibility to ensure that we are able to match the current maturing portion of long-term fixed-rate loans based on maturity date and the opportunity in the current low interest rate environment to maximize the gross yield on our fixed-rate assets without taking what we would consider to be excessive risk.
Financial Instruments
Table 36 provides information about our financial instruments, other than derivatives, that are sensitive to changes in interest rates. We provide additional information on our use of derivatives and exposure in “Note 1—Summary of Significant Accounting Policies—Derivative Instruments” and “Note 10—Derivative Instruments and Hedging Activities.” All of our financial instruments as of May 31, 2016 were entered into or contracted for purposes other than trading. For debt obligations, the table presents principal cash flows and related average interest rates by expected maturity dates as of May 31, 2016.
Table 36: Financial Instruments
Principal Amortization and Maturities | ||||||||||||||||||||||||||||||||
Outstanding Balance | Fair Value | Remaining Years | ||||||||||||||||||||||||||||||
(Dollars in millions) | 2017 | 2018 | 2019 | 2020 | 2021 | |||||||||||||||||||||||||||
Instruments: | ||||||||||||||||||||||||||||||||
Assets: | ||||||||||||||||||||||||||||||||
Investments in time deposits | $ | 340 | $ | 340 | $ | 340 | $ | — | $ | — | $ | — | $ | — | $ | — | ||||||||||||||||
Investments in equity securities | $ | 88 | $ | 88 | $ | — | $ | — | $ | — | $ | — | $ | — | $ | 88 | ||||||||||||||||
Long-term fixed-rate loans (1) | $ | 21,391 | $ | 21,568 | $ | 1,139 | $ | 1,069 | $ | 1,049 | $ | 1,067 | $ | 1,062 | $ | 16,005 | ||||||||||||||||
Average rate | 4.69 | % | 4.25 | % | 4.38 | % | 4.44 | % | 4.52 | % | 4.56 | % | 4.78 | % | ||||||||||||||||||
Long-term variable-rate loans (2) | $ | 758 | $ | 758 | $ | 62 | $ | 51 | $ | 115 | $ | 56 | $ | 34 | $ | 440 | ||||||||||||||||
Average rate | 2.57 | % | — | — | — | — | — | — | ||||||||||||||||||||||||
Line of credit loans | $ | 1,005 | $ | 1,005 | $ | 1,005 | $ | — | $ | — | $ | — | $ | — | $ | — | ||||||||||||||||
Average rate | 2.23 | % | 2.23 | % | — | — | — | — | — | |||||||||||||||||||||||
Liabilities and equity: | ||||||||||||||||||||||||||||||||
Short-term debt (3) | $ | 2,939 | $ | 2,939 | $ | 2,939 | $ | — | $ | — | $ | — | $ | — | $ | — | ||||||||||||||||
Average rate | 0.51 | % | 0.51 | % | — | — | — | — | — | |||||||||||||||||||||||
Long-term debt | $ | 17,474 | $ | 18,577 | $ | 2,338 | $ | 1,058 | $ | 2,187 | $ | 1,050 | $ | 1,256 | $ | 9,585 | ||||||||||||||||
Average rate | 3.28 | % | 2.26 | % | 4.08 | % | 6.06 | % | 2.06 | % | 2.12 | % | 3.09 | % | ||||||||||||||||||
Subordinated deferrable debt | $ | 742 | $ | 751 | $ | — | $ | — | $ | — | $ | — | $ | — | $ | 742 | ||||||||||||||||
Average rate | 4.98 | % | — | % | — | — | — | — | 4.98 | % | ||||||||||||||||||||||
Membership subordinated certificates (4) | $ | 1,343 | $ | 1,343 | $ | 8 | $ | 11 | $ | 11 | $ | 11 | $ | 50 | $ | 1,252 | ||||||||||||||||
Average rate | 4.45 | % | 3.25 | % | 2.88 | % | 3.66 | % | 5.18 | % | 4.22 | % | 4.48 | % | ||||||||||||||||||
____________________________
(1) The principal amount of fixed-rate loans is the total of scheduled principal amortizations without consideration for loans that reprice. Includes $173 million of loans guaranteed by RUS and $14 million in TDR loans that were on accrual status as of May 31, 2016.
(2) Long-term variable-rate loans include $0.1 million of loans guaranteed by RUS and $4 million in TDR loans that were on nonaccrual status as of May 31, 2016.
(3) Short-term debt includes commercial paper, select notes, daily liquidity fund notes, bank bid notes and medium-term notes issued with an original maturity of one year or less.
68
(4) Carrying value and fair value exclude loan subordinated certificates totaling $101 million that amortize annually based on the outstanding balance of the related loan and $0.3 million in subscribed and unissued certificates for which a payment has been received. There are many items that affect the amortization of a loan, such as loan conversions, loan repricing at the end of an interest rate term and prepayments; therefore, an amortization schedule cannot be maintained for these certificates. Over the past fiscal year, annual amortization on these certificates was $16 million. In fiscal year 2016, amortization represented 15% of amortizing loan subordinated certificates outstanding.
Loan Repricing
Table 37 shows long-term fixed-rate loans outstanding as of May 31, 2016, which will be subject to interest rate repricing during the next five fiscal years and thereafter (due to principal repayments, amounts subject to interest rate repricing may be lower at the actual time of interest rate repricing).
Table 37: Loan Repricing
(Dollars in thousands) | Repricing Amount | Weighted-Average Interest Rate | |||||
Fiscal year: | |||||||
2017 | $ | 993,260 | 4.07 | % | |||
2018 | 982,940 | 4.40 | |||||
2019 | 701,533 | 4.71 | |||||
2020 | 473,980 | 4.84 | |||||
2021 | 371,754 | 4.60 | |||||
Thereafter | 1,741,242 | 5.11 | |||||
Total | $ | 5,264,709 | |||||
OPERATIONAL RISK |
Operational risk represents the risk of loss resulting from conducting our operations, including, but not limited to, the execution of unauthorized transactions by employees; errors relating to loan documentation, transaction processing and technology; the inability to perfect liens on collateral; breaches of internal control and information systems; and the risk of fraud by employees or persons outside the Company. This risk of loss also includes potential legal actions that could arise as a result of operational deficiencies, noncompliance with covenants in our revolving credit agreements and indentures, employee misconduct or adverse business decisions. In the event of a breakdown in the internal control system, improper access to or operation of systems or improper employee actions, we could incur financial loss. Operational/business risk may also include breaches of our technology and information systems resulting from unauthorized access to confidential information or from internal or external threats, such as cyberattacks.
Operational risk is inherent in all business activities. The management of such risk is important to the achievement of our objectives. We maintain business policies and procedures, employee training, an internal control framework and a comprehensive business continuity and disaster recovery plan that are intended to provide a sound operational environment. Our business policies and controls have been designed to manage operational risk at appropriate levels given our financial strength, the business environment and markets in which we operate, the nature of our businesses, and considering factors such as competition and regulation. Our Corporate Compliance group monitors compliance with established procedures that are designed to ensure adherence to generally accepted conduct, ethics and business practices defined in our corporate policies. We provide employee compliance training programs, such as for our “Code of Conduct” and regarding information protection, suspicious activity reporting and operational risk. Our Internal Audit group examines the design and operating effectiveness of our internal controls and operational and financial reporting systems on an ongoing basis.
Our business continuity and disaster recovery plan establishes the basic principles and framework necessary to ensure emergency response, resumption, restoration and permanent recovery of CFC’s operations and business activities during a business interruption event. This plan includes a duplication of our production information systems at an off-site facility coupled with an extensive business continuity and recovery process to leverage those remote systems. Each of our departments is required to develop, exercise, test and maintain business resumption plans for the recovery of business functions and processing resources to minimize disruption for our members and other parties with whom we do business.
69
We conduct disaster recovery exercises periodically that include both the information technology group and business areas. The business resumption plans are based on a risk assessment that considers potential losses due to unavailability of service versus the cost of resumption. These plans anticipate a variety of probable scenarios ranging from local to regional crises.
NON-GAAP FINANCIAL MEASURES |
In addition to financial measures determined in accordance with GAAP, management evaluates performance based on certain non-GAAP measures, which we refer to as “adjusted” measures. We discuss each of these non-GAAP measures and provide a reconciliation of our adjusted measures to the most comparable GAAP measures in this section. We believe our non-GAAP adjusted metrics, which are not a substitute for GAAP and may not be consistent with similarly titled non-GAAP measures used by other companies, provide meaningful information and are useful to investors because the financial covenants in our revolving credit agreements and debt indentures are based on these adjusted metrics and management uses these metrics to compare operating results across financial reporting periods, for internal budgeting and forecasting purposes, for compensation decisions and for short- and long-term strategic planning decisions.
Statements of Operations Non-GAAP Adjustments and Calculation of Adjusted TIER
Our primary performance measure is TIER. TIER is calculated by adding the interest expense to net income prior to the cumulative effect of change in accounting principle and dividing that total by the interest expense. TIER is a measure of our ability to cover interest expense requirements on our debt. We adjust the TIER calculation to add the derivative cash settlements to the interest expense and to remove the derivative forward value and foreign currency adjustments from total net income. Adding the cash settlements back to the interest expense also has a corresponding effect on our adjusted net interest income. We make these adjustments to our TIER calculation for covenant compliance on our revolving credit agreements.
We use derivatives to manage interest rate risk on our funding of the loan portfolio. The derivative cash settlements represent the amount that we receive from or pay to our counterparties based on the interest rate indexes in our derivatives that do not qualify for hedge accounting. We adjust the reported interest expense to include the derivative cash settlements. We use the adjusted cost of funding to set interest rates on loans to our members and believe that the interest expense adjusted to include derivative cash settlements represents our total cost of funding for the period. For computing compliance with our revolving credit agreement covenants, we are required to adjust our interest expense to include the derivative cash settlements. TIER calculated by adding the derivative cash settlements to the interest expense reflects management’s perspective on our operations and, therefore, we believe that it represents a useful financial measure for investors.
The derivative forward value and foreign currency adjustments do not represent our cash inflows or outflows during the current period and, therefore, do not affect our current ability to cover our debt service obligations. The derivative forward value included in the derivative gains (losses) line of the statement of operations represents a present value estimate of the future cash inflows or outflows that will be recognized as net cash settlements for all periods through the maturity of our derivatives that do not qualify for hedge accounting. We have not issued foreign-denominated debt since 2007, and as of May 31, 2016 and 2015, there were no foreign currency derivative instruments outstanding.
For operational management and decision-making purposes, we subtract the derivative forward value and foreign currency adjustments from our net income when calculating TIER and for other net income presentation purposes. The covenants in our revolving credit agreements also exclude the effects of derivative forward value and foreign currency adjustments, if any. In addition, since the derivative forward value and foreign currency adjustments do not represent current period cash flows, we do not allocate such funds to our members and, therefore, exclude the derivative forward value and foreign currency adjustments from net income in calculating the amount of net income to be allocated to our members. TIER calculated by excluding the derivative forward value and foreign currency adjustments from net income reflects management’s perspective on our operations and, therefore, we believe that it represents a useful financial measure for investors.
Our total equity includes the noncash impact of changes in derivative forward values and foreign currency adjustments that are recorded in net income. In addition, the accumulated other comprehensive income component of total equity includes the impact of changes in the fair value of derivatives designated as cash flow hedges as well as the remaining transition adjustment recorded when we adopted the accounting guidance requiring that all derivatives be recorded on the balance
sheet at fair value. In evaluating our leverage and debt-to-equity ratios discussed further below, we make adjustments to equity similar to the adjustments made in calculating TIER. We exclude from total equity the cumulative impact of changes in derivative forward values and foreign currency adjustments and amounts included in accumulated other comprehensive income related to derivatives designated for cash flow hedge accounting and the remaining derivative transition adjustment to derive non-GAAP adjusted equity.
Table 38 provides a reconciliation of adjusted interest expense, adjusted net interest income and adjusted net income to the comparable GAAP measures. The adjusted amounts are used in the calculation of our adjusted net interest yield and adjusted TIER for fiscal years 2016, 2015, 2014, 2013 and 2012.
Table 38: Adjusted Financial Measures—Income Statement
Year Ended May 31, | ||||||||||||||||||||
(Dollars in thousands) | 2016 | 2015 | 2014 | 2013 | 2012 | |||||||||||||||
Interest expense | $ | (681,850 | ) | $ | (635,684 | ) | $ | (654,655 | ) | $ | (692,025 | ) | $ | (761,778 | ) | |||||
Plus: Derivative cash settlements | (88,758 | ) | (82,906 | ) | (73,962 | ) | (56,461 | ) | (12,846 | ) | ||||||||||
Adjusted interest expense | $ | (770,608 | ) | $ | (718,590 | ) | $ | (728,617 | ) | $ | (748,486 | ) | $ | (774,624 | ) | |||||
Net interest income | $ | 330,786 | $ | 317,292 | $ | 302,885 | $ | 263,728 | $ | 199,183 | ||||||||||
Less: Derivative cash settlements | (88,758 | ) | (82,906 | ) | (73,962 | ) | (56,461 | ) | (12,846 | ) | ||||||||||
Adjusted net interest income | $ | 242,028 | $ | 234,386 | $ | 228,923 | $ | 207,267 | $ | 186,337 | ||||||||||
Net income | $ | (51,516 | ) | $ | (18,927 | ) | $ | 192,926 | $ | 358,087 | $ | (148,797 | ) | |||||||
Less: Derivative forward value | 221,083 | 114,093 | (39,541 | ) | (141,304 | ) | 223,774 | |||||||||||||
Adjusted net income | $ | 169,567 | $ | 95,166 | $ | 153,385 | $ | 216,783 | $ | 74,977 | ||||||||||
We consider the cost of derivatives to be an inherent cost of funding and hedging our loan portfolio and, therefore, economically similar to the interest expense that we recognize on debt issued for funding. We therefore include derivative cash settlements in our adjusted interest expense and exclude the unrealized forward value of derivatives from our adjusted net income.
TIER Calculation
Table 39 presents our TIER and adjusted TIER for the years ended May 2016, 2015, 2014, 2013 and 2012.
Table 39: TIER and Adjusted TIER
Year Ended May 31, | |||||||||||||||
2016 | 2015 | 2014 | 2013 | 2012 | |||||||||||
TIER (1) | 0.92 | 0.97 | 1.29 | 1.52 | 0.80 | ||||||||||
Adjusted TIER (2) | 1.22 | 1.13 | 1.21 | 1.29 | 1.10 | ||||||||||
____________________________
(1) TIER is calculated based on net income plus interest expense for the period divided by interest expense for the period.
(2) Adjusted TIER is calculated based on adjusted net income plus adjusted interest expense for the period divided by adjusted interest expense for the period.
Adjustments to the Calculation of Leverage and Debt-to-Equity Ratios
Our adjusted leverage and debt-to-equity ratios reflect how management evaluates performance. We therefore believe that these adjusted measures, in combination with the comparable GAAP measures, are useful to investors in evaluating performance. We adjust the comparable GAAP measures to:
71
• | subtract debt used to fund loans that are guaranteed by RUS from total liabilities; |
• | subtract from total liabilities, and add to total equity, debt with equity characteristics issued to our members and in the capital markets; and |
• | exclude the noncash impact of derivative financial instruments and foreign currency adjustments from total liabilities and total equity. |
For computing compliance with our revolving credit agreement covenants, we are required to make these adjustments to our leverage ratio calculation. The revolving credit agreements prohibit us from incurring senior debt in an amount in excess of 10 times the sum of equity, members’ subordinated certificates and subordinated deferrable debt, as defined by the agreements. In addition to the adjustments we make to calculate the adjusted leverage ratio, guarantees to our member systems that have an investment-grade rating from Moody’s and S&P are excluded from the calculation of the leverage ratio under the terms of the revolving credit agreements.
We are an eligible lender under the RUS loan guarantee program. Loans issued under this program carry the U.S. government’s guarantee of all interest and principal payments. We have little or no risk associated with the collection of principal and interest payments on these loans. Therefore, we believe there is little or no risk related to the repayment of the liabilities used to fund RUS-guaranteed loans and we subtract such liabilities from total liabilities to calculate our leverage and debt-to-equity ratios. For computing compliance with our revolving credit agreement covenants, we are required to adjust our leverage ratio by subtracting liabilities used to fund RUS-guaranteed loans from total liabilities.
Members may be required to purchase subordinated certificates as a condition of membership and as a condition to obtaining a loan or guarantee. The subordinated certificates are accounted for as debt under GAAP. The subordinated certificates have long-dated maturities and pay no interest or pay interest that is below market, and under certain conditions we are prohibited from making interest payments to members on the subordinated certificates. For computing compliance with our revolving credit agreement covenants, we are required to adjust our leverage ratio by subtracting members’ subordinated certificates from total liabilities and adding members’ subordinated certificates to total equity.
We also sell subordinated deferrable debt in the capital markets with maturities of up to 30 years and the option to defer interest payments. The characteristics of subordination, deferrable interest and long-dated maturity are all equity characteristics. For computing compliance with our revolving credit agreement covenants, we are required to adjust our leverage ratio by subtracting subordinated deferrable debt from total liabilities and adding it to total equity.
We record derivative instruments at fair value on our consolidated balance sheets. For computing compliance with our revolving credit agreement covenants, we are required to adjust our leverage ratio by excluding the noncash impact of our derivative accounting from liabilities and equity. For computing compliance with our revolving credit agreement covenants, we are also required to adjust our leverage ratio by excluding the impact of foreign currency valuation adjustments from liabilities and equity. The leverage and debt-to-equity ratios adjusted to exclude the effect of foreign currency translation reflect management’s perspective on our operations and, therefore, we believe these are useful financial measures for investors.
Table 40 provides a reconciliation between the liabilities and equity used to calculate the leverage and debt-to-equity ratios and the adjusted leverage and adjusted debt-to-equity ratios as of May 31, 2016, 2015, 2014, 2013 and 2012. As indicated in the table below, subordinated debt is treated in the same manner as equity in calculating our adjusted leverage and adjusted-debt-to-equity ratios pursuant to the financial covenants under our revolving bank line of credit agreements.
72
Table 40: Adjusted Financial Measures—Balance Sheet
May 31, | ||||||||||||||||||||
(Dollars in thousands) | 2016 | 2015 | 2014 | 2013 | 2012 | |||||||||||||||
Total liabilities | $ | 23,452,822 | $ | 21,934,273 | $ | 21,220,311 | $ | 21,221,441 | $ | 19,417,065 | ||||||||||
Less: | ||||||||||||||||||||
Derivative liabilities | (594,820 | ) | (408,382 | ) | (388,208 | ) | (475,278 | ) | (654,125 | ) | ||||||||||
Debt used to fund loans guaranteed by RUS | (173,514 | ) | (179,241 | ) | (201,863 | ) | (210,815 | ) | (219,084 | ) | ||||||||||
Subordinated deferrable debt | (742,212 | ) | (395,699 | ) | (395,627 | ) | (395,729 | ) | (180,990 | ) | ||||||||||
Subordinated certificates | (1,443,810 | ) | (1,505,420 | ) | (1,612,191 | ) | (1,765,776 | ) | (1,739,454 | ) | ||||||||||
Adjusted total liabilities | $ | 20,498,466 | $ | 19,445,531 | $ | 18,622,422 | $ | 18,373,843 | $ | 16,623,412 | ||||||||||
Total equity | $ | 817,378 | $ | 911,786 | $ | 970,374 | $ | 811,261 | $ | 490,755 | ||||||||||
Less: | ||||||||||||||||||||
Prior year cumulative derivative forward value adjustments | 299,274 | 185,181 | 224,722 | 366,026 | 142,252 | |||||||||||||||
Year-to-date derivative forward value (gains) losses, net | 221,083 | 114,093 | (39,541 | ) | (141,304 | ) | 223,774 | |||||||||||||
Accumulated other comprehensive income (1) | (4,487 | ) | (5,371 | ) | (6,320 | ) | (7,287 | ) | (8,270 | ) | ||||||||||
Plus: | ||||||||||||||||||||
Subordinated certificates | 1,443,810 | 1,505,420 | 1,612,191 | 1,765,776 | 1,739,454 | |||||||||||||||
Subordinated deferrable debt | 742,212 | 395,699 | 395,627 | 395,729 | 180,990 | |||||||||||||||
Adjusted total equity | $ | 3,519,270 | $ | 3,106,808 | $ | 3,157,053 | $ | 3,190,201 | $ | 2,768,955 | ||||||||||
Guarantees (2) | $ | 909,208 | $ | 986,500 | $ | 1,064,822 | $ | 1,112,771 | $ | 1,249,330 | ||||||||||
____________________________
(1) Represents the accumulated other comprehensive income related to derivatives. Excludes $7 million and $4 million, respectively, of accumulated other comprehensive income as of May 31, 2016 and 2015, $0.4 million of accumulated other comprehensive loss as of May 31, 2014, and $1 million of accumulated other comprehensive income as of May 31, 2013 and 2012, related to the unrecognized gains on our investments. It also excludes $10 million, $4 million and $2 million of accumulated other comprehensive loss related to foreclosed assets as of May 31, 2016, 2015 and 2014, respectively, and $1 million of accumulated other comprehensive loss related to a defined benefit pension plan as of May 31, 2016 and 2015.
(2) Guarantees are used in the calculation of leverage and adjusted leverage ratios below.
Table 41 displays the calculations of our leverage and debt-to-equity ratios and our adjusted leverage and debt-to-equity ratios as of the years ended May 31, 2016, 2015, 2014, 2013 and 2012.
Table 41: Leverage and Debt-to-Equity Ratios
May 31, | |||||||||||||||
2016 | 2015 | 2014 | 2013 | 2012 | |||||||||||
Leverage ratio (1) | 29.81 | 25.14 | 22.97 | 27.53 | 42.11 | ||||||||||
Adjusted leverage ratio (2) | 6.08 | 6.58 | 6.24 | 6.11 | 6.45 | ||||||||||
Debt-to-equity ratio (3) | 28.69 | 24.06 | 21.87 | 26.16 | 39.57 | ||||||||||
Adjusted debt-to-equity ratio (4) | 5.82 | 6.26 | 5.90 | 5.76 | 6.00 | ||||||||||
____________________________
(1) Calculated based on total liabilities and guarantees as of the end of the period divided by total equity as of the end of the period.
(2) Calculated based on adjusted total liabilities and guarantees as of the end of the period divided by adjusted total equity as of the end of the period. See Table 40 above for the adjustments to reconcile total liabilities and guarantees and total equity to adjusted total liabilities and guarantees and adjusted total equity.
(3) Calculated based on total liabilities as of the end of the period divided by total equity as of the end of the period.
(4) Calculated based on adjusted total liabilities at period end divided by adjusted total equity at period end, such calculation is presented in Table 40 above.
73
In calculating the required financial covenants in our revolving credit agreements, we adjust net income, debt and total equity to exclude unrealized amounts related to the accounting for derivatives and foreign currency translation. Below we provide additional information on the calculations to derive adjusted TIER and the adjusted debt-to-total equity ratio pursuant to the required financial covenants in our revolving credit agreements.
• | Adjusted TIER, as defined in our revolving credit agreements, is calculated based on (i) interest expense, adjusted to include (ii) derivative cash settlements, plus (iii) net income prior to the cumulative effect of change in accounting principle, divided by (iv) interest expense plus derivative cash settlements. |
• | The adjusted debt-to-total equity ratio is calculated based on (i) senior debt, adjusted to exclude (ii) RUS-guaranteed loans, subordinated deferrable debt and members’ subordinated certificates divided by (iii) total equity, adjusted to include (iv) subordinated deferrable debt and members’ subordinated certificates. Senior debt includes guarantees; however, it excludes: |
◦ | guarantees for members where the long-term unsecured debt of the member is rated at least BBB+ by S&P or Baa1 by Moody’s; and |
◦ | the payment of principal and interest by the member on the guaranteed indebtedness if covered by insurance or reinsurance provided by an insurer having an insurance financial strength rating of AAA by S&P or Aaa by Moody’s. |
• | Results of operations related to CAH, including impairment and other comprehensive income amounts, are excluded in calculating both adjusted TIER and the adjusted senior debt-to-total equity ratio. |
74
Item 7A. | Quantitative and Qualitative Disclosures About Market Risk |
For quantitative and qualitative disclosures about market risk, see “Item 7. MD&A—Market Risk” and “Note 10—Derivative Instruments and Hedging Activities.”
Item 8. | Financial Statements and Supplementary Data |
Page | |||
75
REPORT OF INDEPENDENT REGISTERED PUBLIC ACCOUNTING FIRM
To the Board of Directors and Members of
National Rural Utilities Cooperative Finance Corporation
Dulles, Virginia
We have audited the accompanying consolidated balance sheets of National Rural Utilities Cooperative Finance Corporation and subsidiaries (the Company) as of May 31, 2016 and 2015, and the related consolidated statements of operations, comprehensive income, changes in equity, and cash flows for each of the years in the three-year period ended May 31, 2016. These consolidated financial statements are the responsibility of the Company’s management. Our responsibility is to express an opinion on these consolidated financial statements based on our audits.
We conducted our audits in accordance with the standards of the Public Company Accounting Oversight Board (United States). Those standards require that we plan and perform the audit to obtain reasonable assurance about whether the financial statements are free of material misstatement. An audit includes examining, on a test basis, evidence supporting the amounts and disclosures in the financial statements. An audit also includes assessing the accounting principles used and significant estimates made by management, as well as evaluating the overall financial statement presentation. We believe that our audits provide a reasonable basis for our opinion.
In our opinion, the consolidated financial statements referred to above present fairly, in all material respects, the financial position of National Rural Utilities Cooperative Finance Corporation and subsidiaries as of May 31, 2016 and 2015, and the results of their operations and their cash flows for each of the years in the three-year period ended May 31, 2016, in conformity with U.S. generally accepted accounting principles.
/s/ KPMG LLP
McLean, Virginia
August 25, 2016
76
NATIONAL RURAL UTILITIES COOPERATIVE FINANCE CORPORATION
CONSOLIDATED STATEMENTS OF OPERATIONS
Year Ended May 31, | ||||||||||||
(Dollars in thousands) | 2016 | 2015 | 2014 | |||||||||
Interest income | $ | 1,012,636 | $ | 952,976 | $ | 957,540 | ||||||
Interest expense | (681,850 | ) | (635,684 | ) | (654,655 | ) | ||||||
Net interest income | 330,786 | 317,292 | 302,885 | |||||||||
Benefit (provision) for loan losses | 646 | 21,954 | (3,498 | ) | ||||||||
Net interest income after provision for loan losses | 331,432 | 339,246 | 299,387 | |||||||||
Non-interest income: | ||||||||||||
Fee and other income | 21,785 | 36,783 | 17,762 | |||||||||
Derivative losses | (309,841 | ) | (196,999 | ) | (34,421 | ) | ||||||
Results of operations of foreclosed assets | (6,899 | ) | (120,148 | ) | (13,494 | ) | ||||||
Total non-interest income | (294,955 | ) | (280,364 | ) | (30,153 | ) | ||||||
Non-interest expense: | ||||||||||||
Salaries and employee benefits | (44,590 | ) | (43,845 | ) | (41,176 | ) | ||||||
Other general and administrative expenses | (41,753 | ) | (32,685 | ) | (31,390 | ) | ||||||
Losses on early extinguishment of debt | (333 | ) | (703 | ) | (1,452 | ) | ||||||
Other | (1,260 | ) | (167 | ) | (286 | ) | ||||||
Total non-interest expense | (87,936 | ) | (77,400 | ) | (74,304 | ) | ||||||
Income (loss) before income taxes | (51,459 | ) | (18,518 | ) | 194,930 | |||||||
Income tax expense | (57 | ) | (409 | ) | (2,004 | ) | ||||||
Net income (loss) | (51,516 | ) | (18,927 | ) | 192,926 | |||||||
Less: Net (income) loss attributable to noncontrolling interests | 1,863 | (105 | ) | (2,859 | ) | |||||||
Net income (loss) attributable to CFC | $ | (49,653 | ) | $ | (19,032 | ) | $ | 190,067 | ||||
See accompanying notes to consolidated financial statements. | ||||||||||||
77
NATIONAL RURAL UTILITIES COOPERATIVE FINANCE CORPORATION
CONSOLIDATED STATEMENTS OF COMPREHENSIVE INCOME
Year Ended May 31, | ||||||||||||
(Dollars in thousands) | 2016 | 2015 | 2014 | |||||||||
Net income (loss) | $ | (51,516 | ) | $ | (18,927 | ) | $ | 192,926 | ||||
Other comprehensive income (loss): | ||||||||||||
Unrealized gains (losses) on available-for-sale investment securities | 3,468 | 4,295 | (1,455 | ) | ||||||||
Unrealized losses on foreclosed assets | (5,575 | ) | (1,938 | ) | (2,310 | ) | ||||||
Reclassification of derivative gains to net income | (888 | ) | (959 | ) | (983 | ) | ||||||
Defined benefit plan adjustments | (31 | ) | (977 | ) | — | |||||||
Other comprehensive income (loss) | (3,026 | ) | 421 | (4,748 | ) | |||||||
Total comprehensive income (loss) | (54,542 | ) | (18,506 | ) | 188,178 | |||||||
Less: Total comprehensive (income) loss attributable to noncontrolling interest | 1,867 | (95 | ) | (2,843 | ) | |||||||
Total comprehensive income (loss) attributable to CFC | $ | (52,675 | ) | $ | (18,601 | ) | $ | 185,335 | ||||
See accompanying notes to consolidated financial statements. | ||||||||||||
78
NATIONAL RURAL UTILITIES COOPERATIVE FINANCE CORPORATION
CONSOLIDATED BALANCE SHEETS
May 31, | ||||||||
(Dollars in thousands) | 2016 | 2015 | ||||||
Assets: | ||||||||
Cash and cash equivalents | $ | 204,540 | $ | 248,836 | ||||
Restricted cash | 4,628 | 485 | ||||||
Time deposits | 340,000 | 485,000 | ||||||
Investment securities available for sale, at fair value | 87,940 | 84,472 | ||||||
Loans to members | 23,162,696 | 21,469,017 | ||||||
Less: Allowance for loan losses | (33,258 | ) | (33,690 | ) | ||||
Loans to members, net | 23,129,438 | 21,435,327 | ||||||
Accrued interest receivable | 113,272 | 107,047 | ||||||
Other receivables | 51,478 | 90,781 | ||||||
Fixed assets, net | 112,563 | 110,540 | ||||||
Debt service reserve funds | 17,151 | 25,602 | ||||||
Foreclosed assets, net | 102,967 | 116,507 | ||||||
Derivative assets | 80,095 | 115,276 | ||||||
Other assets | 26,128 | 26,186 | ||||||
Total assets | $ | 24,270,200 | $ | 22,846,059 | ||||
Liabilities: | ||||||||
Accrued interest payable | $ | 132,996 | $ | 123,697 | ||||
Debt outstanding: | ||||||||
Short-term debt | 2,938,848 | 3,127,754 | ||||||
Long-term debt | 17,473,603 | 16,244,794 | ||||||
Subordinated deferrable debt | 742,212 | 395,699 | ||||||
Members’ subordinated certificates: | ||||||||
Membership subordinated certificates | 630,063 | 645,035 | ||||||
Loan and guarantee subordinated certificates | 593,701 | 640,889 | ||||||
Member capital securities | 220,046 | 219,496 | ||||||
Total members’ subordinated certificates | 1,443,810 | 1,505,420 | ||||||
Total debt outstanding | 22,598,473 | 21,273,667 | ||||||
Deferred income | 78,651 | 75,579 | ||||||
Derivative liabilities | 594,820 | 408,382 | ||||||
Other liabilities | 47,882 | 52,948 | ||||||
Total liabilities | 23,452,822 | 21,934,273 | ||||||
Commitments and contingencies | ||||||||
Equity: | ||||||||
CFC equity: | ||||||||
Retained equity | 790,234 | 880,242 | ||||||
Accumulated other comprehensive income | 1,058 | 4,080 | ||||||
Total CFC equity | 791,292 | 884,322 | ||||||
Noncontrolling interests | 26,086 | 27,464 | ||||||
Total equity | 817,378 | 911,786 | ||||||
Total liabilities and equity | $ | 24,270,200 | $ | 22,846,059 | ||||
See accompanying notes to consolidated financial statements. | ||||||||
79
NATIONAL RURAL UTILITIES COOPERATIVE FINANCE CORPORATION
CONSOLIDATED STATEMENTS OF CHANGES IN EQUITY
(Dollars in thousands) | Membership Fees and Educational Fund | Patronage Capital Allocated | Members’ Capital Reserve | Unallocated Net Income (Loss) | CFC Retained Equity | Accumulated Other Comprehensive Income | Total CFC Equity | Non-controlling Interests | Total Equity | |||||||||||||||||||||||||||
Balance as of May 31, 2013 | $ | 2,505 | $ | 591,581 | $ | 410,259 | $ | (213,255 | ) | $ | 791,090 | $ | 8,381 | $ | 799,471 | $ | 11,790 | $ | 811,261 | |||||||||||||||||
Net income | 950 | 79,324 | 75,188 | 34,605 | 190,067 | — | 190,067 | 2,859 | 192,926 | |||||||||||||||||||||||||||
Other comprehensive loss | — | — | — | — | — | (4,732 | ) | (4,732 | ) | (16 | ) | (4,748 | ) | |||||||||||||||||||||||
Patronage capital retirement | — | (40,565 | ) | — | — | (40,565 | ) | — | (40,565 | ) | (400 | ) | (40,965 | ) | ||||||||||||||||||||||
Other | (704 | ) | — | — | — | (704 | ) | — | (704 | ) | 12,604 | 11,900 | ||||||||||||||||||||||||
Balance as of May 31, 2014 | $ | 2,751 | $ | 630,340 | $ | 485,447 | $ | (178,650 | ) | $ | 939,888 | $ | 3,649 | $ | 943,537 | $ | 26,837 | $ | 970,374 | |||||||||||||||||
Net income | 927 | 78,420 | 16,283 | (114,662 | ) | (19,032 | ) | — | (19,032 | ) | 105 | (18,927 | ) | |||||||||||||||||||||||
Other comprehensive income | — | — | — | — | — | 431 | 431 | (10 | ) | 421 | ||||||||||||||||||||||||||
Patronage capital retirement | — | (39,779 | ) | — | — | (39,779 | ) | — | (39,779 | ) | (362 | ) | (40,141 | ) | ||||||||||||||||||||||
Other | (935 | ) | (1 | ) | 1 | 100 | (835 | ) | — | (835 | ) | 894 | 59 | |||||||||||||||||||||||
Balance as of May 31, 2015 | $ | 2,743 | $ | 668,980 | $ | 501,731 | $ | (293,212 | ) | $ | 880,242 | $ | 4,080 | $ | 884,322 | $ | 27,464 | $ | 911,786 | |||||||||||||||||
Net loss | 1,000 | 84,257 | 85,917 | (220,827 | ) | (49,653 | ) | — | (49,653 | ) | (1,863 | ) | (51,516 | ) | ||||||||||||||||||||||
Other comprehensive income | — | — | — | — | — | (3,022 | ) | (3,022 | ) | (4 | ) | (3,026 | ) | |||||||||||||||||||||||
Patronage capital retirement | — | (39,384 | ) | — | — | (39,384 | ) | — | (39,384 | ) | — | (39,384 | ) | |||||||||||||||||||||||
Other | (971 | ) | — | (429 | ) | 429 | (971 | ) | — | (971 | ) | 489 | (482 | ) | ||||||||||||||||||||||
Balance as of May 31, 2016 | $ | 2,772 | $ | 713,853 | $ | 587,219 | $ | (513,610 | ) | $ | 790,234 | $ | 1,058 | $ | 791,292 | $ | 26,086 | $ | 817,378 | |||||||||||||||||
See accompanying notes to consolidated financial statements. | ||||||||||||||||||||||||||||||||||||
80
NATIONAL RURAL UTILITIES COOPERATIVE FINANCE CORPORATION
CONSOLIDATED STATEMENTS OF CASH FLOWS
Year Ended May 31, | ||||||||||||
(Dollars in thousands) | 2016 | 2015 | 2014 | |||||||||
Cash flows from operating activities: | ||||||||||||
Net income (loss) | $ | (51,516 | ) | $ | (18,927 | ) | $ | 192,926 | ||||
Adjustments to reconcile net income to net cash provided by operating activities: | ||||||||||||
Amortization of deferred income | (18,751 | ) | (11,582 | ) | (10,137 | ) | ||||||
Amortization of debt issuance costs and deferred charges | 8,478 | 7,351 | 7,367 | |||||||||
Amortization of discount on long-term debt | 8,693 | 7,939 | 5,690 | |||||||||
Amortization of issuance costs for revolving bank lines of credit | 5,535 | 5,238 | 2,827 | |||||||||
Depreciation and amortization | 7,327 | 6,497 | 5,646 | |||||||||
(Recovery) provision for loan losses | (646 | ) | (21,954 | ) | 3,498 | |||||||
Results of operations of foreclosed assets | 6,899 | 120,148 | 13,494 | |||||||||
Derivative forward value | 221,083 | 114,093 | (39,541 | ) | ||||||||
Changes in operating assets and liabilities: | ||||||||||||
Accrued interest and other receivables | 15,339 | (3,622 | ) | (25,736 | ) | |||||||
Accrued interest payable | 9,299 | 5,316 | (26,564 | ) | ||||||||
Deferred income | 21,822 | 9,122 | 62,460 | |||||||||
Other | (6,004 | ) | (641 | ) | (1,945 | ) | ||||||
Net cash provided by operating activities | 227,558 | 218,978 | 189,985 | |||||||||
Cash flows from investing activities: | ||||||||||||
Advances on loans | (8,484,794 | ) | (8,333,180 | ) | (7,795,237 | ) | ||||||
Principal collections on loans | 6,791,710 | 7,339,378 | 7,623,829 | |||||||||
Net investment in fixed assets | (9,806 | ) | (9,940 | ) | (8,229 | ) | ||||||
Proceeds from foreclosed assets | 5,414 | 16,709 | 13,667 | |||||||||
Investments in foreclosed assets | (4,349 | ) | (9,651 | ) | (13,650 | ) | ||||||
Net proceeds from sale of time deposits | 145,000 | 65,000 | 150,000 | |||||||||
Investments in securities available for sale | — | (25,000 | ) | (25,000 | ) | |||||||
Change in restricted cash | (4,143 | ) | 35 | 7,176 | ||||||||
Net cash used in investing activities | (1,560,968 | ) | (956,649 | ) | (47,444 | ) | ||||||
Cash flows from financing activities: | ||||||||||||
(Repayments of) proceeds from issuances of short-term debt, net | (154,072 | ) | (1,042,483 | ) | (122,385 | ) | ||||||
Proceeds from issuances of short-term debt with original maturity greater than 90 days | 890,242 | 574,187 | 742,935 | |||||||||
Repayments of short term-debt with original maturity greater than 90 days | (925,076 | ) | (503,281 | ) | (783,625 | ) | ||||||
Payments for issuance costs for revolving bank lines of credit | (3,009 | ) | (3,249 | ) | (3,121 | ) | ||||||
Proceeds from issuance of long-term debt | 2,920,669 | 3,049,869 | 3,592,292 | |||||||||
Payments for retirement of long-term debt | (1,709,283 | ) | (1,296,620 | ) | (3,122,790 | ) | ||||||
Proceeds from issuance of subordinated debt | 346,433 | — | — | |||||||||
Proceeds from issuance of members’ subordinated certificates | 5,654 | 74,842 | 153,921 | |||||||||
Payments for retirement of members’ subordinated certificates | (43,596 | ) | (166,275 | ) | (307,271 | ) | ||||||
Payments for retirement of patronage capital | (38,848 | ) | (39,198 | ) | (40,030 | ) | ||||||
Payments for cash portion of debt exchange premium | — | — | (90,814 | ) | ||||||||
Net cash provided by financing activities | 1,289,114 | 647,792 | 19,112 | |||||||||
Net increase (decrease) in cash and cash equivalents | (44,296 | ) | (89,879 | ) | 161,653 | |||||||
Beginning cash and cash equivalents | 248,836 | 338,715 | 177,062 | |||||||||
Ending cash and cash equivalents | $ | 204,540 | $ | 248,836 | $ | 338,715 | ||||||
See accompanying notes to consolidated financial statements. | ||||||||||||
81
NATIONAL RURAL UTILITIES COOPERATIVE FINANCE CORPORATION
CONSOLIDATED STATEMENTS OF CASH FLOWS
Year Ended May 31, | ||||||||||||
(Dollars in thousands) | 2016 | 2015 | 2014 | |||||||||
Supplemental disclosure of cash flow information: | ||||||||||||
Cash paid for interest | $ | 649,845 | $ | 609,840 | $ | 665,334 | ||||||
Cash paid for income taxes | 72 | 210 | 157 | |||||||||
Noncash financing and investing activities: | ||||||||||||
Subordinated certificates applied against loan balances | $ | — | $ | 228 | $ | — | ||||||
Patronage capital applied against loan balances | — | 117 | (160 | ) | ||||||||
Charge-offs of allowance for loan losses applied against loan balances | — | 999 | 1,606 | |||||||||
Net decrease in debt service reserve funds/debt service reserve certificates | (8,451 | ) | (13,751 | ) | (450 | ) | ||||||
Collateral trust bonds issued as debt exchange premium | — | — | 2,408 | |||||||||
See accompanying notes to consolidated financial statements. | ||||||||||||
82
NATIONAL RURAL UTILITIES COOPERATIVE FINANCE CORPORATION
NOTES TO CONSOLIDATED FINANCIAL STATEMENTS
NOTE 1—SUMMARY OF SIGNIFICANT ACCOUNTING POLICIES |
The Company
National Rural Utilities Cooperative Finance Corporation (“CFC”) is a member-owned cooperative association incorporated under the laws of the District of Columbia in April 1969. CFC’s principal purpose is to provide its members with financing to supplement the loan programs of the Rural Utilities Service (“RUS”) of the United States Department of Agriculture (“USDA”). CFC makes loans to its rural electric members so they can acquire, construct and operate electric distribution, generation, transmission and related facilities. CFC also provides its members with credit enhancements in the form of letters of credit and guarantees of debt obligations. As a cooperative, CFC is owned by and exclusively serves its membership, which consists of not-for-profit entities or subsidiaries or affiliates of not-for-profit entities. CFC is exempt from federal income taxes.
Rural Telephone Finance Cooperative (“RTFC”) is a taxable Subchapter T cooperative association originally incorporated in South Dakota in 1987 and reincorporated as a member-owned cooperative association in the District of Columbia in 2005. RTFC’s principal purpose is to provide financing for its rural telecommunications members and their affiliates. RTFC’s membership consists of a combination of not-for-profit and for-profit entities. CFC is the sole lender to and manages the business operations of RTFC through a management agreement in effect until December 1, 2016, which is automatically renewed for one-year terms thereafter unless terminated by either party. Under a guarantee agreement, RTFC pays CFC a fee and, in exchange, CFC reimburses RTFC for loan losses. As permitted under Subchapter T of the Internal Revenue Code, RTFC pays income tax based on its net income, excluding patronage-sourced earnings allocated to its patrons. RTFC is headquartered with CFC in Dulles, Virginia.
National Cooperative Services Corporation (“NCSC”) is a taxable cooperative incorporated in 1981 in the District of Columbia as a member-owned cooperative association. NCSC’s principal purpose is to provide financing to members of CFC, entities eligible to be members of CFC and the for-profit and nonprofit entities that are owned, operated or controlled by or provide significant benefit to certain members of CFC. NCSC’s membership consists of distribution systems, power supply systems and statewide and regional associations that are members of CFC. CFC is the primary source of funding for NCSC and manages NCSC’s business operations under a management agreement that is automatically renewable on an annual basis unless terminated by either party. NCSC pays CFC a fee and, in exchange, CFC reimburses NCSC for loan losses under a guarantee agreement. As a taxable cooperative, NCSC pays income tax based on its reported taxable income and deductions. NCSC is headquartered with CFC in Dulles, Virginia.
Basis of Presentation and Use of Estimates
The accompanying consolidated financial statements have been prepared in accordance with accounting principles generally accepted in the United States (“GAAP”). The preparation of financial statements in conformity with GAAP requires management to make estimates and assumptions that affect the reported amounts and related disclosures. The most significant estimates and assumptions involve establishing the allowance for loan losses and determining the fair value of financial instruments and other assets and liabilities. While management makes its best judgment, actual amounts or results could differ from these estimates. Certain reclassifications have been made to previously reported amounts to conform to the current-period presentation.
Principles of Consolidation
Our consolidated financial statements include the accounts of CFC, RTFC and NCSC and subsidiaries created and controlled by CFC to hold foreclosed assets. All intercompany balances and transactions have been eliminated. We consolidate entities in which CFC has a controlling financial interest. We determine whether CFC has a controlling financial interest in an entity by first evaluating whether the entity is a voting interest entity or a variable interest entity (“VIE”).
83
NATIONAL RURAL UTILITIES COOPERATIVE FINANCE CORPORATION
NOTES TO CONSOLIDATED FINANCIAL STATEMENTS
CFC established limited liability corporations and partnerships to hold foreclosed assets resulting from defaulted loans or bankruptcy. CFC owns and controls all of these entities and, therefore, consolidates their financial results. CFC presents the companies established to hold foreclosed assets in one line on the consolidated balance sheets and the consolidated statements of operations. Unless stated otherwise, references to “we, “our” or “us” relate to CFC and its consolidated entities.
Variable Interest Entities
A VIE is an entity that has a total equity investment at risk that is not sufficient to finance its activities without additional subordinated financial support provided by another party, or where the group of equity holders does not have: (i) the ability to make significant decisions about the entity’s activities; (ii) the obligation to absorb the entity’s expected losses; or (iii) the right to receive the entity’s expected residual returns.
NCSC and RTFC meet the definition of variable interest entities because they do not have enough equity investment at risk to finance their activities without additional financial support. When evaluating an entity for possible consolidation, we must determine whether or not we have a variable interest in the entity. If it is determined that we do not have a variable interest in the entity, no further analysis is required and we do not consolidate the entity. If we have a variable interest in the entity, we must evaluate whether we are the primary beneficiary based on an assessment of quantitative and qualitative factors. We are considered the primary beneficiary holder if we have a controlling financial interest in the VIE that provides (i) the power to direct the activities of the VIE that most significantly impact the VIE’s economic performance and (ii) the obligation to absorb losses of the VIE or the right to receive benefits from the VIE that could potentially be significant to the VIE. We consolidate the results of NCSC and RTFC because we are the primary beneficiary holder.
Cash and Cash Equivalents
Cash, certificates of deposit and other investments with original maturities of less than 90 days are classified as cash and cash equivalents.
Restricted Cash
Restricted cash consists of cash and cash equivalents for which the use is contractually restricted.
Time Deposits
Time deposits are deposits that we make with financial institutions in interest-bearing accounts. These deposits have a maturity of less than one year as of the reporting date and are valued at carrying value, which approximates fair value.
Investment Securities Available for Sale
Our investment securities, which are classified as available for sale, consist of investments in Federal Agricultural Mortgage Corporation (“Farmer Mac”) Series A Common Stock and Farmer Mac Series A, Series B and Series C Non-Cumulative Preferred Stock. Available-for-sale securities are carried at fair value with unrealized gains and losses recorded as a component of accumulated other comprehensive income. We regularly evaluate our investment securities whose fair value has declined below the amortized cost to assess whether the decline in fair value is other than temporary. We recognize any other-than-temporary impairment amounts in earnings.
Loans to Members
Loans to members are classified as held for investment and reported at amortized cost, which is measured based on the outstanding principal balance net of unamortized deferred loan origination costs. Deferred loan origination costs are amortized using the straight-line method, which approximates the effective interest method, over the life of the loan as a reduction to interest income.
84
NATIONAL RURAL UTILITIES COOPERATIVE FINANCE CORPORATION
NOTES TO CONSOLIDATED FINANCIAL STATEMENTS
Allowance for Loan Losses
We maintain an allowance for loan losses at a level estimated by management to provide for probable losses inherent in the loan portfolio. The allowance for loan losses is reported separately on the consolidated balance sheet, and the provision for loan losses is reported as a separate line item on the consolidated statement of operations.
We review the estimates and assumptions used in the calculations of the allowance for loan losses on a quarterly basis. The estimate of the allowance for loan losses is based on a review of the composition of the loan portfolio, past loss experience, specific problem loans, current economic conditions, available market data and/or projection of future cash flows and other pertinent factors that in management’s judgment may contribute to incurred losses. The allowance is based on estimates and, accordingly, actual losses may differ from the allowance amount. The methodology used to calculate the allowance for loan losses is summarized below.
The allowance for loan losses is calculated by dividing the portfolio into two categories of loans:
(1) | the general portfolio, which comprises loans that are performing according to the contractual agreements; and |
(2) | the impaired portfolio, which comprises loans that (i) are not currently performing or (ii) for various reasons we do not expect to collect all amounts as and when due and payable under the loan agreement or (iii) are performing according to a restructured loan agreement, but as a result of the troubled debt restructuring are required to be classified as impaired. |
Collective Allowance
The general portfolio of loans consists of all loans not specifically identified in the impaired category. We disaggregate the loans in the general portfolio by company: CFC, RTFC and NCSC. We further disaggregate the CFC loan portfolio by member class: distribution, power supply and statewide and associates.
We use the following factors to determine the allowance for loan losses for the general portfolio category:
• | Internal risk ratings system. We maintain risk ratings for our borrowers that are updated at least annually and are based on the following: |
◦ | general financial condition of the borrower; |
◦ | our judgment of the quality of the borrower’s management; |
◦ | our judgment of the borrower’s competitive position within its service territory and industry; |
◦ | our estimate of the potential impact of proposed regulation and litigation; and |
◦ | other factors specific to individual borrowers or classes of borrowers. |
• | Standard & Poor’s historical utility sector default table. The table provides expected default rates for the utility sector based on rating level and the remaining maturity. We correlate our internal risk ratings to the ratings used in the utility sector default table. We use the default table to assist in estimating our allowance for loan losses because we have limited history from which to develop loss expectations. |
• | Loss Emergence Period. Based on the estimated time between the loss-causing event(s) and the date that we charge off the unrecoverable portion of the loan. |
• | Recovery rates. Estimated recovery rates are based on our historical recovery experience by member class calculated by comparing loan balances at the time of default to the total loss recorded on the loan. We have been lending to our electric cooperative members since our incorporation in 1969. |
In addition to the allowance for loan losses for the general portfolio, we maintain a qualitative reserve for the general portfolio based on risk factors not captured in the collective allowance for loan losses. The overriding factor that creates the necessity for this additional component of loan loss reserves not captured in our loan loss model is lag in the timing of receipt of information regarding our borrowers. We actively monitor the operations and financial performance of our borrowers through the review of audited financial statements, review of borrower-prepared financial statements (if required) and discussions with borrower management. As a result of the lag, there could be credit events or circumstances that exist with our borrowers of which we have not been made aware that could potentially lead to reassessing/downgrading of certain
85
NATIONAL RURAL UTILITIES COOPERATIVE FINANCE CORPORATION
NOTES TO CONSOLIDATED FINANCIAL STATEMENTS
borrower risk ratings (“BRRs”) to better reflect the risk of default and ultimate loss. Additional qualitative considerations include our expectations with respect to loan workouts, risks associated with large loan exposures and economic and environmental factors.
To measure these additional risk factors supporting an additional reserve for the general portfolio, we perform an internal credit risk ratings portfolio stress test quantifying the impact that both upgrades and downgrades in internal credit risk ratings would have on our estimate of losses inherent in the portfolio.
Specific Allowance
A loan is considered to be impaired when we do not expect to collect all principal and interest payments as scheduled by the original loan terms, other than an insignificant delay or an insignificant shortfall in amount. Factors considered in determining impairment may include, but are not limited to:
• | the review of the borrower’s audited financial statements and interim financial statements if available, |
• | the borrower’s payment history, |
• | communication with the borrower, |
• | economic conditions in the borrower’s service territory, |
• | pending legal action involving the borrower, |
• | restructure agreements between us and the borrower and |
• | estimates of the value of the borrower’s assets that have been pledged as collateral to secure our loans. |
We generally measure impairment for individually impaired loans based on the difference between the recorded investment of the loan and the present value of the expected future cash flows discounted at the loan’s effective interest rate. If the loan is collateral dependent, we measure impairment based upon the fair value of the underlying collateral, which we determine based on the current fair value of the collateral less estimated selling costs. Loans are identified as collateral dependent if we believe that collateral is the expected source of repayment.
In calculating the impairment on a loan, the estimates of the expected future cash flows or collateral value are the key estimates made by management. Changes in the estimated future cash flows or collateral value affect the amount of the calculated impairment. The change in cash flows required to make the change in the calculated impairment material will be different for each borrower and depend on the period covered, the effective interest rate at the time the loan became impaired and the amount of the loan outstanding. Estimates are not used to determine our investment in the receivables or the discount rate since, in all cases, the investment is equal to the loan balance outstanding at the reporting date, and the discount rate is equal to the effective interest rate on the loan at the time the loan became impaired.
We recognize interest income on impaired loans on a case-by-case basis. An impaired loan to a borrower that is nonperforming will typically be placed on nonaccrual status and we will reverse all accrued and unpaid interest. We generally apply all cash received during the nonaccrual period to the reduction of principal, thereby foregoing interest income recognition. Interest income may be recognized on an accrual basis for restructured impaired loans where the borrower is performing and is expected to continue to perform based on agreed-upon terms. All of our restructured loans are troubled debt restructurings.
All loans are written off in the period that it becomes evident that collectability is highly unlikely; however, our efforts to recover all charged-off amounts may continue. The determination to write off all or a portion of a loan balance is made based on various factors on a case-by-case basis including, but not limited to, cash flow analysis and the fair value of collateral securing the borrower’s loans.
Allowance for Unadvanced Loan Commitments
We do not maintain an allowance for the majority of our unadvanced loan commitments as the loans are generally subject to material adverse change clauses that would not require us to lend or continue to lend to a borrower experiencing a material adverse change in their business or condition, financial or otherwise. The methodology used to determine an estimate of
86
NATIONAL RURAL UTILITIES COOPERATIVE FINANCE CORPORATION
NOTES TO CONSOLIDATED FINANCIAL STATEMENTS
probable losses for unadvanced commitments related to committed lines of credit that are not subject to a material adverse change clause at the time of each loan advance is consistent with the methodology used to determine the allowance for loan losses. Due to the nature of unadvanced commitments, the estimate of probable losses also considers the probability of funding such loans based on our historical average utilization rate for committed lines of credit. The allowance for unadvanced commitments is included in the other liabilities line item on the consolidated balance sheet. Changes to the allowance for unadvanced commitments are recorded in the consolidated statement of operations in other non-interest expense.
Guarantee Liability
We maintain a guarantee liability that represents our contingent and noncontingent exposure related to guarantees and standby liquidity obligations associated with our members’ debt. The guarantee liability is included in the other liabilities line item on the consolidated balance sheet, and the provision for guarantee liability is reported in non-interest expense as a separate line item on the consolidated statement of operations.
The contingent portion of the guarantee liability represents management’s estimate of our exposure to losses within the guarantee portfolio. The methodology used to estimate the contingent guarantee liability is consistent with the methodology used to determine the allowance for loan losses.
We record a noncontingent guarantee liability for all new or modified guarantees since January 1, 2003. Our noncontingent guarantee liability represents our obligation to stand ready to perform over the term of our guarantees and liquidity obligations that we have entered into or modified since January 1, 2003. Our noncontingent obligation is estimated based on guarantee and liquidity fees charged for guarantees issued, which represents management’s estimate of the fair value of our obligation to stand ready to perform. The fees are deferred and amortized using the straight-line method into interest income over the term of the guarantee.
Nonperforming Loans
We classify loans as nonperforming when any one of the following criteria is met:
• | principal or interest payments on any loan to the borrower are past due 90 days or more; |
• | as a result of court proceedings, repayment on the original terms is not anticipated; or |
• | for other reasons, management does not expect the timely repayment of principal and interest. |
A loan is considered past due if a full payment of principal and interest is not received within 30 days of its due date. Once a borrower is classified as nonperforming, we typically place the loan on nonaccrual status and reverse any accrued and unpaid interest recorded during the period in which the borrower stopped performing. We generally apply all cash received during the nonaccrual period to the reduction of principal, thereby foregoing interest income recognition. The decision to return a loan to accrual status is determined on a case-by-case basis.
Fixed Assets
Fixed assets are recorded at cost less accumulated depreciation. We recognized depreciation expense of $7 million, $6 million and $6 million in fiscal years 2016, 2015 and 2014, respectively, based on the use of the straight-line method over estimated useful lives ranging from 3 to 40 years. CFC owns its headquarters facility in Loudoun County, Virginia, which is reported in the building and building equipment category below. Fixed assets consisted of the following as of May 31, 2016 and 2015.
87
NATIONAL RURAL UTILITIES COOPERATIVE FINANCE CORPORATION
NOTES TO CONSOLIDATED FINANCIAL STATEMENTS
May 31, | ||||||||
(Dollars in thousands) | 2016 | 2015 | ||||||
Building and building equipment | $ | 50,156 | $ | 50,114 | ||||
Furniture and fixtures | 5,455 | 5,309 | ||||||
Computer software and hardware | 36,378 | 37,516 | ||||||
Other | 1,018 | 968 | ||||||
Total depreciable fixed assets | 93,007 | 93,907 | ||||||
Less: accumulated depreciation | (35,592 | ) | (31,268 | ) | ||||
Net depreciable fixed assets | 57,415 | 62,639 | ||||||
Land | 37,847 | 37,847 | ||||||
Construction-in-progress and software | 17,301 | 10,054 | ||||||
Fixed assets, net | $ | 112,563 | $ | 110,540 | ||||
Debt Service Reserve Fund
We had $17 million and $26 million as of May 31, 2016 and 2015, respectively, pledged to the trustee for our members’ obligations to repay tax-exempt bonds, for which we are the guarantor. The member cooperatives are required to purchase debt service reserve subordinated certificates from us as a condition to obtaining the guarantee. We are required to pledge the proceeds from the members’ purchase of the debt service reserve subordinated certificates to the trustee. At inception of the guarantee transaction, the trustee sets aside the required debt service reserve fund amount out of the bond proceeds to be held as the asset pledged by us. We record a liability for the member’s investment in debt service reserve subordinated certificates and record an asset for the debt service reserve fund. Since the trustee holds the proceeds, the increase to the debt service reserve fund and increase to the debt service reserve subordinated certificates are disclosed as a noncash transaction in the consolidated statement of cash flows.
A deficiency in the fund may occur when (i) the member does not pay the full amount of the periodic debt service payments as due to the trustee or (ii) upon maturity, the trustee uses the amount of the debt service reserve fund to reduce the final payment required by the member. If there is a deficiency in the bond payment due from a member, the trustee will first use the pledged amounts in the related debt service reserve fund to make up the deficiency. If there is still a deficiency after the debt service reserve fund amount is used, then we are required to perform under our guarantee. The member cooperatives are required to make up any deficiency in their specific debt service reserve fund. We record a guarantee liability, which is based on the full amount of the tax-exempt bonds guaranteed. We do not have any additional liability specific to the debt service reserve fund as we have the right at any time to offset the member’s investment in the debt service subordinated certificate against the amount that the member is required to pay to replenish the debt service reserve fund. There were no deficiencies in the debt service reserve fund as of May 31, 2016 and 2015. Earnings on the debt service reserve fund inure to the benefit of the member cooperatives but are pledged to the trustee and used to reduce the periodic interest payments due from the member cooperatives.
During the year ended May 31, 2016, $8 million of guaranteed bonds requiring a debt service reserve fund were repaid, and no new guarantees requiring a debt service reserve fund were made. This resulted in a reduction of $8 million to the debt service reserve fund and member investments in debt service reserve subordinated certificates. During the year ended May 31, 2015, $14 million of guaranteed bonds requiring a debt service reserve fund were fully repaid and no new guarantees requiring a debt service reserve fund were made. This resulted in a reduction of $14 million to the debt service reserve fund and member investments in debt service reserve subordinated certificates for the year ended May 31, 2015. At maturity, the trustee uses the debt service reserve fund to repay the bonds, reducing the amount that the member must pay. The member is obligated to replenish the debt service reserve fund so the trustee can return the pledged funds to us since the guaranteed tax-exempt bonds have been repaid. We offset our requirement to repay the member the amount of the debt service reserve subordinated certificate against our right to collect the amount of the debt service reserve fund from the trustee. As a result, the member’s obligation to replenish the debt service reserve fund is met. The reduction to the debt
88
NATIONAL RURAL UTILITIES COOPERATIVE FINANCE CORPORATION
NOTES TO CONSOLIDATED FINANCIAL STATEMENTS
service reserve fund and the debt service reserve subordinated certificates on our consolidated balance sheet are offsetting and disclosed as a noncash transaction in the consolidated statement of cash flows.
Foreclosed Assets
Foreclosed assets acquired through our lending activities in satisfaction of indebtedness currently are held in operating entities created and controlled by CFC and presented separately in our consolidated balance sheets under foreclosed assets, net. These assets are initially recorded at estimated fair value as of the date of acquisition. Subsequent to acquisition, foreclosed assets not classified as held for sale are evaluated for impairment and the results of operations and any impairment are reported on our consolidated statements of operations under results of operations of foreclosed assets. When foreclosed assets meet the accounting criteria to be classified as held for sale, they are recorded at the lower of cost or fair value less estimated costs to sell at the date of transfer, with the amount at the date of transfer representing the new cost basis. Subsequent changes are recognized in our consolidated statements of operations under results of operations of foreclosed assets. We also review foreclosed assets classified as held for sale each reporting period to determine whether the existing carrying amounts are fully recoverable in comparison to estimated fair values.
Debt
Debt securities are reported at cost net of discounts or premiums. Issuance costs on debt and discounts are deferred and amortized as interest expense using the effective interest method or a method approximating the effective interest method over the legal maturity of each bond issue. Issuance costs on dealer commercial paper and medium-term notes are recognized as incurred.
Derivative Instruments
We are an end user of derivative financial instruments and do not engage in derivative trading. We use derivatives, primarily interest rate swaps and treasury rate locks, to manage interest rate risk. Derivatives may be privately negotiated contracts, which are often referred to as over-the-counter (“OTC”) derivatives, or they may be listed and traded on an exchange. We generally engage in OTC derivative transactions.
In accordance with the accounting standards for derivatives and hedging activities, we record derivative instruments at fair value as either a derivative asset or derivative liability on our consolidated balance sheets. We report derivative asset and liability amounts on a gross basis based on individual contracts, which does not take into consideration the effects of master netting agreements or collateral netting. Derivatives in a gain position are reported as derivative assets on our consolidated balance sheets, while derivatives in a loss position are reported as derivative liabilities. Accrued interest related to derivatives is reported on our consolidated balance sheets as a component of either accrued interest receivable or accrued interest payable.
If we do not elect hedge accounting treatment, changes in the fair value of derivative instruments, which consist of net accrued periodic derivative cash settlements and derivative forward value amounts, are recognized in our consolidated statements of operations under derivative gains (losses). If we elect hedge accounting treatment for derivatives, we formally document, designate and assess the effectiveness of the hedge relationship. Changes in the fair value of derivatives designated as qualifying fair value hedges are recorded in earnings together with offsetting changes in the fair value of the hedged item and any related ineffectiveness. Changes in the fair value of derivatives designated as qualifying cash flow hedges are recorded as a component of other comprehensive income (“OCI”), to the extent that the hedge relationships are effective, and reclassified from accumulated other comprehensive income (“AOCI”) to earnings using the effective interest method over the term of the forecasted transaction. Any ineffectiveness in the hedging relationship is recognized as a component of derivative gains (losses) in our consolidated statement of operations.
We generally do not designate interest rate swaps, which represent the substantial majority of our derivatives, for hedge accounting. Accordingly, changes in the fair value of interest rate swaps are reported in our consolidated statements of operations under derivative gains (losses). Net periodic cash settlements related to interest rate swaps are classified as an operating activity in our consolidated statements of cash flows.
89
NATIONAL RURAL UTILITIES COOPERATIVE FINANCE CORPORATION
NOTES TO CONSOLIDATED FINANCIAL STATEMENTS
We typically designate treasury rate locks as cash flow hedges of forecasted debt issuances. Accordingly, changes in the fair value of the derivative instruments are recorded as a component of OCI and reclassified to interest expense when the forecasted transaction occurs using the effective interest method. Any ineffectiveness in the hedging relationship is recognized as a component of derivative gains (losses) in our consolidated statements of operations. We did not have any derivatives designated as accounting hedges as of May 31, 2016 and 2015.
At June 1, 2001, as a result of the adoption of the derivative accounting guidance that required derivatives to be reported at fair value on the balance sheet, we recorded a transition adjustment net loss in AOCI. The transition adjustment net loss is being reclassified into earnings and reported as a component of derivative gains (losses) in our consolidated statements of operations. We expect to continue to reclassify the remaining balance of the transition adjustment into earnings through 2029.
Fair Value Valuation Processes
We carry a portion of our assets and liabilities at fair value. We use fair value measurements to record fair value adjustments for certain assets and liabilities and to determine fair value disclosures. Fair value is defined as the price that would be received for an asset or paid to transfer a liability in an orderly transaction between market participants on the measurement date (also referred to as an exit price). We have various processes and controls in place to ensure that fair value is reasonably estimated. We consider observable prices in the principal market in our valuations where possible. Fair value estimates were developed at the reporting date and may not necessarily be indicative of amounts that could ultimately be realized in a market transaction at a future date. With the exception of redeeming debt under early redemption provisions, terminating derivative instruments under early termination provisions and allowing borrowers to prepay their loans, we held and intend to hold all financial instruments to maturity excluding common stock and preferred stock investments that have no stated maturity.
Fair Value Hierarchy
The fair value accounting guidance provides a three-level fair value hierarchy for classifying financial instruments. This hierarchy is based on the markets in which the assets or liabilities trade and whether the inputs to the valuation techniques used to measure fair value are observable or unobservable. Fair value measurement of a financial asset or liability is assigned a level based on the lowest level of any input that is significant to the fair value measurement in its entirety. The three levels of the fair value hierarchy are summarized below:
• | Level 1: Quoted prices (unadjusted) in active markets for identical assets or liabilities |
• | Level 2: Observable market-based inputs, other than quoted prices in active markets for identical assets or liabilities |
• | Level 3: Unobservable inputs |
The degree of management judgment involved in determining the fair value of a financial instrument is dependent upon the availability of quoted prices in active markets or observable market parameters. When quoted prices and observable data in active markets are not fully available, management’s judgment is necessary to estimate fair value. Changes in market conditions, such as reduced liquidity in the capital markets or changes in secondary market activities, may reduce the availability and reliability of quoted prices or observable data used to determine fair value.
Membership Fees
Members are charged a one-time membership fee based on member class. CFC distribution system members, power supply system members and national associations of cooperatives pay a $1,000 membership fee. CFC service organization members pay a $200 membership fee and CFC associates pay a $1,000 fee. RTFC voting members pay a $1,000 membership fee and RTFC associates pay a $100 fee. NCSC members pay a $100 membership fee. Membership fees are accounted for as members’ equity.
90
NATIONAL RURAL UTILITIES COOPERATIVE FINANCE CORPORATION
NOTES TO CONSOLIDATED FINANCIAL STATEMENTS
Financial Instruments with Off-Balance Sheet Risk
In the normal course of business, we are a party to financial instruments with off-balance sheet risk to meet the financing needs of our member borrowers. These financial instruments include committed lines of credit, standby letters of credit and guarantees of members’ obligations.
Interest Income
Interest income on loans is recognized using the effective interest method. The following table presents interest income, categorized by loan and investment type, for the years ended May 31, 2016, 2015 and 2014.
Year Ended May 31, | ||||||||||||
(Dollars in thousands) | 2016 | 2015 | 2014 | |||||||||
Interest income on loans and investments: | ||||||||||||
Long-term fixed-rate loans(1) | $ | 959,701 | $ | 898,181 | $ | 897,918 | ||||||
Long-term variable-rate loans | 19,858 | 20,184 | 20,388 | |||||||||
Line of credit loans | 24,864 | 26,411 | 31,376 | |||||||||
Restructured loans | 512 | 15 | 136 | |||||||||
Nonperforming loans | 142 | — | 236 | |||||||||
Investments | 8,647 | 7,933 | 7,080 | |||||||||
Fee income(2) | (1,088 | ) | 252 | 406 | ||||||||
Total interest income | $ | 1,012,636 | $ | 952,976 | $ | 957,540 | ||||||
____________________________
(1) Includes loan conversion fees, which are deferred and recognized in interest income using the effective interest method.
(2) Primarily related to amortization of loan origination costs and late payment fees. Up-front loan arranger fees, which are not based on interest rates, are included in fee and other income for fiscal year 2016.
Deferred income on the consolidated balance sheets consists primarily of deferred loan conversion fees, which totaled $71 million and $70 million as of May 31, 2016 and 2015, respectively.
Interest Expense
The following table presents interest expense, categorized by debt product type, for the years ended May 31, 2016, 2015 and 2014.
Year Ended May 31, | ||||||||||||
(Dollars in thousands) | 2016 | 2015 | 2014 | |||||||||
Interest expense on debt:(1)(2)(3) | ||||||||||||
Short-term debt | $ | 14,728 | $ | 14,374 | $ | 13,457 | ||||||
Medium-term notes | 86,270 | 71,739 | 85,502 | |||||||||
Collateral trust bonds | 333,338 | 315,106 | 305,760 | |||||||||
Long-term notes payable | 165,820 | 151,763 | 151,623 | |||||||||
Subordinated deferrable debt | 21,245 | 19,143 | 19,118 | |||||||||
Subordinated certificates | 60,449 | 63,559 | 79,195 | |||||||||
Total interest expense | $ | 681,850 | $ | 635,684 | $ | 654,655 | ||||||
____________________________
91
NATIONAL RURAL UTILITIES COOPERATIVE FINANCE CORPORATION
NOTES TO CONSOLIDATED FINANCIAL STATEMENTS
(1) Represents interest expense and the amortization of discounts on debt.
(2) Includes underwriter’s fees, legal fees, printing costs and certain accounting fees, which are deferred and recognized in interest expense using the effective interest method. Also includes issuance costs related to dealer commercial paper, which are recognized immediately as incurred.
(3) Includes fees related to funding activities, including fees paid to banks participating in our revolving credit agreements. Amounts are recognized as incurred or amortized on a straight-line basis over the life of the agreement.
Early Extinguishment of Debt
We redeem outstanding debt early from time to time to manage liquidity and interest rate risk. When we redeem outstanding debt early, we recognize a gain or loss related to the difference between the amount paid to redeem the debt and the net book value of the extinguished debt as a component of non-interest expense in the gain (loss) on early extinguishment of debt line item.
Income Taxes
While CFC is exempt under Section 501(c)(4) of the Internal Revenue Code, it is subject to tax on unrelated business taxable income. RTFC is a taxable cooperative under Subchapter T of the Internal Revenue Code and is not subject to income taxes on income from patronage sources that is allocated to its borrowers, as long as the allocation is properly noticed and at least 20% of the amount allocated is retired in cash prior to filing the applicable tax return. NCSC is a taxable cooperative that pays income tax on the full amount of its reportable taxable income and allowable deductions.
The income tax benefit (expense) recorded in the consolidated statement of operations for the years ended May 31, 2016, 2015 and 2014 represents the income tax benefit (expense) for RTFC and NCSC at the applicable federal and state income tax rates resulting in a statutory tax rate of approximately 38%.
Accounting Standards Adopted in Fiscal Year 2016
Simplifying the Presentation of Debt Issuance Costs
In April 2015, the Financial Accounting Standards Board (“FASB”) issued Accounting Standards Update (“ASU”) 2015-03, Simplifying the Presentation of Debt Issuance Costs, which amends the current presentation of debt issuance costs in the financial statements by requiring that debt issuance costs related to a recognized debt liability be presented in the balance sheet as a direct deduction from the carrying amount of that debt liability, consistent with debt discounts. Prior to the issuance of ASU 2015-03, debt issuance costs were required to be presented as an asset in the balance sheet. The guidance, which does not affect the recognition and measurement requirements for debt issuance costs, is effective for the first quarter of fiscal year 2017. However, we early-adopted this guidance in the first quarter of fiscal year 2016 and applied its provisions retrospectively, which resulted in the reclassification of unamortized debt issuance costs of $47 million as of
May 31, 2015, from total assets on our consolidated balance sheet to total debt outstanding. We previously presented debt issuance costs as a separate line item under total assets on our consolidated balance sheets. Other than this reclassification, the adoption of the guidance did not impact our consolidated financial statements.
Recently Issued But Not Yet Adopted Accounting Standards
Financial Instruments—Credit Losses: Measurement of Credit Losses on Financial Instruments
In June 2016, FASB issued ASU 2016-13, Financial Instruments—Credit Losses: Measurement of Credit Losses on Financial Instruments, which changes the accounting for credit losses on certain financial assets to an expected loss model from the incurred loss model currently in use. The new guidance will result in earlier recognition of credit losses based on measuring the expected credit losses over the estimated life of financial assets held at each reporting date. The expected loss model will be the basis for determining the allowance for credit losses for loans and leases, unfunded lending commitments, held-to-maturity debt securities and other debt instruments measured at amortized cost. In addition, the new guidance modifies the other-than-temporary impairment model for available-for-sale debt securities to require the recognition of credit losses through a valuation allowance when fair value is less than amortized cost, regardless of whether the impairment is considered to be other-than-temporary, which allows for the reversal of credit impairments in future periods. The new
92
NATIONAL RURAL UTILITIES COOPERATIVE FINANCE CORPORATION
NOTES TO CONSOLIDATED FINANCIAL STATEMENTS
guidance is effective for public entities in fiscal years beginning after December 15, 2019, including interim periods within those fiscal years. This update is effective for us in the first quarter of fiscal year 2020 with a cumulative-effect adjustment to retained earnings as of the beginning of the fiscal year of adoption. We are in the process of evaluating the impact this new guidance will have on our consolidated financial statements.
Financial Instruments—Overall: Recognition and Measurement of Financial Assets and Financial Liabilities
In January 2016, FASB issued ASU 2016-01, Financial Instruments—Overall: Recognition and Measurement of Financial Assets and Financial Liabilities, which changes how entities measure certain equity investments and present changes in the fair value of financial liabilities measured under the fair value option that are attributable to their own credit. Under the new guidance, entities will be required to measure equity investments that do not result in consolidation and are not accounted for under the equity method at fair value and recognize any changes in fair value in net income unless the investments qualify for the new practicability exception. For financial liabilities measured using the fair value option, entities will be required to record changes in fair value caused by a change in instrument-specific credit risk (own credit risk) separately in other comprehensive income. The accounting for other financial instruments, such as loans and investments in debt securities, is largely unchanged. The classification and measurement guidance is effective for public entities in fiscal years beginning after December 15, 2017, including interim periods within those fiscal years. This update will be effective for us in the first quarter of fiscal year 2019. We are in the process of evaluating the impact of this update on our consolidated financial statements.
Amendments to the Consolidation Analysis
In February 2015, FASB issued ASU 2015-02, Amendments to the Consolidation Analysis, which is intended to improve upon and simplify the consolidation assessment required to evaluate whether organizations should consolidate certain legal entities such as limited partnerships, limited liability corporations and securitization structures. This update is effective for us in the first quarter of fiscal year 2017. We do not expect the adoption of the update to have a material impact on our consolidated financial statements.
Revenue from Contracts with Customers
In May 2014, FASB issued ASU 2014-09, Revenue from Contracts with Customers, which clarifies the principles for recognizing revenue from contracts with customers and will replace most existing revenue recognition in GAAP when it becomes effective. In July 2015, FASB approved a one-year deferral of the effective date of this standard, with a revised effective date for fiscal years beginning after December 15, 2017. Early adoption is permitted, although not prior
to fiscal years beginning after December 15, 2016. The new accounting guidance, which does not apply to financial instruments, is effective beginning in the first quarter of fiscal year 2018. We do not expect the new guidance to have a material impact on our consolidated financial statements, as CFC’s primary business and source of revenue is from lending.
NOTE 2—VARIABLE INTEREST ENTITIES |
Based on the accounting standards governing consolidations, we are required to consolidate the financial results of RTFC and NCSC because CFC is the primary beneficiary of variable interests in RTFC and NCSC due to its exposure to absorbing the majority of their expected losses.
CFC manages the lending activities of RTFC and NCSC. Under separate guarantee agreements, RTFC and NCSC pay CFC a fee to indemnify them against loan losses. CFC is the sole lender to and manages the business operations of RTFC through a management agreement in effect until December 1, 2016, which is automatically renewed for one-year terms thereafter unless terminated by either party. CFC is the primary source of funding to and manages the lending activities of NCSC through a management agreement that is automatically renewable on an annual basis unless terminated by either party. NCSC funds its lending programs through loans from CFC or debt guaranteed by CFC. In connection with these guarantees, NCSC must pay a guarantee fee.
93
NATIONAL RURAL UTILITIES COOPERATIVE FINANCE CORPORATION
NOTES TO CONSOLIDATED FINANCIAL STATEMENTS
All loans that require RTFC board approval also require approval by CFC for funding under RTFC’s credit facilities with CFC. CFC is not a member of RTFC and does not elect directors to the RTFC board. RTFC is a non-voting associate of CFC. RTFC members elect directors to the RTFC board based on one vote for each member. All loans that require NCSC board approval also require CFC board approval. CFC is not a member of NCSC and does not elect directors to the NCSC board. If CFC becomes a member of NCSC, it would control the nomination process for one NCSC director. NCSC members elect directors to the NCSC board based on one vote for each member within a district. NCSC is a service organization member of CFC.
RTFC and NCSC creditors have no recourse against CFC in the event of a default by RTFC and NCSC, unless there is a guarantee agreement under which CFC has guaranteed NCSC or RTFC debt obligations to a third party. CFC had guaranteed $42 million of NCSC debt, derivative instruments and guarantees with third parties as of May 31, 2016, and CFC’s maximum potential exposure for these instruments totaled $46 million. The maturities for NCSC obligations guaranteed by CFC extend through 2031. Guarantees of NCSC debt and derivative instruments are not presented in the amounts in “Note 13—Guarantees,” as the debt and derivatives are reported on the consolidated balance sheet. CFC guaranteed $2 million of RTFC guarantees with third parties as of May 31, 2016. The maturities for RTFC obligations guaranteed by CFC extend through 2017. All CFC loans to RTFC and NCSC are secured by all assets and revenue of RTFC and NCSC. As of May 31, 2016, RTFC had total assets of $441 million including loans outstanding to members of $342 million, and NCSC had total assets of $692 million including loans outstanding of $681 million. As of May 31, 2016, CFC had committed to lend RTFC up to $4,000 million, of which $323 million was outstanding. As of May 31, 2016, CFC had committed to provide up to $3,000 million of credit to NCSC, of which $702 million was outstanding, representing $660 million of outstanding loans and $42 million of credit enhancements.
As of May 31, 2016, after taking into consideration systems that are members of both CFC and NCSC and eliminating memberships between CFC, RTFC and NCSC, our consolidated membership totaled 1,463 members and 230 associates. Our membership includes the following:
• | 839 distribution systems; |
• | 71 power supply systems; |
• | 487 telecommunications members; |
• | 65 statewide and regional associations; and |
• | 1 national association of cooperatives. |
Associates are eligible to borrow; however, they are not eligible to vote on matters submitted to the membership for approval. Our members and associates are located in 49 states, the District of Columbia and two U.S. territories. All references to members within this document include members and associates.
NOTE 3—INVESTMENT SECURITIES |
Our investment securities consist of holdings of Farmer Mac preferred and common stock. The following tables present the amortized cost, gross unrealized gains and losses and fair value of our investment securities, all of which are classified as available for sale, as of May 31, 2016 and 2015.
May 31, 2016 | ||||||||||||||||
(Dollars in thousands) | Amortized Cost | Gross Unrealized Gains | Gross Unrealized Losses | Fair Value | ||||||||||||
Farmer Mac—Series A Non-Cumulative Preferred Stock | $ | 30,000 | $ | 780 | $ | — | $ | 30,780 | ||||||||
Farmer Mac—Series B Non-Cumulative Preferred Stock | 25,000 | 2,600 | — | 27,600 | ||||||||||||
Farmer Mac—Series C Non-Cumulative Preferred Stock | 25,000 | 1,650 | — | 26,650 | ||||||||||||
Farmer Mac—Class A Common Stock | 538 | 2,372 | — | 2,910 | ||||||||||||
Total investment securities, available for sale | $ | 80,538 | $ | 7,402 | $ | — | $ | 87,940 | ||||||||
94
NATIONAL RURAL UTILITIES COOPERATIVE FINANCE CORPORATION
NOTES TO CONSOLIDATED FINANCIAL STATEMENTS
May 31, 2015 | ||||||||||||||||
(Dollars in thousands) | Amortized Cost | Gross Unrealized Gains | Gross Unrealized Losses | Fair Value | ||||||||||||
Farmer Mac—Series A Non-Cumulative Preferred Stock | $ | 30,000 | $ | 264 | $ | — | $ | 30,264 | ||||||||
Farmer Mac—Series B Non-Cumulative Preferred Stock | 25,000 | 1,250 | — | 26,250 | ||||||||||||
Farmer Mac—Series C Non-Cumulative Preferred Stock | 25,000 | 900 | — | 25,900 | ||||||||||||
Farmer Mac—Class A Common Stock | 538 | 1,520 | — | 2,058 | ||||||||||||
Total investment securities, available for sale | $ | 80,538 | $ | 3,934 | $ | — | $ | 84,472 | ||||||||
We did not have any investment securities in an unrealized loss position as of May 31, 2016 or May 31, 2015. For additional information regarding the unrealized gains (losses) recorded on our available-for-sale investment securities, see “Note 11—Equity—Accumulated Other Comprehensive Income. ”
NOTE 4—LOANS AND COMMITMENTS |
We are a cost-based lender that offers long-term fixed- and variable-rate loans and line of credit loans. On long-term loans, borrowers choose between a variable interest rate or a fixed interest rate for periods of one to 35 years. When a selected fixed interest rate term expires, the borrower may select another fixed-rate term or the variable rate. Collateral and security requirements for advances on loan commitments are identical to those required at the time of the initial loan approval.
The following table presents the outstanding principal balance of loans to members, including deferred loan origination costs, and unadvanced loan commitments by loan type and member class, as of May 31, 2016 and 2015.
95
NATIONAL RURAL UTILITIES COOPERATIVE FINANCE CORPORATION
NOTES TO CONSOLIDATED FINANCIAL STATEMENTS
May 31, | ||||||||||||||||
2016 | 2015 | |||||||||||||||
(Dollars in thousands) | Loans Outstanding | Unadvanced Commitments (1) | Loans Outstanding | Unadvanced Commitments (1) | ||||||||||||
Loan type: (2) | ||||||||||||||||
Long-term fixed-rate loans | $ | 21,217,139 | $ | — | $ | 19,543,274 | $ | — | ||||||||
Long-term variable-rate loans | 757,423 | 4,508,562 | 698,495 | 4,835,623 | ||||||||||||
Loans guaranteed by RUS | 173,514 | — | 179,241 | — | ||||||||||||
Line of credit loans | 1,004,441 | 8,696,448 | 1,038,210 | 9,294,127 | ||||||||||||
Total loans outstanding (3) | 23,152,517 | 13,205,010 | 21,459,220 | 14,129,750 | ||||||||||||
Deferred loan origination costs | 10,179 | — | 9,797 | — | ||||||||||||
Loans to members | $ | 23,162,696 | $ | 13,205,010 | $ | 21,469,017 | $ | 14,129,750 | ||||||||
Member class:(2) | ||||||||||||||||
CFC: | ||||||||||||||||
Distribution | $ | 17,674,335 | $ | 8,967,730 | $ | 16,095,043 | $ | 9,474,568 | ||||||||
Power supply | 4,401,185 | 3,191,873 | 4,181,481 | 3,273,501 | ||||||||||||
Statewide and associate | 54,353 | 155,129 | 65,466 | 127,473 | ||||||||||||
CFC total | 22,129,873 | 12,314,732 | 20,341,990 | 12,875,542 | ||||||||||||
RTFC | 341,842 | 246,657 | 385,709 | 288,810 | ||||||||||||
NCSC | 680,802 | 643,621 | 731,521 | 965,398 | ||||||||||||
Total loans outstanding(3) | $ | 23,152,517 | $ | 13,205,010 | $ | 21,459,220 | $ | 14,129,750 | ||||||||
____________________________
(1) The interest rate on unadvanced commitments is not set until drawn; therefore, the long-term unadvanced loan commitments have been classified in this table as variable-rate unadvanced commitments. However, at the time of the advance, the borrower may select a fixed or a variable rate on the new loan.
(2) Includes nonperforming and restructured loans.
(3) Represents the unpaid principal balance excluding deferred loan origination costs.
Unadvanced Loan Commitments
Unadvanced loan commitments totaled $2,448 million and $2,765 million as of May 31, 2016 and 2015, respectively, related to committed lines of credit loans that are not subject to a material adverse change clause at the time of each loan advance. As such, we are required to advance amounts on these committed facilities as long as the borrower is in compliance with the terms and conditions of the facility.
The following table summarizes the available balance under unconditional committed lines of credit and the related maturities, by fiscal year, as of May 31, 2016.
Available Balance | Notional Maturities of Unconditional Committed Lines of Credit | ||||||||||||
(Dollars in thousands) | 2017 | 2018 | 2019 | 2020 | 2021 | Thereafter | |||||||
Committed lines of credit | $2,447,902 | $148,240 | $601,353 | $610,442 | $613,059 | $423,621 | $51,187 | ||||||
The remaining unadvanced commitments totaling $10,757 million and $11,365 million as of May 31, 2016 and 2015, respectively, were generally subject to material adverse change clauses. Prior to making an advance on these facilities, we confirm that there has been no material adverse change in the business or condition, financial or otherwise, of the borrower since the time the loan was approved and confirm that the borrower is currently in compliance with loan terms and
96
NATIONAL RURAL UTILITIES COOPERATIVE FINANCE CORPORATION
NOTES TO CONSOLIDATED FINANCIAL STATEMENTS
conditions. In some cases, the borrower’s access to the full amount of the facility is further constrained by the designated purpose imposition of borrower-specific restrictions or by additional conditions that must be met prior to advancing funds.
The following table summarizes the available balance under unadvanced commitments as of May 31, 2016 and the related maturities, by fiscal year and thereafter, by loan type:
Available Balance | Notional Maturities of Unadvanced Commitments | |||||||||||||||||||||||||||
(Dollars in thousands) | 2017 | 2018 | 2019 | 2020 | 2021 | Thereafter | ||||||||||||||||||||||
Line of credit loans | $ | 8,696,448 | $ | 5,036,881 | $ | 1,141,935 | $ | 974,918 | $ | 793,476 | $ | 613,838 | $ | 135,400 | ||||||||||||||
Long-term loans | 4,508,562 | 961,355 | 695,989 | 1,061,425 | 852,481 | 836,708 | 100,604 | |||||||||||||||||||||
Total | $ | 13,205,010 | $ | 5,998,236 | $ | 1,837,924 | $ | 2,036,343 | $ | 1,645,957 | $ | 1,450,546 | $ | 236,004 | ||||||||||||||
Unadvanced commitments related to line of credit loans are typically for periods not to exceed five years and are generally revolving facilities used for working capital and backup liquidity purposes. Historically, we have experienced a very low utilization rate on line of credit loan facilities, whether or not there is a material adverse change clause. Since we generally do not charge a fee on the unadvanced portion of the majority of our loan facilities, our borrowers will typically request long-term facilities to fund construction work plans and other capital expenditures for periods of up to five years and draw down on the facility over that time. In addition, borrowers will typically request an amount in excess of their immediate estimated loan requirements to avoid the expense related to seeking additional loan funding for unexpected items. These factors contribute to our expectation that the majority of the unadvanced commitments will expire without being fully drawn upon and that the total unadvanced amount does not necessarily represent future cash funding requirements.
Loan Sales
We transfer, from time to time, loans to third parties under our direct loan sale program. Our transfer of loans, which are generally at par value, meets the applicable accounting criteria for sale accounting. Accordingly, we remove the loans from our consolidated balance sheets when control has been surrendered and recognize a gain or loss. Because the loans are sold at par, we record immaterial losses on the sale of these loans for unamortized deferred loan origination costs. We retain the servicing performance obligations on these loans and recognize related servicing fees on an accrual basis over the period for which servicing activity is provided, as we believe the servicing fee represents adequate compensation. We do not hold any continuing interest in the loans sold to date other than servicing performance obligations. We have no obligation to repurchase loans from the purchaser, except in the case of breaches of representations and warranties.
We sold CFC loans with outstanding balances totaling $99 million, $26 million and $111 million, respectively, at par for cash, during the years ended May 31, 2016, 2015 and 2014.
Credit Quality
We closely monitor loan performance trends to manage and evaluate our credit risk exposure. We seek to provide a balance between meeting the credit needs of our members while also ensuring the sound credit quality of our loan portfolio. Payment status and internal risk rating trends are key indicators, among others, of the level of credit risk within our loan portfolio.
As part of our strategy in managing our our credit risk exposure, we entered into a long-term standby purchase commitment agreement with Farmer Mac on August 31, 2015, as amended on May 31, 2016. Under this agreement, we may designate certain loans to be covered under the commitment, subject to approval by Farmer Mac, and in the event any such loan later goes into material default for at least 90 days, upon request by us, Farmer Mac must purchase such loan at par value. We designated, and Farmer Mac approved, loans that had an aggregate outstanding principal balance of $926 million as of May 31, 2016. Under the agreement, we are required to pay Farmer Mac a monthly fee based on the unpaid principal balance of loans covered under the purchase commitment. No loans had been put to Farmer Mac for purchase, pursuant to this agreement, as of May 31, 2016.
97
NATIONAL RURAL UTILITIES COOPERATIVE FINANCE CORPORATION
NOTES TO CONSOLIDATED FINANCIAL STATEMENTS
Payment Status of Loans
The tables below present the payment status of loans outstanding by member class as of May 31, 2016 and 2015.
May 31, 2016 | ||||||||||||||||||||||||
(Dollars in thousands) | Current | 30-89 Days Past Due | 90 Days or More Past Due (1) | Total Past Due | Total Financing Receivables | Nonaccrual Loans | ||||||||||||||||||
CFC: | ||||||||||||||||||||||||
Distribution | $ | 17,674,335 | $ | — | $ | — | $ | — | $ | 17,674,335 | $ | — | ||||||||||||
Power supply | 4,401,185 | — | — | — | 4,401,185 | — | ||||||||||||||||||
Statewide and associate | 54,353 | — | — | — | 54,353 | — | ||||||||||||||||||
CFC total | 22,129,873 | — | — | — | 22,129,873 | — | ||||||||||||||||||
RTFC | 338,336 | — | 3,506 | 3,506 | 341,842 | 3,506 | ||||||||||||||||||
NCSC | 680,802 | — | — | — | 680,802 | — | ||||||||||||||||||
Total loans outstanding | $ | 23,149,011 | $ | — | $ | 3,506 | $ | 3,506 | $ | 23,152,517 | $ | 3,506 | ||||||||||||
As a % of total loans | 99.98 | % | — | % | 0.02 | % | 0.02 | % | 100.00 | % | 0.02 | % | ||||||||||||
May 31, 2015 | ||||||||||||||||||||||||
(Dollars in thousands) | Current | 30-89 Days Past Due | 90 Days or More Past Due (1) | Total Past Due | Total Financing Receivables | Nonaccrual Loans | ||||||||||||||||||
CFC: | ||||||||||||||||||||||||
Distribution | $ | 16,095,043 | $ | — | $ | — | $ | — | $ | 16,095,043 | $ | 7,221 | ||||||||||||
Power supply | 4,181,481 | — | — | — | 4,181,481 | — | ||||||||||||||||||
Statewide and associate | 65,466 | — | — | — | 65,466 | — | ||||||||||||||||||
CFC total | 20,341,990 | — | — | — | 20,341,990 | 7,221 | ||||||||||||||||||
RTFC | 385,709 | — | — | — | 385,709 | 4,221 | ||||||||||||||||||
NCSC | 731,521 | — | — | — | 731,521 | 294 | ||||||||||||||||||
Total loans outstanding | $ | 21,459,220 | $ | — | $ | — | $ | — | $ | 21,459,220 | $ | 11,736 | ||||||||||||
As a % of total loans | 100.00 | % | — | % | — | % | — | % | 100.00 | % | 0.05 | % | ||||||||||||
____________________________
(1) All loans 90 days or more past due are on nonaccrual status.
Internal Risk Ratings of Loans
We evaluate the credit quality of our loans using an internal risk rating system that employs similar criteria for all member classes. Our internal risk rating system is based on a determination of a borrower’s risk of default utilizing both quantitative and qualitative measurements.
We have grouped our risk ratings into the categories of pass and criticized based on the criteria below.
(i) Pass: Borrowers that are not experiencing difficulty and/or not showing a potential or well-defined credit weakness.
(ii) Criticized: Includes borrowers categorized as special mention, substandard and doubtful as described below:
• | Special mention: Borrowers that may be characterized by a potential credit weakness or deteriorating financial condition that is not sufficiently serious to warrant a classification of substandard or doubtful. |
98
NATIONAL RURAL UTILITIES COOPERATIVE FINANCE CORPORATION
NOTES TO CONSOLIDATED FINANCIAL STATEMENTS
• | Substandard: Borrowers that display a well-defined credit weakness that may jeopardize the full collection of principal and interest. |
• | Doubtful: Borrowers that have a well-defined weakness and the full collection of principal and interest is questionable or improbable. |
Borrowers included in the pass, special mention and substandard categories are generally reflected in the general portfolio of loans. Borrowers included in the doubtful category are reflected in the impaired portfolio of loans. Each risk rating is reassessed annually following the receipt of the borrower’s audited financial statements; however, interim risk rating downgrades or upgrades may take place at any time as significant events or trends occur.
The following table presents our loan portfolio by risk rating category and member class based on available data as of
May 31, 2016 and 2015.
May 31, | ||||||||||||||||||||||||
2016 | 2015 | |||||||||||||||||||||||
(Dollars in thousands) | Pass | Criticized | Total | Pass | Criticized | Total | ||||||||||||||||||
CFC: | ||||||||||||||||||||||||
Distribution | $ | 17,640,928 | $ | 33,407 | $ | 17,674,335 | $ | 16,062,516 | $ | 32,527 | $ | 16,095,043 | ||||||||||||
Power supply | 4,401,185 | — | 4,401,185 | 4,181,481 | — | 4,181,481 | ||||||||||||||||||
Statewide and associate | 54,100 | 253 | 54,353 | 65,200 | 266 | 65,466 | ||||||||||||||||||
CFC total | 22,096,213 | 33,660 | 22,129,873 | 20,309,197 | 32,793 | 20,341,990 | ||||||||||||||||||
RTFC | 330,167 | 11,675 | 341,842 | 373,087 | 12,622 | 385,709 | ||||||||||||||||||
NCSC | 678,552 | 2,250 | 680,802 | 727,159 | 4,362 | 731,521 | ||||||||||||||||||
Total loans outstanding | $ | 23,104,932 | $ | 47,585 | $ | 23,152,517 | $ | 21,409,443 | $ | 49,777 | $ | 21,459,220 | ||||||||||||
Credit Concentration
The service territories of our electric and telecommunications members are located throughout the United States and its territories, including 49 states, the District of Columbia, American Samoa and Guam. Loans outstanding to borrowers in any state or territory did not exceed 15% of total loans outstanding as of May 31, 2016 and 2015. CFC, RTFC and NCSC each have policies limiting the amount of credit that can be extended to individual borrowers or a controlled group of borrowers. The total exposure outstanding to any one borrower or controlled group represented approximately 2% of total loans and guarantees outstanding as of May 31, 2016 and 2015. The 20 largest borrowers included 11 distribution systems and 9 power supply systems as of May 31, 2016. The 20 largest borrowers included 12 distribution systems and 8 power supply systems as of May 31, 2015. The following table shows the exposure to the 20 largest borrowers as a percentage of total credit exposure broken down by exposure type and by borrower type as of May 31, 2016 and 2015.
99
NATIONAL RURAL UTILITIES COOPERATIVE FINANCE CORPORATION
NOTES TO CONSOLIDATED FINANCIAL STATEMENTS
May 31, | ||||||||||||||
2016 | 2015 | |||||||||||||
(Dollars in thousands) | Amount | % | Amount | % | ||||||||||
Total by type: | ||||||||||||||
Loans(1) | $ | 5,638,217 | 23 | % | $ | 5,478,977 | 24 | % | ||||||
Guarantees | 365,457 | 2 | 374,189 | 2 | ||||||||||
Total credit exposure to 20 largest borrowers | 6,003,674 | 25 | 5,853,166 | 26 | ||||||||||
Less: Loans covered under Farmer Mac standby purchase commitment(1) | (402,244 | ) | (2 | ) | — | — | ||||||||
Net exposure to 20 largest borrowers | $ | 5,601,430 | 23 | % | $ | 5,853,166 | 26 | % | ||||||
Company: | ||||||||||||||
CFC(1) | $ | 5,991,674 | 25 | % | $ | 5,837,463 | 26 | % | ||||||
NCSC | 12,000 | — | 15,703 | — | ||||||||||
Total credit exposure to 20 largest borrowers | 6,003,674 | 25 | 5,853,166 | 26 | ||||||||||
Less: Loans covered under Farmer Mac standby purchase commitment(1) | (402,244 | ) | (2 | ) | — | — | ||||||||
Net exposure to 20 largest borrowers | $ | 5,601,430 | 23 | % | $ | 5,853,166 | 26 | % | ||||||
____________________________
(1) The standby purchase commitment agreement with Farmer Mac entered into during fiscal year 2016 covered $402 million of this total as of May 31, 2016.
Allowance for Loan Losses
We maintain an allowance for loan losses at a level estimated by management to provide for probable losses inherent in the loan portfolio as of each balance sheet date. The tables below summarize changes, by company, in the allowance for loan losses as of and for the years ended May 31, 2016, 2015 and 2014.
Year Ended May 31, 2016 | ||||||||||||||||
(Dollars in thousands) | CFC | RTFC | NCSC | Total | ||||||||||||
Balance as of May 31, 2015 | $ | 23,716 | $ | 4,533 | $ | 5,441 | $ | 33,690 | ||||||||
Provision for loan losses | 629 | 1,032 | (2,307 | ) | (646 | ) | ||||||||||
Recoveries | 214 | — | — | 214 | ||||||||||||
Balance as of May 31, 2016 | $ | 24,559 | $ | 5,565 | $ | 3,134 | $ | 33,258 | ||||||||
Year Ended May 31, 2015 | ||||||||||||||||
(Dollars in thousands) | CFC | RTFC | NCSC | Total | ||||||||||||
Balance as of May 31, 2014 | $ | 45,600 | $ | 4,282 | $ | 6,547 | $ | 56,429 | ||||||||
Provision for loan losses | (22,098 | ) | 1,250 | (1,106 | ) | (21,954 | ) | |||||||||
Charge-offs | — | (999 | ) | — | (999 | ) | ||||||||||
Recoveries | 214 | — | — | 214 | ||||||||||||
Balance as of May 31, 2015 | $ | 23,716 | $ | 4,533 | $ | 5,441 | $ | 33,690 | ||||||||
100
NATIONAL RURAL UTILITIES COOPERATIVE FINANCE CORPORATION
NOTES TO CONSOLIDATED FINANCIAL STATEMENTS
Year Ended May 31, 2014 | ||||||||||||||||
(Dollars in thousands) | CFC | RTFC | NCSC | Total | ||||||||||||
Balance as of May 31, 2013 | $ | 41,246 | $ | 9,158 | $ | 3,921 | $ | 54,325 | ||||||||
Provision for loan losses | 4,142 | (3,270 | ) | 2,626 | 3,498 | |||||||||||
Charge-offs | — | (1,606 | ) | — | (1,606 | ) | ||||||||||
Recoveries | 212 | — | — | 212 | ||||||||||||
Balance as of May 31, 2014 | $ | 45,600 | $ | 4,282 | $ | 6,547 | $ | 56,429 | ||||||||
Our allowance for loan losses consists of a specific allowance for loans individually evaluated for impairment and a collective allowance for loans collectively evaluated for impairment. The tables below present, by company, the components of our allowance for loan losses and the recorded investment of the related loans as of May 31, 2016 and 2015.
May 31, 2016 | ||||||||||||||||
(Dollars in thousands) | CFC | RTFC | NCSC | Total | ||||||||||||
Ending balance of the allowance: | ||||||||||||||||
Collectively evaluated | $ | 24,559 | $ | 2,465 | $ | 3,134 | $ | 30,158 | ||||||||
Individually evaluated | — | 3,100 | — | 3,100 | ||||||||||||
Total ending balance of the allowance | $ | 24,559 | $ | 5,565 | $ | 3,134 | $ | 33,258 | ||||||||
Recorded investment in loans: | ||||||||||||||||
Collectively evaluated | $ | 22,123,157 | $ | 331,244 | $ | 680,802 | $ | 23,135,203 | ||||||||
Individually evaluated | 6,716 | 10,598 | — | 17,314 | ||||||||||||
Total recorded investment in loans | $ | 22,129,873 | $ | 341,842 | $ | 680,802 | $ | 23,152,517 | ||||||||
Loans to members, net (1) | $ | 22,105,314 | $ | 336,277 | $ | 677,668 | $ | 23,119,259 | ||||||||
May 31, 2015 | ||||||||||||||||
(Dollars in thousands) | CFC | RTFC | NCSC | Total | ||||||||||||
Ending balance of the allowance: | ||||||||||||||||
Collectively evaluated | $ | 23,716 | $ | 4,138 | $ | 5,441 | $ | 33,295 | ||||||||
Individually evaluated | — | 395 | — | 395 | ||||||||||||
Total ending balance of the allowance | $ | 23,716 | $ | 4,533 | $ | 5,441 | $ | 33,690 | ||||||||
Recorded investment in loans: | ||||||||||||||||
Collectively evaluated | $ | 20,334,769 | $ | 381,488 | $ | 731,227 | $ | 21,447,484 | ||||||||
Individually evaluated | 7,221 | 4,221 | 294 | 11,736 | ||||||||||||
Total recorded investment in loans | $ | 20,341,990 | $ | 385,709 | $ | 731,521 | $ | 21,459,220 | ||||||||
Loans to members, net(1) | $ | 20,318,274 | $ | 381,176 | $ | 726,080 | $ | 21,425,530 | ||||||||
___________________________
(1) Excludes unamortized deferred loan origination costs of $10 million as of May 31, 2016 and 2015.
101
NATIONAL RURAL UTILITIES COOPERATIVE FINANCE CORPORATION
NOTES TO CONSOLIDATED FINANCIAL STATEMENTS
Impaired Loans
Below we provide information on loans classified as individually impaired as of May 31, 2016 and 2015.
May 31, | ||||||||||||||||
2016 | 2015 | |||||||||||||||
(Dollars in thousands) | Recorded Investment | Related Allowance | Recorded Investment | Related Allowance | ||||||||||||
With no specific allowance recorded: | ||||||||||||||||
CFC | $ | 6,716 | $ | — | $ | 7,221 | $ | — | ||||||||
NCSC | — | — | 294 | — | ||||||||||||
Total | 6,716 | — | 7,515 | — | ||||||||||||
With a specific allowance recorded: | ||||||||||||||||
RTFC | 10,598 | 3,100 | 4,221 | 395 | ||||||||||||
Total | 10,598 | 3,100 | 4,221 | 395 | ||||||||||||
Total impaired loans | $ | 17,314 | $ | 3,100 | $ | 11,736 | $ | 395 | ||||||||
The following table represents the average recorded investment in individually impaired loans and the interest income recognized by company for fiscal years ended May 31, 2016, 2015 and 2014.
Average Recorded Investment | Interest Income Recognized | |||||||||||||||||||||||
(Dollars in thousands) | 2016 | 2015 | 2014 | 2016 | 2015 | 2014 | ||||||||||||||||||
CFC | $ | 6,842 | $ | 7,312 | $ | 15,100 | $ | 390 | $ | — | $ | 141 | ||||||||||||
RTFC | 9,823 | 1,438 | 6,235 | 264 | — | 224 | ||||||||||||||||||
NCSC | — | 325 | 218 | — | 15 | 7 | ||||||||||||||||||
Total impaired loans | $ | 16,665 | $ | 9,075 | $ | 21,553 | $ | 654 | $ | 15 | $ | 372 | ||||||||||||
Troubled Debt Restructured (“TDR”) and Nonperforming Loans
TDR Loans
The following table summarizes modified loans accounted for and reported as TDRs, the performance status of these loans, and the related unadvanced commitments, by member class, as of May 31, 2016 and 2015.
102
NATIONAL RURAL UTILITIES COOPERATIVE FINANCE CORPORATION
NOTES TO CONSOLIDATED FINANCIAL STATEMENTS
May 31, | ||||||||||||||||||||||
2016 | 2015 | |||||||||||||||||||||
(Dollars in thousands) | Loans Outstanding | % of Total Loans | Unadvanced Commitments(1) | Loans Outstanding | % of Total Loans | Unadvanced Commitments(1) | ||||||||||||||||
TDR loans: | ||||||||||||||||||||||
Nonperforming TDR loans: | ||||||||||||||||||||||
RTFC | $ | 3,506 | $ | — | $ | — | $ | — | ||||||||||||||
Total nonperforming TDR loans | 3,506 | 0.01 | % | — | — | — | % | — | ||||||||||||||
Performing TDR loans: | ||||||||||||||||||||||
CFC/Distribution(2) | 6,716 | — | 7,221 | — | ||||||||||||||||||
RTFC | 7,092 | — | 4,221 | — | ||||||||||||||||||
NCSC | — | — | 294 | — | ||||||||||||||||||
Total performing TDR loans | 13,808 | 0.06 | % | — | 11,736 | 0.05 | % | — | ||||||||||||||
Total TDR loans | $ | 17,314 | 0.07 | % | $ | — | $ | 11,736 | 0.05 | % | $ | — | ||||||||||
___________________________
(1) The interest rate on unadvanced commitments is not set until drawn; therefore, the long-term unadvanced loan commitments have been classified in this table as variable-rate unadvanced commitments. However, at the time of the advance, the borrower may select a fixed or a variable rate on the new loan.
(2) A borrower in this category also had a line of credit loan outstanding that was classified as performing as of May 31, 2016 and 2015. Unadvanced commitments related to this line of credit loan totaled $4 million and $2 million as of May 31, 2016 and 2015, respectively.
All loans classified as performing TDR loans were performing in accordance with the terms of the restructured loan agreements as of May 31, 2016 and 2015. The TDR loans classified as performing as of May 31, 2015 were on nonaccrual status as of that date. These loans were returned to accrual status during the year ended May 31, 2016.
Nonperforming Loans
We had no loans classified as nonperforming as of May 31, 2016 and 2015.
The following table shows foregone interest income for loans on nonaccrual status fiscal years ended May 31, 2016, 2015 and 2014.
Year Ended May 31, | ||||||||||||
(Dollars in thousands) | 2016 | 2015 | 2014 | |||||||||
Nonperforming loans | $ | — | $ | 123 | $ | 314 | ||||||
Performing TDR loans | 166 | 532 | 488 | |||||||||
Nonperforming TDR loans | 109 | — | — | |||||||||
Total | $ | 275 | $ | 655 | $ | 802 | ||||||
Pledging of Loans and Loans on Deposit
We are required to pledge eligible mortgage notes in an amount at least equal to the outstanding balance of our secured debt.
The following table summarizes our loans outstanding as collateral pledged to secure our collateral trust bonds, Clean Renewable Energy Bonds, notes payable to Farmer Mac and notes payable under the Guaranteed Underwriter Program of the USDA (the “Guaranteed Underwriter Program”) and the amount of the corresponding debt outstanding as of May 31, 2016 and 2015. See “Note 6—Short-Term Borrowings” and “Note 7—Long-Term Debt” for information on our borrowings.
103
NATIONAL RURAL UTILITIES COOPERATIVE FINANCE CORPORATION
NOTES TO CONSOLIDATED FINANCIAL STATEMENTS
May 31, | ||||||||
(Dollars in thousands) | 2016 | 2015 | ||||||
Collateral trust bonds: | ||||||||
2007 indenture: | ||||||||
Distribution system mortgage notes | $ | 7,246,973 | $ | 6,551,836 | ||||
RUS-guaranteed loans qualifying as permitted investments | 151,687 | 156,665 | ||||||
Total pledged collateral | $ | 7,398,660 | $ | 6,708,501 | ||||
Collateral trust bonds outstanding | 6,747,711 | 6,197,711 | ||||||
1994 indenture: | ||||||||
Distribution system mortgage notes | $ | 968,030 | $ | 905,656 | ||||
Collateral trust bonds outstanding | 800,000 | 855,000 | ||||||
Farmer Mac: | ||||||||
Distribution and power supply system mortgage notes | $ | 2,683,806 | $ | 2,160,805 | ||||
Notes payable outstanding | 2,303,122 | 1,910,688 | ||||||
Clean Renewable Energy Bonds Series 2009A: | ||||||||
Distribution and power supply system mortgage notes | $ | 17,081 | $ | 19,260 | ||||
Cash | — | 485 | ||||||
Total pledged collateral | $ | 17,081 | $ | 19,745 | ||||
Notes payable outstanding | 14,871 | 16,529 | ||||||
FFB: | ||||||||
Distribution and power supply system mortgage notes | $ | 5,248,935 | $ | — | ||||
Notes payable outstanding | 4,777,404 | — | ||||||
We were required to maintain collateral on deposit in an amount at least equal to the balance of debt outstanding to the Federal Financing Bank (“FFB”) of the United States Treasury issued under the Guaranteed Underwriter Program as of
May 31, 2015. See “Note 6—Short-Term Borrowings” and “Note 7—Long-Term Debt.”
The following table shows the collateral on deposit and the amount of the corresponding debt outstanding as of May 31, 2016 and 2015.
May 31, | ||||||||
(Dollars in thousands) | 2016 | 2015 | ||||||
FFB: | ||||||||
Distribution and power supply system mortgage notes on deposit | $ | — | $ | 4,943,746 | ||||
Notes payable outstanding | — | 4,406,785 | ||||||
On March 29, 2016, we entered into a second amended restated and consolidated pledge agreement with RUS and U.S. Bank National Association to pledge all mortgage notes previously held on deposit pursuant to the Guaranteed Underwriter Program and, in connection with any advance, pledge collateral satisfactory to RUS pursuant to the terms of the facility. The agreement replaces the previous pledge agreement, dated December 13, 2012, and will govern all collateral under the Guaranteed Underwriter Program.
104
NATIONAL RURAL UTILITIES COOPERATIVE FINANCE CORPORATION
NOTES TO CONSOLIDATED FINANCIAL STATEMENTS
The notes payable to the FFB under the Guaranteed Underwriter Program contain a provision that if during any portion of the fiscal year, our senior secured debt credit ratings do not have at least two of the following ratings: (i) A3 or higher from Moody’s, (ii) A- or higher from S&P, (iii) A- or higher from Fitch or (iv) an equivalent rating from a successor rating agency to any of the above rating agencies, we may not make cash patronage capital distributions in excess of 5% of total patronage capital. The credit ratings of our senior secured debt from S&P, Moody’s and Fitch was A, A1 and A+, respectively, as of May 31, 2016, and all three companies had our ratings on stable outlook.
NOTE 5—FORECLOSED ASSETS |
We had one entity, Caribbean Asset Holdings, LLC (“CAH”), that held foreclosed assets as of May 31, 2016. CAH was established as a holding company for various U.S. Virgin Islands, British Virgin Islands and St. Maarten-based telecommunications operating entities that were transferred in fiscal year 2011 to CAH as a result of a loan default by an RTFC borrower and subsequent bankruptcy proceedings. These operating entities provide local, long-distance and wireless telephone, cable television and Internet services to residential and commercial customers.
CAH was classified as held for sale beginning with the quarter ended August 31, 2015. Since that date, we have assessed the fair value less cost to sell of CAH each reporting period, reported our investment in CAH at the lower of the carrying value, as of the date of transfer to held for sale, or fair value less cost to sell and recognized subsequent changes in fair value less cost to sell in earnings. We recorded a loss in our consolidated statement of operations for CAH of $7 million in fiscal year 2016, which was attributable to impairment of our investment in CAH due to a reduction in the fair value less estimated cost to sell.
Sale of CAH
On September 30, 2015, CFC entered into a Purchase Agreement (as amended, the “Purchase Agreement”) with CAH, ATN VI Holdings, LLC (“Buyer”) and ATN International, Inc. (formerly Atlantic Tele-Network, Inc.), the parent corporation of Buyer, to sell all of the issued and outstanding membership interests of CAH to Buyer for a purchase price of $145 million, subject to certain adjustments described in the Purchase Agreement. On July 1, 2016, the Purchase Agreement was amended and the sale of CAH was completed for a purchase price of approximately $144 million.
Our reported investment in CAH totaled $103 million as of May 31, 2016, which represents the fair value less estimated cost to sell as of that date. The measurement of fair value takes into consideration the contractual purchase price less agreed-upon purchase price adjustments, including cash on hand, changes in working capital and settlement of CAH’s pension and other postretirement benefit plan obligations, as well as the unrecognized net loss of $10 million recorded in accumulated other comprehensive income (“AOCI”) attributable to actuarial-related changes in CAH’s pension and other postretirement benefit plan obligations. Upon closing of the sale of CAH, the unrecognized net loss of $10 million recorded in AOCI as of May 31, 2016 was derecognized as an offset against the sale proceeds, which will have no effect on our consolidated statement of operations for the first quarter of fiscal year 2017.
Our net proceeds at closing totaled $109 million, which represents the purchase price of $144 million less agreed-upon purchase price adjustments, as noted above, and transaction costs as of the closing date. The net proceeds at closing take into consideration the impact of CAH’s operating results subsequent to our May 31, 2016 fiscal year end and the July 1, 2016 closing date, and the impact of these results on CAH’s cash on hand and transaction costs as of the closing date. The net proceeds are subject to post-closing adjustments, which are due from Buyer within 60 days of the closing date for review by us. We expect to record any required post-closing adjustments in the first quarter of fiscal year 2017. CFC also remains subject to potential indemnification claims, as specified in the Purchase Agreement. Upon closing, $16 million of the sale proceeds were deposited into escrow to fund potential indemnification claims for a period of 15 months following the closing. In connection with the sale, RTFC provided a loan in the amount of $60 million to Buyer to finance a portion of the transaction. ATN International has provided a guarantee on an unsecured basis of Buyer’s obligations to RTFC pursuant to the financing.
105
NATIONAL RURAL UTILITIES COOPERATIVE FINANCE CORPORATION
NOTES TO CONSOLIDATED FINANCIAL STATEMENTS
NOTE 6—SHORT-TERM BORROWINGS |
The following table provides comparative information on our short-term borrowings and weighted-average interest rates as of May 31, 2016 and 2015.
May 31, | ||||||||||||||
2016 | 2015 | |||||||||||||
(Dollars in thousands) | Amount | Weighted- Average Interest Rate | Amount | Weighted-Average Interest Rate | ||||||||||
Short-term borrowings: | ||||||||||||||
Commercial paper sold through dealers, net of discounts | $ | 659,935 | 0.43 | % | $ | 984,954 | 0.15 | % | ||||||
Commercial paper sold directly to members, at par | 848,007 | 0.45 | 736,162 | 0.15 | ||||||||||
Select notes | 701,849 | 0.62 | 671,635 | 0.29 | ||||||||||
Daily liquidity fund notes | 525,959 | 0.34 | 509,131 | 0.08 | ||||||||||
Medium-term notes sold to members | 203,098 | 1.05 | 225,872 | 0.65 | ||||||||||
Total short-term debt | $ | 2,938,848 | 0.51 | % | $ | 3,127,754 | 0.20 | % | ||||||
We issue commercial paper for periods of one to 270 days. We also issue select notes for periods ranging from 30 to 270 days. Select notes are unsecured obligations that do not require backup bank lines of credit for liquidity purposes. These notes require a larger minimum investment than our commercial paper sold to members and, as a result, offer a higher interest rate than our commercial paper. We also issue daily liquidity fund notes, which are unsecured obligations that do not require backup bank lines of credit for liquidity purposes. We also issue medium-term notes, which represent unsecured obligations that may be issued through dealers in the capital markets or directly to our members.
Revolving Credit Agreements
We had $3,420 million of commitments under revolving credit agreements as of May 31, 2016 and 2015. Under our current revolving credit agreements, we have the ability to request up to $300 million of letters of credit, which would result in a reduction in the remaining available amount under the facilities. On November 19, 2015, we amended and restated the $1,665 million three-year and $1,645 million five-year revolving credit agreements to extend the maturity dates to November 19, 2018 and November 19, 2020, respectively, from October 28, 2017 and October 28, 2019, respectively. Commitments of $25 million under the three-year agreement will expire at the prior maturity date of October 28, 2017. Commitments of $45 million under the five-year agreement will expire at the prior maturity date of October 28, 2019. Also, as part of the amendment, the commitments from three banks were increased by $45 million.
Prior to this amendment, NCSC assumed $155 million in commitments from one of the banks, which was reduced to $110 million as part of the amendment on November 19, 2015. Although the total commitment amount under our new revolving credit agreements is unchanged from the previous total of $3,420 million, NCSC’s commitment amount is excluded from the commitment amount from third parties of $3,310 million because NCSC receives all of its funding from CFC and NCSC's financial results are consolidated with CFC. The NCSC assumption of $110 million of commitments under the revolving credit agreements also reduces the total letters of credit from third parties to $290 million.
The following table presents the total commitment, the net amount available for use and the outstanding letters of credit under our revolving credit agreements as of May 31, 2016 and 2015.
106
NATIONAL RURAL UTILITIES COOPERATIVE FINANCE CORPORATION
NOTES TO CONSOLIDATED FINANCIAL STATEMENTS
May 31, | ||||||||||||||||||||||||||||
2016 | 2015 | |||||||||||||||||||||||||||
(Dollars in millions) | Total Commitment | Letters of Credit Outstanding | Net Available for Use(1) | Total Commitment | Letters of Credit Outstanding | Net Available for Use(1) | Maturity | Annual Facility Fee (2) | ||||||||||||||||||||
3-year agreement | $ | 25 | $ | — | $ | 25 | $ | 1,720 | $ | — | $ | 1,720 | October 28, 2017 | 7.5 bps | ||||||||||||||
3-year agreement | 1,640 | — | 1,640 | — | — | — | November 19, 2018 | 7.5 bps | ||||||||||||||||||||
Total 3-year agreement | 1,665 | — | 1,665 | 1,720 | — | 1,720 | ||||||||||||||||||||||
5-year agreement | 45 | — | 45 | 1,700 | 1 | 1,699 | October 28, 2019 | 10 bps | ||||||||||||||||||||
5-year agreement | 1,600 | 1 | 1,599 | — | — | — | November 19, 2020 | 10 bps | ||||||||||||||||||||
Total 5-year agreement | 1,645 | 1 | 1,644 | 1,700 | 1 | 1,699 | ||||||||||||||||||||||
Total | $ | 3,310 | $ | 1 | $ | 3,309 | $ | 3,420 | $ | 1 | $ | 3,419 | ||||||||||||||||
___________________________
(1)Reflects amounts available from unaffiliated third parties that are not consolidated by CFC.
(2) Facility fee determined by CFC’s senior unsecured credit ratings based on the pricing schedules put in place at the inception of the related agreement.
We were in compliance with all covenants and conditions under our revolving credit agreements and there were no borrowings outstanding under these agreements as of May 31, 2016 and 2015.
NOTE 7—LONG-TERM DEBT |
The following table displays long-term debt outstanding and the weighted-average interest rates, by debt type, as of May 31, 2016 and 2015.
107
NATIONAL RURAL UTILITIES COOPERATIVE FINANCE CORPORATION
NOTES TO CONSOLIDATED FINANCIAL STATEMENTS
May 31, | |||||||||||||||||||
2016 | 2015 | ||||||||||||||||||
(Dollars in thousands) | Amount | Weighted- Average Interest Rate | Maturity Date | Amount | Weighted- Average Interest Rate | Maturity Date | |||||||||||||
Unsecured long-term debt: | |||||||||||||||||||
Medium-term notes sold through dealers | $ | 2,668,276 | 3.02 | % | 2016-2032 | $ | 2,749,894 | 2.55 | % | 2015-2032 | |||||||||
Medium-term notes sold to members | 450,960 | 1.93 | 2016-2037 | 392,298 | 1.44 | 2015-2032 | |||||||||||||
Subtotal medium-term notes | 3,119,236 | 2.86 | 3,142,192 | 2.41 | |||||||||||||||
Unamortized discount | (537 | ) | (706 | ) | |||||||||||||||
Debt issuance costs | (19,370 | ) | (15,335 | ) | |||||||||||||||
Total unsecured medium-term notes | 3,099,329 | 3,126,151 | |||||||||||||||||
Guaranteed Underwriter Program notes payable | — | — | 4,406,785 | 3.14 | 2025-2035 | ||||||||||||||
Debt issuance costs | — | (320 | ) | ||||||||||||||||
Total Guaranteed Underwriter Program notes payable | — | 4,406,465 | |||||||||||||||||
Other unsecured notes payable: | 27,092 | 4.02 | 2022-2023 | 31,168 | 4.07 | 2022-2023 | |||||||||||||
Unamortized discount | (496 | ) | (626 | ) | |||||||||||||||
Debt issuance costs | (123 | ) | (155 | ) | |||||||||||||||
Total other unsecured notes payable | 26,473 | 30,387 | |||||||||||||||||
Total unsecured notes payable | 26,473 | 4.02 | 4,436,852 | 3.15 | |||||||||||||||
Total unsecured long-term debt | 3,125,802 | 2.87 | 7,563,003 | 2.84 | |||||||||||||||
Secured long-term debt: | |||||||||||||||||||
Collateral trust bonds | 7,547,711 | 4.28 | 2017-2032 | 7,052,711 | 4.48 | 2015-2032 | |||||||||||||
Unamortized discount | (265,837 | ) | (271,201 | ) | |||||||||||||||
Debt issuance costs | (28,778 | ) | (26,443 | ) | |||||||||||||||
Total collateral trust bonds | 7,253,096 | 6,755,067 | |||||||||||||||||
Guaranteed Underwriter Program notes payable | 4,777,404 | 2.98 | 2025-2036 | — | — | ||||||||||||||
Debt issuance costs | (293 | ) | — | ||||||||||||||||
Total Guaranteed Underwriter Program notes payable | 4,777,111 | — | |||||||||||||||||
Farmer Mac notes payable | 2,303,123 | 1.15 | 2018-2045 | 1,910,688 | 0.77 | 2018-2045 | |||||||||||||
Other secured notes payable | 14,871 | 2.86 | 2024 | 16,529 | 2.91 | 2024 | |||||||||||||
Debt issuance costs | (400 | ) | (493 | ) | |||||||||||||||
Total other secured notes payable | 14,471 | 16,036 | |||||||||||||||||
Total secured notes payable | 7,094,705 | 2.39 | 1,926,724 | 0.79 | |||||||||||||||
Total secured long-term debt | 14,347,801 | 3.36 | 8,681,791 | 3.69 | |||||||||||||||
Total long-term debt | $ | 17,473,603 | 3.28 | % | $ | 16,244,794 | 3.30 | % | |||||||||||
108
NATIONAL RURAL UTILITIES COOPERATIVE FINANCE CORPORATION
NOTES TO CONSOLIDATED FINANCIAL STATEMENTS
The following table presents the amount of long-term debt maturing in each of the five fiscal years subsequent to May 31, 2016 and thereafter.
(Dollars in thousands) | Amount Maturing | Weighted-Average Interest Rate | |||||
2017 | $ | 2,337,652 | 2.26 | % | |||
2018 | 1,057,777 | 4.08 | |||||
2019 | 2,187,247 | 6.06 | |||||
2020 | 1,049,853 | 2.06 | |||||
2021 | 1,256,128 | 2.12 | |||||
Thereafter | 9,584,946 | 3.09 | |||||
Total | $ | 17,473,603 | 3.28 | % | |||
Medium-Term Notes
Medium-term notes represent unsecured obligations that may be issued through dealers in the capital markets or directly to our members.
Collateral Trust Bonds
Collateral trust bonds represent secured obligations sold to investors in the capital markets. Collateral trust bonds are secured by the pledge of mortgage notes or eligible securities in an amount at least equal to the principal balance of the bonds outstanding. During the year ended May 31, 2016, we issued a total of $1,450 million collateral trust bonds with an average coupon of 2.50% and maturities ranging between 2019 and 2025. On February 16, 2016, we redeemed $300 million of 3.05% collateral trust bonds due March 1, 2016. The premium and unamortized issuance costs totaling $0.3 million were recorded as a loss on early extinguishment of debt during the third quarter of fiscal year 2016.
Unsecured Notes Payable
On March 29, 2016, we entered into a second amended, restated and consolidated pledge agreement with RUS and U.S. Bank National Association to pledge all mortgage notes previously held on deposit pursuant to the Guaranteed Underwriter Program and, in connection with any advance, pledge collateral satisfactory to RUS pursuant to the terms of the facility. The agreement replaces the previous pledge agreement, dated December 13, 2012, and will govern all collateral under the Guaranteed Underwriter Program. As a result, we had no unsecured notes payable outstanding under the Guaranteed Underwriter Program as of May 31, 2016. We had unsecured notes payable totaling $4,407 million outstanding under bond purchase agreements with the Federal Financing Bank and a bond guarantee agreement with RUS issued under the Guaranteed Underwriter Program, which provides guarantees to the Federal Financing Bank, as of May 31, 2015. We were required to place mortgage notes on deposit in an amount at least equal to the principal balance of the notes outstanding of $4,407 million as of May 31, 2015.
Secured Notes Payable
As of May 31, 2016, we had secured notes payable totaling $4,777 million outstanding under a bond purchase agreement with the Federal Financing Bank and a bond guarantee agreement with RUS issued under the Guaranteed Underwriter Program, which provides guarantees to the Federal Financing Bank. We pay RUS a fee of 30 basis points per year on the total amount borrowed. As of May 31, 2016, $4,777 million of secured notes payable outstanding under the Guaranteed Underwriter Program require us to pledge mortgage notes in an amount at least equal to the principal balance of the notes outstanding. See “Note 4—Loans and Commitments” for additional information on the collateral pledged to secure notes payable under this program. During the year ended May 31, 2016, we borrowed $400 million under our committed loan
109
NATIONAL RURAL UTILITIES COOPERATIVE FINANCE CORPORATION
NOTES TO CONSOLIDATED FINANCIAL STATEMENTS
facilities with the Federal Financing Bank. On March 29, 2016, we closed on a $250 million committed loan facility (“Series K”) from the Federal Financing Bank guaranteed by RUS pursuant to the Guaranteed Underwriter Program. Under the Series K facility, we are able to borrow an additional $250 million any time before January 15, 2019 with each advance having a final maturity no longer than 20 years from the advance date. As of May 31, 2016, we had up to $600 million available under committed loan facilities from the Federal Financing Bank as part of this program.
As of May 31, 2016 and 2015, secured notes payable include $2,303 million and $1,911 million, respectively, in debt outstanding to Farmer Mac under a note purchase agreement totaling $4,500 million. Under the terms of the note purchase agreement, we can borrow up to $4,500 million at any time through January 11, 2020, and thereafter automatically extend the agreement on each anniversary date of the closing for an additional year, unless prior to any such anniversary date, Farmer Mac provides us with a notice that the draw period would not be extended beyond the remaining term. During the year ended May 31, 2016, we borrowed $430 million under the note purchase agreement with Farmer Mac. The agreement with Farmer Mac is a revolving credit facility that allows us to borrow, repay and re-borrow funds at any time through maturity or from time to time as market conditions permit, provided that the principal amount at any time outstanding is not more than the total available under the agreement.
On July 31, 2015, we entered into a new revolving note purchase agreement with Farmer Mac totaling $300 million. Under the terms of the new agreement, we can borrow up to $300 million at any time through July 31, 2018. This agreement with Farmer Mac is a revolving credit facility that allows us to borrow, repay and re-borrow funds at any time through maturity or from time to time, provided that the principal amount at any time outstanding is not more than the total available under the agreement.
We are required to pledge eligible distribution system or power supply system loans as collateral in an amount at least equal to the total principal amount of notes outstanding under the Farmer Mac agreements. See “Note 4—Loans and Commitments” for additional information on the collateral pledged to secure notes payable under these programs.
We were in compliance with all covenants and conditions under our senior debt indentures as of May 31, 2016 and 2015.
NOTE 8—SUBORDINATED DEFERRABLE DEBT |
Subordinated deferrable debt is long-term debt that is subordinated to our outstanding debt and senior to subordinated certificates held by our members. Our 4.75% and 5.25% subordinated debt due 2043 and 2046, respectively, was issued for a term of up to 30 years, pays interest semi-annually, may be called at par after ten years, converts to a variable rate after ten years, and allows us to defer the payment of interest for one or more consecutive interest periods not exceeding five consecutive years. To date, we have not exercised our right to defer interest payments.
The following table presents subordinated deferrable debt outstanding and the weighted-average interest rates as of May 31, 2016 and 2015.
May 31, | ||||||||||||||
2016 | 2015 | |||||||||||||
(Dollars in thousands) | Amount | Weighted- Average Interest Rate | Amount | Weighted-Average Interest Rate | ||||||||||
4.75% due 2043 with a call date of April 30, 2023 | $ | 400,000 | 4.75 | % | $ | 400,000 | 4.75 | % | ||||||
5.25% due 2046 with a call date of April 20, 2026 | 350,000 | 5.25 | — | — | ||||||||||
Debt issuance costs | (7,788 | ) | (4,301 | ) | ||||||||||
Total subordinated deferrable debt | $ | 742,212 | 4.98 | % | $ | 395,699 | 4.75 | % | ||||||
On April 20, 2016, we issued $350 million of 5.25% subordinated deferrable debt due 2046 callable at par on or after
April 20, 2026.
110
NATIONAL RURAL UTILITIES COOPERATIVE FINANCE CORPORATION
NOTES TO CONSOLIDATED FINANCIAL STATEMENTS
NOTE 9—MEMBERS’ SUBORDINATED CERTIFICATES |
Membership Subordinated Certificates
CFC members may be required to purchase membership subordinated certificates as a condition of membership. Such certificates are interest-bearing, unsecured, subordinated debt. Members may purchase the certificates over time as a percentage of the amount they borrow from CFC. Membership certificates typically have an original maturity of 100 years and pay interest at 5% semi-annually. The weighted-average maturity for all membership subordinated certificates outstanding as of May 31, 2016 and 2015 was 60 years and 61 years, respectively. RTFC and NCSC members are not required to purchase membership certificates as a condition of membership.
Loan and Guarantee Subordinated Certificates
Members obtaining long-term loans, certain line of credit loans or guarantees may be required to purchase additional loan or guarantee subordinated certificates with each such loan or guarantee based on the borrower’s debt-to-equity ratio with CFC. These certificates are unsecured, subordinated debt and may be interest bearing or non-interest bearing.
Under our current policy, most borrowers requesting standard loans are not required to buy subordinated certificates as a condition of a loan or guarantee. Borrowers meeting certain criteria, including but not limited to, high leverage ratios, or borrowers requesting large facilities, may be required to purchase loan or guarantee subordinated certificates or member capital securities (described below) as a condition of the loan. Loan subordinated certificates have the same maturity as the related long-term loan. Some certificates may amortize annually based on the outstanding loan balance.
The interest rates payable on guarantee subordinated certificates purchased in conjunction with our guarantee program vary in accordance with applicable CFC policy. Guarantee subordinated certificates have the same maturity as the related guarantee.
Member Capital Securities
CFC offers member capital securities to its voting members. Member capital securities are interest-bearing, unsecured obligations of CFC, which are subordinate to all existing and future senior and subordinated indebtedness of CFC held by non-members of CFC, but rank proportionally to our member subordinated certificates. Series 2008 member capital maturities mature 35 years from the date of issuance, pay interest at 5% and are callable at par at our option five years from the date of issuance and anytime thereafter. Series 2013 member capital securities mature 30 years from the date of issuance, typically pay interest at 5% and are callable at par at our option 10 years from the date of issuance and anytime thereafter. These securities represent voluntary investments in CFC by the members.
111
NATIONAL RURAL UTILITIES COOPERATIVE FINANCE CORPORATION
NOTES TO CONSOLIDATED FINANCIAL STATEMENTS
The following table displays members’ subordinated certificates and the weighted-average interest rates as of May 31, 2016 and 2015.
May 31, | ||||||||||||||
2016 | 2015 | |||||||||||||
(Dollars in thousands) | Amounts Outstanding | Weighted- Average Interest Rate | Amounts Outstanding | Weighted- Average Interest Rate | ||||||||||
Membership subordinated certificates: | ||||||||||||||
Certificates maturing 2020 through 2095 | $ | 629,114 | $ | 628,916 | ||||||||||
Subscribed and unissued (1) | 949 | 16,119 | ||||||||||||
Total membership subordinated certificates | 630,063 | 4.94 | % | 645,035 | 4.89 | % | ||||||||
Loan and guarantee subordinated certificates: | ||||||||||||||
3% certificates maturing through 2040 | 110,164 | 110,164 | ||||||||||||
2% to 10% certificates maturing through 2045 | 279,823 | 301,361 | ||||||||||||
Non-interest bearing certificates maturing through 2047 | 203,463 | 229,126 | ||||||||||||
Subscribed and unissued (1) | 251 | 238 | ||||||||||||
Total loan and guarantee subordinated certificates | 593,701 | 2.99 | 640,889 | 2.94 | ||||||||||
Member capital securities: | ||||||||||||||
Securities maturing through 2048 | 220,046 | 5.00 | 219,496 | 5.00 | ||||||||||
Total members’ subordinated certificates | $ | 1,443,810 | 4.14 | % | $ | 1,505,420 | 4.08 | % | ||||||
___________________________
(1) The subscribed and unissued subordinated certificates represent subordinated certificates that members are required to purchase. Upon collection of full payment of the subordinated certificate amount, the certificate will be reclassified from subscribed and unissued to outstanding.
The following table presents the amount of members’ subordinated certificates maturing in each of the five fiscal years following May 31, 2016 and thereafter.
(Dollars in thousands) | Amount Maturing | Weighted-Average Interest Rate | |||||
2017 | $ | 8,137 | 3.25 | % | |||
2018 | 10,692 | 2.88 | |||||
2019 | 11,486 | 3.66 | |||||
2020 | 10,684 | 5.18 | |||||
2021 | 49,881 | 4.22 | |||||
Thereafter | 1,251,753 | 4.48 | |||||
Total(1) | $ | 1,342,633 | 4.45 | % | |||
___________________________
(1) Loan subordinated certificates totaling $101 million that amortize annually based on the outstanding balance of the related loan and $0.3 million in subscribed and unissued certificates for which a payment has been received are excluded because the future payment amounts are not fixed and readily determinable due to factors that impact the payment, such as loan conversions, loan repricing at the end of an interest rate term and prepayments. Amortization payments on these certificates totaled $16 million in fiscal year 2016 and represented 15% of amortizing loan subordinated certificates outstanding.
112
NATIONAL RURAL UTILITIES COOPERATIVE FINANCE CORPORATION
NOTES TO CONSOLIDATED FINANCIAL STATEMENTS
NOTE 10—DERIVATIVE INSTRUMENTS AND HEDGING ACTIVITIES |
Use of Derivatives
We are an end user of derivative financial instruments and do not engage in derivative trading. We use derivatives, primarily interest rate swaps and Treasury rate locks, to manage interest rate risk. Derivatives may be privately negotiated contracts, which are often referred to as over-the-counter (“OTC”) derivatives, or they may be listed and traded on an exchange. We generally engage in OTC derivative transactions.
Outstanding Notional Amount and Maturities of Derivatives
The notional amount provides an indication of the volume of our derivatives activity, but this amount is not recorded on our consolidated balance sheets. The notional amount is used only as the basis on which interest payments are determined and is not the amount exchanged. The following table shows the outstanding notional amounts and the weighted-average rate paid and received for our interest rate swaps, by type, as of May 31, 2016 and 2015. The substantial majority of our interest rate swaps use an index based on the London Interbank Offered Rate (“LIBOR”) for either the pay or receive leg of the swap agreement.
May 31, | ||||||||||||||||||||
2016 | 2015 | |||||||||||||||||||
(Dollars in thousands) | Notional Amount(1) | Weighted- Average Rate Paid | Weighted- Average Rate Received | Notional Amount | Weighted- Average Rate Paid | Weighted- Average Rate Received | ||||||||||||||
Pay fixed swaps | $ | 6,661,471 | 2.95 | % | 0.63 | % | $ | 5,776,533 | 3.15 | % | 0.28 | % | ||||||||
Receive fixed swaps | 3,499,000 | 1.02 | 2.82 | 3,849,000 | 0.79 | 3.09 | ||||||||||||||
Total interest rate swaps | $ | 10,160,471 | 2.29 | % | 1.39 | % | $ | 9,625,533 | 2.21 | % | 1.40 | % | ||||||||
____________________________
(1)Excludes $40 million notional amount of forward-starting swaps, with an effective start date of June 30, 2016, outstanding as of May 31, 2016.
In addition to the notional amount of swaps displayed in the above table, we had $40 million notional amount of forward-
starting swaps, with an effective start date of June 30, 2016, outstanding as of May 31, 2016. While the notional amount of these forward-starting swaps is not presented in the table above, we have recorded the fair value of these swaps as of May 31, 2016 in our consolidated financial statements.
The following table presents the maturities for each of the next five fiscal years and thereafter based on the notional amount of our interest rate swaps as of May 31, 2016.
Notional Amount(1) | Notional Amortization and Maturities | |||||||||||||
(Dollars in thousands) | 2017 | 2018 | 2019 | 2020 | 2021 | Thereafter | ||||||||
Interest rate swaps | $10,160,471 | $1,515,813 | $662,326 | $522,533 | $1,049,106 | $489,606 | $5,921,087 | |||||||
____________________________
(1)Excludes $40 million notional amount of forward starting swaps, with an effective start date of June 30, 2016, outstanding as of May 31, 2016.
Impact of Derivatives on Consolidated Balance Sheets
The following table displays the fair value of the derivative assets and derivative liabilities recorded on our consolidated balance sheets and the related outstanding notional amount of our interest rate swaps as of May 31, 2016 and 2015.
113
NATIONAL RURAL UTILITIES COOPERATIVE FINANCE CORPORATION
NOTES TO CONSOLIDATED FINANCIAL STATEMENTS
May 31, | ||||||||||||||||
2016 | 2015 | |||||||||||||||
(Dollars in thousands) | Fair Value | Notional Amount(1) | Fair Value | Notional Amount | ||||||||||||
Derivative assets | $ | 80,095 | $ | 2,879,567 | $ | 115,276 | $ | 3,448,615 | ||||||||
Derivative liabilities | (594,820 | ) | 7,280,904 | (408,382 | ) | 6,176,918 | ||||||||||
Total | $ | (514,725 | ) | $ | 10,160,471 | $ | (293,106 | ) | $ | 9,625,533 | ||||||
____________________________
(1)The notional amount excludes $40 million notional amount of forward starting swaps, with an effective start date of June 30, 2016, outstanding as of May 31, 2016. However, the fair value of these swaps as of May 31, 2016 is included in the above table and in our consolidated financial statements.
All of our master swap agreements include legally enforceable netting provisions that allow for offsetting of all contracts with a given counterparty in the event of default by one of the two parties. However, as indicated above in “Note 1—Summary of Significant Accounting Policies,” we report derivative asset and liability amounts on a gross basis based on individual contracts. The following table presents the gross fair value of derivative assets and liabilities reported on our consolidated balance sheets as of May 31, 2016 and 2015, and provides information on the impact of netting provisions and collateral pledged.
May 31, 2016 | ||||||||||||||||||||||||
Gross Amount of Recognized Assets/ Liabilities | Gross Amount Offset in the Balance Sheet | Net Amount of Assets/ Liabilities Presented in the Balance Sheet | Gross Amount Not Offset in the Balance Sheet | |||||||||||||||||||||
(Dollars in thousands) | Financial Instruments | Cash Collateral Pledged | Net Amount | |||||||||||||||||||||
Derivative assets: | ||||||||||||||||||||||||
Interest rate swaps | $ | 80,095 | $ | — | $ | 80,095 | $ | 80,095 | $ | — | $ | — | ||||||||||||
Derivative liabilities: | ||||||||||||||||||||||||
Interest rate swaps | 594,820 | — | 594,820 | 80,095 | — | 514,725 | ||||||||||||||||||
May 31, 2015 | ||||||||||||||||||||||||
Gross Amount of Recognized Assets/ Liabilities | Gross Amount Offset in the Balance Sheet | Net Amount of Assets/ Liabilities Presented in the Balance Sheet | Gross Amount Not Offset in the Balance Sheet | |||||||||||||||||||||
(Dollars in thousands) | Financial Instruments | Cash Collateral Pledged | Net Amount | |||||||||||||||||||||
Derivative assets: | ||||||||||||||||||||||||
Interest rate swaps | $ | 115,276 | $ | — | $ | 115,276 | $ | 115,276 | $ | — | $ | — | ||||||||||||
Derivative liabilities: | ||||||||||||||||||||||||
Interest rate swaps | 408,382 | — | 408,382 | 115,276 | — | 293,106 | ||||||||||||||||||
Impact of Derivatives on Consolidated Statements of Operations
Derivative gains (losses) reported in our consolidated statements of operations consist of derivative cash settlements and derivative forward value. Derivative cash settlements represent net contractual interest expense accruals on interest rate swaps during the period. The derivative forward value represents the change in fair value of our interest rate swaps during the reporting period due to changes in the estimate of future interest rates over the remaining life of our derivative contracts.
The following table presents the components of the derivative gains (losses) reported in our consolidated statements of operations for our interest rate swaps for the years ended May 31, 2016, 2015 and 2014.
114
NATIONAL RURAL UTILITIES COOPERATIVE FINANCE CORPORATION
NOTES TO CONSOLIDATED FINANCIAL STATEMENTS
Year Ended May 31, | ||||||||||||
(Dollars in thousands) | 2016 | 2015 | 2014 | |||||||||
Derivative cash settlements | $ | (88,758 | ) | $ | (82,906 | ) | $ | (73,962 | ) | |||
Derivative forward value | (221,083 | ) | (114,093 | ) | 39,541 | |||||||
Derivative losses | $ | (309,841 | ) | $ | (196,999 | ) | $ | (34,421 | ) | |||
Credit-Risk-Related Contingent Features
Our derivative contracts typically contain mutual early termination provisions, generally in the form of a credit rating trigger. Under the mutual credit rating trigger provisions, either counterparty may, but is not obligated to, terminate and settle the agreement if the credit rating of the other counterparty falls to a level specified in the agreement. If a derivative contract is terminated, the amount to be received or paid by us would be equal to the mark-to-market value, as defined in the agreement, as of termination date.
Our senior unsecured credit ratings from Moody’s and S&P were A2 and A, respectively, as of May 31, 2016. Both Moody’s and S&P had our ratings on stable outlook as of May 31, 2016. The following table displays the notional amounts of our derivative contracts with rating triggers as of May 31, 2016 and the payments that would be required if the contracts were terminated as of that date because of a downgrade of our unsecured credit ratings or the counterparty’s unsecured credit ratings below A3/A-, below Baa1/BBB+, to or below Baa2/BBB, below Baa3/BBB-, or to or below Ba2/BB+ by Moody’s or S&P, respectively. In calculating the payment amounts that would be required upon termination of the derivative contracts, we assumed that the amounts for each counterparty would be netted in accordance with the provisions of the master netting agreements for each counterparty. The net payment amounts are based on the fair value of the underlying derivative instrument, excluding the credit risk valuation adjustment, plus any unpaid accrued interest amounts.
(Dollars in thousands) | Notional Amount(1) | Payable Due From CFC | Receivable Due to CFC | Net (Payable)/Receivable | ||||||||||||
Impact of rating downgrade trigger: | ||||||||||||||||
Falls below A3/A-(2) | $ | 63,295 | $ | (18,232 | ) | $ | — | $ | (18,232 | ) | ||||||
Falls below Baa1/BBB+ | 6,516,255 | (316,969 | ) | — | (316,969 | ) | ||||||||||
Falls to or below Baa2/BBB (3) | 160,467 | (2,930 | ) | — | (2,930 | ) | ||||||||||
Falls below Baa3/BBB- | 392,068 | (30,244 | ) | — | (30,244 | ) | ||||||||||
Total | $ | 7,132,085 | $ | (368,375 | ) | $ | — | $ | (368,375 | ) | ||||||
___________________________
(1) Excludes $40 million notional amount of forward starting swaps, with an effective start date of June 30, 2016, outstanding as of May 31, 2016.
(2) Rating trigger for CFC falls below A3/A-, while rating trigger for counterparty falls below Baa1/BBB+ by Moody’s or S&P, respectively.
(3) Rating trigger for CFC falls to or below Baa2/BBB, while rating trigger for counterparty falls to or below Ba2/BB+ by Moody’s or S&P, respectively.
The aggregate amount, excluding the credit risk valuation adjustment, of all interest rate swaps with rating triggers that were in a net liability position was $368 million as of May 31, 2016. There were no interest rate swaps with rating triggers that were in a net asset position as of May 31, 2016.
115
NATIONAL RURAL UTILITIES COOPERATIVE FINANCE CORPORATION
NOTES TO CONSOLIDATED FINANCIAL STATEMENTS
NOTE 11—EQUITY |
The following table presents the components of equity as of May 31, 2016 and 2015. Total equity decreased $94 million to $817 million as of May 31, 2016. The decrease in total equity was attributable to the net loss of $52 million in fiscal year 2016 and the patronage capital retirement of $39 million in September 2015.
May 31, | ||||||||
(Dollars in thousands) | 2016 | 2015 | ||||||
Membership fees | $ | 974 | $ | 976 | ||||
Educational fund | 1,798 | 1,767 | ||||||
Total membership fees and educational fund | 2,772 | 2,743 | ||||||
Patronage capital allocated | 713,853 | 668,980 | ||||||
Members’ capital reserve | 587,219 | 501,731 | ||||||
Unallocated net loss: | ||||||||
Current-year derivative forward value loss | (220,827 | ) | (114,665 | ) | ||||
Prior-year cumulative derivative forward value losses | (287,077 | ) | (172,412 | ) | ||||
Current year cumulative derivative forward value losses | (507,904 | ) | (287,077 | ) | ||||
Other unallocated net income (loss) | (5,706 | ) | (6,135 | ) | ||||
Unallocated net loss | (513,610 | ) | (293,212 | ) | ||||
CFC retained equity | 790,234 | 880,242 | ||||||
Accumulated other comprehensive income | 1,058 | 4,080 | ||||||
Total CFC equity | 791,292 | 884,322 | ||||||
Noncontrolling interests | 26,086 | 27,464 | ||||||
Total equity | $ | 817,378 | $ | 911,786 | ||||
District of Columbia cooperative law requires cooperatives to allocate net earnings to patrons, to a general reserve in an amount sufficient to maintain a balance of at least 50% of paid-in capital and to a cooperative educational fund, as well as permits additional allocations to board-approved reserves. District of Columbia cooperative law also requires that a cooperative’s net earnings be allocated to all patrons in proportion to their individual patronage and each patron’s allocation be distributed to the patron unless the patron agrees that the cooperative may retain its share as additional capital.
Annually, the CFC Board of Directors allocates its net earnings to its patrons in the form of patronage capital, to a cooperative educational fund, to a general reserve, if necessary, and to board-approved reserves. An allocation to the general reserve is made, if necessary, to maintain the balance of the general reserve at 50% of the membership fees collected. CFC’s bylaws require the allocation to the cooperative educational fund to be at least 0.25% of its net earnings. Funds from the cooperative educational fund are disbursed annually to statewide cooperative organizations to fund the teaching of cooperative principles and for other cooperative education programs.
Currently, CFC has one additional board-approved reserve, the members’ capital reserve. The CFC Board of Directors determines the amount of net earnings that is allocated to the members’ capital reserve, if any. The members’ capital reserve represents net earnings that CFC holds to increase equity retention. The net earnings held in the members’ capital reserve have not been specifically allocated to members, but may be allocated to individual members in the future as patronage capital if authorized by the CFC Board of Directors.
All remaining net earnings are allocated to CFC’s members in the form of patronage capital. The amount of net earnings allocated to each member is based on the member’s patronage of CFC’s lending programs during the year. No interest is earned by members on allocated patronage capital. There is no effect on CFC’s total equity as a result of allocating net
116
NATIONAL RURAL UTILITIES COOPERATIVE FINANCE CORPORATION
NOTES TO CONSOLIDATED FINANCIAL STATEMENTS
earnings to members in the form of patronage capital or to board-approved reserves. The CFC Board of Directors has voted annually to retire a portion of the patronage capital allocation. Upon retirement, patronage capital is paid out in cash to the members to whom it was allocated. CFC’s total equity is reduced by the amount of patronage capital retired to its members and by amounts disbursed from board-approved reserves.
The current policy of the CFC Board of Directors is to retire 50% of the prior year’s allocated patronage capital and hold the remaining 50% for 25 years. The retirement amount and timing remains subject to annual approval by the CFC Board of Directors.
In July 2015, the CFC Board of Directors authorized the allocation of the fiscal year 2015 net earnings as follows: $1 million to the Cooperative Educational Fund, $16 million to the members’ capital reserve and $78 million to members in the form of patronage. In July 2015, the CFC Board of Directors authorized the retirement of allocated net earnings totaling $39 million, representing 50% of the fiscal year 2015 allocation. This amount was returned to members in cash in September 2015.
In July 2016, the CFC Board of Directors authorized the allocation of the fiscal year 2016 net earnings as follows: $1 million to the Cooperative Educational Fund, $86 million to the members’ capital reserve and $84 million to members in the form of patronage. In July 2016, the CFC Board of Directors authorized the retirement of allocated net earnings totaling $42 million, representing 50% of the fiscal year 2016 allocation. This amount will be returned to members in cash in the second quarter of fiscal year 2017. Future allocations and retirements of net earnings may be made annually as determined by the CFC Board of Directors with due regard for its financial condition. The CFC Board of Directors has the authority to change the current practice for allocating and retiring net earnings at any time, subject to applicable laws and regulations.
Total equity includes noncontrolling interest, which represents 100% of RTFC and NCSC equity, as the members of RTFC and NCSC own or control 100% of the interest in their respective companies. In accordance with District of Columbia cooperative law and its bylaws and board policies, RTFC allocates its net earnings to its patrons, a cooperative educational fund and a general reserve, if necessary. RTFC’s bylaws require that it allocate at least 1% of net income to a cooperative educational fund. Funds from the cooperative educational fund are disbursed annually to fund the teaching of cooperative principles and for other cooperative education programs. An allocation to the general reserve is made, if necessary, to maintain the balance of the general reserve at 50% of the membership fees collected. The remainder is allocated to borrowers in proportion to their patronage. RTFC retires at least 20% of its annual allocation, if any, to members in cash prior to filing the applicable tax return. Any additional amounts are retired as determined by the board of directors taking into consideration RTFC’s financial condition.
RTFC reported a net loss for fiscal year 2016; therefore, there will be no allocation to the educational fund or of patronage capital to members for fiscal 2016. In October 2015, the RTFC Board of Directors approved the allocation of RTFC’s earnings for fiscal year 2015, with 99% allocated to members and 1% allocated to a cooperative educational fund. A total of $0.9 million was allocated to members as follows: $0.2 million in cash and $0.7 million in the form of certificates to be redeemed at a later date. In January 2016, RTFC distributed the $0.2 million cash portion of the allocation to members, representing 20% of allocated net earnings for fiscal year 2015. NCSC’s bylaws require that it allocate at least 0.25% of its net earnings to a cooperative educational fund and an amount to the general reserve required to maintain the general reserve balance at 50% of membership fees collected. Funds from the cooperative educational fund are disbursed annually to fund the teaching of cooperative principles and for other cooperative education programs.
The NCSC Board of Directors has the authority to determine if and when net earnings will be allocated. There is no effect on noncontrolling interest as a result of RTFC and NCSC allocating net earnings to borrowers or board-approved reserves. There is a reduction to noncontrolling interest as a result of the cash retirement of amounts allocated to borrowers or to disbursements from board-approved reserves.
Accumulated Other Comprehensive Income
The following tables summarize, by component, the activity in the accumulated other comprehensive income as of and for the years ended May 31, 2016 and 2015.
117
NATIONAL RURAL UTILITIES COOPERATIVE FINANCE CORPORATION
NOTES TO CONSOLIDATED FINANCIAL STATEMENTS
Year Ended May 31, 2016 | ||||||||||||||||||||
(Dollars in thousands) | Unrealized Gains (Losses) AFS Securities | Unrealized Gains Derivatives | Unrealized Losses Foreclosed Assets | Unrealized Losses Defined Benefit Plan | Total | |||||||||||||||
Beginning balance | $ | 3,934 | $ | 5,371 | $ | (4,248 | ) | $ | (977 | ) | $ | 4,080 | ||||||||
Unrealized gains | 3,468 | — | — | — | 3,468 | |||||||||||||||
Unrealized losses | — | — | (5,575 | ) | (206 | ) | (5,781 | ) | ||||||||||||
Losses reclassified into earnings | — | — | — | 175 | 175 | |||||||||||||||
Gains reclassified into earnings | — | (884 | ) | — | — | (884 | ) | |||||||||||||
Other comprehensive income | 3,468 | (884 | ) | (5,575 | ) | (31 | ) | (3,022 | ) | |||||||||||
Ending balance | $ | 7,402 | $ | 4,487 | $ | (9,823 | ) | $ | (1,008 | ) | $ | 1,058 | ||||||||
Year Ended May 31, 2015 | ||||||||||||||||||||
(Dollars in thousands) | Unrealized Gains (Losses) AFS Securities | Unrealized Gains Derivatives | Unrealized Losses Foreclosed Assets | Unrealized Losses Defined Benefit Plan | Total | |||||||||||||||
Beginning balance | $ | (361 | ) | $ | 6,320 | $ | (2,310 | ) | $ | — | $ | 3,649 | ||||||||
Unrealized gains | 4,295 | — | — | — | 4,295 | |||||||||||||||
Unrealized losses | — | — | (1,938 | ) | (1,050 | ) | (2,988 | ) | ||||||||||||
Losses reclassified into earnings | — | — | — | 73 | 73 | |||||||||||||||
Gains reclassified into earnings | — | (949 | ) | — | — | (949 | ) | |||||||||||||
Other comprehensive income | 4,295 | (949 | ) | (1,938 | ) | (977 | ) | 431 | ||||||||||||
Ending balance | $ | 3,934 | $ | 5,371 | $ | (4,248 | ) | $ | (977 | ) | $ | 4,080 | ||||||||
We expect to reclassify approximately $1 million of amounts in accumulated other comprehensive income related to unrealized derivative gains into earnings over the next 12 months.
NOTE 12—EMPLOYEE BENEFITS |
NRECA Retirement Security Plan
CFC is a participant in the NRECA Retirement Security Plan (“the Plan”), a noncontributory, defined benefit multiemployer master pension plan. The employer identification number of the Plan is 53-0116145 and the Plan number is 333. Plan information is available publicly through the annual Form 5500, including attachments. The Plan is available to all qualified CFC employees. Under the Plan, participating employees are entitled to receive annually, under a 50% joint and surviving spouse annuity, 1.70% of the average of their five highest base salaries during their last 10 years of employment, multiplied by the number of years of participation in the Plan. As a multiemployer plan, there is no funding liability for CFC related to the Plan. CFC’s expense is limited to the annual premium to participate in the Plan.
The risks of participating in CFC’s multiemployer plan are different from single-employer plans based on the following characteristics of the Plan:
• | Assets contributed to the multiemployer plan by one participating employer may be used to provide benefits to employees of other participating employers. |
• | If a participating employer stops contributing to the Plan, the unfunded obligations of the Plan may be borne by the remaining participating employers. |
• | If CFC chooses to stop participating in the Plan, CFC may be required to pay a withdrawal liability representing an amount based on the underfunded status of the Plan. |
118
NATIONAL RURAL UTILITIES COOPERATIVE FINANCE CORPORATION
NOTES TO CONSOLIDATED FINANCIAL STATEMENTS
In the Plan, a certified zone status determination is not required and, therefore, not determined under the Pension Protection Act of 2006. In total, the Plan was more than 80% funded at January 1, 2016, 2015 and 2014, based on the Pension Protection Act (“PPA”) funding target and PPA actuarial value of assets on those dates. CFC made contributions of $4 million, $3 million and $4 million during fiscal years 2016, 2015 and 2014, respectively. In each of these years, these contributions represented less than 5% of total contributions made to the plan by all participating employers. There are no collective bargaining agreements in place that cover CFC’s employees. As of May 31, 2016, CFC’s contribution rate did not include a surcharge, there were no funding improvement plans or rehabilitation plans implemented or pending and there were no required minimum contributions.
Pension Restoration Plan
The Economic Growth and Tax Relief Act of 2001 set a limit of $265,000 for calendar year 2016 on the compensation to be used in the calculation of pension benefits. To restore potential lost benefits, we adopted a Pension Restoration Plan administered by NRECA. Under the Plan, the amount that NRECA invoices CFC for the Retirement Security Plan will continue to be based on the full compensation paid to each employee. Upon the retirement of a covered employee, NRECA will calculate the retirement and security benefit to be paid with consideration of the compensation limits and will pay the maximum benefit thereunder. NRECA will also calculate the retirement and security benefit that would have been available without consideration of the compensation limits and CFC will pay the difference. NRECA will then give CFC a credit against future retirement and security contribution liabilities in the amount paid by CFC to the covered employee.
The Pension Restoration Plan is an unfunded, unsecured deferred compensation plan (“Deferred Compensation Pension Restoration Plan”). The benefit and payout formula under the restoration component of the Retirement Security Plan is similar to that under the qualified plan component. However, three of the named executive officers have satisfied the provisions established to receive the benefit from this plan. Since there is no longer a risk of forfeiture of the benefit under the Pension Restoration Plan, distributions will be made from the plan to each of those named executive officers annually and credited back to CFC by NRECA on following pension invoices.
Executive Benefit Restoration Plan
NRECA has restricted additional participation in the Pension Restoration Plan. We, therefore, adopted a top-hat Executive Benefit Restoration Plan, effective January 1, 2015. The Executive Benefit Restoration Plan is a nonqualified, unfunded plan maintained by CFC to provide retirement benefits to a select group of senior management employees whose compensation exceed IRS limits for qualified defined benefit plans. There is a risk of forfeiture if participants leave the company prior to becoming fully vested in the Executive Benefit Restoration Plan. As of May 31, 2016 we recorded an unfunded pension obligation of $1 million. The pension obligation is included on our consolidated balance sheet as a component of other liabilities.
Defined Contribution Plan
CFC offers a 401(k) defined contribution savings program, the 401(k) Pension Plan, to all employees who have completed a minimum of 1,000 hours of service in either the first 12 consecutive months or first full calendar year of employment. CFC contributes an amount up to 2% of an employee’s salary each year for all employees participating in the program with a minimum 2% employee contribution. CFC contributed $0.5 million to the plan during each of the fiscal years 2016, 2015 and 2014.
NOTE 13—GUARANTEES |
We guarantee certain contractual obligations of our members so they may obtain various forms of financing. We use the same credit policies and monitoring procedures in providing guarantees as we do for loans and commitments. If a member system defaults on its obligation to pay debt service, then we are obligated to pay any required amounts under our guarantees. Meeting our guarantee obligations satisfies the underlying obligation of our member systems and prevents the
119
NATIONAL RURAL UTILITIES COOPERATIVE FINANCE CORPORATION
NOTES TO CONSOLIDATED FINANCIAL STATEMENTS
exercise of remedies by the guarantee beneficiary based upon a payment default by a member system. In general, the member system is required to repay any amount advanced by us with interest, pursuant to the documents evidencing the member system’s reimbursement obligation.
The following table summarizes total guarantees by type of guarantee and member class as of May 31, 2016 and 2015.
May 31, | ||||||||
(Dollars in thousands) | 2016 | 2015 | ||||||
Total by type: | ||||||||
Long-term tax-exempt bonds | $ | 475,965 | $ | 489,520 | ||||
Letters of credit | 319,596 | 382,233 | ||||||
Other guarantees | 113,647 | 114,747 | ||||||
Total | $ | 909,208 | $ | 986,500 | ||||
Total by member class: | ||||||||
CFC: | ||||||||
Distribution | $ | 127,890 | $ | 172,104 | ||||
Power supply | 759,345 | 763,746 | ||||||
Statewide and associate | 5,054 | 17,025 | ||||||
CFC total | 892,289 | 952,875 | ||||||
RTFC | 1,574 | 1,574 | ||||||
NCSC | 15,345 | 32,051 | ||||||
Total | $ | 909,208 | $ | 986,500 | ||||
We guarantee debt issued in connection with the construction or acquisition of pollution control, solid waste disposal, industrial development and electric distribution facilities, classified as long-term tax-exempt bonds in the table above. We unconditionally guarantee to the holders or to trustees for the benefit of holders of these bonds the full principal, interest and in most cases, premium, if any, on each bond when due. If a member system defaults in its obligation to pay debt service, then we are obligated to pay any required amounts under our guarantees. Such payment will prevent the occurrence of an event of default that would otherwise permit acceleration of the bond issue. In general, the member system is required to repay any amount advanced by us with interest, pursuant to the documents evidencing the member system’s reimbursement obligation.
The maturities for the long-term tax-exempt bonds and the related guarantees run through calendar year 2042. Amounts in the table represent the outstanding principal amount of the guaranteed bonds. As of May 31, 2016, our maximum potential exposure for the $70 million of fixed-rate tax-exempt bonds is $98 million, representing principal and interest. Of the amounts shown in the table above for long-term tax-exempt bonds, $406 million and $418 million as of May 31, 2016 and 2015, respectively, are adjustable or floating-rate bonds that may be converted to a fixed rate as specified in the applicable indenture for each bond offering. We are unable to determine the maximum amount of interest that we could be required to pay related to the remaining adjustable and floating-rate bonds. Many of these bonds have a call provision that in the event of a default allow us to trigger the call provision. This would limit our exposure to future interest payments on these bonds. Our maximum potential exposure is secured by mortgage liens on all of the systems’ assets and future revenue. If a system's debt is accelerated because of a determination that the interest thereon is not tax-exempt, the system’s obligation to reimburse us for any guarantee payments will be treated as a long-term loan.
The maturities for letters of credit run through calendar year 2024. The amounts shown in the table above represent our maximum potential exposure, of which $125 million is secured as of May 31, 2016. As of May 31, 2016 and 2015 the letters of credit include $76 million to provide the standby liquidity for adjustable and floating-rate tax-exempt bonds issued for the
120
NATIONAL RURAL UTILITIES COOPERATIVE FINANCE CORPORATION
NOTES TO CONSOLIDATED FINANCIAL STATEMENTS
benefit of our members, respectively. Security provisions include a mortgage lien on substantially all of the system’s assets, future revenue and the system’s investment in our commercial paper.
In addition to the letters of credit listed in the table above, under master letter of credit facilities in place as of May 31, 2016, we may be required to issue up to an additional $83 million in letters of credit to third parties for the benefit of our members. As of May 31, 2016, all of our master letter of credit facilities were subject to material adverse change clauses at the time of issuance. Prior to issuing a letter of credit, we would confirm that there has been no material adverse change in the business or condition, financial or otherwise, of the borrower since the time the loan was approved and confirm that the borrower is currently in compliance with the letter of credit terms and conditions. The maturities for other guarantees listed in the table run through calendar year 2025. The maximum potential exposure for these other guarantees is $114 million, all of which is unsecured.
As of May 31, 2016 and 2015, we had $308 million and $434 million of guarantees, respectively, representing 34% and 44%, respectively, of total guarantees, under which our right of recovery from our members was not secured.
In addition to the guarantees described above, as of May 31, 2016, we were the liquidity provider for $482 million of variable-rate tax-exempt bonds issued for our member cooperatives. While the bonds are in variable-rate mode, in return for a fee, we have unconditionally agreed to purchase bonds tendered or put for redemption if the remarketing agents are unable to sell such bonds to other investors. During the year ended May 31, 2016, we were not required to perform as liquidity provider pursuant to these obligations.
Guarantee Liability
As of May 31, 2016 and 2015, we recorded a guarantee liability of $17 million and $20 million, respectively, which represents the contingent and noncontingent exposures related to guarantees and liquidity obligations. The contingent guarantee liability as of May 31, 2016 and 2015 was $1 million based on management’s estimate of exposure to losses within the guarantee portfolio. The remaining balance of the total guarantee liability of $16 million and $19 million as of May 31, 2016 and 2015, respectively, relates to our noncontingent obligation to stand ready to perform over the term of our guarantees and liquidity obligations that we have entered into or modified since January 1, 2003.
The following table details the scheduled maturities of our outstanding guarantees in each of the five fiscal years following May 31, 2016 and thereafter:
(Dollars in thousands) | Amount Maturing | |||
2017 | $ | 164,607 | ||
2018 | 217,194 | |||
2019 | 14,561 | |||
2020 | 62,405 | |||
2021 | 112,622 | |||
Thereafter | 337,819 | |||
Total | $ | 909,208 | ||
121
NATIONAL RURAL UTILITIES COOPERATIVE FINANCE CORPORATION
NOTES TO CONSOLIDATED FINANCIAL STATEMENTS
NOTE 14—FAIR VALUE MEASUREMENT |
Fair Value of Financial Instruments
We use fair value measurements for the initial recording of certain assets and liabilities and periodic remeasurement of certain assets and liabilities on a recurring or nonrecurring basis. The accounting guidance for fair value measurements and disclosures establishes a three-level fair value hierarchy that prioritizes the inputs into the valuation techniques used to measure fair value. The levels of the fair value hierarchy, in priority order, include Level 1, Level 2 and Level 3. We describe the valuation technique for each level in “Note 1—Summary of Significant Accounting Policies.” The following tables present the carrying value and fair value for all of our financial instruments, including those carried at amortized cost, as of May 31, 2016 and 2015. The table also displays the classification within the fair value hierarchy of the valuation technique used in estimating fair value.
May 31, 2016 | Fair Value Measurements Using | |||||||||||||||||||
(Dollars in thousands) | Carrying Value | Fair Value | Level 1 | Level 2 | Level 3 | |||||||||||||||
Assets: | ||||||||||||||||||||
Cash and cash equivalents | $ | 204,540 | $ | 204,540 | $ | 204,540 | $ | — | $ | — | ||||||||||
Restricted cash | 4,628 | 4,628 | 4,628 | — | — | |||||||||||||||
Time deposits | 340,000 | 340,000 | — | 340,000 | — | |||||||||||||||
Investment securities available for sale | 87,940 | 87,940 | 87,940 | — | — | |||||||||||||||
Deferred compensation investments | 4,326 | 4,326 | 4,326 | — | — | |||||||||||||||
Loans to members, net | 23,129,438 | 23,297,924 | — | — | 23,297,924 | |||||||||||||||
Accrued interest receivable | 113,272 | 113,272 | — | 113,272 | — | |||||||||||||||
Debt service reserve funds | 17,151 | 17,151 | 17,151 | — | — | |||||||||||||||
Derivative assets | 80,095 | 80,095 | — | 80,095 | — | |||||||||||||||
Liabilities: | ||||||||||||||||||||
Short-term debt | $ | 2,938,848 | $ | 2,938,716 | $ | 1,185,959 | $ | 1,752,757 | $ | — | ||||||||||
Long-term debt | 17,473,603 | 18,577,261 | — | 11,327,004 | 7,250,257 | |||||||||||||||
Accrued interest payable | 132,996 | 132,996 | — | 132,996 | — | |||||||||||||||
Guarantee liability | 17,109 | 19,019 | — | — | 19,019 | |||||||||||||||
Derivative liabilities | 594,820 | 594,820 | — | 594,820 | — | |||||||||||||||
Subordinated deferrable debt | 742,212 | 751,395 | — | 751,395 | — | |||||||||||||||
Members’ subordinated certificates | 1,443,810 | 1,443,834 | — | — | 1,443,834 | |||||||||||||||
122
NATIONAL RURAL UTILITIES COOPERATIVE FINANCE CORPORATION
NOTES TO CONSOLIDATED FINANCIAL STATEMENTS
May 31, 2015 | Fair Value Measurements Using | |||||||||||||||||||
(Dollars in thousands) | Carrying Value | Fair Value | Level 1 | Level 2 | Level 3 | |||||||||||||||
Assets: | ||||||||||||||||||||
Cash and cash equivalents | $ | 248,836 | $ | 248,836 | $ | 248,836 | $ | — | $ | — | ||||||||||
Restricted cash | 485 | 485 | 485 | — | — | |||||||||||||||
Time deposits | 485,000 | 485,000 | — | 485,000 | — | |||||||||||||||
Investment securities available for sale | 84,472 | 84,472 | 84,472 | — | — | |||||||||||||||
Deferred compensation investments | 4,294 | 4,294 | 4,294 | — | — | |||||||||||||||
Loans to members, net | 21,435,327 | 21,961,048 | — | — | 21,961,048 | |||||||||||||||
Accrued interest receivable | 107,047 | 107,047 | — | 107,047 | — | |||||||||||||||
Debt service reserve funds | 25,602 | 25,602 | 25,602 | — | — | |||||||||||||||
Derivative assets | 115,276 | 115,276 | — | 115,276 | — | |||||||||||||||
Liabilities: | ||||||||||||||||||||
Short-term debt | $ | 3,127,754 | $ | 3,127,541 | $ | 1,494,131 | $ | 1,633,410 | $ | — | ||||||||||
Long-term debt | 16,244,794 | 18,565,673 | — | 11,316,785 | 7,248,888 | |||||||||||||||
Accrued interest payable | 123,697 | 123,697 | — | 123,697 | — | |||||||||||||||
Guarantee liability | 19,917 | 22,545 | — | — | 22,545 | |||||||||||||||
Derivative liabilities | 408,382 | 408,382 | — | 408,382 | — | |||||||||||||||
Subordinated deferrable debt | 395,699 | 406,000 | — | 406,000 | — | |||||||||||||||
Members’ subordinated certificates | 1,505,420 | 1,505,444 | — | — | 1,505,444 | |||||||||||||||
Following is a description of the valuation techniques we use for fair value measurement and disclosure, the significant inputs used in those techniques (if applicable) and the classification within the fair value hierarchy.
Cash and Cash Equivalents
Cash and cash equivalents include cash and certificates of deposit with original maturities of less than 90 days. Cash and cash equivalents are valued at the carrying value, which approximates fair value and are classified within Level 1 of the fair value hierarchy.
Restricted Cash
Restricted cash consists of cash and cash equivalents for which use is contractually restricted. The carrying value of restricted cash approximates fair value and is classified within Level 1 of the fair value hierarchy.
Investment Securities Available for Sale
Our investments in equity securities consist of investments in Farmer Mac Class A common stock and Series A, Series B and Series C preferred stock. These securities are classified as available for sale and reported at fair value in our consolidated balance sheets. We determine the fair value based on quoted prices on the stock exchange where the stock is traded. That stock exchange is an active market based on the volume of shares transacted. Fair values for these securities are classified within Level 1 of the fair value hierarchy.
Time Deposits
Time deposits with financial institutions in interest-bearing accounts have maturities of less than one year as of the reporting date and are valued at the carrying value, which approximates fair value and are classified within Level 2 of the fair value hierarchy.
123
NATIONAL RURAL UTILITIES COOPERATIVE FINANCE CORPORATION
NOTES TO CONSOLIDATED FINANCIAL STATEMENTS
Deferred Compensation Investments
CFC offers a nonqualified 457(b) deferred compensation plan to highly compensated employees. Such amounts deferred by employees are invested by the company. The deferred compensation investments are presented as other assets in the consolidated balance sheets in the other assets category at fair value. We calculate fair value based on the quoted price on the stock exchange where the funds are traded. That stock exchange is an active market based on the volume of shares transacted. The amounts are invested in highly liquid indices and mutual funds and are classified within Level 1 of the fair value hierarchy.
Loans to Members, Net
As part of receiving a loan from us, our members have additional requirements and rights that are not typical of other financial institutions, such as the ability to receive a patronage capital allocation, the general requirement to purchase subordinated certificates or member capital securities to meet their capital contribution requirements as a condition of obtaining additional credit from us, the option to select fixed rates from one year to maturity with the fixed rate resetting or repricing at the end of each selected rate term, the ability to convert from a fixed rate to another fixed rate or the variable rate at any time, and certain interest rate discounts that are specific to the borrower’s activity with us. These features make it difficult to obtain market data for similar loans. Therefore, we must use other methods to estimate the fair value.
Fair values for fixed-rate loans are estimated using a discounted cash flow technique by discounting the expected future cash flows using the current rates at which we would make similar loans to new borrowers for the same remaining maturities. The maturity date used in the fair value calculation of loans with a fixed rate for a selected rate term is the next repricing date since these borrowers must reprice their loans at various times throughout the life of the loan at the current market rate.
Loans with different risk characteristics, specifically nonperforming and restructured loans, are valued by using collateral valuations or by adjusting cash flows for credit risk and discounting those cash flows using the current rates at which similar loans would be made by us to borrowers for the same remaining maturities. See below for more details about how we calculate the fair value of certain impaired loans.
The carrying value of our variable-rate loans adjusted for credit risk approximates fair value since variable-rate loans are eligible to be reset at least monthly.
Loans to members are classified within Level 3 of the fair value hierarchy.
Accrued Interest Receivable
Accrued interest receivable represents accrued interest to be collected on our loans to members and derivative instruments and is valued at the carrying value, which approximates fair value. Accrued interest receivable is classified within Level 2 of the fair value hierarchy.
Debt Service Reserve Funds
Debt service reserve funds represent cash and/or investments on deposit with the bond trustee for tax-exempt bonds that we guarantee. Debt service reserve fund investments include actively traded tax-exempt municipal bonds and commercial paper. The carrying value approximates the fair value and the valuation technique is classified as Level 1.
Short-Term Debt
Short-term debt consists of commercial paper, select notes, bank bid notes, daily liquidity fund notes and medium-term notes. The fair value of short-term debt with maturities less than or equal to 90 days is carrying value, which is a reasonable estimate of fair value. The fair value of short-term debt with maturities greater than 90 days is estimated based on discounted cash flows and quoted market rates for debt with similar maturities. Short-term debt classified within Level 1 of the fair value hierarchy includes dealer commercial paper, bank bid notes and daily liquidity fund notes. Short-term debt classified within Level 2 of the fair value hierarchy consists of member commercial paper and select notes and is determined
124
NATIONAL RURAL UTILITIES COOPERATIVE FINANCE CORPORATION
NOTES TO CONSOLIDATED FINANCIAL STATEMENTS
based on discounted cash flows using discount rates consistent with current market rates for similar products with similar remaining terms.
Short-term debt classified within Level 2 also includes our medium-term notes with an original maturity equal to or less than one year. The fair value of short-term medium-term notes classified within Level 2 of the fair value hierarchy was determined based on discounted cash flows using a pricing model that incorporates available market information such as indicative benchmark yields and credit spread assumptions that are provided by third-party pricing services such as the banks that underwrite our other debt transactions.
Long-Term Debt
Long-term debt consists of collateral trust bonds, medium-term notes and long-term notes payable. We issue substantially
all collateral trust bonds and some medium-term notes in underwritten public transactions. Collateral trust bonds and medium-term notes are classified within Level 2 of the fair value hierarchy. The fair value of long-term debt classified within Level 2 of the fair value hierarchy was determined based on discounted cash flows. There is no active secondary trading for the underwritten collateral trust bonds and medium-term notes; therefore, dealer quotes and recent market prices are both used in estimating fair value. There is essentially no secondary market for the medium-term notes issued to our members or in transactions that are not underwritten; therefore, fair value is estimated based on observable benchmark yields and spreads for similar instruments supplied by banks that underwrite our other debt transactions.
The long-term notes payable are issued in private placement transactions and there is no secondary trading of such debt. Long-term notes payable are classified within Level 3 of the fair value hierarchy. The fair value was determined based on discounted cash flows using benchmark yields and spreads for similar instruments supplied by underwriter quotes for similar instruments, if available. Secondary trading quotes for our debt instruments used in the determination of fair value incorporate our credit risk.
Accrued Interest Payable
Accrued interest payable represents accrued interest to be paid on our debt and derivative instruments and is valued at the carrying value, which approximates fair value. Accrued interest payable is classified within Level 2 of the fair value hierarchy.
Guarantees
The fair value of our guarantee liability is based on the fair value of our contingent and noncontingent exposure related to our guarantees. The fair value of our contingent exposure for guarantees is based on management’s estimate of our exposure to losses within the guarantee portfolio using a discounted cash flow method. The fair value of our noncontingent exposure for guarantees issued is estimated based on the total unamortized balance of guarantee fees paid and guarantee fees to be paid discounted at our current short-term funding rate, which represents management’s estimate of the fair value of our obligation to stand ready to perform. Guarantees are classified within Level 3 of the fair value hierarchy.
Subordinated Deferrable Debt
Subordinated deferrable debt outstanding was issued in an underwritten public transaction. There is no active secondary trading for this subordinated deferrable debt; therefore, dealer quotes and recent market prices are both used in estimating fair value based on a discounted cash flow method. Subordinated deferrable debt is classified within Level 2 of the fair value hierarchy.
Members’ Subordinated Certificates
Members’ subordinated certificates include (i) membership subordinated certificates issued to our members, (ii) loan and guarantee subordinated certificates issued as a condition of obtaining loan funds or guarantees and (iii) member capital securities issued as voluntary investments by our members. All members’ subordinated certificates are nontransferable other than among members with CFC’s consent and there is no ready market from which to obtain fair value quotes. These certificates are valued at par and are classified within Level 3 of the fair value hierarchy.
125
NATIONAL RURAL UTILITIES COOPERATIVE FINANCE CORPORATION
NOTES TO CONSOLIDATED FINANCIAL STATEMENTS
Derivative Instruments
We account for derivative instruments in the consolidated balance sheets as either an asset or liability measured at fair value. We only enter into swap agreements with counterparties that are participating in our revolving lines of credit at the time the exchange agreements are executed. All of our swap agreements are subject to master netting agreements. There is not an active secondary market for the types of interest rate swaps we use. To calculate fair value, we determine the forward curve. The forward curve allows us to determine the projected floating rate cash flows and the discount factors needed to calculate the net present value of each interest payment. We use an internal model to calculate the value of our derivatives based on discounted cash flows utilizing observable market inputs. The significant observable market inputs for our derivatives include spot LIBOR rates, Eurodollar futures contracts and market swap rates. We record counterparty credit risk valuation adjustments on our derivative assets to properly reflect the credit quality of the counterparty. The credit default swap levels represent the credit risk premium required by a market participant based on the available information related to us and the counterparty. The technique for determining the fair value for our interest rate swaps is classified as Level 2.
Commitments
The fair value of our commitments is estimated based on the carrying value, or zero. Extensions of credit under these commitments, if exercised, would result in loans priced at market rates.
Recurring Fair Value Measurements
The following table presents the carrying value and fair value of financial instruments reported in our consolidated financial statements at fair value on a recurring basis as of May 31, 2016 and 2015 and the classification of the valuation technique within the fair value hierarchy.
May 31, | ||||||||||||||||||||||||
2016 | 2015 | |||||||||||||||||||||||
(Dollars in thousands) | Level 1 | Level 2 | Total | Level 1 | Level 2 | Total | ||||||||||||||||||
Investment securities available for sale | $ | 87,940 | $ | — | $ | 87,940 | $ | 84,472 | $ | — | $ | 84,472 | ||||||||||||
Deferred compensation investments | 4,326 | — | 4,326 | 4,294 | — | 4,294 | ||||||||||||||||||
Derivative assets | — | 80,095 | 80,095 | — | 115,276 | 115,276 | ||||||||||||||||||
Derivative liabilities | — | 594,820 | 594,820 | — | 408,382 | 408,382 | ||||||||||||||||||
Transfers Between Levels
We monitor the availability of observable market data to assess the appropriate classification of financial instruments within the fair value hierarchy and transfer between Level 1, Level 2 and Level 3 accordingly. Observable market data includes, but is not limited, to quoted prices and market transactions. Changes in economic conditions or market liquidity generally will drive changes in availability of observable market data. Changes in availability of observable market data, which also may result in changes in the valuation technique used, are generally the cause of transfers between levels. We did not have any transfers between levels for financial instruments measured at fair value on a recurring basis for the years ended May 31, 2016 and 2015.
Nonrecurring Fair Value Measurements
We may be required, from time to time, to measure certain assets at fair value on a nonrecurring basis in accordance with GAAP. Any adjustments to fair value usually result from application of lower-of-cost or fair value accounting or write-downs of individual assets. Assets measured at fair value on a nonrecurring basis as of May 31, 2016 and 2015 consisted of certain impaired loans and foreclosed assets. The fair value of these assets is determined based on the use of significant unobservable inputs, which are considered Level 3 in the fair value hierarchy. We provide additional information on foreclosed assets in “Note 1—Summary of Significant Accounting Policies” and “Note 5—Foreclosed Assets.”
126
NATIONAL RURAL UTILITIES COOPERATIVE FINANCE CORPORATION
NOTES TO CONSOLIDATED FINANCIAL STATEMENTS
The following table presents the carrying value and fair value of assets reported in our consolidated financial statements at fair value on a nonrecurring basis as of May 31, 2016 and 2015, and unrealized losses for the years ended May 31, 2016 and 2015.
Level 3 Fair Value | Unrealized Losses Year Ended May 31, | |||||||||||||||
(Dollars in thousands) | May 31, 2016 | May 31, 2015 | 2016 | 2015 | ||||||||||||
Impaired loans, net of specific reserves (1) | $ | 7,498 | $ | — | $ | (4,273 | ) | $ | — | |||||||
____________________________
(1) Excludes impaired loans for which there is no specific allowance recorded.
Significant Unobservable Level 3 Inputs
Impaired Loans
We utilize the fair value of the collateral underlying the loan or the estimated cash flows to determine the fair value and specific allowance for impaired loans. In estimating the fair value of the collateral, we may use third-party valuation specialists, internal estimates or a combination of both. The valuation technique used to determine fair value of the impaired loans provided by both our internal staff and third-party specialists includes market multiples (i.e., comparable companies). The significant unobservable inputs used in the determination of fair value for individually impaired loans is a multiple of earnings before interest, taxes, depreciation and amortization based on various factors (i.e., financial condition of the borrower). The significant unobservable inputs for estimating the fair value of impaired collateral-dependent loans are reviewed by our Credit Risk Management group to assess the reasonableness of the assumptions used and the accuracy of the work performed. In cases where we rely on third-party inputs, we use the final unadjusted third-party valuation analysis as support for any adjustments to our consolidated financial statements and disclosures.
Because of the limited amount of impaired loans as of May 31, 2016 and 2015, we do not believe that potential changes in the significant unobservable inputs used in the determination of the fair value for impaired loans will have a material impact on the fair value measurement of these assets or our results of operations.
NOTE 15—BUSINESS SEGMENTS |
Our consolidated financial statements include the financial results of CFC, RTFC and NCSC and certain entities created and controlled by CFC to hold foreclosed assets. Separate financial statements are produced for CFC, RTFC and NCSC and are the primary reports that management reviews in evaluating performance. The separate financial statements for CFC represent the consolidation of the financial results for CFC and the entities controlled by CFC. For more detail on the requirement to consolidate the financial results of RTFC and NCSC see “Note 1—Summary of Significant Accounting Policies.”
The consolidated CFC financial statements include three operating segments: CFC, RTFC and NCSC. As of May 31, 2016, the RTFC and NCSC operating segments are not required to be separately reported as the financial results of RTFC and NCSC do not meet the quantitative thresholds outlined by the accounting standards for segment reporting. As a result, we have elected to aggregate the RTFC and NCSC financial results into a combined “Other” segment.
CFC is the sole source of funding to RTFC. CFC is the primary source of funding to NCSC. Pursuant to a guarantee agreement, CFC has agreed to indemnify RTFC and NCSC for loan losses. The loan loss allowance at RTFC and NCSC is offset by a guarantee receivable from CFC.
The following tables display segment results for the years ended May 31, 2016, 2015 and 2014, and assets attributable to each segment as of May 31, 2016 and 2015.
127
NATIONAL RURAL UTILITIES COOPERATIVE FINANCE CORPORATION
NOTES TO CONSOLIDATED FINANCIAL STATEMENTS
Year Ended May 31, 2016 | ||||||||||||||||
(Dollars in thousands) | CFC | Other | Elimination | Consolidated | ||||||||||||
Statement of operations: | ||||||||||||||||
Interest income | $ | 1,001,241 | $ | 45,798 | $ | (34,403 | ) | $ | 1,012,636 | |||||||
Interest expense | (680,661 | ) | (35,665 | ) | 34,476 | (681,850 | ) | |||||||||
Net interest income | 320,580 | 10,133 | 73 | 330,786 | ||||||||||||
Provision for loan losses | 646 | — | — | 646 | ||||||||||||
Net interest income after provision for loan losses | 321,226 | 10,133 | 73 | 331,432 | ||||||||||||
Non-interest income: | ||||||||||||||||
Fee and other income | 21,164 | 4,350 | (3,729 | ) | 21,785 | |||||||||||
Derivative losses | (306,143 | ) | (3,698 | ) | — | (309,841 | ) | |||||||||
Results of operations of foreclosed assets | (6,899 | ) | — | — | (6,899 | ) | ||||||||||
Total non-interest income | (291,878 | ) | 652 | (3,729 | ) | (294,955 | ) | |||||||||
Non-interest expense: | ||||||||||||||||
General and administrative expenses | (77,407 | ) | (8,936 | ) | — | (86,343 | ) | |||||||||
Losses on early extinguishment of debt | (333 | ) | — | — | (333 | ) | ||||||||||
Other | (1,261 | ) | (3,655 | ) | 3,656 | (1,260 | ) | |||||||||
Total non-interest expense | (79,001 | ) | (12,591 | ) | 3,656 | (87,936 | ) | |||||||||
Loss before income taxes | (49,653 | ) | (1,806 | ) | — | (51,459 | ) | |||||||||
Income tax expense | — | (57 | ) | — | (57 | ) | ||||||||||
Net loss | $ | (49,653 | ) | $ | (1,863 | ) | $ | — | $ | (51,516 | ) | |||||
May 31, 2016 | ||||||||||||||||
CFC | Other | Elimination | Consolidated | |||||||||||||
Assets: | ||||||||||||||||
Total loans outstanding | $ | 23,112,714 | $ | 1,022,644 | $ | (982,841 | ) | $ | 23,152,517 | |||||||
Deferred origination costs | 10,179 | — | — | 10,179 | ||||||||||||
Less: Allowance for loan losses | (33,258 | ) | — | — | (33,258 | ) | ||||||||||
Loans to members, net | 23,089,635 | 1,022,644 | (982,841 | ) | 23,129,438 | |||||||||||
Other assets | 1,129,138 | 111,789 | (100,165 | ) | 1,140,762 | |||||||||||
Total assets | $ | 24,218,773 | $ | 1,134,433 | $ | (1,083,006 | ) | $ | 24,270,200 | |||||||
128
NATIONAL RURAL UTILITIES COOPERATIVE FINANCE CORPORATION
NOTES TO CONSOLIDATED FINANCIAL STATEMENTS
Year Ended May 31, 2015 | ||||||||||||||||
(Dollars in thousands) | CFC | Other | Elimination | Consolidated | ||||||||||||
Statement of operations: | ||||||||||||||||
Interest income | $ | 940,541 | $ | 46,666 | $ | (34,213 | ) | $ | 952,976 | |||||||
Interest expense | (634,287 | ) | (35,628 | ) | 34,231 | (635,684 | ) | |||||||||
Net interest income | 306,254 | 11,038 | — | 317,292 | ||||||||||||
Provision for loan losses | 21,954 | — | — | 21,954 | ||||||||||||
Net interest income after provision for loan losses | 328,208 | 11,038 | — | 339,246 | ||||||||||||
Non-interest income: | ||||||||||||||||
Fee and other income | 36,215 | 3,447 | (2,879 | ) | 36,783 | |||||||||||
Derivative losses | (193,289 | ) | (3,710 | ) | — | (196,999 | ) | |||||||||
Results of operations of foreclosed assets | (120,148 | ) | — | — | (120,148 | ) | ||||||||||
Total non-interest income | (277,222 | ) | (263 | ) | (2,879 | ) | (280,364 | ) | ||||||||
Non-interest expense: | ||||||||||||||||
General and administrative expenses | (69,129 | ) | (8,370 | ) | 969 | (76,530 | ) | |||||||||
Losses on early extinguishment of debt | (703 | ) | — | — | (703 | ) | ||||||||||
Other | (186 | ) | (1,891 | ) | 1,910 | (167 | ) | |||||||||
Total non-interest expense | (70,018 | ) | (10,261 | ) | 2,879 | (77,400 | ) | |||||||||
Income (loss) before income taxes | (19,032 | ) | 514 | — | (18,518 | ) | ||||||||||
Income tax expense | — | (409 | ) | — | (409 | ) | ||||||||||
Net income (loss) | $ | (19,032 | ) | $ | 105 | $ | — | $ | (18,927 | ) | ||||||
May 31, 2015 | ||||||||||||||||
CFC | Other | Elimination | Consolidated | |||||||||||||
Assets: | ||||||||||||||||
Total loans outstanding | $ | 21,431,927 | $ | 1,117,230 | $ | (1,089,937 | ) | $ | 21,459,220 | |||||||
Deferred origination costs | 9,797 | — | — | 9,797 | ||||||||||||
Less: Allowance for loan losses | (33,690 | ) | — | — | (33,690 | ) | ||||||||||
Loans to members, net | 21,408,034 | 1,117,230 | (1,089,937 | ) | 21,435,327 | |||||||||||
Other assets | 1,381,255 | 134,623 | (105,146 | ) | 1,410,732 | |||||||||||
Total assets | $ | 22,789,289 | $ | 1,251,853 | $ | (1,195,083 | ) | $ | 22,846,059 | |||||||
129
NATIONAL RURAL UTILITIES COOPERATIVE FINANCE CORPORATION
NOTES TO CONSOLIDATED FINANCIAL STATEMENTS
Year Ended May 31, 2014 | ||||||||||||||||
(Dollars in thousands) | CFC | Other | Elimination | Consolidated | ||||||||||||
Statement of operations: | ||||||||||||||||
Interest income | $ | 942,611 | $ | 50,856 | $ | (35,927 | ) | $ | 957,540 | |||||||
Interest expense | (653,189 | ) | (37,393 | ) | 35,927 | (654,655 | ) | |||||||||
Net interest income | 289,422 | 13,463 | — | 302,885 | ||||||||||||
Provision for loan losses | (3,498 | ) | — | — | (3,498 | ) | ||||||||||
Net interest income after provision for loan losses | 285,924 | 13,463 | — | 299,387 | ||||||||||||
Non-interest income: | ||||||||||||||||
Fee and other income | 17,255 | 1,433 | (926 | ) | 17,762 | |||||||||||
Derivative losses | (33,325 | ) | (1,096 | ) | — | (34,421 | ) | |||||||||
Results of operations of foreclosed assets | (13,494 | ) | — | — | (13,494 | ) | ||||||||||
Total non-interest income | (29,564 | ) | 337 | (926 | ) | (30,153 | ) | |||||||||
Non-interest expense: | ||||||||||||||||
General and administrative expenses | (64,555 | ) | (8,937 | ) | 926 | (72,566 | ) | |||||||||
Losses on early extinguishment of debt | (1,452 | ) | — | — | (1,452 | ) | ||||||||||
Other | (286 | ) | — | — | (286 | ) | ||||||||||
Total non-interest expense | (66,293 | ) | (8,937 | ) | 926 | (74,304 | ) | |||||||||
Income before income taxes | 190,067 | 4,863 | — | 194,930 | ||||||||||||
Income tax expense | — | (2,004 | ) | — | (2,004 | ) | ||||||||||
Net income | $ | 190,067 | $ | 2,859 | $ | — | $ | 192,926 | ||||||||
130
SUPPLEMENTARY DATA |
Selected Quarterly Financial Data (Unaudited)
Condensed quarterly financial information for fiscal years 2016 and 2015 is presented below.
Fiscal Year 2016 | ||||||||||||||||||||
(Dollars in thousands) | Aug 31, 2015 | Nov 30, 2015 | Feb 29, 2016 | May 31, 2016 | Total | |||||||||||||||
Interest income | $ | 246,116 | $ | 256,325 | $ | 253,633 | $ | 256,562 | $ | 1,012,636 | ||||||||||
Interest expense | (165,700 | ) | (167,124 | ) | (171,189 | ) | (177,837 | ) | (681,850 | ) | ||||||||||
Net interest income | 80,416 | 89,201 | 82,444 | 78,725 | 330,786 | |||||||||||||||
Provision for loan losses | (4,562 | ) | (1,240 | ) | 1,735 | 4,713 | 646 | |||||||||||||
Net interest income after provision for loan losses | 75,854 | 87,961 | 84,179 | 83,438 | 331,432 | |||||||||||||||
Non-interest income: | ||||||||||||||||||||
Derivative gains (losses) | (12,017 | ) | (101,184 | ) | (243,036 | ) | 46,396 | (309,841 | ) | |||||||||||
Other non-interest income | 2,780 | 9,085 | 7,076 | (4,055 | ) | 14,886 | ||||||||||||||
Total non-interest income | (9,237 | ) | (92,099 | ) | (235,960 | ) | 42,341 | (294,955 | ) | |||||||||||
Non-interest expense | (23,192 | ) | (20,240 | ) | (23,194 | ) | (21,310 | ) | (87,936 | ) | ||||||||||
Income (loss) before income taxes | 43,425 | (24,378 | ) | (174,975 | ) | 104,469 | (51,459 | ) | ||||||||||||
Income tax (expense) benefit | (330 | ) | (110 | ) | 593 | (210 | ) | (57 | ) | |||||||||||
Net income (loss) | 43,095 | (24,488 | ) | (174,382 | ) | 104,259 | (51,516 | ) | ||||||||||||
Less: Net (income) loss attributable to noncontrolling interests | 230 | 351 | 1,401 | (119 | ) | 1,863 | ||||||||||||||
Net income (loss) attributable to CFC | $ | 43,325 | $ | (24,137 | ) | $ | (172,981 | ) | $ | 104,140 | $ | (49,653 | ) | |||||||
Fiscal Year 2015 | ||||||||||||||||||||
(Dollars in thousands) | Aug 31, 2014 | Nov 30, 2014 | Feb 28, 2015 | May 31, 2015 | Total | |||||||||||||||
Interest income | $ | 237,291 | $ | 235,235 | $ | 238,740 | $ | 241,710 | $ | 952,976 | ||||||||||
Interest expense | (156,552 | ) | (158,275 | ) | (156,850 | ) | (164,007 | ) | (635,684 | ) | ||||||||||
Net interest income | 80,739 | 76,960 | 81,890 | 77,703 | 317,292 | |||||||||||||||
Provision for loan losses | 6,771 | (992 | ) | (2,304 | ) | 18,479 | 21,954 | |||||||||||||
Net interest income after provision for loan losses | 87,510 | 75,968 | 79,586 | 96,182 | 339,246 | |||||||||||||||
Non-interest income: | ||||||||||||||||||||
Derivative gains (losses) | (49,878 | ) | (74,561 | ) | (98,770 | ) | 26,210 | (196,999 | ) | |||||||||||
Other non-interest income | 1,658 | (19,119 | ) | 3,651 | (69,555 | ) | (83,365 | ) | ||||||||||||
Total non-interest income | (48,220 | ) | (93,680 | ) | (95,119 | ) | (43,345 | ) | (280,364 | ) | ||||||||||
Non-interest expense | (18,482 | ) | (18,241 | ) | (18,718 | ) | (21,959 | ) | (77,400 | ) | ||||||||||
Income (loss) before income taxes | 20,808 | (35,953 | ) | (34,251 | ) | 30,878 | (18,518 | ) | ||||||||||||
Income tax benefit (expense) | (196 | ) | 41 | 55 | (309 | ) | (409 | ) | ||||||||||||
Net income (loss) | 20,612 | (35,912 | ) | (34,196 | ) | 30,569 | (18,927 | ) | ||||||||||||
Less: Net (income) loss attributable to noncontrolling interest | (211 | ) | 207 | 217 | (318 | ) | (105 | ) | ||||||||||||
Net income (loss) attributable to CFC | $ | 20,401 | $ | (35,705 | ) | $ | (33,979 | ) | $ | 30,251 | $ | (19,032 | ) | |||||||
131
Item 9. Changes in and Disagreements with Accountants on Accounting and Financial Disclosure
None.
Item 9A. Controls and Procedures
Evaluation of Disclosure Controls and Procedures
Senior management, including the Chief Executive Officer and Chief Financial Officer, evaluated the effectiveness of disclosure controls and procedures as defined in Rules 13a-15(e) and 15d-15(e) under the Securities Exchange Act of 1934. At the end of the period covered by this Report, based on this evaluation process, the Chief Executive Officer and Chief Financial Officer have concluded that our disclosure controls and procedures are effective at the reasonable assurance level.
Management’s Report on Internal Control Over Financial Reporting
The management of National Rural Utilities Cooperative Finance Corporation (“we”, “our” or “us”) is responsible for establishing and maintaining adequate internal control over financial reporting as defined in Rules 13a-15(f) and 15d-15(f) under the Securities Exchange Act of 1934. Our internal control system over financial reporting is designed under the supervision of management, including the Chief Executive Officer and Chief Financial Officer, to provide reasonable assurance regarding the reliability of financial reporting and the preparation of financial statements for external purposes in accordance with U.S. generally accepted accounting principles. Our internal control over financial reporting includes those policies and procedures that:
(i) | pertain to the maintenance of records that, in reasonable detail, accurately and fairly reflect the transactions and dispositions of the assets; |
(ii) | provide reasonable assurance that transactions are recorded as necessary to permit preparation of financial statements in accordance with U.S. generally accepted accounting principles, and that receipts and expenditures of ours are being made only in accordance with authorizations of management and our directors; and |
(iii) | provide reasonable assurance regarding prevention or timely detection of unauthorized acquisition, use or dispositions of our assets. |
Any system of internal control, no matter how well designed, has inherent limitations, including but not limited to the possibility that a control can be circumvented or overridden and misstatements due to error or fraud may occur and not be detected. Also, because of changes in conditions, internal control effectiveness may vary over time. Therefore, even those systems determined to be effective can provide only reasonable assurance with respect to financial statement preparation and presentation.
Our management assessed the effectiveness of internal control over financial reporting as of May 31, 2016. In making this assessment, management used the criteria set forth by the Committee of Sponsoring Organizations of the Treadway Commission in Internal Control-Integrated Framework (“2013 Framework”).
Based on management’s assessment and those criteria, management believes that we maintained effective internal control over financial reporting as of May 31, 2016.
This annual report on Form 10-K does not include an attestation report of our registered public accounting firm regarding internal control over financial reporting. Management’s report was not subject to attestation by our registered public accounting firm pursuant to the rules of the U.S. Securities and Exchange Commission that permit us to furnish only management’s report with this annual report on Form 10-K.
Changes in Internal Control Over Financial Reporting
There were no changes in our internal control over financial reporting that occurred during our last fiscal quarter that have materially affected, or are reasonably likely to materially affect, our internal control over financial reporting.
132
By: | /s/ SHELDON C. PETERSEN | By: | /s/ J. ANDREW DON | ||
Sheldon C. Petersen Chief Executive Officer | J. Andrew Don Senior Vice President and Chief Financial Officer | ||||
August 25, 2016 | August 25, 2016 | ||||
By: | /s/ ROBERT E. GEIER | ||||
Robert E. Geier Vice President and Controller | |||||
August 25, 2016 | |||||
Item 9B. Other Information
None.
133
PART III
Item 10. | Directors, Executive Officers and Corporate Governance |
(a) Directors | ||||||
Name | Age | Director Since | Date Present Term Expires | |||
R. Grant Clawson (President of CFC) | 67 | 2011 | 2017 | |||
Mike Campbell (Vice President of CFC) | 68 | 2012 | 2018 | |||
Harry N. Park (Secretary-Treasurer of CFC) | 81 | 2013 | 2019 | |||
Patrick L. Bridges | 57 | 2013 | 2019 | |||
Robert Brockman | 66 | 2015 | 2019 | |||
Phillip A. Carson | 65 | 2015 | 2017 | |||
Mel Coleman | 62 | 2013 | 2017 | |||
Kent D. Farmer | 58 | 2014 | 2017 | |||
Roman E. Gillen | 54 | 2013 | 2019 | |||
Doyle Jay Hanson | 70 | 2015 | 2018 | |||
Thomas L. Hayes | 60 | 2014 | 2017 | |||
Robert M. Hill | 68 | 2013 | 2019 | |||
Jimmy A. LaFoy | 75 | 2015 | 2018 | |||
Curtin R. Rakestraw II | 63 | 2013 | 2019 | |||
Debra L. Robinson | 58 | 2016 | 2019 | |||
Bradley J. Schardin | 56 | 2015 | 2018 | |||
Mark D. Snowden | 41 | 2015 | 2018 | |||
Dean R. Tesch | 54 | 2015 | 2018 | |||
Kirk A. Thompson | 53 | 2011 | 2017 | |||
Stephen C. Vail | 57 | 2014 | 2017 | |||
Todd P. Ware | 50 | 2015 | 2018 | |||
Alan W. Wattles | 50 | 2016 | 2019 | |||
Gregory D. Williams | 57 | 2015 | 2018 | |||
Under CFC’s bylaws, the board of directors shall be composed of the following individuals:
• | 20 directors, which must include one general manager and one director of a member system from each of 10 districts (but no more than one director from each state except in a district where only one state has members); |
• | two directors designated by NRECA; and |
• | if the board determines at its discretion that an at-large director shall be elected, one at-large director who satisfies the requirements of an Audit Committee financial expert as defined by the Sarbanes-Oxley Act of 2002 and is a trustee, director, manager, Chief Executive Officer or Chief Financial Officer of a member. |
The 20 district-level directors are each elected by a vote of the members within the district for which the director serves. The at-large director who satisfies the requirements of an Audit Committee financial expert is elected by the vote of all members. All CFC directors are elected for a three-year term and can serve a maximum of two consecutive terms. Each CFC member (other than associates) is entitled to one vote with respect to elections of directors in their districts.
134
(b) Executive Officers | |||||||
Title | Name | Age | Held Present Office Since(1) | ||||
President and Director | R. Grant Clawson | 67 | 2016 | ||||
Vice President and Director | Mike Campbell | 67 | 2016 | ||||
Secretary-Treasurer and Director | Harry N. Park | 81 | 2016 | ||||
Chief Executive Officer | Sheldon C. Petersen | 63 | 1995 | ||||
Executive Vice President and Chief Operating Officer | John T. Evans | 66 | 2011 | ||||
Senior Vice President and Chief Financial Officer | J. Andrew Don | 56 | 2014 | ||||
Senior Vice President, Special Asset Management | Steven L. Lilly | 66 | 2014 | ||||
Senior Vice President, Credit Risk Management | John M. Borak | 71 | 2003 | ||||
Senior Vice President, Member Services | Joel Allen | 50 | 2014 | ||||
Senior Vice President and General Counsel | Roberta B. Aronson | 58 | 2014 | ||||
Senior Vice President, Corporate Relations | Brad L. Captain | 46 | 2014 | ||||
Senior Vice President, Corporate Services | Graceann D. Clendenen | 58 | 2014 | ||||
Senior Vice President, Strategic Services | Steven M. Kettler | 57 | 2014 | ||||
Senior Vice President, Loan Operations | Robin C. Reed | 53 | 2016 | ||||
Senior Vice President, Business and Industry Development | Gregory Starheim | 53 | 2016 | ||||
___________________________
(1) Refers to fiscal year.
The President, Vice President and Secretary-Treasurer are elected annually by the board of directors at its first organizational meeting immediately following CFC’s annual membership meeting, each to serve a term of one year; the Chief Executive Officer serves at the pleasure of the board of directors; and the other Executive Officers serve at the pleasure of the Chief Executive Officer.
(c) Identification of Certain Significant Employees
Not applicable.
(d) Family Relationships
No family relationship exists between any director or executive officer and any other director or executive officer of the registrant.
(e) (1) and (2) Business Experience and Directorships
Mr. Clawson has been a trustee of Continental Divide Electric Cooperative in Grants, New Mexico, since 1989, and has served as a director and member of the contract committee of the Tri-State Generation and Transmission Cooperative for the past four years. Mr. Clawson is a farmer, rancher and school administrator and has been the owner of a custom saddle business since 1974. As a trustee of Continental Divide Electric Cooperative, Mr. Clawson has acquired extensive experience with and knowledge of the rural electric cooperative industry and, therefore, we believe Mr. Clawson has the qualifications, skills and experience necessary to act in the best interests of CFC and to serve as a director on the CFC board.
Mr. Campbell has been the executive vice president and general manager of Central Florida Electric Cooperative, Inc. in Chiefland, Florida, since 2005. He served as the vice president of engineering and operations of Coastal Electric Cooperative in Midway, Georgia, from 1998 to 2005 and the engineering manager of Colquitt Electric Membership Corporation in Moultrie, Georgia, from 1991 to 1998. He has served as a trustee on the executive committee of Seminole Electric Cooperative since 2005, and as a director and secretary-treasurer of the Florida Rural Electric Self Insurer’s Fund and Florida Rural Electric Credit Union since 2005. As the general manager of Central Florida Electric Cooperative, Mr. Campbell has acquired extensive experience with and knowledge of the rural electric cooperative industry and, therefore, we
135
believe Mr. Campbell has the qualifications, skills and experience necessary to act in the best interests of CFC and to serve as a director on the CFC board.
Mr. Park has been a director of Southern Rivers Energy in Barnesville, Georgia, since 1997. He has also served as a director of Georgia System Operations Corporation since 2005. As the director of Southern Rivers Energy, Mr. Park has acquired extensive experience with and knowledge of the rural electric cooperative industry and, therefore, we believe Mr. Park has the qualifications, skills and experience necessary to act in the best interest of CFC and to serve as a director on the CFC board.
Mr. Bridges has been the CFO of Tri-State G&T Association in Westminster, Colorado, since 2008. He served as the vice president and treasurer of Texas-New Mexico Power Company from 2000 to 2003. Mr. Bridges has more than 30 years of experience working in the electric power industry and 20 years of experience working for companies registered with the U.S. Securities and Exchange Commission. Mr. Bridges chaired the Finance Subcommittee of the G&T Managers’ Technical Advisory Council from 2009 to 2012, served as president of the G&T Accounting and Finance Association from 2014 to 2015, and is chairman of the board of the Colorado Council for Economic Education. Mr. Bridges is a CPA and chartered financial analyst. As the CFO of Tri-State G&T Association, Mr. Bridges has acquired extensive experience with and knowledge of the rural electric cooperative industry and, therefore, we believe Mr. Bridges has the qualifications, skills and experience necessary to act in the best interest of CFC and to serve as a director on the CFC board. Mr. Bridges’ experience with accounting principles, financial reporting rules and regulations and evaluating financial results makes him a valuable resource as a director and member of the Audit Committee of CFC.
Mr. Brockman has been a director at Wheatland Rural Electric Association in Wheatland, Wyoming, since 2006. He has served as president and real estate broker for Keyhole Land Co. in Wheatland, Wyoming, since 1988. As a director of Wheatland Rural Electric Association, Mr. Brockman has acquired extensive experience with and knowledge of the rural electric cooperative industry and, therefore, we believe Mr. Brockman has the qualifications, skills and experience necessary to act in the best interests of CFC and to serve as a director on the CFC board.
Mr. Carson has been a director at Tri-County Electric Cooperative in Mt. Vernon, Illinois, since 1999. He has been a director on the NRECA Board of Directors since 2006, and has served as NRECA board vice president since 2015. Until 2016, Mr. Carson operated a 160-year-old family dairy farm. He now serves as pastor at First Presbyterian Church in Nashville, Illinois. As a director of Tri-County Electric Cooperative, Mr. Carson has acquired extensive experience with and knowledge of the rural electric cooperative industry and, therefore, we believe Mr. Carson has the qualifications, skills and experience necessary to act in the best interests of CFC and to serve as a director on the CFC board.
Mr. Coleman has been the CEO of North Arkansas Electric Cooperative in Salem, Arkansas, since 2001. He has served as president of the NRECA Board of Directors since February 2015 and has been a director of NRECA since 2004. In addition, Mr. Coleman has been a director of Arkansas Electric Cooperative Corporation since January 2001 and of Arkansas Electric Cooperatives since January 2001. Before becoming CEO, he was assistant general manager from 1999 to 2001, and manager of member services from 1988 to 1999 for North Arkansas Electric Cooperative. Mr. Coleman is a member of the Development Council of Arkansas State University in Mountain Home, Arkansas. As the CEO of North Arkansas Electric Cooperative, Mr. Coleman has acquired extensive experience with and knowledge of the rural electric cooperative industry and, therefore, we believe Mr. Coleman has the qualifications, skills and experience necessary to act in the best interest of CFC and to serve as a director on the CFC board. Mr. Coleman’s experience with accounting principles, financial reporting rules and regulations and evaluating financial results makes him a valuable resource as a director and member of the Audit Committee of CFC.
Mr. Farmer has been the president and CEO of Rappahannock Electric Cooperative in Fredericksburg, Virginia, since 2004 and has been employed there in various roles, including chief operating officer and chief financial officer, since 1979. Mr. Farmer has been the treasurer/secretary of the Old Dominion Electric Cooperative Board of Directors since July 2013 and on the University of Mary Washington Business Advisory Board since 2013. He has served as a board member of the Virginia, Maryland and Delaware Association of Electric cooperatives since 2004. As the president and CEO of Rappahannock Electric Cooperative, Mr. Farmer has acquired extensive experience with and knowledge of the rural electric cooperative industry and, therefore, we believe Mr. Farmer has the qualifications, skills and experience necessary to act in the best interests of CFC and to serve as a director on the CFC board.
136
Mr. Gillen has been the president and CEO of Consumers Power, Inc. in Philomath, Oregon, since 2006. He served as director of information systems from 1986 to 2003 and assistant manager from 2004 to 2005. Mr. Gillen served as chairman of Power Resources Cooperative from 2008 to 2010, secretary of Casco Communications, Inc. from 2006 to present, and president of the Oregon Rural Electric Cooperative Association from 2011 to 2012. He has also been vice chairman of PNGC Power since 2013. As the president and CEO of Consumers Power, Inc., Mr. Gillen has acquired extensive experience with and knowledge of the rural electric cooperative industry and, therefore, we believe Mr. Gillen has the qualifications, skills and experience necessary to act in the best interest of CFC and to serve as a director on the CFC board.
Mr. Hanson has been a director of Fall River Rural Electric Cooperative in Ashton, Idaho since 2005. From 1968 until 2001 Mr. Hanson served as a Cooperative Extension agent for the University of Idaho and University of Wyoming. He also chaired the Idaho Consumer-Owned Utilities Association Nominating Committee from 2013 until 2014. As a director of Fall River Rural Electric Cooperative, Mr. Hanson has acquired extensive experience with and knowledge of the rural electric cooperative industry and, therefore, we believe Mr. Hanson has the qualifications, skills and experience necessary to act in the best interests of CFC and to serve as a director on the CFC board. Mr. Hanson’s experience with accounting principles, financial reporting rules and regulations and evaluating financial results makes him a valuable resource as a director and member of the Audit Committee of CFC.
Mr. Hayes has been the vice president of Brown County Rural Electrical Association in Sleepy Eye, Minnesota, since March 2014. He served as the president of Brown County Rural Electrical Association from 2004 to 2014. He has been a self-employed farmer since 1973. Mr. Hayes was a director and utility committee chair of Cooperative Network from 1998 to 2014. As the president of Brown County Rural Electrical Association, Mr. Hayes has acquired extensive experience with and knowledge of the rural electric cooperative industry and, therefore, we believe Mr. Hayes has the qualifications, skills and experience necessary to act in the best interests of CFC and to serve as a director on the CFC board.
Mr. Hill has been the board chairman of First Electric Cooperative Corporation in Jacksonville, Arkansas, since 2009 and a director since 1983. Since 2005 he has also served as a director and audit committee member of the Arkansas Electric Cooperative Corporation. From 1990 until 2000, Mr. Hill was a member of the Arkansas State Banking Board and from 1986 until 2008 was the owner of Chart Bank and the accounting firm Robert M. Hill. He is currently the owner and chair of Hill Investments, LLC, and is a former CPA. As the chair of First Electric Cooperative Corporation, Mr. Hill has acquired extensive experience with and knowledge of the rural electric cooperative industry and, therefore, we believe Mr. Hill has the qualifications, skills and experience necessary to act in the best interest of CFC and to serve as a director on the CFC board. Mr. Hill’s experience with accounting principles, financial reporting rules and regulations and evaluating financial results makes him a valuable resource as a director and member of the Audit Committee of CFC.
Mr. LaFoy has served as a director and the secretary-treasurer for Baldwin County Electric Member Corporation in Gulf Shores, Alabama, since July 2009. Mr. LaFoy is a certified public accountant and since 1977 has owned and operated the public accounting firm LaFoy & Associates. He is a founding organizer and has served as a member of the Southern States Bank Board since August 2007. Mr. LaFoy also was a member of the Farmers National Bank Board of Opelika from 1989 to 2002 and the First American Bank Advisory Board from 2002 to 2006. Mr. LaFoy was a council member from 1981 until 1986 and president from 1985 until 1986 of the Alabama Society of Certified Public Accountants. He was also a council member of the American Institute of Certified Public Accountants from 1986 until 1990. As a director and secretary-treasurer of Baldwin County Electric Member Corporation, Mr. LaFoy has acquired extensive experience with and knowledge of the rural electric cooperative industry and, therefore, we believe Mr. LaFoy has the qualifications, skills and experience necessary to act in the best interests of CFC and to serve as a director on the CFC board. Mr. LaFoy’s experience with accounting principles, financial reporting rules and regulations and evaluating financial results makes him a valuable resource as a director and member of the Audit Committee of CFC.
Mr. Rakestraw has been a director of Sullivan County Rural Electric Cooperative in Forksville, Pennsylvania, since 1986. He has also been a director of Allegheny Electric Cooperative since 2002 and director of Continental Cooperative Services since 2002. Mr. Rakestraw served as the director and president of the Pennsylvania Corn Growers Association from 1985 to 1997 and as a founding director of Lycoming Farmland Preservation. He is the owner of Rakestraw Farms and Promised Land Busing. As a director of Sullivan County Rural Electric Cooperative, Mr. Rakestraw has acquired extensive experience with and knowledge of the rural electric cooperative industry and, therefore, we believe Mr. Rakestraw has the qualifications, skills and experience necessary to act in the best interest of CFC and to serve as a director on the CFC board.
137
Mrs. Robinson has served as chief executive officer and general manager of Wood County Electric Cooperative, Inc. in Quitman, Texas, since 1997. As chief executive officer and general manager of Wood County Electric Cooperative, Inc., Mrs. Robinson has acquired extensive experience with and knowledge of the rural electric cooperative industry and, therefore, we believe Mrs. Robinson has the qualifications, skills and experience necessary to act in the best interests of CFC and to serve as a director on the CFC board.
Mr. Schardin has served as general manager of Southeastern Electric Cooperative in Marion, South Dakota, since 1990. He chaired the Managers Advisory Committee for his cooperative’s wholesale power supplier, East River Electric Power Cooperative from January 2013 to 2015 and at the same time was a member of the Basin Electric Power Cooperative Managers Advisory Committee. Mr. Schardin has also been a member of the South Dakota Rural Electric Association Strategic Issues Committee since 2005 and a director on the Rural Electric Economic Development Fund Board of Directors since 1996. As general manager of Southeastern Electric Cooperative, Mr. Schardin has acquired extensive experience with and knowledge of the rural electric cooperative industry and, therefore, we believe Mr. Schardin has the qualifications, skills and experience necessary to act in the best interests of CFC and to serve as a director on the CFC board.
Mr. Snowden has served as CEO of Cimarron Electric Cooperative in Kingfisher, Oklahoma, since 2009. He began his career with the cooperative in 1998 in the Member Services department. Mr. Snowden has served as a director on the Oklahoma Association of Electric Cooperatives board since 2009, where he chairs the Legislative Committee. In addition, he heads the Oklahoma Association of Electric Cooperatives Managers Association. Since 2009, he has served as an alternate director on the board of his cooperative’s wholesale power supplier, Western Farmers Electric Cooperative, and since 2013 has also been chairman of the Western Farmers Electric Cooperative Managers Group. As CEO of Cimarron Electric Cooperative, Mr. Snowden has acquired extensive experience with and knowledge of the rural electric cooperative industry and, therefore, we believe Mr. Snowden has the qualifications, skills and experience necessary to act in the best interests of CFC and to serve as a director on the CFC board.
Mr. Tesch has served as board chairman of Taylor Electric Cooperative in Stetsonville, Wisconsin, since August 2014 and as a director for the cooperative’s wholesale power supplier, Dairyland Power Cooperative, headquartered in La Crosse, Wisconsin, since June 2014. Mr. Tesch has been a certified financial planner since 2000 and is a former elementary school teacher. Since 2010 he has been a member of the Certified Financial Planners Board Item Writing Group and from 2002 until 2014 served as treasurer for former Wisconsin State Representative Mary Williams. As the board chairman of Taylor Electric Cooperative and a director of Dairyland Power Cooperative, Mr. Tesch has acquired extensive experience with and knowledge of the rural electric cooperative industry and, therefore, we believe Mr. Tesch has the qualifications, skills and experience necessary to act in the best interest of CFC and to serve as a director on the CFC board.
Mr. Thompson has been the general manager of CMS Electric Cooperative, Inc., in Meade, Kansas since 1991. Mr. Thompson previously served as board president of Kansas Electric Power Cooperative and board president of High Plains Energy LLC. Mr. Thompson has also served as board president of Southwest Kansas Area Cooperative District 613. As general manager of CMS Electric Cooperative, Mr. Thompson has acquired extensive experience with and knowledge of the rural electric cooperative industry and, therefore, we believe Mr. Thompson has the qualifications, skills and experience necessary to act in the best interests of CFC and to serve as a director on the CFC board. Mr. Thompson’s experience with accounting principles, financial reporting rules and regulations and evaluating financial results makes him a valuable resource as a director and member of the Audit Committee of CFC.
Mr. Vail served as the board chairman of NineStar Connect in Greenfield, Indiana from 2012 to 2016. Since 2011, he also has served as a board member of the Indiana Statewide Association of Rural Electric Cooperatives. Mr. Vail has been the owner of ETL Group since 2011. The ETL Group provides strategic and operational efficiency consulting services to business entities and non-profit organizations. Mr. Vail has held various positions at the Hancock Regional Hospital, and he was the senior special accounts loan officer at Farm Credit Services. He has been a member of Hancock Redevelopment Commission since 2010. As the board chairman of NineStar Connect, Mr. Vail has acquired extensive experience with and knowledge of the rural electric cooperative industry. We, therefore, believe Mr. Vail has the qualifications, skills and experience necessary to act in the best interests of CFC and to serve as a director on the CFC board. Mr. Vail’s experience with accounting principles, financial reporting rules and regulations and evaluating financial results makes him a valuable resource as a director and member of the Audit Committee of CFC.
138
Mr. Ware has been president and CEO of Licking Rural Electrification-The Energy Cooperative in Newark, Ohio, since 2012. Mr. Ware was the vice president and CFO of Licking Rural Electrification-The Energy Cooperative from 2000 until 2011. He has been a director of Licking County United Way and Genesis Healthcare Foundation since 2009, Altheirs Oil Inc. since 2005 and the cooperative’s wholesale power supplier, Buckeye Power Cooperative, since 2012. He is also a member of the Buckeye Power Cooperative Reliability Committee and the American Gas Association Leadership Council. As president and CEO of Licking Rural Electrification-The Energy Cooperative, Mr. Ware has acquired extensive experience with and knowledge of the rural electric cooperative industry and, therefore, we believe Mr. Ware has the qualifications, skills and experience necessary to act in the best interests of CFC and to serve as a director on the CFC board. Mr. Ware’s experience with accounting principles, financial reporting rules and regulations and evaluating financial results makes him a valuable resource as a director and member of the Audit Committee of CFC.
Mr. Wattles has been president and chief executive officer of Monroe County Electric Co-Operative in Waterloo, Illinois, since 2002. He has been a board member of Southern Illinois Power Cooperative since 2002. As president and chief executive officer of Monroe County Electric Co-Operative, Mr. Wattles has acquired extensive experience with and knowledge of the rural electric cooperative industry and, therefore, we believe Mr. Wattles has the qualifications, skills and experience necessary to act in the best interests of CFC and to serve as a director on the CFC board.
Mr. Williams has been the general manager and executive vice president of Appalachian Electric Cooperative in New Market, Tennessee, since 2010. He has been a board member of the East Tennessee Economic Development Agency since 2010 and the Northeast Tennessee Valley Industrial Development Association since 2010. He has served as chairman of the board of the Tenessee Valley Public Power Association for the last two years. As general manager and executive vice president of Appalachian Electric Cooperative, Mr. Williams has acquired extensive experience with and knowledge of the rural electric cooperative industry and, therefore, we believe Mr. Williams has the qualifications, skills and experience necessary to act in the best interests of CFC and to serve as a director on the CFC board. Mr. William’s experience with accounting principles, financial reporting rules and regulations and evaluating financial results makes him a valuable resource as a director and member of the Audit Committee of CFC.
Mr. Petersen joined CFC in August 1983 as an area representative. He became the director of Policy Development and Internal Audit in January 1990, director of Credit Analysis in November 1990 and corporate secretary on June 1, 1992. He became assistant to the governor on May 1, 1993. He became assistant to the governor and acting administrative officer on June 1, 1994. He became governor and CEO on March 1, 1995. Mr. Petersen began his career in the rural electrification program in 1976 as staff assistant for Nishnabotna Rural Electric Cooperative in Harlan, Iowa. He later served as general manager of Rock County Electric Cooperative Association in Janesville, Wisconsin.
Mr. Evans joined CFC as Senior Vice President of Operations in November 1997. On June 1, 2010, Mr. Evans became Executive Vice President and Chief Operating Officer. He was Senior Vice President and Chief Operating Officer of Suburban Hospital Healthcare System, Bethesda, Maryland, from 1994 to 1997. He was Senior Vice President and Chief Operating Officer for Geisinger Medical Center, Danville, Pennsylvania, from 1991 to 1994.
Mr. Don joined CFC in September 1999 as Director of Loan Syndications and became Vice President of Capital Market Relations in June 2005. Effective June 2010, Mr. Don became CFC’s Senior Vice President and Treasurer. Effective July 1, 2013, Mr. Don became CFC’s Senior Vice President and Chief Financial Officer. Prior to joining CFC, he held the position of Vice President and Manager of the Washington, D.C. Office for The Bank of Tokyo-Mitsubishi. Mr. Don started his banking career with the Bank of Montreal in New York in 1984 and subsequently was a Vice President for Corporate Banking for The Bank of New York from 1987 to 1990.
Mr. Lilly joined CFC as a senior financial consultant in October 1983. He became Director of Special Finance in June 1985 and Director of Corporate Finance in June 1986. He became Treasurer and Principal Finance Officer on June 1, 1993, and became Senior Vice President and Chief Financial Officer on January 1, 1994. Effective July 1, 2013, Mr. Lilly became CFC’s Senior Vice President, Special Asset Management.
Mr. Borak joined CFC in June 2002 as Senior Vice President, Credit Risk Management. Previously, he was with Fleet National Bank, Boston, Massachusetts, from 1992 to 2001 where he was a senior credit officer with risk management and loan approval responsibility for several industry banking portfolios including investor-owned utilities. Prior assignments at Fleet in Hartford, Connecticut, included Manager of Credit Review and Manager of Loan Workout.
139
Mr. Allen joined CFC in 1990. Throughout his career with CFC, Mr. Allen has held various positions. He served as a Director, Portfolio Management through 2010 and as Vice President, Portfolio Management from 2010 until April 2014, when he became Senior Vice President, Member Services.
Ms. Aronson joined CFC in 1995. She served as Vice President and Deputy General Counsel until June 2013. Effective July 1, 2013, Ms. Aronson became Senior Vice President and General Counsel. Prior to joining CFC, Ms. Aronson was a partner at the law firm of Thompson Hine LLP.
Mr. Captain joined CFC in 1999. He served as Vice President, Government Relations until 2010 when he became Vice President, Corporate Communications. In January 2014, Mr. Captain became Vice President, Corporate Relations. Effective April 16, 2014, Mr. Captain became Senior Vice President, Corporate Relations. Prior to joining CFC, he worked as a Special Assistant to the Undersecretary of Rural Development at the United States Department of Agriculture.
Ms. Clendenen joined CFC in 1982. Throughout her career with CFC, Ms. Clendenen has held various positions. She served as Vice President, Human Resources until February 2012. In February 2012, she became Vice President, Human Resources & Corporate Services. Effective April 16, 2014, Ms. Clendenen became Senior Vice President, Corporate Services.
Mr. Kettler joined CFC as a regional vice president in 2001. In 2010, he became Vice President, Portfolio Management. On April 16, 2014, Mr. Kettler became Senior Vice President, Strategic Business Development and Support. Effective July 6, 2015, Mr. Kettler became Senior Vice President, Strategic Services.
Ms. Reed joined CFC in 1987. She served as Vice President, Portfolio Management from 2002 until 2014. On April 16, 2014, Ms. Reed became Senior Vice President, Member Services. Effective September 14, 2015, Ms. Reed became Senior Vice President, Loan Operations.
Mr. Starheim joined CFC as Senior Vice President, Business and Industry Development on July 6, 2015. Prior to joining CFC, Mr. Starheim served as CEO and General Manager of Delaware County Electric Cooperative in upstate New York from 2001 until 2012. From 2012 until joining CFC, Mr. Starheim held the position of President and CEO of Kenergy Corp.
(f) Involvement in Certain Legal Proceedings
None to our knowledge.
(g) Promoters and Control Persons
Not applicable.
(h) Code of Ethics
We have adopted a Code of Ethics within the meaning of Item 406(b) of Regulation S-K. This Code of Ethics applies to our principal executive officer, principal financial officer and principal accounting officer. This Code of Ethics is publicly available on our website at www.nrucfc.coop (under the link “Investor Relations/Corporate Governance”).
(i) Nominating Committee
Our board of directors does not have a standing nominating committee. As described above under “Part III. Item 10(a) Directors,” 20 of our directors are each elected by members in the district for which the director serves. To nominate director candidates, at the district meeting before the meeting at which candidates are to be elected from such district, a nominating committee is elected composed of one person from each state within the district. Each member of the nominating committee must be a trustee, director or manager of one of our members. Each district nominating committee then submits names of two or more nominees for each position in the district for which an election is to be held. We provide members of the nominating committee with director guidelines to use in reviewing applications from potential candidates. One or more candidates for the at-large director position who satisfies the requirements of an Audit Committee financial expert are nominated by our board of directors if the board determines that it is appropriate to fill the seat. Our board of directors
140
believes that it is appropriate for the full board of directors to nominate this director because of the position’s specific qualification requirements and the lack of any local district qualification requirement.
While we do not have a formal policy regarding diversity, the director guidelines we provide to each district nominating committee specify that a variety of perspectives, opinions and backgrounds is critical to the board’s ability to perform its duties and various roles. We recognize the value of having a board that encompasses a broad range of skills, expertise, industry knowledge and diversity of professional and personal experience.
(j) Audit Committee
Our Audit Committee currently consists of 10 directors: Mr. Hill (Chairperson), Mr. Ware (Vice Chairperson), Mr. Bridges (Vice Chairperson), Mr. Clawson (Ex Officio), Mr. LaFoy, Mr. Williams, Mr. Vail, Mr. Thompson, Mr. Hanson and Mr. Coleman. Mr. Bridges was designated by the board as the “Audit Committee financial expert” as defined by Section 407 of the Sarbanes-Oxley Act of 2002. The members of the Audit Committee are “independent” as that term is defined in Rule 10A-3 under the Securities Exchange Act. Among other things, the Audit Committee reviews our financial statements and the disclosure under “Item 7. Management’s Discussion and Analysis of Financial Condition and Results of Operations” in our Annual Report on Form 10-K. The Audit Committee meets with our independent registered public accounting firm, internal auditors, CEO and financial management executives to review the scope and results of audits and recommendations made by those persons with respect to internal and external accounting controls and specific accounting and financial reporting issues and to assess corporate risk. The board has adopted a written charter for the Audit Committee that may be found on our website, www.nrucfc.coop (under the link “Investor Relations/Corporate Governance”).
The Audit Committee completed its review and discussions with management regarding our audited financial statements for the year ended May 31, 2016. The Audit Committee has discussed with the independent auditors the matters required to be discussed by Statement on Auditing Standards No. 114, and received from the independent accountants written disclosures and the letter from the independent accountant required by applicable requirements of the Public Company Accounting Oversight Board regarding the independent accountant’s communications with the Audit Committee concerning independence, and discussed with the accountants their independence.
Based on the review and discussions noted above, the Audit Committee recommended to the board that the audited financial statements be included in our Annual Report on Form 10-K for the year ended May 31, 2016 for filing with the U.S. Securities and Exchange Commission.
(k) Compensation Committee
Role of the Compensation Committee
Our Compensation Committee currently consists of seven directors: Mr. Clawson, Mr. Campbell, Mr. Park, Mr. Farmer, Mr. Vail, Mr. Hayes and Mr. Hill. The Compensation Committee of the board of directors reviews and makes appropriate recommendations to the full board of directors regarding CFC’s total compensation philosophy and pay components, including, but not limited to, base and incentive pay programs. The Compensation Committee is also responsible for approving the compensation, employment agreements and perquisites for the CEO. The Compensation Committee annually reviews all approved corporate goals and objectives relevant to compensation, evaluates performance in light of those goals and approves the CEO’s compensation based on this evaluation, all of which is then submitted to the full board of directors for ratification. The Compensation Committee has delegated authority to the CEO for evaluating the performance and approving the annual base compensation for all of the other named executive officers as identified in the “Summary Compensation Table” below. Other than the CEO, no other named executive officer makes decisions regarding executive compensation.
The Compensation Committee reports to the board of directors on its actions and recommendations following committee meetings and meets in executive session without members of management present when making specific compensation decisions. Although the board has delegated authority to the Compensation Committee with respect to CFC’s executive and general employee compensation programs and practices, the full board of directors also reviews and ratifies CFC’s compensation and benefit programs each year.
141
The Compensation Committee’s charter can be found on our website at www.nrucfc.coop (under the link “Investor Relations/Corporate Governance”).
The Compensation Committee’s Processes
The Compensation Committee has established a process to assist it in ensuring that CFC’s executive compensation program is achieving its objectives. Prior to the start of each fiscal year, the board of directors approves performance measures for the “corporate balanced scorecard,” which is the basis for the short-term incentive plan, and the specific goal and metrics for the long-term incentive plan. The Compensation Committee reviews and assesses the accomplishment of goals as of the end of the fiscal year and determines whether to authorize the payment of incentive compensation. This authorization is then submitted to the full board of directors for ratification.
The President, Vice President and Secretary-Treasurer of the board of directors meet annually with the CEO to review his performance based on his individual achievements, contribution to CFC’s performance and other leadership accomplishments. In determining Mr. Petersen’s base pay, the Compensation Committee subjectively considers a variety of corporate performance measures, including financial metrics, portfolio management, customer satisfaction and market share, industry leadership, and peer group compensation data provided by the compensation consultant, as discussed below.
Role of Compensation Consultant
In fiscal year 2016, the Compensation Committee hired Mercer (US) Inc. (“Mercer US”) to advise it on the CEO’s compensation as compared with the compensation of CEOs of peer group organizations. Through discussions with the Compensation Committee, Mercer US established a peer group of companies to use in assessing the competitiveness of the CEO’s compensation (see “Compensation Analysis” in the “Compensation Discussion and Analysis” section below). Mercer US advised the Compensation Committee through an assessment of compensation data from this peer group using both a one-year compensation analysis, which assesses CFC’s CEO compensation and the compensation of peer CEOs for the most recent fiscal year, and a three-year compensation analysis, which assesses average peer CEO pay for the last three fiscal years. Compensation analyses include peer group CEO base pay, actual and target annual incentives, actual and target total cash compensation, three-year average long-term incentives and total direct compensation. Mercer US did not determine or provide the Compensation Committee with a specific recommendation on any component of executive compensation; it only reviewed benchmark data and discussed what is generally occurring with executive compensation. Mercer US did not provide any other service to CFC.
In fiscal year 2016, the Compensation Committee conducted an evaluation of Mercer US’ independence considering the relevant regulations of the U.S. Securities and Exchange Commission and the listing standards of the New York Stock Exchange, and concluded that the services performed by Mercer US raised no conflicts of interest.
Role of Executive Officers
As described above, the Compensation Committee has delegated the authority for making base pay decisions for the other named executive officers to the CEO. The CEO exercises his judgment to set base pay rates, based on general market data, overall corporate performance and leadership accomplishments. For additional information about the CEO’s role in compensation decisions, see “Base Pay” under the “Compensation Discussion and Analysis” section below.
(l) Section 16(a) Beneficial Ownership Reporting Compliance
Not applicable.
(m) Board Leadership Structure and Role of Risk Oversight by the Board of Directors
Board Leadership Structure
The positions of CEO and president of the CFC Board of Directors are held by two separate individuals. The president must be a member of the board of directors and is elected annually by the board of directors. The president of the CFC Board of Directors has authority, among other things, to appoint members of the board to standing committees, to appoint a vice
142
chairperson to each board standing committee and to appoint members to ad-hoc board committees. The president of the board presides over board meetings, sets meeting agendas and determines materials to be distributed to the board. Accordingly, the board president has substantial ability to influence the direction of the board. CFC believes that separation of the positions of board president and CEO reinforces the independence of the board in its oversight of CFC’s business and affairs. CFC also believes that this leadership structure is appropriate in light of the cooperative nature of the organization.
The board of directors appoints the CEO. The CEO is not a member of the board of directors. If the CEO position becomes vacant, the president will exercise the responsibilities of the CEO until a permanent or interim CEO is selected by the board of directors.
Board Role in Risk Oversight
CFC’s management has primary responsibility for day-to-day management of the risks associated with CFC’s business, including operational, credit, loan, asset and liability management, legal, regulatory and political risks, while the board of directors is primarily responsible for the oversight and direction of risk management and setting the corporate risk appetite. Management’s role includes identifying risks, establishing appropriate internal processes and an effective internal control environment to identify and manage risks, and communicating information about risk to the board. Management within the operating groups is responsible for managing and monitoring risks along with the Asset Liability Committee, Corporate Credit Committee, Disclosure Committee and IT Steering Committee. Each of these internal committees consist of certain management-level employees, which are appointed by the CEO.
In fulfilling its risk management oversight duties, the board of directors receives periodic reports on business activities from management and from various operating groups and committees across the organization, including the Credit Risk Management, the Member Services, the Internal Audit and the Corporate Compliance groups, as well as the Asset Liability Committee, the Corporate Credit Committee and the Disclosure Committee. The board of directors also reviews CFC’s risk profile and management’s response to those risks throughout the year at its meetings.
CFC has an annual strategic planning process that involves the board of directors and executive management. The fiscal year 2016 strategic planning process included board and senior management risk surveys and senior management’s facilitated risk assessment process. The objective of the risk surveys was to identify significant business risks facing CFC that could impede its ability to achieve its mission and strategic objective. The objective of the risk assessment process was to evaluate the financial impact and likelihood of occurrence for the identified critical business risks. The risk surveys and risk assessment results were used as the basis for the development of the strategic plan. The results were also analyzed by executive management to determine the risk management analyses and management plans that will be developed for certain critical business risks.
The board of directors has developed a risk management philosophy, which is reviewed and, if appropriate, updated annually. It states CFC’s set of shared beliefs and attitudes on how risk is considered from strategy development and implementation to our operations.
The board of directors has established a risk appetite that includes a common understanding between executive management and the board of directors regarding acceptable risks and risk tolerances underlying the execution of CFC’s strategy. It is also intended as a benchmark for discussing the implications of pursuing new strategies and business opportunities.
CFC has an Enterprise Risk Management (“ERM”) program that provides a holistic top-down view of key risks that may impede successful achievement of the organization’s strategic objectives. ERM provides our organization with a process it needs to become more anticipatory and effective at evaluating and managing the uncertainties it faces as it creates sustainable value for our members and investors. The ERM activities, which include risk surveys, risk assessments and risk management analyses, are executed within the context of the organization’s strategic objectives, mission, values, culture, risk management philosophy and risk appetite. The program provides a consistent approach for identifying an entity’s key risks and determining appropriate responses in light of the strategic objectives and risk appetite and tolerances. The Corporate Strategy Team oversees the ERM program activities, which are coordinated by the Internal Audit group.
The Audit Committee of the board of directors assists the full board of directors in its risk oversight responsibilities. In accordance with its charter, CFC’s Audit Committee is required to periodically inquire of the internal auditors and the
143
external auditors regarding significant risks and exposures to the organization, as well as inquire as to the steps management has taken or proposes to take to minimize these risks. The Audit Committee periodically reviews compliance with such steps. The Corporate Compliance group provides the Audit Committee with semi-annual reports on compliance and ethics matters, including any breaches of laws, regulations or organizational standards. In addition, the Internal Audit group provides the Audit Committee with feedback on the effectiveness and design of internal control processes by reporting the results of its internal audits and ERM activities.
Item 11. | Executive Compensation |
Compensation Discussion and Analysis
Executive Compensation Philosophy and Objectives
The components of our compensation package for the named executive officers (consisting of Messrs. Petersen, Don, Evans, Starheim and Lilly) are consistent with those offered to all employees.
Our executive compensation program provides a balanced mix of compensation that incorporates the following key components:
• | annual base pay; |
• | an annual cash incentive that is based on the achievement of short-term (one-year) corporate goals; |
• | a three-year cash incentive that is based on the achievement of long-term corporate goals; and |
• | retirement, health and welfare and other benefit programs. |
While all elements of executive compensation work together to provide a competitive compensation package, each element of compensation is determined independently of the other elements.
Our compensation philosophy is to provide a total compensation package for employees—base pay, short-term incentive, long-term incentive and benefits—that is competitive in the local employment market. However, due to the cooperative nature of the organization, CFC does not meet the total cash compensation levels of named executive officers of other financial services organizations since we do not offer stock or other equity compensation. It is important to CFC, however, to pay the named executive officers of CFC competitively in base pay to retain key talent.
Performance — Named executive officers receive base pay that is both market competitive and reflective of their role in developing, implementing and overseeing CFC’s strategy and operations. Other components of compensation—short-term and long-term incentives—reflect the performance of the organization and its success in achieving corporate performance metrics established by the board of directors.
Retention — CFC’s success is due in large part to the relationship between our employees and our members. This makes the retention of employees, including the named executive officers, vital to our business and long-term success. The compensation package, particularly the long-term incentive plan and the retirement benefits, assist in the retention of a highly qualified management team.
Compensation Analysis
In fiscal year 2016, Mercer (US), Inc. (“Mercer”) was engaged by the Compensation Committee to conduct a survey to provide compensation data for the CEO position using 14 peer organizations identified by Mercer through discussions with the Compensation Committee. Mercer included companies in the peer group that were similar to CFC in asset size, industry and business description. The peer group included financial institutions that are private market, commercial and/or mission-driven lenders, offering full-service financing, investment and related services. The companies targeted as peer companies included two members of the Farm Credit system and 12 regional banks and financial services companies.
The peer group companies had assets ranging from approximately 50% to 200% of CFC’s May 31, 2015 total assets of $22.9 billion, and included eight companies with greater total assets than CFC’s. The peer group consisted of financial services organizations New York Community Bancorp, Inc.; Astoria Financial Corporation.; Nelnet, Inc.; Webster Financial Corporation; Flagstar Bancorp, Inc.; People’s United Financial, Inc.; Washington Federal, Inc.; Hudson City Bancorp, Inc.;
144
First Niagara Financial Group, Inc.; TFS Financial Corporation; Everbank Financial Corporation; and Federal Agricultural Mortgage Corporation, as well as two Farm Credit System peers. Even though Hudson City Bancorp, Inc. has agreed to a merger with M&T Bank Corporation, Mercer recommended that this company remain in the peer group for this year, since they were operating as a stand-alone entity. We will re-evaluate the peer group for next year’s analysis.
Mercer led the Compensation Committee through an assessment of CEO compensation data for the peer group companies. Mercer’s data included both actual compensation and target compensation based on information obtained from each peer group company’s most recent annual report or proxy statement.
The elements of compensation reviewed include:
• | current base salary; |
• | actual bonus paid for fiscal year 2014 and, for the target compensation, the target bonus for 2015; |
• | three-year average actual long-term incentive paid, which includes restricted stock awards (valued at face value on the date of grant), stock option awards (valued at grant date utilizing the Black-Scholes option pricing model), other long-term incentive target awards (valued at target value on date of award) and cash long-term incentive payouts (valued at actual payout on date of award if target value is not disclosed); |
• | sign-on awards, special awards and mega-grants annualized over the term of the employment contract or the vesting schedule; and |
• | annualized value of retirement, perquisites and other noncash compensation. |
The Compensation Committee reviewed total compensation data for the peer group for informational purposes and used this data solely to determine the competitiveness of our CEO base pay.
In determining the base compensation paid to our other named executive officers, the CEO reviewed national, credible third-party compensation surveys (including the Mercer Executive and CompAnalyst surveys) for financial services and other organizations of similar asset size as CFC in order to obtain a general understanding of current compensation practices and to ensure that the base pay component of compensation for the named executive officers other than the CEO is competitive with such institutions. CFC has often recruited non-CEO talent from industries outside the financial services sector. As a result, the CEO considers data from surveys covering a larger and broader group of for-profit companies in setting compensation for the other named executive officers than the Compensation Committee considers in setting compensation for the CEO. The CEO considered the data to gain a general understanding of current compensation practices at institutions of similar asset size to CFC; and did not review or consider underlying data pertaining to individual organizations comprising any of the survey groups. Instead, the CEO considered the aggregate compensation data to enhance his understanding of current practices in setting compensation at competitive levels.
Elements of Compensation
Base Pay — Our philosophy is to provide annual base pay that reflects the value of the job in the marketplace, targeted at the 50th percentile. To attract and retain a highly skilled work force, we must remain competitive with the pay of other employers that compete with us for talent.
After reviewing the performance of the organization and the evaluation of the CEO’s performance by each board member, it was the assessment of the Compensation Committee that the CEO and the organization performed extremely well during this business year. In fact, the business results exceeded company targets for many key metrics of performance, and the CEO continued to demonstrate outstanding leadership. Therefore, in recognition of his strong performance and leadership, the Committee increased the CEO’s base pay to $1,005,000 effective January 1, 2016.
As discussed under “Compensation Analysis” above, the CEO exercised his judgment to set the annual base pay for the other named executive officers based on general market data, overall company performance and individual leadership accomplishments.
Mr. Evans, Mr. Lilly and Mr. Don all performed well in their various roles as senior leaders of the organization. They each contributed to the achievement of corporate strategies and objectives in a positive and meaningful way that would typically warrant a merit-based increase in base pay and/or a one-time cash award. Mr. Evans and Mr. Don each received a merit increase as well as a one-time cash award. Mr. Lilly received a one-time cash award. The merit increases and/or cash awards
145
granted are included in the total compensation table below. Mr. Starheim joined the organization on July 6, 2015, and his compensation remained unchanged during the fiscal year and is reflected in the total compensation table below.
Short-Term Incentive — Our short-term cash incentive program is a one-year cash incentive that is tied to the annual performance of the organization as a whole. We believe that by paying a short-term incentive tied to the achievement of annual operating goals, all employees, including named executive officers, will focus their efforts on the most important strategic objectives that will help us fulfill our mission to our members and our obligations to the financial markets. Additionally, the short-term incentive pay enhances our ability to provide competitive compensation while at the same time tying total compensation paid to the achievement of corporate goals. Every employee participates in the short-term incentive program, and the corporate strategic goals are the same for all employees, including the named executive officers.
The short-term incentive program provides annual cash incentive opportunities based upon the level of the position within our base pay structure, ranging from 15% to 25% of base pay. Named executive officers are eligible to receive short-term cash incentive compensation up to 25% of their base pay. Over the last 10 years, the actual payout percentage has ranged from 55% to 100% of total opportunity, with an average over the 10 years of 80.60%. This equates to a 10-year average payout of 15.65% of base salaries for all employees.
Our approach to establishing corporate goals for short-term incentive compensation has not changed since the plan’s inception. Corporate performance is measured using a balanced scorecard approved by the board of directors prior to the start of the fiscal year. The balanced scorecard is a performance management tool that articulates the corporate strategy into specific, quantifiable and measurable goals. The goals have always been tied to enhancing service to our member owners while ensuring all aspects of the business are effectively managed.
The scorecard is divided into four quadrants, reflecting crucial areas of business performance. Specific goals are established within those quadrants to focus all employees on the target results and measures that must be achieved if we are to succeed at realizing our strategic plan. The intent is to align organizational, departmental and individual initiatives to achieve a common set of goals.
The four quadrants for fiscal year 2016, which are the basis for the short-term incentive payment, are the same as they have been in previous years: Customer Engagement, Financial Ratios, Internal Process and Operations, and Learning, Growth and Innovation. For fiscal year 2016, the board of directors established seven corporate goals within these four quadrants. The board of directors establishes corporate goals and measures they believe are challenging but achievable if each individual performs well in his or her role and we meet our internal business plan goals.
The goals for fiscal year 2016 were:
• | Customer Engagement: Two goals supporting efforts to maintain or increase market share of borrowers in key segments of the loan portfolio. |
• | Internal Process and Operations: Two goals focused on managing CFC’s operating expense levels and enhancing the efficient delivery of services to our members. |
• | Financial Ratios: Two goals supporting efforts to meet or exceed established financial targets to maintain CFC’s financial strength. |
• | Learning, Growth & Innovation: One goal focused on the development of programs and staff training in the area of enhanced member engagement. |
The determination of the extent to which the seven goals were achieved and, therefore, the amount to be paid out under the short-term incentive plan for fiscal year 2016 was confirmed by the board of directors with the filing of this Form 10-K. The board determined that six of the goals were 100% achieved and one was achieved at 75%. Each goal may carry a different weight varying between 10% and 20% resulting in an aggregate payout of 95% of the total opportunity.
Long-Term Incentive — The long-term incentive program is a three-year plan that is tied to CFC’s long-term strategic objectives. The long-term incentive program was implemented to create dynamic tension between short-term objectives and long-term goals. It is also an effective retention tool, helping us to keep key employees, and supports CFC’s efforts to compensate its employees at market-competitive levels.
146
All individuals employed by CFC on the first day of each fiscal year in which there is a long-term incentive plan in place, June 1, are eligible to participate in the program for the performance period beginning on that date. One named executive officer, Mr. Starheim, began employment after June 1 of this fiscal year; however, the CEO authorized his participation in the incentive plan for the performance period beginning June 1 on a prorated basis. Under the long-term incentive program, performance units covering a three-year performance period are issued to each employee at the start of each fiscal year. The long-term incentive is paid out in one lump sum cash payment after the end of the performance period, subject to approval by the board of directors and the continued employment (or retirement, disability or death) of the participant by CFC on the date of payment. We sometimes refer to each three-year performance period as a plan cycle.
The performance measure for the active long-term incentive plans is the achievement of bond rating targets for our issuer credit ratings as rated by S&P, Fitch and Moody’s rating agencies, as outlined in each plan document. The value of the performance units will range from $0 to $150 per performance unit according to the level of CFC’s issuer credit ratings by the rating agencies. To achieve the highest value of $150, which exceeds the targeted value, the agencies defined in each plan would have to raise CFC’s issuer credit rating to AA (or the equivalent rating at Moody’s). To determine the payout value of performance units, the ratings by agencies identified in each plan are given a numerical value, i.e., 2 for A stable, 3 for A positive, etc. The ratings of these agencies are then averaged to achieve the final value of the performance units.
The number of performance units awarded to each employee for each plan cycle is calculated by dividing a percentage, ranging from 15% to 25%, of the participant’s base pay for the first fiscal year of the plan cycle, by the payout value assigned to the target rating level. For the program cycle ending May 31, 2016, the target rating level was “A+ Stable,” which was assigned a payout value of $100 per performance unit. For the named executive officers, the number of performance units awarded for that program cycle was based on 25% of each named executive officer’s base pay for fiscal year 2014, the first year of the plan cycle. If the highest rating level was achieved at the end of that plan cycle, resulting in payout of $150 per performance unit, the long-term incentive pay for named executive officers would have been 37.5% of fiscal year 2014 base pay.
The following table presents the potential payout values for performance units awarded for the program cycle that ended May 31, 2016:
Issuer Credit Rating—Incentive-Performance Linkage
Rating | A | A+ | AA- | |||||||||||
Outlook | Negative | Stable | Positive | Negative | Stable | Positive | ||||||||
Numerical Score | 1 | 2 | 3 | 4 | 5 | 6 | ||||||||
Plan Pay-Out Unit Value | $— | $20 | $60 | $60 | $100 | $120 | $150 | |||||||
____________________________
* The target objective is in bold.
CFC uses our issuer credit rating as the performance measure for the long-term incentive plan because stronger ratings lead to lower interest cost and more reliable access to the capital markets. We also believe our long-term incentive measure will better align management’s interests with the interests of our members and investors. Since we have no publicly held equity securities and our objective is to offer our members cost-based financial products and services consistent with sound financial management rather than to maximize net income, more traditional performance measures such as net income or earnings per share would not be appropriate.
As of May 31, 2016, there were three active long-term incentive plans in which named executive officers were participants. Performance units issued to named executive officers in fiscal year 2014 had a payout value based on our issuer credit ratings in place on May 31, 2016; performance units issued to named executive officers in fiscal year 2015 will have a payout value based on issuer credit ratings in place on May 31, 2017; and performance units issued to named executive officers in fiscal year 2016 will have a payout value based on issuer credit ratings in place on May 31, 2018. Payments made to the named executive officers for fiscal year 2016 were for performance units issued in fiscal year 2014 and were based on the May 31, 2016 issuer credit rating level of A stable outlook, which has a value of $20 per performance unit, or 20% of the targeted opportunity (5% of fiscal year 2014 base pay).
147
All current plans will pay out if the rating agencies rate our issuer credit rating at a high enough level to receive a payout. The payout will be based on the average of the ratings (averages are calculated and rounded down to the next whole number).
Risk Assessment
The Compensation Committee conducts an annual risk assessment of the Company’s compensation policies and practices, particularly the short-term and long-term incentive plan goals, to ensure that the policies and practices do not encourage excessive risk. For fiscal year 2016 the Compensation Committee concluded that our compensation policies and practices are not reasonably likely to provide incentives for behavior that could have a material adverse effect on the Company.
Benefits
An important retention tool is our defined benefit pension plan, the Retirement Security Plan. CFC participates in a multiple-employer pension plan managed by NRECA. We balance the effectiveness of this plan as a compensation and retention tool with the cost of the annual premium incurred to participate in this pension plan. The value of the pension benefit is determined by base pay only and does not include other cash compensation.
We also offer a Pension Restoration Plan (“PRP”) and an Executive Benefit Restoration Plan (“EBR”). The PRP is a plan for a select group of management, including three of the named executive officers, to increase their retirement benefits above amounts available under the Retirement Security Plan, which is restricted by IRS limitations on annual pay levels and maximum annual annuity benefits. The PRP restores the value of the Retirement Security Plan for named executive officers to the level it would be if the IRS limits on annual pay and annual annuity benefits were not in place. The PRP was frozen as of December 31, 2014. We then established the EBR to provide a similar benefit to a select group of management. A named executive officer may only participate in the PRP or the EBR. Unlike the Retirement Security Plan, the PRP and the EBR are unfunded, unsecured obligations of CFC and are not qualified for tax purposes. Two of the named executive officers are participants in the EBR.
Under the PRP, we pay the amount owed to the named executive officers for the pension restoration benefit; amounts paid are then deducted from the premium due for the next Retirement Security Plan invoice(s) to NRECA. Under the EBR, we will also pay any amounts owed to the named executive officers for the restoration benefit once the risk of forfeiture has expired; amounts are paid directly by CFC. We record an unfunded pension obligation and an offsetting adjustment to AOCI for this liability.
For more information on the Retirement Security Plan, the PRP and the EBR, see the “Pension Benefits Table” and accompanying narrative below.
As an additional retention tool designed to assist named executive officers in deferring compensation for use in retirement, each named executive officer is also eligible to participate in CFC’s nonqualified 457(b) deferred compensation savings plan. Contributions to the plan are limited by IRS regulations. The calendar year 2016 cap for contributions is $18,000. There is no CFC contribution to the deferred compensation plan. For more information see “Nonqualified Deferred Compensation” below.
The CEO is eligible to earn retirement benefits in addition to those credited under any of the above mentioned plans in a Supplemental Executive Retirement Plan. This plan is an ineligible deferred compensation plan within the meaning of section 457. The account is considered unfunded and may be credited from time to time pursuant to the plan at the discretion of the CFC Board of Directors. There are currently no credits to this plan.
Other Compensation
We provide named executive officers with other benefits, as reflected in the All Other Compensation column in the “Summary Compensation Table” below, that we believe are reasonable and consistent with our compensation philosophy. We do not provide significant perquisites or personal benefits to the named executive officers.
148
The Compensation Committee considers perquisites for the CEO in connection with its annual review of the CEO’s total compensation package described above. The perquisites provided to Mr. Petersen are limited to an annual automobile allowance, an annual spousal air travel allowance to permit Mr. Petersen’s spouse to accompany him on business travel and home security. To provide the automobile and spousal travel perquisites in an efficient fashion, the board of directors authorizes an annual allowance rather than providing unlimited reimbursement or use of a company-owned vehicle. The amount of each allowance is authorized annually by the board of directors and is determined based on the estimated cost for operation and maintenance of an automobile and the anticipated cost of air travel by the CEO’s spouse. For 2016, the board of directors authorized an aggregate of $30,000 to cover these two allowances. We provide security for Mr. Petersen, including security in addition to that provided at business facilities. We believe that all Company-incurred security costs are reasonable and necessary and for the Company’s benefit.
Severance/Change-in-Control Agreements
Mr. Petersen, CEO, and Mr. Evans, executive vice president and chief operating officer, each have an executive agreement with CFC under which they may continue to receive compensation and benefits in certain circumstances after resignation or termination of employment. The value of Mr. Petersen’s severance package was determined to be appropriate for a CEO and approved by the Compensation Committee as part of his employment contract. The value of Mr. Evans’ severance package was negotiated by the CEO and Mr. Evans as part of Mr. Evans’ employment offer. No other named executive officers have termination or change-in-control agreements. For more information on these severance arrangements, see “Termination of Employment and Change-in-Control Arrangements” below.
Compensation Committee Report
The Compensation Committee of the board of directors oversees CFC’s compensation program on behalf of the board. In fulfilling its oversight responsibilities, the Compensation Committee reviewed and discussed with management the “Compensation Discussion and Analysis” set forth in this Form 10-K. Based on this review and discussion, the Compensation Committee recommended to the board of directors that the “Compensation Discussion and Analysis” be included in this Form 10-K.
Submitted by the Compensation Committee:
R. Grant Clawson
Mike Campbell
Harry N. Park
Robert M. Hill
Stephen C. Vail
Kent D. Farmer
Thomas L. Hayes
149
Summary Compensation Table
The summary compensation table below sets forth the aggregate compensation for the fiscal years ended May 31, 2016, 2015 and 2014 earned by the named executive officers.
Name and Principal Position | Year | Salary | Bonus(1) | Non-Equity Incentive Plan Compensation(2)(6) | Change in Pension Value and Nonqualified Deferred Compensation Earnings (3) | All Other Compensation (4) | Total | |||||||||||||||||||
Sheldon C. Petersen | 2016 | $ | 987,500 | $ | — | $ | 275,180 | $ | 264,155 | $ | 151,957 | $ | 1,678,792 | |||||||||||||
Chief Executive | 2015 | 945,833 | — | 253,435 | 858,490 | 240,000 | 2,297,758 | |||||||||||||||||||
Officer | 2014 | 860,075 | — | 192,675 | 179,778 | 35,825 | 1,268,353 | |||||||||||||||||||
J. Andrew Don | 2016 | 422,500 | 10,000 | 120,938 | 224,406 | 7,925 | 785,769 | |||||||||||||||||||
Senior Vice President | 2015 | 410,000 | 15,000 | 111,010 | 344,608 | 7,783 | 888,401 | |||||||||||||||||||
and Chief Financial | 2014 | 395,833 | — | 87,510 | 52,179 | 7,433 | 542,955 | |||||||||||||||||||
Officer | ||||||||||||||||||||||||||
John T. Evans | 2016 | 532,500 | 15,000 | 151,303 | 136,833 | 6,800 | 842,436 | |||||||||||||||||||
Executive Vice | 2015 | 520,000 | — | 139,920 | 238,043 | 6,992 | 904,955 | |||||||||||||||||||
President and Chief | 2014 | 480,550 | 15,000 | 109,311 | 118,207 | 6,947 | 730,015 | |||||||||||||||||||
Operating Officer | ||||||||||||||||||||||||||
Gregory J. Starheim(5) | 2016 | 371,364 | — | 88,084 | 101,819 | 83,678 | 644,945 | |||||||||||||||||||
Senior Vice President, | 2015 | — | — | — | — | — | — | |||||||||||||||||||
Business & Industry | 2014 | — | — | — | — | — | — | |||||||||||||||||||
Development | ||||||||||||||||||||||||||
Steven L. Lilly | 2016 | 405,650 | 5,000 | 116,622 | 86,441 | — | 613,713 | |||||||||||||||||||
Senior Vice President, | 2015 | 405,650 | 5,000 | 111,551 | 188,469 | — | 710,670 | |||||||||||||||||||
Special Asset | 2014 | 405,650 | 7,500 | 92,536 | 98,483 | — | 604,169 | |||||||||||||||||||
Management | ||||||||||||||||||||||||||
____________________________
(1) Includes amounts given as one-time cash awards in lieu of base pay increases, except for Mr. Evans and Mr. Don. For Mr. Evans it was a bonus in addition to a base pay increase in 2016. For Mr. Don it was a bonus in addition to a base pay increase in 2016 and 2015.
(2) Includes amounts earned during each respective fiscal year and payable as of May 31 under the long-term and short-term incentive plans. For a discussion of the long-term and short-term incentive plans, see “Elements of Compensation” in “Compensation Discussion and Analysis” above. The amounts earned by each named executive officer under these incentive plans are listed above.
(3) Represents solely the aggregate change in the actuarial present value of the accumulated pension benefit under NRECA Retirement Security Plan, the multiple-employer defined benefit pension plan in which CFC participates, during each respective fiscal year as calculated by NRECA.
(4) For Mr. Petersen for fiscal year 2016, includes (i) perquisites comprising Mr. Petersen’s automobile allowance and his spousal air travel allowance, and (ii) $115,056 representing the approximate aggregate incremental cost to the Company for maintaining security arrangements for Mr. Petersen in addition to security arrangements provided at the headquarters facility. We do not believe this provides a personal benefit (other than the intended security) nor do we view these security arrangements as compensation to the individual. We report these security arrangements as perquisites as required under applicable SEC rules. The annual automobile allowance is calculated based on estimated costs associated with maintenance, use and insurance of a personal automobile. The annual spousal travel allowance is calculated based on the anticipated air travel for Mrs. Petersen during the fiscal year. For Mr. Starheim, this amount includes taxable and non-taxable relocation The remaining amounts included in this column represent CFC contributions on behalf of each named executive officer pursuant to the CFC 401(k) defined contribution plan and contributions to health savings.
(5) Mr. Starheim began employment on July 6, 2015.
(6) The following chart has the amounts paid to each named executive officer under the short-term and long-term incentive plans for the preceding three years.
150
Name | Year | Short-Term Incentive Plan | Long-Term Incentive Plan | |||||||
Sheldon C. Petersen | 2016 | $ | 234,500 | $ | 40,680 | |||||
2015 | 212,755 | 40,680 | ||||||||
2014 | 153,175 | 39,500 | ||||||||
J. Andrew Don | 2016 | 100,938 | 20,000 | |||||||
2015 | 92,250 | 18,760 | ||||||||
2014 | 71,250 | 16,260 | ||||||||
John T. Evans | 2016 | 127,063 | 24,240 | |||||||
2015 | 117,000 | 22,920 | ||||||||
2014 | 86,391 | 22,920 | ||||||||
Gregory J. Starheim | 2016 | 88,084 | — | |||||||
2015 | — | — | ||||||||
2014 | — | — | ||||||||
Steven L. Lilly | 2016 | 96,342 | 20,280 | |||||||
2015 | 91,271 | 20,280 | ||||||||
2014 | 72,256 | 20,280 | ||||||||
Grants of Plan-Based Awards
We have a long-term and a short-term incentive plan for all employees, under which the named executive officers may receive a cash incentive up to 37.5% and 25% of salary, respectively. The incentive payouts are based on the executive officer’s salary for the fiscal year in which the program becomes effective. See the “Compensation Discussion and Analysis” above for further information on these incentive plans.
The following table contains the estimated possible payouts under our short-term incentive plan and possible future payouts for grants issued under our long-term incentive plan during the year ended May 31, 2016.
Estimated Future Payouts Under Non-Equity Incentive Plan Awards | ||||||||||||
Name | Threshold | Target | Maximum | |||||||||
Sheldon C. Petersen | ||||||||||||
Long-Term Incentive Plan (1) | $ | — | $ | 243,800 | $ | 365,700 | ||||||
Short-Term Incentive Plan (2) | — | 251,250 | 251,250 | |||||||||
J. Andrew Don | ||||||||||||
Long-Term Incentive Plan (1) | — | 106,300 | 159,450 | |||||||||
Short-Term Incentive Plan (2) | — | 106,250 | 106,250 | |||||||||
John T. Evans | ||||||||||||
Long-Term Incentive Plan (1) | — | 133,800 | 200,700 | |||||||||
Short-Term Incentive Plan (2) | — | 133,750 | 133,750 | |||||||||
Gregory J. Starheim | ||||||||||||
Long-Term Incentive Plan (1) | — | 102,500 | 153,750 | |||||||||
Short-Term Incentive Plan (2) | — | 102,500 | 102,500 | |||||||||
Steven L. Lilly | ||||||||||||
Long-Term Incentive Plan (1) | — | 101,400 | 152,100 | |||||||||
Short-Term Incentive Plan (2) | — | 101,413 | 101,413 | |||||||||
___________________________
(1) Target payouts are calculated using unit values of $100 based on our goal of achieving an average long-term senior secured credit rating of A+ stable as of May 31, 2018.
151
(2) Target and maximum payouts represent 25% of May 31, 2016 base salary. For the payout earned under the fiscal year 2016 short-term incentive plan, see the Non-Equity Incentive Plan Compensation column of the “Summary Compensation Table” above.
The board of directors approved a new long-term incentive plan and made grants of performance units to the named executive officers in August 2016. The payout under these grants will be determined on May 31, 2019.
Employment Contracts
Pursuant to an employment agreement effective as of January 1, 2015, CFC has agreed to employ Mr. Petersen as Chief Executive Officer through May 31, 2017, unless otherwise terminated in accordance with the terms of the Agreement. The amended Agreement provides that CFC shall pay Mr. Petersen a base salary at an annual rate of not less than $975,000 per annum, plus such incentive payments (if any) as may be awarded him. In addition, pursuant to the Agreement, Mr. Petersen is entitled to certain payments in the event of his termination other than for cause (e.g., Mr. Petersen leaving for good reason, disability or termination due to death). See “Termination of Employment and Change-in-Control Arrangements” below for a description of these provisions and for information on these amounts.
For information about Mr. Evans’ termination agreement, see “Termination of Employment and Change-in-Control Arrangements.”
Pension Benefits Table
CFC is a participant in a multi-employer defined benefit pension plan, the Retirement Security Plan, which is administered by NRECA. Since the plan is a multi-employer plan in which CFC participates, CFC is not liable for the amounts shown in the table below and such amounts are not reflected in CFC’s audited financial statements. CFC’s expense is limited to the annual premium to participate in the Plan. There is no funding liability for CFC for the Plan.
The Retirement Security Plan is a qualified plan in which all employees are eligible to participate upon completion of one year of service. Each of the named executive officers participates in the qualified pension plan component of the Retirement Security Plan. CFC reduced the value of the pension plan effective September 1, 2010. Under the current pension plan, participants are entitled to receive annually, under a 50% joint and surviving spouse annuity, 1.70% of the average of their five highest base salaries during their last 10 years of employment, multiplied by the number of years of participation in the plan. The value of the pension benefit is determined by base pay only and does not include other cash compensation. Normal retirement age under the qualified pension plan is age 65; however, the plan does allow for early retirement with reduced benefits beginning at age 55. For early retirement, the pension benefit will be reduced by 1/15 for each of the first five years and 1/30 for each of the next five years by which the elected early retirement date precedes the normal retirement date. Benefits accrued prior to September 1, 2010, are based on a benefit level of 1.9% of the average of their five highest base salaries during their last 10 years of employment and a normal retirement age of 62.
CFC also offers a PRP and an EBR. Each of the named executive officers participates in either the PRP or the EBR. The purpose of these plans is to increase the retirement benefits above amounts available under the Retirement Security Plan, which is restricted by IRS limitations on annual pay levels and maximum annual annuity benefits. The PRP and the EBR restore the value of the Retirement Security Plan for each officer to the level it would be if the IRS limits on annual pay and annual annuity benefits were not in place.
The benefit and payout formula under these restoration plans is similar to that under the qualified Retirement Security Plan. However, three of the named executive officers have satisfied the provisions established to receive the benefit from the PRP. They were grandfathered in the plan and no longer have a risk of forfeiture of the benefit under the PRP. Distributions are made from the plan to each of those named executive officers annually.
The following table contains the years of service, the present value of the accumulated benefit for the named executive officers listed in the “Summary Compensation Table” as of May 31, 2016, as calculated by NRECA and distributions from the plan for the fiscal year then ended.
152
Name | Plan Name | Number of Years of Credited Service (1) | Present Value of Accumulated Benefit (2) | Payments During Last Fiscal Year(3) | |||||||||
Sheldon C. Petersen (4) | NRECA Retirement Security Plan | 5.75 | $ | 388,144 | $ | 255,317 | |||||||
J. Andrew Don | NRECA Retirement Security Plan | 15.66 | 1,428,021 | — | |||||||||
John T. Evans (4) | NRECA Retirement Security Plan | 6.33 | 500,279 | 81,439 | |||||||||
Gregory J. Starheim | NRECA Retirement Security Plan | 10.25 | 468,223 | — | |||||||||
Steven L. Lilly (4) | NRECA Retirement Security Plan | 6.33 | 450,841 | 36,515 | |||||||||
___________________________
(1) CFC is a participant in a multi-employer pension plan. Credited years of service, therefore, includes not only years of service with CFC, but also years of service with another cooperative participant in the multi-employer pension plan. All other named executive officers, except for Mr. Starheim, have credited years of service only with CFC.
(2) Amount represents the actuarial present value of the named executive officer’s accumulated benefit under the plan as of May 31, 2016, as provided by the plan administrator, NRECA, using interest rates ranging from 1.25% to 5.13% per annum and mortality according to tables prescribed by the IRS as published in Revenue Rulings 2001-62 and 2007-67.
(3) Distributions during fiscal year 2016 were as a result of named executive officers no longer being at risk of forfeiture with respect to these amounts provided under the PRP. Mr. Don and Mr. Starheim continue to have a risk of forfeiture of the benefits under the EBR; therefore, no payments have been made.
(4) The NRECA Pension Plan allows active employees who have reached normal retirement age to cash in their lump sum benefit accrued through August 31, 2010, or “quasi-retire.” Due to the quasi-retirements of Mr. Petersen in February 2015, Mr. Lilly in January 2012 and Mr. Evans in March 2012, for benefits earned and eligible for quasi-retirement, their credited years of service were reduced and they received 12 months of credited service in January of each year thereafter.
Nonqualified Deferred Compensation
The CFC deferred compensation plan is a nonqualified deferred compensation savings program for the senior executive group, including each of the named executive officers, and other selected management or highly compensated employees designated by CFC. Participants may elect to defer up to the lesser of 100% of their compensation for the year or the applicable IRS statutory dollar limit in effect for that calendar year. The calendar year 2016 cap for contributions is $18,000. During the three plan years immediately prior to the date a participant attains normal retirement age, participants may be eligible for a statutory catch-up provision that allows them to defer more than the annual contribution limit. Compensation for the purpose of this plan is defined as the total amount of compensation, including incentive pay, if any, paid by CFC. CFC does not make any contributions to the plan.
The accounts are credited with “earnings” based on the participants’ selection of available investment options (currently, eight options) within the Homestead Funds. When a participant ceases to be an employee for any reason, distribution of the account will generally be made in 15 substantially equal annual payments beginning approximately 60 days after termination (unless an election is made to change the form and timing of the payout). The participant may elect either a single lump sum or substantially equal annual installments paid over no less than two and no more than 14 years. The amount paid is based on the accumulated value of the account.
The following table summarizes information related to the nonqualified deferred compensation plan in which the named executive officers listed in the “Summary Compensation Table” were eligible to participate during the year ended May 31, 2016.
153
Name | Executive Contributions in Last Fiscal Year (1) | Registrant Contributions in Last Fiscal Year | Aggregate Earnings in Last Fiscal Year | Aggregate Withdrawals/ Distributions | Aggregate Balance at Last Fiscal Year End | |||||||||||||||
Sheldon C. Petersen | $ | 18,000 | $ | — | $ | (17,032 | ) | $ | — | $ | 591,979 | |||||||||
J. Andrew Don | — | — | — | — | — | |||||||||||||||
John T. Evans | 18,000 | — | 2,198 | — | 348,815 | |||||||||||||||
Gregory J. Starheim | 25,500 | (2) | — | 1,169 | — | 127,686 | ||||||||||||||
Steven L. Lilly | — | — | 3,782 | — | 336,549 | |||||||||||||||
___________________________
(1)Executive contributions are also included in the fiscal year 2016 Salary column in the “Summary Compensation Table” above.
(2)Since our fiscal year crosses over two calendar years, the potential exists to exceed the IRS annual contribution limit on a fiscal year basis, which was the case with respect to Mr. Starheim.
Termination of Employment and Change-in-Control Arrangements
Mr. Petersen and Mr. Evans each have an executive agreement with CFC under which each such officer may continue to receive base salary and benefits in certain circumstances after resignation or termination of employment. No other named executive officers have termination or change-in-control agreements.
Mr. Petersen
Under the executive agreement with Mr. Petersen, if CFC terminates his employment without “cause,” or Mr. Petersen terminates his employment for “good reason” (each term as defined below), CFC is obligated to pay him a lump-sum payment equal to the product of three times his annual base salary at the rate in effect at the time of termination and his short-term incentive bonus, if any, for the previous year (or, if none, an amount equal to the short-term incentive bonus for fiscal year 2007). Assuming a triggering event on May 31, 2016, the compensation payable to Mr. Petersen for termination without cause would be $3,653,264. The actual payments due on a termination without cause on different dates could materially differ from this estimate.
For purposes of Mr. Petersen’s executive agreement, “cause” generally means (i) the willful and continued failure by Mr. Petersen to perform his duties under the agreement or comply with written policies of CFC, (ii) willful conduct materially injurious to CFC or (iii) conviction of a felony involving moral turpitude. “Good reason” generally means (i) a reduction in the rate of Mr. Petersen’s base salary, (ii) a decrease in his titles, duties or responsibilities, or the assignment of new responsibilities which, in either case, is materially less favorable to Mr. Petersen when compared with his titles, duties and responsibilities which were in effect immediately prior to such assignment or (iii) the relocation of CFC’s principal office or the relocation of Mr. Petersen to a location more than 50 miles from the principal office of CFC.
Mr. Evans
Under the executive agreement with Mr. Evans, if CFC terminates his employment without cause, Mr. Evans would receive continued annual base salary in effect at the time of termination, incentive compensation, and payment for all health and welfare and retirement plans for an additional nine-month period. Assuming a termination date of May 31, 2016, the compensation payable to Mr. Evans for termination without cause would be $580,246. The actual payments due for a termination without cause on different dates could materially differ from this estimate.
The estimates do not include amounts to which the named executive officers would be entitled to upon termination, such as base salary to date, unpaid bonuses earned, unreimbursed expenses, paid vacation time and any other earned benefits under company plans.
Director Compensation Table
Directors receive an annual fee for their service on the CFC board. Additionally, the directors receive reimbursement for reasonable travel expenses. The fee is paid on a monthly basis and reimbursement for travel expenses is paid following the conclusion of each board meeting.
154
The following chart summarizes the total compensation earned by CFC’s directors during the year ended May 31, 2016.
Name | Total Fees Earned | |||
Ray Beavers | $ | 45,167 | ||
Patrick L. Bridges | 54,417 | |||
Robert Brockman | 36,667 | |||
Mike Campbell | 60,417 | |||
Philip A. Carson | 54,417 | |||
R. Grant Clawson | 60,417 | |||
Mel Coleman | 54,417 | |||
Kent D. Farmer | 54,417 | |||
Roman E. Gillen | 54,417 | |||
Doyle Jay Hanson | 54,417 | |||
Thomas L. Hayes | 54,417 | |||
Robert M. Hill | 54,417 | |||
Lyle Korver | 40,667 | |||
Jimmy A. LaFoy | 54,417 | |||
Harry N. Park | 55,917 | |||
Curtin R. Rakestraw II | 54,417 | |||
Debra L. Robinson | 13,750 | |||
Bradley J. Schardin | 54,417 | |||
Mark D. Snowden | 54,417 | |||
Dean R. Tesch | 54,417 | |||
Kirk A. Thompson | 54,417 | |||
Stephen C. Vail | 54,417 | |||
Todd P. Ware | 54,417 | |||
Alan W. Wattles | 13,750 | |||
Gregory D. Williams | 54,417 | |||
Compensation Committee Interlocks and Insider Participation
During the year ended May 31, 2016, there were no compensation committee interlocks or insider participation related to executive compensation.
Item 12. | Security Ownership of Certain Beneficial Owners and Management and Related Stockholder Matters |
Not applicable.
Item 13. | Certain Relationships and Related Transactions, and Director Independence |
Review and Approval of Transactions with Related Persons
Our board of directors has established a written policy governing related-person transactions. The policy covers transactions between CFC, on the one hand, and its directors, executive officers or key employees and their immediate family members and entities of which any of our directors, executive officers or key employees (i) is an officer, director, trustee, alternative director or trustee or employee, (ii) control or (iii) have a substantial interest. Under this policy, a related person transaction is any transaction in excess of $120,000 in which CFC was, is or is proposed to be a direct or indirect participant in which a related person had, has or will have a direct or indirect material interest in the transaction. Related person transactions do not include compensation or expense reimbursement arrangements with directors, officers or key employees (notwithstanding
155
that officer compensation may be disclosed in “Item 13. Certain Relationships and Related Transactions, and Director Independence” in our Annual Report on Form 10-K, elsewhere in the CFC’s periodic reports filed with the SEC or otherwise disclosed publicly as a related person transaction); transactions where the related person’s interest arises only from the person’s position as a director of another entity that is a party to the transaction, and transactions deemed to be related credits. Related-person transactions are subject to review by the general counsel, or in some cases, the board of directors (excluding any interested director), based on whether the transaction is fair and reasonable to CFC and consistent with the best interests of CFC.
Related credits are extensions of credit to, or for the benefit of, related persons and entities that are made on substantially the same terms as, and follow underwriting procedures that are no less stringent than, those prevailing at the time for comparable transactions generally offered by CFC. Related credits are not subject to the procedures for transactions with related persons because we were established for the very purpose of extending financing to our members. We, therefore, enter into loan and guarantee transactions with members of which our officers and directors are officers, directors, trustees, alternative directors or trustees, or employees in the ordinary course of our business. All related credits are reviewed from time to time by our internal Corporate Credit Committee, which monitors our extensions of credit, and our independent third-party reviewer, which reviews our credit extension policies on an annual basis. All loans, including related credits, are approved in accordance with an internal credit approval matrix, with each level of risk or exposure potentially escalating the required approval from our lending staff to management, a credit committee or the board of directors. Related credits of $250,000 or less are generally approved by our lending staff or internal Corporate Credit Committee. Any related credit in excess of $250,000 requires approval by the full board of directors, except that any interested directors may not participate, directly or indirectly, in the credit approval process, and the CEO has the authority to approve emergency lines of credit and certain other loans and lines of credit. Notwithstanding the related-person transaction policy, the CEO will extend such loans and lines of credit in qualifying situations to a member of which a CFC director was a director or officer, provided that all such credits are underwritten in accordance with prevailing standards and terms. Such situations are typically weather related and must meet specific qualifying criteria. To ensure compliance with this policy, no related persons may be present in person or by teleconference while a related credit is being considered. Under no circumstances may we extend credit to a related person or any other person in the form of a personal loan.
As a cooperative, CFC was established for the very purpose of extending financing to its members, from which our directors must be drawn. Loans and guarantees to member systems of which directors of CFC are officers, directors, trustees, alternative directors or trustees, or employees, are made in the ordinary course of CFC business on the same terms, including interest rates and collateral, as those prevailing at the time for comparable transactions with other members and that do not involve more than normal risk of uncollectibility or present other unfavorable features. It is anticipated that, consistent with its loan and guarantee policies in effect from time to time, additional loans and guarantees will be made by CFC to member systems and trade and service organizations of which directors of CFC or their immediate family members (i) are officers, directors, trustees, alternative directors or trustees or employees, (ii) control or (iii) have a substantial beneficial interest. CFC has adopted a policy whereby substantially all extensions of credit to such entities are approved only by the disinterested directors.
156
Related-Person Transactions
The following table contains the total compensation earned by CFC’s executive officers during the year ended May 31, 2016 who are not named executive officers but meet the definition of a “related person” as described above. Total compensation disclosed below is made up of the same components included in the “Summary Compensation Table” under “Item 11. Executive Compensation.”
Name and Principal Position | Total Compensation | |||
Roberta B. Aronson | ||||
Senior Vice President and General Counsel | $ | 649,902 | ||
Joel Allen | ||||
Senior Vice President, Member Services | 549,697 | |||
Robin C. Reed | ||||
Senior Vice President, Loan Operations | 507,304 | |||
Graceann D. Clendenen | ||||
Senior Vice President, Corporate Services | 504,695 | |||
Steven M. Kettler | ||||
Senior Vice President, Strategic Services | 488,856 | |||
Brad L. Captain | ||||
Senior Vice President, Corporate Relations | 392,810 | |||
John M. Borak | ||||
Senior Vice President, Credit Risk Management | 391,038 | |||
John J. List(1) | ||||
Senior Vice President and Chief Lending Officer | 199,537 | |||
___________________________
(1) Mr. List retired from his position on September 11, 2015.
Independence Determinations
The board of directors has determined the independence of each director based on a review by the full board. The Audit Committee is subject to the independence requirements of Rule 10A-3 under the Securities Exchange Act. To evaluate the independence of our directors, the board has voluntarily adopted categorical independence standards consistent with the New York Stock Exchange (“NYSE”) standards. However, because we only list debt securities on the NYSE, we are not subject to most of the corporate governance listing standards of the NYSE, including the independence requirements.
No director is considered independent unless the board has affirmatively determined that he or she has no material relationship with CFC, either directly or as a partner, shareholder or officer of an organization that has a relationship with CFC. Material relationships can include banking, legal, accounting, charitable and familial relationships, among others. In addition, a director is not considered independent if any of the following relationships existed:
(i) | the director is, or has been within the last three years, an employee of CFC or an immediate family member is, or has been within the last three years, an executive officer of CFC; |
(ii) | the director has received, or has an immediate family member who has received, during any 12-month period within the last three years, more than $120,000 in direct compensation from CFC, other than director and committee fees and pension or other forms of deferred compensation for prior service (provided that such compensation is not contingent in any way on continued service); |
(iii) | (a) the director or an immediate family member is a current partner of a firm that is CFC’s internal or external auditor; (b) the director is a current employee of such a firm; (c) the director has an immediate family member who |
157
is a current employee of such a firm and personally works on CFC’s audit; or (d) the director or an immediate family member was within the last three years (but is no longer) a partner or employee of such a firm and personally worked on CFC’s audit within that time;
(iv) | the director or an immediate family member is, or has been within the last three years, employed as an executive officer of another company where any of CFC’s present executive officers at the same time serves or served on that company’s compensation committee; or |
(v) | the director is a current employee, or an immediate family member is a current executive officer, of a company that has made payments to, or received payments from, CFC for property or services in an amount which, in any of the last three fiscal years, exceeds the greater of $1 million, or 2% of such other company’s consolidated gross revenue. |
The board of directors also reviewed directors’ responses to a questionnaire asking about their relationships with CFC and its affiliates (and those of their immediate family members) and other potential conflicts of interest.
Based on the criteria above, the board of directors has determined that the directors listed below are independent for the period of time served by such directors during fiscal year 2016. The board determined that none of the directors listed below had any of the relationships listed in (i) - (v) above or any other material relationship that would compromise their independence.
Independent Directors | ||
Ray Beavers (1) | Mel Coleman | Harry N. Park |
Patrick L. Bridges | Kent D. Farmer | Curtin R. Rakestraw II |
Robert Brockman | Doyle Jay Hanson | Bradley J. Schardin |
Mike Campbell | Thomas L. Hayes | Dean R. Tesch |
Philip A. Carson | Robert M. Hill | Stephen C. Vail |
R. Grant Clawson | Jimmy A. LaFoy | Gregory D. Williams |
____________________________ | ||
(1) This director served during the year ended May 31, 2016; however, he was no longer a director as of May 31, 2016. | ||
Item 14. | Principal Accounting Fees and Services |
CFC’s Audit Committee is solely responsible for the nomination, approval, compensation, evaluation and discharge of the independent public accountants. The independent registered public accountants report directly to the Audit Committee, and the Audit Committee is responsible for the resolution of disagreements between management and the independent registered public accountants. Consistent with U.S. Securities and Exchange Commission requirements, the Audit Committee has adopted a policy to pre-approve all audit and permissible non-audit services provided by the independent registered public accountants provided such services do not impair the independent public accountant’s independence.
KPMG, LLP was our independent registered public accounting firm for the fiscal years ended May 31, 2016 and 2015. KPMG, LLP has advised the Audit Committee that they are independent accountants with respect to the Company, within the meaning of standards established by the Public Company Accounting Oversight Board (“PCAOB”) and federal securities laws administered by the SEC. The following table displays the aggregate estimated or actual fees for professional services provided by KPMG, LLP in fiscal years 2016 and 2015, including fees for the 2016 and 2015 audits. All services for fiscal years 2016 and 2015 were pre-approved by the Audit Committee.
May 31, | ||||||||
(Dollars in thousands) | 2016 | 2015 | ||||||
Description of fees: | ||||||||
Audit fees(1) | $ | 1,623 | $ | 1,928 | ||||
Tax fees(2) | 17 | 28 | ||||||
All other fees(3) | 28 | 28 | ||||||
Total | $ | 1,668 | $ | 1,984 | ||||
158
____________________________
(1) Audit fees for fiscal years 2016 and 2015 consist of fees for the quarterly reviews of our interim financial information and the audit of our annual consolidated financial statements and fees for the preparation of the stand-alone financial statements for RTFC, NCSC and CAH. Audit fees for fiscal years 2016 and 2015 also include comfort letter fees and consents related to debt issuances and compliance work required by the independent auditors.
(2) Tax fees consist of assistance with matters related to tax compliance and consulting.
(3) All other fees for fiscal years 2016 and 2015 consist of fees for the audit of a trust serviced by CFC and fees for certain agreed-upon procedures.
PART IV
Item 15. Exhibits, Financial Statement Schedules
(a) | Financial Statement Schedules | |
The following documents are filed as part of this Report in Part II, Item 8 and are incorporated herein by reference. | ||
1. | Consolidated Financial Statements | Page |
2. | Schedules | |
None. | ||
(b) | Exhibits | |
An Exhibit Index has been filed as part of this Form 10-K and is incorporated herein by reference. | ||
160
SIGNATURES
Pursuant to the requirements of Section 13 or 15(d) of the Securities Exchange Act of 1934, the registrant has duly caused this report to be signed on its behalf by the undersigned, thereunto duly authorized, in the County of Loudoun, Commonwealth of Virginia, on the 25th day of August 2016.
NATIONAL RURAL UTILITIES COOPERATIVE | |
FINANCE CORPORATION | |
By: | /s/ SHELDON C. PETERSEN |
Sheldon C. Petersen | |
Chief Executive Officer | |
Pursuant to the requirements of the Securities Exchange Act of 1934, this report has been signed below by the following persons on behalf of the registrant and in the capacities and on the date indicated.
161
Signature | Title | Date | ||
/s/ SHELDON C. PETERSEN | Chief Executive Officer | August 25, 2016 | ||
Sheldon C. Petersen | ||||
/s/ J. ANDREW DON | Senior Vice President and Chief Financial Officer | August 25, 2016 | ||
J. Andrew Don | ||||
/s/ ROBERT E. GEIER | Vice President and Controller | August 25, 2016 | ||
Robert E. Geier | ||||
/s/ R. GRANT CLAWSON | President and Director | August 25, 2016 | ||
R. Grant Clawson | ||||
/s/ MIKE CAMPBELL | Vice President and Director | August 25, 2016 | ||
Mike Campbell | ||||
/s/ HARRY N. PARK | Secretary-Treasurer and Director | August 25, 2016 | ||
Harry N. Park | ||||
/s/ PATRICK L. BRIDGES | Director | August 25, 2016 | ||
Patrick L. Bridges | ||||
/s/ ROBERT BROCKMAN | Director | August 25, 2016 | ||
Robert Brockman | ||||
/s/ PHILLIP A. CARSON | Director | August 25, 2016 | ||
Philip A. Carson | ||||
/s/ MEL COLEMAN | Director | August 25, 2016 | ||
Mel Coleman | ||||
/s/ KENT D. FARMER | Director | August 25, 2016 | ||
Kent D. Farmer | ||||
/s/ ROMAN E. GILLEN | Director | August 25, 2016 | ||
Roman E. Gillen | ||||
/s/ DOYLE JAY HANSON | Director | August 25, 2016 | ||
Doyle Jay Hanson | ||||
/s/ THOMAS L. HAYES | Director | August 25, 2016 | ||
Thomas L. Hayes | ||||
162
/s/ ROBERT M. HILL | Director | August 25, 2016 | ||
Robert M. Hill | ||||
/s/ JIMMY A. LAFOY | Director | August 25, 2016 | ||
Jimmy A. LaFoy | ||||
/s/ CURTIN R. RAKESTRAW II | Director | August 25, 2016 | ||
Curtin R. Rakestraw II | ||||
/s/ DEBRA L. ROBINSON | Director | August 25, 2016 | ||
Debra L. Robinson | ||||
/s/ BRADLEY J. SCHARDIN | Director | August 25, 2016 | ||
Bradley J. Schardin | ||||
/s/ MARK D. SNOWDEN | Director | August 25, 2016 | ||
Mark D. Snowden | ||||
/s/ DEAN R. TESCH | Director | August 25, 2016 | ||
Dean R. Tesch | ||||
/s/ KIRK A. THOMPSON | Director | August 25, 2016 | ||
Kirk A. Thompson | ||||
/s/ STEPHEN C. VAIL | Director | August 25, 2016 | ||
Stephen C. Vail | ||||
/s/ TODD P. WARE | Director | August 25, 2016 | ||
Todd P. Ware | ||||
/s/ ALAN W. WATTLES | Director | August 25, 2016 | ||
Alan W. Wattles | ||||
/s/ GREGORY D. WILLIAMS | Director | August 25, 2016 | ||
Gregory D. Williams | ||||
163
EXHIBIT INDEX
The following exhibits are incorporated by reference or filed herewith.
Exhibit No. | Description | |
3.1 | — | Articles of Incorporation. Incorporated by reference to Exhibit 3.1 to our Form 10-K filed on August 28, 2014. |
3.2 | — | Amended Bylaws as approved by the CFC Board of Directors and members on March 7, 2011. Incorporated by reference to Exhibit 3.2 to our Form 10-Q filed on April 13, 2011. |
4.1 | — | Form of Capital Term Certificate. Incorporated by reference to Exhibit 4.3 to Registration Statement No. 2-46018 filed October 12, 1972. |
4.2 | — | Indenture dated February 15, 1994, between the Registrant and First Bank National Association as trustee. Incorporated by reference to Exhibit 4.2 to our Form 10-Q filed on October 15, 2007. |
4.3 | — | Form of indenture between CFC and Mellon Bank, N.A., as Trustee. Incorporated by reference to Exhibit 4.1 to Registration Statement on Form S-3 filed on November 14, 1995 (Registration No. 33-64231). |
4.4 | — | Indenture dated as of December 15,1987, between CFC and Chemical Bank, as Trustee. Incorporated by reference to Exhibit 4.1 to Registration Statement on Form S-3ASR filed on November 24, 2008 (Registration No. 333-155631). |
4.5 | — | First Supplemental Indenture between CFC and Chemical Bank, as Trustee. Incorporated by reference to Exhibit 4.2 to Registration Statement on Form S-3 filed on April 5, 1995 (Registration No. 33-58445). |
4.6 | — | Form of indenture dated May 15, 2000, between the Registrant and Bank One Trust Company, National Association, as trustee. Incorporated by reference to Exhibit 4.1 to Registration Statement on Form S-3 filed on May 25, 2000 (Registration No. 333-37940). |
4.7 | — | First Supplemental Indenture dated March 12, 2007, between the Registrant and U.S. Bank National Association, as successor trustee. Incorporated by reference to Exhibit 4.2 to Registration Statement on Form S-3ASR filed on April 19, 2007 (Registration No. 333-142230). |
4.8 | — | Indenture dated October 25, 2007, between the Registrant and U.S. Bank National Association, as trustee. Incorporated by reference to Exhibit 4.1 to Registration Statement on Form S-3ASR filed on October 26, 2007 (Registration No. 333-146960). |
10.1^ | — | Plan Document for CFC’s Deferred Compensation Program amended and restated July 1, 2003. Incorporated by reference to Exhibit 10.1 to our Form 10-K filed on August 24, 2005. |
10.2^ | — | Employment Contract between CFC and John T. Evans, dated September 17, 1997. Incorporated by reference to Exhibit 10.4 to our Form 10-K filed on August 27, 2007. |
10.3^ | — | Plan Document for CFC’s Deferred Compensation Pension Restoration Plan dated January 1, 2005. Incorporated by reference to Exhibit 10.16 to our Form 10-K filed on August 17, 2009. |
10.4^ | — | Plan Document for CFC’s Deferred Compensation Program amended and restated February 1, 2014. Incorporated by reference to Exhibit 10.6 to our Form 10-K filed on August 28, 2014. |
10.5^ | — | Plan Document for CFC's Executive Benefit Restoration Plan dated December 9, 2014. Incorporated by reference to Exhibit 10.1 to our Form 10-Q filed on April 13, 2015. |
10.6^ | — | Employment Agreement between the Company and Sheldon C. Petersen, effective January 1, 2015. Incorporated by reference to Exhibit 10.1 to our Form 8-K filed on December 23, 2014. |
10.7^ | — | Supplemental Executive Retirement Plan of the Company, effective January 1, 2015. Incorporated by reference to Exhibit 10.2 to our Form 8-K filed on December 23, 2014. |
10.8 | Amended and Restated Revolving Credit Agreement dated November 19, 2015 maturing on November 19, 2018. Incorporated by reference to Exhibit 10.1 to our Form 10-Q filed on January 13, 2016. | |
10.9 | Amended and Restated Revolving Credit Agreement dated November 19, 2015 maturing on November 19, 2020. Incorporated by reference to Exhibit 10.2 to our Form 10-Q filed on January 13, 2016. | |
164
Exhibit No. | Description | |
10.10 | — | Bond Purchase Agreement between the Registrant, Federal Financing Bank and Rural Utilities Service dated June 14, 2005 for up to $1,000,000,000. Incorporated by reference to Exhibit 4.12 to our Form 10-K filed on August 24, 2005. |
10.11 | — | Series A Future Advance Bond from the Registrant to the Federal Financing Bank dated June 14, 2005 for up to $1,000,000,000 maturing on July 15, 2028. Incorporated by reference to Exhibit 4.15 to our Form 10-K filed on August 24, 2005. |
10.12 | — | Bond Purchase Agreement between the Registrant, Federal Financing Bank and Rural Utilities Service dated April 28, 2006 for up to $1,500,000,000. Incorporated by reference to Exhibit 4.11 to our Form 10-K filed on August 25, 2006. |
10.13 | — | Series B Future Advance Bond from the Registrant to the Federal Financing Bank dated April 28, 2006 for up to $1,500,000,000 maturing on July 15, 2029. Incorporated by reference to Exhibit 4.14 to our Form 10-K filed on August 25, 2006. |
10.14 | — | Series C Bond Purchase Agreement between the Registrant, Federal Financing Bank and Rural Utilities Service dated September 19, 2008 for up to $500,000,000. Incorporated by reference to Exhibit 4.29 to our Form 10-Q filed on October 14, 2008. |
10.15 | — | Series C Future Advance Bond from the Registrant to the Federal Financing Bank dated September 19, 2008 for up to $500,000,000 maturing on October 15, 2031. Incorporated by reference to Exhibit 4.32 to our Form 10-Q filed on October 14, 2008. |
10.16 | — | Indenture for Clean Renewable Energy Bonds, Tax Credit Series 2008A dated January 1, 2008, between the Registrant and U.S. Bank Trust National Association. The Indenture has been omitted and will be furnished supplementally to the Securities and Exchange Commission upon request. |
10.17 | — | Indenture for Clean Renewable Energy Bonds, Secured Tax Credit Series 2009A dated September 1, 2009 between the Registrant, U.S. Bank Trust National Association as trustee, and the Federal Agricultural Mortgage Corporation as guarantor. The Indenture has been omitted and will be furnished supplementally to the Securities and Exchange Commission upon request. |
10.18 | — | Series D Bond Purchase Agreement between the Registrant, Federal Financing Bank and Rural Utilities Service dated as of November 10, 2010 for up to $500,000,000. Incorporated by reference to Exhibit 4.1 to our Form 10-Q filed on January 14, 2011. |
10.19 | — | Series D Future Advance Bond from the Registrant to the Federal Financing Bank dated as of November 10, 2010 for up to $500,000,000 maturing on October 15, 2033. Incorporated by reference to Exhibit 4.4 to our Form 10-Q filed on January 14, 2011. |
10.20 | — | Series E Bond Purchase Agreement between the Registrant, Federal Financing Bank and Rural Utilities Service dated as of December 1, 2011 for up to $499,000,000. Incorporated by reference to Exhibit 10.3 to our Form 10-Q filed on January 17, 2012. |
10.21 | — | Series E Future Advance Bond from the Registrant to the Federal Financing Bank dated as of December 1, 2011 for up to $499,000,000 maturing on October 15, 2034. Incorporated by reference to Exhibit 10.6 to our Form 10-Q filed on January 17, 2012. |
10.22 | — | Series F Bond Purchase Agreement between the Registrant, Federal Financing Bank and Rural Utilities Service dated as of December 13, 2012 for up to $424,286,000. Incorporated by reference to Exhibit 10.1 to our Form 10-Q filed in January 14, 2013. |
10.23 | — | Series F Future Advance Bond from the Registrant to the Federal Financing Bank dated as of December 13, 2012 for up to $424,286,000 maturing on October 15, 2035. Incorporated by reference to Exhibit 10.4 to our Form 10-Q filed in January 14, 2013. |
10.24 | — | Series G Bond Purchase Agreement between the Registrant, Federal Financing Bank and Rural Utilities Service dated as of November 21, 2013 for up to $500,000,000. Incorporated by reference to Exhibit 10.1 to our Form 10-Q filed in January 13, 2014. |
10.25 | — | Series G Future Advance Bond from the Registrant to the Federal Financing Bank dated as of November 21, 2013 for up to $500,000,000 maturing on October 15, 2036. Incorporated by reference to Exhibit 10.3 to our Form 10-Q filed in January 13, 2014. |
10.26 | — | Series H Bond Purchase Agreement between the Registrant, Federal Financing Bank and Rural Utilities Service dated as of November 18, 2014 for up to $250,000,000. Incorporated by reference to Exhibit 10.1 to our Form 10-Q filed on April 13, 2015. |
10.27 | — | Series H Future Advance Bond from the Registrant to the Federal Financing Bank dated as of November 18, 2014 for up to $250,000,000 maturing on October 15, 2034. Incorporated by reference to Exhibit 10.1 to our Form 10-Q filed on April 13, 2015. |
165
Exhibit No. | Description | |
10.28 | Series K Bond Purchase Agreement between the Registrant, Federal Financing Bank and Rural Utilities Service dated as of March 29, 2016 for up to $250,000,000. Incorporated by reference to Exhibit 10.1 to our Form 10-Q filed on April 4, 2016. | |
10.29 | Series K Future Advance Bond from the Registrant to the Federal Financing Bank dated as of March 29, 2016 for up to $250,000,000 maturing on January 15, 2039. Incorporated by reference to Exhibit 10.2 to our Form 10-Q filed on April 4, 2016. | |
10.30 | Second Amended, Restated and Consolidated Pledge Agreement dated as of March 29, 2016 between the Registrant, the Rural Utilities Service and U.S. Bank National Association. Incorporated by reference to Exhibit 10.3 to our Form 10-Q filed on April 4, 2016. | |
10.31 | Second Amended, Restated and Consolidated Bond Guarantee Agreement dated as of March 29, 2016 between the Registrant and the Rural Utilities Service. Incorporated by reference to Exhibit 10.4 to our Form 10-Q filed on April 4, 2016. | |
10.32 | — | Master Sale and Servicing Agreement dated July 24, 2009, between the Registrant and Federal Agricultural Mortgage Corporation. Incorporated by reference to Exhibit 4.47 to our Form 10-K filed on August 17, 2009. |
10.33 | — | Amended and Restated Master Note Purchase Agreement dated March 24, 2011 between the Registrant and Federal Agricultural Mortgage Corporation. Incorporated by reference to Exhibit 4.4 to our Form 10-Q filed on April 13, 2011. |
10.34 | — | First Supplemental Note Purchase Agreement dated March 24, 2011 for $3,900,000,000 between the Registrant and Federal Agricultural Mortgage Corporation. Incorporated by reference to Exhibit 4.6 to our Form 10-Q filed on April 13, 2011. |
10.35 | — | Amended and Restated First Supplemental Note Purchase Agreement dated January 8, 2015, between the Registrant and Federal Agricultural Mortgage Corporation. Incorporated by reference to Exhibit 10.6 to our Form 10-Q filed on January 14, 2015. |
10.36 | — | Second Amended, Restated and Consolidated Pledge Agreement dated July 31, 2015, between the Registrant, Federal Agricultural Mortgage Corporation and U.S. Bank Trust National Association. Incorporated by reference to Exhibit 10.48 to our Form 10-K filed on August 26, 2015. |
10.37 | Long Term Standby Commitment to Purchase dated August 31, 2015, between the Registrant and Federal Agricultural Mortgage Corporation. Incorporated by reference to Exhibit 10.1 to our Form 10-Q filed on October 14, 2015. | |
10.38* | Amendment No. 1 to Long Term Standby Commitment to Purchase, dated as of May 31, 2016, between the Registrant and Federal Agricultural Mortgage Corporation. | |
10.39 | Purchase Agreement dated September 30, 2015, between the Registrant, Caribbean Asset Holdings, LLC, ATN VI Holdings, LLC and Atlantic Tele-Network, Inc. Incorporated by reference to Exhibit 10.2 to our Form 10-Q filed on October 14, 2015. | |
10.40* | Amendment to Purchase Agreement dated July 1 2016, between the Registrant, Caribbean Asset Holdings, LLC, ATN VI Holdings, LLC and ATN International (formerly Atlantic Tele-Network, Inc.). | |
— | Registrant agrees to furnish to the Securities and Exchange Commission a copy of all other instruments defining the rights of holders of its long-term debt upon request. | |
12* | — | Computations of ratio of earnings to fixed charges. |
23.1* | — | Consent of KPMG LLP. |
31.1* | — | Certification of the Chief Executive Officer required by Section 302 of the Sarbanes-Oxley Act of 2002. |
31.2* | — | Certification of the Chief Financial Officer required by Section 302 of the Sarbanes-Oxley Act of 2002. |
32.1† | — | Certification of the Chief Executive Officer required by Section 906 of the Sarbanes-Oxley Act of 2002. |
32.2† | — | Certification of the Chief Financial Officer required by Section 906 of the Sarbanes-Oxley Act of 2002. |
101.INS* | — | XBRL Instance Document |
101.SCH* | — | XBRL Taxonomy Extension Schema Document |
101.CAL* | — | XBRL Taxonomy Calculation Linkbase Document |
166
Exhibit No. | Description | |
101.LAB* | — | XBRL Taxonomy Label Linkbase Document |
101.PRE* | — | XBRL Taxonomy Presentation Linkbase Document |
101.DEF* | — | XBRL Taxonomy Definition Linkbase Document |
___________________________
*Indicates a document being filed with this Report.
^Identifies a management contract or compensatory plan or arrangement.
†Indicates a document that is furnished with this Report, which shall not be deemed “filed” for purposes of Section 18 of the Securities Exchange Act of 1934, or otherwise subject to the liability of that Section.
167