Attached files
| file | filename |
|---|---|
| EX-32.2 - EXHIBIT 32.2 - NATIONAL RURAL UTILITIES COOPERATIVE FINANCE CORP /DC/ | nrufy2021q1exhibit322.htm |
| EX-32.1 - EXHIBIT 32.1 - NATIONAL RURAL UTILITIES COOPERATIVE FINANCE CORP /DC/ | nrufy2021q1exhibit321.htm |
| EX-31.2 - EXHIBIT 31.2 - NATIONAL RURAL UTILITIES COOPERATIVE FINANCE CORP /DC/ | nrufy2021q1exhibit312.htm |
| EX-31.1 - EXHIBIT 31.1 - NATIONAL RURAL UTILITIES COOPERATIVE FINANCE CORP /DC/ | nrufy2021q1exhibit311.htm |
| EX-3.2 - EXHIBIT 3.2 - NATIONAL RURAL UTILITIES COOPERATIVE FINANCE CORP /DC/ | nrufy2021q1exhibit32.htm |
UNITED STATES
SECURITIES AND EXCHANGE COMMISSION
Washington, D.C. 20549
__________________________
FORM 10-Q
__________________________
x QUARTERLY REPORT PURSUANT TO SECTION 13 OR 15(d) OF THE SECURITIES EXCHANGE ACT OF 1934 |
For the quarterly period ended August 31, 2020
OR
¨ TRANSITION REPORT PURSUANT TO SECTION 13 OR 15(d) OF THE SECURITIES EXCHANGE ACT OF 1934 |
For the transition period from to
Commission File Number: 1-7102
__________________________
NATIONAL RURAL UTILITIES
COOPERATIVE FINANCE CORPORATION
(Exact name of registrant as specified in its charter)
__________________________
District of Columbia | 52-0891669 | |
(State or other jurisdiction of incorporation or organization) | (I.R.S. Employer Identification No.) | |
20701 Cooperative Way, Dulles, Virginia, 20166 |
(Address of principal executive offices) (Zip Code) |
Registrant’s telephone number, including area code: (703) 467-1800
__________________________
Securities registered pursuant to Section 12(b) of the Act:
Title of Each Class | Trading Symbol(s) | Name of Each Exchange on Which Registered |
7.35% Collateral Trust Bonds, due 2026 | NRUC 26 | New York Stock Exchange |
5.50% Subordinated Notes, due 2064 | NRUC | New York Stock Exchange |
Indicate by check mark whether the registrant (1) has filed all reports required to be filed by Section 13 or 15(d) of the Securities Exchange Act of 1934 during the preceding 12 months (or for such shorter period that the registrant was required to file such reports), and (2) has been subject to such filing requirements for the past 90 days. Yes x No ¨
Indicate by check mark whether the registrant has submitted electronically every Interactive Data File required to be submitted pursuant to Rule 405 of Regulation S-T (§232.405 of this chapter) during the preceding 12 months (or for such shorter period that the registrant was required to submit such files). Yes x No ¨
Indicate by check mark whether the registrant is a large accelerated filer, an accelerated filer, a non-accelerated filer, a smaller reporting company, or an emerging growth company. See the definitions of “large accelerated filer,” “accelerated filer,” “smaller reporting company,” and “emerging growth company” in Rule 12b-2 of the Exchange Act.
Large accelerated filer ¨ Accelerated filer ¨ Non-accelerated filer x Smaller reporting company ¨ Emerging growth company ¨
If an emerging growth company, indicate by check mark if the registrant has elected not to use the extended transaction period for complying with any new or revised financial accounting standards provided pursuant to Section13(a) of the Exchange Act. ¨
Indicate by check mark whether the registrant is a shell company (as defined in Rule 12b-2 of the Exchange Act). Yes ¨ No x
TABLE OF CONTENTS
Page | ||||
i
MD&A TABLE CROSS REFERENCE INDEX
Table | Description | Page | |||
1 | Summary of Selected Financial Data | 3 | |||
2 | Average Balances, Interest Income/Interest Expense and Average Yield/Cost | 11 | |||
3 | Rate/Volume Analysis of Changes in Interest Income/Interest Expense | 13 | |||
4 | Non-Interest Income | 15 | |||
5 | Derivative Gains (Losses) | 16 | |||
6 | Derivative Cash Settlements Expense—Average Notional Amounts and Interest Rates | 17 | |||
7 | Non-Interest Expense | 18 | |||
8 | Loans Outstanding by Member Class and Loan Type | 19 | |||
9 | Historical Retention Rate and Repricing Selection | 20 | |||
10 | Total Debt Outstanding | 21 | |||
11 | Member Investments | 22 | |||
12 | Collateral Pledged | 23 | |||
13 | Unencumbered Loans | 24 | |||
14 | Equity | 25 | |||
15 | Guarantees Outstanding | 26 | |||
16 | Maturities of Guarantee Obligations | 27 | |||
17 | Unadvanced Loan Commitments | 27 | |||
18 | Unadvanced Loan Commitments Maturities of Notional Amount | 28 | |||
19 | Unconditional Committed Lines of Credit Maturities of Notional Amount | 29 | |||
20 | Loan Portfolio Security Profile | 31 | |||
21 | Loan Exposure to 20 Largest Borrowers | 32 | |||
22 | Troubled Debt Restructured Loans | 33 | |||
23 | Allowance for Credit Losses | 35 | |||
24 | Rating Triggers for Derivatives | 37 | |||
25 | Available Liquidity | 38 | |||
26 | Committed Bank Revolving Line of Credit Agreements | 38 | |||
27 | Short-Term Borrowings—Funding Sources | 40 | |||
28 | Short-Term Borrowings | 40 | |||
29 | Long-Term and Subordinated Debt Issuances and Repayments | 41 | |||
30 | Long-Term and Subordinated Debt Principal Maturity | 41 | |||
31 | Projected Sources and Uses of Liquidity from Debt and Investment Activity | 42 | |||
32 | Credit Ratings | 43 | |||
33 | Interest Rate Gap Analysis | 45 | |||
34 | Adjusted Financial Measures—Income Statement | 46 | |||
35 | TIER and Adjusted TIER | 47 | |||
36 | Adjusted Financial Measures—Balance Sheet | 47 | |||
37 | Debt-to-Equity Ratio and Adjusted Debt-to-Equity Ratio | 48 | |||
38 | Members’ Equity | 48 | |||
ii
PART I—FINANCIAL INFORMATION
Item 2. | Management’s Discussion and Analysis of Financial Condition and Results of Operations (“MD&A”) |
FORWARD-LOOKING STATEMENTS |
This Quarterly Report on Form 10-Q for the quarterly period ended August 31, 2020 (“this Report”) contains certain statements that are considered “forward-looking statements” as defined and within the meaning of the safe-harbor provisions of the Private Securities Litigation Reform Act of 1995. Forward-looking statements do not represent historical facts or statements of current conditions. Instead, forward-looking statements represent management’s current beliefs and expectations, based on certain assumptions and estimates made by, and information available to, management at the time the statements are made, regarding our future plans, strategies, operations, financial results or other events and developments, many of which, by their nature, are inherently uncertain and outside our control. Forward-looking statements are generally identified by the use of words such as “intend,” “plan,” “may,” “should,” “will,” “project,” “estimate,” “anticipate,” “believe,” “expect,” “continue,” “potential,” “opportunity” and similar expressions, whether in the negative or affirmative. All statements about future expectations or projections, including statements about loan volume, the adequacy of the allowance for credit losses, operating income and expenses, leverage and debt-to-equity ratios, borrower financial performance, impaired loans, and sources and uses of liquidity, are forward-looking statements. Although we believe that the expectations reflected in our forward-looking statements are based on reasonable assumptions, actual results and performance may differ materially from our forward-looking statements. Therefore, you should not place undue reliance on any forward-looking statement and should consider the risks and uncertainties that could cause our current expectations to vary from our forward-looking statements including, but not limited to, general economic conditions, legislative changes including those that could affect our tax status, governmental monetary and fiscal policies, demand for our loan products, lending competition, changes in the quality or composition of our loan portfolio, changes in our ability to access external financing, changes in the credit ratings on our debt, valuation of collateral supporting impaired loans, charges associated with our operation or disposition of foreclosed assets, technological changes within the rural electric utility industry, regulatory and economic conditions in the rural electric industry, nonperformance of counterparties to our derivative agreements, the costs and impact of legal or governmental proceedings involving us or our members, the occurrence and effect of natural disasters or public health emergencies, such as the emergence in 2019 and continued spread of a novel coronavirus that causes coronavirus disease 2019 (“COVID-19”), which was declared a global pandemic by the World Health Organization (“WHO”) in March 2020, and the factors identified under “Item 1A. Risk Factors” in our Annual Report on Form 10-K for the fiscal year ended May 31, 2020 (“2020 Form 10-K”), as well as any risk factors identified under “Part II—Item 1A. Risk Factors” in this Report. Forward-looking statements speak only as of the date they are made, and, except as required by law, we undertake no obligation to update any forward-looking statement to reflect the impact of events, circumstances or changes in expectations that arise after the date the forward-looking statement is made.
INTRODUCTION |
National Rural Utilities Cooperative Finance Corporation (“CFC”) is a member-owned cooperative association incorporated under the laws of the District of Columbia in April 1969. CFC’s principal purpose is to provide its members with financing to supplement the loan programs of the Rural Utilities Service (“RUS”) of the United States Department of Agriculture (“USDA”). CFC makes loans to its rural electric members so they can acquire, construct and operate electric distribution systems, generation and transmission (“power supply”) systems and related facilities. CFC also provides its members with credit enhancements in the form of letters of credit and guarantees of debt obligations. As a cooperative, CFC is owned by and exclusively serves its membership, which consists of not-for-profit entities or subsidiaries or affiliates of not-for-profit entities. CFC is exempt from federal income taxes under Section 501(c)(4) of the Internal Revenue Code. As a member-owned cooperative, CFC’s objective is not to maximize profit, but rather to offer members cost-based financial products and services. CFC funds its activities primarily through a combination of public and private issuances of debt securities, member investments and retained equity. As a Section 501(c)(4) tax-exempt, member-owned cooperative, we cannot issue equity securities.
Our financial statements include the consolidated accounts of CFC, National Cooperative Services Corporation (“NCSC”), Rural Telephone Finance Cooperative (“RTFC”) and subsidiaries created and controlled by CFC to hold foreclosed assets resulting from defaulted loans or bankruptcy. NCSC is a taxable member-owned cooperative that may provide financing to
1
members of CFC, government or quasi-government entities which own electric utility systems that meet the Rural Electrification Act definition of “rural,” and for-profit and nonprofit entities that are owned, operated or controlled by, or provide significant benefits to certain members of CFC. RTFC is a taxable Subchapter T cooperative association that provides financing for its rural telecommunications members and their affiliates. CFC and its consolidated entities have not held any foreclosed assets since fiscal year 2017. See “Item 1. Business—Overview” in our 2020 Form 10-K for additional information on the business activities of each of these entities. Unless stated otherwise, references to “we,” “our” or “us” relate to CFC and its consolidated entities. All references to members within this document include members, associates and affiliates of CFC and its consolidated entities, except where indicated otherwise.
We conduct our operations through three business segments, which are based on of the legal entities included in our consolidated financial statements: CFC, NCSC and RTFC. CFC’s business operations account for the substantial majority of our loans and revenue. Loans to members totaled $26,929 million as of August 31, 2020, of which 96% was attributable to CFC. We generated total revenue, which consists of net interest income and fee and other income, of $103 million for the three months ended August 31, 2020 (“current quarter”), compared with $88 million for the three months ended August 31, 2019 (“same prior-year quarter”). Our adjusted total revenue was $76 million for the current quarter, compared with $77 million for the same prior-year quarter. We provide information on the financial performance of our business segments in “Note 14—Business Segments.”
Management monitors a variety of key indicators to evaluate our business performance. In addition to financial measures determined in accordance with generally accepted accounting principles in the United States (“GAAP”), management also evaluates performance based on certain non-GAAP measures and metrics, which we refer to as “adjusted” measures. The following MD&A is intended to provide the reader with an understanding of our consolidated results of operations, financial condition and liquidity by discussing the factors influencing changes from period to period and key measures used by management to evaluate performance, including, among others, net interest income, net interest yield, debt-to-equity ratio and the related non-GAAP adjusted measures, loan activity and credit quality metrics. Our MD&A is provided as a supplement to, and should be read in conjunction with the unaudited consolidated financial statements and related notes in this Report, our audited consolidated financial statements and related notes in our 2020 Form 10-K and additional information contained in our 2020 Form 10-K, including the risk factors identified under “Part I—Item 1A. Risk Factors,” as well as additional information contained elsewhere in this Report.
SUMMARY OF SELECTED FINANCIAL DATA |
Table 1 provides a summary of consolidated selected financial data for the three months ended August 31, 2020 and 2019, and as of August 31, 2020 and May 31, 2020. In addition to financial measures determined in accordance with GAAP, management also evaluates performance based on certain non-GAAP measures, which we refer to as “adjusted” measures. Our key non-GAAP financial measures are adjusted net income, adjusted net interest income, adjusted interest expense, adjusted net interest yield, adjusted TIER and adjusted debt-to-equity ratio. The most comparable GAAP measures are net income, net interest income, interest expense, net interest yield, TIER and debt-to-equity ratio, respectively. The primary adjustments we make to calculate these non-GAAP measures consist of: (i) adjusting interest expense and net interest income to include the impact of net periodic derivative cash settlements expense; (ii) adjusting net income, total liabilities and total equity to exclude the non-cash impact of the accounting for derivative financial instruments; (iii) adjusting total liabilities to exclude the amount that funds CFC member loans guaranteed by RUS, subordinated deferrable debt and members’ subordinated certificates; and (iv) adjusting total equity to include subordinated deferrable debt and members’ subordinated certificates and exclude cumulative derivative forward value gains and losses and accumulated other comprehensive income (“AOCI”). We believe our non-GAAP adjusted measures, which are not a substitute for GAAP and may not be consistent with similarly titled non-GAAP measures used by other companies, provide meaningful information and are useful to investors because management evaluates performance based on these metrics for purposes of: (i) budgeting and forecasting; (ii) comparing period-to-period operating results, analyzing changes in results and identifying potential trends; (iii) making compensation decisions; and (iv) informing the establishment of short- and long-term strategic goals. In addition, certain of the financial covenants in our committed bank revolving line of credit agreements and debt indentures are based on these non-GAAP adjusted measures. We provide a reconciliation of our non-GAAP adjusted measures to the most comparable GAAP measures in the section “Non-GAAP Financial Measures.”
2
Table 1: Summary of Selected Financial Data(1)
Three Months Ended August 31, | ||||||||||
(Dollars in thousands) | 2020 | 2019 | Change | |||||||
Statement of operations | ||||||||||
Interest income | $ | 279,584 | $ | 290,015 | (4)% | |||||
Interest expense | (179,976 | ) | (213,271 | ) | (16) | |||||
Net interest income | 99,608 | 76,744 | 30 | |||||||
Fee and other income | 3,516 | 10,941 | (68) | |||||||
Total revenue | 103,124 | 87,685 | 18 | |||||||
Provision for credit losses | (326 | ) | (30 | ) | 987 | |||||
Derivative gains (losses)(2) | 60,276 | (395,725 | ) | ** | ||||||
Investment securities gains | 4,659 | 1,620 | 188 | |||||||
Operating expenses(3) | (22,663 | ) | (25,329 | ) | (11) | |||||
Other non-interest (expense) income(1) | (332 | ) | 7,179 | ** | ||||||
Income (loss) before income taxes | 144,738 | (324,600 | ) | ** | ||||||
Income tax (provision) benefit | (151 | ) | 521 | ** | ||||||
Net income (loss) | $ | 144,587 | $ | (324,079 | ) | ** | ||||
Adjusted operational financial measures | ||||||||||
Adjusted interest expense(4) | $ | (206,948 | ) | $ | (224,314 | ) | (8) | |||
Adjusted net interest income(4) | 72,636 | 65,701 | 11 | |||||||
Adjusted total revenue(4) | 76,152 | 76,642 | (1) | |||||||
Adjusted net income(4) | 57,339 | 60,603 | (5) | |||||||
Selected ratios | ||||||||||
Fixed-charge coverage ratio/TIER(5) | 1.80 | — | 180 bps | |||||||
Adjusted TIER(4) | 1.28 | 1.27 | 1 | |||||||
Net interest yield(6) | 1.42 | % | 1.14 | % | 28 | |||||
Adjusted net interest yield(4)(7) | 1.04 | 0.97 | 7 | |||||||
Net charge-off rate(8) | 0.00 | 0.00 | — | |||||||
3
August 31, 2020 | May 31, 2020 | Change | ||||||||
Balance sheet | ||||||||||
Cash, cash equivalents and restricted cash | $ | 357,194 | $ | 680,019 | (47)% | |||||
Investment securities | 589,792 | 370,135 | 59 | |||||||
Loans to members(9) | 26,928,877 | 26,702,380 | 1 | |||||||
Allowance for credit losses(10) | (57,351 | ) | (53,125 | ) | 8 | |||||
Loans to members, net | 26,871,526 | 26,649,255 | 1 | |||||||
Total assets | 28,262,621 | 28,157,605 | — | |||||||
Short-term borrowings | 4,553,491 | 3,961,985 | 15 | |||||||
Long-term debt | 19,181,520 | 19,712,024 | (3) | |||||||
Subordinated deferrable debt | 986,166 | 986,119 | — | |||||||
Members’ subordinated certificates | 1,298,845 | 1,339,618 | (3) | |||||||
Total debt outstanding | 26,020,022 | 25,999,746 | — | |||||||
Total liabilities | 27,531,117 | 27,508,783 | — | |||||||
Total equity | 731,504 | 648,822 | 13 | |||||||
Guarantees(11) | 683,246 | 820,786 | (17) | |||||||
Selected ratios period end | ||||||||||
Allowance coverage ratio(10)(12) | 0.21 | % | 0.20 | % | — | |||||
Debt-to-equity ratio(13) | 37.64 | 42.40 | (476) | |||||||
Adjusted debt-to-equity ratio(4) | 5.96 | 5.85 | 11 | |||||||
** Calculation of percentage change is not meaningful.
(1)Certain reclassifications have been made to prior periods to conform to the current period presentation.
(2)Consists of net periodic contractual interest amounts on our interest rate swaps, which we refer to as derivatives cash settlements interest (expense) income, and derivative forward value gains (losses) on derivatives not designated for hedge accounting. Derivative forward value gains (losses) represent changes in fair value during the period, excluding net periodic contractual interest amounts, related to derivatives not designated for hedge accounting and amounts reclassified into income related to the cumulative transition adjustment amount recorded in accumulated other comprehensive income as of June 1, 2001, the adoption date of the derivative accounting guidance requiring derivatives to be reported at fair value on the balance sheet.
(3)Consists of salaries and employee benefits and the other general and administrative expenses components of non-interest expense, each of which are presented separately on our consolidated statements of operations.
(4)See “Non-GAAP Financial Measures” for details on the calculation of these non-GAAP adjusted measures and the reconciliation to the most comparable GAAP measures.
(5)Calculated based on net income (loss) plus interest expense for the period divided by interest expense for the period. The fixed-charge coverage ratios and TIER were the same during each period presented because we did not have any capitalized interest during these periods.
(6)Calculated based on annualized net interest income for the period divided by average interest-earning assets for the period.
(7)Calculated based on annualized adjusted net interest income for the period divided by average interest-earning assets for the period.
(8)Calculated based on annualized net charge-offs (recoveries) for the period divided by average total outstanding loans for the period.
(9)Consists of the outstanding principal balance of member loans plus unamortized deferred loan origination costs, which totaled $12 million as of both August 31, 2020 and May 31, 2020.
(10)On June 1, 2020, we adopted Accounting Standards Update (“ASU”) 2016-13, Financial Instruments—Credit Losses (Topic 326): Measurement of Credit Losses on Financial Instruments, which replaces the incurred loss methodology previously used for estimating our allowance for credit losses with an expected loss methodology referred to as the current expected credit loss (“CECL”) model. At adoption, we recorded an increase in our allowance for credit losses of $4 million and a corresponding decrease in retained earnings through a cumulative-effect adjustment.
(11)Reflects the total amount of member obligations for which CFC has guaranteed payment to a third party as of the end of each period. This amount represents our maximum exposure to loss, which significantly exceeds the guarantee liability recorded on our consolidated balance sheets. See “Note 11—Guarantees” for additional information.
(12)Calculated based on the allowance for credit losses at period end divided by total outstanding loans at period end.
(13)Calculated based on total liabilities at period end divided by total equity at period end.
4
EXECUTIVE SUMMARY |
Our primary objective as a member-owned cooperative lender is to provide cost-based financial products to our rural electric members while maintaining a sound financial position required for investment-grade credit ratings on our debt instruments. Our objective is not to maximize profit; therefore, the rates we charge our member-borrowers reflect our funding costs plus a spread to cover our operating expenses, a provision for credit losses and earnings sufficient to achieve interest coverage to meet our financial objectives. Our goal is to earn an annual minimum adjusted TIER of 1.10 and to maintain an adjusted debt-to-equity ratio at approximately 6.00-to-1 or below.
We are subject to period-to-period volatility in our reported GAAP results due to changes in market conditions and differences in the way our financial assets and liabilities are accounted for under GAAP. Our financial assets and liabilities expose us to interest-rate risk. We use derivatives, primarily interest rate swaps, as part of our strategy in managing this risk. Our derivatives are intended to economically hedge and manage the interest-rate sensitivity mismatch between our financial assets and liabilities. We are required under GAAP to carry derivatives at fair value on our consolidated balance sheets; however, the financial assets and liabilities for which we use derivatives to economically hedge are carried at amortized cost. Changes in interest rates and the shape of the swap curve result in periodic fluctuations in the fair value of our derivatives, which may cause volatility in our earnings because we do not apply hedge accounting for our interest rate swaps. As a result, the mark-to-market changes in our interest rate swaps are recorded in earnings. Because our derivative portfolio consists of a higher proportion of pay-fixed swaps than receive-fixed swaps, we generally record derivative losses when interest rates decline and derivative gains when interest rates rise. This earnings volatility generally is not indicative of the underlying economics of our business, as the derivative forward fair value gains or losses recorded each period may or may not be realized over time, depending on the terms of our derivative instruments and future changes in market conditions that impact the periodic cash settlement amounts of our interest rate swaps. As such, management uses our non-GAAP adjusted results to evaluate our operating performance. Our adjusted results include realized net periodic interest rate swap settlement amounts but exclude the impact of unrealized forward fair value gains and losses. Certain of the financial covenants in our committed bank revolving line of credit agreements and debt indentures are also based on our non-GAAP adjusted results, as the forward fair value gains and losses related to our interest rate swaps do not affect our cash flows, liquidity or ability to service our debt.
Financial Performance
Reported Results
We reported net income of $145 million and a TIER of 1.80 for the current quarter. In comparison, we reported a net loss of $324 million for the same prior-year quarter, which resulted in no TIER coverage. The significant variance between our reported results for the current quarter and the same prior-year quarter was attributable to mark-to-market changes in the fair value of our derivative instruments. Our debt-to-equity ratio decreased to 37.64 as of August 31, 2020, from 42.40 as of May 31, 2020, primarily due to an increase in equity from our reported net income of $145 million, which was partially offset by a decrease in equity as a result of the CFC Board of Directors’ authorization in the current quarter to retire patronage capital of $60 million, which we returned to members in September 2020.
The variance of $469 million between our reported net income of $145 million for the current quarter and our reported net loss of $324 million for the same prior-year quarter was driven by a shift of $456 million in the derivative fair value changes recorded in each period. We recorded net derivative gains of $60 million for the current quarter due to a net increase in the fair value of our swap portfolio, which consists predominately of pay-fixed swaps, primarily attributable to an increase in long-term swap interest rates. In comparison, we recorded net derivative losses of $396 million for the same prior-year quarter due to a net decrease in the fair value of our swap portfolio primarily attributable to a decline in interest rates across the swap curve, with medium- and longer-term interest rates experiencing a steeper decline than short-term rates. Net interest income increased $23 million, or 30%, to $100 million for the current quarter, attributable to an increase in the net interest yield of 28 basis points, or 25%, to 1.42% and an increase in our average interest-earning assets of $947 million, or 4%. The increase in the net interest yield was largely due to a reduction in our average cost of borrowings of 61 basis points to 2.75%, partially offset by a decrease in the average yield on interest-earning assets of 31 basis points to 3.99%. The reduction in the overall average cost of borrowings was driven by a decrease in the average cost of our short-term borrowings of 213 basis points to 0.45% for the current quarter.
5
The decreases in our average borrowing cost and average yield on interest-earning assets reflect in part the impact of the overall lower interest rate environment. Since August 31, 2019, the end of the same prior-year quarter, the Federal Open Market Committee (“FOMC”) of the Federal Reserve has lowered the benchmark federal funds rate by 200 basis points, including a 150 basis point reduction in March 2020 to a near zero target range of 0% to 0.25% as part of a series of measures implemented to ease the economic impact of the COVID-19 crisis. Over the last 12 months, the 3-month London Interbank Offered Rate (“LIBOR”) decreased by190 basis points to 0.24% as of August 31, 2020. Medium- and longer-term interest rates also fell during this 12-month period, but the decreases were not as pronounced as the decrease in short-term interest rates.
Other factors affecting the variance between our results for the current quarter and the same prior-year quarter include a decrease in fee income of $7 million due to a reduction in prepayment fees and the absence of a gain of $8 million recorded in connection with the sale of land in the same prior-year quarter.
Adjusted Non-GAAP Results
Adjusted net income totaled $57 million and adjusted TIER was 1.28 for the current quarter, compared with adjusted net income of $61 million and adjusted TIER of 1.27 for the same prior-year quarter. Our adjusted debt-to-equity ratio increased to 5.96 as of August 31, 2020, from 5.85 as of May 31, 2020, primarily attributable to a reduction in adjusted equity due to the maturity of subordinated certificates and the authorized patronage capital retirement amount, partially offset by adjusted net income for the current quarter. Our adjusted debt-to-equity ratio of 5.96 as of August 31, 2020, remained below our targeted threshold of 6.00-to-1.
The decrease in adjusted net income of $4 million in the current quarter from the same prior-year quarter was largely attributable to the combined impact of the decrease in fee income of $7 million due to a reduction in prepayment fees and the absence of the gain of $8 million recorded in connection with the sale of land in the same prior-year quarter, which was partially offset by an increase in adjusted net interest income of $7 million, or 11%, to $73 million for the current quarter. The increase in adjusted net interest income was driven by an increase in the adjusted net interest yield of 7 basis points, or 7%, to 1.04% and an increase in average interest-earning assets of $947 million, or 4%. The increase in our adjusted net interest yield reflected the favorable impact of a reduction in our adjusted average cost of borrowings of 37 basis points to 3.16%, which was partially offset by a decrease in the average yield on interest-earning assets of 31 basis points to 3.99%. As noted above, the lower interest rate environment had a favorable impact on our adjusted average cost of borrowings and contributed to the decrease in the average yield on interest-earnings assets.
See “Non-GAAP Financial Measures” for additional information on our adjusted measures, including a reconciliation of these measures to the most comparable GAAP measures.
Lending Activity
Loans to members totaled $26,929 million as of August 31, 2020, an increase of $227 million, or 1%, from May 31, 2020. The increase was driven by an increase in long-term loans of $385 million, partially offset by a decrease in line of credit loans of $159 million. CFC distribution loans and RTFC loans increased by $242 million and $11 million, respectively. NCSC loans, CFC statewide and associate loans and CFC power supply loans decreased by $17 million, $8 million and $2 million, respectively.
Long-term loan advances totaled $807 million during the current quarter, of which approximately 93% was provided to members for capital expenditures and approximately 4% was provided for the refinancing of loans made by other lenders. In comparison, long-term loan advances totaled $888 million during the same prior-year quarter, of which approximately 73% was provided to members for capital expenditures and approximately 19% was provided for the refinancing of loans made by other lenders. CFC had long-term fixed-rate loans totaling $79 million that were scheduled to reprice during the current quarter. Of this total, $78 million repriced to a new long-term fixed rate and the remainder either repriced to a long-term variable rate or were repaid in full. In comparison, CFC had long-term fixed-rate loans totaling $110 million that were scheduled to reprice during the same prior-year quarter, of which $109 million repriced to a new long-term fixed rate and $1 million was repaid in full.
6
Credit Quality
Despite the economic disruption caused by COVID-19, the overall credit quality of our loan portfolio remained high as of August 31, 2020, as evidenced by our continued strong credit performance metrics. We had no delinquent loans as of August 31, 2020 or May 31, 2020, and we have not experienced any loan defaults or charge-offs since fiscal year 2017. During the fourth quarter of fiscal year 2020, we classified one loan to a CFC power supply borrower with an outstanding balance of $168 million as of May 31, 2020, as nonperforming, placed the loan on nonaccrual status and established an asset-specific allowance for credit losses of $34 million as of May 31, 2020. We received payments from the borrower on this loan during the current quarter, which reduced the outstanding balance to $161 million as of August 31, 2020. The asset-specific allowance for credit losses for this loan, which we continue to report as nonperforming and remains on nonaccrual status, was $33 million as of August 31, 2020. We had no other loans classified as nonperforming or on nonaccrual status as of August 31, 2020 or May 31, 2020.
Loans outstanding to electric utility organizations represented approximately 99% of total loans outstanding as of both August 31, 2020 and May 31, 2020. We historically have had limited defaults and losses on loans in our electric utility loan portfolio largely because of the essential nature of the service provided by electric utility cooperatives as well as other factors, such as limited rate regulation and competition, which we discuss further in the section “Credit Risk—Loan Portfolio Credit Risk.” We generally lend to members on a senior secured basis, which reduces the risk of loss in the event of a borrower default. Of our total loans outstanding, 94% were secured as of August 31, 2020 and May 31, 2020.
On June 1, 2020, we adopted ASU 2016-13, Financial Instruments—Credit Losses (Topic 326): Measurement of Credit Losses on Financial Instruments, which replaces the incurred loss methodology for estimating credit losses with an expected loss methodology that is referred to as the current expected credit loss (“CECL”) model. The incurred loss model delayed the recognition of credit losses until it was probable that a loss had occurred, while the CECL model requires the immediate recognition of expected credit losses over the contractual term, adjusted as appropriate for estimated prepayments, of financial instruments that fall within the scope of CECL at the date of origination or purchase of the financial instrument. The CECL model, which is applicable to the measurement of credit losses on financial assets measured at amortized cost and certain off-balance sheet credit exposures, affects our estimates of the allowance for credit losses for our loan portfolio and our off-balance sheet credit exposures related to unadvanced loan commitments and financial guarantees.The adoption of CECL resulted in an increase in our allowance for credit losses for our loan portfolio of $4 million and a corresponding decrease to retained earnings of $4 million recorded through a cumulative-effect adjustment. The impact on the allowance for credit losses for our off-balance sheet credit exposures related to unadvanced loan commitments and financial guarantees was not material. While the adoption of CECL had no impact on our earnings, subsequent to our adoption on June 1, 2020, lifetime expected credit losses for newly recognized loans, unadvanced loan commitments and financial guarantees, as well as changes during the period in our estimate of lifetime expected credit losses for existing financial instruments subject to CECL, will be recognized in earnings.
The allowance for credit losses for our loan portfolio increased to $57 million as of August 31, 2020, from $53 million as of May 31, 2020, and the allowance coverage ratio increased to 0.21% from 0.20%, primarily due to the increase in the allowance of $4 million recorded at adoption of CECL on June 1, 2020. We discuss our methodology for estimating the allowance for credit losses under the CECL model in “Note 1—Summary of Significant Accounting Policies” of this Report. We also provide information on the allowance for credit losses below in the section “Credit Risk—Allowance for Credit Losses” and in “Note 5—Allowance for Credit Losses.”
7
Financing Activity
We issue debt primarily to fund growth in our loan portfolio. As such, our outstanding debt volume generally increases and decreases in response to member loan demand. Total debt outstanding was $26,020 million as of August 31, 2020, an increase of $20 million from May 31, 2020. Debt activity during the current quarter consisted of net increases in outstanding member commercial paper, select notes and daily liquidity fund notes of $297 million and dealer commercial paper of $300 million, which together totaled $597 million. This increase was partially offset by net decreases in collateral trust bonds of $396 million, medium-term notes of $86 million, borrowings under the United States Department of Agriculture (“USDA”) Guaranteed Underwriter Program (“Guaranteed Underwriter Program”) of $35 million and Federal Agricultural Mortgage Corporation (“Farmer Mac”) notes payable of $18 million, which together totaled $535 million. Outstanding dealer commercial paper totaled $300 million as of August 31, 2020, below our targeted maximum threshold of $1,250 million.
Liquidity
As of August 31, 2020, our sources of liquidity readily available for access totaled $6,956 million, consisting of (i) $348 million in cash and cash equivalents; (ii) $528 million in debt investment securities; (iii) up to $2,722 million available for access under committed bank revolving line of credit agreements; (iv) up to $900 million available under committed loan facilities under the Guaranteed Underwriter Program; and (v) up to $2,458 million available under a revolving note purchase agreement with Farmer Mac, subject to market conditions.
The face value of long-term debt scheduled to mature over the next 12 months totaled $2,269 million as of August 31, 2020, consisting of fixed-rate debt of $1,395 million with a weighted average cost of 2.35%, variable-rate debt of $645 million and scheduled amortization on borrowings under the Guaranteed Underwriter Program and notes payable to Farmer Mac of $229 million. Our available liquidity of $6,956 million as of August 31, 2020, was $4,687 million, or 2.1 times, in excess of our long-term debt obligations of $2,269 million over the next 12 months. We currently believe that our available liquidity along with our ability to access the capital markets as a well-known seasoned issuer of debt and to issue debt to our members and in private placements will be more than sufficient to cover our debt obligations to meet the borrowing needs of our members and satisfy our obligations to repay long-term debt maturing over the next 12 months subsequent to August 31, 2020.
Our members historically have maintained a relatively stable level of short-term investments in CFC in the form of commercial paper, select notes, daily liquidity fund notes and medium-term notes. We believe we can continue to roll over outstanding member short-term debt of $4,003 million as of August 31, 2020, based on our expectation that our members will continue to reinvest their excess cash in our commercial paper, daily liquidity fund notes, select notes and medium-term notes. We expect to continue accessing the dealer commercial paper market as a cost-effective means of satisfying our short-term liquidity needs. Although the intra-period amount of outstanding dealer commercial paper may fluctuate based on our liquidity requirements, we intend to manage our short-term wholesale funding risk by maintaining outstanding dealer commercial paper at an amount near or below $1,250 million for the foreseeable future. We expect to continue to be in compliance with the covenants under our committed bank revolving line of credit agreements, which will allow us to mitigate roll-over risk, as we can draw on these facilities to repay dealer or member commercial paper that cannot be refinanced with similar debt.
We provide additional information on our primary sources and uses of liquidity and our liquidity profile below in the section “Liquidity Risk.”
COVID-19
We continue to adhere to the COVID-19 guidelines established by the Centers for Disease Control and Prevention and the World Health Organization and orders issued by state and local governments where we operate. In mid-June 2020, following the announcement by the governor of phased reopening dates and guidelines for Virginia, we implemented a return-to-work policy that included, as part of our physical distancing measures, assigning employees to physically separate teams and a staggered weekly in-office rotation schedule for each team to limit the number of employees present at any given time, face mask covering requirements and an enhanced cleaning program to maintain the well-being of our employees as well as comply with Virginia’s reopening guidelines. Our current expectation is that we will maintain the return-to-work policy
8
implemented in mid-June for the near term. To date, our business resiliency plans and technology systems have effectively supported both remote and on-site operations.
We have been working with our members not only as a lender, but also by offering a full range of products, services, tools and training designed to help cooperatives continue to deliver uninterrupted, essential utility services to their customers and successfully manage the ongoing challenges of the COVID-19 pandemic.
Outlook for the Next 12 Months
We have been able to navigate the challenges of the COVID-19 pandemic reasonably well to date. As noted above, we currently believe that we have sufficient cash flow and liquidity to cover our debt obligations as well as meet the borrowing needs of our members. While there continues to be uncertainty about the duration and severity of the COVID-19 pandemic and the extent of its future economic impact, our borrowers operate in an industry sector that historically has been resilient to economic downturns. Our electric utility cooperative members, which have a strong track record in preparing for and responding to emergencies, thus far, have been able to manage the challenges and pressures presented by the COVID-19 pandemic. To date, the COVID-19 pandemic has not had a material adverse impact on the operations and financial performance of the substantial majority of our borrowers. Thus far, we have not experienced any delinquencies in scheduled loan payments from our borrowers or received requests for payment deferrals or covenant relief.
While the overall credit quality of our loan portfolio remains high, we continue to actively monitor conditions and developments, including key credit metrics of our borrowers, to facilitate the timely identification of loans with potential credit weaknesses and assess any notable shifts in the credit quality of our loan portfolio as well as any impact on our financial position. Assuming no material adverse change in the overall credit quality of our borrowers, we expect that our financial performance for fiscal year 2021 will be comparable to or slightly better than our financial performance for fiscal year 2020, absent the impact of (i) the non-cash impairment charge of $31 million recorded in the fourth quarter of fiscal year 2020 resulting from the abandonment of an internal-use software project; (ii) the loan impairment charge of $34 million recorded in the fourth quarter of fiscal year 2020 due to the establishment of an asset-specific allowance for the outstanding loan to the CFC power supply borrower noted above; and (iii) changes in the fair value of our derivatives and investment securities that are driven by changes in market interest rates and prices, which we are unable to predict.
See “Item 1A. Risk Factors” in our 2020 Form 10-K for a discussion of the potential adverse impact of COVID-19 on our business, results of operations, financial condition and liquidity.
CRITICAL ACCOUNTING POLICIES AND ESTIMATES |
The preparation of financial statements in accordance with GAAP requires management to make a number of judgments, estimates and assumptions that affect the reported amount of assets, liabilities, income and expenses in our consolidated financial statements. Understanding our accounting policies and the extent to which we use management’s judgment and estimates in applying these policies is integral to understanding our financial statements. We provide a discussion of our significant accounting policies under “Note 1—Summary of Significant Accounting Policies” in our 2020 Form 10-K. Pursuant to our June 1, 2020 adoption of the CECL accounting standard, we have provided updates to certain of our significant accounting policies, including the allowance for credit losses, in “Note 1—Summary of Significant Accounting Policies” of this Report.
We have identified certain accounting policies as critical because they involve significant judgments and assumptions about highly complex and inherently uncertain matters, and the use of reasonably different estimates and assumptions could have a material impact on our results of operations or financial condition. Our most critical accounting policies and estimates involve the determination of the allowance for credit losses and fair value. Below we have updated our critical accounting policy for the allowance for credit losses under the CECL model, which involves additional areas involving significant management judgment.
Prior to the adoption of CECL on June 1, 2020, we maintained an allowance based on an estimate of probable incurred losses inherent in our loan portfolio as of each balance sheet date. Under CECL, we are required to maintain an allowance based on a current estimate of credit losses that are expected to occur over the remaining contractual life of the loans in our
9
portfolio. The methods utilized to estimate the allowance for credit losses, key assumptions and quantitative and qualitative information considered by management in determining the appropriate allowance for credit losses is discussed in “Note 1—Summary of Significant Accounting Policies” of this Report. The determination of allowance for credit losses entails significant judgment on various risk factors, including our historical loss data, third-party default data and the assessment of a borrower’s capacity to meet its financial obligations. While our estimate of lifetime credit losses is sensitive to each of these inputs, the most notable input that affects the sensitivity of the allowance is the internal risk ratings assigned to each borrower.
We evaluate our critical accounting estimates and judgments required by our policies on an ongoing basis and update them as necessary based on changing conditions. Management has discussed significant judgments and assumptions in applying our critical accounting policies with the Audit Committee of the CFC Board of Directors. We provide information on the significant judgments and assumptions in measuring fair value under “MD&A—Critical Accounting Policies and Estimates” in our 2020 Form 10-K. See “Item 1A. Risk Factors” in our 2020 Form 10-K for a discussion of the risks associated with management’s judgments and estimates in applying our accounting policies and methods.
RECENT ACCOUNTING CHANGES AND OTHER DEVELOPMENTS |
Recent Accounting Changes
See “Note 1—Summary of Significant Accounting Policies” for information on accounting standards adopted during the current fiscal year, as well as recently issued accounting standards not yet required to be adopted and the expected impact of the adoption of these accounting standards. To the extent we believe the adoption of new accounting standards has had or will have a material impact on our consolidated results of operations, financial condition or liquidity, we also discuss the impact in the applicable section(s) of this MD&A.
CONSOLIDATED RESULTS OF OPERATIONS |
The section below provides a comparative discussion of our consolidated results of operations between the three months ended August 31, 2020 and 2019. Following this section, we provide a comparative analysis of our consolidated balance sheets as of August 31, 2020 and May 31, 2020. You should read these sections together with our “Executive Summary—Outlook for the Next 12 Months” where we discuss trends and other factors that we expect will affect our future results of operations.
Net Interest Income
Net interest income represents the difference between the interest income earned on our interest-earning assets, which includes loans and investment securities, and the interest expense on our interest-bearing liabilities. Our net interest yield represents the difference between the yield on our interest-earning assets and the cost of our interest-bearing liabilities plus the impact from non-interest bearing funding. We expect net interest income and our net interest yield to fluctuate based on changes in interest rates and changes in the amount and composition of our interest-earning assets and interest-bearing liabilities. We do not fund each individual loan with specific debt. Rather, we attempt to minimize costs and maximize efficiency by proportionately funding large aggregated amounts of loans.
Table 2 presents average balances for the three months ended August 31, 2020 and 2019, and for each major category of our interest-earning assets and interest-bearing liabilities, the interest income earned or interest expense incurred, and the average yield or cost. Table 2 also presents non-GAAP adjusted interest expense, adjusted net interest income and adjusted net interest yield, which reflect the inclusion of net accrued periodic derivative cash settlements expense in interest expense. We provide reconciliations of our non-GAAP adjusted measures to the most comparable GAAP measures under “Non-GAAP Financial Measures.”
10
Table 2: Average Balances, Interest Income/Interest Expense and Average Yield/Cost
Three Months Ended August 31, | ||||||||||||||||||||||
(Dollars in thousands) | 2020 | 2019 | ||||||||||||||||||||
Assets: | Average Balance | Interest Income/Expense | Average Yield/Cost | Average Balance | Interest Income/Expense | Average Yield/Cost | ||||||||||||||||
Long-term fixed-rate loans(1) | $ | 24,607,166 | $ | 263,184 | 4.24 | % | $ | 23,358,728 | $ | 258,528 | 4.40 | |||||||||||
Long-term variable-rate loans | 686,024 | 4,400 | 2.54 | 993,105 | 9,756 | 3.91 | ||||||||||||||||
Line of credit loans | 1,416,678 | 8,242 | 2.31 | 1,712,082 | 16,033 | 3.73 | ||||||||||||||||
Troubled debt restructuring (“TDR”) loans | 10,781 | 207 | 7.62 | 11,786 | 206 | 6.95 | ||||||||||||||||
Nonperforming loans | 164,758 | — | — | — | — | — | ||||||||||||||||
Other, net(2) | — | (335 | ) | — | — | (334 | ) | — | ||||||||||||||
Total loans | 26,885,407 | 275,698 | 4.07 | 26,075,701 | 284,189 | 4.34 | ||||||||||||||||
Cash, time deposits and investment securities | 906,308 | 3,886 | 1.70 | 768,763 | 5,826 | 3.01 | ||||||||||||||||
Total interest-earning assets | $ | 27,791,715 | $ | 279,584 | 3.99 | % | $ | 26,844,464 | $ | 290,015 | 4.30 | % | ||||||||||
Other assets, less allowance for credit losses | 476,024 | 605,697 | ||||||||||||||||||||
Total assets | $ | 28,267,739 | $ | 27,450,161 | ||||||||||||||||||
Liabilities: | ||||||||||||||||||||||
Short-term borrowings | $ | 3,864,887 | $ | 4,341 | 0.45 | % | $ | 3,513,191 | $ | 22,822 | 2.58 | % | ||||||||||
Medium-term notes | 3,684,835 | 29,887 | 3.22 | 3,571,967 | 32,076 | 3.57 | ||||||||||||||||
Collateral trust bonds | 6,850,779 | 62,593 | 3.62 | 7,385,085 | 65,381 | 3.52 | ||||||||||||||||
Guaranteed Underwriter Program notes payable | 6,242,813 | 42,413 | 2.70 | 5,398,324 | 40,433 | 2.98 | ||||||||||||||||
Farmer Mac notes payable | 3,052,451 | 13,933 | 1.81 | 3,031,600 | 25,074 | 3.29 | ||||||||||||||||
Other notes payable | 11,625 | 87 | 2.97 | 22,529 | 254 | 4.49 | ||||||||||||||||
Subordinated deferrable debt | 986,136 | 12,890 | 5.19 | 986,014 | 12,882 | 5.20 | ||||||||||||||||
Subordinated certificates | 1,307,879 | 13,832 | 4.20 | 1,356,145 | 14,349 | 4.21 | ||||||||||||||||
Total interest-bearing liabilities | $ | 26,001,405 | $ | 179,976 | 2.75 | % | $ | 25,264,855 | $ | 213,271 | 3.36 | % | ||||||||||
Other liabilities | 1,591,883 | 1,012,301 | ||||||||||||||||||||
Total liabilities | 27,593,288 | 26,277,156 | ||||||||||||||||||||
Total equity | 674,451 | 1,173,005 | ||||||||||||||||||||
Total liabilities and equity | $ | 28,267,739 | $ | 27,450,161 | ||||||||||||||||||
Net interest spread(3) | 1.24 | % | 0.94 | % | ||||||||||||||||||
Impact of non-interest bearing funding(4) | 0.18 | 0.20 | ||||||||||||||||||||
Net interest income/net interest yield(5) | $ | 99,608 | 1.42 | % | $ | 76,744 | 1.14 | % | ||||||||||||||
Adjusted net interest income/adjusted net interest yield: | ||||||||||||||||||||||
Interest income | $ | 279,584 | 3.99 | % | $ | 290,015 | 4.30 | % | ||||||||||||||
Interest expense | 179,976 | 2.75 | 213,271 | 3.36 | ||||||||||||||||||
Add: Net periodic derivative cash settlements interest expense(6) | 26,972 | 1.16 | 11,043 | 0.41 | ||||||||||||||||||
Adjusted interest expense/adjusted average cost(7) | $ | 206,948 | 3.16 | % | $ | 224,314 | 3.53 | % | ||||||||||||||
Adjusted net interest spread(5) | 0.83 | % | 0.77 | % | ||||||||||||||||||
Impact of non-interest bearing funding(4) | 0.21 | % | 0.20 | % | ||||||||||||||||||
Adjusted net interest income/adjusted net interest yield(8) | $ | 72,636 | 1.04 | % | $ | 65,701 | 0.97 | % | ||||||||||||||
____________________________
(1)Interest income on long-term, fixed-rate loans includes loan conversion fees, which are generally deferred and recognized as interest income using the effective interest method.
(2)Consists of late payment fees and net amortization of deferred loan fees and loan origination costs.
11
(3)Net interest spread represents the difference between the average yield on total average interest-earning assets and the average cost of total average interest-bearing liabilities. Adjusted net interest spread represents the difference between the average yield on total average interest-earning assets and the adjusted average cost of total average interest-bearing liabilities.
(4)Includes other liabilities and equity.
(5)Net interest yield is calculated based on annualized net interest income for the period divided by total average interest-earning assets for the period.
(6)Represents the impact of net periodic contractual interest amounts on our interest rate swaps during the period. This amount is added to interest expense to derive non-GAAP adjusted interest expense. The average (benefit)/cost associated with derivatives is calculated based on the annualized net periodic swap settlement interest amount during the period divided by the average outstanding notional amount of derivatives during the period. The average outstanding notional amount of interest rate swaps was $9,225 million and $10,752 million for the three months ended August 31, 2020 and 2019, respectively.
(7)Adjusted interest expense consists of interest expense plus net periodic derivative cash settlements interest expense during the period. Net periodic derivative cash settlement interest amounts are reported on our consolidated statements of operations as a component of derivative gains (losses). Adjusted average cost is calculated based on annualized adjusted interest expense for the period divided by total average interest-bearing liabilities during the period.
(8)Adjusted net interest yield is calculated based on annualized adjusted net interest income for the period divided by total average interest-earning assets for the period.
Table 3 displays the change in net interest income between periods and the extent to which the variance is attributable to:
(i) changes in the volume of our interest-earning assets and interest-bearing liabilities or (ii) changes in the interest rates of these assets and liabilities. The table also presents the change in adjusted net interest income between periods. Changes that are not solely due to either volume or rate are allocated to these categories on a pro-rata basis based on the absolute value of the change due to average volume and average rate.
12
Table 3: Rate/Volume Analysis of Changes in Interest Income/Interest Expense
Three Months Ended August 31, | ||||||||||||
2020 versus 2019 | ||||||||||||
Total | Variance Due To:(1) | |||||||||||
(Dollars in thousands) | Variance | Volume | Rate | |||||||||
Interest income: | ||||||||||||
Long-term fixed-rate loans | $ | 4,656 | $ | 14,564 | $ | (9,908 | ) | |||||
Long-term variable-rate loans | (5,356 | ) | (2,998 | ) | (2,358 | ) | ||||||
Line of credit loans | (7,791 | ) | (2,730 | ) | (5,061 | ) | ||||||
TDR loans | 1 | (17 | ) | 18 | ||||||||
Other, net | (1 | ) | — | (1 | ) | |||||||
Total loans | (8,491 | ) | 8,819 | (17,310 | ) | |||||||
Cash, time deposits and investment securities | (1,940 | ) | 1,061 | (3,001 | ) | |||||||
Total interest income | (10,431 | ) | 9,880 | (20,311 | ) | |||||||
Interest expense: | ||||||||||||
Short-term borrowings | (18,481 | ) | 2,353 | (20,834 | ) | |||||||
Medium-term notes | (2,189 | ) | 1,104 | (3,293 | ) | |||||||
Collateral trust bonds | (2,788 | ) | (4,564 | ) | 1,776 | |||||||
Guaranteed Underwriter Program notes payable | 1,980 | 6,453 | (4,473 | ) | ||||||||
Farmer Mac notes payable | (11,141 | ) | 242 | (11,383 | ) | |||||||
Other notes payable | (167 | ) | (123 | ) | (44 | ) | ||||||
Subordinated deferrable debt | 8 | 37 | (29 | ) | ||||||||
Subordinated certificates | (517 | ) | (473 | ) | (44 | ) | ||||||
Total interest expense | (33,295 | ) | 5,029 | (38,324 | ) | |||||||
Net interest income | $ | 22,864 | $ | 4,851 | $ | 18,013 | ||||||
Adjusted net interest income: | ||||||||||||
Interest income | $ | (10,431 | ) | $ | 9,880 | $ | (20,311 | ) | ||||
Interest expense | (33,295 | ) | 5,029 | (38,324 | ) | |||||||
Net periodic derivative cash settlements interest expense(2) | 15,929 | (1,542 | ) | 17,471 | ||||||||
Adjusted interest expense(3) | (17,366 | ) | 3,487 | (20,853 | ) | |||||||
Adjusted net interest income | $ | 6,935 | $ | 6,393 | $ | 542 | ||||||
____________________________
(1)The changes for each category of interest income and interest expense are divided between the portion of change attributable to the variance in volume and the portion of change attributable to the variance in rate for that category. The amount attributable to the combined impact of volume and rate has been allocated to each category based on the proportionate absolute dollar amount of change for that category.
(2)For the net periodic derivative cash settlements interest amount, the variance due to average volume represents the change in the net periodic derivative cash settlements interest amount resulting from the change in the average notional amount of derivative contracts outstanding. The variance due to average rate represents the change in the net periodic derivative cash settlements amount resulting from the net difference between the average rate paid and the average rate received for interest rate swaps during the period.
(3)See “Non-GAAP Financial Measures” for additional information on our adjusted non-GAAP measures.
Reported Net Interest Income
Reported net interest income of $100 million for the current quarter increased $23 million, or 30%, from the same prior-year quarter, driven by an increase in the net interest yield of 28 basis points, or 25%, to 1.42% and an increase in average interest-earning assets of 4%.
13
• | Net Interest Yield: The increase in the net interest yield of 28 basis points, or 25%, was largely due to a reduction in our average cost of borrowings of 61 basis points to 2.75%, partially offset by a decrease in the average yield on interest-earning assets of 31 basis points to 3.99%. The reduction in our average cost of borrowings was primarily driven by a decrease in the average cost of our short-term and variable-rate borrowings due to a decrease in short-term interest rates as the FOMC lowered the benchmark federal funds rate by 200 basis points over the last 12 months, including a 150 basis point reduction in March 2020 to a near zero target range of 0% to 0.25% as part of a series of measures implemented to ease the economic impact of the COVID-19 crisis. The average cost of our short-term borrowings decreased 213 basis points to 0.45% for the current quarter. The decrease in the average yield on interest-earning assets reflected the combined impact of a reduction in the average yield on our long-term fixed-rate loan portfolio, as the maturity and pay-off of loan advances at higher rates were replaced with new loan advances at lower rates due to the lower interest rate environment, and a reduction in the average yield on our long-term variable-rate and line of credit loan portfolios due to the decline in short-term interest rates over the last 12 months. |
• | Average Interest-Earning Assets: The increase in average interest-earning assets of 4% was primarily driven by growth in average total loans of $810 million, or 3%, largely attributable to an increase in average long-term fixed-rate loans of $1,248 million, or 5%, as the lower interest rate environment presented an opportunity for members to obtain advances to fund capital investments and refinance with us loans made by other lenders at a reduced fixed rate of interest. |
Adjusted Net Interest Income
Adjusted net interest income of $73 million for the current quarter increased $7 million, or 11%, from the same prior-year quarter, driven by an increase in the adjusted net interest yield of 7 basis points, or 7%, to 1.04%, and the increase in average interest-earning assets of $947 million, or 4%.
• | Adjusted Net Interest Yield: The increase in the adjusted net interest yield 7 basis points, or 7%, reflected the favorable impact of a reduction in our adjusted average cost of borrowings of 37 basis points to 3.16%, which was partially offset by the decrease in the average yield on interest-earning assets of 31 basis points to 3.99%. The reduction in our adjusted average cost of borrowings was largely attributable to the decrease in the average cost of our short-term and variable-rate borrowings and a partially offsetting increase in net periodic derivative cash settlements expense, both of which resulted from the decline in short-term interest rates over the last 12 months. As noted above, the decrease in the average yield on interest-earning assets reflected the combined impact of a reduction in the average yield on our long-term fixed-rate loan portfolio, as the maturity and pay-off of loan advances at higher rates were replaced with new loan advances at lower rates due to the lower interest rate environment, and a reduction in the average yield on our long-term variable-rate and line of credit loan portfolios from the decline in short-term interest rates over the last 12 months. |
• | Average Interest-Earning Assets: The increase in average interest-earning assets of 4% was primarily driven by the growth in average total loans of $810 million, or 3%. |
We include the net periodic derivative interest settlement amounts on our interest rate swaps in the calculation of our adjusted average cost of borrowings, which, as a result, also impacts the calculation of adjusted net interest income and adjusted net interest yield. We recorded net periodic derivative cash settlements interest expense of $27 million for the current quarter, an increase of $16 million from the $11 million recorded for the same prior-year quarter. Because our derivative portfolio consists of a higher proportion of pay-fixed swaps than receive-fixed swaps, we generally record derivative losses when interest rates decline and derivative gains when interest rates rise. The floating-rate payments on our interest rate swaps are typically based on the 3-month LIBOR, which decreased by 190 basis points over the last 12 months to 0.24% as of August 31, 2020. The decrease in the 3-month LIBOR drove the increase of $16 million in the net periodic derivative cash settlements interest expense recorded in the current quarter. See “Non-GAAP Financial Measures” for additional information on our adjusted measures, including a reconciliation of these measures to the most comparable GAAP measures.
14
Provision for Credit Losses
We recorded a provision for credit losses of less than $1 million for the current quarter under the CECL model for estimating our allowance for credit losses. We also recorded a provision for credit losses of less than $1 million for the same prior-year quarter under the incurred model for estimating our allowance for credit losses.
Under CECL, we are required to maintain an allowance based on a current estimate of credit losses that are expected to occur over the remaining contractual term of the loans in our portfolio. Prior to the adoption of CECL on June 1, 2020, we maintained an allowance based on an estimate of probable incurred losses inherent in our loan portfolio as of each balance sheet date.
As discussed above in “Executive Summary—Credit Quality,” the adoption of CECL resulted in an increase in our allowance for credit losses for our loan portfolio of $4 million and a corresponding decrease to retained earnings of $4 million recorded through a cumulative-effect adjustment. While the adoption of CECL had no impact on our earnings, subsequent to our adoption on June 1, 2020, lifetime expected credit losses for newly recognized loans, unadvanced loan commitments and financial guarantees, as well as changes during the period in our estimate of lifetime expected credit losses for existing financial instruments subject to CECL, will be recognized in earnings.
The allowance for credit losses for our loan portfolio increased to $57 million as of August 31, 2020, from $53 million as of May 31, 2020, and the allowance coverage ratio increased to 0.21% from 0.20%, primarily due to the increase in the allowance of $4 million recorded at adoption of CECL on June 1, 2020.
We discuss our methodology for estimating the allowance for credit losses under the CECL model in “Note 1—Summary of Significant Accounting Policies” of this Report. We also provide information on the allowance for credit losses below in the section “Credit Risk—Allowance for Credit Losses” and in “Note 5—Allowance for Credit Losses.”
Non-Interest Income
Non-interest income consists of fee and other income, gains and losses on derivatives not accounted for in hedge accounting relationships and gains and losses on equity and debt investment securities. In the fourth quarter of fiscal year 2020, we transferred all of the debt securities in our held-to-maturity investment portfolio to trading. As a result, we discontinued the reporting of our debt securities at amortized cost and began reporting these securities at fair value and recognizing the related unrealized gains and losses in earnings.
Table 4 presents the components of non-interest income (expense) for the three months ended August 31, 2020 and 2019.
Table 4: Non-Interest Income
Three Months Ended August 31, | ||||||||
(Dollars in thousands) | 2020 | 2019 | ||||||
Non-interest income: | ||||||||
Fee and other income | $ | 3,516 | $ | 10,941 | ||||
Derivative gains (losses) | 60,276 | (395,725 | ) | |||||
Investment securities gains | 4,659 | 1,620 | ||||||
Total non-interest income (loss) | $ | 68,451 | $ | (383,164 | ) | |||
The significant variance between non-interest income for the current quarter and the same prior-year quarter was attributable to the mark-to-market changes in the fair value of our derivative instruments. In addition, fee and other income decreased $7 million due to a reduction in prepayment fees.
Derivative Gains (Losses)
Our derivative instruments are an integral part of our interest rate risk management strategy. Our principal purpose in using derivatives is to manage our aggregate interest rate risk profile within prescribed risk parameters. The derivative instruments
15
we use primarily include interest rate swaps, which we typically hold to maturity. In addition, we may on occasion use treasury locks to manage the interest rate risk associated with debt that is scheduled to reprice in the future. The primary factors affecting the fair value of our derivatives and derivative gains (losses) recorded in our results of operations include changes in interest rates, the shape of the swap curve and the composition of our derivative portfolio. We generally do not designate our interest rate swaps, which currently account for all our derivatives, for hedge accounting. Accordingly, changes in the fair value of interest rate swaps are reported in our consolidated statements of operations under derivative gains (losses). However, we typically designate treasury locks as cash flow hedges. We did not have any derivatives designated as accounting hedges as of August 31, 2020 or May 31, 2020.
We currently use two types of interest rate swap agreements: (i) we pay a fixed rate of interest and receive a variable rate of interest (“pay-fixed swaps”); and (ii) we pay a variable rate of interest and receive a fixed rate of interest (“receive-fixed swaps”). The interest amounts are based on a specified notional balance, which is used for calculation purposes only. The benchmark variable rate for the substantial majority of the floating rate payments under our swap agreements is 3-month LIBOR. As interest rates decline, pay-fixed swaps generally decrease in value and result in the recognition of derivative losses, as the amount of interest we pay remains fixed, while the amount of interest we receive declines. In contrast, as interest rates rise, pay-fixed swaps generally increase in value and result in the recognition of derivative gains, as the amount of interest we pay remains fixed, but the amount we receive increases. With a receive-fixed swap, the opposite results occur as interest rates decline or rise. Because our pay-fixed and receive-fixed swaps are referenced to different maturity terms along the swap curve, different changes in the swap curve—parallel, flattening, inversion or steepening—will also impact the fair value of our derivatives.
Table 5 presents the components of net derivative gains (losses) recorded in our consolidated statements of operations for the three months ended August 31, 2020 and 2019. Derivative cash settlements interest expense represents the net periodic contractual interest amount for our interest-rate swaps during the reporting period. Derivative forward value gains (losses) represent the change in fair value of our interest rate swaps during the reporting period due to changes in expected future interest rates over the remaining life of our derivative contracts. We generally record derivative losses when interest rates decline and derivative gains when interest rates rise, as our derivative portfolio consists of a higher proportion of pay-fixed swaps than receive-fixed swaps.
Table 5: Derivative Gains (Losses)
Three Months Ended August 31, | ||||||||
(Dollars in thousands) | 2020 | 2019 | ||||||
Derivative gains (losses) attributable to: | ||||||||
Derivative cash settlements interest expense | $ | (26,972 | ) | $ | (11,043 | ) | ||
Derivative forward value gains (losses) | 87,248 | (384,682 | ) | |||||
Derivative gains (losses) | $ | 60,276 | $ | (395,725 | ) | |||
The net derivative gains of $60 million for the current quarter were due to a net increase in the fair value of our swap portfolio, primarily attributable to an increase in long-term swap interest rates as depicted by the August 31, 2020 and May 31, 2020 swap curves displayed below in the “Comparative Swap Curves” chart.
The net derivative losses of $396 million for the same prior-year quarter were due to a net decrease in the fair value of our swap portfolio, primarily attributable to a decline in interest rates across the swap curve, with medium- and longer-term interest rates experiencing a steeper decline than short-term rates as depicted by the August 31, 2019 and May 31, 2019 swap curves displayed below in the “Comparative Swap Curves” chart.
Pay-fixed swaps accounted for approximately 72% and 71% of the outstanding notional amount of our derivative portfolio as of August 31, 2020 and May 31, 2020, respectively. The profile of our derivative portfolio, however, may change as a result of changes in market conditions and actions taken to manage exposure to interest rate risk. The average remaining maturity of our pay-fixed and receive-fixed swaps was 19 years and four years, respectively, as of August 31, 2020. In comparison, the average remaining maturity of our pay-fixed and receive-fixed swaps was 18 years and four years, respectively, as of August 31, 2019.
16
Derivative Cash Settlements
As indicated in Table 5 above, we recorded net periodic derivative cash settlements interest expense of $27 million for the current quarter, an increase of $16 million from the $11 million recorded for the same prior-year quarter. The increase was driven by the decrease in the 3-month LIBOR of 190 basis points over the last 12 months to 0.24% as of August 31, 2020. Table 6 displays, by interest rate swap agreement type, the average notional amount outstanding and the weighted-average interest rate paid and received for the net periodic derivative cash settlements interest expense during each respective period.
Table 6: Derivative Cash Settlements Expense—Average Notional Amounts and Interest Rates
Three Months Ended August 31, | ||||||||||||||||||||
2020 | 2019 | |||||||||||||||||||
(Dollars in thousands) | Average Notional Balance | Weighted- Average Rate Paid | Weighted- Average Rate Received | Average Notional Balance | Weighted- Average Rate Paid | Weighted- Average Rate Received | ||||||||||||||
Pay-fixed swaps | $ | 6,579,420 | 2.78 | % | 0.38 | % | $ | 7,353,402 | 2.84 | % | 2.39 | % | ||||||||
Receive-fixed swaps | 2,646,826 | 1.21 | 2.76 | 3,399,000 | 3.09 | 2.56 | ||||||||||||||
Total | $ | 9,226,246 | 2.33 | % | 1.06 | % | $ | 10,752,402 | 2.92 | % | 2.44 | % | ||||||||
Comparative Swap Curves
The chart below provides comparative swap curves as of August 31, 2020, May 31, 2020, August 31, 2019 and May 31, 2019.
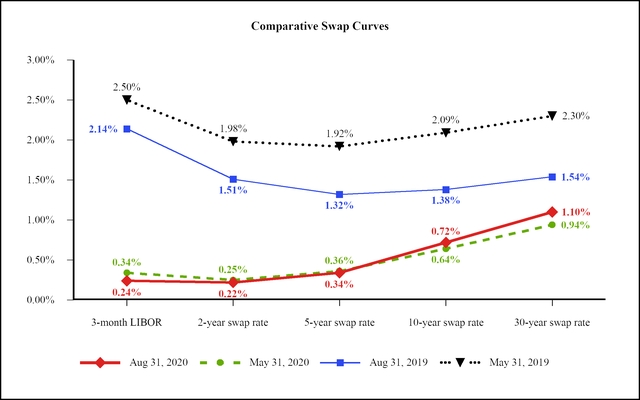
____________________________
Benchmark rates obtained from Bloomberg.
See “Note 9—Derivative Instruments and Hedging Activities” for additional information on our derivative instruments.
17
Non-Interest Expense
Non-interest expense consists of salaries and employee benefit expense, general and administrative expenses, gains and losses on the early extinguishment of debt and other miscellaneous expenses.
Table 7 presents the components of non-interest expense recorded in our consolidated statements of operations for the three months ended August 31, 2020 and 2019.
Table 7: Non-Interest Expense
Three Months Ended August 31, | ||||||||
(Dollars in thousands) | 2020 | 2019 | ||||||
Non-interest expense: | ||||||||
Salaries and employee benefits | $ | (13,133 | ) | $ | (12,942 | ) | ||
Other general and administrative expenses | (9,530 | ) | (12,387 | ) | ||||
Other non-interest (expense) income | (332 | ) | 7,179 | |||||
Total non-interest expense | $ | (22,995 | ) | $ | (18,150 | ) | ||
Non-interest expense of $23 million for the current quarter increased $5 million, or 27%, from the same prior-year quarter, primarily due to the absence of a gain of $8 million recorded in connection with the sale of land in the same prior-year quarter.
Net Income (Loss) Attributable to Noncontrolling Interests
Net income (loss) attributable to noncontrolling interests represents 100% of the results of operations of NCSC and RTFC, as the members of NCSC and RTFC own or control 100% of the interest in their respective companies. The fluctuations in net income (loss) attributable to noncontrolling interests are primarily due to changes in the fair value of NCSC’s derivative instruments recognized in NCSC’s earnings.
We recorded net income attributable to noncontrolling interests of less than $1 million for the current quarter, compared with a net loss of $2 million for the same prior-year quarter.
CONSOLIDATED BALANCE SHEET ANALYSIS |
Total assets of $28,263 million as of August 31, 2020 increased $105 million from May 31, 2020, primarily due to growth in our loan portfolio. Total liabilities of $27,531 million as of August 31, 2020 was relatively unchanged from May 31, 2020. Total equity increased $83 million to $732 million as of August 31, 2020, attributable to our reported net income of $145 million for the current quarter, which was partially offset by the retirement of patronage capital of $60 million authorized by the CFC Board of Directors during the current quarter and a decrease to retained earnings of $4 million from the cumulative-effect adjustment recorded at adoption of the CECL accounting standard on June 1, 2020.
Following is a discussion of changes in the major components of our assets and liabilities during the three months ended August 31, 2020. Period-end balance sheet amounts may vary from average balance sheet amounts due to liquidity and balance sheet management activities that are intended to manage liquidity requirements for the company and our market risk exposure in accordance with our risk appetite.
Loan Portfolio
We segregate our loan portfolio into portfolio segments based on the member class of the borrower, which consists of CFC distribution, CFC power supply, CFC statewide and associate, NCSC and RTFC. We offer both long-term and line of credit loan loans to our borrowers. Under our long-term loan facilities, a borrower may select a fixed interest rate or a variable interest rate at the time of each loan advance. Line of credit loans are revolving loan facilities and generally have a variable interest rate.
18
Loans Outstanding
Table 8 summarizes loans to members, by member class and by loan type, as of August 31, 2020 and May 31, 2020. As indicated in Table 8, loans to CFC distribution and power supply borrowers accounted for 96% of total loans to members as of both August 31, 2020 and May 31, 2020, and long-term fixed-rate loans accounted for 92% of loans to members as of each date.
Table 8: Loans Outstanding by Member Class and Loan Type
August 31, 2020 | May 31, 2020 | |||||||||||||||||
(Dollars in millions) | Amount | % of Total | Amount | % of Total | Change | |||||||||||||
Loans by member class: | ||||||||||||||||||
CFC: | ||||||||||||||||||
Distribution | $ | 21,012 | 78 | % | $ | 20,770 | 78 | % | $ | 242 | ||||||||
Power supply | 4,730 | 18 | 4,732 | 18 | (2 | ) | ||||||||||||
Statewide and associate | 98 | — | 106 | — | (8 | ) | ||||||||||||
CFC total | 25,840 | 96 | 25,608 | 96 | 232 | |||||||||||||
NCSC | 681 | 3 | 698 | 3 | (17 | ) | ||||||||||||
RTFC | 396 | 1 | 385 | 1 | 11 | |||||||||||||
Total loans outstanding(1) | 26,917 | 100 | 26,691 | 100 | 226 | |||||||||||||
Deferred loan origination costs | 12 | — | 11 | — | 1 | |||||||||||||
Loans to members | $ | 26,929 | 100 | % | $ | 26,702 | 100 | % | $ | 227 | ||||||||
Loans by type: | ||||||||||||||||||
Long-term loans: | ||||||||||||||||||
Fixed-rate | $ | 24,817 | 92 | % | $ | 24,472 | 92 | % | $ | 345 | ||||||||
Variable-rate | 696 | 3 | 656 | 2 | 40 | |||||||||||||
Total long-term loans | 25,513 | 95 | 25,128 | 94 | 385 | |||||||||||||
Line of credit loans | 1,404 | 5 | 1,563 | 6 | (159 | ) | ||||||||||||
Total loans outstanding(1) | 26,917 | 100 | 26,691 | 100 | 226 | |||||||||||||
Deferred loan origination costs | 12 | — | 11 | — | 1 | |||||||||||||
Loans to members | $ | 26,929 | 100 | % | $ | 26,702 | 100 | % | $ | 227 | ||||||||
____________________________
(1) Represents the unpaid principal balance, net of charge-offs and recoveries, of loans as of the end of each period.
Loans to members totaled $26,929 million as of August 31, 2020, an increase of $227 million, or 1%, from May 31, 2020. The increase was driven by an increase in long-term loans of $385 million, partially offset by a decrease in line of credit loans of $159 million. CFC distribution loans and RTFC loans increased by $242 million and $11 million, respectively. NCSC loans, CFC statewide and associate loans and CFC power supply loans decreased by $17 million, $8 million and $2 million, respectively.
Long-term loan advances totaled $807 million during the current quarter, of which approximately 93% was provided to members for capital expenditures and approximately 4% was provided for the refinancing of loans made by other lenders. In comparison, long-term loan advances totaled $888 million during the same prior-year quarter, of which approximately 73% was provided to members for capital expenditures and approximately 19% was provided for the refinancing of loans made by other lenders.
We provide additional information on our loan product types in “Item 1. Business—Loan Programs” and “Note 4—Loans” in our 2020 Form 10-K. See “Debt—Collateral Pledged” below for information on encumbered and unencumbered loans and “Credit Risk Management” for information on the credit risk profile of our loan portfolio.
19
Loan Retention Rate
Table 9 presents a summary of the options selected by borrowers for CFC’s long-term fixed-rate loans that repriced, in accordance with our standard loan repricing provisions, during the three months ended August 31, 2020 and fiscal year 2020. At the repricing date, the borrower has the option of (i) selecting CFC’s current long-term fixed rate for a term of between one year and up to the final maturity of the loan; (ii) selecting CFC’s current long-term variable rate; or (iii) repaying the loan in full.
Table 9: Historical Retention Rate and Repricing Selection(1)
Three Months Ended | Fiscal Year Ended | |||||||||||||
August 31, 2020 | May 31, 2020 | |||||||||||||
(Dollars in thousands) | Amount | % of Total | Amount | % of Total | ||||||||||
Loans retained: | ||||||||||||||
Long-term fixed rate selected | $ | 78,301 | 99 | % | $ | 441,165 | 95 | % | ||||||
Long-term variable rate selected | 319 | — | 11,446 | 3 | ||||||||||
Total loans retained by CFC | 78,620 | 99 | 452,611 | 98 | ||||||||||
Loans repaid | 408 | 1 | 10,350 | 2 | ||||||||||
Total | $ | 79,028 | 100 | % | $ | 462,961 | 100 | % | ||||||
____________________________
(1)Does not include NCSC and RTFC loans.
As displayed in Table 9, of the loans that repriced during the three months ended August 31, 2020 and fiscal year 2020, the substantial majority of borrowers selected a new long-term fixed or variable rate. The average retention rate, which is calculated based on the election made by the borrower at the repricing date, was 96% for CFC loans that repriced during the three fiscal year period ended May 31, 2020.
Debt
We utilize both short-term borrowings and long-term debt as part of our funding strategy and asset/liability interest rate risk management. We seek to maintain diversified funding sources across products, programs and markets to manage funding concentrations and reduce our liquidity or debt rollover risk. Our funding sources include a variety of secured and unsecured debt securities in a wide range of maturities to our members and affiliates and in the capital markets.
Debt Outstanding
Table 10 displays the composition, by product type, of our outstanding debt as of August 31, 2020 and May 31, 2020. Table 10 also displays the composition of our debt based on several additional selected attributes.
20
Table 10: Total Debt Outstanding
(Dollars in thousands) | August 31, 2020 | May 31, 2020 | Change | |||||||||
Debt product type: | ||||||||||||
Commercial paper: | ||||||||||||
Members, at par | $ | 1,421,582 | $ | 1,318,566 | $ | 103,016 | ||||||
Dealer, net of discounts | 299,998 | — | 299,998 | |||||||||
Total commercial paper | 1,721,580 | 1,318,566 | 403,014 | |||||||||
Select notes to members | 1,655,029 | 1,597,959 | 57,070 | |||||||||
Daily liquidity fund notes to members | 645,036 | 508,618 | 136,418 | |||||||||
Medium-term notes: | ||||||||||||
Members, at par | 598,248 | 658,959 | (60,711 | ) | ||||||||
Dealer, net of discounts | 3,043,323 | 3,068,793 | (25,470 | ) | ||||||||
Total medium-term notes | 3,641,571 | 3,727,752 | (86,181 | ) | ||||||||
Collateral trust bonds | 6,792,448 | 7,188,553 | (396,105 | ) | ||||||||
Guaranteed Underwriter Program notes payable | 6,225,855 | 6,261,312 | (35,457 | ) | ||||||||
Farmer Mac notes payable | 3,041,843 | 3,059,637 | (17,794 | ) | ||||||||
Other notes payable | 11,649 | 11,612 | 37 | |||||||||
Subordinated deferrable debt | 986,166 | 986,119 | 47 | |||||||||
Members’ subordinated certificates: | ||||||||||||
Membership subordinated certificates | 630,483 | 630,483 | — | |||||||||
Loan and guarantee subordinated certificates | 439,742 | 482,965 | (43,223 | ) | ||||||||
Member capital securities | 228,620 | 226,170 | 2,450 | |||||||||
Total members’ subordinated certificates | 1,298,845 | 1,339,618 | (40,773 | ) | ||||||||
Total debt outstanding | $ | 26,020,022 | $ | 25,999,746 | $ | 20,276 | ||||||
Security type: | ||||||||||||
Secured debt | 62 | % | 64 | % | ||||||||
Unsecured debt | 38 | 36 | ||||||||||
Total | 100 | % | 100 | % | ||||||||
Funding source: | ||||||||||||
Members | 21 | % | 21 | % | ||||||||
Private placement: | ||||||||||||
Guaranteed Underwriter Program notes payable | 24 | 24 | ||||||||||
Farmer Mac notes payable | 12 | 12 | ||||||||||
Total private placement | 36 | 36 | ||||||||||
Capital markets | 43 | 43 | ||||||||||
Total | 100 | % | 100 | % | ||||||||
Interest rate type: | ||||||||||||
Fixed-rate debt | 72 | % | 75 | % | ||||||||
Variable-rate debt | 28 | 25 | ||||||||||
Total | 100 | % | 100 | % | ||||||||
Interest rate type, including the impact of swaps: | ||||||||||||
Fixed-rate debt(1) | 88 | % | 90 | % | ||||||||
Variable-rate debt(2) | 12 | 10 | ||||||||||
Total | 100 | % | 100 | % | ||||||||
Maturity classification:(3) | ||||||||||||
Short-term borrowings | 17 | % | 15 | % | ||||||||
Long-term and subordinated debt(4) | 83 | 85 | ||||||||||
Total | 100 | % | 100 | % | ||||||||
21
____________________________
(1) Includes variable-rate debt that has been swapped to a fixed rate, net of any fixed-rate debt that has been swapped to a variable rate.
(2) Includes fixed-rate debt that has been swapped to a variable rate, net of any variable-rate debt that has been swapped to a fixed rate. Also includes commercial paper notes, which generally have maturities of less than 90 days. The interest rate on commercial paper notes does not change once the note has been issued; however, the interest rate for new commercial paper issuances changes daily.
(3) Borrowings with an original contractual maturity of one year or less are classified as short-term borrowings. Borrowings with an original contractual maturity of greater than one year are classified as long-term debt.
(4) Consists of long-term debt, subordinated deferrable debt and total members’ subordinated debt reported on our consolidated balance sheets. Maturity classification is based on the original contractual maturity as of the date of issuance of the debt.
Our outstanding debt volume generally increases and decreases in response to member loan demand. Total debt outstanding was $26,020 million as of August 31, 2020, an increase of $20 million from May 31, 2020. Debt activity during the current quarter consisted of net increases in outstanding member commercial paper, select notes and daily liquidity fund notes of $297 million and dealer commercial paper of $300 million, which together totaled $597 million. This increase was partially offset by net decreases in collateral trust bonds of $396 million, medium-term notes of $86 million, borrowings under the Guaranteed Underwriter Program of $35 million and Farmer Mac notes payable of $18 million, which together totaled $535 million.
The decrease in collateral trust bonds was attributable to the redemption of $400 million outstanding principal amount of our 2.35% collateral trust bonds due June 15, 2020. On October 1, 2020, we redeemed all $350 million outstanding principal amount of our 2.30% collateral trust bonds due November 1, 2020.
Member Investments
Debt securities issued to our members represent an important, stable source of funding. Table 11 displays outstanding member debt, by product type, as of August 31, 2020 and May 31, 2020.
Table 11: Member Investments
August 31, 2020 | May 31, 2020 | Change | ||||||||||||||||
(Dollars in thousands) | Amount | % of Total (1) | Amount | % of Total (1) | ||||||||||||||
Member investments: | ||||||||||||||||||
Commercial paper | $ | 1,421,582 | 83 | % | $ | 1,318,566 | 100 | % | $ | 103,016 | ||||||||
Select notes | 1,655,029 | 100 | 1,597,959 | 100 | 57,070 | |||||||||||||
Daily liquidity fund notes | 645,036 | 100 | 508,618 | 100 | 136,418 | |||||||||||||
Medium-term notes | 598,248 | 16 | 658,959 | 18 | (60,711 | ) | ||||||||||||
Members’ subordinated certificates | 1,298,845 | 100 | 1,339,618 | 100 | (40,773 | ) | ||||||||||||
Total member investments | $ | 5,618,740 | $ | 5,423,720 | $ | 195,020 | ||||||||||||
Percentage of total debt outstanding | 22 | % | 21 | % | ||||||||||||||
____________________________
(1) Represents outstanding debt attributable to members for each debt product type as a percentage of the total outstanding debt for each debt product type.
Member investments totaled $5,619 million and accounted for 22% of total debt outstanding as of August 31, 2020, compared with $5,424 million, or 21% of total debt outstanding as of May 31, 2020. Over the last twelve quarters, debt issued to members has averaged $4,805 million as of each quarter end.
Short-Term Borrowings
Short-term borrowings consist of borrowings with an original contractual maturity of one year or less and do not include the current portion of long-term debt. Short-term borrowings totaled $4,553 million and accounted for 17% of total debt outstanding as of August 31, 2020, compared with $3,962 million, or 15%, of total debt outstanding as of May 31, 2020. See “Liquidity Risk” below and for “Note 6—Short-Term Borrowings” for information on the composition of our short-term borrowings.
22
Long-Term and Subordinated Debt
Long-term debt, defined as debt with an original contractual maturity term of greater than one year, primarily consists of medium-term notes, collateral trust bonds, notes payable under the Guaranteed Underwriter Program and notes payable under our note purchase agreement with Farmer Mac. Subordinated debt consists of subordinated deferrable debt and members’ subordinated certificates. Our subordinated deferrable debt and members’ subordinated certificates have original contractual maturity terms of greater than one year.
Long-term and subordinated debt together totaled $21,467 million and accounted for 83% of total debt outstanding as of August 31, 2020, compared with $22,038 million, or 85% of total debt outstanding as of May 31, 2020. We provide additional information on our long-term debt below under “Liquidity Risk” and in “Note 7—Long-Term Debt” and “Note 8—Subordinated Deferrable Debt.”
Collateral Pledged
We are required to pledge loans or other collateral in transactions under our collateral trust bond indentures, note purchase agreements with Farmer Mac and bond agreements under the Guaranteed Underwriter Program. We are required to maintain pledged collateral equal to at least 100% of the face amount of outstanding borrowings. However, as discussed below, we typically maintain pledged collateral in excess of the required percentage. Under the provisions of our committed bank revolving line of credit agreements, the excess collateral that we are allowed to pledge cannot exceed 150% of the outstanding borrowings under our collateral trust bond indentures, Farmer Mac note purchase agreements or the Guaranteed Underwriter Program. In certain cases, provided that all conditions of eligibility under the different programs are satisfied, we may withdraw excess pledged collateral or transfer collateral from one borrowing program to another to facilitate a new debt issuance.
Table 12 displays the collateral coverage ratios as of August 31, 2020 and May 31, 2020 for the debt agreements noted above that require us to pledge collateral.
Table 12: Collateral Pledged
Requirement Coverage Ratios | ||||||||||||
Minimum Debt Indentures | Maximum Committed Bank Revolving Line of Credit Agreements | Actual Coverage Ratios(1) | ||||||||||
Debt Agreement | August 31, 2020 | May 31, 2020 | ||||||||||
Collateral trust bonds 1994 indenture | 100 | % | 150 | % | 111 | % | 114 | % | ||||
Collateral trust bonds 2007 indenture | 100 | 150 | 118 | 113 | ||||||||
Guaranteed Underwriter Program notes payable | 100 | 150 | 120 | 120 | ||||||||
Farmer Mac notes payable | 100 | 150 | 120 | 121 | ||||||||
Clean Renewable Energy Bonds Series 2009A | 100 | 150 | 112 | 120 | ||||||||
____________________________
(1) Calculated based on the amount of collateral pledged divided by the face amount of outstanding secured debt.
Of our total debt outstanding of $26,020 million as of August 31, 2020, $16,066 million, or 62%, was secured by pledged loans totaling $19,457 million. In comparison, of our total debt outstanding of $26,000 million as of May 31, 2020, $16,515 million, or 64%, was secured by pledged loans totaling $19,643 million. Total debt outstanding is presented on our consolidated balance sheets net of unamortized discounts and issuance costs; however, our collateral pledging requirements are based on the face amount of secured outstanding debt, which excludes net unamortized discounts and issuance costs.
Table 13 displays the unpaid principal balance of loans pledged for secured debt, the excess collateral pledged and unencumbered loans as of August 31, 2020 and May 31, 2020.
23
Table 13: Unencumbered Loans
(Dollars in thousands) | August 31, 2020 | May 31, 2020 | ||||||
Total loans outstanding(1) | $ | 26,917,099 | 26,690,854 | |||||
Less: Loans required to be pledged for secured debt (2) | (16,331,477 | ) | (16,784,728 | ) | ||||
Loans pledged in excess of requirement (2)(3) | (3,125,847 | ) | (2,858,238 | ) | ||||
Total pledged loans | (19,457,324 | ) | (19,642,966 | ) | ||||
Unencumbered loans | $ | 7,459,775 | $ | 7,047,888 | ||||
Unencumbered loans as a percentage of total loans outstanding | 28 | % | 26 | % | ||||
____________________________
(1) Represents the unpaid principal balance of loans as of the end of each period. Excludes unamortized deferred loan origination costs of $12 million as of August 31, 2020 and May 31, 2020.
(2) Reflects unpaid principal balance of pledged loans.
(3) Excludes cash collateral pledged to secure debt. If there is an event of default under most of our indentures, we can only withdraw the excess collateral if we substitute cash or permitted investments of equal value.
As displayed above in Table 13, we had excess loans pledged as collateral totaling $3,126 million and $2,858 million as of August 31, 2020 and May 31, 2020, respectively. We typically pledge loans in excess of the required amount for the following reasons: (i) our distribution and power supply loans are typically amortizing loans that require scheduled principal payments over the life of the loan, whereas the debt securities issued under secured indentures and agreements typically have bullet maturities; (ii) distribution and power supply borrowers have the option to prepay their loans; and (iii) individual loans may become ineligible for various reasons, some of which may be temporary.
We provide additional information on our borrowings, including the maturity profile, below in “Liquidity Risk.” Also refer to “Note 5—Short-Term Borrowings,” “Note 7—Long-Term Debt,” “Note 8—Subordinated Deferrable Debt” and “Note 9—Members’ Subordinated Certificates” in our 2020 Form 10-K for a more detailed description of each of our debt product types. See “Note 4—Loans—Pledging of Loans” in this Report for additional information related to pledged collateral.
Equity
Table 14 presents the components of total CFC equity and total equity as of August 31, 2020 and May 31, 2020.
24
Table 14: Equity
(Dollars in thousands) | August 31, 2020 | May 31, 2020 | Change | |||||||||
Equity components: | ||||||||||||
Membership fees and educational fund: | ||||||||||||
Membership fees | $ | 969 | $ | 969 | $ | — | ||||||
Educational fund | 1,970 | 2,224 | (254 | ) | ||||||||
Total membership fees and educational fund | 2,939 | 3,193 | (254 | ) | ||||||||
Patronage capital allocated | 834,209 | 894,066 | (59,857 | ) | ||||||||
Members’ capital reserve | 807,320 | 807,320 | — | |||||||||
Total allocated equity | 1,644,468 | 1,704,579 | (60,111 | ) | ||||||||
Unallocated net income (loss): | ||||||||||||
Prior year-end cumulative derivative forward value losses(1) | (1,079,739 | ) | (348,965 | ) | (730,774 | ) | ||||||
Year-to-date derivative forward value gains (losses) (1) | 86,783 | (730,774 | ) | 817,557 | ||||||||
Period-end cumulative derivative forward value losses(1) | (992,956 | ) | (1,079,739 | ) | 86,783 | |||||||
Other unallocated net income | 56,924 | 3,191 | 53,733 | |||||||||
Unallocated net loss | (936,032 | ) | (1,076,548 | ) | 140,516 | |||||||
CFC retained equity | 708,436 | 628,031 | 80,405 | |||||||||
Accumulated other comprehensive loss | (1,827 | ) | (1,910 | ) | 83 | |||||||
Total CFC equity | 706,609 | 626,121 | 80,488 | |||||||||
Noncontrolling interests | 24,895 | 22,701 | 2,194 | |||||||||
Total equity | $ | 731,504 | $ | 648,822 | $ | 82,682 | ||||||
(1)Represents derivative forward value gains (losses) for CFC only, as total CFC equity does not include the noncontrolling interests of the variable interest entities NCSC and RTFC, which we are required to consolidate. We present the consolidated total derivative forward value gains (losses) in Table 36 in the “Non-GAAP Financial Measures” section below. Also, see “Note 14—Business Segments” for the statements of operations for CFC.
Total equity increased $83 million to $732 million as of August 31, 2020, attributable to our reported net income of $145 million for the current quarter, which was partially offset by the retirement of patronage capital of $60 million authorized by the CFC Board of Directors during the current quarter and a decrease to retained earnings of $4 million from the cumulative-effect adjustment recorded at adoption of the CECL accounting standard on June 1, 2020. The retired patronage capital amount was paid to members in September 2020.
In July 2020, the CFC Board of Directors authorized the allocation of fiscal year 2020 adjusted net income as follows: $96 million to members in the form of patronage capital; $48 million to the members’ capital reserve; and $1 million to the cooperative educational fund. The amount of patronage capital allocated each year by CFC’s Board of Directors is based on non-GAAP adjusted net income, which excludes the impact of derivative forward value gains (losses). We provide a reconciliation of our adjusted net income to our reported net income and an explanation of the adjustments below in “Non-GAAP Financial Measures.”
In July 2020, the CFC Board of Directors also authorized the retirement of patronage capital totaling $60 million, consisting of $48 million, which represented 50% of the patronage capital allocation for fiscal year 2020, and $12 million, which represented the portion of the allocation from fiscal year 1994 net earnings that has been held for 25 years pursuant to the CFC Board of Directors policy. This amount was returned to members in cash in September 2020. The remaining portion of the amount allocated for fiscal year 2020 will be retained by CFC for 25 years under current guidelines adopted by the CFC Board of Directors in June 2009.
The CFC Board of Directors is required to make annual allocations of adjusted net income, if any. CFC has made annual retirements of allocated net earnings in 41 of the last 42 fiscal years; however, future retirements of allocated amounts are determined based on CFC’s financial condition. The CFC Board of Directors has the authority to change the current practice
25
for allocating and retiring net earnings at any time, subject to applicable laws. See “Item 1. Business—Allocation and Retirement of Patronage Capital” of our 2020 Form 10-K for additional information.
OFF-BALANCE SHEET ARRANGEMENTS |
In the ordinary course of business, we engage in financial transactions that are not presented on our consolidated balance sheets, or may be recorded on our consolidated balance sheets in amounts that are different from the full contract or notional amount of the transaction. Our off-balance sheet arrangements consist primarily of guarantees of member obligations and unadvanced loan commitments intended to meet the financial needs of our members.
Guarantees
We provide guarantees for certain contractual obligations of our members to assist them in obtaining various forms of financing. We use the same credit policies and monitoring procedures in providing guarantees as we do for loans and commitments. If a member defaults on its obligation, we are obligated to pay required amounts pursuant to our guarantees. Meeting our guarantee obligations satisfies the underlying obligation of our member systems and prevents the exercise of remedies by the guarantee beneficiary based upon a payment default by a member. In general, the member is required to repay any amount advanced by us with accrued interest, pursuant to the documents evidencing the member’s reimbursement obligation. Table 15 displays the notional amount of our outstanding guarantee obligations, by guarantee type and by company, as of August 31, 2020 and May 31, 2020.
Table 15: Guarantees Outstanding
(Dollars in thousands) | August 31, 2020 | May 31, 2020 | Change | |||||||||
Guarantee type: | ||||||||||||
Long-term tax-exempt bonds(1) | $ | 186,075 | $ | 263,875 | $ | (77,800 | ) | |||||
Letters of credit(2) | 353,896 | 413,839 | (59,943 | ) | ||||||||
Other guarantees | 143,275 | 143,072 | 203 | |||||||||
Total | $ | 683,246 | $ | 820,786 | $ | (137,540 | ) | |||||
Company: | ||||||||||||
CFC(3) | $ | 673,477 | $ | 810,787 | $ | (137,310 | ) | |||||
NCSC | 9,769 | 9,999 | (230 | ) | ||||||||
Total | $ | 683,246 | $ | 820,786 | $ | (137,540 | ) | |||||
____________________________
(1) Represents the outstanding principal amount of long-term fixed-rate and variable-rate guaranteed bonds.
(2) Reflects our maximum potential exposure for letters of credit.
(3) Includes CFC guarantees to NCSC and RTFC members totaling $3 million as of August 31, 2020 and May 31, 2020.
Of the total notional amount of our outstanding guarantee obligations of $683 million and $821 million as of August 31, 2020 and May 31, 2020, respectively, 46% and 48%, respectively, were secured by a mortgage lien on substantially all of the assets and future revenue of our member cooperatives for which we provide guarantees.
In addition to providing a guarantee on long-term tax-exempt bonds issued by member cooperatives totaling $186 million as of August 31, 2020, we also were the liquidity provider on $166 million of those tax-exempt bonds. As liquidity provider, we may be required to purchase bonds that are tendered or put by investors. Investors provide notice to the remarketing agent that they will tender or put a certain amount of bonds at the next interest rate reset date. If the remarketing agent is unable to sell such bonds to other investors by the next interest rate reset date, we have unconditionally agreed to purchase such bonds. We were not required to perform as liquidity provider pursuant to these obligations during the three months ended August 31, 2020 or the prior fiscal year.
We had outstanding letters of credit for the benefit of our members totaling $354 million as of August 31, 2020. These letters of credit relate to obligations for which we may be required to advance funds based on various trigger events
26
specified in the letter of credit agreements. If we are required to advance funds, the member is obligated to repay the advance amount and accrued interest to us. In addition to these letters of credit, we had master letter of credit facilities in place as of August 31, 2020, under which we may be required to issue letters of credit to third parties for the benefit of our members up to an additional $71 million as of August 31, 2020. All of these master letter of credit facilities were subject to material adverse change clauses at the time of issuance. Prior to issuing a letter of credit under these facilities, we confirm that there has been no material adverse change in the business or condition, financial or otherwise, of the borrower since the time the loan was approved and that the borrower is currently in compliance with the letter of credit terms and conditions.
Table 16 presents the maturities of the outstanding notional amount of guarantee obligations of $683 million as of August 31, 2020, in each fiscal year during the five-year period ended May 31, 2025, and thereafter.
Table 16: Maturities of Guarantee Obligations
Outstanding Notional Amount | Maturities of Guarantee Obligations | |||||||||||||||||||||||||||
(Dollars in thousands) | 2021 | 2022 | 2023 | 2024 | 2025 | Thereafter | ||||||||||||||||||||||
Guarantees | $ | 683,247 | $ | 132,821 | $ | 98,896 | $ | 157,228 | $ | 32,348 | $ | 83,775 | $ | 178,179 | ||||||||||||||
We recorded a guarantee liability of $10 million and $11 million as of August 31, 2020 and May 31, 2020, respectively, for our guarantee and liquidity obligations associated with our members’ debt. We provide additional information about our guarantee obligations in “Note 11—Guarantees.”
Unadvanced Loan Commitments
Unadvanced loan commitments represent approved and executed loan contracts for which funds have not been advanced to borrowers. Our line of credit commitments include both contracts that are subject to material adverse change clauses and contracts that are not subject to material adverse change clauses, while our long-term loan commitments are typically subject to material adverse change clauses.
Table 17 displays the amount of unadvanced loan commitments, which consist of line of credit and long-term loan commitments, as of August 31, 2020 and May 31, 2020.
Table 17: Unadvanced Loan Commitments
August 31, 2020 | May 31, 2020 | |||||||||||||||||
(Dollars in thousands) | Amount | % of Total | Amount | % of Total | Change | |||||||||||||
Line of credit commitments: | ||||||||||||||||||
Conditional(1) | $ | 5,119,518 | 37 | % | $ | 5,072,921 | 38 | % | $ | 46,597 | ||||||||
Unconditional(2) | 3,074,095 | 23 | 2,857,029 | 21 | 217,066 | |||||||||||||
Total line of credit unadvanced commitments | 8,193,613 | 60 | 7,929,950 | 59 | 263,663 | |||||||||||||
Total long-term loan unadvanced commitments(1) | 5,461,029 | 40 | 5,458,676 | 41 | 2,353 | |||||||||||||
Total unadvanced loan commitments | $ | 13,654,642 | 100 | % | $ | 13,388,626 | 100 | % | $ | 266,016 | ||||||||
____________________________
(1)Represents amount related to facilities that are subject to material adverse change clauses.
(2)Represents amount related to facilities that are not subject to material adverse change clauses.
Table 18 presents the maturities, by loan type, of our total unadvanced loan commitments of $13,655 million as of August 31, 2020, in each fiscal year during the five-year period ended May 31, 2025, and thereafter.
27
Table 18: Unadvanced Loan Commitments Maturities of Notional Amount
Available Balance | Notional Maturities of Unadvanced Loan Commitments | |||||||||||||||||||||||||||
(Dollars in thousands) | 2021 | 2022 | 2023 | 2024 | 2025 | Thereafter | ||||||||||||||||||||||
Line of credit loans | $ | 8,193,613 | $ | 487,556 | $ | 4,047,076 | $ | 1,357,059 | $ | 1,063,694 | $ | 1,079,137 | $ | 159,091 | ||||||||||||||
Long-term loans | 5,461,029 | 312,622 | 1,273,237 | 906,698 | 1,633,259 | 1,018,758 | 316,455 | |||||||||||||||||||||
Total | $ | 13,654,642 | $ | 800,178 | $ | 5,320,313 | $ | 2,263,757 | $ | 2,696,953 | $ | 2,097,895 | $ | 475,546 | ||||||||||||||
Unadvanced line of credit commitments accounted for 60% of total unadvanced loan commitments as of August 31, 2020, while unadvanced long-term loan commitments accounted for 40% of total unadvanced loan commitments. Unadvanced line of credit commitments are typically revolving facilities for periods not to exceed five years and generally serve as supplemental back-up liquidity to our borrowers. Historically, borrowers have not drawn the full commitment amount for line of credit facilities, and we have experienced a very low utilization rate on line of credit loan facilities regardless of whether or not we are obligated to fund the facility where a material adverse change exists. Our unadvanced long-term loan commitments generally have a five-year draw period under which a borrower may advance funds prior to the expiration of the commitment. We expect that the majority of the long-term unadvanced loan commitments of $5,461 million will be advanced prior to the expiration of the commitment.
Because we historically have experienced a very low utilization rate on line of credit loan facilities, which account for the majority of our total unadvanced loan commitments, we believe the unadvanced loan commitment total of $13,655 million as of August 31, 2020 is not necessarily representative of our future funding requirements.
Unadvanced Loan Commitments—Conditional
The majority of our line of credit commitments and all our unadvanced long-term loan commitments include material adverse change clauses. Unadvanced loan commitments subject to material adverse change clauses totaled $10,581 million and $10,532 million as of August 31, 2020 and May 31, 2020, respectively, and accounted for 78% and 79%, respectively, of the combined total of unadvanced line of credit and long-term loan commitments as of each respective date. Prior to making advances on these facilities, we confirm that there has been no material adverse change in the borrower’s business or condition, financial or otherwise, since the time the loan was approved and confirm that the borrower is currently in compliance with loan terms and conditions. In some cases, the borrower’s access to the full amount of the facility is further constrained by use of proceeds restrictions, imposition of borrower-specific restrictions, or by additional conditions that must be met prior to advancing funds. Since we generally do not charge a fee for the borrower to have an unadvanced amount on a loan facility that is subject to a material adverse change clause, our borrowers tend to request amounts in excess of their immediate estimated loan requirements.
Unadvanced Loan Commitments—Unconditional
Unadvanced loan commitments not subject to material adverse change clauses at the time of each advance consisted of unadvanced committed lines of credit totaling $3,074 million and $2,857 million as of August 31, 2020 and May 31, 2020, respectively. For contracts not subject to a material adverse change clause, we are generally required to advance amounts on the committed facilities as long as the borrower is in compliance with the terms and conditions of the facility.
Syndicated loan facilities, where the pricing is set at a spread over a market index rate as agreed upon by all of the participating financial institutions based on market conditions at the time of syndication, accounted for 91% of unconditional line of credit commitments as of August 31, 2020. The remaining 9% represented unconditional committed line of credit loans, for which any new advance would be made at rates determined by us.
Table 19 presents the maturities of our unadvanced committed lines of credit not subject to a material adverse clause of $3,074 million as of August 31, 2020, in each fiscal year during the five-year period ended May 31, 2025, and thereafter.
28
Table 19: Unconditional Committed Lines of Credit Maturities of Notional Amount
Available Balance | Notional Maturities of Unconditional Committed Lines of Credit | |||||||||||||||||||||||||||
(Dollars in thousands) | 2021 | 2022 | 2023 | 2024 | 2025 | Thereafter | ||||||||||||||||||||||
Committed lines of credit | $ | 3,074,095 | $ | 120,020 | $ | 242,006 | $ | 1,068,391 | $ | 716,378 | $ | 927,300 | $ | — | ||||||||||||||
See “MD&A—Off-Balance Sheet Arrangements” in our 2020 Form 10-K for additional information on our off-balance sheet arrangements.
RISK MANAGEMENT |
Overview
We face a variety of risks that can significantly affect our financial performance, liquidity, reputation and ability to meet the expectations of our members, investors and other stakeholders. As a financial services company, the major categories of risk exposures inherent in our business activities include credit risk, liquidity risk, market risk and operational risk. These risk categories are summarized below.
• | Credit risk is the risk that a borrower or other counterparty will be unable to meet its obligations in accordance with agreed-upon terms. |
• | Liquidity risk is the risk that we will be unable to fund our operations and meet our contractual obligations or that we will be unable to fund new loans to borrowers at a reasonable cost and tenor in a timely manner. |
• | Market risk is the risk that changes in market variables, such as movements in interest rates, may adversely affect the match between the timing of the contractual maturities, re-pricing and prepayments of our financial assets and the related financial liabilities funding those assets. |
• | Operational risk is the risk of loss resulting from inadequate or failed internal controls, processes, systems, human error or external events, including natural disasters or public health emergencies, such as the current COVID-19 global pandemic. Operational risk also includes compliance risk, fiduciary risk, reputational risk and litigation risk. |
Effective risk management is critical to our overall operations and to achieving our primary objective of providing cost-based financial products to our rural electric members while maintaining the sound financial results required for investment-grade credit ratings on our rated debt instruments. Accordingly, we have a risk-management framework that is intended to govern the principal risks we face in conducting our business and the aggregate amount of risk we are willing to accept, referred to as risk appetite, in the context of CFC’s mission and strategic objectives and initiatives. We provide information on our risk management framework in our 2020 Form 10-K under “Item 7. MD&A—Risk Management—Risk Management Framework.”
CREDIT RISK |
Our loan portfolio, which represents the largest component of assets on our balance sheet, and guarantees account for the substantial majority of our credit risk exposure. We also engage in certain non-lending activities that may give rise to credit and counterparty settlement risk, including the purchase of investment securities and entering into derivative transactions to manage interest rate risk. Our primary credit exposure is to rural electric cooperatives that provide essential electric services to end-users, the majority of which are residential customers. We also have a limited portfolio of loans to not-for-profit and for-profit telecommunication companies. We provide a discussion of our credit-risk management framework and activities undertaken to manage credit risk in our 2020 Form 10-K under “Item 7. MD&A—Credit Risk—Credit Risk Management.”
29
Loan Portfolio Credit Risk
As a tax-exempt, member-owned finance cooperative, CFC’s principal focus is to provide funding to its rural electric utility cooperative members to assist them in acquiring, constructing and operating electric distribution systems, power supply systems and related facilities. Loans outstanding to electric utility organizations of $26,521 million and $26,306 million as of August 31, 2020 and May 31, 2020, respectively, accounted for 99% of total loans outstanding as of each respective date. The remaining loans outstanding in our portfolio were to RTFC members, affiliates and associates in the telecommunications industry.
Because we lend primarily to our rural electric utility cooperative members, we have had a loan portfolio subject to single-industry and single-obligor concentration risks since our inception in 1969. We historically, however, have experienced limited defaults and losses in our electric utility loan portfolio due to several factors. First, the majority of our electric cooperative borrowers operate in states where electric cooperatives are not subject to rate regulation. Thus, they are able to make rate adjustments to pass along increased costs to the end customer without first obtaining state regulatory approval, allowing them to cover operating costs and generate sufficient earnings and cash flows to service their debt obligations. Second, electric cooperatives face limited competition, as they tend to operate in exclusive territories not serviced by public investor-owned utilities. Third, electric cooperatives typically are consumer-owned, not-for-profit entities that provide an essential service to end-users, the majority of which are residential customers. Fourth, electric cooperatives tend to adhere to a conservative business strategy model that has historically resulted in a relatively stable, resilient operating environment and overall strong financial performance and credit strength for the electric cooperative network. Finally, we generally lend to our members on a senior secured basis, which reduces the risk of loss in the event of a borrower default.
Below we provide information on the credit risk profile of our loan portfolio, including security provisions, credit concentration, credit quality indicators and our allowance for credit losses.
Security Provisions
Except when providing line of credit loans, we generally lend to our members on a senior secured basis. Long-term loans are generally secured on parity with other secured lenders (primarily RUS), if any, by all assets and revenue of the borrower with exceptions typical in utility mortgages. Line of credit loans are generally unsecured. In addition to the collateral pledged to secure our loans, distribution and power supply borrowers also are required to set rates charged to customers to achieve certain specified financial ratios.
Table 20 presents, by loan type and by company, the amount and percentage of secured and unsecured loans in our loan portfolio as of August 31, 2020 and May 31, 2020. Of our total loans outstanding, 94% were secured as of both August 31, 2020 and May 31, 2020.
30
Table 20: Loan Portfolio Security Profile
August 31, 2020 | ||||||||||||||||||
(Dollars in thousands) | Secured | % of Total | Unsecured | % of Total | Total | |||||||||||||
Loan type: | ||||||||||||||||||
Long-term loans: | ||||||||||||||||||
Long-term fixed-rate loans | $ | 24,538,566 | 99 | % | $ | 278,762 | 1 | % | $ | 24,817,328 | ||||||||
Long-term variable-rate loans | 691,788 | 99 | 3,612 | 1 | 695,400 | |||||||||||||
Total long-term loans | 25,230,354 | 99 | 282,374 | 1 | 25,512,728 | |||||||||||||
Line of credit loans | 196,018 | 14 | 1,208,353 | 86 | 1,404,371 | |||||||||||||
Total loans outstanding(1) | $ | 25,426,372 | 94 | $ | 1,490,727 | 6 | $ | 26,917,099 | ||||||||||
Company: | ||||||||||||||||||
CFC | $ | 24,421,263 | 95 | % | $ | 1,418,397 | 5 | % | $ | 25,839,660 | ||||||||
NCSC | 638,275 | 94 | 43,046 | 6 | 681,321 | |||||||||||||
RTFC | 366,834 | 93 | 29,284 | 7 | 396,118 | |||||||||||||
Total loans outstanding(1) | $ | 25,426,372 | 94 | $ | 1,490,727 | 6 | $ | 26,917,099 | ||||||||||
May 31, 2020 | ||||||||||||||||||
(Dollars in thousands) | Secured | % of Total | Unsecured | % of Total | Total | |||||||||||||
Loan type: | ||||||||||||||||||
Long-term loans: | ||||||||||||||||||
Long-term fixed-rate loans | $ | 24,137,145 | 99 | % | $ | 334,858 | 1 | % | $ | 24,472,003 | ||||||||
Long-term variable-rate loans | 650,192 | 99 | 5,512 | 1 | 655,704 | |||||||||||||
Total long-term loans | 24,787,337 | 99 | 340,370 | 1 | 25,127,707 | |||||||||||||
Line of credit loans | 191,268 | 12 | 1,371,879 | 88 | 1,563,147 | |||||||||||||
Total loans outstanding(1) | $ | 24,978,605 | 94 | $ | 1,712,249 | 6 | $ | 26,690,854 | ||||||||||
Company: | ||||||||||||||||||
CFC | $ | 23,977,438 | 94 | % | $ | 1,630,219 | 6 | % | $ | 25,607,657 | ||||||||
NCSC | 638,488 | 91 | 59,374 | 9 | 697,862 | |||||||||||||
RTFC | 362,679 | 94 | 22,656 | 6 | 385,335 | |||||||||||||
Total loans outstanding(1) | $ | 24,978,605 | 94 | $ | 1,712,249 | 6 | $ | 26,690,854 | ||||||||||
____________________________
(1) Represents the unpaid principal balance, net of charge-offs and recoveries, of loans as of the end of each period. Excludes unamortized deferred loan origination costs of $12 million as of both August 31, 2020 and May 31, 2020.
Credit Concentration
Concentrations may exist when there are amounts loaned to borrowers engaged in similar activities or in geographic areas that would cause them to be similarly impacted by economic or other conditions or when there are large exposures to single borrowers. As discussed above under “Credit Risk—Loan Portfolio Credit Risk,” loans outstanding to electric utility organizations represented approximately 99% of our total outstanding loan portfolio as of August 31, 2020, unchanged from May 31, 2020.
Geographic Concentration
Although our organizational structure and mission results in single-industry concentration, we serve a geographically diverse group of electric and telecommunications borrowers throughout the United States. The number of borrowers with
31
outstanding loans totaled 888 and 889 as of August 31, 2020 and May 31, 2020, respectively, located in 49 states. Texas accounted for the largest number of borrowers in any one state as of each respective date. In addition, Texas accounted for approximately 16% of total loans outstanding as of both August 31, 2020 and May 31, 2020, representing the largest concentration of loans outstanding to borrowers in any one state.
Single-Obligor Concentration
Table 21 displays the outstanding loan exposure for our 20 largest borrowers, by company, as of August 31, 2020 and May 31, 2020. The 20 largest borrowers consisted of 12 distribution systems and eight power supply systems as of August 31, 2020. In comparison, the 20 largest borrowers consisted of 11 distribution systems and 9 power supply systems as of May 31, 2020. The largest total exposure to a single borrower or controlled group represented less than 2% of total loans outstanding as of both August 31, 2020 and May 31, 2020.
Table 21: Loan Exposure to 20 Largest Borrowers
August 31, 2020 | May 31, 2020 | Change | ||||||||||||||||
(Dollars in thousands) | Amount | % of Total | Amount | % of Total | ||||||||||||||
By company: | ||||||||||||||||||
CFC | $ | 5,700,033 | 21 | % | $ | 5,661,540 | 21 | % | $ | 38,493 | ||||||||
NCSC | 209,561 | 1 | 215,595 | 1 | (6,034 | ) | ||||||||||||
Total loan exposure to 20 largest borrowers | 5,909,594 | 22 | 5,877,135 | 22 | 32,459 | |||||||||||||
Less: Loans covered under Farmer Mac standby purchase commitment | (285,001 | ) | (1 | ) | (313,644 | ) | (1 | ) | 28,643 | |||||||||
Net loan exposure to 20 largest borrowers | $ | 5,624,593 | 21 | % | $ | 5,563,491 | 21 | % | $ | 61,102 | ||||||||
As part of our strategy in managing credit exposure to large borrowers, we entered into a long-term standby purchase commitment agreement with Farmer Mac during fiscal year 2016. Under this agreement, we may designate certain long-term loans to be covered under the commitment, subject to approval by Farmer Mac, and in the event any such loan later goes into payment default for at least 90 days, upon request by us, Farmer Mac must purchase such loan at par value. The aggregate unpaid principal balance of designated and Farmer Mac approved loans was $551 million and $569 million as of August 31, 2020 and May 31, 2020, respectively. Loan exposure to our 20 largest borrowers covered under the Farmer Mac agreement totaled $285 million and $314 million as of August 31, 2020 and May 31, 2020, respectively. No loans have been put to Farmer Mac for purchase pursuant to this agreement. Our credit exposure is also mitigated by long-term loans guaranteed by RUS. Guaranteed RUS loans totaled $145 million and $147 million as of August 31, 2020 and May 31, 2020, respectively.
Credit Quality Indicators
Assessing the overall credit quality of our loan portfolio and measuring our credit risk is an ongoing process that involves tracking payment status, troubled debt restructurings, nonperforming loans, charge-offs, the internal risk ratings of our borrowers and other indicators of credit risk. We monitor and subject each borrower and loan facility in our loan portfolio to an individual risk assessment based on quantitative and qualitative factors. Payment status trends and internal risk ratings are indicators, among others, of the probability of borrower default and overall credit quality of our loan portfolio.
Despite the economic disruption caused by COVID-19, the overall credit quality of our loan portfolio remained high as of August 31, 2020, as evidenced by our continued strong credit performance metrics. We had no delinquent loans as of August 31, 2020 or May 31, 2020, and we have not experienced any loan defaults or charge-offs since fiscal year 2017. We had one loan to a CFC power supply borrower that we classified as nonperforming and placed on nonaccrual status in the fourth quarter of fiscal year 2020. The outstanding balance of this loan, which we continue to report as nonperforming, was $161 million and $168 million as of August 31, 2020 and May 31, 2020, respectively. We had no other loans classified as nonperforming or on nonaccrual status as of August 31, 2020 or May 31, 2020. We provide additional information on this loan below under “Nonperforming Loans” and “Allowance for Credit Losses.”
32
Troubled Debt Restructurings
We actively monitor problem loans and, from time to time, attempt to work with borrowers to manage such exposures through loan workouts or modifications that better align with the borrower’s current ability to pay. A loan restructuring or modification of terms is accounted for as a troubled debt restructuring (“TDR”) if, for economic or legal reasons related to the borrower’s financial difficulties, a concession is granted to the borrower that we would not otherwise consider. TDR loans generally are initially classified as nonperforming and placed on nonaccrual status, although in many cases such loans were already classified as nonperforming prior to modification. These loans may be returned to performing status and the accrual of interest resumed if the borrower performs under the modified terms for an extended period of time, and we expect the borrower to continue to perform in accordance with the modified terms. In certain limited circumstances in which a TDR loan is current at the modification date, the loan may remain on accrual status at the time of modification.
We did not have any loan modifications that were required to be accounted for as TDRs during the three months ended August 31, 2020, nor have we had any TRD loan modifications since fiscal year 2016. Table 22 presents the outstanding amount of modified loans accounted for as TDRs in prior periods and the performance status as of August 31, 2020 and May 31, 2020. The outstanding TDR loans for CFC and RTFC each relate to the modification of a loan for one borrower that, at the time of the modification, was experiencing financial difficulty.
Table 22: Troubled Debt Restructured Loans
August 31, 2020 | May 31, 2020 | |||||||||||||||||||
(Dollars in thousands) | Number of Borrowers | Outstanding Amount(1) | % of Total Loans Outstanding | Number of Borrowers | Outstanding Amount(1) | % of Total Loans Outstanding | ||||||||||||||
TDR loans: | ||||||||||||||||||||
CFC | 1 | $ | 5,379 | 0.02 | % | 1 | $ | 5,755 | 0.02 | % | ||||||||||
RTFC | 1 | 4,967 | 0.02 | 1 | 5,092 | 0.02 | ||||||||||||||
Total TDR loans | 2 | $ | 10,346 | 0.04 | % | 2 | $ | 10,847 | 0.04 | % | ||||||||||
Performance status of TDR loans: | ||||||||||||||||||||
Performing TDR loans | 2 | $ | 10,346 | 0.04 | % | 2 | 10,847 | 0.04 | % | |||||||||||
Total TDR loans | 2 | $ | 10,346 | 0.04 | % | 2 | $ | 10,847 | 0.04 | % | ||||||||||
____________________________
(1) Represents the unpaid principal balance net of charge-offs and recoveries as of the end of each period.
We did not have any TDR loans classified as nonperforming as of August 31, 2020 or May 31, 2020. Although TDR loans may be returned to performing status if the borrower performs under the modified terms of the loan for an extended period of time, TDR loans are evaluated on an individual basis in estimating lifetime expected credit losses under the CECL model.
Nonperforming Loans
In addition to TDR loans that may be classified as nonperforming, we also may have nonperforming loans that have not been modified as a TDR. During the fourth quarter of fiscal year 2020, we classified one loan to a CFC power supply borrower with an outstanding balance of $168 million as of May 31, 2020, as nonperforming, placed the loan on nonaccrual status and established an asset-specific allowance for credit losses of $34 million as of May 31, 2020. Under the terms of the loan, which matures in December 2026, the amount the borrower is required to pay in 2024 and 2025 may vary as the payments are contingent on the borrower's financial performance in those years. Based on our review and assessment of the borrower’s most recent forecast and underlying assumptions provided to us in May 2020, we no longer believe that the future expected cash payments from the borrower through the maturity of the loan in December 2026 will be sufficient to repay the outstanding loan balance. We received payments from the borrower on this loan during the current quarter, which reduced the outstanding balance to $161 million as of August 31, 2020. The asset-specific allowance for credit losses for this loan was $33 million as of August 31, 2020. Although the borrower is not in default and was current with respect to required payments on the loan as of August 31, 2020, we continue to report the loan as nonperforming. We had no other loans classified as nonperforming or on nonaccrual status as of August 31, 2020 or May 31, 2020.
33
Net Charge-Offs
We had no loan defaults, charge-offs or recoveries during the three months ended August 31, 2020 and 2019. We experienced our last charge-off, which was attributable to a borrower in our RTFC telecommunications loan portfolio, in fiscal year 2017. We now have experienced an extended period of seven consecutive fiscal years for which we have had no charge-offs in our electric utility loan portfolio, which accounted for 99% of total loans outstanding as of August 31, 2020 and May 31, 2020.
In its 51-year history, CFC has experienced only 16 defaults, of which 10 resulted in no loss and six resulted in cumulative historical net charge-offs of $86 million for our electric utility loan portfolio. Of this amount, $67 million was attributable to electric utility power supply cooperatives and $19 million was attributable to electric distribution cooperatives. We discuss the reasons loans to electric utility cooperatives, our principal lending market, typically have a relatively low risk of default above under “Credit Risk—Loan Portfolio Credit Risk.”
In comparison, since RTFC’s inception in 1987, we have experienced 15 defaults and cumulative net charge-offs attributable to telecommunication borrowers totaling $427 million, the most significant of which was a charge-off of $354 million in fiscal year 2011. This charge-off related to outstanding loans to Innovative Communications Corporation (“ICC”), a former RTFC member, and the transfer of ICC’s assets in foreclosure to Caribbean Asset Holdings, LLC.
Borrower Risk Ratings
As part of our management of credit risk, we maintain a credit risk rating framework under which we employ a consistent process for assessing the credit quality of our loan portfolio. We evaluate each borrower and loan facility in our loan portfolio and assign internal borrower and loan facility risk ratings based on consideration of a number of quantitative and qualitative factors. Each risk rating is reassessed annually following the receipt of the borrower’s audited financial statements; however, interim risk-rating adjustments may occur as a result of updated information affecting a borrower’s ability to fulfill its obligations or other significant developments and trends. We categorize loans in our portfolio based on our internally assigned borrower risk ratings, which are intended to assess the general credit worthiness of the borrower and probability of default. Our borrower risk ratings align with the U.S. federal banking regulatory agencies credit risk definitions of pass and criticized categories, with the criticized category further segmented among special mention, substandard and doubtful. Pass ratings reflect relatively low probability of default, while criticized ratings have a higher probability of default.
Criticized loans totaled $362 million and $371 million as of August 31, 2020 and May 31, 2020, respectively, representing approximately 1% of total loans outstanding as of each date. Criticized loans in the substandard category decreased to $5 million as of August 31, 2020, from $170 million as of May 31, 2020. Loans outstanding to one electric distribution cooperative borrower and its subsidiary totaling $165 million accounted for the substantial majority of the $170 million in the substandard category as of May 31, 2020. Based on updated financial performance information from the borrower, we reassessed and upgraded the risk rating for the borrower from substandard to special mention as of August 31, 2020. Criticized loans in the doubtful category totaled $161 million and $168 million as of August 31, 2020 and May 31, 2020, respectively. The amount in the doubtful category as of each date is attributable to the loan to the CFC power supply borrower that we classified as nonperforming and placed on nonaccrual status in the fourth quarter of fiscal year 2020, discussed above under “Nonperforming Loans.”
We use our internal risk ratings to measure the credit risk of each borrower and loan facility, identify or confirm problem or potential problem loans in a timely manner, differentiate risk within each of our portfolio segments, assess the overall credit quality of our loan portfolio and manage overall risk levels. Our internally assigned borrower risk ratings, which we map to equivalent credit ratings by external credit rating agencies, serve as the primary credit quality indicator for our loan portfolio. Because our internal borrower risk ratings provide important information on the collectibility of each of our loan portfolio segments, they are a key input in estimating our allowance for credit losses.
We provide additional information on our borrower risk rating classifications in “Note 1—Summary of Significant Accounting” and “Note 4—Loans.”
34
Allowance for Credit Losses
As discussed above, we adopted the CECL accounting standard on June 1, 2020, which resulted in an increase in our allowance for credit losses for our loan portfolio of $4 million and a corresponding decrease to retained earnings of $4 million recorded through a cumulative-effect adjustment. The impact on the allowance for credit losses for our off-balance sheet credit exposures related to unadvanced loan commitments and financial guarantees was not material. Under CECL, we are required to maintain an allowance based on a current estimate of credit losses that are expected to occur over the remaining contractual term of the loans in our portfolio. Prior to the adoption of CECL on June 1, 2020, we maintained an allowance based on an estimate of probable incurred losses inherent in our loan portfolio as of each balance sheet date.
Table 23 summarizes changes in the allowance for credit losses for the three months ended August 31, 2020 and 2019, and presents the allowance components and allowance coverage ratios as of August 31, 2020 and May 31, 2020. The changes in the allowance and the allowance components prior to our adoption of CECL on June 1, 2020 are based on the incurred loss model for estimating the allowance for credit losses. The allowance components, which consist of a collective allowance and an asset-specific allowance, are based on the evaluation method used to measure our loans for credit losses. Loans that share similar risk characteristics are evaluated on a collective basis in measuring credit losses, while loans that do not share similar risk characteristics with other loans in our portfolio are evaluated on an individual basis.
Table 23: Allowance for Credit Losses
Three Months Ended August 31, | ||||||||
(Dollars in thousands) | 2020 | 2019 | ||||||
Beginning balance | 53,125 | $ | 17,535 | |||||
Cumulative-effect adjustment from adoption of CECL accounting standard | 3,900 | — | ||||||
Beginning balance, adjusted | 57,025 | 17,535 | ||||||
Provision for credit losses | 326 | 30 | ||||||
Ending balance | $ | 57,351 | $ | 17,565 | ||||
August 31, 2020 | May 31, 2020 | |||||||
Allowance for credit losses by company: | ||||||||
CFC | $ | 52,730 | $ | 47,438 | ||||
NCSC | 829 | 806 | ||||||
RTFC | 3,792 | 4,881 | ||||||
Total allowance for credit losses | $ | 57,351 | $ | 53,125 | ||||
Allowance components: | ||||||||
Collective allowance | $ | 23,519 | 18,292 | |||||
Asset-specific allowance | 33,832 | 34,833 | ||||||
Total allowance for credit losses | $ | 57,351 | $ | 53,125 | ||||
Loans outstanding: | ||||||||
Collectively evaluated loans | $ | 26,745,276 | $ | 26,512,298 | ||||
Individually evaluated loans | 171,823 | 178,556 | ||||||
Total loans outstanding(1) | $ | 26,917,099 | $ | 26,690,854 | ||||
Allowance coverage ratios: | ||||||||
Collective allowance coverage ratio(2) | 0.09 | % | 0.07 | % | ||||
Asset-specific allowance coverage ratio(3) | 19.69 | % | 19.51 | % | ||||
Total allowance coverage ratio(4) | 0.21 | % | 0.20 | % | ||||
____________________________
(1)Represents the unpaid principal balance, net of charge-offs and recoveries, of loans as of each period end. Excludes unamortized deferred loan origination costs of $12 million as of August 31, 2020 and May 31, 2020.
35
(2)Calculated based on the collective allowance component at period end divided by collectively evaluated loans outstanding at period end.
(3)Calculated based on the asset-specific allowance component at period end divided by individually evaluated loans outstanding at period end.
(4)Calculated based on the total allowance for credit losses at period end divided by total loans outstanding at period end.
The allowance for credit losses for our loan portfolio increased to $57 million as of August 31, 2020, from $53 million as of May 31, 2020, and the allowance coverage ratio increased to 0.21% from 0.20%, primarily due to the increase in the allowance of $4 million recorded at adoption of CECL on June 1, 2020.
We discuss our methodology for estimating the allowance for credit losses under CECL in “Note 1—Summary of Significant Accounting Policies.” See “Note 4—Loans” and “Note 5—Allowance for Credit Losses” for additional information.
Counterparty Credit Risk
We are exposed to counterparty credit risk related to the performance of the parties with which we enter into financial transactions, primarily for derivative instruments, cash and time deposit accounts and our investment security holdings. To mitigate this risk, we only enter into these transactions with financial institutions with investment-grade ratings. Our cash and time deposits with financial institutions generally have an original maturity of less than one year.
We manage our derivative counterparty credit risk by monitoring the overall credit worthiness of each counterparty based on our internal counterparty credit risk scoring model; using counterparty-specific credit risk limits; executing master netting arrangements; and diversifying our derivative transactions among multiple counterparties. We also require that our derivative counterparties be a participant in one of our committed bank revolving line of credit agreements. Our active derivative counterparties had credit ratings ranging from Aa2 to Baa2 by Moody’s Investors Service (“Moody’s”) and from AA- to BBB+ by S&P Global Inc. (“S&P”) as of August 31, 2020. Our largest counterparty exposure, based on the outstanding notional amount, represented approximately 25% of the total outstanding notional amount of derivatives as of August 31, 2020 and May 31, 2020.
Credit Risk-Related Contingent Features
Our derivative contracts typically contain mutual early-termination provisions, generally in the form of a credit rating trigger. Under the mutual credit rating trigger provisions, either counterparty may, but is not obligated to, terminate and settle the agreement if the credit rating of the other counterparty falls below a level specified in the agreement. If a derivative contract is terminated, the amount to be received or paid by us would be equal to the prevailing fair value, as defined in the agreement, as of the termination date.
Our senior unsecured credit ratings from Moody’s and S&P were A2 and A, respectively, as of August 31, 2020. Both Moody’s and S&P had our ratings on stable outlook as of August 31, 2020. Table 24 displays the notional amounts of our derivative contracts with rating triggers as of August 31, 2020, and the payments that would be required if the contracts were terminated as of that date because of a downgrade of our unsecured credit ratings or the counterparty’s unsecured credit ratings below A3/A-, below Baa1/BBB+, to or below Baa2/BBB, below Baa3/BBB-, or to or below Ba2/BB+ by Moody’s or S&P, respectively. In calculating the payment amounts that would be required upon termination of the derivative contracts, we assumed that the amounts for each counterparty would be netted in accordance with the provisions of the counterparty's master netting agreements. The net payment amounts are based on the fair value of the underlying derivative instrument, excluding the credit risk valuation adjustment, plus any unpaid accrued interest amounts.
36
Table 24: Rating Triggers for Derivatives
(Dollars in thousands) | Notional Amount | Payable Due From CFC | Receivable Due to CFC | Net (Payable)/Receivable | ||||||||||||
Impact of rating downgrade trigger: | ||||||||||||||||
Falls below A3/A-(1) | $ | 45,860 | $ | (10,614 | ) | $ | — | $ | (10,614 | ) | ||||||
Falls below Baa1/BBB+ | 6,029,690 | (634,659 | ) | — | (634,659 | ) | ||||||||||
Falls to or below Baa2/BBB (2) | 417,041 | (31,630 | ) | — | (31,630 | ) | ||||||||||
Falls below Baa3/BBB- | 44,877 | (15,097 | ) | — | (15,097 | ) | ||||||||||
Total | $ | 6,537,468 | $ | (692,000 | ) | $ | — | $ | (692,000 | ) | ||||||
____________________________
(1) Rating trigger for CFC falls below A3/A-, while rating trigger for counterparty falls below Baa1/BBB+ by Moody’s or S&P, respectively.
(2) Rating trigger for CFC falls to or below Baa2/BBB, while rating trigger for counterparty falls to or below Ba2/BB+ by Moody’s or S&P, respectively.
Table 24 does not include an interest rate swap agreement with one counterparty that is subject to a ratings trigger and early termination provision in the event of a downgrade of CFC’s senior unsecured credit ratings below Baa3, BBB- or BBB- by Moody’s, S&P or Fitch Ratings Inc. (“Fitch”). The outstanding notional amount of interest rate swaps with this counterparty totaled $205 million as of August 31, 2020, and the swaps were in an unrealized loss position of $56 million as of August 31, 2020.
The aggregate fair value amount, including the credit valuation adjustment, of all interest rate swaps with rating triggers that were in a net liability position was $734 million as of August 31, 2020, compared with $798 million as of May 31, 2020. There were no counterparties that fell below the rating trigger levels in our interest swap contracts as of August 31, 2020. If a counterparty has a credit rating that falls below the rating trigger level specified in the interest swap contract, we have the option to terminate all derivatives with the counterparty. However, we generally do not terminate such agreements prior to maturity because our interest rate swaps are critical to our matched funding strategy to mitigate interest rate risk.
See “Item 1A. Risk Factors” in our 2020 Form 10-K and “Item 1A. Risk Factors” in this Report for additional information about credit risks related to our business.
LIQUIDITY RISK |
We define liquidity as the ability to convert assets into cash quickly and efficiently, maintain access to readily available funding and to roll-over or issue new debt under normal operating conditions and periods of CFC-specific and/or market stress, to ensure that we can meet borrower loan requests, pay current and future obligations and fund our operations on a cost-effective basis. Our primary sources of liquidity include cash flows from operations, member loan repayments, committed bank revolving lines of credit, committed loan facilities under the Guaranteed Underwriter Program, revolving note purchase agreements with Farmer Mac and our ability to issue debt in the capital markets, to our members and in private placements. We provide information on our liquidity risk-management framework and activities undertaken to manage liquidity risk under “Item 7. MD&A—Liquidity Risk—Liquidity Risk Management” in our 2020 Form 10-K.
Available Liquidity
As part of our strategy in managing liquidity risk and meeting our liquidity objectives, we seek to maintain a substantial level of on-balance sheet and off-balance sheet sources of liquidity that are readily available for access to meet our near-term liquidity needs. Table 25 presents the sources of readily available liquidity as of August 31, 2020 and May 31, 2020.
37
Table 25: Available Liquidity
August 31, 2020 | May 31, 2020 | |||||||||||||||||||||||
(Dollars in millions) | Total | Accessed | Available | Total | Accessed | Available | ||||||||||||||||||
Liquidity sources: | ||||||||||||||||||||||||
Cash and cash equivalents | $ | 348 | $ | — | $ | 348 | $ | 671 | $ | — | $ | 671 | ||||||||||||
Debt securities investment portfolio(1) | 528 | — | 528 | 309 | — | 309 | ||||||||||||||||||
Committed bank revolving line of credit agreements—unsecured(2) | 2,725 | 3 | 2,722 | 2,725 | 3 | 2,722 | ||||||||||||||||||
Guaranteed Underwriter Program committed facilities—secured(3) | 7,798 | 6,898 | 900 | 7,798 | 6,898 | 900 | ||||||||||||||||||
Farmer Mac revolving note purchase agreement, dated March 24, 2011, as amended—secured(4) | 5,500 | 3,042 | 2,458 | 5,500 | 3,060 | 2,440 | ||||||||||||||||||
Total available liquidity | $ | 16,899 | $ | 9,943 | $ | 6,956 | $ | 17,003 | $ | 9,961 | $ | 7,042 | ||||||||||||
(1)Our portfolio of equity securities consists primarily of preferred stock securities that are not as readily redeemable; therefore, we have excluded our portfolio of equity securities from our sources of available liquidity.
(2)The committed bank revolving line of credit agreements consist of a three-year and a five-year revolving line of credit agreement. The accessed amount of $3 million as of August 31, 2020 and May 31, 2020, relates to letters of credit issued pursuant to the five-year revolving line of credit agreement.
(3)The committed facilities under the Guaranteed Underwriter Program are not revolving.
(4)Availability subject to market conditions.
Borrowing Capacity Under Current Facilities
Following is a discussion of our borrowing capacity and key terms and conditions under our revolving line of credit agreements with banks and committed loan facilities under the Guaranteed Underwriter Program and revolving note purchase agreements with Farmer Mac.
Committed Bank Revolving Line of Credit Agreements—Unsecured
Our committed bank revolving lines of credit may be used for general corporate purposes; however, we generally rely on them as a backup source of liquidity for our member and dealer commercial paper. We had $2,725 million of commitments under committed bank revolving line of credit agreements as of August 31, 2020. Under our current committed bank revolving line of credit agreements, we have the ability to request up to $300 million of letters of credit, which would result in a reduction in the remaining available amount under the facilities.
Table 26 presents the total commitment amount under our committed bank revolving line of credit agreements, outstanding letters of credit and the amount available for access as of August 31, 2020. We did not have any outstanding borrowings under our bank revolving line of credit agreements as of August 31, 2020.
Table 26: Committed Bank Revolving Line of Credit Agreements
August 31, 2020 | ||||||||||||||||
(Dollars in millions) | Total Commitment | Letters of Credit Outstanding | Available Amount | Maturity | Annual Facility Fee (1) | |||||||||||
3-year agreement | $ | 1,315 | $ | — | $ | 1,315 | November 28, 2022 | 7.5 bps | ||||||||
5-year agreement | 1,410 | 3 | 1,407 | November 28, 2023 | 10 bps | |||||||||||
Total | $ | 2,725 | $ | 3 | $ | 2,722 | ||||||||||
____________________________
(1)Facility fee based on CFC’s senior unsecured credit ratings in accordance with the established pricing schedules at the inception of the related agreement.
Our committed bank revolving line of credit agreements do not contain a material adverse change clause or rating triggers that would limit the banks’ obligations to provide funding under the terms of the agreements; however, we must be in
38
compliance with the covenants to draw on the facilities. We have been and expect to continue to be in compliance with the covenants under our committed bank revolving line of credit agreements. As such, we could draw on these facilities to repay dealer or member commercial paper that cannot be rolled over. See “Financial Ratios and Debt Covenants” below for additional information, including the specific financial ratio requirements under our committed bank revolving line of credit agreements.
Guaranteed Underwriter Program Committed Facilities—Secured
Under the Guaranteed Underwriter Program, we can borrow from the Federal Financing Bank and use the proceeds to make new loans and refinance existing indebtedness. As part of the program, we pay fees, based on outstanding borrowings supporting the USDA Rural Economic Development Loan and Grant program. The borrowings under this program are guaranteed by RUS. We had up to $900 million available for borrowing under the Guaranteed Underwriter Program as of August 31, 2020. Of this amount, $400 million is available for advance through July 15, 2023 and $500 million is available for advance through July 15, 2024. Each advance is subject to quarterly amortization and a final maturity not longer than 30 years from the date of the advance. On September 16, 2020, we received a commitment letter for the guarantee by RUS for a $375 million loan facility from the Federal Financing Bank under the Guaranteed Underwriter Program.
We are required to pledge eligible distribution system loans or power supply system loans as collateral in an amount at least equal to the total outstanding borrowings under the Guaranteed Underwriter Program. See “Consolidated Balance Sheet Analysis—Debt—Collateral Pledged” and “Note 4—Loans” for additional information on pledged collateral.
Farmer Mac Revolving Note Purchase Agreement—Secured
As indicated in Table 25, we have a revolving note purchase agreement with Farmer Mac, dated March 24, 2011, as amended, under which we can borrow up to $5,500 million from Farmer Mac at any time, subject to market conditions, through January 11, 2022. This date automatically extends on each anniversary date of the closing for an additional year, unless prior to any such anniversary date, Farmer Mac provides us with a notice that the draw period will not be extended beyond the remaining term. Pursuant to the terms of the Farmer Mac revolving note purchase agreement, we can borrow, repay and re-borrow funds at any time through maturity, as market conditions permit, provided that the outstanding principal amount at any time does not exceed the total available under the agreement. Under this agreement, we had outstanding secured notes payable totaling $3,042 million and $3,060 million as of August 31, 2020 and May 31, 2020, respectively. The amount available for borrowing under this agreement was $2,458 million as of August 31, 2020.
We are required to pledge eligible electric distribution system or electric power supply system loans as collateral in an amount at least equal to the total principal amount of notes outstanding under this agreement. See “Consolidated Balance Sheet Analysis—Debt—Collateral Pledged” and “Note 4—Loans” for additional information on pledged collateral.
Short-Term Borrowings and Long-Term and Subordinated Debt
Additional funding is provided by short-term borrowings and issuances of long-term and subordinated debt. We rely on short-term borrowings as a source to meet our daily, near-term funding needs. Long-term and subordinated debt represents the most significant component of our funding. The issuance of long-term debt allows us to reduce our reliance on short-term borrowings and effectively manage our refinancing and interest rate risk.
Short-Term Borrowings
Our short-term borrowings consist of commercial paper, which we offer to members and dealers, select notes and daily liquidity fund notes offered to members, and bank-bid notes and medium-term notes offered to members and dealers.
Short-term borrowings of $4,553 million as of August 31, 2020, reflected an increase of $592 million from May 31, 2020, driven by higher member investments and issuances of dealer commercial paper.
Table 27 displays the composition, by funding source, of our short-term borrowings as of August 31, 2020 and May 31, 2020. Member borrowings accounted for 88% of total short-term borrowings as of August 31, 2020, compared with 94% of total short-term borrowings as of May 31, 2020.
39
Table 27: Short-Term Borrowings—Funding Sources
August 31, 2020 | May 31, 2020 | |||||||||||||
(Dollars in thousands) | Amount Outstanding | % of Total Short-Term Borrowings | Amount Outstanding | % of Total Short-Term Borrowings | ||||||||||
Funding source: | ||||||||||||||
Members | $ | 4,003,493 | 88 | % | $ | 3,711,985 | 94 | % | ||||||
Private placement—Farmer Mac notes payable | 250,000 | 5 | 250,000 | 6 | ||||||||||
Capital markets | 299,998 | 7 | — | — | ||||||||||
Total | $ | 4,553,491 | 100 | % | $ | 3,961,985 | 100 | % | ||||||
Table 28 displays the composition, by product type, of our short-term borrowings as of August 31, 2020 and May 31, 2020.
Table 28: Short-Term Borrowings
August 31, 2020 | May 31, 2020 | |||||||||||||
(Dollars in thousands) | Amount Outstanding | % of Total Debt Outstanding | Amount Outstanding | % of Total Debt Outstanding | ||||||||||
Short-term borrowings: | ||||||||||||||
Commercial paper: | ||||||||||||||
Commercial paper to dealers, net of discounts | $ | 299,998 | 1 | % | $ | — | — | % | ||||||
Commercial paper to members, at par | 1,421,582 | 6 | 1,318,566 | 5 | ||||||||||
Total commercial paper | 1,721,580 | 7 | 1,318,566 | 5 | ||||||||||
Select notes to members | 1,655,029 | 6 | 1,597,959 | 6 | ||||||||||
Daily liquidity fund notes to members | 645,036 | 2 | 508,618 | 2 | ||||||||||
Medium-term notes sold to members | 281,846 | 1 | 286,842 | 1 | ||||||||||
Farmer Mac notes payable | 250,000 | 1 | 250,000 | 1 | ||||||||||
Total short-term borrowings | $ | 4,553,491 | 17 | % | $ | 3,961,985 | 15 | % | ||||||
Our short-term borrowings of $4,553 million accounted for 17% of total debt outstanding as of August 31, 2020, compared with $3,962 million and 15% of total debt outstanding as of May 31, 2020. Commercial paper to dealers totaled $300 million as of August 31, 2020. In comparison, we had no commercial paper to dealers outstanding as of May 31, 2020. Our intent is to manage our short-term wholesale funding risk by maintaining outstanding dealer commercial paper at an amount below $1,250 million for the foreseeable future.
Long-Term and Subordinated Debt
In addition to access to private debt facilities, we also issue debt in the public capital markets. Pursuant to Rule 405 of the Securities Act, we are classified as a “well-known seasoned issuer.” Under our effective shelf registration statements filed with the SEC, we may offer and issue the following debt securities:
• | an unlimited amount of collateral trust bonds until September 2022; |
• | an unlimited amount of senior and subordinated debt securities, including medium-term notes, member capital securities and subordinated deferrable debt, until November 2020; and |
• | daily liquidity fund notes up to $20,000 million in the aggregate—with a $3,000 million limit on the aggregate principal amount outstanding at any time—until March 2022. |
40
We intend to file a new registration statement registering an unlimited amount of senior and subordinated debt securities, including medium-term notes, member capital securities and subordinated deferrable debt prior to the expiration of the existing shelf registration statement in November 2020.
As discussed in “Consolidated Balance Sheet Analysis—Debt,” long-term and subordinated debt of $21,467 million and $22,038 million as of August 31, 2020 and May 31, 2020, respectively, accounted for 83% and 85% of total debt outstanding as of each respective date. Table 29 summarizes long-term and subordinated debt issuances and repayments during the three months ended August 31, 2020.
Table 29: Long-Term and Subordinated Debt Issuances and Repayments(1)
Three Months Ended August 31, 2020 | ||||||||||||
(Dollars in thousands) | Issuances | Repayments(2) | Change | |||||||||
Long-term and subordinated debt activity: | ||||||||||||
Collateral trust bonds | $ | — | $ | 400,000 | $ | (400,000 | ) | |||||
Guaranteed Underwriter Program notes payable | — | 35,457 | (35,457 | ) | ||||||||
Farmer Mac notes payable | — | 17,794 | (17,794 | ) | ||||||||
Medium-term notes sold to members | 8,050 | 63,765 | (55,715 | ) | ||||||||
Medium-term notes sold to dealers | — | 26,539 | (26,539 | ) | ||||||||
Other notes payable | — | — | — | |||||||||
Members’ subordinated certificates | 3,257 | 44,030 | (40,773 | ) | ||||||||
Total | $ | 11,307 | $ | 587,585 | $ | (576,278 | ) | |||||
____________________________
(1)Amounts exclude unamortized debt issuance costs and discounts.
(2)Repayments include principal maturities, scheduled amortization payments, repurchases and redemptions.
Table 30 summarizes the scheduled amortization of the principal amount of long-term debt, subordinated deferrable debt and members’ subordinated certificates outstanding as of August 31, 2020, in each fiscal year during the five-year period ended May 31, 2025, and thereafter.
Table 30: Long-Term and Subordinated Debt Principal Maturity
(Dollars in thousands) | Scheduled Amortization(1) | % of Total | |||||
Fiscal year ending May 31: | |||||||
2021 | $ | 1,504,092 | 7 | % | |||
2022 | 2,535,954 | 12 | |||||
2023 | 1,243,063 | 6 | |||||
2024 | 1,130,890 | 5 | |||||
2025 | 830,070 | 4 | |||||
Thereafter | 14,222,402 | 66 | |||||
Total | $ | 21,466,471 | 100 | % | |||
____________________________
(1)Excludes $0.06 million in subscribed and unissued member subordinated certificates for which a payment has been received. Member loan subordinated certificates totaling $207 million amortize annually based on the unpaid principal balance of the related loan.
We provide additional information on our financing activities above under “Consolidated Balance Sheet Analysis—Debt.”
Debt Securities Investment Portfolio
We have an investment portfolio of debt securities, which are classified as trading, that serves as an additional source of liquidity. Our debt securities investment portfolio increased $218 million to $528 million as of August 31, 2020, from $309 million as of May 31, 2020, largely due to the purchase of additional securities during the current quarter. During the fourth
41
quarter of fiscal year 2020, we executed a plan for the orderly liquidation of a portion of our debt securities from our investment portfolio due to disruptions in the capital and credit markets in mid-March 2020 caused by the COVID-19 pandemic. As the volatility in the capital and credit markets eased, we purchased additional securities to increase our investment portfolio total to a level more comparable with the level prior to the market disruptions.
Our debt securities investment portfolio is unencumbered and structured so that the securities generally have active secondary or resale markets under normal market conditions. The objective of the portfolio is to achieve returns commensurate with the level of risk assumed subject to CFC’s investment policy and guidelines and liquidity requirements. Pursuant to our investment policy and guidelines, all fixed-income debt securities, at the time of purchase, must be rated at least investment grade and on stable outlook based on external credit ratings from at least two of the leading global credit rating agencies, when available, or the corresponding equivalent, when not available. Securities rated investment grade, that is those rated Baa3 or higher by Moody’s or BBB- or higher by S&P or BBB- or higher by Fitch, are generally considered by the rating agencies to be of lower credit risk than non-investment grade securities.
We provide additional information on our investment securities in “Note 3—Investment Securities.”
Projected Near-Term Sources and Uses of Liquidity
As discussed above, our primary sources of liquidity include cash flows from operations, member loan repayments, committed bank revolving lines of credit, committed loan facilities, short-term borrowings and funds from the issuance of long-term and subordinated debt. Our primary uses of liquidity include loan advances to members, principal and interest payments on borrowings, periodic settlement payments related to derivative contracts, and operating expenses.
Table 31 below displays our projected sources and uses of cash from debt and investment activity, by quarter, over the next six quarters through the quarter ending August 31, 2021. Our assumptions also include the following: (i) the estimated issuance of long-term debt, including collateral trust bonds and private placement of term debt, is based on maintaining a matched funding position within our loan portfolio with our bank revolving lines of credit serving as a backup liquidity facility for commercial paper and on maintaining outstanding dealer commercial paper at an amount below $1,250 million; (ii) long-term loan scheduled amortization payments represent the scheduled long-term loan payments for loans outstanding as of August 31, 2020, and our current estimate of long-term loan prepayments, which the amount and timing of are subject to change; (iii) other loan repayments and other loan advances primarily relate to line of credit repayments and advances; (iv) long-term debt maturities reflect scheduled maturities of outstanding term debt for the periods presented; and (v) long-term loan advances reflect our current estimate of member demand for loans, the amount and timing of which are subject to change.
Table 31: Projected Sources and Uses of Liquidity from Debt and Investment Activity(1)
Projected Sources of Liquidity | Projected Uses of Liquidity | |||||||||||||||||||||||||||||||||||
(Dollars in millions) | Long-Term Debt Issuance | Anticipated Long-Term Loan Repayments(2) | Other Long-Term Repayments(3) | Total Projected Sources of Liquidity | Long-Term Debt Maturities(4) | Long-Term Loan Advances | Other Loan Advances(5) | Total Projected Uses of Liquidity | Other Sources/ (Uses) of Liquidity(6) | |||||||||||||||||||||||||||
2Q FY 2021 | $ | 563 | $ | 358 | $ | 75 | $ | 996 | $ | 593 | $ | 579 | $ | — | $ | 1,172 | $ | 50 | ||||||||||||||||||
3Q FY2021 | 461 | 344 | — | 805 | 454 | 474 | — | 928 | 205 | |||||||||||||||||||||||||||
4Q FY2021 | 121 | 333 | — | 454 | 707 | 352 | — | 1,059 | 535 | |||||||||||||||||||||||||||
1Q FY2022 | 552 | 352 | — | 904 | 516 | 486 | — | 1,002 | 58 | |||||||||||||||||||||||||||
2Q FY2022 | 35 | 321 | — | 356 | 269 | 466 | — | 735 | 316 | |||||||||||||||||||||||||||
3Q FY2022 | 1,421 | 318 | — | 1,739 | 1,233 | 467 | — | 1,700 | (64 | ) | ||||||||||||||||||||||||||
Total | $ | 3,153 | $ | 2,026 | $ | 75 | $ | 5,254 | $ | 3,772 | $ | 2,824 | $ | — | $ | 6,596 | $ | 1,100 | ||||||||||||||||||
____________________________
42
(1) The dates presented represent the end of each quarterly period through the quarter ended August 31, 2021.
(2) Anticipated long-term loan repayments include scheduled long-term loan amortizations, anticipated cash repayments at repricing date and loan sales.
(3) Other loan repayments include anticipated short-term loan repayments.
(4) Long-term debt maturities also include medium-term notes with an original maturity of one year or less and expected early redemptions of debt.
(5)Other loan advances include anticipated short-term loan advances.
(6) Includes net increase or decrease to dealer commercial paper, member commercial paper and select notes, and purchases and maturity of investments.
As displayed in Table 31, we currently project long-term advances of $1,891 million over the next 12 months, which we anticipate will exceed anticipated loan repayments over the same period of $1,387 million by approximately $504 million. The estimates presented above are developed at a particular point in time based on our expected future business growth and funding. Our actual results and future estimates may vary, perhaps significantly, from the current projections, as a result of changes in market conditions, management actions or other factors.
Credit Ratings
Our funding and liquidity, borrowing capacity, ability to access capital markets and other sources of funds and the cost of these funds are partially dependent on our credit ratings. Rating agencies base their ratings on numerous factors, including liquidity, capital adequacy, industry position, member support, management, asset quality, quality of earnings and the probability of systemic support. Significant changes in these factors could result in different ratings. Table 32 displays our credit ratings as of August 31, 2020, which are unchanged from May 31, 2020, and as of the date of the filing of this Report.
Table 32: Credit Ratings
August 31, 2020 | ||||||
Moody’s | S&P | Fitch | ||||
Long-term issuer credit rating(1) | A2 | A | A | |||
Senior secured debt(2) | A1 | A | A+ | |||
Senior unsecured debt(3) | A2 | A | A | |||
Subordinated debt | A3 | BBB+ | BBB+ | |||
Commercial paper | P-1 | A-1 | F1 | |||
Outlook | Stable | Stable | Stable | |||
___________________________
(1) Based on our senior unsecured debt rating.
(2)Applies to our collateral trust bonds.
(3)Applies to our medium-term notes.
In order to access the commercial paper markets at attractive rates, we believe we need to maintain our current commercial paper credit ratings of P-1 by Moody’s, A-1 by S&P and F1 by Fitch. In addition, the notes payable to the Federal Financing Bank and guaranteed by RUS under the Guaranteed Underwriter Program contain a provision that if during any portion of the fiscal year, our senior secured credit ratings do not have at least two of the following ratings: (i) A3 or higher from Moody’s, (ii) A- or higher from S&P, (iii) A- or higher from Fitch or (iv) an equivalent rating from a successor rating agency to any of the above rating agencies, we may not make cash patronage capital distributions in excess of 5% of total patronage capital. See “Credit Risk—Counterparty Credit Risk—Credit Risk-Related Contingent Features” above for information on credit rating provisions related to our derivative contracts.
Financial Ratios
Our debt-to-equity ratio decreased to 37.64 as of August 31, 2020, from 42.40 as of May 31, 2020, primarily due to the an increase in equity from our reported net income of $145 million, which was partially offset by a decrease in equity as a result of the CFC Board of Directors’ authorization in the current quarter to retire patronage capital of $60 million, which we returned to members in September 2020.
43
Our adjusted debt-to-equity ratio increased to 5.96 as of August 31, 2020, from 5.85 as of May 31, 2020, primarily attributable to a reduction in adjusted equity due to the maturity of subordinated certificates and the authorized patronage capital retirement amount, partially offset by adjusted net income for the current quarter. We provide a reconciliation of our adjusted debt-to-equity ratio to the most comparable GAAP measure and an explanation of the adjustments below in “Non-GAAP Financial Measures.”
Debt Covenants
As part of our short-term and long-term borrowing arrangements, we are subject to various financial and operational covenants. If we fail to maintain specified financial ratios, such failure could constitute a default by CFC of certain debt covenants under our committed bank revolving line of credit agreements and senior debt indentures. We were in compliance with all covenants and conditions under our committed bank revolving line of credit agreements and senior debt indentures as of August 31, 2020.
As discussed above in “Summary of Selected Financial Data,” the financial covenants set forth in our committed bank revolving line of credit agreements and senior debt indentures are based on adjusted financial measures, including adjusted TIER. We provide a reconciliation of adjusted TIER and other non-GAAP measures disclosed in this Report to the most comparable GAAP measures and an explanation of the adjustments below in “Non-GAAP Financial Measures.”
MARKET RISK |
Interest rate risk represents our primary source of market risk. Interest rate risk is the risk to current or anticipated earnings or equity arising primarily from movements in interest rates. This risk results from differences between the timing of cash flows on our assets and the liabilities funding those assets. The timing of cash flows of our assets is impacted by re-pricing characteristics, prepayments and contractual maturities. Our interest rate risk exposure is primarily related to the funding of the fixed-rate loan portfolio. We provide a discussion of how we manage interest rate risk in our 2020 Form 10-K under “Item 7. MD&A—Market Risk—Market Risk Management.”
Future of LIBOR
In 2017, the United Kingdom’s Financial Conduct Authority (“FCA”), which regulates the LIBOR index, announced that the FCA intends to stop requesting banks to submit the rates required to calculate LIBOR after 2021. Management has formed a cross-functional LIBOR working group to identify CFC’s exposure, assess the potential risks related to the transition from LIBOR to a new index and develop a strategic transition plan. The LIBOR working group has performed an initial assessment of all of the CFC’s LIBOR dependent contracts and financial instruments and the systems, models and processes that may be impacted. The LIBOR working group will closely monitor and assess developments with respect to the phasing out of LIBOR and provide regular reports to the Chief Financial Officer and the CFC Board of Directors. We discuss the risks related to the uncertainty as to the nature of potential changes or other reforms associated with the transition away from and expected replacement of LIBOR as a benchmark interest rate in in our 2020 Form 10-K under “Item 1A. Risk Factors.”
Matched Funding Objective
Our funding objective is to manage the matched funding of asset and liability repricing terms within a range of adjusted total assets (calculated by excluding derivative assets from total assets) deemed appropriate by the Asset Liability Committee based on the current environment and extended outlook for interest rates. We refer to the difference between fixed-rate loans scheduled for amortization or repricing and the fixed-rate liabilities and equity funding those loans as our interest rate gap. Our primary strategies for managing our interest rate risk include the use of derivatives and limiting the amount of fixed-rate assets that can be funded by variable-rate debt to a specified percentage of adjusted total assets based on market conditions. We provide our members with many options on loans with regard to interest rates, the term for which the selected interest rate is in effect and the ability to convert or prepay the loan. Long-term loans generally have maturities of up to 35 years. Borrowers may select fixed interest rates for periods of one year through the life of the loan. We do not match fund the majority of our fixed-rate loans with a specific debt issuance at the time the loans are advanced. We fund the amount of fixed-rate assets that exceed fixed-rate debt and members’ equity with short-term debt, primarily commercial paper.
44
Interest Rate Gap Analysis
As part of our asset-liability management, we perform a monthly interest rate gap analysis that provides a comparison between the timing of cash flows, by year, for fixed-rate assets scheduled for amortization and repricing and for fixed-rate liabilities and members’ equity maturing. This gap analysis is a useful tool in measuring, monitoring and mitigating the interest rate risk inherent in the funding of fixed-rate assets with variable-rate debt and also helpful in assessing liquidity risk.
Table 33 displays the scheduled amortization and repricing of fixed-rate assets and outstanding fixed-rate liabilities and equity as of August 31, 2020. We exclude variable-rate loans from our interest rate gap analysis, as we do not consider the interest rate risk on these loans to be significant because they are subject to repricing at least monthly. Loans with variable interest rates accounted for 8% of our total loan portfolio as of August 31, 2020 and May 31, 2020. Fixed-rate liabilities include debt issued at a fixed rate, as well as variable-rate debt swapped to a fixed rate using interest rate swaps. Fixed-rate debt swapped to a variable rate using interest rate swaps is excluded from the analysis because it is used to match fund our variable-rate loans. With the exception of members’ subordinated certificates, which are generally issued with extended maturities, and commercial paper, our liabilities have average maturities that closely match the repricing terms (but not the maturities) of our fixed-rate loans.
Table 33: Interest Rate Gap Analysis
(Dollars in millions) | Prior to 5/31/21 | Two Years 6/1/21 to 5/31/23 | Two Years 6/1/23 to 5/31/25 | Five Years 6/1/25 to 5/31/30 | 10 Years 6/1/30 to 5/31/40 | 6/1/40 and Thereafter | Total | |||||||||||||||||||||
Asset amortization and repricing | $ | 1,286 | $ | 3,293 | $ | 2,988 | $ | 6,189 | $ | 7,759 | $ | 3,575 | $ | 25,090 | ||||||||||||||
Liabilities and members’ equity: | ||||||||||||||||||||||||||||
Long-term debt (1)(2) | $ | 1,620 | $ | 3,722 | $ | 2,362 | $ | 6,172 | $ | 4,877 | $ | 1,870 | $ | 20,623 | ||||||||||||||
Subordinated deferrable debt and subordinated certificates(2)(3) | 10 | 417 | 159 | 484 | 150 | 807 | 2,027 | |||||||||||||||||||||
Members’ equity (4) | 54 | 25 | 33 | 116 | 332 | 1,052 | 1,612 | |||||||||||||||||||||
Total liabilities and members’ equity | $ | 1,684 | $ | 4,164 | $ | 2,554 | $ | 6,772 | $ | 5,359 | $ | 3,729 | $ | 24,262 | ||||||||||||||
Gap (5) | $ | (398 | ) | $ | (871 | ) | $ | 434 | $ | (583 | ) | $ | 2,400 | $ | (154 | ) | $ | 828 | ||||||||||
Cumulative gap | (398 | ) | (1,269 | ) | (835 | ) | (1,418 | ) | 982 | 828 | ||||||||||||||||||
Cumulative gap as a % of total assets | (1.41 | )% | (4.49 | )% | (2.95 | )% | (5.02 | )% | 3.47 | % | 2.93 | % | ||||||||||||||||
Cumulative gap as a % of adjusted total assets(6) | (1.42 | ) | (4.52 | ) | (2.97 | ) | (5.05 | ) | 3.50 | 2.95 | ||||||||||||||||||
____________________________
(1)Includes long-term fixed-rate debt and the net impact of our interest rate swaps.
(2) The maturity presented for debt is based on the call date.
(3)Represents the amount of subordinated deferrable debt and subordinated certificates allocated to fund fixed-rate assets.
(4)Represents the portion of members’ equity and allowance for credit losses allocated to fund fixed-rate assets. See Table 38: Members’ Equity below under “Non-GAAP Financial Measures” for a reconciliation of total CFC equity to members’ equity.
(5)Calculated based on the amount of assets scheduled for amortization and repricing less total liabilities and members’ equity funding those assets.
(6)Adjusted total assets represents total assets reported in our consolidated balance sheets less derivative assets.
When the amount of the cash flows related to fixed-rate assets scheduled for amortization and repricing exceeds the amount of cash flows related to the fixed-rate debt and equity funding those assets, we refer to the difference, or gap, as “warehousing.” When the amount of the cash flows related to fixed-rate assets scheduled for amortization and repricing is less than the amount of the cash flows related to the fixed-rate debt and equity funding those assets, we refer to the gap as “prefunding.” The amount of the gap is an indication of our interest rate and liquidity risk exposure. Our goal is to maintain an unmatched position related to the cash flows for fixed-rate financial assets within a targeted range of adjusted total assets.
Because the substantial majority of our financial assets are fixed-rate, amortizing loans and these loans are primarily funded with bullet debt and equity, our interest rate gap analysis typically reflects a warehouse position. When we are in a
45
warehouse position, we utilize some short-term borrowings to fund the scheduled amortization and repricing of our financial assets. However, we limit the extent to which we fund our long-term, fixed-rate loans with short-term, variable-rate debt because it exposes us to higher interest rate and liquidity risk. As indicated above in Table 33, we were in a warehouse position of $828 million as of August 31, 2020.
NON-GAAP FINANCIAL MEASURES |
As discussed above in the section “Summary of Selected Financial Data,” in addition to financial measures determined in accordance with GAAP, management evaluates performance based on certain non-GAAP measures, which we refer to as “adjusted” measures. We provide a discussion of each of our non-GAAP measures under “Item 7. MD&A—Non-GAAP Measures” in our 2020 Form 10-K. Below we provide a reconciliation of our adjusted measures presented in this Report to the most comparable GAAP measures.
Adjusted Operational Financial Measures
Table 34 provides a reconciliation of adjusted interest expense, adjusted net interest income, adjusted total revenue and adjusted net income to the comparable GAAP measures. These adjusted measures are used in the calculation of our adjusted net interest yield and adjusted TIER.
Table 34: Adjusted Financial Measures—Income Statement
Three Months Ended August 31, | ||||||||
(Dollars in thousands) | 2020 | 2019 | ||||||
Adjusted interest expense: | ||||||||
Interest expense | $ | (179,976 | ) | $ | (213,271 | ) | ||
Include: Derivative cash settlements interest expense(1) | (26,972 | ) | (11,043 | ) | ||||
Adjusted interest expense | $ | (206,948 | ) | $ | (224,314 | ) | ||
Adjusted net interest income: | ||||||||
Net interest income | $ | 99,608 | $ | 76,744 | ||||
Include: Derivative cash settlements interest expense(1) | (26,972 | ) | (11,043 | ) | ||||
Adjusted net interest income | $ | 72,636 | $ | 65,701 | ||||
Adjusted total revenue: | ||||||||
Total revenue | $ | 103,124 | $ | 87,685 | ||||
Include: Derivative cash settlements interest expense(1) | (26,972 | ) | (11,043 | ) | ||||
Adjusted total revenue | $ | 76,152 | $ | 76,642 | ||||
Adjusted net income: | ||||||||
Net income (loss) | $ | 144,587 | $ | (324,079 | ) | |||
Exclude: Derivative forward value gains (losses)(2) | 87,248 | (384,682 | ) | |||||
Adjusted net income | $ | 57,339 | $ | 60,603 | ||||
____________________________
(1)Represents the net periodic contractual interest amount for our interest-rate swaps for the reporting period.
(2)Represents the change in fair value of our interest rate swaps during the reporting period due to changes in expected future interest rates over the remaining life of our derivative contracts.
We primarily fund our loan portfolio through the issuance of debt. However, we use derivatives as a supplemental source of funding and to economically hedge the interest rate risk associated with our loan portfolio. We therefore consider the interest expense incurred on our derivatives to be part of funding cost in addition to the interest expense on our debt. As such, we add derivative cash settlements interest expense to our reported interest expense to derive our adjusted interest expense and
46
adjusted net interest income. We exclude the unrealized derivative forward value gains and losses from our adjusted total revenue and adjusted net income.
TIER and Adjusted TIER
Table 35 displays the calculation of our TIER and adjusted TIER for the three months ended August 31, 2020 and 2019.
Table 35: TIER and Adjusted TIER
Three Months Ended August 31, | ||||||
2020 | 2019 | |||||
TIER (1) | 1.80 | — | ||||
Adjusted TIER (2) | 1.28 | 1.27 | ||||
____________________________
(1) TIER is calculated based on our net income (loss) plus interest expense for the period divided by interest expense for the period.
(2) Adjusted TIER is calculated based on adjusted net income (loss) plus adjusted interest expense for the period divided by adjusted interest expense for the period.
Debt-to-Equity and Adjusted Debt-to-Equity
Table 36 provides a reconciliation between our total liabilities and total equity and the adjusted amounts used in the calculation of our adjusted debt-to-equity ratio as of August 31, 2020 and May 31, 2020. As indicated in Table 36, subordinated debt is treated in the same manner as equity in calculating our adjusted-debt-to-equity ratio.
Table 36: Adjusted Financial Measures—Balance Sheet
(Dollars in thousands) | August 31, 2020 | May 31, 2020 | ||||||
Total liabilities | $ | 27,531,117 | $ | 27,508,783 | ||||
Exclude: | ||||||||
Derivative liabilities | 1,165,585 | 1,258,459 | ||||||
Debt used to fund loans guaranteed by RUS | 144,891 | 146,764 | ||||||
Subordinated deferrable debt | 986,166 | 986,119 | ||||||
Subordinated certificates | 1,298,845 | 1,339,618 | ||||||
Adjusted total liabilities | $ | 23,935,630 | $ | 23,777,823 | ||||
Total equity | $ | 731,504 | $ | 648,822 | ||||
Exclude: | ||||||||
Prior fiscal year-end cumulative derivative forward value losses(1) | (1,088,982 | ) | (354,704 | ) | ||||
Current year derivative forward value gains (losses)(1) | 87,248 | (734,278 | ) | |||||
Period-end cumulative derivative forward value losses(1) | (1,001,734 | ) | (1,088,982 | ) | ||||
Accumulated other comprehensive income attributable to derivatives(2) | 2,025 | 2,130 | ||||||
Subtotal | (999,709 | ) | (1,086,852 | ) | ||||
Include: | ||||||||
Subordinated deferrable debt | 986,166 | 986,119 | ||||||
Subordinated certificates | 1,298,845 | 1,339,618 | ||||||
Subtotal | 2,285,011 | 2,325,737 | ||||||
Adjusted total equity | $ | 4,016,225 | $ | 4,061,411 | ||||
____________________________
(1) Represents consolidated total derivative forward value gains (losses).
(2) Represents the AOCI amount related to derivatives. See “Note 10—Equity” for the additional components of AOCI.
47
Table 37 displays the calculations of our debt-to-equity and adjusted debt-to-equity ratios as of August 31, 2020 and May 31, 2020.
Table 37: Debt-to-Equity Ratio and Adjusted Debt-to-Equity Ratio
(Dollars in thousands) | August 31, 2020 | May 31, 2020 | ||||||
Debt-to equity ratio: | ||||||||
Total liabilities | $ | 27,531,117 | $ | 27,508,783 | ||||
Total equity | 731,504 | 648,822 | ||||||
Debt-to-equity ratio (1) | 37.64 | 42.40 | ||||||
Adjusted debt-to-equity ratio: | ||||||||
Adjusted total liabilities(2) | $ | 23,935,630 | $ | 23,777,823 | ||||
Adjusted total equity(2) | 4,016,225 | 4,061,411 | ||||||
Adjusted debt-to-equity ratio (3) | 5.96 | 5.85 | ||||||
____________________________
(1) Calculated based on total liabilities at period end of the period divided by total equity at period end.
(2) See Table 36 above for details on the calculation of these non-GAAP adjusted measures and the reconciliation to the most comparable GAAP measures.
(3) Calculated based on adjusted total liabilities at period end divided by adjusted total equity at period end.
Members’ Equity
Members’ equity represents equity attributable to CFC members. Table 38 provides a reconciliation of members’ equity to total CFC equity as of August 31, 2020 and May 31, 2020.
Table 38: Members’ Equity
(Dollars in thousands) | August 31, 2020 | May 31, 2020 | ||||||
Members’ equity: | ||||||||
Total CFC equity | $ | 706,609 | $ | 626,121 | ||||
Exclude: | ||||||||
Accumulated other comprehensive loss | (1,827 | ) | (1,910 | ) | ||||
Period-end cumulative derivative forward value losses attributable to CFC(1) | (992,956 | ) | (1,079,739 | ) | ||||
Subtotal | (994,783 | ) | (1,081,649 | ) | ||||
Members’ equity | $ | 1,701,392 | $ | 1,707,770 | ||||
____________________________
(1)Represents period-end cumulative derivative forward value losses for CFC only, as total CFC equity does not include the noncontrolling interests of the variable interest entities NCSC and RTFC, which we are required to consolidate. We report the separate results of operations for CFC in “Note 15—Business Segments.” The period-end cumulative derivative forward value losses total amounts as of August 31, 2020 and May 31, 2020 are presented above in Table 36.
48
Item 1. | Financial Statements |
Page | |||
49
NATIONAL RURAL UTILITIES COOPERATIVE FINANCE CORPORATION
CONSOLIDATED STATEMENTS OF OPERATIONS
(UNAUDITED)
Three Months Ended August 31, | ||||||||
(Dollars in thousands) | 2020 | 2019 | ||||||
Interest income | $ | 279,584 | $ | 290,015 | ||||
Interest expense | (179,976 | ) | (213,271 | ) | ||||
Net interest income | 99,608 | 76,744 | ||||||
Provision for credit losses | (326 | ) | (30 | ) | ||||
Net interest income after provision for credit losses | 99,282 | 76,714 | ||||||
Non-interest income: | ||||||||
Fee and other income | 3,516 | 10,941 | ||||||
Derivative gains (losses) | 60,276 | (395,725 | ) | |||||
Investment securities gains | 4,659 | 1,620 | ||||||
Total non-interest income | 68,451 | (383,164 | ) | |||||
Non-interest expense: | ||||||||
Salaries and employee benefits | (13,133 | ) | (12,942 | ) | ||||
Other general and administrative expenses | (9,530 | ) | (12,387 | ) | ||||
Other non-interest expense | (332 | ) | 7,179 | |||||
Total non-interest expense | (22,995 | ) | (18,150 | ) | ||||
Income (loss) before income taxes | 144,738 | (324,600 | ) | |||||
Income tax (provision) benefit | (151 | ) | 521 | |||||
Net income (loss) | 144,587 | (324,079 | ) | |||||
Less: Net (income) loss attributable to noncontrolling interests | (171 | ) | 1,657 | |||||
Net income (loss) attributable to CFC | $ | 144,416 | $ | (322,422 | ) | |||
The accompanying Notes to Consolidated Financial Statements (Unaudited) are an integral part of these statements. | ||||||||
50
NATIONAL RURAL UTILITIES COOPERATIVE FINANCE CORPORATION
CONSOLIDATED STATEMENTS OF COMPREHENSIVE INCOME (LOSS)
(UNAUDITED)
Three Months Ended August 31, | ||||||||
(Dollars in thousands) | 2020 | 2019 | ||||||
Net income (loss) | $ | 144,587 | $ | (324,079 | ) | |||
Other comprehensive income (loss): | ||||||||
Reclassification of derivative gains to earnings | (105 | ) | (112 | ) | ||||
Defined benefit plan adjustments | 188 | 145 | ||||||
Other comprehensive income | 83 | 33 | ||||||
Total comprehensive income (loss) | 144,670 | (324,046 | ) | |||||
Less: Total comprehensive (income) loss attributable to noncontrolling interests | (171 | ) | 1,657 | |||||
Total comprehensive income (loss) attributable to CFC | $ | 144,499 | $ | (322,389 | ) | |||
The accompanying Notes to Consolidated Financial Statements (Unaudited) are an integral part of these statements. | ||||||||
51
NATIONAL RURAL UTILITIES COOPERATIVE FINANCE CORPORATION
CONSOLIDATED BALANCE SHEETS
(UNAUDITED)
(Dollars in thousands) | August 31, 2020 | May 31, 2020 | ||||||
Assets: | ||||||||
Cash and cash equivalents | $ | 347,818 | $ | 671,372 | ||||
Restricted cash (1) | 9,376 | 8,647 | ||||||
Total cash, cash equivalents and restricted cash | 357,194 | 680,019 | ||||||
Investment securities: | ||||||||
Equity securities, at fair value | 62,266 | 60,735 | ||||||
Debt securities trading, at fair value | 527,526 | 309,400 | ||||||
Total investment securities | 589,792 | 370,135 | ||||||
Loans to members | 26,928,877 | 26,702,380 | ||||||
Less: Allowance for credit losses | (57,351 | ) | (53,125 | ) | ||||
Loans to members, net | 26,871,526 | 26,649,255 | ||||||
Accrued interest receivable | 104,762 | 117,138 | ||||||
Other receivables | 39,701 | 41,099 | ||||||
Fixed assets, net | 88,245 | 89,137 | ||||||
Derivative assets | 167,463 | 173,195 | ||||||
Other assets | 43,938 | 37,627 | ||||||
Total assets | $ | 28,262,621 | $ | 28,157,605 | ||||
Liabilities: | ||||||||
Accrued interest payable | $ | 182,166 | $ | 139,619 | ||||
Debt outstanding: | ||||||||
Short-term borrowings | 4,553,491 | 3,961,985 | ||||||
Long-term debt | 19,181,520 | 19,712,024 | ||||||
Subordinated deferrable debt | 986,166 | 986,119 | ||||||
Members’ subordinated certificates: | ||||||||
Membership subordinated certificates | 630,483 | 630,483 | ||||||
Loan and guarantee subordinated certificates | 439,742 | 482,965 | ||||||
Member capital securities | 228,620 | 226,170 | ||||||
Total members’ subordinated certificates | 1,298,845 | 1,339,618 | ||||||
Total debt outstanding | 26,020,022 | 25,999,746 | ||||||
Patronage capital retirement payable | 57,835 | — | ||||||
Deferred income | 57,225 | 59,303 | ||||||
Derivative liabilities | 1,165,585 | 1,258,459 | ||||||
Other liabilities | 48,284 | 51,656 | ||||||
Total liabilities | 27,531,117 | 27,508,783 | ||||||
Equity: | ||||||||
CFC equity: | ||||||||
Retained equity | 708,436 | 628,031 | ||||||
Accumulated other comprehensive loss | (1,827 | ) | (1,910 | ) | ||||
Total CFC equity | 706,609 | 626,121 | ||||||
Noncontrolling interests | 24,895 | 22,701 | ||||||
Total equity | 731,504 | 648,822 | ||||||
Total liabilities and equity | $ | 28,262,621 | $ | 28,157,605 | ||||
____________________________ | ||||||||
(1) Restricted cash consists primarily of member funds held in escrow for certain specifically designed cooperative programs. | ||||||||
The accompanying Notes to Consolidated Financial Statements (Unaudited) are an integral part of these statements. | ||||||||
52
NATIONAL RURAL UTILITIES COOPERATIVE FINANCE CORPORATION
CONSOLIDATED STATEMENTS OF CHANGES IN EQUITY
(UNAUDITED)
Three Months Ended August 31, 2020 | ||||||||||||||||||||||||||||||||||||
(Dollars in thousands) | Membership Fees and Educational Fund | Patronage Capital Allocated | Members’ Capital Reserve | Unallocated Net (Loss) Income | CFC Retained Equity | Accumulated Other Comprehensive Income (Loss) | Total CFC Equity | Non-controlling Interests | Total Equity | |||||||||||||||||||||||||||
Balance as of May 31, 2020 | $ | 3,193 | $ | 894,066 | $ | 807,320 | $ | (1,076,548 | ) | $ | 628,031 | $ | (1,910 | ) | $ | 626,121 | $ | 22,701 | $ | 648,822 | ||||||||||||||||
Cumulative-effect adjustment from adoption of new accounting standard | — | — | — | (3,900 | ) | (3,900 | ) | — | (3,900 | ) | — | (3,900 | ) | |||||||||||||||||||||||
Balance as of June 1, 2020 | 3,193 | 894,066 | 807,320 | (1,080,448 | ) | 624,131 | (1,910 | ) | 622,221 | 22,701 | 644,922 | |||||||||||||||||||||||||
Net income | — | — | — | 144,416 | 144,416 | — | 144,416 | 171 | 144,587 | |||||||||||||||||||||||||||
Other comprehensive income | — | — | — | — | — | 83 | 83 | — | 83 | |||||||||||||||||||||||||||
Patronage capital retirement | — | (59,857 | ) | — | — | (59,857 | ) | — | (59,857 | ) | — | (59,857 | ) | |||||||||||||||||||||||
Other | (254 | ) | — | — | — | (254 | ) | — | (254 | ) | 2,023 | 1,769 | ||||||||||||||||||||||||
Balance as of August 31, 2020 | $ | 2,939 | $ | 834,209 | $ | 807,320 | $ | (936,032 | ) | $ | 708,436 | $ | (1,827 | ) | $ | 706,609 | $ | 24,895 | $ | 731,504 | ||||||||||||||||
Three Months Ended August 31, 2019 | ||||||||||||||||||||||||||||||||||||
(Dollars in thousands) | Membership Fees and Educational Fund | Patronage Capital Allocated | Members’ Capital Reserve | Unallocated Net Loss | CFC Retained Equity | Accumulated Other Comprehensive (Loss) Income | Total CFC Equity | Non-controlling Interests | Total Equity | |||||||||||||||||||||||||||
Balance as of May 31, 2019 | $ | 2,982 | $ | 860,578 | $ | 759,097 | $ | (345,775 | ) | $ | 1,276,882 | $ | (147 | ) | $ | 1,276,735 | $ | 27,147 | $ | 1,303,882 | ||||||||||||||||
Net loss | — | — | — | (322,422 | ) | (322,422 | ) | — | (322,422 | ) | (1,657 | ) | (324,079 | ) | ||||||||||||||||||||||
Other comprehensive income | — | — | — | — | — | 33 | 33 | — | 33 | |||||||||||||||||||||||||||
Patronage capital retirement | — | (62,822 | ) | — | — | (62,822 | ) | — | (62,822 | ) | (62,822 | ) | ||||||||||||||||||||||||
Other | (306 | ) | — | — | — | (306 | ) | — | (306 | ) | 1,720 | 1,414 | ||||||||||||||||||||||||
Balance as of August 31, 2019 | $ | 2,676 | $ | 797,756 | $ | 759,097 | $ | (668,197 | ) | $ | 891,332 | $ | (114 | ) | $ | 891,218 | $ | 27,210 | $ | 918,428 | ||||||||||||||||
The accompanying Notes to Consolidated Financial Statements (Unaudited) are an integral part of these statements. | ||||||||||||||||||||||||||||||||||||
53
NATIONAL RURAL UTILITIES COOPERATIVE FINANCE CORPORATION
CONSOLIDATED STATEMENTS OF CASH FLOWS
(UNAUDITED)
Three Months Ended August 31, | ||||||||
(Dollars in thousands) | 2020 | 2019 | ||||||
Cash flows from operating activities: | ||||||||
Net income (loss) | $ | 144,587 | $ | (324,079 | ) | |||
Adjustments to reconcile net income to net cash provided by operating activities: | ||||||||
Amortization of deferred loan fees | (2,460 | ) | (2,332 | ) | ||||
Amortization of debt issuance costs and deferred charges | 2,172 | 2,357 | ||||||
Amortization of discount on long-term debt | 2,876 | 2,626 | ||||||
Amortization of issuance costs for bank revolving lines of credit | 1,118 | 1,268 | ||||||
Depreciation and amortization | 1,819 | 2,374 | ||||||
Provision for credit losses | 326 | 30 | ||||||
Gain on sale of land | — | (7,713 | ) | |||||
Unrealized gains on equity and debt securities | (4,366 | ) | (1,620 | ) | ||||
Derivative forward value losses | (87,248 | ) | 384,682 | |||||
Changes in operating assets and liabilities: | ||||||||
Accrued interest receivable | 12,376 | 485 | ||||||
Accrued interest payable | 42,546 | 50,934 | ||||||
Deferred income | 383 | (43 | ) | |||||
Other | (10,102 | ) | (9,160 | ) | ||||
Net cash provided by operating activities | 104,027 | 99,809 | ||||||
Cash flows from investing activities: | ||||||||
Advances on loans, net | (226,245 | ) | (382,936 | ) | ||||
Investment in fixed assets | (837 | ) | (3,087 | ) | ||||
Proceeds from sale of land | — | 21,618 | ||||||
Purchase of trading securities | (245,095 | ) | — | |||||
Proceeds from sales and maturities of trading securities | 30,097 | — | ||||||
Proceeds from redemption of equity securities | — | 25,000 | ||||||
Purchases of held-to-maturity debt securities | — | (23,650 | ) | |||||
Proceeds from maturities of held-to-maturity debt securities | — | 19,533 | ||||||
Net cash used in investing activities | (442,080 | ) | (343,522 | ) | ||||
Cash flows from financing activities: | ||||||||
Proceeds from short-term borrowings, net | 585,021 | 355,750 | ||||||
Proceeds from short-term borrowings with original maturity > 90 days | 836,241 | 679,062 | ||||||
Repayments of short-term borrowings with original maturity > 90 days | (829,756 | ) | (614,892 | ) | ||||
Proceeds from issuance of long-term debt, net of discount and issuance costs | 8,050 | 94,256 | ||||||
Payments for retirement of long-term debt | (543,555 | ) | (215,751 | ) | ||||
Payments for issuance costs for subordinated deferrable debt | — | (84 | ) | |||||
Proceeds from issuance of members’ subordinated certificates | 3,257 | 1,289 | ||||||
Payments for retirement of members’ subordinated certificates | (44,030 | ) | (1,933 | ) | ||||
Net cash provided by financing activities | 15,228 | 297,697 | ||||||
Net increase (decrease) in cash, cash equivalents and restricted cash | (322,825 | ) | 53,984 | |||||
Beginning cash, cash equivalents and restricted cash | 680,019 | 186,204 | ||||||
Ending cash, cash equivalents and restricted cash | 357,194 | 240,188 | ||||||
Supplemental disclosure of cash flow information: | ||||||||
Cash paid for interest | $ | 129,017 | $ | 155,330 | ||||
The accompanying Notes to Consolidated Financial Statements (Unaudited) are an integral part of these statements. | ||||||||
54
NATIONAL RURAL UTILITIES COOPERATIVE FINANCE CORPORATION
NOTES TO CONSOLIDATED FINANCIAL STATEMENTS
(UNAUDITED)
NOTE 1—SUMMARY OF SIGNIFICANT ACCOUNTING POLICIES |
The Company
National Rural Utilities Cooperative Finance Corporation (“CFC”) is a member-owned cooperative association incorporated under the laws of the District of Columbia in April 1969. CFC’s principal purpose is to provide its members with financing to supplement the loan programs of the Rural Utilities Service (“RUS”) of the United States Department of Agriculture (“USDA”). CFC makes loans to its rural electric members so they can acquire, construct and operate electric distribution systems, electric generation and transmission (“power supply”) systems and related facilities. CFC also provides its members with credit enhancements in the form of letters of credit and guarantees of debt obligations. As a cooperative, CFC is owned by and exclusively serves its membership, which consists of not-for-profit entities or subsidiaries or affiliates of not-for-profit entities. CFC is exempt from federal income taxes.
Principles of Consolidation and Basis of Presentation
The accompanying unaudited interim consolidated financial statements have been prepared in accordance with accounting principles generally accepted in the United States (“GAAP”). These consolidated financial statements include the accounts of CFC, variable interest entities (“VIEs”) where CFC is the primary beneficiary and subsidiary entities created and controlled by CFC to hold foreclosed assets. National Cooperative Services Corporation (“NCSC”) and Rural Telephone Finance Cooperative (“RTFC”) are VIEs that are required to be consolidated by CFC. NCSC is a taxable member-owned cooperative that may provide financing to members of CFC, government or quasi-government entities which own electric utility systems that meet the Rural Electrification Act definition of “rural,” and for-profit and nonprofit entities that are owned, operated or controlled by, or provide significant benefits to certain members of CFC. RTFC is a taxable Subchapter T cooperative association that provides financing for its rural telecommunications members and their affiliates. CFC has not had entities that held foreclosed assets since fiscal year 2017. All intercompany balances and transactions have been eliminated.
The preparation of financial statements in conformity with GAAP requires management to make estimates and assumptions that affect the reported amounts and related disclosures during the period. Management’s most significant estimates and assumptions involve determining the allowance for credit losses and the fair value of financial assets and liabilities. Actual results could differ from these estimates. We believe these financial statements reflect all adjustments of a normal, recurring nature that are, in the opinion of management, necessary for the fair presentation of the results for the interim period. The results of operations in the interim financial statements are not necessarily indicative of results that may be expected for the full fiscal year. Certain reclassifications have been made to prior periods to conform to the current presentation. Unless stated otherwise, references to “we,” “our” or “us” relate to CFC and its consolidated entities.
Risks and Uncertainties
We have considered the impact of the emergence in 2019 and continued spread of a novel strain of coronavirus that causes coronavirus disease 2019 (“COVID-19”), which was declared a global pandemic by the World Health Organization (“WHO”) in March 2020, on our consolidated financial statements. Although the effects of COVID-19 and the response to the virus have negatively impacted financial markets and overall economic conditions, we have been able to navigate the challenges of the pandemic reasonably well. We have been monitoring developments closely, and the future impact of COVID-19 on our operations is highly uncertain and cannot be predicted. The extent of the impact of COVID-19 on our operational and financial performance will depend on certain developments, including, among others, the duration and severity of the COVID-19 pandemic, the ultimate impact on our members, potential further disruption and deterioration in the corporate debt markets and additional, or extended, federal, state and local government orders and regulations that might be imposed in response to the pandemic, all of which are uncertain.
55
NATIONAL RURAL UTILITIES COOPERATIVE FINANCE CORPORATION
NOTES TO CONSOLIDATED FINANCIAL STATEMENTS
(UNAUDITED)
New Accounting Standards Adopted in Fiscal Year 2021
Fair Value Measurement—Changes to the Disclosure Requirements for Fair Value Measurement
On June 1, 2020, we adopted Accounting Standards Update (“ASU”) 2018-13, Fair Value Measurement (Topic 820): Disclosure Framework—Changes to the Disclosure Requirements for Fair Value Measurement, which removes, adds and modifies certain disclosure requirements on fair value measurements. The adoption of this guidance, which resulted only in certain changes to the fair value measurement disclosures presented in “Note 12—Fair Value Measurement” did not otherwise affect our consolidated financial statements.
Financial Instruments—Credit Losses: Measurement of Credit Losses on Financial Instruments
On June 1, 2020, we adopted ASU 2016-13, Financial Instruments—Credit Losses (Topic 326): Measurement of Credit Losses on Financial Instruments, which replaces the incurred loss methodology for estimating credit losses with an expected loss methodology that is referred to as the current expected credit loss (“CECL”) model. The incurred loss model delayed the recognition of credit losses until it was probable that a loss had occurred, while the CECL model requires the immediate recognition of expected credit losses over the contractual term, adjusted as appropriate for estimated prepayments, of financial instruments that fall within the scope of CECL at the date of origination or purchase of the financial instrument. The CECL model, which is applicable to the measurement of credit losses on financial assets measured at amortized cost and certain off-balance sheet credit exposures, affects our estimates of the allowance for credit losses for our loan portfolio and our off-balance sheet credit exposures related to unadvanced loan commitments and financial guarantees. In measuring lifetime expected credit losses, management is required to take into consideration relevant information about past events, including historical experience, current conditions, and reasonable and supportable forecasts that affect the collectibility of the reported amount of the financial instrument.
The adoption of CECL resulted in an increase in our allowance for credit losses for our loan portfolio of $4 million and a corresponding decrease to retained earnings of $4 million recorded as a cumulative-effect adjustment. The impact on the allowance for credit losses for our off-balance sheet credit exposures related to unadvanced loan commitments and financial guarantees was not material. The increase in the allowance for credit losses for our loan portfolio was attributable to the transition to measuring the allowance based on expected credit losses over the remaining contractual term of loans in our portfolio as required under the CECL model, whereas the allowance under the incurred model did not consider the remaining contractual term of our loans. The transition adjustment was primarily driven by an increase in the allowances for CFC distribution and CFC power supply loans, which have a much longer remaining contractual term than the estimated loss emergence period of five years we used in estimating probable losses in our loan portfolio under the incurred loss model.
While the adoption of CECL had no impact on our earnings, subsequent to our adoption on June 1, 2020, lifetime expected credit losses for newly recognized loans, unadvanced loan commitments and financial guarantees, as well as changes during the period in our estimate of lifetime expected credit losses for existing financial instruments subject to CECL, will be recognized in earnings. In connection with our adoption of CECL, we have provided an update to certain of our significant accounting policies below under “Updates to Significant Accounting Policies.” We present the expanded credit quality disclosures required under CECL for financial instruments measured at amortized cost in “Note 4—Loans” and “Note 5—Allowance for Credit Losses.” Amounts in periods prior to our adoption of CECL on June 1, 2020, continue to be reported in accordance with previously applicable GAAP.
56
NATIONAL RURAL UTILITIES COOPERATIVE FINANCE CORPORATION
NOTES TO CONSOLIDATED FINANCIAL STATEMENTS
(UNAUDITED)
New Accounting Standards Issued But Not Yet Adopted
Reference Rate Reform
On March 12, 2020, the Financial Accounting Standards Board (“FASB”) issued ASU 2020-04, Reference Rate Reform (Topic 848): Facilitation of the Effects of Reference Rate Reform on Financial Reporting, which provides temporary optional expedients and exceptions for applying GAAP on contracts, hedging relationships and other transactions subject to modification due to the expected discontinuance of the London Interbank Offered Rate (“LIBOR”) and other reference rate reform changes to ease the potential accounting and financial burdens related to the expected transition in market reference rates. This guidance permits entities to elect not to apply certain modification accounting requirements to contracts affected by reference rate transition, if certain criteria are met. An entity that makes this election would not be required to remeasure modified contracts at the modification date or reassess a previous accounting determination. The guidance was effective upon issuance on March 12, 2020, and can generally be applied through December 31, 2022. We expect to apply certain of the practical expedients and are in the process of evaluating the timing and application of those elections. Based on our current assessment, we do not believe that the application of this guidance will have a material impact on our consolidated financial statements.
Updates to Significant Accounting Policies
Pursuant to our June 1, 2020 adoption of the CECL accounting standard, we have provided an update to the significant accounting policies presented below.
Loans to Members
We originate loans to members and classify loans that management has the intent and ability to hold for the foreseeable future or until maturity or payoff as held for investment. Loans classified as held for investment are reported based on the unpaid principal balance, net of principal charge-offs, and deferred loan origination costs.
As permitted by CECL, we elected to continue reporting accrued interest on loans separately on our consolidated balance sheets as a component of the line item accrued interest receivable rather than as a component of loans to member. Accrued interest receivable amounts generally represent three months or less of accrued interest on loans outstanding. Because our policy is to write off past due accrued interest receivable in a timely manner, we elected not to measure an allowance for credit losses for accrued interest receivable on loans outstanding, which totaled $86 million and $96 million as of August 31, 2020 and May 31, 2020, respectively. We also elected to exclude accrued interest receivable from the credit quality disclosures required under CECL.
Interest Income
Interest income on performing loans is accrued and recognized as interest income based on the contractual rate of interest.
Loan origination costs and nonrefundable loan fees that meet the definition of loan origination fees are deferred and recognized in interest income as yield adjustments over the period to maturity of the loan using the effective interest method.
Troubled Debt Restructurings
A loan modification is considered a troubled debt restructuring (“TDR”) if the borrower is experiencing financial difficulties and a concession is granted to the borrower that we would not otherwise consider. Under CECL, we are required to estimate an allowance for lifetime expected credit losses for TDR loans. As discussed below under “Allowance for Credit Losses—Loan Portfolio,” TDR loans are evaluated on an individual basis in estimating expected credit losses. Credit losses for anticipated TDRs are accounted for similarly to TDRs and are identified when there is a reasonable expectation that a TDR
57
NATIONAL RURAL UTILITIES COOPERATIVE FINANCE CORPORATION
NOTES TO CONSOLIDATED FINANCIAL STATEMENTS
(UNAUDITED)
will be executed with the borrower and when we expect the modification to affect the timing or amount of payments and/or the payment term.
We generally classify TDR loans as nonperforming and place the loan on nonaccrual status, although in many cases such loans were already classified as nonperforming prior to modification. These loans may be returned to performing status and the accrual of interest resumed if the borrower performs under the modified terms for an extended period of time, and we expect the borrower to continue to perform in accordance with the modified terms. In certain limited circumstances in which a TDR loan is current at the modification date, the loan may remain on accrual status at the time of modification.
Nonperforming Loans
We classify loans as nonperforming when contractual principal or interest is 90 days past due or when we believe the collection of principal and interest in full is not reasonably assured. When a loan is classified as nonperforming, we generally place the loan on nonaccrual status. Interest accrued but not collected at the date a loan is placed on nonaccrual status is reversed against current period interest income. Interest income on nonaccrual loans is subsequently recognized only upon the receipt of cash payments. However, if we believe the ultimate collectibility of the loan principal is in doubt, cash received is applied against the principal balance of the loan. Nonaccrual loans generally are returned to accrual status when principal and interest becomes and remains current for a specified period and repayment of the remaining contractual principal and interest is reasonably assured.
Charge-Offs
We charge off loans or a portion of a loan when we determine that the loan is uncollectible. The charge-off of uncollectible principal amounts result in a reduction to the allowance for credit losses for our loan portfolio. Recoveries of previously charged off principal amounts result in an increase to the allowance.
Allowance for Credit Losses—Loan Portfolio
We maintain an allowance for credit losses for our loan portfolio that represents management’s current estimate of expected credit losses over the remaining contractual term, adjusted as appropriate for estimated prepayments, of loans in our loan portfolio as of each balance sheet date. The allowance for our loan portfolio is reported on our consolidated balance sheet as a valuation account that is deducted from loans to members to present the net amount we expect to collect over the life of our loans. We are required to immediately recognize an allowance for expected credit losses upon origination of a loan. Adjustments to the allowance each period for changes in our estimate of lifetime expected credit losses for existing loans, or for newly originated loans, are recognized in earnings through the provision for credit losses presented on our consolidated statements of operations.
We estimate our allowance for lifetime expected credit losses for our loan portfolio using a using a probability of default/loss given default methodology. Our allowance for credit losses consists of a collective allowance and an asset-specific allowance. The collective allowance is established for loans in our portfolio that share similar risk characteristics and are therefore evaluated on a collective, or pool, basis in measuring expected credit losses. The asset-specific allowance is established for loans in our portfolio that do not share similar risk characteristics with other loans in our portfolio and are therefore evaluated on an individual basis in measuring expected credit losses. Expected credit losses are estimated based on historical experience, current conditions and forecasts, if applicable, that affect the collectibility of the reported amount.
Since inception in 1969, CFC has experienced limited defaults and losses as the utility sector generally tends to be less sensitive to changes in the economy than other sectors largely due to the essential nature of the service provided. The losses we have incurred were not tied to economic factors, but rather to distinct operating issues related to each borrower. Given that our loss experience has not correlated to specific underlying macroeconomic variables, such as U.S. unemployment rates or gross national domestic (“GDP”) growth, we have not made adjustments to our historical loss rates for any
58
NATIONAL RURAL UTILITIES COOPERATIVE FINANCE CORPORATION
NOTES TO CONSOLIDATED FINANCIAL STATEMENTS
(UNAUDITED)
forecasted period. We consider the need, however, to adjust our historical loss information for differences in the specific characteristics of our existing loan portfolio based on an evaluation of relative qualitative factors, such as differences in the composition of our loan portfolio, our underwriting standards, problem loan trends, the quality of our credit review function, the regulatory environment and other pertinent external factors.
Collective Allowance
We employ a quantitative methodology and a qualitative framework to measure the collective component of our allowance for expected credit losses. The first element in our quantitative methodology involves the segmentation of our loan into loan pools that share similar risk characteristics. We divide our portfolio into segments that reflect the member borrower type, which is based on the utility sector of the borrower because the key operational, infrastructure, regulatory, environmental, customer and financial risks of each sector are similar in nature. Our primary member borrower types consist of CFC electric distribution, CFC electric power supply, CFC statewide and associate, NCSC and RTFC telecommunications. Our portfolio segments align with the sectors generally seen in the utilities industry. We further stratify each portfolio into loan pools based on our internal borrower risk ratings, as our borrower risk ratings provide important information on the collectibility of each of our loan portfolio segments. We then apply loss factors, consisting of the probability of default and loss given default, to the scheduled loan-level amortization amounts over the life of the loans for each of our loan pools. Below we discuss the source and basis for the key inputs, which include borrower risk ratings and the loss factors, in measuring expected credit losses for our loan portfolio.
• | Borrower Risk Ratings: We evaluate each borrower and loan facility in our loan portfolio and assign internal borrower and loan facility risk ratings based on consideration of a number of quantitative and qualitative factors. Each risk rating is reassessed annually following the receipt of the borrower’s audited financial statements; however, interim risk-rating adjustments may occur as a result of updated information affecting a borrower’s ability to fulfill its obligations or other significant developments and trends. Our internally assigned borrower risk ratings are intended to assess the general credit worthiness of the borrower and probability of default. We use our internal borrower risk ratings, which we map to the equivalent credit ratings by external rating agencies, to differentiate risk within each of our portfolio segments and loan pools. We provide additional information on our borrower risk ratings below in “Note 4—Loans.” |
• | Probability of Default: The probability of default, or default rate, represents the likelihood that a borrower will default over a particular time horizon. Because of our limited default history, we utilize third-party default data for the utility sector as a proxy to estimate default rates for each of our loan pools. The third-party default data provides historical default rates, based on credit ratings and remaining maturities of outstanding bonds, for the utility sector. Based on the mapping and alignment of our internal borrower risk ratings to equivalent credit ratings provided in the third-party utility default table, we apply the corresponding cumulative default rates to the scheduled amortization amounts over the remaining term of the loans in each of our loan pools. |
• | Loss Given Default: The loss given default, or loss severity, represents the estimated loss, net of recoveries, on a loan that would be realized in the event of a borrower default. While we utilize third-party default data, we utilize our lifetime historical loss experience to estimate loss given default, or the recovery rate, for each of our loan portfolio segments. We believe our internal historical loss severity rates provide a more reliable estimate than third-party loss severity data due to the organizational structure and operating environment of rural utility cooperatives, our lending practice of generally requiring a senior security position on the assets and revenues of borrowers for long-term loans, the investment our member borrowers have in CFC and therefore the collaborative approach we generally take in working with members in the event that a default occurs. |
59
NATIONAL RURAL UTILITIES COOPERATIVE FINANCE CORPORATION
NOTES TO CONSOLIDATED FINANCIAL STATEMENTS
(UNAUDITED)
In addition to the quantitative methodology used in our collective measurement of expected credit losses, management performs a qualitative evaluation and analyses of relevant factors, such as changes in risk-management practices, current and past underwriting standards, specific industry issues and trends and other subjective factors. Based on our assessment, we did not make a qualitative adjustment to the collective allowance for credit losses measured under our quantitative methodology as of August 31, 2020 or at adoption of CECL on June 1, 2020.
Asset-Specific Allowance
We generally consider nonperforming loans as well as loans that have been or are anticipated to be modified under a troubled debt restructuring for individual evaluation given the risk characteristics of such loans. Factors we consider in measuring the extent of expected credit loss include the payment status, the collateral value, the borrower’s financial condition, guarantor support, the probability of collecting scheduled principal and interest payments when due, anticipated modifications of payment structure or term for troubled borrowers, and recoveries if they can be reasonably estimated. We measure the expected credit loss as the difference between the amortized cost basis in the loan and the present value of the expected future cash flows from the borrower which is generally discounted at the loan’s effective interest rate, or the fair value of the collateral, if the loan is collateral dependent.
Reserve for Credit Losses—Off-Balance Sheet Credit Exposures
We also maintain a reserve for credit losses for our off-balance sheet credit exposures related to unadvanced loan commitments and financial guarantees. Because our business processes and credit risks associated with our off-balance sheet credit exposures are essentially the same as for our loans, we utilize similar processes to measure expected credit losses over the contractual period of our exposure to credit risk arising from these obligations. We include the reserve for expected credit losses for our off-balance sheet credit exposures as a component of other liabilities on our consolidated balance sheets.
60
NATIONAL RURAL UTILITIES COOPERATIVE FINANCE CORPORATION
NOTES TO CONSOLIDATED FINANCIAL STATEMENTS
(UNAUDITED)
NOTE 2—INTEREST INCOME AND INTEREST EXPENSE |
The following table presents the components of interest income, by interest-earning asset type, and interest expense, by debt product type, presented on our consolidated statements of operations.
Table 2.1: Interest Income and Interest Expense
Three Months Ended August 31, | ||||||||
(Dollars in thousands) | 2020 | 2019 | ||||||
Interest income: | ||||||||
Long-term fixed-rate loans(1) | $ | 263,184 | $ | 258,528 | ||||
Long-term variable-rate loans | 4,400 | 9,756 | ||||||
Line of credit loans | 8,242 | 16,033 | ||||||
Troubled debt restructuring (“TDR”) loans | 207 | 206 | ||||||
Other, net(2) | (335 | ) | (334 | ) | ||||
Total loans | 275,698 | 284,189 | ||||||
Cash, time deposits and investment securities | 3,886 | 5,826 | ||||||
Total interest income | 279,584 | 290,015 | ||||||
Interest expense:(3)(4) | ||||||||
Short-term borrowings | 4,341 | 22,822 | ||||||
Medium-term notes | 29,887 | 32,076 | ||||||
Collateral trust bonds | 62,593 | 65,381 | ||||||
Guaranteed Underwriter Program notes payable | 42,413 | 40,433 | ||||||
Farmer Mac notes payable | 13,933 | 25,074 | ||||||
Other notes payable | 87 | 254 | ||||||
Subordinated deferrable debt | 12,890 | 12,882 | ||||||
Subordinated certificates | 13,832 | 14,349 | ||||||
Total interest expense | 179,976 | 213,271 | ||||||
Net interest income | $ | 99,608 | $ | 76,744 | ||||
____________________________
(1)Includes loan conversion fees, which are generally deferred and recognized in interest income over the period to maturity using the effective interest method.
(2)Consists of late payment fees, commitment fees and net amortization of deferred loan fees and loan origination costs.
(3) Includes amortization of debt discounts and debt issuance costs, which are generally deferred and recognized as interest expense over the period to maturity using the effective interest method. Issuance costs related to dealer commercial paper, however, are recognized in interest expense immediately as incurred.
(4) Includes fees related to funding arrangements, such as up-front fees paid to banks participating in our committed bank revolving line of credit agreements. Based on the nature of the fees, the amount is either recognized immediately as incurred or deferred and recognized in interest expense ratably over the term of the arrangement.
Deferred income reported on our consolidated balance sheets of $57 million and $59 million as of August 31, 2020 and May 31, 2020, respectively, consists primarily of deferred loan conversion fees, which totaled $51 million and $53 million as of each respective date. Deferred loan conversion fees are recognized in interest income over the period to maturity using the effective interest method.
61
NATIONAL RURAL UTILITIES COOPERATIVE FINANCE CORPORATION
NOTES TO CONSOLIDATED FINANCIAL STATEMENTS
(UNAUDITED)
NOTE 3—INVESTMENT SECURITIES |
We maintain a portfolio of debt and equity securities that is intended to serve as a supplemental source of liquidity. We generally record purchases and sales of securities on the trade date. Our current equity security holdings have readily determinable fair values. Therefore, we report these securities at fair value with changes in fair value recognized in earnings as a component of non-interest income in our consolidated statements of operations. In the fourth quarter of fiscal year 2020, we transferred our debt securities from held-to-maturity to trading. As a result, our debt securities were classified as trading as of both August 31, 2020 and May 31, 2020. Debt securities classified as trading are reported at fair value with changes in fair value recognized in earnings as a component of non-interest income on our consolidated statements of operations.
Equity Securities
The following table presents the composition of our equity security holdings and the fair value as of August 31, 2020 and May 31, 2020.
Table 3.1: Investments in Equity Securities, at Fair Value
(Dollars in thousands) | August 31, 2020 | May 31, 2020 | ||||||
Equity securities, at fair value: | ||||||||
Farmer Mac—Series A and Series C non-cumulative preferred stock | $ | 57,376 | $ | 55,640 | ||||
Farmer Mac—Class A common stock | 4,890 | 5,095 | ||||||
Total equity securities, at fair value | $ | 62,266 | $ | 60,735 | ||||
We recognized net unrealized gains on our equity securities of $2 million for both the three months ended August 31, 2020 and the three months ended August 31, 2019.
On September 19, 2020, Farmer Mac redeemed all of the outstanding shares of its 5.875% Series A non-cumulative preferred stock at a redemption price of $25.00 per share, plus any declared and unpaid dividends through and including the redemption date. We held 1.2 million shares of Farmer Mac’s Series A non-cumulative preferred stock at an amortized cost of $25 per share as of the redemption date, which was equal to the per share redemption price.
Debt Securities
The following table presents the composition of our debt security holdings and the fair value as of August 31, 2020 and May 31, 2020.
62
NATIONAL RURAL UTILITIES COOPERATIVE FINANCE CORPORATION
NOTES TO CONSOLIDATED FINANCIAL STATEMENTS
(UNAUDITED)
Table 3.2: Investments in Debt Securities, at Fair Value
(Dollars in thousands) | August 31, 2020 | May 31, 2020 | ||||||
Debt securities, at fair value: | ||||||||
Certificates of deposit | $ | 5,007 | $ | 5,585 | ||||
Commercial paper | 5,993 | — | ||||||
Corporate debt securities | 454,286 | 253,153 | ||||||
Commercial mortgage-backed securities (“MBS”): | ||||||||
Agency | 7,703 | 7,655 | ||||||
Non-agency | 1,321 | 3,207 | ||||||
Total commercial MBS | 9,024 | 10,862 | ||||||
U.S. state and municipality debt securities | 8,423 | 8,296 | ||||||
Other asset-backed securities(1) | 44,793 | 31,504 | ||||||
Total debt securities, at fair value | $ | 527,526 | $ | 309,400 | ||||
____________________________
(1)Consists primarily of securities backed by auto lease loans, equipment-backed loans, auto loans and credit card loans.
We sold debt investment securities totaling $3 million and realized a gain related to the sale of these securities of less than $1 million during the three months ended August 31, 2020. We recognized net unrealized gains on our debt securities of $3 million for the three months ended August 31, 2020.
NOTE 4—LOANS |
We segregate our loan portfolio into portfolio segments based on the member class of the borrower, which consists of CFC distribution, CFC power supply, CFC statewide and associate, NCSC and RTFC. We offer both long-term and line of credit loan loans to our borrowers. Under our long-term loan facilities, a borrower may select a fixed interest rate or a variable interest rate at the time of each loan advance. Line of credit loans are revolving loan facilities and generally have a variable interest rate.
Loans to Members
Loans to members consists of total loans outstanding, which reflects the unpaid principal balance, net of charge-offs and recoveries, of loans and deferred loan origination costs. The following table presents loans to members and unadvanced loan commitments, by member class and by loan type, as of August 31, 2020 and May 31, 2020.
63
NATIONAL RURAL UTILITIES COOPERATIVE FINANCE CORPORATION
NOTES TO CONSOLIDATED FINANCIAL STATEMENTS
(UNAUDITED)
Table 4.1: Loans to Members by Member Class and Loan Type
August 31, 2020 | May 31, 2020 | |||||||||||||||
(Dollars in thousands) | Loans Outstanding | Unadvanced Commitments(1) | Loans Outstanding | Unadvanced Commitments(1) | ||||||||||||
Member class: | ||||||||||||||||
CFC: | ||||||||||||||||
Distribution | $ | 21,012,216 | $ | 8,970,802 | $ | 20,769,653 | $ | 8,992,457 | ||||||||
Power supply | 4,730,101 | 3,673,711 | 4,731,506 | 3,409,227 | ||||||||||||
Statewide and associate | 97,343 | 155,041 | 106,498 | 153,626 | ||||||||||||
Total CFC | 25,839,660 | 12,799,554 | 25,607,657 | 12,555,310 | ||||||||||||
NCSC | 681,321 | 557,550 | 697,862 | 551,674 | ||||||||||||
RTFC | 396,118 | 297,538 | 385,335 | 281,642 | ||||||||||||
Total loans outstanding(2) | 26,917,099 | 13,654,642 | 26,690,854 | 13,388,626 | ||||||||||||
Deferred loan origination costs | 11,778 | — | 11,526 | — | ||||||||||||
Loans to members | $ | 26,928,877 | $ | 13,654,642 | $ | 26,702,380 | $ | 13,388,626 | ||||||||
Loan type: | ||||||||||||||||
Long-term loans: | ||||||||||||||||
Fixed rate | $ | 24,817,328 | $ | — | $ | 24,472,003 | $ | — | ||||||||
Variable rate | 695,400 | 5,461,029 | 655,704 | 5,458,676 | ||||||||||||
Total long-term loans | 25,512,728 | 5,461,029 | 25,127,707 | 5,458,676 | ||||||||||||
Lines of credit | 1,404,371 | 8,193,613 | 1,563,147 | 7,929,950 | ||||||||||||
Total loans outstanding(2) | 26,917,099 | 13,654,642 | 26,690,854 | 13,388,626 | ||||||||||||
Deferred loan origination costs | 11,778 | — | 11,526 | — | ||||||||||||
Loans to members | $ | 26,928,877 | $ | 13,654,642 | $ | 26,702,380 | $ | 13,388,626 | ||||||||
____________________________
(1)The interest rate on unadvanced loan commitments is not set until an advance is made; therefore, all unadvanced long-term loan commitments are reported as variable rate. However, the borrower may select either a fixed or a variable rate when an advance is drawn under a loan commitment.
(2) Represents the unpaid principal balance, net of charge-offs and recoveries, of loans as of the end of each period.
Unadvanced Loan Commitments
Unadvanced loan commitments represent approved and executed loan contracts for which funds have not been advanced to borrowers. The following table displays, by loan type, the available balance under unadvanced loan commitments as of August 31, 2020, and the related maturities in each fiscal year during the five fiscal-year period ended May 31, 2025, and thereafter.
64
NATIONAL RURAL UTILITIES COOPERATIVE FINANCE CORPORATION
NOTES TO CONSOLIDATED FINANCIAL STATEMENTS
(UNAUDITED)
Table 4.2: Unadvanced Loan Commitments
Available Balance | Notional Maturities of Unadvanced Loan Commitments | |||||||||||||||||||||||||||
(Dollars in thousands) | 2021 | 2022 | 2023 | 2024 | 2025 | Thereafter | ||||||||||||||||||||||
Line of credit loans | $ | 8,193,613 | $ | 487,556 | $ | 4,047,076 | $ | 1,357,059 | $ | 1,063,694 | $ | 1,079,137 | $ | 159,091 | ||||||||||||||
Long-term loans | 5,461,029 | 312,622 | 1,273,237 | 906,698 | 1,633,259 | 1,018,758 | 316,455 | |||||||||||||||||||||
Total | $ | 13,654,642 | $ | 800,178 | $ | 5,320,313 | $ | 2,263,757 | $ | 2,696,953 | $ | 2,097,895 | $ | 475,546 | ||||||||||||||
Unadvanced line of credit commitments accounted for 60% of total unadvanced loan commitments as of August 31, 2020, while unadvanced long-term loan commitments accounted for 40% of total unadvanced loan commitments. Unadvanced line of credit commitments are typically revolving facilities for periods not to exceed five years. Unadvanced line of credit commitments generally serve as supplemental back-up liquidity to our borrowers. Historically, borrowers have not drawn the full commitment amount for line of credit facilities, and we have experienced a very low utilization rate on line of credit loan facilities regardless of whether or not we are obligated to fund the facility where a material adverse change exists.
Our unadvanced long-term loan commitments have a five-year draw period under which a borrower may draw funds prior to the expiration of the commitment. We expect that the majority of the long-term unadvanced loan commitments of $5,461 million will be advanced prior to the expiration of the commitment.
Because we historically have experienced a very low utilization rate on line of credit loan facilities, which account for the majority of our total unadvanced loan commitments, we believe the unadvanced loan commitment total of $13,655 million as of August 31, 2020 is not necessarily representative of our future funding requirements.
Unadvanced Loan Commitments—Conditional
The substantial majority of our line of credit commitments and all of our unadvanced long-term loan commitments include material adverse change clauses. Unadvanced loan commitments subject to material adverse change clauses totaled $10,581 million and $10,532 million as of August 31, 2020 and May 31, 2020, respectively. Prior to making an advance on these facilities, we confirm that there has been no material adverse change in the business or condition, financial or otherwise, of the borrower since the time the loan was approved and confirm that the borrower is currently in compliance with loan terms and conditions. In some cases, the borrower’s access to the full amount of the facility is further constrained by the designated purpose, imposition of borrower-specific restrictions or by additional conditions that must be met prior to advancing funds.
Unadvanced Loan Commitments—Unconditional
Unadvanced loan commitments not subject to material adverse change clauses at the time of each advance consisted of unadvanced committed lines of credit totaling $3,074 million and $2,857 million as of August 31, 2020 and May 31, 2020, respectively. As such, we are required to advance amounts on these committed facilities as long as the borrower is in compliance with the terms and conditions of the facility. The table below displays the amount available for advance under unconditional committed lines of credit as of August 31, 2020, and the maturities in each fiscal year during the five-year period ended May 31, 2025, and thereafter.
Table 4.3: Unconditional Committed Lines of Credit—Available Balance
Available Balance | Notional Maturities of Unconditional Committed Lines of Credit | |||||||||||||||||||||||||||
(Dollars in thousands) | 2021 | 2022 | 2023 | 2024 | 2025 | Thereafter | ||||||||||||||||||||||
Committed lines of credit | $ | 3,074,095 | $ | 120,020 | $ | 242,006 | $ | 1,068,391 | $ | 716,378 | $ | 927,300 | $ | — | ||||||||||||||
65
NATIONAL RURAL UTILITIES COOPERATIVE FINANCE CORPORATION
NOTES TO CONSOLIDATED FINANCIAL STATEMENTS
(UNAUDITED)
Loan Sales
We transfer, from time to time, whole loans and participating interests to third parties. We sold CFC loans, at par for cash, totaling $85 million and $20 million during the three months ended August 31, 2020 and 2019, respectively. We recorded immaterial losses upon the sale of these loans attributable to the unamortized deferred loan origination costs associated with the transferred loans.
Pledged Loans
We are required to pledge eligible mortgage notes in an amount at least equal to the outstanding balance of our secured debt. The following table summarizes loans outstanding pledged as collateral to secure our collateral trust bonds, notes payable under the United States Department of Agriculture (“USDA”) Guaranteed Underwriter Program (“Guaranteed Underwriter Program”), notes payable under the revolving note purchase agreement with Farmer Mac and Clean Renewable Energy Bonds, and the corresponding debt outstanding as of August 31, 2020 and May 31, 2020. See “Note 6—Short-Term Borrowings” and “Note 7—Long-Term Debt” for information on our borrowings.
Table 4.4: Pledged Loans
(Dollars in thousands) | August 31, 2020 | May 31, 2020 | ||||||
Collateral trust bonds: | ||||||||
2007 indenture: | ||||||||
Distribution system mortgage notes pledged | $ | 8,162,005 | $ | 8,244,202 | ||||
RUS-guaranteed loans qualifying as permitted investments | 126,722 | 128,361 | ||||||
Total pledged collateral | $ | 8,288,727 | $ | 8,372,563 | ||||
Collateral trust bonds outstanding | 7,022,711 | 7,422,711 | ||||||
1994 indenture: | ||||||||
Distribution system mortgage notes pledged | $ | 39,016 | $ | 39,785 | ||||
Collateral trust bonds outstanding | 35,000 | 35,000 | ||||||
Guaranteed Underwriter Program: | ||||||||
Distribution and power supply system mortgage notes pledged | $ | 7,457,756 | $ | 7,535,931 | ||||
Notes payable outstanding | 6,225,855 | 6,261,312 | ||||||
Farmer Mac: | ||||||||
Distribution and power supply system mortgage notes pledged | $ | 3,665,038 | $ | 3,687,418 | ||||
Notes payable outstanding | 3,041,843 | 3,059,637 | ||||||
Clean Renewable Energy Bonds Series 2009A: | ||||||||
Distribution and power supply system mortgage notes pledged | $ | 6,787 | $ | 7,269 | ||||
Cash | 708 | 395 | ||||||
Total pledged collateral | $ | 7,495 | $ | 7,664 | ||||
Notes payable outstanding | 6,068 | 6,068 | ||||||
66
NATIONAL RURAL UTILITIES COOPERATIVE FINANCE CORPORATION
NOTES TO CONSOLIDATED FINANCIAL STATEMENTS
(UNAUDITED)
Credit Concentration
Concentrations may exist when there are amounts loaned to borrowers engaged in similar activities or in geographic areas that would cause them to be similarly impacted by economic or other conditions or when there are large exposures to single borrowers. As a tax-exempt, member-owned finance cooperative, CFC’s principal focus is to provide funding to its rural electric utility cooperative members to assist them in acquiring, constructing and operating electric distribution systems, power supply systems and related facilities. Because we lend primarily to our rural electric utility cooperative members, we have had a loan portfolio subject to single-industry and single-obligor concentration risks since our inception in 1969. Loans outstanding to electric utility organizations of $26,521 million and $26,306 million as of August 31, 2020 and May 31, 2020, respectively, accounted for 99% of total loans outstanding as of each respective date. The remaining loans outstanding in our portfolio were to RTFC members, affiliates and associates in the telecommunications industry.
Geographic Concentration
Although our organizational structure and mission results in single-industry concentration, we serve a geographically diverse group of electric and telecommunications borrowers throughout the United States. The number of borrowers with outstanding loans totaled 888 and 889 as of August 31, 2020 and May 31, 2020, respectively, located in 49 states. Texas accounted for the largest number of borrowers in any one state as of each respective date. In addition, Texas accounted for approximately 16% of total loans outstanding as of both August 31, 2020 and May 31, 2020, representing the largest concentration of loans outstanding to borrowers in any one state.
Single-Obligor Concentration
The outstanding loan exposure for our 20 largest borrowers totaled $5,910 million and $5,877 million as of August 31, 2020 and May 31, 2020, respectively, representing 22% of total loans outstanding as of each respective date. The 20 largest borrowers consisted of 12 distribution systems and eight power supply systems as of August 31, 2020. In comparison, the 20 largest borrowers consisted of 11 distribution systems and nine power supply systems as of May 31, 2020. The largest total outstanding exposure to a single borrower or controlled group represented less than 2% of total loans outstanding as of both August 31, 2020 and May 31, 2020.
As part of our strategy in managing credit exposure to large borrowers, we entered into a long-term standby purchase commitment agreement with Farmer Mac during fiscal year 2016. Under this agreement, we may designate certain long-term loans to be covered under the commitment, subject to approval by Farmer Mac, and in the event any such loan later goes into payment default for at least 90 days, upon request by us, Farmer Mac must purchase such loan at par value. We are required to pay Farmer Mac a monthly fee based on the unpaid principal balance of loans covered under the purchase commitment. The aggregate unpaid principal balance of designated and Farmer Mac approved loans was $551 million and $569 million as of August 31, 2020 and May 31, 2020, respectively. Loan exposure to our 20 largest borrowers covered under the Farmer Mac agreement totaled $285 million and $314 million as of August 31, 2020 and May 31, 2020, respectively. No loans had been put to Farmer Mac for purchase, pursuant to this agreement, as of August 31, 2020. Our credit exposure is also mitigated by long-term loans guaranteed by the Rural Utilities Service (“RUS”) of the USDA. Guaranteed RUS loans totaled $145 million and $147 million as of August 31, 2020 and May 31, 2020, respectively.
Credit Quality Indicators
Assessing the overall credit quality of our loan portfolio and measuring our credit risk is an ongoing process that involves tracking payment status, troubled debt restructurings, nonperforming loans, charge-offs, the internal risk ratings of our borrowers and other indicators of credit risk. We monitor and subject each borrower and loan facility in our loan portfolio to an individual risk assessment based on quantitative and qualitative factors. Payment status trends and internal risk ratings are indicators, among others, of the probability of borrower default and overall credit quality of our loan portfolio.
67
NATIONAL RURAL UTILITIES COOPERATIVE FINANCE CORPORATION
NOTES TO CONSOLIDATED FINANCIAL STATEMENTS
(UNAUDITED)
Payment Status of Loans
Loans are considered delinquent when contractual principal or interest amounts become past due 30 days or more following the scheduled payment due date. Loans are placed on nonaccrual status when payment of principal or interest is 90 days or more past due or management determines that the full collection of principal and interest is doubtful. The following table presents the payment status, by member class, of loans outstanding as of August 31, 2020 and May 31, 2020.
Table 4.5: Payment Status of Loans Outstanding
August 31, 2020 | ||||||||||||||||||||||||
(Dollars in thousands) | Current | 30-89 Days Past Due | 90 Days or More Past Due | Total Past Due | Total Loans Outstanding | Nonaccrual Loans (1) | ||||||||||||||||||
CFC: | ||||||||||||||||||||||||
Distribution | $ | 21,012,216 | $ | — | $ | — | $ | — | $ | 21,012,216 | $ | — | ||||||||||||
Power supply | 4,730,101 | — | — | — | 4,730,101 | 161,477 | ||||||||||||||||||
Statewide and associate | 97,343 | — | — | — | 97,343 | — | ||||||||||||||||||
CFC total | 25,839,660 | — | — | — | 25,839,660 | 161,477 | ||||||||||||||||||
NCSC | 681,321 | — | — | — | 681,321 | — | ||||||||||||||||||
RTFC | 396,118 | — | — | — | 396,118 | — | ||||||||||||||||||
Total loans outstanding | $ | 26,917,099 | $ | — | $ | — | $ | — | $ | 26,917,099 | $ | 161,477 | ||||||||||||
Percentage of total loans | 100.00 | % | — | % | — | % | — | % | 100.00 | % | 0.60 | % | ||||||||||||
May 31, 2020 | ||||||||||||||||||||||||
(Dollars in thousands) | Current | 30-89 Days Past Due | 90 Days or More Past Due (1) | Total Past Due | Total Loans Outstanding | Nonaccrual Loans (1) | ||||||||||||||||||
CFC: | ||||||||||||||||||||||||
Distribution | $ | 20,769,653 | $ | — | $ | — | $ | — | $ | 20,769,653 | $ | — | ||||||||||||
Power supply | 4,731,506 | — | — | — | 4,731,506 | 167,708 | ||||||||||||||||||
Statewide and associate | 106,498 | — | — | — | 106,498 | — | ||||||||||||||||||
CFC total | 25,607,657 | — | — | — | 25,607,657 | 167,708 | ||||||||||||||||||
NCSC | 697,862 | — | — | — | 697,862 | — | ||||||||||||||||||
RTFC | 385,335 | — | — | — | 385,335 | — | ||||||||||||||||||
Total loans outstanding | $ | 26,690,854 | $ | — | $ | — | $ | — | $ | 26,690,854 | $ | 167,708 | ||||||||||||
Percentage of total loans | 100.00 | % | — | % | — | % | — | % | 100.00 | % | 0.63 | % | ||||||||||||
____________________________
(1) Consists of one loan to a CFC power supply borrower that was classified as nonperforming in the fourth quarter of fiscal year 2020.
We had no delinquent loans as of August 31, 2020 or May 31, 2020, and we have not experienced any loan defaults or charge-offs since fiscal year 2017. However, we have one loan to a CFC power supply borrower with an outstanding balance of $161 million and $168 million as of August 31, 2020 and May 31, 2020, respectively, that we classified as nonperforming and placed on nonaccrual status in the fourth quarter of fiscal year 2020. No interest income was recognized on nonaccrual loans during the three months ended August 31, 2020 and 2019. We provide additional information on this loan below under “Nonperforming Loans.”
68
NATIONAL RURAL UTILITIES COOPERATIVE FINANCE CORPORATION
NOTES TO CONSOLIDATED FINANCIAL STATEMENTS
(UNAUDITED)
Troubled Debt Restructurings
We did not had any loan modifications that were required to be accounted for as a TDR during the three months ended August 31, 2020, nor have we had any TRD loan modifications since fiscal year 2016. The following table presents the outstanding balance of modified loans accounted for as TDRs in prior periods and the performance status, by member class, of these loans as of August 31, 2020 and May 31, 2020.
Table 4.6: Trouble Debt Restructurings
August 31, 2020 | May 31, 2020 | |||||||||||||||||
(Dollars in thousands) | Number of Borrowers | Outstanding Amount (1) | % of Total Loans Outstanding | Number of Borrowers | Outstanding Amount (1) | % of Total Loans Outstanding | ||||||||||||
TDR loans: | ||||||||||||||||||
CFC—Distribution | 1 | $ | 5,379 | 0.02 | % | 1 | $ | 5,755 | 0.02 | % | ||||||||
RTFC | 1 | 4,967 | 0.02 | 1 | 5,092 | 0.02 | ||||||||||||
Total TDR loans | 2 | $ | 10,346 | 0.04 | % | 2 | $ | 10,847 | 0.04 | % | ||||||||
Performance status of TDR loans: | ||||||||||||||||||
Performing TDR loans | 2 | $ | 10,346 | 0.04 | % | 2 | $ | 10,847 | 0.04 | % | ||||||||
Total TDR loans | 2 | $ | 10,346 | 0.04 | % | 2 | $ | 10,847 | 0.04 | % | ||||||||
____________________________
(1) Represents the unpaid principal balance net of charge-offs and recoveries as of the end of each period.
The outstanding TDR loans for CFC and RTFC each relate to the modification of a loan for one borrower that, at the time of the modification, was experiencing financial difficulty. There were no unadvanced commitments related to these loans as of August 31, 2020 and May 31, 2020. We did not have any TDR loans classified as nonperforming as of August 31, 2020 or May 31, 2020.
Nonperforming Loans
In addition to TDR loans that may be classified as nonperforming, we also may have nonperforming loans that have not been modified as a TDR. During the fourth quarter of fiscal year 2020, we classified one loan to a CFC power supply borrower with an outstanding balance of $168 million as of May 31, 2020, as nonperforming, placed the loan on nonaccrual status and established an asset-specific allowance for credit losses of $34 million as of as of May 31, 2020. Under the terms of the loan, which matures in December 2026, the amount the borrower is required to pay in 2024 and 2025 may vary as the payments are contingent on the borrower's financial performance in those years. Based on our review and assessment of the borrower’s most recent forecast and underlying assumptions provided to us in May 2020, we no longer believe that the future expected cash payments from the borrower through the maturity of the loan in December 2026 will be sufficient to repay the outstanding loan balance. We received payments from the borrower on this loan during the current quarter, which reduced the outstanding balance to $161 million as of August 31, 2020. The asset-specific allowance for credit losses for this loan was $33 million as of August 31, 2020. Although the borrower is not in default and was current with respect to required payments on the loan as of August 31, 2020, we continue to report the loan as nonperforming and it remains on nonaccrual status. This loan also was categorized as doubtful as of August 31, 2020 and May 31, 2020. We had no other loans classified as nonperforming or on nonaccrual status as of August 31, 2020 or May 31, 2020.
69
NATIONAL RURAL UTILITIES COOPERATIVE FINANCE CORPORATION
NOTES TO CONSOLIDATED FINANCIAL STATEMENTS
(UNAUDITED)
Net Charge-Offs
We had no loan defaults, charge-offs or recoveries during the three months ended August 31, 2020 and 2019. We experienced our last charge-off, which was attributable to a borrower in our RTFC telecommunications loan portfolio, in fiscal year 2017.
Borrower Risk Ratings
As part of our management of credit risk, we maintain a credit risk rating framework under which we employ a consistent process for assessing the credit quality of our loan portfolio. We evaluate each borrower and loan facility in our loan portfolio and assign internal borrower and loan facility risk ratings based on consideration of a number of quantitative and qualitative factors. Each risk rating is reassessed annually following the receipt of the borrower’s audited financial statements; however, interim risk-rating adjustments may occur as a result of updated information affecting a borrower’s ability to fulfill its obligations or other significant developments and trends. We categorize loans in our portfolio based on our internally assigned borrower risk ratings, which are intended to assess the general credit worthiness of the borrower and probability of default. Our borrower risk ratings align with the U.S. federal banking regulatory agencies credit risk definitions of pass and criticized categories, with the criticized category further segmented among special mention, substandard and doubtful. Pass ratings reflect relatively low probability of default, while criticized ratings have a higher probability of default. Following is a description of the borrower risk rating categories.
• | Pass: Borrowers that are not experiencing difficulty and/or not showing a potential or well-defined credit weakness. |
• | Special Mention: Borrowers that may be characterized by a potential credit weakness or deteriorating financial condition that is not sufficiently serious to warrant a classification of substandard or doubtful. |
• | Substandard: Borrowers that display a well-defined credit weakness that may jeopardize the full collection of principal and interest. |
• | Doubtful: Borrowers that have a well-defined credit weakness or weaknesses that make full collection of principal and interest, on the basis of currently known facts, conditions and collateral values, highly questionable and improbable. |
We use our internal risk ratings to measure the credit risk of each borrower and loan facility, identify or confirm problem or potential problem loans in a timely manner, differentiate risk within each of our portfolio segments, assess the overall credit quality of our loan portfolio and manage overall risk levels. Our internally assigned borrower risk ratings, which we map to equivalent credit ratings by external credit rating agencies, serve as the primary credit quality indicator for our loan portfolio. Because our internal borrower risk ratings provide important information on the collectibility of each of our loan portfolio segments, they are a key input in estimating our allowance for credit losses.
The following table provides a breakdown of our total loans outstanding, by borrower risk rating category and member type, as of August 31, 2020 and May 31, 2020. If a parent company provides a guarantee of full repayment of loans of a subsidiary borrower, we include the loans outstanding in the borrower risk rating category of the guarantor parent company rather than the risk rating category of the subsidiary borrower for purposes of estimating the allowance for credit losses. The borrower risk rating categories of loans outstanding presented below correspond to the borrower risk rating categories used in estimating the allowance for credit losses.
70
NATIONAL RURAL UTILITIES COOPERATIVE FINANCE CORPORATION
NOTES TO CONSOLIDATED FINANCIAL STATEMENTS
(UNAUDITED)
In connection with our adoption of CECL, we present term loans outstanding as of August 31, 2020, by fiscal year of origination for each year during the five-year annual reporting period beginning in fiscal year 2017, and in aggregate prior to fiscal year 2017. The origination period represents the date CFC advances funds to a borrower, rather than the execution date of a loan facility for a borrower. Revolving loans are presented separately due to the nature of revolving loans. The substantial majority of loans in our portfolio represent fixed-rate advances under secured long-term facilities with terms up to 35 years, and as indicated in the table below, $16,608 million, or 62%, of total loans outstanding of $26,917 million as of August 31, 2020 represent term-loan advances made to borrowers prior to fiscal year 2017.
As discussed above, as a tax-exempt, member-owned finance cooperative, CFC’s principal focus is to provide funding to its rural electric utility cooperative members to assist them in acquiring, constructing and operating electric distribution systems, power supply systems and related facilities. As such, since our inception in 1969 we have had an extended repeat lending and repayment history with substantially all of member borrowers through our various loan programs. Our secured long-term loan commitment facilities typically provide a five-year draw period under which a borrower may draw funds prior to the expiration of the commitment. Because our electric utility cooperative borrowers must make substantial annual capital investments to maintain operations and ensure delivery of the essential service provided by electric utilities, they require a continuous inflow of funds to finance infrastructure upgrades and new asset purchases. Due to the funding needs of electric utility cooperatives, a CFC borrower generally has multiple loans outstanding under advances drawn in different years. While the number of borrowers with loans outstanding was 888 borrowers as of August 31, 2020, the number of loans outstanding was 16,569 as of August 31, 2020, resulting in an average of 19 loans outstanding per borrower. Our borrowers, however, are subject to cross-default under the terms of our loan agreements. Therefore, if a borrower defaults on one loan, the borrower is considered in default on all outstanding loans. Due to these factors, we historically have not observed a correlation between the year of origination of our loans and default risk. Instead, default risk is more closely correlated to the risk rating of our borrowers.
Table 4.7: Loans Outstanding by Borrower Risk Ratings and Origination Year
71
NATIONAL RURAL UTILITIES COOPERATIVE FINANCE CORPORATION
NOTES TO CONSOLIDATED FINANCIAL STATEMENTS
(UNAUDITED)
August 31, 2020 | ||||||||||||||||||||||||||||||||||||
Term Loans by Fiscal Year of Origination | ||||||||||||||||||||||||||||||||||||
(Dollars in thousands) | Q1 2021 | 2020 | 2019 | 2018 | 2017 | Prior | Revolving Loans | Total | May 31, 2020 | |||||||||||||||||||||||||||
Pass | ||||||||||||||||||||||||||||||||||||
CFC: | ||||||||||||||||||||||||||||||||||||
Distribution | $ | 468,438 | $ | 1,978,080 | $ | 1,264,632 | $ | 1,533,073 | $ | 1,563,130 | $ | 13,160,291 | $ | 921,764 | $ | 20,889,408 | $ | 20,643,737 | ||||||||||||||||||
Power supply | 294,223 | 210,030 | 451,539 | 257,350 | 259,332 | 2,703,549 | 345,634 | 4,521,657 | 4,516,595 | |||||||||||||||||||||||||||
Statewide and associate | 75 | 24,537 | 3,978 | — | 718 | 27,508 | 24,356 | 81,172 | 90,274 | |||||||||||||||||||||||||||
CFC total | 762,736 | 2,212,647 | 1,720,149 | 1,790,423 | 1,823,180 | 15,891,348 | 1,291,754 | 25,492,237 | 25,250,606 | |||||||||||||||||||||||||||
NCSC | 12,476 | 248,220 | 4,603 | 58,797 | 15,587 | 271,827 | 69,813 | 681,323 | 697,862 | |||||||||||||||||||||||||||
RTFC | 31,977 | 74,146 | 13,653 | 31,086 | 65,921 | 142,064 | 22,638 | 381,485 | 371,507 | |||||||||||||||||||||||||||
Total pass | 807,189 | 2,535,013 | 1,738,405 | 1,880,306 | 1,904,688 | 16,305,239 | 1,384,205 | 26,555,045 | 26,319,975 | |||||||||||||||||||||||||||
Special mention | ||||||||||||||||||||||||||||||||||||
CFC: | ||||||||||||||||||||||||||||||||||||
Distribution | — | — | — | — | 4,694 | 99,198 | 18,916 | 122,808 | 7,743 | |||||||||||||||||||||||||||
Power supply | — | — | — | 2,362 | 8,293 | 36,309 | — | 46,964 | — | |||||||||||||||||||||||||||
Statewide and associate | — | — | 5,000 | 4,000 | 5,963 | 1,208 | — | 16,171 | 16,224 | |||||||||||||||||||||||||||
CFC total | — | — | 5,000 | 6,362 | 18,950 | 136,715 | 18,916 | 185,943 | 23,967 | |||||||||||||||||||||||||||
RTFC | — | — | 1,596 | 3,334 | 3,487 | — | 1,250 | 9,667 | 8,736 | |||||||||||||||||||||||||||
Total special mention | — | — | 6,596 | 9,696 | 22,437 | 136,715 | 20,166 | 195,610 | 32,703 | |||||||||||||||||||||||||||
Substandard | ||||||||||||||||||||||||||||||||||||
CFC: | ||||||||||||||||||||||||||||||||||||
Distribution | — | — | — | — | — | — | — | — | 118,173 | |||||||||||||||||||||||||||
Power supply | — | — | — | — | — | — | — | — | 47,203 | |||||||||||||||||||||||||||
CFC total | — | — | — | — | — | — | — | — | 165,376 | |||||||||||||||||||||||||||
RTFC | — | — | — | — | — | 4,967 | — | 4,967 | 5,092 | |||||||||||||||||||||||||||
Total substandard | — | — | — | — | — | 4,967 | — | 4,967 | 170,468 | |||||||||||||||||||||||||||
Doubtful | ||||||||||||||||||||||||||||||||||||
CFC: | ||||||||||||||||||||||||||||||||||||
Power supply | — | — | — | — | — | 161,477 | — | 161,477 | 167,708 | |||||||||||||||||||||||||||
CFC total | — | — | — | — | — | 161,477 | — | 161,477 | 167,708 | |||||||||||||||||||||||||||
Total doubtful | — | — | — | — | — | 161,477 | — | 161,477 | 167,708 | |||||||||||||||||||||||||||
Total loans outstanding | $ | 807,189 | $ | 2,535,013 | $ | 1,745,001 | $ | 1,890,002 | $ | 1,927,125 | $ | 16,608,398 | $ | 1,404,371 | $ | 26,917,099 | $ | 26,690,854 | ||||||||||||||||||
Loans to one electric distribution cooperative borrower and its subsidiary totaling $165 million as of May 31, 2020 accounted for the substantial majority of the substandard loan category amount of the $170 million as of May 31, 2020. Several years ago the electric distribution cooperative borrower established a subsidiary to deploy retail broadband service in underserved rural communities, which led to financial difficulties. The borrower and its subsidiary, however, continued to be current with regard to all principal and interest payments due. Based on updated financial performance information from the borrower, we reassessed and upgraded the risk rating for the borrower from substandard to special mention as of August 31, 2020. The loans outstanding to this borrower of $164 million as of August 31, 2020 are secured under our typical collateral requirements for long-term loan advances as of August 31, 2020. We currently expect to collect all principal and interest amounts due from the borrower and its subsidiary.
72
NATIONAL RURAL UTILITIES COOPERATIVE FINANCE CORPORATION
NOTES TO CONSOLIDATED FINANCIAL STATEMENTS
(UNAUDITED)
The doubtful loan category amounts of $161 million and $168 million as of August 31, 2020 and May 31, 2020, are attributable to the outstanding loan to the CFC power supply borrower discussed above under “Nonperforming Loans.”
NOTE 5—ALLOWANCE FOR CREDIT LOSSES |
Upon adoption of CECL on June 1, 2020, we recorded an increase in our allowance for credit losses for our loan portfolio of $4 million. The impact on the reserve for expected credit losses for our off-balance credit exposures related to unadvanced loan commitments and financial guarantees was not material. Additional information on our adoption of CECL is provided in “Note 1—Summary of Significant Accounting Policies.”
Allowance for Credit Losses—Loan Portfolio
The following tables summarize changes in the allowance for credit losses for our loan portfolio and present the allowance components. The changes in the allowance and the allowance components prior to our adoption of CECL on June 1, 2020 are based on the incurred loss model. The allowance components, which consist of a collective allowance and an asset-specific allowance, are based on the evaluation method used to measure our loans for credit losses. Loans that share similar risk characteristics are evaluated on a collective basis in measuring credit losses, while loans that do not share similar risk characteristics with other loans in our portfolio are evaluated on an individual basis.
Table 5.1: Changes in Allowance for Credit Losses
Three Months Ended August 31, 2020 | ||||||||||||||||
(Dollars in thousands) | CFC | NCSC | RTFC | Total | ||||||||||||
Balance as of May 31, 2020 | $ | 47,438 | $ | 806 | $ | 4,881 | $ | 53,125 | ||||||||
Cumulative-effect adjustment from adoption of CECL accounting standard | 5,645 | (15 | ) | (1,730 | ) | 3,900 | ||||||||||
Balance as of June 1, 2020 | 53,083 | 791 | 3,151 | 57,025 | ||||||||||||
(Benefit) provision for credit losses | (353 | ) | 38 | 641 | 326 | |||||||||||
Balance as of August 31, 2020 | $ | 52,730 | $ | 829 | $ | 3,792 | $ | 57,351 | ||||||||
Three Months Ended August 31, 2019 | ||||||||||||||||
(Dollars in thousands) | CFC | NCSC | RTFC | Total | ||||||||||||
Balance as of May 31, 2019 | $ | 13,120 | $ | 2,007 | $ | 2,408 | $ | 17,535 | ||||||||
(Benefit) provision for credit losses | (158 | ) | 70 | 118 | 30 | |||||||||||
Balance as of August 31, 2019 | $ | 12,962 | 2,077 | 2,526 | 17,565 | |||||||||||
73
NATIONAL RURAL UTILITIES COOPERATIVE FINANCE CORPORATION
NOTES TO CONSOLIDATED FINANCIAL STATEMENTS
(UNAUDITED)
Table 5.2: Allowance for Credit Losses Components
August 31, 2020 | ||||||||||||||||
(Dollars in thousands) | CFC | NCSC | RTFC | Total | ||||||||||||
Allowance components: | ||||||||||||||||
Collective allowance | $ | 19,914 | $ | 829 | $ | 2,776 | $ | 23,519 | ||||||||
Asset-specific allowance | 32,816 | — | 1,016 | 33,832 | ||||||||||||
Total allowance for credit losses | $ | 52,730 | $ | 829 | $ | 3,792 | $ | 57,351 | ||||||||
Loans outstanding:(1) | ||||||||||||||||
Collectively evaluated loans | $ | 25,672,804 | $ | 681,321 | $ | 391,151 | $ | 26,745,276 | ||||||||
Individually evaluated loans | 166,856 | — | 4,967 | 171,823 | ||||||||||||
Total loans outstanding | $ | 25,839,660 | $ | 681,321 | $ | 396,118 | $ | 26,917,099 | ||||||||
Allowance ratios: | ||||||||||||||||
Collective allowance coverage ratio(2) | 0.08 | % | 0.12 | % | 0.71 | % | 0.09 | % | ||||||||
Asset-specific allowance coverage ratio(3) | 19.67 | — | 20.46 | 19.69 | ||||||||||||
Total allowance coverage ratio(4) | 0.20 | 0.12 | 0.96 | 0.21 | ||||||||||||
May 31, 2020 | ||||||||||||||||
(Dollars in thousands) | CFC | NCSC | RTFC | Total | ||||||||||||
Allowance components: | ||||||||||||||||
Collective allowance | $ | 13,584 | $ | 806 | $ | 3,902 | $ | 18,292 | ||||||||
Asset-specific allowance | 33,854 | — | 979 | 34,833 | ||||||||||||
Total allowance for credit losses | $ | 47,438 | $ | 806 | $ | 4,881 | $ | 53,125 | ||||||||
Loans outstanding:(1) | ||||||||||||||||
Collectively evaluated loans | $ | 25,434,193 | $ | 697,862 | $ | 380,243 | $ | 26,512,298 | ||||||||
Individually evaluated loans | 173,464 | — | 5,092 | 178,556 | ||||||||||||
Total loans outstanding | $ | 25,607,657 | $ | 697,862 | $ | 385,335 | $ | 26,690,854 | ||||||||
Allowance coverage ratios: | ||||||||||||||||
Collective allowance coverage ratio(2) | 0.05 | % | 0.12 | % | 1.03 | % | 0.07 | % | ||||||||
Asset-specific allowance coverage ratio(3) | 19.52 | — | 19.23 | 19.51 | ||||||||||||
Total allowance coverage ratio(4) | 0.19 | 0.12 | 1.27 | 0.20 | ||||||||||||
____________________________
(1)Represents the unpaid principal amount of loans as of the end of each period. Excludes unamortized deferred loan origination costs of $12 million as of both August 31, 2020 and May 31, 2020.
(2)Calculated based on the collective allowance component at period end divided by collectively evaluated loans outstanding at period end.
(3)Calculated based on the asset-specific allowance component at period end divided by individually evaluated loans outstanding at period end.
(4)Calculated based on the total allowance for credit losses at period end divided by total loans outstanding at period end.
74
NATIONAL RURAL UTILITIES COOPERATIVE FINANCE CORPORATION
NOTES TO CONSOLIDATED FINANCIAL STATEMENTS
(UNAUDITED)
As discussed above in “Note 4—Loans,” we had one loan to a CFC power supply borrower with an outstanding balance of $161 million and $168 million as of August 31, 2020 or May 31, 2020, respectively, classified as nonperforming and on nonaccrual status as of each respective date. We evaluated this loan on an individual basis in determining the asset-specific allowance of $33 million and $34 million as of August 31, 2020 and May 31, 2020, respectively.
Individually Impaired Loans Under Incurred Loss Methodology
Prior to our adoption of CECL on June 1, 2020, we assessed loan impairment on a collective basis unless we considered a loan to be impaired. We assessed loan impairment on an individual basis when, based on current information, it was probable that we would not receive all principal and interest amounts due in accordance with the contractual terms of the original loan agreement. In connection with our adoption of CECL, we no longer provide information on impaired loans. The following table provides information on loans previously classified as individually impaired under the incurred loss model for determining the allowance for credit losses.
Table 5.3: Individually Impaired Loans—Incurred Loss Model
May 31, 2020 | Three Months Ended August 31, 2019 | |||||||||||||||||||||||
(Dollars in thousands) | Recorded Invested | Related Allowance | With Specific Allowance | With No Specific Allowance | Average Recorded Investment | Interest Income Recognized | ||||||||||||||||||
Individually impaired loans: | ||||||||||||||||||||||||
CFC | $ | 173,463 | $ | 33,854 | $ | 167,708 | $ | 5,755 | $ | 6,239 | $ | 137 | ||||||||||||
RTFC | 5,092 | 979 | 5,092 | — | 5,547 | 69 | ||||||||||||||||||
Total | $ | 178,555 | $ | 34,833 | $ | 172,800 | $ | 5,755 | $ | 11,786 | $ | 206 | ||||||||||||
Reserve for Credit Losses—Unadvanced Loan Commitments
In addition to the allowance for credit losses for our loan portfolio, we maintain an allowance for credit losses for unadvanced loan commitments, which we refer to as our reserve for credit losses because this amount is reported as a component of other liabilities on our consolidated balance sheets. Upon adoption of CECL on June 1, 2020, we began measuring the reserve for credit losses for unadvanced loan commitments based on expected credit losses over the contractual period of our exposure to credit risk arising from our obligation to extend credit, unless that obligation is unconditionally cancellable by us. The reserve for credit losses related to our off-balance sheet exposure for unadvanced loan commitments was less than $1 million as of both August 31, 2020 and May 31, 2020.
NOTE 6—SHORT-TERM BORROWINGS | ||||
Short-term borrowings consist of borrowings with an original contractual maturity of one year or less and do not include the current portion of long-term debt. Our short-term borrowings totaled $4,553 million and accounted for 17% of total debt outstanding as of August 31, 2020, compared with $3,962 million and 15% of total debt outstanding as of May 31, 2020. The following table provides comparative information on our short-term borrowings as of August 31, 2020 and May 31, 2020.
75
NATIONAL RURAL UTILITIES COOPERATIVE FINANCE CORPORATION
NOTES TO CONSOLIDATED FINANCIAL STATEMENTS
(UNAUDITED)
Table 6.1: Short-Term Borrowings Sources
(Dollars in thousands) | August 31, 2020 | May 31, 2020 | ||||||
Short-term borrowings: | ||||||||
Commercial paper: | ||||||||
Commercial paper sold through dealers, net of discounts | $ | 299,998 | $ | — | ||||
Commercial paper sold directly to members, at par | 1,421,582 | 1,318,566 | ||||||
Total commercial paper | 1,721,580 | 1,318,566 | ||||||
Select notes to members | 1,655,029 | 1,597,959 | ||||||
Daily liquidity fund notes | 645,036 | 508,618 | ||||||
Medium-term notes sold to members | 281,846 | 286,842 | ||||||
Farmer Mac notes payable (1) | 250,000 | 250,000 | ||||||
Total short-term borrowings | $ | 4,553,491 | $ | 3,961,985 | ||||
____________________________
(1) Advanced under the revolving purchase agreement with Farmer Mac dated March 24, 2011. See “Note 7—Long-Term Debt” for additional information on this revolving note purchase agreement.
Committed Bank Revolving Line of Credit Agreements
Under our committed bank revolving line of credit agreements, we had a total commitment of $2,725 million as of both August 31, 2020 and May 31, 2020. These agreements allow us to request up to $300 million of letters of credit, which would reduce the remaining amount available for our use. The following table presents the total commitment, letters of credit outstanding and the amount available for access as of August 31, 2020 and May 31, 2020.
Table 6.1: Committed Bank Revolving Line of Credit Agreements Available Amounts
August 31, 2020 | May 31, 2020 | |||||||||||||||||||||
(Dollars in millions) | Total Commitment | Letters of Credit Outstanding | Available Amount | Total Commitment | Letters of Credit Outstanding | Available Amount | Maturity | Annual Facility Fee (1) | ||||||||||||||
3-year agreement, 2022 | 1,315 | — | 1,315 | 1,315 | — | 1,315 | November 28, 2022 | 7.5 bps | ||||||||||||||
5-year agreement, 2023 | 1,410 | 3 | 1,407 | 1,410 | 3 | 1,407 | November 28, 2023 | 10 bps | ||||||||||||||
Total | 2,725 | 3 | 2,722 | 2,725 | 3 | 2,722 | ||||||||||||||||
____________________________
(1) Facility fee determined by CFC’s senior unsecured credit ratings based on the pricing schedules put in place at the inception of the related agreement.
We had no borrowings outstanding under our committed bank revolving line of credit agreements as of August 31, 2020 or May 31, 2020, and we were in compliance with all covenants and conditions under the agreements as of each date.
76
NATIONAL RURAL UTILITIES COOPERATIVE FINANCE CORPORATION
NOTES TO CONSOLIDATED FINANCIAL STATEMENTS
(UNAUDITED)
NOTE 7—LONG-TERM DEBT | ||||
The following table displays long-term debt outstanding, by debt type, as of August 31, 2020 and May 31, 2020.
Table 7.1: Long-Term Debt by Debt Type
(Dollars in thousands) | August 31, 2020 | May 31, 2020 | ||||||
Secured long-term debt: | ||||||||
Collateral trust bonds | $ | 7,057,711 | $ | 7,457,711 | ||||
Unamortized discount | (233,748 | ) | (236,461 | ) | ||||
Debt issuance costs | (31,515 | ) | (32,697 | ) | ||||
Total collateral trust bonds | 6,792,448 | 7,188,553 | ||||||
Guaranteed Underwriter Program notes payable | 6,225,855 | 6,261,312 | ||||||
Farmer Mac notes payable | 2,791,843 | 2,809,637 | ||||||
Other secured notes payable | 6,068 | 6,068 | ||||||
Debt issuance costs | (101 | ) | (117 | ) | ||||
Total other secured notes payable | 5,967 | 5,951 | ||||||
Total secured notes payable | 9,023,665 | 9,076,900 | ||||||
Total secured long-term debt | 15,816,113 | 16,265,453 | ||||||
Unsecured long-term debt: | ||||||||
Medium-term notes sold through dealers | 3,060,194 | 3,086,733 | ||||||
Medium-term notes sold to members | 316,402 | 372,117 | ||||||
Subtotal medium-term notes | 3,376,596 | 3,458,850 | ||||||
Unamortized discount | (852 | ) | (997 | ) | ||||
Debt issuance costs | (16,019 | ) | (16,943 | ) | ||||
Total unsecured medium-term notes | 3,359,725 | 3,440,910 | ||||||
Unsecured notes payable | 5,794 | 5,794 | ||||||
Unamortized discount | (90 | ) | (107 | ) | ||||
Debt issuance costs | (22 | ) | (26 | ) | ||||
Total unsecured notes payable | 5,682 | 5,661 | ||||||
Total unsecured long-term debt | 3,365,407 | 3,446,571 | ||||||
Total long-term debt | $ | 19,181,520 | $ | 19,712,024 | ||||
Medium-Term Notes
Medium-term notes represent unsecured obligations that may be issued through dealers in the capital markets or directly to our members.
Collateral Trust Bonds
Collateral trust bonds represent secured obligations sold to investors in the capital markets. Collateral trust bonds are secured by the pledge of mortgage notes or eligible securities in an amount at least equal to the principal balance of the bonds outstanding. In June 2020, we redeemed all $400 million outstanding principal amount of our 2.35% collateral trust
77
NATIONAL RURAL UTILITIES COOPERATIVE FINANCE CORPORATION
NOTES TO CONSOLIDATED FINANCIAL STATEMENTS
(UNAUDITED)
bonds due June 15, 2020. On October 1, 2020, we redeemed all $350 million outstanding principal amount of our 2.30% collateral trust bonds, due November 1, 2020.
Secured Notes Payable
We had outstanding secured notes payable totaling $6,226 million and $6,261 million as of August 31, 2020 and May 31, 2020, respectively, under bond purchase agreements with the Federal Financing Bank and a bond guarantee agreement with RUS issued under the Guaranteed Underwriter Program, which provides guarantees to the Federal Financing Bank. We pay RUS a fee of 30 basis points per year on the total amount outstanding. We had up to $900 million available for access under the Guaranteed Underwriter Program as of August 31, 2020. On September 16, 2020, we received a commitment letter for the guarantee by RUS for a $375 million loan facility from the Federal Financing Bank under the Guaranteed Underwriter Program.
The notes outstanding under the Guaranteed Underwriter Program contain a provision that if during any portion of the fiscal year, our senior secured credit ratings do not have at least two of the following ratings: (i) A3 or higher from Moody’s, (ii) A- or higher from S&P, (iii) A- or higher from Fitch, or (iv) an equivalent rating from a successor rating agency to any of the above rating agencies, we may not make cash patronage capital distributions in excess of 5% of total patronage capital. We are required to pledge eligible distribution system or power supply system loans as collateral in an amount at least equal to the total principal amount of notes outstanding under the Guaranteed Underwriter Program. See “Note 4—Loans” for additional information on the collateral pledged to secure notes payable under this program.
We have a revolving note purchase agreement with Farmer Mac, dated March 24, 2011, as amended, under which we can borrow up to $5,500 million from Farmer Mac at any time, subject to market conditions, through January 11, 2022. This date automatically extends on each anniversary date of the closing for an additional year, unless prior to any such anniversary date, Farmer Mac provides us with a notice that the draw period will not be extended beyond the remaining term. Pursuant to the terms of the Farmer Mac revolving note purchase agreement, we can borrow, repay and re-borrow funds at any time through maturity, as market conditions permit, provided that the outstanding principal amount at any time does not exceed the total available under the agreement. Under this agreement, we had outstanding secured notes payable totaling $2,792 million and $2,810 million as of August 31, 2020 and May 31, 2020, respectively. The amount available for borrowing under this agreement was $2,458 million as of August 31, 2020.
Pursuant to the Farmer Mac revolving note purchase agreement, we are required to pledge eligible electric distribution system or electric power supply system loans as collateral in an amount at least equal to the total principal amount of notes outstanding. See “Note 4—Loans” for additional information on pledged collateral.
We were in compliance with all covenants and conditions under our senior debt indentures as of August 31, 2020 and May 31, 2020.
NOTE 8—SUBORDINATED DEFERRABLE DEBT | ||||
Subordinated deferrable debt is long-term debt that is subordinated to our outstanding debt and senior to subordinated certificates held by our members. The following table presents our issuances of subordinated deferrable debt outstanding as of August 31, 2020 and May 31, 2020.
78
NATIONAL RURAL UTILITIES COOPERATIVE FINANCE CORPORATION
NOTES TO CONSOLIDATED FINANCIAL STATEMENTS
(UNAUDITED)
Table 8.1: Subordinated Deferrable Debt Outstanding
(Dollars in thousands) | August 31, 2020 | May 31, 2020 | ||||||
Subordinated deferrable debt: | ||||||||
4.75% due 2043 with a call date of April 30, 2023 | $ | 400,000 | $ | 400,000 | ||||
5.25% due 2046 with a call date of April 20, 2026 | 350,000 | 350,000 | ||||||
5.50% due 2064 with a call date of May 15, 2024 | 250,000 | 250,000 | ||||||
Debt issuance costs | (13,834 | ) | (13,881 | ) | ||||
Total subordinated deferrable debt | $ | 986,166 | $ | 986,119 | ||||
See “Note 8—Subordinated Deferrable Debt” in our 2020 Form 10-K for additional information on the terms of our subordinated deferrable debt outstanding.
NOTE 9—DERIVATIVE INSTRUMENTS AND HEDGING ACTIVITIES |
We are an end user of derivative financial instruments and do not engage in derivative trading. Derivatives may be privately negotiated contracts, which are often referred to as other-the-counter (“OTC”) derivatives, or they may be listed and traded on an exchange. We generally engage in OTC derivative transactions. Our derivative instruments are an integral part of our interest rate risk management strategy. Our principal purpose in using derivatives is to manage our aggregate interest rate risk profile within prescribed risk parameters. The derivative instruments we use primarily include interest rate swaps, which we typically hold to maturity. In addition, we may on occasion use treasury locks to manage the interest rate risk associated with debt that is scheduled to reprice in the future.
Accounting for Derivatives
In accordance with the accounting standards for derivatives and hedging activities, all derivative instruments are recorded at fair value on our consolidated balance sheets and classified as either derivative assets or derivative liabilities. Derivatives in a gain position are reported as derivative assets, while derivatives in a loss position are reported as derivative liabilities. We report derivative asset and liability amounts on a gross basis based on individual contracts, which does not take into consideration the effects of master netting agreements or collateral netting. Our derivatives transactions are not collateralized and do not include collateralization agreements with counterparties. Accrued interest related to derivative transactions is reported on our consolidated balance sheets as a component of either accrued interest receivable or accrued interest payable.
If we do not elect hedge accounting treatment, changes in the fair value of derivative instruments, which consist of net accrued periodic derivative cash settlements expense and derivative forward value amounts, are recognized in our consolidated statements of operations under derivative gains (losses). If we elect hedge accounting treatment for derivatives, we formally document, designate and assess the effectiveness of the hedge relationship. Changes in the fair value of derivatives designated as qualifying fair value hedges are recognized in the same line item on our consolidated statements of operations as the earnings effect of the related hedged item. Changes in the fair value of derivatives designated as qualifying cash flow hedges are recorded as a component of AOCI. Those amounts are reclassified into earnings in the same period during which the forecasted transaction impacts earnings and presented in the same line item on our consolidated statements of operations as the earnings effect of the related hedged item.
79
NATIONAL RURAL UTILITIES COOPERATIVE FINANCE CORPORATION
NOTES TO CONSOLIDATED FINANCIAL STATEMENTS
(UNAUDITED)
We generally do not designate our interest rate swaps for hedge accounting. Therefore, changes in the fair value of our interest rate swaps are reported on our consolidated statements of operations under derivative gains (losses). If we enter into a treasury lock, we typically designate the treasury lock as a cash flow hedge. We did not have any derivatives designated as accounting hedges as of August 31, 2020 or May 31, 2020.
Outstanding Notional Amount of Derivatives Not Designated as Accounting Hedges
The notional amount provides an indication of the volume of our derivatives activity, but this amount is not recorded on our consolidated balance sheets. The notional amount is used only as the basis on which interest payments are determined and is not the amount exchanged. The following table shows the outstanding notional amounts and the weighted-average rate paid and received for our interest rate swaps, by type, as of August 31, 2020 and May 31, 2020. The substantial majority of our interest rate swaps use an index based on LIBOR for either the pay or receive leg of the swap agreement.
Table 9.1: Derivative Notional Amount and Weighted Average Rates
August 31, 2020 | May 31, 2020 | |||||||||||||||||||
(Dollars in thousands) | Notional Amount | Weighted- Average Rate Paid | Weighted- Average Rate Received | Notional Amount | Weighted- Average Rate Paid | Weighted- Average Rate Received | ||||||||||||||
Pay-fixed swaps | $ | 6,540,816 | 2.79 | % | 0.29 | % | $ | 6,604,808 | 2.78 | % | 0.88 | % | ||||||||
Receive-fixed swaps | 2,599,000 | 1.01 | 2.76 | 2,699,000 | 1.54 | 2.75 | ||||||||||||||
Total interest rate swaps | 9,139,816 | 2.28 | 0.99 | 9,303,808 | 2.42 | 1.42 | ||||||||||||||
Forward pay-fixed swaps | 120,000 | 3,000 | ||||||||||||||||||
Total | $ | 9,259,816 | $ | 9,306,808 | ||||||||||||||||
Impact of Derivatives on Consolidated Balance Sheets
The following table displays the fair value of the derivative assets and derivative liabilities, by derivatives type, recorded on our consolidated balance sheets and the related outstanding notional amount as of August 31, 2020 and May 31, 2020.
Table 9.2: Derivative Assets and Liabilities at Fair Value
August 31, 2020 | May 31, 2020 | |||||||||||||||
(Dollars in thousands) | Fair Value | Notional Amount | Fair Value | Notional Amount | ||||||||||||
Derivative assets: | ||||||||||||||||
Interest rate swaps | $ | 167,463 | $ | 2,722,000 | $ | 173,195 | $ | 2,699,000 | ||||||||
Derivative liabilities: | ||||||||||||||||
Interest rate swaps | $ | 1,165,585 | $ | 6,537,816 | $ | 1,258,459 | $ | 6,607,808 | ||||||||
All of our master swap agreements include netting provisions that allow for offsetting of all contracts with a given counterparty in the event of default by one of the two parties. However, as indicated above, we report derivative asset and liability amounts on a gross basis by individual contracts. The following table presents the gross fair value of derivative assets and liabilities reported on our consolidated balance sheets as of August 31, 2020 and May 31, 2020, and provides information on the impact of netting provisions and collateral pledged, if any.
80
NATIONAL RURAL UTILITIES COOPERATIVE FINANCE CORPORATION
NOTES TO CONSOLIDATED FINANCIAL STATEMENTS
(UNAUDITED)
Table 9.3: Derivative Gross and Net Amounts
August 31, 2020 | ||||||||||||||||||||||||
Gross Amount of Recognized Assets/ Liabilities | Gross Amount Offset in the Balance Sheet | Net Amount of Assets/ Liabilities Presented in the Balance Sheet | Gross Amount Not Offset in the Balance Sheet | |||||||||||||||||||||
(Dollars in thousands) | Financial Instruments | Cash Collateral Pledged | Net Amount | |||||||||||||||||||||
Derivative assets: | ||||||||||||||||||||||||
Interest rate swaps | $ | 167,463 | $ | — | $ | 167,463 | $ | 167,463 | $ | — | $ | — | ||||||||||||
Derivative liabilities: | ||||||||||||||||||||||||
Interest rate swaps | 1,165,585 | — | 1,165,585 | 167,463 | — | 998,122 | ||||||||||||||||||
May 31, 2020 | ||||||||||||||||||||||||
Gross Amount of Recognized Assets/ Liabilities | Gross Amount Offset in the Balance Sheet | Net Amount of Assets/ Liabilities Presented in the Balance Sheet | Gross Amount Not Offset in the Balance Sheet | |||||||||||||||||||||
(Dollars in thousands) | Financial Instruments | Cash Collateral Pledged | Net Amount | |||||||||||||||||||||
Derivative assets: | ||||||||||||||||||||||||
Interest rate swaps | $ | 173,195 | $ | — | $ | 173,195 | $ | 173,195 | $ | — | $ | — | ||||||||||||
Derivative liabilities: | ||||||||||||||||||||||||
Interest rate swaps | 1,258,459 | — | 1,258,459 | 173,195 | — | 1,085,264 | ||||||||||||||||||
Impact of Derivatives on Consolidated Statements of Operations
The primary factors affecting the fair value of our derivatives and the derivative gains (losses) recorded in our consolidated statements of operations include changes in interest rates, the shape of the swap curve and the composition of our derivative portfolio. We generally record derivative losses when interest rates decline and derivative gains when interest rates rise, as our derivative portfolio consists of a higher proportion of pay-fixed swaps than receive-fixed swaps.
The following table presents the components of the derivative gains (losses) reported in our consolidated statements of operations for the three months ended August 31, 2020 and 2019. Derivative cash settlements interest expense represents the net periodic contractual interest amount for our interest-rate swaps during the reporting period. Derivative forward value gains (losses) represent the change in fair value of our interest rate swaps during the reporting period due to changes in expected future interest rates over the remaining life of our derivative contracts. We classify the derivative cash settlement amounts for the net periodic contractual interest expense on our interest rate swaps as an operating activity in our consolidated statements of cash flows.
81
NATIONAL RURAL UTILITIES COOPERATIVE FINANCE CORPORATION
NOTES TO CONSOLIDATED FINANCIAL STATEMENTS
(UNAUDITED)
Table 9.4: Derivative Gains (Losses)
Three Months Ended August 31, | ||||||||
(Dollars in thousands) | 2020 | 2019 | ||||||
Derivative gains (losses) attributable to: | ||||||||
Derivative cash settlements interest expense | $ | (26,972 | ) | $ | (11,043 | ) | ||
Derivative forward value gains (losses) | 87,248 | (384,682 | ) | |||||
Derivative gains (losses) | $ | 60,276 | $ | (395,725 | ) | |||
Credit Risk-Related Contingent Features
Our derivative contracts typically contain mutual early-termination provisions, generally in the form of a credit rating trigger. Under the mutual credit rating trigger provisions, either counterparty may, but is not obligated to, terminate and settle the agreement if the credit rating of the other counterparty falls below a level specified in the agreement. If a derivative contract is terminated, the amount to be received or paid by us would be equal to the prevailing fair value, as defined in the agreement, as of the termination date.
Our senior unsecured credit ratings from Moody’s and S&P were A2 and A, respectively, as of August 31, 2020. Both Moody’s and S&P had our ratings on stable outlook as of August 31, 2020. The following table displays the notional amounts of our derivative contracts with rating triggers as of August 31, 2020, and the payments that would be required if the contracts were terminated as of that date because of a downgrade of our unsecured credit ratings or the counterparty’s unsecured credit ratings below A3/A-, below Baa1/BBB+, to or below Baa2/BBB, below Baa3/BBB-, or to or below Ba2/BB+ by Moody’s or S&P, respectively. In calculating the payment amounts that would be required upon termination of the derivative contracts, we assume that amounts for each counterparty would be netted in accordance with the provisions of the master netting agreements with the counterparty. The net payment amounts are based on the fair value of the underlying derivative instrument, excluding the credit risk valuation adjustment, plus any unpaid accrued interest amounts.
Table 9.5: Derivative Credit Rating Trigger Exposure
(Dollars in thousands) | Notional Amount | Payable Due from CFC | Receivable Due to CFC | Net (Payable)/Receivable | ||||||||||||
Impact of rating downgrade trigger: | ||||||||||||||||
Falls below A3/A-(1) | $ | 45,860 | $ | (10,614 | ) | $ | — | $ | (10,614 | ) | ||||||
Falls below Baa1/BBB+ | 6,029,690 | (634,659 | ) | — | (634,659 | ) | ||||||||||
Falls to or below Baa2/BBB (2) | 417,041 | (31,630 | ) | — | (31,630 | ) | ||||||||||
Falls below Baa3/BBB- | 44,877 | (15,097 | ) | — | (15,097 | ) | ||||||||||
Total | $ | 6,537,468 | $ | (692,000 | ) | $ | — | $ | (692,000 | ) | ||||||
____________________________
(1) Rating trigger for CFC falls below A3/A-, while rating trigger for counterparty falls below Baa1/BBB+ by Moody’s or S&P, respectively.
(2) Rating trigger for CFC falls to or below Baa2/BBB, while rating trigger for counterparty falls to or below Ba2/BB+ by Moody’s or S&P, respectively.
We have interest rate swaps with one counterparty that are subject to a ratings trigger and early termination provision in the event of a downgrade of CFC’s senior unsecured credit ratings below Baa3, BBB- or BBB- by Moody’s, S&P or Fitch, respectively. The outstanding notional amount of these swaps, which is not included in the above table, totaled $205 million as of August 31, 2020. These swaps were in an unrealized loss position of $56 million as of August 31, 2020.
Our largest counterparty exposure, based on the outstanding notional amount, accounted for approximately 25% of the total outstanding notional amount of derivatives as of August 31, 2020 and May 31, 2020. The aggregate fair value amount,
82
NATIONAL RURAL UTILITIES COOPERATIVE FINANCE CORPORATION
NOTES TO CONSOLIDATED FINANCIAL STATEMENTS
(UNAUDITED)
including the credit valuation adjustment, of all interest rate swaps with rating triggers that were in a net liability position was $734 million as of August 31, 2020.
NOTE 10—EQUITY |
Total equity increased $83 million to $732 million as of August 31, 2020, attributable to the combined impact of our reported net income of $145 million for the three months ended August 31, 2020, which was partially offset by the retirement of patronage capital of $60 million authorized by the CFC Board of Directors during the current quarter and the decrease to retained earnings of $4 million from the cumulative-effect adjustment recorded at adoption of the CECL accounting standard on June 1, 2020.
Allocation of Earnings and Retirement of Patronage Capital
In July 2020, the CFC Board of Directors authorized the allocation of fiscal year 2020 net earnings as follows: $96 million to members in the form of patronage capital, $48 million to the members’ capital reserve and $1 million to the cooperative educational fund. The amount of patronage capital allocated each year by CFC’s Board of Directors is based on adjusted net income, which excludes the impact of derivative forward value gains (losses). See “MD&A—Non-GAAP Financial Measures” for information on adjusted net income.
In July 2020, the CFC Board of Directors authorized the retirement of allocated net earnings totaling $60 million, consisting of $48 million, which represented 50% of the patronage capital allocation for fiscal year 2020, and $12 million, which represented the portion of the allocation from fiscal year 1995 net earnings that has been held for 25 years pursuant to the CFC Board of Directors policy. The authorized patronage capital retirement amount of $60 million was returned to members in cash in September 2020. The remaining portion of the amount allocated for fiscal year 2020 will be retained by CFC for 25 years under current guidelines adopted by the CFC Board of Directors in June 2009.
Accumulated Other Comprehensive Income (Loss)
The following table presents, by component, changes in AOCI for the three months ended August 31, 2020 and 2019 and the balance of each component as of the end of each respective period.
Table 10.1: Changes in Accumulated Other Comprehensive Income (Loss)
Three Months Ended August 31, 2020 | ||||||||||||
(Dollars in thousands) | Derivatives Unrealized Gains(1) | Defined Benefit Plans Unrealized Losses(2) | Total | |||||||||
Beginning balance | $ | 2,130 | $ | (4,040 | ) | $ | (1,910 | ) | ||||
(Gains) losses reclassified to earnings | (105 | ) | 188 | 83 | ||||||||
Ending balance | $ | 2,025 | $ | (3,852 | ) | $ | (1,827 | ) | ||||
Three Months Ended August 31, 2019 | ||||||||||||
(Dollars in thousands) | Derivatives Unrealized Gains(1) | Defined Benefit Plans Unrealized Losses(2) | Total | |||||||||
Beginning balance | $ | 2,571 | $ | (2,718 | ) | $ | (147 | ) | ||||
(Gains) losses reclassified to earnings | (112 | ) | 145 | 33 | ||||||||
Ending balance | $ | 2,459 | $ | (2,573 | ) | $ | (114 | ) | ||||
____________________________
83
NATIONAL RURAL UTILITIES COOPERATIVE FINANCE CORPORATION
NOTES TO CONSOLIDATED FINANCIAL STATEMENTS
(UNAUDITED)
(1) Reclassified to earnings as a component of the derivative gains (losses) line item presented on our consolidated statements of operations.
(2) Reclassified to earnings as component of the other non-interest expense line item presented on our consolidated statements of operations.
We expect to reclassify less than $1 million of amounts in AOCI related to unrealized derivative gains to earnings over the next 12 months.
NOTE 11—GUARANTEES |
The following table displays the notional amount of our outstanding guarantee obligations, by guarantee type and by member class, as of August 31, 2020 and May 31, 2020.
Table 11.1: Guarantees Outstanding by Type and Member Class
(Dollars in thousands) | August 31, 2020 | May 31, 2020 | ||||||
Guarantee type: | ||||||||
Long-term tax-exempt bonds(1) | $ | 186,075 | $ | 263,875 | ||||
Letters of credit(2) | 353,896 | 413,839 | ||||||
Other guarantees | 143,275 | 143,072 | ||||||
Total | $ | 683,246 | $ | 820,786 | ||||
Member class: | ||||||||
CFC: | ||||||||
Distribution | $ | 258,366 | $ | 266,301 | ||||
Power supply | 409,001 | 538,532 | ||||||
Statewide and associate(3) | 6,110 | 5,954 | ||||||
CFC total | 673,477 | 810,787 | ||||||
NCSC | 9,769 | 9,999 | ||||||
Total | $ | 683,246 | $ | 820,786 | ||||
____________________________
(1)Represents the outstanding principal amount of long-term fixed-rate and variable-rate guaranteed bonds.
(2)Reflects our maximum potential exposure for letters of credit.
(3) Includes CFC guarantees to NCSC and RTFC members totaling $3 million as of August 31, 2020 and May 31, 2020.
Long-term tax-exempt bonds of $186 million and $264 million as of August 31, 2020 and May 31, 2020, respectively, included $166 million and $244 million, respectively, of adjustable or variable-rate bonds that may be converted to a fixed rate as specified in the applicable indenture for each bond offering. We are unable to determine the maximum amount of interest that we may be required to pay related to the remaining adjustable and variable-rate bonds. Many of these bonds have a call provision that allows us to call the bond in the event of a default, which would limit our exposure to future interest payments on these bonds. Our maximum potential exposure generally is secured by mortgage liens on the members’ assets and future revenue. If a member’s debt is accelerated because of a determination that the interest thereon is not tax-exempt, the member’s obligation to reimburse us for any guarantee payments will be treated as a long-term loan. The remaining long-term tax-exempt bonds of $20 million as of August 31, 2020 are fixed-rate. The maximum potential exposure for these bonds, including the outstanding principal of $20 million and related interest through maturity, totaled $34 million as of August 31, 2020. The maturities for long-term tax-exempt bonds and the related guarantees extend through calendar year 2040.
84
NATIONAL RURAL UTILITIES COOPERATIVE FINANCE CORPORATION
NOTES TO CONSOLIDATED FINANCIAL STATEMENTS
(UNAUDITED)
Of the outstanding letters of credit of $354 million and $414 million as of August 31, 2020 and May 31, 2020, respectively, $103 million and $106 million, respectively, were secured. We did not have any letters of credit outstanding that provided for standby liquidity for adjustable and floating-rate tax-exempt bonds issued for the benefit of our members as of August 31, 2020. The maturities for the outstanding letters of credit as of August 31, 2020 extend through calendar year 2039.
In addition to the letters of credit listed in the table above, under master letter of credit facilities in place as of August 31, 2020, we may be required to issue up to an additional $71 million in letters of credit to third parties for the benefit of our members. All of our master letter of credit facilities were subject to material adverse change clauses at the time of issuance as of August 31, 2020. Prior to issuing a letter of credit, we would confirm that there has been no material adverse change in the business or condition, financial or otherwise, of the borrower since the time the loan was approved and confirm that the borrower is currently in compliance with the letter of credit terms and conditions.
The maximum potential exposure for other guarantees was $143 million as of both August 31, 2020 and May 31, 2020, of which $25 million was secured as of both August 31, 2020 and May 31, 2020. The maturities for these other guarantees listed in the table above extend through calendar year 2025. Guarantees under which our right of recovery from our members was not secured totaled $369 million and $426 million and represented 54% and 52% of total guarantees as of August 31, 2020 and May 31, 2020, respectively.
In addition to the guarantees described above, we were also the liquidity provider for $166 million of variable-rate tax-exempt bonds as of August 31, 2020, issued for our member cooperatives. While the bonds are in variable-rate mode, in return for a fee, we have unconditionally agreed to purchase bonds tendered or put for redemption if the remarketing agents are unable to sell such bonds to other investors. We were not required to perform as liquidity provider pursuant to these obligations during the three months ended August 31, 2020 or the prior fiscal year.
Guarantee Liability
We recorded a total guarantee liability for noncontingent and contingent exposures related to guarantees and liquidity obligations of $10 million and $11 million as of August 31, 2020 and May 31, 2020, respectively. The noncontingent guarantee liability, which pertains to our obligation to stand ready to perform over the term of our guarantees and liquidity obligations we have entered into or modified since January 1, 2003, was $9 million and $10 million as of August 31, 2020 and May 31, 2020, respectively. The contingent guarantee liability, which is based on management’s estimate of exposure to losses within our guarantee portfolio, was $1 million as of both August 31, 2020 and May 31, 2020.
NOTE 12—FAIR VALUE MEASUREMENT |
Fair value, also referred to as an exit price, is defined as the price that would be received for an asset or paid to transfer a liability in an orderly transaction between market participants on the measurement date. The fair value accounting guidance provides a three-level fair value hierarchy for classifying financial instruments. This hierarchy is based on the markets in which the assets or liabilities trade and whether the inputs to the valuation techniques used to measure fair value are observable or unobservable. The fair value measurement of a financial asset or liability is assigned a level based on the lowest level of any input that is significant to the fair value measurement in its entirety. The levels, in priority order based on the extent to which observable inputs are available to measure fair value, are Level 1, Level 2 and Level 3. The accounting guidance for fair value measurements requires that we maximize the use of observable inputs and minimize the use of unobservable inputs in determining fair value.
The following table presents the carrying value and estimated fair value of all of our financial instruments, including those carried at amortized cost, as of August 31, 2020 and May 31, 2020. The table also displays the classification level within the fair value hierarchy based on the degree of observability of the inputs used in the valuation technique for estimating fair value.
85
NATIONAL RURAL UTILITIES COOPERATIVE FINANCE CORPORATION
NOTES TO CONSOLIDATED FINANCIAL STATEMENTS
(UNAUDITED)
Table 12.1: Fair Value of Financial Instruments
August 31, 2020 | Fair Value Measurement Level | |||||||||||||||||||
(Dollars in thousands) | Carrying Value | Fair Value | Level 1 | Level 2 | Level 3 | |||||||||||||||
Assets: | ||||||||||||||||||||
Cash and cash equivalents | $ | 347,818 | $ | 347,818 | $ | 347,818 | $ | — | $ | — | ||||||||||
Restricted cash | 9,376 | 9,376 | 9,376 | — | — | |||||||||||||||
Equity securities, at fair value | 62,266 | 62,266 | 62,266 | — | — | |||||||||||||||
Debt securities trading, at fair value | 527,526 | 527,526 | — | 527,526 | — | |||||||||||||||
Deferred compensation investments | 6,159 | 6,159 | 6,159 | — | — | |||||||||||||||
Loans to members, net | 26,871,526 | 30,200,954 | — | — | 30,200,954 | |||||||||||||||
Accrued interest receivable | 104,762 | 104,762 | — | 104,762 | — | |||||||||||||||
Debt service reserve funds | 14,591 | 14,591 | 14,591 | — | — | |||||||||||||||
Derivative assets | 167,463 | 167,463 | — | 167,463 | — | |||||||||||||||
Total financial assets | $ | 28,111,487 | $ | 31,440,915 | $ | 440,210 | $ | 799,751 | $ | 30,200,954 | ||||||||||
Liabilities: | ||||||||||||||||||||
Short-term borrowings | $ | 4,553,491 | $ | 4,552,523 | $ | — | $ | 4,302,523 | $ | 250,000 | ||||||||||
Long-term debt | 19,181,520 | 21,548,208 | — | 11,759,472 | 9,788,736 | |||||||||||||||
Accrued interest payable | 182,166 | 182,166 | — | 182,166 | — | |||||||||||||||
Guarantee liability | 10,320 | 11,322 | — | — | 11,322 | |||||||||||||||
Derivative liabilities | 1,165,585 | 1,165,585 | — | 1,165,585 | — | |||||||||||||||
Subordinated deferrable debt | 986,166 | 1,064,046 | — | 1,064,046 | — | |||||||||||||||
Members’ subordinated certificates | 1,298,845 | 1,298,845 | — | — | 1,298,845 | |||||||||||||||
Total financial liabilities | $ | 27,378,093 | $ | 29,822,695 | $ | — | $ | 18,473,792 | $ | 11,348,903 | ||||||||||
86
NATIONAL RURAL UTILITIES COOPERATIVE FINANCE CORPORATION
NOTES TO CONSOLIDATED FINANCIAL STATEMENTS
(UNAUDITED)
May 31, 2020 | Fair Value Measurement Level | |||||||||||||||||||
(Dollars in thousands) | Carrying Value | Fair Value | Level 1 | Level 2 | Level 3 | |||||||||||||||
Assets: | ||||||||||||||||||||
Cash and cash equivalents | $ | 671,372 | $ | 671,372 | $ | 671,372 | $ | — | $ | — | ||||||||||
Restricted cash | 8,647 | 8,647 | 8,647 | — | — | |||||||||||||||
Equity securities, at fair value | 60,735 | 60,735 | 60,735 | — | — | |||||||||||||||
Debt securities trading, at fair value | 309,400 | 309,400 | — | 309,400 | — | |||||||||||||||
Deferred compensation investments | 5,496 | 5,496 | 5,496 | — | — | |||||||||||||||
Loans to members, net | 26,649,255 | 29,252,065 | — | — | 29,252,065 | |||||||||||||||
Accrued interest receivable | 117,138 | 117,138 | — | 117,138 | — | |||||||||||||||
Debt service reserve funds | 14,591 | 14,591 | 14,591 | — | — | |||||||||||||||
Derivative assets | 173,195 | 173,195 | — | 173,195 | — | |||||||||||||||
Total financial assets | $ | 28,009,829 | $ | 30,612,639 | $ | 760,841 | $ | 599,733 | $ | 29,252,065 | ||||||||||
Liabilities: | ||||||||||||||||||||
Short-term borrowings | $ | 3,961,985 | $ | 3,963,164 | $ | — | $ | 3,713,164 | $ | 250,000 | ||||||||||
Long-term debt | 19,712,024 | 21,826,337 | — | 11,981,580 | 9,844,757 | |||||||||||||||
Accrued interest payable | 139,619 | 139,619 | — | 139,619 | — | |||||||||||||||
Guarantee liability | 10,937 | 11,948 | — | — | 11,948 | |||||||||||||||
Derivative liabilities | 1,258,459 | 1,258,459 | — | 1,258,459 | — | |||||||||||||||
Subordinated deferrable debt | 986,119 | 1,030,108 | — | 1,030,108 | — | |||||||||||||||
Members’ subordinated certificates | 1,339,618 | 1,339,618 | — | — | 1,339,618 | |||||||||||||||
Total financial liabilities | $ | 27,408,761 | $ | 29,569,253 | $ | — | $ | 18,122,930 | $ | 11,446,323 | ||||||||||
For additional information regarding fair value measurements, the fair value hierarchy and a description of the methodologies we use to estimate fair value, see “Note 14—Fair Value Measurement” to the Consolidated Financial Statements in our 2020 Form 10-K.
Transfers Between Levels
We monitor the availability of observable market data to assess the appropriate classification of financial instruments within the fair value hierarchy and transfer between Level 1, Level 2, and Level 3 accordingly. Observable market data includes but is not limited to quoted prices and market transactions. Changes in economic conditions or market liquidity generally will drive changes in availability of observable market data. Changes in availability of observable market data, which also may result in changes in the valuation technique used, are generally the cause of transfers between levels. We did not have any transfers between levels for financial instruments measured at fair value on a recurring basis for the three months ended August 31, 2020 and 2019.
Assets and Liabilities Measured at Fair Value on a Recurring Basis
The following table presents the carrying value and fair value of financial instruments reported in our consolidated financial statements at fair value on a recurring basis as of August 31, 2020 and May 31, 2020, and the classification of the valuation technique within the fair value hierarchy.
87
NATIONAL RURAL UTILITIES COOPERATIVE FINANCE CORPORATION
NOTES TO CONSOLIDATED FINANCIAL STATEMENTS
(UNAUDITED)
Table 12.2: Assets and Liabilities Measured at Fair Value on a Recurring Basis
August 31, 2020 | May 31, 2020 | |||||||||||||||||||||||
(Dollars in thousands) | Level 1 | Level 2 | Total | Level 1 | Level 2 | Total | ||||||||||||||||||
Assets: | ||||||||||||||||||||||||
Equity securities, at fair value | $ | 62,266 | $ | — | $ | 62,266 | $ | 60,735 | $ | — | $ | 60,735 | ||||||||||||
Debt securities trading, at fair value | — | 527,526 | 527,526 | — | 309,400 | 309,400 | ||||||||||||||||||
Deferred compensation investments | 6,159 | — | 6,159 | 5,496 | — | 5,496 | ||||||||||||||||||
Derivative assets | — | 167,463 | 167,463 | — | 173,195 | 173,195 | ||||||||||||||||||
Liabilities: | ||||||||||||||||||||||||
Derivative liabilities | — | 1,165,585 | 1,165,585 | — | 1,258,459 | 1,258,459 | ||||||||||||||||||
Assets and Liabilities Measured at Fair Value on a Nonrecurring Basis
We may be required, from time to time, to measure certain assets at fair value on a nonrecurring basis on our consolidated balance sheets. These assets are not measured at fair value on an ongoing basis but are subject to fair value adjustments in certain circumstances, such as in the application of lower of cost or fair value accounting or when we evaluate assets for impairment. We did not have any assets measured at fair value on a nonrecurring basis during the three months ended August 31, 2020 or during the three months ended August 31, 2019.
NOTE 13—VARIABLE INTEREST ENTITIES |
NCSC and RTFC meet the definition of a VIE because they do not have sufficient equity investment at risk to finance their activities without financial support. CFC is the primary source of funding for NCSC and the sole source of funding for RTFC. Under the terms of management agreements with each company, CFC manages the business operations of NCSC and RTFC. CFC also unconditionally guarantees full indemnification for any loan losses of NCSC and RTFC pursuant to guarantee agreements with each company. CFC earns management and guarantee fees from its agreements with NCSC and RTFC.
NCSC and RTFC creditors have no recourse against CFC in the event of a default by NCSC and RTFC, unless there is a guarantee agreement under which CFC has guaranteed NCSC or RTFC debt obligations to a third party. The following table provides information on incremental consolidated assets and liabilities of VIEs included in CFC’s consolidated financial statements, after intercompany eliminations, as of August 31, 2020 and May 31, 2020.
88
NATIONAL RURAL UTILITIES COOPERATIVE FINANCE CORPORATION
NOTES TO CONSOLIDATED FINANCIAL STATEMENTS
(UNAUDITED)
13.1: Consolidated Assets and Liabilities of Variable Interest Entities
(Dollars in thousands) | August 31, 2020 | May 31, 2020 | ||||||
Assets: | ||||||||
Loans outstanding | $ | 1,077,439 | $ | 1,083,197 | ||||
Other assets | 10,371 | 11,352 | ||||||
Total assets | $ | 1,087,810 | $ | 1,094,549 | ||||
Liabilities: | ||||||||
Long-term debt | $ | — | $ | — | ||||
Other liabilities | 37,397 | 38,803 | ||||||
Total liabilities | $ | 37,397 | $ | 38,803 | ||||
The following table provides information on CFC’s credit commitments to NCSC and RTFC and potential exposure to loss under these commitments as of August 31, 2020 and May 31, 2020.
13.2: CFC Exposure Under Credit Commitments to NCSC and RTFC
(Dollars in thousands) | August 31, 2020 | May 31, 2020 | ||||||
CFC credit commitments to NCSC and RTFC: | ||||||||
Total CFC credit commitments | $ | 5,500,000 | $ | 5,500,000 | ||||
Outstanding commitments: | ||||||||
Borrowings payable to CFC(1) | 1,055,979 | 1,062,103 | ||||||
Credit enhancements: | ||||||||
CFC third-party guarantees | 9,769 | 9,999 | ||||||
Other credit enhancements | 11,290 | 11,755 | ||||||
Total credit enhancements(2) | 21,059 | 21,754 | ||||||
Total outstanding commitments | 1,077,038 | 1,083,857 | ||||||
CFC credit commitments available(3) | $ | 4,422,962 | $ | 4,416,143 | ||||
____________________________
(1) Borrowings payable to CFC are eliminated in consolidation.
(2) Excludes interest due on these instruments.
(3) Represents total CFC credit commitments less outstanding commitments as of each period end.
CFC loans to NCSC and RTFC are secured by all assets and revenue of NCSC and RTFC. CFC’s maximum potential exposure, including interest due, for the credit enhancements totaled $21 million as of August 31, 2020. The maturities for obligations guaranteed by CFC extend through 2031.
NOTE 14—BUSINESS SEGMENTS |
Our activities are conducted through three operating segments, which are based on each of the legal entities included in our consolidated financial statements: CFC, NCSC and RTFC. We report segment information for CFC separately, while we aggregate NCSC and RTFC and report combined segment information for these entities. The following table presents our reportable business segment results for the three months ended August 31, 2020 and 2019, assets attributable to each segment as of August 31, 2020 and 2019 and a reconciliation to amounts reported in our consolidated financial statements.
89
NATIONAL RURAL UTILITIES COOPERATIVE FINANCE CORPORATION
NOTES TO CONSOLIDATED FINANCIAL STATEMENTS
(UNAUDITED)
Table 14.1: Business Segment Information
Three Months Ended August 31, 2020 | ||||||||||||||||
(Dollars in thousands) | CFC | NCSC and RTFC | Elimination | Consolidated Total | ||||||||||||
Statement of operations: | ||||||||||||||||
Interest income | $ | 277,596 | $ | 11,009 | $ | (9,021 | ) | $ | 279,584 | |||||||
Interest expense | (179,976 | ) | (9,021 | ) | 9,021 | (179,976 | ) | |||||||||
Net interest income | 97,620 | 1,988 | — | 99,608 | ||||||||||||
(Provision) benefit for credit losses | (326 | ) | 1,066 | (1,066 | ) | (326 | ) | |||||||||
Net interest income after (provision) benefit for credit losses | 97,294 | 3,054 | (1,066 | ) | 99,282 | |||||||||||
Non-interest income: | ||||||||||||||||
Fee and other income | 4,775 | (516 | ) | (743 | ) | 3,516 | ||||||||||
Derivative gains (losses): | ||||||||||||||||
Derivative cash settlements interest expense | (26,563 | ) | (409 | ) | — | (26,972 | ) | |||||||||
Derivative forward value gains | 86,783 | 465 | — | 87,248 | ||||||||||||
Derivative gains | 60,220 | 56 | — | 60,276 | ||||||||||||
Investment securities gains | 4,659 | — | — | 4,659 | ||||||||||||
Total non-interest income | 69,654 | (460 | ) | (743 | ) | 68,451 | ||||||||||
Non-interest expense: | ||||||||||||||||
General and administrative expenses | (22,200 | ) | (2,057 | ) | 1,594 | (22,663 | ) | |||||||||
Other non-interest expense | (332 | ) | (215 | ) | 215 | (332 | ) | |||||||||
Total non-interest expense | (22,532 | ) | (2,272 | ) | 1,809 | (22,995 | ) | |||||||||
Income before income taxes | 144,416 | 322 | — | 144,738 | ||||||||||||
Income tax provision | — | (151 | ) | — | (151 | ) | ||||||||||
Net income | $ | 144,416 | $ | 171 | $ | — | $ | 144,587 | ||||||||
August 31, 2020 | ||||||||||||||||
CFC | NCSC and RTFC | Elimination | Consolidated Total | |||||||||||||
Assets: | ||||||||||||||||
Total loans outstanding | $ | 26,895,639 | $ | 1,077,439 | $ | (1,055,979 | ) | $ | 26,917,099 | |||||||
Deferred loan origination costs | 11,778 | — | — | 11,778 | ||||||||||||
Loans to members | 26,907,416 | 1,077,439 | (1,055,979 | ) | 26,928,877 | |||||||||||
Less: Allowance for credit losses | (57,351 | ) | — | — | (57,351 | ) | ||||||||||
Loans to members, net | 26,850,065 | 1,077,439 | (1,055,979 | ) | 26,871,526 | |||||||||||
Other assets | 1,380,725 | 104,924 | (94,554 | ) | 1,391,095 | |||||||||||
Total assets | $ | 28,230,790 | $ | 1,182,363 | $ | (1,150,533 | ) | $ | 28,262,621 | |||||||
90
NATIONAL RURAL UTILITIES COOPERATIVE FINANCE CORPORATION
NOTES TO CONSOLIDATED FINANCIAL STATEMENTS
(UNAUDITED)
Three Months Ended August 31, 2019 | ||||||||||||||||
(Dollars in thousands) | CFC | NCSC and RTFC | Elimination | Consolidated Total | ||||||||||||
Statement of operations: | ||||||||||||||||
Interest income | $ | 287,964 | $ | 12,347 | $ | (10,296 | ) | $ | 290,015 | |||||||
Interest expense | (213,135 | ) | (10,432 | ) | 10,296 | (213,271 | ) | |||||||||
Net interest income | 74,829 | 1,915 | — | 76,744 | ||||||||||||
Provision for credit losses | (30 | ) | — | — | (30 | ) | ||||||||||
Net interest income after provision for credit loses | 74,799 | 1,915 | — | 76,714 | ||||||||||||
Non-interest income: | ||||||||||||||||
Fee and other income | 12,282 | 7,821 | (9,162 | ) | 10,941 | |||||||||||
Derivative losses: | ||||||||||||||||
Derivative cash settlements interest expense | (10,801 | ) | (242 | ) | — | (11,043 | ) | |||||||||
Derivative forward value losses | (382,762 | ) | (1,920 | ) | — | (384,682 | ) | |||||||||
Derivative losses | (393,563 | ) | (2,162 | ) | — | (395,725 | ) | |||||||||
Investment securities gains | 1,620 | — | — | 1,620 | ||||||||||||
Total non-interest income | (379,661 | ) | 5,659 | (9,162 | ) | (383,164 | ) | |||||||||
Non-interest expense: | ||||||||||||||||
General and administrative expenses | (24,739 | ) | (2,235 | ) | 1,645 | (25,329 | ) | |||||||||
Other non-interest expense | 7,179 | (7,517 | ) | 7,517 | 7,179 | |||||||||||
Total non-interest expense | (17,560 | ) | (9,752 | ) | 9,162 | (18,150 | ) | |||||||||
Loss before income taxes | (322,422 | ) | (2,178 | ) | — | (324,600 | ) | |||||||||
Income tax benefit | — | 521 | — | 521 | ||||||||||||
Net loss | $ | (322,422 | ) | $ | (1,657 | ) | $ | — | $ | (324,079 | ) | |||||
August 31, 2019 | ||||||||||||||||
CFC | NCSC and RTFC | Elimination | Consolidated Total | |||||||||||||
Assets: | ||||||||||||||||
Total loans outstanding | $ | 26,258,810 | $ | 1,048,892 | $ | (1,019,103 | ) | $ | 26,288,599 | |||||||
Deferred loan origination costs | 11,239 | — | — | 11,239 | ||||||||||||
Loans to members | 26,270,049 | 1,048,892 | (1,019,103 | ) | 26,299,838 | |||||||||||
Less: Allowance for credit losses | (17,565 | ) | — | — | (17,565 | ) | ||||||||||
Loans to members, net | 26,252,484 | 1,048,892 | (1,019,103 | ) | 26,282,273 | |||||||||||
Other assets | 1,286,409 | 105,290 | (95,216 | ) | 1,296,483 | |||||||||||
Total assets | $ | 27,538,893 | $ | 1,154,182 | $ | (1,114,319 | ) | $ | 27,578,756 | |||||||
91
Item 3. | Quantitative and Qualitative Disclosures About Market Risk |
For quantitative and qualitative disclosures about market risk, see “Part I—Item 2. MD&A—Market Risk” and “Note 9—Derivative Instruments and Hedging Activities.”
Item 4. | Controls and Procedures |
As of the end of the period covered by this report, senior management, including the Chief Executive Officer and Chief Financial Officer, evaluated the effectiveness of our disclosure controls and procedures as defined in Rules 13a-15(e) and 15d-15(e) of the Securities Exchange Act of 1934. Based on this evaluation process, the Chief Executive Officer and Chief Financial Officer concluded that our disclosure controls and procedures are effective. There were no changes in our internal control over financial reporting that occurred during the three months ended August 31, 2020 that have materially affected, or are reasonably likely to materially affect, our internal control over financial reporting.
In addition, subsequent to August 31, 2020, we have not experienced material changes in our internal control over financial reporting resulting from our transition in mid-March 2020 from an office-based working culture to remote working, currently on a staggered basis, for the substantial majority of employees due to the COVID-19 pandemic. We continue to monitor COVID-19 developments to assess potential changes in our operating environment and determine whether it is necessary to develop and implement significant new processes, procedures and controls in response to developments.
PART II—OTHER INFORMATION
Item 1. | Legal Proceedings |
From time to time, CFC is subject to certain legal proceedings and claims in the ordinary course of business, including litigation with borrowers related to enforcement or collection actions. Management presently believes that the ultimate outcome of these proceedings, individually and in the aggregate, will not materially harm our financial position, liquidity or results of operations. CFC establishes reserves for specific legal matters when it determines that the likelihood of an unfavorable outcome is probable and the loss is reasonably estimable. Accordingly, no reserve has been recorded with respect to any legal proceedings at this time.
Item 1A. | Risk Factors |
Our financial condition, results of operations and liquidity are subject to various risks and uncertainties, some of which are inherent in the financial services industry and others of which are more specific to our own business. We identify and discuss the most significant risk factors of which we are currently aware that could have a material adverse impact on our business, results of operations, financial condition or liquidity in the section “Part I—Item 1A. Risk Factors” in our 2020 Form 10-K, as filed with the SEC on August 5, 2020. We are not aware of any material changes in the risk factors identified in our 2020 Form 10-K. However, other risks and uncertainties, including those not currently known to us, could also negatively impact our business, results of operations, financial condition and liquidity. Therefore, the risk factors identified and discussed in our 2020 Form 10-K should not be considered a complete discussion of all the risks and uncertainties we may face. For information on how we manage our key risks, see “Item 7. MD&A—Risk Management” in our 2020 Form 10-K.
Item 2. | Unregistered Sales of Equity Securities and Use of Proceeds |
Not applicable.
Item 3. | Defaults Upon Senior Securities |
Not applicable.
92
Item 4. | Mine Safety Disclosures |
Not applicable.
Item 5. | Other Information |
None.
Item 6. Exhibits
The following exhibits are incorporated by reference or filed as part of this Report.
EXHIBIT INDEX
Exhibit No. | Description | |
3.2* | — | |
31.1* | — | |
31.2* | — | |
32.1† | — | |
32.2† | — | |
101.INS* | — | XBRL Instance Document |
101.SCH* | — | XBRL Taxonomy Extension Schema Document |
101.CAL* | — | XBRL Taxonomy Calculation Linkbase Document |
101.LAB* | — | XBRL Taxonomy Label Linkbase Document |
101.PRE* | — | XBRL Taxonomy Presentation Linkbase Document |
101.DEF* | — | XBRL Taxonomy Definition Linkbase Document |
____________________________
* Filed herewith this Report.
† Furnished with this Report, which shall not be deemed “filed” for purposes of Section 18 of the Securities Exchange Act of 1934, or otherwise subject to the liability of that Section.
93
SIGNATURES
Pursuant to the requirements of the Securities Exchange Act of 1934, the registrant has duly caused this report to be signed on its behalf by the undersigned thereunto duly authorized.
NATIONAL RURAL UTILITIES |
COOPERATIVE FINANCE CORPORATION |
Date: October 15, 2020
By: | /s/ J. ANDREW DON |
J. Andrew Don | |
Senior Vice President and Chief Financial Officer | |
By: | /s/ ROBERT E. GEIER |
Robert E. Geier | |
Controller and Principal Accounting Officer | |
94