Attached files
| file | filename |
|---|---|
| EX-99.1 - EXHIBIT 99.2 - AVADEL PHARMACEUTICALS PLC | v446255_ex99-1.htm |
| 8-K - FORM 8-K - AVADEL PHARMACEUTICALS PLC | v446255_8k.htm |
Exhibit 99.2

August 8, 2016 Second Quarter 2016 Earnings Conference Call 1 Second Quarter 2016 Earnings Conference Call August 8, 2016
August 8, 2016 Second Quarter 2016 Earnings Conference Call 2 Forward Looking Statements This presentation may include "forward - looking statements" within the meaning of the Private Securities Litigation Reform Act of 1995. All statements herein that are not clearly historical in nature are forward - looking, and the words "anticipate," "assume," "believe," "expect," "estimate," "plan," "will," "may," and the negative of these and similar expressions generally identify for ward - looking statements. All forward - looking statements involve risks, uncertainties and contingencies, many of which are beyond Flamel's control and could cause actual results to differ materially from the results contemplated in such forward - looking statements. These risks, uncertainties and contingencies include the risks relating to: our dependence on a small number of products and customers for the majority of our revenues; the possibility that our Bloxiverz ® and Vazculep ® products, which are not patent protected, could face substantial competition resulting in a loss of market share or forcing us to reduce the prices w e c harge for those products; the possibility that we could fail to successfully complete the research and development for the two pipe lin e products we are evaluating for potential application to the FDA pursuant to our "unapproved - to - approved" strategy, or that competitors could complete the development of such products and apply for FDA approval of such products before us; our dependence on the performance of third parties in partnerships or strategic alliances for the commercialization of some of ou r products; the possibility that our products may not reach the commercial market or gain market acceptance; our need to invest substantial sums in research and development in order to remain competitive; our dependence on certain single providers for development of several of our drug delivery platforms and products; our dependence on a limited number of suppliers to manufacture our products and to deliver certain raw materials used in our products; the possibility that our competitors may develop and market technologies or products that are more effective or safer than ours, or obtain regulatory approval and mar ket such technologies or products before we do; the challenges in protecting the intellectual property underlying our drug delive ry platforms and other products; our dependence on key personnel to execute our business plan; the amount of additional costs we will incur to comply with U.S. securities laws as a result of our ceasing to qualify as a foreign private issuer; and the oth er risks, uncertainties and contingencies described in the Company's filings with the U.S. Securities and Exchange Commission, includin g o ur annual report on Form 10 - K for the year ended December 31, 2015, all of which filings are also available on the Company's website. Flamel undertakes no obligation to update its forward - looking statements as a result of new information, future events or otherwise, except as required by law.
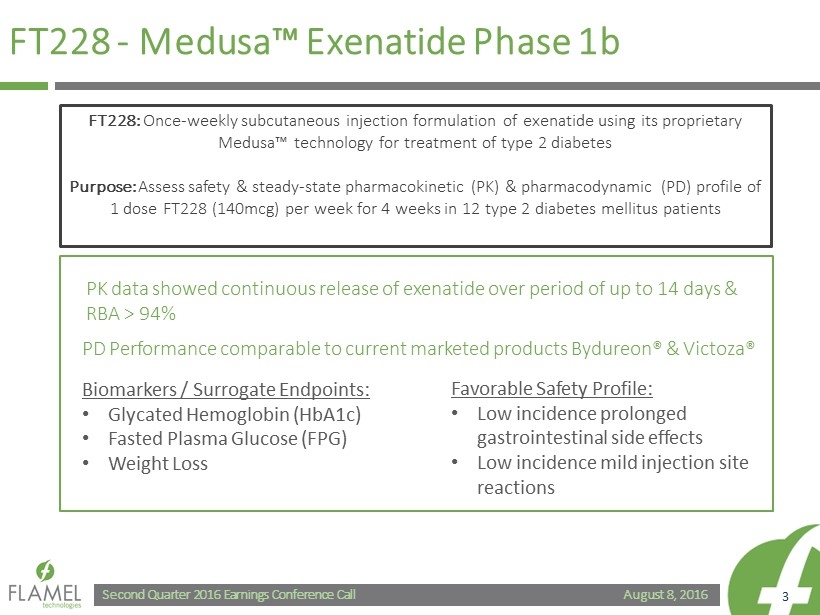
August 8, 2016 Second Quarter 2016 Earnings Conference Call 3 FT228 - Medusa™ Exenatide Phase 1b PD Performance comparable to current marketed products Bydureon ® & Victoza ® Biomarkers / Surrogate Endpoints: • Glycated Hemoglobin (HbA1c) • Fasted Plasma Glucose (FPG) • Weight Loss Favorable Safety Profile: • Low incidence prolonged gastrointestinal side effects • Low incidence mild injection site reactions FT228: Once - weekly subcutaneous injection formulation of exenatide using its proprietary Medusa™ technology for treatment of type 2 diabetes Purpose: Assess safety & steady - state pharmacokinetic (PK) & pharmacodynamic (PD) profile of 1 dose FT228 (140mcg) per week for 4 weeks in 12 type 2 diabetes mellitus patients PK data showed continuous release of exenatide over period of up to 14 days & RBA > 94%
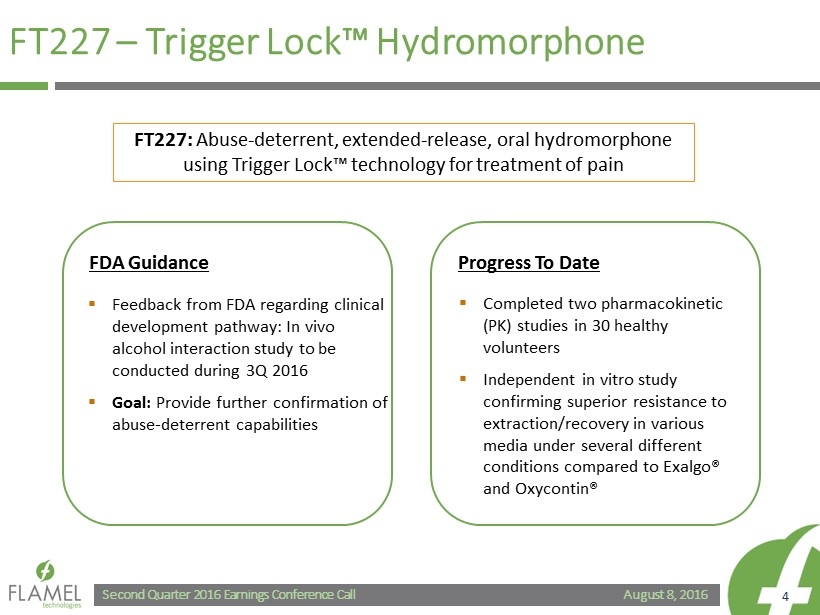
August 8, 2016 Second Quarter 2016 Earnings Conference Call 4 FT227 – Trigger Lock™ Hydromorphone ▪ Completed two pharmacokinetic (PK) studies in 30 healthy volunteers ▪ Independent in vitro study confirming superior resistance to extraction/recovery in various media under several different conditions compared to Exalgo ® and Oxycontin ® FT227: Abuse - deterrent, extended - release, oral hydromorphone using Trigger Lock™ technology for treatment of pain ▪ Feedback from FDA regarding clinical development pathway: In vivo alcohol interaction study to be conducted during 3Q 2016 ▪ Goal: Provide further confirmation of abuse - deterrent capabilities FDA Guidance Progress To Date
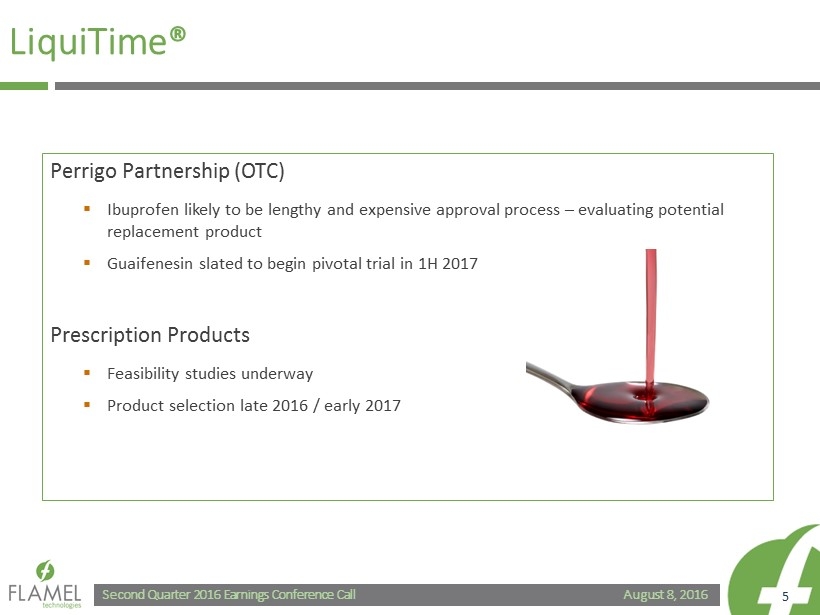
August 8, 2016 Second Quarter 2016 Earnings Conference Call 5 LiquiTime ® Perrigo Partnership (OTC) ▪ Ibuprofen likely to be lengthy and expensive approval process – evaluating potential replacement product ▪ Guaifenesin slated to begin pivotal trial in 1H 2017 Prescription Products ▪ Feasibility studies underway ▪ Product selection late 2016 / early 2017
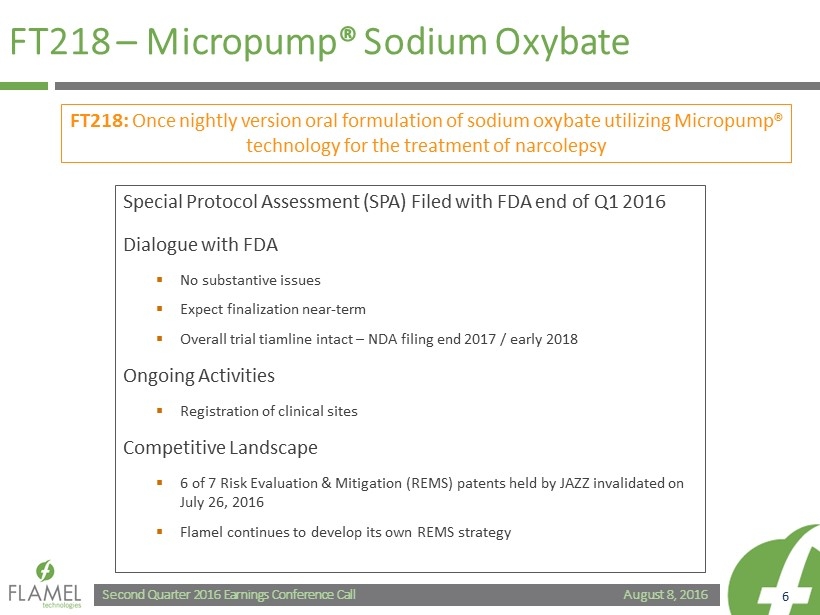
August 8, 2016 Second Quarter 2016 Earnings Conference Call 6 FT218 – Micropump ® Sodium Oxybate Special Protocol Assessment (SPA) Filed with FDA end of Q1 2016 Dialogue with FDA ▪ No substantive issues ▪ Expect finalization near - term ▪ Overall trial tiamline intact – NDA filing end 2017 / early 2018 Ongoing Activities ▪ Registration of clinical sites Competitive Landscape ▪ 6 of 7 Risk Evaluation & Mitigation (REMS) patents held by JAZZ invalidated on July 26, 2016 ▪ Flamel continues to develop its own REMS strategy FT218: Once nightly version oral formulation of sodium oxybate utilizing Micropump ® technology for the treatment of narcolepsy
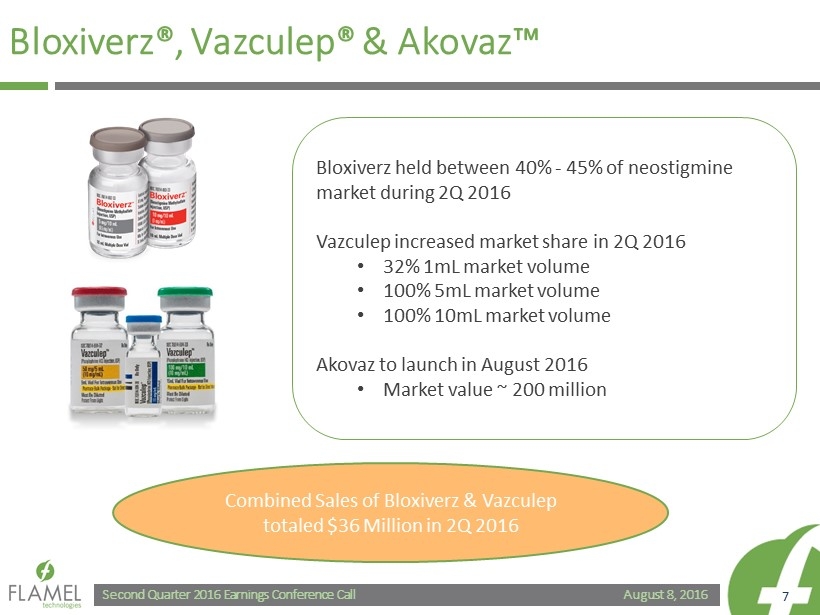
August 8, 2016 Second Quarter 2016 Earnings Conference Call 7 Bloxiverz ®, Vazculep ® & Akovaz ™ Bloxiverz held between 40% - 45% of neostigmine market during 2Q 2016 Vazculep increased market share in 2Q 2016 • 32% 1mL market volume • 100% 5mL market volume • 100% 10mL market volume Akovaz to launch in August 2016 • Market value ~ 200 million Combined Sales of Bloxiverz & Vazculep totaled $36 Million in 2Q 2016
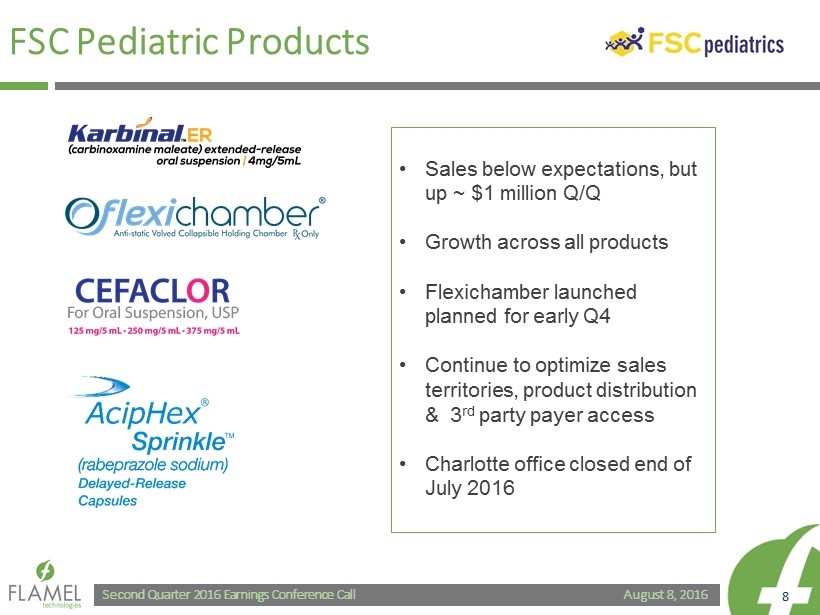
August 8, 2016 Second Quarter 2016 Earnings Conference Call 8 FSC Pediatric Products • Sales below expectations, but up ~ $1 million Q/Q • Growth across all products • Flexichamber launched planned for early Q4 • Continue to optimize sales territories, product distribution & 3 rd party payer access • Charlotte office closed end of July 2016
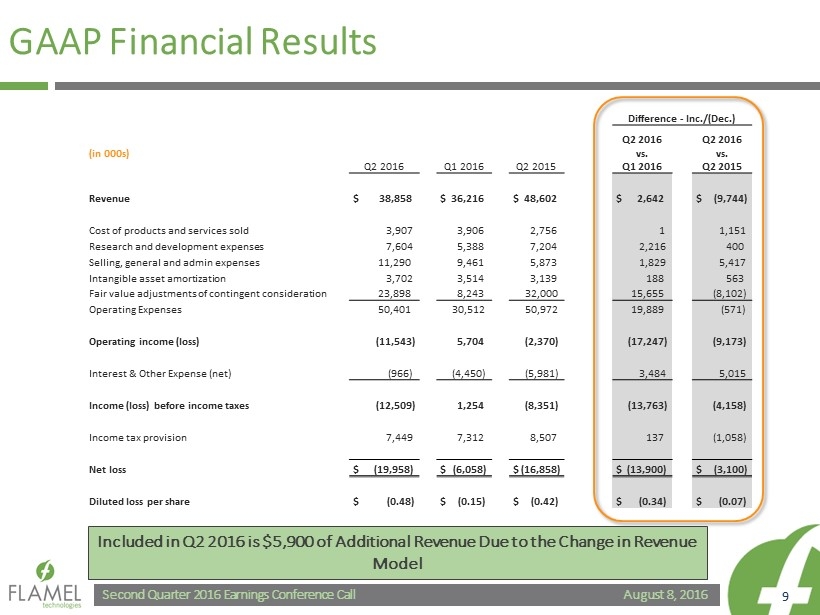
August 8, 2016 Second Quarter 2016 Earnings Conference Call 9 GAAP Financial Results Difference - Inc./(Dec.) (in 000s) Q2 2016 Q1 2016 Q2 2015 Q2 2016 vs. Q1 2016 Q2 2016 vs. Q2 2015 Revenue $ 38,858 $ 36,216 $ 48,602 $ 2,642 $ (9,744) Cost of products and services sold 3,907 3,906 2,756 1 1,151 Research and development expenses 7,604 5,388 7,204 2,216 400 Selling, general and admin expenses 11,290 9,461 5,873 1,829 5,417 Intangible asset amortization 3,702 3,514 3,139 188 563 Fair value adjustments of contingent consideration 23,898 8,243 32,000 15,655 (8,102) Operating Expenses 50,401 30,512 50,972 19,889 (571) Operating income (loss) (11,543) 5,704 (2,370) (17,247) (9,173) Interest & Other Expense (net) (966) (4,450) (5,981) 3,484 5,015 Income (loss) before income taxes (12,509) 1,254 (8,351) (13,763) (4,158) Income tax provision 7,449 7,312 8,507 137 (1,058) Net loss $ (19,958) $ (6,058) $ (16,858) $ (13,900) $ (3,100) Diluted loss per share $ (0.48) $ (0.15) $ (0.42) $ (0.34) $ (0.07) Included in Q2 2016 is $5,900 of Additional Revenue Due to the Change in Revenue Model
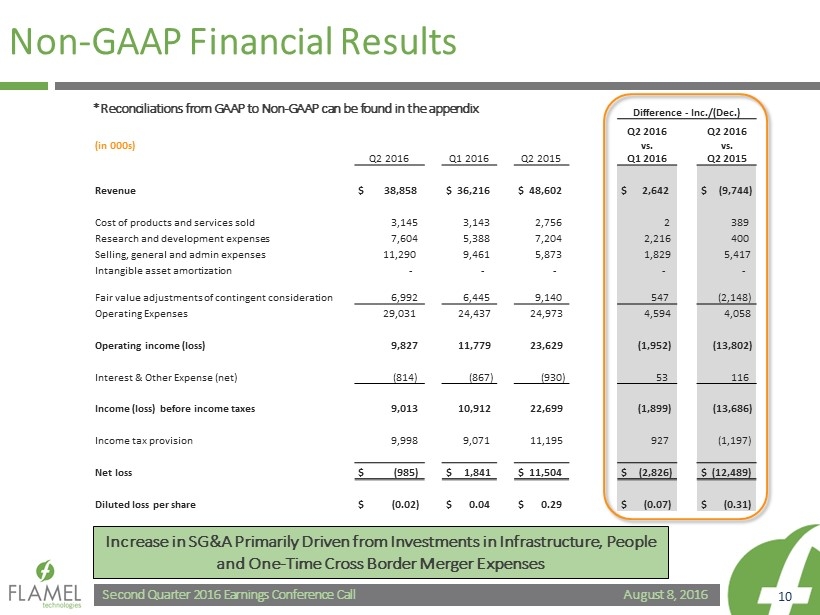
August 8, 2016 Second Quarter 2016 Earnings Conference Call 10 Non - GAAP Financial Results Difference - Inc./(Dec.) (in 000s) Q2 2016 Q1 2016 Q2 2015 Q2 2016 vs. Q1 2016 Q2 2016 vs. Q2 2015 Revenue $ 38,858 $ 36,216 $ 48,602 $ 2,642 $ (9,744) Cost of products and services sold 3,145 3,143 2,756 2 389 Research and development expenses 7,604 5,388 7,204 2,216 400 Selling, general and admin expenses 11,290 9,461 5,873 1,829 5,417 Intangible asset amortization - - - - - Fair value adjustments of contingent consideration 6,992 6,445 9,140 547 (2,148) Operating Expenses 29,031 24,437 24,973 4,594 4,058 Operating income (loss) 9,827 11,779 23,629 (1,952) (13,802) Interest & Other Expense (net) (814) (867) (930) 53 116 Income (loss) before income taxes 9,013 10,912 22,699 (1,899) (13,686) Income tax provision 9,998 9,071 11,195 927 (1,197) Net loss $ (985) $ 1,841 $ 11,504 $ (2,826) $ (12,489) Diluted loss per share $ (0.02) $ 0.04 $ 0.29 $ (0.07) $ (0.31) Increase in SG&A Primarily Driven from Investments in Infrastructure, People and One - Time Cross Border Merger Expenses *Reconciliations from GAAP to Non - GAAP can be found in the appendix
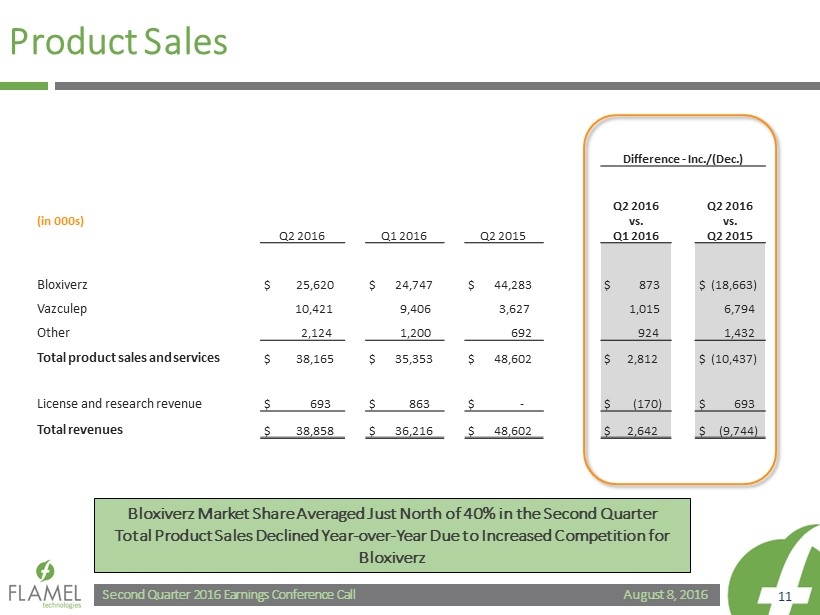
August 8, 2016 Second Quarter 2016 Earnings Conference Call 11 Product Sales Difference - Inc./(Dec.) (in 000s) Q2 2016 Q1 2016 Q2 2015 Q2 2016 vs. Q1 2016 Q2 2016 vs. Q2 2015 Bloxiverz $ 25,620 $ 24,747 $ 44,283 $ 873 $ (18,663) Vazculep 10,421 9,406 3,627 1,015 6,794 Other 2,124 1,200 692 924 1,432 Total product sales and services $ 38,165 $ 35,353 $ 48,602 $ 2,812 $ (10,437) License and research revenue $ 693 $ 863 $ - $ (170) $ 693 Total revenues $ 38,858 $ 36,216 $ 48,602 $ 2,642 $ (9,744) Bloxiverz Market Share Averaged Just North of 40% in the Second Quarter Total Product Sales Declined Year - over - Year Due to Increased Competition for Bloxiverz
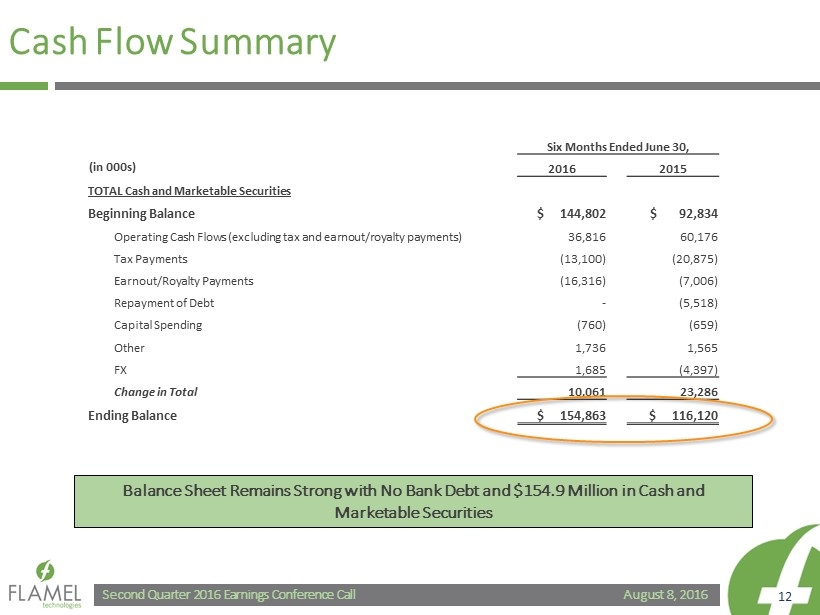
August 8, 2016 Second Quarter 2016 Earnings Conference Call 12 Cash Flow Summary Six Months Ended June 30, 2016 2015 TOTAL Cash and Marketable Securities Beginning Balance $ 144,802 $ 92,834 Operating Cash Flows (excluding tax and earnout /royalty payments) 36,816 60,176 Tax Payments (13,100) (20,875) Earnout /Royalty Payments (16,316) (7,006) Repayment of Debt - (5,518) Capital Spending (760) (659) Other 1,736 1,565 FX 1,685 (4,397) Change in Total 10,061 23,286 Ending Balance $ 154,863 $ 116,120 (in 000s) Balance Sheet Remains Strong with No Bank Debt and $154.9 Million in Cash and Marketable Securities
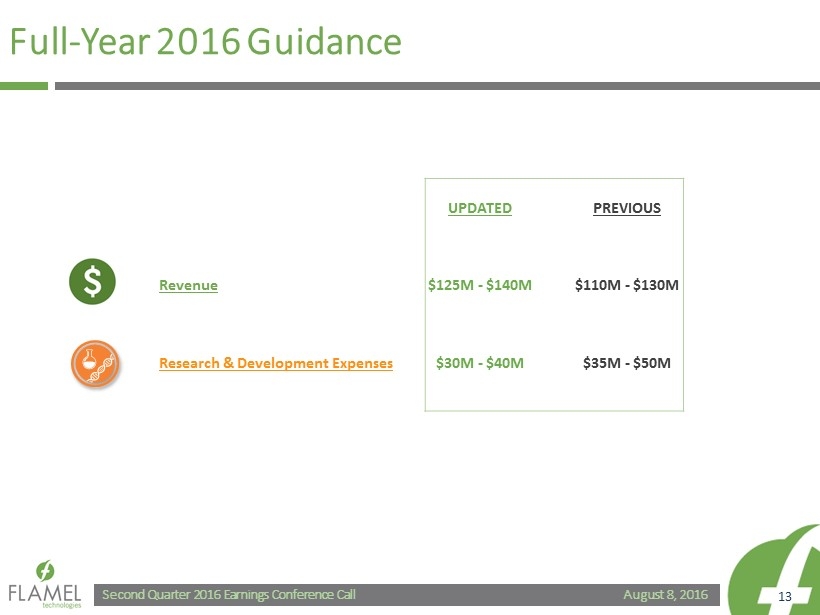
August 8, 2016 Second Quarter 2016 Earnings Conference Call 13 Full - Year 2016 Guidance UPDATED PREVIOUS Revenue $125M - $140M $110M - $130M Research & Development Expenses $30M - $40M $35M - $50M

August 8, 2016 Second Quarter 2016 Earnings Conference Call 14 Question & Answer
August 8, 2016 Second Quarter 2016 Earnings Conference Call 15 Appendix
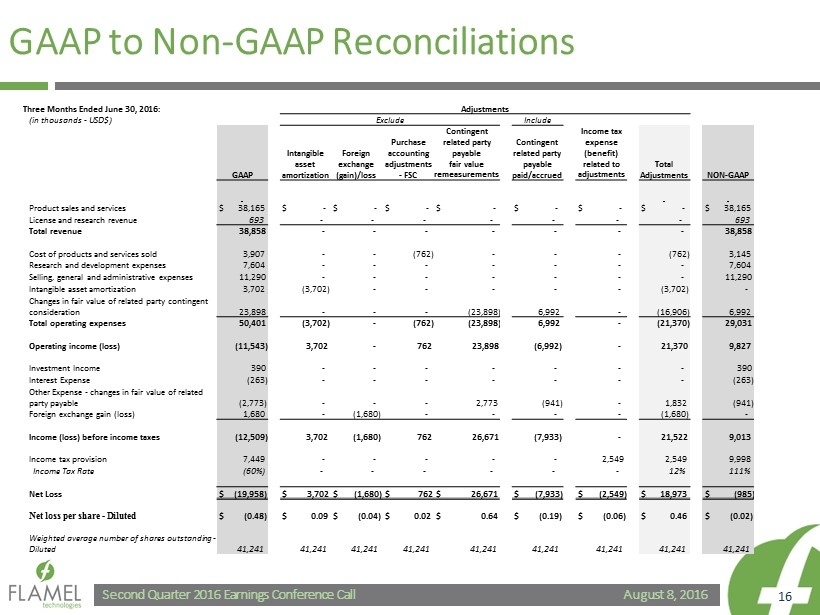
August 8, 2016 Second Quarter 2016 Earnings Conference Call 16 GAAP to Non - GAAP Reconciliations Three Months Ended June 30, 2016: Adjustments (in thousands - USD$) Exclude Include GAAP Intangible asset amortization Foreign exchange (gain)/loss Purchase accounting adjustments - FSC Contingent related party payable fair value remeasurements Contingent related party payable paid/accrued Income tax expense (benefit) related to adjustments Total Adjustments NON - GAAP Product sales and services $ 38,165 $ - $ - $ - $ - $ - $ - $ - $ 38,165 License and research revenue 693 - - - - - - - 693 Total revenue 38,858 - - - - - - - 38,858 Cost of products and services sold 3,907 - - (762) - - - (762) 3,145 Research and development expenses 7,604 - - - - - - - 7,604 Selling, general and administrative expenses 11,290 - - - - - - - 11,290 Intangible asset amortization 3,702 (3,702) - - - - - (3,702) - Changes in fair value of related party contingent consideration 23,898 - - - (23,898) 6,992 - (16,906) 6,992 Total operating expenses 50,401 (3,702) - (762) (23,898) 6,992 - (21,370) 29,031 Operating income (loss) (11,543) 3,702 - 762 23,898 (6,992) - 21,370 9,827 Investment Income 390 - - - - - - - 390 Interest Expense (263) - - - - - - - (263) Other Expense - changes in fair value of related party payable (2,773) - - - 2,773 (941) - 1,832 (941) Foreign exchange gain (loss) 1,680 - (1,680) - - - - (1,680) - Income (loss) before income taxes (12,509) 3,702 (1,680) 762 26,671 (7,933) - 21,522 9,013 Income tax provision 7,449 - - - - - 2,549 2,549 9,998 Income Tax Rate (60%) - - - - - - 12% 111% Net Loss $ (19,958) $ 3,702 $ (1,680) $ 762 $ 26,671 $ (7,933) $ (2,549) $ 18,973 $ (985) Net loss per share - Diluted $ (0.48) $ 0.09 $ (0.04) $ 0.02 $ 0.64 $ (0.19) $ (0.06) $ 0.46 $ (0.02) Weighted average number of shares outstanding - Diluted 41,241 41,241 41,241 41,241 41,241 41,241 41,241 41,241 41,241
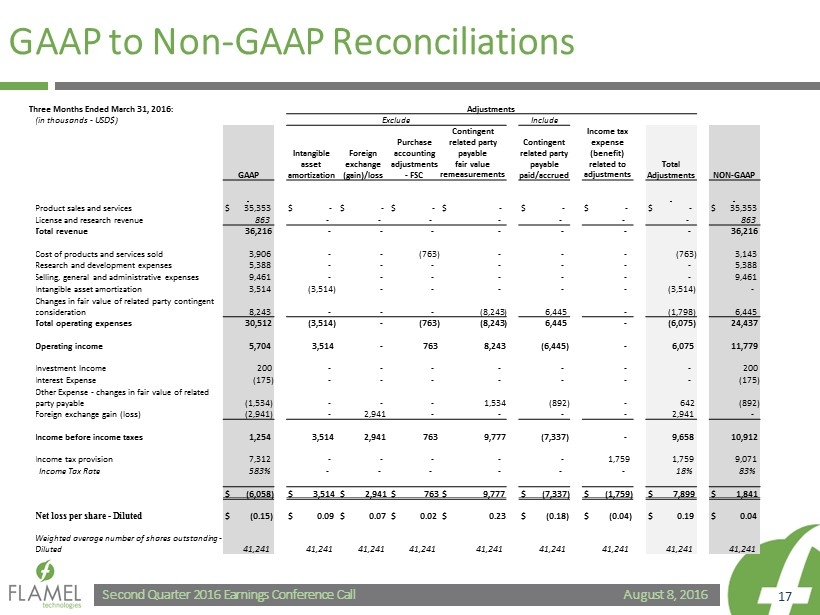
August 8, 2016 Second Quarter 2016 Earnings Conference Call 17 GAAP to Non - GAAP Reconciliations Three Months Ended March 31, 2016: Adjustments (in thousands - USD$) Exclude Include GAAP Intangible asset amortization Foreign exchange (gain)/loss Purchase accounting adjustments - FSC Contingent related party payable fair value remeasurements Contingent related party payable paid/accrued Income tax expense (benefit) related to adjustments Total Adjustments NON - GAAP Product sales and services $ 35,353 $ - $ - $ - $ - $ - $ - $ - $ 35,353 License and research revenue 863 - - - - - - - 863 Total revenue 36,216 - - - - - - - 36,216 Cost of products and services sold 3,906 - - (763) - - - (763) 3,143 Research and development expenses 5,388 - - - - - - - 5,388 Selling, general and administrative expenses 9,461 - - - - - - - 9,461 Intangible asset amortization 3,514 (3,514) - - - - - (3,514) - Changes in fair value of related party contingent consideration 8,243 - - - (8,243) 6,445 - (1,798) 6,445 Total operating expenses 30,512 (3,514) - (763) (8,243) 6,445 - (6,075) 24,437 Operating income 5,704 3,514 - 763 8,243 (6,445) - 6,075 11,779 Investment Income 200 - - - - - - - 200 Interest Expense (175) - - - - - - - (175) Other Expense - changes in fair value of related party payable (1,534) - - - 1,534 (892) - 642 (892) Foreign exchange gain (loss) (2,941) - 2,941 - - - - 2,941 - Income before income taxes 1,254 3,514 2,941 763 9,777 (7,337) - 9,658 10,912 Income tax provision 7,312 - - - - - 1,759 1,759 9,071 Income Tax Rate 583% - - - - - - 18% 83% $ (6,058) $ 3,514 $ 2,941 $ 763 $ 9,777 $ (7,337) $ (1,759) $ 7,899 $ 1,841 Net loss per share - Diluted $ (0.15) $ 0.09 $ 0.07 $ 0.02 $ 0.23 $ (0.18) $ (0.04) $ 0.19 $ 0.04 Weighted average number of shares outstanding - Diluted 41,241 41,241 41,241 41,241 41,241 41,241 41,241 41,241 41,241
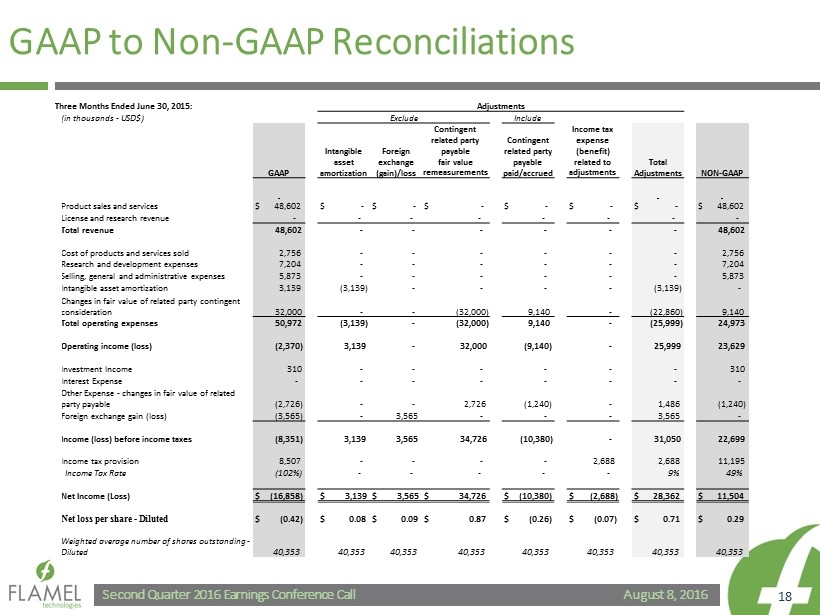
August 8, 2016 Second Quarter 2016 Earnings Conference Call 18 GAAP to Non - GAAP Reconciliations Three Months Ended June 30, 2015: Adjustments (in thousands - USD$) Exclude Include Income tax expense (benefit) related to adjustments GAAP Intangible asset amortization Foreign exchange (gain)/loss Contingent related party payable fair value remeasurements Contingent related party payable paid/accrued Total Adjustments NON - GAAP Product sales and services $ 48,602 $ - $ - $ - $ - $ - $ - $ 48,602 License and research revenue - - - - - - - - Total revenue 48,602 - - - - - - 48,602 Cost of products and services sold 2,756 - - - - - - 2,756 Research and development expenses 7,204 - - - - - - 7,204 Selling, general and administrative expenses 5,873 - - - - - - 5,873 Intangible asset amortization 3,139 (3,139) - - - - (3,139) - Changes in fair value of related party contingent consideration 32,000 - - (32,000) 9,140 - (22,860) 9,140 Total operating expenses 50,972 (3,139) - (32,000) 9,140 - (25,999) 24,973 Operating income (loss) (2,370) 3,139 - 32,000 (9,140) - 25,999 23,629 Investment Income 310 - - - - - - 310 Interest Expense - - - - - - - - Other Expense - changes in fair value of related party payable (2,726) - - 2,726 (1,240) - 1,486 (1,240) Foreign exchange gain (loss) (3,565) - 3,565 - - - 3,565 - Income (loss) before income taxes (8,351) 3,139 3,565 34,726 (10,380) - 31,050 22,699 Income tax provision 8,507 - - - - 2,688 2,688 11,195 Income Tax Rate (102%) - - - - - 9% 49% Net Income (Loss) $ (16,858) $ 3,139 $ 3,565 $ 34,726 $ (10,380) $ (2,688) $ 28,362 $ 11,504 Net loss per share - Diluted $ (0.42) $ 0.08 $ 0.09 $ 0.87 $ (0.26) $ (0.07) $ 0.71 $ 0.29 Weighted average number of shares outstanding - Diluted 40,353 40,353 40,353 40,353 40,353 40,353 40,353 40,353