Attached files
| file | filename |
|---|---|
| EX-99.2 - EXHIBIT 99.2 - ION GEOPHYSICAL CORP | ioq216earningspresentati.htm |
| EX-99.1 - EXHIBIT 99.1 - ION GEOPHYSICAL CORP | ex991earningsrelease2016-q2.htm |
| 8-K - 8-K - ION GEOPHYSICAL CORP | a8k-2016xq2xearnings.htm |

New Financial Reporting Segments
(Illustrative Only)
August 4, 2016

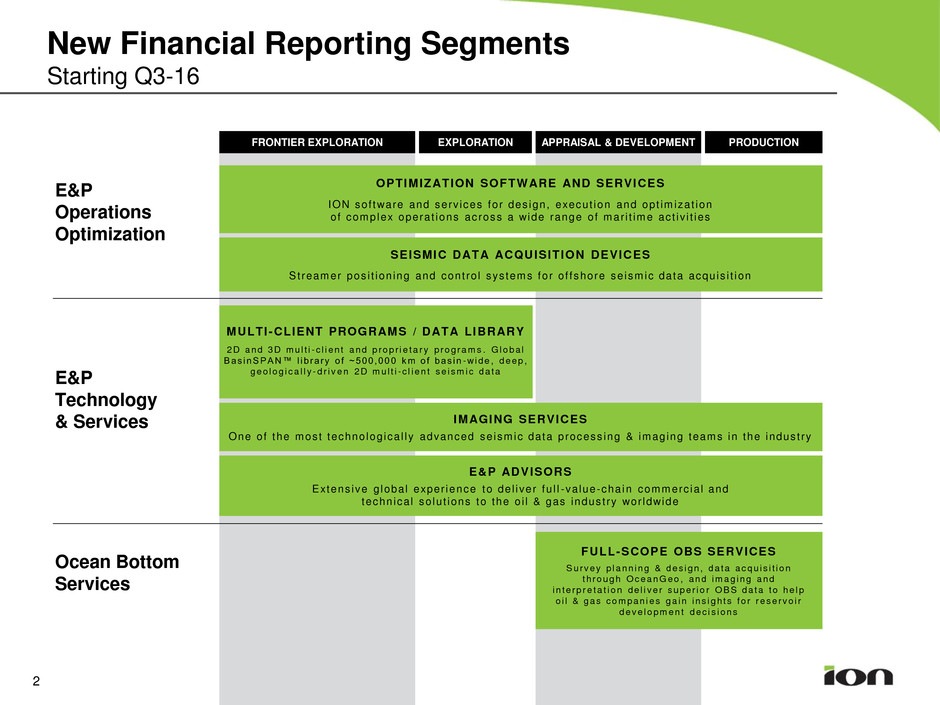
FRONTIER EXPLORATION EXPLORATION APPRAISAL & DEVELOPMENT PRODUCTION
E&P
Operations
Optimization
OPTIMIZATION SOFTWARE AND SERVICES
ION sof tware and serv ices for des ign, execut ion and opt im izat ion
o f complex operat ions ac ross a wide range o f mar i t ime ac t iv i t ies
SEISMIC DATA ACQUISITION DEVICES
St reamer pos i t ion ing and cont ro l sys tems for o f f shore se ism ic data acqu is i t ion
IMAGING SERVICES
One of the mos t technolog ica l l y advanced se ism ic data process ing & imaging teams in the indus t ry
FULL-SCOPE OBS SERVICES
S urvey p l ann ing & des i gn , da ta acqu i s i t i on
t h rough OceanG eo , and im ag ing and
i n te rp r e ta t i on de l i ve r supe r i o r OB S da ta t o he l p
o i l & gas com pan ies ga i n i ns i gh t s f o r rese rvo i r
deve lopm en t dec i s i ons
MULTI-CLIENT PROGRAMS / DATA LIBRARY
2D and 3D m u l t i - c l i en t and p rop r i e ta r y p rog ram s . G loba l
Bas inSPAN™ l i b ra ry o f ~500 ,000 km o f bas i n -w ide , deep ,
geo log i ca l l y - d r i v e n 2D m u l t i - c l i en t se i sm i c da ta
E&P ADVISORS
Extens ive g loba l exper ience to de l i ver fu l l -va lue-cha in commerc ia l and
techn ica l so lu t ions to the o i l & gas indus t ry wor ldwide
E&P
Technology
& Services
Ocean Bottom
Services
New Financial Reporting Segments
Starting Q3-16
2

New Financial Reporting Segments - Q2 & 1H 16
3
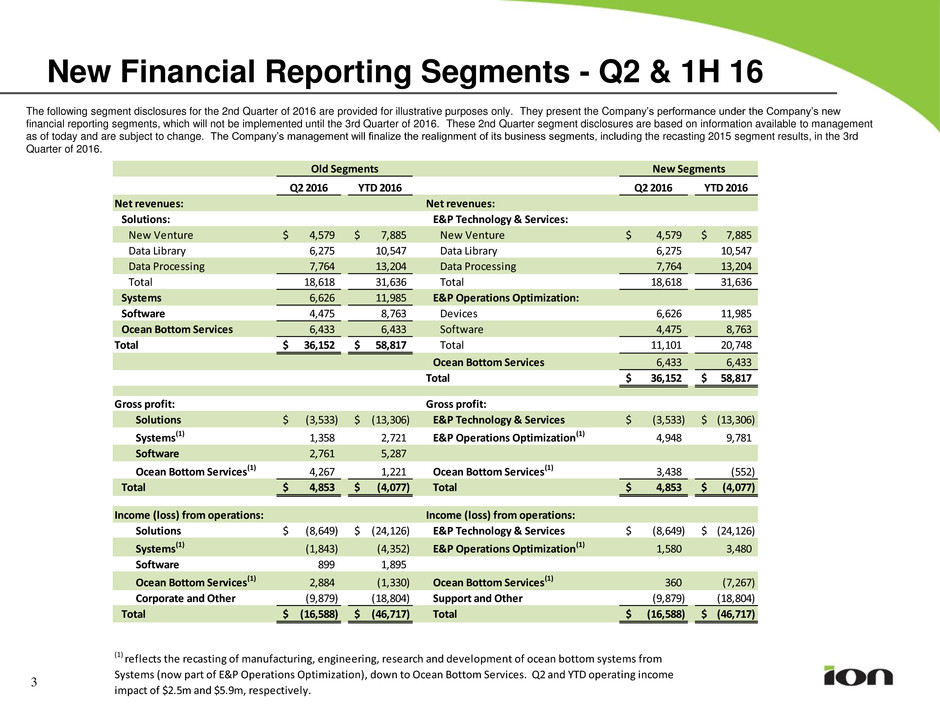
The following segment disclosures for the 2nd Quarter of 2016 are provided for illustrative purposes only. They present the Company’s performance under the Company’s new
financial reporting segments, which will not be implemented until the 3rd Quarter of 2016. These 2nd Quarter segment disclosures are based on information available to management
as of today and are subject to change. The Company’s management will finalize the realignment of its business segments, including the recasting 2015 segment results, in the 3rd
Quarter of 2016.
Q2 2016 YTD 2016 Q2 2016 YTD 2016
Net revenues: Net revenues:
Solutions: E&P Technology & Services:
New Venture 4,579$ 7,885$ New Venture 4,579$ 7,885$
Data Library 6,275 10,547 Data Library 6,275 10,547
Data Processing 7,764 13,204 Data Processing 7,764 13,204
Total 18,618 31,636 Total 18,618 31,636
Systems 6,626 11,985 E&P Operations Optimization:
Software 4,475 8,763 Devices 6,626 11,985
Ocean Bottom Services 6,433 6,433 Software 4,475 8,763
Total 36,152$ 58,817$ Total 11,101 20,748
Ocean Bottom Services 6,433 6,433
Total 36,152$ 58,817$
Gross profit: Gross profit:
Solutions (3,533)$ (13,306)$ E&P Technology & Services (3,533)$ (13,306)$
Systems(1) 1,358 2,721 E&P Operations Optimization(1) 4,948 9,781
Software 2,761 5,287
Ocean Bottom Services(1) 4,267 1,221 Ocean Bottom Services(1) 3,438 (552)
Total 4,853$ (4,077)$ Total 4,853$ (4,077)$
Income (loss) from operations: Income (loss) from operations:
Solutions (8,649)$ (24,126)$ E&P Technology & Services (8,649)$ (24,126)$
Systems(1) (1,843) (4,352) E&P Operations Optimization(1) 1,580 3,480
Software 899 1,895
Ocean Bottom Services(1) 2,884 (1,330) Ocean Bottom Services(1) 360 (7,267)
Corporate and Other (9,879) (18,804) Support and Other (9,879) (18,804)
T l (16,588)$ (46,717)$ Total (16,588)$ (46,717)$
Old Segments New Segments
(1) reflects the recasting of manufacturing, engineering, research and development of ocean bottom systems from
Systems (now part of E&P Operations Optimization), down to Ocean Bottom Services. Q2 and YTD operating income
impact of $2.5m and $5.9m, respectively.

New Financial Reporting Segments - Q2 & IH 15
4
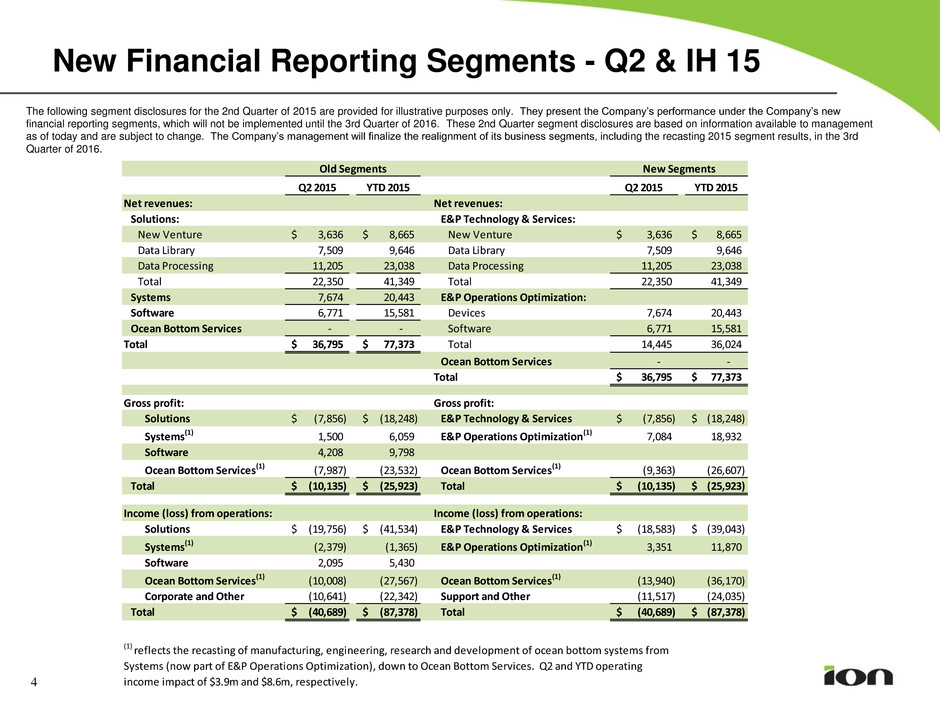
The following segment disclosures for the 2nd Quarter of 2015 are provided for illustrative purposes only. They present the Company’s performance under the Company’s new
financial reporting segments, which will not be implemented until the 3rd Quarter of 2016. These 2nd Quarter segment disclosures are based on information available to management
as of today and are subject to change. The Company’s management will finalize the realignment of its business segments, including the recasting 2015 segment results, in the 3rd
Quarter of 2016.
Q2 2015 YTD 2015 Q2 2015 YTD 2015
Net revenues: Net revenues:
Solutions: E&P Technology & Services:
New Venture 3,636$ 8,665$ New Venture 3,636$ 8,665$
Data Library 7,509 9,646 Data Library 7,509 9,646
Data Processing 11,205 23,038 Data Processing 11,205 23,038
Total 22,350 41,349 Total 22,350 41,349
Systems 7,674 20,443 E&P Operations Optimization:
Software 6,771 15,581 Devices 7,674 20,443
Ocean Bottom Services - - Software 6,771 15,581
Total 36,795$ 77,373$ Total 14,445 36,024
Ocean Bottom Services - -
Total 36,795$ 77,373$
Gross profit: Gross profit:
Solutions (7,856)$ (18,248)$ E&P Technology & Services (7,856)$ (18,248)$
Systems(1) 1,500 6,059 E&P Operations Optimization(1) 7,084 18,932
Software 4,208 9,798
Ocean Bottom Services(1) (7,987) (23,532) Ocean Bottom Services(1) (9,363) (26,607)
Total (10,135)$ (25,923)$ Total (10,135)$ (25,923)$
Income (loss) from operations: Income (loss) from operations:
Solutions (19,756)$ (41,534)$ E&P Technology & Services (18,583)$ (39,043)$
Systems(1) (2,379) (1,365) E&P Operations Optimization(1) 3,351 11,870
Software 2,095 5,430
Ocean Bottom Services(1) (10,008) (27,567) Ocean Bottom Services(1) (13,940) (36,170)
Corporate and Other (10,641) (22,342) Support and Other (11,517) (24,035)
Total (40,689)$ (87,378)$ Total (40,689)$ (87,378)$
Old Segments New Segments
(1) reflects the recasting of manufacturing, engineering, research and development of ocean bottom systems from
Systems (now part of E&P Operations Optimization), down to Ocean Bottom Services. Q2 and YTD operating
income impact of $3.9m and $8.6m, respectively.
