Attached files
| file | filename |
|---|---|
| EX-31.2 - EX-31.2 - NEOGEN CORP | d223408dex312.htm |
| EX-31.1 - EX-31.1 - NEOGEN CORP | d223408dex311.htm |
| EX-23.1 - EX-23.1 - NEOGEN CORP | d223408dex231.htm |
| EX-32 - EX-32 - NEOGEN CORP | d223408dex32.htm |
| EX-24.1 - EX-24.1 - NEOGEN CORP | d223408dex241.htm |
| EX-21 - EX-21 - NEOGEN CORP | d223408dex21.htm |
Table of Contents
UNITED STATES
SECURITIES AND EXCHANGE COMMISSION
WASHINGTON, D.C. 20549
FORM 10-K
| x | ANNUAL REPORT PURSUANT TO SECTION 13 OR 15(d) OF THE SECURITIES EXCHANGE ACT OF 1934 |
For the Fiscal Year Ended May 31, 2016
| ¨ | TRANSITION REPORT PURSUANT TO SECTION 13 OR 15(d) OF THE SECURITIES EXCHANGE ACT OF 1934 |
For The Transition Period From To .
COMMISSION FILE NUMBER 0-17988
NEOGEN CORPORATION
(Exact name of registrant as specified in its charter)
| MICHIGAN | 38-2367843 | |
| (State or other jurisdiction of incorporation or organization) |
(I.R.S. Employer Identification No.) |
620 Lesher Place
Lansing, Michigan 48912
(Address of principal executive offices, including zip code)
517-372-9200
(Registrant’s telephone number, including area code)
SECURITIES REGISTERED PURSUANT TO SECTION 12(b) OF THE ACT: NONE
SECURITIES REGISTERED PURSUANT TO SECTION 12(g) OF THE ACT:
COMMON STOCK, $0.16 par value per share
(Title of Class)
Indicate by check mark if the registrant is a well-known seasoned issuer, as defined in Rule 405 of the Securities Act. Yes x No ¨
Indicate by a check mark if the registrant is not required to file reports pursuant to Section 13 or 15(d) of the Act. Yes ¨ No x
Indicate by check mark whether the registrant has submitted electronically and posted on its corporate web site, if any, every Interactive Data File required to be submitted and posted pursuant to Rule 405 of Regulation S-T (§ 232.405 of this chapter) during the preceding 12 months (or for such shorter period that the registrant was required to submit and post such files). Yes x No ¨
Indicate by check mark whether the registrant (1) has filed all reports required to be filed by Section 13 or 15(d) of the Securities Exchange Act of 1934 during the preceding 12 months (or for such shorter period that the registrant was required to file such reports), and (2) has been subject to such filing requirements for the past 90 days. Yes x No ¨
Indicate by check mark if disclosure of delinquent filers pursuant to Item 405 of Regulation S-K is not contained herein, and will not be contained, to the best of registrant’s knowledge, in definitive proxy or information statements incorporated by reference in Part III of this Form 10-K or any amendment to this Form 10-K. ¨
Indicate by check mark whether the registrant is a large accelerated filer, an accelerated filer, or a non-accelerated filer. See definition of “accelerated filer and large accelerated filer” in Rule 12b-2 of the Exchange Act.
(Check one):
| Large accelerated filer x |
Accelerated filer ¨ | Non-accelerated filer ¨ | Smaller reporting company ¨ |
Indicate by check mark whether the registrant is a shell company (as defined in Rule 12b-2 of the Act). Yes ¨ No x
Based on the closing sale price on November 30, 2015 the aggregate market value of the voting stock held by non-affiliates of the registrant was $2,211,000,000. For these purposes, the registrant considers its Directors and executive officers to be its only affiliates.
The number of outstanding shares of the registrant’s Common Stock was 37,574,890 on June 30, 2016.
Table of Contents
DOCUMENTS INCORPORATED BY REFERENCE
The Registrant’s definitive proxy statement to be prepared pursuant to Regulation 14a and filed in connection with solicitation of proxies for its October 6, 2016 annual meeting of shareholders is incorporated by reference into part III of this Form 10-K.
1
Table of Contents
2
Table of Contents
CAUTIONARY STATEMENT REGARDING FORWARD-LOOKING INFORMATION
Forward-looking statements, within the meaning of Section 27A of the Securities Act of 1933, as amended, and Section 21E of the Securities Exchange Act of 1934, as amended, are made throughout this Annual Report on Form 10-K, including statements relating to management’s expectations regarding new product introductions; the adequacy of the Company’s sources for certain components, raw materials and finished products; and the Company’s ability to utilize certain inventory. For this purpose, any statements contained herein that are not statements of historical fact may be deemed to be forward-looking statements. Without limiting the foregoing, the words “believes,” “anticipates,” “plans,” “expects,” “seeks,” “estimates,” and similar expressions are intended to identify forward-looking statements. There are a number of important factors that could cause Neogen Corporation’s results to differ materially from those indicated by such forward-looking statements, including those detailed in ITEM 1A. RISK FACTORS and under the caption Management’s Discussion and Analysis of Financial Condition and Results of Operations, Critical Accounting Policies and Estimates, and Future Operating Results.
In addition, any forward-looking statements represent management’s views only as of the day this Annual Report on Form 10-K was first filed with the Securities and Exchange Commission and should not be relied upon as representing management’s views as of any subsequent date. While management may elect to update forward-looking statements at some point in the future, it specifically disclaims any obligation to do so, even if its views change.
3
Table of Contents
| ITEM 1. | BUSINESS |
Neogen Corporation and subsidiaries (Neogen or the Company) develop, manufacture and market a diverse line of products dedicated to food and animal safety. The Company’s Food Safety segment consists primarily of diagnostic test kits and complementary products (e.g., dehydrated culture media) sold to food producers and processors to detect dangerous and/or unintended substances in human food and animal feed, such as foodborne pathogens, spoilage organisms, natural toxins, food allergens, genetic modifications, ruminant by-products, meat speciation, drug residues, pesticide residues and general sanitation concerns. The diagnostic test kits are generally less expensive, easier to use and provide greater accuracy and speed than conventional diagnostic methods. The majority of the tests are disposable, single-use, immunoassay and DNA detection products that rely on the Company’s proprietary antibodies and RNA and DNA testing methodologies to produce rapid and accurate test results. The Company’s expanding line of food safety products also includes bioluminescence-based diagnostic technology.
Neogen’s Animal Safety segment is engaged in the development, manufacture, marketing and distribution of pharmaceuticals, rodenticides, disinfectants, vaccines, veterinary instruments, topicals, diagnostic products for the worldwide animal safety market, and genomic testing services. The majority of these consumable products are marketed through a network of national and international distributors, as well as a number of large farm supply retail chains in the United States and Canada. The Company’s USDA-licensed facility in Lansing, Michigan, produces immunostimulant products for horses and dogs, and a unique equine botulism vaccine. The Company’s line of drug detection products is sold worldwide for the detection of abused and therapeutic drugs in animals and animal products.
Neogen’s products are marketed by Company sales personnel in North America, the United Kingdom and other parts of Europe, Mexico, Brazil, China and India–and by distributors throughout the rest of the world.
Neogen’s mission is to be the leading company in the development and marketing of solutions for food and animal safety. To meet this vision, a growth strategy consisting of the following elements has been developed: (i) increasing sales of existing products; (ii) introducing new products and product lines; (iii) expanding international sales; and (iv) acquiring businesses and forming strategic alliances. The Company has been historically successful at increasing product sales organically and maintains an active acquisition program to identify and capitalize on opportunities to acquire new products and/or businesses.
Neogen Corporation was formed as a Michigan corporation in June 1981 and actual operations began in 1982. The Company’s principal executive offices are located at 620 Lesher Place, Lansing, Michigan 48912-1595 and its telephone number is (517) 372-9200.
Neogen’s Annual Report on Form 10-K, Quarterly Reports on Form 10-Q, Current Reports on Form 8-K, and amendments to those reports are available free of charge via our Internet website (www.neogen.com) as soon as reasonably practicable after such information is filed with, or furnished to, the United States Securities and Exchange Commission.
PRODUCTS
Product trademarks and registered trademarks owned by Neogen include: CORPORATE: Neogen®, Neogen flask logo®; FOOD SAFETY: AccuClean®, AccuPoint®, AccuScan®, Acumedia®, Agri-Screen®, Alert®, ANSR®, BetaStar®, BioLumix®, Centrus®, F.A.S.T.®, GeneQuence®, GENE-TRAK®, Harlequin™, ISO-GRID®, Lab M®, NeoCare™, NeoColumn™, NeoFilm®, NeoSeek™, NEO-GRID®, Nutritone®, Penzyme®, Pinnacle®, Reveal®, Revive®, Soleris®, µPREP™, Veratox®, Simple. Accurate. Supported. Food Safety SolutionsSM; LIFE SCIENCES: Alert®, K-Blue®, K-Blue Substrate®, K-Gold®, NeoSal®, ANIMAL SAFETY: Acid-A-Foam™, Aero-ssault™, Ag-Tek®, AluShield™, AquaPrime®, Assault®, Barnstorm™, BioCres™, BioPhene™, BioQuat™, BotVax®, BreederSleeve®, Bromethalin One Meal Is All It Takes (design)®, Calf Eze™, Chem-Tech, Ltd.™, Chem-Tech’s CT logo (with circle)™, Chlor-A-Foam™, Companion™, Cowboy Syringe®, CT-511®, Cykill™, D3™, DC&R®, DeciMax®, Di-Kill®, Dr. Frank’s®, Dy-Fly®, Dyne-O-Might™, Earth City Resources (design)®, ElectroJac®, ELISA Technologies (design)®, EqStim®, EquiSleeve®, E-Z Bond™, E-Z Catch®, Farmphene™, Final-Fly-T®, Fly-Die Defense™, Fura-Zone®, GenQuat™, Gold Nugget®, Horse Sense®, Ideal®, ImmunoRegulin®, Insectrin®, Insight™, Iodis™, Jolt®, LD-44®, LD-44T™, Maxi Sleeve®, MaxKlor™, MegaShot™, MycAseptic™, NeedleGard™, NFZ™, Nu-Dyne™, One Bad Cat®, PanaKare™, Pantek™, ParlorMint™, Parvosol®, Place Pack®, PolyPetite™, PolyShield™, Poly-Sleeve®, Poridon®, Preserve™, Prima®, Prima BMV®, Prima Marc™, Prima Tech®, Prima Tech logo®, Pro-Fix®, Pro-Flex®, Pro-Shot™, PRO-TECT 6 MIL®, PRO-TECT 6 MIL logo®, Prozap®, Prozap (stylized mark w/fancy Z)™, PY-75™, Ramik®, Rat & Mouse-A-Rest II®, RenaKare™, Rodent Elimination Station™, Rodex™, Rot-Not™, Safe-T-Flex™, Siloxycide™, Spectrasol™, Spec-Tuss™, Squire®, Starlicide®, Stress-Dex®, SureBond®, SureKill®, Synergize™, SyrVet®, SyrVet logo®, Tetrabase™, Tetracid™, Tetradyne™, ThyroKare™, TopHoof™, Tri-Hist®, Tri-Seal™, Tryad®, Turbocide®, Turbocide Gold®, Udder Shield®, Uniprim®, UriKare™, VAP-5™, VAP-20™, Vet-Tie™, Vita-15™, War Paint®, We keep ‘em movin’®, X-185™, Zipcide®, AGRIGENOMICS: Deoxi™, GeneSeek®, Genomic Profiler™, Genomic Solutions for Food Security®, Igenity®, SeekGain™, SeekSire™, SeekTrace™, Tru-Polled®; LOGOTYPES: BioSentry barn logo®, BioSentry chicken logo®, BioSentry pig logo®, TurboCide® (stylized).
4
Table of Contents
Neogen operates in two primary business areas: the Food Safety segment, which develops and markets products for the detection of pathogens, natural toxins, allergens and other unwanted substances in food and feed products; and the Animal Safety segment, which develops and markets products and services dedicated to animal health. See Notes to Consolidated Financial Statements elsewhere in this Form 10-K for financial information about the Company’s business segments and international operations.
FOOD SAFETY SEGMENT
Neogen’s Food Safety segment is primarily engaged in the production and marketing of diagnostic test kits and complementary products marketed to food and feed producers and processors to detect dangerous and/or unintended substances in food and animal feed, such as foodborne pathogens, spoilage organisms, natural toxins, food allergens, genetic modifications, meat speciation, drug residues, pesticide residues and general sanitation concerns.
Neogen’s test kits are used to detect potential hazards in food and animal feed by testers ranging from small local grain elevators to the largest, best-known food and feed processors in the world, and numerous regulatory agencies. Neogen’s products include tests for:
Mycotoxins. Grain producers and processors of all types and sizes use the Company’s Veratox, Agri-Screen, Reveal, Reveal Q+ and Reveal Q+ MAX tests for mycotoxins, including aflatoxin, deoxynivalenol, fumonisin, ochratoxin, zearalenone and T-2/HT-2 toxin, to help ensure product safety and quality.
Food allergens. The world’s largest producers of cookies, crackers, candy, ice cream and many other foods, use the Company’s Veratox, Alert, Reveal, Reveal 3-D and BioKits testing products for food allergens to help protect their food-allergic customers from the inadvertent contamination of products with food allergens, such as peanut, milk, egg, almond, gliadin (gluten), soy and hazelnut residues.
Dairy antibiotics. Dairies are the primary users of Neogen’s BetaStar, BetaStar Combo, BetaStar 4D and Penzyme diagnostic tests to detect the presence of beta-lactam and tetracycline antibiotics in milk. The presence of these drugs in milk is a public health hazard and an economic risk to processors as it limits the milk’s further processing.
Foodborne pathogens. Meat and poultry processors, seafood processors, fruit and vegetable producers and many other market segments are the primary users of Neogen’s ANSR and Reveal tests for foodborne bacteria, including E. coli O157:H7, Salmonella, Listeria and Campylobacter. Neogen’s ANSR pathogen detection system is an isothermal amplification reaction test method which exponentially amplifies the DNA of any bacteria present in food and environmental samples to detectable levels in 10 minutes. Combined with ANSR’s single enrichment step, Neogen’s pathogen detection method provides DNA-definitive results in a fraction of the time of other molecular detection methods. Reveal’s lateral flow device combines an immunoassay with chromatography for a rapid and accurate one-step result.
Spoilage microorganisms. Neogen’s Soleris and BioLumix products are used by food processors to identify the presence of spoilage organisms (e.g., yeast and mold) and other microbiological contamination. The systems measure microbial growth by monitoring biochemical reactions that generate a color change in the media as microorganisms grow. The sensitivity of the system allows detection in a fraction of the time needed for traditional methods, with less labor and handling time.
Sanitation monitoring. Neogen manufactures and markets its AccuPoint Advanced rapid sanitation test for adenosine triphosphate (ATP), a chemical found in all living cells. This easy-to-use and inexpensive test uses bioluminescence to quickly determine if a food contact surface has been completely sanitized. When ATP comes into contact with the reagents contained in the test device, a reaction takes place that produces light. More light is indicative of higher levels of ATP and a need for more thorough sanitation. The Company’s worldwide customer base for its ATP sanitation testing products includes food and beverage processors, the food service and healthcare industries, as well as many other users.
Dehydrated culture media. Neogen’s Acumedia and Lab M subsidiaries offer dehydrated culture media for varied purposes, including traditional bacterial testing, and growing beneficial bacteria, such as cultures for sausages and beer. The Company’s customers for dehydrated culture media also include commercial and research laboratories and producers of pharmaceuticals, cosmetics and veterinary vaccines.
Seafood contaminants. Neogen’s specialty products for the seafood market include tests for histamine, a highly allergenic substance that occurs when certain species of fish begin to decay; chloramphenicol, a banned antibiotic in most of the world, but still used by some shrimp farmers to improve the yield of their products; sulfite, an effective but potentially allergenic shrimp preservative; and shellfish toxins.
The majority of Neogen’s food safety test kits use immunoassay technology to rapidly detect target substances. The Company’s ability to produce high quality antibodies sets its products apart from immunoassay test kits produced and sold by other companies. The Company’s kits are available in microwell formats, which allow for automated and rapid processing of a large number of samples, and lateral flow and other similar devices that provide distinct visual results. Typically, test kits use antibody-coated test devices and chemical reagents to indicate a positive or negative result for the presence of a target substance in a test sample; the simplicity of the tests makes them accessible to all levels of food producers, processors and handlers. Neogen also offers other test methods and products to complement its immunoassay tests.
5
Table of Contents
The Company’s kits are generally based on internally developed technology, licensed technology, or technology that is acquired in connection with acquisitions. In fiscal 2016, the Food Safety segment incurred royalty expense totaling $1,329,000 for licenses and royalties for technology used in the Company’s products, including expense of $737,000 for allergen products, $134,000 for the pathogen product line and $122,000 for licenses related to the dairy antibiotics product line. Generally, the Company’s royalty rates are in the range of 2% to 10% of revenues on products containing the licensed technology. Some licenses involve technology that is exclusive to Neogen’s use while others are nonexclusive and involve technology licensed to multiple licensees.
Revenues from Neogen’s Food Safety segment accounted for 45.4%, 46.5% and 47.0% of the Company’s total revenues for fiscal years ended May 31, 2016, 2015 and 2014, respectively.
ANIMAL SAFETY SEGMENT
Neogen’s Animal Safety segment is primarily engaged in the development, manufacture and marketing of veterinary instruments, pharmaceuticals, vaccines, topicals, a full suite of agricultural biosecurity products, such as rodenticides, insecticides, cleaners and disinfectants, genomic services and diagnostic products.
Veterinary instruments. Neogen markets a broad line of veterinary instruments and animal health delivery systems under the Ideal brand name. Approximately 250 different products are offered, many of which are used to deliver animal health products, such as antibiotics and vaccines. Ideal’s D3 Needles are stronger than conventional veterinary needles and are uniquely detectable by common meat processing facility metal detectors — a big market advantage in the safety-conscious beef and swine industries. Neogen’s Prima Tech product line is designed around highly accurate devices used by farmers, ranchers, and veterinarians to inject animals, provide topical applications and to use for oral administration. Prima Tech is also a supplier of products used in artificial insemination in the swine industry. Other products include animal identification and handling equipment.
Veterinary pharmaceuticals. Animal Safety’s NeogenVet product line provides innovative, value-added, high quality products to the veterinary market. Top NeogenVet products include PanaKare, a digestive aid that serves as a replacement therapy where digestion of protein, carbohydrate and fat is inadequate due to exocrine pancreatic insufficiency; Natural Vitamin E-AD, which aids in the prevention and treatment of vitamin deficiencies in swine, cattle and sheep; and RenaKare, a supplement for potassium deficiency in cats and dogs. Other products sold under the NeogenVet brand include Vita-15 and Liver 7, which are used in the treatment and prevention of nutritional deficiencies. The Company also manufactures Uniprim, a leading veterinary antibiotic.
Veterinary biologics. Neogen’s BotVax B vaccine has successfully protected thousands of high-value horses and foals against Type B botulism, commonly known as Shaker Foal Syndrome. The Company’s product is the only USDA-approved vaccine for the prevention of Type B botulism in horses. Years of research and many thousands of doses have proven Neogen’s EqStim immunostimulant to be safe and effective as a veterinarian-administered adjunct to conventional treatment of equine bacterial and viral respiratory infections. The Company’s ImmunoRegulin product uses similar immunostimulant technology to aid in the treatment of pyoderma (a bacterial skin inflammation) in dogs.
Veterinary OTC products. Animal Safety products offered by Neogen to the retail over-the-counter (OTC) market include Ideal brand veterinary instruments packaged for the retail market. OTC products also include Stress-Dex, an oral electrolyte replacer for performance horses, and Fura-Zone, for the prevention and treatment of surface bacterial infections in wounds, burns and cutaneous ulcers. Ag-Tek and other hoof care, disposables and artificial insemination supplies are marketed to the dairy and veterinary industries.
Rodenticides. Neogen’s comprehensive line of proven rodenticides, sold under brand names such as Ramik and Havoc, effectively address rodent problems of any size and serve as a critical component of an overall biosecurity plan for major agricultural operations. Neogen offers several rodenticide active ingredients including diphacinone, bromethalin, brodifacoum, and zinc phosphide formulated with food grade ingredients to generate the highest acceptance and most palatable bait possible.
Cleaners and disinfectants. Used in animal and food production facilities, Neogen’s cleaners and disinfectants, including DC&R, 904 Disinfectant, Acid-A-Foam, Preserve, Tetradyne and FarmFluid S, can stop a disease outbreak before it starts. The products also are used in the veterinary clinic market to maintain sanitary conditions and limit the potential hazards of bacteria, fungi and viruses.
Insecticides. Neogen’s highly effective Chem-Tech insecticides utilize environmentally friendly technical formulas, and several are approved for use in food establishments. The company’s Prozap insecticide brand is well known in the large animal production industry, particularly with dairy and equine producers.
Animal genomics services. Neogen’s animal genomics businesses, GeneSeek and Igenity, provide value-added services to leading agricultural genetics providers, large national cattle associations, companion animal breed registries, university researchers, and numerous commercial cattle producers. With both state-of-the-art genetics laboratories and the comprehensive bioinformatics to interpret genetic test results, Neogen offers identity and trait determination and analysis. GeneSeek’s technology employs high-resolution DNA genotyping for identity and trait analysis in a variety of important animal and agricultural plant species. Igenity’s extensive bioinformatics system identifies and predicts an animal’s positive or negative traits based on DNA test results. This information has helped livestock producers make significant improvements in genetics and improve overall quality of their animals.
6
Table of Contents
Life sciences. Neogen’s line of approximately 100 drug detection immunoassay test kits is sold worldwide for the detection of approximately 300 abused and therapeutic drugs in farm animals and racing animals, and for detection of drug residues in meat and meat products. The test kits are also used for human forensic toxicology drug screening applications. This line includes tests for narcotics, analgesics, stimulants, depressants, tranquilizers, anesthetics, steroids and diuretics. Neogen also has several products used by researchers for the detection of biologically active substances.
Many of the products and services in the Animal Safety segment use licensed technology. Animal Safety incurred royalty expense totaling $640,000 for licenses and royalties in fiscal 2016 for technology used in the segment’s products and services, including expense of $304,000 for licenses related to the genomics services line.
Revenues from Neogen’s Animal Safety segment accounted for 54.6%, 53.5% and 53.0% of the Company’s total revenues for fiscal years ended May 31, 2016, 2015 and 2014, respectively.
GENERAL SALES AND MARKETING
Neogen is organized under two segments — Food Safety and Animal Safety. Within these segments, the Company’s sales efforts are generally organized by specific markets, rather than by products or geography. During the fiscal year that ended May 31, 2016, the Company had approximately 22,000 customers for its products. Since many customers for animal safety products are distributors, and certain animal safety products are offered to the general retail market, the total number of end users of the Company’s products is considerably greater than 22,000. As of May 31, 2016, a total of 348 employees were assigned to sales and marketing functions within the Company, compared to 305 at the end of May 2015. During the years ended May 31, 2016, 2015 and 2014, no single customer or distributor accounted for 10% or more of the Company’s revenues.
DOMESTIC SALES AND MARKETING
FOOD SAFETY
To reach each customer and prospect with expertise and experience, Neogen has a staff of specialized food safety sales and technical service representatives assigned to specific markets. This staff sells Company products directly to end users, and also handles technical support issues that arise with customers in the United States and Canada.
Neogen’s food safety markets are primarily comprised of: milling and grain, including grain elevators, feed mills, pet food manufacturers, and grain inspection companies; meat and poultry, including meat and poultry processors, producers of ready-to-eat meat and poultry products; and the USDA’s Food Safety Inspection Service (FSIS); grocery products, including flour millers, malters, bakeries, candy and confection manufacturers, manufacturers of prepared meals, nuts, spices, cookies, crackers and other snack foods; fruits and vegetables, including growers and processors of juice and packaged fresh cut grocery items; seafood, including harvesters and processors of a wide variety of seafood products; dairy and beverage, including milk processors and soft drink bottlers; healthcare, including hospitals and distributors to the healthcare industry; traditional culture media markets, including commercial and research laboratories and producers of pharmaceuticals, cosmetics and veterinary vaccines; food service and retail, including fast food service establishments and retail grocery market chains, and nutraceuticals, including producers and marketers of a wide variety of nutritional and holistic consumer products.
ANIMAL SAFETY
Neogen markets a broad range of pharmaceuticals, vitamin injectables, wound care products, topicals, instruments, genomics services and biologicals to the veterinary market. The product range is focused on the food (e.g., cattle, swine and poultry) and companion (e.g., horses, dogs and cats) animal markets. Neogen’s sales group works directly with veterinarians, clinics and universities and markets through established ethical distributors by supporting the efforts of over 1,000 domestic distributor sales representatives calling on 35,000 plus veterinarians. Neogen further supports its veterinary distribution channel through product training, field support, promotions and technical service.
The Company believes the OTC animal health market offers growth opportunities for Neogen and its products. Neogen offers a broad range of products including well-recognized brands of rodenticides, disinfectants, insecticides, instruments and horse care products. To reach the OTC market, Neogen’s sales team works with a large network of animal health distributors including marketing groups, traditional two-step distributors, catalogers and large retail chains. Support includes product training, field support, planogram solutions, promotions and advertising.
7
Table of Contents
As a commercial laboratory, GeneSeek provides services direct to large-herd beef and dairy cattle, swine, poultry and sheep producers, universities and other research organizations, and various livestock and canine breed associations.
INTERNATIONAL SALES AND MARKETING
Neogen maintains eight Company-owned locations outside of the United States to provide a direct presence in regions of particular importance to the Company, and maintains an extensive network of distributors to reach countries where the Company does not have a direct presence.
Neogen Europe. Neogen Europe, Ltd., located in Ayr, Scotland, provides the Company access to the European Union (E.U.), and sells products and services to its network of customers and distributors throughout the E.U. Customers in the United Kingdom, France, Germany and the Netherlands are served by Company employees. In other European regions, customers are generally serviced by distributors managed by Neogen Europe personnel. Neogen Europe’s research and development team continues to be a strong asset in the development of products tailored to meet the unique requirements of the European market.
Lab M Holdings. In August 2015, Neogen acquired the stock of Lab M Holdings (Lab M), a developer, manufacturer and supplier of microbiological culture media and diagnostic systems located in Heywood, England. Lab M’s extensive range of microbiological culture media, supplements, immunomagnetic separation techniques and proficiency testing systems are used in laboratories around the world.
Neogen Latinoamérica. The Company’s subsidiary in Mexico, Neogen Latinoamérica, is headquartered in Mexico City and distributes Neogen’s products throughout Mexico and Central America. Neogen Latinoamérica manages the Company’s business activities throughout the region to animal and crop producers, and food processors.
Neogen do Brasil and Deoxi. Neogen do Brasil (translated as Neogen of Brazil), headquartered near São Paulo, distributes Neogen’s products throughout Brazil. Brazil is one of the world leaders in the export of numerous food commodities, including beef, poultry, soybeans, coffee, sugar and orange juice, and this operation gives the Company direct sales representation to these important markets. Neogen also owns Deoxi Biotecnologia Ltda, a genomics testing laboratory located in Aracatuba, Brazil, which it purchased in April 2016.
Neogen China. Noegen’s Chinese subsidiary, with locations in Shanghai and Beijing, employs sales representatives who sell directly to Chinese customers. China’s burgeoning middle class, with its rapidly growing demand for higher quality meat and dairy products, makes the country a substantial growth opportunity for Neogen products — both for animal production on the country’s farms, and in processing plants throughout China’s food processing and distribution industry.
Neogen India. In June 2015, Neogen acquired the assets of Sterling Test House, a leading commercial food testing laboratory based in southwest India, to serve as a base for the Company’s new operations in India. Sterling Test House was incorporated in 1990, and its business has grown to include most of the food safety and water quality testing for major hotels and restaurants in its home region, as well as safety and quality analysis for the country’s expanding nutraceutical market, and growing food export businesses. The laboratory is located in Cochin in the state of Kerala, which is India’s leading region for the export of spices, tea, and fresh fruits and vegetables. In late fiscal 2016, Neogen transferred sales responsibility for its Food Safety products directly to sales representatives at Neogen India.
Neogen Canada. In September 2015, Neogen opened a Canadian location in Guelph, Ontario. Currently, this office is used for genomics sales and sample reception.
Dairy antibiotics distributor. Neogen’s dairy antibiotics diagnostic products are distributed outside of North America, Brazil and China by Denmark based Chr. Hansen, an international supplier of natural ingredient solutions for the food, health and nutritional industries.
Other distributor partners. Outside of the Company locations and dairy antibiotics distributor mentioned above, Neogen uses its own sales managers to work closely with and coordinate the efforts of a network of approximately 140 distributors in more than 100 countries. The distributors provide local training and technical support, perform market research and promote Company products within designated countries around the world.
Animal Safety products distribution. Animal Safety has a strong presence in several key international markets with rodenticides, disinfectants, instruments, diagnostics and veterinary products. Utilizing Company personnel in Brazil, Mexico and China, as well as in-country distributors and U.S.-based exporters, these markets include Canada, Mexico and Central America, South America, the Caribbean, Australia, Europe and Asia.
Sales to customers outside the United States accounted for 33.5%, 36.7% and 38.8% of the Company’s total revenues for fiscal years ended May 31, 2016, 2015 and 2014, respectively.
8
Table of Contents
RESEARCH AND DEVELOPMENT
Management maintains a strong commitment to Neogen’s research and development activities. The Company’s product development efforts are focused on the enhancement of existing product lines and in the development of new products that fit its business strategy. As of May 31, 2016, the Company employed 85 individuals in its worldwide research and development group, including immunologists, chemists and microbiologists. Research and development costs were approximately $9.9 million, $9.6 million and $8.3 million representing 3.1%, 3.4% and 3.4% of total revenues in fiscal years 2016, 2015 and 2014, respectively. Management currently expects the Company’s future research and development expenditures to approximate 3% to 4% of total revenues.
Neogen has ongoing development projects for new diagnostic tests and other complementary products for both the food safety and animal safety markets. Management expects that a number of these products will be commercially available at various times during fiscal years 2017 to 2019.
Portions of certain technologies utilized in some products manufactured and marketed by Neogen were acquired from or developed in collaboration with affiliated partnerships, independent scientists, governmental units, universities and other third parties. The Company has entered into agreements with these parties that provide for the payment of license fees and royalties based upon sales of products that utilize the pertinent technology. License fees and royalties expensed under these agreements amounted to $1,969,000, $2,189,000 and $2,278,000 in fiscal years 2016, 2015 and 2014, respectively.
PROPRIETARY PROTECTION AND APPROVALS
Neogen uses trade secrets as proprietary protection in many of its food and animal safety products. In many cases, the Company has developed unique antibodies capable of detecting microorganisms and residues at minute levels. The supply of these antibodies, and the proprietary techniques utilized for their development, may offer better protection than the filing of patents. Such proprietary reagents are maintained in secure facilities and stored in more than one location to reduce exposure to complete destruction by natural disaster or other means.
Patent and trademark applications are submitted whenever appropriate. Since its inception, Neogen has acquired and received numerous patents and trademarks, and has several pending patents and trademarks. The patents expire at various times over the next 23 years.
A summary of patents by product categories follows:
| USA | International | Expiration | ||||||||||
| Natural Toxins, Allergens & Drug Residues |
4 | 35 | 2018-2038 | |||||||||
| Bacterial & General Sanitation |
18 | 37 | 2017-2028 | |||||||||
| Life Science |
0 | 7 | 2024 | |||||||||
| Vaccine |
2 | 0 | 2018-2028 | |||||||||
| Veterinary Instruments & Other |
11 | 35 | 2017-2039 | |||||||||
| Genomics |
6 | 2 | 2021-2028 | |||||||||
The Company does not expect the near-term expiration of any patent to have a significant effect on future results of operations.
Management believes that Neogen has adequate protection as to proprietary rights for its products. However, it is aware that substantial research has taken place at universities, governmental agencies and other companies throughout the world and that numerous patents have been applied for and issued for technologies which may be used in the Company’s products. To the extent some of the Company’s products may now, or in the future, embody technologies protected by patents, copyrights or trade secrets of others, licenses to use such technologies may need to be obtained in order to continue to sell the products. These licenses may not be available on commercially reasonable terms. Failure to obtain any such licenses may delay or prevent the sale of certain new or existing products. In addition, patent litigation is not uncommon. Accordingly, there can be no assurance that the Company’s existing patents will be sufficient to completely protect its proprietary rights.
One of the major areas affecting the success of biotechnology development involves the time, cost and uncertainty surrounding regulatory approvals. Neogen products requiring regulatory approval, which the Company currently has in place, include BotVax B, EqStim, ImmunoRegulin, Uniprim and BetaStar. The Company’s general strategy is to select technical and proprietary products that do not require mandatory approval to be marketed. Neogen’s rodenticide, disinfectant and insecticide products are subject to registration in the United States and internationally.
Neogen utilizes third-party validations on many of its disposable test kits as a marketing tool to provide its customers with the proper assurances. These include validation by the AOAC International, independently administered third-party, multi-laboratory collaborative studies and approvals by the U.S. Federal Grain Inspection Service and the USDA Food Safety Inspection Service for the use of Company products in their operations.
9
Table of Contents
PRODUCTION AND SUPPLY
Neogen manufactures its products in Michigan, Kentucky, Wisconsin, North Carolina, Iowa, Tennessee, California and the United Kingdom and provides genomics services in Nebraska, Scotland and Brazil. As of May 31, 2016, there were approximately 577 full-time employees assigned to manufacturing and providing of services in these locations, operating on one or two shifts; with occasional 24/7 production during high demand periods; future demand increases could be accommodated by adding shifts. Management believes it could increase the current output of its primary product lines by more than 50% using the current space available; however, to do so could require investment in additional capital equipment.
Food safety diagnostics. Manufacturing of diagnostic tests for the detection of natural toxins, pathogens, food allergens, dairy antibiotics, spoilage organisms and pesticides, final kit assembly, quality assurance and shipping takes place in the Company’s facilities in Lansing, Michigan. Proprietary monoclonal and polyclonal antibodies for Neogen’s diagnostic kits are produced on a regular schedule in the Company’s immunology laboratories in Lansing. Generally, final assembly and shipment of diagnostic test kits to customers in Europe is performed in the Company’s Ayr, Scotland facility. Assembly and shipment of electronic readers and disposable single-use samplers takes place in the Company’s facilities in Lansing. Soleris instrument readers are produced by third party vendors, quality tested in Lansing, and then shipped to customers. Dehydrated culture media products are manufactured in a FDA-registered facility in Lansing and and also at Lab M in Heywood, England. Products are blended following strict formulations or custom blended to customer specification and shipped directly to customers from Lansing and Heywood.
Animal health products. Manufacturing of animal health products, pharmacological diagnostic test kits and test kits for drug residues takes place in the Company’s FDA-registered facilities in Lexington, Kentucky. In general, manufacturing operations including reagent manufacturing, quality assurance, final kit assembly and packaging are performed by Neogen personnel. Certain animal health products and veterinary instruments that are purchased finished or that are toll manufactured by third party vendors are warehoused and shipped from the Company’s Lexington facilities. Other veterinary instruments are produced in the Company’s facilities in Lansing, and are generally then shipped to Lexington, for distribution to customers. Manufacturing and shipment of devices used for animal injections, topical applications and oral administration takes place in a Company-owned facility in Kenansville, North Carolina.
Veterinary biologics. Neogen maintains a Lansing-based USDA-approved manufacturing facility devoted to the production of the biologic products EqStim and ImmunoRegulin. P. acnes seed cultures are added to media and then subjected to several stages of further processing resulting in a finished product that is filled and packaged within the facility. The Company’s BotVax B vaccine is also produced in the Lansing facility utilizing Type B botulism seed cultures and a traditional fermentation process. All completed biologic products are then shipped to Neogen’s Lexington facilities for inventory and distribution to customers.
Agricultural genomic services. Neogen offers agricultural genomics laboratory services and bioinformatics at its locations in Nebraska, Scotland and Brazil. Through its laboratory services and bioinformatics (primarily in beef and dairy cattle, pigs, sheep, poultry, horses and dogs), GeneSeek empowers its customers to speed genetic improvement efforts, as well as identify economically important diseases. The Company renovated a building during fiscal 2014 to meet its current and near-term future domestic needs, and added to its processing capabilities in Scotland in fiscal 2016, while also purchasing a genomics business in Brazil to enhance its presence there.
Cleaners, disinfectants and rodenticides. Manufacturing of rodenticides and certain cleaners and disinfectants takes place in the following locations: Randolph, Wisconsin; Memphis, Tennessee; and Turlock, California. Manufacturing of rodenticides consists of blending technical material (active ingredient) with bait consisting principally of various grains. Certain cleaners and disinfectants are manufactured in Neogen facilities, while others are purchased from other manufacturers for resale, or toll manufactured by third parties.
Pesticides. Chem-Tech Ltd. manufactures insecticides and other pesticides at its facility in Pleasantville, Iowa.
Neogen purchases component parts and raw materials from more than 800 suppliers. Though many of these supplies are purchased from a single source in order to achieve the greatest volume discounts, the Company believes it has identified acceptable alternative suppliers for most of its key components and raw materials where it is economically feasible to do so. There can be no assurance that the Company would avoid a disruption of supply in the event a supplier discontinues shipment of product. Shipments of products are generally accomplished within a 48-hour turnaround time. As a result of this quick response time, Neogen’s backlog of unshipped orders at any given time has historically not been significant.
10
Table of Contents
COMPETITION
Although competitors vary in individual markets, management knows of no competitor that is pursuing Neogen’s fundamental strategy of developing and marketing a broad line of products, ranging from disposable tests and dehydrated culture media to veterinary pharmaceuticals and instruments for a large number of food safety and animal safety concerns. For each of its individual products, the Company faces intense competition from companies ranging from small businesses to divisions of large multinational companies. Some of these organizations have substantially greater financial resources than the Company. Neogen competes primarily on the basis of ease of use, speed, accuracy and other similar performance characteristics of its products. The breadth of the Company’s product line, the effectiveness of its sales and customer service organizations, and pricing are also components in management’s competitive plan.
Future competition may become even more intense, including the development of changing technologies, which could affect the marketability and profitability of Neogen’s products. The Company’s competitive position will also depend on management’s ability to develop proprietary products, attract and retain qualified scientific and other personnel, develop and implement production and marketing plans and obtain patent protection. Additionally, the Company must have adequate capital resources to execute its strategy.
FOOD SAFETY:
With a large professional sales organization offering a comprehensive catalog of food safety solutions, management believes the Company maintains a general competitive advantage over competitors offering only limited product lines. In most cases, Neogen sales and technical service personnel can offer unique insight into a customer’s numerous safety and quality challenges, and offer testing and other solutions to help the customer overcome those challenges.
Competition for pathogen detection products includes traditional methods and antibody and genetic-based platforms. Neogen’s product offerings compete across the entire spectrum of methods. Competition for natural toxins and allergen detection products include instrumentation and antibody-based tests. While the Company’s offerings will not always compete on all platforms in all markets, the products that are offered provide tests that can be well utilized by most customers to meet their testing needs.
Besides its extensive product offerings and robust distribution network, the Company focuses its competitive advantage in the areas of customer service, product performance, speed and ease of use of its products. Additionally, by aggressively maintaining itself as a low-cost producer, Neogen believes that it can be competitive with new market entrants that may choose a low pricing strategy in an attempt to gain market share.
ANIMAL SAFETY:
Neogen’s Animal Safety segment faces no one competitor across the products and markets it serves. In the racing industry market, the Company believes it holds a leading market share position. In the life sciences and forensics markets, the Company competes against several other diagnostic and reagent companies with similar product offerings.
In the veterinary market, Neogen markets BotVax B, the only USDA-approved vaccine for the prevention of botulism Type B in horses. The Company competes on other key products through differentiated product performance and superior customer and technical support. With some of its products, the Company provides solutions as a lower cost alternative and offers a private label option for its distributors.
Competition in the rodenticide market includes several companies of comparable size that offer products into similar market segments. The rodenticide retail market is not dominated by a single brand. While the technical materials used by competing companies are similar, Neogen uses manufacturing and bait formula techniques which the Company believes better attracts rodents to the product and thereby improves overall product performance.
Within the insecticide market, Chem-Tech products specifically focus on the area of insect control for food and animal safety applications. There are several competitors offering similar products, however, the Company has a proprietary formulation chemistry that optimizes the delivery and safe application of insecticides at the customer’s location. These products are currently only sold in the U.S. through a combination of direct sales and distributors.
Several companies compete for sales in the cleaner and disinfectant product segment. Neogen’s products are sold through its distributor network around the world, primarily to assist in the cleaning and disinfecting of animal production facilities.
In addition to the Company’s extensive portfolio of Animal Safety products, Neogen also competes in the retail market by providing solutions to common retail problems, such as stock outs, wasted floor space and inconsistent brand identity. The Company offers planograms and reordering systems to maximize turns and profitability for its retail customers.
11
Table of Contents
GeneSeek, the leading commercial agricultural genomics laboratory in the U.S., employs cutting-edge technology in the area of genomics. The result of this technology allows the acceleration of natural selection through selective breeding of traits such as disease resistance and meat quality. Competition comes mainly from service providers whose primary focus are the human and pharmaceutical industries, as well as several smaller companies offering genomics services. GeneSeek is not involved in cloning or the development of transgenic animals.
GOVERNMENT REGULATION
A significant portion of Neogen’s products and revenues are affected by the regulations of various domestic and foreign government agencies, including the U.S. Department of Agriculture, the Environmental Protection Agency, and the U.S. Food and Drug Administration. Changes in these regulations could affect revenues and/or costs of production and distribution.
Neogen’s development and manufacturing processes involve the use of certain hazardous materials, chemicals and compounds. Management believes that the Company’s safety procedures for handling and disposing of such commodities comply with the standards prescribed by federal, state and local regulations; however, changes in such regulations or rules could involve significant costs to the Company and could be materially adverse to its business.
The rodenticides, insecticides, cleaners, disinfectants and sanitizers manufactured and distributed by Neogen are subject to Environmental Protection Agency and various state regulations. In general, any international sale of the product must also comply with similar regulatory requirements in the country of destination. Each country has its own individual regulatory construct with specific requirements (e.g., label in the language of the importing country). To the best of the Company’s knowledge, Neogen products are in compliance with applicable regulations in the countries where such products are sold.
Dairy products used in National Conference on Interstate Milk Shipments (NCIMS) and other milk monitoring programs are regulated by the FDA. Before products requiring FDA approval can be sold in the U.S., extensive product performance data must be submitted in accordance with the FDA approved protocol administered by AOAC Research Institute (AOAC RI). Following approval of a product by the FDA, the product must also be approved by NCIMS, an oversight body that includes federal, state and industry representatives. The Company’s BetaStar U.S. dairy antibiotic residue testing product has been approved by the FDA, NCIMS, and AOAC RI. While some foreign countries accept AOAC RI approval as part of their regulatory approval processes, many countries have their own regulatory requirements.
Many of the food safety diagnostic products to detect allergens and spoilage organisms do not require direct government approval. However, the Company has pursued AOAC approval for many of the products to enhance their marketability. Products for mycotoxin detection, which are used by federal inspectors, must be approved by the USDA. Neogen has obtained and retained the necessary approvals to conduct its current operations.
Neogen’s veterinary vaccine products and one pharmaceutical product require government approval to allow for lawful sales. The vaccine products are approved by United States Department of Agriculture, Center for Veterinary Biologics (USDA-CVB) and the pharmaceutical product is approved by the FDA. The products, and the facilities in which they are manufactured, are in a position of good standing with both agencies. The Company has had no warning letters based on any review or inspection, no recalls on any of these products, and knows of no reason why it could not manufacture and market such products in the future.
Other animal safety and food safety products generally do not require additional registrations or approvals. However, Neogen’s regulatory staff routinely monitors amendments to current regulatory requirements to ensure compliance.
EMPLOYEES
As of May 31, 2016, the Company employed 1,235 full-time persons worldwide. None of the employees are covered by collective bargaining agreements. There have been no work stoppages or slowdowns due to labor-related problems, and management believes that its relationship with its employees is generally good. Employees having access to proprietary information have executed confidentiality agreements with the Company.
12
Table of Contents
| ITEM 1A. | RISK FACTORS |
An investment in Neogen Corporation’s common shares involves a high degree of risk. The risks described below are not the only ones that an investor faces. Additional risks that are not yet known to us or that we currently think are immaterial could also impair our business, financial condition or results of operations. If any of the following risks actually occurs, our business, financial condition or results of operations could be adversely affected.
Risks Relating to Our Business
Our business strategy is dependent on successfully promoting internal growth and identifying and integrating acquisitions.
Our business has grown significantly over the past several years as a result of both internal growth and acquisitions of existing businesses and their products. Management initiatives may be attempted to augment internal growth, such as strengthening our presence in select markets, reallocating research and development funds to higher growth potential products, development of new applications for our technologies, enhancing our service offerings, continuing key customer efforts, and finding new markets for our products. Failure of these management initiatives may have a material adverse effect on our operating results and financial condition.
Identifying and pursuing acquisition opportunities, integrating these acquisitions into our business and managing their growth requires a significant amount of management’s time and skill. We cannot assure that we will be effective in identifying, integrating or managing future acquisition targets. Our failure to successfully integrate and manage a future acquisition may have a material adverse effect on our operating results and financial condition.
In addition, if we continue to experience growth in our business, such growth could place a significant strain on our management, customer service, operations, sales and administrative personnel, and other resources. To serve the needs of our existing and future customers we will be required to recruit, train, motivate and manage qualified employees. We have incurred and will continue to incur significant costs to retain qualified management, sales and marketing, engineering, production, manufacturing and administrative personnel, as well as expenses for marketing and promotional activities. Our ability to manage our planned growth depends upon our success in expanding our operating, management, information and financial systems, which might significantly increase our operating expenses.
We may not be able to effectively manage our future growth, and if we fail to do so, our business, financial condition and results of operations could be adversely affected.
We rely significantly on our information systems and telecommunications infrastructure to support our operations and a security breach of the Company’s information systems could damage the Company’s reputation and have an adverse effect on operations and results.
We rely on information systems and telecommunications infrastructure to integrate departments and functions, to enhance our ability to service customers, to improve our control environment and to manage our cost reduction initiatives. Any issues involving our critical business applications and infrastructure may adversely impact our ability to manage operations and the customers we serve. In addition, if the Company’s security and information systems are compromised, or employees fail to comply with the applicable laws and regulations and this information is obtained by unauthorized persons or used inappropriately, it could adversely affect the Company’s reputation, as well as results of operations, and could result in litigation, the imposition of penalties, or significant expenditures to remediate any damage to persons whose personal information has been compromised.
Disruption of our manufacturing and service operations could have an adverse effect on our financial condition and results of operations.
We manufacture our products at several manufacturing facilities located in the following locations: Lansing, Michigan; Lexington, Kentucky; Randolph, Wisconsin; Kenansville, North Carolina; Pleasantville, Iowa; Memphis, Tennessee; Turlock, California; Heywood, England; and Ayr, Scotland. We offer genomics services from facilities located in: Lincoln, Nebraska; Ayr, Scotland; and Aracatuba, Brazil. These facilities and our distribution systems are subject to catastrophic loss due to fire, flood, terrorism or other natural or man-made disasters. If any of these facilities were to experience a catastrophic loss, it could disrupt our operations, delay production, shipments and revenue and result in large expenses to repair or replace the facility and/or distribution system. If such a disruption were to occur, we could breach agreements, our reputation could be harmed, and our business and operating results could be adversely affected. Although we carry insurance for property damage and business interruption, we do not carry insurance or financial reserves for interruptions or potential losses arising from terrorism. Economic conditions and uncertainties in global markets may adversely affect the cost and other terms upon which we are able to obtain third party insurance. If our third party insurance coverage is adversely affected, or to the extent we have elected to self-insure, we may be at greater risk that our operations will be harmed by a catastrophic loss.
13
Table of Contents
Our dependence on suppliers could limit our ability to sell certain products or negatively affect our operating results.
We rely on third party suppliers to provide components in our products, manufacture products that we do not manufacture ourselves and perform services that we do not provide ourselves, including package delivery services. Because these suppliers are independent third parties with their own financial objectives, actions taken by them could have a negative effect on our results of operations. The risks of relying on suppliers include our inability to enter into contracts with third party suppliers on reasonable terms, inconsistent or inadequate quality control, relocation of supplier facilities, supplier work stoppages and suppliers’ failure to comply with their contractual obligations. In addition, we currently purchase some raw materials and products from sole or single sources. Some of the products that we purchase from these sources are proprietary and, therefore, cannot be readily or easily replaced by alternative sources. Problems with suppliers could negatively impact our ability to supply the market, substantially decrease sales, lead to higher costs or damage our reputation with our customers.
We rely heavily on third party package delivery services, and a significant disruption in these services or significant increases in prices may disrupt our ability to ship products, increase our costs and lower our profitability.
We ship a significant portion of our products to our customers through independent package delivery companies, such as UPS, Federal Express and DHL. We also ship our products through other carriers, including national and regional trucking firms, overnight carrier services and the U.S. Postal Service. If one or more of these third party package delivery providers were to experience a major work stoppage, preventing our products from being delivered in a timely fashion or causing us to incur additional shipping costs we could not pass on to our customers, our costs could increase and our relationships with some of our customers could be adversely affected. In addition, if one or more of our third party package delivery providers were to increase prices, and we were not able to find comparable alternatives or make adjustments in our delivery network, our profitability could be adversely affected.
Our business sells many products through distributors, which present risks that could negatively affect our operating results.
We sell many of our products, both within and outside of the U.S., through distributors. As a result, we are dependent on these distributors to sell our products and assist us in promoting and creating a demand for our products. Our distributors sometimes offer products from several different companies, and those distributors may carry our competitors’ products and promote our competitors’ products over our own products. We have limited ability, if any, to cause our distributors to devote adequate resources to promoting, marketing, selling and supporting our products. We cannot assure that we will be successful in maintaining and strengthening our relationships with our distributors or establishing relationships with new distributors who have the ability to market, sell and support our products effectively. We may rely on one or more key distributors for a product or region, and the loss of one or more of these distributors could reduce our revenue. Distributors may face financial difficulties, including bankruptcy, which could harm our collection of accounts receivable and financial results. In addition, violations of anti-corruption laws or similar laws by our distributors could have a material impact on our business, and any termination of a distributor relationship may result in increased competition in the applicable jurisdiction. Failing to manage the risks associated with our use of distributors may reduce sales, increase expenses and weaken our competitive position, which could have a negative effect on our operating results.
The development of new products entails substantial risk of failure due to the production of non-viable products, lack of properly identifying market potential, and competitors better serving the marketplace.
Our growth strategy includes significant investment in and expenditures for product development. To execute this strategy, we are continually developing new products for which we believe there should be significant market demand. We cannot assure that we will successfully develop commercially viable products, that the products will be developed on a timely basis to meet market demand or that the relevant market will be properly identified. Our competitors may also adapt more quickly, and deliver superior technologies, price and/or service to better fit our customers’ requirements. If we expend substantial resources in developing an unsuccessful product, whether that lack of success is the result of our production of a non-viable product, a misidentified market, or a competitor’s superior ability to meet our customers’ requirements, operating results could be adversely affected.
Our international operations are subject to different product standards as well as other operational risks.
In fiscal 2016, sales to customers outside of the U.S. accounted for 33.5% of the Company’s total revenue. We expect that our international business will continue to account for a significant portion of our total revenue. Foreign regulatory bodies may establish product standards different from those in the U.S. and with which the Company’s current products do not comply. Our potential inability to design products that comply with foreign standards could have a material adverse effect on our future growth. Other risks related to our sales to customers outside of the U.S. include possible disruptions in transportation, difficulties in building and managing foreign distribution, fluctuation in the value of foreign currencies, changes in import duties and quotas and unexpected economic and political changes in foreign markets. These factors could adversely affect international sales and our overall financial performance.
14
Table of Contents
The markets for our products are extremely competitive, and our competitors may be able to utilize existing resource advantages to our detriment.
The markets in which the Company competes are subject to rapid and substantial changes in technology and are characterized by extensive research and development and intense competition. Many of our competitors and potential competitors have greater financial, technical, manufacturing, marketing, research and development and management resources than we do. These competitors might be able to use their resources, reputations and ability to leverage existing customer relationships to give them a competitive advantage over us. They might also succeed in developing products that are more reliable and effective than our products, make additional measurements, are less costly than our products or provide alternatives to our products.
We are dependent on the agricultural marketplace, which is affected by factors beyond our control.
Our primary customers are in the agricultural and food production industries. Economic conditions affecting agricultural industries are cyclical and are dependent upon many factors outside of our control, including weather conditions, changes in consumption patterns or commodity prices. Any of these factors in the agricultural marketplace could affect our sales and overall financial performance.
Our quarterly operating results are subject to significant fluctuations.
We have experienced, and may experience in the future, significant fluctuations in our quarterly operating results. The mix of products sold and the acceptance of new products, in addition to other factors, could contribute to this quarterly variability. We operate with relatively little backlog and have few long-term customer contracts. Substantially all of our product revenue in each quarter results from orders received in that quarter. In addition, our expense levels are based, in part, on our expectation of future revenue levels. A shortfall in expected revenue could, therefore, result in a disproportionate decrease in our net income.
Our success is highly dependent on our ability to obtain protection for the intellectual property utilized in our products.
Our success and ability to compete depends in part upon our ability to obtain protection in the United States and other countries for our products by establishing and maintaining intellectual property rights relating to or incorporated into our technology and products. Patent applications filed by the Company may not result in the issuance of patents or, if issued, may not be issued in a form that will be commercially advantageous to us. Even if issued, patents may be challenged, narrowed, invalidated or circumvented, which could limit our ability to stop competitors from marketing similar products or limit the length of time we may have patent protection for our products. We also cannot assure that our nondisclosure agreements, together with trade secrets and other common law rights, will provide meaningful protection for the Company’s trade secrets and other proprietary information. Moreover, the laws of some foreign jurisdictions may not protect intellectual property rights to the same extent as in the United States, and many companies have encountered significant difficulties in protecting and defending such rights in foreign jurisdictions. If we encounter such difficulties or we are otherwise precluded from effectively protecting our intellectual property rights domestically or in foreign jurisdictions, we may incur substantial costs and our business, including our business prospects, could be substantially harmed.
From time to time, the Company has received notices alleging that the Company’s products infringe third party proprietary rights. Whether the manufacture, sale or use of current products, or whether any products under development would, upon commercialization, infringe any patent claim will not be known with certainty unless and until a court interprets the patent claim in the context of litigation. When an infringement allegation is made against us, we may seek to invalidate the asserted patent claim and/or to allege non-infringement of the asserted patent claim. In order for us to invalidate a U.S. patent claim, we would need to rebut the presumption of validity afforded to issued patents in the United States with clear and convincing evidence of invalidity, which is a high burden of proof. The outcome of infringement litigation is subject to substantial uncertainties, and also the testimony of experts as to technical facts upon which experts may reasonably disagree. Our defense of an infringement litigation lawsuit could result in significant expense. Regardless of the outcome, infringement litigation could significantly disrupt our marketing, development and commercialization efforts, divert management’s attention and consume our financial resources. In the event that we are found to infringe any valid claim in a patent held by a third party, we may, among other things, be required to:
| • | Pay damages, including up to treble damages and the other party’s attorneys’ fees, which may be substantial; |
| • | Cease the development, manufacture, importation, use and sale of products that infringe the patent rights of others, through a court-imposed injunction; |
| • | Expend significant resources to redesign our technology so that it does not infringe others’ patent rights, or develop or acquire non-infringing intellectual property, which may not be possible; |
| • | Discontinue manufacturing or other processes incorporating infringing technology; and/or |
| • | Obtain licenses to the infringed intellectual property, which may not be available to us on acceptable terms, or at all. |
Any development or acquisition of non-infringing products, technology or licenses could require the expenditure of substantial time and other resources and could have a material adverse effect on our business and financial results. If we are required to, but cannot, obtain a license to valid patent rights held by a third party, we would likely be prevented from commercializing the relevant product, or from further manufacture, sale or use of the relevant product.
15
Table of Contents
We are subject to substantial governmental regulation.
A portion of our products and facilities are regulated by various domestic and foreign government agencies, including the U.S. Department of Agriculture, the U.S. Food and Drug Administration and the Environmental Protection Agency. Although less than 10% of our revenue is currently derived from products requiring government approval prior to sale, a significant portion of our revenue is derived from products used to monitor and detect the presence of residues that are regulated by various government agencies. Furthermore, the Company’s growth may be adversely affected by the implementation of new regulations. The Company is not aware of any failures to comply with applicable laws and regulations; the costs of compliance or failure to comply with any obligations could adversely impact the business.
We are dependent on key employees.
Our success depends, in large part, on members of our management team. Our loss of any of these, or other, key employees could have a material adverse effect on the Company. We maintain certain incentive plans for key employees, and most of these employees have been with the Company in excess of five years. However, we have not executed long-term employment agreements with any of these employees and do not expect to do so in the foreseeable future. Our success depends, significantly, on our ability to continue to attract such personnel. We cannot assure that we will be able to retain our existing personnel or attract additional qualified persons when required and on acceptable terms.
Our business may be subject to product liability claims.
The manufacturing and distribution of the Company’s products involve an inherent risk of product liability claims being asserted against us. Regardless of whether we are ultimately determined to be liable or our products are determined to be defective, we might incur significant legal expenses not covered by insurance. In addition, product liability litigation could damage our reputation and impair our ability to market our products, regardless of the outcome. Litigation could also impair our ability to retain product liability insurance or make our insurance more expensive. Although the Company currently maintains liability insurance, we cannot assure that we will be able to continue to obtain such insurance on acceptable terms, or that such insurance will provide adequate coverage against all potential claims. If we are subject to an uninsured or inadequately insured product liability claim, our business, financial condition and results of operations could be adversely affected.
Market prices for securities of technology companies are highly volatile.
The market prices for securities of technology companies have been volatile in the past and could continue to be volatile in the future. Fluctuations in our financial performance from period to period could have a significant impact on the market price of our common shares.
Operating results could be negatively impacted by economic, political or other developments in countries in which we do business.
Future operating results could be negatively impacted by unstable economic, political and social conditions, including but not limited to fluctuations in foreign currency exchange rates, political instability, or changes in the creation or interpretation of laws and regulations or administrative actions in each of the countries where the Company conducts business, including the United States.
These potential negative impacts include, but are not limited to: reduction of demand for some of our products, increase in the rate of order cancellations or delays, increased risk of excess and obsolete inventories, increased pressure on the prices for our products and services, and longer sales cycles and greater difficulty in collecting accounts receivable.
Additionally, the Company operates in multiple income tax jurisdictions and must determine the appropriate allocation of income to each of these jurisdictions based on current interpretations of complex income tax regulations. Income tax audits associated with the allocation of income and other complex issues may result in significant income tax adjustments that could negatively impact the Company’s future operating results.
16
Table of Contents
| ITEM 1B. | UNRESOLVED STAFF COMMENTS – NONE |
| ITEM 2. | PROPERTIES |
Neogen owns 15 separate buildings located throughout Lansing, Michigan, totaling 277,500 square feet. These buildings are used for corporate offices, including accounting and human resources, manufacturing and warehousing of food safety products, food safety sales and marketing, and research and development.
Animal Safety sales and marketing, diagnostic test kit manufacturing, warehousing and distribution of certain Animal Safety products takes place from two Company-owned facilities totaling 210,000 square feet in Lexington, Kentucky.
The Company rents 26,000 square feet at a manufacturing facility in Kenansville, North Carolina at a monthly cost of $5,360. The lease automatically renews annually but can be terminated with six months’ notice. The Company manufactures and warehouses veterinary devices at this location.
Food Safety researchers occupy 5,400 square feet of space in St. Joseph, Michigan at a monthly cost of $3,100. The lease extends through May 2017, with two one-year extensions, at the Company’s option.
Neogen Europe Ltd. operations take place in two Company-owned facilities, totaling 74,000 square feet, in Ayr, Scotland.
Lab M manufacturing and warehousing takes place in a 24,800 square foot Company-owned facility in Heywood, England.
Rodenticide and disinfectant manufacturing and warehousing is conducted in 113,000 square feet of Company-owned buildings in Randolph, Wisconsin.
The Company’s GeneSeek subsidiary owns 26,000 square feet of laboratory and office space in Lincoln, Nebraska.
The Company’s Chem-Tech Ltd. subsidiary manufactures and warehouses insecticides and other pesticides in 59,000 square feet of rented space in Pleasantville, Iowa. The monthly rent is $17,000 and the lease extends through December 2016.
Manufacturing and warehousing facilities for cleaners and disinfectants acquired in the Preserve International acquisition are located in Memphis, Tennessee and Turlock, California. The Memphis building, totaling 66,000 square feet, is owned by the Company. The Turlock building, at 30,000 square feet, is rented at a monthly rate of $5,960, with the lease extending through May 2020.
Neogen do Brasil rents 6,800 square feet of office and warehouse space near Sao Paulo, Brazil at a cost of approximately $2,000 per month. The lease extends to May 2021. Deoxi occupies 2,000 square feet of rented lab and office space in Aracatuba, Brazil at a cost of approximately $2,100 per month. The lease extends through October 2017.
Neogen Latinoamerica rents 27,000 square feet of office and warehouse space in Mexico City, Mexico for approximately $9,500 per month. The lease extends to November 1, 2018.
Neogen China rents 3,800 square feet of office and warehouse space in Shanghai at a cost of $5,800 per month. The lease extends to February 2019. Neogen China also rents 350 square feet of office and lab space in Beijing at a cost of $2,000 per month. The lease extends to March 2017.
Neogen India rents 5,500 square feet of lab, office and warehouse space in Kerla, India at a cost of approximately $1,600 per month. The lease extends through June 2017.
These properties are in good condition, well-maintained, and generally suitable and adequate to carry on the Company’s business.
| ITEM 3. | LEGAL PROCEEDINGS |
Neogen is subject to certain legal proceedings in the normal course of business that, in the opinion of management, should not have a material effect on its future results of operations or financial position.
| ITEM 4. | MINE SAFETY DISCLOSURES |
Not Applicable
17
Table of Contents
| ITEM 5. | MARKET FOR REGISTRANT’S COMMON EQUITY, RELATED STOCKHOLDER MATTERS AND ISSUER PURCHASES OF EQUITY SECURITIES |
MARKET INFORMATION:
Neogen Common Stock is traded on the NASDAQ Global Select Market under the symbol “NEOG”. The following table sets forth, for the fiscal periods indicated, the high and low sales prices for the Common Stock as reported on the NASDAQ Stock Market.
| HIGH | LOW | |||||||
| YEAR ENDED MAY 31, 2016 |
||||||||
| First Quarter |
$ | 62.70 | $ | 44.90 | ||||
| Second Quarter |
$ | 59.76 | $ | 43.00 | ||||
| Third Quarter |
$ | 60.38 | $ | 45.00 | ||||
| Fourth Quarter |
$ | 53.02 | $ | 43.79 | ||||
| YEAR ENDED MAY 31, 2015 |
||||||||
| First Quarter |
$ | 45.06 | $ | 36.78 | ||||
| Second Quarter |
$ | 44.65 | $ | 39.23 | ||||
| Third Quarter |
$ | 51.63 | $ | 43.08 | ||||
| Fourth Quarter |
$ | 51.21 | $ | 42.37 | ||||
HOLDERS:
As of June 30, 2016, there were approximately 304 stockholders of record of Common Stock and management believes there are a total of approximately 11,736 beneficial holders.
DIVIDENDS:
Neogen has never paid cash dividends on its Common Stock and does not anticipate paying cash dividends in the foreseeable future.
18
Table of Contents
The graph below matches Neogen Corporation’s cumulative 5-year total shareholder return on common stock with the cumulative total returns of the NASDAQ Composite index and the NASDAQ Medical Equipment index. The graph tracks the performance of a $100 investment in our common stock and in each index (with the reinvestment of all dividends) from May 31, 2011 to May 31, 2016.
The stock price performance included in this graph is not necessarily indicative of future stock price performance.
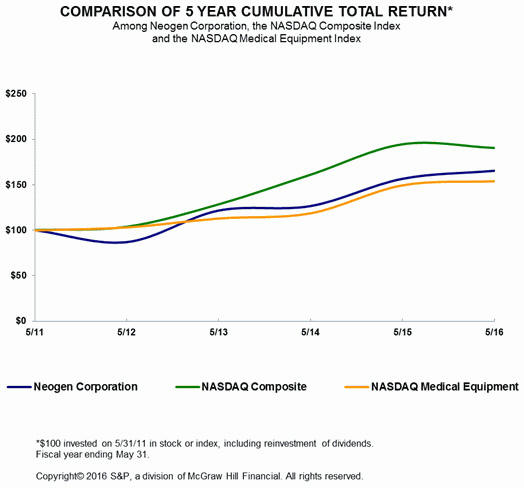
| May 31 of : |
2011 | 2012 | 2013 | 2014 | 2015 | 2016 | ||||||||||||||||||
| Neogen Corporation |
100.00 | 86.84 | 121.48 | 126.42 | 156.36 | 165.15 | ||||||||||||||||||
| NASDAQ Composite |
100.00 | 103.65 | 128.29 | 160.97 | 194.49 | 190.42 | ||||||||||||||||||
| NASDAQ Medical Equipment |
100.00 | 103.31 | 113.10 | 118.81 | 149.55 | 154.08 | ||||||||||||||||||
The stock price performance included in this graph is not necessarily indicative of future stock price performance.
Issuer Purchases of Equity Securities
In December 2008, the Board of Directors authorized management to repurchase up to a total of 1,125,000 shares of its common stock in open market transactions. This authorization remains in effect; however, the Company made no purchases of common stock in fiscal years 2016, 2015 and 2014.
19
Table of Contents
| ITEM 6. | SELECTED FINANCIAL DATA |
The following tables set forth selected consolidated financial data of Neogen for each of the five fiscal years ended May 31, 2016. The selected consolidated financial data presented below have been derived from the Company’s consolidated financial statements. This financial data should be read in conjunction with the consolidated financial statements, related notes and other financial information appearing elsewhere in this Form 10-K.
| Years Ended May 31 | ||||||||||||||||||||
| (in thousands, except per share data) | 2016 | 2015 | 2014 | 2013 | 2012 | |||||||||||||||
| Income Statement Data: |
||||||||||||||||||||
| Food Safety Revenues |
$ | 145,841 | $ | 131,479 | $ | 116,290 | $ | 106,158 | $ | 91,104 | ||||||||||
| Animal Safety Revenues |
175,434 | 151,595 | 131,115 | 101,370 | 92,942 | |||||||||||||||
|
|
|
|
|
|
|
|
|
|
|
|||||||||||
| Total Revenues |
321,275 | 283,074 | 247,405 | 207,528 | 184,046 | |||||||||||||||
| Cost of Revenues |
168,211 | 143,389 | 124,807 | 98,034 | 91,621 | |||||||||||||||
| Sales and Marketing |
57,599 | 51,757 | 46,432 | 40,791 | 35,026 | |||||||||||||||
| General and Administrative |
29,189 | 25,233 | 24,449 | 20,216 | 17,024 | |||||||||||||||
| Research and Development |
9,890 | 9,577 | 8,326 | 7,781 | 6,636 | |||||||||||||||
|
|
|
|
|
|
|
|
|
|
|
|||||||||||
| Operating Income |
56,386 | 53,118 | 43,391 | 40,706 | 33,739 | |||||||||||||||
| Other Income (Expense) |
(873 | ) | (1,042 | ) | (360 | ) | 435 | 100 | ||||||||||||
|
|
|
|
|
|
|
|
|
|
|
|||||||||||
| Income Before Income Taxes |
55,513 | 52,076 | 43,031 | 41,141 | 33,839 | |||||||||||||||
| Provision for Income Taxes |
18,975 | 18,500 | 15,000 | 14,100 | 11,450 | |||||||||||||||
|
|
|
|
|
|
|
|
|
|
|
|||||||||||
| Net Income |
36,538 | 33,576 | 28,031 | 27,041 | 22,389 | |||||||||||||||
| Net (Income) Loss Attributable to Non-controlling Interest |
26 | (49 | ) | 127 | 149 | 124 | ||||||||||||||
|
|
|
|
|
|
|
|
|
|
|
|||||||||||
| Net Income Attributable to Neogen |
$ | 36,564 | $ | 33,527 | $ | 28,158 | $ | 27,190 | $ | 22,513 | ||||||||||
|
|
|
|
|
|
|
|
|
|
|
|||||||||||
| Net Income per Share (basic)(1) |
$ | 0.98 | $ | 0.91 | $ | 0.77 | $ | 0.76 | $ | 0.64 | ||||||||||
| Net Income per Share (diluted)(1) |
$ | 0.97 | $ | 0.90 | $ | 0.76 | $ | 0.75 | $ | 0.62 | ||||||||||
| Weighted Average Shares Outstanding (diluted)(1) |
37,875 | 37,444 | 37,267 | 36,491 | 36,029 | |||||||||||||||
| 2016 | 2015 | 2014 | 2013 | 2012 | ||||||||||||||||
| Balance Sheet Data: |
||||||||||||||||||||
| Cash and Cash Equivalents and Marketable Securities |
$ | 107,796 | $ | 114,164 | $ | 76,496 | $ | 85,369 | $ | 68,645 | ||||||||||
| Working Capital(2) |
221,403 | 205,739 | 163,779 | 150,728 | 123,962 | |||||||||||||||
| Total Assets |
451,715 | 392,181 | 345,301 | 290,558 | 251,600 | |||||||||||||||
| Long-Term Debt |
0 | 0 | 0 | 0 | 0 | |||||||||||||||
| Total Equity |
404,161 | 350,963 | 306,300 | 258,287 | 219,054 | |||||||||||||||
| (1) | On October 30, 2013, the Company paid a 3-for-2 stock split affected in the form of a dividend of its common stock. All share and per share amounts have been adjusted to reflect the stock split as if it had taken place at the beginning of the period presented. |
| (2) | Defined as current assets less current liabilities. |
20
Table of Contents
| ITEM 7. | MANAGEMENT’S DISCUSSION AND ANALYSIS OF FINANCIAL CONDITION AND RESULTS OF OPERATIONS |
The information in this Management’s Discussion and Analysis of Financial Condition and Results of Operations contains both historical financial information and forward-looking statements. Neogen Corporation management does not provide forecasts of future financial performance. While management is optimistic about the Company’s long-term prospects, historical financial information may not be indicative of future financial results.
Any statements contained herein that are not statements of historical fact may be deemed to be forward-looking statements. Without limiting the foregoing, the words “believes,” “anticipates,” “plans,” “expects,” “seeks,” “estimates,” and similar expressions are intended to identify forward-looking statements. There are a number of important factors, including competition, recruitment and dependence on key employees, impact of weather on agriculture and food production, identification and integration of acquisitions, research and development risks, patent and trade secret protection, government regulation and other risks detailed from time to time in the Company’s reports on file at the Securities and Exchange Commission, that could cause Neogen Corporation’s results to differ materially from those indicated by such forward-looking statements, including those detailed in this “Management’s Discussion and Analysis of Financial Condition and Results of Operations.”
In addition, any forward-looking statements represent management’s views only as of the day this Report on Form 10-K was first filed with the Securities and Exchange Commission and should not be relied upon as representing management’s views as of any subsequent date. While management may elect to update forward-looking statements at some point in the future, it specifically disclaims any obligation to do so, even if its views change.
CRITICAL ACCOUNTING POLICIES AND ESTIMATES
The discussion and analysis of the Company’s financial condition and results of operations are based on the consolidated financial statements that have been prepared in accordance with accounting principles generally accepted in the United States. The preparation of these financial statements requires that management make estimates and judgments that affect the reported amounts of assets, liabilities, revenues and expenses, and related disclosure of contingent assets and liabilities. On an ongoing basis, management evaluates the estimates, including but not limited to, those related to receivable allowances, inventories and intangible assets. These estimates are based on historical experience and on various other assumptions that are believed to be reasonable under the circumstances, the results of which form the basis for making judgments about the carrying values of assets and liabilities that are not readily apparent from other sources. Actual results may differ from these estimates under different assumptions or conditions.
The following critical accounting policies reflect management’s more significant judgments and estimates used in the preparation of the consolidated financial statements.
Revenue Recognition
Revenue from products and services is recognized when the product has been shipped or the service performed, the sales price is fixed and determinable, and collection of any receivable is probable. To the extent that customer payment has been received before all recognition criteria are met, these revenues are initially deferred and later recognized in the period that all recognition criteria have been met. Customer credits for sales returns, pricing and other disputes, and other related matters (including volume rebates offered to certain distributors as marketing support) represent approximately 3% of reported net revenue for each period presented.
Accounts Receivable Allowance
Management attempts to minimize credit risk by reviewing customers’ credit history before extending credit and by monitoring credit exposure on a regular basis. An allowance for doubtful accounts receivable is established based upon factors surrounding the credit risk of specific customers, historical trends and other information. Collateral or other security is generally not required for accounts receivable. Once a receivable balance has been determined to be uncollectible, that amount is charged against the allowance for doubtful accounts.
Inventory
A reserve for obsolete and slow moving inventory has been established and is reviewed at least quarterly based on an analysis of the inventory, taking into account the current condition of the asset as well as other known facts and future plans. The reserve required to record inventory at lower of cost or market may be adjusted as conditions change. Product obsolescence may be caused by shelf-life expiration, discontinuance of a product line, replacement products in the marketplace or other competitive situations.
21
Table of Contents
Goodwill and Other Intangible Assets
Goodwill represents the excess of purchase price over fair value of tangible net assets of acquired businesses after amounts are allocated to other identifiable intangible assets. Other intangible assets include customer relationships, trademarks, licenses, trade names, covenants not-to-compete and patents. Amortizable intangible assets are amortized on either an accelerated or a straight-line basis over 5 to 25 years. The Company reviews the carrying amounts of goodwill and other non-amortizable intangible assets annually, or when indications of impairment exist, to determine if such assets may be impaired. If the Company’s qualitative assessment concludes that it is more likely than not that an impairment exists, or the Company skips the qualitative assessment, then the Company performs a quantitative assessment. If the carrying amounts of these assets are deemed to be less than fair value based upon a discounted cash flow analysis and comparison to comparable EBITDA multiples of peer companies, such assets are reduced to their estimated fair value and a charge is made to operations.
Long-lived Assets
Management reviews the carrying values of its long-lived assets to be held and used, including definite-lived intangible assets, for possible impairment whenever events or changes in business conditions warrant such a review. The carrying value of a long-lived asset is considered impaired when the anticipated separately identifiable undiscounted cash flows over the remaining useful life of the asset indicate that the carrying amount of the asset may not be recoverable. In such an event, fair value is determined using discounted cash flows and, if lower than the carrying value, impairment is recognized through a charge to operations.
Equity Compensation Plans
Share options awarded to employees and shares of stock awarded to employees under certain stock purchase plans are recognized as compensation expense based on their fair value at grant date. The fair market value of options granted under the Company’s stock option plans was estimated on the date of grant using the Black-Scholes option-pricing model using assumptions for inputs such as interest rates, expected dividends, volatility measures and specific employee exercise behavior patterns based on statistical data. Some of the inputs used are not market-observable and have to be estimated or derived from available data. Use of different estimates would produce different option values, which in turn would result in higher or lower compensation expense recognized.
To value options, several recognized valuation models exist. None of these models can be singled out as being the best or most correct one. The model applied by the Company is able to handle some of the specific features included in the options granted, which is the reason for its use. If a different model were used, the option values could differ despite using the same inputs. Accordingly, using different assumptions coupled with using a different valuation model could have a significant impact on the fair value of employee stock options. Fair value could be either higher or lower than the number provided by the model applied and the inputs used. Further information on the Company’s equity compensation plans, including inputs used to determine the fair value of options, is disclosed in Notes 1 and 5 to the consolidated financial statements.
Income Taxes
The Company accounts for income taxes using the asset and liability method. Under this method, deferred income tax assets and liabilities are determined based on differences between the financial reporting and tax bases of assets and liabilities and for tax credit carry forwards and are measured using the enacted tax rates in effect for the years in which the differences are expected to reverse. Deferred income tax expense represents the change in net deferred income tax assets and liabilities during the year.
The Company’s foreign subsidiaries are comprised of Neogen Europe (wholly-owned subsidiary), Lab M Holdings (wholly-owned subsidiary), Neogen Latinoamerica (90% owned subsidiary), Neogen do Brasil (90% owned subsidiary), Neogen Bio-Scientific Technology Co (Shanghai) (wholly-owned subsidiary), Neogen Food and Animal Security (India) (wholly-owned subsidiary), Neogen Canada (wholly-owned subsidiary) and Deoxi Biotecnologia Ltda (wholly-owned subsidiary). Based on historical experience, as well as the Company’s future plans, earnings from these subsidiaries are expected to be re-invested indefinitely for future expansion and working capital needs. Furthermore, the Company’s domestic operations have historically produced sufficient operating cash flow to mitigate the need to remit foreign earnings. On an annual basis, the Company evaluates the current business environment and whether any new events or other external changes might require a re-evaluation of the decision to indefinitely re-invest foreign earnings. At May 31, 2016, unremitted earnings of the foreign subsidiaries were $27,880,000.
22
Table of Contents
RESULTS OF OPERATIONS
Executive Overview
Total consolidated revenue for Neogen Corporation in fiscal 2016 was $321.3 million, an increase of 13% compared to revenue of $283.1 million in fiscal 2015. Net income attributable to Neogen increased 9% to $36.6 million, or $0.97 per fully diluted share, compared to $33.5 million, or $0.90 per fully diluted share, in fiscal 2015. Cash flow from operations for fiscal 2016 was $35.3 million compared to $43.8 million in fiscal 2015.
The Company’s Food Safety segment revenues were $145.8 million in fiscal 2016, an increase of 11% compared to prior fiscal year revenues of $131.5 million. Animal Safety segment revenues were $175.4 million, up 16%, compared to $151.6 million in fiscal 2015. Organic sales growth for fiscal 2016 was 6% for the Food Safety segment and 14% for the Animal Safety segment, each compared to the prior fiscal year.
Revenue increases were aided by acquisitions the Company completed in the 2015 and 2016 fiscal years, which added revenue totaling $9.0 million during the fiscal 2016 year. BioLumix was acquired in October 2014 of the prior fiscal year. In fiscal 2016, the Company acquired Sterling Test House (June 2015), a commercial food service testing laboratory in India, which was purchased as the Company’s entry point into the important Indian market; Lab M (August 2015), a manufacturer and marketer of dehydrated culture media based in England; Virbac (December 2015), a line of rodenticides with a number of international product registrations; Deoxi (April 2016), a genomics lab in Brazil, to aid in the expansion of the Company’s genomics efforts in that country; and Preserve/Tetradyne (May 2016), manufacturers and marketers of cleaners and disinfectants, an important component of the Company’s biosecurity product offering, with particular strength in the swine and cattle markets.
International sales were $107.7 million in fiscal 2016, an increase of 4% compared to the prior fiscal year. Sales growth in the Company’s international operations, which report primarily in its Food Safety segment, was adversely impacted by the strength of the U.S. dollar, which rose during the year against all currencies in which the Company conducts business. Neogen Europe recorded a 3% revenue gain in pound sterling compared to the prior year; however, these revenues resulted in a 3% decrease when converted to U.S. dollars. Neogen do Brasil had revenue increases of 49% in its local currency, the real, due to strong sales increases of its BetaStar dairy antibiotics test kits; this was reduced to a 7% increase in dollars due to the significant devaluation of the real against the dollar in fiscal 2016. Neogen Latinoamerica recorded a revenue increase of 44% in fiscal 2016, which reduced to 20% when converted to dollars. In local currency, Neogen China increased revenues 91% in fiscal 2016, albeit off of a small base, with minimal impact due to currency conversion. On a neutral currency basis, organic growth for the Company for fiscal 2016 was 12% for the Food Safety segment; currency had no impact on organic growth in the Animal Safety segment.
Expressed as a percentage of total sales, international sales in fiscal 2016 were 33.5% compared to 36.7% in fiscal 2015. This decline as a percentage of sales was due in part to the strength of the U.S. dollar, which reduced comparative revenues in the local currency when converted to dollars; international sales were negatively impacted by $7.7 million on a comparative basis for fiscal 2016. Additionally, sales of the Company’s cleaners and disinfectants to international customers declined by 28%, due to dollar strength which made these products less competitive internationally compared to products produced locally, and poor economic conditions in a number of our key international markets.
Service revenue was $47.7 million in fiscal 2016, an increase of 22% compared to prior year revenues of $39.2 million. The increase for the year was primarily due to increased business with a large customer in the poultry industry, and sales of new proprietary genomic offerings developed for the beef and dairy cattle and pork industries for both domestic and international customers. The Company also benefitted from the expansion of its genomics service capabilities at its Ayr, Scotland facilities.
Gross margins were 47.6% in fiscal 2016, versus 49.3% in fiscal 2015. The decrease was primarily the result of lower gross margins in the Food Safety segment, resulting from adverse currency impacts caused by the strong U.S. dollar, and product mix changes towards products which have lower gross margins within Food Safety. Additionally, a greater proportion of the Company’s overall revenues derived from the Animal Safety segment, which has lower average gross margins than the Food Safety segment. Operating expenses rose 12% in fiscal 2016 compared to 2015; expressed as a percentage of revenues, operating expenses decreased from 30.6% in fiscal 2015 to 30.1% in fiscal 2016; the Company controlled its expense growth while incurring additional amortization and other expenses related to its recent acquisitions.
23
Table of Contents
REVENUES
| Year Ended | ||||||||||||||||||||
| (dollars in thousands) |
May 31, 2016 | Increase/ (Decrease) |
May 31, 2015 | Increase/ (Decrease) |
May 31, 2014 | |||||||||||||||
| Food Safety: |
||||||||||||||||||||
| Natural Toxins, Allergens & Drug Residues |
$ | 63,269 | 4 | % | $ | 60,561 | 0 | % | $ | 60,358 | ||||||||||
| Bacterial & General Sanitation |
33,899 | 15 | % | 29,492 | 20 | % | 24,652 | |||||||||||||
| Dehydrated Culture Media & Other |
48,673 | 17 | % | 41,426 | 32 | % | 31,280 | |||||||||||||
|
|
|
|
|
|
|
|||||||||||||||
| 145,841 | 11 | % | 131,479 | 13 | % | 116,290 | ||||||||||||||
| Animal Safety: |
||||||||||||||||||||
| Life Sciences |
7,815 | (10 | %) | 8,715 | 16 | % | 7,528 | |||||||||||||
| Veterinary Instruments & Disposables |
42,028 | 1 | % | 41,740 | 24 | % | 33,593 | |||||||||||||
| Animal Care & Other |
37,074 | 34 | % | 27,606 | (9 | %) | 30,366 | |||||||||||||
| Rodenticides, Insecticides & Disinfectants |
53,490 | 17 | % | 45,857 | 25 | % | 36,702 | |||||||||||||
| DNA Testing |
35,027 | 27 | % | 27,677 | 21 | % | 22,926 | |||||||||||||
|
|
|
|
|
|
|
|||||||||||||||
| 175,434 | 16 | % | 151,595 | 16 | % | 131,115 | ||||||||||||||
|
|
|
|
|
|
|
|||||||||||||||
| Total Revenue |
$ | 321,275 | 13 | % | $ | 283,074 | 14 | % | $ | 247,405 | ||||||||||
|
|
|
|
|
|
|
|||||||||||||||
Year Ended May 31, 2016 Compared to Year Ended May 31, 2015
The Company’s Food Safety segment revenues were $145.8 million in fiscal 2016, an 11% increase compared to the prior year. The increase, predominantly volume related, from organic sales was 6%, with revenues from the BioLumix (October 2014), Lab M (August 2015) and Deoxi (April 2016) acquisitions contributing the remainder of the growth. Sales of Natural Toxins, Allergens and Drug Residues increased 4% in the current fiscal year compared to fiscal 2015. Natural toxin sales were flat with a 10% increase in aflatoxin sales offset by a 3% decrease in DON sales, due to outbreaks in the prior year which were not repeated in fiscal 2016. Allergen sales increased 20%, as increased consumer awareness continued to grow demand for these products, while sales of drug residue test kits decreased 5%, caused by currency conversions, as the majority of these sales are invoiced in euros.
Bacterial and General Sanitation revenues increased 15% in fiscal 2016, aided by $1.9 million in sales from the October 2014 BioLumix acquisition. Excluding BioLumix sales, the organic increase in these products was 9% over the prior year. The AccuPoint sanitation monitoring product line recorded an increase of 18% due to the continued successful introduction of an improved, next generation product line. Sales of the Soleris and BioLumix product lines, which detect spoilage organisms, increased 23% for the year (5% organic growth), with revenue increases in both equipment and disposable vials. Pathogen sales increased 4% in fiscal 2016 as compared to the prior year, primarily due to an increase in sales of Listeria test kits to the commercial lab market.
Dehydrated Culture Media and Other sales increased 17% in fiscal 2016. This category includes $4.8 million of Lab M sales, a business which was acquired in August 2015; excluding the impact of these revenues, the organic increase was 6%. Sales of Acumedia products into the food safety market increased 10% while sales into traditional domestic media markets increased 16%. Genomics service revenues in the Company’s international operations (reported within Other) increased 4% while sales of Animal Safety products primarily to customers in Mexico, Central America and Brazil, also reported in this category, decreased 8% in U.S. dollars, due to the strength of the dollar, poor economic conditions in some of these markets and order timing from large distributors.
The Company’s Animal Safety segment revenues were $175.4 million in fiscal 2016, a 16% increase, predominantly volume related, over fiscal 2015. Life Sciences sales decreased 10% in fiscal 2016 after a strong 16% increase in 2015. Sales of forensic kits to commercial labs declined as new testing requirements in Brazil for commercial drivers, originally anticipated to go into effect in late fiscal 2015, were delayed until the 4th quarter of fiscal 2016. Veterinary Instruments and Disposables increased 1%, as market share gains in disposable syringes, up 25%, and animal marking products, up 14%, were almost entirely offset by an 8% decrease in detectable needles, due to large orders in the prior year which did not recur, and an 11% decline in hoof and leg products, due to lower sales of these products to customers in the retail market.
Animal Care and Other product sales rose 34% in fiscal 2016, with the increase primarily the result of a new distribution agreement with a large manufacturer and supplier of dairy equipment, and strong sales of the Company’s line of thyroid replacement therapy for companion animals. Also contributing to growth in the Animal Care product category were increased sales of wound care products, as a key active ingredient which had been on backorder for much of fiscal 2015, became available in fiscal 2016, and veterinary antibiotics, due to a competitor exiting the business. During the fourth quarter of fiscal 2016, the Company was notified that a competitor had been granted approval on a new drug application for a competitive thyroid replacement product, effectively giving them exclusive rights to sell the product. As a result, the Company will be unable to sell its product into the domestic market effective the end of July 2016, until it is granted similar regulatory approval; this approval is expected in fiscal 2018. Sales of this product in fiscal 2016 were $6.6 million.
24
Table of Contents
The Company’s line of Rodenticides, Insecticides and Disinfectants rose 17% in fiscal 2016, compared to the prior year, led by a 58% increase in sales of rodenticides. This increase was in large part the result of an expansion of the Company’s contract manufacturing business with a large marketer of rodenticides to the commercial and residential markets. Additionally, the Company successfully introduced a number of new products into the retail agricultural market, and also benefitted from the continued vole outbreak in the northwestern U.S. Cleaners and disinfectant revenues declined 9% compared to fiscal 2015, primarily due to lower sales to international customers as the strength of the U.S. dollar made the Company’s products less competitive internationally; poor economic conditions in a number of the Company’s key international markets also adversely impacted sales. The Company’s line of insecticides rose 1% in fiscal 2016, as incremental revenues from new product launches were almost entirely offset by lower sales of existing products due to timing of orders and backorders caused by a vendor issue.
DNA Testing Services revenues increased 27% in fiscal 2016 compared to the same period in the prior year. Incremental business with a large poultry producer, earned in fiscal 2015, was the primary driver of the growth. The Company also continued to gain market share in fiscal 2016 with its proprietary chip technology, primarily to cattle and pig producers, and grew sample volume particularly with its largest customers. In addition, the canine testing service business grew 17% as the Company successfully commercialized new service offerings, developed in the prior fiscal year.
Year Ended May 31, 2015 Compared to Year Ended May 31, 2014
The Company’s Food Safety segment revenues were $131.5 million in fiscal 2015, a 13% increase compared to the prior year. Sales of Natural Toxins, Allergens and Drug Residues were flat in fiscal 2015 as compared to the prior year. Natural toxin sales increased 5%, with strong sales of DON test kits, up 28% due to outbreaks of this toxin in crops in Eastern Europe, Canada and the U.S. This increase was offset by a 15% decline in aflatoxin test kits due to a difficult comparison to the prior year caused by high demand from aflatoxin outbreaks in Eastern Europe, and relatively clean crops in the current fiscal year relative to that toxin.
Revenues for the Company’s test kits to detect allergens such as milk, gluten, soy, peanut, and egg, among others, in processed foods rose 18%, the result of higher demand resulting from increased recalls due to inadvertent allergenic contamination and higher consumer awareness of the risks of ingesting foods with allergenic components. Included within this category and partially offsetting the gains from allergen products were decreased sales of meat speciation test kits, which declined 40% in fiscal 2015, due to lower levels of testing during the year and competitor entry into the market. Sales of drug residue test kits were down 16% this year, primarily due to currency conversion and lower test kit volumes to customers in Eastern Europe due to delays in the launch of a new product in that region.
Bacterial and General Sanitation revenues increased 20% in fiscal 2015, aided by $4.0 million in revenues from the October 1, 2014 BioLumix acquisition. Excluding BioLumix sales, the increase was 4% over the prior year. The Soleris consumable product line, which consists primarily of reagent vials used to detect spoilage organisms such as yeast and molds in foods, increased 10%, while sales of the recently-launched next generation AccuPoint environmental reader increased 35%. Ampoule media and filter sales increased 14% compared to the prior fiscal year; the Company continues to gain new customers and market share, primarily in the beverage industry. Partially offsetting these gains was a 43% decline in Soleris equipment sales due to difficult comparisons caused by prior year international placements, which did not repeat in the current fiscal year.
Dehydrated Culture Media and Other sales increased 32% in the current fiscal year. Within this product category, Acumedia sales increased 5% in fiscal 2015. While sales of Acumedia products to food safety customers increased 10%, this was offset by flat sales to the traditional media market due to lower demand and continuing credit issues at some significant customers. Genomics revenues to European customers (included as Other revenues), increased 57% due to market share gains for services and the sale of new proprietary product offerings. Also included in this category were sales of Animal Safety products to customers in Mexico and Central America, transferred to the Company’s Neogen Latinoamerica subsidiary which reports in the Food Safety segment, to better serve customers in those locations.
The Company’s Animal Safety segment revenues were $151.6 million in fiscal 2015, a 16% increase over fiscal 2014. Life Sciences sales increased 16% in fiscal 2015 compared to the prior year, led by forensic kit sales to commercial labs to meet new testing requirements in Brazil for commercial drivers. For the year, revenues of Veterinary Instruments and Disposables increased 24%. This product category benefitted from revenues from the SyrVet and Prima Tech acquisitions from fiscal 2014; these product lines were almost entirely veterinary instruments. Excluding these revenues, organic growth in this category was 14% for fiscal 2015, led by sales of detectable needles, which continued to be a strong product line with growth of 29% in fiscal 2015. Partially offsetting some of this growth was the transfer of customers and revenue in Mexico and Central America to Neogen Latinoamerica, in order to more directly serve those customers.
25
Table of Contents
Sales of Animal Care and Other products declined 9% in fiscal 2015; on an organic basis, these sales were down 15%, partially due to the transfer of some customers to Neogen Latinoamerica. Within this category in fiscal 2014, the Company recorded strong sales of a wound care product caused by a supply disruption in the market. This product was available for sale from all competitors in fiscal 2015, and revenues for this product declined. Additionally, sales of a distributed antibiotic declined due to supplier discontinuance of the product. Animal supplements rose by $1.5 million in fiscal 2015, due to strong sales of the Company’s thyroid replacement offering for the canine market.
Rodenticides, Insecticides and Disinfectants sales increased 25% in fiscal 2015, largely the result of revenues gained from the Chem-Tech insecticide business acquisition in January 2014. Excluding the contribution from this acquisition, the organic increase in this category was 4%. Rodenticide sales increased 21%, primarily due to rodent infestations in the northwestern U.S. and the capture of new business. Partially offsetting this growth was a 12% decrease in sales of cleaners and disinfectants, due to unusually high sales in the prior year caused by a porcine virus outbreak, primarily in international markets.
DNA Testing revenues, excluding sales through Neogen Europe, Neogen do Brasil and Neogen China, which are reported in the Food Safety segment, increased 21% in fiscal 2015 as compared to the prior year. Continuing improvements to a number of proprietary service offerings, primarily targeted at dairy and beef cattle markets, helped the Company increase sales to existing customers and gain market share. Additionally, there were strong sales to a new poultry customer in the current fiscal year.
COST OF REVENUES
| (dollars in thousands) |
2016 | Increase | 2015 | Increase | 2014 | |||||||||||||||
| Cost of Revenues |
$ | 168,211 | 17 | % | $ | 143,389 | 15 | % | $ | 124,807 | ||||||||||
Cost of revenues increased 17% in fiscal 2016 and 15% in fiscal 2015 in comparison with the prior years. This compares with revenue increases of 13% in fiscal 2016 and 14% in fiscal 2015. Expressed as a percentage of revenues, cost of revenues was 52.4%, 50.7% and 50.4% in fiscal years 2016, 2015 and 2014, respectively. For fiscal 2016, the strength of the U.S. dollar, which adversely impacted top line revenue with no corresponding decline in product cost, had the largest impact on the decline in gross margins. In addition, shifts in product mix within the Food Safety segment, in part the result of acquisitions completed in fiscal years 2015 and 2016, towards products which have lower gross margins than the segment average, and a shift in the proportion of Animal Safety revenues to the overall revenue of the Company, resulted in the decline in gross margins. For fiscal year 2015, the increase in cost of revenues, expressed as a percentage of sales, and the corresponding decline in gross margin percentage was due to the strength of the U.S. dollar, the overall shift in revenues towards Animal Safety products and product mix shifts within each segment.
Food Safety gross margins were 56.7%, 59.7% and 62.5% in fiscal years 2016, 2015 and 2014, respectively. In fiscal 2016, the lower gross margins resulted primarily from the strength in the U.S. dollar, which resulted in lower revenues and gross margins when international sales, primarily in Europe, Mexico and Brazil, were converted from local currencies to the dollar. All currencies the Company operates in weakened against the dollar in fiscal 2016, pressuring margins in this segment. Additionally, revenues from the acquisition of Lab M, which were at lower average gross margins than the rest of the segment, standard cost adjustments at Neogen Latinoamerica, and other product mix shifts within the segment, negatively impacted gross margins in Food Safety.
Animal Safety gross margins were 40.1%, 40.4% and 38.1% in fiscal years 2016, 2015 and 2014, respectively. For fiscal 2016, improved gross margins from the 58% increase in sales of rodenticides, which have higher than average gross margins within the segment, were offset by lower gross margins on revenues from the dairy distribution business initiated in August 2015, lower gross margins at GeneSeek due to the significant increase in poultry business, which has lower than average gross margins within the genomics product line, and other product mix shifts within the segment. The improved margins in fiscal 2015 compared to fiscal 2014 reflect a mix shift towards higher margin products and efficiency gains made in a number of the segment’s operating units. Rodenticides had a sales increase of 21% due to a vole infestation in the northwestern U.S., and the Company’s animal supplements product line experienced an increase of 16%, due to strong sales of the Company’s higher margin thyroid replacement product.
26
Table of Contents
OPERATING EXPENSES
| (dollars in thousands) |
2016 | Increase | 2015 | Increase | 2014 | |||||||||||||||
| Sales and Marketing |
$ | 57,599 | 11 | % | $ | 51,757 | 11 | % | $ | 46,432 | ||||||||||
| General and Administrative |
29,189 | 16 | % | 25,233 | 3 | % | 24,449 | |||||||||||||
| Research and Development |
9,890 | 3 | % | 9,577 | 15 | % | 8,326 | |||||||||||||
Sales and marketing expenses increased by 11% in fiscal 2016 and 11% in fiscal 2015, each compared with the prior year. As a percentage of sales, sales and marketing expense was 17.9%, 18.3% and 18.8% in fiscal years 2016, 2015 and 2014, respectively. For fiscal 2016, salaries, commissions and travel expenses for the sales and marketing group, which is also comprised of technical service, customer service and product management personnel, rose 13%, primarily on increases in staffing. Other significant expense increases were sales promotions and allowances, based on higher levels of sales to the Company’s largest distributors, shipping expense, up 13% and in line with the revenue increase, and shows and exhibits, which rose 22%, on increased Company participation in trade shows. In fiscal 2015, salaries and commission expense were the largest increase in this category at 15%, reflecting the increase in personnel and revenue. Other significant increases were shipping expense, which was 15% higher and commensurate with the increase in revenues, and other personnel-related expenses, such as fringe benefits and travel.
General and administrative expenses increased 16% in fiscal 2016 compared to fiscal 2015 and by 3% in fiscal 2015 compared to fiscal 2014. The increases in fiscal years 2016 and 2015, respectively, are primarily due to increased salaries, higher stock option expense and increased amortization of intangible assets resulting from the Company’s recent acquisitions. In addition, legal and professional fees rose by $425,000 in fiscal 2016, the result of higher levels of acquisition activity. In fiscal 2015, legal expenses declined by $1.2 million, or 73%, primarily related to a lawsuit that was settled in October 2014; this decrease muted the overall increase in this category for that period.
Research and development expenses increased 3% in fiscal 2016 compared to fiscal 2015 and 15% in fiscal 2015 compared to fiscal 2014. Higher salaries expense, from both increases in base wages as well as increased headcount, and increases in development activities, are the drivers of the increase. These increases were partially offset by lower levels of consulting and other outside services. In fiscal 2015, the increase in expense was primarily due to higher salaries, resulting from increased headcount needed to support the Company’s product development efforts, and outside services and lab supplies, due to higher levels of commercialization activities. As a percentage of revenue, these expenses were 3.1% in fiscal year 2016 and 3.4% in fiscal years 2015 and 2014; the Company expects to continue to spend 3% to 4% of total revenue on research and development annually. For those products requiring support by research and development, which are primarily Food Safety diagnostics products, the Company has spent approximately 6% of revenues for the past three years on its research and development efforts.
OPERATING INCOME
| (dollars in thousands) |
2016 | Increase | 2015 | Increase | 2014 | |||||||||||||||
| Operating Income |
$ | 56,386 | 6 | % | $ | 53,118 | 22 | % | $ | 43,391 | ||||||||||
The Company’s operating income increased by 6% in fiscal 2016 compared to fiscal 2015, and by 22% in fiscal 2015 compared to fiscal 2014. Expressed as a percentage of revenues, it was 17.6%, 18.8% and 17.5% in fiscal years 2016, 2015 and 2014, respectively.
The 6% increase in operating income in fiscal 2016 was due primarily to the 13% increase in revenues and lower rates of increases in operating expenses, partially offset by the 170 basis point reduction in gross margin expressed as a percentage of revenues, which was the result of the adverse currency impact of the stronger U.S. dollar, and mix shifts within and between segments. The Company controlled its expense growth while incurring additional amortization and other expenses relating to its recent acquisitions.
In fiscal 2015, the 22% increase in operating income was due to the 14% increase in revenues and lower increases in sales and marketing and general and administrative expenses, partially offset by the slight reduction in gross margin expressed as a percentage of revenues. The Company was able to increase revenues at a faster rate than expense growth in these categories due to efficiencies of scale gained from recent acquisitions.
27
Table of Contents
OTHER INCOME (EXPENSE)
| (dollars in thousands) |
2016 | Increase/ (Decrease) |
2015 | Increase/ (Decrease) |
2014 | |||||||||||||||
| Operating Income (Expense) |
$ | (873) | 16% | $ | (1,042) | (189%) | $ | (360) | ||||||||||||
Other Income (Expense) consists principally of royalty income, interest income from investing the Company’s excess cash balances, the impact of foreign currency transactions, adjustments to contingent consideration liabilities relating to acquisitions, and other miscellaneous items.
In fiscal 2016, Other Expense primarily consisted of losses on foreign currency translations of $1,338,000, the result of all foreign currencies in which we operate devaluing against the U.S. dollar. In addition, the Company recognized interest income of $322,000, and royalty income of $217,000.
In fiscal 2015, Other Income (Expense) primarily consisted of losses on foreign currency translations of $1,124,000, the result of the stronger U.S. dollar during the year. In addition, the Company recognized interest income of $228,000, royalty income of $150,000 and net expense of $297,000 resulting from contingent consideration payments made during the year for prior year acquisitions. The contingent consideration adjustments consisted of $241,000 of income for SyrVet, $454,000 of expense for Prima Tech, and $84,000 of expense for Chem-Tech; these adjustments were the difference between the liability recorded at the initial purchase of each business and the actual payment made to the former owners, and were based on the achievement of sales goals for the first twelve months of the Company’s ownership.
In fiscal 2014, Other Income (Expense) consisted primarily of losses on foreign currency translations of $717,000, partially offset by $231,000 in royalty income and $115,000 in interest income.
PROVISION FOR INCOME TAXES
| (dollars in thousands) |
2016 | Increase | 2015 | Increase | 2014 | |||||||||||||||
| Provision for Income Taxes |
$ | 18,975 | 3% | $ | 18,500 | 23% | $ | 15,000 | ||||||||||||
The effective tax rate was 34.2% of pretax income in fiscal 2016, 35.5% in fiscal 2015 and 34.9% in fiscal 2014. Differences in the tax rate from the 35% statutory corporate rate were primarily due to increases from international taxes and the provision for state taxes, offset by tax credits related to domestic manufacturing and research and development activities. The effective tax rate declined in fiscal 2016 due primarily to amendments filed for the fiscal 2012, 2013 and 2014 federal income tax returns and an adjustment for fiscal 2015 relating to credits claimed for research and development activities. The Company engaged a third party in fiscal 2016 to perform a study of its research and development activities, and credits originally claimed thereon, for these prior annual periods. Based on the results of the study, the Company revised its calculations for its research and development activities for those periods, resulting in higher tax credits. The effective tax rate increased in fiscal 2015 from fiscal 2014 due to increased state tax expense resulting from the Company’s presence in additional states due to recent acquisitions and a valuation allowance for deferred tax assets at Neogen do Brasil.
NET INCOME AND INCOME PER SHARE
| (dollars in thousands-except per share data) |
2016 | Increase | 2015 | Increase | 2014 | |||||||||||||||
| Net Income Attributable to Neogen |
$ | 36,564 | 9% | $ | 33,526 | 19% | $ | 28,158 | ||||||||||||
| Net Income Per Share-Basic |
0.98 | 0.91 | 0.77 | |||||||||||||||||
| Net Income Per Share-Diluted |
0.97 | 0.90 | 0.76 | |||||||||||||||||
Net income increased by 9% in fiscal 2016 and increased by 19% in fiscal 2015, each compared with the prior year. As a percentage of revenue, net income was 11.4% in fiscal 2016, 11.8% in fiscal 2015 and 11.4% in fiscal 2014.
28
Table of Contents
FUTURE OPERATING RESULTS
Neogen Corporation’s future operating results involve a number of risks and uncertainties. Actual events or results may differ materially from those discussed in this report. Factors that could cause or contribute to such differences include, but are not limited to, the factors discussed below as well as those discussed elsewhere in this report. Management’s ability to grow the business in the future depends upon its ability to successfully implement various strategies, including:
| • | developing, manufacturing and marketing new products with new features and capabilities; |
| • | expanding the Company’s markets by fostering increased use of Company products by customers; |
| • | maintaining or increasing gross and net operating margins in changing cost environments; |
| • | strengthening sales and marketing activities in geographies outside of the U.S.; |
| • | developing and implementing new technology development strategies; and |
| • | identifying and completing acquisitions that enhance existing product categories or create new products or services. |
FINANCIAL CONDITION AND LIQUIDITY
On May 31, 2016, the Company had $55.3 million in cash and cash equivalents, $52.5 million in marketable securities and working capital of $221.4 million. For the year ended May 31, 2016, cash generated from operating activities was $35.3 million, compared to the $43.8 million generated in fiscal 2015; proceeds from stock option exercises provided an additional $12.4 million of cash. For the same period, additions to property and equipment and business acquisitions used cash of $14.2 million and $42.5 million, respectively. The Company has a financing agreement with a bank providing for an unsecured revolving line of credit of $12.0 million, which expires on September 1, 2017. There were no advances against this line of credit during fiscal years 2016, 2015 and 2014, and no balance outstanding at May 31, 2016 and 2015.
Accounts receivable at May 31, 2016 increased $8.4 million, or 14%, compared to balances at May 31, 2015, primarily due to the increase in revenues. Days sales outstanding, a measurement of the time it takes to collect receivables, decreased from 63 days at May 31, 2015 to 61 days at May 31, 2016. All customer accounts are actively managed and no losses in excess of amounts reserved are currently expected.
Inventory balances were $64.4 million at May 31, 2016, an increase of $12.8 million, or 25%, compared to $51.6 million at May 31, 2015. Approximately $4.0 million of the increase was from acquisitions completed during fiscal 2016, primarily relating to Lab M and Preserve/Tetradyne; an additional $1.0 million of the increase is due to the dairy distribution agreement entered into in fiscal 2016. The Company also increased inventory levels at its other operations to support the increases in revenues, and to ensure adequate safety stocks to minimize backorders. The Company continues to identify and rationalize redundant product offerings resulting from recent acquisitions.
Neogen has been consistently profitable from operations and has generated positive cash flow, approximating its net income, from operations during fiscal years 2014, 2015 and 2016. However, the Company’s cash on hand and current borrowing capacity may not be sufficient to meet the Company’s cash requirements to commercialize products currently under development or its potential plans to acquire additional businesses, technology and products that fit within the Company’s strategic plan. Accordingly, the Company may be required, or may choose, to issue equity securities or enter into other financing arrangements for a portion of its future capital needs.
The Company is subject to certain legal and other proceedings in the normal course of business that have not had, and, in the opinion of management, are not expected to have, a material effect on its results of operations or financial position.
29
Table of Contents
CONTRACTUAL OBLIGATIONS
The Company has the following contractual obligations due by period:
| (in thousands) | Total | Less than one year |
1-3 years | 3-5 years | More than 5 years |
|||||||||||||||
| Long-Term Debt |
$ | 0 | $ | 0 | $ | 0 | $ | 0 | $ | 0 | ||||||||||
| Operating Leases |
1,144 | 541 | 485 | 118 | 0 | |||||||||||||||
| Unconditional Purchase Obligations |
50,091 | 50,091 | 0 | 0 | 0 | |||||||||||||||
|
|
|
|
|
|
|
|
|
|
|
|||||||||||
| $ | 51,235 | $ | 50,632 | $ | 485 | $ | 118 | $ | 0 | |||||||||||
NEW ACCOUNTING PRONOUNCEMENTS
See discussion of any New Accounting Pronouncements in Note 1 to Consolidated Financial Statements.
30
Table of Contents
| ITEM 7A. | QUANTITATIVE AND QUALITATIVE DISCLOSURES ABOUT MARKET RISKS |
The Company has interest rate and foreign exchange rate risk exposure but no long-term fixed rate investments or borrowings. The Company’s primary interest rate risk is due to potential fluctuations of interest rates for variable rate borrowings (no borrowings at May 31, 2016) and short-term investments.
Foreign exchange risk exposure arises because the Company markets and sells its products throughout the world. Revenues in certain foreign countries as well as certain expenses related to those revenues are transacted in currencies other than the U.S. dollar. The Company’s operating results are exposed to changes in exchange rates between the U.S. dollar, the British pound sterling, the euro, the Mexican peso, the Brazilian real, the Chinese yuan, and to a lesser extent, the Indian rupee and the Canadian dollar. When the U.S. dollar weakens against foreign currencies, the dollar value of revenues denominated in foreign currencies increases. When the U.S. dollar strengthens, the opposite situation occurs. Additionally, previously recognized revenues in the course of collection can be affected positively or negatively by changes in exchange rates. The Company uses derivative financial instruments to help manage the economic impact of fluctuations in certain currency exchange rates. These contracts are adjusted to fair value through earnings.
Neogen has assets, liabilities and operations outside of the United States, located in Scotland, England, Brazil, Mexico, China, India, and Canada where the functional currency is the British pound sterling, Brazilian real, Mexican peso, Chinese yuan, Indian rupee and Canadian dollar, respectively, and also transacts business throughout Europe in the euro. The Company’s investments in foreign subsidiaries are considered to be long-term.
| ITEM 8. | FINANCIAL STATEMENTS AND SUPPLEMENTAL DATA |
The response to this item is submitted in a separate section of this report starting on page F-1.
| ITEM 9. | CHANGES IN AND DISAGREEMENTS WITH ACCOUNTANTS ON ACCOUNTING AND FINANCIAL DISCLOSURE—NONE |
| ITEM 9A. | CONTROLS AND PROCEDURES |
Evaluation of Disclosure Controls and Procedures
An evaluation was performed under the supervision and with the participation of the Company’s management, including the Chief Executive Officer and Chief Financial Officer, of the effectiveness of the design and operation of the Company’s disclosure controls and procedures (as defined in Rule 13a-15 (e) under the Securities Exchange Act of 1934) as of May 31, 2016. Based on and as of the time of such evaluation, the Company’s Management, including the Chief Executive Officer and Chief Financial Officer, concluded that the Company’s disclosure controls and procedures were effective as of the end of the period covered by this report to ensure that information required to be disclosed in the reports that are filed or submitted under the Securities and Exchange Act of 1934 is appropriately recorded, processed, summarized and reported within the time periods specified in the Securities and Exchange Commission’s rules and forms. Disclosure controls and procedures include, without limitation, controls and procedures designed to ensure the information required to be disclosed in the reports that are filed or submitted under the Securities Exchange Act of 1934 is accumulated and communicated to management, including the Chief Executive Officer and Chief Financial Officer, as appropriate to allow timely decisions regarding required disclosure.
Management’s Report on Internal Control over Financial Reporting
Management is responsible for establishing and maintaining adequate internal control over financial reporting, as such term is defined in Exchange Act Rules 13-a-15(f) and 15d-15(f). Under the supervision and with the participation of the Company’s management, including the Chief Executive Officer and Chief Financial Officer, an evaluation was conducted as to the effectiveness of internal control over financial reporting as of May 31, 2016, based on the framework in Internal Control – Integrated Framework (2013) issued by the Committee of Sponsoring Organizations of the Treadway Commission (COSO). Based on that evaluation, management concluded that internal control over financial reporting was effective as of May 31, 2016. The effectiveness of internal control over financial reporting as of May 31, 2016, has been audited by BDO USA, LLP, an independent registered public accounting firm, as stated in its attestation report, which is included on the following page and is incorporated into this Item 9A by reference.
Changes in Internal Control over Financial Reporting
No changes in our internal control over financial reporting were identified as having occurred during the quarter ended May 31, 2016 that have materially affected, or are reasonably likely to materially affect, internal control over financial reporting.
31
Table of Contents
Report of Independent Registered Public Accounting Firm
Board of Directors and Stockholders
Neogen Corporation and Subsidiaries
Lansing, Michigan
We have audited Neogen Corporation and Subsidiaries’ internal control over financial reporting as of May 31, 2016, based on criteria established in Internal Control – Integrated Framework (2013) issued by the Committee of Sponsoring Organizations of the Treadway Commission (the COSO criteria). Neogen Corporation and Subsidiaries’ management is responsible for maintaining effective internal control over financial reporting and for its assessment of the effectiveness of internal control over financial reporting, included in the accompanying “Item 9A, Management’s Report on Internal Control Over Financial Reporting”. Our responsibility is to express an opinion on the company’s internal control over financial reporting based on our audit.
We conducted our audit in accordance with the standards of the Public Company Accounting Oversight Board (United States). Those standards require that we plan and perform the audit to obtain reasonable assurance about whether effective internal control over financial reporting was maintained in all material respects. Our audit included obtaining an understanding of internal control over financial reporting, assessing the risk that a material weakness exists, and testing and evaluating the design and operating effectiveness of internal control based on the assessed risk. Our audit also included performing such other procedures as we considered necessary in the circumstances. We believe that our audit provides a reasonable basis for our opinion.
A company’s internal control over financial reporting is a process designed to provide reasonable assurance regarding the reliability of financial reporting and the preparation of financial statements for external purposes in accordance with generally accepted accounting principles. A company’s internal control over financial reporting includes those policies and procedures that (1) pertain to the maintenance of records that, in reasonable detail, accurately and fairly reflect the transactions and dispositions of the assets of the company; (2) provide reasonable assurance that transactions are recorded as necessary to permit preparation of financial statements in accordance with generally accepted accounting principles, and that receipts and expenditures of the company are being made only in accordance with authorizations of management and directors of the company; and (3) provide reasonable assurance regarding prevention or timely detection of unauthorized acquisition, use, or disposition of the company’s assets that could have a material effect on the financial statements.
Because of its inherent limitations, internal control over financial reporting may not prevent or detect misstatements. Also, projections of any evaluation of effectiveness to future periods are subject to the risk that controls may become inadequate because of changes in conditions, or that the degree of compliance with the policies or procedures may deteriorate.
In our opinion, Neogen Corporation and Subsidiaries maintained, in all material respects, effective internal control over financial reporting as of May 31, 2016, based on the COSO criteria.
We also have audited, in accordance with the standards of the Public Company Accounting Oversight Board (United States), the consolidated balance sheets of Neogen Corporation and Subsidiaries as of May 31, 2016 and 2015, and the related consolidated statements of income, comprehensive income, equity, and cash flows for each of the three years in the period ended May 31, 2016, and our report dated July 29, 2016 expressed an unqualified opinion thereon.
/s/ BDO USA, LLP
Grand Rapids, Michigan
July 29, 2016
32
Table of Contents
| ITEM 9B. | OTHER INFORMATION – NONE |
| ITEM 10. | DIRECTORS AND EXECUTIVE OFFICERS OF THE REGISTRANT AND CORPORATE GOVERNANCE |
Information regarding the Company and certain corporate governance matters appearing under the captions “Election of Directors”, “Audit Committee”, and “Miscellaneous-Section 16(a) Beneficial Ownership Reporting Compliance” is incorporated by reference to Neogen’s 2016 proxy statement to be filed within 120 days of May 31, 2016.
The Company has adopted a Code of Conduct that applies to all of its directors, officers and employees. The Company has made a copy of this Code of Conduct available on its Website at http://www.neogen.com/Corporate/pdf/CodeOfConduct.pdf.
OFFICERS AND OTHER KEY INDIVIDUALS OF THE REGISTRANT
The officers of Neogen are elected by and serve at the discretion of the Board of Directors. The names and titles of the Company’s officers are set forth below.
| Name | Position with the Company | Year Joined the Company |
||||
| Edward L. Bradley |
Vice President, Food Safety | 1995 | ||||
| Richard E. Calk |
President & Chief Operating Officer | 2014 | ||||
| Joseph A. Corbett |
Vice President, Animal Safety Sales & Operations | 1993 | ||||
| James L. Herbert |
Chairman of the Board & Chief Executive Officer | 1982 | ||||
| Melissa K. Herbert |
Vice President, Support Services | 2005 | ||||
| Kenneth V. Kodilla |
Vice President, Manufacturing | 2003 | ||||
| Jason W. Lilly, Ph.D., MBA |
Vice President, Corporate Development | 2005 | ||||
| Terri A. Morrical |
Vice President, Animal Safety | 1992 | ||||
| Mark A. Mozola, Ph.D. |
Vice President, Research & Development | 2001 | ||||
| Steven J. Quinlan |
Vice President & Chief Financial Officer | 2011 | ||||
| Jennifer A. Rice, D.V.M, Ph.D. |
Vice President & Senior Research Director | 2008 | ||||
| Dwight E. Schroedter |
Vice President, Animal Safety Manufacturing | 1995 | ||||
Melissa K. Herbert, Vice President, Support Services, is the daughter of James L. Herbert, Chairman of the Board & Chief Executive Officer.
Information concerning the executive officers of Neogen follows:
Edward L. Bradley, age 56, joined the Company in February 1995 as part of its acquisition of AMPCOR Diagnostics, Inc, where he served as Vice President of Sales and Marketing. In June 1996, he was named a Vice President of Neogen. In June 2006, Mr. Bradley was named Vice President, Food Safety. From 1988 to 1995, Mr. Bradley served in several sales and marketing capacities for Mallinckrodt Animal Health, including the position of National Sales Manager in its Food Animal Products Division. Prior to joining Mallinckrodt, he held several sales and marketing positions for Stauffer Chemical Company.
Richard E. Calk Jr., age 53, joined the Company as President and Chief Operating Officer in December 2014. He joined the Company after gaining extensive experience in a variety of senior leadership positions, including for food ingredient companies CP Kelco, Roquette America, and DSM Food Specialties. Mr. Calk has specialized in leading the resurgence of various companies’ brands by helping to modify simple food commodities to become value-added specialty ingredients to be used in foods and other products, and then expanding the global reach of those value-added ingredients. His experience includes establishing new operations throughout Asia, Europe, North and South America.
Joseph A. Corbett, age 47, joined Neogen in December 1993 as a sales representative in the Animal Safety operation based in Lexington, Kentucky. Prior to Neogen, he worked for the Marriott Corporation in sales and operations. He has served in various sales, marketing and operational roles in the Neogen Animal Safety group. Most recently, Mr. Corbett was Senior Director of Sales & Operations, Animal Safety and was responsible for all Animal Safety revenues excluding GeneSeek and Life Sciences. He was named Vice President, Animal Safety Sales and Operations in October 2014.
33
Table of Contents
James L. Herbert, age 76, has been Chief Executive Officer and a director of the Company since he joined Neogen in June 1982. He served as President from June 1982 through June 2006. From 1999 to 2001 he was Chairman of the Company’s Board; and was again named Chairman in June 2006. Mr. Herbert previously held the position of Corporate Vice President of DeKalb Ag Research, a major agricultural genetics and energy company. He has management experience in animal biologics, specialized chemical research, medical instruments, aquaculture, animal nutrition, and poultry and livestock breeding and production.
Melissa K. Herbert, age 52, joined the Company in August 2005 as a sales representative in the Company’s Food Safety Division in Lansing, Michigan. In 2011, Ms. Herbert was named Manager of Industry Affairs, with oversight of regulatory issues for both the Food and Animal Safety divisions, and in June 2013, Director of Industry Affairs. She was named Vice President, Support Services, in October 2015. Support Services is focused on reinforcement of efforts of Neogen’s Food and Animal Safety Commercial Teams, specifically in the areas of Technical Service, Regulatory Affairs and Industry Affairs.
Kenneth V. Kodilla, age 59, joined Neogen in November 2003 as Vice President of Manufacturing. He has responsibility for all manufacturing, inventory management, shipping and quality system operations for the Company’s Food Safety Division in Lansing, Michigan. Prior to joining Neogen, Mr. Kodilla served as plant manager for Facet Technologies in Atlanta, Georgia from 2001, as Manufacturing Manager for Becton Dickinson and Difco Laboratories from 1988, and as Quality Manager for Lee Laboratories from 1984. Mr. Kodilla’s manufacturing and regulatory experience includes FDA/ISO regulated Class and diagnostic reagents and devices, high volume automated assembly and packaging, materials management and plant operations.
Dr. Jason W. Lilly, age 42, joined the Company in June 2005 as Market Development Manager for Food Safety. In June 2009, he began to work in the Corporate Development group. He was named Vice President of Corporate Development in December 2011. Prior to joining Neogen, he served in various technical sales and marketing roles at Invitrogen Corporation. Dr. Lilly’s technical knowledge and business acumen provides the Company with a strong combination of merger and acquisition skills.
Terri A. Morrical, age 51, joined Neogen on September 1, 1992 as part of the Company’s acquisition of WTT, Incorporated. She has directed most aspects of the Company’s Animal Safety operations since she joined Neogen and currently serves as Vice President in charge of all of the Company’s Animal Safety operations excluding GeneSeek. From 1986 to 1991, Ms. Morrical was Controller for Freeze Point Cold Storage Systems and concurrently served in the same capacity for Powercore, Inc. In 1990, she joined WTT, Incorporated as VP/CFO and then became President, the position she held at the time Neogen acquired the business.
Dr. Mark A. Mozola, age 60, became Neogen’s Vice President of Research and Development in 2001 following the Company’s acquisition of Gene-Trak Systems. He served in various technical and managerial positions at Gene-Trak Systems for 16 years, most recently as General Manager. He has also served as a Laboratory Director for Silliker Laboratories. Dr. Mozola’s particular technical expertise is in the area of development of modern, rapid methods for the detection of foodborne pathogens. Dr. Mozola retired on October 30, 2015.
Steven J. Quinlan, age 53, joined Neogen in January 2011 as Vice President and Chief Financial Officer. Mr. Quinlan came to the Company following 19 years at Detrex Corporation (1992-2010), the last eight years serving as Vice President-Finance, CFO and Treasurer. He was Corporate Controller at Detrex from 1998-2001, and was Divisional Controller for a number of Detrex operating businesses from 1992-1997. Prior to joining Detrex, Mr. Quinlan was employed by Ford Motor Company from 1989 through 1991 as a Cost Analyst. He was on the audit staff at the public accounting firm Price Waterhouse (now PriceWaterhouseCoopers) from 1985-1989.
Dr. Jennifer A. Rice, age 55, joined the Company in February 2009 as Senior Scientific Officer. In October 2010, she was named Vice President and Senior Research Director and has responsibility to manage and lead Neogen’s research and development team. Prior to joining Neogen, Dr. Rice served as Animal Health Global Product Development Leader at Dow AgroSciences. From 1996 to 2004, she held Research Director Positions at Biocor Animal Health (2001-2004) and Merial Animal Health (1996-2001). Dr. Rice’s strong background in leading large global research and development teams brings a key management skill to Neogen.
Dwight E. Schroedter, age 59, joined Neogen in January 1995 as the Research and Development Manager of the Animal Safety Division based in Lexington, Kentucky. He has served in a variety of technical, operational and sales roles as part of the Animal Safety Division and was named Vice President, Animal Safety Manufacturing in October 2014. Prior to joining Neogen, Mr. Schroedter managed the antibody development laboratory for the Ames Division of Miles, Incorporated.
| ITEM 11. | EXECUTIVE COMPENSATION |
The information required by this Item is incorporated by reference to Neogen’s Proxy Statement to be filed within 120 days of May 31, 2016.
| ITEM 12. | SECURITY OWNERSHIP OF CERTAIN BENEFICIAL OWNERS, MANAGEMENT AND RELATED STOCKHOLDER MATTERS |
The information required by this Item is incorporated by reference to Neogen’s Proxy Statement to be filed within 120 days of May 31, 2016.
34
Table of Contents
| ITEM 13. | CERTAIN RELATIONSHIPS AND RELATED TRANSACTIONS, AND DIRECTOR INDEPENDENCE |
The information required by this Item is incorporated by reference to Neogen’s Proxy Statement to be filed within 120 days of May 31, 2016.
| ITEM 14. | PRINCIPAL ACCOUNTANT FEES AND SERVICES |
The information required by this item is incorporated by reference to Neogen’s Proxy Statement to be filed within 120 days of May 31, 2016.
35
Table of Contents
| ITEM 15. | EXHIBITS, FINANCIAL STATEMENT SCHEDULES |
(a) (1) and (2) and (c). The response to this portion of ITEM 15 is submitted as a separate section of this report.
(a) (3). The Exhibits listed on the accompanying Exhibits Index on page 37, is incorporated herein by reference.
36
Table of Contents
Neogen Corporation
Annual Report on Form 10-K
Year Ended May 31, 2016
EXHIBIT INDEX
| EXHIBIT NO. |
DESCRIPTION | |
| 3.1 | Articles of Incorporation, as restated (incorporated by reference to Exhibit 3(i) to the Registrant’s Quarterly Report on Form 10-Q dated November 30, 2011). | |
| 3.2 | By-Laws, as amended (incorporated by reference to Exhibit 3.2 to the Registrant’s Quarterly Report on Form 10-Q dated February 29, 2000). | |
| 10.1 | Neogen Corporation 1997 Stock Option Plan, as amended (incorporated by reference to Exhibit 4.3 to the Registrant’s Registration Statement on Form S-8 (No. 333-122110) filed January 18, 2005). | |
| 10.2 | Neogen Corporation 2007 Stock Option Plan as amended and restated (incorporated by reference to Exhibit A to the Registrant’s 2011 Proxy Statement August 31, 2011 filed September 1, 2011). | |
| 10.3 | Neogen Corporation 2015 Omnibus Incentive Plan (incorporated by reference to Appendix A to the Registrant’s 2015 Proxy Statement dated and filed August 29, 2015) | |
| 10.4 | Line of Credit Note (Facility A) dated May 30, 2014 between Registrant and JPMorgan Chase N.A. (incorporated by reference to exhibit 10.3 to the registrant’s form 10-K filed in July 2014). | |
| 10.5 | Fourth Amendment to Credit Agreement dated May 30, 2014 between Registrant and JPMorgan Chase N.A.. (incorporated by reference to exhibit 10.3 to the registrant’s form 10-K filed in July 2014). | |
| 21.0 | Listing of Subsidiaries | |
| 23.1 | Consent of Independent Registered Public Accounting Firm BDO USA, LLP. | |
| 24.1 | Power of Attorney | |
| 31.1 | Section 302 Certification of Principal Executive Officer. | |
| 31.2 | Section 302 Certification of Principal Financial Officer. | |
| 32 | Certification Pursuant to 18 U.S.C Section 1350, as Adopted Pursuant to Section 906 of the Sarbanes-Oxley Act of 2002 | |
| 101.INS | XBRL Instance Document | |
| 101.SCH | XBRL Taxonomy Extension Schema Document | |
| 101.CAL | XBRL Taxonomy Extension Calculation Linkbase Document | |
| 101.DEF | XBRL Taxonomy Extension Definition Document | |
| 101.LAB | XBRL Taxonomy Extension Label Linkbase Document | |
| 101.PRE | XBRL Taxonomy Extension Presentation Linkbase Document | |
37
Table of Contents
Pursuant to the requirements of Section 13 or 15(d) of the Securities Exchange Act of 1934, the Registrant has duly caused this Report to be signed on its behalf by the undersigned, thereunto duly authorized.
| NEOGEN CORPORATION | ||||
| /s/ James L. Herbert | /s/ Steven J. Quinlan | |||
| James L. Herbert, Chairman & |
Steven J. Quinlan, Vice President & | |||
| Chief Executive Officer |
Chief Financial Officer | |||
| (Principal Executive Officer) |
(Principal Accounting Officer) | |||
Dated: July 29, 2016
Pursuant to the requirements of the Securities Exchange Act of 1934, this Report has been signed below by the following persons on behalf of the Registrant and in the capacities and on the dates indicated.
| Signature |
Title |
Date | ||||
| /s/ James L. Herbert James L. Herbert |
Chairman of the Board of Directors & Chief Executive Officer (Principal Executive Officer) | July 29, 2016 | ||||
| /s/ Richard E. Calk Richard E. Calk |
President & Chief Operating Officer | July 29, 2016 | ||||
| /s/ Steven J. Quinlan Steven J. Quinlan |
Vice President & Chief Financial Officer (Principal Accounting Officer) | July 29, 2016 | ||||
| * William T. Boehm |
Director | |||||
| * A. Charles Fischer |
Director | |||||
| * Ronald D. Green |
Director | |||||
| * G. Bruce Papesh |
Director | |||||
| * Jack C. Parnell |
Director | |||||
| * Thomas H. Reed |
Director | |||||
| * |
||||||
| Clayton K. Yeutter |
Director | |||||
| *By: | /s/ James L. Herbert | |||||||
| James L. Herbert, Attorney-in-fact | July 29, 2016 | |||||||
38
Table of Contents
ANNUAL REPORT ON FORM 10-K
ITEM 15 (a)(1)(2) (3), (b) and (c)
LIST OF FINANCIAL STATEMENTS, EXHIBITS AND FINANCIAL STATEMENT SCHEDULES
YEAR ENDED MAY 31, 2016
NEOGEN CORPORATION
LANSING, MICHIGAN
FORM 10-K—ITEM 15(a)(1) AND (2) AND 15(c)
LIST OF FINANCIAL STATEMENTS AND FINANCIAL STATEMENT SCHEDULES
The following consolidated financial statements of Neogen Corporation and subsidiaries are included below and incorporated in ITEM 8:
| Report of Independent Registered Public Accounting Firm |
||||
| Consolidated Balance Sheets—May 31, 2016 and 2015 |
||||
| Consolidated Statements of Income—Years ended May 31, 2016, 2015 and 2014 |
||||
| Consolidated Statements of Comprehensive Income—Years ended May 31, 2016, 2015 and 2014 |
||||
| Consolidated Statements of Equity— Years ended May 31, 2016, 2015 and 2014 |
||||
| Consolidated Statements of Cash Flows— Years ended May 31, 2016, 2015 and 2014 |
||||
| Notes to Consolidated Financial Statements |
||||
Schedules for which provision is made in the applicable accounting regulation of the United States Securities and Exchange Commission are not required under the related instructions or are inapplicable and, therefore, have been omitted.
FORM 10-K – ITEM 15 (a) (3) AND (b)
A list of Exhibits required to be filed as a part of this report is set forth in the Exhibit Index, which immediately follows the signature page, and is incorporated herein by reference.
F-1
Table of Contents
Report of Independent Registered Public Accounting Firm
Board of Directors and Stockholders
Neogen Corporation and Subsidiaries
Lansing, Michigan
We have audited the accompanying consolidated balance sheets of Neogen Corporation and Subsidiaries (the Company) as of May 31, 2016 and 2015, and the related consolidated statements of income, comprehensive income, equity, and cash flows for each of the three years in the period ended May 31, 2016. These financial statements are the responsibility of the Company’s management. Our responsibility is to express an opinion on these financial statements based on our audits.
We conducted our audits in accordance with the standards of the Public Company Accounting Oversight Board (United States). Those standards require that we plan and perform the audit to obtain reasonable assurance about whether the financial statements are free of material misstatement. An audit includes examining, on a test basis, evidence supporting the amounts and disclosures in the financial statements, assessing the accounting principles used and significant estimates made by management, as well as evaluating the overall presentation of the financial statements. We believe that our audits provide a reasonable basis for our opinion.
In our opinion, the consolidated financial statements referred to above present fairly, in all material respects, the financial position of Neogen Corporation and Subsidiaries at May 31, 2016 and 2015, and the results of its operations and its cash flows for each of the three years in the period ended May 31, 2016, in conformity with accounting principles generally accepted in the United States of America.
We also have audited, in accordance with the standards of the Public Company Accounting Oversight Board (United States), Neogen Corporation and Subsidiaries’ internal control over financial reporting as of May 31, 2016, based on criteria established in Internal Control – Integrated Framework (2013) issued by the Committee of Sponsoring Organizations of the Treadway Commission (COSO) and our report dated July 29, 2016 expressed an unqualified opinion thereon.
/s/ BDO USA, LLP
Grand Rapids, Michigan
July 29, 2016
F-2
Table of Contents
Neogen Corporation and Subsidiaries
Consolidated Balance Sheets – Assets
(in thousands)
| May 31 | ||||||||
| 2016 | 2015 | |||||||
| Assets |
||||||||
| Current Assets |
||||||||
| Cash and cash equivalents |
$ | 55,257 | $ | 66,061 | ||||
| Marketable securities |
52,539 | 48,103 | ||||||
| Accounts receivable, less allowance of $1,500 and $1,300 at May 31, 2016 and 2015 |
67,652 | 59,208 | ||||||
| Inventories |
64,371 | 51,601 | ||||||
| Deferred income taxes |
1,775 | 1,991 | ||||||
| Prepaid expenses and other current assets |
8,407 | 4,231 | ||||||
|
|
|
|
|
|||||
| Total Current Assets |
250,001 | 231,195 | ||||||
| Property and Equipment |
||||||||
| Land and improvements |
2,659 | 2,296 | ||||||
| Buildings and improvements |
33,417 | 26,925 | ||||||
| Machinery and equipment |
56,470 | 46,794 | ||||||
| Furniture and fixtures |
3,068 | 2,691 | ||||||
| Construction in progress |
1,057 | 783 | ||||||
|
|
|
|
|
|||||
| 96,671 | 79,489 | |||||||
| Less accumulated depreciation |
41,988 | 35,016 | ||||||
|
|
|
|
|
|||||
| Net Property and Equipment |
54,683 | 44,473 | ||||||
| Other Assets |
||||||||
| Goodwill |
88,506 | 70,119 | ||||||
| Other non-amortizable intangible assets |
9,170 | 9,020 | ||||||
| Amortizable customer-based intangible assets, net of accumulated amortization of $17,277 and $14,446 at May 31, 2016 and 2015 |
30,909 | 24,170 | ||||||
| Other non-current intangible assets, net of accumulated amortization of $7,530 and $6,077 at May 31, 2016 and 2015 |
18,446 | 13,204 | ||||||
|
|
|
|
|
|||||
| Total Other Assets |
147,031 | 116,513 | ||||||
|
|
|
|
|
|||||
| $ | 451,715 | $ | 392,181 | |||||
|
|
|
|
|
|||||
See accompanying notes to consolidated financial statements.
F-3
Table of Contents
Neogen Corporation and Subsidiaries
Consolidated Balance Sheets – Liabilities and Equity
(in thousands, except share and per share)
| May 31 | ||||||||
| 2016 | 2015 | |||||||
| Liabilities and Equity |
||||||||
| Current Liabilities |
||||||||
| Accounts payable |
$ | 15,800 | $ | 13,691 | ||||
| Accruals |
||||||||
| Compensation and benefits |
4,986 | 4,142 | ||||||
| Federal income taxes |
0 | 1,275 | ||||||
| Other |
7,812 | 6,348 | ||||||
|
|
|
|
|
|||||
| Total Current Liabilities |
28,598 | 25,456 | ||||||
| Deferred Income Taxes |
16,533 | 13,711 | ||||||
| Other Long-Term Liabilities |
2,423 | 2,051 | ||||||
|
|
|
|
|
|||||
| Total Liabilities |
47,554 | 41,218 | ||||||
| Commitments and Contingencies (note 7) |
||||||||
| Equity |
||||||||
| Preferred stock, $1.00 par value - shares authorized 100,000; none issued and outstanding |
0 | 0 | ||||||
| Common stock, $0.16 par value - shares authorized 60,000,000; 37,567,689 and 37,128,269 shares issued and outstanding at May 31, 2016 and 2015 |
6,011 | 5,941 | ||||||
| Additional paid-in capital |
150,000 | 131,906 | ||||||
| Accumulated other comprehensive loss |
(3,946 | ) | (2,442 | ) | ||||
| Retained earnings |
252,133 | 215,569 | ||||||
|
|
|
|
|
|||||
| Total Neogen Corporation and Subsidiaries |
||||||||
| Stockholders’ Equity |
404,198 | 350,974 | ||||||
| Non-controlling interest |
(37 | ) | (11 | ) | ||||
|
|
|
|
|
|||||
| Total Equity |
404,161 | 350,963 | ||||||
|
|
|
|
|
|||||
| $ | 451,715 | $ | 392,181 | |||||
|
|
|
|
|
|||||
See accompanying notes to consolidated financial statements.
F-4
Table of Contents
Neogen Corporation and Subsidiaries
Consolidated Statements of Income
(in thousands, except per share)
| Year Ended May 31 | ||||||||||||
| 2016 | 2015 | 2014 | ||||||||||
| Revenues |
||||||||||||
| Product revenues |
$ | 273,570 | $ | 243,909 | $ | 216,148 | ||||||
| Service revenues |
47,705 | 39,165 | 31,257 | |||||||||
|
|
|
|
|
|
|
|||||||
| Total Revenues |
321,275 | 283,074 | 247,405 | |||||||||
|
|
|
|
|
|
|
|||||||
| Cost of Revenues |
||||||||||||
| Cost of product revenues |
137,766 | 120,377 | 106,067 | |||||||||
| Cost of service revenues |
30,445 | 23,012 | 18,740 | |||||||||
|
|
|
|
|
|
|
|||||||
| Total Cost of Revenues |
168,211 | 143,389 | 124,807 | |||||||||
|
|
|
|
|
|
|
|||||||
| Gross Margin |
153,064 | 139,685 | 122,598 | |||||||||
| Operating Expenses |
||||||||||||
| Sales and marketing |
57,599 | 51,757 | 46,432 | |||||||||
| General and administrative |
29,189 | 25,233 | 24,449 | |||||||||
| Research and development |
9,890 | 9,577 | 8,326 | |||||||||
|
|
|
|
|
|
|
|||||||
| 96,678 | 86,567 | 79,207 | ||||||||||
|
|
|
|
|
|
|
|||||||
| Operating Income |
56,386 | 53,118 | 43,391 | |||||||||
| Other Income (Expense) |
||||||||||||
| Interest income |
322 | 228 | 115 | |||||||||
| Royalty income |
217 | 150 | 231 | |||||||||
| Change in purchase consideration |
0 | (297 | ) | 38 | ||||||||
| Other, net |
(1,412 | ) | (1,123 | ) | (744 | ) | ||||||
|
|
|
|
|
|
|
|||||||
| (873 | ) | (1,042 | ) | (360 | ) | |||||||
|
|
|
|
|
|
|
|||||||
| Income Before Income Taxes |
55,513 | 52,076 | 43,031 | |||||||||
| Provision for Income Taxes |
18,975 | 18,500 | 15,000 | |||||||||
|
|
|
|
|
|
|
|||||||
| Net Income |
36,538 | 33,576 | 28,031 | |||||||||
| Net (Income) Loss Attributable to Non-controlling Interest |
26 | (50 | ) | 127 | ||||||||
| Net Income Attributable to Neogen |
$ | 36,564 | $ | 33,526 | $ | 28,158 | ||||||
|
|
|
|
|
|
|
|||||||
| Net Income Attributable to Neogen Per Share |
||||||||||||
| Basic |
$ | 0.98 | $ | 0.91 | $ | 0.77 | ||||||
|
|
|
|
|
|
|
|||||||
| Diluted |
$ | 0.97 | $ | 0.90 | $ | 0.76 | ||||||
|
|
|
|
|
|
|
|||||||
See accompanying notes to consolidated financial statements.
F-5
Table of Contents
Neogen Corporation and Subsidiaries
Consolidated Statements of Comprehensive Income
(in thousands, except per share)
| Year Ended May 31 | ||||||||||||
| 2016 | 2015 | 2014 | ||||||||||
| Net income Other comprehensive income (loss), net of tax: |
$ | 36,538 | $ | 33,576 | $ | 28,031 | ||||||
| currency translation adjustments |
(1,504 | ) | (2,813 | ) | 1,743 | |||||||
|
|
|
|
|
|
|
|||||||
| Comprehensive income |
35,034 | 30,763 | 29,774 | |||||||||
| Comprehensive (income) loss attributable to non-controlling interest |
26 | (50 | ) | 127 | ||||||||
|
|
|
|
|
|
|
|||||||
| Comprehensive income attributable to Neogen Corporation |
$ | 35,060 | $ | 30,713 | $ | 29,901 | ||||||
|
|
|
|
|
|
|
|||||||
See accompanying notes to consolidated financial statements.
F-6
Table of Contents
Neogen Corporation and Subsidiaries
Consolidated Statements of Equity
(in thousands, except shares)
| Common Stock | Additional Paid-in Capital |
Accumulated Other Comprehensive Income (Loss) |
Retained Earnings |
Non-controlling Interest |
Total Equity |
|||||||||||||||||||||||
| Shares | Amount | |||||||||||||||||||||||||||
| Balance, May 31, 2013 |
36,084,021 | 5,773 | 99,935 | (1,372 | ) | 153,885 | 66 | 258,287 | ||||||||||||||||||||
| Exercise of options, share based compensation and $4,757 income tax benefit |
629,826 | 101 | 17,522 | 17,623 | ||||||||||||||||||||||||
| Issuance of shares under employee stock purchase plan |
18,466 | 3 | 613 | 616 | ||||||||||||||||||||||||
| Net income (loss) for 2014 |
28,158 | (127 | ) | 28,031 | ||||||||||||||||||||||||
| Other comprehensive income |
1,743 | 1,743 | ||||||||||||||||||||||||||
|
|
|
|
|
|
|
|
|
|
|
|
|
|
|
|||||||||||||||
| Balance, May 31, 2014 |
36,732,313 | 5,877 | 118,070 | 371 | 182,043 | (61 | ) | 306,300 | ||||||||||||||||||||
| Exercise of options, share based compensation and $2,475 income tax benefit |
376,364 | 61 | 13,115 | 13,176 | ||||||||||||||||||||||||
| Issuance of shares under employee stock purchase plan |
19,592 | 3 | 721 | 724 | ||||||||||||||||||||||||
| Net income (loss) for 2015 |
33,526 | 50 | 33,576 | |||||||||||||||||||||||||
| Other comprehensive loss |
(2,813 | ) | (2,813 | ) | ||||||||||||||||||||||||
|
|
|
|
|
|
|
|
|
|
|
|
|
|
|
|||||||||||||||
| Balance, May 31, 2015 |
37,128,269 | 5,941 | 131,906 | (2,442 | ) | 215,569 | (11 | ) | 350,963 | |||||||||||||||||||
|
|
|
|
|
|
|
|
|
|
|
|
|
|
|
|||||||||||||||
| Exercise of options, share based compensation and $2,945 income tax benefit |
421,143 | 67 | 17,311 | 17,378 | ||||||||||||||||||||||||
| Issuance of shares under employee stock purchase plan |
18,277 | 3 | 783 | 786 | ||||||||||||||||||||||||
| Net income (loss) for 2016 |
36,564 | (26 | ) | 36,538 | ||||||||||||||||||||||||
| Other comprehensive loss |
(1,504 | ) | (1,504 | ) | ||||||||||||||||||||||||
|
|
|
|
|
|
|
|
|
|
|
|
|
|
|
|||||||||||||||
| Balance, May 31, 2016 |
37,567,689 | 6,011 | 150,000 | (3,946 | ) | 252,133 | (37 | ) | 404,161 | |||||||||||||||||||
|
|
|
|
|
|
|
|
|
|
|
|
|
|
|
|||||||||||||||
See accompanying notes to consolidated financial statements.
F-7
Table of Contents
Neogen Corporation and Subsidiaries
Consolidated Statements of Cash Flows
(In thousands)
| Year Ended May 31 | ||||||||||||
| 2016 | 2015 | 2014 | ||||||||||
| Cash Flows From Operating Activities |
||||||||||||
| Net income |
$ | 36,538 | $ | 33,576 | $ | 28,031 | ||||||
| Adjustments to reconcile net income to net cash provided from operating activities: |
||||||||||||
| Depreciation and amortization |
12,540 | 10,649 | 9,180 | |||||||||
| Deferred income taxes |
1,906 | 496 | (542 | ) | ||||||||
| Share based compensation |
5,468 | 4,450 | 3,686 | |||||||||
| Excess income tax benefit from the exercise of stock options |
(2,945 | ) | (2,475 | ) | (4,757 | ) | ||||||
| Changes in operating assets and liabilities, net of business acquisitions: |
||||||||||||
| Accounts receivable |
(6,002 | ) | (7,252 | ) | (10,602 | ) | ||||||
| Inventories |
(9,427 | ) | 319 | (3,529 | ) | |||||||
| Prepaid expenses and other current assets |
(3,836 | ) | 3,264 | (2,654 | ) | |||||||
| Accounts payable |
704 | 412 | 1,970 | |||||||||
| Accruals and other changes |
385 | 353 | 885 | |||||||||
|
|
|
|
|
|
|
|||||||
| Net Cash From Operating Activities |
35,331 | 43,792 | 21,668 | |||||||||
| Cash Flows Used In Investing Activities |
||||||||||||
| Purchases of property, equipment and other non-current intangible assets |
(14,222 | ) | (9,619 | ) | (11,543 | ) | ||||||
| Proceeds from the sale of marketable securities |
147,189 | 93,662 | 91,207 | |||||||||
| Purchases of marketable securities |
(151,625 | ) | (105,944 | ) | (91,691 | ) | ||||||
| Business acquisitions, net of cash acquired |
(42,491 | ) | (6,554 | ) | (39,265 | ) | ||||||
|
|
|
|
|
|
|
|||||||
| Net Cash Used In Investing Activities |
(61,149 | ) | (28,455 | ) | (51,292 | ) | ||||||
| Cash Flows From Financing Activities |
||||||||||||
| Exercise of stock options |
12,363 | 8,558 | 14,851 | |||||||||
| Excess income tax benefit from the exercise of stock options |
2,945 | 2,475 | 4,757 | |||||||||
|
|
|
|
|
|
|
|||||||
| Net Cash From Financing Activities |
15,308 | 11,033 | 19,608 | |||||||||
| Effect of Exchange Rate on Cash |
(294 | ) | (984 | ) | 659 | |||||||
|
|
|
|
|
|
|
|||||||
| Net Increase (Decrease) In Cash and Cash Equivalents |
(10,804 | ) | 25,386 | (9,357 | ) | |||||||
| Cash And Cash Equivalents At Beginning of Year |
66,061 | 40,675 | 50,032 | |||||||||
|
|
|
|
|
|
|
|||||||
| Cash And Cash Equivalents At End of Year |
$ | 55,257 | $ | 66,061 | $ | 40,675 | ||||||
|
|
|
|
|
|
|
|||||||
| Supplementary Cash Flow Information |
||||||||||||
| Income taxes paid, net of refunds |
$ | 13,413 | $ | 10,454 | $ | 9,956 | ||||||
See accompanying notes to consolidated financial statements.
F-8
Table of Contents
Neogen Corporation and Subsidiaries
Notes to Consolidated Financial Statements
| 1. | Summary of Significant Accounting Policies |
Nature of Operations
Neogen Corporation develops, manufactures and markets a diverse line of products and services dedicated to food and animal safety.
Basis of Consolidation
The consolidated financial statements include the accounts of Neogen Corporation and its subsidiaries (collectively, the Company), all of which are wholly owned, with the exception of Neogen Latinoamerica and Neogen do Brasil, which are each 90% owned as of May 31, 2016 and 2015, respectively. The Company made an additional capital contribution on December 31, 2013 which increased its ownership interest in Neogen Latinoamerica from 60% to 90%. Non-controlling interest represents the non-controlling owner’s proportionate share in the equity of these two subsidiaries; the non-controlling owner’s proportionate share in the income or losses of the subsidiaries is subtracted from, or added to, Company net income to calculate the net income attributable to Neogen Corporation.
All intercompany accounts and transactions have been eliminated in consolidation.
Share and per share amounts reflect the October 30, 2013 3-for-2 stock split as if it took place at the beginning of the period presented.
Use of Estimates
The preparation of financial statements in conformity with U.S. generally accepted accounting principles requires management to make estimates and assumptions that affect the amounts reported in the consolidated financial statements and accompanying notes. Actual results could differ from these estimates. Significant estimates impacting the accompanying consolidated financial statements include the allowance for uncollectible accounts receivable, inventory valuation and intangible assets.
Comprehensive Income
Comprehensive income represents net income and any revenues, expenses, gains and losses that, under U.S. generally accepted accounting principles, are excluded from net income and recognized directly as a component of equity. Accumulated other comprehensive income (loss) consists solely of foreign currency translation adjustments.
Accounts Receivable and Concentrations of Credit Risk
Financial instruments which potentially subject the Company to concentrations of credit risk consist principally of accounts receivable. Management attempts to minimize credit risk by reviewing customers’ credit history before extending credit and by monitoring credit exposure on a regular basis. An allowance for doubtful accounts on accounts receivable is established based upon factors surrounding the credit risk of specific customers, historical trends and other information. Collateral or other security is generally not required for accounts receivable. Once a receivable balance has been determined to be uncollectible, that amount is charged against the allowance for doubtful accounts. No customer accounted for more than 10% of accounts receivable at May 31, 2016 or 2015, respectively. The activity in the allowance for doubtful accounts was as follows:
| Year ended May 31 | ||||||||||||
| (in Thousands) | 2016 | 2015 | 2014 | |||||||||
| Beginning Balance |
$ | 1,300 | $ | 1,200 | $ | 900 | ||||||
| Provision |
305 | 337 | 367 | |||||||||
| Recoveries |
90 | 92 | 8 | |||||||||
| Write-offs |
(195 | ) | (329 | ) | (75 | ) | ||||||
|
|
|
|
|
|
|
|||||||
| Ending Balance |
$ | 1,500 | $ | 1,300 | $ | 1,200 | ||||||
|
|
|
|
|
|
|
|||||||
Fair Value of Financial Instruments
The carrying amounts of the Company’s financial instruments other than cash equivalents and marketable securities, which include accounts receivable and accounts payable, approximate fair value based on either their short maturity or current terms for similar instruments.
F-9
Table of Contents
Fair Value Measurements
Fair value measurements are determined based upon the exit price that would be received to sell an asset or paid to transfer a liability in an orderly transaction between market participants exclusive of any transaction costs. The Company utilizes a fair value hierarchy based upon the observability of inputs used in valuation techniques as follows:
| Level 1: |
Observable inputs such as quoted prices in active markets; | |
| Level 2: |
Inputs, other than quoted prices in active markets, that are observable either directly or indirectly; and | |
| Level 3: |
Unobservable inputs in which there is little or no market data, which require the reporting entity to develop its own assumptions. |
Cash and Cash Equivalents
Cash and cash equivalents consist of bank demand accounts, savings deposits, certificates of deposit and commercial paper with original maturities of 90 days or less. Cash and cash equivalents were $55,257,000 and $66,061,000 at May 31, 2016 and 2015, respectively. The carrying value of these assets approximates fair value due to the short maturity of these instruments and meet the Level 1 criteria. Cash held by foreign subsidiaries was $5,320,000 and $13,277,000 at May 31, 2016 and 2015, respectively.
Marketable Securities
The Company has marketable securities held by banks or broker-dealers at May 31, 2016 consisting of short-term domestic certificates of deposit of $25,873,000 and commercial paper rated at least A-2/P-2 with maturities between 91 days and one year of $26,666,000. Outstanding marketable securities at May 31, 2016 were $52,539,000; there were $48,103,000 in marketable securities outstanding at May 31, 2015. These securities are classified as available for sale. The primary objective of the Company’s short-term investment activity is to preserve capital for the purpose of funding operations, capital expenditures and business acquisitions; short-term investments are not entered into for trading or speculative purposes. These securities are recorded at fair value (that approximates cost) based on recent trades or pricing models and therefore meet the Level 2 criteria. Interest income on these investments is recorded within Other Income on the income statement.
Inventories
Inventories are stated at the lower of cost, determined on the first-in, first-out method, or market. The components of inventories were as follows:
| May 31 | ||||||||
| (in thousands) | 2016 | 2015 | ||||||
| Raw materials |
$ | 29,501 | $ | 21,605 | ||||
| Work-in-process |
4,498 | 3,972 | ||||||
| Finished and purchased finished goods |
30,372 | 26,024 | ||||||
|
|
|
|
|
|||||
| $ | 64,371 | $ | 51,601 | |||||
|
|
|
|
|
|||||
The Company’s inventories are analyzed for slow moving, expired and obsolete items no less frequently than quarterly and the valuation allowance is adjusted as required. The valuation allowance for inventory was $1,550,000 at both May 31, 2016 and 2015, respectively.
Property and Equipment
Property and equipment is stated at cost. Expenditures for major improvements are capitalized while repairs and maintenance are charged to expense. Depreciation is provided on the straight-line method over the estimated useful lives of the respective assets, which are generally seven to 39 years for buildings and improvements and three to ten years for furniture, fixtures, machinery and equipment. Depreciation expense was $7,452,000, $6,318,000 and $5,383,000 in fiscal years 2016, 2015 and 2014, respectively.
Goodwill and Other Intangible Assets
Goodwill represents the excess of purchase price over fair value of tangible net assets of acquired businesses after amounts are allocated to other identifiable intangible assets. Other intangible assets include customer relationships, trademarks, licenses, trade names, covenants not-to-compete and patents. Amortizable intangible assets are amortized on either an accelerated or a straight-line basis over 5 to 25 years. The Company reviews the carrying amounts of goodwill and other non-amortizable intangible assets annually, or when indications of impairment exist, to determine if such assets may be impaired. If the Company’s qualitative assessment concludes that it is more likely than not that an impairment exists, or the Company skips the qualitative assessment, then the Company performs a quantitative assessment. If the carrying amounts of these assets are deemed to be less than fair value based upon a discounted cash flow analysis and comparison to comparable earnings multiples of peer companies, such assets are reduced to their estimated fair value and a charge is made to operations. The remaining weighted-average amortization period for customer-based intangibles and other intangibles are both 12 years, respectively, at May 31, 2016 and May 31, 2015.
F-10
Table of Contents
Long-lived Assets
Management reviews the carrying values of its long-lived assets to be held and used, including definite-lived intangible assets, for possible impairment whenever events or changes in business conditions warrant such a review. The carrying value of a long-lived asset is considered impaired when the anticipated separately identifiable undiscounted cash flows over the remaining useful life of the asset are less than the carrying value of the asset. In such an event, fair value is determined using discounted cash flows and if lower than the carrying value, impairment is recognized through a charge to operations.
Reclassifications
Certain amounts in the fiscal 2015 and 2014 financial statements have been reclassified to conform to the fiscal 2016 presentation.
Stock Options
At May 31, 2016, the Company had stock option plans which are described more fully in Note 5.
The weighted-average fair value per share of stock options granted during fiscal years 2016, 2015 and 2014, estimated on the date of grant using the Black-Scholes option pricing model, was $13.11, $11.91 and $9.87, respectively. The fair value of stock options granted was estimated using the following weighted-average assumptions:
| Year ended May 31 | ||||||||||||
| 2016 | 2015 | 2014 | ||||||||||
| Risk-free interest rate |
1.2% | 1.2% | 0.8% | |||||||||
| Expected dividend yield |
0% | 0% | 0% | |||||||||
| Expected stock price volatility |
33.3% | 36.2% | 33.1% | |||||||||
| Expected option life |
4.0 years | 4.0 years | 4.0 years | |||||||||
The risk-free interest rate for periods within the expected life of options granted is based on the United States Treasury yield curve in effect at the time of grant. Expected stock price volatility is based on historical volatility of the Company’s stock. The expected option life, representing the period of time that options granted are expected to be outstanding, is based on historical option exercise and employee termination data. The Company recognizes the fair value of stock options using the accelerated method over their requisite service periods which the Company has determined to be the vesting periods.
Revenue Recognition
Revenue from products and services is recognized when the product has been shipped or the service performed, the sales price is fixed and determinable, and collection of any receivable is probable. To the extent that customer payment has been received before all recognition criteria are met, these revenues are initially deferred and later recognized in the period that all recognition criteria have been met. Customer credits for sales returns, pricing and other disputes, and other related matters (including volume rebates offered to certain distributors as marketing support) represent approximately 3% of reported net revenue in fiscal years 2016, 2015 and 2014.
Shipping and Handling Costs
Shipping and handling costs that are charged to and reimbursed by the customer are recognized as revenues, while the related expenses incurred by the Company are recorded in sales and marketing expense; these expenses totaled $9,734,000, $8,648,000 and $7,497,000 in fiscal years 2016, 2015 and 2014, respectively.
Income Taxes
The Company accounts for income taxes using the asset and liability method. Under this method, deferred income tax assets and liabilities are determined based on differences between the financial reporting and tax bases of assets and liabilities and for tax credit carry forwards and are measured using the enacted tax rates in effect for the years in which the differences are expected to reverse. Deferred income tax expense represents the change in net deferred income tax assets and liabilities during the year.
The Company’s foreign subsidiaries are comprised of Neogen Europe (wholly-owned subsidiary), Lab M Holdings (wholly-owned subsidiary), Neogen Latinoamerica (90% owned subsidiary), Neogen do Brasil (90% owned subsidiary), Neogen Bio-Scientific Technology (Shanghai) Co (wholly-owned subsidiary), Neogen Food and Animal Security (India) (wholly-owned subsidiary), Neogen Canada (wholly-owned subsidiary) and Deoxi Biotecnologia Ltda (wholly-owned subsidiary). Based on historical experience, as well as the Company’s future plans, earnings from these subsidiaries are expected to be re-invested indefinitely for future expansion and working capital needs. Furthermore, the Company’s domestic operations have historically produced sufficient operating cash flow to mitigate the need to remit foreign earnings. On an annual basis, the Company evaluates the current business environment and whether any new events or other external changes might require a re-evaluation of the decision to indefinitely re-invest foreign earnings. At May 31, 2016, unremitted earnings of the foreign subsidiaries were $27,880,000.
F-11
Table of Contents
Research and Development Costs
Research and development costs, which consist primarily of compensation costs, administrative expenses and new product development, among other items, are expensed as incurred.
Advertising Costs
Advertising costs are expensed as incurred and totaled $1,463,000, $1,371,000 and $1,344,000 in fiscal years 2016, 2015 and 2014, respectively.
Net Income Attributable to Neogen per Share
Basic net income per share is based on the weighted average number of common shares outstanding during each year. Diluted earnings per share is based on the weighted average number of common shares and dilutive potential common shares outstanding. The Company’s dilutive potential common shares outstanding during the years result entirely from dilutive stock options. The following table presents the net income per share calculations:
| Year ended May 31 | ||||||||||||
| (in thousands, except per share) | 2016 | 2015 | 2014 | |||||||||
| Numerator for basic and diluted net income per share - Net income attributable to Neogen |
$ | 36,564 | $ | 33,526 | $ | 28,158 | ||||||
|
|
|
|
|
|
|
|||||||
| Denominator for basic net income per share - Weighted average shares |
37,402 | 36,953 | 36,511 | |||||||||
| Effect of dilutive stock options |
473 | 491 | 756 | |||||||||
|
|
|
|
|
|
|
|||||||
| Denominator for diluted net income per share |
37,875 | 37,444 | 37,267 | |||||||||
| Net income attributable to Neogen per share |
||||||||||||
| Basic |
$ | 0.98 | $ | 0.91 | $ | 0.77 | ||||||
| Diluted |
$ | 0.97 | $ | 0.90 | $ | 0.76 | ||||||
At both May 31, 2016 and 2015, the market price of the common stock exceeded the option exercise price for all outstanding options; therefore, no shares were excluded from the diluted net income per share computation. At May 31, 2014, 48,716 shares were excluded from the computation, as the option exercise prices exceeded the average market price of the common shares.
On October 30, 2013, the Company paid a 3-for-2 stock split effected in the form of a dividend of its common stock. All share and per share amounts, with the exception of par value per share, have been adjusted to reflect the stock split as if it had taken place at the beginning of the period presented. The common stock and additional paid-in capital accounts at May 31, 2013 reflect the retroactive capitalization of the 3-for-2 stock split.
New Accounting Pronouncements
In May 2014, the Financial Accounting Standards Board issued a new standard on revenue recognition. The new standard outlines a single comprehensive model for entities to use in accounting for revenue arising from contracts with customers and supersedes most current revenue recognition guidance, including industry-specific guidance. The core principle of the revenue model is that an entity should recognize revenue to depict the transfer of promised goods or services to customers in an amount that reflects the consideration to which the entity expects to be entitled in exchange for those goods or services. The standard is designed to create greater comparability for financial statement users across industries and jurisdictions and also requires enhanced disclosures. The guidance is effective for fiscal years, and interim periods within those years, beginning after December 15, 2017, and the change will be presented retrospectively. Early adoption is not permitted. The Company is currently evaluating the impact of the adoption of this standard on our consolidated financial statements.
In November 2015, the FASB issued ASU 2015-17—Balance Sheet Classification of Deferred Taxes. As part of the FASB’s accounting simplification initiative, ASU 2015-17 removes the requirement to separate deferred income tax liabilities and assets into current and noncurrent amounts in a classified statement of financial position. Instead, the update requires that deferred tax liabilities and assets be classified as non-current in a classified statement of financial position. ASU 2015-17 is effective for entities for fiscal years beginning after December 15, 2016, with retrospective application to all periods presented. The Company is currently evaluating the effects of ASU 2015-17 on our consolidated balance sheet and statements of income.
F-12
Table of Contents
In September 2015, the FASB issued ASU 2015-16—Simplifying the Accounting for Measurement -Period Adjustments. Changes to the accounting for measurement-period adjustments relate to business combinations. Currently, an acquiring entity is required to retrospectively adjust the balance sheet amounts of the acquiree recognized at the acquisition date with a corresponding adjustment to goodwill as a result of changes made to the balance sheet amounts of the acquiree. The measurement period is the period after the acquisition date during which the acquirer may adjust the balance sheet amounts recognized for a business combination (generally up to one year from the date of acquisition). The changes eliminate the requirement to make such retrospective adjustments, and, instead require the acquiring entity to record these adjustments in the reporting period they are determined. The new standard is effective for public companies for periods beginning after December 15, 2015. The Company is currently evaluating the impact of adopting this guidance.
In July 2015, the FASB issued ASU No. 2015-11—Inventory: Simplifying the Measurement of Inventory. The update requires inventory not measured using either the last in, first out (LIFO) or the retail inventory method to be measured at the lower of cost and net realizable value. Net realizable value is the estimated selling prices in the ordinary course of business, less reasonably predictable cost of completion, disposal, and transportation. The update is effective for fiscal years beginning after December 15, 2016. Early adoption is permitted for financial statements that have not been previously issued. The Company is currently evaluating the impact of ASU 2015-11 on our consolidated financial condition and results of operations.
In February 2016, the FASB issued ASU No. 2016-02—Leases, to increase transparency and comparability among organizations by recognizing lease assets and lease liabilities on the balance sheet and disclosing key information about leasing arrangements. A lessee should recognize in the statement of financial position a liability to make lease payments (the lease liability) and a right-of-use asset representing its right to use the underlying asset for the lease term. The recognition, measurement, and presentation of expenses and cash flows arising from a lease by a lessee have not significantly changed from previous U.S. GAAP. This ASU is effective for annual periods, including interim periods within those annual periods, beginning after December 15, 2018. Modified retrospective application is permitted with certain practical expedients. Early adoption is permitted. The Company is currently evaluating the impact of ASU No. 2016-02 on our consolidated financial condition and results of operations.
In March 2016, the FASB issued ASU No. 2016-09, Compensation-Stock Compensation (Topic 718): Improvements to Employee Share-Based Payment Accounting to provide guidance that changes the accounting for certain aspects of share-based payments to employees. The guidance requires the recognition of the income tax effects of awards in the income statement when the awards vest or are settled, thus eliminating additional paid-in capital pools. The guidance also allows for the employer to repurchase more of an employee’s shares for tax withholding purposes without triggering liability accounting. In addition, the guidance allows for a policy election to account for forfeitures as they occur rather than on an estimated basis. This ASU is effective for annual periods, including interim periods within those annual periods, beginning after December 15, 2016 with early adoption permitted. The Company is currently evaluating the impact of ASU No. 2016-09 on our consolidated financial condition and results of operations.
| 2. | Goodwill and Other Intangible Assets |
Management has completed the annual impairment analysis of goodwill and intangible assets with indefinite lives using a quantitative assessment as of the first day of the fourth quarter of fiscal years 2016, 2015 and 2014, respectively, and determined that recorded amounts were not impaired and that no write-down was necessary.
The following table summarizes goodwill by reportable segment:
| (in thousands) | Food Safety | Animal Safety | Total | |||||||||
| Balance, May 31, 2014 |
$ | 16,696 | $ | 51,494 | $ | 68,190 | ||||||
| Goodwill acquired and/or adjusted |
2,110 | (181 | ) | 1,929 | ||||||||
|
|
|
|
|
|
|
|||||||
| Balance, May 31, 2015 |
$ | 18,806 | $ | 51,313 | $ | 70,119 | ||||||
| Goodwill acquired and/or adjusted |
7,322 | 11,065 | 18,387 | |||||||||
|
|
|
|
|
|
|
|||||||
| Balance, May 31, 2016 |
$ | 26,128 | $ | 62,378 | $ | 88,506 | ||||||
|
|
|
|
|
|
|
|||||||
At May 31, 2016, non-amortizable intangible assets included licenses of $569,000, trademarks of $7,377,000 and other intangibles of $1,224,000. At May 31, 2015, non-amortizable intangible assets included licenses of $569,000, trademarks of $7,227,000 and other intangibles of $1,224,000.
F-13
Table of Contents
Amortizable intangible assets consisted of the following and are included in customer-based intangible and other non-current assets within the consolidated balance sheets:
| (in thousands) | Gross Carrying Amount |
Less Accumulated Amortization |
Net Carrying Amount |
|||||||||
| Licenses |
$ | 5,189 | $ | 1,782 | $ | 3,407 | ||||||
| Covenants not to compete |
491 | 193 | 298 | |||||||||
| Patents |
8,040 | 3,631 | 4,409 | |||||||||
| Customer-based intangibles |
48,186 | 17,277 | 30,909 | |||||||||
| Other product and service-related intangibles |
12,256 | 1,924 | 10,332 | |||||||||
|
|
|
|
|
|
|
|||||||
| Balance, May 31, 2016 |
$ | 74,162 | $ | 24,807 | $ | 49,355 | ||||||
|
|
|
|
|
|
|
|||||||
| Licenses |
$ | 4,919 | $ | 1,630 | $ | 3,289 | ||||||
| Covenants not to compete |
428 | 124 | 304 | |||||||||
| Patents |
7,701 | 3,087 | 4,614 | |||||||||
| Customer-based intangibles |
38,616 | 14,446 | 24,170 | |||||||||
| Other product and service-related intangibles |
6,233 | 1,236 | 4,997 | |||||||||
|
|
|
|
|
|
|
|||||||
| Balance, May 31, 2015 |
$ | 57,897 | $ | 20,523 | $ | 37,374 | ||||||
|
|
|
|
|
|
|
|||||||
Amortization expense for intangibles totaled $5,088,000, $4,331,000 and $3,797,000 in fiscal years 2016, 2015, and 2014, respectively. The estimated amortization expense for each of the five succeeding fiscal years is as follows: $5,759,000 in 2017, $5,405,000 in 2018, $5,012,000 in 2019, $4,706,000 in 2020 and $4,459,000 in 2021. The amortizable intangible assets useful lives are 5 to 20 years for licenses, 5 to 13 years for covenants not to compete, 5 to 25 years for patents, 6 to 20 years for customer-based intangibles and 5 to 20 years for other product and service-related intangibles, which primarily consist of product formulations. All definite-lived intangibles are amortized on a straight line basis with the exception of definite-lived customer-based intangibles and product and service-related intangibles, which are amortized on an accelerated basis.
| 3. | Business Combinations |
The Consolidated Statements of Income reflect the results of operations for business acquisitions since the respective dates of purchase. All are accounted for using the acquisition method. Goodwill recognized in the acquisitions described below relates primarily to enhancing the Company’s strategic platform for the expansion of available product offerings.
On July 1, 2013, the Company acquired the assets of SyrVet Inc., a veterinary business based in Waukee, Iowa. SyrVet offered a product line similar to Neogen’s Ideal Instruments line of veterinary instruments with a strong presence in Mexico and Latin America. Consideration for the purchase was $10,012,000 in cash and up to $1,500,000 of a contingent consideration liability, due at the end of the first year, based on an excess net sales formula. The Company estimated the contingent consideration liability to be $930,000, based on forecasted sales. The final purchase price allocation, based upon the fair value of these assets and liabilities determined using the income approach, included accounts receivable of $747,000, inventory of $2,195,000, property and equipment of $556,000, current liabilities of $226,000, contingent consideration liabilities of $930,000, non-amortizable trademarks of $790,000, intangible assets of $4,810,000 (with an estimated life of 15 years) and the remainder to goodwill (deductible for tax purposes). These values are Level 3 fair value measurements. This business has been relocated to Lexington, Kentucky and integrated with the Company’s current operations there, reporting within the Animal Safety segment. In August 2014, the Company paid $689,000 to the former owner for contingent consideration based upon the level of achievement of sales targets; the remaining $241,000 of the accrual was reversed to other income.
On November 1, 2013, the Company acquired the assets of Prima Tech Incorporated, a veterinary instrument company based in Kenansville, North Carolina. Prima Tech manufactures devices used by farmers, ranchers and veterinarians to inject animals, provide topical applications, and to use for oral administration. Prima Tech is also a supplier of products used in artificial insemination in the swine industry. Consideration for the purchase was $12,068,000 in cash and up to $600,000 of contingent consideration, due at the end of the first year, based on an excess net sales formula. The Company estimated the contingent consideration liability to be $146,000 based on forecasted sales. The final purchase price allocation, based upon the fair value of these assets and liabilities determined using the income approach, included accounts receivable of $963,000, inventory of $2,796,000, property and equipment of $1,653,000, prepaid assets of $8,000, current liabilities of $1,840,000, contingent consideration liabilities of $146,000, non-amortizable trademarks of $1,500,000, intangible assets of $4,400,000 (with an estimated life of 5-15 years) and the remainder to goodwill (deductible for tax purposes). These values are Level 3 fair value measurements. This business continues to operate in its current location and reports within the Animal Safety segment. In October 2014, the Company paid the former owners $600,000 for contingent consideration based on achievement of defined sales targets, recording an additional $454,000 charge to other expense.
F-14
Table of Contents
On January 2, 2014, the Company acquired all of the stock of Chem-Tech Ltd., a pest control manufacturing and distribution business located in Pleasantville, Iowa. Consideration for the purchase was $17,185,000 in cash and up to $1,000,000 of a contingent consideration liability, due at the end of the first year, based on an excess net sales formula. The Company estimated the contingent consideration liability to be $390,000, based on forecasted sales. The final purchase price allocation based upon the fair value of these assets and liabilities determined using the income approach, included accounts receivable of $380,000, inventory of $4,184,000, prepaid assets of $100,000, property and equipment of $807,000, current liabilities of $184,000, contingent consideration liabilities of $390,000, intangible assets of $8,327,000 (with an estimated life of 5-25 years) and the remainder to goodwill (deductible for tax purposes). These values are Level 3 fair value measurements. This business continues to operate in its current location and reports within the Animal Safety segment. In February 2015, the Company paid the former owners $474,000 for contingent consideration, based upon achievement of sales targets, and recorded an additional $84,000 charge to other expense.
On October 1, 2014, the Company acquired all of the stock of BioLumix, Inc., a manufacturer and marketer of automated systems for the detection of microbial contaminants located in Ann Arbor, Michigan. Consideration for the purchase was $4,514,000 in cash. The final purchase price allocation, based upon the fair value of these assets and liabilities determined using the income approach, included accounts receivable of $499,000, other receivable of $178,000, net inventory of $421,000 prepaid assets of $48,000, property and equipment of $159,000, current liabilities of $155,000, long-term liabilities of $780,000, intangible assets of $2,090,000 (with an estimated life of 5-15 years) and the remainder to goodwill (non-deductible for tax purposes). These values are Level 3 fair value measurements. This business has been relocated to Lansing, Michigan and integrated with the Company’s operations there, reporting within the Food Safety segment.
On December 8, 2014, the Company acquired the food safety and veterinary genomic assets of its Chinese distributor Beijing Anapure BioScientific Co., Ltd. Consideration for the purchase was $2,040,000 in cash. The final purchase price allocation, based upon the fair value of these assets and liabilities determined using the income approach, included inventory of $525,000, property and equipment of $64,000, intangible assets of $422,000 (with an estimated life of 5-15 years) and the remainder to goodwill (deductible for tax purposes). These values are Level 3 fair value measurements. This business has been integrated into the Company’s subsidiary in China and reports within the Food Safety segment.
On June 1, 2015, the Company acquired the assets of Sterling Test House, a commercial food testing laboratory based in India. Consideration for the purchase was $1,118,000 in cash and approximately $150,000 of a contingent consideration liability, due in installments on the first two anniversary dates, based on an excess sales formula. The final purchase price allocation, based upon the fair value of these assets and liabilities determined using the income approach, included accounts receivable of $43,000, inventory of $14,000, property and equipment of $141,000, contingent consideration of $97,000, intangible assets of $345,000 and the remainder to goodwill (deductible for tax purposes). These values are Level 3 fair value measurements. This business continues to operate in its current location and reports within the Animal Safety segment.
On August 26, 2015, the Company acquired all of the stock of Lab M Holdings, a developer, manufacturer and supplier of microbiological culture media and diagnostic systems located in the United Kingdom. Consideration for the purchase was $12,436,000 in cash. The preliminary purchase price allocation included cash of $285,000, accounts receivable of $975,000, inventory of $1,169,000, property and equipment of $3,337,000, other current assets of $596,000, current liabilities of $1,350,000, long-term deferred tax liability of $784,000, intangible assets of $3,918,000 (with an estimated life of 3-15 years) and the remainder to goodwill (non-deductible for tax purposes). These values are Level 3 fair value measurements. This business continues to operate in its current location and reports within the Food Safety segment.
On December 22, 2015, the Company acquired the rodenticide assets of Virbac Corporation, the North American affiliate of the France-based Virbac group, a global animal health company. The acquired assets include a rodenticide active ingredient that complements Neogen’s existing active ingredients, and more than 40 regulatory approvals for a variety of formulations in the United States, Canada and Mexico. The acquired assets also include a large retail and OEM customer base. Consideration for the purchase was $3,525,000 in cash and up to $300,000 of contingent consideration. The preliminary purchase price allocation included inventory of $317,000, property and equipment of $60,000, intangible assets of $2,545,000 (with an estimated life of 5-15 years) and the remainder to goodwill (deductible for tax purposes). These values are Level 3 fair value measurements. The products will be manufactured at the Company’s production facility in Randolph, Wisconsin and will report through Animal Safety.
On April 26, 2016, the Company acquired the stock of Deoxi Biotecnologia Ltda, an animal genomics laboratory located in Aracatuba, Brazil. Deoxi was a competitor of Neogen’s in the livestock genomics market and this acquisition is intended to help accelerate the growth of Neogen’s GeneSeek animal genomics services in Brazil. Consideration for the purchase was $1,560,000 in cash and up to $2,552,000 of contingent consideration, due at the end of the each of the first two years, based on an excess net sales formula. The preliminary purchase price allocation included accounts receivable of $150,000, inventory of $89,000, other current
F-15
Table of Contents
assets of $6,000, property and equipment of $229,000, current liabilities of $246,000, contingent consideration liabilities of $741,000, intangible assets of $852,000 (with an estimated life of 5-15 years) and the remainder to goodwill (deductible for tax purposes). These values are Level 3 fair value measurements. This business will continue to operate in its current location and reports within the Food Safety segment.
On May 1, 2016, the Company acquired the stock of Preserve International and its sister company, Tetradyne LLC., manufacturers and marketers of cleaners, disinfectants and associated products to the swine, poultry, food processing and dairy markets. Preserve and Tetradyne have manufacturing locations in Memphis, Tennessee and Turlock, California. Consideration for the purchase was $24,086,000 in cash. The preliminary purchase price allocation included accounts receivable of $1,588,000, inventory of $1,964,000, other current assets of $338,000, land, property and equipment of $1,625,000, current liabilities of $756,000, long-term liabilities of $660,000, intangible assets of $10,590,000 (with an estimated life of 5-15 years) and the remainder to goodwill (partially deductible for tax purposes). These values are Level 3 fair value measurements. This business continues to operate in its current locations and reports within the Animal Safety segment.
| 4. | Long-Term Debt |
The Company has a financing agreement with a bank providing for an unsecured revolving line of credit of up to $12,000,000, which expires on September 1, 2017. There were no advances against this line of credit during fiscal years 2016, 2015 and 2014, and no balance outstanding at May 31, 2016 and 2015. Interest is at LIBOR plus 100 basis points (rate under the terms of the agreement was 1.58% at May 31, 2016). Financial covenants include maintaining specified levels of tangible net worth, debt service coverage and funded debt to EBITDA, each of which the Company was in compliance with at May 31, 2016 and May 31, 2015.
F-16
Table of Contents
| 5. | Equity Compensation Plans |
Qualified and non-qualified options to purchase shares of common stock may be granted to directors, officers and employees of the Company under the terms of the Company’s stock option plans. These options are granted at an exercise price of not less than the fair market value of the stock on the date of grant. Remaining shares available for grant under stock option plans were 2,457,000, 306,000 and 805,000 at May 31, 2016, 2015 and 2014, respectively. Options vest ratably over three and five year periods and the contractual terms are generally five or ten years.
| (shares in thousands) | Shares | Weighted-Average Exercise Price |
Weighted-Average Grant Date Fair Value |
|||||||||
| Outstanding at May 31, 2013 (749 exercisable) |
2,092 | 19.21 | 6.00 | |||||||||
| Granted |
512 | 36.44 | 9.87 | |||||||||
| Exercised |
(643 | ) | 13.69 | 4.28 | ||||||||
| Forfeited |
(92 | ) | 22.08 | 6.65 | ||||||||
|
|
|
|||||||||||
| Outstanding at May 31, 2014 (577 exercisable) |
1,869 | 25.69 | 7.62 | |||||||||
| Granted |
536 | 39.79 | 11.91 | |||||||||
| Exercised |
(380 | ) | 16.69 | 5.17 | ||||||||
| Forfeited |
(37 | ) | 33.55 | 9.45 | ||||||||
|
|
|
|||||||||||
| Outstanding at May 31, 2015 (639 exercisable) |
1,988 | 31.04 | 9.20 | |||||||||
| Granted |
549 | 46.98 | 13.11 | |||||||||
| Exercised |
(427 | ) | 23.47 | 7.15 | ||||||||
| Forfeited |
(29 | ) | 38.57 | 11.14 | ||||||||
|
|
|
|||||||||||
| Outstanding at May 31, 2016 (656 exercisable) |
2,081 | 36.71 | 10.63 | |||||||||
|
|
|
|||||||||||
The following is a summary of stock options outstanding at May 31, 2016:
| (options in thousands) | ||||||||||||||||||||
| Options Outstanding | Options Exercisable | |||||||||||||||||||
| Range of Exercise price |
Number | Average Remaining Contractual Life (in years) |
Weighted-Average Exercise Price |
Number | Weighted Average Exercise Price |
|||||||||||||||
| $ 6.01 - $28.26 |
277 | 1.8 | $ | 20.67 | 209 | $ | 19.88 | |||||||||||||
| 28.27 - 32.37 |
321 | 2.1 | 28.67 | 173 | 28.67 | |||||||||||||||
| 32.38 - 38.03 |
408 | 2.6 | 36.07 | 156 | 36.07 | |||||||||||||||
| 38.04 - 43.75 |
532 | 4.1 | 39.88 | 118 | 40.10 | |||||||||||||||
| 43.76 - 47.12 |
543 | 4.9 | 46.99 | 0 | — | |||||||||||||||
|
|
|
|
|
|||||||||||||||||
| 2,081 | 3.4 | 36.71 | 656 | 29.69 | ||||||||||||||||
The weighted average exercise price of shares that were exercisable at May 31, 2016 and 2015 was $29.69 and $24.50, respectively.
Compensation expense related to share-based awards was $5,468,000, $4,450,000 and $3,686,000 in fiscal years 2016, 2015 and 2014, respectively. Remaining compensation cost to be expensed in future periods for non-vested options was $7,335,000 at May 31, 2016, with a weighted average expense recognition period of 2.3 years.
The aggregate intrinsic value of options outstanding and options exercisable was $26,344,000 and $12,912,000, respectively, at May 31, 2016, $31,204,000 and $14,201,000 respectively, at May 31, 2015 and $22,751,000 and $10,984,000 respectively, at May 31, 2014. The aggregate intrinsic value of options exercised during the year was $12,980,000 in fiscal 2016, $10,690,000 in fiscal 2015 and $17,669,000 in fiscal 2014.
Common stock totaling 27,440 of the 337,500 originally authorized shares are reserved for issuance under the terms of the 2002 Employee Stock Purchase Plan. An additional 375,000 shares are also reserved for issuance under the terms of the 2011 Employee Stock Purchase Plan. The plans give eligible employees the option to purchase common stock at a 5% discount to the lower of the market value of the stock at the beginning or end of each participation period. Total individual purchases in any year are limited to 10% of compensation. Shares purchased by employees were 18,277, 19,592 and 18,466 in fiscal years 2016, 2015 and 2014, respectively.
F-17
Table of Contents
| 6. | Income Taxes |
Income before income taxes by source consists of the following amounts:
| Year ended May 31 | ||||||||||||
| (in thousands) | 2016 | 2015 | 2014 | |||||||||
| U.S. |
$ | 50,662 | $ | 45,156 | $ | 37,568 | ||||||
| Foreign |
4,851 | 6,920 | 5,463 | |||||||||
|
|
|
|
|
|
|
|||||||
| $ | 55,513 | $ | 52,076 | $ | 43,031 | |||||||
|
|
|
|
|
|
|
|||||||
The provision for income taxes consisted of the following:
| Year ended May 31 | ||||||||||||
| (in thousands) | 2016 | 2015 | 2014 | |||||||||
| Current: |
||||||||||||
| U.S. Taxes |
$ | 14,630 | $ | 15,269 | $ | 14,442 | ||||||
| Foreign |
1,756 | 1,364 | 1,100 | |||||||||
| Deferred |
2,589 | 1,867 | (542 | ) | ||||||||
|
|
|
|
|
|
|
|||||||
| $ | 18,975 | $ | 18,500 | $ | 15,000 | |||||||
|
|
|
|
|
|
|
|||||||
The reconciliation of income taxes computed at the U.S. federal statutory tax rate to income tax expense is as follows:
| Year ended May 31 | ||||||||||||
| (in thousands) | 2016 | 2015 | 2014 | |||||||||
| Tax at U.S. statutory rates |
$ | 19,429 | $ | 18,227 | $ | 15,061 | ||||||
| Section 199 domestic production deduction |
(1,143 | ) | (1,067 | ) | (821 | ) | ||||||
| Foreign rate differential |
(699 | ) | (949 | ) | (726 | ) | ||||||
| Subpart F income |
1,049 | 1,396 | 1,143 | |||||||||
| Tax credits and other |
337 | 39 | (170 | ) | ||||||||
| Provisions for state income taxes, net of federal benefit |
779 | 854 | 513 | |||||||||
| Amended U.S. Federal tax returns, FY12, FY13 & FY14 |
(777 | ) | 0 | 0 | ||||||||
|
|
|
|
|
|
|
|||||||
| $ | 18,975 | $ | 18,500 | $ | 15,000 | |||||||
|
|
|
|
|
|
|
|||||||
Deferred income taxes reflect the tax effects of temporary differences between the carrying amounts of assets and liabilities for financial reporting purposes and the amounts used for income tax purposes. Significant components of the Company’s deferred income tax liabilities and assets are as follows:
| May 31 | ||||||||
| (in thousands) | 2016 | 2015 | ||||||
| Deferred income tax liabilities |
||||||||
| Indefinite and long-lived assets |
$ | (19,296 | ) | $ | (15,906 | ) | ||
| Prepaid expenses |
(824 | ) | (431 | ) | ||||
| Brazil valuation allowance |
(542 | ) | (542 | ) | ||||
|
|
|
|
|
|||||
| (20,662 | ) | (16,879 | ) | |||||
| Deferred income tax assets |
||||||||
| Stock options |
2,786 | 2,234 | ||||||
| Inventories and accounts receivable |
2,076 | 1,809 | ||||||
| Tax loss carryforwards |
813 | 542 | ||||||
| Accrued expenses and other |
229 | 574 | ||||||
|
|
|
|
|
|||||
| 5,904 | 5,159 | |||||||
|
|
|
|
|
|||||
| Net deferred income tax liabilities |
$ | (14,758 | ) | $ | (11,720 | ) | ||
|
|
|
|
|
|||||
The Company had no accrual for unrecognized tax benefits at both May 31, 2016 and 2015. Should the accrual of any interest or penalties relative to unrecognized tax benefits be necessary, such accruals will be reflected within income tax accounts. The Company is no longer subject to U.S. Federal income tax examinations by tax authorities for fiscal years before 2011.
F-18
Table of Contents
| 7. | Commitments and Contingencies |
The Company is involved in environmental remediation and monitoring activities at its Randolph, Wisconsin manufacturing facility and accrues for related costs when such costs are determined to be probable and estimable. The Company expenses annual costs of remediation which have ranged from $47,000 to $57,000 per year over the past five years. The Company’s estimated liability for these costs is $916,000 at May 31, 2016 and 2015, measured on an undiscounted basis over an estimated period of 15 years; $60,000 of the liability is recorded within current liabilities and the remainder is recorded within other long term liabilities in the consolidated balance sheet.
The Company has agreements with unrelated third parties that provide for the payment of license fees and royalties on the sale of certain products. Royalty expense under the terms of these agreements was $1,969,000, $2,189,000 and $2,278,000 for fiscal years 2016, 2015 and 2014, respectively. Some of these agreements provide for guaranteed minimum royalty payments to be paid each fiscal year by the Company for certain technologies. Future minimum royalty payments are as follows: 2017—$572,000, 2018—$597,000, 2019—$597,000, 2020—$593,000 and 2021—$586,000.
The Company leases office and manufacturing facilities under non-cancelable operating leases. Rent expense for fiscal years 2016, 2015 and 2014 was $662,000, $736,000 and $856,000, respectively. Future fiscal year minimum rental payments for these leases over their remaining terms are as follows: 2017—$541,000, 2018—$290,000, 2019—$195,000, 2020 – $96,000 and 2021 later—$22,000.
The Company is subject to certain legal and other proceedings in the normal course of business that, in the opinion of management, should not have a material effect on its future results of operations or financial position.
| 8. | Defined Contribution Benefit Plan |
The Company maintains a defined contribution 401(k) benefit plan covering substantially all employees. Employees are permitted to defer compensation up to IRS limits, with the Company matching 100% of the first 3% of deferred compensation and 50% of the next 2% deferred. The Company’s expense under this plan was $1,188,000, $1,051,000 and $954,000 in fiscal years 2016, 2015 and 2014, respectively.
F-19
Table of Contents
| 9. | Segment Information |
The Company has two reportable segments: Food Safety and Animal Safety. The Food Safety segment is primarily engaged in the development, production and marketing of diagnostic test kits and related products used by food producers and processors to detect harmful natural toxins, foodborne bacteria, allergens and levels of general sanitation. The Animal Safety segment is primarily engaged in the development, production and marketing of products dedicated to animal safety, including a complete line of consumable products marketed to veterinarians and animal health product distributors; this segment also provides genomic identification and related interpretive bioinformatic services. Additionally, the Animal Safety segment produces and markets rodenticides, disinfectants, and insecticides to assist in control of rodents, insects and disease in and around agricultural, food production and other facilities.
These segments are managed separately because they represent strategic business units that offer different products and require different marketing strategies. The Company evaluates performance based on total sales and operating income of the respective segments. The accounting policies of each of the segments are the same as those described in Note 1.
Segment information is as follows:
| (in thousands) | Food Safety | Animal Safety | Corporate and Eliminations (1) |
Total | ||||||||||||
| Fiscal 2016 |
||||||||||||||||
| Product revenues to external customers |
$ | 133,685 | $ | 139,885 | $ | 0 | $ | 273,570 | ||||||||
| Service revenues to external customers |
12,156 | 35,549 | 0 | 47,705 | ||||||||||||
|
|
|
|
|
|
|
|
|
|||||||||
| Total revenues to external customers |
145,841 | 175,434 | 0 | 321,275 | ||||||||||||
| Operating income (loss) |
29,185 | 30,777 | (3,576 | ) | 56,386 | |||||||||||
| Depreciation and amortization |
5,745 | 6,795 | 0 | 12,540 | ||||||||||||
| Total assets |
142,078 | 216,599 | 93,038 | 451,715 | ||||||||||||
| Expenditures for long-lived assets |
9,192 | 5,030 | 0 | 14,222 | ||||||||||||
| Fiscal 2015 |
||||||||||||||||
| Product revenues to external customers |
$ | 119,990 | $ | 123,919 | $ | 0 | $ | 243,909 | ||||||||
| Service revenues to external customers |
11,489 | 27,676 | 0 | 39,165 | ||||||||||||
|
|
|
|
|
|
|
|
|
|||||||||
| Total revenues to external customers |
131,479 | 151,595 | 0 | 283,074 | ||||||||||||
| Operating income (loss) |
30,265 | 26,034 | (3,181 | ) | 53,118 | |||||||||||
| Depreciation and amortization |
4,620 | 6,029 | 0 | 10,649 | ||||||||||||
| Total assets |
110,655 | 179,082 | 102,444 | 392,181 | ||||||||||||
| Expenditures for long-lived assets |
4,216 | 5,403 | 0 | 9,619 | ||||||||||||
| Fiscal 2014 |
||||||||||||||||
| Product revenues to external customers |
$ | 107,959 | $ | 108,189 | $ | 0 | $ | 216,148 | ||||||||
| Service revenues to external customers |
8,331 | 22,926 | 0 | 31,257 | ||||||||||||
|
|
|
|
|
|
|
|
|
|||||||||
| Total revenues to external customers |
116,290 | 131,115 | 0 | 247,405 | ||||||||||||
| Operating income (loss) |
28,009 | 18,571 | (3,189 | ) | 43,391 | |||||||||||
| Depreciation and amortization |
4,181 | 4,999 | 0 | 9,180 | ||||||||||||
| Total assets |
105,607 | 173,643 | 66,051 | 345,301 | ||||||||||||
| Expenditures for long-lived assets |
5,999 | 5,544 | 0 | 11,543 | ||||||||||||
| (1) | Includes corporate assets, including cash and cash equivalents, marketable securities, current and deferred tax accounts, and overhead expenses not allocated to specific business segments. Also includes the elimination of intersegment transactions and noncontrolling interests. |
Revenues to customers located outside the United States amounted to $107,680,000 or 33.5% of consolidated revenues in fiscal 2016, $103,867,000 or 36.7% in fiscal 2015 and $96,111,000 or 38.8% in fiscal 2014 and were derived primarily in various countries throughout Europe, Canada, South and Central America and Asia. No customer represented revenues in excess of 10% of consolidated net sales in any of the three years. The United States based operations represent 89% of the Company’s long-lived assets as of May 31, 2016 and 95% as May 31, 2015.
F-20
Table of Contents
| 10. | Stock Repurchase |
In December 2008, the Company’s Board of Directors authorized a program to purchase, subject to market conditions, up to 1,125,000 shares of the Company’s common stock. As of May 31, 2016, 112,026 cumulative shares have been purchased in negotiated and open market transactions for a total price, including commissions, of approximately $923,000. There were no purchases in fiscal years 2016 or 2015. Shares purchased under the program were retired.
| 11. | Summary of Quarterly Data (Unaudited) |
| Quarter Ended | ||||||||||||||||
| (in thousands, except per share) | August 2015 |
November 2015 |
February 2016 |
May 2016 |
||||||||||||
| Total revenues |
$ | 74,860 | $ | 79,610 | $ | 76,725 | $ | 90,080 | ||||||||
| Gross margin |
37,792 | 38,224 | 35,196 | 41,852 | ||||||||||||
| Net income |
9,289 | 9,142 | 8,289 | 9,818 | ||||||||||||
| Net income attributable to Neogen |
9,323 | 9,073 | 8,311 | 9,857 | ||||||||||||
| Basic net income per share |
0.25 | 0.24 | 0.22 | 0.27 | ||||||||||||
| Diluted net income per share |
0.25 | 0.24 | 0.22 | 0.26 | ||||||||||||
| Quarter Ended | ||||||||||||||||
| (in thousands, except per share) | August 2014 |
November 2014 |
February 2015 |
May 2015 |
||||||||||||
| Total revenues |
67,599 | 68,455 | 68,409 | $ | 78,611 | |||||||||||
| Gross margin |
34,076 | 34,208 | 33,703 | 37,698 | ||||||||||||
| Net income |
8,909 | 7,826 | 7,409 | 9,432 | ||||||||||||
| Net income attributable to Neogen |
8,883 | 7,806 | 7,454 | 9,384 | ||||||||||||
| Basic net income per share |
0.24 | 0.21 | 0.20 | 0.26 | ||||||||||||
| Diluted net income per share |
0.24 | 0.21 | 0.20 | 0.25 | ||||||||||||
Quarterly net income per share is based on weighted-average shares outstanding and potentially dilutive stock options for the specific period, and as a result, will not necessarily aggregate to total net income per share as computed for the year as disclosed in the consolidated statements of income.
F-21