Attached files
Table of Contents
UNITED STATES
SECURITIES AND EXCHANGE COMMISSION
WASHINGTON, D.C. 20549
FORM 10-K
| x | ANNUAL REPORT PURSUANT TO SECTION 13 OR 15(d) OF THE SECURITIES EXCHANGE ACT OF 1934 |
For the Fiscal Year Ended May 31, 2010
| ¨ | TRANSITION REPORT PURSUANT TO SECTION 13 OR 15(d) OF THE SECURITIES EXCHANGE ACT OF 1934 |
For The Transition Period From To .
COMMISSION FILE NUMBER 0-17988
NEOGEN CORPORATION
(Exact name of registrant as specified in its charter)
| MICHIGAN | 38-2367843 | |
| (State or other jurisdiction of incorporation or organization) |
(I.R.S. Employer Identification No.) |
620 Lesher Place
Lansing, Michigan 48912
(Address of principal executive offices including zip code)
517-372-9200
(Registrant’s telephone number, including area code)
SECURITIES REGISTERED PURSUANT TO SECTION 12(b) OF THE ACT: NONE
SECURITIES REGISTERED PURSUANT TO SECTION 12(g) OF THE ACT:
COMMON STOCK, $0.16 par value per share
(Title of Class)
Indicate by check mark if the registrant is a well-known seasoned issuer, as defined in Rule 405 of the Securities Act. Yes ¨ No x
Indicate by a check mark if the registrant is not required to file reports pursuant to Section 13 or 15(d) of the Act. Yes ¨ No x
Indicate by check mark whether the registrant has submitted electronically and posted on its corporate web site, if any, every Interactive Data File required to be submitted and posted pursuant to Rule 405 of Regulation S-T (§ 232.405 of this chapter) during the preceding 12 months (or for such shorter period that the registrant was required to submit and post such files). Yes ¨ No ¨
Indicate by check mark whether the registrant (1) has filed all reports required to be filed by Section 13 or 15(d) of the Securities Exchange Act of 1934 during the preceding 12 months (or for such shorter period that the registrant was required to file such reports), and (2) has been subject to such filing requirements for the past 90 days. Yes x No ¨
Indicate by check mark if disclosure of delinquent filers pursuant to Item 405 of Regulation S-K is not contained herein, and will not be contained, to the best of registrant’s knowledge, in definitive proxy or information statements incorporated by reference in Part III of this Form 10-K or any amendment to this Form 10-K. ¨
Indicate by check mark whether the registrant is a large accelerated filer, an accelerated filer, or a non-accelerated filer. See definition of “accelerated filer and large accelerated filer” in Rule 12b-2 of the Exchange Act. (Check one):
| Large accelerated filer ¨ | Accelerated filer x | Non-accelerated filer ¨ | Smaller reporting company ¨ |
Indicate by check mark whether the registrant is a shell company (as defined in Rule 12b-2 of the Act). Yes ¨ No x
Based on the closing sale price on November 30, 2009 the aggregate market value of the voting stock held by non-affiliates of the registrant was $453,000,000. For these purposes, the registrant considers its Directors and executive officers to be its only affiliates.
The number of outstanding shares of the registrant’s Common Stock was 22,681,000 on July 31, 2010.
Table of Contents
DOCUMENTS INCORPORATED BY REFERENCE
The Registrant’s definitive proxy statement to be prepared pursuant to regulation 14a and filed in connection with solicitation of proxies for its October 7, 2010 annual meeting of shareholders is incorporated by reference into part III of this Form 10-K.
1
Table of Contents
2
Table of Contents
CAUTIONARY STATEMENT REGARDING FORWARD-LOOKING INFORMATION
Forward-looking statements, within the meaning of Section 27A of the Securities Act of 1933, as amended, and Section 21E of the Securities Exchange Act of 1934, as amended, are made throughout this Annual Report on Form 10-K, including statements relating to management’s expectations regarding new product introductions; the adequacy of the Company’s sources for certain components, raw materials and finished products; and the Company’s ability to utilize certain inventory. For this purpose, any statements contained herein that are not statements of historical fact may be deemed to be forward-looking statements. Without limiting the foregoing, the words “believes,” “anticipates,” “plans,” “expects,” “seeks,” “estimates,” and similar expressions are intended to identify forward-looking statements. There are a number of important factors that could cause Neogen Corporation’s results to differ materially from those indicated by such forward-looking statements, including those detailed in ITEM 1A. RISK FACTORS and under the caption Management’s Discussion and Analysis of Financial Condition and Results of Operations – Critical Accounting Policies and Estimates and – Future Operating Results.
In addition, any forward-looking statements represent management’s views only as of the day this Annual Report on Form 10-K was first filed with the Securities and Exchange Commission and should not be relied upon as representing management’s views as of any subsequent date. While management may elect to update forward-looking statements at some point in the future, it specifically disclaims any obligation to do so, even if its views change.
3
Table of Contents
| ITEM 1. | BUSINESS |
Neogen Corporation and subsidiaries (Neogen or the Company) develop, manufacture, and market a diverse line of products dedicated to food and animal safety. The Company’s food safety segment consists primarily of diagnostic test kits and complementary products (e.g., dehydrated culture media) marketed by company sales personnel in North America, the United Kingdom and other parts of Europe, Mexico and Brazil, and by distributors elsewhere to food producers and processors to detect dangerous and/or unintended substances in human food and animal feed, such as foodborne pathogens, spoilage organisms, natural toxins, food allergens, genetic modifications, ruminant by-products, drug residues, pesticide residues and general sanitation concerns. The diagnostic test kits are generally less expensive, easier to use and provide greater accuracy and speed than conventional diagnostic methods. The majority of the tests are disposable, single-use, immunoassay and gene probe products that rely on the Company’s proprietary antibodies and RNA and DNA probes to produce rapid and accurate test results. The Company’s expanding line of food safety products also includes bioluminescence-based diagnostic technology.
Neogen’s animal safety segment is engaged in the development, manufacture and marketing of pharmaceuticals, rodenticides, disinfectants, vaccines, veterinary instruments, topicals and diagnostic products and genetic testing services for the worldwide animal safety market. The majority of these consumable products are marketed through a network of national and international distributors, as well as a number of large farm supply retail chains in the United States and Canada. The Company’s USDA-licensed facility in Lansing, MI, produces immunostimulant products for horses and dogs, and a unique equine botulism vaccine. The Company’s line of drug detection products are sold worldwide for the detection of abused and therapeutic drugs in animals and animal products.
Management’s vision is for Neogen to become a world leader in development and marketing of products dedicated to food and animal safety. To meet this vision, a growth strategy consisting of the following elements has been developed: (i) increasing sales of existing products; (ii) introducing new products and product lines; (iii) expanding international sales; and (iv) acquiring businesses and forming strategic alliances. While the elements of the strategy are stated in order of importance over the long term, management understands and believes that strategic acquisitions will provide the best opportunity for more rapid growth in the short term. For that reason, an active acquisition program is maintained and financial and other resources are maintained to capitalize on opportunities as they arise.
Neogen Corporation was formed as a Michigan corporation in June 1981 and actual operations began in 1982. The Company’s principal executive offices are located at 620 Lesher Place, Lansing, Michigan 48912-1595 and its telephone number is (517) 372-9200.
Neogen’s Annual Report on Form 10-K, Quarterly Reports on Form 10-Q, Current Reports on Form 8-K, and amendments to those reports are available free of charge via our Internet website (www.neogen.com) as soon as reasonably practicable after such information is filed with, or furnished to, the United States Securities and Exchange Commission.
PRODUCTS
Product trademarks and registered trademarks owned by Neogen include: Corporate: Acumedia®, Neogen®, Neogen flask®; Food Safety: AccuClean®, AccuPoint®, AccuScan®, Agri-Screen®, Alert®, BetaStar®, BioPlate™, Centrus®, GeneQuence®, GENE-TRAK®, ISO-GRID®, NeoColumn™, NEO-GRID®, Penzym™, Penzyme®, Reveal®, Revive®, Soleris®, TetraStar®, Veratox®; Life Sciences: K-Blue®, K-Gold®; Rodenticides: CyKill™, Di-Kill®, Hacco®, Ramik®, Rodex™; Animal Safety: AluShield™, AmVet®, BottomHoof™, BotVax®, Calf Eze™, D3 Needles™, DC&R®, Dr. Franks®, ElectroJac®, ELISA Technologies®, Eqimax™, EqStim®, Furazone®, GeneSeek ®,Gnat-Away™, Gnatural™, Gold Nugget®, Gold Wrap™, Ideal®, ImmunoRegulin®, ImmunoVet™, Injecto-Stik™, Insight™, ISO-Prine™, Jolt™, MegaShot™, Mini-Shot™, Molecular Solutions for Life®, MycAseptic®, NeedleGard™, NFZ ®, Paddock & Pasture™, PanaKare™, Parvosol®, Poridon®, Pro-Pistol™, Pro-Shot™, Pyril-Pam™, RenaKare™, Rivard®, SeekGain™,SeekSire™, SeekTrace ™, Shine N’ Glo™, Spec-Tuss™, Spectrasol®, Squire®, Stam-N-Aid™, Stress-Dex®, TCA Paint™, ThrushCrusher™, ThyroKare™, TopHoof™, Tri-Hist®, Tri-Seal™, Triple Block™, Triple Cast™, Triple Crown™, Triple Heat™, Tri-Soxsuprine™, Tryad®, UriCon®, UriKare™, Vet-Tie™, Vita-
4
Table of Contents
15™; Kane veterinary products: Ag-Tek®, BreederSleeve®, Correct®, EquiSleeve®, E-Z Bond™, E-Z Catch®, FuturaPad®, Kane®; MaxiSleeve ®, PolyHand®, PolySleeve ®, Pro-Fix®, Pro-Flex®, Safe-T-Flex™, SurgiCryl®; BioSentry agricultural cleaners and disinfectants: Acid-A-Foam™, BioCres™, BioPhene™, BioSentry®, BioQuat™, Chlor-A-Foam™, Evap™, GenQuat®, X-185™.
Neogen operates in two primary business areas: the Food Safety segment, which develops and markets products for the detection of pathogens, natural toxins and other unwanted substances in food and feed products; and the Animal Safety segment, which develops and markets products and services dedicated to animal health. See Notes to Consolidated Financial Statements elsewhere in this Form 10-K for financial information about the Company’s business segments and international operations.
FOOD SAFETY SEGMENT
The products of Neogen’s food safety segment consist of diagnostic test kits and complementary products marketed to food and feed producers and processors to detect dangerous and/or unintended substances in food and animal feed, such as foodborne pathogens, spoilage organisms, natural toxins, food allergens, genetic modifications, ruminant by-products, drug residues, pesticide residues and general sanitation concerns.
Many of Neogen’s food safety test kits use immunoassay technology to rapidly detect target substances. The Company’s ability to produce superior antibodies sets its products apart from immunoassay test kits produced and sold by other companies. The Company’s kits are available in microwell formats, which allow for the rapid processing of a large number of samples and automated procedures, and lateral flow and other similar devices that provide distinct visual results. Typically test kits use antibody-coated test devices and chemical reagents to produce a color change to indicate a positive or negative result for the presence of a target substance in a test sample. The simplicity of the tests makes them accessible to all levels of food producers, processors and handlers.
The Company’s kits are generally based on internally developed technology or technology that is acquired in connection with acquisitions. In 2010 Food Safety royalty payments totaled $975,000, including payments of $433,000 for licenses related to the dairy antibiotics product line and $291,000 for allergen products. The remaining items are individually inmaterial. All royalty rates are in the low single digit range.
Neogen’s test kits are used to detect potential hazards in food and animal feed by testers ranging from small local grain elevators to the largest, best-known food and feed processors in the world, and numerous regulatory agencies.
Meat and poultry processors, seafood processors, fruit and vegetable producers and many other market segments are the primary users of the Neogen’s Reveal® and Alert® tests for foodborne bacteria, including E. coli O157:H7, Salmonella, Listeria and Campylobacter. Grain producers and processors of all types and sizes use the Company’s Veratox®, Agri-Screen® and Reveal® tests for mycotoxins, including aflatoxin, deoxynivalenol, fumonisin, ochratoxin, zearalenone and T-2 toxin, to help ensure product safety and quality. The world’s largest producers of cookies, crackers, candy, ice cream, and many other foods, use the Company’s Veratox®, Alert® and Reveal®, Reveal 3-D and BioKits testing products for food allergens to help protect their food-allergenic customers from the inadvertent contamination of products with food allergens, such as peanut, milk, casein, egg, almond, wheat (gluten), soy, and hazelnut residues. The Company’s December 2009 acquisition of the BioKits food safety business of Gen-Probe Incorporated added more than 50 test kits for food allergens, meat and fish speciation, and plant genetics, including tests in an advanced lateral flow format for gluten and casein.
Dairies are primary users of Neogen’s BetaStar®, BetaStar Combo, Penzyme® and TetraStar® diagnostic tests to detect the presence of beta lactam and tetracycline antibiotics in milk. The presence of these drugs in milk is a public health hazard, and an economic risk to processors as it limits the milk’s further processing.
Neogen developed the first rapid immunoassay test kits to detect ruminant by-products in animal feed ingredients and finished feed. The Reveal® tests were designed to help prevent ruminants (cattle, sheep and goats) from being fed rendered materials containing ruminant by-products in an effort to prevent the spread of BSE (a.k.a., “mad cow” disease) from animal to animal. The Company’s specialty products for the seafood
5
Table of Contents
market include tests for histamine, a highly allergenic substance that occurs when certain species of fish begin to decay; chloramphenicol, a banned antibiotic in most of the world, but still used by some shrimp farmers to improve the yield of their product; and sulfites, an effective but potentially allergenic shrimp preservative.
Neogen also offers other test methods and products to complement its immunoassay tests. The Company’s line of GENE-TRAK® and GeneQuence® assays utilize DNA probe hybridization technology to create exceptionally sensitive and specific tests to detect foodborne bacteria. Instead of using antibodies as in an immunoassay to “capture” a target pathogen that may be present in a sample, this technology uses a portion of the target pathogen’s unique ribosomal RNA (rRNA) sequence to bind to complementary rRNA strands of the pathogen in a sample. The result is a test with the ease and speed of a rapid test method, but the specificity of a time-consuming conventional laboratory method (specificity is a test’s ability to distinguish between a target pathogen, and a closely-related but innocuous bacterium).
Neogen’s Soleris® product is used by food processors to identify the presence of spoilage organisms (e.g., yeast and mold) and other microbiological contamination.
Neogen’s Acumedia® subsidiary offers dehydrated culture media for varied purposes, including traditional bacterial testing, and growing beneficial bacteria, such as cultures for sausages and beer. The Company’s customers for dehydrated culture media also include commercial and research laboratories and producers of pharmaceuticals, cosmetics and veterinary vaccines.
Neogen manufactures and markets its AccuPoint® rapid sanitation test for adenosine triphosphate (ATP), a chemical found in all living cells. This easy-to-use and inexpensive test uses bioluminescence to quickly (in less than 30 seconds) determine if a food contact surface has been completely sanitized. When ATP comes into contact with the firefly reagent luciferin luciferase contained in the test device, a reaction takes place that produces light. The more light, the more present ATP and the greater the need for more thorough sanitation. The Company’s worldwide customer base for its ATP sanitation testing products includes food and beverage processors, the foodservice industry, as well as many other users.
Revenues from Neogen’s Food Safety Division accounted for 54.4%, 51.4% and 56.3% of the Company’s total revenues for fiscal years ended May 31, 2010, 2009 and 2008, respectively.
ANIMAL SAFETY SEGMENT
Neogen’s animal safety segment is engaged in the development, manufacture and marketing of pharmaceuticals, rodenticides, disinfectants, vaccines, veterinary instruments, topicals and diagnostic products to the worldwide animal safety market. Beginning with the acquisition of GeneSeek, Inc. in 2010, the Company provides important genotyping services to animal breeders throughout the world.
Neogen’s AmVet® product line provides innovative, value-added, high quality products to the veterinary market. Top AmVet products include PanaKare™, a digestive aid that serves as a replacement therapy where digestion of protein, carbohydrate and fat is inadequate due to exocrine pancreatic insufficiency; Natural Vitamin E-AD, which aids in the prevention and treatment of vitamin deficiencies in swine, cattle and sheep; and RenaKare™, a supplement for potassium deficiency in cats and dogs. Products sold under the NeogenVet™ brand include Vita-15™ and Liver 7, which are used in the treatment and prevention of nutritional deficiencies in horses.
In 2003, Neogen acquired Hacco, Inc., a manufacturer of rodenticides, including the brand Ramik®. On the same date, it also acquired Hess & Clark, Inc. Hess & Clark’s principal products are disinfectants, such as DC&R®, used in animal and food production facilities.
In early fiscal 2009, Neogen acquired a product line of 14 different product formulations used in animal health and hygiene applications from DuPont Animal Health Solutions (DAHS). These products, including 904 Disinfectant, Acid-A-Foam™, and FarmFluid S™ added to the Company’s strategy of providing biosecurity solutions in the farm production markets. The products also have the potential for use in the veterinary clinic market to maintain sanitary conditions and limit the potential hazards of bacteria, fungi, and viruses.
6
Table of Contents
Neogen’s in-house equine protozoal myeloencephalitis (EPM) testing service offers veterinarians accurate, timely results for early diagnosis of the disease that can devastate a horse’s central nervous system. In addition, the Company’s BotVax® B vaccine has successfully protected thousands of high-value horses and foals against type B botulism, commonly known as Shaker Foal Syndrome. The Company’s product is the only USDA-approved vaccine for the prevention of Type B botulism in horses.
Years of research and many thousands of doses have proven Neogen’s EqStim® immunostimulant to be safe and effective as a veterinarian-administered adjunct to conventional treatment of equine bacterial and viral respiratory infections. The Company’s ImmunoRegulin® product uses similar immunostimulant technology to aid in the treatment of pyoderma (a bacterial skin inflammation) in dogs.
Neogen markets a complete line of veterinary instruments and animal health delivery systems under the Ideal product brand name. Approximately 250 different products are offered, many of which are used to deliver animal health products, such as antibiotics and vaccines. Ideal’s D3 Needles™ and the HDN, HDDI and DTN needle product lines that were acquired in the Rivard acquisition are stronger than conventional veterinary needles, and are uniquely detectable by common meat processing facility metal detectors—a big market advantage in the safety-conscious beef and swine industries.
Animal safety products offered by Neogen to the retail over-the-counter market include many of the Ideal brand veterinary instruments and products sold under the Squire® and Gold Nugget® brands. Squire products include Stress-Dex® oral electrolyte replacer for performance horses, and Furazone®, for the prevention and treatment of surface bacterial infections in wounds, burns and cutaneous ulcers. Gold Nugget OTC products include GNatural™ Spray, to protect horses from biting insects, and Poridon®, a pour-on insecticide for horses. Ag-Tek® and other hoof care, disposables and artificial insemination supplies that were acquired in the Kane acquisition are marketed to the dairy and veterinary industries.
Neogen’s line of approximately 100 drug detection immunoassay test kits are sold worldwide for the detection of approximately 300 abused and therapeutic drugs in farm animals and racing animals, such as horses, greyhounds and camels, and for detection of drug residues in meat and meat products. The test kits are also used for human forensic toxicology drug screening applications. This line includes tests for narcotics, analgesics, stimulants, depressants, tranquilizers, anesthetics, steroids and diuretics.
In April 2010, Neogen acquired GeneSeek, Inc., a leading commercial agricultural genetics laboratory in the United States. Founded in 1998, GeneSeek employs 36 individuals and has grown rapidly in recent years. GeneSeek’s technology employs high-resolution DNA genotyping for identity and trait analysis in a variety of important animal and agricultural plant species. Through the use of single nucleotide polymorphism (SNP) discovery and analysis, GeneSeek empowers its customers to speed genetic improvement efforts, as well as identify economically important diseases.
Neogen also has several products used by researchers for the detection of biologically-active substances. These products include tests for cyclic nucleotides, hormones, leukotrienes, prostaglandins and steroids. Marketed under the trademarks of K-Blue® and K-Gold®, Neogen offers proprietary substrates that it uses in its own testing products, and that are sold to other diagnostic test kit manufacturers.
Revenues from Neogen’s Animal Safety Division accounted for 45.6%, 48.6% and 43.7% of the Company’s total revenues for fiscal years ended May 31, 2010, 2009 and 2008, respectively.
GENERAL SALES AND MARKETING
Neogen’s domestic sales efforts are generally organized by market segments, rather than by products or geography. During the fiscal year that ended May 31, 2010, the Company had approximately 6,000 customers for its products. Since many customers for animal safety products are distributors, and certain animal safety products are offered to the general retail market, the total number of end users of the Company’s products is considerably greater than 6,000. A total of 184 employees are assigned to sales and marketing functions within the Company. During the year ended May 31, 2010, revenues from one food safety distributor customer were 10.3% of total revenues. No other customer represented in excess of 10% of revenues.
7
Table of Contents
FOOD SAFETY SALES AND MARKETING
To reach each customer and prospect with expertise and experience, Neogen has a staff of specialized food safety sales and technical service representatives assigned to specific markets. This staff sells Company products directly to end users, and also handles technical support issues that arise with customers.
Neogen’s food safety markets are comprised of: milling and grain, including grain elevators, feed mills, pet food manufacturers, and grain inspection companies; meat and poultry, including meat and poultry processors, producers of ready-to-eat meat and poultry products; and the USDA’s Food Safety Inspection Service (FSIS); grocery products, including flour millers, malters, bakeries, candy and confection manufacturers, manufacturers of prepared meals, nuts, spices, cookies, crackers and other snack foods; fruits and vegetables, including growers and processors of juice and packaged fresh cut grocery items; seafood, including harvesters and processors of a wide variety of seafood products; dairy and beverage, including milk processors and soft drink bottlers; Acumedia dehydrated culture media, including commercial and research laboratories and producers of pharmaceuticals, cosmetics and veterinary vaccines; food service and retail, including fast food service establishments and retail grocery market chains, and nutraceuticals, including producers and marketers of a wide variety of nutraceutical products.
ANIMAL SAFETY SALES AND MARKETING
Neogen markets a broad range of pharmaceuticals, vitamin injectibles, wound care products, topicals, instruments, testing services and biologicals to the ethical veterinary market. The product range is focused on the food (cattle and pigs) and companion (horses, dogs, and cats) animal markets. Neogen’s sales group works directly with veterinarians, clinics and universities and markets through established ethical distributors by supporting the efforts of over 500 domestic distributor sales representatives calling on 35,000 plus veterinarians. Neogen further supports its veterinary distribution channel through product training, field support, promotions and technical service.
The over-the-counter (OTC) animal health market also offers significant growth opportunities for Neogen and its products. Neogen offers a broad range of products including well recognized brands of rodenticides, disinfectants, instruments and horse care products. To reach the OTC market, Neogen’s sales team works with a large network of animal health distributors including marketing groups, traditional two-step distributors, catalogers and large retail chains. Support includes product training, field support, planogram solutions, promotions and advertising. As a commercial laboratory, GeneSeek provides services direct to the customer.
INTERNATIONAL SALES AND MARKETING
FOOD SAFETY:
Internationally, Neogen uses its own sales managers to work closely with and coordinate the efforts of a network of more than 120 distributors in 100 countries. The distributors provide local training and technical support, perform market research, and promote Company products within designated countries around the world.
Neogen Europe, Ltd. provides the Company access to the European Union, and allows it to serve its network of customers and distributors throughout the EU. Customers in United Kingdom, France and Germany are served by Company employees. Other European region customers generally are serviced by distributors managed by Neogen Europe personnel. Neogen Europe’s strong research and development continue to be a strong asset in the development of products tailored to meet unique requirements of the European market.
Neogen’s dairy antibiotics diagnostic products are distributed outside of North America by Denmark based Chr. Hansen, an international supplier of natural ingredient solutions for the food and health and nutritional industries.
Neogen’s Soleris diagnostic test system for general spoilage organisms is marketed worldwide by Neogen personnel and Denmark based Foss Analytical.
8
Table of Contents
Since 2002, Neogen has continued to maintain a presence in Shanghai, China, to better serve the expanding food safety market, as well as more closely manage its Chinese food and animal product procurement. Neogen intends to continue to use local distributors to introduce the Company’s products in the Chinese market.
In 2008, Neogen formed a subsidiary in Mexico, Neogen LatinoAmerica. The company, headquartered in Mexico City, distributes the Company’s food and animal safety products throughout Mexico and Latin America. Neogen LatinoAmerica unifies Neogen’s widespread business activities throughout the region to animal and crop producers, and food processors. As a result of nearly 20 years of use, Neogen products have earned the trust of Mexican and Latin American producers of meat and milk, and food processors.
In October 2009, Neogen formed a subsidiary in Brazil, Neogen do Brasil (Neogen of Brazil). The new company, headquartered near Sao Paulo, will distribute Neogen’s food safety products throughout Brazil. Neogen do Brasil was created to accelerate the success of Neogen products in Brazil, which has become one of the world’s largest food producers and exporters. Brazil is the world leader in the export of numerous food commodities, including beef, poultry, soybeans, coffee, sugar, and orange juice.
ANIMAL SAFETY:
The Animal Safety’s international sales group has established a strong presence in several key markets with rodenticides, disinfectants, instruments and veterinary products. Primarily, utilizing in-country distributors and US-based exporters, these markets include Canada, Mexico and Central America, South America, the Caribbean, Australia and Europe Diagnostic products are sold around the world through an extensive distributor network.
GENERAL:
International sales accounted for 39.9%, 41.0% and 38.4% of the Company’s total revenues for fiscal years ended May 31, 2010, 2009 and 2008, respectively.
Risks associated with foreign operations include the need for additional regulatory approvals, possible disruptions of product delivery, the differing product needs of foreign customers, difficulties in building and managing foreign operations, fluctuations in the value of foreign currencies, import/export duties and quotas, and unexpected regulatory, economic or political changes in foreign markets.
RESEARCH AND DEVELOPMENT
Management maintains a strong commitment to Neogen’s research and development activities. The Company’s product development efforts are focused on the enhancement of existing product lines and in development of new products that fit its business strategy. The Company employs 51 individuals in its research and development department, including immunologists, chemists, engineers and microbiologists. Research and development expenditures were approximately $6.3 million, $4.6 million and $3.6 million representing 4.5%, 3.8% and 3.6% of total revenues in fiscal 2010, 2009 and 2008, respectively. Management currently intends to maintain the Company’s research and development expenditures at approximately 4% to 6% of total revenues.
Neogen has ongoing development projects for new diagnostic tests and other complementary products for both the food safety and animal safety markets. Management expects that these products will be available for marketing in fiscal years 2010 to 2012. Expenditures in FY-2011 are expected to be approximately 5% of total revenues.
Portions of certain technologies utilized in some products marketed by Neogen were acquired from or developed in collaboration with affiliated partnerships, independent scientists, governmental units, universities and other third parties. The Company has entered into agreements with these parties that provide for the payment of royalties based upon sales of products that utilize the pertinent technology. Royalty expense under these agreements amounted to $1,337,000, $1,184,000 and $1,231,000 in 2010, 2009 and 2008, respectively.
9
Table of Contents
PROPRIETARY PROTECTION AND APPROVALS
Neogen uses trade secrets as proprietary protection in numerous of its food and animal safety products. In many cases, the Company has developed unique antibodies capable of detecting microorganisms and residues at minute levels. The supply of these antibodies, and the proprietary techniques utilized for their development, may offer better protection than the filing of patents. Such proprietary reagents are maintained in secure facilities and stored in more than one location to reduce exposure to complete destruction by natural disaster or other means.
Patents and trademarks are applied for whenever appropriate. Since its inception, Neogen has acquired and received more than 50 patents and trademarks, and has several pending patents and trademarks. The patents expire at various times over the next 20 years.
A summary of patents by product categories follow:
| USA | International | Expiration | ||||
| Natural Toxins, Allergens & Drug Residues |
3 | 34 | 2010-2019 | |||
| Bacterial & General Sanitation |
12 | 3 | 2012-2026 | |||
| Dry Culture Media & Other |
1 | 0 | 2016 | |||
| Life Science & Other |
0 | 2 | 2024 | |||
| Vaccine |
1 | 0 | 2018 | |||
| Veterinary Instruments & Other |
4 | 6 | 2018-2022 |
The Company does not expect that the near term expiration of any patent will have a significant effect on future results of operations.
Management believes that Neogen has adequate protection as to proprietary rights for its products. However, it is aware that substantial research has taken place at universities, governmental agencies and other companies throughout the world and that numerous patents have been applied for and issued. To the extent some of the Company’s products may now, or in the future, embody technologies protected by patents, copyrights or trade secrets of others, licenses to use such technologies may need to be obtained in order to continue to sell the products. These licenses may not be available on commercially reasonable terms. Failure to obtain any such licenses may delay or prevent the sale of certain new or existing products. In addition, patent litigation is not uncommon. Accordingly, there can be no assurance that the Company’s existing patents will be sufficient to completely protect its proprietary rights.
One of the major areas affecting the success of biotechnology development involves the time, costs and uncertainty surrounding regulatory approvals. Currently, Neogen products requiring regulatory approval include BotVax B, EqStim, ImmunoRegulin and Beta Star. The Company’s general strategy is to select technical and proprietary products that do not require mandatory approval to be marketed. Neogen’s rodenticide and disinfectant products are subject to registration in the United States and internationally.
Neogen utilizes third-party validations on many of its disposable test kits as a marketing tool to provide its customers with the proper assurances. These include validation by the AOAC International, independently administered third-party, multi-laboratory collaborative studies and approvals by the U.S. Federal Grain Inspection Service and the U.S. Food Safety Inspection Service for the use of Company products in their operations.
PRODUCTION AND SUPPLY
Neogen manufactures its products in Lansing, Michigan; Lexington, Kentucky; Randolph, Wisconsin; and Ayr, Scotland. There are currently approximately 248 full-time employees assigned to manufacturing in these four locations. Most locations operate on a one-shift basis, but could be increased to a two-shift basis, if needed. Management believes it could increase the current output of its primary product lines by more than 50% using the current space available with a minimum of additional capital equipment.
Manufacturing of diagnostic tests for detection of natural toxins, pathogens, food allergen and pesticides, final kit assembly, quality assurance and shipping takes place in the Company’s facilities in Lansing. Proprietary
10
Table of Contents
monoclonal and polyclonal antibodies for the Neogen’s diagnostic kits are produced on a regular schedule in the Company’s immunology laboratories. Other reagents are similarly prepared by the R&D employees. Manufacturing of diagnostic tests for the presence of dairy antibiotics in milk is completed in the Company’s Lansing facilities. Generally, final assembly and shipment of diagnostic test kits to customers in Europe are performed in the Company’s Ayr, Scotland facility.
Assembly and shipment of electronic readers and disposable single-use samplers takes place in the Company’s facilities in Lansing.
Dehydrated culture media products are manufactured in a FDA monitored facility in Lansing. Products are blended following strict formulations or custom blended to customer specification and shipped directly to customers from Lansing.
Soleris single-use vials and equipment are produced and shipped to customers mostly by third party vendors.
Manufacture of pharmacological diagnostic test kits, test kits for drug residues and of animal health products takes place in the Company’s facility in Lexington. In general, manufacturing operations including reagent manufacturing, quality assurance, final kit assembly and packaging are performed by Neogen personnel. Certain animal health products that are purchased finished or that are toll manufactured by third party vendors and veterinary instruments are warehoused and shipped from the Company’s Lexington facility. Other veterinary instruments are produced in the Company’s facilities in Lansing, and are generally then shipped to Lexington, for distribution to customers.
Manufacture of rodenticides and certain cleaners and disinfectants takes place in Randolph. Manufacturing of rodenticides consists of blending technical material (active ingredient) with bait consisting principally of various grains. Certain cleaners and disinfectants are manufactured in Randolph, while others are purchased from other manufacturers and sold, or toll manufactured by third parties.
Neogen maintains a Lansing-based USDA-approved manufacturing plant devoted to the production of the biologic products EqStim® and ImmunoRegulin®. P. acnes seed cultures are added to media and then subjected to several stages of further processing resulting in a product that is filled and packaged within the facility. The Company’s BotVax ®B vaccine is also produced in the Lansing facility utilizing Type B botulism seed cultures and a traditional fermentation process. All completed biologic products are then shipped to Neogen’s Lexington facilities for inventory and distribution to customers.
With its April 2010 acquisition of GeneSeek, Inc., Neogen now maintains a commercial agricultural genetics laboratory in Lincoln, Neb. Through its laboratory services, GeneSeek empowers its customers to speed genetic improvement efforts, as well as identify economically important diseases.
Neogen purchases component parts and raw materials from more than 500 suppliers. Though many of these supplies are purchased from a single source in order to achieve the greatest volume discounts, the Company believes it has identified acceptable alternative suppliers for all of its components and raw materials. Shipments of products are generally accomplished within a 48-hour turnaround time. As a result of this quick response time, Neogen’s backlog of unshipped orders at any given time is not significant.
COMPETITION
Although competitors vary in individual markets, management knows of no competitor that is pursuing Neogen’s fundamental strategy of developing and marketing a full line of products, ranging from disposable tests and dehydrated culture media to veterinary pharmaceuticals and veterinary instruments for a large number of food safety and animal safety concerns. For each of its individual products, the Company faces intense competition from companies ranging from small businesses to divisions of large international companies. Some of these organizations have substantially greater financial resources than the Company. The Company competes primarily on the basis of ease of use, speed, accuracy, and other similar performance characteristics of its products. The breadth of the Company’s product line, the effectiveness of its sales and customer service organizations and pricing are also components in management’s competitive plan. Management is not aware of any factors within its product lines that place the Company in an unfavorable position relative to its competitors.
11
Table of Contents
Future competition may become even more intense, including the development of changing technologies, which could affect the marketability of Neogen’s products. The Company’s competitive position also will depend on management’s ability to develop proprietary products, attract and retain qualified scientific and other personnel, develop and implement production and marketing plans and obtain patent protection and adequate capital resources.
FOOD SAFETY:
Neogen’s Food Safety Division has strong distribution of its products using Company employees domestically and in Europe and Mexico and from an active and aggressive distributor group elsewhere. With one of the largest professional sales organizations in the industry, management believes that it maintains a general competitive advantage as sales personnel are in a position to be with customers and prospects more frequently than those of its competitors. Additionally, as an agricultural based company, Neogen has what is believed to be a unique insight into the food industry as opposed to clinically based competition.
Competition for pathogen detection products includes traditional methods and antibody and genetic based platforms. Neogen’s product offerings compete across the entire spectrum of methods. Competition for natural toxins and allergen detection products include instrumentation and antibody based tests. Generally, the Company’s products fall within the non-instrument category. While for these and other food safety products the Company’s offerings will not always compete on all platforms in all markets, the products that are offered provide tests that can be well utilized by most customers to meet their testing needs.
Besides its strong product offerings and its superior distribution, the Company focuses its competitive advantage in the areas of customer service and speed and ease of use of its products. Additionally, by aggressively maintaining itself as a low cost producer, Neogen assures that it can be competitive with new market entrants that may choose a low pricing strategy in an attempt to gain market share.
ANIMAL SAFETY:
Neogen’s Animal Safety Division faces no one competitor across the products and markets it serves. In the racing industry market, the Company believes it holds the position of dominant market share, facing only one other significant company in the marketplace. In the Life Sciences market, the Company competes against several other diagnostic and reagent companies with similar product offerings.
In the veterinary market, Neogen markets BotVax B®, the only USDA approved vaccine for the prevention of botulism Type B in horses. The Company competes on other key products through differentiated product performance and superior customer and technical support. With some of its products, the Company provides solutions as a lower cost alternative and offers a private label option for its distributors.
Competition in the rodenticide market includes several companies of comparable size that offer products into similar market segments. The rodenticide retail market is dominated by a single brand. While the technical materials used by the competing companies are similar, Neogen uses manufacturing and bait formula techniques to better draw rodents to the product and thereby improve overall product performance.
Several companies compete for sales in the disinfectant and cleaner product segment. Neogen’s products are sold through their distributor network around the world, primarily to assist in animal production facilities.
Neogen competes in the retail market by providing solutions to common retail problems – stock outs, wasted floor space, and inconsistent brand identity. The Company offers planograms and reordering systems to maximize turns and profitability for its retail customers.
Neogen added to its genomic capability through its April 2010 acquisition of GeneSeek, the leading commercial agricultural genetics laboratory in the U.S. GeneSeek employs cutting-edge technology in the area of genomics. GeneSeek is not involved in cloning or the development of transgenic animals. Instead, the results of its technology allow the acceleration of natural selection through selective breeding of traits such as disease resistance and meat quality. Competition comes mainly from service providers whose primary focus is the human and pharmaceutical industries.
12
Table of Contents
GOVERNMENT REGULATION
A significant portion of the Neogen’s products and revenues are affected by the regulations of various domestic and foreign government agencies, including the U.S. Department of Agriculture, the Environmental Protection Agency, and the U.S. Food and Drug Administration. Changes in these regulations could affect revenues and/or costs of production and distribution.
Neogen’s development and manufacturing processes involve the use of certain hazardous material, chemicals and compounds. Management believes that the Company’s safety features for handling and disposing of such commodities comply with the standards prescribed by local, state and federal regulations. The Company’s cost to comply with these regulations is not significant and the Company has no reason to believe that any such future legislation or rules would be materially adverse to its business.
The rodenticides, disinfectants and sanitizers manufactured and distributed by Neogen Corporation are subject to Environmental Protection Agency regulations. In general, any international sale of the product must also comply with similar regulatory requirements in the country of destination. Each country has its own individual regulatory construct with specific requirements (e.g., label in the language of the importing country). To the best of our knowledge pertinent products are in compliance with the appropriate federal and foreign regulations.
Dairy products used in National Conference on Interstate Milk Shipments (NCIMS) milk monitoring programs are regulated by the FDA. Before products requiring FDA approval can be sold in the U.S., extensive product performance data must be submitted in accordance with FDA approved protocol administered by AOAC Research Institute (AOAC RI). Following approval of a product by the FDA, the product must also be approved by NCIMS, an oversight body that includes state, federal and industry representatives. Our BetaStar® US dairy antibiotic residue testing product has been approved by the FDA, NCIMS, and AOAC RI. While some foreign countries accept AOAC RI approval as part of their regulatory approval process, many countries have separate regulatory processes.
Many of the food safety diagnostic products of allergens, spoilage organisms and mycotoxins do not require direct government approval. However, we have pursued AOAC approval for many of the products to enhance the marketability of products. Products for mycotoxin detection, which are used by federal inspectors, must be approved by USDA. Neogen Corporation has obtained and retained the necessary approvals to conduct its current operations.
Neogen’s veterinary vaccine products and one pharmaceutical product require government approval to allow for lawful sales. The vaccine products are approved by United States Department of Agriculture, Center for Veterinary Biologics (USDA-CVB) and the pharmaceutical product is approved by the FDA. The products, and the facilities in which they manufactured, are in a position of good standing with both agencies. The Company has had no warning letters based on any review or inspection; the Company has had no recalls on any of these products; and the Company knows of no reason why its freedom to manufacture and market in the future is in any danger.
Other animal safety and food products generally do not require additional registrations or approvals. However, Neogen Corporation’s regulatory staff routinely monitor amendments to current regulatory requirements to ensure compliance.
The Company’s rodenticide products generally require registration with U.S. governmental agencies at federal and state levels and with foreign governments.
EMPLOYEES
Currently, the Company employs 585 full-time persons. None of the employees are covered by collective bargaining agreements. There have been no work stoppages or slowdowns due to labor-related problems. Management believes that its relationship with its employees is good. All employees having access to proprietary information have executed confidentiality agreements with the Company.
13
Table of Contents
| ITEM 1A. | RISK FACTORS |
An investment in our common shares involves a high degree of risk. The risks described below are not the only ones that an investor faces. Additional risks that are not yet known to us or that we currently think are immaterial could also impair our business, financial condition or results of operations. If any of the following risks actually occurs, our business, financial condition or results of operations could be adversely affected.
Risks Relating to Our Business
Our business strategy is dependent on successfully identifying and integrating acquisitions as well as promoting internal growth.
Our business has grown significantly over the past several years as a result of both internal growth and acquisitions of existing businesses and their products. Identifying and pursuing acquisition opportunities, integrating these acquisitions into our business and managing their growth require a significant amount of management time and skill. We cannot assure that we will be effective in identifying, integrating or managing any acquisition target in the future. Our failure to successfully integrate and manage any future acquisition may have a material adverse effect on our operating results and financial condition.
In addition, if we continue to experience growth in our business, our growth could place a significant strain on our management, customer service, operations, sales and administrative personnel and other resources. To serve the needs of our existing and future customers, we will be required to train, motivate and manage qualified employees. We have incurred and will continue to incur significant costs to retain qualified management, sales and marketing, engineering, production, manufacturing and administrative personnel, as well as expenses for marketing and promotional activities. Our ability to manage our planned growth depends upon our success in expanding our operating, management and information and financial systems, which might significantly increase our operating expenses.
We might not be able to effectively manage our future growth, and if we fail to do so, our business, financial condition and results of operations would be adversely affected.
The development of new products entails substantial risk of failure.
We are continually developing new products for which we believe there should be significant market demand. We cannot assure that we will successfully develop commercially viable products, that the products will be developed on a timely basis to meet market demand or that the relevant market will be properly identified. If we expend substantial resources in developing an unsuccessful product, operating results will be adversely affected.
14
Table of Contents
Our international operations are subject to different product standards as well as other operational risks.
In fiscal 2010, sales to customers outside of the United States accounted for 40% of the Company’s total revenue. We expect that our international business will continue to account for a significant portion of our total revenue. Foreign regulatory bodies may establish product standards different from those in the U.S. and with which the Company’s current products do not comply. Our inability to design products that comply with foreign standards could have a material adverse effect on our future growth. Other risks related to our sales to customers outside of the United States include the possible disruption in transportation, difficulties in building and managing foreign distribution, fluctuation in the value of foreign currencies, import duties and quotas and unexpected economic and political changes in foreign markets. These factors might adversely affect international sales and our overall financial performance.
The markets for our products are extremely competitive, and our competitors may be able to utilize existing resource advantages to our detriment.
The markets in which the Company competes are subject to rapid and substantial changes in technology and are characterized by extensive research and development and intense competition. Many of our competitors and potential competitors have greater financial, technical, manufacturing, marketing, research and development and management resources than we do. These competitors might be able to use their resources, reputations and ability to leverage existing customer relationships to give them a competitive advantage over us. They might also succeed in developing products that are at least as reliable and effective as our products, make additional measurements, are less costly than our products or provide alternatives to our products.
We are dependent on the agricultural marketplace, which is affected by factors beyond our control.
Our primary customers are in the agricultural and food production industries. Economic conditions affecting agricultural industries are cyclical and are dependent upon many factors outside our control, including weather conditions or changes in consumption patterns. An economic downturn in the agricultural marketplace could adversely affect our sales.
Our quarterly operating results are subject to significant fluctuations.
We have experienced, and may experience in the future, significant fluctuations in our quarterly operating results. The mix of products sold and the acceptance of new products, in addition to other factors, could contribute to this quarterly variability. We operate with relatively little backlog and have few long-term customer contracts. Substantially all of our product revenue in each quarter results from orders received in that quarter. In addition, our expense levels are based, in part, on expectation of future revenue levels. A shortfall in expected revenue could, therefore, result in a disproportionate decrease in our net income.
Our success is highly dependent on our ability to obtain protection for the intellectual property utilized in our products.
Our success and ability to compete depends in part upon our ability to obtain protection in the United States and other countries for our products by establishing and maintaining intellectual property rights relating to or incorporated into our technology and products. Patent applications filed by the Company may not result in the issuance of patents or, if issued, may not be issued in a form that will be commercially advantageous to us. Even if issued, patents may be challenged, narrowed, invalidated or circumvented, which could limit our ability to stop competitors from marketing similar products or limit the length of time of patent protection we may have for our products. We also cannot assure that our nondisclosure agreements, together with trade secrets and other common law rights, will provide meaningful protection for the Company’s trade secrets and other proprietary information. Moreover, the laws of some foreign jurisdictions may not protect intellectual property rights to the same extent as in the United States, and many companies have encountered significant difficulties in protecting and defending such rights in foreign jurisdictions. If we encounter such difficulties or we are otherwise precluded from effectively protecting our intellectual property rights domestically or in foreign jurisdictions, we may incur substantial costs and our business, including our business prospects, could be substantially harmed. From time to time, the Company has received notices alleging that the Company’s products infringe third party proprietary rights. Whether the manufacture, sale or use of current products, or
15
Table of Contents
whether any products under development would, upon commercialization, infringe any patent claim will not be known with certainty unless and until a court interprets the patent claim in the context of litigation. If an infringement allegation is made against us, we may seek to invalidate the asserted patent claim and/or to allege non-infringement of the asserted patent claim. In order for us to invalidate a U.S. patent claim, we would need to rebut the presumption of validity afforded to issue patents in the United States with clear and convincing evidence of invalidity, which is a high burden of proof. The outcome of infringement litigation is subject to substantial uncertainties, and also the testimony of experts as to technical facts upon which experts may reasonably disagree. Our defense of an infringement litigation lawsuit could result in significant expense. Regardless of the outcome, infringement litigation could significantly disrupt our marketing, development and commercialization efforts, divert our management’s attention and consume our financial resources. In the event that we are found to infringe any valid claim in a patent held by a third party, we may, among other things, be required to:
| • | Pay damages, including up to treble damages and the other party’s attorneys’ fees, which may be substantial; |
| • | Cease the development, manufacture, importation, use and sale of products that infringe the patent rights of others, through a court-imposed sanction called an injunction; |
| • | Expend significant resources to redesign our technology so that it does not infringe others’ patent rights, or to develop or acquire non-infringing intellectual property, which may not be possible; |
| • | Discontinue manufacturing or other processes incorporating infringing technology; and/or |
| • | Obtain licenses to the infringed intellectual property, which may not be available to us on acceptable terms, or at all. |
Any development or acquisition of non-infringing products or technology or licenses could require the expenditure of substantial time and other resources and could have a material adverse effect on our business and financial results. If we are required to, but cannot, obtain a license to valid patent rights held by a third party, we would likely be prevented from commercializing the relevant product, or from further manufacture, sale or use of the relevant product.
We are subject to substantial governmental regulation.
A portion of our products are regulated by various domestic and foreign government agencies, including the U.S. Department of Agriculture and the U.S. Food and Drug Administration. Although less than 10% of our revenues is currently derived from products requiring government approval prior to sale, a significant portion of our revenues is derived from products used to monitor and detect the presence of residues that are regulated by various government agencies. Furthermore, a significant portion of the Company’s growth may be affected by the implementation of new regulations.
We are dependent on key employees.
Our success depends, in large part, on our chairman, president and other members of our management team. Our loss of any of these key employees could have a material adverse effect on the Company. We maintain certain incentive plans for key employees, and most of these employees have been with the Company in excess of five years. However, we have not executed long-term employment agreements with any of these employees and do not expect to do so in the foreseeable future. Our success also depends, significantly, on our ability to continue to attract such personnel. We cannot assure that we will be able to retain our existing personnel or attract additional qualified persons when required and on acceptable terms.
Our business may be subject to product liability claims.
The manufacturing and distribution of the Company’s products involve an inherent risk of product liability claims being asserted against us. Regardless of whether we are ultimately determined to be liable or our
16
Table of Contents
products are determined to be defective, we might incur significant legal expenses not covered by insurance. In addition, product liability litigation could damage our reputation and impair our ability to market our products, regardless of the outcome. Litigation could also impair our ability to retain product liability insurance or make our insurance more expensive. Although the Company currently maintains liability insurance, we cannot assure that we will be able to continue to obtain such insurance on acceptable terms, or that such insurance will provide adequate coverage against all potential claims. If we are subject to an uninsured or inadequately insured product liability claim, our business, financial condition and results of operations could be adversely affected.
Market prices for securities of technology companies are highly volatile.
The market prices for securities of technology companies have been volatile in the past and could continue to be volatile in the future. Fluctuations in our financial performance from period to period could have a significant impact on the market price of our common shares.
Operating results could be negatively impacted by economic, political or other developments in countries in which we do business.
Future operating results could be negatively impacted by unstable economic, political and social conditions, including but not limited to fluctuations in foreign currency exchange rates, political instability, or changes in the interpretation or creation of laws and regulations in each of the countries where the Company conducts business, including the United States. Additionally, the Company operates in multiple income tax jurisdictions and must determine the appropriate allocation of income to each of these jurisdictions based on current interpretations of complex income tax regulations. Income tax audits associated with the allocation of income and other complex issues may result in significant income tax adjustments that could negatively impact the Company’s future operating results.
| ITEM 1B. | UNRESOLVED STAFF COMMENTS - NONE |
| ITEM 2. | PROPERTIES |
Neogen owns several separate buildings located in Lansing, Michigan. A 26,000 square foot building located at 620 Lesher Place includes senior corporate administrative offices, food safety sales and marketing offices and research facilities. A 12,000 square foot building located at 600 Lesher Place is used for corporate accounting, human resources, and communications functions. Two adjacent buildings, located at 703 and 720 Shiawassee, total 25,000 square feet and are used for manufacture and warehousing of food safety products. Two buildings on Hosmer Street with a combined total of 49,000 square feet are used for manufacturing and warehousing of dehydrated culture media and veterinary instruments. A 55,000 square foot building at 1614 East Kalamazoo Street is used for research and production of vaccines. 17,000 square feet of the East Kalamazoo Street building is held for expansion.
Animal Safety sales and marketing, diagnostic test kit manufacturing, warehousing and distribution of all other Animal Safety products takes place from an 82,000 square foot Company owned facility at 944 Nandino Drive in Lexington, Kentucky.
Animal Safety pharmaceutical, supplement and topical product manufacturing takes place in 16,000 square feet of leased space at 2040 Creative Drive in Lexington, Kentucky. The lease covering the space is a non-cancelable operating lease through December 31, 2011 currently requiring monthly payments of $6,000.
Animal Safety researchers occupy 7,000 square feet of space in St. Joseph, Michigan. Originally occupied by International Diagnostics Systems Inc., this space now houses research and development labs at a monthly cost of $6,500. The lease extends through May 2013.
Additionally, 12,000 feet of space at 1847 Mercer Road in Lexington, Kentucky houses the distribution facility for many of the Animal Safety product lines. The lease for the space is a non–cancelable operating lease through September 30, 2010, requiring monthly payment of $4,450.
17
Table of Contents
Neogen Europe Ltd. Operations take place in 38,000 square feet in Auchincruive, Ayrshire, Scotland. The company purchased the facilities in 2010. The facility is adjacent to the campus of the Scottish Agricultural College at Ayr.
Rodenticide and disinfectant manufacturing and warehousing is conducted in 80,000 square feet of Company owned buildings at 110 Hopkins Drive in Randolph, Wisconsin. Additionally the Company leases 9,000 square feet of warehouse space in Cambria, Wisconsin for $1,600 per month and 3,000 square foot space in Fox Lake, Wisconsin for $800 per month on a month-to-month basis.
The Company’s GeneSeek Inc. subsidiary, which was acquired in fiscal year 2010, operates in 7,984 square feet of leased space in Lincoln, Nebraska. The lease extends through May 31, 2012 at a monthly rate of $10,900.
These properties are in good condition, well-maintained, and generally suitable and adequate to carry on the Company’s business.
| ITEM 3. | LEGAL PROCEEDINGS |
Neogen is subject to certain legal proceedings in the normal course of business that, in the opinion of management, will not have a material effect on its future results of operations or financial position.
| ITEM 4. | REMOVED AND RESERVED |
18
Table of Contents
| ITEM 5. | MARKET FOR REGISTRANT’S COMMON EQUITY, RELATED STOCKHOLDER MATTERS AND ISSUER PURCHASES OF EQUITY SECURITIES |
MARKET INFORMATION:
Neogen Common Stock is traded on the NASDAQ Global Select Market under the symbol “NEOG”. The following table sets forth, for the fiscal periods indicated, the high and low sales prices for the Common Stock as reported on the NASDAQ Stock Market.
| HIGH | LOW | |||||
| YEAR ENDED MAY 31, 2010 |
||||||
| First Quarter |
$ | 20.23 | $ | 14.56 | ||
| Second Quarter |
$ | 22.79 | $ | 18.96 | ||
| Third Quarter |
$ | 24.70 | $ | 20.51 | ||
| Fourth Quarter |
$ | 27.39 | $ | 23.50 | ||
| YEAR ENDED MAY 31, 2009 |
||||||
| First Quarter |
$ | 19.00 | $ | 14.80 | ||
| Second Quarter |
$ | 21.30 | $ | 12.73 | ||
| Third Quarter |
$ | 18.37 | $ | 13.11 | ||
| Fourth Quarter |
$ | 15.98 | $ | 11.00 | ||
HOLDERS:
As of July 31, 2010, there were approximately 369 stockholders of record of Common Stock that management believes represents a total of approximately 5,420 beneficial holders.
DIVIDENDS:
Neogen has never paid any cash dividends on its Common Stock and does not anticipate paying any cash dividends in the foreseeable future.
The following graph compares the cumulative 5-year total return to shareholders on Neogen Corporation’s common stock relative to the cumulative total returns of the NASDAQ Composite index and the NASDAQ Medical Equipment index. The graph assumes that the value of the investment in the company’s common stock and in each of the indexes (including reinvestment of dividends) was $100 on 5/31/2005 and tracks it through 5/31/2010.
19
Table of Contents
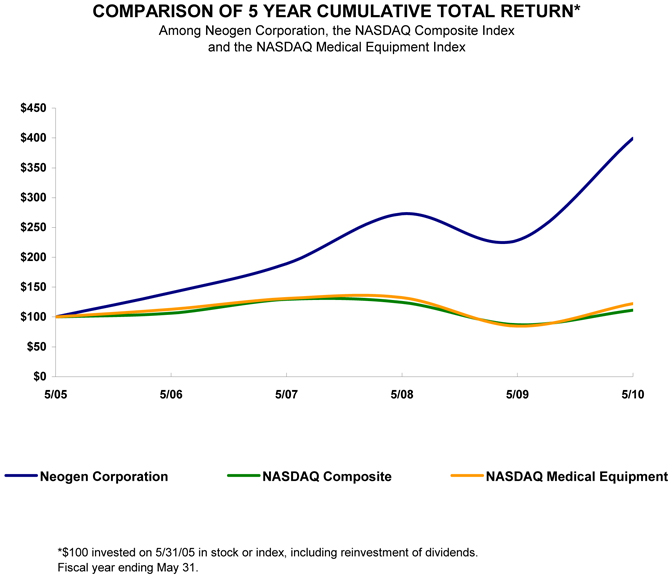
| 5/05 | 5/06 | 5/07 | 5/08 | 5/09 | 5/10 | |||||||||||||
| Neogen Corporation |
$ | 100.00 | $ | 140.88 | $ | 189.09 | $ | 272.86 | $ | 228.31 | $ | 399.50 | ||||||
| NASDAQ Composite |
100.00 | 106.43 | 129.36 | 124.31 | 87.50 | 111.25 | ||||||||||||
| NASDAQ Medical Equipment |
100.00 | 112.92 | 131.13 | 132.53 | 84.67 | 122.23 | ||||||||||||
The stock price performance included in this graph is not necessarily indicative of future stock price performance.
Issuer Purchases of Equity Securities
In December 2008 the Board of Directors authorized management to repurchase up to a total of 750,000 shares of its common stock in open market transactions. The company made no purchases of common stock in fiscal year 2010.
20
Table of Contents
| ITEM 6. | SELECTED FINANCIAL DATA |
The following tables set forth selected consolidated financial data of Neogen for each of the five fiscal years ended May 31, 2010. The selected consolidated financial data presented below have been derived from the Company’s consolidated financial statements. These financial data should be read in conjunction with the consolidated financial statements, related notes and other financial information appearing elsewhere in this Form 10-K.
| Year Ended May 31 | |||||||||||||||
| 2006(1)(2) | 2007(2) | 2008(2) | 2009(2) | 2010 | |||||||||||
| (In thousands, except per share data) | |||||||||||||||
| Income Statement Data: |
|||||||||||||||
| Food Safety Sales |
$ | 34,922 | $ | 47,165 | $ | 57,664 | $ | 61,025 | $ | 76,454 | |||||
| Animal Safety Sales |
37,511 | 38,973 | 44,754 | 57,696 | 64,055 | ||||||||||
| Net Sales |
72,433 | 86,138 | 102,418 | 118,721 | 140,509 | ||||||||||
| Cost of Goods Sold |
35,427 | 41,575 | 49,185 | 59,288 | 67,534 | ||||||||||
| Sales and Marketing |
15,799 | 18,463 | 20,648 | 22,906 | 26,350 | ||||||||||
| General and Administrative |
7,414 | 9,301 | 10,927 | 11,484 | 13,488 | ||||||||||
| Research and Development |
2,988 | 3,295 | 3,639 | 4,555 | 6,258 | ||||||||||
| Operating Income |
10,805 | 13,504 | 18,019 | 20,488 | 26,879 | ||||||||||
| Interest and Other Income |
46 | 371 | 479 | 1,136 | 442 | ||||||||||
| Income Before Income Taxes |
10,851 | 13,875 | 18,498 | 21,624 | 27,321 | ||||||||||
| Provision for Income Taxes |
3,822 | 4,750 | 6,400 | 7,750 | 9,800 | ||||||||||
| Net Income |
$ | 7,029 | $ | 9,125 | $ | 12,098 | $ | 13,874 | $ | 17,521 | |||||
| Net Income per Share (basic)(1) (2) |
$ | .38 | $ | .44 | $ | .56 | $ | .63 | $ | .78 | |||||
| Net Income per Share (diluted)(1)(2) |
$ | .37 | $ | .43 | $ | .54 | $ | .61 | $ | .76 | |||||
| Common Shares Outstanding (diluted)(1)(2) |
19,029 | 21,243 | 22,499 | 22,587 | 23,091 | ||||||||||
| May 31 | |||||||||||||||
| 2006 | 2007 | 2008 | 2009 | 2010 | |||||||||||
| (In thousands) | |||||||||||||||
| Balance Sheet Data: |
|||||||||||||||
| Cash and cash equivalents |
$ | 1,959 | $ | 13,424 | $ | 14,270 | $ | 13,842 | $ | 22,806 | |||||
| Working Capital(3) |
26,252 | 41,060 | 54,495 | 62,520 | 68,987 | ||||||||||
| Total Assets |
88,290 | 105,284 | 126,357 | 142,176 | 180,233 | ||||||||||
| Long-Term Debt |
9,955 | — | — | — | — | ||||||||||
| Stockholders’ Equity |
65,424 | 91,945 | 111,248 | 128,679 | 153,053 | ||||||||||
| (1) | On June 1, 2006 the Company adopted ASC 718 related to stock options. Financial statements of May 31, 2006 were restated to conform to the new standard. |
| (2) | On September 4, 2007, and on December 15, 2009 the Company paid 3-for-2 stock splits affected in the form of a dividend of its common stock. All share and per share amounts have been adjusted to reflect the stock splits as if they had taken place at the beginning of the period presented. |
| (3) | Defined as current assets less current liabilities. |
21
Table of Contents
| ITEM 7. | MANAGEMENT’S DISCUSSION AND ANALYSIS OF FINANCIAL CONDITION AND RESULTS OF OPERATIONS |
The information in this Management’s Discussion and Analysis of Financial Condition and Results of Operations contains both historical financial information and forward-looking statements. Neogen Corporation management does not provide forecasts of future financial performance. While management is optimistic about the Company’s long-term prospects, historical financial information may not be indicative of future financial results.
Any statements contained herein that are not statements of historical fact may be deemed to be forward-looking statements. Without limiting the foregoing, the words “believes,” “anticipates,” “plans,” “expects,” “seeks,” “estimates,” and similar expressions are intended to identify forward-looking statements. There are a number of important factors, including competition, recruitment and dependence on key employees, impact of weather on agriculture and food production, identification and integration of acquisitions, research and development risks, patent and trade secret protection, government regulation and other risks detailed from time to time in the Company’s reports on file at the Securities and Exchange Commission, that could cause Neogen Corporation’s results to differ materially from those indicated by such forward-looking statements, including those detailed in this “Management’s Discussion and Analysis of Financial Condition and Results of Operations.”
In addition, any forward-looking statements represent management’s views only as of the day this Report on Form 10-K was first filed with the Securities and Exchange Commission and should not be relied upon as representing management’s views as of any subsequent date. While management may elect to update forward-looking statements at some point in the future, it specifically disclaims any obligation to do so, even if its views change.
CRITICAL ACCOUNTING POLICIES AND ESTIMATES
The discussion and analysis of the Company’s financial condition and results of operations are based on the consolidated financial statements that have been prepared in accordance with accounting principles generally accepted in the United States. The preparation of these financial statements requires that management make estimates and judgments that affect the reported amounts of assets, liabilities, revenues and expenses, and related disclosure of contingent assets and liabilities. On an ongoing basis, management evaluates the estimates, including those related to receivable allowances, inventories and intangible assets. These estimates are based on historical experience and on various other assumptions that are believed to be reasonable under the circumstances, the results of which form the basis for making judgments about the carrying values of assets and liabilities that are not readily apparent from other sources. Actual results may differ from these estimates under different assumptions or conditions.
The following critical accounting policies reflect management’s more significant judgments and estimates used in the preparation of the consolidated financial statements.
Revenue Recognition
Revenue from sales of products is recognized at the time title of goods passes to the buyer and the buyer assumes the risks and rewards of ownership, which is generally at the time of shipment. Where right of return exists, allowances are made at the time of sale to reflect expected returns based on historical experience.
Accounts Receivable Allowance
Management attempts to minimize credit risk by reviewing customers’ credit history before extending credit and by monitoring credit exposure on a regular basis. An allowance for possible losses on accounts receivable is established based upon factors surrounding the credit risk of specific customers, historical trends and other information, such as changes in overall changes in customer credit and general credit conditions. Actual collections can differ from historical experience, and if economic or business conditions deteriorate significantly, adjustments to these reserves could be required.
22
Table of Contents
Inventory
A reserve for obsolescence is established based on an analysis of the inventory taking into account the current condition of the asset as well as other known facts and future plans. The amount of reserve required to record inventory at lower of cost or market may be adjusted as conditions change. Product obsolescence may be caused by shelf-life expiration, discontinuance of a product line, replacement products in the marketplace or other competitive situations.
Goodwill and Other Intangible Assets
Management assesses goodwill and other non-amortizable intangible assets for possible impairment on no less often than an annual basis. This test was performed in the fourth quarter of fiscal 2010 and it was determined that no impairment exists. There was also no impairment indicated for 2009 or 2008. In the event of changes in circumstances that indicate the carrying value of these assets may not be recoverable, management will make an assessment at any time. Factors that could cause an impairment review to take place would include:
| • | Significant under performance relative to expected historical or projected future operating results. |
| • | Significant changes in the use of acquired assets or strategy of the Company. |
| • | Significant negative industry or economic trends. |
When management determines that the carrying value of definite-lived intangible assets may not be recoverable based on the existence of one or more of the above indicators of impairment, the carrying value of the definitive-lived intangible assets are compared to their value determined by using undiscounted future cash flows. If the carrying amounts of these assets are greater than the amount of undiscounted future cash flows expected to be generated by the assets, such assets are reduced to their estimated fair value.
Equity Compensation Plans
ASC 718 - Compensation – Stock Compensation, (ASC 718) requires that stock options awarded to employees and shares of stock awarded to employees under certain stock purchase plans are recognized as compensation expense based on their fair value at grant date. The fair market value of options granted under the Company’s stock option plans was estimated on the date of grant using the Black-Scholes option-pricing model using assumptions for inputs such as interest rates, expected dividends, volatility measures and specific employee exercise behavior patterns based on statistical data. Some of the inputs used are not market-observable and have to be estimated or derived from available data. Use of different estimates would produce different option values, which in turn would result in higher or lower compensation expense recognized.
To value options, several recognized valuation models exist. None of these models can be singled out as being the best or most correct one. The model applied is able to handle some of the specific features included in the options granted, which is the reason for its use. If a different model were used, the option values would differ despite using the same inputs. Accordingly, using different assumptions coupled with using a different valuation model could have a significant impact on the fair value of employee stock options. Fair value could be either higher or lower than the ones produced by the model applied and the inputs used.
Business Combinations
Accounting for business combinations requires our management to make significant estimates and assumptions, especially at the acquisition date with respect to the valuation of intangible assets and the determination of the acquisition date fair value of liabilities arising from contingent consideration. Further, contingent consideration classified as an asset or a liability is remeasured to fair value at each reporting date until the contingency is resolved. Although we believe the assumptions and estimates we have made in the past have been reasonable and appropriate, they are based in part on historical experience and information obtained from the management of the acquired companies and are inherently uncertain.
23
Table of Contents
Examples of critical estimates in valuing certain of the intangible assets and contingent consideration liabilities we have acquired include but are not limited to:
| • | future expected cash flows from sales, other customer contracts and acquired developed technologies and patents; |
| • | the acquired company’s brand and competitive position, as well as assumptions about the period of time the acquired brand will continue to be used in the combined company’s product portfolio; and |
| • | discount rates. |
Unanticipated events and circumstances may occur that may affect the accuracy or validity of such assumptions, estimates or actual results.
24
Table of Contents
RESULTS OF OPERATIONS
Executive Overview
For the 2010 fiscal year the Company reported an 18% increase in revenues as compared to the prior fiscal year and a continuation of its record of profitability. Revenues for 2010 were $140,509,000, up from $118,721,000. Net income per share was $0.76 in 2010, compared to $0.61 in the prior year, adjusted for the stock split that took place in December 2009. Both revenues and net income for the 2010 year established new all-time highs. These results came in a very difficult business environment. The Company’s business has shown continued resilience to the economic conditions and despite the worldwide turmoil in economic and currency markets, the Company’s percentage of sales from customers outside the United States approached 40% of total revenues. Cash flow from operations for 2010 improved to $28 million, as the Company has implemented procedures and systems to better manage inventory and other current asset levels.
Neogen Europe recorded a 24% revenue gain, following a 26% gain in 2009. Two acquisitions were completed during the year that should be synergistic to the existing product offerings. The BioKits acquisition pushed the food allergen product line to another outstanding growth year with increasing sales by more than 50%. The GeneSeek acquisition made late in the fiscal year is expected to have a positive impact on future revenues as revenues of GeneSeek were approximately $12 million in the twelve months before purchase.
Consolidated gross margins increased 200 basis points in 2010 to 52% due to product mix and cost containment. Operating expenses as a percentage of revenues remained unchanged from 2009 at 33% but operating margins increased as a result of improved gross margins.
The Company’s financial performance continued to gain increased notice in the investment community in the past year. It continued its inclusion in the Russell 2000 Index and, was named to the Standard & Poor’s 600 Healthcare Index, Fortune’s “40 Stocks to Retire On”, Fortune’s Small Business 100, and to Forbes Magazine’s annual list of the 200 Best Small Companies in America, for the fifth consecutive year and eighth time in the last ten years.
25
Table of Contents
REVENUES
| Twelve Months Ended | |||||||||||||||
| (dollars in thousands) |
May 31, 2010 | Increase / (Decrease) |
May 31, 2009 | Increase / (Decrease) |
May 31, 2008 | ||||||||||
| Food Safety: |
|||||||||||||||
| Natural Toxins, Allergens & Drug Residues |
$ | 39,338 | 28 | % | $ | 30,667 | 6 | % | $ | 29,036 | |||||
| Bacterial & General Sanitation |
19,545 | 5 | % | 18,539 | 10 | % | 16,866 | ||||||||
| Dry Culture Media & Other |
17,571 | 49 | % | 11,819 | 1 | % | 11,762 | ||||||||
| 76,454 | 25 | % | 61,025 | 6 | % | 57,664 | |||||||||
| Animal Safety: |
|||||||||||||||
| Life Sciences & Other |
8,998 | 57 | % | 5,730 | 3 | % | 5,567 | ||||||||
| Vaccine |
2,329 | 6 | % | 2,207 | — | 2,197 | |||||||||
| Rodenticides & Disinfectants |
24,160 | 18 | % | 20,491 | 99 | % | 10,318 | ||||||||
| Veterinary Instruments & Other |
28,568 | (2 | %) | 29,268 | 10 | % | 26,672 | ||||||||
| 64,055 | 11 | % | 57,696 | 29 | % | 44,754 | |||||||||
| Total Revenues |
$ | 140,509 | 18 | % | $ | 118,721 | 16 | % | $ | 102,418 | |||||
Year Ended May 31, 2010 Compared to Year Ended May 31, 2009
The Company’s Food Safety segment recorded a broad-based 2010 revenue increase of 25% to $76,454,000. Organic sales growth for this segment was 22% in the year ended May 31, 2010.
The increase in Natural Toxins, Allergens & Drug Residues resulted from strong organic sales and the contributions of the BioKits food allergen product line that was acquired in December 2009. The allergen product line had another outstanding year of growth, with sales increasing by 57%. The dramatic increase in sales of each of Neogen’s allergen tests is attributable to the aforementioned acquisition and to food producers increasing efforts to ensure that inadvertent allergenic ingredients do not contaminate non-allergenic foods. Sales of Food Safety’s oldest product line, its rapid tests to detect natural toxins in grain, also saw significant improvement for the year, as tests for aflatoxin and deoxynivalenol (DON) improved by 40% compared to the prior year. Cool wet weather combined with an early frost experienced in the U.S. corn belt in 2009, led to sharp increases in demand for tests to detect these toxins. However, continued worldwide interest in toxin levels in human food and animal feed has positively affected sales. Dollar sales of tests to detect drug residues increased by 24% from the prior year, as worldwide concern continued to increase.
Bacterial & General Sanitation sales had a good year despite several products that requires the customer to make a capital investment, including AccuPoint™ readers and Soleris® microbial detection instruments. Sales of these products slowed in 2009 and in 2010 due to the impact of the economic downturn. However, sales of associated disposable AccuPoint samplers and Soleris vials continued strong growth—providing evidence of the continued use and acceptance of these unique Food Safety products.
Dry Culture Media & Other increased significantly during the year as a result of the continued efforts of the sales and marketing staff in executing their sales plan and in gaining and re-gaining new customers.
26
Table of Contents
Revenues from the Company’s Animal Safety segment grew 11% in 2010 compared to the prior year. The successful integration of the acquired DuPont line of disinfectants and cleaners, IDS drug residue diagnostics and GeneSeek, contributed significantly to Animal Safety’s revenue growth for the year. Organic growth was 4% in a very difficult overall market.
Life Sciences and Other sales increased by 57% in 2010, primarily due to the successful integration of the IDS product line acquired in May 2009 and the GeneSeek acquisition in April 2010. Organic sales increases of the Life Sciences & Other products were limited as customers were affected by the economic downturn.
Sales of Neogen’s veterinary biologics, which include an equine vaccine against botulism and immune stimulant products were up 6% for the year. Sales of vitamin injectibles into the livestock market were up 13% over the prior year. Evidence of the synergistic nature of the IDS diagnostic tests to pre-existing Neogen products was shown as we experienced an 18% increase in 2010 in same store sales of tests to detect drug residues for the forensic market.
Even though a number of the Animal Safety customers continue to feel the effects of a depressed animal protein market, this division did experience strong increases in sales of a number of products. Sales of rodenticides into domestic markets increased 27% on a year over year basis. Sales into international markets of the same products increased 25%, as Neogen continues to grow its market share and new products gain market acceptance. Sales of Neogen’s line of cleaners and disinfectants also grew 10% in the year. The Company’s efforts to market its products as synergistic biosecurity solutions are gaining more traction.
Veterinary instrument and other sales decreased by 2% in 2010 in comparison with 2009 as many of these products are ultimately used by customers involved in the production of animal protein. This group of customers has been especially hit hard by the economic recession.
Year Ended May 31, 2009 Compared to Year Ended May 31, 2008
In 2009, sales of Natural Toxins, Allergens & Drug Residues increased by 6% in comparison with FY 2008. Increases from allergen product lines were in excess of 40% and were the result of increased efforts by food producers to ensure that inadvertent allergenic ingredients do not contaminate non-allergen foods. Bacterial & General Sanitation products increased by 10% in FY 2009, as the AccuPoint ATP general sanitation test continued to gain momentum, domestically and internationally.
Dry Culture Media & Other Sales increased by 1% in FY 2009 as compared with FY 2008, as the Company focused their efforts on customer service following a large increase in the prior year.
Within the Animal Safety segment, sales of Life Sciences and Other Products increased by 3% in 2009 in comparison with 2008. Increases in 2009 were due to new direct international customers nd instrument placements for forensic customers, sales of substrates and diagnostic research kits. Many of products in this category are sold into the worldwide eventing animal industry. These customers have been highly effected by the economic downturn. Vaccine sales remained unchanged for the year due to the timing of purchases by key domestic and international distributor purchasers.
Sales of Hacco rodenticides and disinfectants increased by 99% in 2009, primarily based on the successful acquisition and integration of the DuPont product lines.
Veterinary Instruments & Other sales increases were broad based in 2009 and included significant contributions in the disposables product lines, experiencing large increases in the retail and integrator markets.
27
Table of Contents
COST OF GOODS SOLD
| (dollars in thousands) |
2010 | Increase | 2009 | Increase | 2008 | ||||||||||
| Cost of Goods Sold |
$ | 67,534 | 14 | % | $ | 59,288 | 21 | % | $ | 49,185 | |||||
Cost of goods sold increased by 14% in 2010 and by 21% in 2009 in comparison with the prior year. This compares against a 18% and 16% increase in revenues in 2010 and in 2009. Expressed as a percentage of revenues, cost of goods sold was 48%, 50% and 48% in 2010, 2009, and 2008 respectively. 2010 margins increased as a result of favorable product mix and cost containment.
Food Safety gross margins were 64%, 63% and 63% in 2010, 2009 and 2008, respectively. Changes in margins between periods relate primarily to changes in product mix. Margins improved from 2009 from the effects of efficiencies resulting from investments in manufacturing facilities and equipment.
Animal Safety gross margins were 38%, 37% and 38% in 2010, 2009 and 2008, respectively. Changes in margins between periods relate primarily to product mix.
OPERATING EXPENSES
| (dollars in thousands) |
2010 | Increase | 2009 | Increase | 2008 | ||||||||||
| Sales and Marketing |
$ | 26,350 | 15 | % | $ | 22,906 | 11 | % | $ | 20,648 | |||||
| General and Administrative |
13,488 | 17 | % | 11,484 | 5 | % | 10,927 | ||||||||
| Research and Development |
6,258 | 37 | % | 4,555 | 25 | % | 3,639 | ||||||||
Sales and marketing expense categories increased by 15% in 2010 and by 11% in 2009 as compared with the prior year. As a percentage of sales, sales and marketing expense remained at 19% in 2010 as compared to 19% in 2009 and 20% in 2008. Management plans to continue to expand the Company’s sales and marketing efforts both domestically and internationally and currently expects related expenses to remain approximately 20% as expressed as a percentage of sales.
General and administrative expenses increased by 17% in 2010 and by 5% in 2009. These expenses have decreased from 11% to 10%, as a percentage of sales, over the past three fiscal years. Dollar increases in 2010 and 2009 resulted primarily from the acquisitions as well as due to increased levels of operations and added amortization related to businesses acquired. Percent decreases resulted from the fixed nature of many of these expenses.
Research and development expenses increased by 37% in 2010 and 25% in 2009 in comparison with 2009 and 2008. As a percentage of revenue these expenses were 4% in each of the years ended May 31, 2010, 2009 and 2008, respectively. Although some fluctuation in research and development expenses will occur, management expects research and development expenses to approximate 4-6% of revenues over time. These expenses approximate 8% to 10% of revenues from products and product lines that are supported by research and development. Certain Company products require relatively less investment in research and development expenses.
28
Table of Contents
OPERATING INCOME
| (dollars in thousands) |
2010 | Increase | 2009 | Increase | 2008 | ||||||||||
| Operating Income |
$ | 26,879 | 31 | % | $ | 20,488 | 14 | % | $ | 18,019 | |||||
During fiscal year 2010 and 2009, the Company’s operating income increased by 31% and 14% as compared to the respective prior year. As a percentage of revenues it was 19%, 17% and 18% in 2010, 2009 and 2008 respectively. The Company has been successful in improving its operating income in 2010 and 2009 from revenue and gross margin growth from existing products and acquisitions and from control of distribution and administrative costs.
OTHER INCOME (NET)
| (dollars in thousands) |
2010 | (Decrease) | 2009 | Increase | 2008 | ||||||||||
| Other Income—Interest and Other (Net) |
$ | 442 | (61 | %) | $ | 1,136 | 137 | % | $ | 479 | |||||
Other income decreased by 61% in comparison with 2009 and increased by 137% in 2009 in comparison with 2008. Interest income is a result of the Company’s increase in cash and cash equivalent cash position in the periods offset by decreased interest rates. The company follows a very conservative investment philosophy that in the current market results in rates of less than 1%. Investment earnings were $81,000 in 2010, $258,000 in fiscal 2009 and $442,000 in 2008. In 2010 and in 2009 other income also included $181,000 and $429,000 in royalty income and $80,000 in 2010 and $355,000 in 2009 of gains from foreign currency transactions. In general no such other income was earned in 2008.
FEDERAL AND STATE INCOME TAXES
| (dollars in thousands) |
2010 | Increase | 2009 | Increase | 2008 | ||||||||||
| Federal and State Income Taxes |
$ | 9,800 | 26 | % | $ | 7,750 | 21 | % | $ | 6,400 | |||||
Expressed as a percentage of income before tax, the tax provision was 36% in 2010, 36% in 2009 and 35% in 2008. Fluctuations in the tax rate is the result from an increase of the Company’s federal tax rate to 35%, the localities where income is earned in any year and tax credits. Other than rate, the increase in the tax provision is primarily a function of the increase in pre-tax income of the Company.
NET INCOME AND NET INCOME PER SHARE
| (dollars in thousands-except per share data) |
2010 | Increase | 2009 | Increase | 2008 | ||||||||||
| Net Income |
$ | 17,521 | 26 | % | $ | 13,874 | 15 | % | $ | 12,098 | |||||
| Net Income Per Share-Basic |
$ | .78 | $ | .63 | $ | .56 | |||||||||
| Net Income Per Share-Diluted |
$ | .76 | $ | .61 | $ | .54 | |||||||||
Net income and net income per share increased by 26% in 2010 and 15% in 2009 in comparison with the prior years. As a percentage of revenue, net income was 12%, in each year. All of the above factors contributed to the increase in net income.
29
Table of Contents
FUTURE OPERATING RESULTS
Neogen Corporation’s future operating results involve a number of risks and uncertainties. Actual events or results may differ materially from those discussed in this report. Factors that could cause or contribute to such differences include, but are not limited to, the factors discussed below as well as those discussed elsewhere in this report. Management’s ability to grow the business in the future depends upon its ability to successfully implement various strategies, including:
| • | developing, manufacturing and marketing new products with new features and capabilities; |
| • | expanding the Company’s markets by fostering increased use of Company products by customers; |
| • | maintaining gross and net operating margins in changing cost environments; |
| • | strengthening sales and marketing activities in geographies outside of the U.S.; |
| • | developing and implementing new technology development strategies; and |
| • | identifying and completing acquisitions that enhance existing businesses or create new business areas. |
FINANCIAL CONDITION AND LIQUIDITY
On May 31, 2010, the Company had $22,806,000 in cash and cash equivalents, working capital of $68,987,000 and stockholders’ equity of $153,053,000. In addition to cash and cash equivalents, a bank line with unused borrowings of $10,000,000 was available to support ongoing operations or to make acquisitions.
Cash and cash equivalents increased $8,964,000 during 2010. Cash provided from operations was $27,988,000 and stock option exercise proceeds provided an additional $5,900,000 of cash. Additions to property and equipment and other non-current assets used cash of $5,431,000.
Accounts receivable increased $4,070,000 or 17% when compared to May 31, 2009. This resulted from increased sales, as a result of organic sales growth and acquisitions offset by some decrease of average days outstanding. These accounts are being actively managed and no losses thereon in excess of amounts reserved are currently expected. Days sales outstanding decreased from 60 days at May 31, 2009 to 59 days at May 31, 2010.
Inventory levels decreased by less than 1% or $47,000 in 2010 as compared to 2009. Despite higher levels of sales and acquisitions, management was able to maintain a program to decrease inventory on hand while supplying the customers with shipments within 48 hours of placing an order. The Company continued programs aimed at reducing inventory and expects to continue those programs into the future.
The Company has no construction in progress and facilities are generally believed to be adequate to support existing operations in the short run.
Neogen has been profitable from operations for its last 69 quarters and has generated positive cash flow from operations during the period. However, the Company’s current funds may not be sufficient to meet the Company’s cash requirements to commercialize products currently under development or its plans to acquire additional technology and products that fit within the Company’s mission statement. Accordingly, the Company may be required to or may choose to issue equity securities or enter into other financing arrangements for a portion of the Company’s future capital needs.
The Company is subject to certain legal and other proceedings in the normal course of business that, in the opinion of management, will not have a material effect on its results of operations or financial position.
30
Table of Contents
CONTRACTUAL OBLIGATIONS
The Company has the following contractual obligations due by period:
| (in thousands) |
Total | Less than one year |
1-3 years | 3-5 years | More than 5 years | ||||||||||
| Long-Term Debt |
$ | — | $ | — | $ | — | $ | — | $ | — | |||||
| Operating Leases |
665,000 | 313,000 | 352,000 | — | — | ||||||||||
| Unconditional Purchase Obligations |
13,850,000 | 13,850,000 | — | — | — | ||||||||||
| $ | 14,515,000 | $ | 14,163,000 | $ | 352,000 | $ | — | $ | — | ||||||
NEW ACCOUNTING PRONOUNCEMENTS
See discussion of any New Accounting Pronouncements in Note 1 to Consolidated Financial Statements.
| ITEM 7A. | QUANTITATIVE AND QUALITATIVE DISCLOSURES ABOUT MARKET RISKS |
The Company has moderate interest rate and foreign exchange rate risk exposure and no long-term fixed rate investments or borrowings. The Company’s primary interest rate risk is due to potential fluctuations of interest rates for variable rate borrowings.
Because Neogen markets and sells its products throughout the world, it could be affected by weak economic conditions in foreign markets that could reduce the demand for its products. Sales in certain foreign countries as well as certain expenses related to those sales are transacted in currencies other than the U.S. dollar. The Company’s operating results are primarily exposed to changes in exchange rates between the U.S. dollar and the British Pound and Euro. When the U.S. dollar weakens against foreign currencies, the dollar value of sales denominated in foreign currencies increases. When the U.S. dollar strengthens, the opposite situation occurs.
Neogen has assets, liabilities and operations outside of the United States that are located primarily in Ayr, Scotland where the functional currency is the British Pound Sterling. To a lesser extent it also has assets, liabilities and operations in Mexico where the functional currency is the Mexican Peso and in Brazil where the functional currency is the Real. The Company’s investment in its foreign subsidiaries are considered long-term; accordingly, it does not hedge the net investment nor does it generally engage in other foreign currency hedging activities due to the insignificance of these balances to the Company as a whole. It does however use strategies to reduce current exposure to currency fluctuations.
| ITEM 8. | FINANCIAL STATEMENTS AND SUPPLEMENTAL DATA |
The response to this item is submitted in a separate section of this report.
| ITEM 9. | CHANGES IN AND DISAGREEMENTS WITH ACCOUNTANTS ON ACCOUNTING AND FINANCIAL DISCLOSURE |
There were no disagreements or reportable events with Ernst &Young LLP.
| ITEM 9A. | CONTROLS AND PROCEDURES |
Evaluation of Disclosure Controls and Procedures
An evaluation was performed under the supervision and with the participation of the Company’s management, including the Chief Executive Officer and Chief Financial Officer, of the effectiveness of the design and operation of the Company’s disclosure controls and procedure (as defined in Rule 13-a-15 (e) under the Securities Exchange Act of 1934) as of May 31, 2010. Based on and as of the time of such evaluation, the Company’s Management, including the Chief Executive Officer and Chief Financial Officer, concluded that the Company’s disclosure controls and procedures were effective as of the end of the period covered by this report to ensure that information required to be disclosed in the reports that are filed or submitted under the Exchange Act are recorded, processed, summarized and reported within the time periods specified in the Securities and Exchange Commission’s rules and forms and to ensure the information required to be disclosed
31
Table of Contents
in the reports that are filed or submitted under the Exchange Act are accumulated and communicated to management, including our Chief Executive Officer and our Chief Financial Officer to allow timely decisions regarding required disclosure.
Management’s Report on Internal Control Over Financial Reporting
Management is responsible for establishing and maintaining adequate internal control over financial reporting, as such term is defined in Exchange Act Rues 13-a-15(f) and 15d-15(f). Under the supervision and with the participation of the company’s management, including the Chief Executive Officer and Chief Financial Officer, an evaluation was conducted as to the effectiveness of internal control over financial reporting as of May 31, 2010, based on the framework in Internal Control – Integrated Framework issued by the Committee of Sponsoring Organizations of the Treadway Commission. Based on that evaluation, management concluded that internal control over financial reporting was effective as of May 31, 2010. The effectiveness of internal control over financial reporting as of May 31, 2010, has been audited by Ernst & Young, LLP, an independent registered public accounting firm, as stated in its attestation report, which is included in Item 8 and is incorporated into this Item 9A by reference.
Our assessment of and conclusion on the effectiveness of internal control over financial reporting did not include the internal controls of GeneSeek, Inc., which are included in the consolidated financial statements of Neogen Corporation and Subsidiaries and constituted 11% and 10% of total assets and net assets, as of May 31, 2010 and 1% and 4% of revenues and net income respectively, for the year then ended.
Changes in Internal Control over Financial Reporting.
Except for the acquisition of GeneSeek, Inc., no changes in internal control over financial reporting were indentified as having occurred during the quarter ended May 31, 2010 that have materially affected, or are reasonably likely to materially affect, internal control financial reporting.
32
Table of Contents
Report of Independent Registered Public Accounting Firm
The Board of Directors and Shareholders of Neogen Corporation
We have audited Neogen Corporation and subsidiaries’ internal control over financial reporting as of May 31, 2010, based on criteria established in Internal Control—Integrated Framework issued by the Committee of Sponsoring Organizations of the Treadway Commission (the COSO criteria). Neogen Corporation and subsidiaries’ management is responsible for maintaining effective internal control over financial reporting, and for its assessment of the effectiveness of internal control over financial reporting included in the accompanying “Management’s Report on Internal Control Over Financial Reporting”. Our responsibility is to express an opinion on the company’s internal control over financial reporting based on our audit.
We conducted our audit in accordance with the standards of the Public Company Accounting Oversight Board (United States). Those standards require that we plan and perform the audit to obtain reasonable assurance about whether effective internal control over financial reporting was maintained in all material respects. Our audit included obtaining an understanding of internal control over financial reporting, assessing the risk that a material weakness exists, testing and evaluating the design and operating effectiveness of internal control based on the assessed risk, and performing such other procedures as we considered necessary in the circumstances. We believe that our audit provides a reasonable basis for our opinion.
A company’s internal control over financial reporting is a process designed to provide reasonable assurance regarding the reliability of financial reporting and the preparation of financial statements for external purposes in accordance with generally accepted accounting principles. A company’s internal control over financial reporting includes those policies and procedures that (1) pertain to the maintenance of records that, in reasonable detail, accurately and fairly reflect the transactions and dispositions of the assets of the company; (2) provide reasonable assurance that transactions are recorded as necessary to permit preparation of financial statements in accordance with generally accepted accounting principles, and that receipts and expenditures of the company are being made only in accordance with authorizations of management and directors of the company; and (3) provide reasonable assurance regarding prevention or timely detection of unauthorized acquisition, use, or disposition of the company’s assets that could have a material effect on the financial statements.
Because of its inherent limitations, internal control over financial reporting may not prevent or detect misstatements. Also, projections of any evaluation of effectiveness to future periods are subject to the risk that controls may become inadequate because of changes in conditions, or that the degree of compliance with the policies or procedures may deteriorate.
As indicated in the accompanying Management’s Report on Internal Control over Financial Reporting, management’s assessment of and conclusion on the effectiveness of internal control over financial reporting did not include the internal controls of GeneSeek, Inc, which is included in the consolidated financial statements of Neogen Corporation and subsidiaries and constituted 11% and 10% of total and net assets, respectively, as of May 31, 2010 and 1% and 4% of revenues and net income, respectively, for the year then ended. Our audit of internal control over financial reporting of Neogen Corporation and subsidiaries also did not include an evaluation of the internal control over financial reporting of GeneSeek, Inc.
In our opinion, Neogen Corporation and subsidiaries maintained, in all material respects, effective internal control over financial reporting as of May 31, 2010, based on the COSO criteria.
We also have audited, in accordance with the standards of the Public Company Accounting Oversight Board (United States), the consolidated balance sheets of Neogen Corporation and subsidiaries as of May 31, 2010 and 2009, and the related consolidated statements of income, equity, and cash flows for each of the three years in the period ended May 31, 2010, and our report dated August 16, 2010 expressed an unqualified opinion thereon.
/s/ Ernst & Young LLP
Grand Rapids Michigan
August 16, 2010
33
Table of Contents
| ITEM 9B. | OTHER INFORMATION – NONE |
| ITEM 10. | DIRECTORS AND EXECUTIVE OFFICERS OF THE REGISTRANT AND CORPORATE GOVERNANCE |
Information regarding the Company and certain corporate governance matters appearing under the captions “Election of Directors”, “Audit Committee”, and “Miscellaneous-Section 16(a) Beneficial Ownership Reporting Compliance” in the 2010 proxy statement is included herein by reference.
The Company has adopted a Code of Conduct that applies to all of its directors, officers and employees. The Company has made a copy of this Code of Conduct available on its Website at http://www.neogen.com/pdf/Code_of_Conduct.pdf.
OFFICERS AND OTHER KEY INDIVIDUALS OF THE REGISTRANT
The officers of Neogen are elected by and serve at the discretion of the Board of Directors. The names and occupations of the Company’s officers are set forth below.
| Name |
Position with the Company |
Year Joined the Company | ||
| Lon M. Bohannon | President & Chief Operating Officer, Director |
1985 | ||
| Edward L. Bradley |
Vice President, Food Safety | 1995 | ||
| Richard R. Current |
Vice President & Chief Financial Officer and Secretary | 1999 | ||
| James L. Herbert |
Chairman of the Board & Chief Executive Officer | 1982 | ||
| Kenneth V. Kodilla |
Vice President, Manufacturing | 2003 | ||
| Joseph M. Madden, Ph.D. |
Vice President, Scientific Affairs | 1997 | ||
| Anthony E. Maltese |
Vice President, Corporate Development | 1999 | ||
| Terri A. Morrical |
Vice President, Animal Safety | 1992 | ||
| Mark A. Mozola, Ph.D. |
Vice President, Research & Development | 2001 |
There are no family relationships among officers. Information concerning the executive officers of Neogen follows:
Lon M. Bohannon, age 57, joined the Company in October 1985 as Vice President of Finance, was promoted to Chief Financial Officer in June 1987, was promoted to Vice President Administration and Chief Financial Officer in November 1994, was elected to the Board of Directors in October 1996, and was named Chief Operating Officer in September 1999. Mr. Bohannon was named President & Chief Operating Officer in June 2006. He is responsible for all Company operations except research, Neogen Europe and corporate development. A CPA, he was Administrative Controller for Federal Forge, Inc., a metal forging and stamping firm, from March 1980 until October 1985, and was associated with the public accounting firm of Ernst & Young LLP from June 1975 to March 1980.
Edward L. Bradley, age 50, joined Neogen in February 1995 as Vice President of Sales and Marketing for AMPCOR Diagnostics, Inc. In June 1996, he was made a Vice President of Neogen Corporation. In June 2006, Mr. Bradley was named Vice President Food Safety. From 1988 to 1995, Mr. Bradley served in several sales and marketing capacities for Mallinckrodt Animal Health, including the position of National Sales Manager responsible for 40 employees in its Food Animal Products Division. Prior to joining Mallinckrodt, he held several sales and marketing positions for Stauffer Chemical Company.
Richard R. Current, age 66, joined the Company in November 1999 as Vice President & Chief Financial Officer. In 2007 he was appointed as Secretary of the Company. Prior to joining Neogen, Mr. Current served as Executive Vice President and Chief Financial Officer of Integral Vision, Inc. from 1994 to 1999 and as Vice President and Chief Financial Officer of the Shane Group, Inc., a privately held company from 1991 to 1994. Mr. Current was associated with the public accounting firm of Ernst & Young LLP for 24 years and served as Managing Partner of the Lansing, Michigan office from 1986 to 1991.
34
Table of Contents
James L. Herbert, age 70, has been Chief Executive Officer and a director of the Company since he joined Neogen in June 1982. He served as President from June 1982 through June 2006. From 1999 to 2001 he was Chairman of the Company’s Board; and was again named Chairman in June 2006. He previously held the position of Corporate Vice President of DeKalb Ag Research, a major agricultural genetics and energy company. He has management experience in animal biologics, specialized chemical research, medical instruments, aquaculture, animal nutrition, and poultry and livestock breeding and production.
Kenneth V. Kodilla, age 53, joined the Company in November 2003 as Vice President of Manufacturing. He has responsibility for all manufacturing, inventory management, shipping and quality system operations for the Company’s Food Safety Division in Lansing, Michigan. Prior to Neogen, Mr. Kodilla served as plant manager for Facet Technologies in Atlanta, Georgia from 2001, as Manufacturing Manager for Becton Dickinson and Difco Laboratories from 1988, and as Quality Manager for Lee Laboratories from 1984. Mr. Kodilla’s manufacturing and regulatory experience includes FDA/ISO regulated Class and diagnostic reagents and devices, high volume automated assembly and packaging, materials management and plant operations.
Dr. Joseph M. Madden, age 61, joined Neogen in December 1997 as Vice President of Scientific Affairs after retiring from the Food and Drug Administration as its Microbiology Strategic Manager. He joined the FDA in 1978 and spent his first 10 years as a research microbiologist for the agency. Dr. Madden has served on numerous committees on food safety, including his current appointment to the National Advisory Committee on Microbiological Criteria for Foods. He is regarded by regulatory agencies and the food industry as being one of the nation’s top experts on both scientific and regulatory issues relating to food safety.
Anthony E. Maltese, age 67, joined Neogen on June 1, 1999 as Manager of Corporate Development. He was promoted to Vice President in October 2000. Prior to joining Neogen, Mr. Maltese served as Vice President of Business Development for Creatogen Biosciences, GmbH of Angsburg, Germany. From 1990 to 1998, he worked in production and special project management positions for REMEL, Inc. including Manager of Business Development. Prior to REMEL, Mr. Maltese spent 20 years at Difco Laboratories, where he served in several management positions in the areas of purchasing, technical sales support, production and research.
Terri A. Morrical, age 45, joined Neogen Corporation on September 1, 1992 as part of the Company’s acquisition of WTT, Incorporated. In June 2006, Ms. Morrical was named Vice President, Animal Safety. From 1986 to 1991, she was Controller for Freeze Point Cold Storage Systems and concurrently served in the same capacity for Powercore, Inc. In 1990, she joined WTT, Incorporated as VP/CFO and then became President, the position she held at the time Neogen acquired the business.
Dr. Mark A. Mozola, age 54, became Neogen’s Vice President of Research and Development in 2001 following the Company’s acquisition of GENE-TRAK Systems. He served in various technical and managerial positions at GENE-TRAK Systems for 16 years, most recently as General Manager. He has also served as a Laboratory Director for Silliker Laboratories. Dr. Mozola’s particular technical expertise is in the area of development of modern, rapid methods for the detection of foodborne pathogens.
The Board of Directors has also named a Scientific Review Council to serve at the pleasure of the Board. The Scientific Review Council meets several times annually to review the research progress of the Company and to recommend or approve new research and product development activities of the Company.
35
Table of Contents
| ITEM 11. | EXECUTIVE COMPENSATION |
The information required by this Item is incorporated by reference to Neogen’s Proxy Statement to be filed within 120 days of May 31, 2010.
| ITEM 12. | SECURITY OWNERSHIP OF CERTAIN BENEFICIAL OWNERS, MANAGEMENT AND RELATED STOCKHOLDER MATTERS |
The information required by this Item is incorporated by reference to Neogen’s Proxy Statement to be filed within 120 days of May 31, 2010.
| ITEM 13. | CERTAIN RELATIONSHIPS, RELATED TRANSACTIONS AND DIRECTOR INDEPENDENCE |
Jack C. Parnell, a Director of the Company, is a governmental relations advisor to the law firm of Kahn, Soares & Conway. Kahn, Soares & Conway an arrangement with Neogen to represent it in governmental relations matters. The Company pays Kahn, Soares & Conway a monthly fee of $750 for up to ten hours of consulting. The arrangement with Kahn, Soares & Conway is terminable by either party at the end of any month with 30 days notice.
| ITEM 14. | PRINCIPAL ACCOUNTANT FEES AND SERVICES |
The information required by this item is incorporated by reference to Neogen’s proxy statement to be filed within 120 days of May 31, 2010.
36
Table of Contents
| ITEM 15. | EXHIBITS, FINANCIAL STATEMENT SCHEDULES |
(a) (1) and (2) and (c). The response to this portion of ITEM 15 is submitted as a separate section of this report.
(a) (3). The Exhibits listed on the accompanying Exhibits Index, which immediately follows the signature page, is incorporated herein by reference.
37
Table of Contents
Pursuant to the requirements of Section 13 or 15(d) of the Securities Exchange Act of 1934, the Registrant has duly caused this Report to be signed on its behalf by the undersigned, thereunto duly authorized.
| NEOGEN CORPORATION | ||||
| /s/ James L. Herbert | /s/ Richard R. Current | |||
| James L. Herbert, Chairman & | Richard R. Current, Vice President & | |||
| Chief Executive Officer | Chief Financial Officer | |||
| (Principal Executive Officer) | (Principal Accounting Officer) | |||
Dated: August 16, 2010
Pursuant to the requirements of the Securities Exchange Act of 1934, this Report has been signed below by the following persons on behalf of the Registrant and in the capacities and on the dates indicated.
| Signature |
Title |
Date | ||||
| /s/ James L. Herbert James L. Herbert |
Chairman of the Board of Directors & Chief Executive Officer, (Principal Executive Officer) | August 16, 2010 | ||||
| /s/ Lon M. Bohannon Lon M. Bohannon |
President & Chief Operating Officer | August 16, 2010 | ||||
| * Robert M. Book |
Director | |||||
| * A. Charles Fischer |
Director | |||||
| * Richard T. Crowder |
Director | |||||
| * G. Bruce Papesh |
Director | |||||
| * Jack C. Parnell |
Director | |||||
| * Thomas H. Reed |
Director | |||||
| * Clayton K. Yeutter, Ph.D. |
Director | |||||
| *By: |
/s/ James L. Herbert |
August 16, 2010 | ||||
| James L. Herbert, Attorney-in-fact |
38
Table of Contents
Neogen Corporation
Annual Report on Form 10-K
Year Ended May 31, 2010
EXHIBIT INDEX
| EXHIBIT NO. |
DESCRIPTION | |
| 4.1 | Articles of Incorporation, as restated (Incorporated by reference to Exhibit 3.1 to the Registrant’s Quarterly Report on Form 10-Q dated February 29, 2000). | |
| 4.2 | By-Laws, as amended (Incorporated by reference to Exhibit 3.2 to the Registrant’s Quarterly Report on Form 10-Q dated February 29, 2000). | |
| 10.5 | Neogen Corporation 2002 Employee Stock Purchase Plan Agreement (Incorporated by reference to Exhibit 99.1 to the Registrant’s Registration Statement on Form S-8 (No. 333-101638) filed December 4, 2002). | |
| 10.6 | Neogen Corporation 401(k) Retirement Savings Plan Agreement (Incorporated by reference to Exhibit 99.1 to the Registrant’s Registration Statement on Form S-8 (No. 333-101639) filed December 4, 2002). | |
| 10.7 | Neogen Corporation 1997 Stock Option Plan, as amended (Incorporated by reference to Exhibit 4.3 to the Registrant’s Registration Statement on Form S-8 (No. 333-122110) filed January 18, 2005). | |
| 10.9 | Neogen Corporation 2007 Stock Option Plan, (Incorporated by reference to Exhibit 4.3 to the Registrant’s Registration Statement on Form S-8 (No. 333-148283) filed December 21, 2007). | |
| 10.10 | Asset purchase agreement between Registrant and Kane Enterprises dated August 24, 2007 (Incorporated by reference to Exhibit 10.9 to the Registrants Current Report on Form 8-K dated August 29, 2007). | |
| 10.11
10.12
10.13 |
Line of Credit Note between Registrant and JP Morgan Chase NA Dated May 20, 2010.
Credit Agreement between Registrant and JP Morgan Chase NA Dated May 20, 2010.
Stock Purchase Agreement between Registrant and the Stockholders of GeneSeek, Inc. Dated April 1, 2010; and amendment thereto dated June 28, 2010 | |
| 21 | Subsidiaries of the Registrant | |
| 23(a) | Consent of Independent Registered Public Accounting Firm Ernst & Young LLP. | |
| 24.2 | Power of Attorney. | |
| 31.1 | Section 302 Certification of Principal Executive Officer. | |
| 31.2 | Section 302 Certification of Principal Financial Officer. | |
| 32 | Certification Pursuant to 18 U.S.C Section 1350, as Adopted Pursuant to Section 906 of the Sarbanes-Oxley Act of 2002. | |
39
Table of Contents
ANNUAL REPORT ON FORM 10-K
ITEM 15 (a)(1)(2) (3) (a) and (c)
LIST OF FINANCIAL STATEMENTS, EXHIBITS AND FINANCIAL STATEMENT SCHEDULES
YEAR ENDED MAY 31, 2010
NEOGEN CORPORATION
LANSING, MICHIGAN
FORM 10-K—ITEM 15(a)(1) AND (2)
LIST OF FINANCIAL STATEMENTS AND FINANCIAL STATEMENT SCHEDULES
The following consolidated financial statements of Neogen Corporation and subsidiaries are included in ITEM 8:
Report of Independent Registered Public Accounting Firm on Financial Statements
Consolidated Balance Sheets—May 31, 2010 and 2009
Consolidated Statements of Income—Years ended May 31, 2010, 2009 and 2008
Consolidated Statements of Stockholders’ Equity—Years ended May 31, 2010, 2009 and 2008
Consolidated Statements of Cash Flows—Years ended May 31, 2010, 2009 and 2008
Notes to Consolidated Financial Statements
Schedules for which provision is made in the applicable accounting regulation of the United States Securities and Exchange Commission are not required under the related instructions or are inapplicable and, therefore, have been omitted.
FORM 10-K – Item 15 (a) (3)
A list of Exhibits required to be filed as a part of this report is set forth in the Exhibit Index, which immediately follows the signature page, and is incorporated herein by reference.
40
Table of Contents
Report of Independent Registered Public Accounting Firm
The Board of Directors and Stockholders of Neogen Corporation
We have audited the accompanying consolidated balance sheets of Neogen Corporation and subsidiaries (the Company) as of May 31, 2010 and 2009, and the related consolidated statements of income, equity, and cash flows for each of the three years in the period ended May 31, 2010. These financial statements are the responsibility of the Company’s management. Our responsibility is to express an opinion on these financial statements based on our audits.
We conducted our audits in accordance with the standards of the Public Company Accounting Oversight Board (United States). Those standards require that we plan and perform the audit to obtain reasonable assurance about whether the financial statements are free of material misstatement. An audit includes examining, on a test basis, evidence supporting the amounts and disclosures in the financial statements. An audit also includes assessing the accounting principles used and significant estimates made by management, as well as evaluating the overall financial statement presentation. We believe that our audits provide a reasonable basis for our opinion.
In our opinion, the financial statements referred to above present fairly, in all material respects, the consolidated financial position of Neogen Corporation and subsidiaries at May 31, 2010 and 2009, and the consolidated results of their operations and their cash flows for each of the three years in the period ended May 31, 2010, in conformity with U.S. generally accepted accounting principles.
We also have audited, in accordance with the standards of the Public Company Accounting Oversight Board (United States), the effectiveness of Neogen Corporation and subsidiaries’ internal control over financial reporting as of May 31, 2010, based on criteria established in Internal Control-Integrated Framework issued by the Committee of Sponsoring Organizations of the Treadway Commission and our report dated August 16, 2010 expressed an unqualified opinion thereon.
/s/ Ernst & Young LLP
Grand Rapids Michigan
August 16, 2010
Table of Contents
Neogen Corporation and Subsidiaries
Consolidated Balance Sheets – Assets
(Dollars in thousands)
| May 31, | ||||||
| 2010 | 2009 | |||||
| Assets |
||||||
| Current Assets |
||||||
| Cash and cash equivalents |
$ | 22,806 | $ | 13,842 | ||
| Accounts receivable, less allowance of $600 at May 31, 2010 and 2009 |
27,433 | 23,363 | ||||
| Inventories |
31,316 | 31,363 | ||||
| Deferred income taxes |
774 | 200 | ||||
| Prepaid expenses and other current assets |
3,691 | 2,998 | ||||
| Total Current Assets |
86,020 | 71,766 | ||||
| Property and Equipment |
||||||
| Land and improvements |
1,181 | 1,175 | ||||
| Buildings and improvements |
13,330 | 11,184 | ||||
| Machinery and equipment |
19,474 | 17,008 | ||||
| Furniture and fixtures |
767 | 806 | ||||
| 34,752 | 30,173 | |||||
| Less accumulated depreciation |
15,572 | 13,115 | ||||
| Net Property and Equipment |
19,180 | 17,058 | ||||
| Other Assets |
||||||
| Goodwill |
52,899 | 39,717 | ||||
| Other non-amortizable intangible assets |
4,139 | 3,730 | ||||
| Amortizable customer based intangibles, net of accumulated amortization of $4,002 and $2,861 at May 31, 2010 and 2009 |
13,021 | 6,143 | ||||
| Other non-current assets, net of accumulated amortization of $1,822 and $1,663 at May 31, 2010 and 2009 |
4,974 | 3,762 | ||||
| Total Other Assets |
75,033 | 53,352 | ||||
| $ | 180,233 | $ | 142,176 | |||
See accompanying notes to consolidated financial statements.
-F1-
Table of Contents
Neogen Corporation and Subsidiaries
Consolidated Balance Sheets – Liabilities and Equity
(Dollars in thousands, except per share)
| May 31, | ||||||||
| 2010 | 2009 | |||||||
| Liabilities and Equity |
||||||||
| Current Liabilities |
||||||||
| Accounts payable |
$ | 7,187 | $ | 3,909 | ||||
| Accruals |
||||||||
| Compensation and benefits |
2,346 | 2,519 | ||||||
| Federal income taxes |
2,838 | 667 | ||||||
| Other |
4,662 | 2,151 | ||||||
| Total Current Liabilities |
17,033 | 9,246 | ||||||
| Deferred Income Taxes |
5,824 | 2,725 | ||||||
| Other Long-Term Liabilities |
4,323 | 1,526 | ||||||
| Total Liabilities |
27,180 | 13,497 | ||||||
| Equity |
||||||||
| Preferred stock, $1.00 par value - shares authorized 100,000; none issued and outstanding |
— | — | ||||||
| Common stock, $0.16 par value - shares authorized 30,000,000; 22,625,399 and 22,105,329 shares issued and outstanding at May 31, 2010 and 2009 |
3,621 | 3,537 | ||||||
| Additional paid-in capital |
69,550 | 61,535 | ||||||
| Accumulated other comprehensive loss |
(1,676 | ) | (430 | ) | ||||
| Retained earnings |
81,170 | 63,611 | ||||||
| Total Neogen Corporation and Subsidiaries |
||||||||
| Stockholders Equity |
152,665 | 128,253 | ||||||
| Noncontrolling interest |
388 | 426 | ||||||
| Total Equity |
153,053 | 128,679 | ||||||
| $ | 180,233 | $ | 142,176 | |||||
See accompanying notes to consolidated financial statements.
-F2-
Table of Contents
Neogen Corporation and Subsidiaries
Consolidated Statements of Income
(Dollars in thousands, except per share)
| Year Ended May 31 | |||||||||
| 2010 | 2009 | 2008 | |||||||
| Net Sales |
$ | 140,509 | $ | 118,721 | $ | 102,418 | |||
| Cost of Goods Sold |
67,534 | 59,288 | 49,185 | ||||||
| Gross Margin |
72,975 | 59,433 | 53,233 | ||||||
| Operating Expenses |
|||||||||
| Sales and marketing |
26,350 | 22,906 | 20,648 | ||||||
| General and administrative |
13,488 | 11,484 | 10,927 | ||||||
| Research and development |
6,258 | 4,555 | 3,639 | ||||||
| 46,096 | 38,945 | 35,214 | |||||||
| Operating Income |
26,879 | 20,488 | 18,019 | ||||||
| Other Income |
|||||||||
| Interest income |
81 | 248 | 442 | ||||||
| Royalty income |
181 | 429 | — | ||||||
| Other, net |
180 | 459 | 37 | ||||||
| 442 | 1,136 | 479 | |||||||
| Income Before Income Taxes |
27,321 | 21,624 | 18,498 | ||||||
| Provision for Income Taxes |
9,800 | 7,750 | 6,400 | ||||||
| Net Income |
$ | 17,521 | $ | 13,874 | $ | 12,098 | |||
| Net Income Per Share |
|||||||||
| Basic |
$ | 0.78 | $ | 0.63 | $ | 0.56 | |||
| Diluted |
$ | 0.76 | $ | 0.61 | $ | 0.54 | |||
See accompanying notes to consolidated financial statements.
-F3-
Table of Contents
Neogen Corporation and Subsidiaries
Consolidated Statements of Equity
(Dollars in thousands, except share amounts)
| Additional Paid-in Capital |
Accumulated Other Comprehensive Income (Loss) |
Retained Earnings |
Noncontrolling Interest |
Total Equity |
|||||||||||||||||||||
| Common Stock | |||||||||||||||||||||||||
| Shares | Amount | ||||||||||||||||||||||||
| Balance, June 1, 2007 |
21,031,209 | $ | 3,365 | $ | 50,577 | $ | 386 | $ | 37,617 | $ | 91,945 | ||||||||||||||
| Exercise of options and warrants, net of share based compensation, including $747,000 income tax benefit |
724,440 | 116 | 6,827 | 6,943 | |||||||||||||||||||||
| Issuance of shares under Employee Stock Purchase Plan |
21,767 | 3 | 224 | 227 | |||||||||||||||||||||
| Comprehensive income: |
|||||||||||||||||||||||||
| Net income for 2008 |
12,098 | 12,098 | |||||||||||||||||||||||
| Foreign currency translation adjustments |
35 | 35 | |||||||||||||||||||||||
| Total comprehensive income |
12,133 | ||||||||||||||||||||||||
| Balance, May 31, 2008 |
21,777,416 | 3,484 | 57,628 | 421 | 49,715 | — | 111,248 | ||||||||||||||||||
| Exercise of options and warrants, net of share based compensation, including $682,000 income tax benefit |
382,782 | 62 | 4,523 | 4,585 | |||||||||||||||||||||
| Issuance of shares under Employee Stock Purchase Plan |
19,815 | 3 | 295 | 298 | |||||||||||||||||||||
| Repurchase and retirement of Common Stock |
(74,684 | ) | (12 | ) | (911 | ) | (923 | ) | |||||||||||||||||
| Noncontrolling interest attributable to acquisition of majority owned subsidiary |
448 | 448 | |||||||||||||||||||||||
| Comprehensive income: |
|||||||||||||||||||||||||
| Net income (loss) for 2009 |
13,896 | (22 | ) | 13,874 | |||||||||||||||||||||
| Foreign currency translation adjustments |
(851 | ) | (851 | ) | |||||||||||||||||||||
| Total comprehensive income |
13,023 | ||||||||||||||||||||||||
| Balance, May 31, 2009 |
22,105,329 | 3,537 | 61,535 | (430 | ) | 63,611 | 426 | 128,679 | |||||||||||||||||
-F4-
Table of Contents
Neogen Corporation and Subsidiaries
Consolidated Statements of Equity (cont.)
(Dollars in thousands, except share amounts)
| Additional Paid-in Capital |
Accumulated Other Comprehensive Income (Loss) |
Retained Earnings |
Noncontrolling Interest |
Total Equity |
|||||||||||||||||||||||
| Common Stock | |||||||||||||||||||||||||||
| Shares | Amount | ||||||||||||||||||||||||||
| Exercise of options and warrants, net of share based compensation, including $709,000 income tax benefits |
500,242 | 80 | 7,687 | 7,767 | |||||||||||||||||||||||
| Issuance of shares under Employee Stock Purchase Plan |
19,828 | 4 | 328 | 332 | |||||||||||||||||||||||
| Comprehensive income: |
|||||||||||||||||||||||||||
| Net income (loss) for 2010 |
17,559 | (38 | ) | 17,521 | |||||||||||||||||||||||
| Foreign currency translation adjustments |
(1,246 | ) | (1,246 | ) | |||||||||||||||||||||||
| Total comprehensive income |
16,275 | ||||||||||||||||||||||||||
| Balance, May 31, 2010 |
22,625,399 | $ | 3,621 | $ | 69,550 | $ | (1,676 | ) | $ | 81,170 | $ | 388 | $ | 153,053 | |||||||||||||
See accompanying notes to consolidated financial statements.
-F5-
Table of Contents
Neogen Corporation and Subsidiaries
Consolidated Statements of Cash Flows
(Dollars in thousands)
| Year Ended May 31 | ||||||||||||
| 2010 | 2009 | 2008 | ||||||||||
| Cash Flows From Operating Activities |
||||||||||||
| Net income |
$ | 17,521 | $ | 13,874 | $ | 12,098 | ||||||
| Adjustments to reconcile net income to net cash provided from operating activities: |
||||||||||||
| Depreciation and amortization |
4,435 | 3,890 | 3,516 | |||||||||
| Deferred income taxes |
(200 | ) | 1,550 | 450 | ||||||||
| Share based compensation |
2,237 | 1,967 | 1,892 | |||||||||
| Excess income tax benefit from the exercise of stock options |
(709 | ) | (682 | ) | (747 | ) | ||||||
| Other |
(207 | ) | — | 253 | ||||||||
| Changes in operating assets and liabilities, net of business acquisitions: |
||||||||||||
| Accounts receivable |
(2,240 | ) | (4,075 | ) | (3,869 | ) | ||||||
| Inventories |
64 | (3,698 | ) | (6,364 | ) | |||||||
| Prepaid expenses and other current assets |
390 | (49 | ) | (122 | ) | |||||||
| Accounts payable |
3,008 | (2,648 | ) | 1,666 | ||||||||
| Accruals and other changes |
3,689 | 856 | (900 | ) | ||||||||
| Net Cash From Operating Activities |
27,988 | 10,985 | 7,873 | |||||||||
| Cash Flows Used In Investing Activities |
||||||||||||
| Purchases of property, equipment and other noncurrent assets |
(5,431 | ) | (2,836 | ) | (2,471 | ) | ||||||
| Business acquisitions, net of cash acquired |
(20,302 | ) | (11,134 | ) | (10,147 | ) | ||||||
| Net Cash Used In Investing Activities |
(25,733 | ) | (13,970 | ) | (12,618 | ) | ||||||
| Cash Flows From Financing Activities |
||||||||||||
| Exercise of options |
5,900 | 2,916 | 5,060 | |||||||||
| Repurchase of common stock |
— | (923 | ) | — | ||||||||
| Excess income tax benefit from the exercise of stock options |
709 | 682 | 747 | |||||||||
| Increase (Decrease) in other long-term liabilities |
100 | (118 | ) | (216 | ) | |||||||
| Net Cash From Financing Activities |
6,709 | 2,557 | 5,591 | |||||||||
| Net Increase (Decrease) In Cash and Cash Equivalents |
8,964 | (428 | ) | 846 | ||||||||
| Cash And Cash Equivalents At Beginning Of Year |
13,842 | 14,270 | 13,424 | |||||||||
| Cash And Cash Equivalents At End Of Year |
$ | 22,806 | $ | 13,842 | $ | 14,270 | ||||||
| Supplement Cash Flow Information |
||||||||||||
| Income taxes paid, net of refunds |
$ | 6,283 | $ | 7,386 | $ | 7,475 | ||||||
See accompanying notes to consolidated financial statements.
-F6-
Table of Contents
Neogen Corporation and Subsidiaries
Notes to Consolidated Financial Statements
| 1. | Summary of Accounting Policies |
Nature of Operations
Neogen Corporation develops, manufactures, and sells a diverse line of products dedicated to food safety testing and animal health applications.
Basis of Consolidation
The consolidated financial statements include the accounts of Neogen Corporation and its subsidiaries (collectively, the Company ), all of which are wholly owned, with the exception of Neogen Latinoamerica S.A.P.I. DE C.V., which is 60% owned and Neogen do Brazil, which is 98% owned. Noncontrolling interest represents the noncontrolling owner’s proportionate share in the equity of the Company’s majority owned subsidiaries. The noncontrolling owner’s proportionate share in the income or losses of the Company’s majority owned subsidiaries is included in other income, net in the statements of income.
All intercompany accounts and transactions have been eliminated in consolidation.
Share and per share amounts reflect the December 15, 2009 3 for 2 stock split as if it took place at the beginning of the periods presented.
Use of Estimates
The preparation of financial statements in conformity with U.S. generally accepted accounting principles requires management to make estimates and assumptions that affect the amounts reported in the consolidated financial statements and accompanying notes. Actual results could differ, from these estimates.
Comprehensive Income
Comprehensive income represents net income and any revenues, expenses, gains and losses that, under U.S. generally accepted accounting principles, are excluded from net income and recognized directly as a component of stockholders’ equity. Accumulated other comprehensive income (loss) consists solely of foreign currency translation adjustments.
Accounts Receivable and Concentrations of Credit Risk
Financial instruments which potentially subject the Company to concentrations of credit risk consist principally of accounts receivable. Management attempts to minimize credit risk by reviewing customers’ credit history before extending credit and by monitoring credit exposure on a regular basis. An allowance for possible losses on accounts receivable is established based upon factors surrounding the credit risk of specific customers, historical trends and other information. Collateral or other security is generally not required for accounts receivable. One customer accounted for more than 10% of accounts receivable at May 31, 2010 and 2009. As of May 31, 2010 and 2009 the balance due from that customer was $2,608,000 or 10% and $2,879,000 or 12%, respectively of the total of all outstanding accounts receivables.
The Company maintains a valuation allowance for accounts receivable of $600,000 at May 31, 2010 and May 31, 2009. Expenses related to uncollectable accounts and allowance adjustments were $242,000, $199,000 and $54,000 in 2010, 2009 and 2008, respectively. Write-offs were $242,000, $99,000 and $54,000 in May 31, 2010, 2009 and 2008, respectively.
Fair Value of Financial Instruments
The carrying amounts of the Company’s financial instruments, including accounts receivable, accounts payable, and accrued expenses approximate fair value based on either their short maturity or current terms for similar instruments.
-F7-
Table of Contents
Neogen Corporation and Subsidiaries
Notes to Consolidated Financial Statements
Cash and Cash Equivalents
Cash and cash equivalents consist of bank demand and savings deposits and short term domestic certificates of deposit with maturities of 90 days or less. Cash equivalents were $13,987,000 and $5,344,000 at May 31, 2010 and 2009, respectively. The carrying value of these assets approximates fair value.
Inventories
Inventories are stated at the lower of cost, determined on the first-in, first-out method, or market. The components of inventories were as follows:
| May 31 | ||||||
| 2010 | 2009 | |||||
| Raw materials |
$ | 11,815,000 | $ | 11,183,000 | ||
| Work-in-process |
1,958,000 | 1,425,000 | ||||
| Finished and purchased finished goods |
17,543,000 | 18,755,000 | ||||
| $ | 31,316,000 | $ | 31,363,000 | |||
No less frequently than quarterly, inventory is analyzed for slow moving and obsolete inventory and the valuation allowance adjusted as required. Write offs against the allowance are not separately identified. The valuation allowance for inventory was $1,000,000, $1,025,000 and $700,000 at May 31, 2010, 2009 and 2008.
Property and Equipment
Property and equipment is stated at cost. Expenditures for major improvements are capitalized while repairs and maintenance are charged to expense. Depreciation is provided on the straight-line method over the estimated useful lives of the respective assets, which are generally seven to thirty-nine years for buildings and improvements and three to five years for furniture, machinery and equipment. Depreciation expense was $2,734,000, $2,560,000, and $2,360,000 in 2010, 2009 and 2008, respectively.
Goodwill and Other Intangible Assets
Goodwill represents the excess of purchase price over fair value of tangible net assets of acquired businesses after amounts allocated to other intangible assets. In general, goodwill is amortizable for tax purposes over 15 years. Other intangible assets include customer relationships, trademarks, licenses, trade names and patents. Amortizable intangible assets are amortized on either an accelerated or a straight-line basis over five to twenty years. The Company reviews the carrying amounts of goodwill and other non-amortizable intangible assets annually to determine if such assets may be impaired. If the carrying amounts of these assets are deemed to be less than fair value based upon a discounted cash flow analysis and comparison to comparable EBITDA multiples of peer companies, such assets are reduced to their estimated fair value. The remaining weighted-average amortization period for customer based intangibles and other intangibles is 13 and 10 years respectively at May 31, 2010.
-F8-
Table of Contents
Neogen Corporation and Subsidiaries
Notes to Consolidated Financial Statements
Long-lived Assets
Management reviews the carrying values of its long-lived assets for possible impairment whenever events or changes in business conditions indicate that the carrying amount of the assets may not be recoverable. Impairment is first evaluated by comparing the carrying value of the long-lived assets to undiscounted future cash flows over the remaining useful life of the assets. If the undiscounted cash flows are less than the carrying value of the assets, the fair value of the long-lived assets is determined, and if lower than the carrying value, impairment is recognized.
Reclassifications
Certain amounts in the 2009 and 2008 financial statements have been reclassified to conform to the 2010 presentation.
Stock Options
At May 31, 2010, the Company had stock option plans that are described more fully in Note 5.
The weighted-average fair value per share of stock options granted during 2010, 2009 and 2008, estimated on the date of grant using the Black-Scholes option pricing model, was $6.35, $5.44 and $4.61 respectively. The fair value of stock options granted was estimated using the following weighted-average assumptions:
| Year ended May 31 | ||||||
| 2010 | 2009 | 2008 | ||||
| Risk-free interest rate |
2.0% | 2.9% | 4.6% | |||
| Expected dividend yield |
0% | 0% | 0% | |||
| Expected stock price volatility |
37.8% | 32.8% | 34.2% | |||
| Expected option life |
4.0 years | 4.0 years | 4.0 years | |||
The risk-free interest rate for periods within the expected life of options granted is based on the United States Treasury yield curve in effect at the time of grant. Expected stock price volatility is based on historical volatility of the Company’s stock. The expected option life, representing the period of time that options granted are expected to be outstanding, is based on historical option exercise and employee termination data. The Company recognizes the cost of stock options using the accelerated method over their requisite service periods which the Company has determined to be the vesting periods.
Revenue Recognition
Revenue from sales of products is recognized at the time title of goods passes to the buyer and the buyer assumes the risks and rewards of ownership, which generally is at the time of shipment. Where right of return exists, allowances are made at the time of sale to reflect expected returns based on historical experience.
Shipping and Handling Costs
Shipping and handling costs that are charged to and reimbursed by the customer are recognized as sales, while the related expenses incurred by the Company are recorded in sales and marketing expense and totaled $4,494,000, $4,266,000 and $3,888,000 in 2010, 2009 and 2008, respectively.
Income Taxes
The Company accounts for income taxes using the liability method. Under this method, deferred income tax assets and liabilities are determined based on differences between the financial reporting and tax bases of assets and liabilities and are measured using the enacted tax rates in effect for the years in which the differences are expected to reverse. Deferred income tax expense represents the change in net deferred income tax assets and liabilities during the year.
-F9-
Table of Contents
Neogen Corporation and Subsidiaries
Notes to Consolidated Financial Statements
No provision has been made for United States federal income taxes that may result from future remittances of the undistributed earnings of foreign subsidiaries because it is expected that such earnings will be reinvested overseas indefinitely. At May 31, 2010 unremitted earnings of the UK subsidiary were $5,032,000.
Research and Development Costs
Research and Development costs are expensed as incurred.
Advertising Costs
Advertising costs are expensed as incurred and totaled $633,000, $603,000 and $424,000 in 2010, 2009 and 2008, respectively.
Net Income Per Share
Basic net income per share is based on the weighted average number of common shares outstanding during each year. Diluted earnings per share is based on the weighted average number of common shares and dilutive potential common shares outstanding. The Company’s dilutive potential common shares outstanding during the years result entirely from dilutive stock options and warrants. The following table presents the net income per share calculations:
| Year ended May 31, | |||||||||
| 2010 | 2009 | 2008 | |||||||
| Numerator for basic and diluted net income per share - Net Income |
$ | 17,521,000 | $ | 13,874,000 | $ | 12,098,000 | |||
| Denominator - Denominator for basic net income per share weighted average shares |
22,425,000 | 22,003,000 | 21,711,000 | ||||||
| Effect of dilutive stock options and warrants |
666,000 | 584,000 | 788,000 | ||||||
| Denominator for diluted net income per share |
23,091,000 | 22,587,000 | 22,499,000 | ||||||
| Net income per share |
|||||||||
| Basic |
$ | .78 | $ | 0.63 | $ | 0.56 | |||
| Diluted |
$ | .76 | $ | 0.61 | $ | 0.54 | |||
In 2009, 417,000 options were excluded from the computations of net income per share as the option prices exceeded the average market price of the common shares. No options were excluded in 2008 and 2010.
New Accounting Pronouncements
In June 2009, the FASB issued Statement of Financial Accounting Standard (“FAS”) No. 168 - The FASB Accounting Standards Codification and the Hierarchy of Generally Accepted Accounting Principles - a replacement of FASB Statement No. 162” (codified in ASC 105). This standard establishes the Accounting Standards Codification (“ASC” or Codification “) as the source of authoritative accounting principles recognized by FASB for all nongovernmental entities in the preparation of financial statements in accordance with GAAP. For SEC registrants, rules and interpretative releases of the SEC under federal securities laws are also considered authoritative sources of GAAP. The FASB will not issue new standards in the form of Statements, FASB Staff Positions (“FSP”) or Emerging Issues Task Force (“EITF”) Abstracts. Instead, it will issue Accounting Standard Updates (“ASUs”). ASUs will serve to update the Codification, provide background information about the guidance and provide the basis for conclusions on changes in the Codification. The provisions of this standard were effective for financial statements issued for interim and annual periods ending after
-F10-
Table of Contents
Neogen Corporation and Subsidiaries
Notes to Consolidated Financial Statements
September 15, 2009. Accordingly, the Company began to use the new guidelines and numbering system prescribed by the Codification when referring to GAAP for this period ended November 30, 2009. As the Codification was not intended to change or alter existing GAAP, it did not have any impact on our consolidated financial results or financial position.
On June 1, 2009, the Company adopted ASC 805 Business Combinations (ASC 805). This standard intended to converge rulemaking and reporting under U.S. Generally Accepted Accounting Principles (GAAP) with international accounting rules. ASC 805 establishes principles and requirements for how an acquirer in a business combination recognizes and measures in its financial statements the identifiable assets acquired, the liabilities assumed, and any noncontrolling interest in the acquiree, recognizes and measures the goodwill acquired in the business combination or a gain from a bargain purchase; and determines what information to disclose to enable users of the financial statements to evaluate the nature and financial effects of the business combination. The adoption of the standard had no material impact on the Company’s results of operations or financial position at the date of adoption.
ASC 810 Consolidation (ASC 810) requires all entities to report non-controlling (minority) interests in subsidiaries as equity in the consolidated financial statements. Its intention is to eliminate the diversity in practice regarding the accounting for transactions between an entity and noncontrolling interests. The Company was required to adopt the provisions of both ASC 805 and ASC 810 simultaneously on June 1, 2009. The standards were adopted on June 1, 2009, and did not have a material impact on the Company’s results of operations or financial position. The presentation and disclosure requirement were applied retrospectively.
Other recent ASU’s issued by the FASB and guidance issued by the SEC did not, or are not believed by management to, have a material effect on the Company’s present or future consolidated financial statements.
| 2. | Goodwill and Other Intangible Assets |
The Company follows the provisions of ASC 350 – Intangibles Goodwill and Other (ASC 350). ASC 350 prohibits the amortization of goodwill and intangible assets with indefinite lives and requires that the Company evaluate these intangibles for impairment on an annual basis. Management has completed the required annual impairment tests of goodwill and intangible assets with indefinite lives as prescribed by ASC 350 as of the first day of the fourth quarter of 2010 and determined that recorded amounts were not impaired and that no write-down was necessary.
The following table summarizes goodwill by business segment:
| Food Safety | Animal Safety | Total | |||||||
| Balance, June 1, 2008 |
$ | 12,401,000 | $ | 18,216,000 | $ | 30,617,000 | |||
| Goodwill acquired |
114,000 | 8,986,000 | 9,100,000 | ||||||
| Balance, May 31, 2009 |
12,515,000 | 27,202,000 | 39,717,000 | ||||||
| Goodwill acquired |
4,037,000 | 9,145,000 | 13,182,000 | ||||||
| Balance, May 31, 2010 |
$ | 16,552,000 | $ | 36,347,000 | $ | 52,899,000 | |||
At May 31, 2010, non-amortizable intangible assets included licenses of $554,000, trademarks of $2,361,000 and a customer relationship intangible of $1,224,000. At May 31, 2009, non-amortizable intangible assets consisted of licenses of $554,000, trademarks of $1,952,000 and a customer relationship intangible of $1,224,000.
-F11-
Table of Contents
Neogen Corporation and Subsidiaries
Notes to Consolidated Financial Statements
Other amortizable intangible assets consisted of the following and are included in customer based intangible and other noncurrent assets within the consolidated balance sheets:
| Gross Carrying Amount |
Less Accumulated Amortization |
Net Carrying Amount | |||||||
| Licenses |
$ | 1,505,000 | $ | 575,000 | $ | 930,000 | |||
| Covenants not to compete |
50,000 | 21,000 | 29,000 | ||||||
| Patents |
3,750,000 | 1,226,000 | 2,524,000 | ||||||
| Customer relationship intangibles |
17,023,000 | 4,002,000 | 13,021,000 | ||||||
| Balance, May 31, 2010 |
$ | 22,328,000 | $ | 5,824,000 | $ | 16,504,000 | |||
| Licenses |
$ | 1,225,000 | $ | 583,000 | $ | 642,000 | |||
| Covenants not to compete |
70,000 | 35,000 | 35,000 | ||||||
| Patents |
3,513,000 | 1,045,000 | 2,468,000 | ||||||
| Customer relationship intangibles |
9,004,000 | 2,861,000 | 6,143,000 | ||||||
| Balance, May 31, 2009 |
$ | 13,812,000 | $ | 4,524,000 | $ | 9,288,000 | |||
Amortization expense for other intangibles totaled $1,701,000, $1,330,000 and $1,156,000 in 2010, 2009 and 2008, respectively. The estimated amortization expense for each of the five succeeding years is as follows: $2,125,000 in 2011, $2,024,000 in 2012, $1,926,000 in 2013, $1,780,000 in 2014, and $1,631,000 in 2015. The other amortizable intangible assets useful lives are 5 to 20 years for licenses, 5 years for covenants not to compete, 5 to 17 years for patents, and 12 to 20 years for customer relationship intangibles. All definite lived intangibles are amortized on a straight line basis with the exception of definite lived customer based intangibles which are amortized on an accelerated basis.
| 3. | Business Combinations |
The Consolidated Statements of Income reflect the results of operations for business acquisitions since the respective dates of purchase. All are accounted for using the purchase method.
On August 24, 2007, Neogen Corporation purchased the net assets of Brandon, South Dakota based Kane Enterprises, Inc. Consideration for the purchase, including additional net current assets of $800,000, consisted of $6,600,000 of cash. The allocation of the purchase price consisted of $600,000 in accounts receivables, $1,775,000 in inventory, $55,000 in fixed assets, $4,350,000 in goodwill and other intangible assets (estimated useful lives of 5-15 years) and $180,000 in assumed liabilities. The acquisition has been integrated into the Lexington, Kentucky operations and is a strong synergistic fit with the Company’s Animal Safety segment.
On December 3, 2007, Neogen Corporation purchased the net assets of Winnipeg, Manitoba based Rivard Instruments Inc. a manufacturer of veterinary instruments. Consideration for the purchase was cash of $3,469,000. The allocation of the purchase price consisted of $468,000 in inventory, $5,000 in fixed assets and $2,996,000 in goodwill and other intangible assets (estimated useful lives of 13-17 years). The acquisition has been integrated into the Lexington, Kentucky operations and is a strong synergistic fit with the Company’s Animal Safety segment.
On June 3, 2008, Neogen Corporation formed a subsidiary in Mexico, Neogen Latinoamerica S.A.P.I. DE C.V. to acquire its former distributor. The new business is 40% owned by Neogen Corporation’s former Mexican distributor in Mexico, with the remainder owned by Neogen. The new company will distribute the Company’s food and animal safety products throughout Mexico. The consideration of $672,000 was allocated $462,000 to current assets, $30,000 to fixed assets and the remainder to intangible assets (estimated useful lives of 10 years).
On June 30, 2008, Neogen Corporation purchased a disinfectant business from DuPont Animal Health Solutions. The products of this business are used in animal health hygiene applications. Assets acquired include 14 different product formulations, associated registrations, patents, trademarks, and other intangibles (estimated useful lives of 5-15 years). As a part of the acquisition, the Company obtained the right to distribute certain other
-F12-
Table of Contents
Neogen Corporation and Subsidiaries
Notes to Consolidated Financial Statements
related DuPont products in North America. DuPont will distribute certain of the newly acquired Neogen products in certain international markets. Consideration for the purchase was $7,000,000 and $5,193,000 was allocated to goodwill, $1,186,000 to customer based intangible and $621,000 to trademarks and patents. This acquisition has been integrated into the Lexington, Kentucky, operations and is expected to be a strong synergistic fit with Company’s Animal Safety segment.
On May 4, 2009, Neogen Corporation acquired International Diagnostics Systems Corporation (IDS), a St. Joseph, Michigan based developer, manufacturer and marketer of test kits to detect drug residues in (IDS) food and animal feed, and drugs in forensic and animal samples. Consideration for the purchase was $3,955,000. The allocation included net current assets of $498,000, deferred tax liabilities of $400,000 and goodwill and intangible assets of $2,964,000 (estimated useful lives of 5-20 years) including customer related intangibles of $1,090,000. The acquisition is synergistic to Animal Safety products and has been integrated there with.
On December 1, 2009, the Company purchased the BioKits food safety business of Gen-Probe, Incorporated. Consideration for the purchase, approximated $6,500,000 in cash and the assumption of trade accounts payable of $175,000. The preliminary allocation of the purchase price included net current assets of $770,000, fixed assets $163,000 and the remainder to goodwill and other intangible assets. The acquired business will be integrated into Neogen’s Food Safety segment. Principal products include synergistic allergen test kits.
On April 1, 2010, Neogen Corporation acquired GeneSeek, Inc. of Lincoln, Nebraska, a leading commercial agricultural genetic laboratory. GeneSeek’s technology employs high-resolution DNA genotyping for identity and trait analysis in a variety of important animal and agricultural plant species. Consideration for the purchase was $13,800,000 in cash and secondary payment obligation of up to $7,000,000. Prelimary allocation of the purchase price included accounts receivable of $1,923,000, inventory of $1,212,000, fixed assets of $847,000, current liabilities of $600,000 deferred tax liabilities of $2,050,000 secondary payment related liabilities of $3,583,000 and other the remainder to goodwill and other intangible assets (with estimated lives of 5-20 years). The secondary payment was measured at fair value, which is considered a level 3 fair value measurement under ASC 820-Fair Value Measurement and Disclosure, as it was based on unobservable inputs and involves management’s judgment. The acquisition will be integrated into the Animal Safety segment and is expected to be a strong synergistic fit.
| 4. | Long-Term Debt |
The Company has a financing agreement with a bank (nothing drawn at May 31, 2010 and 2009) providing for an unsecured revolving line of credit of $10,000,000 that matures on August 20, 2012. Interest is at LIBOR plus 100 basis points (rate under the terms of the agreement was 1.34% at May 31, 2010). Financial covenants include maintaining specified levels of tangible net worth, debt service coverage, and funded debt to EBITDA, each of which the Company is in compliance with at May 31, 2010.
| 5. | Equity Compensation Plans |
Qualified and non-qualified options to purchase shares of common stock may be granted to directors, officers and employees of the Company under the terms of the Company’s stock option plans at an exercise price of not less than the fair market value of the stock on the date of grant. Remaining shares available for grant under stock option plans were 687,000, 1,085,000 and 1,475,000 at May 31, 2010, 2009 and 2008, respectively. Options vest ratably over three and five year periods and the contractual terms are generally five years.
-F13-
Table of Contents
Neogen Corporation and Subsidiaries
Notes to Consolidated Financial Statements
| Shares | Weighted-Average Exercise Price | |||||
| Outstanding at June 1, 2007 (1,032,017 exercisable) |
2,270,552 | $ | 7.40 | |||
| Granted |
584,634 | 13.69 | ||||
| Exercised |
(709,784 | ) | 6.01 | |||
| Forfeited |
(31,187 | ) | 9.35 | |||
| Outstanding at May 31, 2008 (776,975 exercisable) |
2,114,215 | 9.57 | ||||
| Granted |
417,000 | 18.11 | ||||
| Exercised |
(390,302 | ) | 7.23 | |||
| Forfeited |
(26,646 | ) | 5.73 | |||
| Outstanding at May 31, 2009 (832,949 exercisable) |
2,114,267 | 11.67 | ||||
| Granted |
426,382 | 19.60 | ||||
| Exercised |
(479,992 | ) | 8.57 | |||
| Forfeited |
(62,478 | ) | 13.56 | |||
| Outstanding at May 31, 2010 (728,295 exercisable) |
1,998,179 | $ | 14.14 | |||
The following is a summary of stock options outstanding at May 31, 2010:
| Options Outstanding | Options Exercisable | |||||||||||
| Range of Exercise price |
Number | Average Remaining Contractual Life |
Weighted-Average Exercise Price |
Number | Weighted Average Exercise Price | |||||||
| $ 2.45 – $ 4.94 |
15,753 | 1.53 | $ | 4.24 | 15,753 | $ | 4.24 | |||||
| 4.95 – 9.09 |
628,131 | 2.39 | 8.52 | 420,308 | 8.38 | |||||||
| 9.10 – 16.72 |
548,857 | 3.35 | 13.82 | 214,779 | 13.90 | |||||||
| 16.73 – 20.33 |
805,438 | 3.91 | 18.93 | 77,455 | 18.19 | |||||||
| 1,998,179 | 3.26 | 14.14 | 728,295 | 10.96 | ||||||||
The weighted-average exercise price of shares that were exercisable at May 31, 2009 and 2008 was $8.89 and $7.57, respectively. The weighted-average grant-date fair value of options granted in 2010, 2009, and 2008 was $6.35, $5.44 and $4.61 respectively.
The aggregate intrinsic value of options outstanding and options exercisable was $23,119,000 and $10,740,000 respectively, at May 31, 2010, $7,850,000 and $4,855,000 respectively, at May 31, 2009 and $16,879,000, and $7,762,000 respectively, at May 31, 2008. The aggregate intrinsic value of options exercised during the year was $6,554,000 in 2010 and $4,099,000 in 2009 and $6,783,000 in 2008. Remaining compensation cost to be expensed in future periods for non-vested options was $2,680,000 at May 31, 2010, with a weighted average expense recognition period of 2.2 years.
-F14-
Table of Contents
Neogen Corporation and Subsidiaries
Notes to Consolidated Financial Statements
The following table summarizes warrant activity with non-employees that are expensed at fair value upon grant. All warrants are exercisable for common stock of the Company and expire through 2012.
| Shares | Weighted-Average Exercise Price | |||||
| Outstanding warrants at June1, 2007 |
121,220 | $ | 7.05 | |||
| Warrants exercised during the year |
(40,220 | ) | 5.43 | |||
| Outstanding warrants at May 31, 2008 |
81,000 | 7.86 | ||||
| Warrants exercised during the year |
(23,625 | ) | 7.22 | |||
| Warrants forfeited during the year |
(5,625 | ) | 6.75 | |||
| Outstanding warrants at May 31, 2009 |
51,750 | 8.40 | ||||
| Warrants exercised during the year |
(20,250 | ) | 8.28 | |||
| Warrants forfeited during the year |
(2,250 | ) | 8.55 | |||
| Outstanding warrants at May 31, 2010 |
29,250 | $ | 8.48 | |||
Common stock totaling 90,860 of the 225,000 originally authorized shares are reserved for issuance under the terms of the 2002 Employee Stock Purchase Plan. The plan gives eligible employees the option to purchase common stock (total purchases in any year are limited to 10% of compensation) at 95% of the lower of the market value of the stock at the beginning or end of each participation period. Shares purchased by employees were 19,828, 19,815 and 21,767 in 2010, 2009 and 2008, respectively.
| 6. | Income Taxes |
The provision for income taxes consisted of the following:
| Year ended May 31, | ||||||||||
| 2010 | 2009 | 2008 | ||||||||
| Current: |
||||||||||
| U.S. Taxes |
$ | 8,850,000 | $ | 5,700,000 | $ | 5,550,000 | ||||
| Foreign |
450,000 | 500,000 | 400,000 | |||||||
| Deferred |
(200,000 | ) | 1,550,000 | 450,000 | ||||||
| $ | 9,800,000 | $ | 7,750,000 | $ | 6,400,000 | |||||
Deferred income taxes reflect the tax effects of temporary differences between the carrying amounts of assets and liabilities for financial reporting purposes and the amounts used for income tax purposes. Significant components of the Company’s deferred income tax liabilities and assets are as follows:
| May 31, | ||||||||
| 2010 | 2009 | |||||||
| Deferred income tax liabilities |
||||||||
| Indefinite and long-lived assets |
$ | (7,479,000 | ) | $ | (4,079,000 | ) | ||
| Prepaids |
(454,000 | ) | (229,000 | ) | ||||
| Other |
(151,000 | ) | (451,000 | ) | ||||
| (8,084,000 | ) | (4,759,000 | ) | |||||
| Deferred income tax assets |
||||||||
| Inventories and accounts receivable |
1,244,000 | 844,000 | ||||||
| Acquired net operating loss carry forwards |
429,000 | 229,000 | ||||||
| Accrued liabilities and other |
1,361,000 | 1,161,000 | ||||||
| 3,034,000 | 2,234,000 | |||||||
| Net deferred income tax liabilities |
$ | (5,050,000 | ) | $ | (2,525,000 | ) | ||
-F15-
Table of Contents
Neogen Corporation and Subsidiaries
Notes to Consolidated Financial Statements
The acquired net operating loss carry forwards resulted in a deferred tax asset of $429,000, of which $100,000 will expire in 2011 and $329,000 will expire in 2019.
The reconciliation of income taxes computed at the U.S. federal statutory tax rate to income tax expense is as follows:
| Year ended May 31, | ||||||||||||
| 2010 | 2009 | 2008 | ||||||||||
| Tax at U.S. statutory rates |
$ | 9,600,000 | $ | 7,600,000 | $ | 6,374,000 | ||||||
| Tax credits and other |
(25,000 | ) | (180,000 | ) | (194,000 | ) | ||||||
| Provisions for state income taxes, net of federal benefit |
225,000 | 330,000 | 220,000 | |||||||||
| $ | 9,800,000 | $ | 7,750,000 | $ | 6,400,000 | |||||||
The Company has no significant accrual for unrecognized tax benefits at May 31, 2010. Should the accrual of any interest or penalties relative to unrecognized tax benefits be necessary, such accruals will be reflected within income tax accounts. For the majority of tax jurisdictions, the Company is no longer subject to U.S. Federal, State and local or non U.S. income tax examinations by tax authorities for fiscal years before 2006.
| 7. | Commitments and Contingencies |
The Company is involved in environmental remediation and monitoring activities at its Randolph, Wisconsin manufacturing facility and accrues for related costs when such costs are determined to be probable and estimable. The Company is currently expensing annual costs of remediation of approximately $90,000. The Company’s estimated liability for this expense of $916,000 at May 31, 2010 is recorded within other long term liabilities in the consolidated balance sheet.
The Company has agreements with unrelated third parties that provide for the payment of royalties on the sale of certain products. Royalty expense under the terms of these agreements was $1,337,000, $1,184,000 and $1,231,000 for 2010, 2009 and 2008, respectively.
The Company leases office and manufacturing facilities under noncancelable operating leases. Rent expense for 2010, 2009 and 2008 was $428,000, $336,000 and $326,000, respectively. Future minimum rental payments for these leases over the remaining terms are as follows: 2011 - $ 313,000; 2012 - $ 265,000; and 2013 - $87,000.
The Company is subject to certain legal and other proceedings in the normal course of business that, in the opinion of management, will not have a material effect on its future results of operations or financial position.
| 8. | Defined Contribution Benefit Plan |
The Company maintains a defined contribution 401(k) benefit plan covering substantially all employees. Employees are permitted to defer up to IRS limits, with the Company matching 100% of the first 3% deferred and 50% of the next 2% deferred. The Company’s expense under this plan was $622,000, $542,000 and $476,000 in 2010, 2009 and 2008, respectively.
| 9. | Segment Information |
The Company has two reportable segments: Food Safety and Animal Safety. The Food Safety segment produces and markets diagnostic test kits and related products used by food producers and processors to detect harmful natural toxins, foodborne bacteria, allergens and levels of general sanitation. The Animal Safety segment is primarily engaged in the production and marketing of products dedicated to animal health, including a complete line of consumable products marketed to veterinarians and animal health product distributors and provides genetic identification services. Additionally, the Animal Safety segment produces and markets rodenticides and disinfectants to assist in control of rodents and disease in and around agricultural, food production and other facilities.
-F16-
Table of Contents
Neogen Corporation and Subsidiaries
Notes to Consolidated Financial Statements
These segments are managed separately because they represent strategic business units that offer different products and require different marketing strategies. The Company evaluates performance based on total sales and operating income of the respective segments. The accounting policies of the segments are the same as those described in Note 1.
Segment information is as follows:
| Food Safety | Animal Safety | Corporate and Eliminations (1) |
Total | ||||||||||
| 2010 |
|||||||||||||
| Net sales to external customers |
$ | 76,454,000 | $ | 64,055,000 | $ | — | $ | 140,509,000 | |||||
| Operating income (loss) |
21,103,000 | 7,801,000 | (2,025,000 | ) | 26,879,000 | ||||||||
| Depreciation and amortization |
2,924,000 | 1,511,000 | — | 4,435,000 | |||||||||
| Interest income |
— | — | 81,000 | 81,000 | |||||||||
| Income taxes (benefit) |
7,570,000 | 2,798,000 | (568,000 | ) | 9,800,000 | ||||||||
| Total assets |
74,583,000 | 87,894,000 | 17,756,000 | 180,233,000 | |||||||||
| Expenditures for long-lived assets |
4,364,000 | 1,067,000 | — | 5,431,000 | |||||||||
| 2009 |
|||||||||||||
| Net sales to external customers |
61,025,000 | 57,696,000 | — | 118,721,000 | |||||||||
| Operating income (loss) |
14,943,000 | 6,786,000 | (1,241,000 | ) | 20,488,000 | ||||||||
| Depreciation and amortization |
2,717,000 | 1,173,000 | — | 3,890,000 | |||||||||
| Interest income |
— | — | 248,000 | 248,000 | |||||||||
| Income taxes (benefit) |
5,356,000 | 2,432,000 | (38,000 | ) | 7,750,000 | ||||||||
| Total assets |
61,322,000 | 69,559,000 | 11,295,000 | 142,176,000 | |||||||||
| Expenditures for long-lived assets |
1,882,000 | 954,000 | — | 2,836,000 | |||||||||
| 2008 |
|||||||||||||
| Net sales to external customers |
57,664,000 | 44,754,000 | — | 102,418,000 | |||||||||
| Operating income (loss) |
14,245,000 | 4,972,000 | (1,198.000 | ) | 18,019,000 | ||||||||
| Depreciation and amortization |
2,495,000 | 1,021,000 | — | 3,516,000 | |||||||||
| Interest income |
— | — | 442,000 | 442,000 | |||||||||
| Income taxes (benefit) |
5,060,000 | 1,766,000 | (426,000 | ) | 6,400,000 | ||||||||
| Total assets |
60,951,000 | 52,236,000 | 13,170,000 | 126,357,000 | |||||||||
| Expenditures for long-lived assets |
1,850,000 | 621,000 | — | 2,471,000 | |||||||||
| (1) | Includes corporate assets, including cash and cash equivalents and current and deferred tax accounts, and overhead expenses not allocated to specific business segments. Also includes the elimination of intersegment transactions and noncontrolling interests. |
Sales to customers located outside the United States amounted to $56,031,000 or 40% of consolidated sales in 2010, $48,678,000 or 41% in 2009 and $39,333,000 or 38% in 2008 and were derived primarily in the geographic areas of Europe, Canada, South and Central America, and Asia. Revenues from one Food Safety distributor customer were 10.3% in 2010 and 9.8% in 2009 of total revenues. No other customer represented revenues in excess of 10% of consolidated net sales. The United States based operations represent 89% of the Company’s long-lived assets as of May 31, 2010 and 2009.
-F17-
Table of Contents
Neogen Corporation and Subsidiaries
Notes to Consolidated Financial Statements
| 10. | Stock Repurchase |
In December 2008, the Company’s Board of Directors rescinded an existing program and authorized a new program to purchase, subject to market conditions, up to 750,000 shares of the Company’s common stock. As of May 31, 2010, 74,684 cumulative shares have been purchased in negotiated and open market transactions for a total price, including commissions, of approximately $923,000. There were no purchases in 2010 or 2008. Shares purchased under the program were retired.
| 11. | Summary of Quarterly Data (Unaudited) |
| Quarter Ended | ||||||||||||
| August 2009 |
November 2009 |
February 2010 |
May 2010 | |||||||||
| (In thousands, except per share data) | ||||||||||||
| Net sales |
$ | 32,347 | $ | 35,251 | $ | 33,833 | $ | 39,078 | ||||
| Gross margin |
17,270 | 18,522 | 17,461 | 19,722 | ||||||||
| Net income |
4,395 | 4,610 | 3,881 | 4,635 | ||||||||
| Basic net income per share |
.20 | .21 | .17 | .20 | ||||||||
| Diluted net income per share |
.19 | .20 | .17 | .20 | ||||||||
| Quarter Ended | ||||||||||||
| August 2008 |
November 2008 |
February 2009 |
May 2009 | |||||||||
| (In thousand, except per share data) | ||||||||||||
| Net sales |
$ | 28,805 | $ | 31,187 | $ | 27,840 | $ | 30,889 | ||||
| Gross Margin |
14,804 | 16,125 | 13,027 | 15,477 | ||||||||
| Net income |
3,733 | 3,901 | 2,823 | 3,417 | ||||||||
| Basic net income per share |
.17 | .18 | .13 | .15 | ||||||||
| Diluted net income per share |
.17 | .17 | .13 | .14 | ||||||||
Quarterly net income per share is based on weighted-average shares outstanding and potentially dilutive stock options and warrants for the specific period, and as a result, will not necessarily aggregate to total net income per share as computed for the year as disclosed in the consolidated statements of income.
-F18-