Attached files
| file | filename |
|---|---|
| 8-K - 8-K_2Q16_INVPRES_KBW - CenterState Bank Corp | csfl-8k_20160729.htm |
2nd Quarter 2016 Investor Presentation Exhibit 99.1
This presentation contains forward-looking statements, as defined by Federal Securities Laws, relating to present or future trends or factors affecting the operations, markets and products of CenterState Banks, Inc. (CSFL). These statements are provided to assist in the understanding of future financial performance. Any such statements are based on current expectations and involve a number of risks and uncertainties. For a discussion of factors that may cause such forward-looking statements to differ materially from actual results, please refer to CSFL’s most recent Form 10-Q and Form 10-K filed with the Securities Exchange Commission. CSFL undertakes no obligation to release revisions to these forward-looking statements or reflect events or circumstances after the date of this presentation. Forward Looking Statement
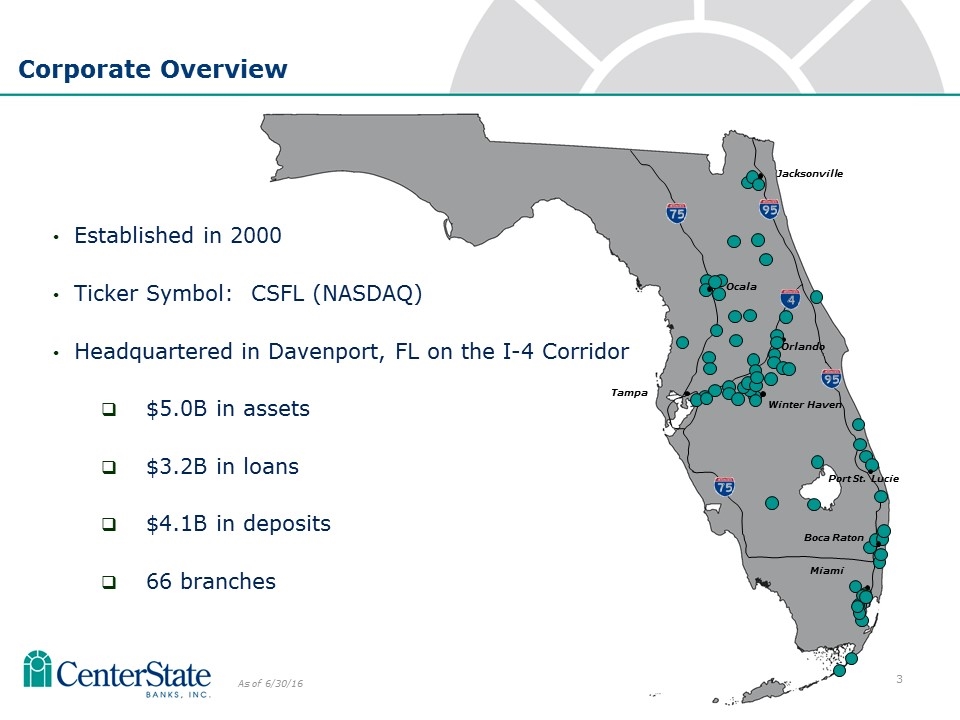
Tampa Winter Haven Miami Jacksonville Orlando Ocala Port St. Lucie Boca Raton As of 6/30/16 Established in 2000 Ticker Symbol: CSFL (NASDAQ) Headquartered in Davenport, FL on the I-4 Corridor $5.0B in assets $3.2B in loans $4.1B in deposits 66 branches Corporate Overview
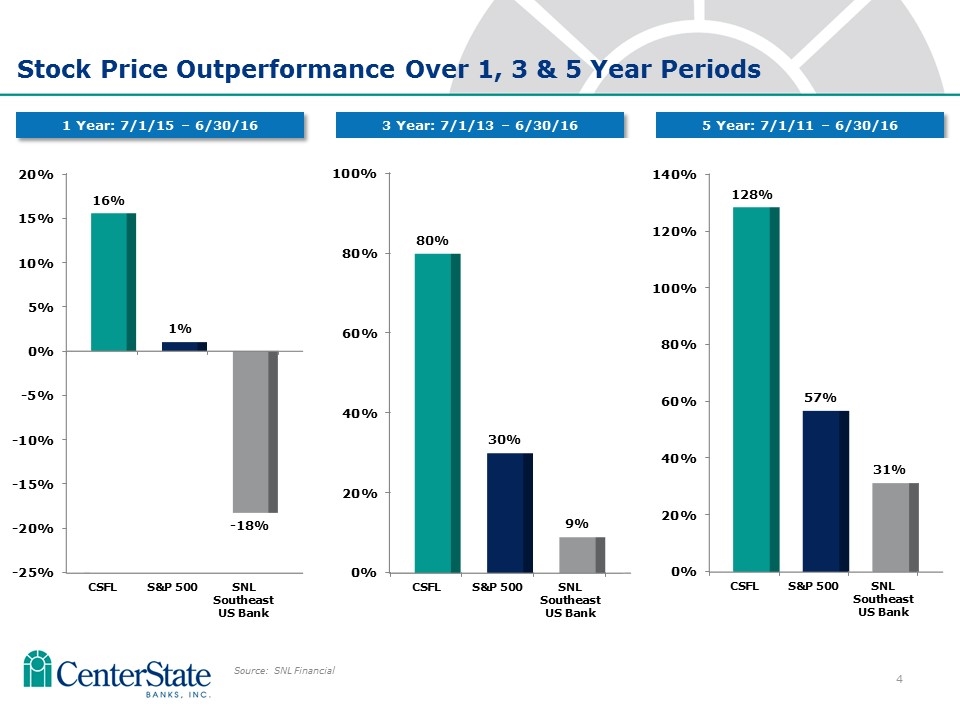
Stock Price Outperformance Over 1, 3 & 5 Year Periods 1 Year: 7/1/15 – 6/30/16 3 Year: 7/1/13 – 6/30/16 Source: SNL Financial 5 Year: 7/1/11 – 6/30/16
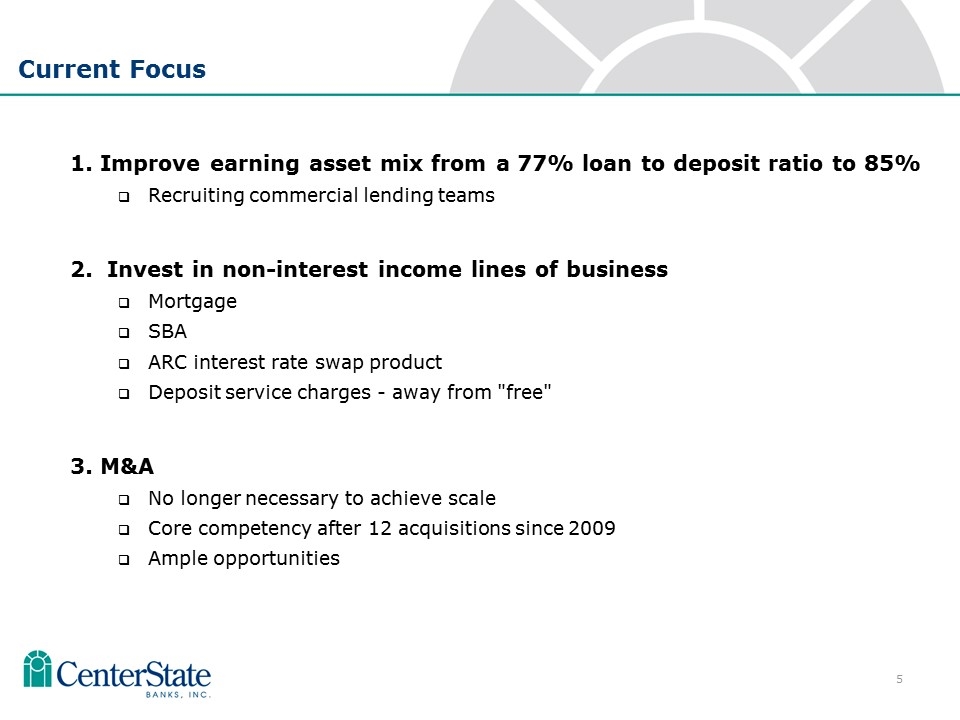
Current Focus 1. Improve earning asset mix from a 77% loan to deposit ratio to 85% Recruiting commercial lending teams 2. Invest in non-interest income lines of business Mortgage SBA ARC interest rate swap product Deposit service charges - away from "free" 3. M&A No longer necessary to achieve scale Core competency after 12 acquisitions since 2009 Ample opportunities

Banking the Sunshine State
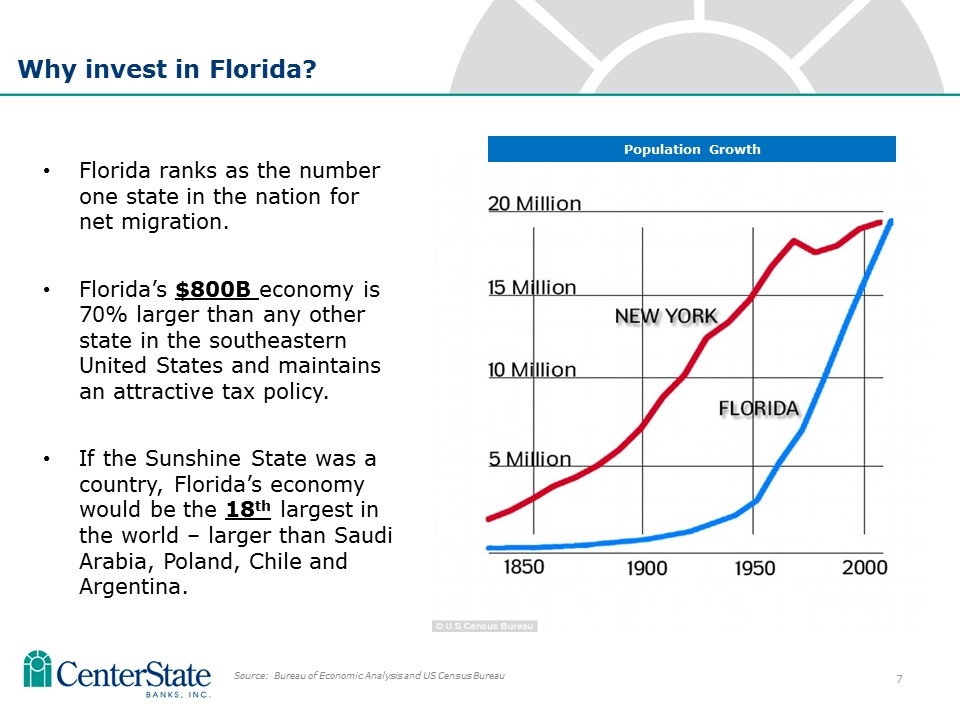
Florida ranks as the number one state in the nation for net migration. Florida’s $800B economy is 70% larger than any other state in the southeastern United States and maintains an attractive tax policy. If the Sunshine State was a country, Florida’s economy would be the 18th largest in the world – larger than Saudi Arabia, Poland, Chile and Argentina. Why invest in Florida? Source: Bureau of Economic Analysis and US Census Bureau Population Growth
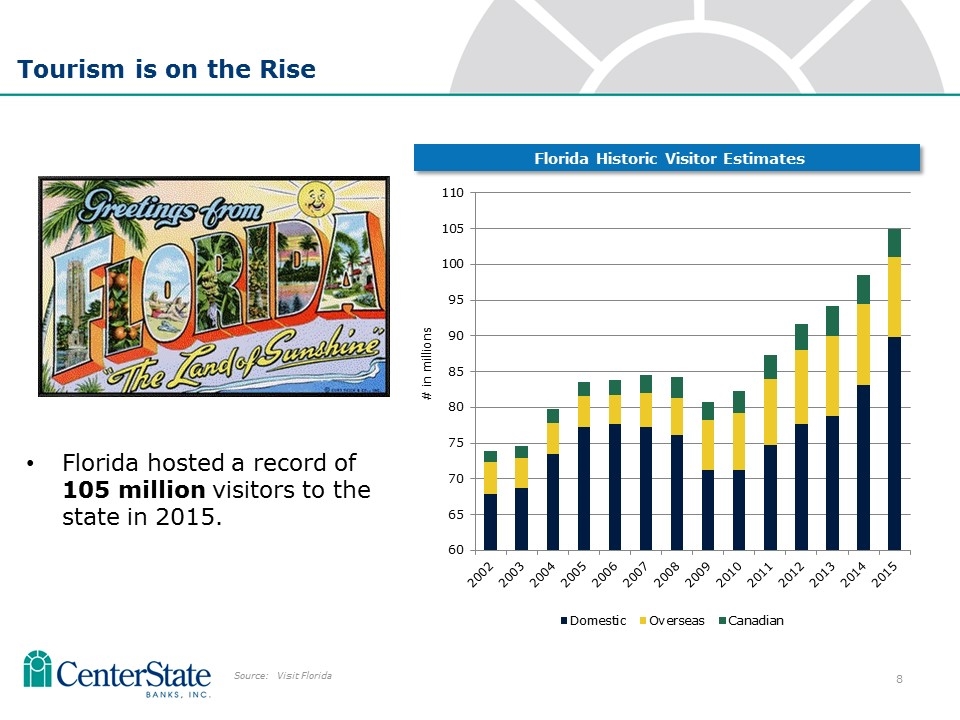
Florida hosted a record of 105 million visitors to the state in 2015. Tourism is on the Rise Source: Visit Florida Florida Historic Visitor Estimates
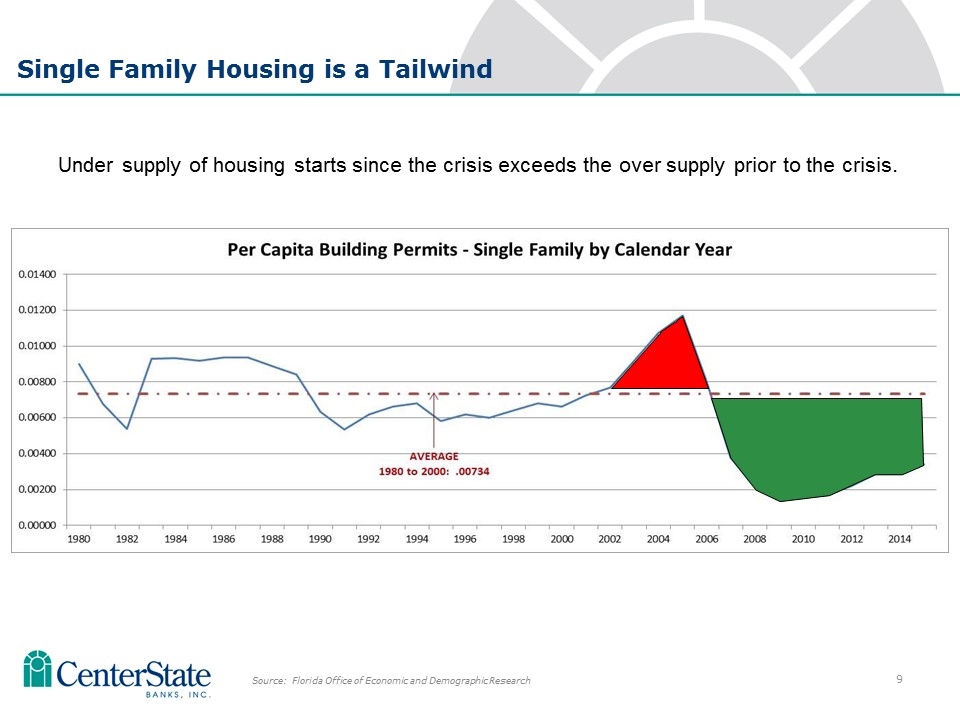
Single Family Housing is a Tailwind Under supply of housing starts since the crisis exceeds the over supply prior to the crisis. Source: Florida Office of Economic and Demographic Research Over supply Under supply
Capital Management
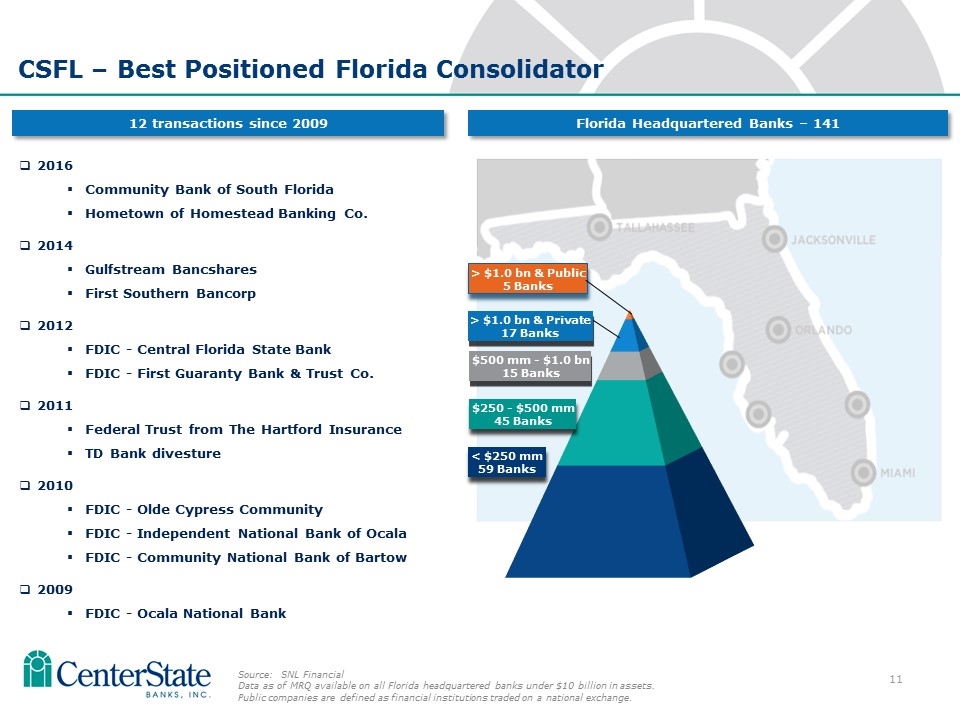
18 CSFL – Best Positioned Florida Consolidator Source: SNL Financial Data as of MRQ available on all Florida headquartered banks under $10 billion in assets. Public companies are defined as financial institutions traded on a national exchange. 2016 Community Bank of South Florida Hometown of Homestead Banking Co. 2014 Gulfstream Bancshares First Southern Bancorp 2012 FDIC - Central Florida State Bank FDIC - First Guaranty Bank & Trust Co. 2011 Federal Trust from The Hartford Insurance TD Bank divesture 2010 FDIC - Olde Cypress Community FDIC - Independent National Bank of Ocala FDIC - Community National Bank of Bartow 2009 FDIC - Ocala National Bank 12 transactions since 2009 Florida Headquartered Banks – 141
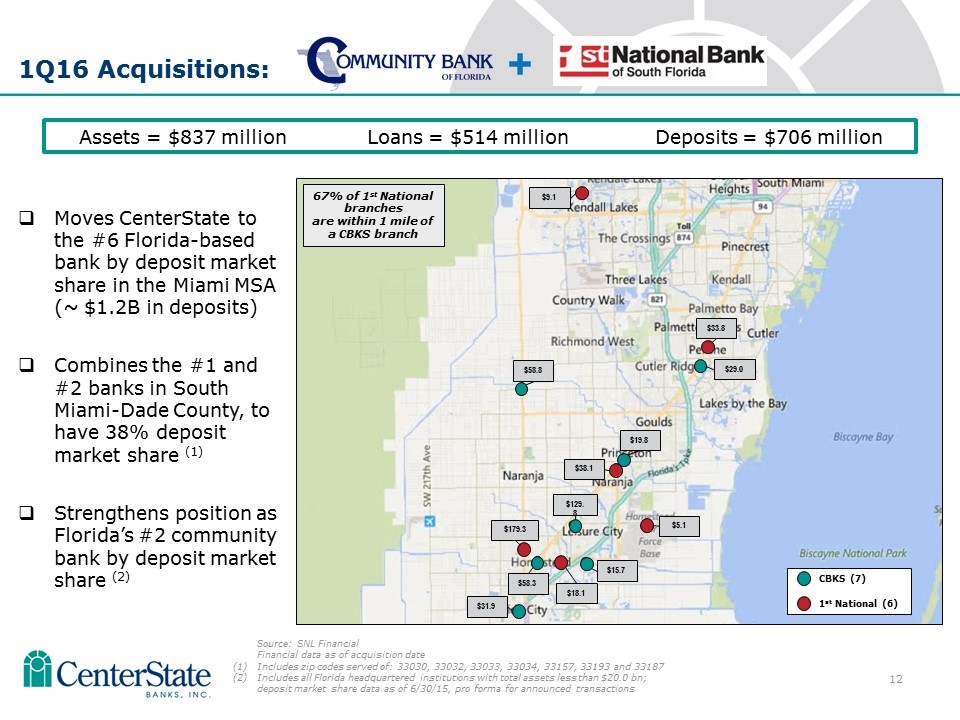
1Q16 Acquisitions: Assets = $837 millionLoans = $514 million Deposits = $706 million + $29.0 $19.8 $31.9 $179.3 67% of 1st National branches are within 1 mile of a CBKS branch CBKS (7) 1st National (6) $58.3 $15.7 $18.1 $129.8 $5.1 $33.8 $58.8 $9.1 $38.1 Moves CenterState to the #6 Florida-based bank by deposit market share in the Miami MSA (~ $1.2B in deposits) Combines the #1 and #2 banks in South Miami-Dade County, to have 38% deposit market share (1) Strengthens position as Florida’s #2 community bank by deposit market share (2) Source: SNL Financial Financial data as of acquisition date Includes zip codes served of: 33030, 33032, 33033, 33034, 33157, 33193 and 33187 Includes all Florida headquartered institutions with total assets less than $20.0 bn; deposit market share data as of 6/30/15, pro forma for announced transactions
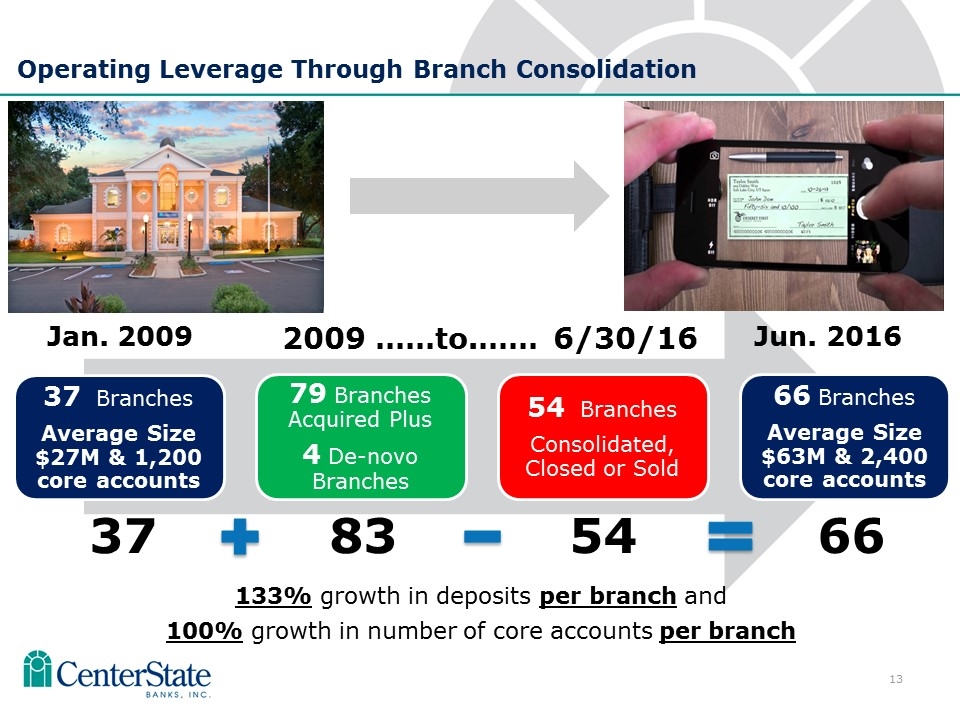
Operating Leverage Through Branch Consolidation 133% growth in deposits per branch and 100% growth in number of core accounts per branch 37 83 54 66 Jan. 2009 2009 ……to.…… 6/30/16 Jun. 2016 37 Branches Average Size $27M & 1,200 core accounts 79 Branches Acquired Plus 4 De-novo Branches 54 Branches Consolidated, Closed or Sold 66 Branches Average Size $63M & 2,400 core accounts
Operating Performance
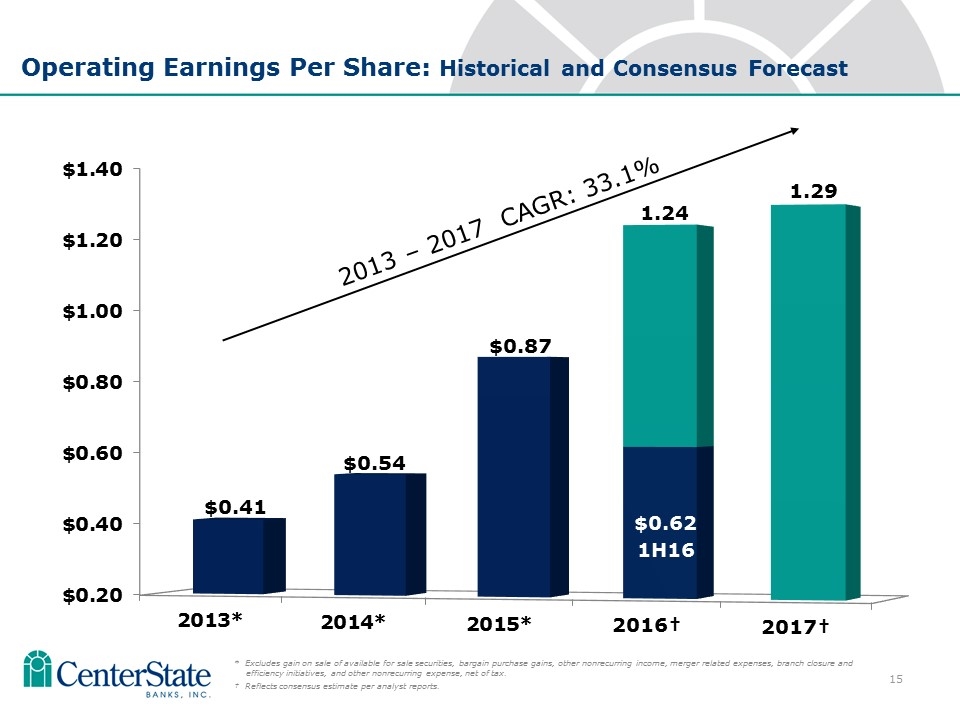
Operating Earnings Per Share: Historical and Consensus Forecast * Excludes gain on sale of available for sale securities, bargain purchase gains, other nonrecurring income, merger related expenses, branch closure and efficiency initiatives, and other nonrecurring expense, net of tax. † Reflects consensus estimate per analyst reports. 1.24 2013 – 2017 CAGR: 33.1% 1H16
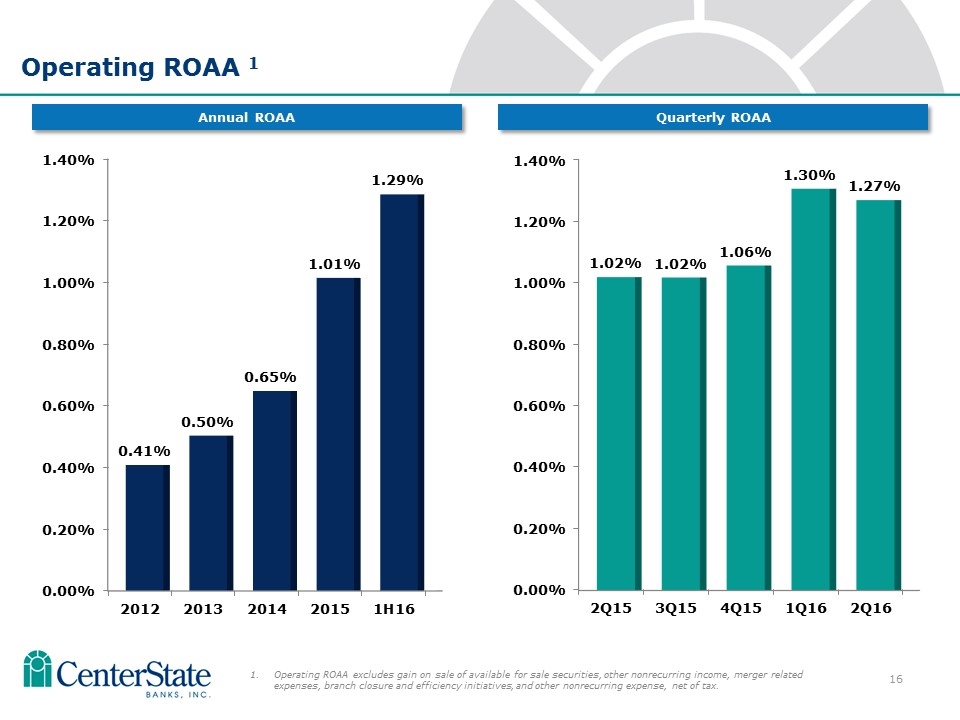
Operating ROAA 1 Operating ROAA excludes gain on sale of available for sale securities, other nonrecurring income, merger related expenses, branch closure and efficiency initiatives, and other nonrecurring expense, net of tax. Quarterly ROAA Annual ROAA
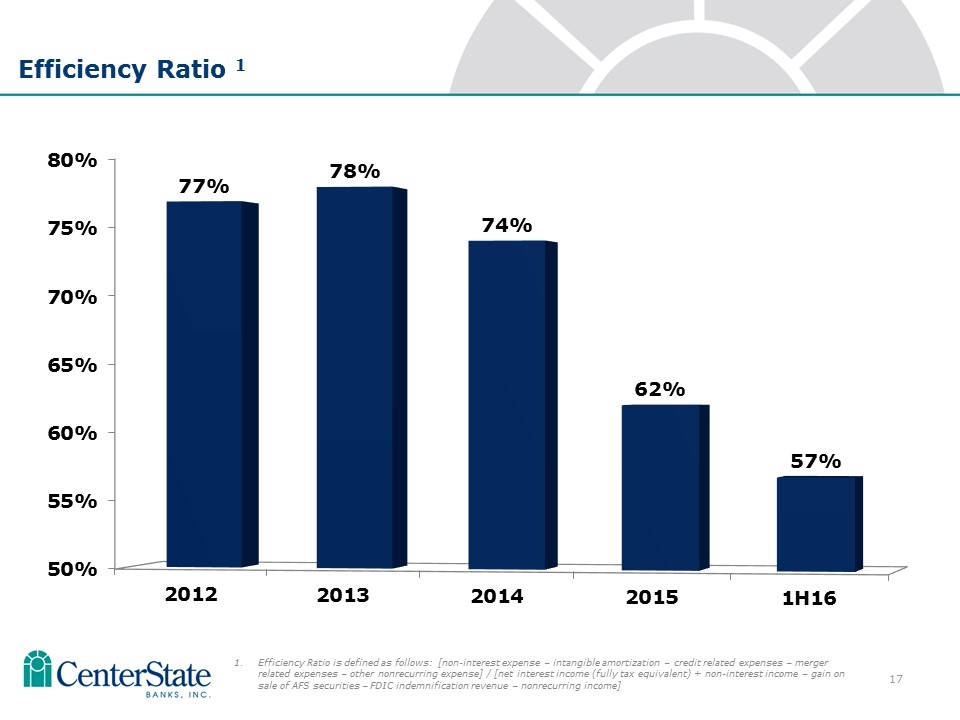
10 Efficiency Ratio 1 Efficiency Ratio is defined as follows: [non-interest expense – intangible amortization – credit related expenses – merger related expenses – other nonrecurring expense] / [net interest income (fully tax equivalent) + non-interest income – gain on sale of AFS securities – FDIC indemnification revenue – nonrecurring income]
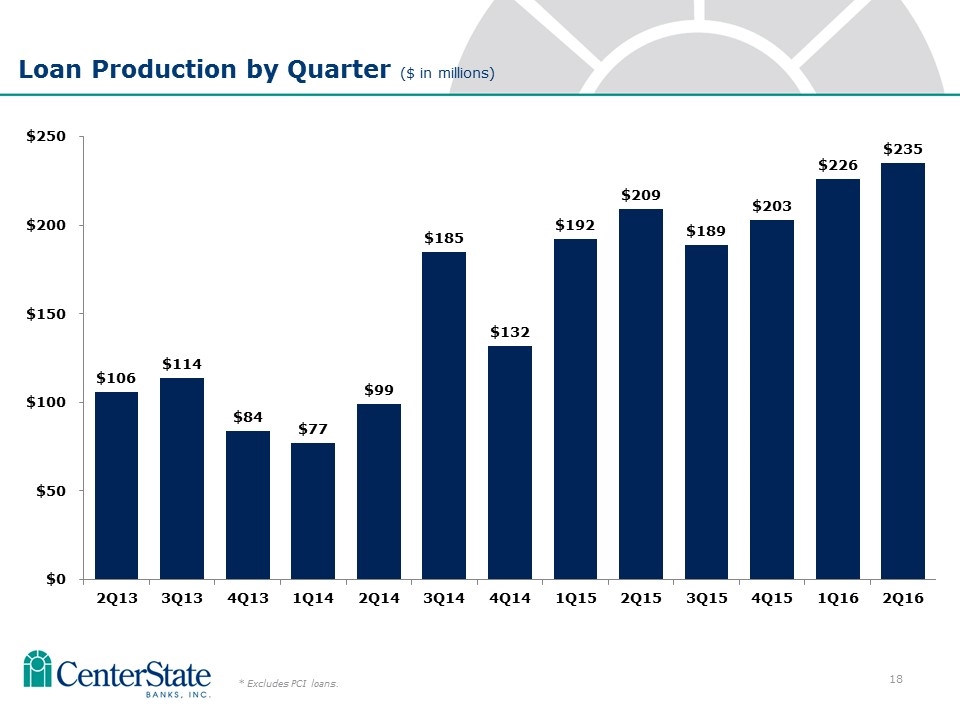
Loan Production by Quarter ($ in millions) * Excludes PCI loans.
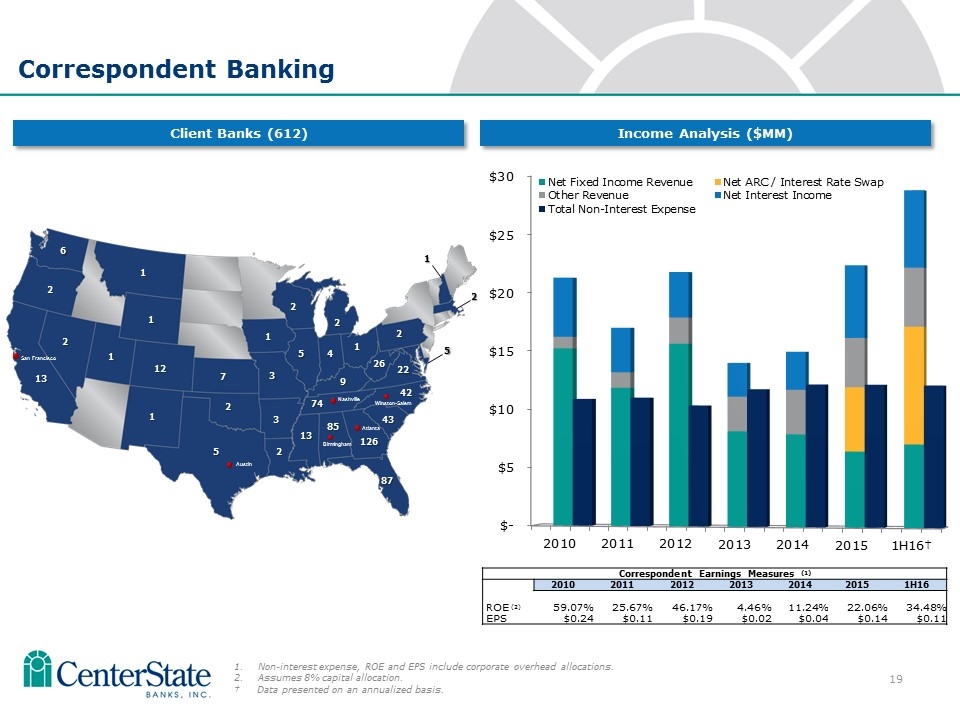
Non-interest expense, ROE and EPS include corporate overhead allocations. Assumes 8% capital allocation. † Data presented on an annualized basis. Correspondent Banking Client Banks (612) Income Analysis ($MM) Correspondent Earnings Measures (1) 2010 2011 2012 2013 2014 2015 1H16 ROE (2) 59.07% 25.67% 46.17% 4.46% 11.24% 22.06% 34.48% EPS $0.24 $0.11 $0.19 $0.02 $0.04 $0.14 $0.11 Birmingham Atlanta 87 5 3 2 13 74 43 42 9 22 26 Nashville Winston-Salem 5 3 2 4 1 7 1 2 2 2 12 1 1 1 1 2 13 2 6 2 1 5 San Francisco Austin 126 85
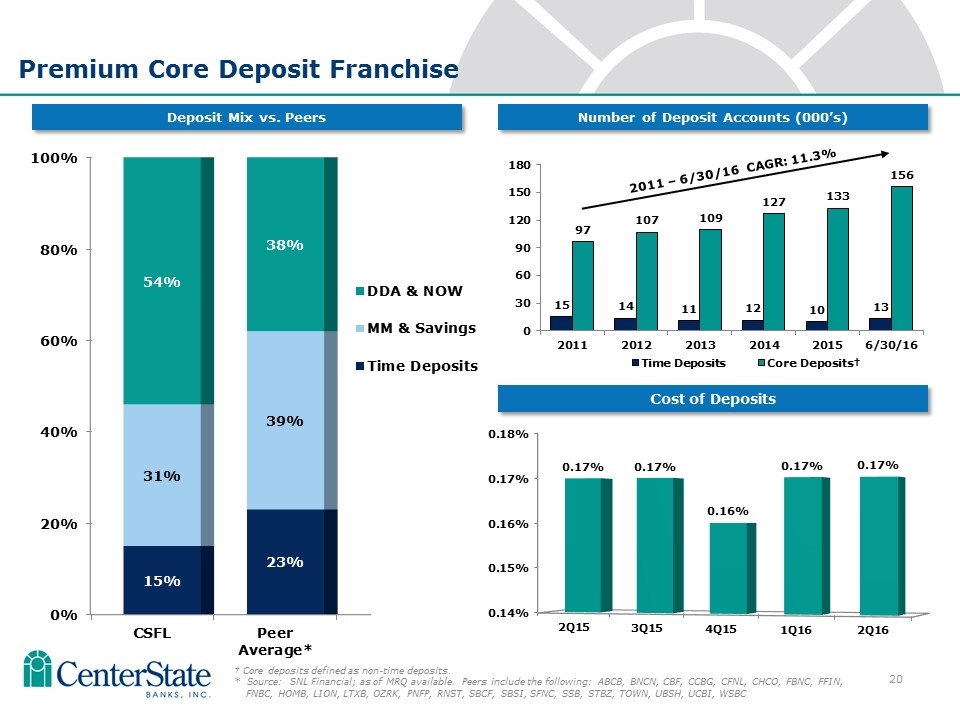
Premium Core Deposit Franchise Cost of Deposits 2011 – 6/30/16 CAGR: 11.3% Number of Deposit Accounts (000’s) Deposit Mix vs. Peers † Core deposits defined as non-time deposits. * Source: SNL Financial; as of MRQ available. Peers include the following: ABCB, BNCN, CBF, CCBG, CFNL, CHCO, FBNC, FFIN, FNBC, HOMB, LION, LTXB, OZRK, PNFP, RNST, SBCF, SBSI, SFNC, SSB, STBZ, TOWN, UBSH, UCBI, WSBC
Investment Thesis Based on strong operating results, CSFL shares outperformed the banking index over a 1, 3 & 5 year horizon. Florida is an economic powerhouse and leads the nation in net migration. With $5 billion in assets, CSFL ranks as the 2nd largest community bank headquartered in Florida. Investments are currently underway to accelerate organic growth and build shareholder value.

Supplemental
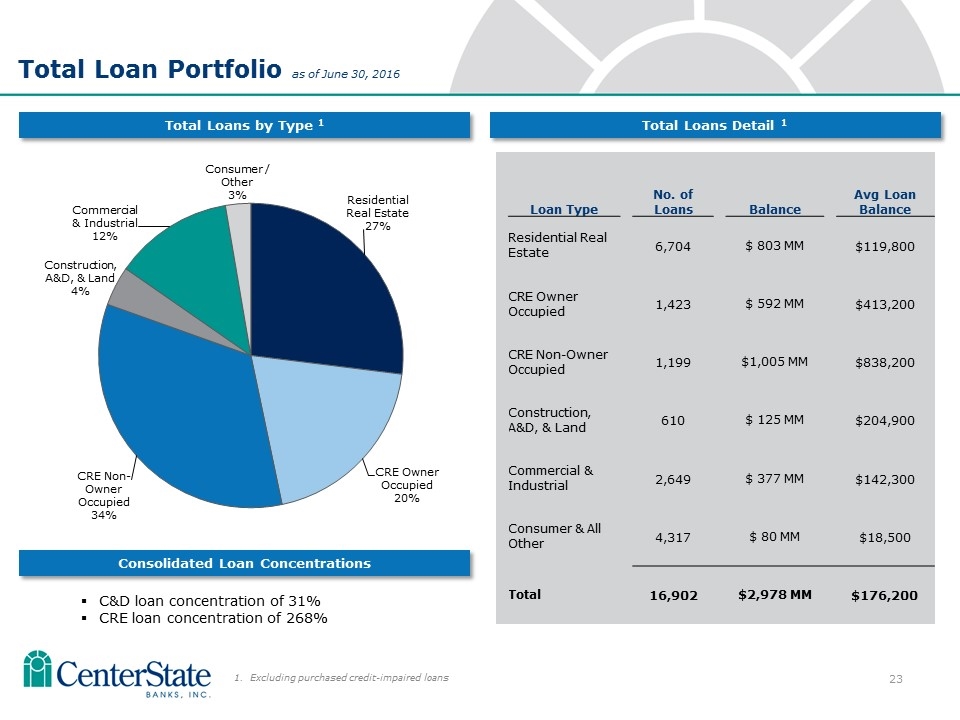
Total Loans by Type 1 Total Loans Detail 1 Loan Type No. of Loans Balance Avg Loan Balance Residential Real Estate 6,704 $ 803 MM $119,800 CRE Owner Occupied 1,423 $ 592 MM $413,200 CRE Non-Owner Occupied 1,199 $1,005 MM $838,200 Construction, A&D, & Land 610 $ 125 MM $204,900 Commercial & Industrial 2,649 $ 377 MM $142,300 Consumer & All Other 4,317 $ 80 MM $18,500 Total 16,902 $2,978 MM $176,200 Total Loan Portfolio as of June 30, 2016 1. Excluding purchased credit-impaired loans C&D loan concentration of 31% CRE loan concentration of 268% Consolidated Loan Concentrations
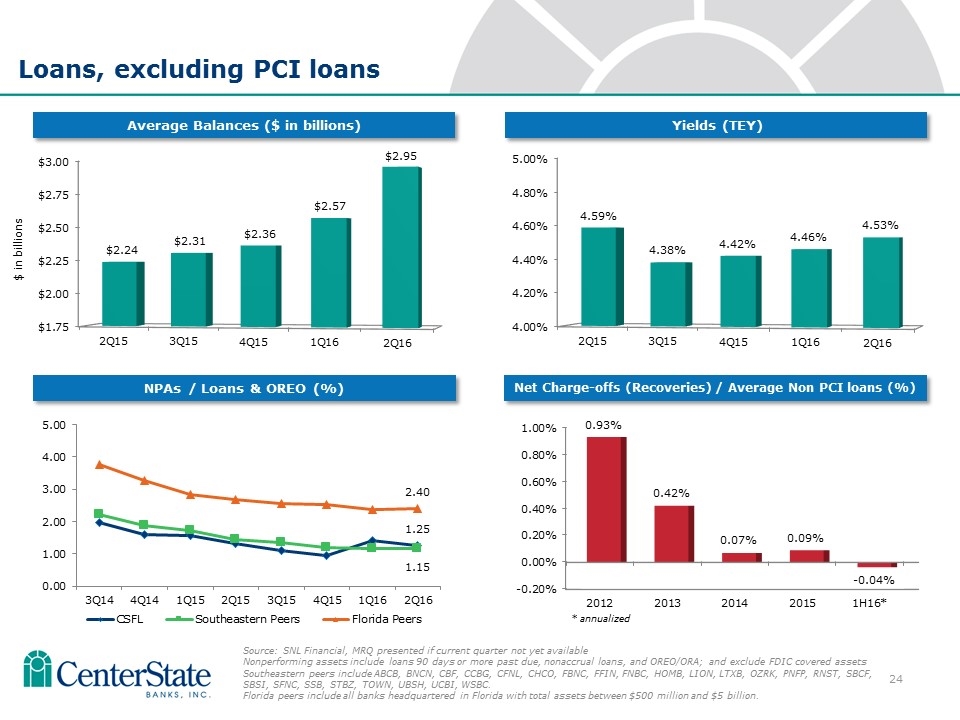
Loans, excluding PCI loans Yields (TEY) Average Balances ($ in billions) Source: SNL Financial, MRQ presented if current quarter not yet available Nonperforming assets include loans 90 days or more past due, nonaccrual loans, and OREO/ORA; and exclude FDIC covered assets Southeastern peers include ABCB, BNCN, CBF, CCBG, CFNL, CHCO, FBNC, FFIN, FNBC, HOMB, LION, LTXB, OZRK, PNFP, RNST, SBCF, SBSI, SFNC, SSB, STBZ, TOWN, UBSH, UCBI, WSBC. Florida peers include all banks headquartered in Florida with total assets between $500 million and $5 billion. NPAs / Loans & OREO (%) Net Charge-offs (Recoveries) / Average Non PCI loans (%) * annualized
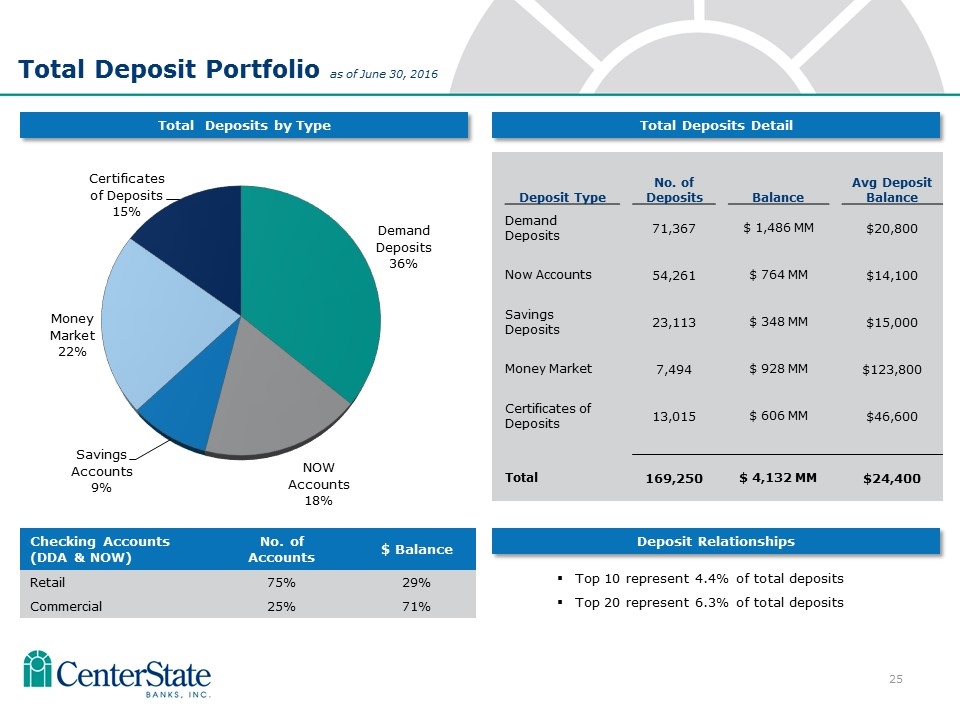
Total Deposits by Type Total Deposits Detail 23 Total Deposit Portfolio as of June 30, 2016 Deposit Type No. of Deposits Balance Avg Deposit Balance Demand Deposits 71,367 $ 1,486 MM $20,800 Now Accounts 54,261 $ 764 MM $14,100 Savings Deposits 23,113 $ 348 MM $15,000 Money Market 7,494 $ 928 MM $123,800 Certificates of Deposits 13,015 $ 606 MM $46,600 Total 169,250 $ 4,132 MM $24,400 Checking Accounts (DDA & NOW) No. of Accounts $ Balance Retail 75% 29% Commercial 25% 71% Top 10 represent 4.4% of total deposits Top 20 represent 6.3% of total deposits Deposit Relationships
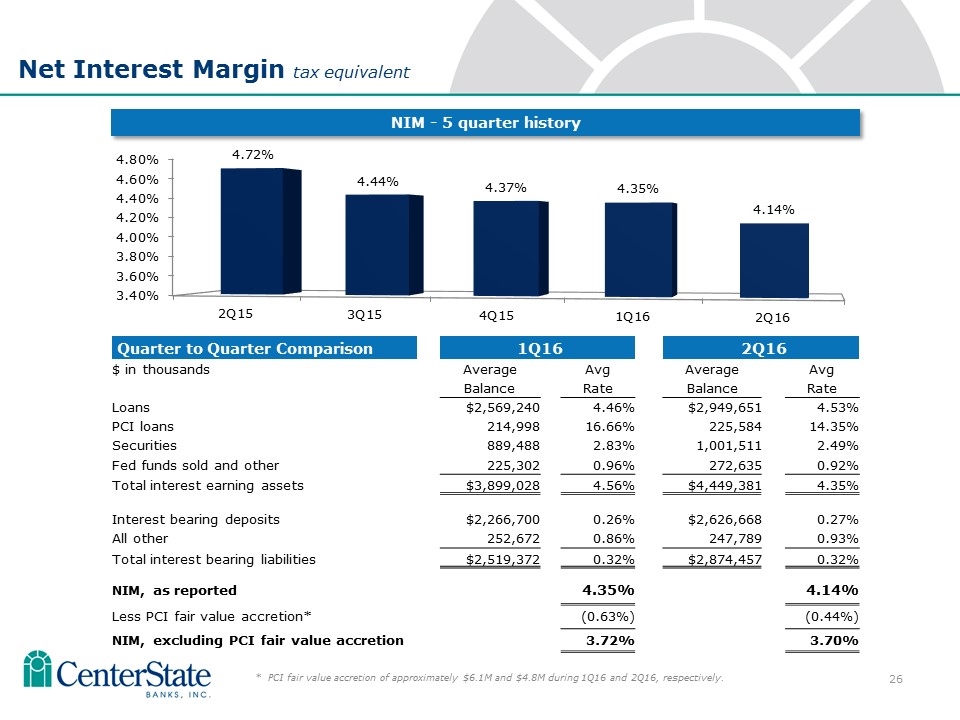
Net Interest Margin tax equivalent Quarter to Quarter Comparison 1Q16 2Q16 $ in thousands Average Avg Average Avg Balance Rate Balance Rate Loans $2,569,240 4.46% $2,949,651 4.53% PCI loans 214,998 16.66% 225,584 14.35% Securities 889,488 2.83% 1,001,511 2.49% Fed funds sold and other 225,302 0.96% 272,635 0.92% Total interest earning assets $3,899,028 4.56% $4,449,381 4.35% Interest bearing deposits $2,266,700 0.26% $2,626,668 0.27% All other 252,672 0.86% 247,789 0.93% Total interest bearing liabilities $2,519,372 0.32% $2,874,457 0.32% NIM, as reported 4.35% 4.14% Less PCI fair value accretion* (0.63%) (0.44%) NIM, excluding PCI fair value accretion 3.72% 3.70% NIM - 5 quarter history * PCI fair value accretion of approximately $6.1M and $4.8M during 1Q16 and 2Q16, respectively.
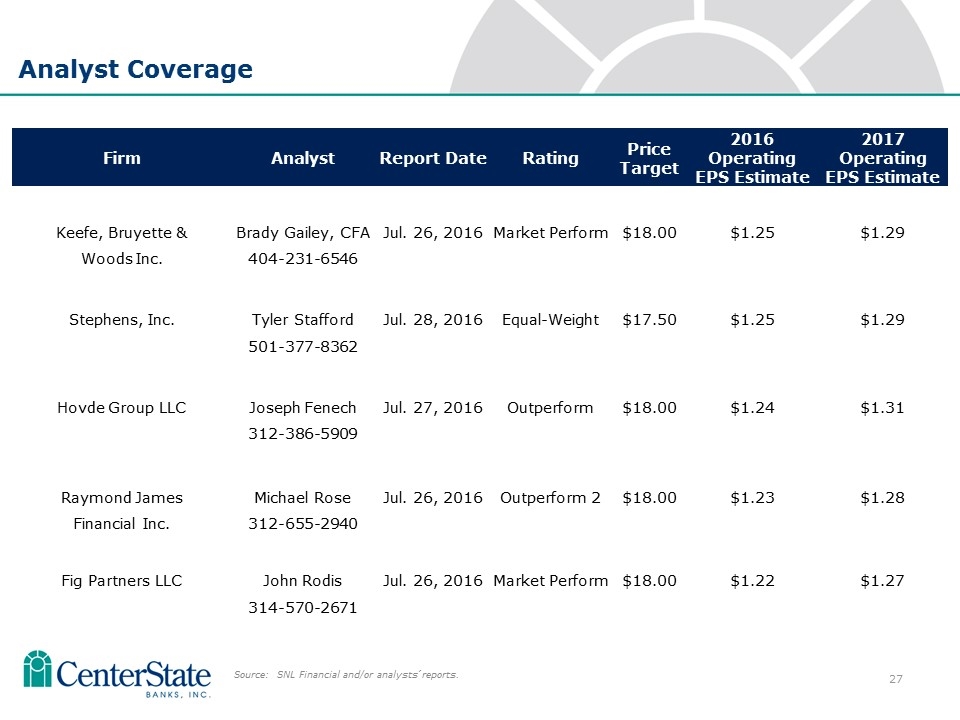
Analyst Coverage Source: SNL Financial and/or analysts’ reports. Firm Analyst Report Date Rating Price Target 2016 Operating EPS Estimate 2017 Operating EPS Estimate Keefe, Bruyette & Brady Gailey, CFA Jul. 26, 2016 Market Perform $18.00 $1.25 $1.29 Woods Inc. 404-231-6546 Stephens, Inc. Tyler Stafford Jul. 28, 2016 Equal-Weight $17.50 $1.25 $1.29 501-377-8362 Hovde Group LLC Joseph Fenech Jul. 27, 2016 Outperform $18.00 $1.24 $1.31 312-386-5909 Raymond James Michael Rose Jul. 26, 2016 Outperform 2 $18.00 $1.23 $1.28 Financial Inc. 312-655-2940 Fig Partners LLC John Rodis Jul. 26, 2016 Market Perform $18.00 $1.22 $1.27 314-570-2671
Investor Contacts Ernie Pinner John Corbett Executive Chairman President & Chief Executive Officer esp@centerstatebank.com jcorbett@centerstatebank.com Steve Young Jennifer Idell Chief Operating Officer Chief Financial Officer syoung@centerstatebank.com jidell@centerstatebank.com
