Attached files
| file | filename |
|---|---|
| 8-K - 8-K - Blackstone Group Inc | d229910d8k.htm |
Exhibit 99.1

|
Blackstone Reports Second Quarter Results
New York, July 21, 2016: Blackstone (NYSE:BX) today reported its second quarter 2016 results.
Stephen A. Schwarzman, Chairman and Chief Executive Officer, said, “Blackstone posted strong results in the second quarter, with Economic Net Income up over last year despite the notable market disturbances in the quarter. Our funds delivered good investment performance across our businesses. Investors around the world are in critical need of high-performing strategies and for many, Blackstone Funds are the solution. Against this backdrop we’ve had $132 billion of inflows since the beginning of 2015 and despite significant realizations in that time period, our Total Assets Under Management rose to a record $356 billion as of June 30.”
Blackstone’s press release of its second quarter 2016 results can also be viewed at www.blackstone.com.
Distribution
Blackstone has declared a quarterly distribution of $0.36 per common unit to record holders of common units at the close of business on August 1, 2016. This distribution will be paid on August 8, 2016.
Quarterly Investor Call Details
Blackstone will host a conference call on July 21, 2016 at 11:00 a.m. ET to discuss second quarter 2016 results. The conference call can be accessed via the Shareholders section of Blackstone’s website at www.blackstone.com or by dialing +1 (866) 338-0147 (U.S. domestic) or +1 (617) 399-5163 (international), pass code 149 943 55#. For those unable to listen to the live broadcast, a replay will be available on www.blackstone.com or by dialing +1 (888) 286-8010 (U.S. domestic) or +1 (617) 801-6888 (international), pass code 885 964 08#.
About Blackstone
Blackstone is one of the world’s leading investment firms. We seek to create positive economic impact and long-term value for our investors, the companies we invest in, and the communities in which we work. We do this by using extraordinary people and flexible capital to help companies solve problems. Our asset management businesses, with over $350 billion in assets under management, include investment vehicles focused on private equity, real estate, public debt and equity, non-investment grade credit, real assets and secondary funds, all on a global basis. Further information is available at www.blackstone.com. Follow Blackstone on Twitter @Blackstone.
The Blackstone Group L.P.
345 Park Avenue
New York, New York 10154
T 212 583 5000
Forward-Looking Statements
This release may contain forward-looking statements within the meaning of Section 27A of the Securities Act of 1933 and Section 21E of the Securities Exchange Act of 1934 which reflect Blackstone’s current views with respect to, among other things, Blackstone’s operations and financial performance. You can identify these forward-looking statements by the use of words such as “outlook,” “indicator,” “believes,” “expects,” “potential,” “continues,” “may,” “will,” “should,” “seeks,” “approximately,” “predicts,” “intends,” “plans,” “estimates,” “anticipates” or the negative version of these words or other comparable words. Such forward-looking statements are subject to various risks and uncertainties. Accordingly, there are or will be important factors that could cause actual outcomes or results to differ materially from those indicated in these statements. Blackstone believes these factors include but are not limited to those described under the section entitled “Risk Factors” in its Annual Report on Form 10-K for the fiscal year ended December 31, 2015, as such factors may be updated from time to time in its periodic filings with the Securities and Exchange Commission, which are accessible on the SEC’s website at www.sec.gov. These factors should not be construed as exhaustive and should be read in conjunction with the other cautionary statements that are included in this release and in the filings. Blackstone undertakes no obligation to publicly update or review any forward-looking statement, whether as a result of new information, future developments or otherwise.
This release does not constitute an offer of any Blackstone Fund.
Investor and Media Relations Contacts
| Joan Solotar Blackstone Tel: +1 (212) 583-5068 solotar@blackstone.com |
Weston Tucker Blackstone Tel: +1 (212) 583-5231 tucker@blackstone.com |
Christine Anderson Blackstone Tel: +1 (212) 583-5182 Christine.Anderson@blackstone.com |
2
 Blackstone’s Second Quarter 2016 Earnings July 21, 2016 |
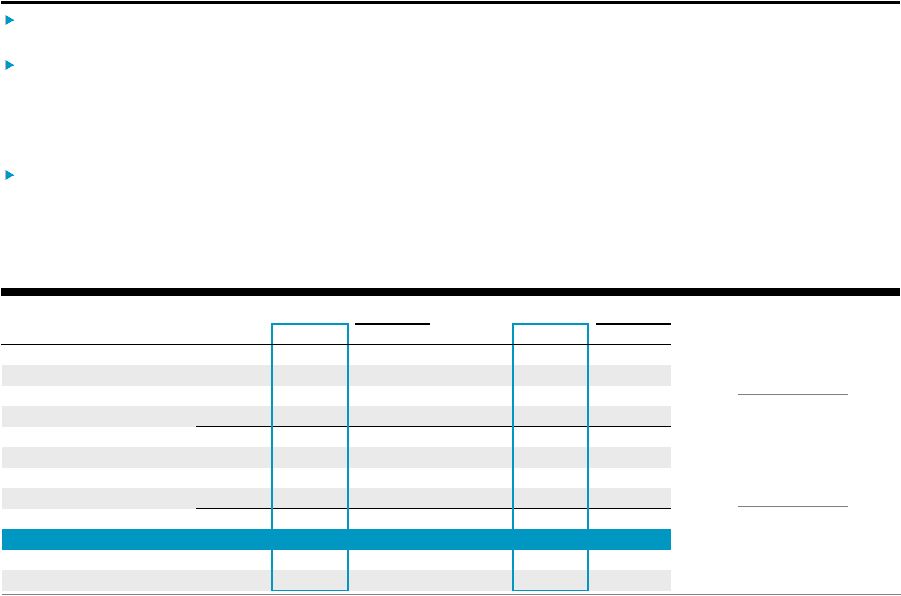
 Blackstone 1 Second Quarter 2016 GAAP Results GAAP Net Income was $463 million for the quarter, up 32% year-over-year. GAAP Net Income Attributable to The Blackstone Group L.P. was $199 million. % Change % Change (Dollars in Thousands, Except per Unit Data) (Unaudited) 2Q'15 2Q'16 vs. 2Q'15 2Q'15 YTD 2Q'16 YTD vs. 2Q'15 YTD Revenues Management and Advisory Fees, Net 574,132 $ 607,823 $ 6% 1,190,900 $ 1,216,729 $ 2% Performance Fees Realized Carried Interest 937,483 323,734 (65)% 2,145,077 554,643 (74)% Realized Incentive Fees 47,682 29,441 (38)% 77,320 57,860 (25)% Unrealized Carried Interest (441,930) 88,292 n/m (68,090) 135,878 n/m Unrealized Incentive Fees 25,070 7,776 (69)% 87,106 15,355 (82)% Total Performance Fees 568,305 449,243 (21)% 2,241,413 763,736 (66)% Investment Income (Loss) Realized 157,823 65,037 (59)% 345,753 53,036 (85)% Unrealized (100,999) 40,102 n/m (82,726) 43,595 n/m Total Investment Income 56,824 105,139 85% 263,027 96,631 (63)% Interest and Dividend Revenue 21,965 22,286 1% 43,885 45,361 3% Other 3,976 7,935 100% (1,665) 2,323 n/m Total Revenues 1,225,202 1,192,426 (3)% 3,737,560 2,124,780 (43)% Expenses Compensation and Benefits Compensation 473,019 355,424 (25)% 1,032,578 701,427 (32)% Performance Fee Compensation Realized Carried Interest 238,033 87,580 (63)% 530,281 146,084 (72)% Realized Incentive Fees 21,837 15,250 (30)% 34,064 29,374 (14)% Unrealized Carried Interest (50,559) 75,202 n/m 23,821 105,203 342% Unrealized Incentive Fees 6,130 2,689 (56)% 31,091 6,137 (80)% Total Compensation and Benefits 688,460 536,145 (22)% 1,651,835 988,225 (40)% General, Administrative and Other 146,859 130,988 (11)% 277,832 254,033 (9)% Interest Expense 37,414 36,878 (1)% 68,784 74,234 8% Fund Expenses 41,699 8,592 (79)% 58,549 13,821 (76)% Total Expenses 914,432 712,603 (22)% 2,057,000 1,330,313 (35)% Other Income Net Gains from Fund Investment Activities 82,015 30,703 (63)% 175,570 49,845 (72)% Income Before Provision for Taxes 392,785 $ 510,526 $ 30% 1,856,130 $ 844,312 $ (55)% Provision for Taxes 43,251 47,415 10% 142,595 56,561 (60)% Net Income 349,534 $ 463,111 $ 32% 1,713,535 $ 787,751 $ (54)% Net Income (Loss) Attributable to Redeemable Non-Controlling Interests in Consolidated Entities
13,780 (2,049) n/m 21,307 (8,450) n/m Net Income Attributable to Non-Controlling Interests in Consolidated Entities
66,716 64,729 (3)% 148,512 104,815 (29)% Net Income Attributable to Non-Controlling Interests in Blackstone Holdings
134,870 201,805 50% 780,100 333,007 (57)% Net Income Attributable to The Blackstone Group L.P. ("BX") 134,168 $ 198,626 $ 48% 763,616 $ 358,379 $ (53)% Net Income per Common Unit, Basic 0.21 $ 0.31 $
48% 1.21 $
0.55 $
(55)% Net Income per Common Unit, Diluted 0.21 $ 0.30 $
43% 1.21 $
0.54 $
(55)% n/m = not meaningful. |
 Blackstone 2 Second Quarter 2016 Segment Highlights Economic Net Income (“ENI”) was $520 million ($0.44/unit) in the quarter, up 2% year-over-year, on $1.2 billion of Total Segment Revenues. • ENI was $890 million ($0.75/unit) year-to-date on $2.1 billion of Total Segment Revenues. Distributable Earnings (“DE”) was $503 million ($0.42/unit) in the quarter, on $353 million of Realized Performance Fees. • DE was $891 million ($0.75/unit) year-to-date on $612 million of Realized Performance Fees. Fee Related Earnings (“FRE”) was $226 million in the second quarter, up 27% from $178 million in the prior year despite the spin-off of Blackstone’s Advisory businesses completed in October 2015. • FRE was $446 million year-to-date, on $1.2 billion of Fee Revenues. Total Assets Under Management (“AUM”) reached a record $356.3 billion through a combination of strong fundraising and organic expansion. • Gross inflows were $21.2 billion in the quarter, bringing the last twelve months (“LTM”) inflows to $70.0 billion. • Total AUM increased 7% year-over-year and Fee-Earning AUM was up 11% to $266.0 billion. Capital deployed of $4.0 billion in the quarter and $10.7 billion year-to-date was achieved by leveraging Blackstone’s diverse platform to find opportunities globally. Blackstone declared a second quarter distribution of $0.36 per common unit payable on August 8, 2016. |
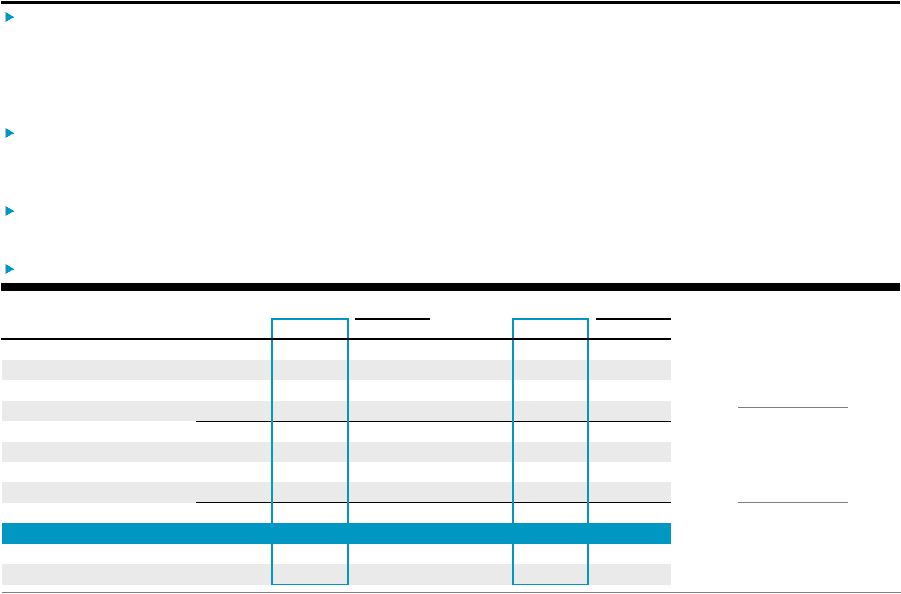
 Blackstone 3 Second Quarter 2016 Segment Earnings The changes in carrying value, fund returns and composite returns presented throughout this presentation represent those of the
applicable Blackstone Funds and not those of The Blackstone Group
L.P. % Change
% Change (Dollars in Thousands, Except per Unit Data) 2Q'15 2Q'16 vs. 2Q'15 2Q'15 YTD 2Q'16 YTD vs. 2Q'15 YTD Fee Revenues 590,757 $ 620,766 $ 5% 1,205,648 $ 1,227,719 $ 2% Performance Fees 569,664 449,372 (21)% 2,243,400 763,437 (66)% Investment Income 10,774 59,771 455% 200,415 33,121 (83)% Interest Income and Dividend Revenue 31,026 35,233 14% 61,477 70,314 14% Total Revenues 1,202,221 1,165,142 (3)% 3,710,940 2,094,591 (44)% Total Expenses 673,194 624,132 (7)% 1,550,130 1,166,136 (25)% Taxes 20,587 21,234 3% 30,306 38,028 25% Economic Net Income (“ENI”) 508,440 $ 519,776 $ 2% 2,130,504 $ 890,427 $ (58)% ENI per Unit 0.43 $
0.44 $
2% 1.80 $
0.75 $
(58)% Fee Related Earnings (“FRE”) 178,441 $ 226,136 $ 27% 359,065 $ 445,592 $ 24% Distributable Earnings (“DE”) 1,033,920 $ 503,459 $ (51)% 2,274,127 $ 891,426 $ (61)% DE per Common Unit 0.88 $
0.42 $
(52)% 1.93 $
0.75 $
(61)% Total AUM 332,723,546 $ 356,281,669 $ 7% 332,723,546 $ 356,281,669 $ 7% Fee-Earning AUM 239,342,214 $ 266,006,713 $ 11% 239,342,214 $ 266,006,713 $ 11% |
 Blackstone 4 Private Equity 2.5% 2Q’16 increase in Corporate Private Equity carrying value $7.1 billion 2Q’16 capital raised $99.7 billion Total AUM up 8% YoY Corporate Private Equity carrying value increased 2.5% in the quarter due to appreciation in both the private and public investment portfolios. Realizations of $3.8 billion in the quarter and $5.9 billion year-to-date were driven mainly by sales in Corporate Private Equity’s public portfolio and Strategic Partners. Deployed $1.6 billion during the quarter and $3.6 billion year-to-date across the segment. Raised $7.1 billion in the quarter across the segment, including closings for the seventh secondary fund and the first core private equity fund, bringing total capital raised to $19.5 billion over the LTM. Total AUM increased 8% year-over-year to a record $99.7 billion, driven by fundraising across all strategies within the segment. Fee-Earning AUM increased 40% year-over-year due to the commencement of investment periods of various flagship funds across the segment, contributing to Fee Revenues increasing 31% year-over-year. % Change % Change (Dollars in Thousands) 2Q'15 2Q'16 vs. 2Q'15 2Q'15 YTD 2Q'16 YTD vs. 2Q'15 YTD Fee Revenues 108,406 $ 141,766 $ 31% 232,803 $ 272,899 $ 17% Performance Fees 241,002 142,103 (41)% 1,190,802 246,260 (79)% Investment Income 27,957 20,160 (28)% 104,260 20,243 (81)% Interest Income and Dividend Revenue 7,669 9,516 24% 15,287 19,365 27% Total Revenues 385,034 313,545 (19)% 1,543,152 558,767 (64)% Compensation 68,106 83,140 22% 139,178 163,414 17% Performance Fee Compensation 80,928 50,396 (38)% 298,530 75,119 (75)% Other Operating Expenses 62,571 48,371 (23)% 101,446 96,434 (5)% Total Expenses 211,605 181,907 (14)% 539,154 334,967 (38)% Economic Income 173,429 $ 131,638 $ (24)% 1,003,998 $ 223,800 $ (78)% Total AUM 92,026,337 $ 99,685,655 $ 8% 92,026,337 $ 99,685,655 $ 8% Fee-Earning AUM 49,537,189 $ 69,467,174 $ 40% 49,537,189 $ 69,467,174 $ 40% |
 Blackstone 5 Real Estate 2.2% 2Q’16 increase in opportunistic funds’ carrying value $223 million 2Q’16 Fee Revenues up 41% YoY $103.2 billion Total AUM up 13% YoY Opportunistic funds’ carrying value up 2.2% during the quarter due to gains in private investment values, partially offset by reductions in value for London office holdings; core+ funds’ carrying value up 2.1% during the quarter. Sustained strong level of realizations with $3.4 billion in the quarter driven by private asset sales in the Equity Office Property and Trizec office portfolios, two secondary equity offerings of the Brixmor public stake and sale of a 66% interest in Tysan Holdings, a Hong Kong publicly listed real estate company. Invested $1.6 billion in the quarter, including the U.S. retail portfolio of RioCan, a Canadian public REIT. Raised $4.1 billion in the quarter across the platform, including $1.4 billion for the fifth European opportunistic fund, $1.2 billion for the third mezzanine debt fund and $1.0 billion for U.S. core+ funds. Total AUM up 13% year-over-year to $103.2 billion and Fee-Earning AUM up 6% year-over-year to $66.7 billion driven by growth in core+ funds. • Total AUM of $12.9 billion in core+ funds, an increase of more than 100% year-over-year. % Change % Change (Dollars in Thousands) 2Q'15 2Q'16 vs. 2Q'15 2Q'15 YTD 2Q'16 YTD vs. 2Q'15 YTD Fee Revenues 157,902 $ 223,128 $ 41% 316,623 $ 453,325 $ 43% Performance Fees 180,530 193,548 7% 817,552 396,487 (52)% Investment Income (Loss) (22,259) 11,027 n/m 86,595 21,865 (75)% Interest Income and Dividend Revenue 10,259 13,084 28% 20,256 26,272 30% Total Revenues 326,432 440,787 35% 1,241,026 897,949 (28)% Compensation 79,484 102,888 29% 164,318 203,466 24% Performance Fee Compensation 66,510 76,540 15% 217,853 153,610 (29)% Other Operating Expenses 43,346 52,201 20% 83,489 100,298 20% Total Expenses 189,340 231,629 22% 465,660 457,374 (2)% Economic Income 137,092 $ 209,158 $ 53% 775,366 $ 440,575 $ (43)% Total AUM 91,578,634 $ 103,197,060 $ 13% 91,578,634 $ 103,197,060 $ 13% Fee-Earning AUM 62,683,857 $ 66,744,550 $ 6% 62,683,857 $ 66,744,550 $ 6% |
 Blackstone 6 Hedge Fund Solutions 1.4% 2Q’16 Composite Gross Return The composite gross return was 1.4% in the quarter, despite challenging market conditions and volatility. Gross inflows of $2.0 billion during the quarter, $5.2 billion year-to-date and $10.7 billion LTM were driven by customized and commingled strategies and individual investor solutions. • July 1 subscriptions of $1.0 billion are not yet included in AUM. Total AUM reached $68.6 billion during the quarter, driven by continued platform diversification and growth in customized strategies and individual investor solutions. • Total AUM for BAAM’s individual investor solutions platform was $6.7 billion, up 47% from $4.6 billion year-over-year. $2.0 billion 2Q’16 Gross Inflows $68.6 billion Total AUM up 1% YoY % Change % Change (Dollars in Thousands) 2Q'15 2Q'16 vs. 2Q'15 2Q'15 YTD 2Q'16 YTD vs. 2Q'15 YTD Fee Revenues 130,067 $ 131,243 $ 1% 258,842 $ 260,556 $ 1% Performance Fees 40,784 1,586 (96)% 98,727 1,367 (99)% Investment Income (Loss) 275 8,842 n/m (5,617) (8,194) 46% Interest Income and Dividend Revenue 3,970 5,205 31% 7,919 10,501 33% Total Revenues 175,096 146,876 (16)% 359,871 264,230 (27)% Compensation 45,841 44,436 (3)% 101,945 98,605 (3)% Performance Fee Compensation 16,552 2,043 (88)% 35,673 2,711 (92)% Other Operating Expenses 20,499 27,218 33% 41,705 53,364 28% Total Expenses 82,892 73,697 (11)% 179,323 154,680 (14)% Economic Income 92,204 $ 73,179 $ (21)% 180,548 $ 109,550 $ (39)% Total AUM 67,829,866 $ 68,649,878 $ 1% 67,829,866 $ 68,649,878 $ 1% Fee-Earning AUM 65,512,170 $ 64,973,999 $ (1)% 65,512,170 $ 64,973,999 $ (1)% The composite gross return is based on the BAAM Principal Solutions (“BPS”) Composite, which does not include BAAM’s
individual investor solutions (liquid alternatives),
long-biased commodities, ventures (seeding and minority interests),
strategic opportunities (co-investments), Senfina (direct trading) and advisory (non-discretionary) platforms, except for investments by BPS funds directly into those platforms. BAAM-managed funds in liquidation are also excluded. On
a net of fees basis, the BPS Composite was 1.2% for
2Q’16. |
 Blackstone 7 Credit $7.3 billion 2Q’16 Gross Inflows $84.7 billion Total AUM up 4% YoY 2Q’16 Composite Gross Returns Performing Credit 9.7% Distressed 7.3% Strong performance across strategies, resulting in gross returns of 9.7% in Performing Credit and 7.3% in Distressed Strategies. • Performance was driven by a significant rebound in energy investments, as well as broad-based appreciation across funds. Total AUM reached a record $84.7 billion in the quarter driven by several capital raises: $3.3 billion for the initial closings of a new mezzanine fund, $1.2 billion for two new CLOs and $960 million for a new opportunistic fund focused on market dislocations. Deployed or committed $1.7 billion of capital during the quarter, predominantly in European deals and investments in the energy sector. Continued realization activity across drawdown funds of $771 million in the quarter. % Change % Change (Dollars in Thousands) 2Q'15 2Q'16 vs. 2Q'15 2Q'15 YTD 2Q'16 YTD vs. 2Q'15 YTD Fee Revenues 122,339 $ 124,629 $ 2% 244,468 $ 240,939 $ (1)% Performance Fees 107,348 112,135 4% 136,319 119,323 (12)% Investment Income (Loss) 5,483 19,742 260% 14,607 (793) n/m Interest Income and Dividend Revenue 5,938 7,428 25% 11,589 14,176 22% Total Revenues 241,108 263,934 9% 406,983 373,645 (8)% Compensation 47,124 55,691 18% 97,001 108,073 11% Performance Fee Compensation 51,451 51,744 1% 67,201 55,358 (18)% Other Operating Expenses 23,539 29,464 25% 45,375 55,684 23% Total Expenses 122,114 136,899 12% 209,577 219,115 5% Economic Income 118,994 $ 127,035 $ 7% 197,406 $ 154,530 $ (22)% Total AUM 81,288,709 $ 84,749,076 $ 4% 81,288,709 $ 84,749,076 $ 4% Fee-Earning AUM 61,608,998 $ 64,820,990 $ 5% 61,608,998 $ 64,820,990 $ 5% Performing Credit Strategies include mezzanine lending funds, Business Development Companies (“BDCs”) and other performing
credit strategy funds. Distressed Strategies include hedge fund strategies, rescue lending funds and distressed energy strategies. The composite gross returns represent a weighted-average composite of the
fee-earning funds exceeding $100 million of fair value at each respective quarter end for each strategy. Composite gross returns exclude the Blackstone Funds that were contributed to GSO as part of
Blackstone’s acquisition of GSO in March 2008. Performing Credit Strategies’ net returns were 8.3% for 2Q'16 and Distressed Strategies’ net returns were 6.2% for 2Q'16. The breakdown of Total AUM for
2Q’16 is as follows: Distressed Strategies $22.1 billion (34% Incentive Fee, 66% Carried Interest), Performing Credit Strategies $31.2 billion (56% Incentive Fee, 44% Carried Interest), and Long Only $31.4
billion. |
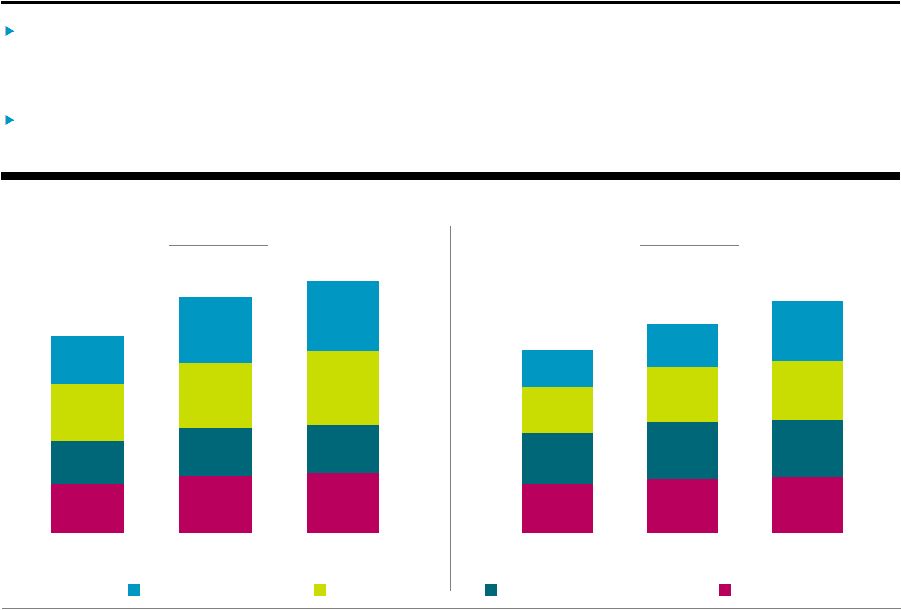 Blackstone 8 $69.5 $81.3 $84.7 $60.7 $67.8 $68.6 $80.4 $91.6 $103.2 $68.3 $92.0 $99.7 2Q'14 2Q'15 2Q'16 Fee-Earning AUM by Segment (Dollars in Billions) Total AUM by Segment (Dollars in Billions) $278.9 Private Equity Real Estate Hedge Fund Solutions Credit Assets Under Management $56.1 $61.6 $64.8 $58.1 $65.5 $65.0 $52.8 $62.7 $66.7 $42.9 $49.5 $69.5 2Q'14 2Q'15 2Q'16 $332.7 $356.3 $209.9 $239.3 $266.0 Total AUM increased 7% year-over-year to $356.3 billion driven by $70.0 billion from gross inflows.
• Each segment experienced growth despite $48.0 billion of capital returned to investors during the LTM.
Fee-Earning AUM of $266.0 billion was up 11%
year-over-year as $63.7 billion of gross inflows significantly outpaced $34.3 billion of realizations and outflows. |
 Blackstone 9 $14.5 $17.7 $25.9 $139.7 $155.1 $129.0 $9.0 $16.2 $44.7 $42.2 $78.7 $95.5 2Q'14 2Q'15 2Q'16 Additional Capital Detail Undrawn capital (“Total Dry Powder”) was $98.5 billion, up 20% year-over-year, driven by recent fundraises for the latest global private equity and real estate funds. Performance Fee Eligible AUM reached $269.2 billion at quarter end, up 8% year-over-year, despite significant realizations in the Real Estate and Private Equity segments. Uninvested Not Currently Earning Performance Fees Currently Earning Performance Fees Private Equity Real Estate Hedge Fund Solutions Credit $98 billion 2Q’16 Total Dry Powder $269 billion Performance Fee Eligible AUM $60 billion Not Currently Earning Management Fees $250.0 $269.2 $191.0 Credit Hedge Fund Solutions Real Estate Private Equity $59.8 $43.4 $33.7 $4.1 $17.3 |
 Blackstone 10 2Q'14 2Q'15 2Q'16 At June 30, 2016, Blackstone had $3.5
billion
in
total
cash,
cash
equivalents,
and
corporate
treasury
investments
and
$9.
1 billion
of
total
net
value,
or
$7.
62
per
unit.
Blackstone
has
no
net
debt,
a
$1.1
billion
undrawn
credit
revolver
and
maintained
A+/A+
ratings.
Deconsolidated Balance Sheet Highlights
A+/A+
rated by S&P and Fitch
$1.1 billion
undrawn credit revolver with
May 2019 maturity
$3.5 billion
total cash and
corporate treasury
$7.62
$9.43
$8.60
Total Net Value
(Per Unit) (Dollars in Millions) 2Q’16 Cash and Cash Equivalents $ 1,495 Corporate Treasury Investments 2,021 GP/Fund Investments 2,214 Net Accrued Performance Fees 3,321 Total Net Value $ 9,051 Outstanding Bonds (at par) $ 2,819 Balance Sheet Highlights are preliminary, and exclude the consolidated Blackstone Funds. Investments include Blackstone investments in
Private Equity, Real Estate, Hedge Fund Solutions, and
Credit, which were $782 million, $1.0 billion, $123 million, and $267 million, respectively, as of June 30, 2016, $1.0 billion, $1.1 billion, $133 million, and $232 million, respectively, as of June 30, 2015 and $1.1 billion, $1.6 billion, $120 million, and $263 million, respectively, as of June 30, 2014.
Total Net Value per unit amounts are calculated using
period end DE Units Outstanding (see page 31, Unit Rollforward). |
 Blackstone 11 $632 $1,454 $718 $298 $1,138 $475 2Q'14 LTM 2Q'15 LTM 2Q'16 LTM $2,664 $2,424 $2,130 $1,275 $1,764 $1,064 2Q'14 2Q'15 2Q'16 Performance Fees Net Realized Performance Fees (Dollars in Millions) $2,828 $1,300 $1,211 Net Accrued Performance Fees (Dollars in Millions) $4,472 $3,321 $4,241 Private Equity Real Estate Credit Hedge Fund Solutions $3.3 billion Net Accrued Performance Fees 53% Net Accrued Performance Fees Related to Publics/Pending Exits $1.3 billion 2Q’16 LTM Net Realized Performance Fees Net Accrued Performance Fees per unit is calculated using period end DE Units Outstanding (see page 31, Unit Rollforward).
Net
Accrued
Performance
Fees
were
$3.3
billion
($2.80/unit)
despite
Net
Realized
Performance
Fees
of
$1.3
billion
over
the
last
twelve
months. |
 Appendix |
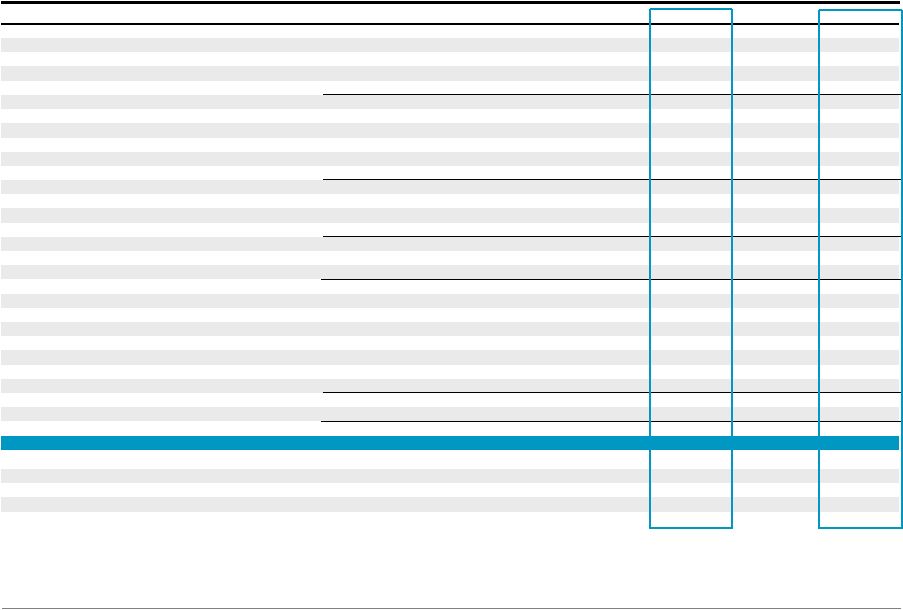
 Blackstone 13 Total Segments (Dollars in Thousands) 2Q'15 3Q'15 4Q'15 1Q'16 2Q'16 2Q'15 YTD 2Q'16 YTD Revenues Management and Advisory Fees, Net Base Management Fees 516,492 $
564,287 $
599,407 $
586,703 $
593,996 $
1,032,889 $ 1,180,699 $ Advisory Fees 76,998 146,153 742 481 1,277 161,236 1,758 Transaction and Other Fees, Net 11,728 32,403 72,481 46,118 32,343 48,801 78,461 Management Fee Offsets (18,434) (34,176) (22,939) (20,101) (15,396) (36,379) (35,497) Total Management and Advisory Fees, Net 586,784 708,667 649,691 613,201 612,220 1,206,547 1,225,421 Performance Fees Realized Carried Interest 937,483 435,189 625,610 230,909 323,734 2,145,077 554,643 Realized Incentive Fees 47,819 34,785 82,472 28,450 29,363 77,489 57,813 Unrealized Carried Interest (441,949) (1,055,977) (471,222) 47,606 88,268 (68,097) 135,874 Unrealized Incentive Fees 26,311 (53,346) (42,834) 7,100 8,007 88,931 15,107 Total Performance Fees 569,664 (639,349) 194,026 314,065 449,372 2,243,400 763,437 Investment Income (Loss) Realized 136,497 87,526 86,993 (10,101) 53,670 244,289 43,569 Unrealized (125,723) (223,657) (98,428) (16,549) 6,101 (43,874) (10,448) Total Investment Income (Loss) 10,774 (136,131) (11,435) (26,650) 59,771 200,415 33,121 Interest Income and Dividend Revenue 31,026 35,459 34,665 35,081 35,233 61,477 70,314 Other 3,973 (841) 10,240 (6,248) 8,546 (899) 2,298 Total Revenues 1,202,221 (32,195) 877,187 929,449 1,165,142 3,710,940 2,094,591 Expenses Compensation 289,352 329,575 240,454 287,403 286,155 619,190 573,558 Performance Fee Compensation Realized Carried Interest 238,032 97,799 165,721 58,503 87,581 530,280 146,084 Realized Incentive Fees 21,837 15,061 36,821 14,123 15,251 34,064 29,374 Unrealized Carried Interest (50,559) (228,697) (107,820) 30,001 75,202 23,821 105,203 Unrealized Incentive Fees 6,131 (14,642) (18,940) 3,448 2,689 31,092 6,137 Total Compensation and Benefits 504,793 199,096 316,236 393,478 466,878 1,238,447 860,356 Other Operating Expenses 168,401 157,565 155,109 148,526 157,254 311,683 305,780 Total Expenses 673,194 356,661 471,345 542,004 624,132 1,550,130 1,166,136 Economic Income (Loss) 529,027 $
(388,856) $ 405,842 $
387,445 $
541,010 $
2,160,810 $ 928,455 $
Economic Net Income (Loss)
508,440 $
(415,926) $ 435,691 $
370,651 $
519,776 $
2,130,504 $ 890,427 $
Fee Related Earnings
178,441 $
265,667 $
310,879 $
219,456 $
226,136 $
359,065 $
445,592 $
Distributable Earnings
1,033,920 $ 691,534 $
878,027 $
387,967 $
503,459 $
2,274,127 $ 891,426 $
Total Assets Under Management
332,723,546 $ 333,925,521 $ 336,384,575 $ 343,705,462 $ 356,281,669 $ 332,723,546 $ 356,281,669 $ Fee-Earning Assets Under Management 239,342,214 $ 240,939,356 $ 246,146,372 $ 244,452,764 $ 266,006,713 $ 239,342,214 $ 266,006,713 $ Weighted Average Fee-Earning AUM 237,576,488 $ 239,786,680 $ 242,942,380 $ 244,891,488 $ 259,476,010 $ 230,738,845 $ 262,556,041 $ LP Capital Invested 4,814,362 $ 6,145,446 $ 14,779,702 $ 6,515,571 $ 3,795,171 $ 9,579,898 $ 10,310,742 $ Total Capital Invested 5,048,058 $ 6,507,371 $ 15,747,511 $ 6,693,375 $ 4,049,774 $ 10,100,428 $ 10,743,149 $ |
 Blackstone 14 Private Equity (Dollars in Thousands) 2Q'15 3Q'15 4Q'15 1Q'16 2Q'16 2Q'15 YTD 2Q'16 YTD Revenues Management Fees, Net Base Management Fees 121,918 $
128,452 $
143,887 $
130,648 $
131,477 $
230,301 $
262,125 $
Advisory Fees 4,843 2,547 742 481
1,277 7,272 1,758 Transaction and Other Fees, Net
(11,842) 9,359 18,382 8,439 9,812 8,517 18,251 Management Fee Offsets
(9,028) (12,262) (10,521) (6,848) (4,195) (13,977) (11,043) Total Management Fees, Net
105,891 128,096 152,490 132,720 138,371 232,113 271,091 Performance Fees
Realized Carried Interest
546,575 214,532 330,902 30,282 57,056 929,553 87,338 Unrealized Carried Interest
(305,573) (809,363) (169,841) 73,875 85,047 261,249 158,922 Total Performance Fees
241,002 (594,831) 161,061 104,157 142,103 1,190,802 246,260 Investment Income (Loss)
Realized 50,258 46,917 47,658 (15,357) 22,926 95,074 7,569 Unrealized (22,301) (110,689) (14,835) 15,440 (2,766) 9,186 12,674 Total Investment Income (Loss)
27,957 (63,772) 32,823 83 20,160
104,260
20,243
Interest Income and Dividend
Revenue 7,669
8,119
9,812
9,849
9,516
15,287
19,365
Other
2,515 471 4,693
(1,587)
3,395
690
1,808 Total Revenues 385,034 (521,917) 360,879 245,222 313,545 1,543,152 558,767 Expenses Compensation 68,106 70,419 70,651 80,274 83,140 139,178 163,414 Performance Fee Compensation
Realized Carried Interest
106,502 16,303 94,635 15,427 30,946 145,984 46,373 Unrealized Carried Interest
(25,574) (141,448) (21,270) 9,296 19,450 152,546 28,746 Total Compensation and Benefits
149,034 (54,726) 144,016 104,997 133,536 437,708 238,533 Other Operating Expenses
62,571 43,812 53,900 48,063 48,371 101,446 96,434 Total Expenses 211,605 (10,914) 197,916 153,060 181,907 539,154 334,967 Economic Income (Loss)
173,429 $
(511,003) $
162,963 $
92,162 $
131,638 $
1,003,998 $ 223,800 $
Total Assets Under Management
92,026,337 $ 91,490,669 $ 94,280,074 $ 95,466,227 $ 99,685,655 $ 92,026,337 $ 99,685,655 $ Fee-Earning Assets Under Management 49,537,189 $ 50,560,404 $ 51,451,196 $ 50,228,312 $ 69,467,174 $ 49,537,189 $ 69,467,174 $ Weighted Average Fee-Earning AUM 49,925,744 $ 50,268,174 $ 51,185,170 $ 51,240,819 $ 63,083,579 $ 49,878,703 $ 67,190,788 $ LP Capital Invested 1,800,854 $ 1,535,702 $ 4,508,023 $ 1,865,698 $ 1,538,436 $ 4,175,453 $ 3,404,134 $ Total Capital Invested 1,949,748 $ 1,677,876 $ 5,270,078 $ 1,974,391 $ 1,637,601 $ 4,467,517 $ 3,611,992 $ |
 Blackstone 15 Real Estate (Dollars in Thousands) 2Q'15 3Q'15 4Q'15 1Q'16 2Q'16 2Q'15 YTD 2Q'16 YTD Revenues Management Fees, Net Base Management Fees 140,743 $
175,710 $
199,774 $
199,907 $
201,004 $
293,091 $
400,911 $
Transaction and Other Fees, Net
21,510 21,390 52,461 35,794 21,112 36,726 56,906 Management Fee Offsets (5,428) (10,147) (6,399) (3,595) (1,219) (10,294) (4,814) Total Management Fees, Net 156,825 186,953 245,836 232,106 220,897 319,523 453,003 Performance Fees Realized Carried Interest 363,983 169,051 290,450 200,627 266,382 1,175,232 467,009 Realized Incentive Fees 1,220 3,879 11,331 4,069 6,099 1,943 10,168 Unrealized Carried Interest (188,608) (128,854) (182,061) (11,522) (84,875) (369,627) (96,397) Unrealized Incentive Fees 3,935 2,784 8,014 9,765 5,942 10,004 15,707 Total Performance Fees 180,530 46,860 127,734 202,939 193,548 817,552 396,487 Investment Income (Loss) Realized 85,432 39,821 38,985 12,975 19,929 156,776 32,904 Unrealized (107,691) (95,382) (66,326) (2,137) (8,902) (70,181) (11,039) Total Investment Income (Loss) (22,259) (55,561) (27,341) 10,838 11,027 86,595 21,865 Interest Income and Dividend Revenue 10,259 11,057 12,677 13,188 13,084 20,256 26,272 Other 1,077 (938) 2,416 (1,909) 2,231 (2,900) 322 Total Revenues 326,432 188,371 361,322 457,162 440,787 1,241,026 897,949 Expenses Compensation 79,484 99,255 94,808 100,578 102,888 164,318 203,466 Performance Fee Compensation Realized Carried Interest 116,168 52,546 68,827 43,076 56,441 362,664 99,517 Realized Incentive Fees 671 1,838 5,813 2,133 3,300 1,027 5,433 Unrealized Carried Interest (50,559) (23,018) (24,686) 27,703 14,257 (148,643) 41,960 Unrealized Incentive Fees 230 5,215 797 4,158 2,542 2,805 6,700 Total Compensation and Benefits 145,994 135,836 145,559 177,648 179,428 382,171 357,076 Other Operating Expenses 43,346 42,050 53,636 48,097 52,201 83,489 100,298 Total Expenses 189,340 177,886 199,195 225,745 231,629 465,660 457,374 Economic Income 137,092 $
10,485 $
162,127 $
231,417 $
209,158 $
775,366 $
440,575 $
Total Assets Under Management
91,578,634 $ 93,187,556 $ 93,917,824 $ 101,107,528 $ 103,197,060 $ 91,578,634 $ 103,197,060 $ Fee-Earning Assets Under Management 62,683,857 $ 64,858,622 $ 67,345,357 $ 67,298,439 $ 66,744,550 $ 62,683,857 $ 66,744,550 $ Weighted Average Fee-Earning AUM 60,939,868 $ 63,492,663 $ 65,356,567 $ 66,943,268 $ 67,215,301 $ 56,168,300 $ 67,306,366 $ LP Capital Invested 2,963,609 $ 4,118,952 $ 7,733,638 $ 3,747,181 $ 1,524,415 $ 4,406,772 $ 5,271,596 $ Total Capital Invested 3,035,837 $ 4,326,151 $ 7,835,881 $ 3,820,460 $ 1,557,192 $ 4,441,440 $ 5,377,652 $ |
 Blackstone 16 Hedge Fund Solutions (Dollars in Thousands) 2Q'15 3Q'15 4Q'15 1Q'16 2Q'16 2Q'15 YTD 2Q'16 YTD Revenues Management Fees, Net Base Management Fees 130,216 $
133,592 $
129,941 $
130,158 $
130,123 $
260,853 $
260,281 $
Transaction and Other Fees, Net
- 219 73 543 (5) 25 538 Management Fee Offsets (608) (507) 1,566 - - (888) - Total Management Fees, Net 129,608 133,304 131,580 130,701 130,118 259,990 260,819 Performance Fees Realized Incentive Fees 16,915 2,783 37,983 2,684 (251) 27,431 2,433 Unrealized Carried Interest 8,014 (5,394) (599) 32 801 8,014 833 Unrealized Incentive Fees 15,855 (29,711) (41,655) (2,935) 1,036 63,282 (1,899) Total Performance Fees 40,784 (32,322) (4,271) (219) 1,586 98,727 1,367 Investment Income (Loss) Realized (1,757) (468) (141) (4,745) (515) (12,132) (5,260) Unrealized 2,032 (6,411) (1,539) (12,291) 9,357 6,515 (2,934) Total Investment Income (Loss) 275 (6,879) (1,680) (17,036) 8,842 (5,617) (8,194) Interest Income and Dividend Revenue 3,970 4,136 5,219 5,296 5,205 7,919 10,501 Other 459 (66) 1,414 (1,388) 1,125 (1,148) (263) Total Revenues 175,096 98,173 132,262 117,354 146,876 359,871 264,230 Expenses Compensation 45,841 44,408 33,131 54,169 44,436 101,945 98,605 Performance Fee Compensation Realized Incentive Fees 8,711 (436) 15,410 1,863 1,325 12,181 3,188 Unrealized Carried Interest 4,077 (3,041) (213) - 238 4,077 238 Unrealized Incentive Fees 3,764 (7,011) (15,316) (1,195) 480 19,415 (715) Total Compensation and Benefits 62,393 33,920 33,012 54,837 46,479 137,618 101,316 Other Operating Expenses 20,499 24,147 24,220 26,146 27,218 41,705 53,364 Total Expenses 82,892 58,067 57,232 80,983 73,697 179,323 154,680 Economic Income 92,204 $
40,106 $
75,030 $
36,371 $
73,179 $
180,548 $
109,550 $
Total Assets Under Management
67,829,866 $ 68,405,948 $ 69,105,425 $ 68,475,416 $ 68,649,878 $ 67,829,866 $ 68,649,878 $ Fee-Earning Assets Under Management 65,512,170 $ 65,182,338 $ 65,665,439 $ 64,831,253 $ 64,973,999 $ 65,512,170 $ 64,973,999 $ Weighted Average Fee-Earning AUM 65,453,883 $ 65,782,066 $ 65,802,335 $ 65,123,126 $ 65,520,626 $ 64,405,449 $ 65,436,771 $ LP Capital Invested 2,131 $
66,427 $
41,332 $
315,757 $
32,804 $
135,482 $
348,561 $
Total Capital Invested
2,136 $
71,132 $
39,877 $
329,793 $
32,809 $
141,359 $
362,602 $ |
 Blackstone 17 Credit (Dollars in Thousands) 2Q'15 3Q'15 4Q'15 1Q'16 2Q'16 2Q'15 YTD 2Q'16 YTD Revenues Management Fees, Net Base Management Fees 123,615 $
126,533 $
125,805 $
125,990 $
131,392 $
248,644 $
257,382 $
Transaction and Other Fees, Net
2,060 1,289 1,565 1,342 1,424 3,517 2,766 Management Fee Offsets (3,370) (11,260) (7,585) (9,658) (9,982) (11,220) (19,640) Total Management Fees, Net 122,305 116,562 119,785 117,674 122,834 240,941 240,508 Performance Fees Realized Carried Interest 26,925 51,606 4,258 - 296 40,292 296 Realized Incentive Fees 29,684 28,123 33,158 21,697 23,515 48,115 45,212 Unrealized Carried Interest 44,218 (112,366) (118,721) (14,779) 87,295 32,267 72,516 Unrealized Incentive Fees 6,521 (26,419) (9,193) 270 1,029 15,645 1,299 Total Performance Fees 107,348 (59,056) (90,498) 7,188 112,135 136,319 119,323 Investment Income (Loss) Realized 2,723 1,735 491 (2,974) 11,330 4,960 8,356 Unrealized 2,760 (10,177) (15,728) (17,561) 8,412 9,647 (9,149) Total Investment Income (Loss) 5,483 (8,442) (15,237) (20,535) 19,742 14,607 (793) Interest Income and Dividend Revenue 5,938 6,053 6,957 6,748 7,428 11,589 14,176 Other 34 (73) 1,717 (1,364) 1,795 3,527 431 Total Revenues 241,108 55,044 22,724 109,711 263,934 406,983 373,645 Expenses Compensation 47,124 51,324 41,864 52,382 55,691 97,001 108,073 Performance Fee Compensation Realized Carried Interest 15,362 28,950 2,259 - 194 21,632 194 Realized Incentive Fees 12,455 13,659 15,598 10,127 10,626 20,856 20,753 Unrealized Carried Interest 21,497 (61,190) (61,651) (6,998) 41,257 15,841 34,259 Unrealized Incentive Fees 2,137 (12,846) (4,421) 485 (333) 8,872 152 Total Compensation and Benefits 98,575 19,897 (6,351) 55,996 107,435 164,202 163,431 Other Operating Expenses 23,539 24,898 23,353 26,220 29,464 45,375 55,684 Total Expenses 122,114 44,795 17,002 82,216 136,899 209,577 219,115 Economic Income 118,994 $
10,249 $
5,722 $
27,495 $
127,035 $
197,406 $
154,530 $
Total Assets Under Management
81,288,709 $ 80,841,348 $ 79,081,252 $ 78,656,291 $ 84,749,076 $ 81,288,709 $ 84,749,076 $ Fee-Earning Assets Under Management 61,608,998 $ 60,337,992 $ 61,684,380 $ 62,094,760 $ 64,820,990 $ 61,608,998 $ 64,820,990 $ Weighted Average Fee-Earning AUM 61,256,993 $ 60,243,777 $ 60,598,308 $ 61,584,275 $ 63,656,504 $ 60,286,393 $ 62,622,116 $ LP Capital Invested 47,768 $
424,365 $
2,496,709 $ 586,935 $
699,516 $
862,191 $
1,286,451 $ Total Capital Invested 60,337 $
432,212 $
2,601,675 $ 568,731 $
822,172 $
1,050,112 $ 1,390,903 $ |
 Blackstone 18 Financial Advisory Note: On October 1,
2015, Blackstone spun-off its Financial Advisory businesses, which did not include Blackstone's capital markets services
business. The results of Blackstone’s capital markets services business have been reclassified from the Financial Advisory segment to the Private Equity segment. All prior
periods have been recast to reflect this
reclassification.
(Dollars in Thousands)
2Q'15 3Q'15 4Q'15 1Q'16 2Q'16 2Q'15 YTD 2Q'16 YTD Revenues Advisory Fees 72,155 $
143,606 $
- $
-
$
- $
153,964
$
-
$
Transaction and
Other Fees, Net -
146 - - - 16 - Total Advisory and Transaction Fees 72,155 143,752 - - - 153,980 - Investment Income (Loss) Realized (159) (479) - - - (389) - Unrealized (523) (998) - - - 959 - Total Investment Income (Loss) (682) (1,477) - - - 570 - Interest Income and Dividend Revenue 3,190 6,094 - - - 6,426 - Other (112) (235) - - - (1,068) - Total Revenues 74,551 148,134 - - - 159,908 - Expenses Compensation 48,797 64,169 - - - 116,748 - Total Compensation and Benefits 48,797 64,169 - - - 116,748 - Other Operating Expenses 18,446 22,658 - - - 39,668 - Total Expenses 67,243 86,827 - - - 156,416 - Economic Income 7,308 $
61,307 $
- $
-
$
-
$
3,492
$
-
$
|
 Blackstone 19 Unitholder Distribution Generated $0.42 of Distributable Earnings per common unit during the quarter, up 27% from the prior quarter, bringing the year-to-date amount to $0.75 per common unit. Declared a quarterly distribution of $0.36 per common unit to record holders as of August 1, 2016; payable on August 8, 2016. % Change % Change (Dollars in Thousands, Except per Unit Data) 2Q'15 3Q'15 4Q'15 1Q'16 2Q'16 vs. 2Q'15 2Q'15 YTD 2Q'16 YTD vs. 2Q'15 YTD Distributable Earnings (“DE”) 1,033,920 $ 691,534 $ 878,027 $ 387,967 $ 503,459 $ (51)% 2,274,127 $ 891,426 $ (61)% Add: Other Payables Attributable to Common Unitholders - - 26,918 - 10,438 n/m 7,288 10,438 43% DE before Certain Payables 1,033,920 691,534 904,945 387,967 513,897 (50)% 2,281,415 901,864 (60)% Percent to Common Unitholders 54% 54% 54% 54% 54% 53% 54% DE before Certain Payables Attributable to Common Unitholders 554,120 370,902 487,075 210,286 279,357 (50)% 1,217,728 489,643 (60)% Less: Other Payables Attributable to Common Unitholders - - (26,918) - (10,438) n/m (7,288) (10,438) 43% DE Attributable to Common Unitholders 554,120 370,902 460,157 210,286 268,919 (51)% 1,210,440 479,205 (60)% DE per Common Unit 0.88 $ 0.58 $ 0.72 $ 0.33 $ 0.42 $ (52)% 1.93 $ 0.75 $ (61)% Less: Retained Capital per Common Unit (0.14) $ (0.09) $ (0.11) $ (0.05) $ (0.06) $ (57)% (0.30) $ (0.11) $ (63)% Actual Distribution per Common Unit 0.74 $ 0.49 $ 0.61 $ 0.28 $ 0.36 $ (51)% 1.63 $ 0.64 $ (61)% Record Date Aug 1, 2016 Payable Date Aug 8, 2016 A detailed description of Blackstone’s distribution policy and the definition of Distributable Earnings can be found on page 32,
Definitions and Distribution Policy. DE before Certain Payables represents Distributable Earnings before the deduction for the Payable Under Tax Receivable Agreement and tax expense (benefit) of wholly owned subsidiaries. Per Unit
calculations are based on end of period Total Common Units Outstanding (page 31, Unit Rollforward); actual distributions are paid to unitholders as of the applicable record date. For the periods presented, Net Cash Available
for Distribution per Common Unit equals the Actual Distribution per Common Unit. Retained capital is withheld pro-rata from common and Blackstone Holdings Partnership unitholders. Common unitholders’ share was
$38.7 million for 2Q’16 and $70.9 million for YTD’16. |
 Blackstone 20 2Q’16 Total AUM Rollforward (Dollars in Millions) 2Q’16 LTM Total AUM Rollforward (Dollars in Millions) Inflows include contributions, capital raised, other increases in available capital, purchases and acquisitions. Outflows represent
redemptions, client withdrawals and other decreases in available
capital. Realizations represent realizations from the disposition of assets. Market Activity represents gains (losses) on portfolio investments and impact of foreign exchange rate fluctuations. Total Assets Under Management Inflows: Mezzanine strategies ($3.5 billion); hedge
fund strategies ($1.3 billion); two CLO
launches ($1.2 billion); BDCs ($728
million); Long Only ($560 million). Outflows: BDCs ($676 million); hedge fund strategies ($440 million); Long Only
($423 million). Private Equity Real Estate Hedge Fund Solutions Credit Inflows: Strategic Partners ($4.3 billion); Core Private Equity ($2.5 billion); Tactical
Opportunities ($452 million). Realizations: BCP V ($1.5 billion); BCP co-investment ($1.3 billion); Strategic Partners ($428 million); Tactical Opportunities
($280 million).
Market Activity: BCP VI ($428
million); BCP co-investment ($291 million); BCP V ($180 million). Inflows: Fifth European opportunistic fund ($1.4 billion); third mezzanine debt fund ($1.2
billion); U.S. core+ funds ($1.0 billion).
Realizations: BREP VI ($756
million); BREP V ($718 million); BREP VII ($457 million); BREP co-investment ($364 million).
Market Activity:
Carrying value increases of 2.2% and 2.1% within the
opportunistic and core+ funds, respectively. Inflows: Individual investor and specialized solutions ($1.1 billion); commingled products ($664 million); customized solutions ($266
million). Outflows: Individual investor and specialized solutions ($1.5 billion); commingled products ($994 million); customized solutions
($508 million).
Market Activity:
BAAM’s Principal Solutions Composite up 1.4% gross (1.2%
net) during the quarter. Private
Real Hedge Fund Equity Estate Solutions 1Q'16 95,466 $ 101,108 $ 68,475 $ 78,656 $ 343,705 $ Inflows 7,358 4,443 2,025 7,334 21,161 Outflows (587) (147) (2,997) (1,503) (5,233) Realizations (3,814) (3,486) (32) (1,766) (9,097) Net Inflows (Outflows) 2,957 811 (1,004) 4,066 6,830 Market Activity 1,262 1,279 1,178 2,027 5,746 2Q'16 99,686 $ 103,197 $ 68,650 $ 84,749 $ 356,282 $ QoQ Increase 4% 2% 0% 8% 4% Credit Total Private Real Hedge Fund Equity Estate Solutions 2Q'15 92,026 $ 91,579 $ 67,830 $ 81,289 $ 332,724 $ Inflows 19,380 22,386 10,684 17,559 70,009 Outflows (1,112) (494) (7,122) (5,131) (13,859) Realizations (12,077) (13,981) (611) (7,424) (34,093) Net Inflows 6,191 7,911 2,951 5,005 22,058 Market Activity 1,468 3,707 (2,131) (1,544) 1,501 2Q'16 99,686 $ 103,197 $ 68,650 $ 84,749 $ 356,282 $ YoY Increase 8% 13% 1% 4% 7% Credit Total |
 Blackstone 21 Inflows include contributions, capital raised, other increases in available capital, purchases and acquisitions. Outflows represent
redemptions, client withdrawals and other decreases in available
capital. Realizations represent realizations from the disposition of assets. Market Activity represents gains (losses) on portfolio investments and impact of foreign exchange rate fluctuations. 2Q’16 Fee-Earning AUM Rollforward (Dollars in Millions) 2Q’16 LTM Fee-Earning AUM Rollforward (Dollars in Millions) Fee-Earning Assets Under Management Inflows: Two new CLO launches ($1.3 billion); hedge fund strategies ($817 million); BDCs
($728 million); Long Only ($572 million);
mezzanine strategies ($405 million).
Realizations: Capital returned to
investors for CLOs outside investment periods ($681 million); mezzanine strategies ($332 million); dividends from BDCs ($232 million); rescue lending funds ($209 million).
Inflows: Commencement of
investment periods for BCP VII ($17.5 billion) and SP VII ($5.3 billion). Outflows: Investment periods ended for BCP VI ($1.8 billion) and SP VI ($453 million).
Realizations:
BCP V ($1.6 billion); Strategic Partners ($290 million). Inflows: BREDS ($614 million); BPP ($168 million).
Realizations: BREP Global
opportunistic ($659 million); BREDS ($480 million); BREP co-investment ($211
million). Inflows: Individual investor and specialized solutions ($1.1 billion); commingled products
($664 million); customized solutions ($266 million). Outflows: Individual investor and specialized solutions ($1.5 billion); commingled products ($994 million); customized
solutions ($508 million).
Private
Equity
Real
Estate
Hedge
Fund
Solutions
Credit
Private Real Hedge Fund Equity Estate Solutions 1Q'16 50,228 $ 67,298 $ 64,831 $ 62,095 $ 244,453 $ Inflows 23,687 884 2,030 3,993 30,594 Outflows (2,297) (107) (2,972) (1,056) (6,432) Realizations (2,120) (1,386) (31) (1,582) (5,119) Net Inflows (Outflows) 19,270 (608) (973) 1,354 19,043 Market Activity (31) 54 1,116 1,372 2,511 2Q'16 69,467 $ 66,745 $ 64,974 $ 64,821 $ 266,007 $ QoQ Increase (Decrease) 38% (1)% 0% 4% 9% Credit Total Private Real Hedge Fund Equity Estate Solutions 2Q'15 49,537 $ 62,684 $ 65,512 $ 61,609 $ 239,342 $ Inflows 28,816 10,765 9,077 15,017 63,675 Outflows (2,972) (181) (6,998) (4,276) (14,427) Realizations (5,751) (7,165) (580) (6,395) (19,892) Net Inflows 20,094 3,418 1,499 4,345 29,357 Market Activity (164) 642 (2,038) (1,133) (2,692) 2Q'16 69,467 $ 66,745 $ 64,974 $ 64,821 $ 266,007 $ YoY Increase (Decrease) 40% 6% (1)% 5% 11% Credit Total |
 Blackstone 22 Net Accrued Performance Fees $3.3 billion Net Accrued Performance Fees at 2Q’16 $2.80 per unit Net Accrued Performance Fees at 2Q’16 Net Accrued Performance Fees are presented net of performance fee compensation and do not include clawback amounts, if any, which are
disclosed in the 10-K/Q. Net Realized Performance Fees
are included in DE. Net Realized Performance Fees represents Performance Fees realized, but not yet distributed as of the reporting date and included in the Net Accrued Performance Fee balance. When these fees are received, the receivable is reduced without further
impacting DE. Per Unit calculations are based on end of
period DE Units Outstanding (see page 31, Unit Rollforward). Net
Accrued Performance Fees (Dollars in Millions, Except per Unit
Data) 1Q'16
2Q'16 2Q'16 Per Unit QoQ Change Private Equity BCP IV Carried Interest 155 $
143
$
0.12
$
(12)
$
BCP V
Carried Interest 358
373 0.31 15 BCP VI Carried Interest 340 385 0.32 45 BEP Carried Interest 46 61 0.05 15 Tactical Opportunities Carried Interest 56 59 0.05 3 BTAS Carried Interest 5 7 0.01 2 Strategic Partners Carried Interest 38 35 0.03 (3) Other Carried Interest 2 1 - (1) Total Private Equity 1,000 $
1,064 $
0.90 $
64 $
Real Estate
BREP IV Carried Interest
11 9 0.01 (2) BREP V Carried Interest 417 390 0.33 (27) BREP VI Carried Interest 636 612 0.52 (24) BREP VII Carried Interest 570 584 0.49 14 BREP VIII Carried Interest 34 84 0.07 50 BREP Europe III Carried Interest 181 156 0.13 (25) BREP Europe IV Carried Interest 126 124 0.10 (2) BREP Asia Carried Interest 68 82 0.07 14 BPP Carried Interest 41 44 0.04 3 BPP Incentive Fees 18 21 0.02 3 BREDS Carried Interest 16 14 0.01 (2) BREDS Incentive Fees 2 3 - 1 Asia Platform Incentive Fees 7 7 0.01 - Total Real Estate 2,127 $
2,130 $
1.79 $
3 $
Hedge Fund Solutions
Incentive Fees
5 6 0.01 1 Total Hedge Fund Solutions 5 $
6
$
0.01 $
1 $
Credit
Carried Interest
66 102 0.09 36 Incentive Fees 14 19 0.02 5 Total Credit 80 $
121
$
0.10
$
41
$
Total
Blackstone Carried Interest
3,166 3,265 2.75 99 Incentive Fees 46 56 0.05 10 Net Accrued Performance Fees 3,212 $
3,321 $
2.80 $
109 $
Memo: Net Realized Performance Fees
28 $
121
$
0.10
$
93
$
|
 Blackstone 23 Investment Records as of June 30, 2016 (a) Continued... Committed Available Unrealized Investments Realized Investments Total Investments Net IRRs (d) (Dollars in Thousands, Except Where Noted) Capital Capital (b) Value MOIC (c) % Public Value MOIC (c) Value MOIC (c) Realized Total Private Equity BCP I (Oct 1987 / Oct 1993) 859,081 $ - $
- $
n/a - 1,741,738 $ 2.6x 1,741,738 $ 2.6x 19% 19% BCP II (Oct 1993 / Aug 1997) 1,361,100 - - n/a - 3,256,819 2.5x 3,256,819 2.5x 32% 32% BCP III (Aug 1997 / Nov 2002) 3,967,422 - - n/a - 9,184,688 2.3x 9,184,688 2.3x 14% 14% BCOM (Jun 2000 / Jun 2006) 2,137,330 24,575 29,441 2.3x - 2,949,591 1.4x 2,979,032 1.4x 6% 7% BCP IV (Nov 2002 / Dec 2005) 6,773,182 219,136 2,037,337 1.3x 26% 19,083,221 3.2x 21,120,558 2.8x 43% 36% BCP V (Dec 2005 / Jan 2011) 21,022,207 1,258,436 8,364,663 1.7x 79% 29,442,294 1.9x 37,806,957 1.9x 9% 8% BCP VI (Jan 2011 / May 2016) 15,182,644 2,428,440 15,511,224 1.3x 24% 2,130,587 1.9x 17,641,811 1.4x 51% 10% BEP (Aug 2011 / Feb 2015) 2,439,157 141,245 2,839,768 1.3x 27% 539,585 2.0x 3,379,353 1.4x 57% 14% BEP II (Feb 2015 / Feb 2021) 4,951,351 4,724,507 149,061 1.0x - - n/a 149,061 1.0x n/a n/m BCP VII (May 2016 / May 2022) 18,898,630 18,898,630 - n/a - - n/a - n/a n/a n/a Total Corporate Private Equity 77,592,104 $ 27,694,969 $ 28,931,494 $ 1.4x 40% 68,328,523 $ 2.2x 97,260,017 $ 1.9x 18% 15% Tactical Opportunities 12,657,994 6,175,613 7,227,525 1.1x 6% 1,517,170 1.5x 8,744,695 1.2x 32% 10% Tactical Opportunities Co-Investment & Other 1,993,004 653,673 1,421,235 1.1x - 160,812 1.5x 1,582,047 1.1x n/a 13% Strategic Partners I-V and Co-Investment (e) 12,143,266 2,185,576 3,762,419 n/m - 13,357,859 n/m 17,120,278 1.5x n/a 14% Strategic Partners VI LBO, RE and SMA (e) 7,053,071 2,058,306 3,832,118 n/m - 601,171 n/m 4,433,289 1.4x n/a 38% Strategic Partners VII (e) 5,399,381 5,285,561 107,988 n/m - - n/a 107,988 n/m n/a n/a BCEP (f) 3,167,500 3,167,500 - n/a - - n/a - n/a n/a n/a Other Funds and Co-Investment (g) 1,509,893 480,230 196,297 0.8x 89% 426,683 1.0x 622,980 0.9x n/a n/m Real Estate Dollar Pre-BREP 140,714 $ - $
- $
n/a - 345,190 $ 2.5x 345,190 $ 2.5x 33% 33% BREP I (Sep 1994 / Oct 1996) 380,708 - - n/a - 1,327,708 2.8x 1,327,708 2.8x 40% 40% BREP II (Oct 1996 / Mar 1999) 1,198,339 - - n/a - 2,531,613 2.1x 2,531,613 2.1x 19% 19% BREP III (Apr 1999 / Apr 2003) 1,522,708 - - n/a - 3,330,406 2.4x 3,330,406 2.4x 21% 21% BREP IV (Apr 2003 / Dec 2005) 2,198,694 - 519,626 0.6x 16% 4,030,933 2.2x 4,550,559 1.7x 36% 13% BREP V (Dec 2005 / Feb 2007) 5,539,418 - 3,263,836 2.2x 32% 9,608,522 2.3x 12,872,358 2.2x 12% 11% BREP VI (Feb 2007 / Aug 2011) 11,060,444 554,490 6,973,627 2.1x 69% 18,657,251 2.4x 25,630,878 2.3x 15% 13% BREP VII (Aug 2011 /Apr 2015) 13,492,593 2,419,900 15,764,383 1.6x 1% 8,919,047 1.9x 24,683,430 1.7x 31% 20% BREP VIII (Apr 2015 / Oct 2020) 16,147,977 10,037,533 7,100,494 1.2x - 16,270 1.1x 7,116,764 1.2x 12% 19% Total Global BREP 51,681,595 $ 13,011,923 $ 33,621,966 $ 1.5x 18% 48,766,940 $ 2.2x 82,388,906 $ 1.9x 21% 16% Euro BREP Int'l (Jan 2001 / Sep 2005) 824,172 € - € - € n/a - 1,367,146 € 2.1x 1,367,146 € 2.1x 23% 23% BREP Int'l II (Sep 2005 / Jun 2008) 1,629,748 - 532,403 1.2x 65% 1,716,134 1.8x 2,248,537 1.6x 8% 5% BREP Europe III (Jun 2008 / Sep 2013) 3,205,140 469,301 2,999,189 1.8x - 2,715,178 2.1x 5,714,367 1.9x 23% 17% BREP Europe IV (Sep 2013 / Mar 2019) 6,699,620 2,115,651 6,411,668 1.3x - 641,477 1.4x 7,053,145 1.3x 26% 13% BREP Europe V (TBD) 5,878,298 5,939,667 - n/a - - n/a - n/a n/a n/a Total Euro BREP 18,236,978 € 8,524,619 € 9,943,260 € 1.4x 4% 6,439,935 € 1.9x 16,383,195 € 1.6x 16% 12% BREP Co-Investment (h) 6,819,065 $ 146,573 $ 4,950,386 $ 1.6x 42% 7,770,729 $ 2.1x 12,721,115 $ 1.9x 18% 15% BREP Asia (Jun 2013 / Dec 2017) 5,079,554 2,717,330 3,229,118 1.4x - 420,637 1.7x 3,649,755 1.4x 25% 15% Total BREP 86,132,424 $ 25,308,317 $ 54,283,736 $ 1.5x 16% 65,516,128 $ 2.2x 119,799,864 $ 1.8x 20% 16% BPP (i) 11,946,027 $ 3,584,314 $ 9,938,325 $ 1.2x - - $
n/a 9,938,325 $ 1.2x n/a 15% BREDS (j) 11,003,179 $ 6,512,182 $ 2,466,397 $ 1.2x - 5,966,987 $ 1.3x 8,433,384 $ 1.3x 13% 11% |
 Blackstone 24 Investment Records as of June 30, 2016 (a) – Continued The returns presented herein represent those of the applicable Blackstone Funds and not those of The Blackstone Group L.P.
n/m Not meaningful. n/a Not applicable. (a) Preliminary. (b) Available Capital represents total investable capital commitments, including side-by-side, adjusted for certain expenses and
expired or recallable capital and may include leverage, less
invested capital. This amount is not reduced by outstanding commitments to investments. (c) Multiple of Invested Capital (“MOIC”) represents carrying value, before management fees, expenses and Carried Interest, divided
by invested capital. (d)
Net Internal Rate of Return (“IRR”) represents the annualized
inception to June 30, 2016 IRR on total invested capital based on realized proceeds and unrealized value, as applicable, after management fees, expenses and Carried Interest.
(e) Realizations are treated as return of capital until fully recovered and therefore unrealized and realized MOICs are not
meaningful. (f)
BCEP, or Blackstone Core Equity Partners, is a core private equity fund which
invests with a more modest risk profile and longer hold period.
(g) Returns for Other Funds and Co-Investment are not meaningful as these funds have limited transaction activity.
(h) BREP Co-Investment represents co-investment capital raised for various BREP investments. The Net IRR reflected is calculated by
aggregating each co- investment’s realized proceeds and
unrealized value, as applicable, after management fees, expenses and Carried Interest. (i) BPP represents the core+ real estate funds which invest with a more modest risk profile and lower leverage.
(j) Excludes Capital Trust drawdown funds. (k) BSCH, or Blackstone Strategic Capital Holdings, is a permanent capital vehicle focused on acquiring strategic minority positions in alternative asset managers. (l) Funds presented represent the flagship credit drawdown funds only. The Total Credit Net IRR is the combined IRR of the six credit
drawdown funds presented.
Committed Available Unrealized Investments Realized Investments Total Investments Net IRRs (d) (Dollars in Thousands, Except Where Noted) Capital Capital (b) Value MOIC (c) % Public Value MOIC (c) Value MOIC (c) Realized Total Hedge Fund Solutions BSCH (Dec 2013 / Jun 2020) (k) 3,300,600 $ 2,755,702 $ 549,925 $ 1.0x - 75,529 $
n/a 625,454 $ 1.2x n/a 4% BSCH Co-Investment 75,500 31,237 44,495 1.0x - 1,427 n/a 45,922 1.0x n/a 2% Total Hedge Fund Solutions 3,376,100 $ 2,786,939 $ 594,420 $ 1.0x - 76,956 $
n/a 671,376 $ 1.2x n/a 4% Credit (l) Mezzanine I (Jul 2007 / Oct 2011) 2,000,000 $ 99,280 $
454,287 $ 1.7x - 4,407,209 $ 1.6x 4,861,496 $ 1.6x n/a 17% Mezzanine II (Nov 2011 / Nov 2016) 4,120,000 1,631,725 3,007,903 1.1x - 2,150,794 1.5x 5,158,697 1.2x n/a 13% Rescue Lending I (Sep 2009 / May 2013) 3,253,143 474,202 1,269,119 1.1x - 4,470,939 1.5x 5,740,058 1.4x n/a 11% Rescue Lending II (Jun 2013 / Jun 2018) 5,125,000 2,490,529 2,989,347 1.1x - 120,256 1.1x 3,109,603 1.1x n/a 11% Energy Select Opportunities (Nov 2015 / Nov 2018) 2,856,866 2,542,430 380,132 1.2x - 98,205 1.4x 478,337 1.2x n/a n/m Euro European Senior Debt Fund (Feb 2015 / Feb 2018) 1,964,689 € 3,401,176 € 523,751 € 1.0x - 142,288 € 1.2x 666,039 € 1.0x n/a n/m Total Credit 19,621,419 $ 11,016,873 $ 8,682,663 $ 1.1x - 11,404,871 $ 1.5x 20,087,534 $ 1.3x n/a 14% |
 Blackstone 25 Reconciliation of GAAP to Non-GAAP Measures Notes on page 26. (Dollars in Thousands) 2Q'15 3Q'15 4Q'15 1Q'16 (m) 2Q'16 2Q'15 YTD 2Q'16 YTD Net Income (Loss) Attributable to The Blackstone Group L.P. 134,168 $ (254,697) $ 200,870 $ 159,753 $ 198,626 $ 763,616 $ 358,379 $ Net Income (Loss) Attributable to Non-Controlling Interests in Blackstone Holdings
134,870 (247,318) 150,734 131,202 201,805 780,100 333,007 Net Income Attributable to Non-Controlling Interests in Consolidated Entities
66,716 30,671 40,717 40,086 64,729 148,512 104,815 Net Income (Loss) Attributable to Redeemable Non-Controlling Interests in Consolidated Entities 13,780 (12,520) 2,358 (6,401) (2,049) 21,307 (8,450) Net Income (Loss) 349,534 $ (483,864) $ 394,679 $ 324,640 $ 463,111 $ 1,713,535 $ 787,751 $ Provision for Taxes 43,251 1,573 46,230 9,146 47,415 142,595 56,561 Income (Loss) Before Provision for Taxes 392,785 $ (482,291) $ 440,909 $ 333,786 $ 510,526 $ 1,856,130 $ 844,312 $ Transaction-Related Charges (a) 192,018 80,962 (15,279) 64,136 69,956 423,880 134,092 Amortization of Intangibles (b) 24,720 30,624 23,287 23,208 23,208 50,619 46,416 (Income) Associated with Non-Controlling Interests of Consolidated Entities
(c) (80,496) (18,151) (43,075) (33,685) (62,680) (169,819) (96,365) Economic Income (Loss) 529,027 $ (388,856) $ 405,842 $ 387,445 $ 541,010 $ 2,160,810 $ 928,455 $ Taxes (d) (20,587) (27,070) 29,849 (16,794) (21,234) (30,306) (38,028) Economic Net Income (Loss) 508,440 $ (415,926) $ 435,691 $ 370,651 $ 519,776 $ 2,130,504 $ 890,427 $ Taxes (d) 20,587 27,070 (29,849) 16,794 21,234 30,306 38,028 Performance Fee Adjustment (e) (569,664) 639,349 (194,026) (314,065) (449,372) (2,243,400) (763,437) Investment (Income) Loss Adjustment (f) (10,774) 136,131 11,435 26,650 (59,771) (200,415) (33,121) Net Interest Loss (g) 14,411 9,522 11,846 13,351 13,546 22,813 26,897 Performance Fee Compensation and Benefits Adjustment (h) 215,441 (130,479) 75,782 106,075 180,723 619,257 286,798 Fee Related Earnings 178,441 $ 265,667 $ 310,879 $ 219,456 $ 226,136 $ 359,065 $ 445,592 $ Net Realized Performance Fees (i) 725,433 357,114 505,540 186,733 250,265 1,658,222 436,998 Realized Investment Income (Loss) (j) 136,497 87,526 86,993 (10,101) 53,670 244,289 43,569 Net Interest (Loss) (g) (14,411) (9,522) (11,846) (13,351) (13,546) (22,813) (26,897) Taxes and Related Payables Including Payable Under Tax Receivable Agreement
(k) (20,587) (27,070) (25,819) (16,794) (31,588) (37,581) (48,382) Equity-Based Compensation (l) 28,547 17,819 12,280 22,024 18,522 72,945 40,546 Distributable Earnings 1,033,920 $ 691,534 $ 878,027 $ 387,967 $ 503,459 $ 2,274,127 $ 891,426 $ Interest Expense 45,437 44,981 46,511 48,432 48,779 84,290 97,211 Taxes and Related Payables Including Payable Under Tax Receivable Agreement
(k) 20,587 27,070 25,819 16,794 31,588 37,581 48,382 Depreciation and Amortization 6,715 6,719 6,852 6,292 6,331 13,642 12,623 Adjusted EBITDA 1,106,659 $ 770,304 $ 957,209 $ 459,485 $ 590,157 $ 2,409,640 $ 1,049,642 $ |
 Blackstone 26 Reconciliation of GAAP to Non-GAAP Measures – Notes Note: See page 32, Definitions and Distribution Policy. (a) This adjustment adds back to Income (Loss) Before Provision (Benefit) for Taxes amounts for Transaction-Related Charges which
include principally equity-based compensation charges
associated with Blackstone’s initial public offering and long-term retention programs outside of annual deferred compensation and other corporate actions.
(b) This adjustment adds back to Income (Loss) Before Provision (Benefit) for Taxes amounts for the Amortization of Intangibles which
are associated with Blackstone’s initial public offering and
other corporate actions. (c)
This adjustment adds back to Income (Loss) Before Provision (Benefit) for Taxes
the amount of (Income) Loss Associated with Non- Controlling
Interests of Consolidated Entities and includes the amount of Management Fee Revenues associated with Consolidated CLO Entities. (d) Taxes represent the total GAAP tax provision adjusted to include only the current tax provision (benefit) calculated on Income (Loss)
Before Provision for Taxes.
(e) This adjustment removes from EI the total segment amount of Performance Fees.
(f) This adjustment removes from EI the total segment amount of Investment Income (Loss).
(g) This adjustment represents Interest Income and Dividend Revenue less Interest Expense.
(h) This adjustment removes from expenses the compensation and benefit amounts related to Blackstone’s profit sharing plans related
to Performance Fees.
(i) Represents the adjustment for realized Performance Fees net of corresponding actual amounts due under Blackstone’s profit
sharing plans related thereto. Equals the sum of Net Realized
Incentive Fees and Net Realized Carried Interest. (j)
Represents the adjustment for Blackstone’s Realized Investment Income
(Loss). (k)
Taxes and Related Payables Including Payable Under Tax Receivable Agreement
represent the total GAAP tax provision adjusted to include only
the current tax provision (benefit) calculated on Income (Loss) Before Provision for Taxes and the Payable Under Tax Receivable Agreement. (l) Represents equity-based award expense included in EI, which excludes all transaction-related equity-based charges.
(m)
Blackstone adopted new GAAP stock compensation guidance in 2Q’16 as of
January 1, 2016. Adoption changed Provision for Taxes, Net
Income, Net Income Attributable to The Blackstone Group L.P. and the number of GAAP Weighted-Average Units Outstanding - Diluted in 1Q’16. Such amounts have been recast in this presentation from the amounts originally reported in
1Q’16. |
 Blackstone 27 Reconciliation of GAAP to Total Segment Measures Notes on page 28. Continued... (Dollars in Thousands) 1Q'15 2Q'15 3Q'15 4Q'15 1Q'16 2Q'16 2Q'15 YTD 2Q'16 YTD Fee Revenues GAAP Management and Advisory Fees, Net 616,768 $ 574,132 $ 703,596 $ 648,009 $ 608,906 $ 607,823 $ 1,190,900 $ 1,216,729 $ Other (5,641) 3,976 (813) 10,260 (5,612) 7,935 (1,665) 2,323 GAAP 611,127 $ 578,108 $ 702,783 $ 658,269 $ 603,294 $ 615,758 $ 1,189,235 $ 1,219,052 $ Elimination Adjustment (a) 3,764 12,649 5,043 1,662 3,659 5,008 16,413 8,667 Segment Management and Advisory Fees, Net 619,763 586,784 708,667 649,691 613,201 612,220 1,206,547 1,225,421 Other (4,872) 3,973 (841) 10,240 (6,248) 8,546 (899) 2,298 Total Segment 614,891 $ 590,757 $ 707,826 $ 659,931 $ 606,953 $ 620,766 $ 1,205,648 $ 1,227,719 $ Performance Fees GAAP 1,673,108 568,305 (638,108) 193,361 314,493 449,243 2,241,413 763,736 Elimination Adjustment (a) 628 1,359 (1,241) 665 (428) 129 1,987 (299) Total Segment 1,673,736 $ 569,664 $ (639,349) $ 194,026 $ 314,065 $ 449,372 $ 2,243,400 $ 763,437 $ Investment Income (Loss) GAAP 206,203 56,824 (79,346) 20,961 (8,508) 105,139 263,027 96,631 Consolidation and Elimination Adjustment (b) (16,562) (46,050) (56,785) (32,396) (18,142) (45,368) (62,612) (63,510) Total Segment 189,641 $ 10,774 $ (136,131) $ (11,435) $ (26,650) $ 59,771 $ 200,415 $ 33,121 $ Interest and Dividend Revenue GAAP 21,920 21,965 26,244 24,828 23,075 22,286 43,885 45,361 Elimination Adjustment (c) 8,531 9,061 9,215 9,837 12,006 12,947 17,592 24,953 Total Segment 30,451 $ 31,026 $ 35,459 $ 34,665 $ 35,081 $ 35,233 $ 61,477 $ 70,314 $ Total Revenues GAAP 2,512,358 1,225,202 11,573 897,419 932,354 1,192,426 3,737,560 2,124,780 Consolidation and Elimination Adjustment (d) (3,639) (22,981) (43,768) (20,232) (2,905) (27,284) (26,620) (30,189) Total Segment 2,508,719 $ 1,202,221 $ (32,195) $ 877,187 $ 929,449 $ 1,165,142 $ 3,710,940 $ 2,094,591 $ Compensation GAAP 559,559 473,019 393,655 299,958 346,003 355,424 1,032,578 701,427 Consolidation Adjustment (e) (229,721) (183,667) (64,080) (59,504) (58,600) (69,269) (413,388) (127,869) Total Segment 329,838 $ 289,352 $ 329,575 $ 240,454 $ 287,403 $ 286,155 $ 619,190 $ 573,558 $ |
 Blackstone 28 Reconciliation of GAAP to Total Segment Measures – Continued This analysis reconciles the summarized components of Total Segments (pages 3-7) to their respective Total Segment amounts (page 13)
and to their equivalent GAAP measures
as reported on the Consolidated Statements of Operations (page 1). (a) Represents the add back of the management and performance fees earned from consolidated Blackstone Funds which have been eliminated in
consolidation. (b)
Represents the add back of investment income, including general partner income,
earned from consolidated Blackstone Funds which have been eliminated in consolidation and the inclusion of investment income on non-consolidated Blackstone Funds which in GAAP is recorded as Other Income (Loss) - Net Gains (Losses) from Fund Investment Activities. (c) Represents the elimination of inter-segment interest income and the related expense.
(d) Represents the total consolidation and elimination adjustments for Total Revenues and Total Expenses, respectively.
(e) Represents transaction-based equity compensation that is not recorded in the segments.
(f) Represents the add back for the amortization of transaction based intangibles, which is not recorded in the segments, and the elimination
of inter-segment interest expense.
(g) Represents the reversal of Fund Expenses which are attributable to consolidated Blackstone Funds and not a component of the
segments. (h)
Represents the inclusion of Other Income (Loss) which is a consolidation amount
not recorded in the segments. (i)
Represents the total consolidation and elimination adjustment between GAAP and
Total Segments. (Dollars in Thousands)
1Q'15 2Q'15 3Q'15 4Q'15 1Q'16 2Q'16 2Q'15 YTD 2Q'16 YTD Other Operating Expenses GAAP General, Administrative and Other 130,973 146,859 158,664 139,607 123,045 130,988 277,832 254,033 Interest Expense 31,370 37,414 36,860 38,878 37,356 36,878 68,784 74,234 GAAP 162,343 $ 184,273 $ 195,524 $ 178,485 $ 160,401 $ 167,866 $ 346,616 $ 328,267 $ Consolidation and Elimination Adjustment (f) (19,061) (15,872) (37,959) (23,376) (11,875) (10,612) (34,933) (22,487) Total Segment 143,282 $ 168,401 $ 157,565 $ 155,109 $ 148,526 $ 157,254 $ 311,683 $ 305,780 $ Total Expenses GAAP 1,142,568 914,432 476,997 556,878 617,710 712,603 2,057,000 1,330,313 Less: GAAP Fund Expenses (g) (16,850) (41,699) (18,296) (2,654) (5,229) (8,592) (58,549) (13,821) Consolidation and Elimination Adjustment (d) (248,782) (199,539) (102,040) (82,879) (70,477) (79,879) (448,321) (150,356) Total Segment 876,936 $ 673,194 $ 356,661 $ 471,345 $ 542,004 $ 624,132 $ 1,550,130 $ 1,166,136 $ GAAP Income (Loss) Before Provision for Taxes to Total Segment Economic Income (Loss)
GAAP Revenues Less Expenses 1,369,790 310,770 (465,424) 340,541 314,644 479,823 1,680,560 794,467 Other Income (Losses) (h) 93,555 82,015 (16,867) 100,368 19,142 30,703 175,570 49,845 Income (Loss) Before Provision for Taxes 1,463,345 392,785 (482,291) 440,909 333,786 510,526 1,856,130 844,312 Consolidation and Elimination Adjustment (i) 168,438 136,242 93,435 (35,067) 53,659 30,484 304,680 84,143 Total Segment 1,631,783 $ 529,027 $ (388,856) $ 405,842 $ 387,445 $ 541,010 $ 2,160,810 $ 928,455 $ |
 Blackstone 29 Walkdown of Financial Metrics See page 30, Walkdown of Financial Metrics – Calculation of Certain Non-GAAP Financial Metrics for the calculation of the amounts presented herein that are not the respective
captions on page
13, Total Segments. 2Q’16 Fee Related Earnings per Unit is based on end of
period DE Units Outstanding; 2Q’16 DE per Unit is based on DE attributable to Common Unit Holders (see page 19, Unitholder Distribution) and end of period Total Common Units Outstanding; and 2Q’16 ENI per Unit is based on Weighted-Average
ENI Adjusted Units. 2Q’16 YTD per Unit represents the sum of
the last two quarters. See page 31, Unit Rollforward.
(Dollars in Thousands, Except per Unit Data)
0.75 $
Net Unrealized Incentive Fees
5,318 8,970 Net Unrealized Carried Interest 13,066 30,671 Unrealized Investment (Loss) 6,101 (10,448) Add Back: Related Payables 10,354 10,354 Less: Equity-Based Compensation (18,522) (40,546) Economic Net Income 519,776 $ 0.44 $
890,427 $ 0.75 $
2Q'16 2Q'16 YTD Results Per Unit Results Per Unit Base Management Fees 593,996 $ 1,180,699 $ Advisory Fees 1,277 1,758 Transaction and Other Fees, Net 32,343 78,461 Management Fee Offsets (15,396) (35,497) Other Revenue 8,546 2,298 Compensation (286,155) (573,558) Non-Interest Operating Expenses (108,475) (208,569) Fee Related Earnings 226,136 $ 0.19 $
445,592 $ 0.37 $
Net Realized Incentive Fees
14,112 28,439 Net Realized Carried Interest 236,153 408,559 Realized Investment Income 53,670 43,569 Net Interest (Loss) (13,546) (26,897) Taxes and Related Payables (31,588) (48,382) Equity-Based Compensation 18,522 40,546 Distributable Earnings 503,459 $ 0.42 $
891,426 $ |
 Blackstone 30 Walkdown of Financial Metrics – Calculation of Certain Non-GAAP Financial Metrics Unless otherwise noted, all amounts are the respective captions from the Total Segment information.
(a) Represents equity-based award expense included in Economic Income, which excludes all transaction-related equity-based
charges. (b)
See page 25, Reconciliation of GAAP to Non-GAAP Measures for this
adjustment. (c)
Represents tax-related payables including the Payable Under Tax Receivable
Agreement, which is a component of Taxes and Related Payables.
(Dollars in Thousands)
2Q'16 YTD'16 Other Operating Expenses 157,254 $ 305,780 $ Less: Interest Expense (48,779) (97,211) Non-Interest Operating Expenses 108,475 $ 208,569 $ Realized Incentive Fees 29,363 57,813 Less: Realized Incentive Fee Compensation (15,251) (29,374) Net Realized Incentive Fees 14,112 $ 28,439 $ Realized Carried Interest 323,734 554,643 Less: Realized Carried Interest Compensation (87,581) (146,084) Net Realized Carried Interest 236,153 $ 408,559 $ Interest Income and Dividend Revenue 35,233 70,314 Less: Interest Expense (48,779) (97,211) Net Interest (Loss) (13,546) $ (26,897) $ Equity-Based Compensation (a) 18,522 $ 40,546 $ Taxes and Related Payables (b) (31,588) $ (48,382) $ Unrealized Incentive Fees 8,007 15,107 Less: Unrealized Incentive Fee Compensation (2,689) (6,137) Net Unrealized Incentive Fees 5,318 $ 8,970 $ Unrealized Carried Interest 88,268 135,874 Less: Unrealized Carried Interest Compensation (75,202) (105,203) Net Unrealized Carried Interest 13,066 $ 30,671 $ Related Payables (c) 10,354 $ 10,354 $ |
 Blackstone 31 Unit Rollforward Common Unitholders receive tax benefits from deductions taken by Blackstone’s corporate tax paying subsidiaries and bear
responsibility for the deduction from Distributable Earnings
of the Payable Under Tax Receivable Agreement and certain other tax-related
payables. Distributable Earnings Units Outstanding excludes units which are not entitled to distributions.
(a)
See page 26 note (m) for information on the 1Q’16 GAAP
Weighted-Average Units Outstanding - Diluted. 2Q'15 3Q'15 4Q'15 1Q'16 (a) 2Q'16 Total GAAP Weighted-Average Common Units Outstanding - Basic 631,881,205 638,832,799 641,134,086 644,897,849 646,933,698 Adjustments: Weighted-Average Unvested Deferred Restricted Common Units 2,311,444 - 1,794,046 1,332,772 1,309,402 Weighted-Average Blackstone Holdings Partnership Units - - 547,495,655 - 546,235,112 Total GAAP Weighted-Average Units Outstanding - Diluted 634,192,649 638,832,799 1,190,423,787 646,230,621 1,194,478,212 Adjustments: Weighted-Average Unvested Deferred Restricted Common Units - 1,913,028 - - - Weighted-Average Blackstone Holdings Partnership Units 555,641,388 550,983,910 - 548,042,780 - Weighted-Average Economic Net Income Adjusted Units 1,189,834,037 1,191,729,737 1,190,423,787 1,194,273,401 1,194,478,212 Economic Net Income Adjusted Units, End of Period 1,190,864,027 1,191,328,573 1,190,361,741 1,194,083,538 1,194,567,513 Total Common Units Outstanding 630,414,455 635,440,608 637,410,828 643,789,108 645,810,990 Adjustments: Blackstone Holdings Partnership Units 545,861,003 549,317,005 546,844,892 543,969,293 542,206,078 Distributable Earnings Units Outstanding 1,176,275,458 1,184,757,613 1,184,255,720 1,187,758,401 1,188,017,068 |
 Blackstone 32 Definitions and Distribution Policy Blackstone discloses the following financial measures that are calculated and presented on the basis of methodologies other than in
accordance with generally accepted accounting principles in the
United States of America (“non-GAAP”) in this presentation: • Blackstone uses Economic Income, or “EI”, as a key measure of value creation, a benchmark of its performance and in making
resource deployment and compensation decisions across its four
segments. EI represents segment net income before taxes excluding transaction-related charges. Transaction-related charges arise from Blackstone’s initial public offering (“IPO”) and long-term retention
programs outside of annual deferred compensation and other
corporate actions, including acquisitions. Transaction-related charges include equity-based compensation charges, the amortization of intangible assets and contingent consideration associated with acquisitions. EI presents revenues and expenses on a basis
that deconsolidates the investment funds Blackstone manages. • Economic Net Income, or “ENI”, represents EI adjusted to include current period taxes. Taxes represent the total GAAP tax
provision adjusted to include only the current tax provision
(benefit) calculated on Income (Loss) Before Provision for Taxes. • Blackstone uses Fee Related Earnings, or “FRE”, which is derived from EI, as a measure to highlight earnings from operations
excluding: (a) the income related to performance fees and related
carry plan costs and (b) income earned from Blackstone’s investments in the Blackstone Funds. Blackstone uses FRE as a measure to assess whether recurring revenue from its businesses is sufficient to adequately cover all of its
operating expenses and generate profits. FRE equals contractual
fee revenues less (a) compensation expenses (which includes amortization of non-IPO and non-acquisition-related equity-based awards, but excludes amortization of IPO and acquisition-related equity-based
awards, Carried Interest and incentive fee compensation), and (b)
non-interest operating expenses. • Distributable Earnings, or “DE”, which is derived from Blackstone’s segment reported results, is a supplemental measure to
assess performance and amounts available for distributions to
Blackstone unitholders, including Blackstone personnel and others who are limited partners of the Blackstone Holdings partnerships. DE is intended to show the amount of net realized earnings without the effects of the consolidation of
the Blackstone Funds. DE, which is a component of ENI, is the sum
across all segments of: (a) Total Management and Advisory Fees, (b) Interest and Dividend Revenue, (c) Other Revenue, (d) Realized Performance Fees, and (e) Realized Investment Income (Loss); less (a) Compensation,
excluding the expense of equity-based awards, (b) Realized
Performance Fee Compensation, (c) Other Operating Expenses, and (d) Taxes and Related Payables Under the Tax Receivable Agreement. DE is reconciled to Blackstone’s Consolidated Statement of Operations. • Blackstone uses Adjusted Earnings Before Interest, Taxes and Depreciation and Amortization, or “Adjusted EBITDA”, as a
supplemental non-GAAP measure derived from segment reported
results and may be used to assess its ability to service its borrowings. Adjusted EBITDA represents DE plus the addition of (a) Interest Expense, (b) Taxes and Related Payables Including Payable Under Tax Receivable Agreement, and (c)
Depreciation and Amortization. Distribution Policy. Blackstone’s intention is to distribute quarterly to common unitholders approximately 85% of The Blackstone
Group L.P.’s share of Distributable Earnings, subject to
adjustment by amounts determined by Blackstone’s general partner to be necessary or appropriate to provide for the conduct of its business, to make appropriate investments in its business and funds, to comply with applicable law, any of its debt
instruments or other agreements, or to provide for future cash
requirements such as tax-related payments, clawback obligations and distributions to unitholders for any ensuing quarter. The amount to be distributed could also be adjusted upward in any one quarter. All of the foregoing is subject to
the qualification that the declaration and payment of any
distributions are at the sole discretion of Blackstone’s general partner and may change its distribution policy at any time, including, without limitation, to eliminate such distributions entirely.
|
 Blackstone 33 Forward-Looking Statements This presentation may contain forward-looking statements within the meaning of Section 27A of the Securities Act of 1933 and
Section 21E of the Securities Exchange Act of 1934 which reflect
Blackstone’s current views with respect to, among other things,
Blackstone’s operations and financial performance. You can identify these
forward-looking statements by the use of words such as
“outlook,” “indicator,” “believes,”
“expects,” “potential,” “continues,” “may,” “will,” “should,” “seeks,” “approximately,” “predicts,”
“intends,” “plans,” “estimates,”
“anticipates” or the negative version of these words or other comparable words. Such forward-looking statements are subject to various risks and uncertainties. Accordingly, there are or will be important factors that could cause actual
outcomes or results to differ materially from those indicated in
these statements. Blackstone believes these factors include but
are not limited to those described under the section entitled “Risk Factors” in its Annual Report on Form 10-K for the fiscal
year ended December 31, 2015, as such factors may be updated from
time to time in its periodic filings with the Securities and Exchange Commission, which are accessible on the SEC’s website at www.sec.gov. These factors should not be construed as exhaustive
and should be read in conjunction with the other cautionary
statements that are included in this presentation and in the filings. Blackstone undertakes no obligation to publicly update or review any forward-looking statement, whether as a result of new information, future
developments or otherwise.
This presentation does not constitute an offer of any Blackstone
Fund. |