Attached files
| file | filename |
|---|---|
| EX-99.1 - EX-99.1 - GMS Inc. | a16-14744_1ex99d1.htm |
| 8-K - 8-K - GMS Inc. | a16-14744_18k.htm |
Exhibit 99.2
GMS Quarterly Review Fiscal Q4 2016
Safe Harbor and Basis of Presentation Forward-Looking Statement Safe Harbor - This presentation includes "forward-looking statements" within the meaning of the Private Securities Litigation Reform Act of 1995. All of these forward-looking statements are based on estimates and assumptions made by our management that, although believed by us to be reasonable, are inherently uncertain. Forward-looking statements involve risks and uncertainties, including, but not limited to, economic, competitive, governmental and technological factors outside of our control, that may cause our business, strategy or actual results to differ materially from the forward-looking statements. These risks and uncertainties may include, among other things: changes in the prices, supply, and/or demand for products which we distribute; general economic and business conditions in the United States; the activities of competitors; changes in significant operating expenses; changes in the availability of capital and interest rates; adverse weather patterns or conditions; acts of cyber intrusion; variations in the performance of the financial markets, including the credit markets; and other factors described in the "Risk Factors" section in our Annual Report on Form 10-K for the fiscal year ended April 30, 2016, and in our other periodic reports filed with the SEC. In addition, the statements in this presentation are made as of July 12, 2016. We undertake no obligation to update any of the forward looking statements made herein, whether as a result of new information, future events, changes in expectation or otherwise. These forward-looking statements should not be relied upon as representing our views as of any date subsequent to July 12, 2016. Use of Non-GAAP and Adjusted Financial Information - To supplement GAAP financial information, we use adjusted measures of operating results which are non-GAAP measures. This non-GAAP adjusted financial information is provided as additional information for investors. These adjusted results exclude certain costs, expenses, gains and losses, and we believe their exclusion can enhance an overall understanding of our past financial performance and also our prospects for the future. These adjustments to our GAAP results are made with the intent of providing both management and investors a more complete understanding of our operating performance by excluding non-recurring, infrequent or other non-cash charges that are not believed to be material to the ongoing performance of our business. The presentation of this additional information is not meant to be considered in isolation or as a substitute for GAAP measures of net earnings, diluted earnings per share or net cash provided by (used in) operating activities prepared in accordance with generally accepted accounting principles in the United States. 2
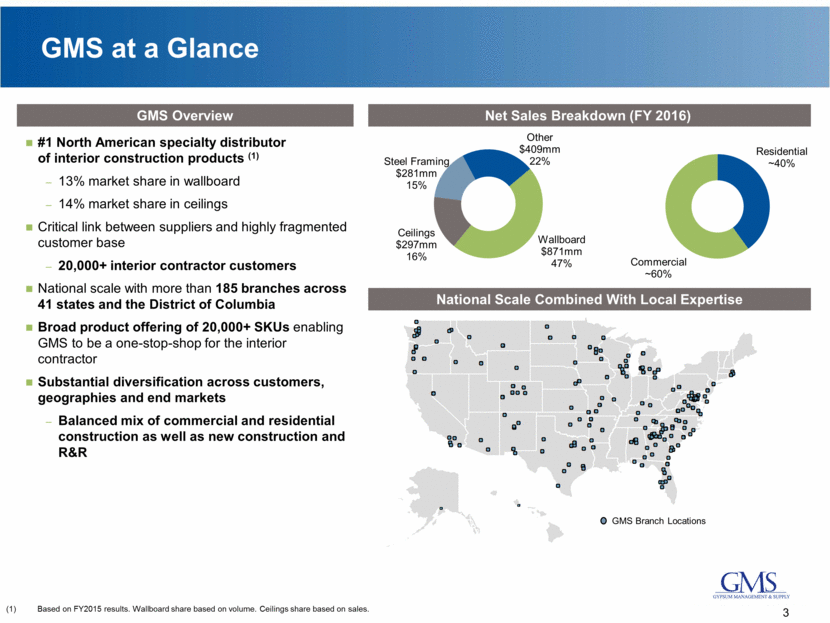
GMS at a Glance Based on FY2015 results. Wallboard share based on volume. Ceilings share based on sales. GMS Overview Net Sales Breakdown (FY 2016) #1 North American specialty distributor of interior construction products (1) 13% market share in wallboard 14% market share in ceilings Critical link between suppliers and highly fragmented customer base 20,000+ interior contractor customers National scale with more than 185 branches across 41 states and the District of Columbia Broad product offering of 20,000+ SKUs enabling GMS to be a one-stop-shop for the interior contractor Substantial diversification across customers, geographies and end markets Balanced mix of commercial and residential construction as well as new construction and R&R National Scale Combined With Local Expertise Wallboard $871mm 47% Ceilings $297mm 16% Steel Framing $281mm 15% Other $409mm 22% 3 GMS Branch Locations Residential ~40% Commercial ~60% Ä Ä Ä Ä Ä Ä Ä Ä Ä Ä Ä Ä Ä Ä Ä Ä Ä Ä Ä Ä Ä Ä Ä Ä Ä Ä Ä Ä Ä Ä Ä Ä Ä Ä Ä Ä Ä Ä Ä Ä Ä Ä Ä Ä Ä Ä Ä Ä Ä Ä Ä Ä Ä Ä Ä Ä Ä Ä Ä Ä Ä Ä Ä Ä Ä Ä Ä Ä Ä Ä Ä Ä Ä Ä Ä Ä Ä Ä Ä Ä Ä Ä Ä Ä Ä Ä Ä Ä Ä Ä Ä Ä Ä Ä Ä Ä Ä Ä Ä Ä Ä Ä Ä Ä Ä Ä Ä Ä Ä Ä Ä Ä Ä Ä Ä Ä Ä Ä Ä Ä Ä Ä Ä Ä Ä Ä Ä Ä Ä Ä Ä Ä Ä Ä Ä Ä Ä Ä Ä Ä Ä Ä Ä Ä Ä Ä Ä Ä Ä Ä Ä Ä Ä Ä Ä Ä Ä Ä Ä Ä Ä Ä Ä Ä Ä Ä Ä Ä Ä Ä Ä Ä Ä Ä Ä Ä Ä Ä Ä Ä Ä Ä Ä Ä Ä Ä Ä Ä Ä Ä Ä Ä Ä Ä Ä Ä
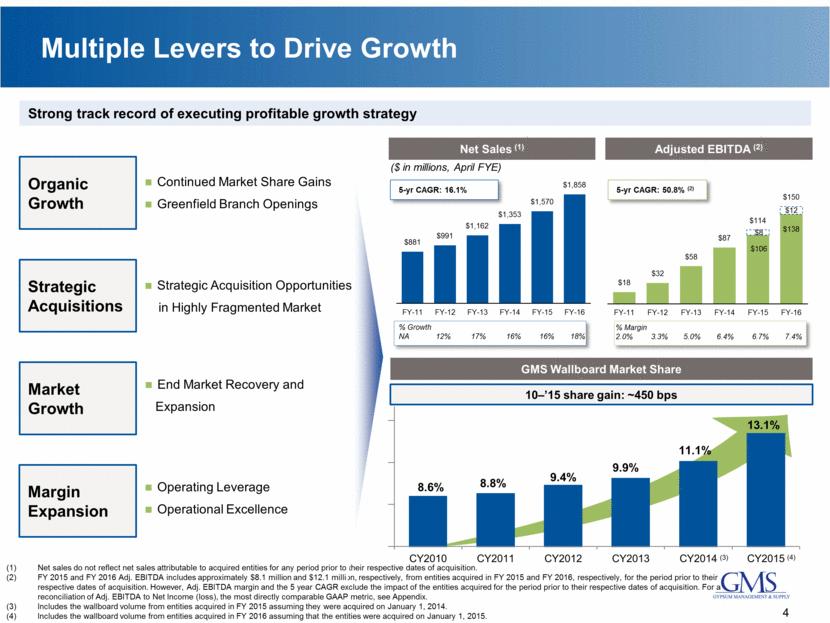
Multiple Levers to Drive Growth End Market Recovery and Expansion Market Growth Operating Leverage Operational Excellence Margin Expansion Organic Growth Strategic Acquisitions ($ in millions, April FYE) 5-yr CAGR: 16.1% 5-yr CAGR: 50.8% (2) % Margin 2.0% 3.3% 5.0% 6.4% 6.7% 7.4% % Growth NA 12% 17% 16% 16% 18% 10–’15 share gain: ~450 bps GMS Wallboard Market Share Adjusted EBITDA (2) Net Sales (1) Net sales do not reflect net sales attributable to acquired entities for any period prior to their respective dates of acquisition. FY 2015 and FY 2016 Adj. EBITDA includes approximately $8.1 million and $12.1 million, respectively, from entities acquired in FY 2015 and FY 2016, respectively, for the period prior to their respective dates of acquisition. However, Adj. EBITDA margin and the 5 year CAGR exclude the impact of the entities acquired for the period prior to their respective dates of acquisition. For a reconciliation of Adj. EBITDA to Net Income (loss), the most directly comparable GAAP metric, see Appendix. Includes the wallboard volume from entities acquired in FY 2015 assuming they were acquired on January 1, 2014. Includes the wallboard volume from entities acquired in FY 2016 assuming that the entities were acquired on January 1, 2015. (3) (4) 4 Strategic Acquisition Opportunities in Highly Fragmented Market Continued Market Share Gains Greenfield Branch Openings Strong track record of executing profitable growth strategy $106 $138 $8 $12 $18 $32 $58 $87 $114 $150 FY-11 FY-12 FY-13 FY-14 FY-15 FY-16 $881 $991 $1,162 $1,353 $1,570 $1,858 FY-11 FY-12 FY-13 FY-14 FY-15 FY-16 8.6% 8.8% 9.4% 9.9% 13.1% CY2010 CY2011 CY2012 CY2013 CY2014 CY2015 11.1 %
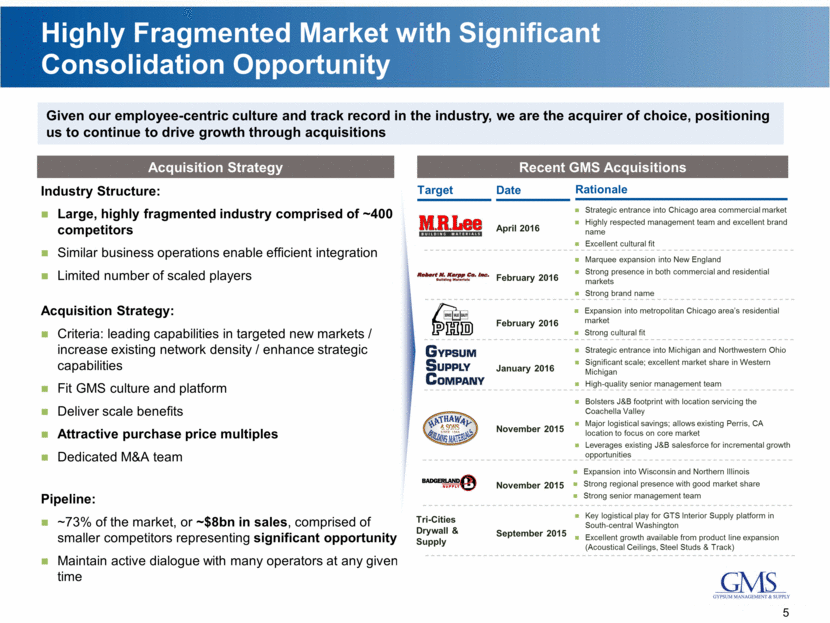
Highly Fragmented Market with Significant Consolidation Opportunity 5 Acquisition Strategy Recent GMS Acquisitions Expansion into metropolitan Chicago area’s residential market Strong cultural fit Target Date Rationale February 2016 January 2016 Strategic entrance into Michigan and Northwestern Ohio Significant scale; excellent market share in Western Michigan High-quality senior management team Marquee expansion into New England Strong presence in both commercial and residential markets Strong brand name November 2015 Bolsters J&B footprint with location servicing the Coachella Valley Major logistical savings; allows existing Perris, CA location to focus on core market Leverages existing J&B salesforce for incremental growth opportunities Key logistical play for GTS Interior Supply platform in South-central Washington Excellent growth available from product line expansion (Acoustical Ceilings, Steel Studs & Track) September 2015 April 2016 February 2016 Strategic entrance into Chicago area commercial market Highly respected management team and excellent brand name Excellent cultural fit Expansion into Wisconsin and Northern Illinois Strong regional presence with good market share Strong senior management team November 2015 Tri-Cities Drywall & Supply Industry Structure: Large, highly fragmented industry comprised of ~400 competitors Similar business operations enable efficient integration Limited number of scaled players Acquisition Strategy: Criteria: leading capabilities in targeted new markets / increase existing network density / enhance strategic capabilities Fit GMS culture and platform Deliver scale benefits Attractive purchase price multiples Dedicated M&A team Pipeline: ~73% of the market, or ~$8bn in sales, comprised of smaller competitors representing significant opportunity Maintain active dialogue with many operators at any given time Given our employee-centric culture and track record in the industry, we are the acquirer of choice, positioning us to continue to drive growth through acquisitions
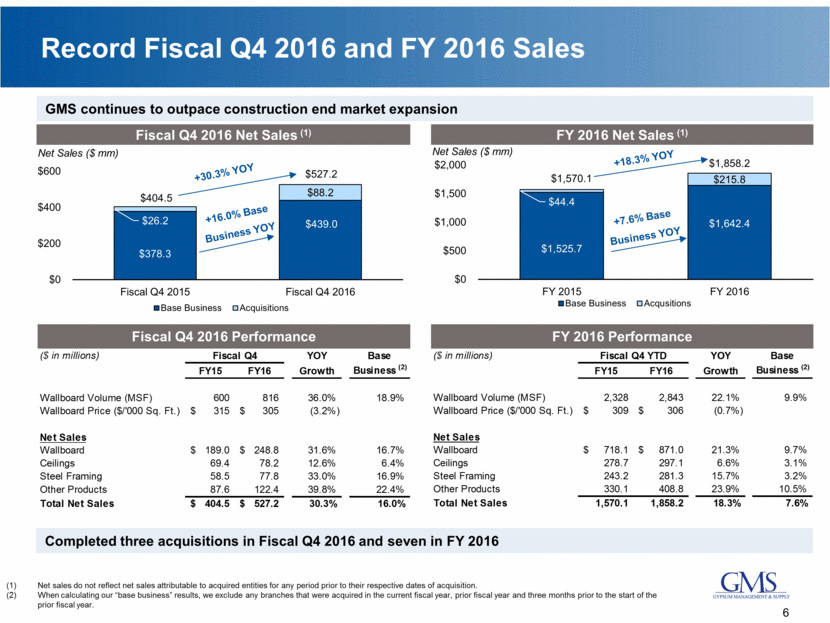
Record Fiscal Q4 2016 and FY 2016 Sales 6 Net Sales ($ mm) Fiscal Q4 2016 Net Sales (1) +30.3% YOY (5) Net Sales ($ mm) FY 2016 Net Sales (1) +18.3% YOY GMS continues to outpace construction end market expansion (5) +16.0% Base Business YOY +7.6% Base Business YOY Completed three acquisitions in Fiscal Q4 2016 and seven in FY 2016 Net sales do not reflect net sales attributable to acquired entities for any period prior to their respective dates of acquisition. When calculating our “base business” results, we exclude any branches that were acquired in the current fiscal year, prior fiscal year and three months prior to the start of the prior fiscal year. $1,570.1 $404.5 $527.2 Fiscal Q4 2016 Performance FY 2016 Performance ($ in millions) Fiscal Q4 YOY Base FY15 FY16 Growth Business (2) Wallboard Volume (MSF) 600 816 36.0% 18.9% Wallboard Price ($/'000 Sq. Ft.) 315 $ 305 $ (3.2%) Net Sales Wallboard 189.0 $ 248.8 $ 31.6% 16.7% Ceilings 69.4 78.2 12.6% 6.4% Steel Framing 58.5 77.8 33.0% 16.9% Other Products 87.6 122.4 39.8% 22.4% Total Net Sales 404.5 $ 527.2 $ 30.3% 16.0% ($ in millions) Fiscal Q4 YTD YOY Base FY15 FY16 Growth Business (2) Wallboard Volume (MSF) 2,328 2,843 22.1% 9.9% Wallboard Price ($/'000 Sq. Ft.) 309 $ 306 $ (0.7%) Net Sales Wallboard 718.1 $ 871.0 $ 21.3% 9.7% Ceilings 278.7 297.1 6.6% 3.1% Steel Framing 243.2 281.3 15.7% 3.2% Other Products 330.1 408.8 23.9% 10.5% Total Net Sales 1,570.1 1,858.2 18.3% 7.6%
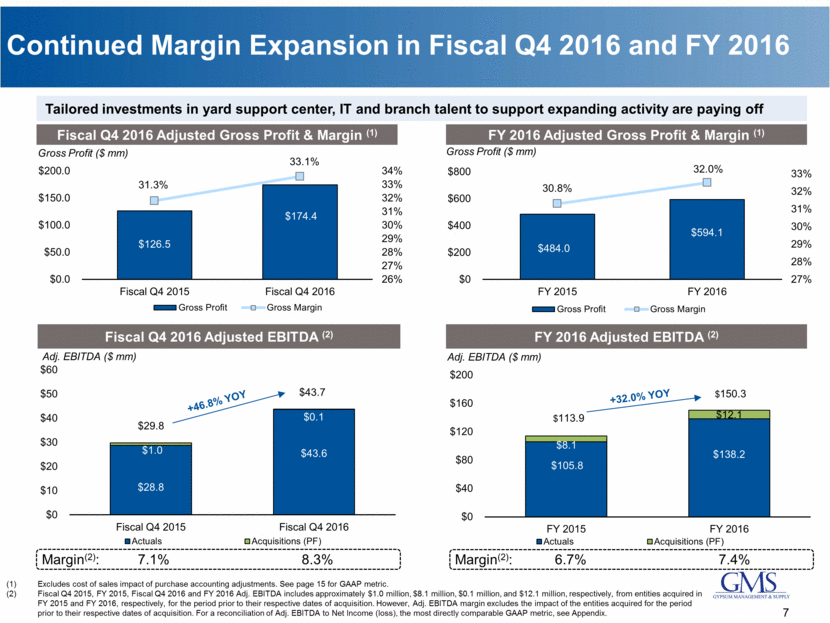
Continued Margin Expansion in Fiscal Q4 2016 and FY 2016 7 Gross Profit ($ mm) Fiscal Q4 2016 Adjusted Gross Profit & Margin (1) (5) Adj. EBITDA ($ mm) Fiscal Q4 2016 Adjusted EBITDA (2) Gross Profit ($ mm) FY 2016 Adjusted Gross Profit & Margin (1) Tailored investments in yard support center, IT and branch talent to support expanding activity are paying off $29.8 (5) Adj. EBITDA ($ mm) FY 2016 Adjusted EBITDA (2) $113.9 Excludes cost of sales impact of purchase accounting adjustments. See page 15 for GAAP metric. Fiscal Q4 2015, FY 2015, Fiscal Q4 2016 and FY 2016 Adj. EBITDA includes approximately $1.0 million, $8.1 million, $0.1 million, and $12.1 million, respectively, from entities acquired in FY 2015 and FY 2016, respectively, for the period prior to their respective dates of acquisition. However, Adj. EBITDA margin excludes the impact of the entities acquired for the period prior to their respective dates of acquisition. For a reconciliation of Adj. EBITDA to Net Income (loss), the most directly comparable GAAP metric, see Appendix. $43.7 +32.0% YOY Margin(2): 7.1% 8.3% Margin(2): 6.7% 7.4%
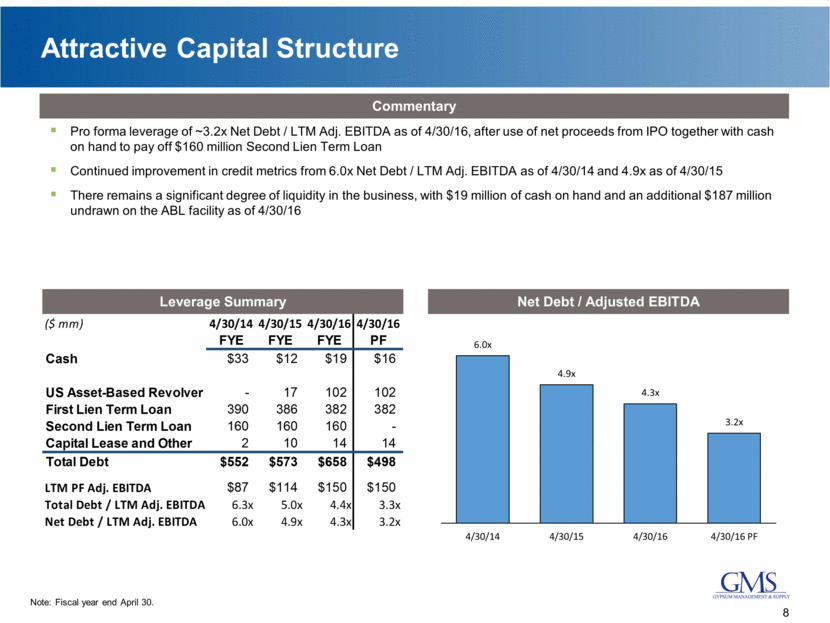
Attractive Capital Structure Pro forma leverage of ~3.2x Net Debt / LTM Adj. EBITDA as of 4/30/16, after use of net proceeds from IPO together with cash on hand to pay off $160 million Second Lien Term Loan Continued improvement in credit metrics from 6.0x Net Debt / LTM Adj. EBITDA as of 4/30/14 and 4.9x as of 4/30/15 There remains a significant degree of liquidity in the business, with $19 million of cash on hand and an additional $187 million undrawn on the ABL facility as of 4/30/16 Commentary Leverage Summary Net Debt / Adjusted EBITDA Note: Fiscal year end April 30. 8 ($ mm) 4/30/14 4/30/15 4/30/16 4/30/16 FYE FYE FYE PF Cash $33 $12 $19 $16 US Asset-Based Revolver - 17 102 102 First Lien Term Loan 390 386 382 382 Second Lien Term Loan 160 160 160 - Capital Lease and Other 2 10 14 14 Total Debt $552 $573 $658 $498 LTM PF Adj. EBITDA $87 $114 $150 $150 Total Debt / LTM Adj. EBITDA 6.3x 5.0x 4.4x 3.3x Net Debt / LTM Adj. EBITDA 6.0x 4.9x 4.3x 3.2x 6.0x 4.9x 4.3x 3.2x 4/30/14 4/30/15 4/30/16 4/30/16 PF
Appendix
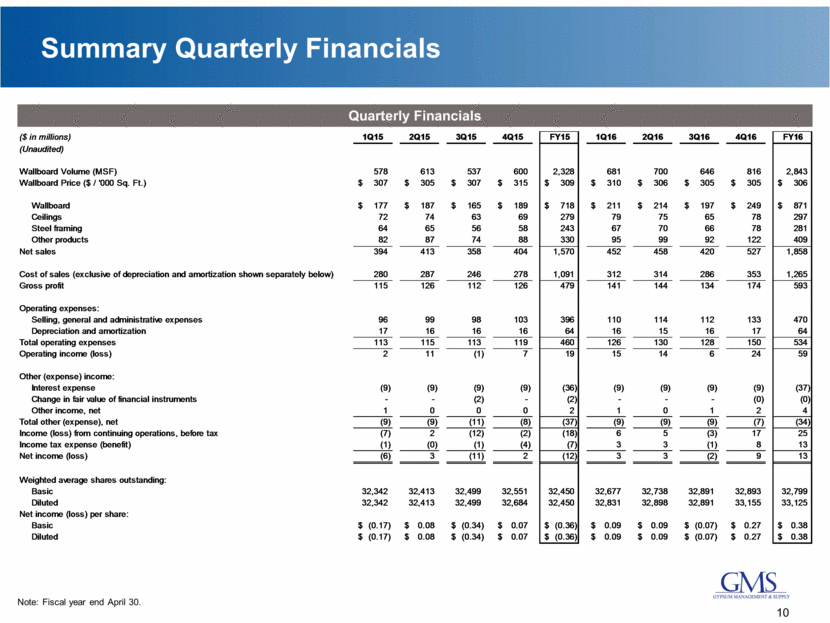
Quarterly Financials Summary Quarterly Financials Note: Fiscal year end April 30. 10 ($ in millions) 1Q15 2Q15 3Q15 4Q15 FY15 1Q16 2Q16 3Q16 4Q16 FY16 (Unaudited) Wallboard Volume (MSF) 578 613 537 600 2,328 681 700 646 816 2,843 Wallboard Price ($ / '000 Sq. Ft.) 307 $ 305 $ 307 $ 315 $ 309 $ 310 $ 306 $ 305 $ 305 $ 306 $ Wallboard 177 $ 187 $ 165 $ 189 $ 718 $ 211 $ 214 $ 197 $ 249 $ 871 $ Ceilings 72 74 63 69 279 79 75 65 78 297 Steel framing 64 65 56 58 243 67 70 66 78 281 Other products 82 87 74 88 330 95 99 92 122 409 Net sales 394 413 358 404 1,570 452 458 420 527 1,858 Cost of sales (exclusive of depreciation and amortization shown separately below) 280 287 246 278 1,091 312 314 286 353 1,265 Gross profit 115 126 112 126 479 141 144 134 174 593 Operating expenses: Selling, general and administrative expenses 96 99 98 103 396 110 114 112 133 470 Depreciation and amortization 17 16 16 16 64 16 15 16 17 64 Total operating expenses 113 115 113 119 460 126 130 128 150 534 Operating income (loss) 2 11 (1) 7 19 15 14 6 24 59 Other (expense) income: Interest expense (9) (9) (9) (9) (36) (9) (9) (9) (9) (37) Change in fair value of financial instruments - - (2) - (2) - - - (0) (0) Other income, net 1 0 0 0 2 1 0 1 2 4 Total other (expense), net (9) (9) (11) (8) (37) (9) (9) (9) (7) (34) Income (loss) from continuing operations, before tax (7) 2 (12) (2) (18) 6 5 (3) 17 25 Income tax expense (benefit) (1) (0) (1) (4) (7) 3 3 (1) 8 13 Net income (loss) (6) 3 (11) 2 (12) 3 3 (2) 9 13 Weighted average shares outstanding: Basic 32,342 32,413 32,499 32,551 32,450 32,677 32,738 32,891 32,893 32,799 Diluted 32,342 32,413 32,499 32,684 32,450 32,831 32,898 32,891 33,155 33,125 Net income (loss) per share: Basic (0.17) $ 0.08 $ (0.34) $ 0.07 $ (0.36) $ 0.09 $ 0.09 $ (0.07) $ 0.27 $ 0.38 $ Diluted (0.17) $ 0.08 $ (0.34) $ 0.07 $ (0.36) $ 0.09 $ 0.09 $ (0.07) $ 0.27 $ 0.38 $
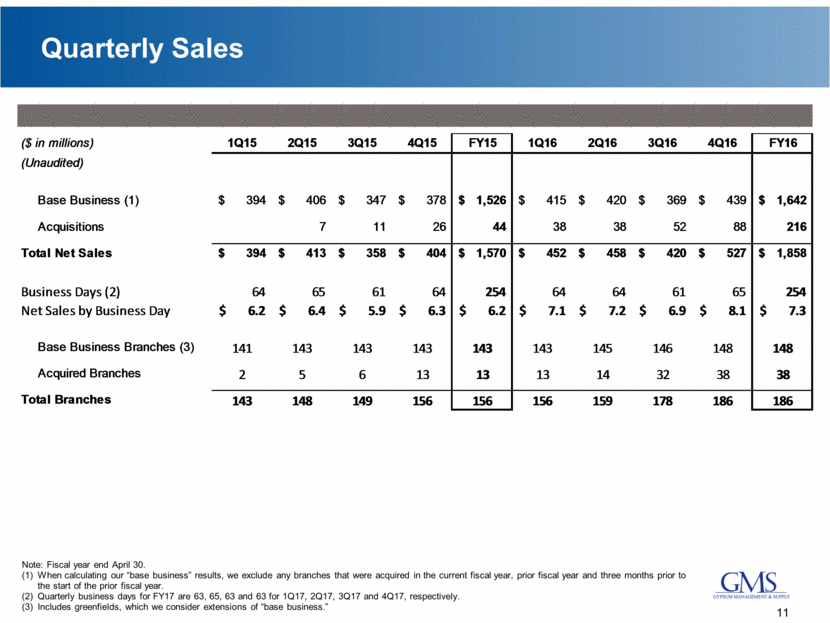
Quarterly Sales Note: Fiscal year end April 30. When calculating our “base business” results, we exclude any branches that were acquired in the current fiscal year, prior fiscal year and three months prior to the start of the prior fiscal year. Quarterly business days for FY17 are 63, 65, 63 and 63 for 1Q17, 2Q17, 3Q17 and 4Q17, respectively. Includes greenfields, which we consider extensions of “base business.” 11 ($ in millions) 1Q15 2Q15 3Q15 4Q15 FY15 1Q16 2Q16 3Q16 4Q16 FY16 (Unaudited) Base Business (1) 394 $ 406 $ 347 $ 378 $ 1,526 $ 415 $ 420 $ 369 $ 439 $ 1,642 $ Acquisitions 7 11 26 44 38 38 52 88 216 Total Net Sales 394 $ 413 $ 358 $ 404 $ 1,570 $ 452 $ 458 $ 420 $ 527 $ 1,858 $ Business Days (2) 64 65 61 64 254 64 64 61 65 254 Net Sales by Business Day 6.2 $ 6.4 $ 5.9 $ 6.3 $ 6.2 $ 7.1 $ 7.2 $ 6.9 $ 8.1 $ 7.3 $ Base Business Branches (3) 141 143 143 143 143 143 145 146 148 148 Acquired Branches 2 5 6 13 13 13 14 32 38 38 Total Branches 143 148 149 156 156 156 159 178 186 186
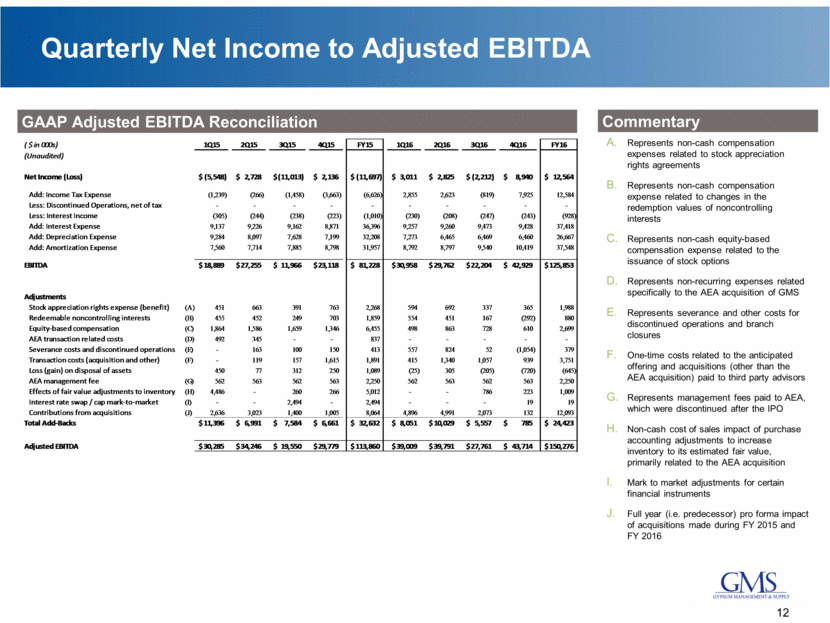
Quarterly Net Income to Adjusted EBITDA GAAP Adjusted EBITDA Reconciliation Commentary Represents non-cash compensation expenses related to stock appreciation rights agreements Represents non-cash compensation expense related to changes in the redemption values of noncontrolling interests Represents non-cash equity-based compensation expense related to the issuance of stock options Represents non-recurring expenses related specifically to the AEA acquisition of GMS Represents severance and other costs for discontinued operations and branch closures One-time costs related to the anticipated offering and acquisitions (other than the AEA acquisition) paid to third party advisors Represents management fees paid to AEA, which were discontinued after the IPO Non-cash cost of sales impact of purchase accounting adjustments to increase inventory to its estimated fair value, primarily related to the AEA acquisition Mark to market adjustments for certain financial instruments Full year (i.e. predecessor) pro forma impact of acquisitions made during FY 2015 and FY 2016 12 ( $ in 000s) 1Q15 2Q15 3Q15 4Q15 FY15 1Q16 2Q16 3Q16 4Q16 FY16 (Unaudited) Net Income (Loss) (5,548) $ 2,728 $ (11,013) $ 2,136 $ (11,697) $ 3,011 $ 2,825 $ (2,212) $ 8,940 $ 12,564 $ Add: Income Tax Expense (1,239) (266) (1,458) (3,663) (6,626) 2,855 2,623 (819) 7,925 12,584 Less: Discontinued Operations, net of tax - - - - - - - - - - Less: Interest Income (305) (244) (238) (223) (1,010) (230) (208) (247) (243) (928) Add: Interest Expense 9,137 9,226 9,162 8,871 36,396 9,257 9,260 9,473 9,428 37,418 Add: Depreciation Expense 9,284 8,097 7,628 7,199 32,208 7,273 6,465 6,469 6,460 26,667 Add: Amortization Expense 7,560 7,714 7,885 8,798 31,957 8,792 8,797 9,540 10,419 37,548 EBITDA 18,889 $ 27,255 $ 11,966 $ 23,118 $ 81,228 $ 30,958 $ 29,762 $ 22,204 $ 42,929 $ 125,853 $ Adjustments Stock appreciation rights expense (benefit) (A) 451 663 391 763 2,268 594 692 337 365 1,988 Redeemable noncontrolling interests (B) 455 452 249 703 1,859 554 451 167 (292) 880 Equity-based compensation (C) 1,864 1,586 1,659 1,346 6,455 498 863 728 610 2,699 AEA transaction related costs (D) 492 345 - - 837 - - - - - Severance costs and discontinued operations (E) - 163 100 150 413 557 824 52 (1,054) 379 Transaction costs (acquisition and other) (F) - 119 157 1,615 1,891 415 1,340 1,057 939 3,751 Loss (gain) on disposal of assets 450 77 312 250 1,089 (25) 305 (205) (720) (645) AEA management fee (G) 562 563 562 563 2,250 562 563 562 563 2,250 Effects of fair value adjustments to inventory (H) 4,486 - 260 266 5,012 - - 786 223 1,009 Interest rate swap / cap mark-to-market (I) - - 2,494 - 2,494 - - - 19 19 Contributions from acquisitions (J) 2,636 3,023 1,400 1,005 8,064 4,896 4,991 2,073 132 12,093 Total Add-Backs 11,396 $ 6,991 $ 7,584 $ 6,661 $ 32,632 $ 8,051 $ 10,029 $ 5,557 $ 785 $ 24,423 $ Adjusted EBITDA 30,285 $ 34,246 $ 19,550 $ 29,779 $ 113,860 $ 39,009 $ 39,791 $ 27,761 $ 43,714 $ 150,276 $
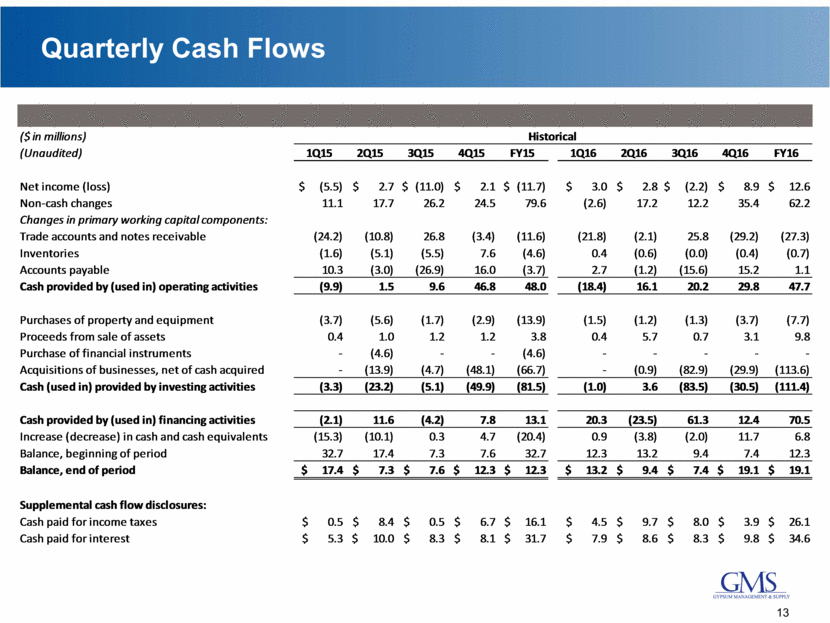
Quarterly Cash Flows 13 ($ in millions) (Unaudited) 1Q15 2Q15 3Q15 4Q15 FY15 1Q16 2Q16 3Q16 4Q16 FY16 Net income (loss) $ (5.5) $ 2.7 $ (11.0) $ 2.1 $ (11.7) $ 3.0 $ 2.8 $ (2.2) $ 8.9 $ 12.6 Non-cash changes 11.1 17.7 26.2 24.5 79.6 (2.6) 17.2 12.2 35.4 62.2 Changes in primary working capital components: Trade accounts and notes receivable (24.2) (10.8) 26.8 (3.4) (11.6) (21.8) (2.1) 25.8 (29.2) (27.3) Inventories (1.6) (5.1) (5.5) 7.6 (4.6) 0.4 (0.6) (0.0) (0.4) (0.7) Accounts payable 10.3 (3.0) (26.9) 16.0 (3.7) 2.7 (1.2) (15.6) 15.2 1.1 Cash provided by (used in) operating activities (9.9) 1.5 9.6 46.8 48.0 (18.4) 16.1 20.2 29.8 47.7 Purchases of property and equipment (3.7) (5.6) (1.7) (2.9) (13.9) (1.5) (1.2) (1.3) (3.7) (7.7) Proceeds from sale of assets 0.4 1.0 1.2 1.2 3.8 0.4 5.7 0.7 3.1 9.8 Purchase of financial instruments - (4.6) - - (4.6) - - - - - Acquisitions of businesses, net of cash acquired - (13.9) (4.7) (48.1) (66.7) - (0.9) (82.9) (29.9) (113.6) Cash (used in) provided by investing activities (3.3) (23.2) (5.1) (49.9) (81.5) (1.0) 3.6 (83.5) (30.5) (111.4) Cash provided by (used in) financing activities (2.1) 11.6 (4.2) 7.8 13.1 20.3 (23.5) 61.3 12.4 70.5 Increase (decrease) in cash and cash equivalents (15.3) (10.1) 0.3 4.7 (20.4) 0.9 (3.8) (2.0) 11.7 6.8 Balance, beginning of period 32.7 17.4 7.3 7.6 32.7 12.3 13.2 9.4 7.4 12.3 Balance, end of period $ 17.4 $ 7.3 $ 7.6 $ 12.3 $ 12.3 $ 13.2 $ 9.4 $ 7.4 $ 19.1 $ 19.1 Supplemental cash flow disclosures: Cash paid for income taxes $ 0.5 $ 8.4 $ 0.5 $ 6.7 $ 16.1 $ 4.5 $ 9.7 $ 8.0 $ 3.9 $ 26.1 Cash paid for interest $ 5.3 $ 10.0 $ 8.3 $ 8.1 $ 31.7 $ 7.9 $ 8.6 $ 8.3 $ 9.8 $ 34.6 Historical
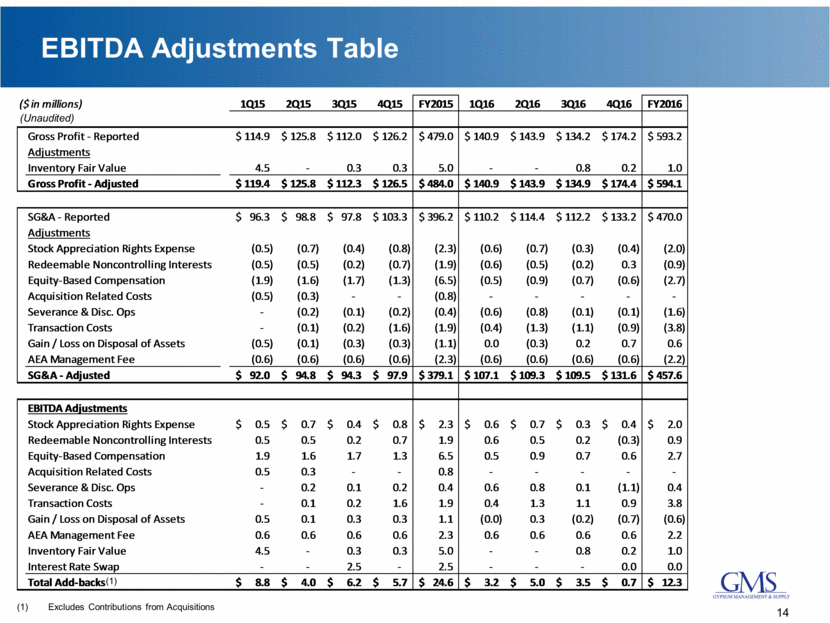
EBITDA Adjustments Table 14 Excludes Contributions from Acquisitions (1) (Unaudited) ($ in millions) 1Q15 2Q15 3Q15 4Q15 FY2015 1Q16 2Q16 3Q16 4Q16 FY2016 Gross Profit - Reported 114.9 $ 125.8 $ 112.0 $ 126.2 $ 479.0 $ 140.9 $ 143.9 $ 134.2 $ 174.2 $ 593.2 $ Adjustments Inventory Fair Value 4.5 - 0.3 0.3 5.0 - - 0.8 0.2 1.0 Gross Profit - Adjusted 119.4 $ 125.8 $ 112.3 $ 126.5 $ 484.0 $ 140.9 $ 143.9 $ 134.9 $ 174.4 $ 594.1 $ SG&A - Reported 96.3 $ 98.8 $ 97.8 $ 103.3 $ 396.2 $ 110.2 $ 114.4 $ 112.2 $ 133.2 $ 470.0 $ Adjustments Stock Appreciation Rights Expense (0.5) (0.7) (0.4) (0.8) (2.3) (0.6) (0.7) (0.3) (0.4) (2.0) Redeemable Noncontrolling Interests (0.5) (0.5) (0.2) (0.7) (1.9) (0.6) (0.5) (0.2) 0.3 (0.9) Equity-Based Compensation (1.9) (1.6) (1.7) (1.3) (6.5) (0.5) (0.9) (0.7) (0.6) (2.7) Acquisition Related Costs (0.5) (0.3) - - (0.8) - - - - - Severance & Disc. Ops - (0.2) (0.1) (0.2) (0.4) (0.6) (0.8) (0.1) (0.1) (1.6) Transaction Costs - (0.1) (0.2) (1.6) (1.9) (0.4) (1.3) (1.1) (0.9) (3.8) Gain / Loss on Disposal of Assets (0.5) (0.1) (0.3) (0.3) (1.1) 0.0 (0.3) 0.2 0.7 0.6 AEA Management Fee (0.6) (0.6) (0.6) (0.6) (2.3) (0.6) (0.6) (0.6) (0.6) (2.2) SG&A - Adjusted 92.0 $ 94.8 $ 94.3 $ 97.9 $ 379.1 $ 107.1 $ 109.3 $ 109.5 $ 131.6 $ 457.6 $ EBITDA Adjustments Stock Appreciation Rights Expense 0.5 $ 0.7 $ 0.4 $ 0.8 $ 2.3 $ 0.6 $ 0.7 $ 0.3 $ 0.4 $ 2.0 $ Redeemable Noncontrolling Interests 0.5 0.5 0.2 0.7 1.9 0.6 0.5 0.2 (0.3) 0.9 Equity-Based Compensation 1.9 1.6 1.7 1.3 6.5 0.5 0.9 0.7 0.6 2.7 Acquisition Related Costs 0.5 0.3 - - 0.8 - - - - - Severance & Disc. Ops - 0.2 0.1 0.2 0.4 0.6 0.8 0.1 (1.1) 0.4 Transaction Costs - 0.1 0.2 1.6 1.9 0.4 1.3 1.1 0.9 3.8 Gain / Loss on Disposal of Assets 0.5 0.1 0.3 0.3 1.1 (0.0) 0.3 (0.2) (0.7) (0.6) AEA Management Fee 0.6 0.6 0.6 0.6 2.3 0.6 0.6 0.6 0.6 2.2 Inventory Fair Value 4.5 - 0.3 0.3 5.0 - - 0.8 0.2 1.0 Interest Rate Swap - - 2.5 - 2.5 - - - 0.0 0.0 Total Add-backs 8.8 $ 4.0 $ 6.2 $ 5.7 $ 24.6 $ 3.2 $ 5.0 $ 3.5 $ 0.7 $ 12.3 $
www.gms.com