Attached files
| file | filename |
|---|---|
| 8-K - 8-K - Trinseo S.A. | a16-13842_28k.htm |
Exhibit 99.1
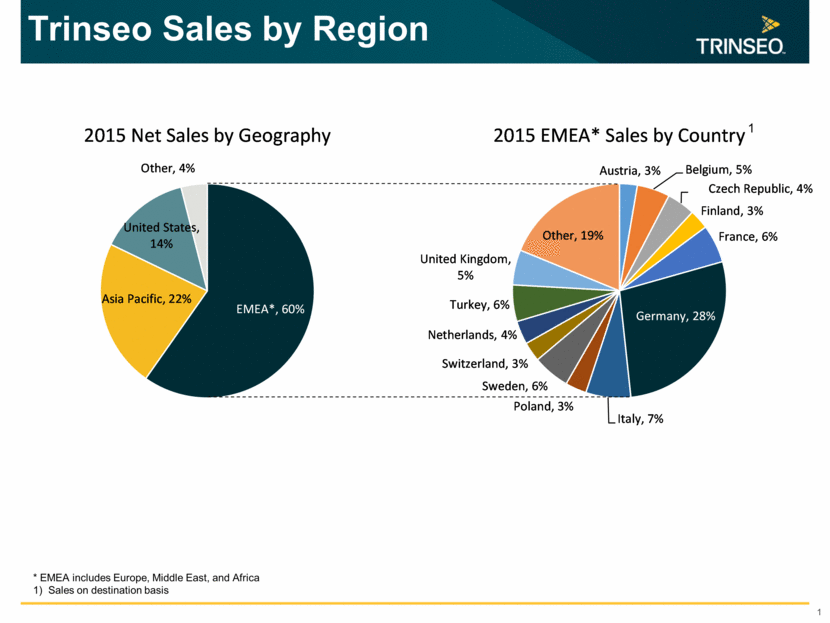
Trinseo Sales by Region 1 * EMEA includes Europe, Middle East, and Africa 1) Sales on destination basis 1 Austria , 3% Belgium , 5% Czech Republic , 4% Finland , 3% France , 6% Germany , 28% Italy , 7% Poland , 3% Sweden , 6% Switzerland , 3% Netherlands , 4% Turkey , 6% United Kingdom , 5% Other , 19% 2015 EMEA* Sales by Country EMEA* , 60% Asia Pacific , 22% United States , 14% Other , 4% 2015 Net Sales by Geography

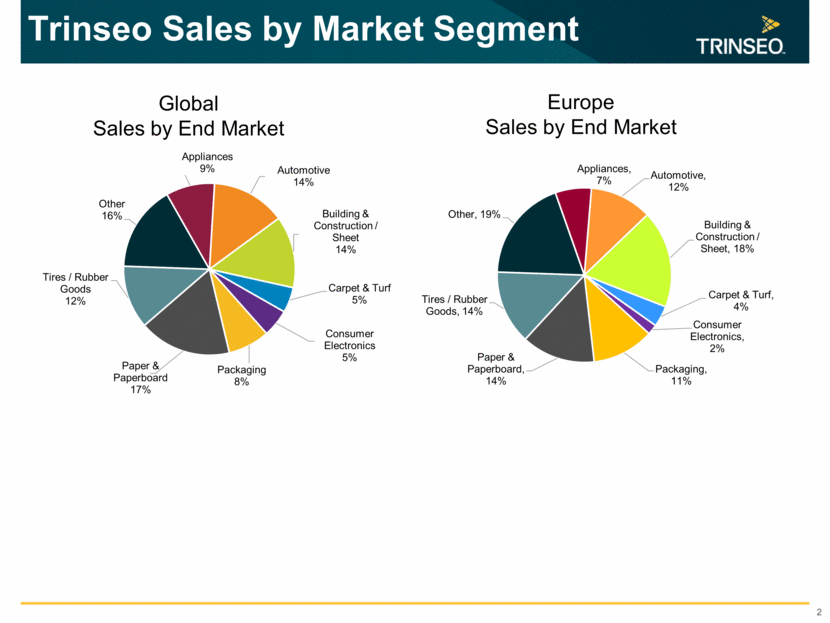
Trinseo Sales by Market Segment 2 Global Sales by End Market Europe Sales by End Market Other , 19% Appliances , 7% Automotive , 12% Building & Construction / Sheet , 18% Carpet & Turf , 4% Consumer Electronics , 2% Packaging , 11% Paper & Paperboard , 14% Tires / Rubber Goods , 14% Other 16% Appliances 9% Automotive 14% Building & Construction / Sheet 14% Carpet & Turf 5% Consumer Electronics 5% Packaging 8% Paper & Paperboard 17% Tires / Rubber Goods 12%

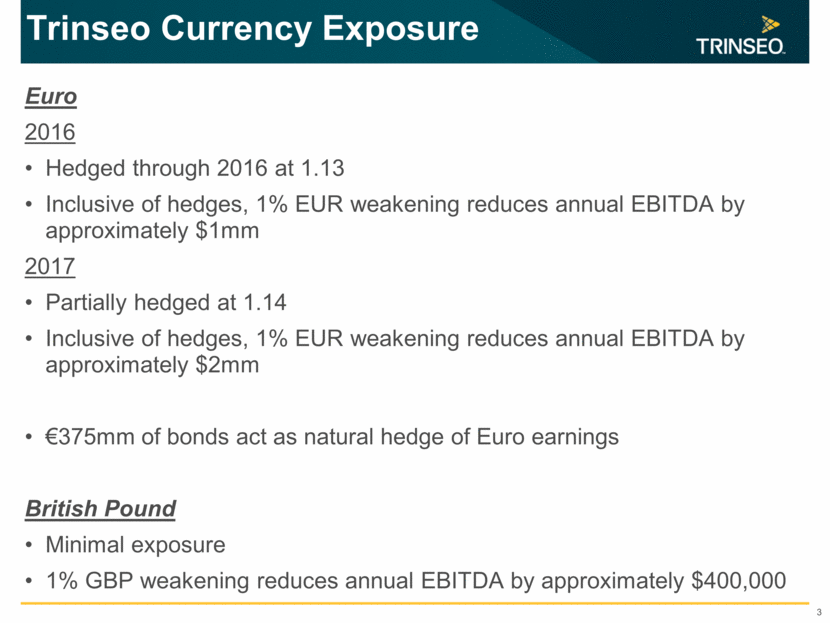
Trinseo Currency Exposure Euro 2016 Hedged through 2016 at 1.13 Inclusive of hedges, 1% EUR weakening reduces annual EBITDA by approximately $1mm 2017 Partially hedged at 1.14 Inclusive of hedges, 1% EUR weakening reduces annual EBITDA by approximately $2mm €375mm of bonds act as natural hedge of Euro earnings British Pound Minimal exposure 1% GBP weakening reduces annual EBITDA by approximately $400,000 3

