Attached files
| file | filename |
|---|---|
| 8-K - 8-K - CORTLAND BANCORP INC | d193606d8k.htm |
Annual Shareholder Meeting | May 24, 2016 Exhibit 99.1
Forward-Looking Statement The Private Securities Litigation Reform Act of 1995 provides a “safe harbor” for forward-looking statements. Any forward-looking statement is not a guarantee of future performance and actual future results could differ materially from those contained in forward-looking information. Factors that could cause or contribute to such differences include, without limitation, risks and uncertainties detailed from time to time in the Company’s filings with the Securities and Exchange Commission, including, without limitation, the risk factors disclosed in Item 1A, “Risk Factors.” In the Company’s Annual Report on Form 10-K for the fiscal year ended December 31, 2014. Many of these factors are beyond the Company’s ability to control or predict, and readers are cautioned not to put undue reliance on these forward-looking statements. The following list, which is not intended to be an all-encompassing list of risks and uncertainties affecting the Company, summarizes several factors that could cause the Company’s results to differ materially from those anticipated or expected in these forward-looking statements: Conditions in the financial markets, the real estate markets and economic conditions generally. Enactment of new legislation and increased regulatory oversight. Changes in interest rates. Future expansions including new branch openings, acquisition of other financial institutions and new business lines or new product or service offerings. Increased competition with other banks, savings and loan associations, credit unions, mortgage banking, insurance companies, securities brokerage and asset management firms. Changes in accounting standards Other factors not currently anticipated may also materially and adversely affect the Company’s results of operations, cash flows and financial position. There can be no assurance that future results will meet expectations. While the Company believes that the forward-looking statements in this presentation are reasonable, you should not place undue reliance on any forward-looking statement. In addition, these statements speak only as of the date made. The Company does not undertake, and expressly disclaims, any obligation to update or alter any statements whether as a result of new information, future events or otherwise, except as may be required by applicable law.
David J. Lucido – Chief Financial Officer
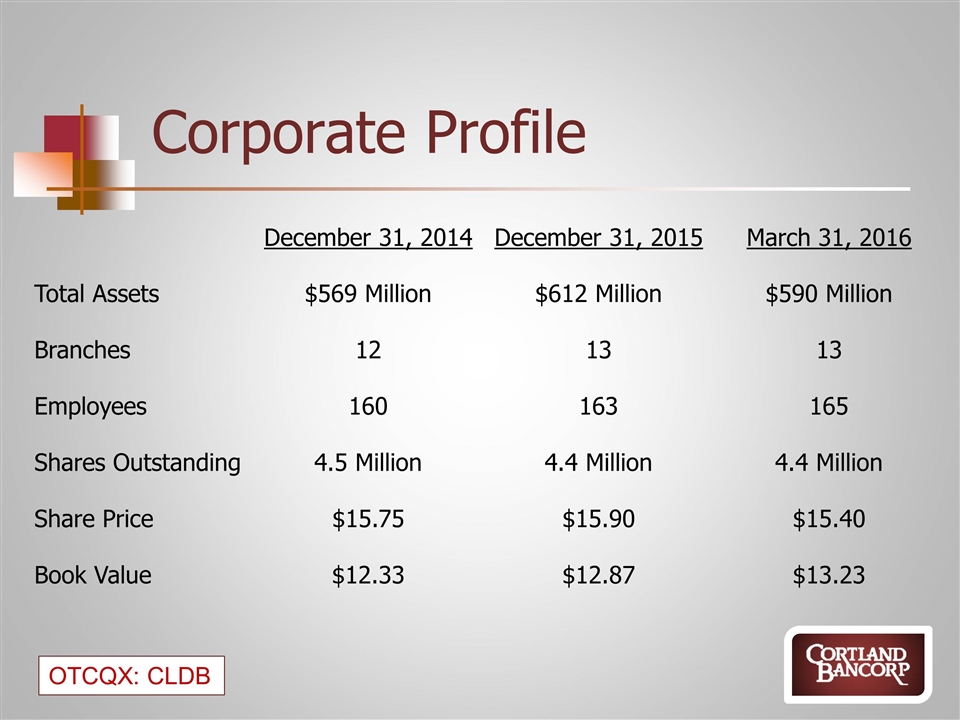
Corporate Profile December 31, 2014 December 31, 2015 March 31, 2016 Total Assets $569 Million $612 Million $590 Million Branches 12 13 13 Employees 160 163 165 Shares Outstanding 4.5 Million 4.4 Million 4.4 Million Share Price $15.75 $15.90 $15.40 Book Value $12.33 $12.87 $13.23
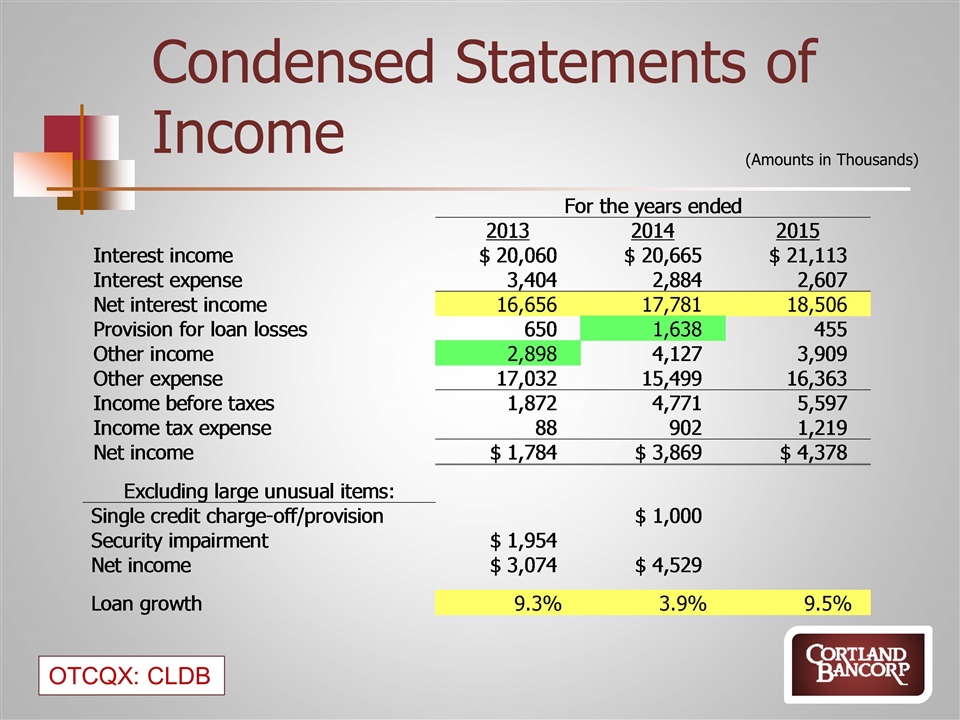
(Amounts in Thousands) Condensed Statements of Income For the years ended 2013 2014 2015 2011 Interest income $20,060 $20,665 $21,113 $21,110 Interest expense $3,404 $2,884 $2,607 4,732 Net interest income $16,656 $17,781 $18,506 16,378 Provision for loan losses $650 $1,638 $455 1,196 Other income $2,898 $4,127 $3,909 3,558 Other expense $17,032 $15,499 $16,363 13,475 Income before taxes $1,872 $4,771 $5,597 5,265 Income tax expense $88 $902 $1,219 1,193 Net income $1,784 $3,869 $4,378 $4,072 Excluding large unusual items: Single credit charge-off/provision $1,000 Security impairment $1,954 Net income $3,074 $4,529 4,072 Loan growth 9.3% 3.9% 9.5% 0.09
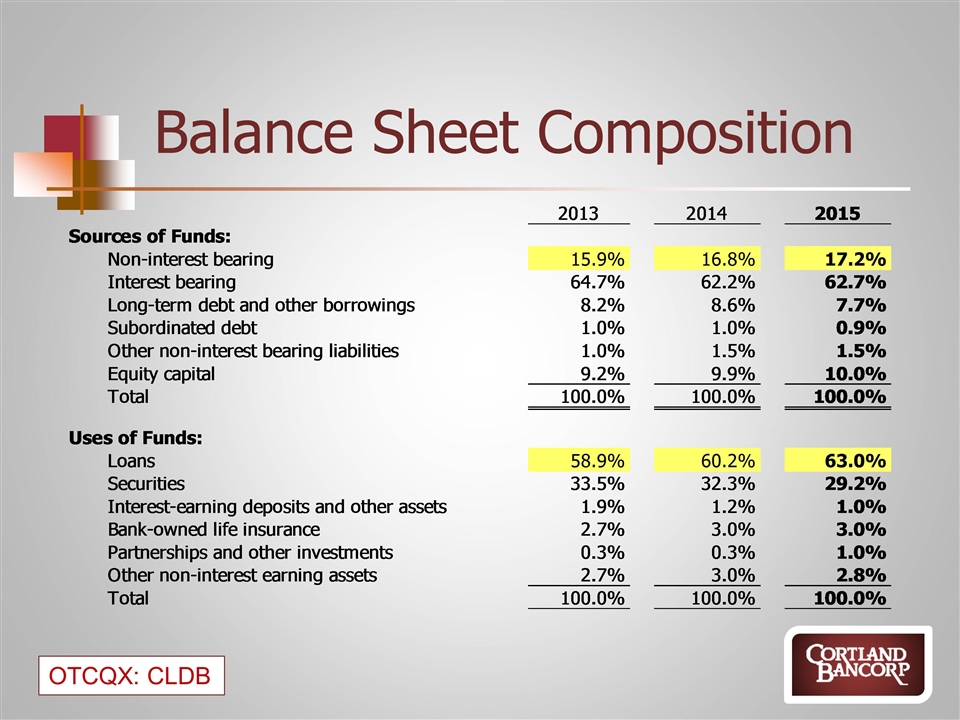
Balance Sheet Composition 2013 2014 2015 2011 2010 2009 Sources of Funds: Non-interest bearing 0.159 0.16800000000000001 0.17199999999999999 0.13400000000000001 growing core 0.126 11.8 growing core Interest bearing 0.64700000000000002 0.622 0.627 0.66700000000000004 0.65099999999999991 65.3 growing core Long-term debt and other borrowings 8.2% 8.6% 7.7% 8.9% less reliance 0.12 13.7 less reliance Subordinated debt 0.01 0.01 .9% 0.01 1.1% 1 Other non-interest bearing liabilities 0.01 1.5% 1.5% 0.01 1.1% 1 Equity capital 9.2% 9.9% 0.1 0.09 growing equity 8.1% 7.2 growing equity Total 100.0% 100.0% 0.99999999999999989 100.0% 100.0% 100 Uses of Funds: Loans 0.58899999999999997 0.60199999999999998 0.63 0.52900000000000003 loan growth 0.48799999999999999 47.8 loan growth Securities 0.33500000000000002 0.32300000000000001 0.29199999999999998 0.37799999999999995 0.39399999999999996 35.4 Interest-earning deposits and other assets 1.9% 1.2% 0.01 2.6% 5.0999999999999997 12 Bank-owned life insurance 2.7% 0.03 0.03 2.6% 2.6% 2.6 Partnerships and other investments .3% .3% 0.01 Other non-interest earning assets 2.7% 0.03 2.8% 4.0999999999999995 4.0999999999999995 2.2000000000000002 Total 100.0% 100.0% 100.0% 100.0% 100.0% 100
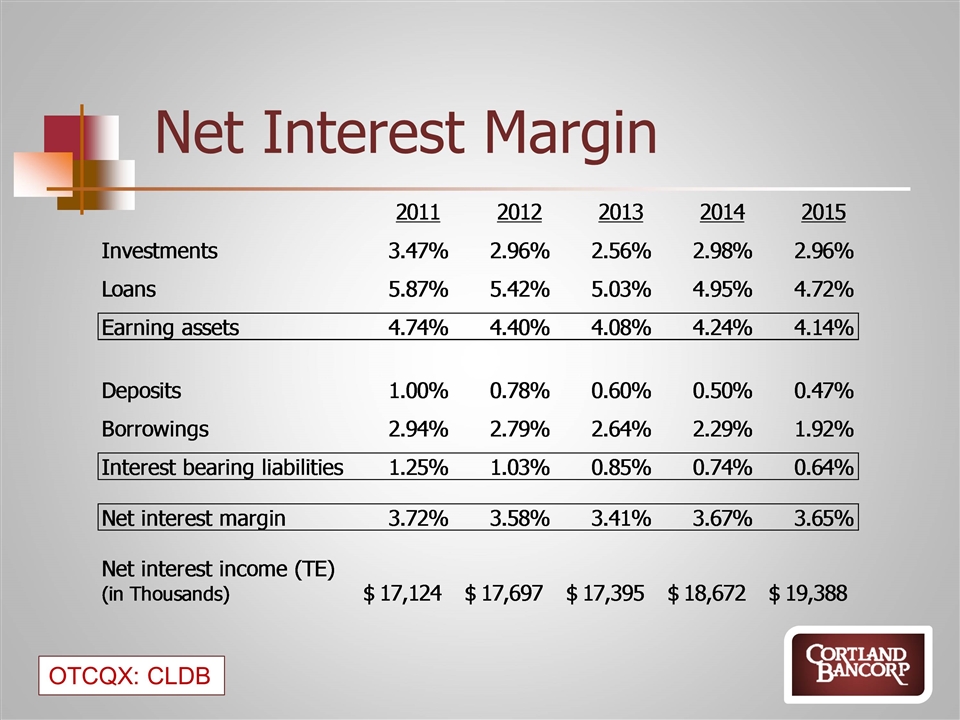
Net Interest Margin 2011 2012 2013 2014 2015 Investments 3.4700000000000002E-2 2.9600000000000001E-2 2.5600000000000001E-2 2.98E-2 2.9600000000000001E-2 Loans 5.8700000000000002E-2 5.4199999999999998E-2 5.0299999999999997E-2 4.9500000000000002E-2 4.7199999999999999E-2 Earning assets 4.7399999999999998E-2 4.3999999999999997E-2 4.0800000000000003E-2 4.24E-2 4.1399999999999999E-2 Deposits 0.01 7.7999999999999996E-3 6.0000000000000001E-3 5.0000000000000001E-3 4.7000000000000002E-3 Borrowings 2.9399999999999999E-2 2.7900000000000001E-2 2.64E-2 2.29E-2 1.9199999999999998E-2 Interest bearing liabilities 1.2500000000000001E-2 1.03E-2 8.5000000000000006E-3 7.4000000000000003E-3 6.4000000000000003E-3 Net interest margin 3.7199999999999997E-2 3.5799999999999998E-2 3.4099999999999998E-2 3.6700000000000003E-2 3.6499999999999998E-2 Net interest income (TE)(in Thousands) $17,124 $17,697 $17,395 $18,672 $19,388
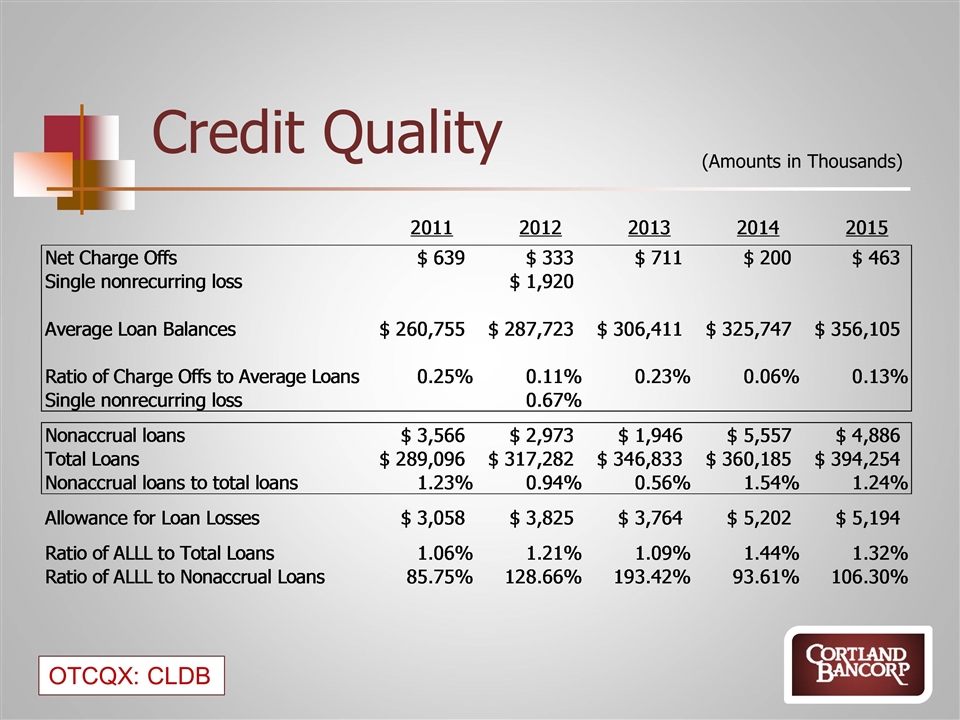
Credit Quality (Amounts in Thousands) 2011 2012 2013 2014 2015 Net Charge Offs $639 $333 $711 $200 $463 Single nonrecurring loss $1,920 Average Loan Balances $,260,755 $,287,723 $,306,411 $,325,747 $,356,105 Ratio of Charge Offs to Average Loans 2.5000000000000001E-3 1.1000000000000001E-3 2.3204127789145951E-3 6.1397342109060094E-4 1.2999999999999999E-3 Single nonrecurring loss 6.7000000000000002E-3 Nonaccrual loans $3,566 $2,973 $1,946 $5,557 $4,886 Total Loans $,289,096 $,317,282 $,346,833 $,360,185 $,394,254 Nonaccrual loans to total loans 1.2335002905609209E-2 9.3702132487818411E-3 5.6107694481205657E-3 1.5428182739425573E-2 1.24E-2 Allowance for Loan Losses $3,058 $3,825 $3,764 $5,202 $5,194 Ratio of ALLL to Total Loans 1.06E-2 1.21E-2 1.09E-2 1.4442578119577439E-2 1.32E-2 Ratio of ALLL to Nonaccrual Loans 0.85754346606842402 1.2865792129162461 1.9342240493319629 0.9361166096814828 1.0630372492836677
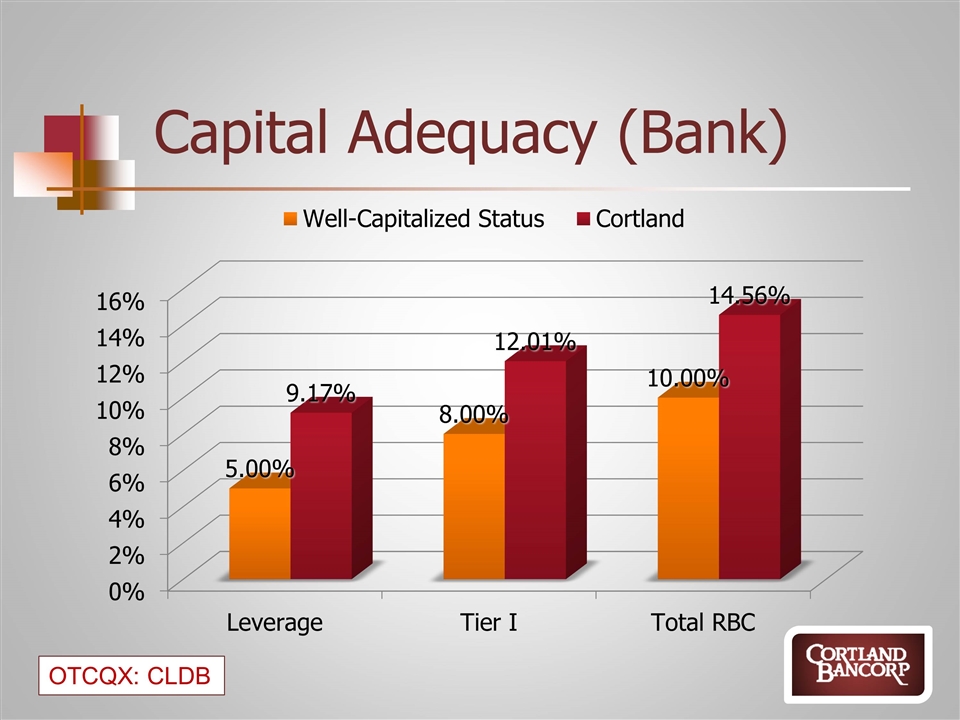
Capital Adequacy (Bank)
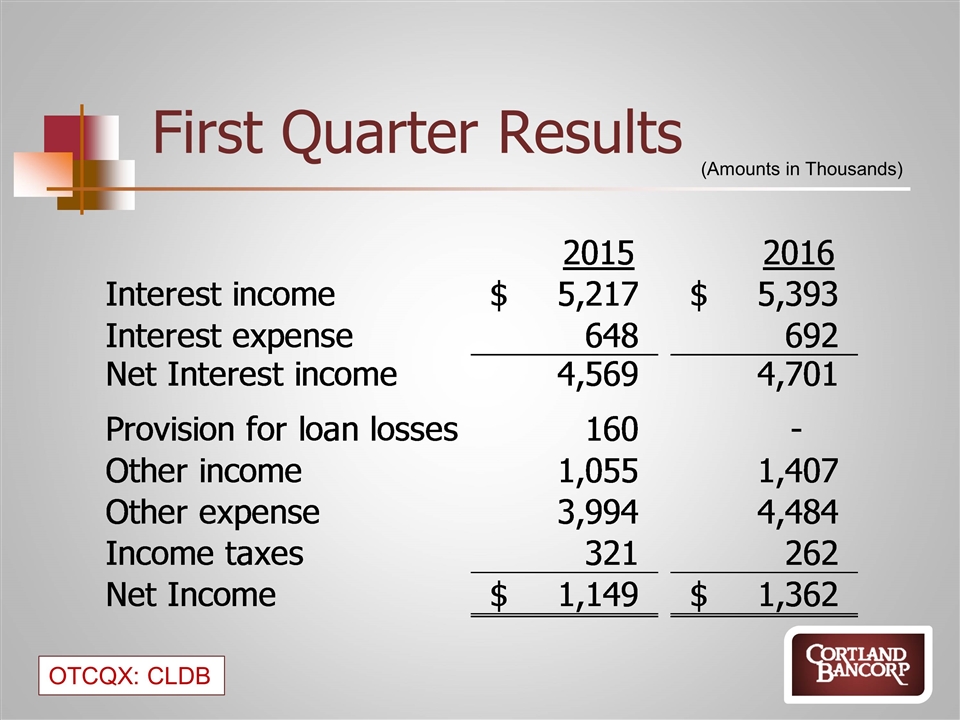
First Quarter Results (Amounts in Thousands) 2015 2016 Interest income $5,217 $5,393 Interest expense 648 692 Net Interest income 4,569 4,701 Provision for loan losses 160 0 Other income 1,055 1,407 Other expense 3,994 4,484 Income taxes 321 262 Net Income $1,149 $1,362 (Amounts in thousands)
James M. Gasior – President & CEO
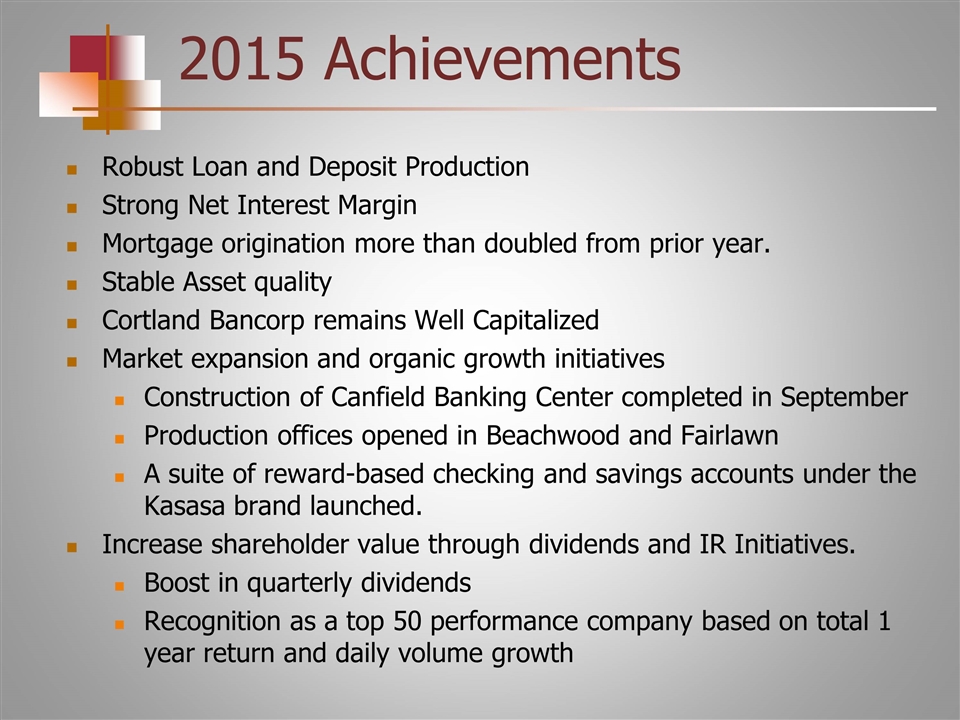
2015 Achievements Robust Loan and Deposit Production Strong Net Interest Margin Mortgage origination more than doubled from prior year. Stable Asset quality Cortland Bancorp remains Well Capitalized Market expansion and organic growth initiatives Construction of Canfield Banking Center completed in September Production offices opened in Beachwood and Fairlawn A suite of reward-based checking and savings accounts under the Kasasa brand launched. Increase shareholder value through dividends and IR Initiatives. Boost in quarterly dividends Recognition as a top 50 performance company based on total 1 year return and daily volume growth
 Canfield Branch Office |
 Kasasa What’s Kasasa? It’s a catchy word for earning cash. We offer three different Kasasa free checking accounts. They are all rewards-based accounts, that pay in cash (interest), cash back or tunes (iTunes, Google Play or Amazon) each month. Plus, unlimited refunds on your ATM fees, nationwide Reward Qualifications (per cycle): 12 debit card purchases Log into online banking Kasasa Saver is a free savings account that earns additional rewards up to 0.75% APY. Also, Saver is linked to Kasasa Cash or Kasasa Cash Back checking accounts. Since its launch in Sept. 2015, we have opened more than 500 checking accounts. |
 OTCQX:
CLDB Price
03/31/16 $15.43 52W High--$17.50 52 W Low--$13.00 Price/Tangible Book 117% Dividend Yield 1.8% Market Cap $68.0M Shares Outstanding 4.40M CLBD Stock Data 1 Year Stock Performance CLDB + 37.61% SNL US Banks Index +7.35% SNL Micro Cap Index +9.26% |
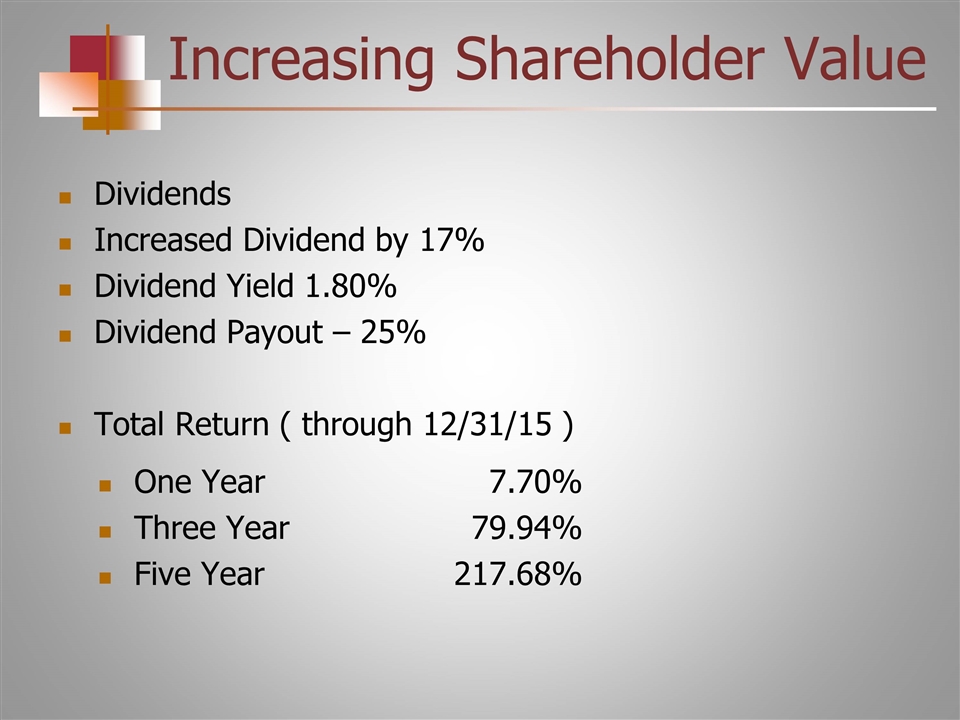
Increasing Shareholder Value Dividends Increased Dividend by 17% Dividend Yield 1.80% Dividend Payout – 25% Total Return ( through 12/31/15 ) One Year7.70% Three Year79.94% Five Year217.68%
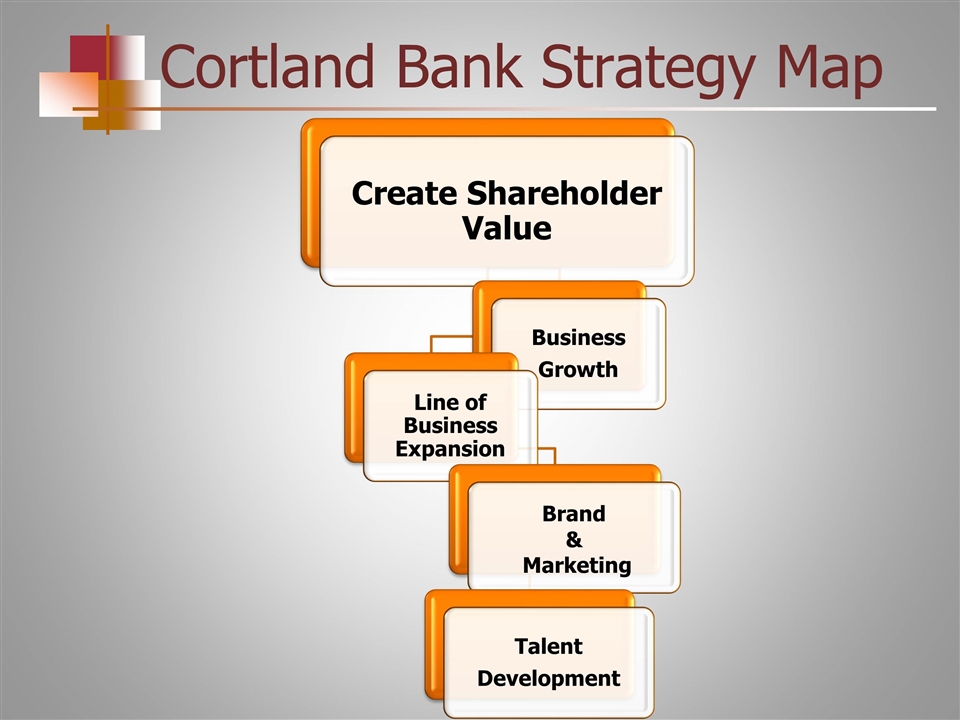
Cortland Bank Strategy Map Create Shareholder Value Business G Growth Line of Business Expansion Brand & Marketing Talent Development
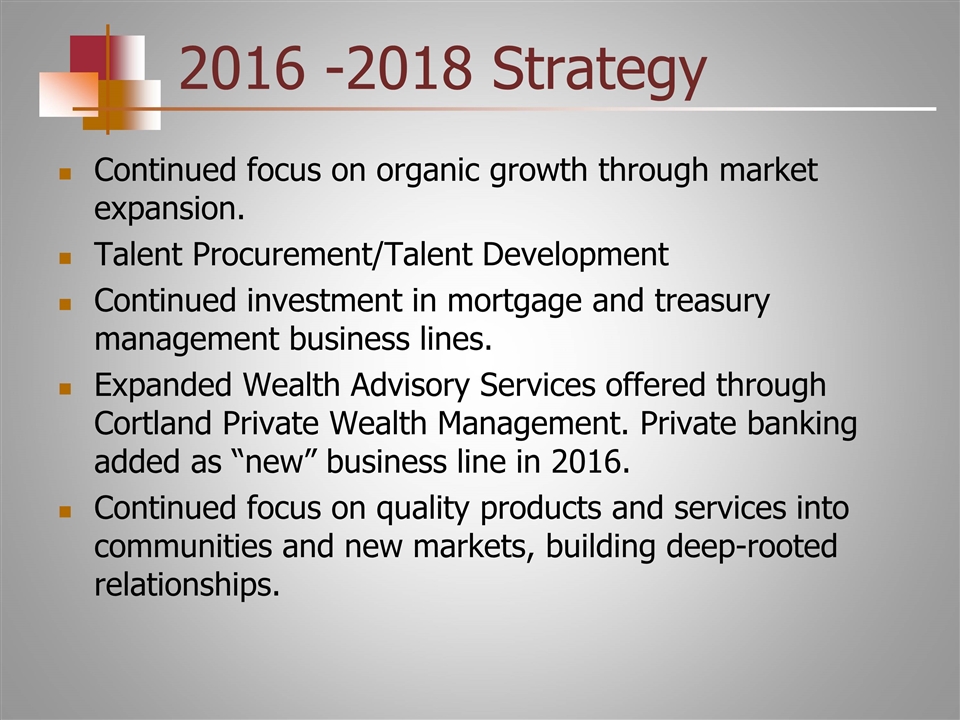
2016 -2018 Strategy Continued focus on organic growth through market expansion. Talent Procurement/Talent Development Continued investment in mortgage and treasury management business lines. Expanded Wealth Advisory Services offered through Cortland Private Wealth Management. Private banking added as “new” business line in 2016. Continued focus on quality products and services into communities and new markets, building deep-rooted relationships.
Questions???
