Attached files
| file | filename |
|---|---|
| 8-K - 8-K ANNUAL MEETING 2016 - Blue Hills Bancorp, Inc. | annualmeeting2016.htm |
| EX-99.1 - EXHIBIT 99.1 PRESS RELEASE 51816 - Blue Hills Bancorp, Inc. | dividendsq22016.htm |
Title 1 1. Footnote. Blue Hills Bancorp, Inc. 2016 Annual Meeting of Stockholders Transforming Into a Full-Service Community Bank May 18, 2016
Forward-Looking Statements This presentation, as well as other written communications made from time to time by the Company and its subsidiaries and oral communications made from time to time by authorized officers of the Company, may contain statements relating to the future results of the Company (including certain projections and business trends) that are considered “forward-looking statements” as defined in the Private Securities Litigation Reform Act of 1995 (the “PSLRA”). Such forward-looking statements may be identified by the use of such words as “believe,” “expect,” “anticipate,” “should,” “planned,” “estimated,” “intend” and “potential.” For these statements, the Company claims the protection of the safe harbor for forward-looking statement contained in the PSLRA. The Company cautions you that a number of important factors could cause actual results to differ materially from those currently anticipated in any forward-looking statement. Such factors include, but are not limited to: our ability to implement successfully our business strategy, which includes significant asset and liability growth; changes that could adversely affect the business in which the Company and the Bank are engaged; prevailing economic and geopolitical conditions; changes in interest rates, loan demand, real estate values and competition; changes in accounting principles, policies and guidelines; changes in any applicable law, rule, regulation or practice with respect to tax or legal issues; and other economic, competitive, governmental, regulatory and technological factors affecting the Company’s operations, pricing, products and services. For additional information on some of the risks and important factors that could affect the Company’s future results and financial condition, see “Risk Factors” in the Company’s Annual Report on Form 10-K as filed with the Securities and Exchange Commission. The forward- looking statements are made as of the date of this presentation, and, except as may be required by applicable law or regulation, the Company assumes no obligation to update the forward-looking statements or to update the reasons why actual results could differ from those projected in the forward-looking statements. 2
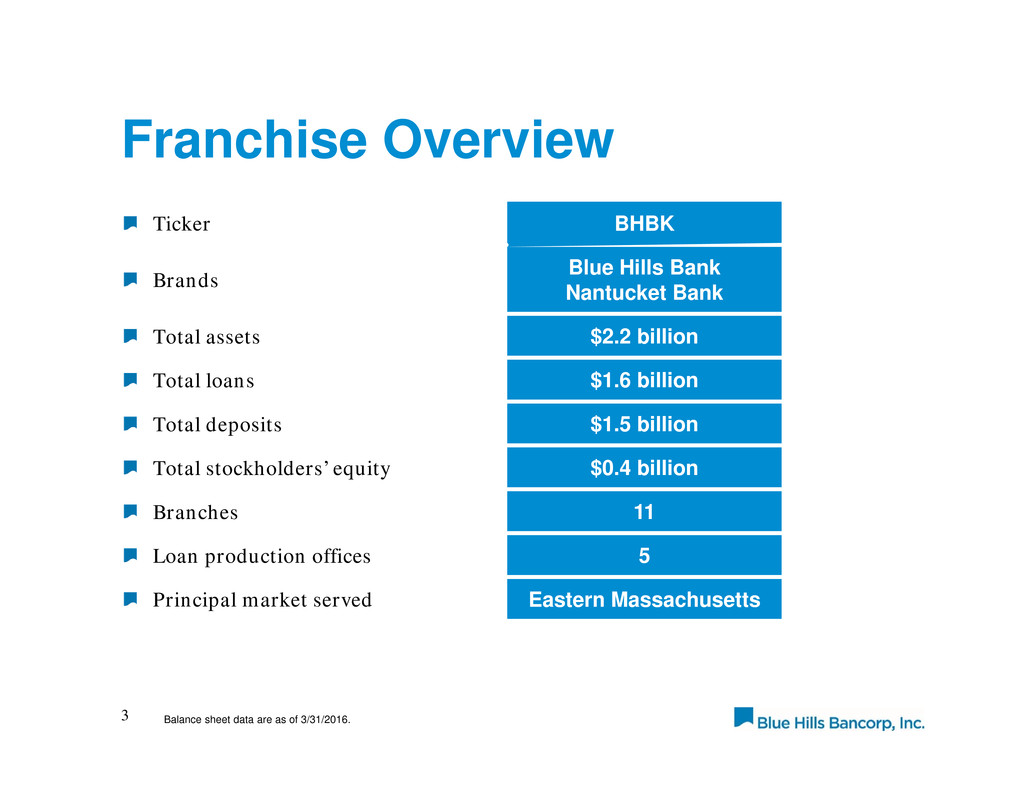
Franchise Overview 3 Ticker BHBK Brands Blue Hills Bank Nantucket Bank Total assets $2.2 billion Total loans $1.6 billion Total deposits $1.5 billion Total stockholders’ equity $0.4 billion Branches 11 Loan production offices 5 Principal market served Eastern Massachusetts Balance sheet data are as of 3/31/2016.
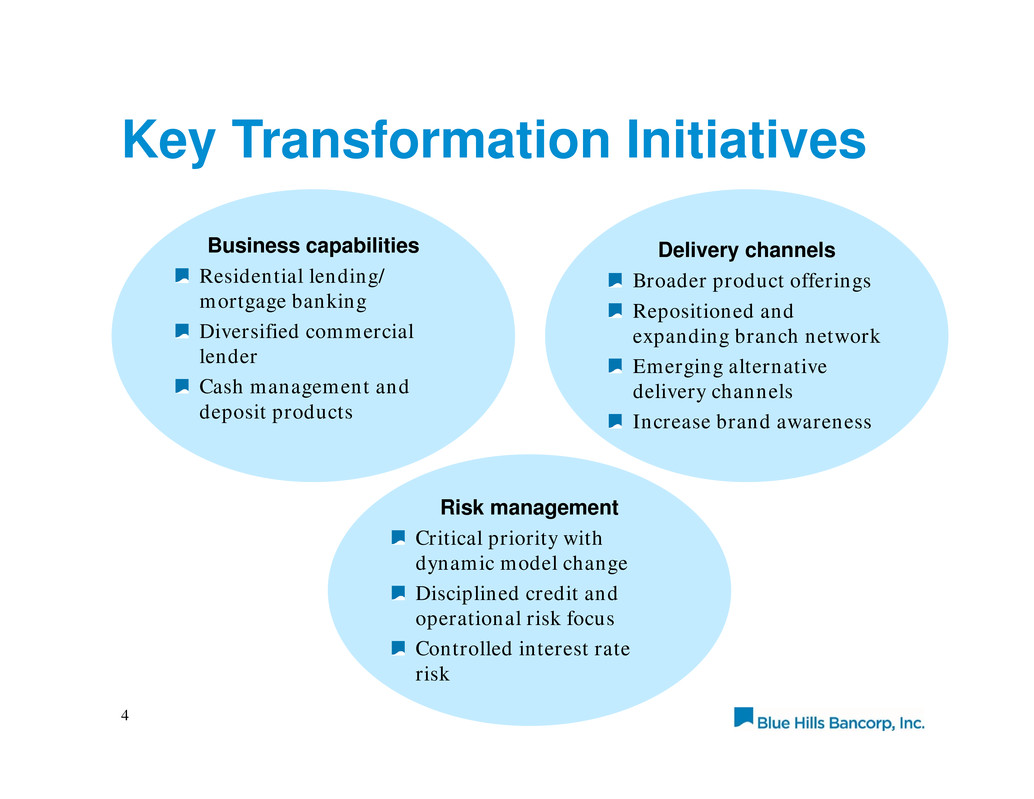
Key Transformation Initiatives 4 Risk management Critical priority with dynamic model change Disciplined credit and operational risk focus Controlled interest rate risk Business capabilities Residential lending/ mortgage banking Diversified commercial lender Cash management and deposit products Delivery channels Broader product offerings Repositioned and expanding branch network Emerging alternative delivery channels Increase brand awareness
Accomplishments to Date Experienced leadership team Upgraded infrastructure Diversified organic asset generation capability Improved the deposit mix and lowered funding costs Added core deposits through organic growth, acquisition and de novo branch expansion Improved contribution from net interest income/margin and fee income Maintained strong asset quality 5
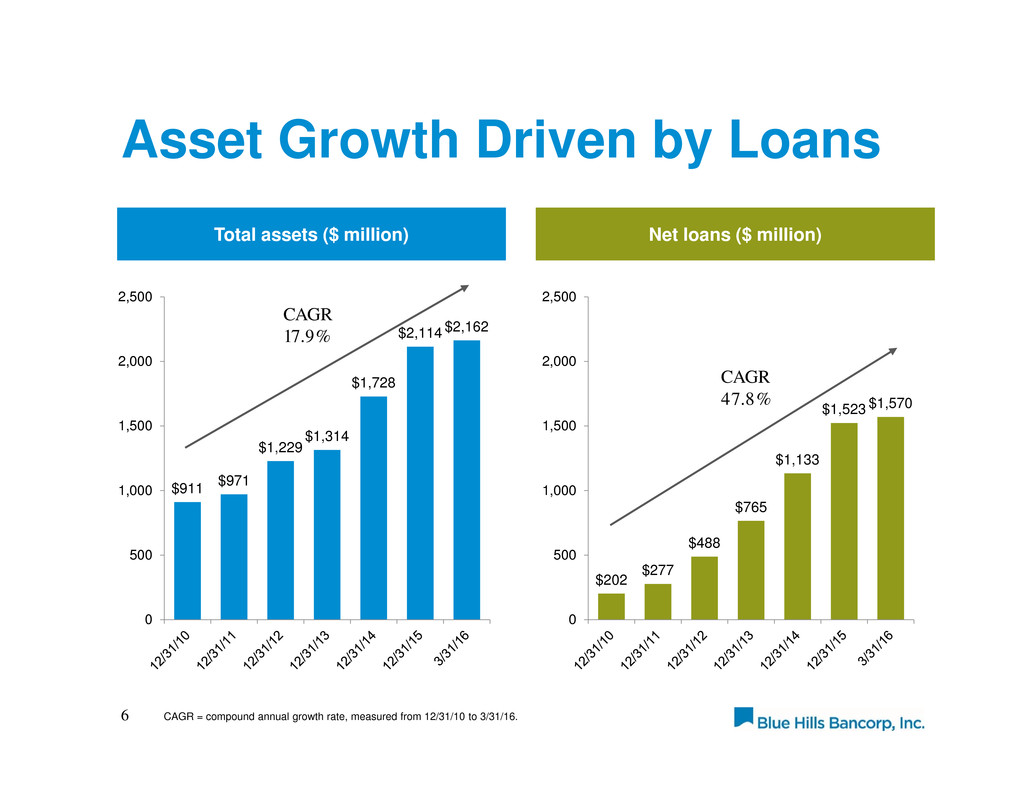
Asset Growth Driven by Loans 6 Total assets ($ million) Net loans ($ million) $911 $971 $1,229 $1,314 $1,728 $2,114 $2,162 0 500 1,000 1,500 2,000 2,500 $202 $277 $488 $765 $1,133 $1,523 $1,570 0 500 1,000 1,500 2,000 2,500 CAGR 17.9% CAGR = compound annual growth rate, measured from 12/31/10 to 3/31/16. CAGR 47.8%
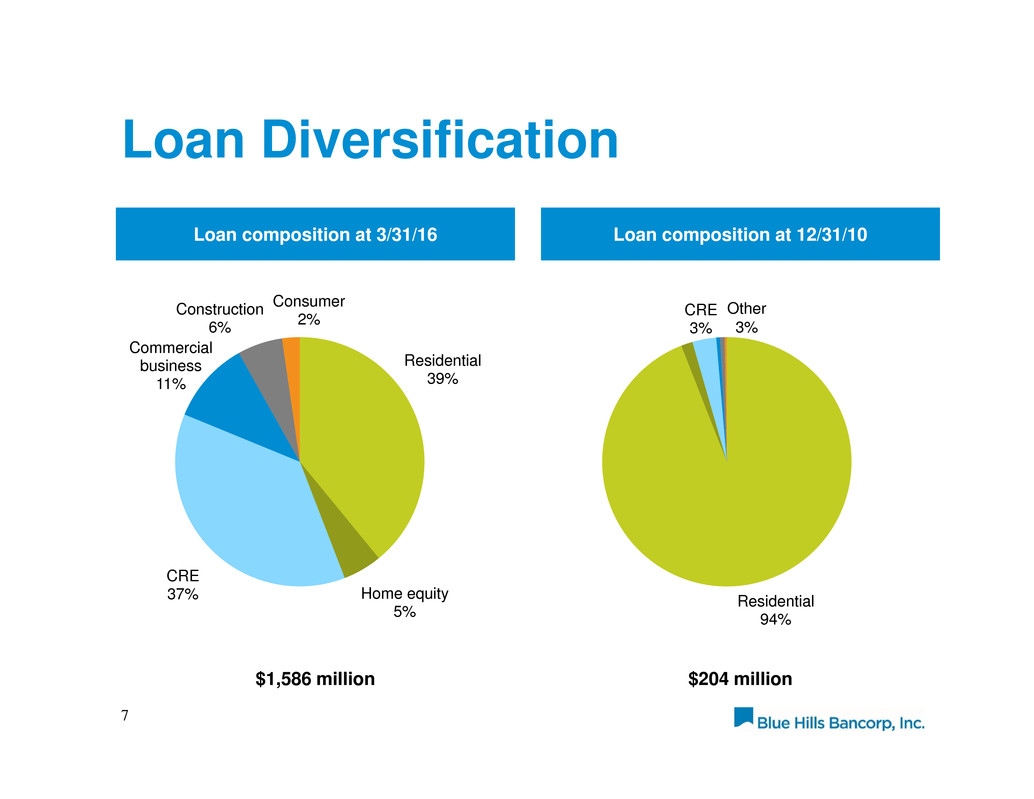
Loan Diversification 7 Loan composition at 3/31/16 Residential 39% Home equity 5% CRE 37% Commercial business 11% Construction 6% Consumer 2% Loan composition at 12/31/10 $1,586 million $204 million Residential 94% CRE 3% Other 3%
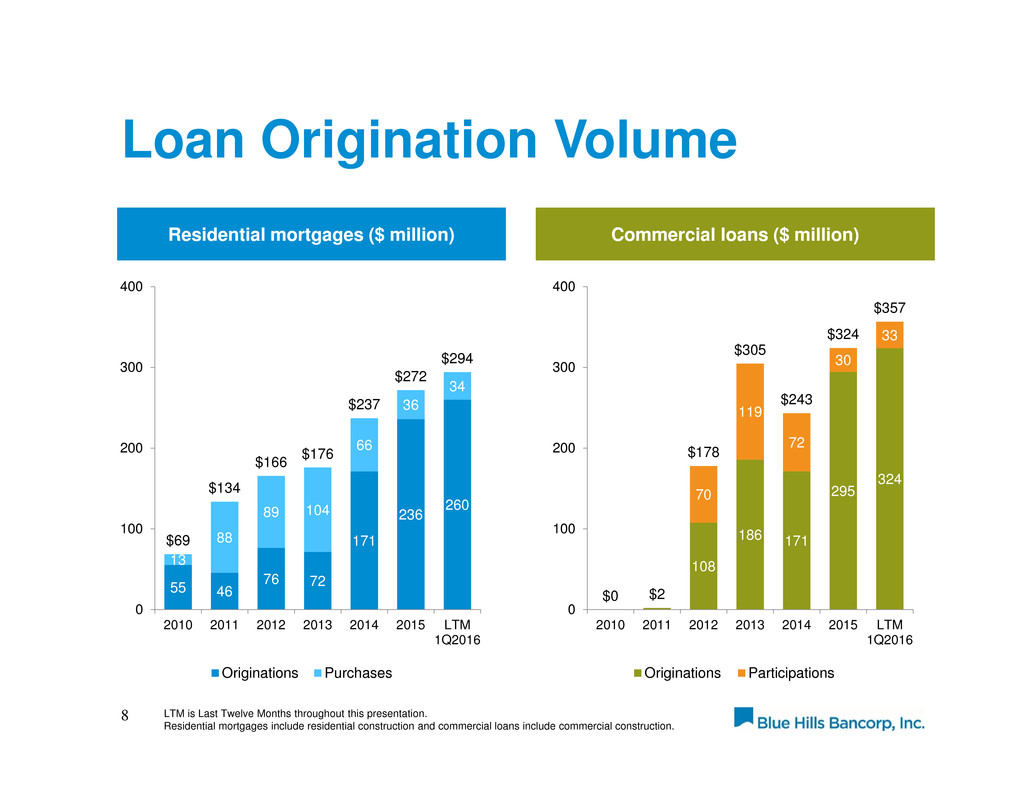
Loan Origination Volume 8 Residential mortgages ($ million) Commercial loans ($ million) 55 46 76 72 171 236 260 13 88 89 104 66 36 34 $69 $134 $166 $176 $237 $272 $294 0 100 200 300 400 2010 2011 2012 2013 2014 2015 LTM 1Q2016 Originations Purchases LTM is Last Twelve Months throughout this presentation. Residential mortgages include residential construction and commercial loans include commercial construction. 108 186 171 295 324 70 119 72 30 33 $0 $2 $178 $305 $243 $324 $357 0 100 200 300 400 2010 2011 2012 2013 2014 2015 LTM 1Q2016 Originations Participations
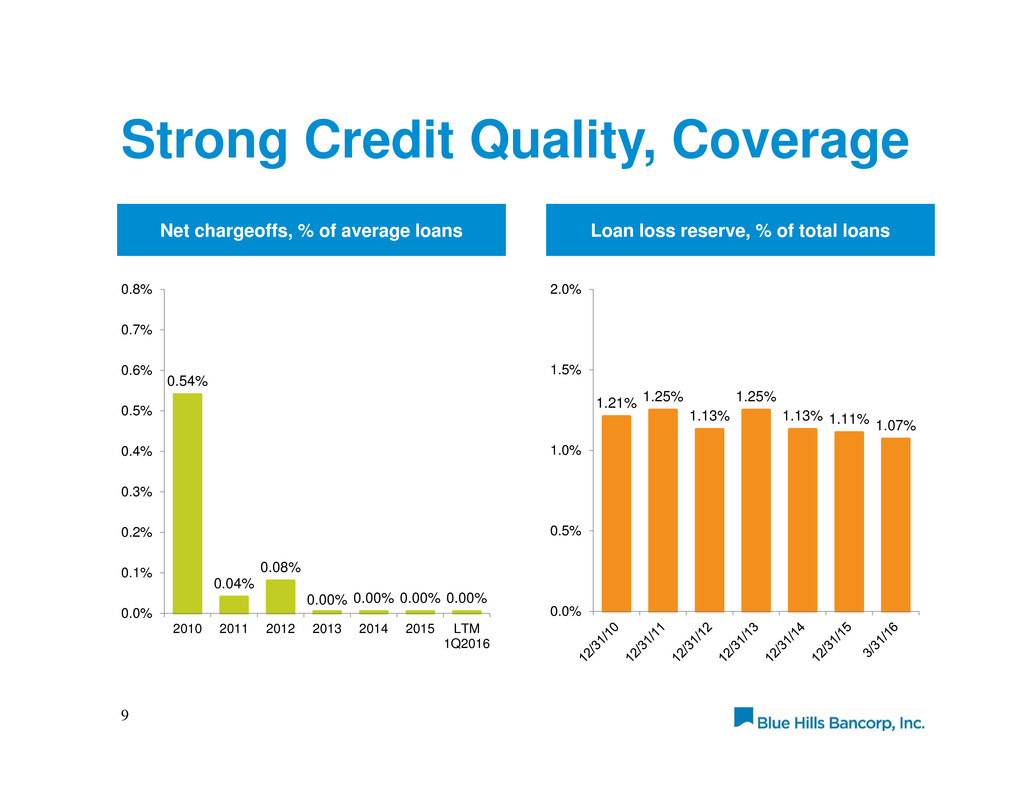
Strong Credit Quality, Coverage 9 Net chargeoffs, % of average loans Loan loss reserve, % of total loans 0.54% 0.04% 0.08% 0.00% 0.00% 0.00% 0.00% 0.0% 0.1% 0.2% 0.3% 0.4% 0.5% 0.6% 0.7% 0.8% 2010 2011 2012 2013 2014 2015 LTM 1Q2016 1.21% 1.25% 1.13% 1.25% 1.13% 1.11% 1.07% 0.0% 0.5% 1.0% 1.5% 2.0%
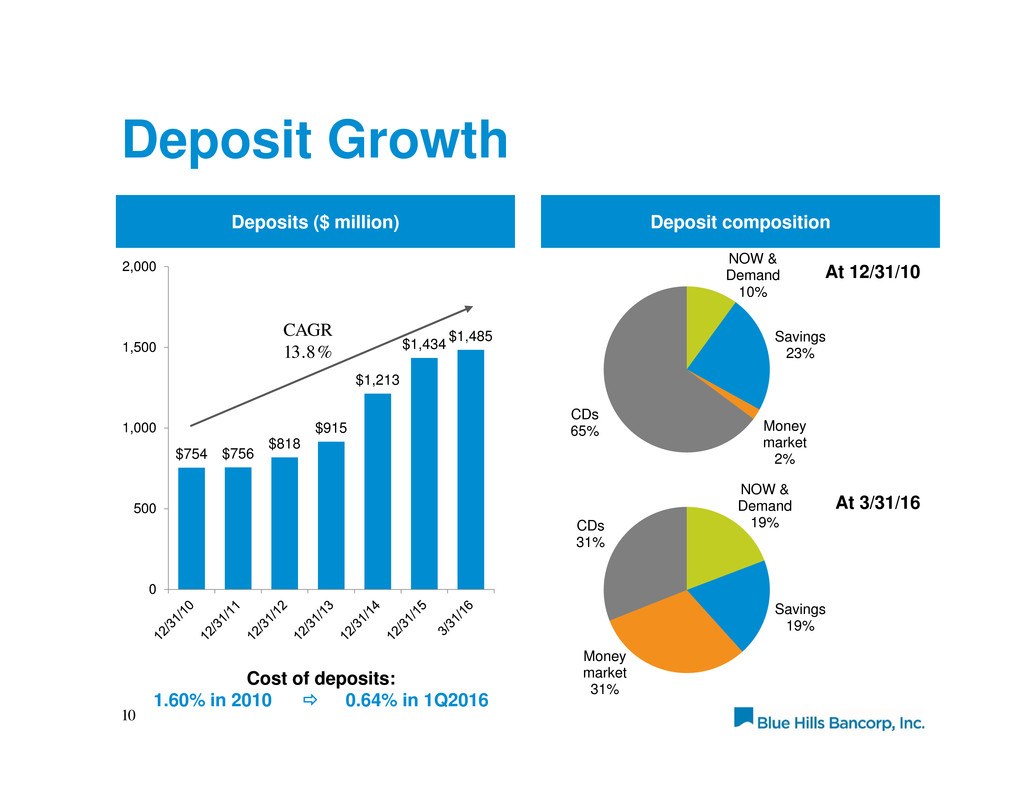
Deposit Growth 10 Deposits ($ million) NOW & Demand 10% Savings 23% Money market 2% CDs 65% Deposit composition At 12/31/10 $754 $756 $818 $915 $1,213 $1,434 $1,485 0 500 1,000 1,500 2,000 At 3/31/16 NOW & Demand 19% Savings 19% Money market 31% CDs 31% Cost of deposits: 1.60% in 2010 0.64% in 1Q2016 CAGR 13.8%
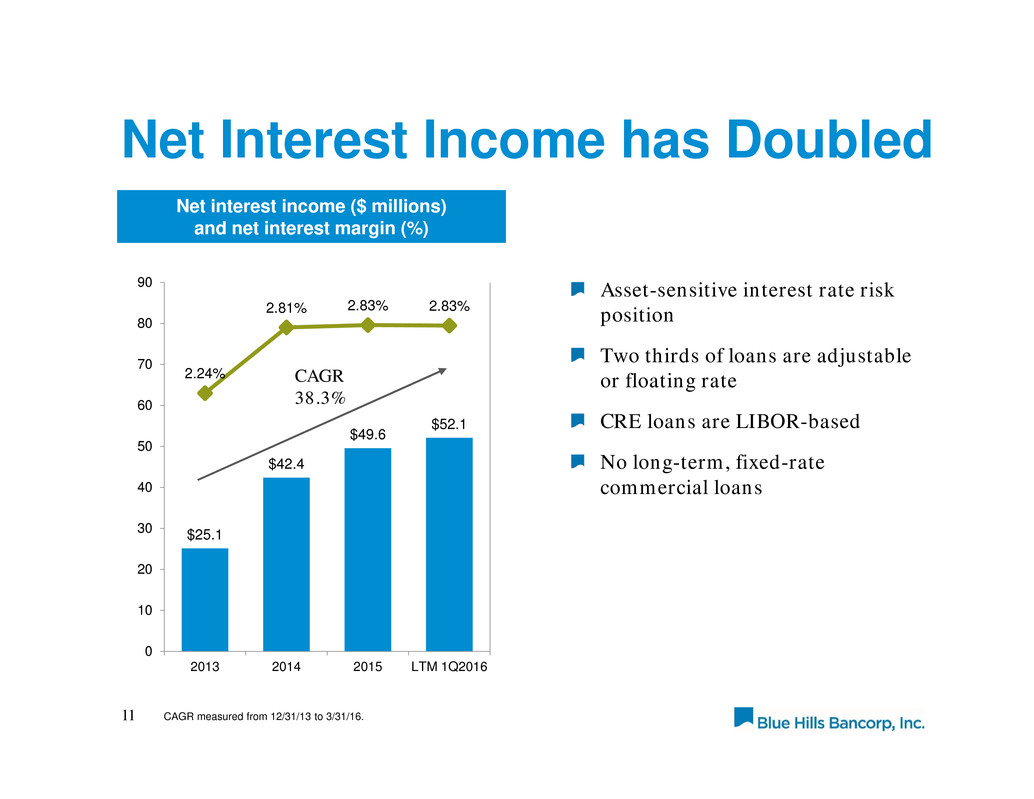
Net Interest Income has Doubled Asset-sensitive interest rate risk position Two thirds of loans are adjustable or floating rate CRE loans are LIBOR-based No long-term, fixed-rate commercial loans 11 Net interest income ($ millions) and net interest margin (%) $25.1 $42.4 $49.6 $52.1 2.24% 2.81% 2.83% 2.83% 0 10 20 30 40 50 60 70 80 90 2013 2014 2015 LTM 1Q2016 CAGR 38.3% CAGR measured from 12/31/13 to 3/31/16.
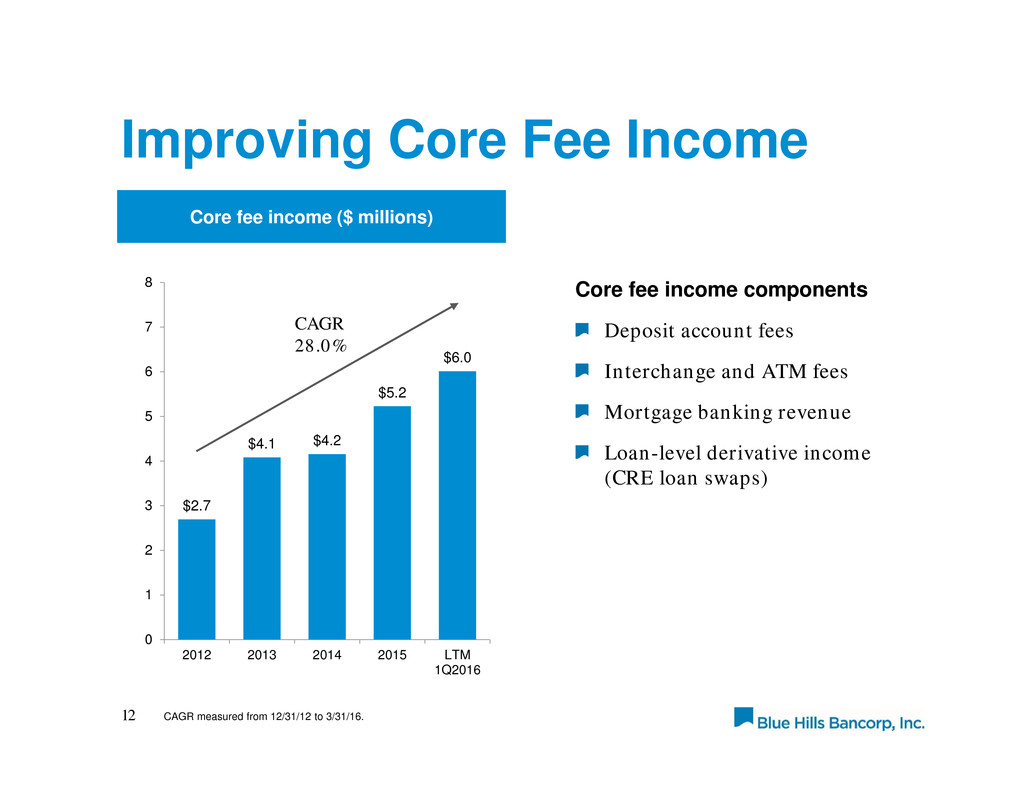
Improving Core Fee Income Core fee income components Deposit account fees Interchange and ATM fees Mortgage banking revenue Loan-level derivative income (CRE loan swaps) 12 Core fee income ($ millions) $2.7 $4.1 $4.2 $5.2 $6.0 0 1 2 3 4 5 6 7 8 2012 2013 2014 2015 LTM 1Q2016 CAGR 28.0% CAGR measured from 12/31/12 to 3/31/16.
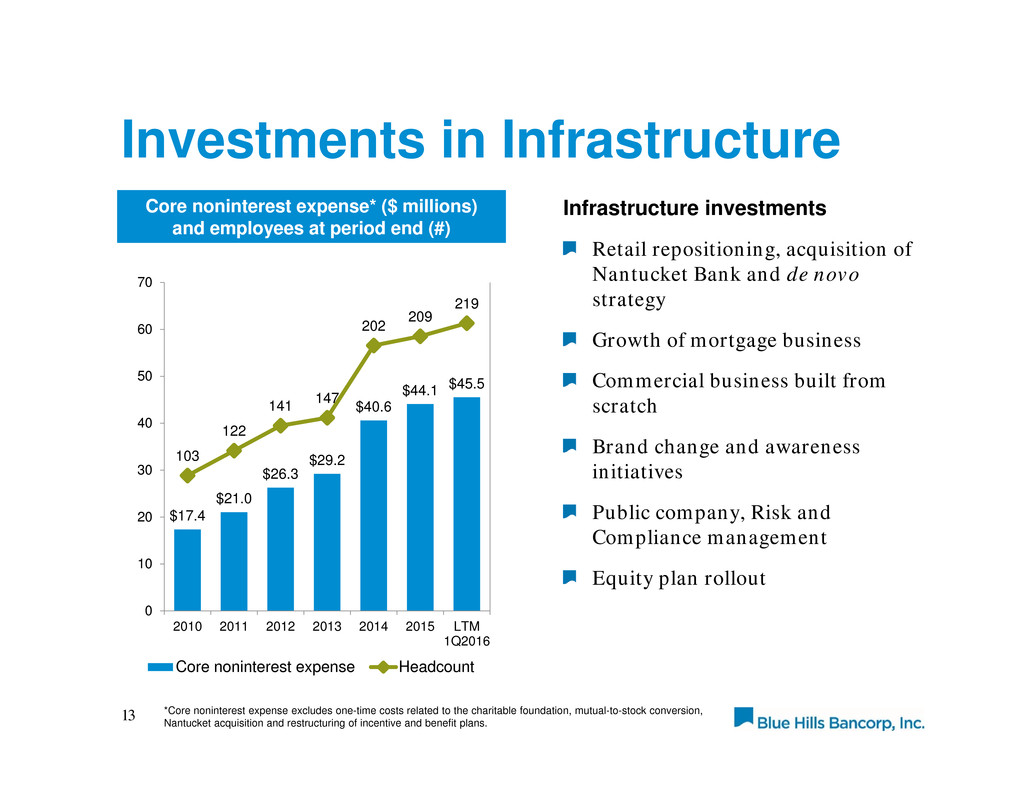
Investments in Infrastructure 13 Core noninterest expense* ($ millions) and employees at period end (#) $17.4 $21.0 $26.3 $29.2 $40.6 $44.1 $45.5 103 122 141 147 202 209 219 0 10 20 30 40 50 60 70 2010 2011 2012 2013 2014 2015 LTM 1Q2016 Core noninterest expense Headcount *Core noninterest expense excludes one-time costs related to the charitable foundation, mutual-to-stock conversion, Nantucket acquisition and restructuring of incentive and benefit plans. Infrastructure investments Retail repositioning, acquisition of Nantucket Bank and de novo strategy Growth of mortgage business Commercial business built from scratch Brand change and awareness initiatives Public company, Risk and Compliance management Equity plan rollout
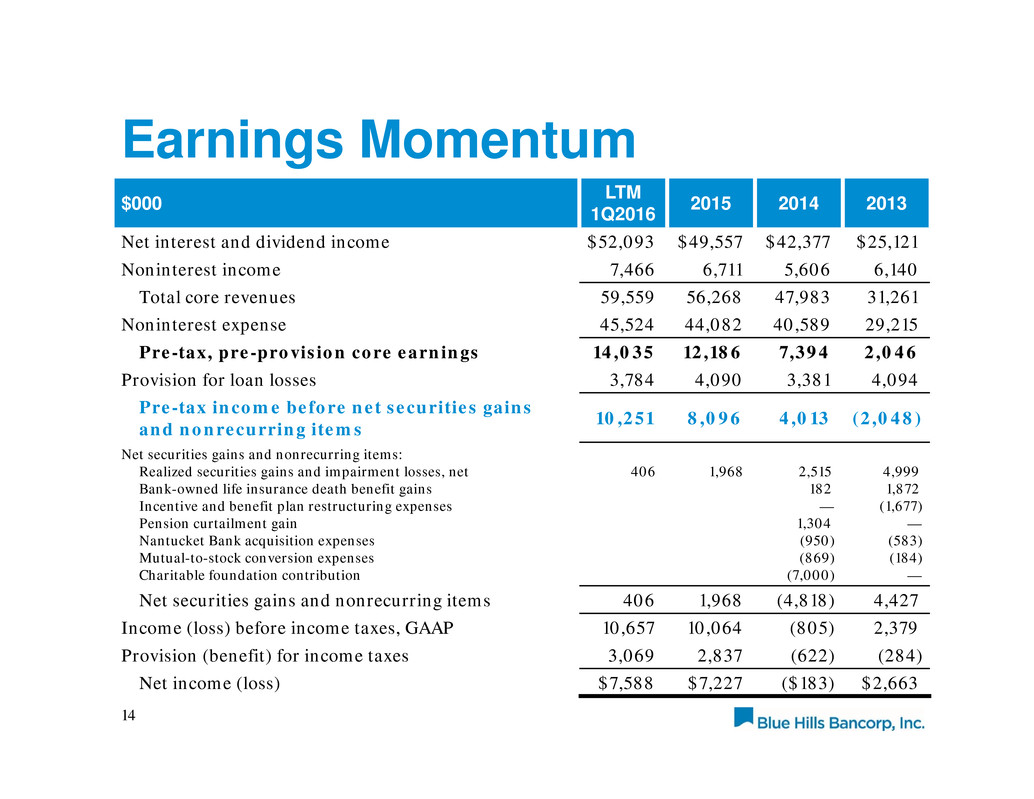
Earnings Momentum 14 $000 LTM 1Q2016 2015 2014 2013 Net interest and dividend income $52,093 $49,557 $42,377 $25,121 Noninterest income 7,466 6,711 5,606 6,140 Total core revenues 59,559 56,268 47,983 31,261 Noninterest expense 45,524 44,082 40,589 29,215 Pre-tax, pre-provision core earnings 14,035 12,186 7,394 2,046 Provision for loan losses 3,784 4,090 3,381 4,094 Pre-tax income before net securities gains and nonrecurring items 10,251 8,096 4,013 (2,048) Net securities gains and nonrecurring items: Realized securities gains and impairment losses, net Bank-owned life insurance death benefit gains Incentive and benefit plan restructuring expenses Pension curtailment gain Nantucket Bank acquisition expenses Mutual-to-stock conversion expenses Charitable foundation contribution 406 1,968 2,515 182 — 1,304 (950) (869) (7,000) 4,999 1,872 (1,677) — (583) (184) — Net securities gains and nonrecurring items 406 1,968 (4,818) 4,427 Income (loss) before income taxes, GAAP 10,657 10,064 (805) 2,379 Provision (benefit) for income taxes 3,069 2,837 (622) (284) Net income (loss) $7,588 $7,227 ($183) $2,663
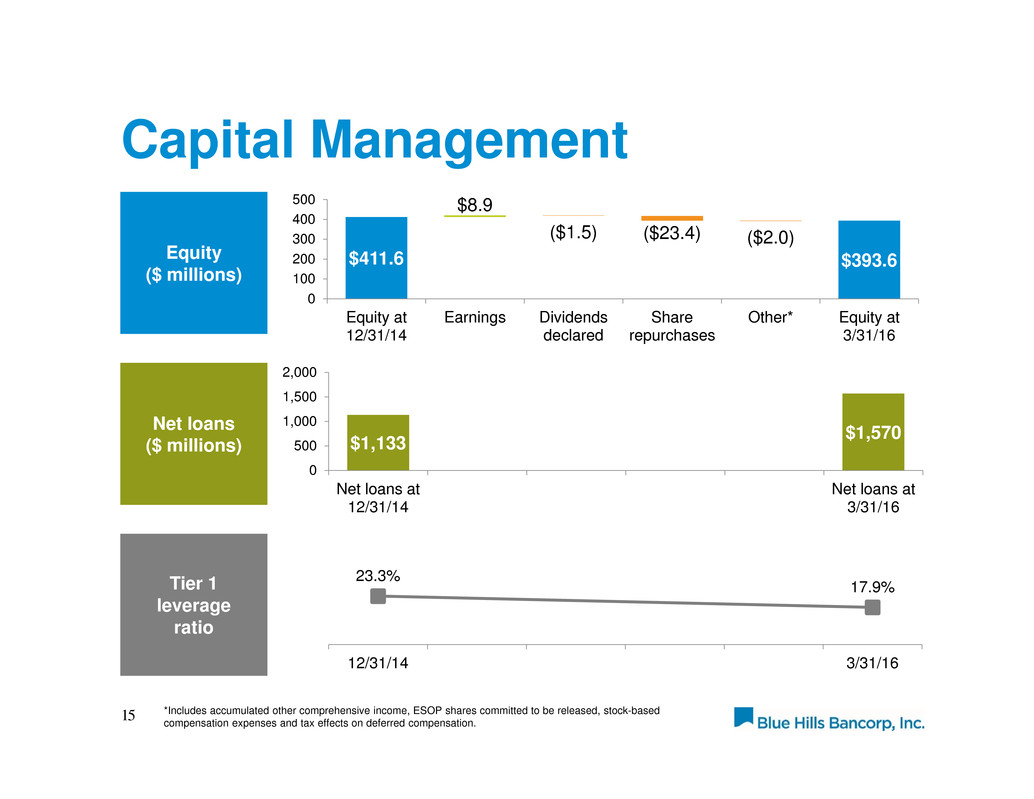
Capital Management 15 Tier 1 leverage ratio $411.6 $393.6 $8.9 ($1.5) ($23.4) ($2.0) 0 100 200 300 400 500 Equity at 12/31/14 Earnings Dividends declared Share repurchases Other* Equity at 3/31/16 *Includes accumulated other comprehensive income, ESOP shares committed to be released, stock-based compensation expenses and tax effects on deferred compensation. Net loans ($ millions) $1,133 $1,570 0 500 1,000 1,500 2,000 Net loans at 12/31/14 Net loans at 3/31/16 Equity ($ millions) 23.3% 17.9% 12/31/14 3/31/16
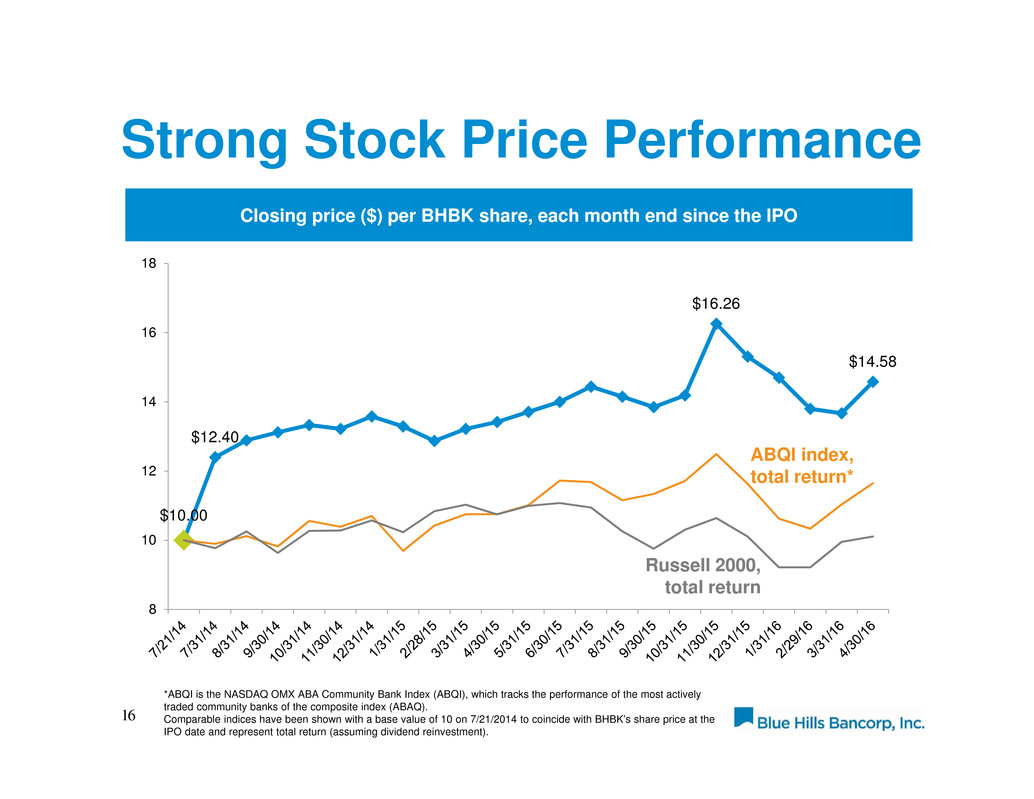
Strong Stock Price Performance 16 Closing price ($) per BHBK share, each month end since the IPO $10.00 $12.40 $16.26 $14.58 8 10 12 14 16 18 ABQI index, total return* *ABQI is the NASDAQ OMX ABA Community Bank Index (ABQI), which tracks the performance of the most actively traded community banks of the composite index (ABAQ). Comparable indices have been shown with a base value of 10 on 7/21/2014 to coincide with BHBK’s share price at the IPO date and represent total return (assuming dividend reinvestment). Russell 2000, total return
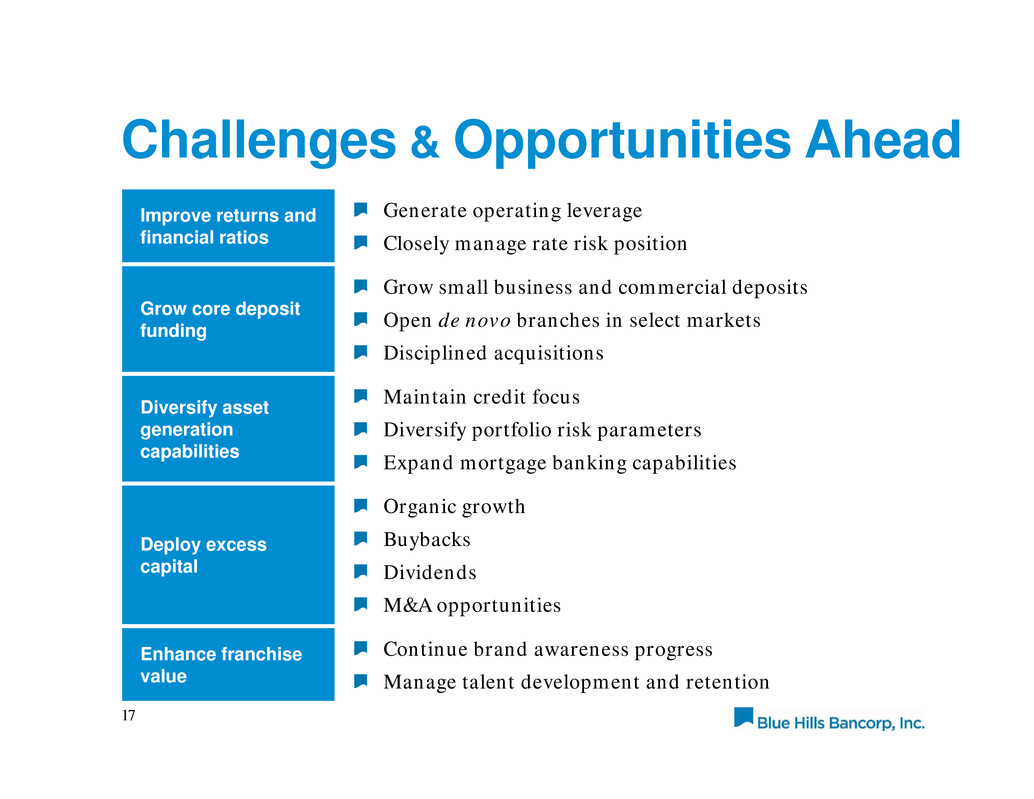
Challenges & Opportunities Ahead 17 Improve returns and financial ratios Generate operating leverage Closely manage rate risk position Grow core deposit funding Grow small business and commercial deposits Open de novo branches in select markets Disciplined acquisitions Diversify asset generation capabilities Maintain credit focus Diversify portfolio risk parameters Expand mortgage banking capabilities Deploy excess capital Organic growth Buybacks Dividends M&A opportunities Enhance franchise value Continue brand awareness progress Manage talent development and retention
Title 18 1. Footnote. Questions & Answers
19 Appendix
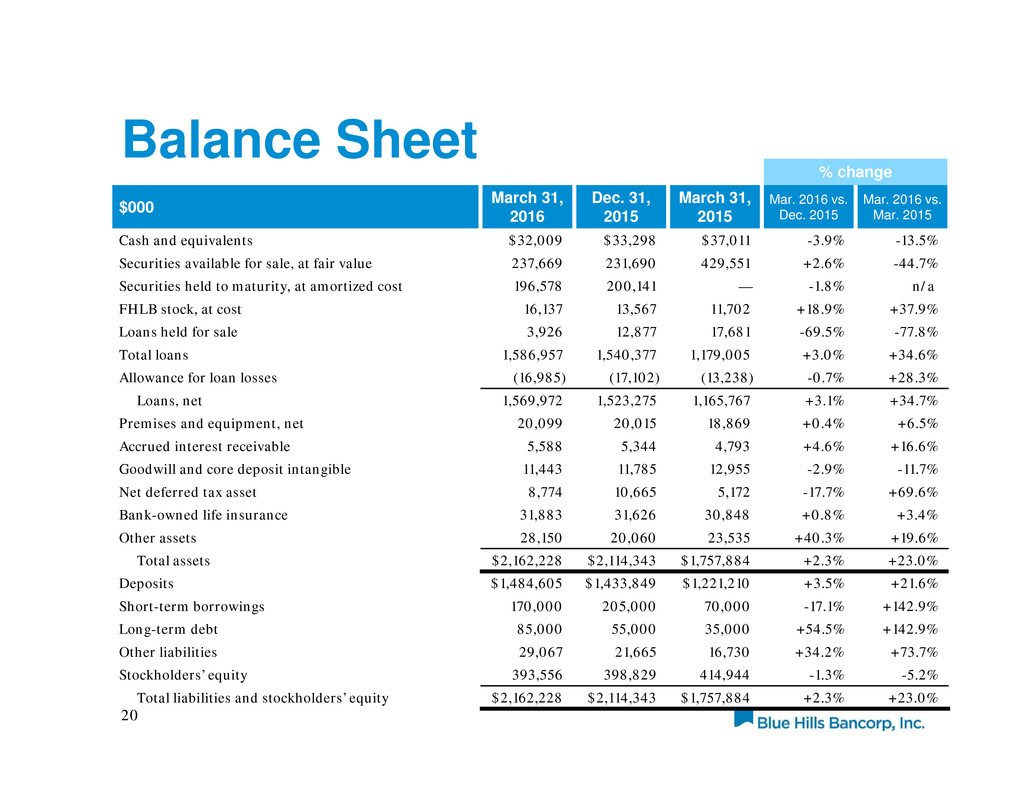
20 % change $000 March 31, 2016 Dec. 31, 2015 March 31, 2015 Mar. 2016 vs. Dec. 2015 Mar. 2016 vs. Mar. 2015 Cash and equivalents $32,009 $33,298 $37,011 -3.9% -13.5% Securities available for sale, at fair value 237,669 231,690 429,551 +2.6% -44.7% Securities held to maturity, at amortized cost 196,578 200,141 — -1.8% n/a FHLB stock, at cost 16,137 13,567 11,702 +18.9% +37.9% Loans held for sale 3,926 12,877 17,681 -69.5% -77.8% Total loans 1,586,957 1,540,377 1,179,005 +3.0% +34.6% Allowance for loan losses (16,985) (17,102) (13,238) -0.7% +28.3% Loans, net 1,569,972 1,523,275 1,165,767 +3.1% +34.7% Premises and equipment, net 20,099 20,015 18,869 +0.4% +6.5% Accrued interest receivable 5,588 5,344 4,793 +4.6% +16.6% Goodwill and core deposit intangible 11,443 11,785 12,955 -2.9% -11.7% Net deferred tax asset 8,774 10,665 5,172 -17.7% +69.6% Bank-owned life insurance 31,883 31,626 30,848 +0.8% +3.4% Other assets 28,150 20,060 23,535 +40.3% +19.6% Total assets $2,162,228 $2,114,343 $1,757,884 +2.3% +23.0% Deposits $1,484,605 $1,433,849 $1,221,210 +3.5% +21.6% Short-term borrowings 170,000 205,000 70,000 -17.1% +142.9% Long-term debt 85,000 55,000 35,000 +54.5% +142.9% Other liabilities 29,067 21,665 16,730 +34.2% +73.7% Stockholders’ equity 393,556 398,829 414,944 -1.3% -5.2% Total liabilities and stockholders’ equity $2,162,228 $2,114,343 $1,757,884 +2.3% +23.0% Balance Sheet
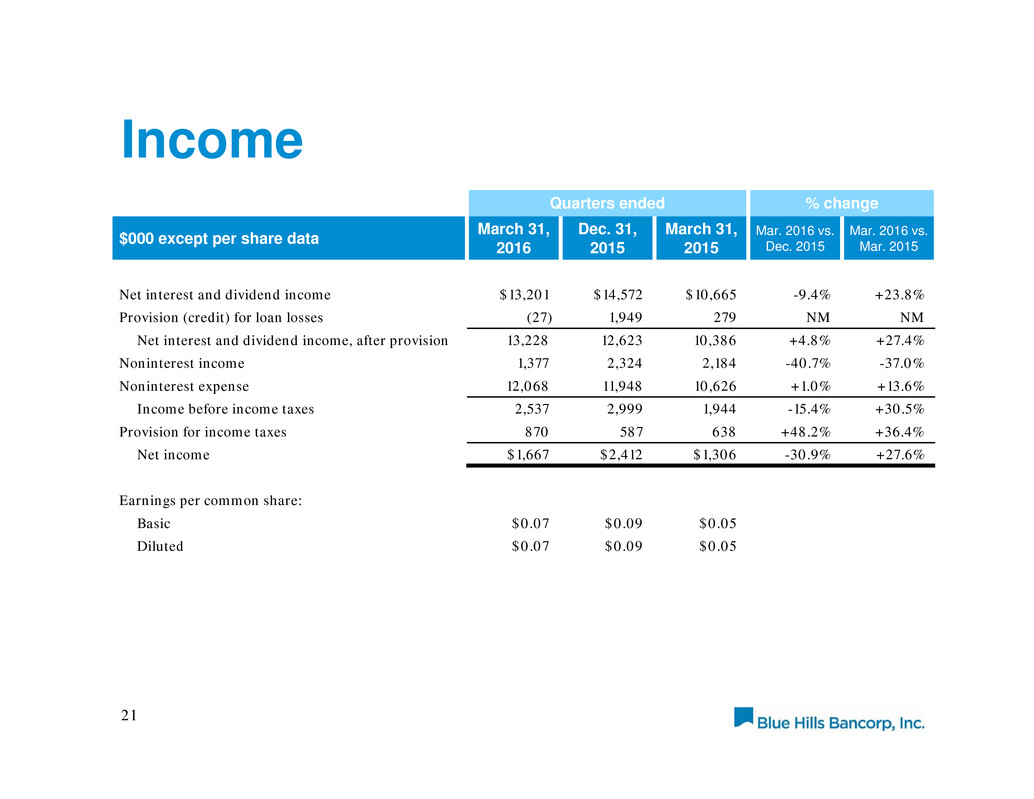
21 Quarters ended % change $000 except per share data March 31, 2016 Dec. 31, 2015 March 31, 2015 Mar. 2016 vs. Dec. 2015 Mar. 2016 vs. Mar. 2015 Net interest and dividend income $13,201 $14,572 $10,665 -9.4% +23.8% Provision (credit) for loan losses (27) 1,949 279 NM NM Net interest and dividend income, after provision 13,228 12,623 10,386 +4.8% +27.4% Noninterest income 1,377 2,324 2,184 -40.7% -37.0% Noninterest expense 12,068 11,948 10,626 +1.0% +13.6% Income before income taxes 2,537 2,999 1,944 -15.4% +30.5% Provision for income taxes 870 587 638 +48.2% +36.4% Net income $1,667 $2,412 $1,306 -30.9% +27.6% Earnings per common share: Basic $0.07 $0.09 $0.05 Diluted $0.07 $0.09 $0.05 Income
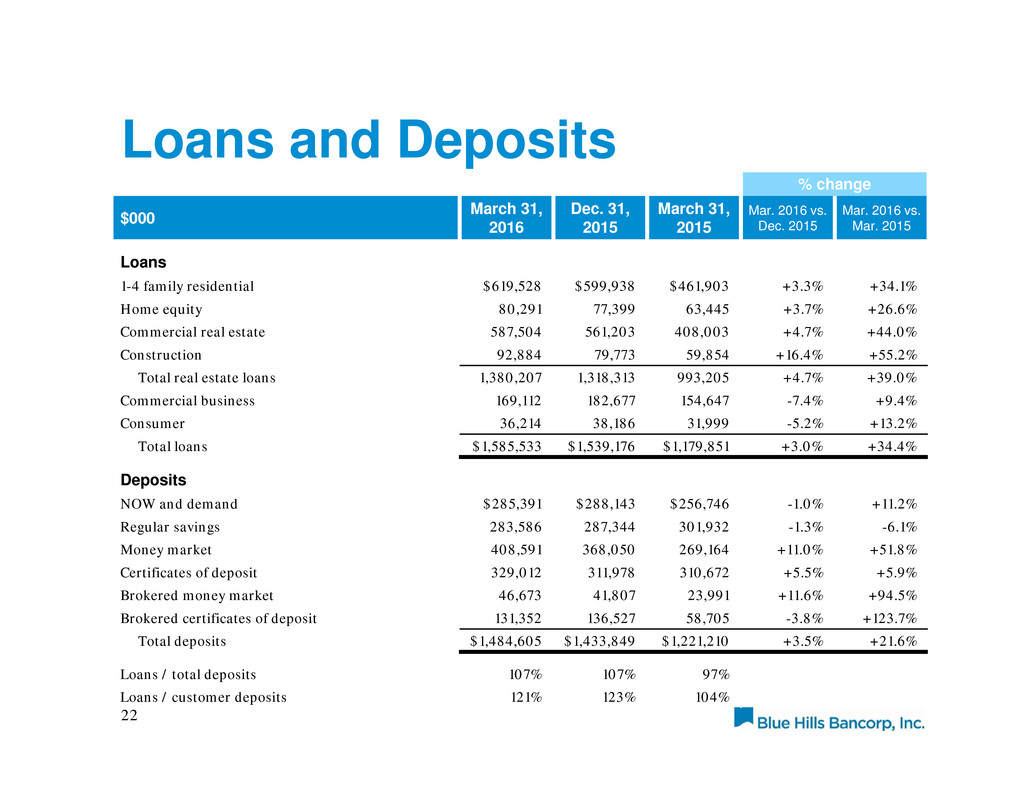
22 % change $000 March 31, 2016 Dec. 31, 2015 March 31, 2015 Mar. 2016 vs. Dec. 2015 Mar. 2016 vs. Mar. 2015 Loans 1-4 family residential $619,528 $599,938 $461,903 +3.3% +34.1% Home equity 80,291 77,399 63,445 +3.7% +26.6% Commercial real estate 587,504 561,203 408,003 +4.7% +44.0% Construction 92,884 79,773 59,854 +16.4% +55.2% Total real estate loans 1,380,207 1,318,313 993,205 +4.7% +39.0% Commercial business 169,112 182,677 154,647 -7.4% +9.4% Consumer 36,214 38,186 31,999 -5.2% +13.2% Total loans $1,585,533 $1,539,176 $1,179,851 +3.0% +34.4% Deposits NOW and demand $285,391 $288,143 $256,746 -1.0% +11.2% Regular savings 283,586 287,344 301,932 -1.3% -6.1% Money market 408,591 368,050 269,164 +11.0% +51.8% Certificates of deposit 329,012 311,978 310,672 +5.5% +5.9% Brokered money market 46,673 41,807 23,991 +11.6% +94.5% Brokered certificates of deposit 131,352 136,527 58,705 -3.8% +123.7% Total deposits $1,484,605 $1,433,849 $1,221,210 +3.5% +21.6% Loans / total deposits 107% 107% 97% Loans / customer deposits 121% 123% 104% Loans and Deposits
