Attached files
| file | filename |
|---|---|
| 8-K - 8-K - BMC STOCK HOLDINGS, INC. | d188017d8k.htm |
| EX-99.2 - EX-99.2 - BMC STOCK HOLDINGS, INC. | d188017dex992.htm |
Exhibit 99.1
BMC Stock Holdings, Inc. Investor Presentation May 2016

Disclaimer Forward-Looking Statements This document contains “forward-looking statements” within the meaning of the Private Securities Litigation Reform Act of 1995. Forward-looking statements in this document may include, without limitation, statements regarding sales growth, price changes, earnings performance, strategic direction and the demand for our products. Forward-looking statements are typically identified by words or phrases such as “may,” “might,” “predict,” “future,” “seek to,” “assume,” “goal,” “objective,” “continue,” “will,” “could,” “should,” “would,” “anticipate,” “estimate,” “expect,” “project,” “intend,” “plan,” “believe,” “target,” “prospects,” “guidance,” “possible,” “predict,” “propose,” “potential” and “forecast,” or the negative of such terms and other words, terms and phrases of similar meaning. Forward-looking statements involve estimates, expectations, projections, goals, forecasts, assumptions, risks and uncertainties, many of which are outside the control of BMC Stock Holdings, Inc. (“BMC Stock” or the “Company”). BMC Stock cautions readers that any forward-looking statement is not a guarantee of future performance and that actual results could differ materially from those contained in the forward-looking statement, therefore investors and shareholders should not place undue reliance on such statement. Such forward-looking statements include, but are not limited to, statements about the benefits of the recently completed merger (the “Merger”) of Stock Building Supply Holdings, Inc. (“SBS”) with Building Material Holdings Corporation (“BMC”), including future financial and operating results, plans, objectives, expectations and intentions, and other statements that are not historical facts. There are a number of risks and uncertainties that could cause actual results to differ materially from the forward-looking statements included in this communication. Important factors that could cause actual results to differ materially from those indicated by such forward-looking statements include risks and uncertainties relating to: the risk that the BMC business will not be integrated successfully or that such integration will take longer, be more difficult, time-consuming or costly to accomplish than expected; the risk that the cost savings and any other synergies from the Merger may not be fully realized or may take longer to realize than expected; disruption from the Merger may make it more difficult to maintain relationships with customers, employees or suppliers; the diversion of management time on Merger-related issues; general worldwide economic conditions and related uncertainties; changes in the markets for BMC Stock’s business segments; unanticipated downturns in business relationships with customers; competitive pressures on the Company’s sales and pricing; increases in the cost of material, energy and other production costs, or unexpected costs that cannot be recouped in product pricing; the introduction of competing technologies; unexpected technical or marketing difficulties; unexpected claims, charges, litigation or dispute resolutions; the effect of changes in governmental regulations; and other factors discussed or referred to in the “Risk Factors” section of BMC Stock’s most recent Annual Report on Form 10-K filed with the Securities and Exchange Commission (“SEC”) on March 15, 2016, and our subsequent filings with the SEC. All such factors are difficult to predict and are beyond BMC Stock’s control. All forward-looking statements attributable to BMC Stock or persons acting on BMC Stock’s behalf are expressly qualified in their entirety by the foregoing cautionary statements. All such statements speak only as of the date made, and BMC Stock undertakes no obligation to update or revise publicly any forward-looking statements, whether as a result of new information, future events or otherwise. Basis of Presentation The Merger was accounted for as a “reverse acquisition” under the acquisition method of accounting, with SBS treated as the legal acquirer and BMC treated as the acquirer for accounting purposes. As such, the Company has accounted for the Merger by using BMC historical information and accounting policies and adding the assets and liabilities of SBS as of the completion date of the Merger at their estimated fair values. The Company’s fourth quarter and full year 2015 results include SBS’s operations from the date of the Merger through December 31, 2015 (the “stub” period), which contributed $103.6 million of net sales. As a result, current year results reported pursuant to U.S. generally accepted accounting principles (“GAAP”) are not comparable to prior periods. 2
Non-GAAP (Adjusted) Financial Measures Non-GAAP Financial Measures For informational purposes only, the Company has furnished Adjusted financial information. The Adjusted financial information combines the historical results of BMC Stock with the pre-Merger results of SBS for pre-Merger financial periods, when applicable. The Adjusted financial information has not been prepared in accordance with GAAP, and is based upon currently available information and assumptions deemed appropriate by the Company’s management. This Adjusted financial information is not necessarily indicative of what the Company’s results actually would have been had the Merger been completed as of any date prior to December 1, 2015. In addition, this Adjusted financial information is not indicative of future results or current financial conditions and does not reflect any anticipated synergies, operating efficiencies, cost savings or integration costs that may result from the Merger. All Adjusted financial information should be read in conjunction with separate historical financial statements and accompanying notes filed with the SEC. A reconciliation of Adjusted financial measures to GAAP financial measures is provided in the Appendix of this presentation. Adjusted net sales relates to 2013, 2014 and 2015 reporting periods and is defined as (i) BMC Stock net sales plus (ii) pre-Merger SBS net sales. Adjusted gross profit for the three months ended March 31, 2016 is defined as (i) BMC Stock gross profit plus (ii) inventory step-up charges, and for 2013-2015 reporting periods is defined as (i) BMC Stock gross profit plus (ii) pre-Merger SBS gross profit plus (iii) inventory step-up charges. Adjusted EBITDA for the three months ended March 31, 2016 is defined as (i) BMC Stock net income (loss) plus (ii) interest expense, income tax expense, depreciation and amortization, impairment of assets, Merger and integration costs, inventory step-up charges and non-cash stock compensation expense, and for 2013-2015 reporting periods is defined as (i) BMC Stock net income (loss) plus (ii) pre-Merger SBS income (loss) from continuing operations plus (iii) including pre-Merger results of SBS, interest expense, income tax expense, depreciation and amortization, non-cash stock compensation expense, headquarters relocation expense, loss portfolio transfer, insurance deductible reserve adjustments and other items. Adjusted net income (loss) for the three months ended March 31, 2016 is defined as (i) BMC Stock net income (loss) plus (ii) impairment of assets, Merger and integration costs, inventory step-up charges, non-cash stock compensation expense, headquarters relocation expense and other items, and after tax effecting those items, and for the three months ended March 31, 2015 is defined as (i) BMC Stock net income (loss) plus (ii) pre-Merger SBS income (loss) from continuing operations, plus (iii) including pre-Merger results of SBS, Merger-related costs, inventory step-up charges, non-cash stock compensation expense, headquarters relocation expense, other items and recognition of previously unrecognized tax benefits, and after tax effecting those items. Adjusted net debt is defined as (i) long-term debt and capital lease obligations, including current and long-term portions, plus (ii) interest payable less (iii) cash and cash equivalents. Adjusted net sales, Adjusted gross profit, Adjusted EBITDA, Adjusted net income (loss) and Adjusted net debt are intended as supplemental measures of the Company’s performance that are not required by, or presented in accordance with, GAAP. The Company believes that Adjusted net sales, Adjusted gross profit, Adjusted EBITDA, Adjusted net income (loss) and Adjusted net debt provide useful information to management and investors regarding certain financial and business trends relating to the Company’s financial condition and operating results. Company management uses Adjusted net sales, Adjusted gross profit, Adjusted EBITDA, Adjusted net income (loss) and Adjusted net debt for trend analyses, for purposes of determining management incentive compensation and for budgeting and planning purposes. Adjusted net sales, Adjusted gross profit, and Adjusted EBITDA is used in monthly financial reports prepared for management and the board of directors. The Company believes that the use of Adjusted net sales, Adjusted gross profit, Adjusted EBITDA, Adjusted net income (loss) and Adjusted net debt provide additional tools for investors to use in evaluating ongoing operating results and trends and in comparing the Company’s financial measures with other distribution and retail companies, which may present similar non-GAAP financial measures to investors. However, the Company’s calculation of Adjusted net sales, Adjusted gross profit, Adjusted EBITDA, Adjusted net income (loss) and Adjusted net debt are not necessarily comparable to similarly titled measures reported by other companies. Company management does not consider Adjusted net sales, Adjusted gross profit, Adjusted EBITDA, Adjusted net income (loss) or Adjusted net debt in isolation or as alternatives to financial measures determined in accordance with GAAP. The principal limitation of Adjusted gross profit, Adjusted EBITDA and Adjusted net income (loss) is that they exclude significant expenses and income that are required by GAAP to be recorded in the Company’s financial statements. Some of these limitations are: (i) Adjusted EBITDA and Adjusted net income (loss) do not reflect changes in, or cash requirements for, working capital needs; (ii) Adjusted EBITDA does not reflect interest expense, or the requirements necessary to service interest or principal payments on debt; (iii) Adjusted EBITDA does not reflect income tax expenses or the cash requirements to pay taxes; (iv) Adjusted EBITDA and Adjusted net income (loss) do not reflect historical cash expenditures or future requirements for capital expenditures or contractual commitments; (v) although depreciation and amortization charges are non-cash charges, the assets being depreciated and amortized will often have to be replaced in the future and Adjusted EBITDA and Adjusted net income (loss) do not reflect any cash requirements for such replacements and (vi) Adjusted EBITDA and Adjusted net income (loss) do not consider the potentially dilutive impact of issuing non-cash stock-based compensation. In order to compensate for these limitations, management presents Adjusted net sales, Adjusted gross profit, Adjusted EBITDA, Adjusted net income (loss) and Adjusted net debt in conjunction with GAAP results. Readers should review the reconciliations of net sales to Adjusted net sales, gross profit to Adjusted gross profit, net income (loss) to Adjusted EBITDA and Adjusted net income (loss), and Adjusted net debt in the Appendix of this presentation, and should not rely on any single financial measure to evaluate the Company’s business. 3
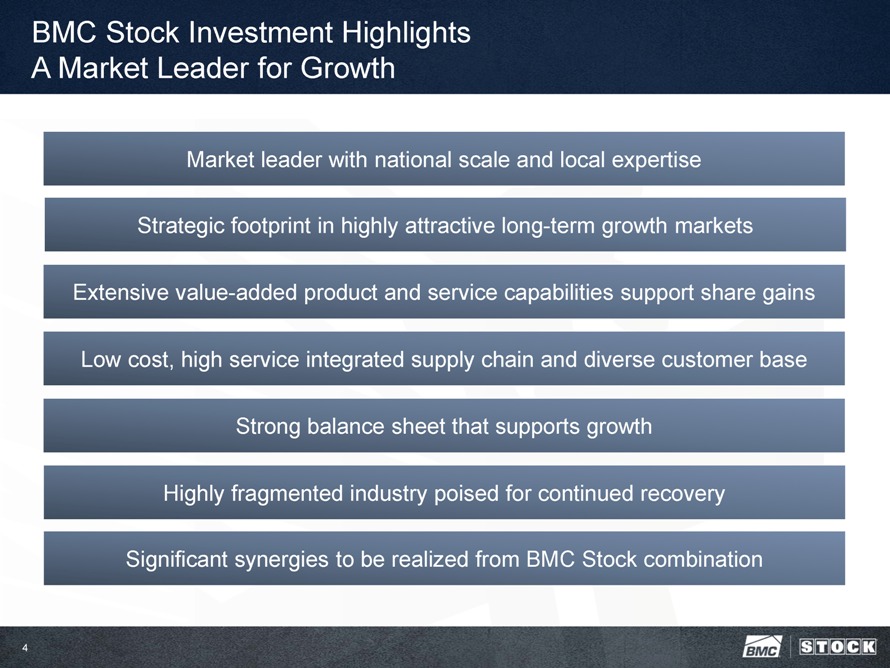
BMC Stock Investment Highlights A Market Leader for Growth Market leader with national scale and local expertise Strategic footprint in highly attractive long-term growth markets Extensive value-added product and service capabilities support share gains Low cost, high service integrated supply chain and diverse customer base Strong balance sheet that supports growth Highly fragmented industry poised for continued recovery Significant synergies to be realized from BMC Stock combination 4

| 1 |
|
Company Overview |
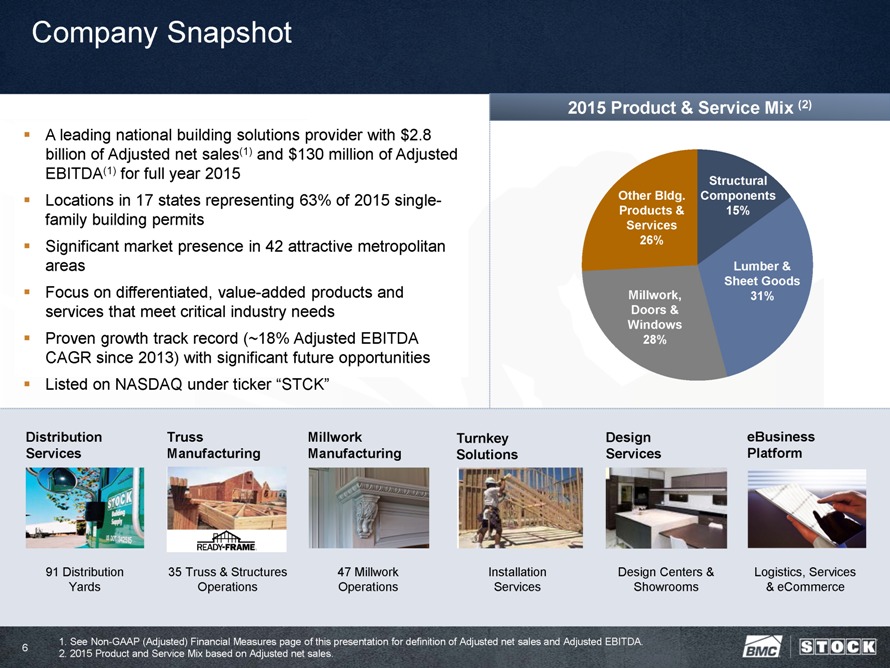
Company Snapshot • A leading national building solutions provider with $2.8 billion of Adjusted net sales(1) and $130 million of Adjusted EBITDA(1) for full year 2015 • Locations in 17 states representing 63% of 2015 single- family building permits • Significant market presence in 42 attractive metropolitan areas • Focus on differentiated, value-added products and services that meet critical industry needs • Proven growth track record (~18% Adjusted EBITDA CAGR since 2013) with significant future opportunities • Listed on NASDAQ under ticker “STCK” 2015 Product & Service Mix (2) Other Bldg. Products & Services 26% Structural Components 15% Millwork, Doors & Windows 28% Lumber & Sheet Goods 31% Distribution Services 91 Distribution Yards Truss Manufacturing 35 Truss & Structures Operations Millwork Manufacturing 47 Millwork Operations Turnkey Solutions Installation Services Design Services Design Centers & Showrooms eBusiness Platform Logistics, Services & eCommerce 1. See Non-GAAP (Adjusted) Financial Measures page of this presentation for definition of Adjusted net sales and Adjusted EBITDA. 2. 2015 Product and Service Mix based on Adjusted net sales. 6
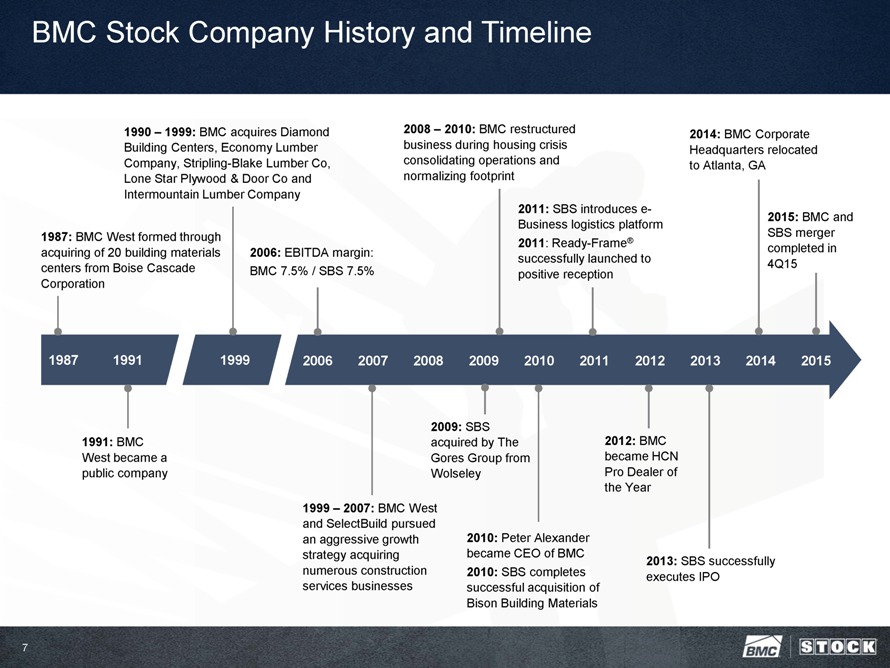
BMC Stock Company History and Timeline 1990 – 1999: BMC acquires Diamond Building Centers, Economy Lumber Company, Stripling-Blake Lumber Co, Lone Star Plywood & Door Co and Intermountain Lumber Company 2008 – 2010: BMC restructured business during housing crisis consolidating operations and normalizing footprint 2014: BMC Corporate Headquarters relocated to Atlanta, GA 1987: BMC West formed through acquiring of 20 building materials centers from Boise Cascade Corporation 2006: EBITDA margin: BMC 7.5% / SBS 7.5% 2011: SBS introduces e-Business logistics platform 2011: Ready-Frame® successfully launched to positive reception 2015: BMC and SBS merger completed in 4Q15 1987 1991 1999 2006 2007 2008 2009 2010 2011 2012 2013 2014 2015 1991: BMC West became a public company 2009: SBS acquired by The Gores Group from Wolseley 2012: BMC became HCN Pro Dealer of the Year 1999 – 2007: BMC West and SelectBuild pursued an aggressive growth strategy acquiring numerous construction services businesses 2010: Peter Alexander became CEO of BMC 2010: SBS completes successful acquisition of Bison Building Materials 2013: SBS successfully executes IPO 7
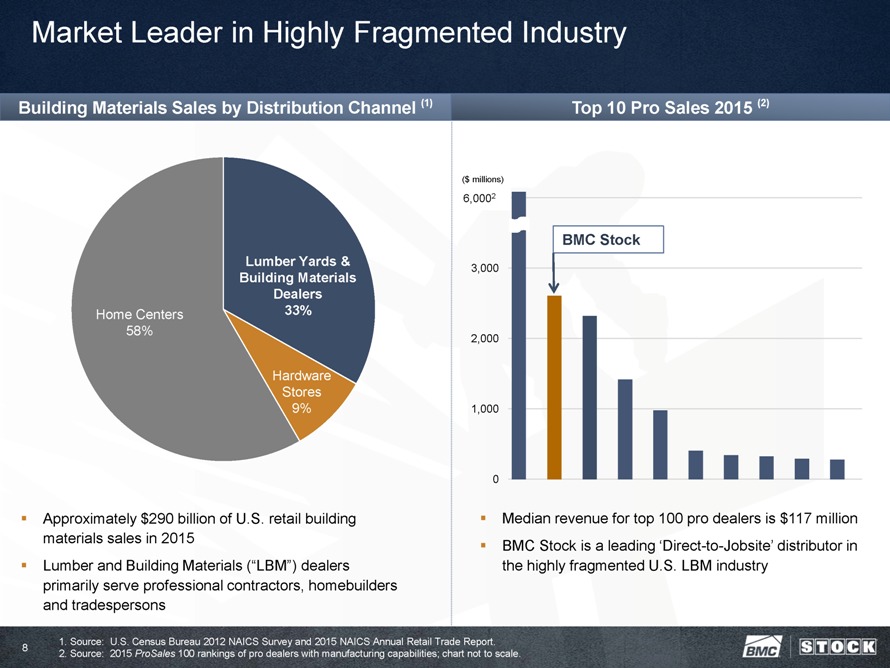
Market Leader in Highly Fragmented Industry Building Materials Sales by Distribution Channel (1) Home Centers 58% Lumber Yards & Building Materials Dealers 33% Hardware Stores 9% • Approximately $290 billion of U.S. retail building materials sales in 2015 • Lumber and Building Materials (“LBM”) dealers primarily serve professional contractors, homebuilders and tradespersons Top 10 Pro Sales 2015 (2) ($ millions) 6,0002 3,000 2,000 1,000 0 BMC Stock • Median revenue for top 100 pro dealers is $117 million • BMC Stock is a leading ‘Direct-to-Jobsite’ distributor in the highly fragmented U.S. LBM industry 1. Source: U.S. Census Bureau 2012 NAICS Survey and 2015 NAICS Annual Retail Trade Report. 2. Source: 2015 ProSales 100 rankings of pro dealers with manufacturing capabilities; chart not to scale. 8
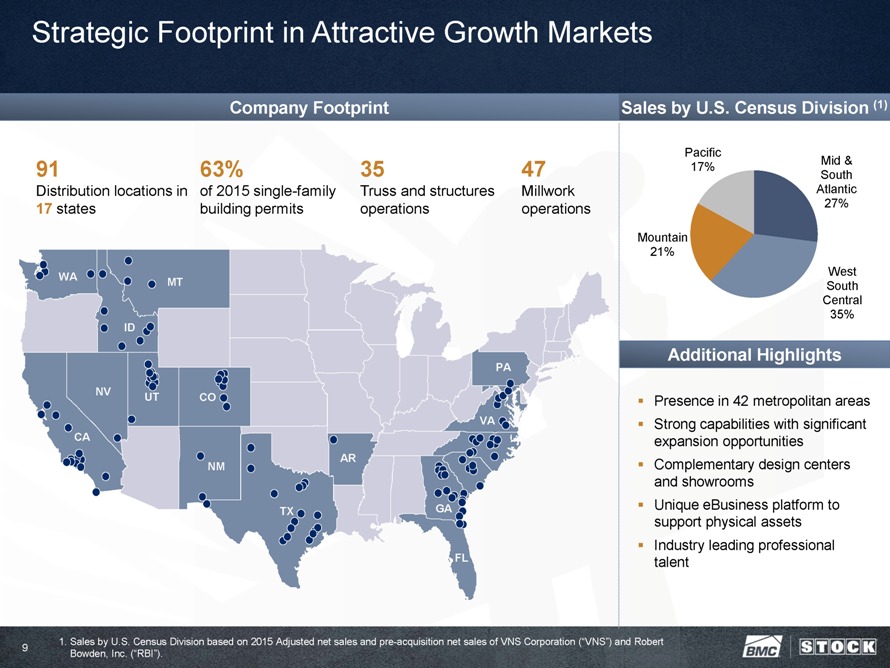
Strategic Footprint in Attractive Growth Markets Company Footprint 91 Distribution locations in 17 states 63% of 2015 single-family building permits 35 Truss and structures operations 47 Millwork operations WA MT ID PA NV UT CO VA CA AR NM TX GA FL Sales by U.S. Census Division (1) Pacific Mid & 17% South Atlantic 27% Mountain 21% West South Central 35% Additional Highlights • Presence in 42 metropolitan areas • Strong capabilities with significant expansion opportunities • Complementary design centers and showrooms • Unique eBusiness platform to support physical assets • Industry leading professional talent 1. Sales by U.S. Census Division based on 2015 Adjusted net sales and pre-acquisition net sales of VNS Corporation (“VNS”) and Robert Bowden, Inc. (“RBI”). 9
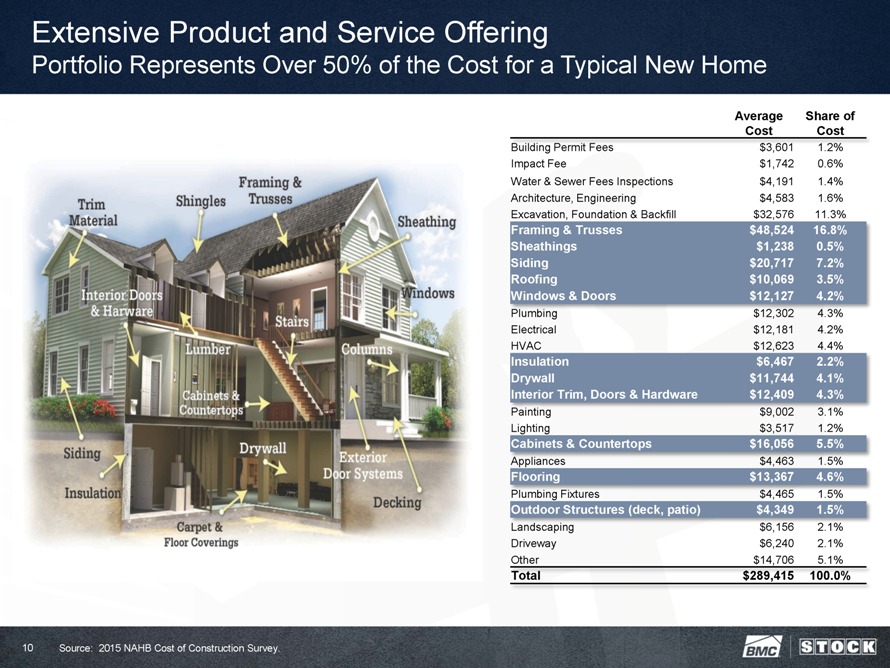
Extensive Product and Service Offering Portfolio Represents Over 50% of the Cost for a Typical New Home Average Share of Cost Cost Building Permit Fees $3,601 1.2% Impact Fee $1,742 0.6% Water & Sewer Fees Inspections $4,191 1.4% Architecture, Engineering $4,583 1.6% Excavation, Foundation & Backfill $32,576 11.3% Framing & Trusses $48,524 16.8% Sheathings $1,238 0.5% Siding $20,717 7.2% Roofing $10,069 3.5% Windows & Doors $12,127 4.2% Plumbing $12,302 4.3% Electrical $12,181 4.2% HVAC $12,623 4.4% Insulation $6,467 2.2% Drywall $11,744 4.1% Interior Trim, Doors & Hardware $12,409 4.3% Painting $9,002 3.1% Lighting $3,517 1.2% Cabinets & Countertops $16,056 5.5% Appliances $4,463 1.5% Flooring $13,367 4.6% Plumbing Fixtures $4,465 1.5% Outdoor Structures (deck, patio) $4,349 1.5% Landscaping $6,156 2.1% Driveway $6,240 2.1% Other $14,706 5.1% Total $289,415 100.0% Source: 2015 NAHB Cost of Construction Survey. 10
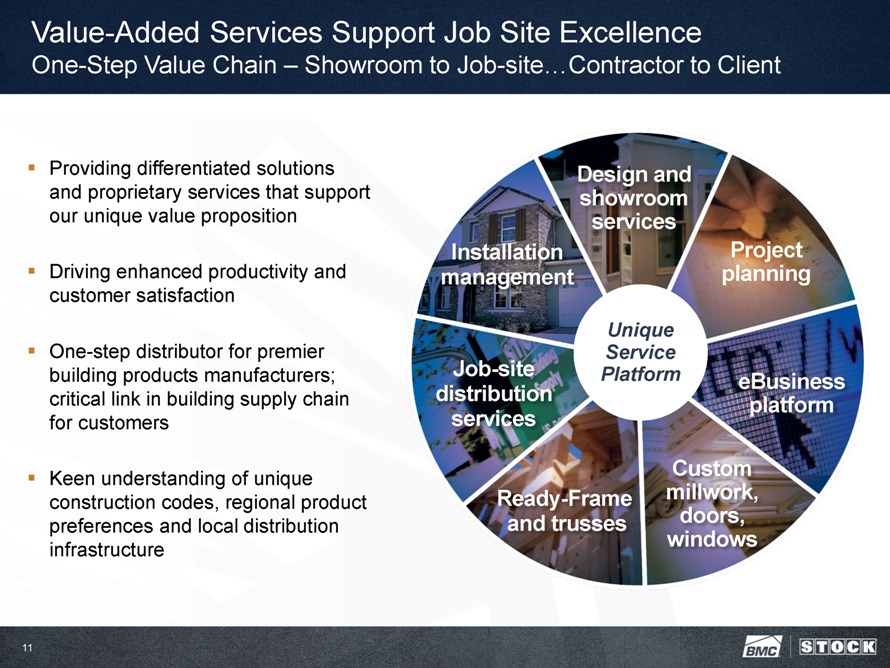
Value-Added Services Support Job Site Excellence One-Step Value Chain – Showroom to Job-site…Contractor to Client • Providing differentiated solutions and proprietary services that support our unique value proposition • Driving enhanced productivity and customer satisfaction • One-step distributor for premier building products manufacturers; critical link in building supply chain for customers • Keen understanding of unique construction codes, regional product preferences and local distribution infrastructure Design and showroom services Project planning eBusiness platform Custom millwork, doors, windows Ready-Frame and trusses Job-site distribution services Installation management Unique Service Platform 11
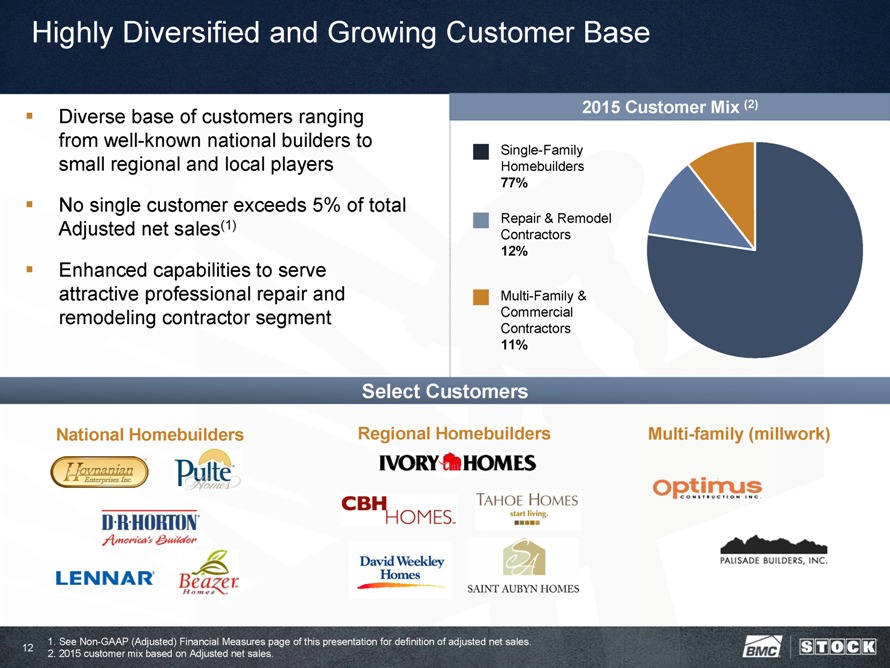
Highly Diversified and Growing Customer Base • Diverse base of customers ranging from well-known national builders to small regional and local players • No single customer exceeds 5% of total Adjusted net sales(1) • Enhanced capabilities to serve attractive professional repair and remodeling contractor segment 2015 Customer Mix (2) Single-Family Homebuilders 77% Repair & Remodel Contractors 12% Multi-Family & Commercial Contractors 11% Select Customers National Homebuilders Regional Homebuilders Multi-family (millwork) 1. See Non-GAAP (Adjusted) Financial Measures page of this presentation for definition of adjusted net sales. 2. 2015 customer mix based on Adjusted net sales. 12
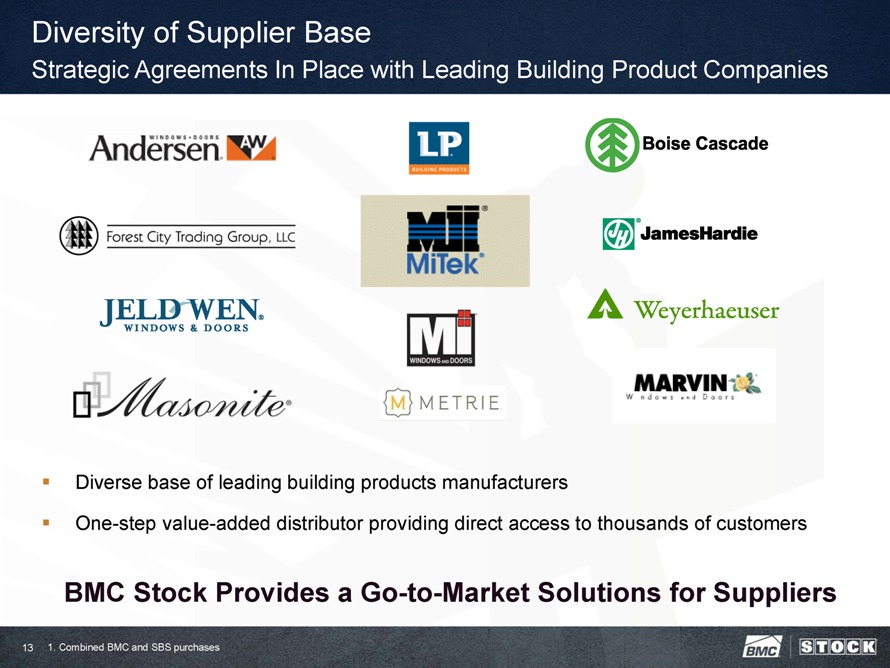
Diversity of Supplier Base Strategic Agreements In Place with Leading Building Product Companies Diverse base of leading building products manufacturers One-step value-added distributor providing direct access to thousands of customers BMC Stock Provides a Go-to-Market Solutions for Suppliers 1. Combined BMC and SBS purchases 13
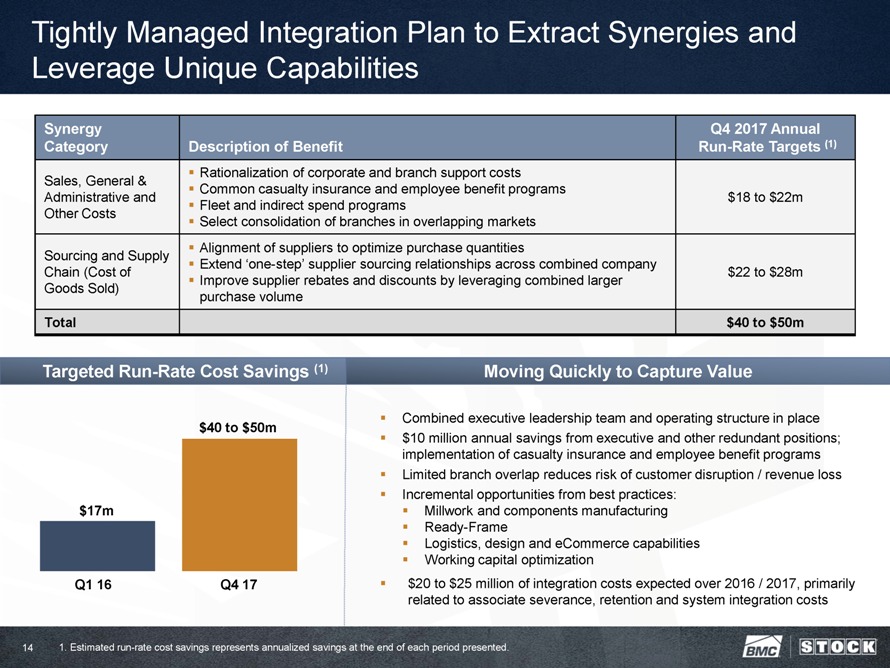
Tightly Managed Integration Plan to Extract Synergies and Leverage Unique Capabilities Synergy Q4 2017 Annual Category Description of Benefit Run-Rate Targets (1) Rationalization of corporate and branch support costs Sales, General & Common casualty insurance and employee benefit programs Administrative and $18 to $22m Fleet and indirect spend programs Other Costs Select consolidation of branches in overlapping markets Alignment of suppliers to optimize purchase quantities Sourcing and Supply Extend ‘one-step’ supplier sourcing relationships across combined company Chain (Cost of $22 to $28m Improve supplier rebates and discounts by leveraging combined larger Goods Sold) purchase volume Total $40 to $50m Targeted Run-Rate Cost Savings (1) $17m Q1 16 $40 to $50m Q4 17 Moving Quickly to Capture Value Combined executive leadership team and operating structure in place $10 million annual savings from executive and other redundant positions; implementation of casualty insurance and employee benefit programs Limited branch overlap reduces risk of customer disruption / revenue loss Incremental opportunities from best practices: Millwork and components manufacturing Ready-Frame Logistics, design and eCommerce capabilities Working capital optimization $20 to $25 million of integration costs expected over 2016 / 2017, primarily related to associate severance, retention and system integration costs 1. Estimated run-rate cost savings represents annualized savings at the end of each period presented. 14

| 2 |
|
Focused Growth Strategy |
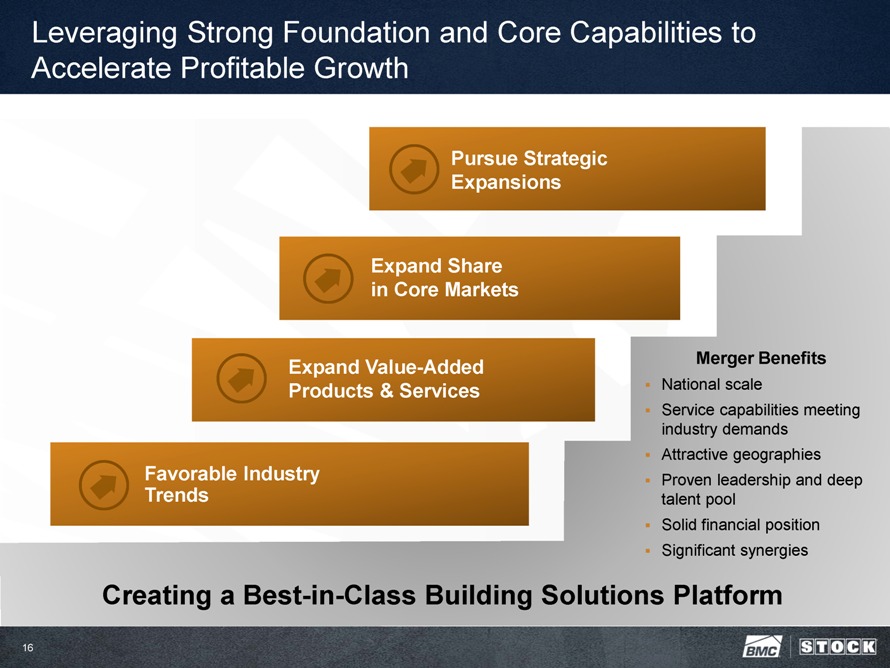
Leveraging Strong Foundation and Core Capabilities to Accelerate Profitable Growth Pursue Strategic Expansions Expand Share in Core Markets Expand Value-Added Products & Services Favorable Industry Trends Merger Benefits National scale Service capabilities meeting industry demands Attractive geographies Proven leadership and deep talent pool Solid financial position Significant synergies Creating a Best-in-Class Building Solutions Platform 16
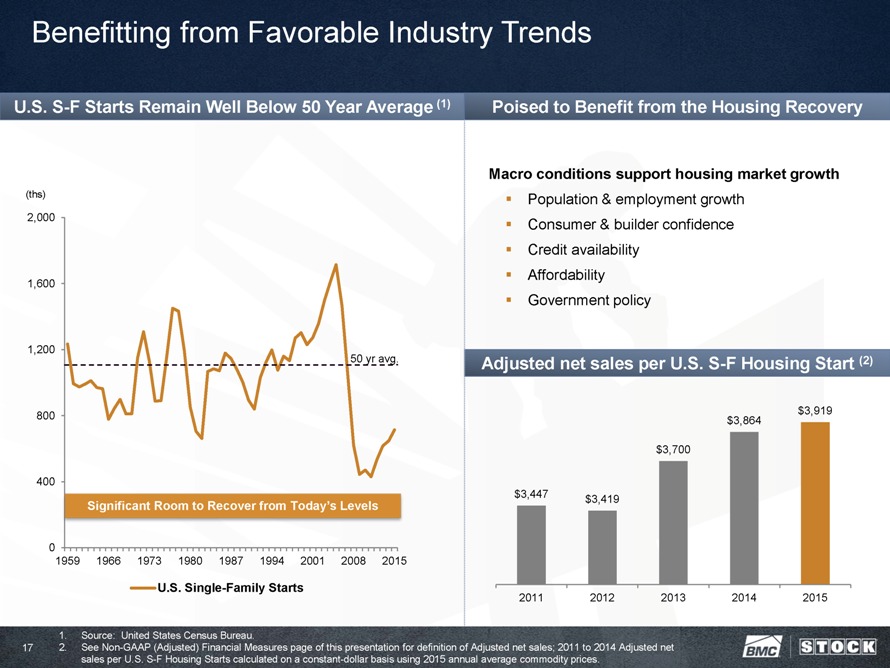
Benefitting from Favorable Industry Trends U.S. S-F Starts Remain Well Below 50 Year Average (1) (ths) 2,000 1,600 1,200 800 400 0 50 yr avg. Significant Room to Recover from Today’s Levels 1959 1966 1973 1980 1987 1994 2001 2008 2015 U.S. Single-Family Starts Poised to Benefit from the Housing Recovery Macro conditions support housing market growth • Population & employment growth • Consumer & builder confidence • Credit availability • Affordability • Government policy Adjusted net sales per U.S. S-F Housing Start (2) $3,919 $3,864 $3,700 $3,447 $3,419 2011 2012 2013 2014 2015 1. Source: United States Census Bureau. 2. See Non-GAAP (Adjusted) Financial Measures page of this presentation for definition of Adjusted net sales; 2011 to 2014 Adjusted net sales per U.S. S-F Housing Starts calculated on a constant-dollar basis using 2015 annual average commodity prices. 17
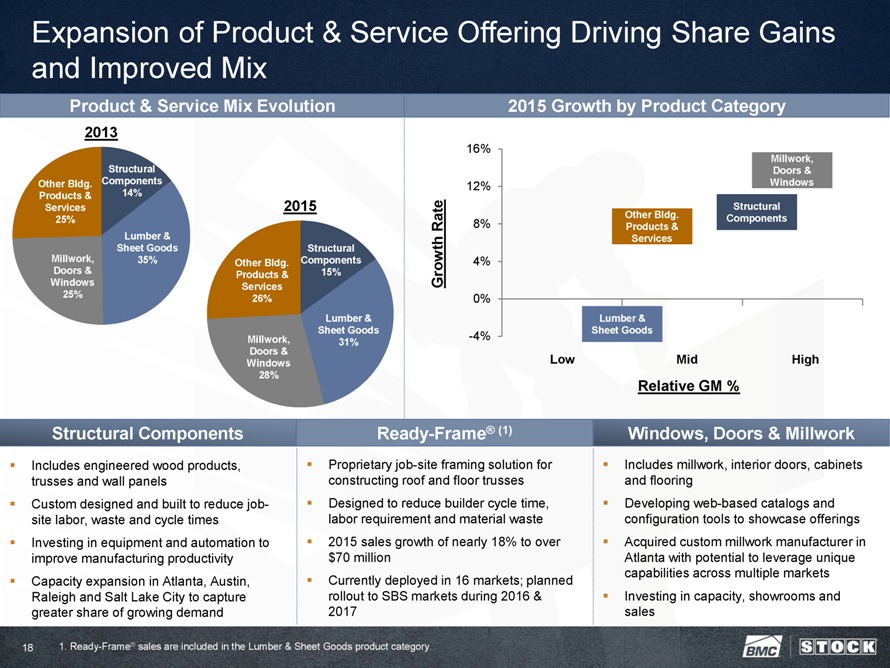
Expansion of Product & Service Offering Driving Share Gains and Improved Mix Product & Service Mix Evolution 2013 Other Bldg. Products & Services 25% Structural Components 14% Lumber & Sheet Goods 35% Millwork, Doors & Windows 25% 2015 Other Bldg. Products & Services 26% Structural Components 15% Lumber & Sheet Goods 31% Millwork, Doors & Windows 28% 2015 Growth by Product Category Growth Rate 16% 12% 8% 4% 0% -4% Millwork, Doors & Windows Structural Components Other Bldg. Products & Services Lumber & Sheet Goods Low Mid High Relative GM % Structural Components • Includes engineered wood products, trusses and wall panels • Custom designed and built to reduce job- site labor, waste and cycle times • Investing in equipment and automation to improve manufacturing productivity • Capacity expansion in Atlanta, Austin, Raleigh and Salt Lake City to capture greater share of growing demand Ready-Frame® (1) • Proprietary job-site framing solution for constructing roof and floor trusses • Designed to reduce builder cycle time, labor requirement and material waste • 2015 sales growth of nearly 18% to over $70 million • Currently deployed in 16 markets; planned rollout to SBS markets during 2016 & 2017 Windows, Doors & Millwork • Includes millwork, interior doors, cabinets and flooring • Developing web-based catalogs and configuration tools to showcase offerings • Acquired custom millwork manufacturer in Atlanta with potential to leverage unique capabilities across multiple markets • Investing in capacity, showrooms and sales 1. Ready-Frame® sales are included in the Lumber & Sheet Goods product category. 18
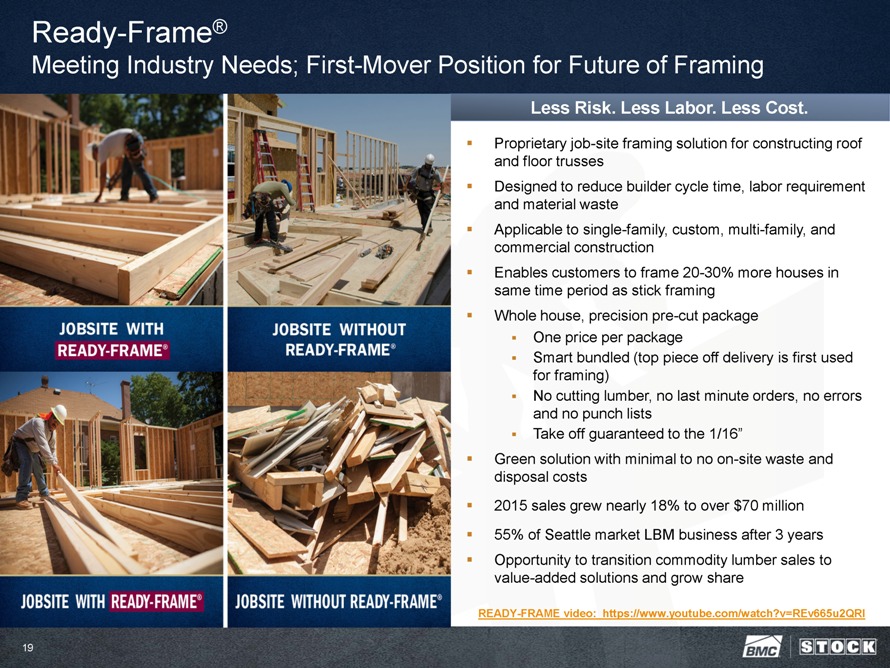
Ready-Frame® Meeting Industry Needs; First-Mover Position for Future of Framing Less Risk. Less Labor. Less Cost. Proprietary job-site framing solution for constructing roof and floor trusses Designed to reduce builder cycle time, labor requirement and material waste Applicable to single-family, custom, multi-family, and commercial construction Enables customers to frame 20-30% more houses in same time period as stick framing Whole house, precision pre-cut package One price per package Smart bundled (top piece off delivery is first used for framing) No cutting lumber, no last minute orders, no errors and no punch lists Take off guaranteed to the 1/16” Green solution with minimal to no on-site waste and disposal costs 2015 sales grew nearly 18% to over $70 million 55% of Seattle market LBM business after 3 years Opportunity to transition commodity lumber sales to value-added solutions and grow share READY-FRAME video: https://www.youtube.com/watch?v=REv665u2QRI 19
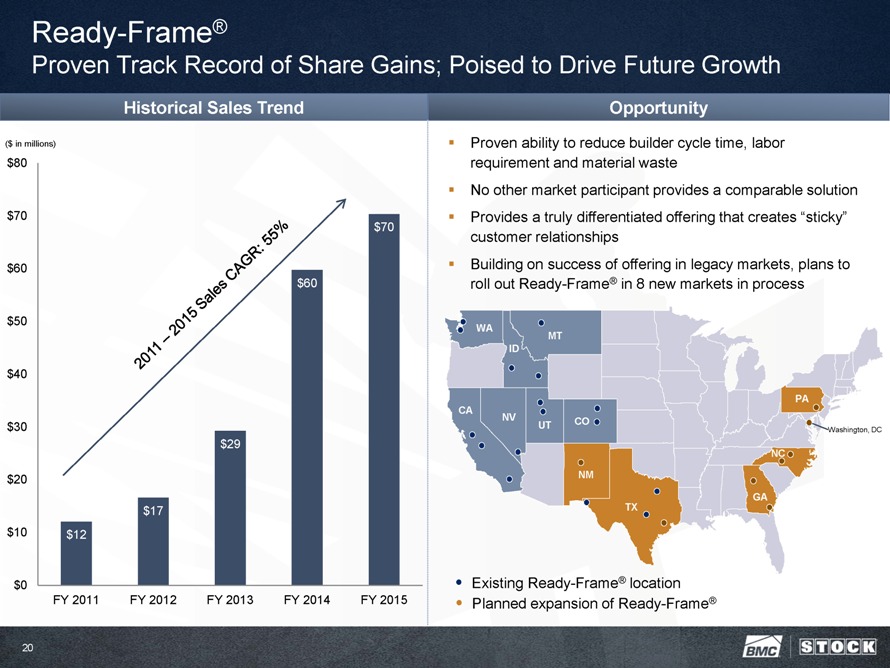
Ready-Frame® Proven Track Record of Share Gains; Poised to Drive Future Growth Historical Sales Trend ($ in millions) $80 $70 $60 $50 $40 $30 $20 $10 $0 $70 $60 $29 $17 $12 FY 2011 FY 2012 FY 2013 FY 2014 FY 2015 Opportunity Proven ability to reduce builder cycle time, labor requirement and material waste No other market participant provides a comparable solution Provides a truly differentiated offering that creates “sticky” customer relationships Building on success of offering in legacy markets, plans to roll out Ready-Frame® in 8 new markets in process WA MT ID PA CA NV CO UT Washington, DC NC NM TX GA Existing Ready-Frame® location Planned expansion of Ready-Frame® 20
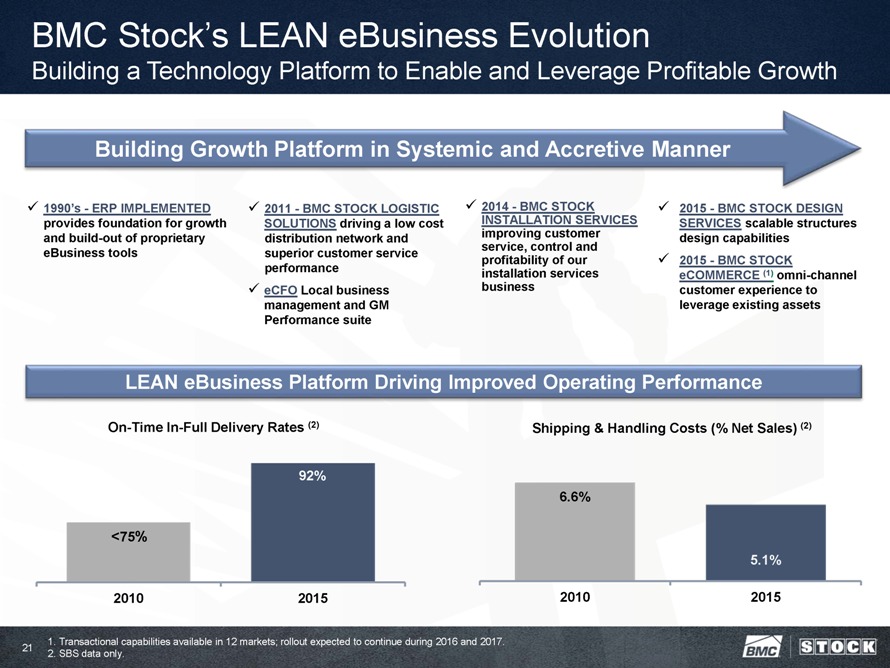
BMC Stock’s LEAN eBusiness Evolution Building a Technology Platform to Enable and Leverage Profitable Growth Building Growth Platform in Systemic and Accretive Manner 1990’s - ERP IMPLEMENTED provides foundation for growth and build-out of proprietary eBusiness tools 2011 - BMC STOCK LOGISTIC SOLUTIONS driving a low cost distribution network and superior customer service performance eCFO Local business management and GM Performance suite 2014 - BMC STOCK INSTALLATION SERVICES improving customer service, control and profitability of our installation services business 2015 - BMC STOCK DESIGN SERVICES scalable structures design capabilities 2015 - BMC STOCK eCOMMERCE (1) omni-channel customer experience to leverage existing assets LEAN eBusiness Platform Driving Improved Operating Performance On-Time In-Full Delivery Rates (2) <75% 2010 92% 2015 Shipping & Handling Costs (% Net Sales) (2) 6.6% 2010 5.1% 2015 1. Transactional capabilities available in 12 markets; rollout expected to continue during 2016 and 2017. 2. SBS data only. 21
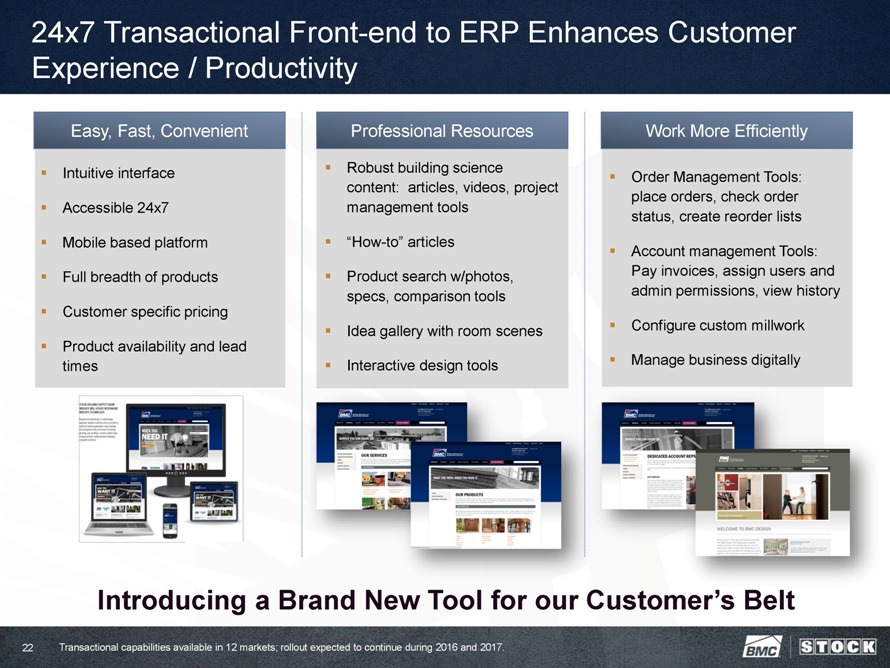
24x7 Transactional Front-end to ERP Enhances Customer Experience / Productivity Easy, Fast, Convenient • Intuitive interface • Accessible 24x7 • Mobile based platform • Full breadth of products • Customer specific pricing • Product availability and lead times Professional Resources • Robust building science content: articles, videos, project management tools • “How-to” articles • Product search w/photos, specs, comparison tools • Idea gallery with room scenes • Interactive design tools Work More Efficiently • Order Management Tools: place orders, check order status, create reorder lists • Account management Tools: Pay invoices, assign users and admin permissions, view history • Configure custom millwork • Manage business digitally Introducing a Brand New Tool for our Customer’s Belt Transactional capabilities available in 12 markets; rollout expected to continue during 2016 and 2017. 22
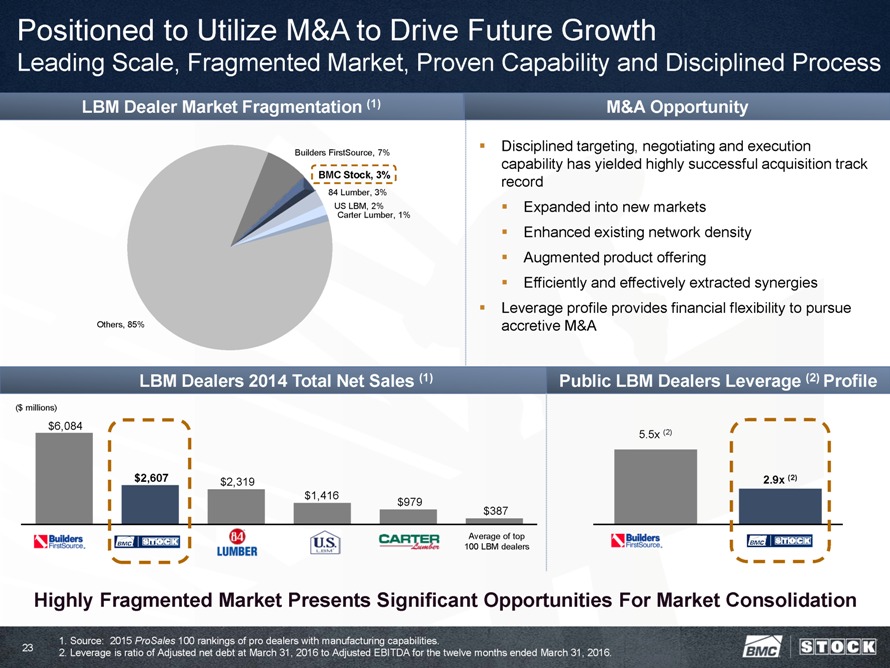
Positioned to Utilize M&A to Drive Future Growth Leading Scale, Fragmented Market, Proven Capability and Disciplined Process LBM Dealer Market Fragmentation (1) Builders FirstSource, 7% BMC Stock, 3% 84 Lumber, 3% US Carter LBM, Lumber, 2% 1% Others, 85% M&A Opportunity • Disciplined targeting, negotiating and execution capability has yielded highly successful acquisition track record • Expanded into new markets • Enhanced existing network density • Augmented product offering • Efficiently and effectively extracted synergies • Leverage profile provides financial flexibility to pursue accretive M&A LBM Dealers 2014 Total Net Sales (1) ($ millions) $6,084 $2,607 $2,319 $1,416 $979 $387 Average of top 100 LBM dealers Public LBM Dealers Leverage (2) Profile 5.5x (2) 2.9x (2) Highly Fragmented Market Presents Significant Opportunities For Market Consolidation 1. Source: 2015 ProSales 100 rankings of pro dealers with manufacturing capabilities. 2. Leverage is ratio of Adjusted net debt at March 31, 2016 to Adjusted EBITDA for the twelve months ended March 31, 2016. 23
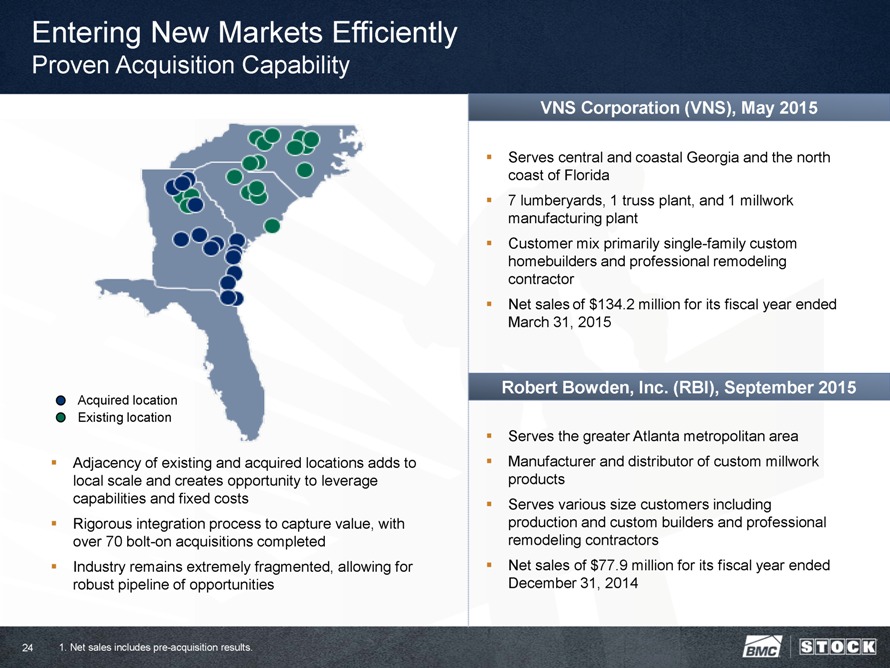
Entering New Markets Efficiently Proven Acquisition Capability Acquired location Existing location • Adjacency of existing and acquired locations adds to local scale and creates opportunity to leverage capabilities and fixed costs • Rigorous integration process to capture value, with over 70 bolt-on acquisitions completed • Industry remains extremely fragmented, allowing for robust pipeline of opportunities VNS Corporation (VNS), May 2015 • Serves central and coastal Georgia and the north coast of Florida • 7 lumberyards, 1 truss plant, and 1 millwork manufacturing plant • Customer mix primarily single-family custom homebuilders and professional remodeling contractor • Net sales of $134.2 million for its fiscal year ended March 31, 2015 Robert Bowden, Inc. (RBI), September 2015 • Serves the greater Atlanta metropolitan area • Manufacturer and distributor of custom millwork products • Serves various size customers including production and custom builders and professional remodeling contractors • Net sales of $77.9 million for its fiscal year ended December 31, 2014 1. Net sales includes pre-acquisition results. 24

| 3 |
|
Financial Overview |
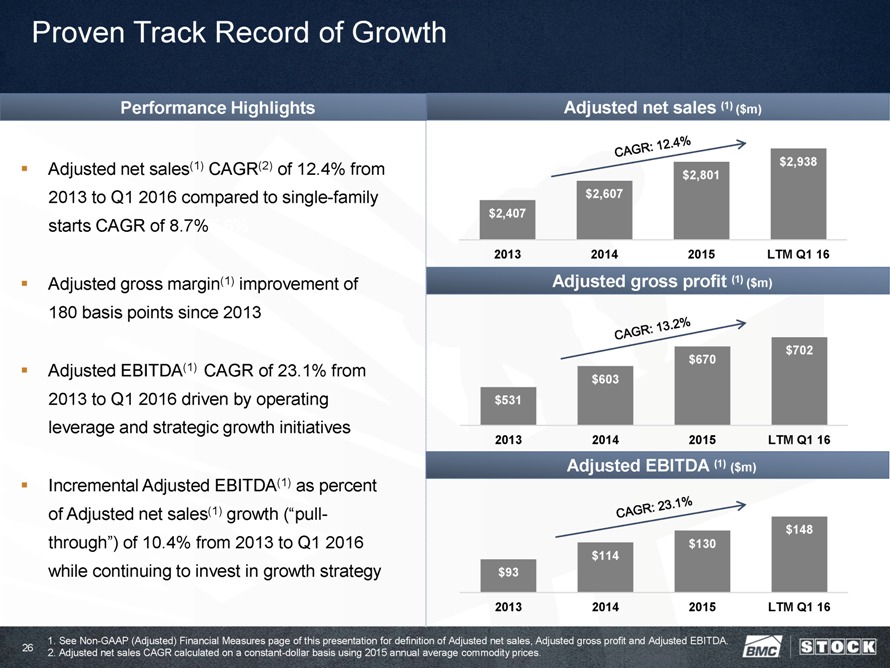
Proven Track Record of Growth Performance Highlights • Adjusted net sales(1) CAGR(2) of 12.4% from 2013 to Q1 2016 compared to single-family starts CAGR of 8.7%7.6% • Adjusted gross margin(1) improvement of 180 basis points since 2013 • Adjusted EBITDA(1) CAGR of 23.1% from 2013 to Q1 2016 driven by operating leverage and strategic growth initiatives • Incremental Adjusted EBITDA(1) as percent of Adjusted net sales(1) growth (“pull- through”) of 10.4% from 2013 to Q1 2016 while continuing to invest in growth strategy Adjusted net sales (1) ($m) $2,938 $2,801 $2,607 $2,407 2013 2014 2015 LTM Q1 16 Adjusted gross profit (1) ($m) $702 $670 $603 $531 2013 2014 2015 LTM Q1 16 Adjusted EBITDA (1) ($m) $148 $114 $130 $93 2013 2014 2015 LTM Q1 16 1. See Non-GAAP (Adjusted) Financial Measures page of this presentation for definition of Adjusted net sales, Adjusted gross profit and Adjusted EBITDA. 2. Adjusted net sales CAGR calculated on a constant-dollar basis using 2015 annual average commodity prices. 26
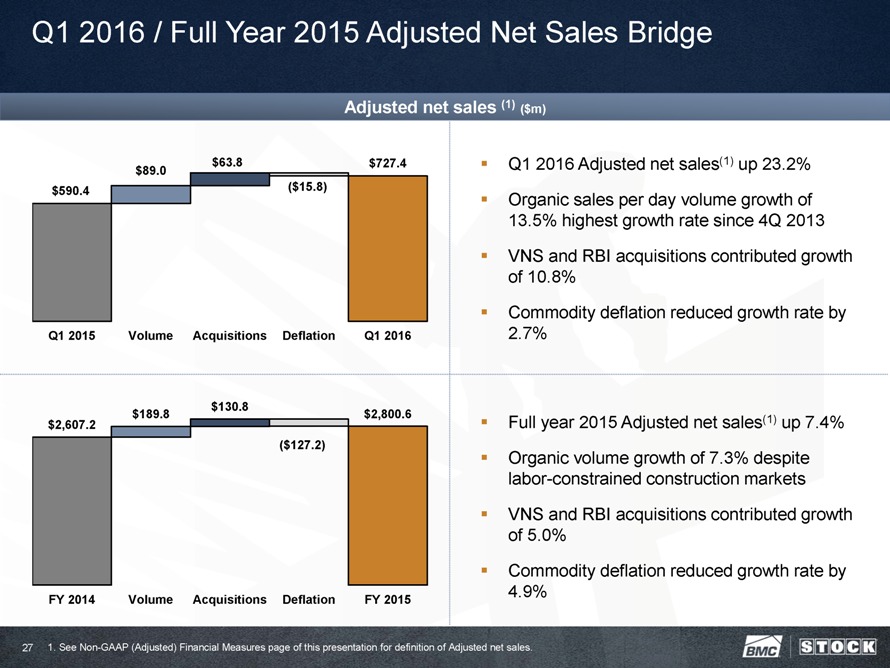
Q1 2016 / Full Year 2015 Adjusted Net Sales Bridge Adjusted net sales (1) ($m) $63.8 $727.4 $89.0 $590.4 ($15.8) Q1 2015 Volume Acquisitions Deflation Q1 2016 • Q1 2016 Adjusted net sales(1) up 23.2% • Organic sales per day volume growth of 13.5% highest growth rate since 4Q 2013 • VNS and RBI acquisitions contributed growth of 10.8% • Commodity deflation reduced growth rate by 2.7% $130.8 $189.8 $2,800.6 $2,607.2 ($127.2) FY 2014 Volume Acquisitions Deflation FY 2015 • Full year 2015 Adjusted net sales(1) up 7.4% • Organic volume growth of 7.3% despite labor-constrained construction markets • VNS and RBI acquisitions contributed growth of 5.0% • Commodity deflation reduced growth rate by 4.9% 1. See Non-GAAP (Adjusted) Financial Measures page of this presentation for definition of Adjusted net sales. 27
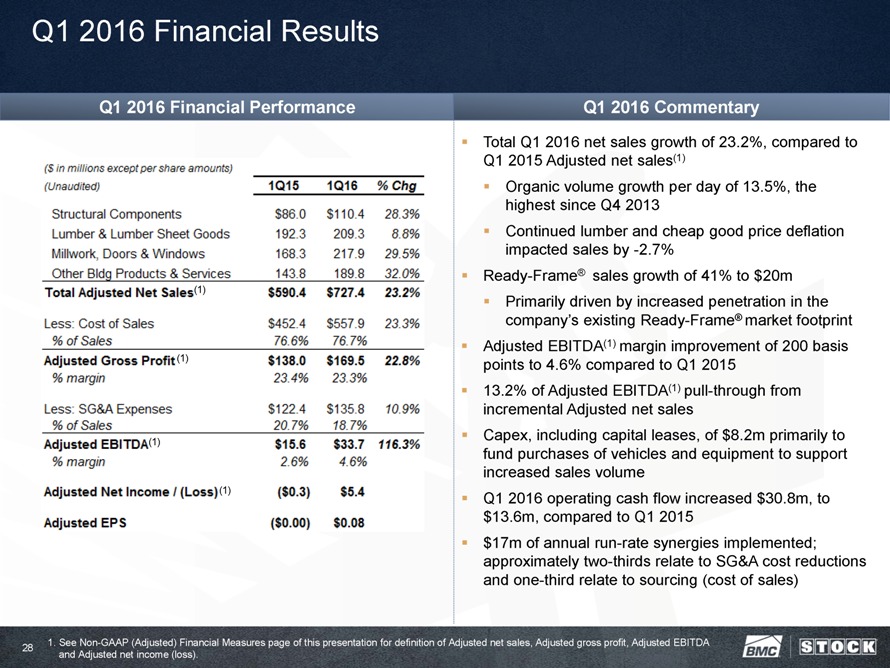
Q1 2016 Financial Results Q1 2016 Financial Performance ($ in millions except per share amounts) (Unaudited) 1Q15 1Q16 %Chg Structural Components $86.0 $110.4 28.3% Lumber & Lumber Sheet Goods 192.3 209.3 8.8% Millwork. Doors & Windows 168.3 217.9 29.5% Other Bldg Products & Services 143.8 189.8 32.0% Total Adjusted Net Sales(1) $590.4 $727.4 23.2% Less: Cost of Sales $452.4 $557.9 23.3% % of Sales 76.6% 76.7% Adjusted Gross Profit(1) $138.0 $169.5 22.8% % margin 23.4% 23.3% Less: SG&A Expenses $122.4 $135.8 10.9% % of Sales 20.7% 18.7% Adjusted EBITDA(1) $15.6 $33.7 116.3% % margin 2.6% 4.6% Adjusted Net Income / (Loss) (1) ($0.3) $5.4 Adjusted EPS ($0.00) $0.08 Q1 2016 Commentary • Total Q1 2016 net sales growth of 23.2%, compared to Q1 2015 Adjusted net sales(1) • Organic volume growth per day of 13.5%, the highest since Q4 2013 • Continued lumber and cheap good price deflation impacted sales by -2.7% • Ready-Frame® sales growth of 41% to $20m • Primarily driven by increased penetration in the company’s existing Ready-Frame® market footprint • Adjusted EBITDA(1) margin improvement of 200 basis points to 4.6% compared to Q1 2015 • 13.2% of Adjusted EBITDA(1) pull-through from incremental Adjusted net sales • Capex, including capital leases, of $8.2m primarily to fund purchases of vehicles and equipment to support increased sales volume • Q1 2016 operating cash flow increased $30.8m, to $13.6m, compared to Q1 2015 • $17m of annual run-rate synergies implemented; approximately two-thirds relate to SG&A cost reductions and one-third relate to sourcing (cost of sales) 1. See Non-GAAP (Adjusted) Financial Measures page of this presentation for definition of Adjusted net sales, Adjusted gross profit, Adjusted EBITDA and Adjusted net income (loss). 28
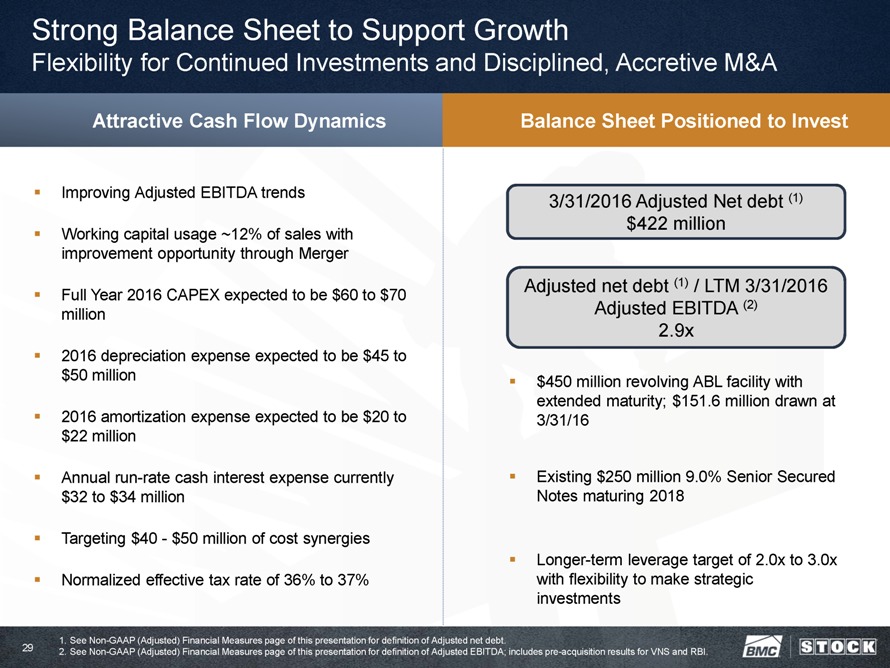
Strong Balance Sheet to Support Growth Flexibility for Continued Investments and Disciplined, Accretive M&A Attractive Cash Flow Dynamics • Improving Adjusted EBITDA trends • Working capital usage ~12% of sales with improvement opportunity through Merger • Full Year 2016 CAPEX expected to be $60 to $70 million • 2016 depreciation expense expected to be $45 to $50 million • 2016 amortization expense expected to be $20 to $22 million • Annual run-rate cash interest expense currently $32 to $34 million • Targeting $40 - $50 million of cost synergies • Normalized effective tax rate of 36% to 37% Balance Sheet Positioned to Invest 3/31/2016 Adjusted Net debt (1) $422 million Adjusted net debt (1) / LTM 3/31/2016 Adjusted EBITDA (2) 2.9x • $450 million revolving ABL facility with extended maturity; $151.6 million drawn at 3/31/16 • Existing $250 million 9.0% Senior Secured Notes maturing 2018 • Longer-term leverage target of 2.0x to 3.0x with flexibility to make strategic investments 1. See Non-GAAP (Adjusted) Financial Measures page of this presentation for definition of Adjusted net debt. 2. See Non-GAAP (Adjusted) Financial Measures page of this presentation for definition of Adjusted EBITDA; includes pre-acquisition results for VNS and RBI. 29
Committed to Shareholder Value Creation Market leader with national scale and local expertise Strategic footprint in highly attractive long-term growth markets Extensive value-added product and service capabilities support share gains Low cost, high service integrated supply chain and diverse customer base Strong balance sheet that supports growth Highly fragmented industry poised for continued recovery Significant synergies to be realized from BMC Stock combination 30

APPENDIX
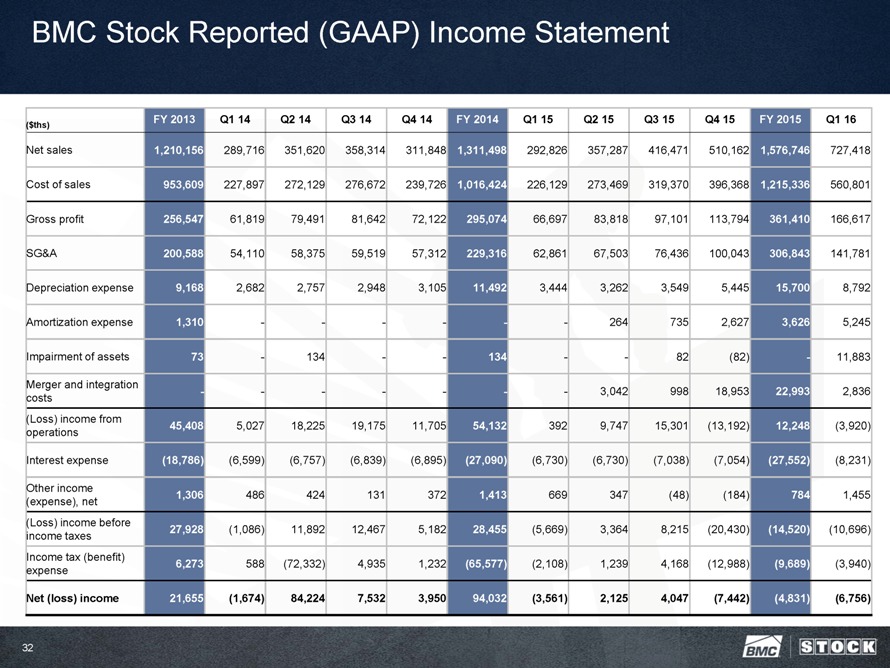
BMC Stock Reported (GAAP) Income Statement FY 2013 Q1 14 Q2 14 Q3 14 Q4 14 FY 2014 Q1 15 Q2 15 Q3 15 Q4 15 FY 2015 Q1 16 ($ths) Net sales 1,210,156 289,716 351,620 358,314 311,848 1,311,498 292,826 357,287 416,471 510,162 1,576,746 727,418 Cost of sales 953,609 227,897 272,129 276,672 239,726 1,016,424 226,129 273,469 319,370 396,368 1,215,336 560,801 Gross profit 256,547 61,819 79,491 81,642 72,122 295,074 66,697 83,818 97,101 113,794 361,410 166,617 SG&A 200,588 54,110 58,375 59,519 57,312 229,316 62,861 67,503 76,436 100,043 306,843 141,781 Depreciation expense 9,168 2,682 2,757 2,948 3,105 11,492 3,444 3,262 3,549 5,445 15,700 8,792 Amortization expense 1,310 - - - - - - 264 735 2,627 3,626 5,245 Impairment of assets 73 - 134 - - 134 - - 82 (82) - 11,883 Merger and integration - - - - - - - 3,042 998 18,953 22,993 2,836 costs (Loss) income from 45,408 5,027 18,225 19,175 11,705 54,132 392 9,747 15,301 (13,192) 12,248 (3,920) operations Interest expense (18,786) (6,599) (6,757) (6,839) (6,895) (27,090) (6,730) (6,730) (7,038) (7,054) (27,552) (8,231) Other income 1,306 486 424 131 372 1,413 669 347 (48) (184) 784 1,455 (expense), net (Loss) income before 27,928 (1,086) 11,892 12,467 5,182 28,455 (5,669) 3,364 8,215 (20,430) (14,520) (10,696) income taxes Income tax (benefit) 6,273 588 (72,332) 4,935 1,232 (65,577) (2,108) 1,239 4,168 (12,988) (9,689) (3,940) expense Net (loss) income 21,655 (1,674) 84,224 7,532 3,950 94,032 (3,561) 2,125 4,047 (7,442) (4,831) (6,756) 32
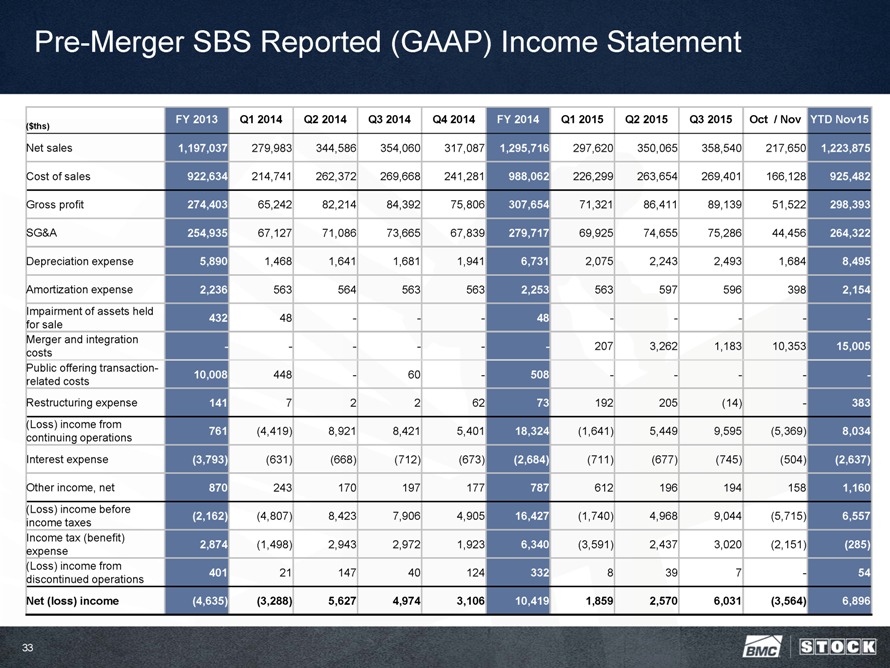
Pre-Merger SBS Reported (GAAP) Income Statement FY 2013 Q1 2014 Q2 2014 Q3 2014 Q4 2014 FY 2014 Q1 2015 Q2 2015 Q3 2015 Oct / Nov YTD Nov15 ($ths) Net sales 1,197,037 279,983 344,586 354,060 317,087 1,295,716 297,620 350,065 358,540 217,650 1,223,875 Cost of sales 922,634 214,741 262,372 269,668 241,281 988,062 226,299 263,654 269,401 166,128 925,482 Gross profit 274,403 65,242 82,214 84,392 75,806 307,654 71,321 86,411 89,139 51,522 298,393 SG&A 254,935 67,127 71,086 73,665 67,839 279,717 69,925 74,655 75,286 44,456 264,322 Depreciation expense 5,890 1,468 1,641 1,681 1,941 6,731 2,075 2,243 2,493 1,684 8,495 Amortization expense 2,236 563 564 563 563 2,253 563 597 596 398 2,154 Impairment of assets held 432 48 - - - 48 - - - - -for sale Merger and integration - - - - - - 207 3,262 1,183 10,353 15,005 costs Public offering transaction-10,008 448 - 60 - 508 - - - - -related costs Restructuring expense 141 7 2 2 62 73 192 205 (14) - 383 (Loss) income from 761 (4,419) 8,921 8,421 5,401 18,324 (1,641) 5,449 9,595 (5,369) 8,034 continuing operations Interest expense (3,793) (631) (668) (712) (673) (2,684) (711) (677) (745) (504) (2,637) Other income, net 870 243 170 197 177 787 612 196 194 158 1,160 (Loss) income before (2,162) (4,807) 8,423 7,906 4,905 16,427 (1,740) 4,968 9,044 (5,715) 6,557 income taxes Income tax (benefit) 2,874 (1,498) 2,943 2,972 1,923 6,340 (3,591) 2,437 3,020 (2,151) (285) expense (Loss) income from 401 21 147 40 124 332 8 39 7 - 54 discontinued operations Net (loss) income (4,635) (3,288) 5,627 4,974 3,106 10,419 1,859 2,570 6,031 (3,564) 6,896 33
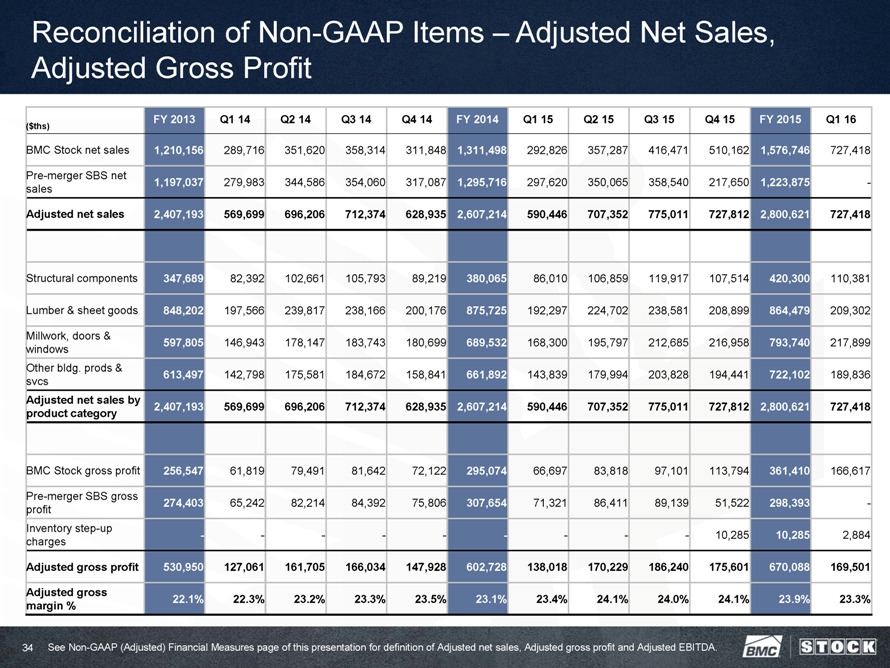
Reconciliation of Non-GAAP Items – Adjusted Net Sales, Adjusted Gross Profit FY 2013 Q1 14 Q2 14 Q3 14 Q4 14 FY 2014 Q1 15 Q2 15 Q3 15 Q4 15 FY 2015 Q1 16 ($ths) BMC Stock net sales 1,210,156 289,716 351,620 358,314 311,848 1,311,498 292,826 357,287 416,471 510,162 1,576,746 727,418 Pre-merger SBS net 1,197,037 279,983 344,586 354,060 317,087 1,295,716 297,620 350,065 358,540 217,650 1,223,875 -sales Adjusted net sales 2,407,193 569,699 696,206 712,374 628,935 2,607,214 590,446 707,352 775,011 727,812 2,800,621 727,418 Structural components 347,689 82,392 102,661 105,793 89,219 380,065 86,010 106,859 119,917 107,514 420,300 110,381 Lumber & sheet goods 848,202 197,566 239,817 238,166 200,176 875,725 192,297 224,702 238,581 208,899 864,479 209,302 Millwork, doors & 597,805 146,943 178,147 183,743 180,699 689,532 168,300 195,797 212,685 216,958 793,740 217,899 windows Other bldg. prods & 613,497 142,798 175,581 184,672 158,841 661,892 143,839 179,994 203,828 194,441 722,102 189,836 svcs Adjusted net sales by 2,407,193 569,699 696,206 712,374 628,935 2,607,214 590,446 707,352 775,011 727,812 2,800,621 727,418 product category BMC Stock gross profit 256,547 61,819 79,491 81,642 72,122 295,074 66,697 83,818 97,101 113,794 361,410 166,617 Pre-merger SBS gross 274,403 65,242 82,214 84,392 75,806 307,654 71,321 86,411 89,139 51,522 298,393 -profit Inventory step-up - - - - - - - - - 10,285 10,285 2,884 charges Adjusted gross profit 530,950 127,061 161,705 166,034 147,928 602,728 138,018 170,229 186,240 175,601 670,088 169,501 Adjusted gross 22.1% 22.3% 23.2% 23.3% 23.5% 23.1% 23.4% 24.1% 24.0% 24.1% 23.9% 23.3% margin % See Non-GAAP (Adjusted) Financial Measures page of this presentation for definition of Adjusted net sales, Adjusted gross profit and Adjusted EBITDA. 34
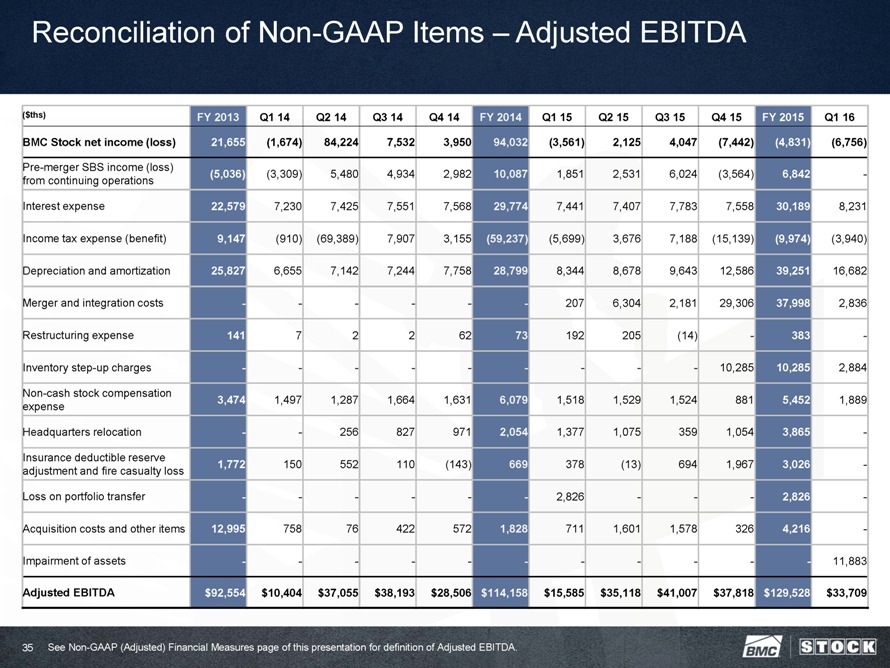
Reconciliation of Non-GAAP Items – Adjusted EBITDA ($ths) FY 2013 Q1 14 Q2 14 Q3 14 Q4 14 FY 2014 Q1 15 Q2 15 Q3 15 Q4 15 FY 2015 Q1 16 BMC Stock net income (loss) 21,655 (1,674) 84,224 7,532 3,950 94,032 (3,561) 2,125 4,047 (7,442) (4,831) (6,756) Pre-merger SBS income (loss) (5,036) (3,309) 5,480 4,934 2,982 10,087 1,851 2,531 6,024 (3,564) 6,842 -from continuing operations Interest expense 22,579 7,230 7,425 7,551 7,568 29,774 7,441 7,407 7,783 7,558 30,189 8,231 Income tax expense (benefit) 9,147 (910) (69,389) 7,907 3,155 (59,237) (5,699) 3,676 7,188 (15,139) (9,974) (3,940) Depreciation and amortization 25,827 6,655 7,142 7,244 7,758 28,799 8,344 8,678 9,643 12,586 39,251 16,682 Merger and integration costs - - - - - - 207 6,304 2,181 29,306 37,998 2,836 Restructuring expense 141 7 2 2 62 73 192 205 (14) - 383 - Inventory step-up charges - - - - - - - - - 10,285 10,285 2,884 Non-cash stock compensation 3,474 1,497 1,287 1,664 1,631 6,079 1,518 1,529 1,524 881 5,452 1,889 expense Headquarters relocation - - 256 827 971 2,054 1,377 1,075 359 1,054 3,865 -Insurance deductible reserve 1,772 150 552 110 (143) 669 378 (13) 694 1,967 3,026 -adjustment and fire casualty loss Loss on portfolio transfer - - - - - - 2,826 - - - 2,826 -Acquisition costs and other items 12,995 758 76 422 572 1,828 711 1,601 1,578 326 4,216 -Impairment of assets - - - - - - - - - - - 11,883 Adjusted EBITDA $92,554 $10,404 $37,055 $38,193 $28,506 $114,158 $15,585 $35,118 $41,007 $37,818 $129,528 $33,709 See Non-GAAP (Adjusted) Financial Measures page of this presentation for definition of Adjusted EBITDA. 35
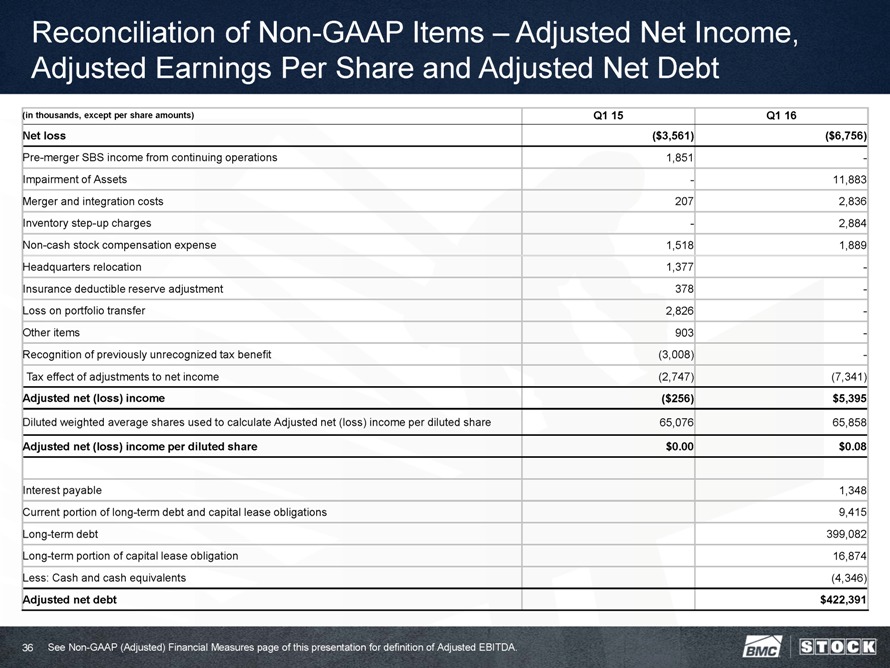
Reconciliation of Non-GAAP Items – Adjusted Net Income, Adjusted Earnings Per Share and Adjusted Net Debt (in thousands, except per share amounts) Q1 15 Q1 16 Net loss ($3,561) ($6,756) Pre-merger SBS income from continuing operations 1,851 -Impairment of Assets - 11,883 Merger and integration costs 207 2,836 Inventory step-up charges - 2,884 Non-cash stock compensation expense 1,518 1,889 Headquarters relocation 1,377 -Insurance deductible reserve adjustment 378 -Loss on portfolio transfer 2,826 -Other items 903 -Recognition of previously unrecognized tax benefit (3,008) -Tax effect of adjustments to net income (2,747) (7,341) Adjusted net (loss) income ($256) $5,395 Diluted weighted average shares used to calculate Adjusted net (loss) income per diluted share 65,076 65,858 Adjusted net (loss) income per diluted share $0.00 $0.08 Interest payable 1,348 Current portion of long-term debt and capital lease obligations 9,415 Long-term debt 399,082 Long-term portion of capital lease obligation 16,874 Less: Cash and cash equivalents (4,346) Adjusted net debt $422,391 See Non-GAAP (Adjusted) Financial Measures page of this presentation for definition of Adjusted EBITDA. 36