Attached files
| file | filename |
|---|---|
| EX-23.2 - EXHIBIT 23.2 - BMC STOCK HOLDINGS, INC. | kpmgconsent.htm |
| EX-23.1 - EXHIBIT 23.1 - BMC STOCK HOLDINGS, INC. | pwcconsent12-31x15.htm |
| EX-32.1 - EXHIBIT 32.1 - BMC STOCK HOLDINGS, INC. | stck-12312015xex321.htm |
| EX-31.1 - EXHIBIT 31.1 - BMC STOCK HOLDINGS, INC. | stck-12312015xex311.htm |
| EX-32.2 - EXHIBIT 32.2 - BMC STOCK HOLDINGS, INC. | stck-12312015xex322.htm |
| EX-31.2 - EXHIBIT 31.2 - BMC STOCK HOLDINGS, INC. | stck-12312015xex312.htm |
| EX-21.1 - EXHIBIT 21.1 - BMC STOCK HOLDINGS, INC. | bmcstocksubsidiaries.htm |
| EX-10.18 - EXHIBIT 10.18 - BMC STOCK HOLDINGS, INC. | wfcf_bmcstock-amendmentnum.htm |
UNITED STATES
SECURITIES AND EXCHANGE COMMISSION
Washington, D.C. 20549
_____________________________
Form 10-K
_____________________________
x ANNUAL REPORT PURSUANT TO SECTION 13 OR 15(d) OF THE SECURITIES EXCHANGE ACT OF 1934
For the fiscal year ended December 31, 2015
OR
o TRANSITION REPORT PURSUANT TO SECTION 13 OR 15(d) OF THE SECURITIES EXCHANGE ACT OF 1934
For the transition period from ___ to ___
Commission file number 001-36050
BMC Stock Holdings, Inc.
(Exact name of Registrant as specified in its charter)
Delaware | 26-4687975 |
(State or other jurisdiction of incorporation or organization) | (I.R.S. Employer Identification No.) |
Two Lakeside Commons 980 Hammond Drive NE, Suite 500 Atlanta, Georgia 30328 | |
(Address of principal executive offices, including zip code) | |
Registrant’s telephone number, including area code: (678) 222-1219
Securities registered pursuant to Section 12(b) of the Act:
Common stock, par value $0.01 per share | The NASDAQ Stock Market LLC | |
(Title of each class) | (Name of exchange on which registered) | |
Securities registered pursuant to Section 12(g) of the Act: None
Indicate by check mark if the registrant is a well-known seasoned issuer, as defined in Rule 405 of the Securities Act. Yes x No o
Indicate by check mark if the registrant is not required to file reports pursuant to Section 13 or 15(d) of the Act. Yes o No x
Indicate by check mark whether the registrant (1) has filed all reports required to be filed by Section 13 or 15(d) of the Securities Exchange Act of 1934 during the preceding 12 months, and (2) has been subject to such filing requirements for the past 90 days. Yes x No o
Indicate by check mark whether the registrant has submitted electronically and posted on its corporate Web site, if any, every Interactive Data File required to be submitted and posted pursuant to Rule 405 of Regulation S-T during the preceding 12 months (or for such shorter period that the registrant was required to submit and post such files). Yes x No o
Indicate by check mark if disclosure of delinquent filers pursuant to Item 405 of Regulation S-K (§ 229.405 of this chapter) is not contained herein, and will not be contained, to the best of registrant’s knowledge, in definitive proxy or information statements incorporated by reference in Part III of this Form 10-K or any amendment to this Form 10-K. o
Indicate by check mark whether the registrant is a large accelerated filer, an accelerated filer, a non-accelerated filer, or a smaller reporting company. See the definitions of “large accelerated filer,” “accelerated filer” and “smaller reporting company” in Rule 12b-2 of the Exchange Act.
Large accelerated filer | o | Accelerated filer | x |
Non-accelerated filer | o (Do not check if a smaller reporting company) | Smaller reporting company | o |
Indicate by check mark whether the registrant is a shell company (as defined in Rule 12b-2 of the Exchange Act). Yes o No x
The aggregate market value of the registrant’s common stock held by non-affiliates of the registrant as of June 30, 2015 was approximately $288.9 million based on the closing price per share on that date of $19.55 as reported on the NASDAQ Stock Market LLC.
The number of shares outstanding of the registrant’s common stock, par value $0.01 per share, at March 14, 2016 was 65,335,544 shares.
Documents Incorporated by Reference
Portions of the registrant's Proxy Statement for the 2016 Annual Meeting of Stockholders are incorporated herein by reference in Part III of this Annual Report on Form 10-K to the extent stated herein. Such proxy statement will be filed with the Securities and Exchange Commission within 120 days of the registrant's fiscal year ended December 31, 2015.
BMC STOCK HOLDINGS, INC. AND SUBSIDIARIES
Table of Contents to Form 10-K
Item 1. | ||
Item 1A. | ||
Item 1B. | ||
Item 2. | ||
Item 3. | ||
Item 4. | ||
Item 5 | ||
Item 6. | ||
Item 7. | ||
Item 7A. | ||
Item 8. | ||
Item 9. | ||
Item 9A. | ||
Item 9B. | ||
Item 10. | ||
Item 11. | ||
Item 12. | ||
Item 13. | ||
Item 14. | ||
Item 15. | ||
i
Cautionary Statement with Respect to Forward-Looking Statements
Some of the statements contained in this Annual Report on Form 10-K constitute forward-looking statements. Forward-looking statements relate to expectations, beliefs, projections, future plans and strategies, anticipated events or trends and similar expressions concerning matters that are not historical facts or present facts or conditions. In many cases, you can identify forward-looking statements by terms such as “may,” “will,” “should,” “expects,” “plans,” “anticipates,” “believes,” “estimates,” “predicts,” “potential” or the negative of these terms or other comparable terminology.
The forward-looking statements reflect our views about future events and are subject to risks, uncertainties, assumptions and changes in circumstances that may cause events or our actual activities or results to differ significantly from those expressed in any forward-looking statement. Although we believe that the expectations reflected in the forward-looking statements are reasonable, we cannot guarantee future events, results, actions, levels of activity, performance or achievements. A number of important factors could cause actual results to differ materially from those indicated by the forward-looking statements. These factors include without limitation:
• | the state of the homebuilding industry and repair and remodeling activity, the economy and the credit markets; |
• | seasonality and cyclicality of the building products supply and services industry; |
• | competitive industry pressures and competitive pricing pressure from our customers and competitors; |
• | inflation or deflation of prices of our products; |
• | our exposure to product liability, warranty, casualty, construction defect, contract, tort, employment and other claims and legal proceedings; |
• | our ability to maintain profitability; |
• | our concentration of business in the Texas, California and Georgia markets; |
• | the potential negative impacts from the recent significant decline in oil prices on employment, home construction and remodeling activity in Texas (particularly the Houston metropolitan area) and other markets dependent on the energy industry; |
• | our ability to retain our key employees and to attract and retain new qualified employees, while controlling our labor costs; |
• | product shortages, loss of key suppliers or failure to develop relationships with qualified suppliers, and our dependence on third-party suppliers and manufacturers; |
• | the implementation of our supply chain and technology initiatives; |
• | the impact of long-term non-cancelable leases at our facilities; |
• | our ability to effectively manage inventory and working capital; |
• | the credit risk from our customers; |
• | the impact of pricing pressure from our customers; |
• | our ability to identify or respond effectively to consumer needs, expectations or trends; |
• | our ability to successfully implement our growth strategy; |
• | the impact of federal, state, local and other laws and regulations; |
• | the potential loss of significant customers; |
• | natural or man-made disruptions to our distribution and manufacturing facilities; |
• | our exposure to environmental liabilities and subjection to environmental laws and regulation; |
• | cybersecurity risks; |
• | risks related to the integration of Building Materials Holding Corporation with and into our business and successful operation of the post-merger company; |
• | our ability to retain qualified employees following the merger with Building Materials Holding Corporation, while controlling labor costs; |
• | our ability to operate on multiple Enterprise Resource Planning ("ERP") information systems and the subsequent conversion to a single system; |
• | the impact of additional indebtedness assumed through the merger with Building Materials Holding Corporation; and |
• | the various financial covenants in our secured credit agreement and senior secured notes indenture. |
Certain of these and other factors are discussed in more detail in “Item 1A. Risk Factors” of this Annual Report on Form 10-K. The forward-looking statements included herein are made only as of the date of this Annual Report on Form 10-K and we undertake no obligation to publicly update or review any forward-looking statement made by us or on our behalf, whether as a result of new information, future developments, subsequent events or circumstances or otherwise.
1
PART I
Item 1. Business
Merger of Stock Building Supply Holdings, Inc. and Building Materials Holding Corporation
On December 1, 2015, Stock Building Supply Holdings, Inc. (“SBS”, “Legacy SBS”) completed a business combination with privately-held Building Materials Holding Corporation (“BMC”, "Legacy BMC") in accordance with the terms of the Agreement and Plan of Merger, dated as of June 2, 2015, by and between SBS and BMC (the “Merger Agreement”), pursuant to which BMC merged with and into SBS (the “Merger”). As a result of the business combination, SBS survived the Merger and in connection therewith changed its name to “BMC Stock Holdings, Inc.”
All references to “BMC Stock,” “we,” “us,” “our” or the “Company” in this Annual Report on Form 10-K mean BMC Stock Holdings, Inc.
Under generally accepted accounting principles in the United States, the Merger is treated as a “reverse merger” under the acquisition method of accounting. For accounting purposes, BMC is considered to have acquired SBS. Consequently, the historical financial statements of the Company reflect only the operations and financial condition of BMC. The operating results of SBS are reported as part of the Company beginning on the closing date of the Merger.
Overview
BMC Stock is a diversified lumber and building materials ("LBM") distributor and solutions provider that sells to new construction and repair and remodeling contractors. We carry a broad line of products and have operations in 17 states throughout the United States. Our primary products are lumber & lumber sheet goods, millwork, doors, flooring, windows, structural components such as engineered wood products ("EWP"), trusses and wall panels and other exterior products. Additionally, we provide solution-based services to our customers, including design, product specification, installation, and installation management services. We serve a broad customer base, including large-scale production homebuilders, custom homebuilders and repair and remodeling contractors. We offer a broad range of products sourced through a strategic network of suppliers, which together with our various solution-based services, represent approximately 50% of the construction cost of a typical new home.
The 17 states in which we operate accounted for approximately 63% of 2015 U.S. single-family housing permits according to the U.S. Census Bureau. Our primary operating regions include the South and West regions of the United States (as defined by the U.S. Census Bureau), with a significant portion of our net sales derived from markets within Texas, California and Georgia. We serve our customers from 147 locations, which include 91 distribution and retail operations, 47 millwork fabrication operations, 35 structural components fabrication operations and 13 flooring operations. Given the local nature of our business, we locate our facilities in close proximity to our key customers and often co-locate multiple operations in one facility to increase customer service and efficiency.
The Company is a Delaware corporation and its common stock is listed on the NASDAQ Stock Market under the ticker symbol “STCK.”
Our Industry
The LBM distribution industry in the United States is highly fragmented, with a number of retailers and distributors offering a broad range of products and services. Demand for our products is principally influenced by new residential construction, residential repair and remodeling activity and multi-family construction.
According to the U.S. Census Bureau, from 2005 to 2011, single-family housing starts in the United States declined by approximately 75% to 0.43 million, which was significantly less than the 50-year average rate of approximately 1.0 million per year. Following several challenging years, single-family housing starts increased in 2012, 2013, 2014 and 2015 to 0.54 million, 0.62 million, 0.65 million and 0.71 million, respectively, and, as a result, demand for the products we distribute and for our services has also increased. As of December 2015, McGraw-Hill Construction forecasts that U.S. single-family housing starts will increase to 0.81 million in 2016. Additionally, the S&P / Case-Shiller Index, a leading measure of pricing for the U.S. residential housing market, has increased on a year-over-year basis for 44 straight months as of December 2015 and during 2015, the index reached its highest levels since late 2007.
2
The products we distribute are also used in professional remodeling and home improvement projects. As of September 2015, the Home Improvement Research Institute ("HIRI") estimated 2015 U.S. sales of home maintenance, repair and improvement products to the professional market were $85.7 billion, compared to $78.9 billion and $82.2 billion for 2013 and 2014, respectively. Several factors, including the overall age of the U.S. housing stock, rising home prices, availability of consumer capital at historically low interest rates and focus on energy efficiency may drive long-term growth in repair and remodeling expenditures. As of September 2015, HIRI estimated U.S. sales of home maintenance, repair and improvement products to the professional market will grow at a rate of 4.5% in 2016.
According to the U.S. Census Bureau, multi-family housing starts in the United States reached a low of 0.11 million in 2009, but have increased to 0.40 million, 0.36 million and 0.31 million in 2015, 2014 and 2013, respectively. Vacancy rates for rental properties with two or more units reached 11.3% in 2009, and have declined to 7.2%, 7.9% and 8.8% in 2015, 2014 and 2013, respectively. As of December 2015, McGraw-Hill Construction forecasts multi-family housing starts will increase approximately 5% in 2016.
Our Strategy
Expand our business with existing customers by investing in value-added products and services
We plan to continue to grow our net sales by increasing our share of our existing customers’ business. By growing our scale and expanding the products and services we offer in each of our local markets, we believe that we can continue to enhance the value offering for, and relationships with, our existing customers and grow our revenues and profitability. Products and services we intend to expand organically include millwork and structural components manufacturing, Ready-Frame® pre-cut framing packages, enhanced specification, showroom and design services. Additionally, we intend to use our eBusiness solutions to improve customer service, reduce waste and improve productivity. By continuing to invest systematically in our core LBM capabilities and in technologies that streamline our processes and improve customer service, we believe we can provide a broader range of products and services at each of our locations and that more customers will look to us as the key solutions provider for their building needs.
Focus on improving customer service, productivity and operational excellence as our business grows
We have developed a talent training and development program focused on specific skills training, business development and operational productivity initiatives. Using these skills, our market managers, division management and senior leadership team examine customer service, operating and financial metrics and use this information to increase customer service and operating expense productivity. Our management team has also implemented, and will continue to pursue, LEAN business practices to increase productivity and identify opportunities for continuing improvement.
We currently operate two primary ERP systems across the significant majority of our branches, and we continue to focus on the use of technology to improve customer service and productivity. This includes an integrated logistics software module used by Legacy SBS operations that schedules orders from the Legacy SBS ERP system for delivery, utilizes GPS and mobile technology in our delivery fleet and provides customers with real-time information on their order status, including notification and pictures of completed deliveries. We are evaluating the implementation of similar logistics technology at our Legacy BMC locations. We are also currently piloting transactional eCommerce capabilities in several markets and a new Legacy BMC ERP technology, with plans to introduce these capabilities to additional markets in 2016. As our Merger integration activities progress, we intend to integrate and upgrade our existing ERP platforms to standardize our processes and introduce new customer service and productivity tools across our branch network.
Expand in existing, adjacent and new geographies
We also plan to expand our business through organic means. We intend to expand our reach and service capabilities in our current metropolitan areas by opening new locations, relocating facilities as needed and increasing capacity at existing facilities. In addition, while we have operations in 17 states that accounted for approximately 63% of 2015 U.S. single-family housing permits, our markets within those states accounted for approximately half of those permits according to the U.S. Census Bureau, providing significant opportunity for growth into markets adjacent to our current markets within these states. Growth opportunities also exist through increasing net sales to residential remodeling, multi-family and light commercial contractors.
Selectively pursue strategic acquisitions
We also plan to expand our business through acquisitive means, provided those opportunities help to accelerate the execution of our strategic plan. We intend to pursue additional acquisition opportunities in markets adjacent to our existing operations or
3
acquisitions that enhance our presence and capabilities in our 42 existing metropolitan areas. Additionally, we will consider acquiring operations or companies to enter new geographic regions.
On May 1, 2015, Legacy BMC acquired Vidalia, Georgia-based VNS Corporation ("VNS"), which generated net sales of $134.2 million for its year ended on March 31, 2015. The VNS acquisition enabled us to expand our operational footprint and product offerings in the southeastern United States while also retaining an experienced local management team capable of leveraging our corporate capabilities to drive additional growth. On September 1, 2015, Legacy BMC purchased certain assets and assumed certain liabilities of Marietta, Georgia-based Robert Bowden Inc. ("RBI"), which generated net sales of $77.9 million for the year ended December 31, 2014. RBI has three locations in the Atlanta, Georgia area, including its manufacturing facility in Marietta, and sells millwork and window products to homebuilders and residential contractors.
Our Customers
We serve a broad customer base that includes a mix of large-scale production homebuilders, custom homebuilders and repair and remodeling contractors. We serve 42 metropolitan areas in 17 states. Approximately 63% of U.S. housing permits in 2015 were issued in states in which we operate.
Our largest 10 customers accounted for approximately 20% of our 2015 net sales, with no single customer accounting for more than 5% of our 2015 net sales. Our largest customers are comprised primarily of the large production homebuilders, including publicly traded companies such as D.R. Horton, Inc., KB Home, Inc., Lennar Corporation, PulteGroup, Inc. and Toll Brothers, Inc. In addition to these large production homebuilders, we also service and supply regional and local custom homebuilders. Our capabilities allow us also to serve residential remodeling contractors, multi-family and light commercial contractors in most of our markets.
Our Products and Services
We provide a wide variety of building products and services directly to homebuilder and professional contractor customers. We offer a broad range of products sourced through a network of suppliers with whom we have strategic supplier agreements. These products are available through our distribution locations and, in most instances, delivered to the job site. We manufacture floor trusses, roof trusses, wall panels, stairs, specialty millwork, windows and pre-hung doors. We also provide an extensive range of installation services and special order products.
We group our building products and services into four product categories: (i) structural components, (ii) lumber & lumber sheet goods, (iii) millwork, windows & doors, and (iv) other building products & services. For the year ended December 31, 2015, our sales of structural components and millwork, windows & doors products represented 44% of net sales. Each of these categories includes both manufactured and distributed products. Products in these categories typically carry a higher gross margin and provide us with opportunities to cross-sell other products and services.
Structural components. Structural components are factory-built substitutes for job-site framing and include floor trusses, roof trusses, wall panels, and EWP that in many cases we design and cut for each home. Roof trusses, floor trusses and wall panels are built in a factory controlled environment. Engineered floors and beams are cut to the required size and packaged for the given application at many of our locations. Without structural components, builders construct these items on site, where weather and variable labor quality can negatively impact construction cost, quality and installation time.
In addition to increased efficiency and improved quality, a primary benefit of using structural components is shortening cycle time from start to completion, eliminating job-site waste and clutter and minimizing the amount of skilled labor that must be sourced for a job site.
Lumber & lumber sheet goods. Lumber & lumber sheet goods include dimensional lumber, plywood and oriented strand board ("OSB") products used in on-site house framing. We have developed several proprietary capabilities to design, pre-cut, label and bundle lumber and lumber sheet goods into customized framing packages, which we have branded Ready-Frame®.
Millwork, windows & doors. The millwork, windows & doors products category includes interior and exterior doors, windows, interior trim, custom millwork, moldings, stairs and stair parts, and cabinetry, among other products. We pre-hang interior and exterior doors in many of our markets, which consists of attaching hinges and door jambs to a door slab, thereby reducing on-site installation time and providing a higher quality finished door unit than those constructed on site. Selecting, designing and managing the procurement of the proper window package for performance and architectural reasons is a key service provided by our employees.
4
Other building products & services. Other building products & services consist of various products, including hardware, wood boards, gypsum, insulation, roofing, siding and flooring. This category also includes design assistance and professional installation services of products spanning most of our product categories. Through our installation services program, we offer scheduling, supplier and subcontractor management, and other services to many of our customers. We also provide professional estimating, product advisory and product display services that assist homebuilders and their clients in selecting the appropriate mix of products to meet their needs.
Manufacturing
Our manufacturing facilities and related design capabilities are utilized to improve quality, cost and service to our homebuilder and repair and remodeling customers. We utilize specialized assembly and manufacturing technology and various design software packages in our manufacturing and assembly activities. We manufacture and assemble products within two of our product categories: structural components and millwork, windows & doors.
Sales and Marketing
We seek to attract and retain customers through customer service, product quality, a range of product and service offerings and competitive pricing. This strategy is centered on building and maintaining strong customer relationships. We strive to add value for homebuilders through solution-based selling, improved product selection and procurement processes, lower material costs and general project coordination and support.
Our experienced sales and service professionals advise the homebuilder or contractor in areas such as opportunities for cost optimization, increased building or project efficiencies, new products and regional product preferences. The team coordinates with the customer a sequence of site deliveries. Our large delivery fleet and inventory management systems enable us to provide “just-in-time” product delivery. We believe this level of service is valued by our customers and generates customer loyalty. At January 31, 2016, we employed approximately 1,000 sales professionals.
Materials and Supplier Relationships
We purchase inventory primarily for distribution, some of which is also utilized in our manufacturing plants. The key materials we purchase include dimensional lumber, OSB, EWP, windows, doors and millwork. Our largest suppliers are national lumber and wood products producers and distributors such as American International Forest Products, LLC, BlueLinx Holdings Inc., Boise Cascade Company, Canfor Corporation, Interfor US Inc., Hampton Lumber, LP, Norbord Inc. and Weyerhaeuser Company and building products manufacturers such as James Hardie, JELD-WEN, Inc., Metrie, Inc., MI Windows and Doors, Inc., Masonite Corp. and Marvin Windows. We believe there is sufficient supply in the marketplace to source most of our requirements without reliance on any particular supplier and that our diversity of suppliers affords us purchasing flexibility. We also work with our suppliers to ensure that we have sufficient adaptability and flexibility to service our customers' needs as they evolve and as their markets grow. For certain customers, we institute purchasing programs on raw materials such as OSB to align portions of our procurement costs with our customer pricing commitments. We balance our lumber and OSB purchases with a mix of contract and spot market purchases to ensure consistent quantities of product necessary to fulfill customer contracts, to source products at the lowest possible cost and to minimize our exposure to the volatility of commodity lumber prices.
We currently source products from over 1,000 suppliers in order to reduce our dependence on any single company and to maximize purchasing leverage. Although one supplier accounted for more than 10% of our total materials purchases in 2015 on a pro forma basis, including purchases by Legacy SBS, we believe we are one of the largest customers for many of our suppliers, and therefore have significant purchasing leverage.
We seek to maintain strong relationships with our suppliers and we believe opportunities exist to improve purchasing terms in the future, including inventory storage or “just-in-time” delivery to reduce our inventory carrying costs.
Competition
We compete in the professional building contractor segment of the U.S. residential new construction building products supply market (the “Pro Segment”). Our customers primarily consist of professional homebuilders and those that provide construction
5
services to them. We focus on a distinctly different target market than home center retailers such as The Home Depot and Lowe’s, which primarily serve do-it-yourself and remodeling customers. The principal methods of competition in the Pro Segment are developing long-term relationships with professional builders and retaining such customers by delivering a full range of high-quality products on time and offering trade credit, competitive pricing, flexibility in transaction processing, and integrated service and product packages, as well as offering value-added products and services such as structural components and installation. Our market positions in the highly competitive Pro Segment create economies of scale that allow us to supply our customers cost-effectively, which both enhances profitability and reduces the risk of losing customers to competitors.
We have and will continue to experience competition for homebuilder business. Many of our competitors are predominantly small, privately owned companies, local and regional materials distributors, single or multi-site lumberyards, and truss manufacturing and millwork operations. Most of these companies have limited access to capital and lack sophisticated IT systems and large-scale procurement capabilities. We believe we have substantial competitive advantages over these smaller competitors due to our long-standing customer relationships, local market knowledge, integrated supply chain and competitive pricing. We also face competition from large national lumber and building materials companies. For example, our largest competitors in our local markets often include one or more of 84 Lumber Co., Builders FirstSource, Inc., and US LBM Holdings, LLC. Some of our competitors are larger than we are and may have greater financial resources. These resources may afford those competitors greater purchasing power, increased financial flexibility and more capital resources for expansion and improvement.
Employees
At January 31, 2016, we had approximately 9,600 full-time equivalent employees, 195 of whom were represented by a union. We believe that we have good relations with our employees.
Seasonality and Other Factors
Our first and fourth quarters have historically been, and are generally expected to continue to be, adversely affected by weather patterns in some of our markets, causing reduced construction activity. In addition, quarterly results historically have reflected, and are expected to continue to reflect, fluctuations from period to period arising from the following:
• | the volatility of lumber prices; |
• | the cyclical nature of the homebuilding industry; |
• | general economic conditions in the markets in which we compete; |
• | the pricing policies of our competitors; |
• | the production schedules of our customers; and |
• | the effects of weather. |
History
SBS’s predecessor was founded as Carolina Builders Corporation in Raleigh, North Carolina in 1922 and began operating under the Stock Building Supply name in 2003. In addition, certain companies acquired by SBS were founded as early as 1822. On August 14, 2013, SBS completed its initial public offering ("IPO").
BMC was created in 1987 and initially operated approximately 20 lumber and building material distribution facilities located in the West. The company has since grown primarily through acquisition and has expanded its footprint throughout the South and West regions of the United States.
On December 1, 2015, SBS and BMC completed the Merger, with SBS surviving the Merger. In connection with the Merger, SBS was renamed BMC Stock Holdings, Inc.
Intellectual Property
We possess an array of intellectual property rights, including patents, trademarks, trade names, proprietary technology and know-how and other proprietary rights that are important to our brand and marketing strategy. In particular, we maintain registered trademarks for Stock Building Supply® and BMC® and the Stock Building Supply and BMC logos, Fortis® and Artrim®, two of our private label lines and our Ready-Frame® system. In addition, we maintain registered trademarks for the trade names under
6
which many of our local branches operate. While we do not believe our business is dependent on any one of our trademarks, we believe that our trademarks are important to the development and conduct of our business as well as the marketing of our products. We vigorously protect all of our intellectual property rights.
Regulation and Legislation
We are subject to various federal, state and local government regulations applicable to the business generally in the jurisdictions in which we operate, including laws and regulations relating to our relationships with our employees, public health and safety, work place safety, transportation, zoning, business, environmental, contractor licensing and fire codes. We strive to operate each of our distribution, manufacturing, retail and service facilities in accordance with applicable laws, codes and regulations.
Our operations in domestic interstate commerce are subject to the regulatory jurisdiction of the Department of Transportation ("DOT"), which has broad administrative powers with respect to our transportation operations. We are subject to safety requirements governing interstate operations prescribed by the DOT. Vehicle dimensions and driver hours of service also are subject to both federal and state regulation. Our operations are also subject to the regulatory jurisdiction of the Occupational Safety and Health Administration ("OSHA"), which has broad administrative powers with respect to workplace and jobsite safety.
Our operations and properties are also subject to federal, state and local laws and regulations relating to the use, storage, handling, generation, transportation, treatment, emission, release, discharge and disposal of hazardous materials, substances and wastes and relating to the investigation and cleanup of contaminated properties, including off-site disposal locations. We have not incurred material costs in the past to comply with environmental laws and regulations. However, we could be subject to material costs, liabilities or claims relating to environmental compliance in the future, especially in the event of changes in existing laws and regulations or in their interpretation or enforcement.
As current and former owners, lessees and operators of real property, we can be held liable for the investigation or remediation of contamination on or from such properties, in some circumstances regardless of whether we knew of or caused such contamination. Our current expenditures with respect to environmental investigation and remediation at our facilities are immaterial, although no assurance can be provided that more significant investigation and remediation will not be required in the future as a result of spills or releases of petroleum products or other hazardous substances or the discovery of currently unknown environmental conditions, or changes in legislation, laws, rules or regulations or their interpretation or enforcement.
Our suppliers are subject to various laws and regulations, including in particular laws and regulations regulating labor, forestry and the environment. We consult with our suppliers as appropriate to confirm they have determined they are in material compliance with applicable laws and regulations. Generally, our suppliers agree contractually to comply with our expectations concerning environmental, labor and health and safety matters.
Products that we import into the United States are subject to laws and regulations imposed in conjunction with such importation, including those issued and/or enforced by U.S. Customs and Border Protection. In addition, certain of our products are subject to laws and regulations relating to the importation, acquisition or sale of illegally harvested agricultural products and the emissions of hazardous materials. We work closely with our suppliers to help ensure material compliance with the applicable laws and regulations in these areas.
To date, costs to comply with applicable laws and regulations relating to the protection of the environment and natural resources have not had a material adverse effect on our financial condition or operating results. However, there can be no assurance that such laws and regulations will not become more stringent in the future or that we will not incur costs in the future in order to comply with such laws and regulations. We did not incur material capital expenditures for environmental controls in fiscal year 2015 and do not anticipate material capital expenditures in this regard in fiscal year 2016.
Available Information
We are subject to the informational requirements of the Securities Exchange Act of 1934, as amended, and in accordance therewith, we file reports, proxy and information statements and other information with the Securities and Exchange Commission (“SEC”). Our annual reports on Form 10-K, quarterly reports on Form 10-Q, current reports on Form 8-K, proxy and information statements and other information and amendments to those reports filed or furnished pursuant to Section 13(a) or 15(d) of the Securities Exchange Act of 1934 are, or will be, available through the investor relations section of our website under the links to “SEC Filings.” Our investor relations Internet address is www.ir.bmcstock.com. Reports are available on our website free of charge as soon as reasonably practicable after we electronically file them with, or furnish them to, the SEC. In addition, our directors and certain senior officers are required to file with the SEC initial statements of beneficial ownership and statements of change in beneficial ownership of our securities, which are also available on our website at the same location. The information on the respective websites of the Company, its subsidiaries or affiliates is not, and shall not be deemed to be a part of this Annual Report on Form 10-K or incorporated into any other filings the Company makes with the SEC.
7
In addition to our website, you may read and copy public reports we file with or furnish to the SEC at the SEC’s Public Reference Room at 100 F Street, N.E., Washington, DC 20549. You may obtain information on the operation of the Public Reference Room by calling the SEC at 1-800-SEC-0330. The SEC maintains an Internet site that contains our reports, proxy and information statements, and other information that we electronically file with, or furnish to, the SEC at www.sec.gov.
8
Item 1A. Risk Factors
Risks Related to Our Business
The industry in which we operate is dependent upon the homebuilding industry and repair and remodeling activity, the economy, the credit markets and other important factors.
The building products supply and services industry is highly dependent on new home construction and repair and remodeling activity, which in turn are dependent upon a number of factors, including interest rates, consumer confidence, employment rates, wage rates, foreclosure rates, housing inventory levels, housing demand, the availability of land, local zoning and permitting processes, the availability of construction financing and the health of the economy and mortgage markets. Unfavorable changes in demographics, credit markets, consumer confidence, health care costs, housing affordability, housing inventory levels, a weakening of the national economy or of any regional or local economy in which we operate and other factors beyond our control could adversely affect consumer spending, result in decreased demand for homes and adversely affect our business.
The homebuilding industry underwent a significant downturn that began in mid-2006 and began to stabilize in late 2011. The downturn in the homebuilding industry resulted in a substantial reduction in demand for our products and services, which in turn had a significant adverse effect on our business during fiscal years 2007 through 2012. The U.S. Census Bureau reported approximately 715,000 single-family housing starts for 2015, which is an increase of approximately 10% from 2014, but still well below historical averages over the past 50 years. There is significant uncertainty regarding the timing and extent of any recovery in construction and repair and remodeling activity and resulting product demand levels. The positive impact of a recovery on our business may also be dampened to the extent the average selling price or average size of new single family homes decreases, which could cause homebuilders to decrease spending on our products and services.
In addition, beginning in 2007, the mortgage markets experienced substantial disruption due to increased defaults, primarily as a result of credit quality deterioration. The disruption resulted in a stricter regulatory environment and reduced availability of mortgages for potential home buyers due to a tight credit market and stricter standards to qualify for mortgages. Mortgage financing and commercial credit for smaller homebuilders, as well as for the development of new residential lots, continue to be constrained. As the housing industry is dependent upon the economy as well as potential homebuyers’ access to mortgage financing and homebuilders’ access to commercial credit, it is likely that the housing industry will not fully recover until conditions in the economy and the credit markets improve. Prolonged weakness in the homebuilding industry would have a significant adverse effect on our business, financial condition and operating results.
As a result of the homebuilding industry downturn, there has been a trend of significant consolidation as smaller, private homebuilders have gone out of business. We refer to the large homebuilders as “production homebuilders.” While we generate significant business from these homebuilders, our gross margins on sales to them tend to be lower than our gross margins on sales to other market segments. This could impact our gross margins as homebuilding recovers if the market share held by the production homebuilders increases.
Changes in federal income tax laws may also affect demand for new homes. Various proposals have been publicly discussed to limit mortgage interest deductions and to limit the exclusion of gain from the sale of a principal residence. Enactment of such proposals may have an adverse effect on the homebuilding industry in general. No meaningful prediction can be made as to whether any such proposals will be enacted and, if enacted, the particular form such laws would take. Because we have substantial fixed costs, relatively modest declines in our customers’ production levels could have a significant adverse effect on our financial condition, operating results and cash flows.
The building products supply and services industry is seasonal and cyclical.
Our industry is seasonal. Although weather patterns affect our operating results throughout the year, our first and fourth quarters have historically been, and are generally expected to continue to be, adversely affected by weather patterns in some of our markets, causing reduced construction activity. To the extent that hurricanes, severe storms, earthquakes, floods, fires, droughts, other natural disasters or similar events occur in the markets in which we operate, our business may be adversely affected.
The building products supply and services industry is also subject to cyclical market pressures. Quarterly results historically have reflected, and are expected to continue to reflect, fluctuations from period to period arising from the following: the volatility of lumber prices; the cyclical nature of the homebuilding industry; general economic conditions in the markets in which we compete; the pricing policies of our competitors and the production schedules of our customers.
9
Our industry is highly fragmented and competitive, and increased competitive pressure may adversely affect our results.
The building products supply and services industry is highly fragmented and competitive. We face significant competition from local, regional and national building materials chains, as well as from privately-owned single site enterprises. Any of these competitors may (i) foresee the course of market development more accurately than we do, (ii) provide superior service and sell superior products, (iii) have the ability to produce or supply similar products and services at a lower cost, (iv) develop stronger relationships with our customers, (v) adapt more quickly to new technologies or evolving customer requirements than we do, (vi) develop a superior branch network in our markets or (vii) have access to financing on more favorable terms that we can obtain. As a result, we may not be able to compete successfully with them. In addition, home center retailers, which have historically concentrated their sales efforts on retail consumers and small contractors, may in the future intensify their marketing efforts to professional homebuilders. Furthermore, certain product manufacturers sell and distribute their products directly to production homebuilders. The volume of such direct sales could increase in the future. Additionally, manufacturers and specialty distributors who sell products to us may elect to sell and distribute directly to homebuilders in the future or enter into exclusive supplier arrangements with other distributors. Consolidation of production homebuilders may result in increased competition for their business. Finally, we may not be able to maintain our operating costs or product prices at a level sufficiently low for us to compete effectively. If we are unable to compete effectively, our financial condition, operating results and cash flows may be adversely affected.
Certain of our products are commodities and fluctuations in prices of these commodities could affect our operating results.
Many of the building products we distribute, including OSB, plywood, lumber and particleboard, are commodities that are widely available from other manufacturers or distributors with prices and volumes determined frequently based on participants’ perceptions of short-term supply and demand factors. A shortage of capacity or excess capacity in the industry can result in significant increases or declines in market prices for those products, often within a short period of time.
Prices of commodity products can also change as a result of national and international economic conditions, labor and freight costs, competition, market speculation, government regulation and trade policies, as well as from periodic delays in the delivery of lumber and other products. Short-term changes in the cost of these materials, some of which are subject to significant fluctuations, are sometimes passed on to our customers but our pricing quotation periods and pricing pressure from our competitors may limit our ability to pass on such price changes. For example, we frequently enter into extended pricing commitments, which may compress our gross margins in periods of inflation. At times, the price at which we can charge our customers for any one or more products may even fall below the price at which we can purchase such products, requiring us to incur short-term losses on product sales. We may also be limited in our ability to pass on increases in freight costs on our products due to the price of fuel.
Periods of generally increasing prices provide the opportunity for higher sales and increased gross profit (subject to the extended pricing commitments described above), while generally declining price environments may result in declines in sales and profitability. In particular, low market prices for wood products over a sustained period can adversely affect our financial condition, operating results and cash flows, as can excessive spikes in market prices. While we experienced increasing prices from 2011 to 2013 as the homebuilding market recovered, prices have generally decreased for the last two years. For the year ended December 31, 2015, average composite framing lumber prices and average composite structural panel prices (a composite calculation based on index prices for OSB and plywood) as reported by Random Lengths were 14% and 5% lower, respectively, than the prior year. Our lumber & lumber sheet goods product category represented approximately 29% of net sales in 2015. If lumber or structural panel prices were to decline significantly from current levels, our sales and profits would be negatively affected.
We are exposed to product liability, warranty, casualty, construction defect, contract, tort, employment and other claims and legal proceedings related to our business, products and services as well as services provided for us through third parties.
We are from time to time involved in product liability, warranty, casualty, construction defect, contract, tort, employment and other claims relating to our business, the products we manufacture, distribute or install, and services we provide, either directly or through third parties, that, if adversely determined, could adversely affect our financial condition, operating results and cash flows if we were unable to seek indemnification for such claims or were not adequately insured for such claims. We rely on manufacturers and other suppliers to provide us with many of the products we sell, distribute or install. Because we do not have direct control over the quality of such products manufactured or supplied by such third-party suppliers, we are exposed to risks relating to the quality of such products. In addition, we are exposed to potential claims arising from the conduct of our employees, homebuilders and their subcontractors, and third-party installers for which we may be liable. We and they are subject to regulatory requirements and risks applicable to general contractors, which include management of licensing, permitting and quality of our third-party installers. If we fail to manage these processes effectively or provide proper oversight of these services, we could suffer lost sales, fines and lawsuits, as well as damage to our reputation, which could adversely affect our business.
10
Although we currently maintain what we believe to be suitable and adequate insurance in excess of our self-insured amounts, there can be no assurance that we will be able to maintain such insurance on acceptable terms or that such insurance will provide adequate protection against potential liabilities. Product liability, warranty, casualty, construction defect, contract, tort, employment and other claims can be expensive to defend and can divert the attention of management and other personnel for significant periods, regardless of the ultimate outcome. Claims of this nature could also have a negative impact on customer confidence in our products and our Company. We cannot assure you that any current or future claims will not adversely affect our financial condition, operating results and cash flows.
We may be unable to achieve profitability or maintain positive cash flows from operations.
We have set goals to achieve and progressively improve our profitability over time by growing our sales, increasing our gross margin and reducing our expenses as a percentage of sales. For the fiscal year ended 2015 we had a net loss of $4.8 million, which included $23.0 million of Merger-related costs, and cash provided by operations of $0.7 million. For the fiscal year ended 2014 we had net income of $94.0 million, which included a $76.1 million gain related to the reversal of tax valuation allowances, and cash provided by operations of $30.7 million. There can be no assurance that we will achieve our profitability goals or continue to generate positive cash flow from operations. Factors that could significantly adversely affect our efforts to achieve these goals include, but are not limited to, the failure to:
• | integrate BMC into the Company successfully (see “Risks Related to the Merger with Building Materials Holding Corporation” below for risk factors related to the Merger; |
• | grow our revenue through organic growth or through acquisitions; |
• | improve our revenue mix by investing (including through acquisitions) in businesses that provide higher gross margins than we have been able to generate historically; |
• | achieve improvements in purchasing or maintain or increase our rebates from suppliers through our supplier consolidation and/or low-cost country initiatives; |
• | improve our gross margins through the utilization of improved pricing practices and technology and sourcing savings; |
• | maintain or reduce our overhead and support expenses as we grow; |
• | effectively evaluate future inventory reserves; |
• | collect monies owed from customers; |
• | maintain relationships with our significant customers; and |
• | integrate any businesses acquired. |
Any of these failures or delays may adversely affect our ability to increase our profitability.
Homebuilding activities in Texas, California and Georgia have a large impact on our results of operations because we conduct a significant portion of our business in markets within these states.
We presently conduct a significant portion of our business in Texas, California and Georgia, which represented approximately 34%, 13% and 13%, respectively, of 2015 total net sales on a pro forma basis, including pre-acquisition sales of Legacy SBS, VNS and RBI. Home prices and sales activities in these markets and in most of the other markets in which we operate have declined from time to time, particularly as a result of slow economic growth. In the last several years, many of these markets have benefited from better than average employment growth, which has aided homebuilding activities, but we cannot assure you that these conditions will continue. Local economic conditions can depend on a variety of factors, including national economic conditions, local and state budget situations and the impact of cutbacks in federal spending and employment. In addition, the recent significant decline in oil prices may negatively impact home construction and remodeling activity in Texas (particularly the Houston metropolitan area which accounted for 15% of our 2015 total net sales on a pro forma basis, including pre-acquisition sales of Legacy SBS, VNS and RBI) and other markets with significant employment in the energy sector. Such a reduction in construction and remodeling activities could negatively impact our operating results in those markets in the future. If homebuilding activity declines in one or more of the markets in which we operate, our costs may not decline at all or at the same rate and therefore may negatively impact our operating results.
Because our operations are currently concentrated in these areas, a prolonged economic downturn in the future in one or more of these areas or a particular industry that is fundamental to one of these areas, particularly within Texas, could have a material adverse effect on our business, prospects, liquidity, financial condition and results of operations, and a disproportionately greater impact on us than other lumber and building material companies with more diversified operations. To the extent the oil and gas industries, which can be very volatile, are negatively impacted by declining commodity prices, climate change, legislation or other factors,
11
a result could be a reduction in employment, or other negative economic consequences, which in turn could adversely impact home sales and activities in Texas and certain of our other markets.
Our continued success will depend on our ability to retain our key employees and to attract and retain new qualified employees, while controlling our labor costs.
Our success depends in part on our ability to attract, hire, train and retain qualified managerial, operational, sales and other personnel, while at the same time controlling our labor costs. We face significant competition for these types of employees in our industry and from other industries. Labor shortages may impact our ability to hire skilled or unskilled workers with experience in carpentry, construction or fabrication. We may be unsuccessful in attracting and retaining the personnel we require to conduct and expand our operations successfully. In addition, key personnel, including sales force employees with key customer relationships, may leave us and compete against us. Our success also depends to a significant extent on the continued service of our senior management team. Our officers and divisional vice presidents have over 200 years of combined experience in manufacturing, distribution, retail and homebuilding, and have been integral to our successful acquisition and integration of businesses to gain scale in our current markets. The loss of any member of our senior management team or other experienced, senior employees or sales force employees could impair our ability to execute our business plan, cause us to lose customers and reduce our net sales, or lead to employee morale problems and/or the loss of other key employees. In any such event, our financial condition, operating results and cash flows could be adversely affected.
Our ability to control labor costs is subject to numerous external factors, including prevailing wage rates, the impact of legislation or regulations governing wages, regulations governing payment of workers on a "piece-work" or "piece-rate" basis (i.e., by measurable work completed) instead of by the hour, labor relations, healthcare benefits, and health and other insurance costs. In addition, we compete with other companies for many of our employees in hourly and piece-rate positions, and we invest significant resources in training and motivating them to maintain a high level of job satisfaction. These positions have historically had high turnover rates, which can lead to increased training and retention costs. If we are unable to attract or retain highly qualified employees in the future, it could adversely impact our operating results.
Moreover, our employees may experience uncertainty about their future role with the Company in light of the recent Merger until, or even after, strategies with regard to the Company are announced or executed. These factors may adversely affect our ability to retain, motivate and recruit executives and other key employees and keep them focused on applicable strategies and goals. Our failure to attract, retain and motivate executives and other key employees during the post-Merger integration period could have a negative impact on our business.
Product shortages, loss of key suppliers or failure to develop relationships with qualified suppliers, and our dependence on third-party suppliers and manufacturers could affect our financial health.
Our ability to offer a wide variety of products to our customers is dependent upon our ability to obtain adequate product supply from manufacturers and other suppliers. Generally, our products are obtainable from various sources and in sufficient quantities. Our ability to continue to identify and develop relationships with qualified suppliers who can satisfy our high standards for quality and our need to access products in a timely and efficient manner is a significant challenge. Our ability to access products also can be adversely affected by the financial instability of suppliers (particularly in light of continuing economic difficulties in various regions of the United States and the world), suppliers’ noncompliance with applicable laws, supply disruptions, shipping interruptions or costs, and other factors beyond our control. The loss of, or a substantial decrease in the availability of, products from our suppliers or the loss of key supplier arrangements could adversely impact our financial condition, operating results and cash flows.
Although in many instances we have agreements with our suppliers, these agreements are generally terminable by either party on limited notice. Many of our suppliers also offer us favorable terms based on the volume of our purchases. If market conditions change, suppliers may stop offering us favorable terms. Failure by our suppliers to continue to supply us with products on favorable terms, commercially reasonable terms, or at all, could put pressure on our operating margins or have a material adverse effect on our financial condition, operating results and cash flows.
A portion of the workforces of many of our suppliers, particularly our foreign suppliers, are represented by labor unions. Workforce disputes at these suppliers may result in work stoppages or slowdowns. Such disruptions could have a material adverse effect on these suppliers ability to continue meeting our needs.
12
The implementation of our supply chain and technology initiatives could disrupt our operations, and these initiatives might not provide the anticipated benefits or might fail.
We have made, and we plan to continue to make, significant investments in our supply chain and technology. These initiatives are designed to streamline our operations to allow our employees to continue to provide high quality service to our customers, while simplifying customer interaction and providing our customers with a more interconnected purchasing experience. The cost and potential problems and interruptions associated with the implementation of these initiatives, including those associated with managing third-party service providers and employing new web-based tools and services, could disrupt or reduce the efficiency of our operations. In the event that we grow very rapidly, there can be no assurance that we will be able to keep up, expand or adapt our IT infrastructure to meet evolving demand on a timely basis and at a commercially reasonable cost, or at all. In addition, our improved supply chain and new or upgraded technology might not provide the anticipated benefits, it might take longer than expected to realize the anticipated benefits or the initiatives might fail altogether.
We occupy most of our facilities under long-term non-cancellable leases. We may be unable to renew leases at the end of their terms. If we close a facility, we are still obligated under the applicable lease.
Most of our facilities are located in leased premises. Many of our current leases are non-cancellable and typically have initial terms ranging from five to ten years and most provide options to renew for specified periods of time. We believe that leases we enter into in the future will likely be long-term and non-cancellable and have similar renewal options. If we close or idle a facility, most likely we remain committed to perform our obligations under the applicable lease, which would include, among other things, payment of the base rent, insurance, taxes and other expenses on the leased property for the balance of the lease term. The inability to terminate leases when idling a facility or exiting a geographic market can have a significant adverse impact on our financial condition, operating results and cash flows.
In addition, at the end of the lease term and any renewal period for a facility, we may be unable to renew the lease without substantial additional cost, if at all. If we are unable to renew our facility leases, we may close or relocate a facility, which could subject us to construction and other costs and risks, which in turn could have a material adverse effect on our business and operating results. In addition, we may not be able to secure a replacement facility in a location that is as commercially viable, including access to rail service, as the lease we are unable to renew. For example, closing a facility, even during the time of relocation, will reduce the sales that the facility would have contributed to our revenues. Additionally, the revenue and profit, if any, generated at a relocated facility may not equal the revenue and profit generated at the existing one.
We may be unable to effectively manage our inventory and working capital as our sales volume increases or material prices fluctuate, which could have a material adverse effect on our business, financial condition and operating results.
We purchase certain materials, including lumber products, which are then sold to customers as well as used as direct production inputs for our manufactured and prefabricated products. We must maintain, and have adequate working capital to purchase, sufficient inventory to meet customer demand. Due to the lead times required by our suppliers, we order products in advance of expected sales. This requires us to forecast our sales and purchase accordingly. In periods of growth, it can be especially difficult to forecast sales accurately. We must also manage our working capital to fund our inventory purchases. Excessive spikes in the market prices of certain building products, such as lumber, can put negative pressure on our operating cash flows by requiring us to invest more in inventory. In the future, if we are unable to manage effectively our inventory and working capital as we attempt to grow our business, our cash flows may be negatively affected, which could have a material adverse effect on our business, financial condition and operating results.
The majority of our net sales are credit sales that are made primarily to customers whose ability to pay is dependent, in part, upon the economic strength of the industry and geographic areas in which they operate, and the failure to collect or timely collect monies owed from customers could adversely affect our financial condition.
The majority of our net sales volume in fiscal 2015 was facilitated through the extension of credit to our customers whose ability to pay is dependent, in part, upon the economic strength of the industry in the areas where they operate. We offer credit to customers, either through unsecured credit that is based solely upon the creditworthiness of the customer, or secured credit for materials sold for a specific job where the security lies in lien rights associated with the material going into the job. The type of credit offered depends both on the financial strength of the customer and the nature of the business in which the customer is involved. End users, resellers and other non-contractor customers generally purchase more on unsecured credit than secured credit. The inability of our customers to pay off their credit lines in a timely manner, or at all, would adversely affect our financial condition, operating results and cash flows. Furthermore, our collections efforts with respect to non-paying or slow-paying customers could negatively impact our customer relations going forward.
13
Because we depend on the creditworthiness of certain of our customers, if the financial condition of our customers declines, our credit risk could increase. Significant contraction in our markets, coupled with tightened credit availability and financial institution underwriting standards, could adversely affect certain of our customers. Should one or more of our larger customers declare bankruptcy as has occurred in the past, it could adversely affect the collectability of our accounts receivable, bad debt reserves and net income.
We are subject to competitive pricing pressure from our customers.
Production homebuilders historically have exerted significant pressure on their outside suppliers to keep prices low because of their market share and ability to leverage such market share in the highly fragmented building products supply and services industry. The housing industry downturn resulted in significantly increased pricing pressures from production homebuilders and other customers. These pricing pressures have adversely affected our operating results and cash flows. In addition, continued consolidation among homebuilders, and changes in homebuilders’ purchasing policies or payment practices, could result in additional pricing pressure. Moreover, during the housing downturn, several of our homebuilder customers defaulted on amounts owed to us or extended their payable days as a result of their financial condition. If such payment failures or delays were to recur, it could significantly adversely affect our financial condition, operating results and cash flows.
We may not timely identify or effectively respond to consumer needs, expectations or trends, which could adversely affect our relationship with customers, the demand for our products and services and our market share.
It is difficult to predict successfully the products and services our customers will demand. The success of our business depends in part on our ability to identify and respond promptly to changes in demographics, consumer preferences, expectations, needs and weather conditions, while also managing inventory levels. For example, an increased consumer focus on making homes energy efficient could require us to offer more energy efficient building materials and there can be no assurance that we would be able to identify appropriate suppliers on acceptable terms. Failure to identify timely or effectively respond to changing consumer preferences, expectations and building product needs could adversely affect our relationship with customers, the demand for our products and services and our market share.
We may be unable to successfully implement our growth strategy, which includes pursuing strategic acquisitions and opening new facilities.
Our long-term business plan provides for continued growth through strategic acquisitions and organic growth through the construction of new facilities or the expansion of existing facilities. Failure to identify and acquire suitable acquisition candidates on appropriate terms could have a material adverse effect on our growth strategy. Moreover, our reduced operating results during the housing downturn, our liquidity position or the requirements of our Second Amended and Restated Senior Secured Credit Agreement with Wells Fargo Capital Finance (the "Credit Agreement") could prevent us from obtaining the capital required to effect new acquisitions or expansions of existing facilities. Our failure to make successful acquisitions or to build or expand facilities, including manufacturing facilities, produce saleable product or meet customer demand in a timely manner could result in damage to or loss of customer relationships, which could adversely affect our financial condition, operating results and cash flows.
Federal, state, local and other regulations could impose substantial costs and/or restrictions on our operations that would reduce our net income.
We are subject to various federal, state, local and other regulations, including, among other things, regulations promulgated by the DOT, work safety regulations promulgated by OSHA, employment regulations promulgated by the United States Equal Employment Opportunity Commission, regulations of the United States Department of Labor, federal and state environmental regulations, accounting standards issued by the Financial Accounting Standards Board or similar entities, and state and local zoning restrictions, building codes and contractors’ licensing regulations. More burdensome regulatory requirements in these or other areas may increase our general and administrative costs and adversely affect our financial condition, operating results and cash flows. Moreover, failure to comply with the regulatory requirements applicable to our business could expose us to litigation and/or substantial penalties that could adversely affect our financial condition, operating results and cash flows.
Our transportation operations are subject to the regulatory jurisdiction of the DOT. The DOT has broad administrative powers with respect to our transportation operations. More restrictive limitations on vehicle weight and size, trailer length and configuration, or driver hours of service would increase our costs, which, if we are unable to pass these cost increases on to our customers, may increase our selling, general and administrative expenses and adversely affect our financial condition, operating results and cash
14
flows. If we fail to comply adequately with DOT regulations or regulations become more stringent, we could experience increased inspections, regulatory authorities could take remedial action including imposing fines or shutting down our operations or we could be subject to increased audit and compliance costs. If any of these events were to occur, our financial condition, operating results and cash flows would be adversely affected.
In addition, the homebuilding industry is subject to various local, state and federal statutes, ordinances, codes, rules and regulations concerning zoning, building design and safety, construction, energy conservation, environmental protection and similar matters, including regulations that impose restrictive zoning and density requirements on our business or that limit the number of homes that can be built within the boundaries of a particular area. Regulatory restrictions may increase our operating expenses and limit the availability of suitable building lots for our customers, which could negatively affect our sales and earnings.
The loss of any of our significant customers could affect our financial health.
Our ten largest customers generated approximately 20.0% and 22.2% of our net sales for the years ended December 31, 2015 and 2014, respectively. We cannot guarantee that we will maintain or improve our relationships with these customers or that we will continue to supply these customers at historical levels. Due to the weak housing market over the past several years in comparison to long-term averages, many of our homebuilder customers substantially reduced their construction activity. Some homebuilder customers exited or severely curtailed building activity in certain of our markets.
In addition, production homebuilders and other customers may: (i) seek to purchase some of the products that we currently sell directly from manufacturers; (ii) elect to establish their own building products manufacturing and distribution facilities or (iii) give advantages to manufacturing or distribution intermediaries in which they have an economic stake. Continued consolidation among production homebuilders could also result in a loss of some of our present customers to our competitors. The loss of one or more of our significant customers or deterioration in our relations with any of them could adversely affect our financial condition, operating results and cash flows. Furthermore, our customers typically are not required to purchase any minimum amount of products from us. The contracts into which we have entered with most of our professional customers typically provide that we supply particular products or services for a certain period of time when and if ordered by the customer. Should our customers purchase our products in significantly lower quantities than they have in the past, such decreased purchases could have a material adverse effect on our financial condition, operating results and cash flows.
We may be adversely affected by any natural or man-made disruptions to our distribution and manufacturing facilities.
We currently maintain a broad network of distribution and manufacturing facilities throughout the eastern, southern and western United States. Any widespread disruption to our facilities resulting from fire, earthquake, weather-related events, an act of terrorism or any other cause could damage a significant portion of our inventory and could materially impair our ability to distribute our products to customers. We could incur significantly higher costs and longer lead times associated with distributing our products to our customers during the time that it takes for us to reopen or replace a damaged facility. In addition, any shortages of fuel or significant fuel cost increases could disrupt our ability to distribute products to our customers. Disruptions to the national or local transportation infrastructure systems including those related to a domestic terrorist attack may also affect our ability to keep our operations and services functioning properly. If any of these events were to occur, our financial condition, operating results and cash flows could be materially adversely affected.
We are subject to exposure to environmental liabilities and are subject to environmental regulation.
We are subject to various federal, state and local environmental laws, ordinances, rules and regulations including those promulgated by the United States Environmental Protection Agency and analogous state agencies. As current and former owners, lessees and operators of real property, we can be held liable for the investigation or remediation of contamination at or from such properties, in some circumstances irrespective of whether we knew of or caused such contamination. No assurance can be provided that investigation and remediation will not be required in the future as a result of spills or releases of petroleum products or hazardous substances, the discovery of currently unknown environmental conditions, more stringent standards regarding existing contamination, or changes in legislation, laws, ordinances, rules or regulations or their interpretation or enforcement. More burdensome environmental regulatory requirements may increase our costs and adversely affect our financial condition, operating results and cash flows.
15
We are subject to cybersecurity risks and may incur increasing costs in an effort to minimize those risks.
Our business employs systems and a website that allow for the secure storage and transmission of customers’ proprietary information. Security breaches could expose us to a risk of loss or misuse of this information, litigation and potential liability. We may not have the resources or technical sophistication to anticipate or prevent rapidly evolving types of cyber-attacks. Any compromise of our security could result in a violation of applicable privacy and other laws, significant legal and financial exposure, damage to our reputation and a loss of confidence in our security measures, which could harm our business. The regulatory environment related to information security and privacy is increasingly rigorous, with new and constantly changing requirements applicable to our business, and compliance with those requirements could result in additional costs. Our computer systems have been, and will likely continue to be, subjected to computer viruses or other malicious codes, unauthorized access attempts and cyber- or phishing-attacks. These events could compromise our confidential information, impede or interrupt our business operations, and may result in other negative consequences, including remediation costs, loss of revenue, litigation and reputational damage. To date, we have not experienced a material breach of cybersecurity. As cyber-attacks become more sophisticated generally, and as we implement changes giving customers greater electronic access to our systems, we may be required to incur significant costs to strengthen our systems from outside intrusions and/or maintain insurance coverage related to the threat of such attacks. While we have implemented administrative and technical controls and have taken other preventive actions to reduce the risk of cyber incidents and protect our IT, they may be insufficient to prevent physical and electronic break-ins, cyber-attacks or other security breaches to our computer systems.
Risks Related to the Merger
Successful continued integration of BMC and SBS and successful operation of the Company in the future are not assured. Also, integrating BMC’s business may divert the attention of management away from operations.
There can be no assurance that we will be able to maintain and grow the continuing businesses and operations of the Company during, and following, the integration of BMC. In addition, the market segments in which the Company operates may experience declines in demand and/or new competitors. Integrating and coordinating certain aspects of the operations, portfolio of products and personnel of BMC and SBS involves complex operational, technological and personnel-related challenges. This process has been and will continue to be time-consuming and expensive, may disrupt the business of the Company and may not result in the full benefits expected from the Merger, including cost synergies expected to arise from efficiencies and overlapping general and administrative functions. The potential difficulties, and resulting costs and delays, include:
• | managing a larger post-Merger company; |
• | consolidating corporate and administrative infrastructures; |
• | difficulties attracting and retaining key personnel; |
• | loss of customers and suppliers and inability to attract new customers and suppliers; |
• | issues in integrating information technology, communications and other systems; |
• | incompatibility of purchasing, logistics, marketing, administration and other systems and processes; and |
• | unforeseen and unexpected liabilities related to the Merger or BMC’s legacy business. |
Additionally, the continued integration of the Company’s operations, products and personnel may place a significant burden on management and other internal resources. The diversion of management’s attention, and any difficulties encountered in the transition and integration process, could harm our business, financial condition and operating results.
Our continued success will depend on our ability to retain qualified employees, while controlling our labor costs.
Along with competing with other companies for many of our employees in hourly and piece work positions, we invest significant resources in training and motivating them to maintain a high level of job satisfaction. These positions have historically had high turnover rates, which can lead to increased training and retention costs. If we are unable to attract or retain highly qualified employees in the future, it could adversely impact our operating results. In addition, there is uncertainty about our ability to retain and motivate employees following the Merger. Losses of employees due to different business cultures following the Merger could harm our business and financial condition.
We may be adversely affected by any disruption in our information technology systems.
Our operations are dependent upon our IT systems, which encompass all of our major business functions. A substantial disruption in our IT systems for any prolonged time period (arising from, for example, system capacity limits from unexpected increases in our volume of business, outages, computer viruses, unauthorized access or delays in our service) could result in delays in receiving inventory and supplies or filling customer orders and adversely affect our customer service and relationships. Our systems might
16
be damaged or interrupted by natural or man-made events or by computer viruses, physical or electronic break-ins, or similar disruptions affecting the global Internet. Such delays, problems or costs may have a material adverse effect on our financial condition, operating results and cash flows.
Operation on multiple ERP information systems, and the conversion from multiple systems to a single system, may negatively impact our operations.
The Company currently operates on multiple ERP systems, which we use for operations representing virtually all of our sales. Certain of our ERP systems are proprietary systems that have been highly customized by our computer programmers. We rely upon our ERP systems to manage and replenish inventory, to fill and ship customer orders on a timely basis, to coordinate our sales and distribution activities across all of our products and services and to provide information for financial reporting purposes.
Processing, consolidating and reconciling information from multiple ERP systems increases the chance of error, and we may incur significant additional costs related thereto. In markets in which both Legacy Stock and Legacy BMC stores operate, some orders and processes require manual input to consolidate purchasing, inventory, sales and billing functions. Inconsistencies in the information from multiple ERP systems could adversely impact our ability to manage our business efficiently and may result in heightened risk to our ability to maintain accurate books and records and comply with regulatory requirements.
We are currently evaluating whether to integrate all operations under one or more of our current ERP systems or continuing to implement a single, new company-wide ERP system which was selected by Legacy BMC prior to the Merger. We are incurring costs associated with designing and implementing this new software. During 2015, we had capital expenditures of $6.4 million for ERP design and implementation, and incurred an additional $1.2 million of non-capitalizable expenses. Capital expenditures and expenses for ERP systems in 2016 and beyond will depend upon whether we decide to operate under one or more of our current ERP systems or a new system, as well as the pace of conversion to a company-wide platform. If implementation is not executed successfully, this could result in business interruptions. If we do not complete the implementation of a company-wide ERP system timely and successfully, we may also incur additional costs associated with this project and a delay in our ability to improve existing operations, to support future growth and to take advantage of new applications and technologies.
Such projects are inherently complex, resource intensive, and lengthy. As a result, we could experience unplanned or unforeseen issues that could adversely affect the project, our business or our results of operations, including:
• | costs of implementation that materially exceed our expectations; |
• | diversion of management’s attention away from normal daily business operations; |
• | risk of incurring asset impairment charges, accelerated depreciation expense or other charges related to the early retirement of information system assets or the early termination of information system supplier agreements; |
• | increased demand on our operations support personnel; |
• | delays in the go-live of one or more of the stages of the project, resulting in additional costs or time for completion; |
• | errors in implementation resulting in errors in the commencement or reporting of business transactions; |
• | failure in the deliverables of our key partners, suppliers and implementation advisors, resulting in an inferior product, reduced business efficacy and the project not providing expected benefits; |
• | deficiencies in the training of employees in the use of the new solution, resulting in errors in the recording of data or transactions, leading to delays in input deliveries and production impairment; |
• | a control failure during or post implementation, which may result in a material weakness in our internal controls over financial reporting; and |
• | other implementation issues leading to delays and impacts on our business. |
Any of the foregoing could materially and negatively impact our operating results, cash flows or financial condition.
17
Our additional indebtedness could adversely affect our ability to raise additional capital to fund our operations, limit our ability to react to changes in the economy or the industry, expose us to interest rate risk to the extent of our variable rate debt and prevent us from meeting our obligations under our indebtedness.
Following the Merger, we have a significant level of indebtedness. As of December 31, 2015, our total debt was $431.7 million, which includes obligations under the Senior Notes and Credit Agreement, as discussed below, as well obligations under capital leases and certain other notes. This leverage could have important consequences, including: making it more difficult for us to satisfy our obligations with respect to our indebtedness; increasing our vulnerability to general adverse economic and industry conditions; requiring us to dedicate a portion of our cash flow from operations to payments on our indebtedness, thereby reducing the availability of our cash flow to fund working capital, capital expenditures, research and development efforts, and other general corporate purposes; increasing our vulnerability to and limiting our flexibility in planning for, or reacting to, changes in our business and the industry in which we operate; exposing us to the risk of increased interest rates as borrowings under certain of our indebtedness are subject to variable rates of interest; placing the us at a competitive disadvantage compared to our competitors that have less debt; and limiting our ability to borrow additional funds.
On September 20, 2013, Legacy BMC issued $250.0 million of senior secured notes (the "Senior Notes"). The Senior Notes are governed by an indenture dated September 20, 2013 (the " BMC Indenture"). Concurrent with the Merger, the Company entered into a second supplemental indenture pursuant to which the Company assumed all obligations of Legacy BMC in relation to the Senior Notes (together with the BMC Indenture, the "Indenture").
On December 1, 2015, in connection with the Merger, we entered into the Credit Agreement, which includes a revolving line of credit (the “Revolver”). The Revolver has a maximum availability of $450 million, subject to an asset borrowing formula based on eligible accounts receivable, credit card receivables, inventory and fixed assets.
We are substantially reliant on liquidity provided by our Credit Agreement and cash on hand to provide working capital and fund our operations. Our working capital and capital expenditure requirements are likely to grow as the housing market improves and we execute our strategic growth plan. Economic and credit market conditions, the performance of the homebuilding industry, and our financial performance, as well as other factors, may constrain our financing abilities. Our ability to secure additional financing, if available, and to satisfy our financial obligations under indebtedness outstanding from time to time will depend upon our future operating performance, the availability of credit, economic conditions and financial, business and other factors, many of which are beyond our control. The prolonged continuation or worsening of current housing market conditions and the macroeconomic factors that affect our industry could require us to seek additional capital and have a material adverse effect on our ability to secure such capital on favorable terms, if at all.
We may be unable to secure additional financing or financing on favorable terms or our operating cash flow may be insufficient to satisfy our financial obligations under our outstanding indebtedness. If additional funds are raised through the issuance of additional equity or convertible debt securities, our stockholders may experience significant dilution. We may also incur additional indebtedness in the future, including collateralized debt, subject to the restrictions contained in the Credit Agreement and Indenture. If new debt is added to our current debt levels, the related risks that we now face could intensify.
Our ability to generate net income will depend upon various factors beyond our control. A portion of our debt bears variable rates of interest so our interest expense could increase further in the future. We may not generate sufficient cash flow from operations to pay cash interest on our debt.
The Credit Agreement and Indenture contain various covenants that could limit our ability to operate our business.
The Credit Agreement and Indenture place limitations on our ability and the ability of and our subsidiaries to, among other things, incur debt, create other liens on its assets, make investments, sell assets, pay dividends, undertake transactions with affiliates, enter into merger transactions and enter into unrelated businesses. The Credit Agreement also contains a financial covenant requiring us and our subsidiaries to maintain a Fixed Charge Coverage Ratio, as defined therein, of at least 1.0:1.0 at the end of any fiscal quarter during the period from the date that Excess Availability, as defined therein, under the Credit Agreement is less than or equal to the greater of (1) $40.0 million and (2) 10.0% of the Line Cap under the Credit Agreement until the date that Excess Availability has been greater than the greater of (i) $40.0 million and (ii) 10.0% of the Line Cap for a period of at least 30 consecutive days. The Credit Agreement and Indenture also contain various customary representations and warranties, financial and collateral reporting requirements and other affirmative and negative covenants. Amounts owed under the Credit Agreement and Indenture may be accelerated and the lenders may exercise other remedies available to them upon the occurrence of various events of default set forth in the Credit Agreement and Indenture, including the failure to make principal or interest payments when due, breaches of covenants, representations and warranties set forth in the Credit Agreement and Indenture and defaults under other debt obligations. Any of the foregoing could result in a material increase could materially and negatively impact our operating results, cash flows or financial condition.
18
Risks Related to Ownership of Our Common Stock
The price of our common stock may fluctuate significantly.
Volatility in the market price of our common stock may prevent you from being able to sell your shares of our common stock at or above the price you paid for them. The market price for our common stock could fluctuate significantly for various reasons, including but not limited to:
• | our operating and financial performance and prospects; |
• | our quarterly or annual earnings or those of other companies in our industry; |
• | the public’s reaction to our press releases, our other public announcements and our filings with the SEC; |
• | changes in, or failure to meet, earnings estimates or recommendations by research analysts who track our common stock or the stock of other companies in our industry; |
• | the failure of research analysts to cover our common stock; |
• | general economic, industry and market conditions; |
• | strategic actions by us, our customers or our competitors, such as acquisitions or restructurings; |
• | new laws or regulations or new interpretations of existing laws or regulations applicable to our business; |
• | changes in accounting standards, policies, guidance, interpretations or principles; |
• | material litigation or government investigations; |
• | changes in general conditions in the United States and global economies or financial markets, including those resulting from war, incidents of terrorism or responses to such events; |
• | changes in key personnel; |
• | sales of common stock by us, our principal stockholder or members of our management team; |
• | the granting or exercise of employee stock options; |
• | payment of liabilities for which we are self-insured; |
• | volume of trading in our common stock; |
• | threats to, or impairments of, our intellectual property; and |
• | the impact of the factors described elsewhere in “Risk Factors.” |
In addition, in recent years, the stock market has regularly experienced significant price and volume fluctuations. This volatility has had a significant impact on the market price of securities issued by many companies, including companies in our industry. The changes frequently appear to occur without regard to the operating performance of the affected companies. Hence, the price of our common stock could fluctuate based upon factors that have little or nothing to do with us and these fluctuations could materially reduce our share price.
We do not currently intend to pay dividends on our common stock.
We do not anticipate paying any cash dividends on our common stock for the foreseeable future. Instead, we intend to retain future earnings to fund our growth. In addition, our existing indebtedness restricts, and we anticipate our future indebtedness may restrict, our ability to pay dividends. Therefore, you may not receive a return on your investment in our common stock by receiving a payment of dividends.
Future sales of our common stock, or the perception in the public markets that these sales may occur, may depress our stock price.
Sales of substantial amounts of our common stock in the public market, or the perception that these sales could occur, could adversely affect the price of our common stock and could impair our ability to raise capital through the sale of additional shares. Before the Merger, Robotti & Company Advisors, LLC (“Robotti”) and its affiliates owned approximately 14% of BMC’s outstanding common stock while Davidson Kempner Capital Management LP (“DK”) and its affiliates owned approximately 28.0% of BMC’s outstanding common stock. Before the Merger, The Gores Group, LLC (“Gores” and collectively with DK and Robotti, the “Stockholder Group”) owned approximately 38% of our outstanding common stock. As of February 29, 2016, there were approximately 65.3 million shares of our common stock outstanding. Our three largest stockholders, DK, Robotti and Gores own as many as 26.7 million of these shares, with approximately 10.9 million (16.7%) of these shares beneficially owned by DK, approximately 5.8 million (8.9%) of these shares beneficially owned by Robotti and approximately 9.9 million (15.2%) of these shares beneficially owned by Gores.
In connection with the Merger, we entered into a Registration Rights Agreement with the Stockholder Group (the “Registration Rights Agreement”). Under the Registration Rights Agreement, and subject to certain conditions and limitations stated therein,
19
we granted the Stockholder Group registration rights with respect to the shares of Company common stock held by such stockholders. These rights include demand registration rights, shelf registration rights and “piggyback” registration rights, as well as customary indemnification provisions. The registration rights are subject to certain holdback and suspension periods. We generally will bear all fees, costs and expenses related to registrations, other than underwriting discounts and commissions attributable to the sale of registrable shares by the Stockholder Group under a demand registration or a piggyback registration, as applicable. Sales by the Stockholder Group of a substantial number of shares could significantly reduce the market price of our common stock.
In connection with the Merger, an amendment to the Stock Building Supply Holdings, Inc. 2013 Incentive Compensation Plan ("SBS 2013 Incentive Plan") was approved which increased the number of shares of common stock authorized for issuance under the SBS 2013 Incentive Plan from 1.8 million shares to 5.6 million shares. Of this amount, 1.8 million shares are registered and 3.8 million shares will be registered shortly after the filing of this Annual Report on Form 10-K. Of the total 5.6 million shares authorized for issuance under the SBS 2013 Incentive Plan, approximately 3.7 million shares were available for issuance as of February 29, 2016, not including shares underlying outstanding unvested restricted stock awards and restricted stock units ("RSUs") and outstanding vested and unvested stock options. In addition, as of February 29, 2016, there were issued and outstanding approximately (i) 0.5 million shares of nonvested stock, (ii) 0.3 million RSUs that convert into common stock upon vesting, and (iii) 1.0 million options for the purchase of common stock under the SBS 2013 Incentive Plan. Upon vesting, conversion or exercise as applicable, such registered shares can be freely sold in the public market. If a large number of these shares are sold in the public market, the sales could reduce the trading price of our common stock.
Our future operating results may fluctuate significantly and our current operating results may not be a good indication of our future performance. Fluctuations in our quarterly financial results could affect our stock price in the future.
Our revenues and operating results have historically varied from period-to-period and we expect that they will continue to do so as a result of a number of factors, many of which are outside of our control. If our quarterly financial results or our predictions of future financial results fail to meet the expectations of securities analysts and investors, our stock price could be negatively affected. Any volatility in our quarterly financial results may make it more difficult for us to raise capital in the future or pursue acquisitions that involve issuances of our stock. Our operating results for prior periods may not be effective predictors of future performance.
Factors associated with our industry, the operation of our business and the markets for our products and services may cause our quarterly financial results to fluctuate, including:
• | the seasonal and cyclical nature of the homebuilding industry; |
• | the highly competitive nature of our industry; |
• | the volatility of prices, availability and affordability of raw materials, including lumber, wood products and other building products; |
• | shortages of skilled and technical labor, increased labor costs and labor disruptions; |
• | the production schedules of our customers; |
• | general economic conditions, including but not limited to housing starts, repair and remodeling activity and light commercial construction, inventory levels of new and existing homes for sale, foreclosure rates, interest rates, unemployment rates, relative currency values, mortgage availability and pricing, as well as other consumer financing mechanisms, that ultimately affect demand for our products; |
• | actions of suppliers, customers and competitors, including merger and acquisition activities, plant closures and financial failures; |
• | litigation, claims and investigations involving us; |
• | the financial condition and creditworthiness of our customers; |
• | cost of compliance with government laws and regulations; |
• | weather patterns; and |
• | severe weather phenomena such as drought, hurricanes, tornadoes and fire. |
Any one of the factors above or the cumulative effect of some of the factors referred to above may result in significant fluctuations in our quarterly financial and other operating results, including fluctuations in our key metrics. The variability and unpredictability could result in our failing to meet our internal operating plan or the expectations of securities analysts or investors for any period. If we fail to meet or exceed such expectations for these or any other reasons, the market price of our shares could fall substantially and we could face costly lawsuits, including securities class action suits.
Certain provisions of our organizational documents and other contractual provisions may make it difficult for stockholders to change the composition of our Board of Directors ("Board") and may discourage hostile takeover attempts.
20
Certain provisions of our amended and restated certificate of incorporation and amended and restated bylaws may have the effect of delaying or preventing changes in control if our Board determines that such changes in control are not in the best interests of us and our stockholders. The provisions in our amended and restated certificate of incorporation and amended and restated bylaws include, among other things, the following:
• | a classified Board with three-year staggered terms; |
• | the ability of our Board to issue shares of preferred stock and to determine the price and other terms, including preferences and voting rights, of those shares without stockholder approval; |
• | stockholder action can only be taken at a special or regular meeting and not by written consent; |
• | advance notice procedures for nominating candidates to our Board or presenting matters at stockholder meetings; |
• | removal of directors only for cause; |
• | allowing only our Board to fill vacancies on our Board; and |
• | super-majority voting requirements to amend our amended and restated bylaws and certain provisions of our amended and restated certificate of incorporation (the "Charter"). |
We have elected in our Charter not to be subject to Section 203 of the Delaware General Corporation Law ("Section 203"), an anti-takeover law. In general, Section 203 prohibits a publicly held Delaware corporation from engaging in a business combination, such as a merger, with a person or group owning 15% or more of the corporation’s voting stock for a period of three years following the date the person became an interested stockholder, unless (with certain exceptions) the business combination or the transaction in which the person became an interested stockholder is approved in a prescribed manner. Accordingly, we are not subject to any anti-takeover effects of Section 203. However, our Charter contains provisions that are substantially similar in effect to Section 203. In general, the anti-takeover provisions in the Charter, like Section 203, prohibit us from engaging in a business combination, such as a merger, with a person or group owning 15% or more of our voting stock for a period of three years following the date the person became an interested stockholder, unless (with certain exceptions) the business combination or the transaction in which the person became an interested stockholder is approved in a prescribed manner. The Charter includes specified exceptions from anti-takeover provisions, which provide that (i) in certain circumstances (as described below), DK and Gores (the “Grandfathered Stockholders”) and (ii) any person who would otherwise be an interested stockholder because of a transfer, assignment, conveyance, hypothecation, encumbrance or other disposition of 5% or more of our outstanding voting stock by any Grandfathered Stockholder to such person will be excluded from the “interested stockholder” definition in the Charter. At any time during the period beginning on the closing date of the Merger and ending on the third anniversary thereof, each Grandfathered Stockholder is permitted to own any amount less than 20% of our outstanding voting stock and will not be deemed an interested stockholder unless such Grandfathered Stockholder’s ownership level meets or exceeds 20% of our outstanding voting stock during such three-year period. From and after the third anniversary of the closing date of the Merger, each Grandfathered Stockholder is permitted to continue owning its respective ownership amount that it owns, together with its affiliates and associates, on such anniversary and will not be deemed an interested stockholder unless such Grandfathered Stockholder’s ownership level later exceeds such ownership amount of our outstanding voting stock. Moreover, each Grandfathered Stockholder, together with its affiliates and associates, may reduce its ownership amount at any time from and after the third anniversary of the effective time of the merger; provided that, if such Grandfathered Stockholder reduces its ownership amount below the ownership amount of such Grandfathered Stockholder that exists on the third anniversary of the effective time of the merger, such Grandfathered Stockholder may not increase its ownership amount above such reduced amount; provided, further, that if such Grandfathered Stockholder reduces its ownership amount below 15% of our outstanding voting stock after the third anniversary of the effective time of the Merger, such Grandfathered Stockholder may own any amount of voting stock below 15% of our outstanding voting stock, in the case of each of the foregoing provisos, without being deemed an interested stockholder.
While these provisions have the effect of encouraging persons seeking to acquire control of us to negotiate with our Board, they could enable the Board to hinder or frustrate a transaction that some, or a majority, of the stockholders might believe to be in their best interests and, in that case, may prevent or discourage attempts to remove and replace incumbent directors.
These provisions may frustrate or prevent any attempts by our stockholders to replace or remove our current management by making it more difficult for stockholders to replace members of our Board, which is responsible for appointing the members of our management.
Any issuance of preferred stock could make it difficult for another company to acquire us or could otherwise adversely affect holders of our common stock, which could depress the price of our common stock.
Our Board has the authority to issue preferred stock and to determine the preferences, limitations and relative rights of shares of preferred stock and to fix the number of shares constituting any series and the designation of such series, without any further vote or action by our stockholders. Our preferred stock could be issued with voting, liquidation, dividend and other rights superior to
21
the rights of our common stock. The potential issuance of preferred stock may delay or prevent a change in control of us, discouraging bids for our common stock at a premium over the market price, and adversely affect the market price and the voting and other rights of the holders of our common stock.
Failure to establish and maintain effective internal controls in accordance with Section 404 of the Sarbanes-Oxley Act could have a material adverse effect on our business and stock price.
Our internal control over financial reporting will not prevent or detect all errors and all fraud. A control system, no matter how well designed and operated, can provide only reasonable, not absolute, assurance that the control system's objectives will be met. Because of the inherent limitations in all control systems, no evaluation of controls can provide absolute assurance that misstatements due to error or fraud will not occur or that all control issues and instances of fraud will be detected.
BMC was not subject to Section 404 of the Sarbanes-Oxley Act of 2002, which requires companies to conduct a comprehensive evaluation of their internal control over financial reporting. Accordingly, as permitted under applicable regulations, management’s annual report on internal control over financial reporting includes a scope limitation excluding the Legacy BMC business for the year ended December 31, 2015. See Item 9A-“Controls and Procedures.”
Ensuring that the Company has adequate internal financial and accounting controls and procedures in place to produce accurate financial statements on a timely basis is a costly and time-consuming effort that needs to be re-evaluated frequently. Implementing appropriate changes to the internal controls of the Company may take a significant period of time to complete, may distract directors, officers and employees, and may entail substantial costs in order to modify existing accounting systems. Further, the Company may encounter difficulties assimilating or integrating the internal controls, disclosure controls, financial reporting systems and information technology infrastructure of SBS and BMC.
The Company’s efforts to assimilate and integrate the internal controls and financial reporting systems of SBS and BMC may not be effective in maintaining the adequacy of internal controls, and any failure to maintain that adequacy, or consequent inability to produce accurate financial statements on a timely basis, could increase the Company’s operating costs and could materially impair its ability to operate its business. In addition, investors’ perceptions that the Company’s internal controls are inadequate or that it is unable to produce accurate financial statements may adversely affect its stock price.
Additionally, the Company may experience material weaknesses or significant deficiencies in its internal control over financial reporting in the future. Any failure to maintain internal control over financial reporting could severely inhibit the Company’s ability to accurately report its cash flows, results of operations or financial condition. If the Company is unable to conclude that its internal control over financial reporting is effective, or if its independent registered public accounting firm determines the Company has a material weakness or significant deficiency in its internal control over financial reporting, the Company could lose investor confidence in the accuracy and completeness of its financial reports, the market price of its common stock could decline and the Company could be subject to sanctions or investigations by NASDAQ, the SEC or other regulatory authorities. Failure to remedy any material weakness in the Company’s internal control over financial reporting, or to implement or maintain other effective control systems required of public companies, could also restrict its future access to the capital markets and reduce or eliminate the trading market for our common stock.
If securities or industry analysts do not publish research or publish inaccurate or unfavorable research about our business, our stock price and trading volume could decline.
As a relatively new public company we may lose research coverage by securities and industry analysts. If we lose securities or industry analyst coverage of our Company, the trading price for our stock may be negatively impacted. If we maintain or obtain new or additional securities or industry analyst coverage and if one or more of the analysts who covers us downgrades our stock or publishes inaccurate or unfavorable research about our business, our stock price would likely decline. If one or more of these analysts ceases coverage of us or fails to publish reports on us regularly, demand for our stock could decrease, which could cause our stock price and trading volume to decline.
Item 1B. Unresolved Staff Comments
None.
22
Item 2. Properties
We have a broad network of distribution and manufacturing operations across 147 facilities in 17 states throughout the eastern, southern and western United States. These branches are supported from our headquarters in Atlanta, Georgia and and our main operating center in Raleigh, North Carolina. Many of our operations are co-located within a single facility: we have 91 distribution and operations, 47 millwork fabrication operations, 35 structural component fabrication operations, and 13 flooring distribution operations. Our distribution and manufacturing facilities and their related uses as of January 31, 2016, are summarized in the table below:
Facility Use | |||||||||||
State | Total # of Properties | Approximate Aggregate Square Footage of Buildings (millions) | Distribution Operations | Millwork Fabrication | Structural Components Fabrication | Flooring Operations | |||||
Arkansas | 1 | 0.17 | 1 | 1 | 1 | ||||||
California | 24 | 0.75 | 15 | 5 | 5 | ||||||
Colorado | 9 | 0.61 | 5 | 4 | 2 | ||||||
Florida | 1 | 0.02 | 1 | ||||||||
Georgia | 17 | 1.05 | 9 | 6 | 3 | ||||||
Idaho | 6 | 0.22 | 5 | 2 | 2 | ||||||
Maryland | 2 | 0.01 | 2 | ||||||||
Montana | 5 | 0.23 | 2 | 2 | 2 | ||||||
Nevada | 1 | 0.03 | 1 | 1 | |||||||
New Mexico | 3 | 0.10 | 2 | 1 | 1 | ||||||
North Carolina | 15 | 1.34 | 8 | 3 | 3 | 5 | |||||
Pennsylvania | 1 | 0.17 | 1 | 1 | 1 | ||||||
South Carolina | 7 | 0.33 | 4 | 1 | 1 | 2 | |||||
Texas | 31 | 2.82 | 18 | 11 | 8 | ||||||
Utah | 13 | 0.55 | 11 | 6 | 3 | ||||||
Virginia | 7 | 0.35 | 4 | 3 | 1 | 2 | |||||
Washington | 4 | 0.36 | 4 | 2 | 2 | ||||||
Corporate and Branch Support Offices | 3 | 0.11 | |||||||||
Total | 150 | 9.22 | 91 | 47 | 35 | 13 | |||||
Distribution facilities generally include five to 25 acres of outside storage, a 30,000 to 60,000 square foot warehouse, office and product display space, and 15,000 to 30,000 square feet of covered storage. The outside area provides space for lumber storage and a staging area for delivery while the warehouse stores millwork, windows and doors. The distribution facilities are usually located in industrial areas with low cost real estate and easy access to freeways to maximize distribution efficiency and convenience. In most markets, at least one of the distribution facilities is situated on a rail line to facilitate the procurement of dimensional lumber in rail car quantities and minimize our cost of goods.
Our fabrication operations produce roof and floor trusses, wall panels, pre-cut engineered wood, stairs, windows, pre-hung interior and exterior doors and custom millwork. In most cases, they are located on the same premises as our distribution facilities, which facilitates the efficient distribution of product to customers. Millwork fabrication operations typically vary in size from 5,000 to 50,000 square feet of warehouse space to accommodate fabrication lines and the storage of base components and finished goods. Structural component fabrication operations vary in size from 20,000 to 50,000 square feet with five to 25 acres of outside storage for lumber and for finished goods.
As of January 31, 2016, we lease 93 facilities, including our corporate and branch support offices, and own 57 facilities. Our leases typically have an initial operating lease term of three to ten years and most provide options to renew for specified periods of time.
23
A majority of our leases provide for fixed annual rentals. Certain of our leases include provisions for escalating rent, as an example, based on changes in the consumer price index. Most of the leases require us to pay taxes, insurance and maintenance expenses associated with the properties.
As of January 31, 2016, we operate a fleet of approximately 1,500 trucks to deliver products from our distribution and manufacturing centers to job sites.
Item 3. Legal Proceedings
We are currently involved in various claims, legal proceedings and lawsuits incidental to the conduct of our business in the ordinary course. We are a defendant in various pending lawsuits, legal proceedings and claims arising from assertions of alleged product liability, warranty, casualty, construction defect, contract, tort, employment and other claims. We carry insurance in such amounts in excess of our self-insurance or deductibles as we believe to be reasonable under the circumstances although insurance may or may not cover any or all of our liabilities in respect of claims and lawsuits. We do not believe that the ultimate resolution of these matters will have a material adverse effect on our consolidated financial position, cash flows or operating results.
Item 4. Mine Safety Disclosures
Not applicable.
24
PART II
Item 5. Market for Registrant's Common Equity, Related Stockholder Matters and Issuer Purchases of Equity Securities
Market Information for Common Stock
Our common stock is traded on the NASDAQ Stock Market under the symbol “STCK”. The table below sets forth the high and low sales prices of our common stock for the periods indicated:
High | Low | |||
2015 | ||||
First quarter | $18.15 | $13.58 | ||
Second quarter | $25.20 | $16.47 | ||
Third quarter | $19.84 | $17.05 | ||
Fourth quarter | $19.62 | $14.45 | ||
2014 | ||||
First quarter | $23.33 | $16.56 | ||
Second quarter | $20.83 | $16.26 | ||
Third quarter | $20.98 | $14.50 | ||
Fourth quarter | $16.90 | $13.40 | ||
Holders of Record
As of February 29, 2016, there were approximately 90 stockholders of record of our common stock. Because many of our shares of common stock are held by brokers and other institutions on behalf of stockholders, we are unable to estimate the total number of beneficial owners represented by these record holders.
Dividend Policy
We do not plan to pay a regular dividend on our common stock. The declaration and payment of all future dividends, if any, will be at the discretion of our Board and will depend upon our financial condition, earnings, contractual conditions, restrictions imposed by the Credit Agreement and Indenture or applicable laws and other factors that our Board may deem relevant.
Securities Authorized for Issuance Under Equity Compensation Plans
For information on securities authorized for issuance under our equity compensation plans, see "Item 12. Security Ownership of Certain Beneficial Owners and Management."
25
Stock Performance Graph
The following graph shows a comparison from August 9, 2013 (the date trading commenced on our common stock on the NASDAQ) through December 31, 2015 of the cumulative return for our common stock, the Russell 2000 Index and the S&P 600 Building Products Index (ticker symbol "^SP600-201020"). The graph tracks the performance of a $100 investment in our common stock and in each of the indices (with the reinvestment of dividends).
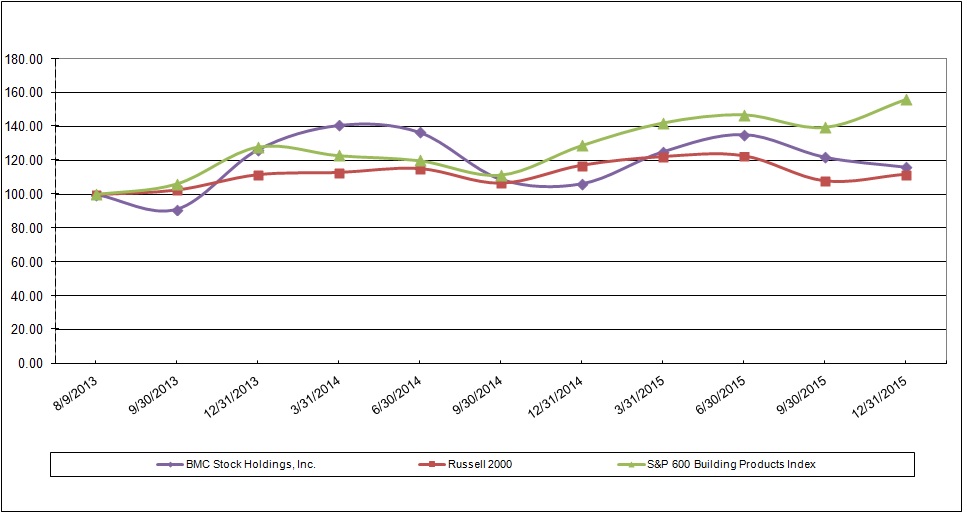
26
Item 6. Selected Financial Data
On December 1, 2015, SBS and BMC completed the Merger. As the Merger constituted a reverse acquisition for accounting purposes under generally accepted accounting principles in the United States, the historical financial statements of the Company reflect only the operations and financial condition of Legacy BMC. The operating results of Legacy SBS are reported as part of the Company beginning on the closing date of the Merger. The selected consolidated financial data as of December 31, 2015 and 2014 and for the years ended December 31, 2015, 2014 and 2013 have been derived from our audited consolidated financial statements included as Item 8 of this Annual Report on Form 10-K. Selected consolidated financial data as of December 31, 2013, 2012 and 2011 and for the years ended December 31, 2012 and 2011 were derived from Legacy BMC's consolidated financial statements, which are not included herein. Earnings per share for the years ended December 31, 2012 and 2011 was not previously presented in the consolidated financial statements of Legacy BMC, but is included in the table below for comparison purposes.
The following data should be read in conjunction with "Management's Discussion and Analysis of Financial Condition and Results of Operations" contained in Item 7 of this Annual Report on Form 10-K and with our consolidated financial statements and related notes included as Item 8 of this Annual Report on Form 10-K:
Year Ended December 31, | |||||||||||||||||||
(in thousands, expect per share data) | 2015 | 2014 | 2013 | 2012 | 2011 | ||||||||||||||
Statement of operations data: | |||||||||||||||||||
Net sales | $ | 1,576,746 | $ | 1,311,498 | $ | 1,210,156 | $ | 886,740 | $ | 644,414 | |||||||||
Gross profit | 361,410 | 295,074 | 256,547 | 180,047 | 131,475 | ||||||||||||||
Selling, general and administrative expenses | 306,843 | 229,316 | 200,588 | 173,382 | 135,151 | ||||||||||||||
Net (loss) income | (4,831 | ) | 94,032 | 21,655 | (17,533 | ) | (35,041 | ) | |||||||||||
Net (loss) income per share - diluted | $ | (0.12 | ) | $ | 2.39 | $ | 0.56 | $ | (0.47 | ) | $ | (0.99 | ) | ||||||
Statement of cash flows data: | |||||||||||||||||||
Net cash provided by (used in): | |||||||||||||||||||
Operating activities (1) | $ | 743 | $ | 30,732 | $ | 15,357 | $ | (38,020 | ) | $ | (25,561 | ) | |||||||
Investing activities | (135,076 | ) | (16,262 | ) | (63,999 | ) | 9,323 | 11,691 | |||||||||||
Financing activities (1) | 72,160 | (424 | ) | 96,098 | 28,045 | (7,352 | ) | ||||||||||||
Other financial data: | |||||||||||||||||||
Depreciation and amortization | $ | 24,589 | $ | 15,457 | $ | 13,767 | $ | 13,248 | $ | 16,509 | |||||||||
Capital expenditures | 31,319 | 28,275 | 15,057 | 10,222 | 7,615 | ||||||||||||||
Adjusted EBITDA (2) | 86,042 | 77,269 | 64,751 | 21,113 | 2,441 | ||||||||||||||
Balance sheet data (at period end): | |||||||||||||||||||
Total current assets | $ | 613,960 | $ | 358,095 | $ | 323,262 | $ | 193,742 | $ | 135,711 | |||||||||
Property and equipment, net of accumulated depreciation | 295,978 | 140,435 | 122,930 | 105,083 | 105,923 | ||||||||||||||
Total assets | 1,376,008 | 588,512 | 468,272 | 320,513 | 277,579 | ||||||||||||||
Total debt and capital lease obligations (including current portion) | 431,709 | 270,108 | 265,743 | 150,929 | 120,233 | ||||||||||||||
Total stockholders' equity | 628,932 | 179,078 | 82,229 | 56,057 | 71,779 | ||||||||||||||
27
(1) | Net cash provided by (used in) operating and financing activities for the years ended December 31, 2014, 2013 and 2012 reflect the reclassification of changes in book overdrafts from a financing activity to an operating activity. See the section entitled "Reclassifications" in Note 2 to our audited financial statements included elsewhere in this Annual Report on Form 10-K. |
(2) | Adjusted EBITDA is defined as income (loss) from continuing operations plus interest expense, income tax expense (benefit), depreciation and amortization, impairment of assets held for sale, Merger-related costs, restructuring expense, inventory step-up charges, non-cash stock compensation expense, acquisition costs, headquarters relocation costs, insurance deductible reserve adjustments, loss portfolio transfer costs and other items. Adjusted EBITDA is intended as a supplemental measure of our performance that is not required by, or presented in accordance with, U.S. generally accepted accounting principles (“GAAP”). We believe that Adjusted EBITDA provides useful information to management and investors regarding certain financial and business trends relating to our financial condition and operating results. Our management uses Adjusted EBITDA to compare our performance to that of prior periods for trend analyses, for purposes of determining management incentive compensation and for budgeting and planning purposes. Adjusted EBITDA is used in monthly financial reports prepared for management and our Board. We believe that the use of Adjusted EBITDA provides additional tools for investors to use in evaluating ongoing operating results and trends and in comparing our financial measures with other distribution and retail companies, which may present similar non-GAAP financial measures to investors. However, our calculation of Adjusted EBITDA is not necessarily comparable to similarly titled measures reported by other companies. Our management does not consider Adjusted EBITDA in isolation or as an alternative to financial measures determined in accordance with GAAP. The principal limitation of Adjusted EBITDA is that it excludes significant expenses and income that are required by GAAP to be recorded in the Company’s financial statements. Some of these limitations are: (i) Adjusted EBITDA does not reflect changes in, or cash requirements for, our working capital needs; (ii) Adjusted EBITDA does not reflect our interest expense, or the requirements necessary to service interest or principal payments on our debt; (iii) Adjusted EBITDA does not reflect our income tax expenses or the cash requirements to pay our taxes; (iv) Adjusted EBITDA does not reflect historical cash expenditures or future requirements for capital expenditure or contractual commitments; (v) although depreciation and amortization charges are non-cash charges, the assets being depreciated and amortized will often have to be replaced in the future and Adjusted EBITDA does not reflect any cash requirements for such replacements and (vi) Adjusted EBITDA does not consider the potentially dilutive impact of issuing non-cash stock-based compensation. In order to compensate for these limitations, management presents Adjusted EBITDA in conjunction with GAAP results. You should review the reconciliation of income (loss) from continuing operations to Adjusted EBITDA below, and should not rely on any single financial measure to evaluate our business. |
28
The following is a reconciliation of net income (loss) to Adjusted EBITDA:
Year Ended December 31, | |||||||||||||||||||
(in thousands) | 2015 | 2014 | 2013 | 2012 | 2011 | ||||||||||||||
Net (loss) income | $ | (4,831 | ) | $ | 94,032 | $ | 21,655 | $ | (17,533 | ) | $ | (35,041 | ) | ||||||
Interest expense | 27,552 | 27,090 | 18,786 | 14,159 | 14,333 | ||||||||||||||
Income tax expense (benefit) | (9,689 | ) | (65,577 | ) | 6,273 | (6 | ) | (99 | ) | ||||||||||
Depreciation and amortization | 24,589 | 15,457 | 13,767 | 13,248 | 16,509 | ||||||||||||||
Impairment of assets held for sale | — | 134 | 73 | 1,098 | 3,064 | ||||||||||||||
Merger-related costs | 22,993 | — | — | — | — | ||||||||||||||
Restructuring expense | — | — | — | 631 | 2,324 | ||||||||||||||
Inventory step-up charges (a) | 10,285 | — | — | — | — | ||||||||||||||
Non-cash stock compensation expense | 2,749 | 3,410 | 2,425 | 2,054 | 2,565 | ||||||||||||||
Headquarters relocation (b) | 3,865 | 2,054 | — | — | — | ||||||||||||||
Insurance deductible reserve adjustments and casualty fire loss (c) | 3,026 | 669 | 1,772 | 7,462 | (1,214 | ) | |||||||||||||
Loss portfolio transfer (d) | 2,826 | — | — | — | — | ||||||||||||||
Acquisition costs and other items (e) | 2,677 | — | — | — | — | ||||||||||||||
Adjusted EBITDA | $ | 86,042 | $ | 77,269 | $ | 64,751 | $ | 21,113 | $ | 2,441 | |||||||||
(a) | Represents expense incurred in relation to the sell-through of SBS inventory which was stepped up in value in connection with the Merger. |
(b) | Represents expenses to relocate BMC's headquarters to Atlanta, Georgia. |
(c) | Represents (i) for the years 2011-2015, adjustments to deductible reserves for workers' compensation, general liability, automobile and construction claims incurred prior to BMC's restructuring and (ii) for 2015, a casualty loss related to a fire at one of the Company’s facilities during 2015. |
(d) | Represents premium and brokerage fees paid to a reinsurer for their assumption of the insurance deductible reserves relating to workers' compensation claims incurred for claim years from 2006 through 2011. |
(e) | Primarily represents costs related to: (i) evaluation of acquisition candidates; (ii) due diligence costs paid to professional service firms; and (iii) other acquisition related expenditures. |
29
Item 7. Management's Discussion and Analysis of Financial Condition and Results of Operations
The following discussion and analysis should be read in conjunction with Item 6. “Selected Financial Data” and our consolidated financial statements and the related notes to those statements included in Item 8. “Financial Statements and Supplementary Data.” The following discussion contains, in addition to historical information, forward-looking statements that involve risks, uncertainties and assumptions. Our actual results may differ materially from those anticipated in these forward-looking statements as a result of many factors, including those set forth under the heading Item IA. “Risk Factors” and elsewhere in this report.
Overview
On December 1, 2015, SBS completed the Merger with privately-held BMC in accordance with the terms of the Merger Agreement, pursuant to which BMC merged with and into SBS. SBS survived the Merger and in connection therewith changed its name to “BMC Stock Holdings, Inc.” The financial statements represent the financial statements of BMC Stock Holdings, Inc. and its subsidiaries.
Under generally accepted accounting principles in the United States, the Merger is treated as a “reverse merger” under the acquisition method of accounting. For accounting purposes, BMC is considered to have acquired SBS. Consequently, the historical financial statements of the Company reflect only the operations and financial condition of BMC. The operating results of SBS are reported as part of the Company beginning on the closing date of the Merger.
We are a diversified lumber and building materials distributor and solutions provider that sells to new construction and repair and remodeling contractors. We carry a broad line of products and have operations throughout the United States. Our primary products are lumber & lumber sheet goods, millwork, doors, flooring, windows, structural components such as EWP, trusses and wall panels and other exterior products. Additionally, we provide solution-based services to our customers, including design, product specification, installation and installation management services. We serve a broad customer base, including large-scale production homebuilders, custom homebuilders and repair and remodeling contractors. We offer a broad range of products sourced through a strategic network of suppliers, which together with our various solution-based services, represent approximately 50% of the construction cost of a typical new home. By enabling our customers to source a significant portion of their materials and services from one supplier, we have positioned ourselves as the supply partner of choice for many of our customers.
We have operations in 17 states, which states accounted for approximately 63% of 2015 U.S. single-family housing permits according to the U.S. Census Bureau. In these 17 states, we operate in 42 metropolitan areas.
Primarily as a result of the improving conditions in the residential construction market, the Merger and two acquisitions, our net sales for the year ended December 31, 2015 increased 20.2%. We estimate sales increased 7.0% due to organic sales volume and 17.9% due to the Merger and acquisitions of VNS and RBI, and decreased 5.0% due to commodity price deflation. Our gross margin was 22.9% for the year ended December 31, 2015 compared to 22.5% for the prior year period. We recorded income from operations of $12.2 million during the year ended December 31, 2015, compared with $54.1 million during the year ended December 31, 2014. See further discussion in “-Operating Results” below.
Factors Affecting Our Operating Results
Our operating results and financial performance are influenced by a variety of factors, including, among others, acquisitions, conditions in the housing market and economic conditions generally, changes in the cost of the products we sell (particularly commodity products), pricing policies of our competitors, production schedules of our customers and seasonality. Some of the more important factors are briefly discussed below.
Merger and acquisitions
On September 1, 2015, Legacy BMC purchased certain assets and assumed certain liabilities of Marietta, Georgia-based RBI for a purchase price of $102.4 million. RBI has three locations in the Atlanta, Georgia area and sells millwork and window products to homebuilders and residential contractors.
On May 1, 2015, Legacy BMC completed the acquisition of Vidalia, Georgia-based VNS for a purchase price of $47.1 million. VNS has nine locations in southern Georgia and sells building materials and provides construction services in the southeastern United States.
30
Net sales increased by approximately $235.0 million for the year ended December 31, 2015 as a result of the Merger and acquisitions of RBI and VNS.
Conditions in the housing and construction market
The building products supply and services industry is highly dependent on new home construction and repair and remodeling activity, which in turn are dependent upon a number of factors, including interest rates, consumer confidence, employment rates, foreclosure rates, housing inventory levels, housing demand, the availability of land, the availability of construction financing and the health of the economy and mortgage markets. The homebuilding industry underwent a significant downturn that began in mid-2006 and began to stabilize in late 2011. According to the U.S. Census Bureau, single-family housing starts in 2015, 2014 and 2013 were 0.71 million, 0.65 million and 0.62 million respectively, which was significantly less than the 50-year average rate of approximately 1.0 million. Single-family houses under construction as of December 31, 2015, 2014 and 2013 were 0.40 million, 0.34 million and 0.32 million, respectively. There remains uncertainty regarding the timing and extent of any recovery in construction and repair and remodeling activity and resulting product demand levels. Many industry forecasters expect to see continued improvement in housing demand over the next few years. For example, as of December 2015, McGraw-Hill Construction forecasts that U.S. single-family housing starts will increase to 0.8 million by 2016. We believe there are several trends that indicate U.S. housing demand will likely recover in the long term and that the recent downturn in the housing industry is likely a trough in the cyclical nature of the residential construction industry. We believe that these trends are supported by positive economic and demographic indicators that are beginning to take hold in many of the markets in which we operate. These indicators, which we believe are typically indicative of housing market strength, include declining unemployment rates, rising home values, increasing household formations and a favorable consumer interest rate environment supporting affordability and home ownership.
Overall economic conditions in the markets where we operate
Economic changes both nationally and locally in our markets impact our financial performance. Unfavorable changes in demographics, credit markets, consumer confidence, health care costs, housing affordability, housing inventory levels, a weakening of the national economy or of any regional or local economy in which we operate and other factors beyond our control could adversely affect consumer spending, result in decreased demand for homes and adversely affect our business. We believe continued employment growth, prospective home buyers’ access to financing and improved consumer confidence will be necessary to increase household formation rates. We believe improved household formation rates in turn will increase demand for housing and stimulate new construction.
Commodity nature of our products
Many of the building products we distribute, including lumber, OSB, plywood and particleboard, are commodities that are widely available from other manufacturers or distributors with prices and volumes determined frequently based on participants’ perceptions of short-term supply and demand factors.
The following table reflects changes in the average composite framing lumber prices (per thousand board feet) and average composite structural panel prices (per thousand square feet). These prices represent transactions between manufacturers and their customers as reported by Random Lengths and may differ in magnitude or timing from the actual selling prices or cost of goods reported in our operating results. The average composite structural panel prices are based on index prices for OSB and plywood.
Year Ended December 31, | |||||||||||||||||||||
2015 Versus 2014 | 2015 Average Price | 2014 Versus 2013 | 2014 Average Price | 2013 Versus 2012 | 2013 Average Price | ||||||||||||||||
Change in framing lumber prices | (14 | )% | $ | 330 | — | % | $ | 383 | 19 | % | $ | 384 | |||||||||
Change in structural panel prices | (5 | )% | $ | 365 | (10 | )% | $ | 385 | 11 | % | $ | 426 | |||||||||
Periods of increasing prices provide the opportunity for higher sales and increased gross profit, while periods of declining prices may result in declines in sales and profitability. In particular, low market prices for wood products over a sustained period can adversely affect our financial condition, operating results and cash flows, as can excessive spikes in market prices. For further discussion of the impact of commodity prices on historical periods, see “-Operating Results.”
31
Consolidation of large homebuilders
Over the past ten years, the homebuilding industry has undergone consolidation and many larger homebuilders have increased their market share. We expect that trend to continue as larger homebuilders have better liquidity and land positions relative to the smaller, less capitalized homebuilders. Our focus is on maintaining relationships and market share with these customers while balancing the competitive pressures we face in our markets with certain profitability expectations. We expect that our ability to maintain strong relationships with the largest builders will be vital to our ability to expand into new markets as well as grow our market share. While we generate significant sales from these homebuilders, our gross margins on sales to them tend to be lower than our gross margins on sales to other market segments. This could impact our gross margins as homebuilding recovers if the market share held by the production homebuilders continues to increase.
Our ability to control expenses
We pay close attention to managing our working capital and operating expenses. We employ a LEAN process operating philosophy, which encourages continuous improvement in our core processes to minimize waste, improve customer service, increase expense productivity, improve working capital and maximize profitability and cash flow. We regularly analyze our workforce productivity to achieve the optimum, cost-efficient labor mix for our facilities. Further, we pay careful attention to our logistics function and have implemented GPS-based technology across certain markets to improve customer service and improve productivity of our shipping and handling costs.
Mix of products sold
We typically realize greater gross margins on more highly engineered and customized products, or ancillary products that are often purchased based on convenience and are therefore less price sensitive to our customers. For example, sales of lumber & lumber sheet goods tend to generate lower gross margins due to their commodity nature and the relatively low switching costs of sourcing those products from different suppliers. Structural components and millwork, windows & doors often generate higher gross profit dollars relative to other products. Homebuilders often use structural components in order to realize increased efficiency and improved quality. We believe shortening cycle time from start to completion is a key goal of homebuilders during periods of strong consumer demand or limited availability of framing labor. As the residential new construction market continues to strengthen, we expect the use of structural components by homebuilders to increase.
Changes in sales mix among construction segments
Our operating results may vary according to the amount and type of products we sell to each of our four primary construction segments: new single-family construction; remodeling; multi-family and light commercial. The following table reflects our estimate of net sales by construction segment:
2015 | 2014 | 2013 | ||||||||||||||||||||||||
(in thousands) | Net Sales | % of Sales | % Change vs. 2014 | Net Sales | % of Sales | % Change vs. 2013 | Net Sales | % of Sales | ||||||||||||||||||
Single-family home builders | $ | 1,258,938 | 79.8 | % | 20.4 | % | $ | 1,045,806 | 79.7 | % | 7.1 | % | $ | 976,113 | 80.7 | % | ||||||||||
Remodeling contractors | 135,184 | 8.6 | % | 17.4 | % | 115,144 | 8.8 | % | 12.5 | % | 102,387 | 8.5 | % | |||||||||||||
Other (including multi-family & light commercial) | 182,624 | 11.6 | % | 21.3 | % | 150,548 | 11.5 | % | 14.3 | % | 131,656 | 10.8 | % | |||||||||||||
Total net sales | $ | 1,576,746 | 100.0 | % | 20.2 | % | $ | 1,311,498 | 100.0 | % | 8.4 | % | $ | 1,210,156 | 100.0 | % | ||||||||||
We tend to realize higher gross margins on sales to the remodeling segment due to the smaller product volumes purchased by those customers, as well as the more customized nature of the projects those customers generally undertake. Gross margins within the new single-family, multi-family and light commercial construction segments can vary based on a variety of factors, including the purchase volumes of the individual customer, the mix of products sold to that customer, the size and selling price of the project being constructed and the number of upgrades added to the project before or during its construction.
32
Freight costs and fuel charges
A portion of our shipping and handling costs is comprised of diesel or other fuels purchased for our delivery fleet. According to the U.S. Energy Information Administration, the average retail price per gallon for No. 2 diesel fuel was $2.71, $3.83 and $3.92 for the years ended December 31, 2015, 2014 and 2013, respectively. For the year ended December 31, 2015, we incurred costs of approximately $10.5 million within selling, general and administrative expenses for diesel and other fuels. Future increases in the cost of fuel, or inbound freight costs for the products we purchase, could impact our operating results and cash flows if we are unable to pass along these cost increases to our customers through increased prices.
Operating Results
The following tables set forth our operating results in dollars and as a percentage of net sales for the periods indicated:
Year Ended December 31, | |||||||||||||||||||||
(in thousands) | 2015 | 2014 | 2013 | ||||||||||||||||||
Net sales | $ | 1,576,746 | 100.0 | % | $ | 1,311,498 | 100.0 | % | $ | 1,210,156 | 100.0 | % | |||||||||
Cost of goods sold | 1,215,336 | 77.1 | % | 1,016,424 | 77.5 | % | 953,609 | 78.8 | % | ||||||||||||
Gross profit | 361,410 | 22.9 | % | 295,074 | 22.5 | % | 256,547 | 21.2 | % | ||||||||||||
Operating expenses: | |||||||||||||||||||||
Selling, general and administrative expenses | 306,843 | 19.5 | % | 229,316 | 17.5 | % | 200,588 | 16.6 | % | ||||||||||||
Depreciation expense | 15,700 | 1.0 | % | 11,492 | 0.9 | % | 9,168 | 0.8 | % | ||||||||||||
Amortization expense | 3,626 | 0.2 | % | — | 0.0 | % | 1,310 | 0.1 | % | ||||||||||||
Impairment of assets held for sale | — | 0.0 | % | 134 | 0.0 | % | 73 | 0.0 | % | ||||||||||||
Merger-related costs | 22,993 | 1.5 | % | — | 0.0 | % | — | 0.0 | % | ||||||||||||
Income from operations | 12,248 | 0.8 | % | 54,132 | 4.1 | % | 45,408 | 3.8 | % | ||||||||||||
Other income (expenses) | |||||||||||||||||||||
Interest expense | (27,552 | ) | (1.7 | )% | (27,090 | ) | (2.1 | )% | (18,786 | ) | (1.6 | )% | |||||||||
Other income (expense), net | 784 | 0.0 | % | 1,413 | 0.1 | % | 1,306 | 0.1 | % | ||||||||||||
(Loss) income before income taxes | (14,520 | ) | (0.9 | )% | 28,455 | 2.2 | % | 27,928 | 2.3 | % | |||||||||||
Income tax (benefit) expense | (9,689 | ) | (0.6 | )% | (65,577 | ) | (5.0 | )% | 6,273 | 0.5 | % | ||||||||||
Net (loss) income | $ | (4,831 | ) | (0.3 | )% | $ | 94,032 | 7.2 | % | $ | 21,655 | 1.8 | % | ||||||||
2015 compared to 2014
Net sales
For the year ended December 31, 2015, net sales increased $265.2 million, or 20.2%, to $1,576.7 million from $1,311.5 million during the year ended December 31, 2014. The increase in net sales was driven primarily by increased volume of approximately 7.0% related to existing operations and 17.9% related to the Merger and acquisitions of VNS and RBI, while the impact of commodity price deflation decreased net sales by approximately 5.0%. We estimate approximately 80% of our net sales for the year ended December 31, 2015 were to customers engaged in new single-family construction. According to the U.S. Census Bureau, single-family housing starts increased approximately 10.3% for the year ended December 31, 2015 as compared to the prior year, while single-family houses completed increased 4.5% during the same time period.
33
The following table shows net sales classified by major product category:
2015 | 2014 | ||||||||||||||||
(in thousands) | Net Sales | % of Sales | Net Sales | % of Sales | % Change | ||||||||||||
Structural components | $ | 249,371 | 15.8 | % | $ | 205,036 | 15.6 | % | 21.6 | % | |||||||
Lumber & sheet goods | 459,446 | 29.1 | % | 428,084 | 32.6 | % | 7.3 | % | |||||||||
Millwork, doors & windows | 442,675 | 28.1 | % | 328,063 | 25.0 | % | 34.9 | % | |||||||||
Other building products & services | 425,254 | 27.0 | % | 350,315 | 26.8 | % | 21.4 | % | |||||||||
Total net sales | $ | 1,576,746 | 100.0 | % | $ | 1,311,498 | 100.0 | % | 20.2 | % | |||||||
Cost of goods sold
For the year ended December 31, 2015, cost of goods sold increased $198.9 million, or 19.6%, to $1,215.3 million from $1,016.4 million during the year ended December 31, 2014. We estimate our cost of sales increased approximately 18.6% as a result of the Merger and acquisitions of VNS and RBI, while organic change accounted for an increase of 1.0%.
Gross profit
For the year ended December 31, 2015, gross profit increased $66.3 million, or 22.5%, to $361.4 million from $295.1 million for the year ended December 31, 2014, driven primarily by increased sales volumes, the Merger and the acquisitions of VNS and RBI. Our gross margin was 22.9% for the year ended December 31, 2015 and 22.5% for the year ended December 31, 2014. This increase was primarily driven by a higher percentage of total net sales being derived from non-commodity product offerings.
Operating expenses
For the year ended December 31, 2015:
• | selling, general and administrative expenses increased $77.5 million, or 33.8%, to $306.8 million, or 19.5% of net sales, from $229.3 million, or 17.5% of net sales, for the year ended December 31, 2014. Approximately $44.1 million of this increase related to the operations of Legacy SBS, VNS and RBI, while $30.3 million related to Legacy BMC existing operations. The increase in SG&A related to Legacy BMC existing operations was driven primarily by higher salary, wage, benefit and other variable costs to serve higher sales volume, increased insurance costs, headquarters relocation costs and third party costs associated with the acquisitions of VNS and RBI. |
• | depreciation expense increased $4.2 million, or 36.6%, to $15.7 million from $11.5 million during the year ended December 31, 2014, primarily as a result of fixed assets acquired through the Merger and acquisitions of VNS and RBI, as well as replacements and additions of delivery fleet, material handling equipment and operating equipment. |
• | amortization expense was $3.6 million compared to $0 in the prior year. The amortization expense recognized in 2015 relates to intangible assets acquired through the Merger and acquisitions of VNS and RBI. |
• | the Company incurred $23.0 million of Merger-related costs which primarily included third-party advisory, legal, accounting and other professional fees and severance costs. |
Interest expense
For the year ended December 31, 2015, interest expense was $27.6 million compared to $27.1 million for the year ended December 31, 2014. This increase relates primarily to borrowings on Legacy BMC's Revolver (the "Legacy BMC Revolver") used to fund the purchase of RBI in September 2015.
34
Income tax
For the year ended December 31, 2015, income tax benefit was $9.7 million compared to $65.6 million for the year ended December 31, 2014. The effective tax rate for the year ended December 31, 2015 was 66.7% compared to (230.5)% for the year ended December 31, 2014. The change in the tax rate is primarily due to the release of valuation allowance against deferred tax assets of $75.2 million creating a tax rate decrease of 267.6% during 2014, and an increase in income tax benefit of $8.1 million during 2015 related to the adoption of a tax position involving change of control limitations on the Company's federal and state net operating loss carry-forwards and other built-in losses under Internal Revenue Code ("IRC") section 382.
2014 compared to 2013
Net sales
For the year ended December 31, 2014, net sales increased $101.3 million, or 8.4%, to $1,311.5 million from $1,210.2 million during the year ended December 31, 2013. The increase in net sales was driven primarily by increased volume of approximately 10.8%, while the impact of commodity price deflation decreased net sales by approximately 2.4%. We estimate approximately 80% of our net sales for the year ended December 31, 2014 were to customers engaged in new single-family construction. According to the U.S. Census Bureau, single-family housing starts increased approximately 4.9% for the year ended December 31, 2014 as compared to the prior year, while single-family houses completed increased 8.9% during the same time period.
The following table shows net sales classified by major product category:
2014 | 2013 | ||||||||||||||||
(in thousands) | Net Sales | % of Sales | Net Sales | % of Sales | % Change | ||||||||||||
Structural components | $ | 205,036 | 15.6 | % | $ | 190,626 | 15.8 | % | 7.6 | % | |||||||
Lumber & sheet goods | 428,084 | 32.6 | % | 419,436 | 34.7 | % | 2.1 | % | |||||||||
Millwork, doors & windows | 328,063 | 25.0 | % | 278,704 | 23.0 | % | 17.7 | % | |||||||||
Other building products & services | 350,315 | 26.8 | % | 321,390 | 26.5 | % | 9.0 | % | |||||||||
Total net sales | $ | 1,311,498 | 100.0 | % | $ | 1,210,156 | 100.0 | % | 8.4 | % | |||||||
Cost of goods sold
For the year ended December 31, 2014, cost of goods sold increased $62.8 million, or 6.6%, to $1,016.4 million from $953.6 million during the year ended December 31, 2013 primarily as as result of higher sales volume.
Gross profit
For the year ended December 31, 2014, gross profit increased $38.5 million, or 15.0%, to $295.1 million from $256.5 million for the year ended December 31, 2013, driven primarily by increased sales volumes. Our gross margin was 22.5% for the year ended December 31, 2014 and 21.2% for the year ended December 31, 2013. This increase was primarily driven by a higher percentage of total net sales being derived from non-commodity product offerings.
Operating expenses
For the year ended December 31, 2014:
• | selling, general and administrative expenses increased $28.7 million, or 14.3%, to $229.3 million, or 17.5% of net sales, from $200.6 million, or 16.6% of net sales, for the year ended December 31, 2013. This increase was was driven primarily by higher salary, wage, incentive compensation costs and other variable costs to serve higher sales volume, costs associated with implementation of Legacy BMC's ERP system and costs associated with relocating the Company's headquarters from Boise, Idaho to Atlanta, Georgia. |
• | depreciation expense increased $2.3 million, or 25.3%, to $11.5 million from $9.2 million during the year ended December 31, 2013, driven primarily by replacements and addition of delivery fleet and handling equipment. |
• | amortization expense decreased to $0 from $1.3 million for the year ended December 31, 2013, due primarily to full amortization of certain intangible assets in 2013. |
35
Interest expense
For the year ended December 31, 2014, interest expense was $27.1 million compared to $18.8 million for the year ended December 31, 2013. This increase was primarily due to a $9.1 million increase in interest expense due to higher interest rates related to a refinancing of Legacy BMC's debt in September 2013, described below under "Historical Cash Flow Information - Cash flows from financing activities." Legacy BMC incurred $10.3 million of debt issuance costs during 2013 related to this refinancing, which led to a $1.0 million increase in debt issuance cost amortization for 2014 compared to 2013. These increases were offset by a $2.1 million decrease due to Legacy BMC not borrowing under the Legacy BMC Revolver during 2014, as well as a reduction in outstanding letters of credit.
Income tax
For the year ended December 31, 2014, the Company recognized income tax benefit of $65.6 million compared to income tax expense of $6.3 million for the year ended December 31, 2013. The effective tax rate for the year ended December 31, 2014 was (230.5)% compared to 22.5% for the year ended December 31, 2013. Excluding a discrete tax impact of $76.1 million related to the reversal of valuation allowances during the second quarter of 2014, the effective tax rate for the year ended December 31, 2014 was 37.1%, which varied from the federal statutory rate of 35% primarily due to state taxes and other non-deductible items. The effective tax rate for the year ended December 31, 2013 was 22.5%, which varied from the federal statutory rate of 35% primarily due to the use of net operating losses generated in prior years. These net operating losses generated prior to November 2011 are limited by IRC section 382.
Liquidity and Capital Resources
Our primary capital requirements are to fund working capital needs and operating expenses, meet required interest and principal payments and fund capital expenditures. During 2015 and 2014, our capital resources have primarily consisted of cash and cash equivalents generated through operating cash flows and remaining proceeds from the Senior Notes issued in 2013, as well as borrowings under our Revolver.
The homebuilding industry, and therefore our business, experienced a significant downturn that started in 2006. However, activity improved beginning in 2012 and gradual improvements in housing starts have continued through 2015. Beyond 2015, it is difficult for us to predict what will happen as our industry is dependent on a number of factors, including, among others, national economic conditions, employment levels, the availability of credit for homebuilders and potential home buyers, the level of foreclosures, existing home inventory and interest rates.
Our liquidity at December 31, 2015 was $128.4 million, which includes $1.1 million in cash and cash equivalents and $127.3 million of unused borrowing capacity under our Revolver.
We believe that our cash flows from operations, combined with our current cash levels and available borrowing capacity, will be adequate to fund debt service requirements and provide cash, as required, to support our ongoing operations, capital expenditures, lease obligations and working capital for at least the next 12 months.
Historical Cash Flow Information
Adjusted working capital* and net current assets
Adjusted working capital was $334.6 million and $136.2 million as of December 31, 2015 and 2014, respectively, and net current assets (current assets less current liabilities) were $335.7 million and $235.6 million as of December 31, 2015 and 2014 , respectively, as summarized in the following table:
36
(in thousands) | December 31, 2015 | December 31, 2014 | ||||||
Accounts receivable, net | $ | 303,176 | $ | 126,652 | ||||
Inventories, net | 243,960 | 104,538 | ||||||
Other current assets | 54,345 | 21,527 | ||||||
Income taxes receivable | 11,390 | 6,010 | ||||||
Total current liabilities | (278,307 | ) | (122,513 | ) | ||||
Total adjusted working capital* | 334,564 | 136,214 | ||||||
Cash and cash equivalents | 1,089 | 63,262 | ||||||
Restricted assets | — | 36,106 | ||||||
Total net current assets | $ | 335,653 | $ | 235,582 | ||||
* Adjusted working capital is a non-GAAP financial measure that management uses to assess the Company’s financial position and liquidity. Management believes adjusted working capital provides investors with an additional view of the Company’s liquidity and ability to repay current obligations. We calculate adjusted working capital as current assets, as determined under GAAP, excluding cash and cash equivalents and restricted assets, minus current liabilities, as determined under GAAP, excluding the Revolver. The presentation of this additional information is not meant to be considered superior to, in isolation of or as a substitute for results prepared in accordance with GAAP. Our calculation of adjusted working capital is not necessarily comparable to similarly titled measures reported by other companies.
Accounts receivable, net, increased $176.5 million from December 31, 2014 to December 31, 2015 primarily as a result of the Merger, acquisitions of VNS and RBI and a year-over-year increase in sales. Days sales outstanding at December 31, 2015 and 2014 (measured against net sales in the fourth quarter of each period and including pre-acquisition sales of Legacy SBS for the fourth quarter of 2015) were approximately 37 and 37 days, respectively.
Inventories, net, increased $139.4 million from December 31, 2014 to December 31, 2015 primarily as a result of the Merger, acquisitions of VNS and RBI and increases in inventory purchases to support higher net sales. Inventory days on hand at December 31, 2015 and 2014 (measured against cost of goods sold in the fourth quarter of each period and including pre-acquisition cost of goods sold of Legacy SBS for the fourth quarter of 2015) were approximately 39 days for each period.
Other current assets, which includes prepaid expenses and other current assets and costs in excess of billings on uncompleted contracts, increased $32.8 million from December 31, 2014 to December 31, 2015 due primarily to a $22.2 million increase in prepaid expenses and costs in excess of billings on uncompleted contracts related to Legacy SBS operations.
Income taxes receivable increased $5.4 million from December 31, 2014 to December 31, 2015 due primarily to additional tax depreciation and repair deductions from new tax regulations resulting in an increase in expected tax refunds on the Company's 2014 and 2015 tax returns.
Total current liabilities increased $155.8 million from December 31, 2014 to December 31, 2015 primarily as a result of the Merger and acquisitions of VNS and RBI. Legacy BMC accounts payable increased approximately $10.5 million from December 31, 2014 to December 31, 2015 due to an increase in the volume of inventory purchases in connection with higher sales volume.
Cash flows from operating activities
Net cash provided by operating activities was $0.7 million, $30.7 million and $15.4 million for the years ended December 31, 2015, 2014 and 2013, respectively, as summarized in the following table:
Year Ended December 31, | ||||||||||||
(in thousands) | 2015 | 2014 | 2013 | |||||||||
Net (loss) income | $ | (4,831 | ) | $ | 94,032 | $ | 21,655 | |||||
Non-cash expenses | 40,392 | 21,535 | 17,625 | |||||||||
Gain on sale of property, equipment and real estate | (497 | ) | (804 | ) | (772 | ) | ||||||
Change in deferred income taxes | (5,892 | ) | (70,492 | ) | — | |||||||
Change in working capital and other | (28,429 | ) | (13,539 | ) | (23,151 | ) | ||||||
Net cash provided by operating activities | $ | 743 | $ | 30,732 | $ | 15,357 | ||||||
37
Net cash provided by (used in) operating activities declined by $30.0 million for the year ended December 31, 2015 as compared to the year ended December 31, 2014 primarily due to the following:
• | Net income declined by $98.9 million to a net loss as discussed in “Operating Results” above. |
• | Non-cash expenses increased by $18.9 million primarily as a result of increases in depreciation and amortization expense, which was driven primarily by fixed assets and intangible assets acquired through the Merger and acquisitions of VNS and RBI. |
• | Change in deferred income taxes declined by $64.6 million due primarily to the reversal of $75.2 million of valuation allowance against deferred tax assets during 2014 and the Company's adoption of a tax position related to IRC section 382 limitations which increased its deferred tax assets by $8.1 million during 2015. |
• | Cash outflows from working capital and other relate primarily to increases in accounts receivable and inventory in relation to higher sales volume, offset by increases to accounts payable. |
Net cash used in operating activities increased by $15.4 million for the year ended December 31, 2014 as compared to the year ended December 31, 2013 primarily due to the following:
• | Net income increased by $72.4 million as discussed in “Operating Results” above. |
• | Non-cash expenses increased by $3.9 million primarily as a result of an increase in depreciation expense related primarily to additions and replacement of delivery and handling equipment to handle higher sales volume and an increase in amortization of deferred loan costs related to costs incurred with a refinancing in September 2013. |
• | Change in deferred income taxes increased by $70.5 million due primarily to the reversal of $75.2 million of valuation allowances against deferred tax assets during 2014. |
• | Cash outflows from working capital and other relate primarily to increases in accounts receivable and inventory in relation to higher sales volume, offset by increases to accounts payable. |
Cash flows from investing activities
Net cash used in investing activities was $135.1 million, $16.3 million and $64.0 million for the years ended December 31, 2015, 2014 and 2013, respectively, as summarized in the following table:
Year Ended December 31, | ||||||||||||
(in thousands) | 2015 | 2014 | 2013 | |||||||||
Purchases of property, equipment and real estate | $ | (31,319 | ) | $ | (28,275 | ) | $ | (15,057 | ) | |||
Cash acquired in the Merger | 6,342 | — | — | |||||||||
Purchases of businesses, net of cash acquired | (149,485 | ) | (236 | ) | (6,705 | ) | ||||||
Change in restricted assets | 36,106 | 10,326 | (46,432 | ) | ||||||||
Other investing activities | 3,280 | 1,923 | 4,195 | |||||||||
Net cash used in investing activities | $ | (135,076 | ) | $ | (16,262 | ) | $ | (63,999 | ) | |||
Cash used for the purchase of property, equipment and real estate for the years ended December 31, 2015, 2014 and 2013 resulted primarily from the purchase of vehicles and equipment to support increased sales volume and replace aged assets, the upgrade and expansion of truss, millwork and other manufacturing equipment, and costs related to the design and implementation of our NetSuite ERP system.
Cash acquired in the Merger of $6.3 million represents cash and cash equivalents of Legacy SBS on the closing date of the Merger.
Cash used for purchases of businesses in 2015 relates to the acquisition of VNS for $47.1 million on May 1, 2015 and the acquisition of RBI for $102.4 million on September 1, 2015. Cash used for purchases of businesses during 2013 relates to the acquisition of a millwork business located in northern California.
38
During 2013, Legacy BMC deposited $46.4 million in a separate bank account to collateralize letters of credit related to insurance claims for periods prior to January 2010. During 2014 and 2015, Legacy BMC was able to release these amounts into unrestricted cash as a result of reductions in claims and the transfer of the risk of loss of remaining claims to a reinsurer in January 2015.
Other investing activities relates primarily to proceeds from sale of property, equipment and real estate.
Cash flows from financing activities
Net cash provided by (used in) financing activities was $72.2 million, $(0.4) million and $96.1 million for the years ended December 31, 2015, 2014 and 2013, respectively, as summarized in the following table:
Year Ended December 31, | ||||||||||||
(in thousands) | 2015 | 2014 | 2013 | |||||||||
Net proceeds from (repayments of) Revolver | $ | 84,546 | $ | — | $ | (40,000 | ) | |||||
Proceeds from Senior Notes, net of original issue discount | — | — | 248,778 | |||||||||
Principal payments on subordinate term notes | — | — | (102,825 | ) | ||||||||
Debt issuance costs | (3,567 | ) | (10 | ) | (10,785 | ) | ||||||
Borrowings under other notes | 2,491 | 9,991 | 3,660 | |||||||||
Payments on capital leases and other notes | (10,623 | ) | (9,812 | ) | (4,822 | ) | ||||||
Other financing activities, net | (687 | ) | (593 | ) | 2,092 | |||||||
Net cash provided by (used in) financing activities | $ | 72,160 | $ | (424 | ) | $ | 96,098 | |||||
Proceeds from the Revolver, net of repayments, of $84.5 million for the year ended December 31, 2015 relates primarily to amounts borrowed to purchase RBI in September 2015, as well as purchases of property and equipment. No amounts were borrowed under the Revolver for the year ended December 31, 2014.
The debt issuance costs incurred during 2015 relate primarily to third-party and lender costs incurred in relation to the Credit Agreement.
During 2013, Legacy BMC completed a comprehensive refinancing of its indebtedness, whereby it issued $250.0 million of Senior Notes and used the proceeds from the Senior Notes to repay outstanding borrowings under its Revolver and a subordinate term note. The remaining proceeds earmarked for general corporate purposes. Legacy BMC incurred $10.3 million of debt issuance costs during 2013 related to this refinancing.
Borrowings under other notes relate to long-term notes secured by delivery and handling equipment with various maturities through April 2019 and a term note secured by real property which matures in March 2021. Payments on capital leases and other notes increased during 2015 and 2014 due primarily to new financing of delivery and handling equipment to support higher sales volumes.
Other financing activities, net, consists primarily of excess tax benefits related to stock based compensation and purchases of treasury stock related to the surrender of shares by certain employees to the Company to satisfy their tax withholding obligations in connection with the vesting of restricted stock awards.
Capital expenditures
Capital expenditures vary depending on prevailing business factors, including current and anticipated market conditions. We expect our 2016 capital expenditures to be approximately $60 million to $70 million (including the incurrence of capital lease obligations) primarily related to vehicles and equipment, including lease buyouts, facility and technology investments to support our operations and capitalizable ERP development and implementation costs.
Revolving credit facility
On December 1, 2015, in connection with the Merger, the Company entered into the Credit Agreement with Wells Fargo Capital Finance, as administrative agent, and certain other lenders. The Credit Agreement includes the Revolver with maximum availability of $450 million, of which up to $75 million may be used for issuance of letters of credit. The Revolver is subject to an asset-based
39
borrowing formula on eligible accounts receivable, credit card receivables and inventory, in each case reduced by certain reserves. We were in compliance with all debt covenants for the year ended December 31, 2015.
Borrowings under the Revolver bear interest, at our option, at either the Base Rate (which means the higher of (i) the Federal Funds Rate plus 0.5%, (ii) the LIBOR rate plus 1.0% or (iii) the prime rate) plus a Base Rate Margin (which ranges from 0.25% to 0.75% based on Revolver availability) or LIBOR plus a LIBOR Rate Margin (which ranges from 1.25% to 1.75% based on Revolver availability).
The fee on any outstanding letters of credit issued under the Revolver ranges from 0.75% to 1.25%, depending on whether the letters of credit are fully cash collateralized. The fee on the unused portion of the Revolver is 0.25%. The Credit Agreement contains customary nonfinancial covenants, including restrictions on new indebtedness, issuance of liens, investments, distributions to equityholders, asset sales and affiliate transactions. The Credit Agreement includes a financial covenant that requires us to maintain a minimum Fixed Charge Coverage Ratio of 1.00:1:00, as defined therein. However, the covenant is only applicable if excess availability under the Credit Agreement is less than or equal to the greater of (1) $40 million and (2) 10% of the line cap, and remains in effect until excess availability has been greater than the greater of (1) $40 million and (2) 10% of the line cap for 30 consecutive days. While there can be no assurances, based upon our forecast, we do not expect the financial covenant to become applicable during the year ended December 31, 2016.
We had outstanding borrowings of $152.3 million with net availability of $127.3 million as of December 31, 2015. The interest rate on outstanding LIBOR Rate borrowings of $150.0 million ranged from 1.7%-1.9% and the interest rate on outstanding Base Rate borrowings of $2.3 million was 4.0% as of December 31, 2015. We had $64.6 million in letters of credit outstanding under the Credit Agreement as of December 31, 2015.
Senior secured notes
On September 20, 2013, Legacy BMC issued $250.0 million of Senior Notes. The Senior Notes are governed by the Indenture. Concurrent with the Merger, the Company entered into a second supplemental indenture pursuant to which the Company assumed all obligations of Legacy BMC in relation to the Senior Notes. The Senior Notes mature on September 15, 2018 and are secured by a first priority lien on certain property and equipment and a subordinate lien on certain assets. The interest rate is fixed at 9.0% and is payable semiannually in March and September. The Indenture contains customary nonfinancial covenants, including restrictions on new indebtedness, issuance of liens, investments, distributions to equityholders, asset sales and affiliate transactions.
Contractual Obligations and Commercial Commitments
In the table below, we set forth our enforceable and legally binding obligations as of December 31, 2015. Some of the amounts included in the table are based on management's estimates and assumptions about these obligations, including their duration, the possibility of renewal, anticipated actions by third parties and other factors. Because these estimates and assumptions are necessarily subjective, our actual payments may vary from those reflected in the table. Purchase orders made in the ordinary course of business and commitments that are cancellable on 30 days' notice are excluded from the table below. Any amounts for which we are liable under purchase orders are reflected on the consolidated balance sheets as accounts payable and accrued liabilities.
Payments Due by Period | ||||||||||||||||||||
(in millions) | Total | 2016 | 2017-2018 | 2019-2020 | Thereafter | |||||||||||||||
Revolver obligations (1) | $ | 152.6 | $ | 0.3 | $ | 152.3 | $ | — | $ | — | ||||||||||
Senior Notes obligations (2) | 311.9 | 22.5 | 289.4 | — | — | |||||||||||||||
Capital lease obligations (3) | 26.4 | 8.3 | 10.7 | 4.5 | 2.9 | |||||||||||||||
Other long-term debt (4) | 6.3 | 2.8 | 3.2 | 0.3 | — | |||||||||||||||
Operating lease obligations (5) | 137.8 | 27.5 | 41.9 | 27.4 | 41.0 | |||||||||||||||
Purchase commitments (6) | 7.8 | 5.8 | 2.0 | — | — | |||||||||||||||
Earnout obligations (7) | — | — | — | — | — | |||||||||||||||
Total | $ | 642.8 | $ | 67.2 | $ | 499.5 | $ | 32.2 | $ | 43.9 | ||||||||||
40
(1) | Represents principal of $152.3 million and interest payments outstanding on our Revolver of $0.3 million as of December 31, 2015, based on interest rates in effect on December 31, 2015, which ranged from 1.7% to 4.0%. To the extent that a decrease in eligible accounts receivable, credit card receivables and inventory reduces the maximum availability under the Revolver below the amount then outstanding, amounts outstanding could become due sooner than reflected in the table. The Revolver matures at the earlier of December 1, 2020 or the date that is three months prior to the maturity date of the Senior Notes. For purposes of this table, we have assumed a maturity date three months prior to the maturity date of the Senior Notes, or June 2018. For further information, refer to Note 9 to our audited financial statements included elsewhere in this Annual Report on Form 10-K. |
(2) | Represents principal of $250.0 million and semi-annual interest payments at a 9.0% interest rate. The Senior Notes mature in September 2018. For further information, refer to Note 9 to our audited financial statements included elsewhere in this Annual Report on Form 10-K. |
(3) | Represents payments under our capital leases for real estate, fleet vehicles and various equipment. For further information, refer to Note 12 to our audited financial statements included elsewhere in this Annual Report on Form 10-K. |
(4) | Represents payments on term notes secured by delivery and handling equipment with various maturities through April 2019 and a term note secured by real property which matures in March 2021. The interest rates on these notes range from 4.6% to 8.4%. For further information, refer to Note 9 to our audited financial statements included elsewhere in this Annual Report on Form 10-K. |
(5) | Represents payments under our operating leases, primarily for buildings, improvements and equipment. For further information, refer to Note 12 to our audited financial statements included elsewhere in this Annual Report on Form 10-K. |
(6) | Consists primarily of obligations to purchase vehicles which are enforceable and legally binding on us and a commitment for a subscription for our enterprise resource planning software. Excludes purchase orders made in the ordinary course of business that are short-term or cancellable. |
(7) | SBS acquired the assets of Total Building Services Group, LLC ("TBSG") in 2012. As part of the acquisition, SBS entered into an earnout agreement ("Earnout") in which the seller of TBSG participates in earnings over certain thresholds during the three fiscal years beginning January 1, 2013. The Company advanced $0.9 million against future Earnout payments and earns 9% interest on the advanced amount. As of December 31, 2015, the net value of the Earnout and related advance was $0. |
Off-Balance Sheet Arrangements
At December 31, 2015, 2014 and 2013, other than operating leases described above and letters of credit issued under the Credit Agreement, we had no material off-balance sheet arrangements with unconsolidated entities.
Seasonality and Other Factors
Our first and fourth quarters have historically been, and are generally expected to continue to be, adversely affected by weather patterns in some of our markets, causing reduced construction activity. In addition, quarterly results historically have reflected, and are expected to continue to reflect, fluctuations from period to period arising from the following:
• | the volatility of lumber prices; |
• | the cyclical nature of the homebuilding industry; |
• | general economic conditions in the markets in which we compete; |
41
• | the pricing policies of our competitors; |
• | the production schedules of our customers; and |
• | the effects of weather. |
The composition and level of working capital typically change during periods of increasing sales as we carry more inventory and receivables, although this is generally offset in part by higher trade payables to our suppliers. Working capital levels typically increase in the second and third quarters of the year due to higher sales during the peak residential construction season. These increases have in the past resulted in negative operating cash flows during this peak season, which historically have been financed through available cash or excess availability on our Revolver. Collection of receivables and reduction in inventory levels following the peak building and construction season have in the past positively impacted cash flow. In the past, we have also utilized our borrowing availability under credit facilities to cover working capital needs.
Recently Issued Accounting Pronouncements
In May 2014, the Financial Accounting Standards Board (“FASB”) issued Accounting Standards Update 2014-09, Revenue from Contracts with Customers (“ASU 2014-09”). ASU 2014-09 provides a comprehensive revenue recognition model requiring companies to recognize revenue for the transfer of goods or services to a customer at an amount that reflects the consideration it expects to receive in exchange for those goods or services. The guidance also requires additional disclosure about the nature, amount, timing and uncertainty of revenue and cash flows arising from customer contracts. In July 2015, the FASB voted to defer the effective date of ASU 2014-09 by one year, and therefore the standard is effective for the Company’s annual and interim periods beginning on January 1, 2018. Early application is permitted, but only for the Company’s annual and interim periods beginning on January 1, 2017. The guidance permits the use of either a retrospective or cumulative effect transition method. We have not yet selected a transition method and are evaluating the impact of the standard on our financial statements.
In April 2015, the FASB issued Accounting Standards Update No. 2015-05, Customer's Accounting for Fees Paid in a Cloud Computing Arrangement ("ASU 2015-05"). ASU 2015-05 provides guidance to customers about whether a cloud computing arrangement includes a software license. If a cloud computing arrangement includes a software license, then the customer should account for the software license element of the arrangement consistent with the acquisition of other software licenses. If a cloud computing arrangement does not include a software license, the customer should account for the arrangement as a service contract. The guidance will not change GAAP for a customer's accounting for service contracts. ASU 2015-05 is effective for the Company’s annual and interim periods beginning on January 1, 2016. Early adoption is permitted. We are evaluating the impact of the standard on our financial statements.
In July 2015, the FASB issued Accounting Standards Update No. 2015-11, Simplifying the Measurement of Inventory (“ASU 2015-11”). ASU 2015-11 requires that inventory within the scope of the guidance be measured at the lower of cost and net realizable value. Prior to the issuance of the standard, inventory was measured at the lower of cost or market, where market was defined as replacement cost, with a ceiling of net realizable value and floor of net realizable value less a normal profit margin. Inventory measured using last-in, first-out (LIFO) and the retail inventory method are not impacted by the new guidance. Prospective application is required and early adoption is permitted. ASU 2015-11 is effective for the Company’s annual and interim periods beginning on January 1, 2017. We are evaluating the impact of the standard on our financial statements.
In August 2015, the FASB issued Accounting Standards Update No. 2015-15, Interest - Imputation of Interest: Presentation and Subsequent Measurement of Debt Issuance Costs Associated with Line-of-Credit Arrangements - Amendments to SEC Paragraphs Pursuant to Staff Announcement at June 18, 2015 EITF Meeting (“ASU 2015-15”). ASU 2015-15 clarifies the treatment of debt issuance costs for line-of-credit arrangements, which was not addressed in Accounting Standards Update 2015-03, Simplifying the Presentation of Debt Issuance Costs. ASU 2015-15 clarifies that the SEC staff would not object to an entity deferring and presenting debt issuance costs related to a line-of-credit arrangement as an asset and subsequently amortizing the deferred debt issuance costs ratably over the term of such arrangement, regardless of whether there are any outstanding borrowings on the line-of-credit arrangement. ASU 2015-15 is effective for the Company’s annual and interim periods beginning on January 1, 2016. Early adoption is permitted. We are evaluating the impact of the standard on our financial statements.
In September 2015, the FASB issued Accounting Standards Update No. 2015-16, Business Combinations: Simplifying the Accounting for Measurement-Period Adjustments (“ASU 2015-16”). ASU 2015-16 requires that an acquirer recognize adjustments to provisional amounts that are identified during the measurement period in the reporting period in which the adjustment amounts are determined, including the cumulative effect of the change in provisional amount as if the accounting had been completed at the acquisition date. The adjustments related to previous reporting periods since the acquisition date must be disclosed by income statement line item either on the face of the income statement or in the notes. Prospective application is required. The Company early adopted ASU 2015-16 during the fourth quarter of 2015.
42
In November 2015, the FASB issued Accounting Standards Update No. 2015-17, Income Taxes (Topic 740): Balance Sheet Classification of Deferred Taxes ("ASU 2015-17"), which requires management to classify all deferred tax liabilities and assets by jurisdiction as non-current on the balance sheet instead of separating deferred taxes into current and non-current amounts. The standard can be applied either prospectively or retrospectively to all periods presented. ASU 2015-17 is effective for the Company's annual and interim periods beginning on January 1, 2018. The Company elected to early adopt this standard during the fourth quarter of 2015, and elected to apply the retrospective approach. Accordingly, we have reclassified $8.7 million of current deferred tax assets to long-term on our consolidated balance sheet as of December 31, 2014.
In February 2016, the FASB issued Accounting Standards Update 2016-02, Leases ("ASU 2016-02"). The new standard establishes a right-of-use ("ROU") model that requires a lessee to record a ROU asset and a lease liability on the balance sheet for all leases with terms longer than 12 months. Leases will be classified as either finance or operating, with classification affecting the pattern of expense recognition in the income statement. ASU 2016-02 is effective for the Company's annual and interim periods beginning on January 1, 2019. A modified retrospective transition approach is required for lessees for capital and operating leases existing at, or entered into after, the beginning of the earliest comparative period presented in the financial statements, with certain practical expedients available. We are evaluating the impact of the standard on our financial statements.
Critical Accounting Policies
Our discussion and analysis of operating results and financial condition are based upon our audited financial statements. The preparation of our financial statements in accordance with GAAP requires us to make estimates and assumptions that affect the reported amounts of assets, liabilities, revenues, expenses and related disclosures of contingent assets and liabilities. We base our estimates on past experience and other assumptions that we believe are reasonable under the circumstances, and we evaluate these estimates on an ongoing basis. Our critical accounting policies are those that materially affect our financial statements and involve difficult, subjective or complex judgments by management. Although these estimates are based on management’s best knowledge of current events and actions that may impact us in the future, actual results may be materially different from the estimates.
We believe the following critical accounting policies are affected by significant judgments and estimates used in the preparation of our consolidated financial statements and that the judgments and estimates are reasonable.
Revenue recognition
We recognize revenue for sales of building products when products are delivered and the customer takes ownership and assumes risk of loss, collection of the relevant receivable is reasonably assured, persuasive evidence of an arrangement exists and the sales price is fixed or determinable. All sales recognized are net of allowances for discounts and estimated returns, based on historical experience. Taxes assessed by governmental authorities that are directly imposed on our revenue-producing transactions are excluded from sales.
The percentage-of-completion method is used to recognize revenue for construction services. Periodic estimates of progress towards completion are made based on either a comparison of labor costs incurred to date with total estimated contract labor costs or total costs incurred to date with total estimated contract costs. The percentage-of-completion method requires the use of various estimates, including among others, the extent of progress towards completion, contract revenues and contract completion costs. Contract revenues and contract costs to be recognized are dependent on the accuracy of estimates, including quantities of materials, labor productivity and other cost estimates. The Company has a history of making reasonable estimates of the extent of progress towards completion, contract revenues and contract completion costs. Due to uncertainties inherent in the estimation process, it is possible that actual contract revenues and completion costs may vary from estimates.
Estimated losses on uncompleted contracts and changes in contract estimates reflect the Company's best estimate of probable losses of unbilled receivables, and are recognized in the period such revisions are known and can be reasonably estimated . These estimates are recognized in cost of sales. Estimated losses on uncompleted contracts and changes in contract estimates are established by assessing estimated costs to complete, change orders and claims for uncompleted contracts. Assumptions for estimated costs to complete include material prices, labor costs, labor productivity and contract claims. Such estimates are inherently uncertain and therefore it is possible that actual completion costs may vary from these estimates.
Allowance for doubtful accounts
We maintain an allowance for doubtful accounts for estimated losses due to the failure of our customers to make required payments. Management believes the accounting estimate related to the allowance for doubtful accounts is a “critical accounting estimate” as it involves judgments about our customers’ ability to pay. The allowance for doubtful accounts is based on an assessment of
43
individual past due accounts, historical write-off experience, accounts receivable aging, customer disputes and the business environment. Account balances are charged off when the potential for recovery is considered remote.
Management believes the allowance amounts recorded, in each instance, represent its best estimate of future outcomes. If there is a deterioration of a major customer’s financial condition, if the Company becomes aware of additional information related to the credit-worthiness of a major customer, or if future actual default rates on trade receivables in general differ from those currently anticipated, the Company may have to adjust its allowance for doubtful accounts, which would affect earnings in the period the adjustments were made.
Inventories
Inventories consist primarily of materials purchased for resale, including lumber and sheet goods, millwork, windows and doors as well as certain manufactured products and are carried at the lower of cost or market. The cost of substantially all of our inventories is determined by the weighted average cost method, which approximates the first-in, first-out approach. We evaluate our inventory value at the end of each quarter to ensure that it is carried at the lower of cost or market. This evaluation includes an analysis of historical physical inventory results, a review of potential excess and obsolete inventories based on inventory aging and anticipated future demand. At least quarterly, each branch’s perpetual inventory records are adjusted to reflect any declines in net realizable value below inventory carrying cost. To the extent historical physical inventory results are not indicative of future results and if future events impact, either favorably or unfavorably, the salability of our products or our relationships with certain key suppliers, our inventory reserves could differ significantly, resulting in either higher or lower future inventory provisions.
Business combinations
For all acquisitions, we allocate the purchase price to the estimated fair values of the assets acquired and liabilities assumed as of the date of acquisition. The excess of the fair value of the purchase consideration over the fair values of the identifiable assets and liabilities is recorded as goodwill. Management makes significant estimates and assumptions when determining the fair value of assets acquired and liabilities assumed. These estimates include, but are not limited to, discount rates, projected future net sales, projected future expected cash flows and useful lives. When necessary, we will engage third-party valuation firms to assist us in determining fair values of acquired assets and assumed liabilities.
Valuation of goodwill, long-lived assets and amortizable other intangible assets
Our long-lived assets consist primarily of property, equipment, purchased intangible assets and goodwill. The valuation and the impairment testing of these long-lived assets involve significant judgments and assumptions, particularly as they relate to the identification of reporting units, asset groups and the determination of fair market value.
We test our tangible and intangible long-lived assets subject to amortization for impairment whenever facts and circumstances indicate that the carrying amount of an asset may not be recoverable. We test goodwill for impairment annually, or more frequently if triggering events occur indicating that there may be impairment.
We have recorded goodwill and perform testing for potential goodwill impairment at a reporting unit level. A reporting unit is an operating segment, or a business unit one level below an operating segment for which discrete financial information is available, and for which management regularly reviews the operating results. Additionally, components within an operating segment are aggregated as a single reporting unit if they have similar economic characteristics. We have determined that our reporting units are equivalent to our six operating segments, which are the Mid-Atlantic, Southeast, Texas, Intermountain, Western and Mountain West divisions. We complete our annual impairment assessment during the third quarter of each year. We did not recognize any impairment for the years ended December 31, 2015, 2014 and 2013.
For impairment testing of long-lived assets, we identify asset groups at the lowest level for which identifiable cash flows are largely independent of the cash flows of other groups of assets and liabilities. Recoverability of assets to be held and used is measured by a comparison of the carrying amount of an asset to estimated undiscounted future cash flows expected to be generated by the assets. If the carrying amount of an asset exceeds its estimated future cash flows, an impairment charge is recognized by the amount by which the carrying amount of the asset exceeds the estimated fair value of the asset.
As discussed above, changes in management intentions, market events or conditions, projected future net sales, operating results, cash flow of our reporting units and other similar circumstances could affect the assumptions used in the impairment tests. Although management currently believes that the estimates used in the evaluation of goodwill and other long-lived assets are reasonable, differences between actual and expected net sales, operating results and cash flow could cause these assets to be impaired. If any
44
asset were determined to be impaired, this could have a material adverse effect on our results of operations and financial position, but not our cash flow from operations.
Stock based compensation
The SBS 2013 Incentive Plan remained in effect upon consummation of the Merger. Upon consummation of the Merger, the Company assumed all obligations of BMC under the BMC 2010 Incentive Plan and BMC 2013 Incentive Plan, including BMC's time-vesting restricted stock and performance-vesting restricted stock. At the effective time of the Merger, each BMC time-vesting restricted share outstanding immediately prior to such time was converted, on the same terms and conditions as were applicable to such BMC time-vesting restricted share at such time, into a restricted share with respect to the number of shares of BMC Stock common stock determined by multiplying each BMC time-vesting restricted share by the exchange ratio, rounded up to the nearest whole share. The performance goals of each award of BMC performance-vesting restricted stock outstanding immediately prior to the Merger was deemed satisfied at maximum and was converted, on the same terms and conditions (other than the terms and conditions relating to achievement of performance goals), into a restricted share with respect to that number of shares of BMC Stock common stock determined by multiplying each BMC performance-vesting restricted share by the exchange ratio, rounded up to the nearest whole share, provided that the vesting criteria applicable to such conversion will provide for vesting based solely on the holder's continuation of service through the time of vesting.
Under the SBS 2013 Incentive Plan, the merger constituted a "change in control" of SBS. In connection with a "change in control," as defined in the SBS 2013 Incentive Plan, the vesting of outstanding awards under the SBS 2013 Incentive Plan was accelerated, with the exception of 0.2 million outstanding stock options and 0.3 million outstanding restricted stock units awarded to certain Legacy SBS employees during November 2015.
We account for restricted stock awards and restricted stock unit awards granted to employees and directors by recording compensation expense based on the award’s fair value at the date of grant. As Legacy BMC was a privately held company prior to the Merger, there was no active market for its shares. The fair value of equity awards was calculated using the enterprise value per share. The enterprise value per share was derived using a blend of the market approach, income approach and prior sales of Legacy BMC's shares. Weights were assigned to each approach to calculate a weighted average enterprise value. Adjustments were made for lack of marketability and non-operating assets and liabilities. Due to uncertainties inherent in the assumptions used in various valuation approaches described above, it is possible that the actual share-based compensation realized by the participant may vary from the estimate of the fair value of these restricted shares.
We account for stock options granted to employees by recording compensation expense based on the award’s fair value, estimated on the date of grant using the Black-Scholes option-pricing model. Stock-based compensation expense is recognized on a straight-line basis over the requisite service period of the award, which generally equals the vesting period. Determining the fair value of stock options under the Black-Scholes option-pricing model requires judgment, including estimating the fair value per share of our common stock, volatility, expected term of the awards, dividend yield and risk-free interest rate. The assumptions used in calculating the fair value of stock options represent our best estimates, based on management's judgment and subjective future expectations. These estimates involve inherent uncertainties. If any of the assumptions used in the model change significantly, share-based compensation recorded for future awards may differ materially from that recorded for awards granted previously.
We developed our assumptions as follows:
• | Fair value of common stock. We use quoted market prices to determine the fair value of our common stock. |
• | Dividend yield. We have never declared or paid any cash dividends on our common stock and do not presently plan to pay cash dividends in the foreseeable future. Consequently, we used an expected dividend yield of zero. |
• | Volatility. The expected price volatility for our common stock was estimated by taking the median historic price volatility for industry peers. |
• | Risk-free interest rate. The risk-free interest rate is based on the yields of United States Treasury securities with maturities similar to the expected term of the options. |
• | Expected term. The expected term was estimated to be the mid-point between the vesting date and the expiration date of the award. We believe use of this approach is appropriate as we have limited prior history of option exercises upon which to base an expected term. |
We estimate potential forfeitures of stock options and adjust share-based compensation expense accordingly. The estimate of forfeitures is adjusted over the requisite service period to the extent that actual forfeitures differ from prior estimates. We estimate forfeitures based upon our historical experience with employee turnover, and, at each period, review the estimated forfeiture rate and make changes as factors affecting the forfeiture rate calculations and assumptions changes.
45
The fair value of employee stock options granted by Legacy SBS for the year ended December 31, 2015 was estimated using the following weighted-average assumptions (Legacy BMC did not issue any stock options during the three years ended December 31, 2015):
2015 | |||
Expected dividend yield | 0 | % | |
Expected volatility factor | 0.44 | ||
Risk-free interest rate | 0.0176 | ||
Expected term (in years) | 6.0 | ||
Our stock-based compensation expense included in selling, general and administrative expenses for the years ended December 31, 2015, 2014 and 2013 was $2.7 million, $3.4 million and $2.4 million, respectively.
Casualty and health insurance
We carry insurance for general liability, auto liability and workers' compensation exposures subject to deductibles or self insured retentions that we believe to be reasonable under the circumstances, and we self-insure for employee and eligible dependent health care claims, with insurance purchased from independent carriers to cover individual claims in excess of the self-insured limits. The expected liability for unpaid claims, including incurred but not reported losses, is determined using the assistance of third-party actuaries and is reflected on the consolidated balance sheets as a liability with current and long-term components. We have elected not to discount this liability. The amount recoverable from insurance providers is reflected on the consolidated balance sheets in prepaid expenses and other current assets. Our accounting policy includes an internal evaluation and adjustment of our reserve for all insured losses on a quarterly basis. At least on an annual basis, we engage external actuarial professionals to independently assess and estimate the total liability outstanding, which is compared to the actual reserve balance at that time and adjusted accordingly.
Deferred income taxes
In accordance with ASC 740 “Income Taxes,” we evaluate our deferred tax assets to determine if valuation allowances are required. In assessing the realizability of deferred tax assets, we consider both positive and negative evidence in determining whether it is more likely than not that some portion or all of the deferred tax assets will not be realized. The primary negative evidence considered includes the cumulative operating losses generated in prior periods. The primary positive evidence considered includes the reversal of deferred tax liabilities related to depreciation and amortization that would occur within the same jurisdiction and during the carry-forward period necessary to absorb the state net operating losses and other deferred tax assets. The reversal of such liabilities would utilize the state net operating losses and other deferred tax assets.
During 2015, the Company evaluated the positive and negative evidence in assessing the realizability of its deferred tax assets. As of December 31, 2015, we concluded that it is more likely than not that we will realize the benefit of the deferred tax assets, net of a state tax valuation allowance of $0.1 million.
During the second quarter of 2014, the Company conducted such an analysis and, based on an evaluation of available positive and negative evidence and the Company’s projection of the income expected to be generated in future years, we concluded that it was more likely than not that all of its deferred tax asset would be realized. As a result, in accordance with ASC 740, we recognized a $76.1 million income tax benefit that resulted from the reversal of all of its deferred tax asset valuation allowance. We conducted a similar analysis in December 2014 and concluded that no valuation allowance was needed as we continued to conclude that it was more likely than not that all of its deferred tax asset would be realized.
ASC 740 also prescribes a recognition threshold and certain measurement principles for the financial statements related to tax positions taken or expected to be taken on a tax return. Under ASC 740, the impact of an uncertain tax position on an income tax return must be recognized at the largest amount that is more likely than not to be sustained upon audit by the relevant taxing authority. An uncertain income tax position will not be recognized if it has less than a 50% likelihood of being sustained. Additionally, ASC 740 provides guidance on derecognition, classification, interest and penalties associated with income taxes, accounting in interim periods, disclosures and transition requirements.
46
Consideration received from suppliers
We enter into arrangements with many of our suppliers providing for inventory purchase rebates (“supplier rebates”) upon achievement of specified volume purchasing levels. We accrue estimated supplier rebates monthly as part of cost of goods sold based on progress toward earning the supplier rebates, taking into consideration cumulative purchases of inventory to date and projected purchases through the end of the year. We estimate the rebates applicable to inventory on-hand at each period end based on the inventory turns of the related items.
Under certain circumstances, including if market conditions were to change, suppliers may change the terms of some or all of these programs. Although these changes would not affect the amounts which we have recorded related to product already purchased, it may impact our gross margins in future periods.
Item 7A. Quantitative and Qualitative Disclosures About Market Risk
In the normal course of business, we are exposed to financial risks such as changes in interest rates and commodity price risk.
Interest Rate Risk
When we have loan amounts under our Revolver, we are exposed to interest rate risk arising from fluctuations in interest rates. During 2015, 2014 and 2013, we did not use any interest rate swap contracts to manage this risk. An increase (decrease) in interest rates of 100 basis points on our variable-rate debt would increase (decrease) our annual interest expense by approximately $1.5 million (based on our borrowings as of December 31, 2015).
Commodity Price Risk
Many of the products we purchase and resell are commodities whose price is determined by the market's supply and demand for such products. Price fluctuations in our selling prices and key costs have a significant effect on our financial performance. The markets for most of these commodities are cyclical and are affected by factors such as global economic conditions, including the strength of the U.S. housing market, changes in, or disruptions to, industry production capacity and changes in inventory levels and other factors beyond our control. During 2015, 2014 and 2013, we did not manage commodity price risk with derivative instruments, except for immaterial lumber future contracts. See “Management’s Discussion and Analysis of Financial Condition and Results of Operations—Factors Affecting Our Operating Results—Commodity nature of our products" for further discussion. We estimate that a 1% increase (decrease) in the cost of lumber & lumber sheet goods, assuming no offsetting pricing changes, would decrease (increase) our annual operating income by approximately $3.8 million (based on our operating results for the year ended December 31, 2015). However, we would likely adjust our pricing to offset any significant increases in our cost of goods.
47
Item 8 Financial Statements and Supplementary Data
Report of Independent Registered Public Accounting Firm
To the Board of Directors and Stockholders of
BMC Stock Holdings, Inc.
In our opinion, the accompanying consolidated balance sheet as of December 31, 2015 and the related consolidated statements of operations, of stockholders’ equity and of cash flows for the year then ended present fairly, in all material respects, the financial position of BMC Stock Holdings, Inc. and its subsidiaries at December 31, 2015, and the results of their operations and their cash flows for the year then ended in conformity with accounting principles generally accepted in the United States of America. Also in our opinion, the Company maintained, in all material respects, effective internal control over financial reporting as of December 31, 2015, based on criteria established in Internal Control - Integrated Framework (2013) issued by the Committee of Sponsoring Organizations of the Treadway Commission (COSO). The Company's management is responsible for these financial statements, for maintaining effective internal control over financial reporting and for its assessment of the effectiveness of internal control over financial reporting, included in Management’s annual report on internal control over financial reporting appearing under Item 9A. Our responsibility is to express opinions on these financial statements and on the Company's internal control over financial reporting based on our integrated audit. We conducted our audit in accordance with the standards of the Public Company Accounting Oversight Board (United States). Those standards require that we plan and perform the audit to obtain reasonable assurance about whether the financial statements are free of material misstatement and whether effective internal control over financial reporting was maintained in all material respects. Our audit of the financial statements included examining, on a test basis, evidence supporting the amounts and disclosures in the financial statements, assessing the accounting principles used and significant estimates made by management, and evaluating the overall financial statement presentation. Our audit of internal control over financial reporting included obtaining an understanding of internal control over financial reporting, assessing the risk that a material weakness exists, and testing and evaluating the design and operating effectiveness of internal control based on the assessed risk. Our audit also included performing such other procedures as we considered necessary in the circumstances. We believe that our audit provides a reasonable basis for our opinions.
As discussed in Note 2 to the consolidated financial statements, the Company changed the manner in which it presents deferred income taxes in 2015.
A company’s internal control over financial reporting is a process designed to provide reasonable assurance regarding the reliability of financial reporting and the preparation of financial statements for external purposes in accordance with generally accepted accounting principles. A company’s internal control over financial reporting includes those policies and procedures that (i) pertain to the maintenance of records that, in reasonable detail, accurately and fairly reflect the transactions and dispositions of the assets of the company; (ii) provide reasonable assurance that transactions are recorded as necessary to permit preparation of financial statements in accordance with generally accepted accounting principles, and that receipts and expenditures of the company are being made only in accordance with authorizations of management and directors of the company; and (iii) provide reasonable assurance regarding prevention or timely detection of unauthorized acquisition, use, or disposition of the company’s assets that could have a material effect on the financial statements.
Because of its inherent limitations, internal control over financial reporting may not prevent or detect misstatements. Also, projections of any evaluation of effectiveness to future periods are subject to the risk that controls may become inadequate because of changes in conditions, or that the degree of compliance with the policies or procedures may deteriorate.
As described in Management’s annual report on internal control over financial reporting, management has excluded Building Materials Holding Corporation from its assessment of internal control over financial reporting as of December 31, 2015 because it was acquired by the Company in a business combination during 2015. We have also excluded Building Materials Holding Corporation from our audit of internal control over financial reporting. The acquired Building Materials Holding Corporation businesses are wholly-owned subsidiaries whose total assets and total revenues represent 45% and 93%, respectively, of the related consolidated financial statement amounts as of and for the year ended December 31, 2015.
/s/ PricewaterhouseCoopers LLP
Raleigh, North Carolina
March 15, 2016
48
Report of Independent Registered Public Accounting Firm
The Board of Directors and Stockholders
BMC Stock Holdings, Inc.:
We have audited the accompanying consolidated balance sheet of BMC Stock Holdings, Inc. (formerly known as Building Materials Holding Corporation and subsidiaries, hereinafter referred to as the Company) as of December 31, 2014, and the related consolidated statements of operations, stockholders’ equity, and cash flows for each of the years in the two-year period ended December 31, 2014. These consolidated financial statements are the responsibility of the Company’s management. Our responsibility is to express an opinion on these consolidated financial statements based on our audits.
We conducted our audits in accordance with the standards of the Public Company Accounting Oversight Board (United States). Those standards require that we plan and perform the audit to obtain reasonable assurance about whether the financial statements are free of material misstatement. An audit includes examining, on a test basis, evidence supporting the amounts and disclosures in the financial statements. An audit also includes assessing the accounting principles used and significant estimates made by management, as well as evaluating the overall financial statement presentation. We believe that our audits provide a reasonable basis for our opinion.
In our opinion, the consolidated financial statements referred to above present fairly, in all material respects, the financial position of the Company as of December 31, 2014, and the results of their operations and their cash flows for each of the years in the two‑year period ended December 31, 2014, in conformity with U.S. generally accepted accounting principles.
/s/ KPMG LLP
Boise, Idaho
March 15, 2016
49
BMC STOCK HOLDINGS, INC. AND SUBSIDIARIES
CONSOLIDATED BALANCE SHEETS
December 31, 2015 | December 31, 2014 | |||||||
(in thousands, except share and per share amounts) | ||||||||
Assets | ||||||||
Current assets | ||||||||
Cash and cash equivalents | $ | 1,089 | $ | 63,262 | ||||
Restricted assets | — | 36,106 | ||||||
Accounts receivables, net of allowances | 303,176 | 126,652 | ||||||
Inventories, net | 243,960 | 104,538 | ||||||
Costs in excess of billings on uncompleted contracts | 22,528 | 7,623 | ||||||
Income taxes receivable | 11,390 | 6,010 | ||||||
Prepaid expenses and other current assets | 31,817 | 13,904 | ||||||
Total current assets | 613,960 | 358,095 | ||||||
Property and equipment, net of accumulated depreciation | 295,978 | 140,435 | ||||||
Deferred financing costs | 9,464 | 8,243 | ||||||
Deferred income taxes | — | 70,492 | ||||||
Customer relationship intangible assets, net of accumulated amortization | 177,036 | — | ||||||
Other intangible assets, net of accumulated amortization | 10,900 | — | ||||||
Goodwill | 254,664 | 1,137 | ||||||
Other long-term assets | 14,006 | 10,110 | ||||||
Total assets | $ | 1,376,008 | $ | 588,512 | ||||
Liabilities and Stockholders' Equity | ||||||||
Current liabilities | ||||||||
Accounts payable | $ | 135,632 | $ | 46,278 | ||||
Accrued expenses and other liabilities | 91,888 | 40,186 | ||||||
Billings in excess of costs on uncompleted contracts | 15,888 | 7,470 | ||||||
Interest payable | 6,882 | 6,713 | ||||||
Current portion: | ||||||||
Long-term debt and capital lease obligation | 10,129 | 7,546 | ||||||
Insurance deductible reserves | 17,888 | 14,320 | ||||||
Total current liabilities | 278,307 | 122,513 | ||||||
Insurance deductible reserves | 37,334 | 24,337 | ||||||
Long-term debt | 405,085 | 255,288 | ||||||
Long-term portion of capital lease obligation | 16,495 | 7,274 | ||||||
Deferred income taxes | 3,021 | — | ||||||
Other long-term liabilities | 6,834 | 22 | ||||||
Total liabilities | 747,076 | 409,434 | ||||||
Commitments and contingencies (Note 12) | ||||||||
Stockholders' equity | ||||||||
Common stock, $0.01 par value, 300.0 million shares and 104.6 million authorized, 65.4 million and 39.5 million shares issued, and 65.3 million and 39.0 million outstanding at December 31, 2015 and December 31, 2014, respectively | 654 | 395 | ||||||
Additional paid-in capital | 626,402 | 174,203 | ||||||
Retained earnings | 2,302 | 7,133 | ||||||
Treasury stock, at cost, less than 0.1 million and 0.5 million shares at December 31, 2015 and December 31, 2014, respectively | (426 | ) | (2,653 | ) | ||||
Total stockholders' equity | 628,932 | 179,078 | ||||||
Total liabilities and stockholders' equity | $ | 1,376,008 | $ | 588,512 | ||||
The accompanying notes are an integral part of these consolidated financial statements.
50
BMC STOCK HOLDINGS, INC. AND SUBSIDIARIES
CONSOLIDATED STATEMENTS OF OPERATIONS
Year Ended December 31, | ||||||||||||
(in thousands, except per share amounts) | 2015 | 2014 | 2013 | |||||||||
Net sales | ||||||||||||
Building products | $ | 1,146,190 | $ | 937,048 | $ | 850,669 | ||||||
Construction services | 430,556 | 374,450 | 359,487 | |||||||||
1,576,746 | 1,311,498 | 1,210,156 | ||||||||||
Cost of sales | ||||||||||||
Building products | 864,485 | 705,812 | 648,274 | |||||||||
Construction services | 350,851 | 310,612 | 305,335 | |||||||||
1,215,336 | 1,016,424 | 953,609 | ||||||||||
Gross profit | 361,410 | 295,074 | 256,547 | |||||||||
Selling, general and administrative expenses | 306,843 | 229,316 | 200,588 | |||||||||
Depreciation expense | 15,700 | 11,492 | 9,168 | |||||||||
Amortization expense | 3,626 | — | 1,310 | |||||||||
Impairment of assets held for sale | — | 134 | 73 | |||||||||
Merger-related costs | 22,993 | — | — | |||||||||
349,162 | 240,942 | 211,139 | ||||||||||
Income from operations | 12,248 | 54,132 | 45,408 | |||||||||
Other income (expenses) | ||||||||||||
Interest expense | (27,552 | ) | (27,090 | ) | (18,786 | ) | ||||||
Other income (expense), net | 784 | 1,413 | 1,306 | |||||||||
(Loss) income before income taxes | (14,520 | ) | 28,455 | 27,928 | ||||||||
Income tax (benefit) expense | (9,689 | ) | (65,577 | ) | 6,273 | |||||||
Net (loss) income | $ | (4,831 | ) | $ | 94,032 | $ | 21,655 | |||||
Weighted average common shares outstanding | ||||||||||||
Basic | 41,260 | 38,828 | 38,321 | |||||||||
Diluted | 41,260 | 39,291 | 38,865 | |||||||||
Net (loss) income per common share | ||||||||||||
Basic | $ | (0.12 | ) | $ | 2.42 | $ | 0.57 | |||||
Diluted | $ | (0.12 | ) | $ | 2.39 | $ | 0.56 | |||||
The accompanying notes are an integral part of these consolidated financial statements.
51
BMC STOCK HOLDINGS, INC. AND SUBSIDIARIES
CONSOLIDATED STATEMENTS OF STOCKHOLDERS' EQUITY
Common Stock | Treasury Stock | Additional Paid-in Capital | Retained Earnings (Deficit) | Total | ||||||||||||||||||||||
(in thousands) | Shares | Amount | Shares | Amount | ||||||||||||||||||||||
Stockholders' equity as of December 31, 2012 | 37,768 | $ | 378 | 454 | $ | (797 | ) | $ | 165,030 | $ | (108,554 | ) | $ | 56,057 | ||||||||||||
Shares vested for long-term incentive plan | 1,405 | 14 | (16 | ) | 24 | (38 | ) | — | — | |||||||||||||||||
Shares repurchased | — | — | 46 | (461 | ) | — | — | (461 | ) | |||||||||||||||||
Stock compensation expense | — | — | — | — | 2,425 | — | 2,425 | |||||||||||||||||||
Tax benefits related to stock based compensation plans | — | — | — | — | 2,553 | — | 2,553 | |||||||||||||||||||
Net income | — | — | — | — | — | 21,655 | 21,655 | |||||||||||||||||||
Stockholders' equity as of December 31, 2013 | 39,173 | 392 | 484 | (1,234 | ) | 169,970 | (86,899 | ) | 82,229 | |||||||||||||||||
Shares vested for long-term incentive plan | 282 | 3 | (126 | ) | 188 | (191 | ) | — | — | |||||||||||||||||
Shares repurchased | — | — | 124 | (1,607 | ) | — | — | (1,607 | ) | |||||||||||||||||
Stock compensation expense | — | — | — | — | 3,410 | — | 3,410 | |||||||||||||||||||
Tax benefits related to stock based compensation plans | — | — | — | — | 1,014 | — | 1,014 | |||||||||||||||||||
Net income | — | — | — | — | — | 94,032 | 94,032 | |||||||||||||||||||
Stockholders' equity as of December 31, 2014 | 39,455 | 395 | 482 | (2,653 | ) | 174,203 | 7,133 | 179,078 | ||||||||||||||||||
Effect of reverse merger | 26,186 | 262 | — | — | 453,128 | — | 453,390 | |||||||||||||||||||
Cancellation of Legacy BMC treasury stock in connection with the Merger | (434 | ) | (4 | ) | (434 | ) | 3,487 | (3,483 | ) | — | — | |||||||||||||||
Shares vested for long-term incentive plans | 153 | 1 | (126 | ) | 194 | (195 | ) | — | — | |||||||||||||||||
Shares repurchased | — | — | 103 | (1,454 | ) | — | — | (1,454 | ) | |||||||||||||||||
Stock compensation expense | — | — | — | — | 2,749 | — | 2,749 | |||||||||||||||||||
Net loss | — | — | — | — | — | (4,831 | ) | (4,831 | ) | |||||||||||||||||
Stockholders' equity as of December 31, 2015 | 65,360 | $ | 654 | 25 | $ | (426 | ) | $ | 626,402 | $ | 2,302 | $ | 628,932 | |||||||||||||
The accompanying notes are an integral part of these consolidated financial statements.
52
BMC STOCK HOLDINGS, INC. AND SUBSIDIARIES CONSOLIDATED STATEMENTS OF CASH FLOWS | ||||||||||||
Year Ended December 31, | ||||||||||||
(in thousands) | 2015 | 2014 | 2013 | |||||||||
Cash flows from operating activities | ||||||||||||
Net (loss) income | $ | (4,831 | ) | $ | 94,032 | $ | 21,655 | |||||
Adjustments to reconcile net (loss) income to net cash provided by operating activities | ||||||||||||
Depreciation expense | 20,963 | 15,457 | 12,457 | |||||||||
Amortization of intangible assets | 3,626 | — | 1,310 | |||||||||
Amortization of deferred loan costs | 2,525 | 2,277 | 1,303 | |||||||||
Amortization of original issue discount | 244 | 257 | 57 | |||||||||
Amortization of inventory step-up charges | 10,285 | — | — | |||||||||
Deferred income taxes | (5,892 | ) | (70,492 | ) | — | |||||||
Non-cash stock compensation expense | 2,749 | 3,410 | 2,425 | |||||||||
Impairment of assets held for sale | — | 134 | 73 | |||||||||
Gain on sale of property, equipment and real estate | (497 | ) | (804 | ) | (772 | ) | ||||||
Change in assets and liabilities, net of effects of acquisitions | ||||||||||||
Accounts receivable, net of allowances | (24,061 | ) | (6,299 | ) | (10,680 | ) | ||||||
Inventories, net | (16,452 | ) | (15,927 | ) | (14,028 | ) | ||||||
Costs in excess of billings on uncompleted contracts | (4,026 | ) | 276 | (1,554 | ) | |||||||
Other current assets | (9,378 | ) | (9,163 | ) | (3,743 | ) | ||||||
Other long-term assets | 1,240 | (1,688 | ) | 453 | ||||||||
Accounts payable | 873 | 9,666 | 3,777 | |||||||||
Accrued expenses and other liabilities | 4,377 | 1,633 | 18,810 | |||||||||
Billings in excess of costs on uncompleted contracts | 8,360 | 1,776 | (343 | ) | ||||||||
Interest on subordinate note | — | — | (16,840 | ) | ||||||||
Insurance deductible reserves | 7,973 | 6,165 | 997 | |||||||||
Other long-term liabilities | 2,665 | 22 | — | |||||||||
Net cash provided by operating activities | 743 | 30,732 | 15,357 | |||||||||
Cash flows from investing activities | ||||||||||||
Change in restricted assets | 36,106 | 10,326 | (46,432 | ) | ||||||||
Cash acquired in the Merger | 6,342 | — | — | |||||||||
Purchases of businesses, net of cash acquired | (149,485 | ) | (236 | ) | (6,705 | ) | ||||||
Purchases of property, equipment and real estate | (31,319 | ) | (28,275 | ) | (15,057 | ) | ||||||
Proceeds from sale of property, equipment and real estate | 3,280 | 1,919 | 4,554 | |||||||||
Other investing activities | — | 4 | (359 | ) | ||||||||
Net cash used in investing activities | (135,076 | ) | (16,262 | ) | (63,999 | ) | ||||||
Cash flows from financing activities | ||||||||||||
Proceeds from revolving line of credit | 293,183 | — | 338,618 | |||||||||
Repayments of proceeds from revolving line of credit | (208,637 | ) | — | (378,618 | ) | |||||||
Proceeds from notes, net of original issue discount | — | — | 248,778 | |||||||||
Principal payments on subordinate term note | — | — | (102,825 | ) | ||||||||
Borrowings under other notes | 2,491 | 9,991 | 3,660 | |||||||||
Principal payments on other notes | (6,081 | ) | (5,999 | ) | (2,415 | ) | ||||||
53
BMC STOCK HOLDINGS, INC. AND SUBSIDIARIES CONSOLIDATED STATEMENTS OF CASH FLOWS | ||||||||||||
Year Ended December 31, | ||||||||||||
(in thousands) | 2015 | 2014 | 2013 | |||||||||
Secured borrowings | $ | 767 | $ | — | $ | — | ||||||
Tax benefits related to stock based compensation | — | 1,014 | 2,553 | |||||||||
Purchase of treasury stock | (1,454 | ) | (1,607 | ) | (461 | ) | ||||||
Payments for debt issuance costs | (3,567 | ) | (10 | ) | (10,785 | ) | ||||||
Payments on capital lease obligations | (4,542 | ) | (3,813 | ) | (2,407 | ) | ||||||
Net cash provided by (used in) financing activities | 72,160 | (424 | ) | 96,098 | ||||||||
Net (decrease) increase in cash and cash equivalents | (62,173 | ) | 14,046 | 47,456 | ||||||||
Cash and cash equivalents | ||||||||||||
Beginning of period | 63,262 | 49,216 | 1,760 | |||||||||
End of period | $ | 1,089 | $ | 63,262 | $ | 49,216 | ||||||
Supplemental disclosure of cash flow information | ||||||||||||
Interest paid | $ | 23,970 | $ | 24,351 | $ | 27,859 | ||||||
Cash paid (received) for income taxes, net | 4,310 | 12,917 | 1,025 | |||||||||
Non-cash investing and financing transactions | ||||||||||||
Accrued purchases of property and equipment | 1,968 | — | — | |||||||||
Assets acquired under capital lease obligations | 2,342 | 3,929 | 9,966 | |||||||||
Consideration transferred in connection with the Merger | 453,390 | — | — | |||||||||
The accompanying notes are an integral part of these consolidated financial statements.
54
BMC STOCK HOLDINGS, INC. AND SUBSIDIARIES
NOTES TO CONSOLIDATED FINANCIAL STATEMENTS
(All amounts are presented in thousands except share and per share amounts.)
1. Organization
On December 1, 2015, Stock Building Supply Holdings, Inc. (“SBS”) completed a business combination with privately-held Building Materials Holding Corporation (“BMC”) in accordance with the terms of the Agreement and Plan of Merger, dated as of June 2, 2015, by and between SBS and BMC (the “Merger Agreement”), pursuant to which BMC merged with and into SBS (the “Merger”). As a result of the business combination, SBS survived the Merger and in connection therewith changed its name to “BMC Stock Holdings, Inc.”
These financial statements represent the financial statements of BMC Stock Holdings, Inc., and its subsidiaries. All references to “BMC Stock,” “we,” “us,” “our” or the “Company” in this Annual Report on Form 10-K mean BMC Stock Holdings, Inc.
Under U.S. generally accepted accounting principles ("U.S. GAAP"), the Merger is treated as a “reverse merger” under the acquisition method of accounting. For accounting purposes, BMC is considered to have acquired SBS. Consequently, the historical financial statements of the Company reflect only the operations and financial condition of BMC prior to the date of the Merger. The operating results of SBS are reported as part of the Company beginning on the closing date of the Merger.
2. Summary of Significant Accounting Policies
Basis of presentation
The accompanying consolidated financial statements have been prepared by management in conformity with U.S. GAAP.
Principles of consolidation
The consolidated financial statements include all accounts of BMC Stock Holdings, Inc., and its wholly-owned subsidiaries. All material intercompany accounts and transactions have been eliminated in consolidation.
Use of estimates
The preparation of financial statements in conformity with U.S. GAAP requires management to make estimates and assumptions that affect the reported amounts of assets and liabilities and disclosure of contingent assets and liabilities at the date of the financial statements and the reported amounts of revenues and expenses during the reporting period. The Company evaluates these estimates and judgments on an ongoing basis and bases its estimates on historical experience, current conditions and various other assumptions that are believed to be reasonable under the circumstances. The results of these estimates form the basis for making judgments about the carrying values of assets and liabilities as well as identifying and assessing the accounting treatment with respect to commitments and contingencies. The significant estimates which could change by a material amount in the near term include revenue recognition for construction services, accounts receivable reserves, estimated losses on uncompleted contracts and changes in contract estimates, inventory reserves, supplier rebates, goodwill impairment, impairment of property and equipment, insurance deductible reserves, warranties, share-based compensation and estimates related to purchase accounting. Actual results may differ materially from these estimates under different assumptions or conditions.
Business and credit concentrations
The Company maintains cash at financial institutions in excess of federally insured limits. Accounts receivable potentially expose the Company to concentrations of credit risk. Mitigating this credit risk is collateral underlying certain accounts receivable (perfected liens or lien rights) as well as the Company’s analysis of a customer’s credit history prior to extending credit. Concentrations of credit risk with respect to accounts receivable are limited due to the Company’s large number of customers and their dispersion across various regions of the United States. At December 31, 2015 and 2014, no customer represented more than 10% of accounts receivable. For the years ended December 31, 2015, 2014 and 2013, no customer represented more than 10% of revenue.
The Company’s future results could be adversely affected by a number of factors including competitive pressure on sales and pricing, weather conditions, consumer spending and debt levels, interest rates, existing residential home sales and new home construction, lumber prices and product mix.
55
Cash and cash equivalents
Cash equivalents are highly liquid investments that are readily convertible to known amounts of cash and have a maturity of three months or less from the time of purchase.
Book overdrafts occur when purchases on corporate purchasing cards and checks written exceed available bank balances at a specific bank, despite there being cash at the Company's other financial institutions. For accounting purposes, the Company reclassifies these book overdrafts to accounts payable on the consolidated balance sheets. Book overdrafts included in accounts payable were $0.3 million and $3.1 million at December 31, 2015 and 2014, respectively.
Restricted assets
As of December 31, 2014, the Company had restricted assets of $36.1 million which related to amounts deposited in a separate bank account to collateralize letters of credit related to insurance claims for periods prior to January 2010. During 2015, the Company was able to release these amounts into unrestricted cash as a result of reductions in claims and the transfer of the risk of loss of remaining claims to a reinsurer.
Fair value of financial instruments
ASC 820, Fair Value Measurements and Disclosures (“ASC 820”), clarifies the definition of fair value, prescribes methods for measuring fair value, and establishes a fair value hierarchy to classify the inputs used in measuring fair value as follows:
Level 1 | Inputs are unadjusted quoted prices in active markets for identical assets or liabilities available at the measurement date. | |
Level 2 | Inputs are unadjusted quoted prices for similar assets and liabilities in active markets, quoted prices for identical or similar assets and liabilities in markets that are not active, inputs other than quoted prices that are observable, and inputs derived from or corroborated by observable market data. | |
Level 3 | Inputs are unobservable inputs which reflect the reporting entity’s own assumptions on what assumptions the market participants would use in pricing the asset or liability based on the best available information. | |
If a financial instrument uses inputs that fall in different levels of the hierarchy, the instrument is categorized based upon the lowest level of input that is significant to the fair value calculation.
Accounts receivable
Accounts receivable result from the extending of credit to trade customers for the purchase of goods and services. The terms generally provide for payment within 30 days of being invoiced. On occasion, when necessary to compete in certain circumstances, the Company will sell product under extended payment terms. Accounts receivable are stated at estimated net realizable value. The allowance for doubtful accounts is based on an assessment of individual past due accounts, historical write-off experience, accounts receivable aging, customer disputes and the business environment. Account balances are charged off when the potential for recovery is considered remote. The Company grants trade discounts on a percentage basis. The Company records an allowance against accounts receivable for the amount of discounts it estimates will be taken by customers. The discounts are recorded as a reduction to revenue when products are sold.
Consideration received from suppliers
The Company enters into agreements with many of its suppliers providing for inventory purchase rebates (“supplier rebates”) upon achievement of specified volume purchasing levels. Supplier rebates are accrued as part of cost of goods sold based on progress towards earning the supplier rebates, taking into consideration cumulative purchases of inventory to date and projected purchases through the end of the year. The Company estimates the rebates applicable to inventory on-hand at each period end based on the inventory turns of the related items. Total rebates receivable at December 31, 2015 and 2014 are $13.7 million and $7.1 million, respectively, included in prepaid expenses and other current assets.
56
Revenue recognition
The Company recognizes revenue for sales of building products when products are delivered and the customer takes ownership and assumes risk of loss, collection of the relevant receivable is reasonably assured, persuasive evidence of an arrangement exists and the sales price is fixed or determinable. All sales recognized are net of allowances for discounts and estimated returns, based on historical experience. Taxes assessed by governmental authorities that are directly imposed on our revenue-producing transactions are excluded from sales.
The percentage-of-completion method is used to recognize revenue for construction services. Periodic estimates of progress towards completion are made based on either a comparison of labor costs incurred to date with total estimated contract labor costs or total costs incurred to date with total estimated contract costs. The percentage-of-completion method requires the use of various estimates, including among others, the extent of progress towards completion, contract revenues and contract completion costs. Contract revenues and contract costs to be recognized are dependent on the accuracy of estimates, including quantities of materials, labor productivity and other cost estimates. The Company has a history of making reasonable estimates of the extent of progress towards completion, contract revenues and contract completion costs. Due to uncertainties inherent in the estimation process, it is possible that actual contract revenues and completion costs may vary from estimates. Revenue recognized using the percentage-of-completion method for the years ended December 31, 2015, 2014 and 2013 represented approximately 92%, 94% and 95% of the total revenue for construction services for the respective periods.
Estimated losses on uncompleted contracts and changes in contract estimates reflect the Company's best estimate of probable losses of unbilled receivables, and are recognized in the period such revisions are known and can be reasonably estimated . These estimates are recognized in cost of sales. Estimated losses on uncompleted contracts and changes in contract estimates are established by assessing estimated costs to complete, change orders and claims for uncompleted contracts. Assumptions for estimated costs to complete include material prices, labor costs, labor productivity and contract claims. Such estimates are inherently uncertain and therefore it is possible that actual completion costs may vary from these estimates.
Shipping and handling costs
The Company includes shipping and handling costs in selling, general and administrative expenses on the consolidated statements of operations. Shipping and handling costs were $81.6 million, $60.3 million and $52.2 million for the years ended December 31, 2015, 2014 and 2013, respectively.
Property and equipment
Property and equipment are stated at cost. Expenditures for renewals and betterments, which extend the useful lives of assets, are capitalized while maintenance and repairs are charged to expense as incurred. Property and equipment obtained through acquisition are stated at estimated fair market value as of the acquisition date, and are depreciated over their estimated remaining useful lives, which may differ from our stated policies for certain assets. Gains and losses related to the sale of property and equipment are recorded as selling, general and administrative expenses.
Property and equipment are depreciated using the straight-line method and are generally depreciated over the following estimated service lives:
Buildings and improvements | 10–30 years | |
Leasehold improvements | Lesser of life of the asset or remaining | |
lease term, and not to exceed 15 years | ||
Furniture, fixtures and equipment | 2–10 years | |
Vehicles | 4–10 years | |
Property and equipment that is expected to be sold within the next twelve months, is actively marketed in its current condition for a price that is reasonable in comparison to its estimated fair value and meets other relevant held-for-sale criteria are classified as assets held for sale. Assets held for sale are measured at the lower of carrying amount or fair value less costs to sell and are no longer depreciated. An impairment for assets held for sale is recognized if the carrying amount is not recoverable. Due to lack of materiality, assets held for sale were not presented separately and were classified as other long-term assets in the consolidated balance sheets and were $0 and $0.7 million at December 31, 2015 and 2014, respectively.
57
Goodwill and other intangible assets
At least annually, or more frequently as changes in circumstances indicate, the Company tests goodwill for impairment. To the extent that the carrying value of the net assets of any of the reporting units having goodwill is greater than their estimated fair value, the Company may be required to record impairment charges. We have determined that our reporting units are equivalent to our six operating segments, which are the Mid-Atlantic, Southeast, Texas, Intermountain, Western and Mountain West divisions. The Company is required to make certain assumptions and estimates regarding the fair value of the reporting units containing goodwill when assessing for impairment. Changes in the fact patterns underlying such assumptions and estimates could ultimately result in the recognition of additional impairment losses.
We complete our annual impairment assessment during the third quarter of each year. We did not recognize any impairment for the years ended December 31, 2015, 2014 and 2013. We may consider qualitative factors as part of our annual impairment assessment to determine whether it is more likely than not that a reporting unit's carrying value exceeds its fair value. If our qualitative assessment indicates that goodwill impairment is more likely than not, we perform the two-step impairment test. Alternatively, we may bypass the qualitative test and initiate goodwill impairment testing with the first step of the two-step goodwill impairment test. During the first step of the goodwill impairment test, the fair value of the reporting unit is compared to its carrying value, including goodwill. We may derive a reporting unit's fair value through a combination of the market approach (a guideline transaction method) and the income approach. The income approach uses a reporting unit’s projection of estimated future cash flows that is discounted at a market derived weighted average cost of capital. The projection uses management’s best estimates of economic and market conditions over the projected period including growth rates in sales, costs, estimates of future expected changes in operating margins and cash expenditures.
If the fair value of a reporting unit exceeds its carrying value, then we conclude no goodwill impairment has occurred. If the carrying value of the reporting unit exceeds its fair value, we perform the second step of the goodwill impairment test to measure possible goodwill impairment loss. During the second step, the implied fair value of the reporting unit's goodwill is compared to the carrying value of its goodwill. If the carrying value of the reporting unit's goodwill exceeds the implied fair value of the goodwill, we would recognize an impairment loss in an amount equal to the excess, not to exceed the carrying value of the reporting unit's goodwill.
Acquired intangible assets other than goodwill are amortized over their weighted average amortization period unless they are determined to be indefinite. Acquired intangible assets are carried at cost, less accumulated amortization. For intangible assets purchased in a business combination, the estimated fair values of the assets received are used to establish the carrying value. The fair value of acquired intangible assets is determined using common valuation techniques, and the Company employs assumptions developed using the perspective of a market participant.
Impairment of long-lived assets
Long-lived assets, such as property, equipment and purchased intangible assets subject to amortization, are reviewed for impairment whenever facts and circumstances indicate that the carrying amount of an asset may not be recoverable. For impairment testing of long-lived assets, the Company identifies asset groups at the lowest level for which identifiable cash flows are largely independent of the cash flows of other groups of assets and liabilities. Recoverability of assets to be held and used is measured by a comparison of the carrying amount of an asset to estimated undiscounted future cash flows expected to be generated by the assets. If the carrying amount of an asset exceeds its estimated future cash flows, an impairment charge is recognized by the amount by which the carrying amount of the asset exceeds the estimated fair value of the asset.
Income taxes
The Company accounts for income taxes in accordance with ASC Topic 740, Income Taxes ("ASC 740"), which requires an asset and liability approach for measuring deferred taxes based on temporary differences between the financial statement and tax basis of assets and liabilities existing at each balance sheet date using enacted tax rates for years in which taxes are expected to be paid or recovered.
The Company evaluates its deferred tax assets on a quarterly basis to determine whether a valuation allowance is required. In accordance with ASC 740, the Company assesses whether a valuation allowance should be established based on its determination of whether it is more likely than not that some portion or all of the deferred tax assets will not be realized. The ultimate realization of deferred tax assets depends primarily on: (i) the Company's ability to carry back net operating losses to tax years where it has previously paid income taxes based on applicable federal law; (ii) the timing of the reversal of deferred tax liabilities; and (iii) the Company's ability to generate future taxable income during the periods in which the related deferred tax assets are deductible.
58
The assessment of a valuation allowance includes giving appropriate consideration to all positive and negative evidence related to the realization of the deferred tax asset. This assessment considers, among other things, the nature, frequency and severity of current and cumulative losses, forecasts of future profitability, the duration of statutory carryforward periods, the Company's experience with operating loss and tax credit carryforwards not expiring unused and tax planning alternatives. Significant judgment is required in determining the future tax consequences of events that have been recognized in the Company's consolidated financial statements and/or tax returns. Actual outcomes of these future tax consequences could differ materially from the outcomes that the Company currently anticipates.
ASC 740 defines the methodology for recognizing the benefits of uncertain tax return positions as well as guidance regarding the measurement of the resulting tax benefits. These provisions require an enterprise to recognize the financial statement effects of a tax position when it is more likely than not, which is defined as a likelihood of more than 50%, based on technical merits, that the position will be sustained upon examination. The evaluation of whether a tax position meets the more likely than not recognition threshold requires a substantial degree of judgment by management based on the individual facts and circumstances. Actual results could differ from estimates. The Company recognized a liability of $3.0 million and $0.0 million for uncertain tax positions as of December 31, 2015 and 2014, respectively, which is included in income taxes receivable on the consolidated balance sheets.
The Company’s policy is to recognize interest and penalties related to income tax liabilities and unrecognized tax benefits in income tax expense.
Casualty and health insurance
The Company carries insurance for general liability, auto liability and workers' compensation exposures subject to deductibles or self-insured retentions it believes to be reasonable under the circumstances, and the Company self-insures for employee and eligible dependent health care claims, with insurance purchased from independent carriers to cover individual claims in excess of the self-insured limits. The expected liability for unpaid claims, including incurred but not reported losses, is reflected on the consolidated balance sheets as a liability with current and long-term components. The amount recoverable from insurance providers is reflected on the consolidated balance sheets in prepaid expenses and other current assets. Provisions for losses are developed from actuarial valuations that rely upon the Company’s past claims experience, which considers both the frequency and settlement of claims. The casualty and health insurance liabilities are recorded at their undiscounted value.
In January 2015, the Company entered into a retroactive reinsurance contract to transfer the risk of loss of certain insurance deductible reserves for workers’ compensation claims incurred from 2006 to 2011 to a reinsurer. As a part of the contract, the Company paid $11.1 million to the reinsurer to assume $8.3 million of insurance deductible reserves. The $2.8 million difference between the amount paid to the reinsurer and the reserves transferred was recorded in selling, general and administrative expenses on the consolidated statement of operations for the year ended December 31, 2015. Pursuant to the reinsurance contract, the reinsurer is obligated to pay an aggregate maximum of $17.5 million for these claims with any excess borne by the Company.
The Company maintains the insurance deductible reserves related to these claims as a liability on its consolidated balance sheet with an offsetting reinsurance receivable, which includes current and long-term components. As of December 31, 2015, the carrying value of the insurance deductible reserves related to these claims and the offsetting reinsurance receivable was $6.4 million. Changes in these claims are recorded as an increase or decrease in the insurance deductible reserves and corresponding increase or decrease in the reinsurance receivable. Additionally, the Company monitors the financial condition of the reinsurer to minimize its exposure to significant losses from reinsurer insolvency.
Retirement savings program
The Company sponsors a defined contribution retirement savings plan. The Company has recorded expense of $2.4 million, $1.6 million and $0.3 million related to employer contributions for the years ended December 31, 2015, 2014 and 2013, respectively, which is included in selling, general and administrative expenses on the consolidated statements of operations.
Lease obligations
The Company recognizes lease obligations with fixed escalations of rental payments on a straight-line basis over the lease term, with the amount of rental expense in excess of lease payments recorded as a deferred rent liability. As of December 31, 2015 and 2014, the Company had a deferred rent liability of $0.8 million and less than $0.1 million, respectively, included in accrued expenses and other liabilities and other long-term liabilities on the consolidated balance sheets.
59
Advertising and promotion
Costs associated with advertising and promoting products and services are expensed in the period incurred. Cooperative advertising allowances that are reimbursement of specific, incremental and identifiable costs incurred to promote vendors' products are recorded as an offset against advertising expenses in selling, general and administrative expenses. If those conditions are not met, the cooperative advertising allowances are recorded as reduction in inventory and a subsequent reduction in cost of goods sold when the related product is sold. Advertising and promotion expenses recorded in selling, general and administrative expenses, net of cooperative advertising allowances, were not significant for the years ended December 31, 2015, 2014 and 2013.
Stock-based compensation
In accordance with the requirements of ASC 718, Compensation—Stock Compensation (“ASC 718”), the Company measures and recognizes compensation expense for all share-based payment awards made to employees using a fair value based pricing model. The compensation expense is recognized over the requisite service period.
Restructuring and related expenses
The Company accounts for costs associated with exit or disposal in accordance with ASC 420, Exit or Disposal Cost Obligations (“ASC 420”), which requires that: (i) liabilities associated with exit and disposal activities be measured at fair value; (ii) one-time termination benefits be expensed at the date the entity notifies the employee, unless the employee must provide future service, in which case the benefits are expensed ratably over the future service period; (iii) liabilities related to an operating lease/contract be recognized and measured at its fair value when the contract does not have any future economic benefit to the entity (i.e., the entity ceases to utilize the rights conveyed by the contract); and (iv) for typically all other costs related to an exit or disposal activity to be expensed as incurred.
Debt issuance costs
Costs incurred in connection with the Company’s Credit Agreement and Senior Notes are capitalized and amortized over the term of the agreement. Total debt issuance costs, net of accumulated amortization, were $9.5 million and $8.2 million as of December 31, 2015 and 2014, respectively. Amortization of debt issuance costs for the years ended December 31, 2015, 2014 and 2013 was $2.5 million, $2.3 million and $1.3 million, respectively, and is included in interest expense on the consolidated statements of operations.
Derivatives
The Company recognizes all derivative instruments as assets or liabilities in the Company’s balance sheets at fair value. Changes in the fair value of derivative instruments that are not designated as hedges or that do not meet the hedge accounting criteria are reported in earnings. The Company elected not to designate any new derivative instruments as hedges for the years 2015, 2014 or 2013, and therefore all changes in the fair market value of the hedge contracts have been reported in cost of goods sold on the consolidated statements of operations.
The Company does not enter into any derivatives for speculative or trading purposes; all derivatives are used to offset existing or expected risks associated with fluctuations in interest rates or commodities.
Warranty expense
The Company has warranty obligations with respect to most manufactured products. As of December 31, 2015 and 2014, the Company had warranty liabilities of $1.8 million and $1.5 million, respectively, included in accrued expenses and other liabilities on the consolidated balance sheets.
Headquarters relocation
In May 2014, BMC announced a plan to relocate its headquarters from Boise, Idaho to Atlanta, Georgia. The relocation will occur in phases, and is expected to be substantially complete no later than December 2016. The Company incurred relocation costs, including employee retention, severance, recruiting, relocation and professional fees, of $3.9 million and $2.1 million during the years ended December 31, 2015 and 2014, respectively. These expenses are recognized in selling, general and administrative expenses on the consolidated statements of operations.
60
Comprehensive (loss) income
Comprehensive (loss) income is equal to the net (loss) income for all periods presented.
Recently issued accounting pronouncements
In May 2014, the Financial Accounting Standards Board (“FASB”) issued Accounting Standards Update 2014-09, Revenue from Contracts with Customers (“ASU 2014-09”). ASU 2014-09 provides a comprehensive revenue recognition model requiring companies to recognize revenue for the transfer of goods or services to a customer at an amount that reflects the consideration it expects to receive in exchange for those goods or services. The guidance also requires additional disclosure about the nature, amount, timing and uncertainty of revenue and cash flows arising from customer contracts. In July 2015, the FASB voted to defer the effective date of ASU 2014-09 by one year, and therefore the standard is effective for the Company’s annual and interim periods beginning on January 1, 2018. Early application is permitted, but only for the Company’s annual and interim periods beginning on January 1, 2017. The guidance permits the use of either a retrospective or cumulative effect transition method. We have not yet selected a transition method and are evaluating the impact of the standard on our financial statements.
In April 2015, the FASB issued Accounting Standards Update No. 2015-05, Customer's Accounting for Fees Paid in a Cloud Computing Arrangement ("ASU 2015-05"). ASU 2015-05 provides guidance to customers about whether a cloud computing arrangement includes a software license. If a cloud computing arrangement includes a software license, then the customer should account for the software license element of the arrangement consistent with the acquisition of other software licenses. If a cloud computing arrangement does not include a software license, the customer should account for the arrangement as a service contract. The guidance will not change GAAP for a customer's accounting for service contracts. ASU 2015-05 is effective for the Company’s annual and interim periods beginning on January 1, 2016. Early adoption is permitted. We are evaluating the impact of the standard on our financial statements.
In July 2015, the FASB issued Accounting Standards Update No. 2015-11, Simplifying the Measurement of Inventory (“ASU 2015-11”). ASU 2015-11 requires that inventory within the scope of the guidance be measured at the lower of cost and net realizable value. Prior to the issuance of the standard, inventory was measured at the lower of cost or market, where market was defined as replacement cost, with a ceiling of net realizable value and floor of net realizable value less a normal profit margin. Inventory measured using last-in, first-out (LIFO) and the retail inventory method are not impacted by the new guidance. Prospective application is required and early adoption is permitted. ASU 2015-11 is effective for the Company’s annual and interim periods beginning on January 1, 2017. We are evaluating the impact of the standard on our financial statements.
In August 2015, the FASB issued Accounting Standards Update No. 2015-15, Interest - Imputation of Interest: Presentation and Subsequent Measurement of Debt Issuance Costs Associated with Line-of-Credit Arrangements - Amendments to SEC Paragraphs Pursuant to Staff Announcement at June 18, 2015 EITF Meeting (“ASU 2015-15”). ASU 2015-15 clarifies the treatment of debt issuance costs for line-of-credit arrangements, which was not addressed in Accounting Standards Update 2015-03, Simplifying the Presentation of Debt Issuance Costs. ASU 2015-15 clarifies that the SEC staff would not object to an entity deferring and presenting debt issuance costs related to a line-of-credit arrangement as an asset and subsequently amortizing the deferred debt issuance costs ratably over the term of such arrangement, regardless of whether there are any outstanding borrowings on the line-of-credit arrangement. ASU 2015-15 is effective for the Company’s annual and interim periods beginning on January 1, 2016. Early adoption is permitted. We are evaluating the impact of the standard on our financial statements.
In September 2015, the FASB issued Accounting Standards Update No. 2015-16, Business Combinations: Simplifying the Accounting for Measurement-Period Adjustments (“ASU 2015-16”). ASU 2015-16 requires that an acquirer recognize adjustments to provisional amounts that are identified during the measurement period in the reporting period in which the adjustment amounts are determined, including the cumulative effect of the change in provisional amount as if the accounting had been completed at the acquisition date. The adjustments related to previous reporting periods since the acquisition date must be disclosed by income statement line item either on the face of the income statement or in the notes. Prospective application is required. The Company early adopted ASU 2015-16 during the fourth quarter of 2015.
In November 2015, the FASB issued Accounting Standards Update No. 2015-17, Income Taxes (Topic 740): Balance Sheet Classification of Deferred Taxes ("ASU 2015-17"), which requires management to classify all deferred tax liabilities and assets by jurisdiction as non-current on the balance sheet instead of separating deferred taxes into current and non-current amounts. The standard can be applied either prospectively or retrospectively to all periods presented. ASU 2015-17 is effective for the Company's annual and interim periods beginning on January 1, 2018. The Company elected to early adopt this standard during the fourth quarter of 2015, and elected to apply the retrospective approach. Accordingly, we have reclassified $8.7 million of current deferred tax assets to long-term on our consolidated balance sheet as of December 31, 2014.
61
In February 2016, the FASB issued Accounting Standards Update 2016-02, Leases ("ASU 2016-02"). The new standard establishes a right-of-use ("ROU") model that requires a lessee to record a ROU asset and a lease liability on the balance sheet for all leases with terms longer than 12 months. Leases will be classified as either finance or operating, with classification affecting the pattern of expense recognition in the income statement. ASU 2016-02 is effective for the Company's annual and interim periods beginning on January 1, 2019. A modified retrospective transition approach is required for lessees for capital and operating leases existing at, or entered into after, the beginning of the earliest comparative period presented in the financial statements, with certain practical expedients available. We are evaluating the impact of the standard on our financial statements.
Reclassifications
In addition to the reclassification related to ASU 2015-17 as discussed in "Recently Issued Accounting Pronouncements" above, certain other amounts in prior years have been reclassified to conform to the current year presentation. These include the following:
• | $7.1 million of vendor rebate and marketing receivables, which were previously included in "Receivables, net of allowances" on the consolidated balance sheet as of December 31, 2014, were reclassified to "Prepaid expenses and other current assets." |
• | $2.8 million of cash advances from customers, which were previously included in "Accounts payable" on the consolidated balance sheet as of December 31, 2014, were reclassified to "Accrued expenses and other liabilities." |
• | $19.8 million of accrued compensation, which was previously shown separately as a line called "Accrued compensation" on the consolidated balance sheet as of December 31, 2014, was reclassified to "Accrued expenses and other liabilities." |
In prior years, the Company included changes in book overdrafts as a financing activity on its consolidated statements of cash flows. Book overdrafts relate primarily to checks issued that have not been presented for payment to the bank, and are classified in accounts payable on the consolidated balance sheets. The Company has reclassified changes in book overdrafts for the years ended December 31, 2014 and 2013 from a financing activity to an operating activity to conform to the current year presentation. The effect of this reclassification on net cash flows from operating and financing activities as previously presented on the consolidated statements of cash flows for the years ended December 31, 2014 and 2013 is as follows:
Year ended December 31, 2014, as previously presented | Reclassification amount | Year ended December 31, 2014, as reclassified | Year ended December 31, 2013, as previously presented | Reclassification amount | Year ended December 31, 2013, as reclassified | ||||||||||||||
Net cash provided by operating activities | $ | 27,681 | $ | 3,051 | $ | 30,732 | $ | 21,154 | $ | (5,797 | ) | $ | 15,357 | ||||||
Net cash provided by (used in) financing activities | 2,627 | (3,051 | ) | (424 | ) | 90,301 | 5,797 | 96,098 | |||||||||||
3. Acquisitions
For all acquisitions, we allocate the purchase price to assets acquired and liabilities assumed as of the date of acquisition based on the estimated fair values at the date of acquisition. The excess of the fair value of the purchase consideration over the fair values of the identifiable assets and liabilities is recorded as goodwill. Management makes significant estimates and assumptions when determining the fair value of assets acquired and liabilities assumed. These estimates include, but are not limited to, discount rates, projected future net sales, projected future expected cash flows and useful lives. When necessary, we will engage third-party valuation firms to assist us in determining fair values of acquired assets and assumed liabilities.
Merger with Stock Building Supply Holdings, Inc.
As described in Note 1, SBS and BMC were merged in an all-stock transaction on December 1, 2015. The Merger was accounted for as a reverse acquisition with BMC deemed to be the acquirer solely for accounting purposes. Accordingly, the consideration transferred has been allocated to the acquired assets and liabilities of SBS based upon their estimated fair values. The consideration transferred was calculated as the number of SBS common shares outstanding immediately prior to the Merger multiplied by the closing stock price of SBS on the closing date of the Merger. In addition, consideration transferred includes the fair value of outstanding SBS restricted stock units and stock options that vested upon consummation of the Merger, as well as the fair value of unvested SBS stock options multiplied by the portion of the requisite service period that elapsed prior to the closing date of the Merger.
62
The calculation of consideration transferred is as follows:
(in thousands, except share and per share data) | ||||
Number of SBS shares outstanding on the closing date of the Merger | 26,186,111 | |||
SBS common stock price per share on the closing date of the Merger | $ | 16.99 | ||
Deemed (for accounting purposes only) issuance of BMC stock to SBS shareholders | 444,902 | |||
Fair value of SBS equity awards | 8,488 | |||
Total consideration transferred | $ | 453,390 | ||
The preliminary allocated fair values of acquired assets and assumed liabilities is summarized as follows:
(in thousands) | ||||
Cash and cash equivalents | $ | 6,342 | ||
Accounts receivable | 124,526 | |||
Inventories | 115,888 | |||
Other current assets | 26,314 | |||
Property and equipment | 126,057 | |||
Customer relationships | 129,800 | |||
Trademarks | 4,500 | |||
Non-compete agreements | 6,112 | |||
Favorable lease agreements | 5,050 | |||
Other long-term assets | 1,302 | |||
Accounts payable | (77,062 | ) | ||
Accrued expenses and other liabilities | (40,652 | ) | ||
Unfavorable lease agreements | (4,550 | ) | ||
Current portion of capital lease obligations | (3,275 | ) | ||
Other current liabilities | (6,664 | ) | ||
Long-term debt | (67,713 | ) | ||
Deferred income taxes | (75,006 | ) | ||
Long-term portion of capital lease obligations | (11,612 | ) | ||
Other long-term liabilities | (5,666 | ) | ||
Identifiable net assets acquired | 253,691 | |||
Goodwill | 199,699 | |||
Total net assets acquired | $ | 453,390 | ||
The gross contractual value and fair value of accounts receivable acquired were $129.2 million and $124.5 million, respectively.
Inventory was valued at its estimated net realizable value, which is defined as expected sales price less cost to sell, plus a reasonable margin for the selling effort. The step-up in the basis of SBS's inventory totaled $13.2 million. Of this amount, $10.3 million was recognized in cost of goods sold in the Company's consolidated statement of operations for the year ended December 31, 2015. The remaining $2.9 million is expected to be recognized in cost of goods sold during the first quarter of 2016 as the remaining acquired inventory is sold.
Personal property assets were valued using the cost approach and/or market approach, real property assets were valued using the sales comparison and/or cost approach, customer relationships were valued using the excess earnings method, trademarks were valued using the relief from royalty method and non-compete agreements were valued using the lost profit method. In estimating the fair value of favorable and unfavorable lease agreements, market rents were estimated for each of SBS’s leased locations. If the contractual rents were considered to be below/above the market rent, a favorable/unfavorable lease agreement was valued by discounting the difference between the contractual rent and estimated market rates over the remaining lease term.
63
The customer relationships, trademarks and non-compete agreements are expected to be amortized over weighted average periods of 16.5 years, 4.2 years and 1.0 year, respectively. Acquired property and equipment will be depreciated on a straight-line basis over the respective estimated remaining useful lives.
The purchase price allocation is based upon all information available to the Company at the present time and is subject to change, and such changes could be material. Due to the size and complexity of the Merger and the consummation of the Merger shortly before the Company's fiscal 2015 year-end, the initial purchase accounting for intangible assets, fixed assets and inventory is not complete. As we receive additional information during the measurement period, these amounts may be adjusted.
Goodwill is calculated as the excess of the consideration transferred over the fair value of the identifiable net assets acquired and liabilities assumed, and represents the future economic benefits expected to arise from other intangible assets acquired that do not qualify for separate recognition, including assembled workforce and non-contractual relationships, as well as expected future synergies. None of the goodwill recognized is expected to be be tax deductible.
Net sales and estimated pre-tax loss of Legacy SBS included in the consolidated statements of operations for the year ended December 31, 2015 were $103.6 million and $18.6 million, respectively.
Acquisition of Robert Bowden, Inc.
On September 1, 2015, Legacy BMC purchased certain assets (excluding cash) and assumed certain liabilities of Marietta, Georgia-based Robert Bowden Inc. ("RBI") for an initial purchase price of $102.4 million in cash (subject to certain adjustments). RBI has three locations in the Atlanta, Georgia area, including its manufacturing facility in Marietta. RBI sells millwork and window products to homebuilders and residential contractors primarily in the Atlanta metro market. Legacy BMC funded the transaction through borrowings under the Legacy BMC Revolver. The acquisition was accounted for using the acquisition method of accounting under ASC 805.
The allocated fair values of acquired assets and assumed liabilities is summarized as follows:
(in thousands) | ||||
Accounts receivable | $ | 8,343 | ||
Inventories | 6,702 | |||
Prepaid expenses and other current assets | 122 | |||
Property and equipment | 5,524 | |||
Customer relationships | 39,900 | |||
Non-compete agreements | 400 | |||
Accounts payable and other accrued liabilities | (3,182 | ) | ||
Identifiable net assets acquired | 57,809 | |||
Goodwill | 44,541 | |||
Total net assets acquired | $ | 102,350 | ||
Inventory and property and equipment were valued using the cost approach and/or market approach, customer relationships were valued using the excess earnings method and non-compete agreements were valued using the lost profit method. The customer relationships and non-compete agreements are expected to be amortized over periods of 10 years and 3 years, respectively.
The purchase price allocation is based upon all information available to the Company at the present time and is subject to change, and such changes could be material. As we receive additional information during the measurement period, these assets and liabilities may be adjusted.
Goodwill represents the future economic benefits expected to arise from other intangible assets acquired that do not qualify for separate recognition, including assembled workforce and non-contractual relationships, as well as expected future synergies. All of the goodwill recognized is expected to be be tax deductible.
Net sales and estimated pre-tax income of RBI included in the consolidated statements of operations for the year ended December 31, 2015 were $27.0 million and $1.2 million, respectively.
64
Acquisition of VNS Corporation
On May 1, 2015, Legacy BMC completed the acquisition of Vidalia, Georgia-based VNS Corporation (“VNS”), enabling Legacy BMC to expand its product offerings into the southeastern United States. Legacy BMC funded the transaction through the use of available cash and borrowings on the Legacy BMC Revolver. The final purchase price was $47.1 million, net of $2.3 million of acquired cash. The acquisition was accounted for using the acquisition method of accounting under ASC 805, Business Combinations.
The allocated fair values of acquired assets and assumed liabilities is summarized as follows:
(in thousands) | ||||
Cash | $ | 2,344 | ||
Accounts receivable | 19,594 | |||
Inventories | 10,665 | |||
Prepaid expenses and other current assets | 952 | |||
Property and equipment | 11,643 | |||
Customer relationships | 10,000 | |||
Trademarks | 850 | |||
Other long-term assets | 59 | |||
Accounts payable | (7,464 | ) | ||
Accrued payable and other accrued liabilities | (4,087 | ) | ||
Deferred taxes | (4,364 | ) | ||
Identifiable net assets acquired | 40,192 | |||
Goodwill | 9,287 | |||
Total net assets acquired | $ | 49,479 | ||
Inventory and property and equipment were valued using the cost approach and/or market approach, customer relationships were valued using the excess earnings method and trademarks were valued using the relief from royalty method. The customer relationships and trademarks are expected to be amortized over periods of 10 years and 2 years, respectively.
The purchase price allocation is based upon all information available to the Company at the present time and is subject to change, and such changes could be material. As we receive additional information during the measurement period, these assets and liabilities may be adjusted.
Goodwill represents the future economic benefits expected to arise from other intangible assets acquired that do not qualify for separate recognition, including assembled workforce and non-contractual relationships, as well as expected future synergies. None of the goodwill recognized is expected to be be deductible for tax purposes.
Net sales and estimated pre-tax income of VNS included in the consolidated statements of operations for the year ended December 31, 2015 were $104.5 million and $4.7 million, respectively.
Pro Forma Financial Information (Unaudited)
The following unaudited pro forma combined results of operations give effect to the Merger and acquisitions of RBI and VNS by the Company as if SBS, RBI and VNS had been acquired on January 1, 2014, the beginning of the comparable prior annual period, applying certain assumptions and pro forma adjustments. These pro forma adjustments primarily relate to depreciation expense on stepped up fixed assets, amortization of acquired intangibles, cost of goods sold expense related to the sale of stepped up inventory, interest expense related to additional debt that would be needed to fund the acquisitions and the estimated impact of these adjustments on the Company's income tax provision. The unaudited pro forma consolidated results of operations are provided for illustrative purposes only and are not indicative of the Company's actual consolidated results of operations or consolidated financial position. The unaudited pro forma results of operations do not reflect any operating efficiencies or potential cost savings which may result from the Merger and acquisitions of RBI and VNS.
65
Unaudited pro forma financial information is as follows:
Pro Forma Year Ended December 31, | ||||||||
(in thousands) | 2015 | 2014 | ||||||
Net sales | $ | 2,890,163 | $ | 2,819,398 | ||||
Net income | 15,098 | 56,710 | ||||||
Basic net income per share | 0.23 | 0.87 | ||||||
Diluted net income per share | 0.23 | 0.86 | ||||||
Western Building Supply
On November 11, 2013, the Company acquired certain assets of Western Building Supply, a millwork business located in northern California for $6.7 million in cash. The acquisition provides us with millwork manufacturing capability to serve new customers in the northern California region.
The impact of this acquisition on our operating results was not considered material for the reporting of pro forma financial information.
4. Accounts Receivable
Accounts receivable consist of the following at December 31, 2015 and 2014:
(in thousands) | 2015 | 2014 | ||||||
Trade receivables | $ | 311,932 | $ | 128,672 | ||||
Allowance for doubtful accounts | (2,357 | ) | (1,560 | ) | ||||
Other allowances | (6,399 | ) | (460 | ) | ||||
$ | 303,176 | $ | 126,652 | |||||
The following table shows the changes in our allowance for doubtful accounts:
(in thousands) | 2015 | 2014 | 2013 | |||||||||
Balance at January 1 | $ | 1,560 | $ | 1,259 | $ | 1,722 | ||||||
Write-offs | (558 | ) | (488 | ) | (342 | ) | ||||||
Recoveries | 236 | 139 | 116 | |||||||||
Increase (decrease) in allowance | 1,119 | 650 | (237 | ) | ||||||||
Balance at December 31 | $ | 2,357 | $ | 1,560 | $ | 1,259 | ||||||
5. Inventories
Inventories consist principally of materials purchased for resale, including lumber, sheet goods, millwork, windows and doors, as well as certain manufactured products and are valued at the lower of cost or market, with cost being measured using a weighted average cost approach, which approximates the first-in, first-out approach. A provision for excess and obsolete inventory of $0.6 million and $0.3 million is recorded as of December 31, 2015 and 2014, respectively.
66
6. Property and Equipment
Property and equipment consists of the following at December 31, 2015 and 2014:
(in thousands) | 2015 | 2014 | ||||||
Land | $ | 58,757 | $ | 39,284 | ||||
Buildings and improvements | 90,429 | 61,451 | ||||||
Leasehold improvements | 10,934 | 1,486 | ||||||
Furniture, fixtures and equipment | 115,861 | 50,251 | ||||||
Vehicles | 87,307 | 44,819 | ||||||
Construction-in-progress | 16,349 | 8,478 | ||||||
379,637 | 205,769 | |||||||
Less: Accumulated depreciation | (83,659 | ) | (65,334 | ) | ||||
$ | 295,978 | $ | 140,435 | |||||
Total depreciation expense for the years ended December 31, 2015, 2014 and 2013 was $21.0 million, $15.5 million and $12.5 million, respectively, including amortization expense related to capital leases. These amounts include depreciation expense of $5.3 million, $4.0 million and $3.3 million included in cost of goods sold in 2015, 2014 and 2013, respectively.
7. Goodwill and Intangible Assets, Net
Goodwill
The carrying value of goodwill was $1.1 million as of December 31, 2013. There was no goodwill activity for the year ended December 31, 2014. The following table details the goodwill activity for the years ended December 31, 2015, 2014 and 2013:
(in thousands) | ||||
December 31, 2012 | $ | — | ||
Acquisition of Western Building Supply | 1,137 | |||
December 31, 2013 and 2014 | 1,137 | |||
Acquisition of VNS Corporation | 9,287 | |||
Acquisition of Robert Bowden, Inc. | 44,541 | |||
Merger with Stock Building Supply Holdings, Inc. | 199,699 | |||
December 31, 2015 | $ | 254,664 | ||
Intangible assets
Intangible assets represent the value assigned to trademarks, customer relationships and non-compete agreements in connection with acquired companies. The trademarks, customer relationships and non-compete agreements are being amortized over weighted-average periods of 3.8 years , 14.7 years and 1.1 years, respectively. The following table provides the gross carrying amount and related accumulated amortization of definite-lived intangible assets.
Trademarks | Customer Relationships | Non-Compete Agreements | |||||||||||||||||||||||||
Gross | Gross | Gross | |||||||||||||||||||||||||
Carrying | Accumulated | Carrying | Accumulated | Carrying | Accumulated | ||||||||||||||||||||||
(in thousands) | Amount | Amortization | Amount | Amortization | Amount | Amortization | Total | ||||||||||||||||||||
December 31, 2014 | $ | — | $ | — | $ | — | $ | — | $ | — | $ | — | $ | — | |||||||||||||
Acquisition of VNS | 850 | — | 10,000 | — | — | — | 10,850 | ||||||||||||||||||||
Acquisition of RBI | — | — | 39,900 | — | 400 | — | 40,300 | ||||||||||||||||||||
Acquisition of SBS | 4,500 | — | 129,800 | — | 6,112 | — | 140,412 | ||||||||||||||||||||
Amortization | — | (408 | ) | — | (2,664 | ) | — | (554 | ) | (3,626 | ) | ||||||||||||||||
December 31, 2015 | $ | 5,350 | $ | (408 | ) | $ | 179,700 | $ | (2,664 | ) | $ | 6,512 | $ | (554 | ) | $ | 187,936 | ||||||||||
67
Aggregate amortization expense was $3.6 million, $0.0 million and $1.3 million for the years ended December 31, 2015, 2014 and 2013, respectively. Based upon current assumptions, the Company expects that its definite-lived intangible assets will be amortized according to the following schedule:
(in thousands) | ||||
2016 | $ | 20,506 | ||
2017 | 14,632 | |||
2018 | 13,629 | |||
2019 | 12,957 | |||
2020 | 12,957 | |||
Thereafter | 113,255 | |||
$ | 187,936 | |||
8. Accrued Expenses and Other Liabilities
Accrued expenses and other liabilities consists of the following at December 31, 2015 and 2014:
(in thousands) | 2015 | 2014 | ||||||
Accrued payroll and other employee related expenses | $ | 42,776 | $ | 19,780 | ||||
Accrued taxes | 19,744 | 8,996 | ||||||
Advances from customers | 10,133 | 2,830 | ||||||
Accrued lending fees | 2,520 | — | ||||||
Accrued professional fees | 2,442 | 399 | ||||||
Accrued rebates payable | 1,840 | 1,439 | ||||||
Accrued warranty reserve | 1,762 | 1,452 | ||||||
Unfavorable leases | 789 | — | ||||||
Other | 9,882 | 5,290 | ||||||
$ | 91,888 | $ | 40,186 | |||||
9. Debt
Long-term debt as of December 31, 2015 and 2014 consists of the following:
(in thousands) | December 31, 2015 | December 31, 2014 | ||||||
Revolving credit agreement | $ | 152,260 | $ | — | ||||
Senior secured notes | 250,000 | 250,000 | ||||||
Other | 6,266 | 9,856 | ||||||
408,526 | 259,856 | |||||||
Unamortized original issue discount | (664 | ) | (907 | ) | ||||
407,862 | 258,949 | |||||||
Less: Current portion of long-term debt | 2,777 | 3,661 | ||||||
$ | 405,085 | $ | 255,288 | |||||
Revolving Credit Agreement
On December 1, 2015, in connection with the Merger, the Company entered into a credit agreement (the "Credit Agreement") with Wells Fargo Capital Finance, as administrative agent, and certain other lenders. The Credit Agreement includes a revolving line of credit (the "Revolver") with maximum availability of $450 million, of which up to $75 million may be used for issuance of letters of credit. The Revolver is subject to an asset-based borrowing formula on eligible accounts receivable, credit card receivables
68
and inventory, in each case reduced by certain reserves. We were in compliance with all debt covenants for the year ended December 31, 2015.
Borrowings under the Revolver bear interest, at our option, at either the Base Rate (which means the higher of (i) the Federal Funds Rate plus 0.5%, (ii) the LIBOR rate plus 1.0% or (iii) the prime rate) plus a Base Rate Margin (which ranges from 0.25% to 0.75% based on Revolver availability) or LIBOR plus a LIBOR Rate Margin (which ranges from 1.25% to 1.75% based on Revolver availability).
The fee on any outstanding letters of credit issued under the Revolver ranges from 0.75%-1.25%, depending on whether the letters of credit are fully cash collateralized. The fee on the unused portion of the Revolver is 0.25%. The Credit Agreement contains customary nonfinancial covenants, including restrictions on new indebtedness, issuance of liens, investments, distributions to equityholders, asset sales and affiliate transactions. The Credit Agreement includes a financial covenant that requires us to maintain a minimum Fixed Charge Coverage Ratio of 1.00:1:00, as defined therein. However, the covenant is only applicable if excess availability under the Credit Agreement is less than or equal to the greater of (1) $40 million and (2) 10% of the line cap, and remains in effect until excess availability has been greater than the greater of (1) $40 million and (2) 10% of the line cap for 30 consecutive days.
We had outstanding borrowings of $152.3 million with net availability of $127.3 million as of December 31, 2015. The interest rate on outstanding LIBOR Rate borrowings of $129.0 million ranged from 1.7%-1.9%, the interest rate on outstanding FILO borrowings of $21.0 million of 2.7% and the interest rate on outstanding Base Rate borrowings of $2.3 million was 4.0% as of December 31, 2015. We had $64.6 million in letters of credit outstanding under the Credit Agreement as of December 31, 2015. The Revolver is collateralized by substantially all assets of the Company. The carrying value of the Revolver at December 31, 2015 approximates fair value as the Revolver contains a variable interest rate. As such, the fair value of the Revolver was classified as a Level 2 measurement in accordance with ASC 820.
Senior Secured Notes
On September 20, 2013, Legacy BMC issued $250.0 million of senior secured notes (the "Senior Notes"). The Senior Notes are governed by an indenture dated September 20, 2013 (the " BMC Indenture"). Concurrent with the Merger, the Company entered into a second supplemental indenture pursuant to which the Company assumed all obligations of Legacy BMC in relation to the Senior Notes (together with the BMC Indenture, the "Indenture"). The Senior Notes mature on September 15, 2018 and are secured by a first priority lien on certain property and equipment and a subordinate lien on certain assets which collectively approximate substantially all assets of the Company. The interest rate is fixed at 9.0% and is payable semiannually in March and September. The Indenture contains customary nonfinancial covenants, including restrictions on new indebtedness, issuance of liens, investments, distributions to equityholders, asset sales and affiliate transactions. The Senior Notes are held at BMC Stock Holdings, Inc., the parent company, which has no independent assets or operations. The Senior Notes are guaranteed by all of the subsidiaries of the Company. Each of the subsidiary guarantors is 100% owned, directly or indirectly, by the Company, and all guarantees are full and unconditional and joint and several.
As of September 2015, we may redeem the Notes at a redemption price of 106.75%, declining to 103.375% beginning September 2016. Redemption prices are reduced to par value in September 2017. As of December 31, 2015, the estimated market value of the Senior Notes is $10.6 million more than the carrying amount. The fair value is based on the institutional trading activity and was classified as a Level 2 measurement in accordance with ASC 820.
Other
Other long-term debt consists of $5.8 million of term notes secured by delivery and handling equipment with various maturities through April 2019 and a $0.5 million term note secured by real property with a maturity of March 2021. The interest rates range from 4.6% to 8.4%. Interest is paid monthly. Based on interest rates available to us, the estimated market value of other long-term debt approximates the carrying amount.
69
Scheduled maturities of long-term debt were as follows:
(in thousands) | ||||
2016 | $ | 2,777 | ||
2017 | 1,970 | |||
2018 | 403,504 | |||
2019 | 146 | |||
2020 | 115 | |||
Thereafter | 14 | |||
$ | 408,526 | |||
10. Other Long-term Liabilities
Other long-term liabilities consists of the following at December 31, 2015 and 2014:
(in thousands) | 2015 | 2014 | ||||||
Unfavorable leases | $ | 3,696 | $ | — | ||||
Long-term severance reserve | 1,986 | — | ||||||
Long-term deferred rent | 774 | 22 | ||||||
Other | 378 | — | ||||||
$ | 6,834 | $ | 22 | |||||
11. Income Taxes
The components of income tax (benefit) expense for the years ended December, 31 2015, 2014 and 2013 are as follows:
(in thousands) | 2015 | 2014 | 2013 | |||||||||
Current | ||||||||||||
Federal | $ | (4,202 | ) | $ | 3,765 | $ | 5,358 | |||||
State | 405 | 1,150 | 915 | |||||||||
(3,797 | ) | 4,915 | 6,273 | |||||||||
Deferred | ||||||||||||
Federal | (4,176 | ) | (69,281 | ) | — | |||||||
State | (1,716 | ) | (1,211 | ) | — | |||||||
(5,892 | ) | (70,492 | ) | — | ||||||||
$ | (9,689 | ) | $ | (65,577 | ) | $ | 6,273 | |||||
A reconciliation of differences between the statutory U.S. federal income tax rate of 35% and the Company’s effective tax rate from continuing operations for the years ended December 31, 2015, 2014, and 2013 follows:
2015 | 2014 | 2013 | |||||||
Federal statutory rate | 35.0 | % | 35.0 | % | 35.0 | % | |||
State taxes, net of federal tax | 1.7 | 4.1 | 4.4 | ||||||
Nondeductible capitalized transaction costs | (16.2 | ) | — | — | |||||
Nondeductible (permanent) items | (3.0 | ) | 0.6 | 0.7 | |||||
Changes in tax rates | (6.2 | ) | — | — | |||||
Changes related to IRC section 382 limitations | 55.5 | — | 17.6 | ||||||
Other items | (0.1 | ) | (2.6 | ) | (1.6 | ) | |||
Valuation allowance | — | (267.6 | ) | (33.6 | ) | ||||
Effective tax rate | 66.7 | % | (230.5 | )% | 22.5 | % | |||
70
For 2015, the Company recognized a $9.7 million income tax benefit, which included an income tax benefit of $8.1 million as a result of the Company adopting a tax position related to Internal Revenue Code ("IRC") section 382 limitations on its federal and state net operating loss carry-forwards and other built-in losses. IRC section 382 imposes annual limitations on the utilization of net operating loss carry-forwards, other tax carry-forwards and certain built-in losses (collectively, “Tax Attributes”) upon an ownership change as defined under that section. In general terms, an ownership change may result from transactions that increase the aggregate ownership of certain stockholders in the Company’s stock by more than 50 percentage points over a three year testing period. If the Company were to experience an IRC section 382 ownership change, an annual limitation could be imposed on certain Tax Attributes. Upon the Merger, the Company reviewed whether any of its Tax Attributes would be subject to IRC section 382 limitation and from such review, identified a tax position which involves using a specific identification method, instead of the Company's previous ratable allocation method, to determine the amount of tax-deductible built-in losses subject to IRC section 382 limitations. As a result of adopting this tax position in the fourth quarter of 2015, the Company more likely than not expects to realize additional federal and state net operating loss carry-forwards that were previously limited under the prior method of determining IRC section 382 limitations against its Tax Attributes. The Company did not recognize any material unfavorable adjustments to its Tax Attributes specifically related to the change of control from the Merger on December 1, 2015. For 2015, the Company's effective tax rate, excluding the IRC section 382 tax position change, was lower than the Company’s federal and state statutory rates primarily due to non-deductible merger-related transaction costs.
In the fourth quarter of 2015, the Company recorded an out-of-period benefit of approximately $0.9 million to income taxes related to an error in the calculation of state net operating loss carryforwards. The Company has determined the adjustment is not material to the current period or any previously issued financial statements.
On December 1, 2015, BMC and SBS completed the Merger. The Merger qualified as a tax-free reorganization within the meaning of IRC section 368(a), and therefore, the Company assumed the carryover tax basis of the acquired assets and liabilities of SBS. As a result, the Company recorded a net deferred tax liability of $75.0 million and a tax payable of $3.2 million impacting goodwill as part of purchase accounting. None of the goodwill recognized as part of this transaction is deductible for income tax purposes.
On September 1, 2015, BMC acquired the assets of RBI and recognized an increase in tax basis based on the purchase price. Goodwill recognized as part of this transaction is deductible for income tax purposes.
On May 1, 2015, BMC completed its stock acquisition of VNS. The Company assumed the carryover tax basis of the acquired assets and liabilities of VNS. As a result, the Company recorded a net deferred tax liability of $4.4 million and a tax receivable of $0.4 million impacting goodwill as part of purchase accounting. None of the goodwill recognized as part of this transaction is deductible for income tax purposes.
For 2014, the Company recognized a $65.6 million income tax benefit primarily related to $76.1 million reversal of the valuation allowance, a discrete item, on BMC’s deferred tax assets during the three months ended June 30, 2014. This income tax benefit was reduced by $10.6 million income tax expense for federal and certain states. The Company’s effective tax rate prior to the reversal of the valuation allowance was 37.1% and was lower than the Company’s federal and state statutory rates due to tax credits partially offset by non-deductible expenses and non-deductible loss limitation.
For 2013, the Company recognized $6.3 million of income tax expense. The Company’s effective tax rate was 22.5% and was lower than the Company’s federal and state statutory rates due to utilization of limited prior operating loss carryforwards and temporary differences and tax credits partially offset by non-deductible expenses.
71
Significant components of the Company’s deferred tax assets and liabilities are as follows at December 31, 2015 and 2014:
(in thousands) | 2015 | 2014 | ||||||
Deferred tax assets related to: | ||||||||
Accounts receivable | $ | 3,780 | $ | 753 | ||||
Inventory | 4,725 | 1,667 | ||||||
Goodwill and intangibles | — | 22,932 | ||||||
Accrued compensation | 5,462 | 1,555 | ||||||
Insurance deductible reserves | 14,186 | 13,496 | ||||||
Stock-based compensation | 2,759 | 1,240 | ||||||
Restructuring reserves | 4,008 | — | ||||||
Other accrued liabilities | 918 | 821 | ||||||
Federal net operating loss carryforward | 32,361 | 30,480 | ||||||
State net operating loss carryforward | 5,036 | 1,211 | ||||||
Other | 283 | 404 | ||||||
73,518 | 74,559 | |||||||
Valuation allowance | (126 | ) | — | |||||
Total deferred tax assets | 73,392 | 74,559 | ||||||
Deferred tax liabilities related to: | ||||||||
Goodwill and intangibles | (32,452 | ) | (33 | ) | ||||
Property and equipment | (42,261 | ) | (2,941 | ) | ||||
Other assets | (1,700 | ) | (1,093 | ) | ||||
Total deferred tax liabilities | (76,413 | ) | (4,067 | ) | ||||
Net deferred tax (liability) asset | $ | (3,021 | ) | $ | 70,492 | |||
At December 31, 2015, due to the IRC section 382 limitations, the Company estimates federal net operating loss carryforwards generated prior to November 2011 will be limited to approximately $4.8 million per year through 2034. These net operating losses may generally be carried forward 20 years. As a result, federal operating losses if unused will expire as follows:
• | $48.1 million in 2028; |
• | $17.3 million in 2029; and |
• | $27.1 million, or approximately $4.8 million per year, in years 2030 through 2034. |
In addition, at December 31, 2015, the Company had $126.2 million of state net operating loss carryforwards that expire at various dates commencing in 2017 through 2032.
Deferred tax assets relating to tax benefits of stock-based compensation have been reduced to reflect exercises. Some exercises resulted in tax deductions in excess of previously recorded deferred tax benefits based on the value at the time of grant ("windfalls"). The Company has excluded excess windfall tax benefits resulting from stock-based compensation vesting and exercises as components of the Company’s gross deferred tax assets, as Tax Attributes related to such windfall tax benefits should not be recognized until they result in a reduction of taxes payable. The tax effected amount of unrealized net operating loss carryforwards resulting from stock-based compensation awards vested and/or exercised was $0.4 million, $0.0 million, and $0.0 million at December 31, 2015, 2014, and 2013, respectively. When realized, these excess windfall tax benefits are credited to additional paid-in capital. Excess windfall tax benefits recognized as a component of shareholders' equity were $0.0 million, $1.0 million, and $2.6 million for December 31, 2015, 2014, and 2013, respectively. The Company follows the "with-and-without" allocation approach to determine when such net operating loss carryforwards have been realized.
The Company recognized a current income tax receivable of $11.4 million and $6.0 million at December 31, 2015 and 2014, respectively. The Company paid federal and state income tax payments of $4.6 million and $12.9 million during 2015 and 2014, respectively. The Company received tax refunds of $0.3 million in 2015 and $0.0 million in 2014.
72
In accordance with ASC 740, the Company evaluates its deferred tax assets to determine if valuation allowances are required. In assessing the realizability of deferred tax assets, the Company considers both positive and negative evidence in determining whether it is more likely than not that some portion or all of the deferred tax assets will not be realized.
As of December 31, 2015, the primary positive evidence considered to support the realization of the Company's deferred tax assets includes: (i) the cumulative pre-tax income over the last 36 months, (ii) the reversal of deferred tax liabilities related to depreciation and amortization that would occur within the same jurisdiction and during the carry forward period necessary to absorb the federal and state net operating losses and other deferred tax assets, (iii) current and prior year utilization of federal and state net operating losses, and (iv) no history of material expiring Tax Attributes. The primary negative evidence considered includes: (i) the Company's cumulative losses prior to 2013, (ii) unsettled circumstances associated with the general economy and housing market, as well as mortgage credit availability, and (iii) no federal and state net operating loss carryback opportunities. To the extent the Company generates future net operating losses, the Company may be required to increase the valuation allowance on its deferred tax assets and income tax benefit would be adversely affected.
Based upon the positive and negative evidence considered, the Company believes it is more likely than not that it will realize the benefit of the deferred tax assets, net of the existing state tax valuation allowances of $0.1 million as of December 31, 2015. To the extent the Company generates sufficient taxable income in the future to fully utilize the tax benefits of the net deferred tax assets on which a valuation allowance was recorded, the Company’s effective tax rate would be impacted as the valuation allowance is reversed. The Company continues to evaluate its deferred tax asset on a quarterly basis and notes that, if economic conditions were to change such that the Company earns less taxable income than the amounts required to fully utilize its deferred tax asset, a portion of the asset may expire unused.
As of June 30, 2014, BMC recognized no valuation allowance against the $76.1 million in total deferred tax assets compared to a valuation allowance of $75.2 million against total deferred tax assets as of December 31, 2013. BMC performed its quarterly assessment of all positive and negative evidence and determined that it was more likely than not that the deferred tax assets would be realizable. As of June 30, 2014, significant components of the deferred tax assets consisted of: (i) $30.5 million (or approximately $87.1 million of federal net operating loss carryforwards on a pre-tax effect basis) associated with federal net operating loss carryforwards; (ii) $24.8 million related to intangible assets reversing through 2020; (iii) $1.8 million in net operating losses from various states expiring between 2015 and 2031; and (iv) $19.0 million of deductible timing differences, primarily related to insurance reserves and other accruals.
The positive evidence supporting the reversal of BMC’s deferred tax asset valuation allowance as of June 30, 2014 included: (i) cumulative pre-tax income for the three years ended June 30, 2014; (ii) cumulative pre-tax income in the five quarters ending June 30, 2014; (iii) increase in sales in most of BMC’s markets during 2013 and the six months ended June 30, 2014; (iv) projected future taxable income based on positive financial indicators compared to the prior year; and (v) no history of expiring tax attributes. Contributing to projected future taxable income were increases in sales and gross margin, as well as external factors, such as macroeconomic reports indicating falling unemployment, historically low interest rates and high housing affordability. The negative evidence evaluated included: (i) BMC’s cumulative losses prior to 2013; (ii) unsettled circumstances associated with the general economy and housing market, as well as mortgage credit availability; (iii) Section 382 limitations related to federal net operating loss; and (iv) no taxable income in the carryback periods.
Taking all of the foregoing information into account, BMC’s analysis showed that, even if U.S. housing permits and starts were to stop growing at the pace they grew in 2013, such that BMC was unable to achieve pre-tax income in excess of the $27.9 million it experienced during 2013, which BMC’s projections for 2014 indicated would not be the case, then BMC would still be able to fully utilize its deferred tax asset allowed in 2014, with respect to which it reversed the valuation allowance. This fact, coupled with the other positive evidence described above, in BMC’s view significantly outweighed the available negative evidence and required BMC to conclude, in accordance with ASC 740, that it was more likely than not that the deferred tax assets at June 30, 2014 would be realized.
As of December 31, 2014, BMC evaluated the realizability of its deferred tax assets and concluded that a valuation allowance was not required at that date. Positive evidence supporting the conclusion as of December 31, 2014 included the following: (i) BMC continued to recognize a cumulative pretax income for the three years ended December 31, 2014; (ii) BMC recorded sales and pre-tax income of $1.3 billion and $28.5 million, respectively, for 2014, increases of 8.4% and 2.2%, respectively, from 2013; (iii) BMC utilized federal and state net operating losses and other allowed deferred tax assets in 2014 and recorded taxable income for the year 2014; and (iv) no history of expiring tax attributes.
73
The following table shows the changes in the amount of the Company’s valuation allowance:
(in thousands) | 2015 | 2014 | 2013 | |||||||||
Balance at January 1, | $ | — | $ | 75,248 | $ | 84,629 | ||||||
Additions charged to expense | — | — | — | |||||||||
Additions charged to Goodwill/Purchase Accounting | 126 | — | — | |||||||||
Deductions - other | — | (75,248 | ) | (9,381 | ) | |||||||
Balance at December 31, | $ | 126 | $ | — | $ | 75,248 | ||||||
During 2015, the Company recognized a liability of $3.0 million for uncertain tax positions related to the Company's tax accounting method to accelerate certain temporary tax deductions on its 2014 federal and state income tax returns, which is reducing income taxes receivable on the consolidated balance sheet as of December 31, 2015. At December 31, 2015, the Company anticipates that it is reasonably possible that the total unrecognized tax benefits may be recognized within the next twelve months. Due to their temporary nature, the Company does not anticipate any impact on the effective tax rate upon the recognition of the tax benefit. During 2014, the Company recognized no material uncertain tax positions.
A reconciliation of the beginning and ending amount of gross unrecognized tax benefits (exclusive of the effect of interest and penalties) is as follows:
(in thousands) | 2015 | 2014 | ||||||
Balance at January 1, | $ | — | $ | — | ||||
Tax positions taken in prior periods: | ||||||||
Gross increases | — | — | ||||||
Gross decreases | — | — | ||||||
Tax positions taken in current period: | ||||||||
Gross increases | 3,224 | — | ||||||
Settlements with taxing authorities | — | — | ||||||
Lapse of applicable statute of limitations | — | — | ||||||
Balance at December 31, | $ | 3,224 | $ | — | ||||
The Company‘s state tax returns are open to examination for an average of three years. However, certain jurisdictions remain open to examination longer than three years due to the existence of net operating losses. The Company’s federal returns are open to examination for three years; however, due to statutory waivers, SBS' tax years ended July 31, 2008 and May 5, 2009 remain open until January 31, 2017 with the federal tax authorities. SBS is currently under examination by the IRS for its tax years ended July 31, 2008 and May 5, 2009. At December 31, 2015 and 2014, the amount recognized related to expected tax, penalties and interest payments as a result of the IRS audits in income taxes receivable on the consolidated balance sheets was immaterial.
The Company’s policy is to recognize interest and penalties related to income tax liabilities and unrecognized tax benefits in income tax expense. During the years ended December 31, 2015, 2014 and 2013, penalties and interest related to income tax liabilities and uncertain tax benefits were not material.
12. Commitments and Contingencies
The Company is obligated under capital leases covering fleet vehicles and certain equipment, as well as one facility. The fleet vehicles and equipment leases generally have terms ranging from three to six years and the facility lease has a remaining term of eight years. The carrying value of property and equipment under capital leases was $26.3 million and $11.7 million at December 31, 2015 and 2014, respectively, net of accumulated depreciation of $21.5 million and $17.6 million, respectively. Amortization of assets held under capital leases is included within depreciation expense or cost of goods sold on the consolidated statements of operations.
The Company also has noncancellable operating leases, primarily for buildings, improvements, and equipment. These leases generally contain renewal options for periods ranging from one to five years and require the Company to pay all executory costs such as property taxes, maintenance and insurance.
74
Future minimum lease payments under noncancellable operating leases (with initial or remaining lease terms in excess of one year) and future minimum capital lease payments as of December 31, 2015 are as follows.
(in thousands) | Capital Leases | Operating Leases | |||||||
2016 | $ | 8,270 | $ | 27,483 | |||||
2017 | 6,772 | 22,771 | |||||||
2018 | 3,936 | 19,131 | |||||||
2019 | 2,636 | 16,397 | |||||||
2020 | 1,892 | 11,062 | |||||||
Thereafter | 2,929 | 40,952 | |||||||
26,436 | $ | 137,796 | (a) | ||||||
Less: Amounts representing interest | (2,589 | ) | |||||||
Total obligation under capital leases | 23,847 | ||||||||
Less: Current portion of capital lease obligation | (7,352 | ) | |||||||
Long term capital lease obligation | $ | 16,495 | |||||||
(a) Minimum operating lease payments have not been reduced by minimum sublease rentals of $0.5 million due in the future under noncancelable subleases.
Total rent expense under operating leases, excluding short-term rentals, for the years ended December 31, 2015, 2014 and 2013 was $8.1 million, $4.2 million and $3.2 million, respectively, which are included in either cost of sales or selling, general and administrative expenses on the consolidated statements of operations, depending on the type of operations undertaken by the related facility or asset. Future payments for certain leases will be adjusted based on increases in the consumer price index.
As of December 31, 2015, the Company had purchase commitments $7.8 million related primarily to vehicles and certain IT equipment, which are enforceable and legally binding on us.
From time to time, various claims, legal proceedings and litigation are asserted or commenced against the Company principally arising from alleged product liability, warranty, casualty, construction defect, contract, tort, employment and other disputes. In determining loss contingencies, management considers the likelihood of loss as well as the ability to reasonably estimate the amount of such loss or liability. An estimated loss is recorded when it is considered probable that such a liability has been incurred and when the amount of loss can be reasonably estimated. It is not certain that the Company will prevail in these matters. However, the Company does not believe that the ultimate outcome of any pending matters will have a material adverse effect on its consolidated financial position, results of operations or cash flows.
13. Stockholders' Equity
Merger
In connection with the Merger, each share of issued and outstanding BMC common stock, par value $0.001 per share, excluding (i) any shares of BMC common stock held in treasury or by any wholly owned subsidiary of BMC or (ii) any shares of BMC common stock held by any Legacy BMC stockholder who was entitled to exercise, and properly exercised, appraisal rights with respect to such shares of BMC common stock pursuant to the General Corporation Law of the State of Delaware, was converted into the right to receive 0.5231 shares of Company common stock, par value $0.01 per share. As a result, approximately 39.2 million shares of Company common stock were issued to Legacy BMC stockholders. Each holder of BMC common stock converted pursuant to the Merger who would otherwise have been entitled to receive a fraction of a share of Company common stock received cash in lieu thereof in an amount each to such fractional amount multiplied by $17.19, the last reported sale price of SBS common stock on the the last complete trading day prior to the Merger.
Shares and price per share of BMC common stock for all prior periods have been restated to reflect the 0.5231 exchange ratio and BMC Stock's par value of $0.01 per share.
75
Treasury stock
Certain Legacy SBS employees elected to surrender shares to the Company to satisfy their tax withholding obligations in connection with the vesting of restricted stock awards on the Merger date. These surrendered shares are reflected as treasury stock, at cost, on the consolidated balance sheet as of December 31, 2015.
All BMC treasury shares were canceled in connection with the Merger.
14. Stock Based Compensation
Legacy BMC long-term incentive plans
In March 2013, BMC's Board of Directors approved the 2013 long-term incentive plan ("BMC 2013 Incentive Plan") as subsequently approved by BMC's shareholders in May 2013. The BMC 2013 Incentive Plan provided for grants of stock options, restricted stock and other stock-based awards. There were 1.6 million common shares reserved for issuance under the plan. The awards granted under this plan vest immediately for directors and over a three year period for key employees.
In March 2010, BMC's Board of Directors approved the 2010 long-term incentive plan ("BMC 2010 Incentive Plan") as approved by Legacy BMC's reorganization plan. The BMC 2010 Incentive Plan provided for grants of restricted stock. There were 5.2 million common shares reserved for issuance under the plan. The awards granted under this plan vest over a two year period for directors and a three year period for key employees.
Legacy SBS long-term incentive plan
In connection with its IPO in August 2013, SBS adopted the Stock Building Supply Holdings, Inc. 2013 Incentive Compensation Plan ("SBS 2013 Incentive Plan"). The SBS 2013 Incentive Plan provides for grants of stock options, stock appreciation rights, restricted stock, other stock-based awards, other cash-based compensation and performance awards. In general, if awards under the SBS 2013 Incentive Plan are for any reason canceled, or expire or terminate unexercised, the shares covered by such awards may again be available for the grant of awards under the SBS 2013 Incentive Plan. Awards granted under the SBS 2013 Incentive Plan generally vest over a period of three or four years. Stock options granted under the SBS 2013 Incentive Plan have a maximum contractual term of 10 years from the date of grant. Shares awarded that revert to the Company as a result of forfeiture or termination, expiration or cancellation of an award or that are used to exercise an award or for tax withholding, will be again available for issuance.
Effect of the Merger on stock based awards
The SBS 2013 Incentive Plan remained in effect upon consummation of the Merger. In connection with the Merger, the Company amended the SBS 2013 Incentive Plan in order to increase the number of shares of common stock authorized for issuance from 1.8 million to 5.6 million. As of December 31, 2015, approximately 3.7 million common shares were available for issuance under the SBS 2013 Incentive Plan.
Upon consummation of the Merger, the Company assumed all obligations of BMC under the BMC 2010 Incentive Plan and BMC 2013 Incentive Plan, including BMC's time-vesting restricted stock and performance-vesting restricted stock. At the effective time of the Merger, (i) each BMC time-vesting restricted share outstanding immediately prior to such time was converted, on the same terms and conditions as were applicable to such BMC time-vesting restricted share at such time, into a restricted share with respect to the number of shares of BMC Stock common stock determined by multiplying each BMC time-vesting restricted share by the exchange ratio, rounded up to the nearest whole share. The performance goals of each award of BMC performance-vesting restricted stock outstanding immediately prior to the Merger was deemed satisfied at maximum and was converted, on the same terms and conditions (other than the terms and conditions relating to achievement of performance goals), into a restricted share with respect to that number of shares of BMC Stock common stock determined by multiplying each BMC performance-vesting restricted share by the exchange ratio, rounded up to the nearest whole share, provided that the vesting criteria applicable to such conversion will provide for vesting based solely on the holder's continuation of service through the time of vesting.
Under the SBS 2013 Incentive Plan, the merger constituted a "change in control" of SBS. In connection with a "change in control," as defined in the SBS 2013 Incentive Plan, the vesting of outstanding awards under the SBS 2013 Incentive Plan was accelerated, with the exception of 0.2 million outstanding stock options and 0.3 million outstanding restricted stock units awarded to certain Legacy SBS employees during November 2015. The fair value of the vested awards on the Merger date of $8.3 million and the
76
fair value of the non-vested awards on the closing date of the Merger related to pre-Merger service rendered of $0.2 million were included in the calculation of consideration transferred.
Valuation of stock based awards
Prior to the Merger, the fair value of BMC equity awards was calculated using the enterprise value per share. The enterprise value was derived using a blend of the market approach, the income approach and prior sales of BMC shares. Weights were assigned to each approach to calculate a weighted average enterprise value. The value of these awards was discounted for a lack of marketability and non-operating assets and liabilities. Due to the uncertainties inherent in the assumptions used in these various valuation approaches, it is possible that actual share-based compensation realized by the participant may vary from the estimate of the fair value of these restricted stock units.
The fair value of the SBS stock options granted during November 2015 was estimated using the Black-Scholes option pricing model, with the following assumptions:
Expected dividend yield | 0 | % | |
Expected volatility factor (a) | 44 | % | |
Risk-free interest rate (b) | 2 | % | |
Expected term (in years) (c) | 6.0 | ||
(b) The risk-free interest rate was based on the U.S. Treasury yield at the time of grant.
(c) | The expected term was derived utilizing the "simplified method" in accordance with Securities and Exchange Commission Staff Accounting Bulletin No. 110, which uses the mid-point between the vesting date and the expiration date of the award. We believe use of this approach is appropriate given the lack of prior history of option exercises upon which to base an expected term. |
Stock based compensation is included in selling, general and administrative expenses on the consolidated statements of operations. The following table highlights stock based compensation for the years ended December 31, 2015, 2014 and 2013:
(in thousands) | 2015 | 2014 | 2013 | |||||||||
Stock options | $ | 42 | $ | — | $ | — | ||||||
Restricted stock | 2,607 | 3,410 | 2,425 | |||||||||
Restricted stock units | 100 | — | — | |||||||||
Stock based compensation | $ | 2,749 | $ | 3,410 | $ | 2,425 | ||||||
77
Stock based award activity
The following is a summary of restricted stock and restricted stock unit activity:
Restricted Stock | Restricted Stock Units | |||||||||||||
Number of Shares Outstanding (in thousands) | Weighted Average Grant Date Fair Value | Number of Units Outstanding (in thousands) | Weighted Average Grant Date Fair Value | |||||||||||
December 31, 2012 | 1,748 | $ | 2.01 | — | $ | — | ||||||||
Granted | 565 | 10.19 | — | — | ||||||||||
Vested | (1,420 | ) | 1.99 | — | — | |||||||||
Forfeited | — | — | — | — | ||||||||||
December 31, 2013 | 893 | 7.25 | — | — | ||||||||||
Granted | 264 | 11.66 | — | — | ||||||||||
Vested | (408 | ) | 4.95 | — | — | |||||||||
Forfeited | (43 | ) | 8.97 | — | — | |||||||||
December 31, 2014 | 706 | 10.15 | — | — | ||||||||||
Legacy SBS restricted stock units assumed | — | — | 318 | 16.99 | ||||||||||
Granted | 206 | 17.15 | — | — | ||||||||||
Vested | (279 | ) | 9.07 | — | — | |||||||||
Forfeited | (178 | ) | 11.37 | (36 | ) | 16.99 | ||||||||
December 31, 2015 | 455 | $ | 13.51 | 282 | $ | 16.99 | ||||||||
The following is a summary of stock option award activity. No stock options were granted by Legacy BMC during any periods prior to the Merger.
Number of Options (in thousands) | Weighted Average Exercise Price | Contractual Term (in years) | Intrinsic Value (in thousands) | ||||||||||
Outstanding at December 31, 2014 | — | $ | — | ||||||||||
Legacy SBS stock options assumed | 1,229 | 14.18 | |||||||||||
Granted | — | — | |||||||||||
Exercised | — | — | |||||||||||
Forfeited | (1 | ) | 17.04 | ||||||||||
Expired | — | — | |||||||||||
Outstanding at December 31, 2015 | 1,228 | $ | 14.17 | 7.9 | $ | 4,470 | |||||||
Exercisable at December 31, 2015 | 992 | $ | 13.49 | 7.5 | $ | 4,470 | |||||||
Vested and expected to vest at December 31, 2015 | 1,184 | $ | 14.07 | 7.9 | $ | 4,470 | |||||||
The grant date fair value of Legacy SBS unvested stock options assumed in the Merger was $7.48.
78
The following table summarizes the Company’s total unrecognized compensation cost related to equity based compensation as of December 31, 2015:
(in thousands, except period data) | Unrecognized Compensation Cost | Weighted Average Remaining Period of Expense Recognition (in years) | ||||
Stock options | $ | 1,687 | 2.8 | |||
Restricted stock | 2,737 | 1.2 | ||||
Restricted stock units | 4,582 | 2.8 | ||||
$ | 9,006 | |||||
15. Segments
ASC 280, Segment Reporting (“ASC 280”) defines operating segments as components of an enterprise about which separate financial information is available that is evaluated regularly by the chief operating decision maker in deciding how to allocate resources and in assessing performance.
The Company's operating segments consist of the Mid-Atlantic, Southeast, Texas, Intermountain, West and Mountain West divisions. Due to the similar economic characteristics, nature of products, distribution methods and customers, the Company has aggregated our operating segments into one reportable segment, "Geographic divisions."
In addition to our reportable segment, the Company's consolidated results include "Other reconciling items." Other reconciling items is comprised of our corporate activities.
The following tables present Net sales, Adjusted EBITDA and certain other performance measures for the reportable segment and total company operations for the periods indicated.
Year Ended December 31, 2015 | December 31, 2015 | |||||||||||||||||||
(in thousands) | Net Sales | Gross Profit | Depreciation & Amortization | Adjusted EBITDA | Total Assets | |||||||||||||||
Geographic divisions | $ | 1,576,746 | $ | 361,410 | $ | 23,726 | $ | 122,914 | $ | 1,305,545 | ||||||||||
Other reconciling items | — | — | 863 | (36,872 | ) | 70,463 | ||||||||||||||
$ | 1,576,746 | $ | 361,410 | $ | 24,589 | $ | 1,376,008 | |||||||||||||
Year Ended December 31, 2014 | December 31, 2014 | |||||||||||||||||||
(in thousands) | Net Sales | Gross Profit | Depreciation & Amortization | Adjusted EBITDA | Total Assets | |||||||||||||||
Geographic divisions | $ | 1,311,498 | $ | 295,074 | $ | 14,906 | $ | 98,933 | $ | 487,027 | ||||||||||
Other reconciling items | — | — | 551 | (21,664 | ) | 101,485 | ||||||||||||||
$ | 1,311,498 | $ | 295,074 | $ | 15,457 | $ | 588,512 | |||||||||||||
79
Year Ended December 31, 2013 | December 31, 2013 | |||||||||||||||||||
(in thousands) | Net Sales | Gross Profit | Depreciation & Amortization | Adjusted EBITDA | Total Assets | |||||||||||||||
Geographic divisions | $ | 1,210,156 | $ | 256,547 | $ | 13,156 | $ | 84,457 | $ | 446,716 | ||||||||||
Other reconciling items | — | — | 611 | (19,706 | ) | 21,556 | ||||||||||||||
$ | 1,210,156 | $ | 256,547 | $ | 13,767 | $ | 468,272 | |||||||||||||
Reconciliation to consolidated financial statements:
Year Ended December 31, | ||||||||||||
(in thousands) | 2015 | 2014 | 2013 | |||||||||
Income before income taxes | $ | (14,520 | ) | $ | 28,455 | $ | 27,928 | |||||
Interest expense | 27,552 | 27,090 | 18,786 | |||||||||
Depreciation and amortization | 24,589 | 15,457 | 13,767 | |||||||||
Impairment of assets held for sale | — | 134 | 73 | |||||||||
Merger-related costs | 22,993 | — | — | |||||||||
Inventory step-up charges | 10,285 | — | — | |||||||||
Non-cash stock compensation expense | 2,749 | 3,410 | 2,425 | |||||||||
Headquarters relocation | 3,865 | 2,054 | — | |||||||||
Insurance deductible reserve adjustments and casualty fire loss | 3,026 | 669 | 1,772 | |||||||||
Loss portfolio transfer | 2,826 | — | — | |||||||||
Acquisition costs and other items | 2,677 | — | — | |||||||||
Adjusted EBITDA of other reconciling items | 36,872 | 21,664 | 19,706 | |||||||||
Adjusted EBITDA of geographic divisions reportable segment | $ | 122,914 | $ | 98,933 | $ | 84,457 | ||||||
The Company does not earn revenues or have long-lived assets located in foreign countries. In accordance with the enterprise-wide disclosure requirements of the accounting standard, the Company's net sales from external customers by main product lines are as follows for the years ended December 31, 2015, 2014 and 2013:
(in thousands) | 2015 | 2014 | 2013 | |||||||||
Structural components | $ | 249,371 | $ | 205,036 | $ | 190,626 | ||||||
Lumber & sheet goods | 459,446 | 428,084 | 419,436 | |||||||||
Millwork, doors & windows | 442,675 | 328,063 | 278,704 | |||||||||
Other building products & services | 425,254 | 350,315 | 321,390 | |||||||||
Total net sales | $ | 1,576,746 | $ | 1,311,498 | $ | 1,210,156 | ||||||
16. Earnings Per Common Share
Basic net income (loss) per share (“EPS”) is calculated by dividing net income (loss) attributable to common stockholders by the weighted average shares outstanding during the period. Diluted EPS is calculated by adjusting weighted average shares outstanding for the dilutive effect of potential common shares, determined using the treasury-stock method. For purposes of the diluted EPS calculation, stock options, nonvested stock and restricted stock unit awards are considered to be potential common shares.
80
The basic and diluted EPS calculations for the years ended December 31, 2015, 2014 and 2013 are presented below:
Year Ended December 31, | ||||||||||||
(in thousands, except per share amounts) | 2015 | 2014 | 2013 | |||||||||
(Loss) income attributable to common stockholders | $ | (4,831 | ) | $ | 94,032 | $ | 21,655 | |||||
Weighted average common shares outstanding, basic | 41,260 | 38,828 | 38,321 | |||||||||
Effect of dilutive securities: | ||||||||||||
Restricted stock | — | 463 | 544 | |||||||||
Weighted average common shares outstanding, diluted | 41,260 | 39,291 | 38,865 | |||||||||
Basic (loss) income per share | $ | (0.12 | ) | $ | 2.42 | $ | 0.57 | |||||
Diluted (loss) income per share | $ | (0.12 | ) | $ | 2.39 | $ | 0.56 | |||||
The following table provides the securities that could potentially dilute basic earnings per share in the future, but were not included in the computation of diluted earnings per share because to do so would have been anti-dilutive:
Year Ended December 31, | |||||||||
(in thousands) | 2015 | 2014 | 2013 | ||||||
Stock options | 1,228 | — | — | ||||||
Restricted stock | 455 | — | — | ||||||
Restricted stock units | 282 | — | — | ||||||
17. Unaudited Quarterly Financial Data
The following tables summarize the consolidated quarterly results of operations for 2015 and 2014:
2015 | ||||||||||||||||
(in thousands, except per share amounts) | First Quarter | Second Quarter | Third Quarter | Fourth Quarter | ||||||||||||
Net sales | $ | 292,826 | $ | 357,287 | $ | 416,471 | $ | 510,162 | ||||||||
Gross profit | 66,697 | 83,818 | 97,101 | 113,794 | ||||||||||||
Net (loss) income | (3,561 | ) | 2,125 | 4,047 | (7,442 | ) | ||||||||||
Basic (loss) income per share | $ | (0.09 | ) | $ | 0.05 | $ | 0.10 | $ | (0.16 | ) | ||||||
Diluted (loss) income per share | $ | (0.09 | ) | $ | 0.05 | $ | 0.10 | $ | (0.16 | ) | ||||||
2014 | ||||||||||||||||
(in thousands, except per share amounts) | First Quarter | Second Quarter | Third Quarter | Fourth Quarter | ||||||||||||
Net sales | $ | 289,716 | $ | 351,620 | $ | 358,314 | $ | 311,848 | ||||||||
Gross profit | 61,819 | 79,491 | 81,642 | 72,122 | ||||||||||||
Net (loss) income | (1,674 | ) | 84,224 | 7,532 | 3,950 | |||||||||||
Basic (loss) income per share | $ | (0.04 | ) | $ | 2.17 | $ | 0.19 | $ | 0.10 | |||||||
Diluted (loss) income per share | $ | (0.04 | ) | $ | 2.14 | $ | 0.19 | $ | 0.10 | |||||||
81
Item 9. Change in and Disagreements with Accountants on Accounting and Financial Disclosures
None.
Item 9A. Controls and Procedures
Disclosure controls and procedures
Our management is responsible for establishing and maintaining disclosure controls and procedures as defined in Rules 13a-15(e) and 15d-15(e) under the Securities Exchange Act of 1934, as amended (the “Exchange Act”). These disclosure controls and procedures are designed to ensure that information required to be disclosed by us in the reports that we file or submit under the Exchange Act is recorded, processed, summarized and reported within the time periods specified in the SEC’s rules and forms. Disclosure controls and procedures include, without limitation, controls and procedures designed to ensure that information required to be disclosed by an issuer in the reports that it files or submits under the Exchange Act is accumulated and communicated to the issuer’s management, including its principal executive officer and principal financial officer, or persons performing similar functions, as appropriate to allow timely decisions regarding required disclosure.
We have evaluated the effectiveness of our disclosure controls and procedures (as defined in Rules 13a-15(e) and 15d-15(e) under the Exchange Act) as of the end of the period covered by this report, with the participation of our Chief Executive Officer and Chief Financial Officer, as well as other key members of our management. Based on this evaluation, our Chief Executive Officer and Chief Financial Officer concluded that our disclosure controls and procedures were effective as of December 31, 2015.
Management's annual report on internal control over financial reporting
Our management is responsible for establishing and maintaining adequate internal control over financial reporting (as defined in Rule 13a-15(f) under the Exchange Act). Management, with the participation of our principal executive officer and principal financial officer, conducted an assessment of the effectiveness of our internal control over financial reporting based on the criteria set forth in Internal Control - Integrated Framework issued by the Committee of Sponsoring Organizations of the Treadway Commission (2013 framework). Based on the assessment, management has concluded that the internal control over financial reporting of BMC Stock Holdings, Inc. (the “Company”) was effective as of December 31, 2015 to provide reasonable assurance regarding the reliability of financial reporting and the preparation of financial statements in accordance with GAAP.
Management excluded the internal control over financial reporting of Building Materials Holding Corporation, which was acquired by the Company on December 1, 2015 in a business combination, from its assessment of the Company’s internal control over financial reporting as of December 31, 2015. Due to the timing of the transaction, the significance of Building Materials Holding Corporation compared to legacy Stock Building Supply Holdings, Inc. and the on-going integration of the two companies, management felt it was impracticable to complete a meaningful assessment of internal control over financial reporting of Building Materials Holding Corporation as of December 31, 2015. The acquired Building Materials Holding Corporation businesses, represented approximately 45% of the Company’s consolidated total assets as of December 31, 2015 and 93% of its consolidated net revenues for the year then ended.
Because of its inherent limitations, internal control over financial reporting may not prevent or detect misstatements. Also, projections of any evaluation of effectiveness to future periods are subject to the risk that controls may become inadequate because of changes in conditions, or that the degree of compliance with the policies or procedures may deteriorate. Our independent registered public accounting firm, PricewaterhouseCoopers LLP, has issued an audit report with respect to the effectiveness of our internal control over financial reporting as of December 31, 2015, which appears in Part II, Item 8 of this Annual Report on Form 10-K.
Changes in internal control over financial reporting
The Merger was completed in the fourth quarter of 2015 and represented a change in internal control over financial reporting. As part of the Company’s ongoing integration activities, Legacy SBS's financial reporting controls and procedures are in the process of being implemented at Legacy BMC. The two companies maintained separate accounting systems throughout 2015. The consolidated financial statements and other information presented in this Annual Report on Form 10-K was prepared using information obtained from these separate accounting systems.
82
Item 9B. Other Information
None.
83
PART III
Item 10. Directors, Executive Officers and Corporate Governance
Code of Business Conduct and Ethics for Chief Executive Officer, Chief Financial Officer and Chief Accounting Officer. We have adopted a Code of Ethics which applies to our chief executive officer, chief financial officer, chief accounting officer and all our other employees, and which can be found through our website, www.stocksupply.com under the Investors section. We are not including this or any other information on our website as a part of, nor incorporating it by reference into, this Annual Report on Form 10-K or any of our other SEC filings.
The information required by Item 401 of Regulation S-K will be included under the captions “Proposal 1 - Election of Directors” and “Executive Officers” in the Company’s definitive Proxy Statement for the Annual Meeting of Stockholders (“Fiscal 2015 Proxy Statement”) which is currently expected to be held May 10, 2016, which section is incorporated in this item by reference. The information required by Items 405, 407(d)(4) and 407(d)(5) of Regulation S-K will be included under the captions “Stock Ownership Information-Section 16(a) Beneficial Ownership Reporting Compliance” and “Corporate Governance” in the Fiscal 2015 Proxy Statement, which sections are incorporated in this item by reference.
Item 11. Executive Compensation
The information required by Item 402 of Regulation S-K will be included under the captions “Executive Compensation” and “Director Compensation” in the Fiscal 2015 Proxy Statement, which section is incorporated in this item by reference. The information required by Item 407(e)(4) of Regulation S-K will be included under the caption “Compensation Committee Interlocks and Insider Participation” in the Fiscal 2015 Proxy Statement, which section is incorporated in this item by reference.
The information required by Item 407(e)(5) of Regulation S-K will be included under the caption “Compensation Committee Report” in the Fiscal 2015 Proxy Statement, which section is incorporated in this item by reference; however, such information is only “furnished” hereunder and not deemed “filed” for purposes of Section 18 of the Securities Exchange Act of 1934.
Item 12. Security Ownership of Certain Beneficial Owners and Management
The information required by this item will appear under the headings “Stock Ownership Information” in our Fiscal 2015 Proxy Statement, which section is incorporated in this item by reference.
The information required by Item 201(d) of Regulation S-K will be included under the caption “Stock Ownership Information” in our Fiscal 2015 Proxy Statement, which section is incorporated in this item by reference.
The information required by Item 403 of Regulation S-K will be included under the caption “Stock Ownership Information” in our Fiscal 2015 Proxy Statement, which section is incorporated in this item by reference.
Item 13. Certain Relationships and Related Transactions and Director Independence
The information required by Item 404 of Regulation S-K will be included under the caption “Related Person Transactions” in our Fiscal 2015 Proxy Statement, which sections are incorporated in this item by reference.
The information required by Item 407(a) of Regulation S-K will be included under the caption “Director Independence” in our Fiscal 2015 Proxy Statement, which sections are incorporated in this item by reference.
Item 14. Principal Accounting Fees and Services
The information required by this item will appear under the heading “Proposal 2 - Ratification of Selection of Independent Registered Public Accounting Firm” in our Fiscal 2015 Proxy Statement, which section is incorporated in this item by reference.
84
PART IV
Item 15. Exhibits and Financial Statement Schedules
(a) The following documents are filed as part of this report:
1. | The list of consolidated financial statements and related notes, together with the report of PricewaterhouseCoopers LLP, appear in Part II, Item 8 "Financial Statements and Supplementary Data" of this Annual Report on Form 10-K and are hereby incorporated by reference. |
2. | Financial statement schedules have been omitted because they are not applicable, not material or the required information is otherwise included. |
3. | The following documents are filed, furnished or incorporated by reference as exhibits to this report as required by Item 601 of Regulation S-K. |
Exhibit No. | Description | |
2.1 | Restructuring and Investment Agreement, dated as of May 5, 2009, by and among Wolseley Investments North America, Stock Building Supply Holdings, LLC and Saturn Acquisition Holdings, LLC (incorporated by reference to Exhibit 2.1 to the Stock Building Supply Holdings, Inc. Registration Statement on Form S-1, as amended, filed with the Commission on June 14, 2013 in Commission File No. 333-189368) | |
2.2 | Plan of Conversion of Saturn Acquisition Holdings, LLC (incorporated by reference to Exhibit 2.2 to the Stock Building Supply Holdings, Inc. Registration Statement on Form S-1, as amended, filed with the Commission on June 14, 2013 in Commission File No. 333-189368) | |
2.3 | Agreement and Plan of Merger, dated as of June 2, 2015, by and between Stock Building Supply Holdings, Inc. and Building Materials Holding Corporation (incorporated by reference to Exhibit 2.1 to the Form 8-K filed with the SEC on June 5, 2015 in Commission File No. 001-36050) | |
3.1 | Amended and Restated Certificate of Incorporation (incorporated by reference to Annex C to the definitive Joint Proxy and Consent Solicitation Statement/Prospectus filed with the SEC on November 2, 2015 in Commission File No. 333-206421) | |
3.2 | Amended and Restated Bylaws of Stock Building Supply Holdings, Inc. (incorporated by reference to Exhibit 3.2 to the Registrant’s Current Report on Form 8-K filed with the Commission on August 15, 2013 in Commission File No. 001-36050) | |
4.1 | Form of stock certificate (incorporated by reference to Exhibit 4.1 to the Stock Building Supply Holdings, Inc. Registration Statement on Form S-1, as amended, filed with the Commission on June 14, 2013 in Commission File No. 333-189368) | |
4.2 | Indenture, dated as of September 20, 2013, by and among Building Materials Holding Corporation, the guarantors party thereto and Wilmington Trust, National Association, as trustee, governing Building Materials Holding Corporation’s 9.0% Senior Secured Notes due 2018 (incorporated by reference to Exhibit 4.1 to the Registrant’s Current Report on Form 8-K filed with the Commission on December 7, 2015 in Commission File No. 001-36050) | |
4.3 | First Supplemental Indenture, dated as of June 1, 2015, by and among VNS Corporation, ProCon Construction Services, LLC, TrussMart Building Components, LLC and Wilmington Trust, National Association, as trustee (incorporated by reference to Exhibit 4.2 to the Registrant’s Current Report on Form 8-K filed with the Commission on December 7, 2015 in Commission File No. 001-36050) | |
4.4 | Second Supplemental Indenture, dated as of December 1, 2015, by and among BMC Stock Holdings, Inc., certain subsidiaries of BMC Stock Holdings, Inc. parties thereto and Wilmington Trust, National Association, as trustee (incorporated by reference to Exhibit 4.3 to the Registrant’s Current Report on Form 8-K filed with the Commission on December 7, 2015 in Commission File No. 001-36050) | |
10.1 | Amended and Restated Professional Services Agreement, dated as of June 13, 2013, by and between Glendon Partners, Inc. and Stock Building Supply Holdings, Inc. (incorporated by reference to Exhibit 10.11 to the Stock Building Supply Holdings, Inc. Registration Statement on Form S-1, as amended, filed with the Commission on June 14, 2013 in Commission File No. 333-189368) | |
10.2 | Management Services Agreement, dated as of May 4, 2009, by and between The Gores Group, LLC and Saturn Acquisition Holdings, LLC (incorporated by reference to Exhibit 10.12 to the Stock Building Supply Holdings, Inc. Registration Statement on Form S-1, as amended, filed with the Commission on June 14, 2013 in Commission File No. 333-189368) | |
10.3 | Termination of Management Services Agreement, dated as of June 13, 2013, by and between The Gores Group, LLC and Stock Building Supply Holdings, Inc. (incorporated by reference to Exhibit 10.13 to the Stock Building Supply Holdings, Inc. Registration Statement on Form S-1, as amended, filed with the Commission on June 14, 2013 in Commission File No. 333-189368) | |
85
Exhibit No. | Description | |
10.4 | Contribution Agreement, dated as of November 16, 2011, by and between Saturn Acquisition Holdings, LLC and Gores Building Holdings, LLC (incorporated by reference to Exhibit 10.14 to the Stock Building Supply Holdings, Inc. Registration Statement on Form S-1, as amended, filed with the Commission on June 14, 2013 in Commission File No. 333-189368) | |
10.5 | Director Nomination Agreement, dated as of August 14, 2013, by and among Stock Building Supply Holdings, Inc. and Gores Building Holdings, LLC (incorporated by reference to Exhibit 10.1 to the Registrant’s Current Report on Form 8-K filed with the Commission on August 15, 2013 in Commission File No. 001-36050) | |
10.6 | Employment Agreement Amendment, dated as of June 2, 2015, by and between James F. Major, Jr. and Stock Building Supply Holdings, Inc. (incorporated by reference to Exhibit 10.3 to the Registrant’s Form 8-K filed with the Commission on June 5, 2015 in Commission File No. 001-36050) | |
10.7 | Employment Agreement Amendment, dated as of June 2, 2015, by and between Lisa M. Hamblet and Stock Building Supply Holdings, Inc. (incorporated by reference to Exhibit 10.5 to the Registrant’s Form 8-K filed with the Commission on June 5, 2015 in Commission File No. 001-36050) | |
10.8 | Employment Agreement Amendment, dated as of June 2, 2015, by and between C. Lowell Ball and Stock Building Supply Holdings, Inc. (incorporated by reference to Exhibit 10.6 to the Registrant’s Form 8-K filed with the Commission on June 5, 2015 in Commission File No. 001-36050) | |
10.9 | Consulting Agreement, effective as of December 1, 2015, by and between BMC Stock Holdings, Inc. and Bryan J. Yeazel (incorporated by reference to Exhibit 10.1 to the Registrant’s Form 8-K filed with the Commission on December 21, 2015 in Commission File No. 001-36050) | |
10.10 | Form of Indemnification Agreement (incorporated by reference to Exhibit 10.20 to the Stock Building Supply Holdings, Inc. Registration Statement on Form S-1, as amended, filed with the Commission on June 14, 2013 in Commission File No. 333-189368) | |
10.11 | Form of Stock Building Supply Holdings, Inc. 2013 Incentive Compensation Plan (incorporated by reference to Exhibit 10.21 to the Stock Building Supply Holdings, Inc. Registration Statement on Form S-1, as amended, filed with the Commission on June 14, 2013 in Commission File No. 333-189368) | |
10.12 | Amendment to the Stock Building Supply Holdings, Inc. 2013 Incentive Compensation Plan, (incorporated by reference to Annex B to the definitive Joint Proxy and Consent Solicitation Statement/Prospectus filed with the SEC on November 2, 2015 in Commission File No. 333-206421) | |
10.13 | Description of Management Incentive Plan for Executive Officers (incorporated by reference to Exhibit 10.24 to the Registrant's Annual Report on Form 10-K filed with the Commission on March 4, 2014 in Commission File No. 001-36050) | |
10.14 | Form of Nonqualified Stock Option Agreement Pursuant to the Stock Building Supply Holdings, Inc. 2013 Incentive Compensation Plan (incorporated by reference to Exhibit 10.23 to Amendment 2 to the Stock Building Supply Holdings, Inc. Registration Statement on Form S-1, as amended, filed with the Commission on July 29, 2013 in Commission File No. 333-189368) | |
10.15 | Form of Restricted Stock Agreement Pursuant to the Stock Building Supply Holdings, Inc. 2013 Incentive Compensation Plan (incorporated by reference to Exhibit 10.24 to Amendment 2 to the Stock Building Supply Holdings, Inc. Registration Statement on Form S-1, as amended, filed with the Commission on July 29, 2013 in Commission File No. 333-189368) | |
10.16 | Form of Restricted Stock Unit Agreement Pursuant to the Stock Building Supply Holdings, Inc. 2013 Incentive Compensation Plan (incorporated by reference to Exhibit 10.25 to Amendment 2 to the Stock Building Supply Holdings, Inc. Registration Statement on Form S-1, as amended, filed with the Commission on July 29, 2013 in Commission File No. 333-189368) | |
10.17 | Second Amended and Restated Senior Secured Credit Agreement, dated as of December 1, 2015, by and among Building Materials Holding Corporation, Stock Building Supply Holdings, Inc., certain subsidiaries of Building Materials Holding Corporation and Stock Building Supply Holdings, Inc. parties thereto, Wells Fargo Capital Finance, LLC as agent for the lenders, joint lead arranger, and joint book runner, Goldman Sachs Bank USA, as joint lead arranger and joint book runner, and the lenders parties thereto (incorporated by reference to Exhibit 4.3 to the Registrant’s Current Report on Form 8-K filed with the Commission on December 7, 2015 in Commission File No. 001-36050) | |
10.18 | Amendment Number One to Second Amended and Restated Senior Secured Credit Agreement and Consent, dated as of January 28, 2016, by and among BMC Stock Holdings, Inc., as parent, the subsidiaries of parent party thereto, as borrowers, the lenders party thereto, and Wells Fargo Capital Finance, LLC, as agent for the lenders | |
10.19 | Registration Rights Agreement, effective as of December 1, 2015, by and among Stock Building Supply Holdings, Inc. and certain stockholders affiliated with Davidson Kempner Capital Management LP, Robotti & Company Advisors, LLC and The Gores Group, LLC (incorporated by reference to Annex G to the definitive Joint Proxy and Consent Solicitation Statement/Prospectus filed with the SEC on November 2, 2015 in Commission File No. 333-206421) | |
86
Exhibit No. | Description | |
16.1 | Letter from KPMG LLP to the U.S. Securities and Exchange Commission (incorporated by reference to Exhibit 16.1 to the Registrant’s Form 8-K filed with the Commission on December 21, 2015 in Commission File No. 001-36050) | |
21.1 | List of subsidiaries of BMC Stock Holdings, Inc. | |
23.1 | Consent of PricewaterhouseCoopers LLP | |
23.2 | Consent of KPMG LLP | |
24.1 | Powers of Attorney (included on the signature page) | |
31.1 | Certification by Peter C. Alexander, President and Chief Executive Officer, pursuant to Exchange Act Rule 13a-14/15d-14(a), as adopted pursuant to Section 302 of the Sarbanes-Oxley Act of 2002 | |
31.2 | Certification by James F. Major, Jr., Executive Vice President, Chief Financial Officer and Treasurer, pursuant to Exchange Act Rule 13a-14/15d-14(a), as adopted pursuant to Section 302 of the Sarbanes-Oxley Act of 2002 | |
32.1 | Certification Pursuant to 18 U.S.C. Section 1350, as adopted pursuant to Section 906 of the Sarbanes-Oxley Act of 2002 | |
32.2 | Certification Pursuant to 18 U.S.C. Section 1350, as adopted pursuant to Section 906 of the Sarbanes-Oxley Act of 2002 | |
101.INS* | XBRL Instance Document | |
101.SCH* | XBRL Taxonomy Extension Schema Document | |
101.CAL* | XBRL Taxonomy Extension Calculation Linkbase Document | |
101.DEF* | XBRL Taxonomy Extension Definition Linkbase Document | |
101.LAB* | XBRL Taxonomy Extension Label Linkbase Document | |
101.PRE* | XBRL Taxonomy Extension Presentation Linkbase Document | |
* XBRL (Extensible Business Reporting Language) information is furnished and not filed or a part of a registration statement or prospectus for purposes of Sections 11 or 12 of the Securities Act of 1933, as amended, is deemed not filed for purposes of Section 18 of the Securities Exchange Act of 1934, as amended, and otherwise is not subject to liability under these sections.
87
SIGNATURES
Pursuant to the requirements of Section 13 or 15(d) of the Securities Exchange Act of 1934, the Registrant has duly caused this report to be signed on its behalf by the undersigned, thereunto duly authorized.
BMC STOCK HOLDINGS, INC. | |||
Date: | March 15, 2016 | By: | /s/ James F. Major, Jr. |
Executive Vice President, Chief Financial Officer and Treasurer | |||
(Principal financial officer and duly authorized officer) | |||
POWER OF ATTORNEY
Each person whose signature appears below constitutes and appoints Paul Street and C. Lowell Ball and each of them singly, his true and lawful attorneys-in-fact and agents, with full power of substitution and resubstitution, for him and in his name, place and stead, in any and all capacities, to sign any and all amendments to this Annual Report on Form 10-K, and to file the same, with all exhibits thereto and all other documents in connection therewith, with the SEC, granting unto each said attorney-in-fact and agents full power and authority to do and perform each and every act in person, hereby ratifying and confirming all that said attorneys-in-fact and agents or either of them or their or his substitute or substitutes may lawfully do or cause to be done by virtue hereof.
Pursuant to the requirements of the Securities Exchange Act of 1934, this Annual Report on Form 10-K has been signed below by the following persons on behalf of the registrant and in the capacities and on the dates indicated.
88
Signature | Title | Date |
/s/ Peter C. Alexander | President and Chief Executive Officer (principal executive officer) | March 15, 2016 |
Peter C. Alexander | ||
/s/ James F. Major, Jr. | Executive Vice President, Chief Financial Officer and Treasurer (principal financial officer) | March 15, 2016 |
James F. Major, Jr. | ||
/s/ Noah Gay | Senior Vice President and Chief Accounting Officer (principal accounting officer) | March 15, 2016 |
Noah Gay | ||
/s/ David Bullock | Director and Chairman of the Board | March 15, 2016 |
David Bullock | ||
/s/ Barry J. Goldstein | Director | March 15, 2016 |
Barry J. Goldstein | ||
/s/ David L. Keltner | Director | March 15, 2016 |
David L. Keltner | ||
/s/ Michael Miller | Director | March 15, 2016 |
Michael Miller | ||
/s/ James O'Leary | Director | March 15, 2016 |
James O'Leary | ||
/s/ Jeffrey G. Rea | Director | March 15, 2016 |
Jeffrey G. Rea | ||
/s/ Carl R. Vertuca, Jr. | Director | March 15, 2016 |
Carl R. Vertuca, Jr. | ||
89