Attached files
| file | filename |
|---|---|
| 8-K - 8-K - PENN VIRGINIA CORP | d176838d8k.htm |
| EX-99.1 - EX-99.1 - PENN VIRGINIA CORP | d176838dex991.htm |
Exhibit 99.2
|
|
Penn Virginia Corporation Aggregated Cleansing Materials May 2016 / Confidential Jefferies LLC, Alvarez & Marsal North America LLC, Kirkland & Ellis LLP Member SIPC
|
|
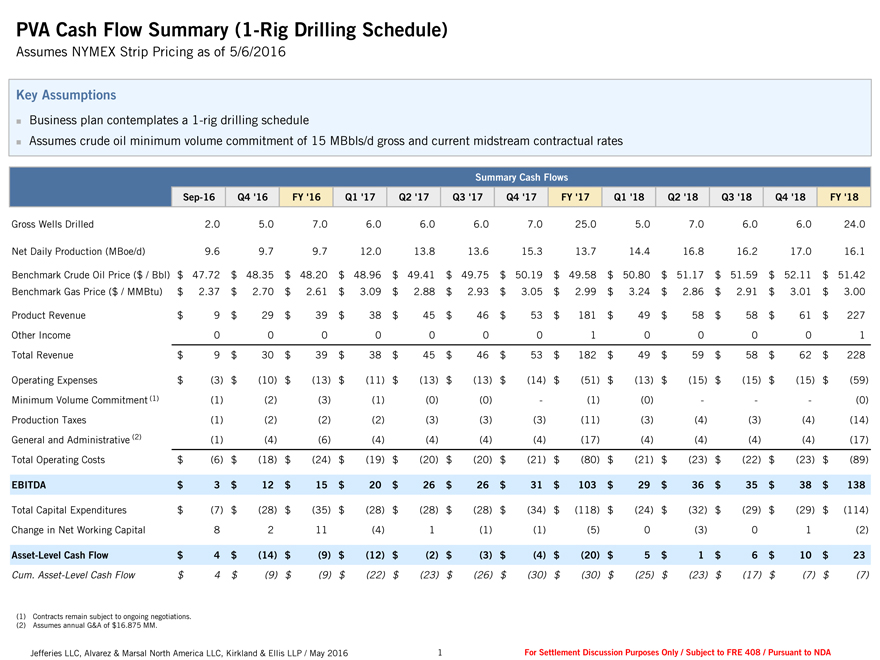
PVA Cash Flow Summary (1-Rig Drilling Schedule) Assumes NYMEX Strip Pricing as of 5/6/2016 Key Assumptions ? Business plan contemplates a 1-rig drilling schedule ? Assumes crude oil minimum volume commitment of 15 MBbls/d gross and current midstream contractual rates Summary Cash Flows Sep-16 Q4 ‘16 FY ‘16 Q1 ‘17 Q2 ‘17 Q3 ‘17 Q4 ‘17 FY ‘17 Q1 ‘18 Q2 ‘18 Q3 ‘18 Q4 ‘18 FY ‘18 Gross Wells Drilled 2.0 5.0 7.0 6.0 6.0 6.0 7.0 25.0 5.0 7.0 6.0 6.0 24.0 Net Daily Production (MBoe/d) 9.6 9.7 9.7 12.0 13.8 13.6 15.3 13.7 14.4 16.8 16.2 17.0 16.1 Benchmark Crude Oil Price ($ / Bbl) $ 47.72 $ 48.35 $ 48.20 $ 48.96 $ 49.41 $ 49.75 $ 50.19 $ 49.58 $ 50.80 $ 51.17 $ 51.59 $ 52.11 $ 51.42 Benchmark Gas Price ($ / MMBtu) $ 2.37 $ 2.70 $ 2.61 $ 3.09 $ 2.88 $ 2.93 $ 3.05 $ 2.99 $ 3.24 $ 2.86 $ 2.91 $ 3.01 $ 3.00 Product Revenue $ 9 $ 29 $ 39 $ 38 $ 45 $ 46 $ 53 $ 181 $ 49 $ 58 $ 58 $ 61 $ 227 Other Income 0 0 0 0 0 0 0 1 0 0 0 0 1 Total Revenue $ 9 $ 30 $ 39 $ 38 $ 45 $ 46 $ 53 $ 182 $ 49 $ 59 $ 58 $ 62 $ 228 Operating Expenses $ (3) $ (10) $ (13) $ (11) $ (13) $ (13) $ (14) $ (51) $ (13) $ (15) $ (15) $ (15) $ (59) Minimum Volume Commitment (1) (1) (2) (3) (1) (0) (0) — (1) (0) ——— (0) Production Taxes (1) (2) (2) (2) (3) (3) (3) (11) (3) (4) (3) (4) (14) General and Administrative (2) (1) (4) (6) (4) (4) (4) (4) (17) (4) (4) (4) (4) (17) Total Operating Costs $ (6) $ (18) $ (24) $ (19) $ (20) $ (20) $ (21) $ (80) $ (21) $ (23) $ (22) $ (23) $ (89) EBITDA $ 3 $ 12 $ 15 $ 20 $ 26 $ 26 $ 31 $ 103 $ 29 $ 36 $ 35 $ 38 $ 138 Total Capital Expenditures $ (7) $ (28) $ (35) $ (28) $ (28) $ (28) $ (34) $ (118) $ (24) $ (32) $ (29) $ (29) $ (114) Change in Net Working Capital 8 2 11 (4) 1 (1) (1) (5) 0 (3) 0 1 (2) Asset-Level Cash Flow $ 4 $ (14) $ (9) $ (12) $ (2) $ (3) $ (4) $ (20) $ 5 $ 1 $ 6 $ 10 $ 23 Cum. Asset-Level Cash Flow $ 4 $ (9) $ (9) $ (22) $ (23) $ (26) $ (30) $ (30) $ (25) $ (23) $ (17) $ (7) $ (7) (1) Contracts remain subject to ongoing negotiations. (2) Assumes annual G&A of $16.875 MM. Jefferies LLC, Alvarez & Marsal North America LLC, Kirkland & Ellis LLP / May 2016 1 For Settlement Discussion Purposes Only / Subject to FRE 408 / Pursuant to NDA
|
|
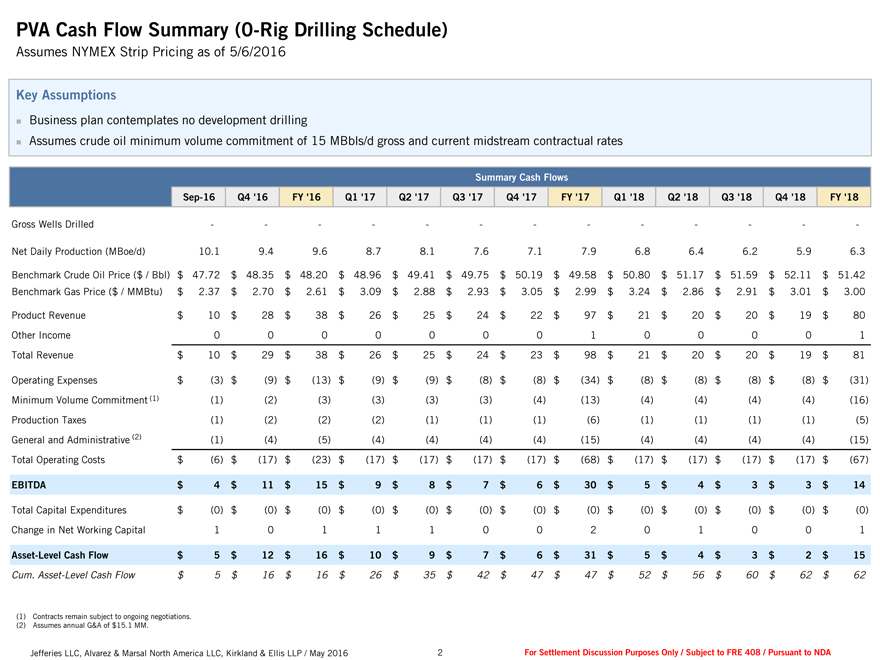
PVA Cash Flow Summary (0-Rig Drilling Schedule) Assumes NYMEX Strip Pricing as of 5/6/2016 Key Assumptions ? Business plan contemplates no development drilling ? Assumes crude oil minimum volume commitment of 15 MBbls/d gross and current midstream contractual rates Summary Cash Flows Sep-16 Q4 ‘16 FY ‘16 Q1 ‘17 Q2 ‘17 Q3 ‘17 Q4 ‘17 FY ‘17 Q1 ‘18 Q2 ‘18 Q3 ‘18 Q4 ‘18 FY ‘18 Gross Wells Drilled —————————————Net Daily Production (MBoe/d) 10.1 9.4 9.6 8.7 8.1 7.6 7.1 7.9 6.8 6.4 6.2 5.9 6.3 Benchmark Crude Oil Price ($ / Bbl) $ 47.72 $ 48.35 $ 48.20 $ 48.96 $ 49.41 $ 49.75 $ 50.19 $ 49.58 $ 50.80 $ 51.17 $ 51.59 $ 52.11 $ 51.42 Benchmark Gas Price ($ / MMBtu) $ 2.37 $ 2.70 $ 2.61 $ 3.09 $ 2.88 $ 2.93 $ 3.05 $ 2.99 $ 3.24 $ 2.86 $ 2.91 $ 3.01 $ 3.00 Product Revenue $ 10 $ 28 $ 38 $ 26 $ 25 $ 24 $ 22 $ 97 $ 21 $ 20 $ 20 $ 19 $ 80 Other Income 0 0 0 0 0 0 0 1 0 0 0 0 1 Total Revenue $ 10 $ 29 $ 38 $ 26 $ 25 $ 24 $ 23 $ 98 $ 21 $ 20 $ 20 $ 19 $ 81 Operating Expenses $ (3) $ (9) $ (13) $ (9) $ (9) $ (8) $ (8) $ (34) $ (8) $ (8) $ (8) $ (8) $ (31) Minimum Volume Commitment (1) (1) (2) (3) (3) (3) (3) (4) (13) (4) (4) (4) (4) (16) Production Taxes (1) (2) (2) (2) (1) (1) (1) (6) (1) (1) (1) (1) (5) General and Administrative (2) (1) (4) (5) (4) (4) (4) (4) (15) (4) (4) (4) (4) (15) Total Operating Costs $ (6) $ (17) $ (23) $ (17) $ (17) $ (17) $ (17) $ (68) $ (17) $ (17) $ (17) $ (17) $ (67) EBITDA $ 4 $ 11 $ 15 $ 9 $ 8 $ 7 $ 6 $ 30 $ 5 $ 4 $ 3 $ 3 $ 14 Total Capital Expenditures $ (0) $ (0) $ (0) $ (0) $ (0) $ (0) $ (0) $ (0) $ (0) $ (0) $ (0) $ (0) $ (0) Change in Net Working Capital 1 0 1 1 1 0 0 2 0 1 0 0 1 Asset-Level Cash Flow $ 5 $ 12 $ 16 $ 10 $ 9 $ 7 $ 6 $ 31 $ 5 $ 4 $ 3 $ 2 $ 15 Cum. Asset-Level Cash Flow $ 5 $ 16 $ 16 $ 26 $ 35 $ 42 $ 47 $ 47 $ 52 $ 56 $ 60 $ 62 $ 62 (1) Contracts remain subject to ongoing negotiations. (2) Assumes annual G&A of $15.1 MM. Jefferies LLC, Alvarez & Marsal North America LLC, Kirkland & Ellis LLP / May 2016 2 For Settlement Discussion Purposes Only / Subject to FRE 408 / Pursuant to NDA
|
|
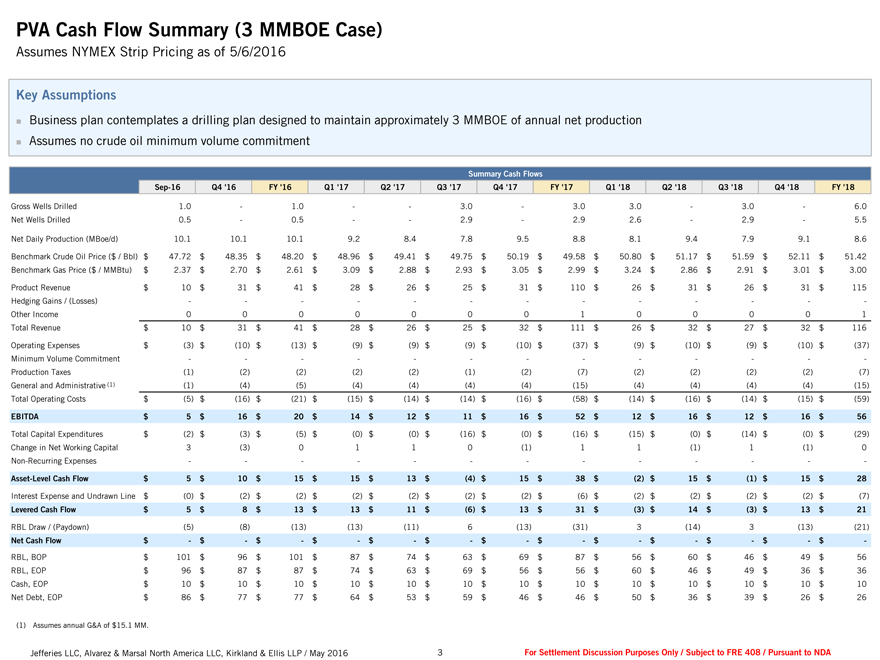
PVA Cash Flow Summary (3 MMBOE Case) Assumes NYMEX Strip Pricing as of 5/6/2016 Key Assumptions ? Business plan contemplates a drilling plan designed to maintain approximately 3 MMBOE of annual net production ? Assumes no crude oil minimum volume commitment Summary Cash Flows Sep-16 Q4 ‘16 FY ‘16 Q1 ‘17 Q2 ‘17 Q3 ‘17 Q4 ‘17 FY ‘17 Q1 ‘18 Q2 ‘18 Q3 ‘18 Q4 ‘18 FY ‘18 Gross Wells Drilled 1.0 — 1.0 —— 3.0 — 3.0 3.0 — 3.0 — 6.0 Net Wells Drilled 0.5 — 0.5 —— 2.9 — 2.9 2.6 — 2.9 — 5.5 Net Daily Production (MBoe/d) 10.1 10.1 10.1 9.2 8.4 7.8 9.5 8.8 8.1 9.4 7.9 9.1 8.6 Benchmark Crude Oil Price ($ / Bbl) $ 47.72 $ 48.35 $ 48.20 $ 48.96 $ 49.41 $ 49.75 $ 50.19 $ 49.58 $ 50.80 $ 51.17 $ 51.59 $ 52.11 $ 51.42 Benchmark Gas Price ($ / MMBtu) $ 2.37 $ 2.70 $ 2.61 $ 3.09 $ 2.88 $ 2.93 $ 3.05 $ 2.99 $ 3.24 $ 2.86 $ 2.91 $ 3.01 $ 3.00 Product Revenue $ 10 $ 31 $ 41 $ 28 $ 26 $ 25 $ 31 $ 110 $ 26 $ 31 $ 26 $ 31 $ 115 Hedging Gains / (Losses) —————————————Other Income 0 0 0 0 0 0 0 1 0 0 0 0 1 Total Revenue $ 10 $ 31 $ 41 $ 28 $ 26 $ 25 $ 32 $ 111 $ 26 $ 32 $ 27 $ 32 $ 116 Operating Expenses $ (3) $ (10) $ (13) $ (9) $ (9) $ (9) $ (10) $ (37) $ (9) $ (10) $ (9) $ (10) $ (37) Minimum Volume Commitment —————————————Production Taxes (1) (2) (2) (2) (2) (1) (2) (7) (2) (2) (2) (2) (7) General and Administrative (1) (1) (4) (5) (4) (4) (4) (4) (15) (4) (4) (4) (4) (15) Total Operating Costs $ (5) $ (16) $ (21) $ (15) $ (14) $ (14) $ (16) $ (58) $ (14) $ (16) $ (14) $ (15) $ (59) EBITDA $ 5 $ 16 $ 20 $ 14 $ 12 $ 11 $ 16 $ 52 $ 12 $ 16 $ 12 $ 16 $ 56 Total Capital Expenditures $ (2) $ (3) $ (5) $ (0) $ (0) $ (16) $ (0) $ (16) $ (15) $ (0) $ (14) $ (0) $ (29) Change in Net Working Capital 3 (3) 0 1 1 0 (1) 1 1 (1) 1 (1) 0 Non-Recurring Expenses —————————————Asset-Level Cash Flow $ 5 $ 10 $ 15 $ 15 $ 13 $ (4) $ 15 $ 38 $ (2) $ 15 $ (1) $ 15 $ 28 Interest Expense and Undrawn Line $ (0) $ (2) $ (2) $ (2) $ (2) $ (2) $ (2) $ (6) $ (2) $ (2) $ (2) $ (2) $ (7) Levered Cash Flow $ 5 $ 8 $ 13 $ 13 $ 11 $ (6) $ 13 $ 31 $ (3) $ 14 $ (3) $ 13 $ 21 RBL Draw / (Paydown) (5) (8) (13) (13) (11) 6 (13) (31) 3 (14) 3 (13) (21) Net Cash Flow $—$—$—$—$—$—$—$—$—$—$—$—$—RBL, BOP $ 101 $ 96 $ 101 $ 87 $ 74 $ 63 $ 69 $ 87 $ 56 $ 60 $ 46 $ 49 $ 56 RBL, EOP $ 96 $ 87 $ 87 $ 74 $ 63 $ 69 $ 56 $ 56 $ 60 $ 46 $ 49 $ 36 $ 36 Cash, EOP $ 10 $ 10 $ 10 $ 10 $ 10 $ 10 $ 10 $ 10 $ 10 $ 10 $ 10 $ 10 $ 10 Net Debt, EOP $ 86 $ 77 $ 77 $ 64 $ 53 $ 59 $ 46 $ 46 $ 50 $ 36 $ 39 $ 26 $ 26 (1) Assumes annual G&A of $15.1 MM. Jefferies LLC, Alvarez & Marsal North America LLC, Kirkland & Ellis LLP / May 2016 3 For Settlement Discussion Purposes Only / Subject to FRE 408 / Pursuant to NDA
|
|
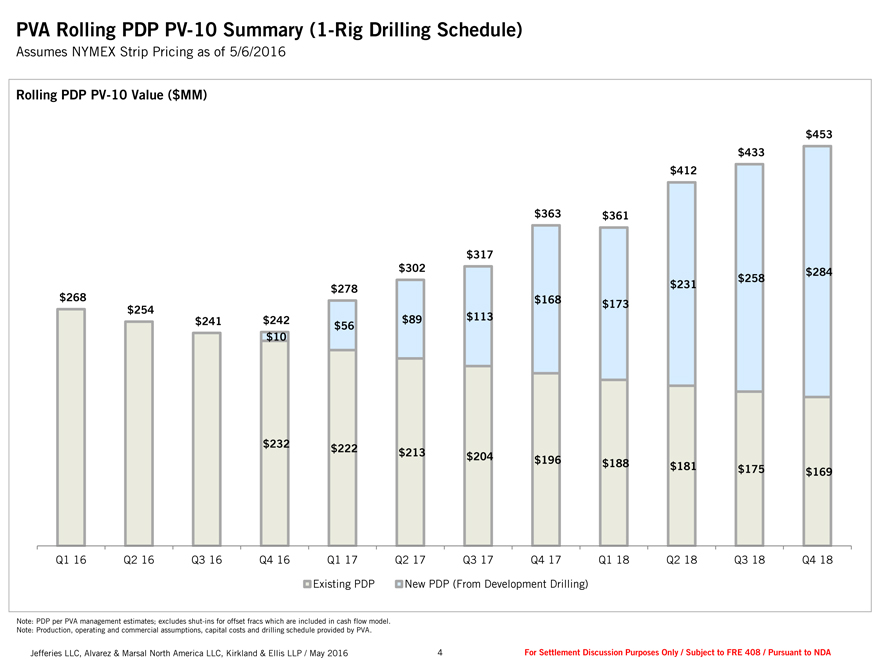
PVA Rolling PDP PV-10 Summary (1-Rig Drilling Schedule) Assumes NYMEX Strip Pricing as of 5/6/2016 Rolling PDP PV-10 Value ($MM) $ 453 $ 433 $ 412 $ 363 $ 361 $ 317 $302 $ 284 $ 258 $278 $ 231 $268 $ 168 $ 173 $254 $241 $242 $89 $ 113 $56 $10 $232 $222 $213 $ 204 $ 196 $ 188 $ 181 $ 175 $ 169 Q1 16 Q2 16 Q3 16 Q4 16 Q1 17 Q2 17 Q3 17 Q4 17 Q1 18 Q2 18 Q3 18 Q4 18 Existing PDP New PDP (From Development Drilling) Note: PDP per PVA management estimates; excludes shut-ins for offset fracs which are included in cash flow model. Note: Production, operating and commercial assumptions, capital costs and drilling schedule provided by PVA. Jefferies LLC, Alvarez & Marsal North America LLC, Kirkland & Ellis LLP / May 2016 4 For Settlement Discussion Purposes Only / Subject to FRE 408 / Pursuant to NDA
|
|
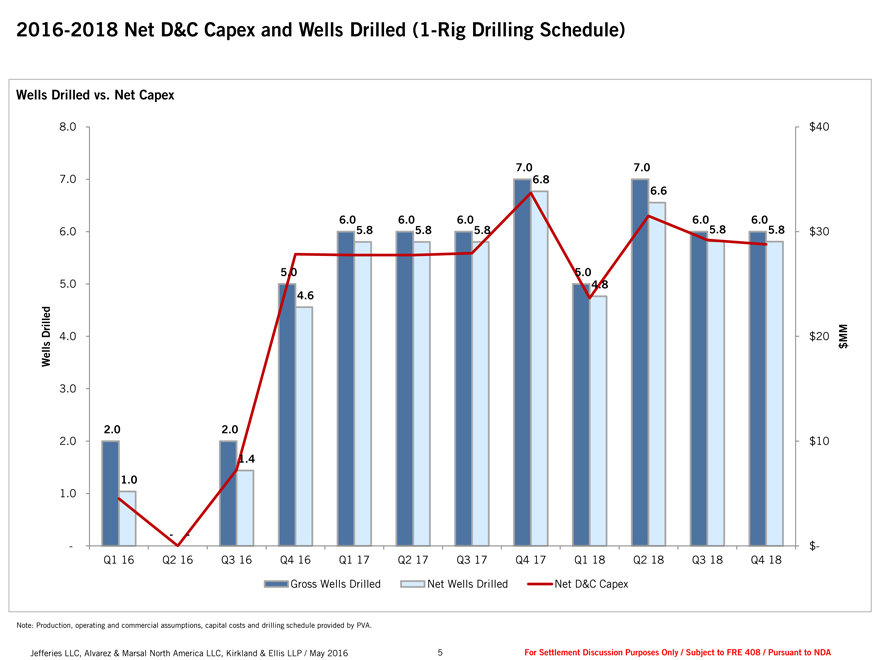
2016-2018 Net D&C Capex and Wells Drilled (1-Rig Drilling Schedule) Wells Drilled vs. Net Capex 8.0 $40 7.0 7.0 7.0 6.8 6.6 6.0 6.0 5.8 6.0 5.8 6.0 5.8 6.0 5.8 6.0 5.8 $30 5.0 5.0 5.0 4.8 4.6 Drilled M 4.0 $20 M s $ Well 3.0 2.0 2.0 2.0 $10 1.4 1.0 1.0 — — $- Q1 16 Q2 16 Q3 16 Q4 16 Q1 17 Q2 17 Q3 17 Q4 17 Q1 18 Q2 18 Q3 18 Q4 18 Gross Wells Drilled Net Wells Drilled Net D&C Capex Note: Production, operating and commercial assumptions, capital costs and drilling schedule provided by PVA. Jefferies LLC, Alvarez & Marsal North America LLC, Kirkland & Ellis LLP / May 2016 5 For Settlement Discussion Purposes Only / Subject to FRE 408 / Pursuant to NDA
|
|
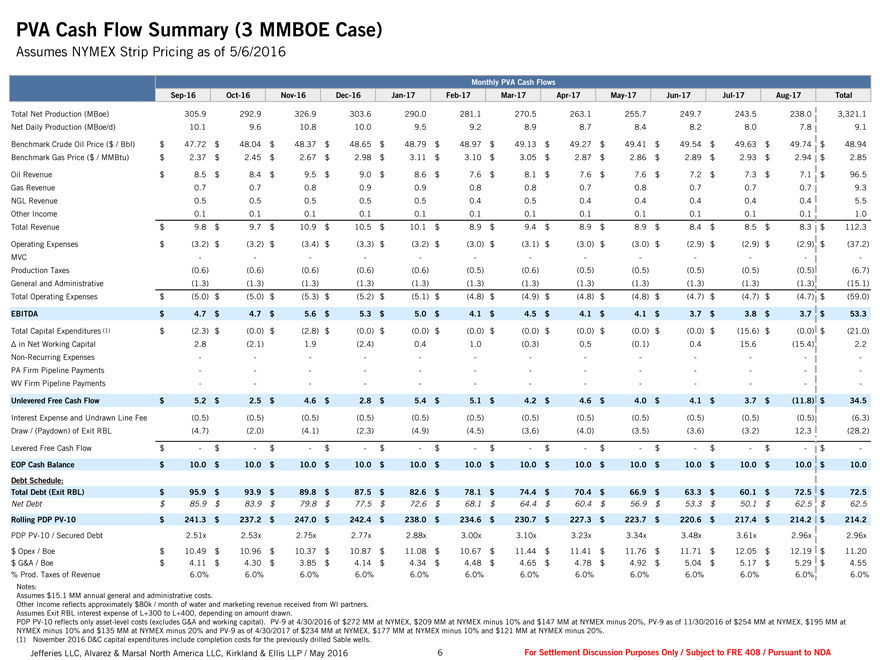
PVA Cash Flow Summary (3 MMBOE Case) Assumes NYMEX Strip Pricing as of 5/6/2016 Monthly PVA Cash Flows Sep-16 Oct-16 Nov-16 Dec-16 Jan-17 Feb-17 Mar-17 Apr-17 May-17 Jun-17 Jul-17 Aug-17 Total Total Net Production (MBoe) 305.9 292.9 326.9 303.6 290.0 281.1 270.5 263.1 255.7 249.7 243.5 238.0 3,321.1 Net Daily Production (MBoe/d) 10.1 9.6 10.8 10.0 9.5 9.2 8.9 8.7 8.4 8.2 8.0 7.8 9.1 Benchmark Crude Oil Price ($ / Bbl) $ 47.72 $ 48.04 $ 48.37 $ 48.65 $ 48.79 $ 48.97 $ 49.13 $ 49.27 $ 49.41 $ 49.54 $ 49.63 $ 49.74 $ 48.94 Benchmark Gas Price ($ / MMBtu) $ 2.37 $ 2.45 $ 2.67 $ 2.98 $ 3.11 $ 3.10 $ 3.05 $ 2.87 $ 2.86 $ 2.89 $ 2.93 $ 2.94 $ 2.85 Oil Revenue $ 8.5 $ 8.4 $ 9.5 $ 9.0 $ 8.6 $ 7.6 $ 8.1 $ 7.6 $ 7.6 $ 7.2 $ 7.3 $ 7.1 $ 96.5 Gas Revenue 0.7 0.7 0.8 0.9 0.9 0.8 0.8 0.7 0.8 0.7 0.7 0.7 9.3 NGL Revenue 0.5 0.5 0.5 0.5 0.5 0.4 0.5 0.4 0.4 0.4 0.4 0.4 5.5 Other Income 0.1 0.1 0.1 0.1 0.1 0.1 0.1 0.1 0.1 0.1 0.1 0.1 1.0 Total Revenue $ 9.8 $ 9.7 $ 10.9 $ 10.5 $ 10.1 $ 8.9 $ 9.4 $ 8.9 $ 8.9 $ 8.4 $ 8.5 $ 8.3 $ 112.3 Operating Expenses $ (3.2) $ (3.2) $ (3.4) $ (3.3) $ (3.2) $ (3.0) $ (3.1) $ (3.0) $ (3.0) $ (2.9) $ (2.9) $ (2.9) $ (37.2) MVC —— — — —————— ———Production Taxes (0.6) (0.6) (0.6) (0.6) (0.6) (0.5) (0.6) (0.5) (0.5) (0.5) (0.5) (0.5) (6.7) General and Administrative (1.3) (1.3) (1.3) (1.3) (1.3) (1.3) (1.3) (1.3) (1.3) (1.3) (1.3) (1.3) (15.1) Total Operating Expenses $ (5.0) $ (5.0) $ (5.3) $ (5.2) $ (5.1) $ (4.8) $ (4.9) $ (4.8) $ (4.8) $ (4.7) $ (4.7) $ (4.7) $ (59.0) EBITDA $ 4.7 $ 4.7 $ 5.6 $ 5.3 $ 5.0 $ 4.1 $ 4.5 $ 4.1 $ 4.1 $ 3.7 $ 3.8 $ 3.7 $ 53.3 Total Capital Expenditures (1) $ (2.3) $ (0.0) $ (2.8) $ (0.0) $ (0.0) $ (0.0) $ (0.0) $ (0.0) $ (0.0) $ (0.0) $ (15.6) $ (0.0) $ (21.0) ? in Net Working Capital 2.8 (2.1) 1.9 (2.4) 0.4 1.0 (0.3) 0.5 (0.1) 0.4 15.6 (15.4) 2.2 Non-Recurring Expenses —— — — —————— ———PA Firm Pipeline Payments —— — — —————— ———WV Firm Pipeline Payments —— — — —————— ———Unlevered Free Cash Flow $ 5.2 $ 2.5 $ 4.6 $ 2.8 $ 5.4 $ 5.1 $ 4.2 $ 4.6 $ 4.0 $ 4.1 $ 3.7 $ (11.8) $ 34.5 Interest Expense and Undrawn Line Fee (0.5) (0.5) (0.5) (0.5) (0.5) (0.5) (0.5) (0.5) (0.5) (0.5) (0.5) (0.5) (6.3) Draw / (Paydown) of Exit RBL (4.7) (2.0) (4.1) (2.3) (4.9) (4.5) (3.6) (4.0) (3.5) (3.6) (3.2) 12.3 (28.2) Levered Free Cash Flow $—$—$ —$ —$ —$—$—$—$—$—$ —$—$—EOP Cash Balance $ 10.0 $ 10.0 $ 10.0 $ 10.0 $ 10.0 $ 10.0 $ 10.0 $ 10.0 $ 10.0 $ 10.0 $ 10.0 $ 10.0 $ 10.0 Debt Schedule: Total Debt (Exit RBL) $ 95.9 $ 93.9 $ 89.8 $ 87.5 $ 82.6 $ 78.1 $ 74.4 $ 70.4 $ 66.9 $ 63.3 $ 60.1 $ 72.5 $ 72.5 Net Debt $ 85.9 $ 83.9 $ 79.8 $ 77.5 $ 72.6 $ 68.1 $ 64.4 $ 60.4 $ 56.9 $ 53.3 $ 50.1 $ 62.5 $ 62.5 Rolling PDP PV-10 $ 241.3 $ 237.2 $ 247.0 $ 242.4 $ 238.0 $ 234.6 $ 230.7 $ 227.3 $ 223.7 $ 220.6 $ 217.4 $ 214.2 $ 214.2 PDP PV-10 / Secured Debt 2.51x 2.53x 2.75x 2.77x 2.88x 3.00x 3.10x 3.23x 3.34x 3.48x 3.61x 2.96x 2.96x $ Opex / Boe $ 10.49 $ 10.96 $ 10.37 $ 10.87 $ 11.08 $ 10.67 $ 11.44 $ 11.41 $ 11.76 $ 11.71 $ 12.05 $ 12.19 $ 11.20 $ G&A / Boe $ 4.11 $ 4.30 $ 3.85 $ 4.14 $ 4.34 $ 4.48 $ 4.65 $ 4.78 $ 4.92 $ 5.04 $ 5.17 $ 5.29 $ 4.55 % Prod. Taxes of Revenue 6.0% 6.0% 6.0% 6.0% 6.0% 6.0% 6.0% 6.0% 6.0% 6.0% 6.0% 6.0% 6.0% Notes: Assumes $15.1 MM annual general and administrative costs. Other Income reflects approximately $80k / month of water and marketing revenue received from WI partners. Assumes Exit RBL interest expense of L+300 to L+400, depending on amount drawn. PDP PV-10 reflects only asset-level costs (excludes G&A and working capital). PV-9 at 4/30/2016 of $ 272 MM at NYMEX, $ 209 MM at NYMEX minus 10% and $ 147 MM at NYMEX minus 20%, PV-9 as of 11/30/2016 of $ 254 MM at NYMEX, $195 MM at NYMEX minus 10% and $135 MM at NYMEX minus 20% and PV-9 as of 4/30/2017 of $234 MM at NYMEX, $177 MM at NYMEX minus 10% and $ 121 MM at NYMEX minus 20%. (1) November 2016 D&C capital expenditures include completion costs for the previously drilled Sable wells. Jefferies LLC, Alvarez & Marsal North America LLC, Kirkland & Ellis LLP / May 2016 6 For Settlement Discussion Purposes Only / Subject to FRE 408 / Pursuant to NDA
|
|
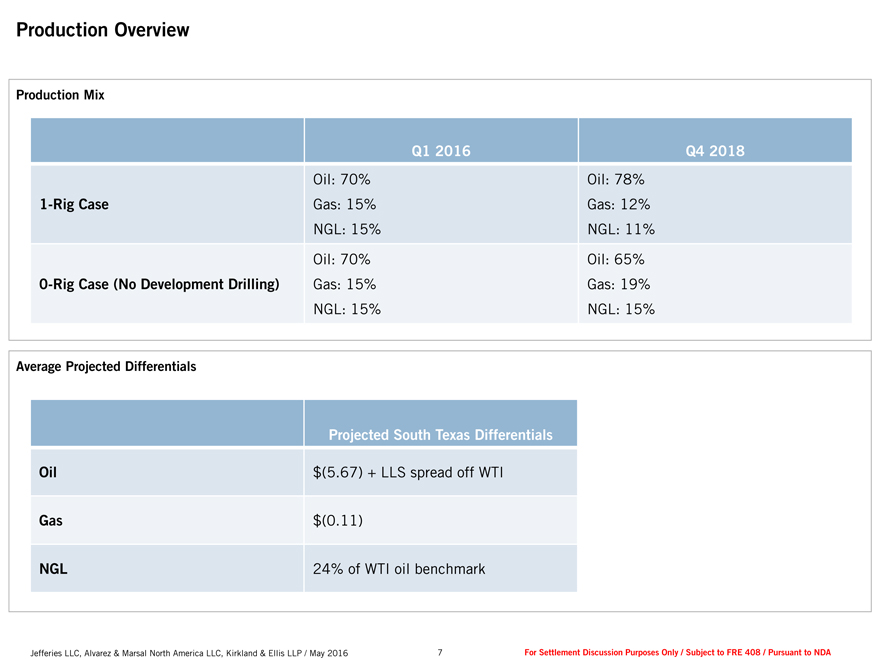
Production Overview Production Mix Q1 2016 Q4 2018 Oil: 70% Oil: 78% 1-Rig Case Gas: 15% Gas: 12% NGL: 15% NGL: 11% Oil: 70% Oil: 65% 0-Rig Case (No Development Drilling) Gas: 15% Gas: 19% NGL: 15% NGL: 15% Average Projected Differentials Projected South Texas Differentials Oil $ (5.67) + LLS spread off WTI Gas $ (0.11) NGL 24% of WTI oil benchmark Jefferies LLC, Alvarez & Marsal North America LLC, Kirkland & Ellis LLP / May 2016 7 For Settlement Discussion Purposes Only / Subject to FRE 408 / Pursuant to NDA
|
|
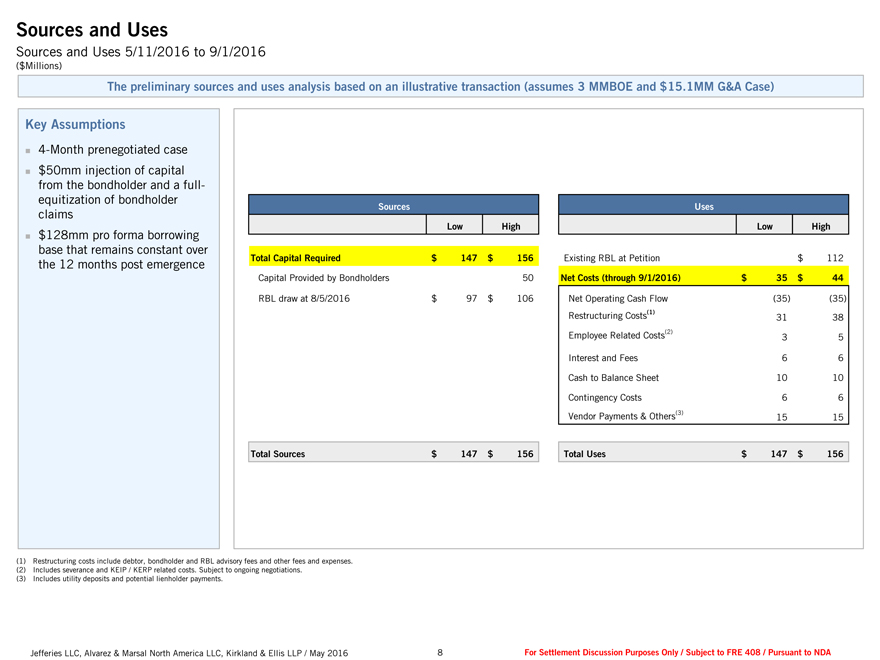
Sources and Uses Sources and Uses 5/11/2016 to 9/1/2016 ($Millions) The preliminary sources and uses analysis based on an illustrative transaction (assumes 3 MMBOE and $15.1MM G&A Case) Key Assumptions ? 4-Month prenegotiated case ? $50mm injection of capital from the bondholder and a full- equitization of bondholder claims Sources Uses Low High Low High ? $128mm pro forma borrowing base that remains constant over the 12 months post emergence Total Capital Required $ 147 $ 156 Existing RBL at Petition $ 112 Capital Provided by Bondholders 50 Net Costs (through 9/1/2016) $ 35 $ 44 RBL draw at 8/5/2016 $ 97 $ 106 Net Operating Cash Flow (35) (35) Restructuring Costs(1) 31 38 Employee Related Costs(2) 3 5 Interest and Fees 6 6 Cash to Balance Sheet 10 10 Contingency Costs 6 6 Vendor Payments & Others(3) 15 15 Total Sources $ 147 $ 156 Total Uses $ 147 $ 156 (1) Restructuring costs include debtor, bondholder and RBL advisory fees and other fees and expenses. (2) Includes severance and KEIP / KERP related costs. Subject to ongoing negotiations. (3) Includes utility deposits and potential lienholder payments. Jefferies LLC, Alvarez & Marsal North America LLC, Kirkland & Ellis LLP / May 2016 8 For Settlement Discussion Purposes Only / Subject to FRE 408 / Pursuant to NDA
|
|
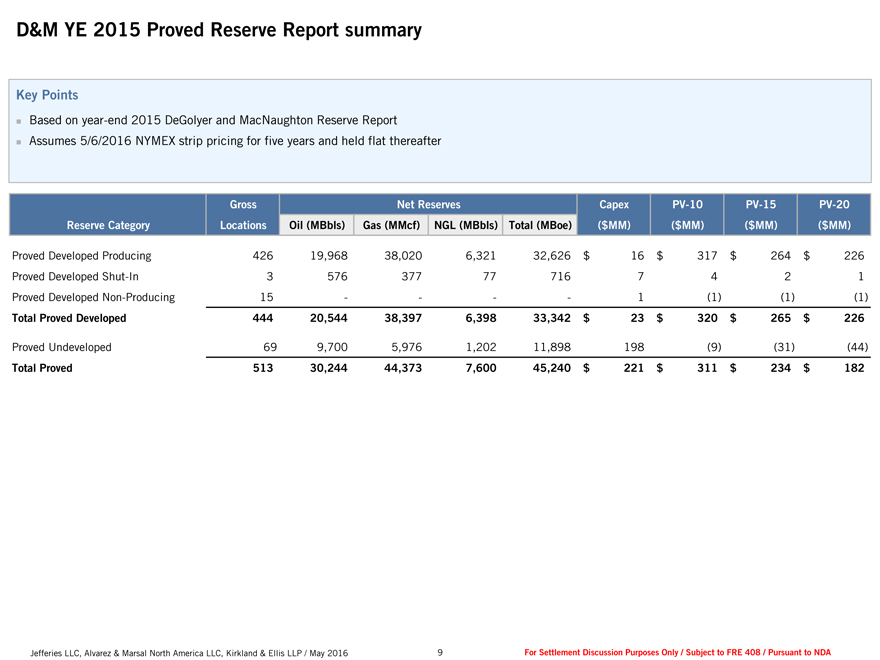
D&M YE 2015 Proved Reserve Report summary Key Points ? Based on year-end 2015 DeGolyer and MacNaughton Reserve Report ? Assumes 5/6/2016 NYMEX strip pricing for five years and held flat thereafter Gross Net Reserves Capex PV-10 PV-15 PV-20 Reserve Category Locations Oil (MBbls) Gas (MMcf) NGL (MBbls) Total (MBoe) ($ MM) ($ MM) ($ MM) ($ MM) Proved Developed Producing 426 19,968 38,020 6,321 32,626 $ 16 $ 317 $ 264 $ 226 Proved Developed Shut-In 3 576 377 77 716 7 4 2 1 Proved Developed Non-Producing 15 — — 1 (1) (1) (1) Total Proved Developed 444 20,544 38,397 6,398 33,342 $ 23 $ 320 $ 265 $ 226 Proved Undeveloped 69 9,700 5,976 1,202 11,898 198 (9) (31) (44) Total Proved 513 30,244 44,373 7,600 45,240 $ 221 $ 311 $ 234 $ 182 Jefferies LLC, Alvarez & Marsal North America LLC, Kirkland & Ellis LLP / May 2016 9 For Settlement Discussion Purposes Only / Subject to FRE 408 / Pursuant to NDA
|
|
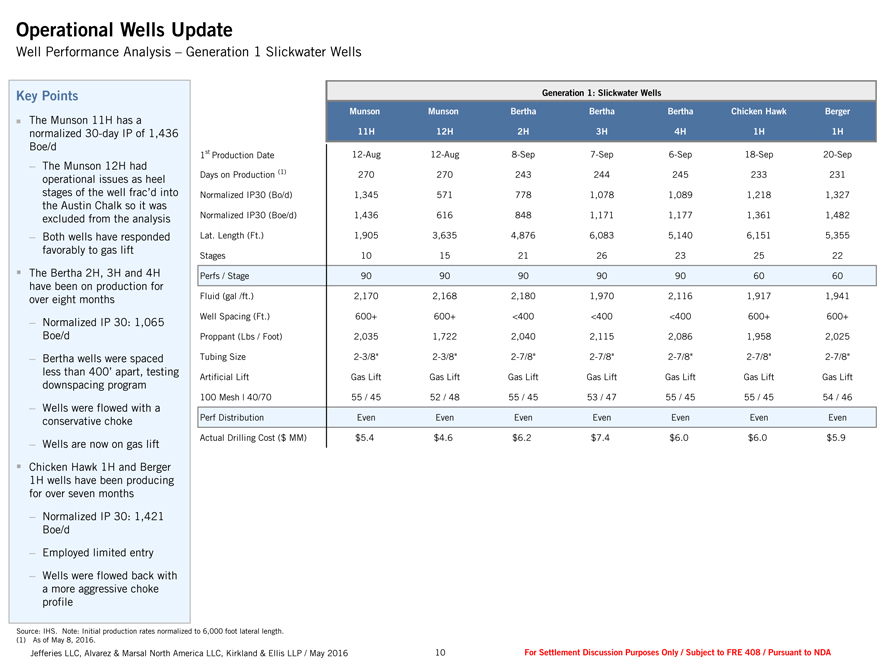
Operational Wells Update Well Performance Analysis – Generation 1 Slickwater Wells Key Points Generation 1: Slickwater Wells Munson Munson Bertha Bertha Bertha Chicken Hawk Berger ? The Munson 11H has a normalized 30-day IP of 1,436 11H 12H 2H 3H 4H 1H 1H Boe/d 1st Production Date 12-Aug 12-Aug 8-Sep 7-Sep 6-Sep 18-Sep 20-Sep ? The Munson 12H had operational issues as heel Days on Production (1) 270 270 243 244 245 233 231 stages of the well frac’d into Normalized IP30 (Bo/d) 1,345 571 778 1,078 1,089 1,218 1,327 the Austin Chalk so it was excluded from the analysis Normalized IP30 (Boe/d) 1,436 616 848 1,171 1,177 1,361 1,482 ? Both wells have responded Lat. Length (Ft.) 1,905 3,635 4,876 6,083 5,140 6,151 5,355 favorably to gas lift Stages 10 15 21 26 23 25 22 ? The Bertha 2H, 3H and 4H Perfs / Stage 90 90 90 90 90 60 60 have been on production for over eight months Fluid (gal /ft.) 2,170 2,168 2,180 1,970 2,116 1,917 1,941 ? Normalized IP 30: 1,065 Well Spacing (Ft.) 600+ 600+ <400 <400 <400 600+ 600+ Boe/d Proppant (Lbs / Foot) 2,035 1,722 2,040 2,115 2,086 1,958 2,025 ? Bertha wells were spaced Tubing Size 2-3/8” 2-3/8” 2-7/8” 2-7/8” 2-7/8” 2-7/8” 2-7/8” less than 400’ apart, testing Artificial Lift Gas Lift Gas Lift Gas Lift Gas Lift Gas Lift Gas Lift Gas Lift downspacing program 100 Mesh | 40/70 55 / 45 52 / 48 55 / 45 53 / 47 55 / 45 55 / 45 54 / 46 ? Wells were flowed with a conservative choke Perf Distribution Even Even Even Even Even Even Even ? Wells are now on gas lift Actual Drilling Cost ($ MM) $5.4 $4.6 $6.2 $7.4 $6.0 $6.0 $5.9 ? Chicken Hawk 1H and Berger 1H wells have been producing for over seven months ? Normalized IP 30: 1,421 Boe/d ? Employed limited entry ? Wells were flowed back with a more aggressive choke profile Source: IHS. Note: Initial production rates normalized to 6,000 foot lateral length. (1) As of May 8, 2016. Jefferies LLC, Alvarez & Marsal North America LLC, Kirkland & Ellis LLP / May 2016 10 For Settlement Discussion Purposes Only / Subject to FRE 408 / Pursuant to NDA
|
|
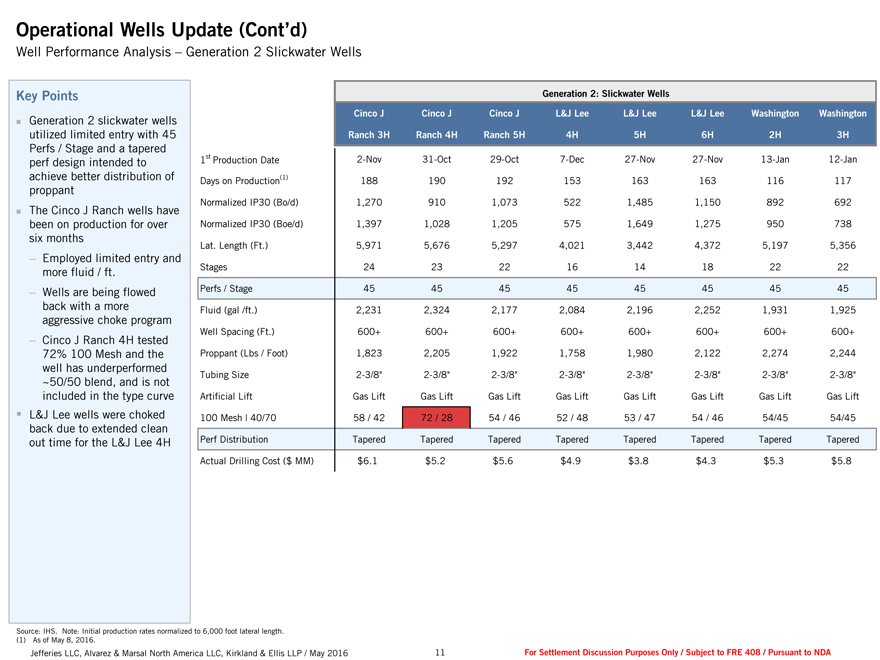
Operational Wells Update (Cont’d) Well Performance Analysis – Generation 2 Slickwater Wells Key Points Generation 2: Slickwater Wells Cinco J Cinco J Cinco J L&J Lee L&J Lee L&J Lee Washington Washington ? Generation 2 slickwater wells utilized limited entry with 45 Ranch 3H Ranch 4H Ranch 5H 4H 5H 6H 2H 3H Perfs / Stage and a tapered perf design intended to 1st Production Date 2-Nov 31-Oct 29-Oct 7-Dec 27-Nov 27-Nov 13-Jan 12-Jan achieve better distribution of Days on Production(1) 188 190 192 153 163 163 116 117 proppant Normalized IP30 (Bo/d) 1,270 910 1,073 522 1,485 1,150 892 692 ? The Cinco J Ranch wells have been on production for over Normalized IP30 (Boe/d) 1,397 1,028 1,205 575 1,649 1,275 950 738 six months Lat. Length (Ft.) 5,971 5,676 5,297 4,021 3,442 4,372 5,197 5,356 ? Employed limited entry and more fluid / ft. Stages 24 23 22 16 14 18 22 22 ? Wells are being flowed Perfs / Stage 45 45 45 45 45 45 45 45 back with a more Fluid (gal /ft.) 2,231 2,324 2,177 2,084 2,196 2,252 1,931 1,925 aggressive choke program Well Spacing (Ft.) 600+ 600+ 600+ 600+ 600+ 600+ 600+ 600+ ? Cinco J Ranch 4H tested 72% 100 Mesh and the Proppant (Lbs / Foot) 1,823 2,205 1,922 1,758 1,980 2,122 2,274 2,244 well has underperformed ~50/50 blend, and is not Tubing Size 2-3/8” 2-3/8” 2-3/8” 2-3/8” 2-3/8” 2-3/8” 2-3/8” 2-3/8” included in the type curve Artificial Lift Gas Lift Gas Lift Gas Lift Gas Lift Gas Lift Gas Lift Gas Lift Gas Lift ? L&J Lee wells were choked 100 Mesh | 40/70 58 / 42 72 / 28 54 / 46 52 / 48 53 / 47 54 / 46 54/45 54/45 back due to extended clean out time for the L&J Lee 4H Perf Distribution Tapered Tapered Tapered Tapered Tapered Tapered Tapered Tapered Actual Drilling Cost ($ MM) $6.1 $5.2 $5.6 $4.9 $3.8 $4.3 $5.3 $5.8 Source: IHS. Note: Initial production rates normalized to 6,000 foot lateral length. (1) As of May 8, 2016. Jefferies LLC, Alvarez & Marsal North America LLC, Kirkland & Ellis LLP / May 2016 11 For Settlement Discussion Purposes Only / Subject to FRE 408 / Pursuant to NDA
|
|
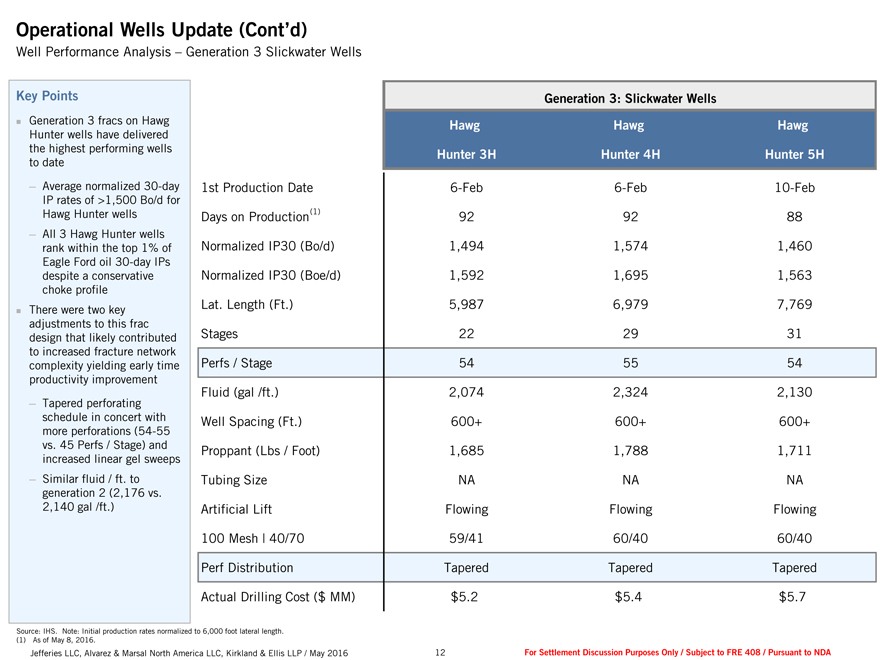
Operational Wells Update (Cont’d) Well Performance Analysis – Generation 3 Slickwater Wells Key Points Generation 3: Slickwater Wells ??Generation 3 fracs on Hawg Hawg Hawg Hawg Hunter wells have delivered the highest performing wells Hunter 3H Hunter 4H Hunter 5H to date ? Average normalized 30-day 1st Production Date 6-Feb 6-Feb 10-Feb IP rates of >1,500 Bo/d for Hawg Hunter wells Days on Production(1) 92 92 88 ? All 3 Hawg Hunter wells rank within the top 1% of Normalized IP30 (Bo/d) 1,494 1,574 1,460 Eagle Ford oil 30-day IPs despite a conservative Normalized IP30 (Boe/d) 1,592 1,695 1,563 choke profile There were two key Lat. Length (Ft.) 5,987 6,979 7,769 ? adjustments to this frac design that likely contributed Stages 22 29 31 to increased fracture network complexity yielding early time Perfs / Stage 54 55 54 productivity improvement Fluid (gal /ft.) 2,074 2,324 2,130 ? Tapered perforating schedule in concert with Well Spacing (Ft.) 600+ 600+ 600+ more perforations (54-55 vs. 45 Perfs / Stage) and Proppant (Lbs / Foot) 1,685 1,788 1,711 increased linear gel sweeps ? Similar fluid / ft. to Tubing Size NA NA NA generation 2 (2,176 vs. 2,140 gal /ft.) Artificial Lift Flowing Flowing Flowing 100 Mesh | 40/70 59/41 60/40 60/40 Perf Distribution Tapered Tapered Tapered Actual Drilling Cost ($ MM) $5.2 $5.4 $5.7 Source: IHS. Note: Initial production rates normalized to 6,000 foot lateral length. (1) As of May 8, 2016. Jefferies LLC, Alvarez & Marsal North America LLC, Kirkland & Ellis LLP / May 2016 12 For Settlement Discussion Purposes Only / Subject to FRE 408 / Pursuant to NDA
|
|
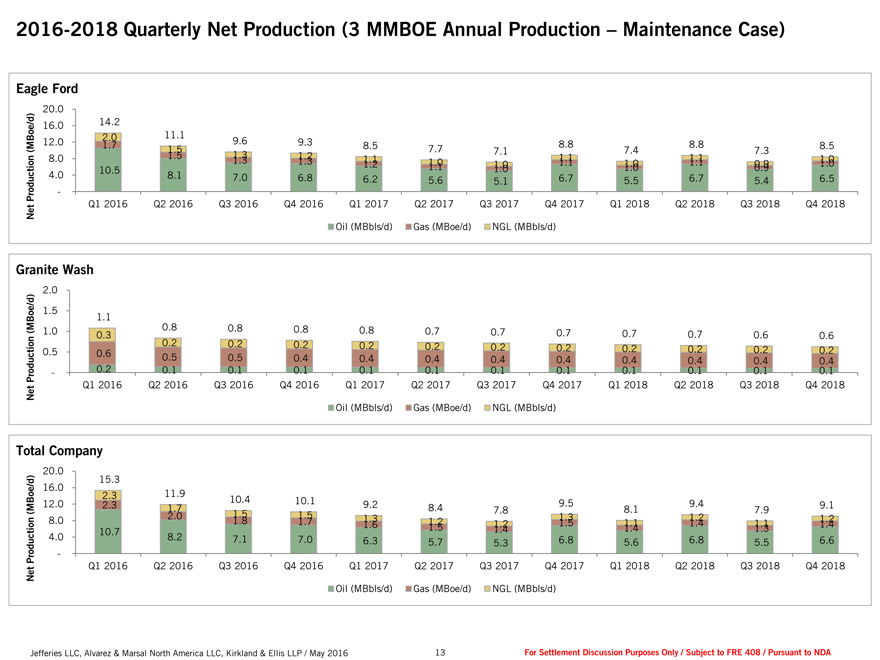
2016-2018 Quarterly Net Production (3 MMBOE Annual Production – Maintenance Case) Eagle Ford 20.0 oe/d) 16.0 14.2 2.0 11.1 9.6 ( MB 12.0 1.7 1.5 9.3 8.5 7.7 7.1 8.8 7.4 8.8 7.3 8.5 n 8.0 1.5 1.3 1.2 1.1 1.1 1.0 o i 10.5 1.3 1.3 1. 1.1 2 1. 1.0 1 1. 1.0 0 1.1 1. 1.0 0 1.1 0. 0.9 9 1.0 oduct 4.0— 8.1 7.0 6.8 6.2 5.6 5.1 6.7 5.5 6.7 5.4 6.5 Pr Q1 2016 Q2 2016 Q3 2016 Q4 2016 Q1 2017 Q2 2017 Q3 2017 Q4 2017 Q1 2018 Q2 2018 Q3 2018 Q4 2018 t e N Oil (MBbls/d) Gas (MBoe/d) NGL (MBbls/d) Granite Wash 2.0 e /d) 1.5 MBo 1.1 ( 1.0 0.3 0.8 0.8 0.8 0.8 0.7 0.7 0.7 0.7 0.7 0.6 0.6 t ion 0.5 0.6 0.2 0.2 0.2 0.2 0.2 0.2 0.2 0.2 0.2 0.2 0.2 duc 0.5 0.5 0.4 0.4 0.4 0.4 0.4 0.4 0.4 0.4 0.4 Pro—0.2 0.1 0.1 0.1 0.1 0.1 0.1 0.1 0.1 0.1 0.1 0.1 t Q1 2016 Q2 2016 Q3 2016 Q4 2016 Q1 2017 Q2 2017 Q3 2017 Q4 2017 Q1 2018 Q2 2018 Q3 2018 Q4 2018 e N Oil (MBbls/d) Gas (MBoe/d) NGL (MBbls/d) Total Company 20.0 e /d) 16.0 15.3 o 2.3 11.9 10.4 10.1 (MB 12.0 2.3 1.7 9.2 8.4 7.8 9.5 8.1 9.4 7.9 9.1 n 2.0 1.5 1.5 1.3 1.2 1. 1.3 1.2 o 8.0 1.8 1.7 1.6 1.5 2 1.5 1.1 1.4 1.1 1. 1.2 4 ti 10.7 1.4 1.4 1.3 duc 4.0 8.2 7.1 7.0 6.3 5.7 5.3 6.8 5.6 6.8 5.5 6.6 Pro— t Q1 2016 Q2 2016 Q3 2016 Q4 2016 Q1 2017 Q2 2017 Q3 2017 Q4 2017 Q1 2018 Q2 2018 Q3 2018 Q4 2018 e N Oil (MBbls/d) Gas (MBoe/d) NGL (MBbls/d) Jefferies LLC, Alvarez & Marsal North America LLC, Kirkland & Ellis LLP / May 2016 13 For Settlement Discussion Purposes Only / Subject to FRE 408 / Pursuant to NDA
|
|
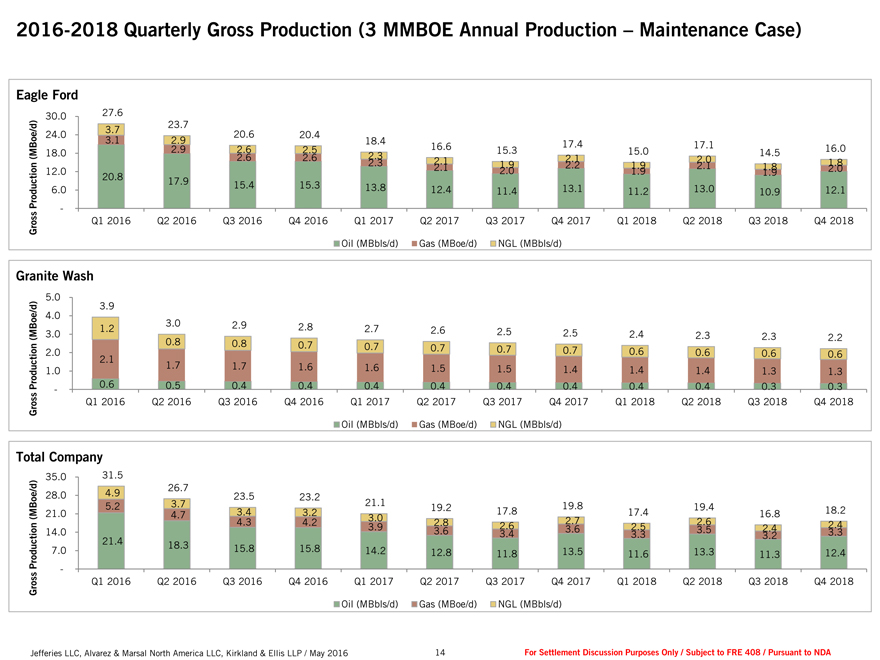
2016-2018 Quarterly Gross Production (3 MMBOE Annual Production – Maintenance Case) Eagle Ford 30.0 27.6 d) 23.7 / 24.0 3.7 20.6 20.4 (MBoe 18.0 3.1 2.9 2.9 2.6 2.5 18.4 16.6 15.3 17.4 15.0 17.1 14.5 16.0 2.6 2.6 2.3 2.1 2.0 1.8 tion 12.0 20.8 2.3 2.1 2.1 2.0 1.9 2.2 1.9 1.9 2.1 1.9 1.8 2.0 c 6.0 17.9 15.4 15.3 13.8 12.4 11.4 13.1 11.2 13.0 10.9 12.1 Produ— s s Q1 2016 Q2 2016 Q3 2016 Q4 2016 Q1 2017 Q2 2017 Q3 2017 Q4 2017 Q1 2018 Q2 2018 Q3 2018 Q4 2018 ro G Oil (MBbls/d) Gas (MBoe/d) NGL (MBbls/d) Granite Wash 5.0 d) 3.9 e / 4.0 o 3.0 2.9 (MB 3.0 1.2 2.8 2.7 2.6 2.5 2.5 2.4 2.3 2.3 2.2 on 2.0 0.8 0.8 0.7 0.7 0.7 0.7 0.7 0.6 0.6 0.6 0.6 c ti 2.1 u 1.0 1.7 1.7 1.6 1.6 1.5 1.5 1.4 1.4 1.4 1.3 1.3 d o Pr—0.6 0.5 0.4 0.4 0.4 0.4 0.4 0.4 0.4 0.4 0.3 0.3 s s Q1 2016 Q2 2016 Q3 2016 Q4 2016 Q1 2017 Q2 2017 Q3 2017 Q4 2017 Q1 2018 Q2 2018 Q3 2018 Q4 2018 ro G Oil (MBbls/d) Gas (MBoe/d) NGL (MBbls/d) Total Company 35.0 31.5 d) 26.7 e/ 28.0 4.9 23.5 23.2 o (MB 21.0 5.2 4.7 3.7 3.4 3.2 21.1 3.0 19.2 17.8 19.8 2.7 17.4 19.4 2. 16.8 18.2 n 4.3 4.2 2.8 6 2.4 o 14.0 3.9 3.6 3.4 2.6 3.6 3.3 2.5 3.5 3.2 2.4 3.3 ti 21.4 duc 7.0 18.3 15.8 15.8 14.2 12.8 11.8 13.5 11.6 13.3 11.3 12.4 ro P— s s Q1 2016 Q2 2016 Q3 2016 Q4 2016 Q1 2017 Q2 2017 Q3 2017 Q4 2017 Q1 2018 Q2 2018 Q3 2018 Q4 2018 ro G Oil (MBbls/d) Gas (MBoe/d) NGL (MBbls/d) Jefferies LLC, Alvarez & Marsal North America LLC, Kirkland & Ellis LLP / May 2016 14 For Settlement Discussion Purposes Only / Subject to FRE 408 / Pursuant to NDA
|
|
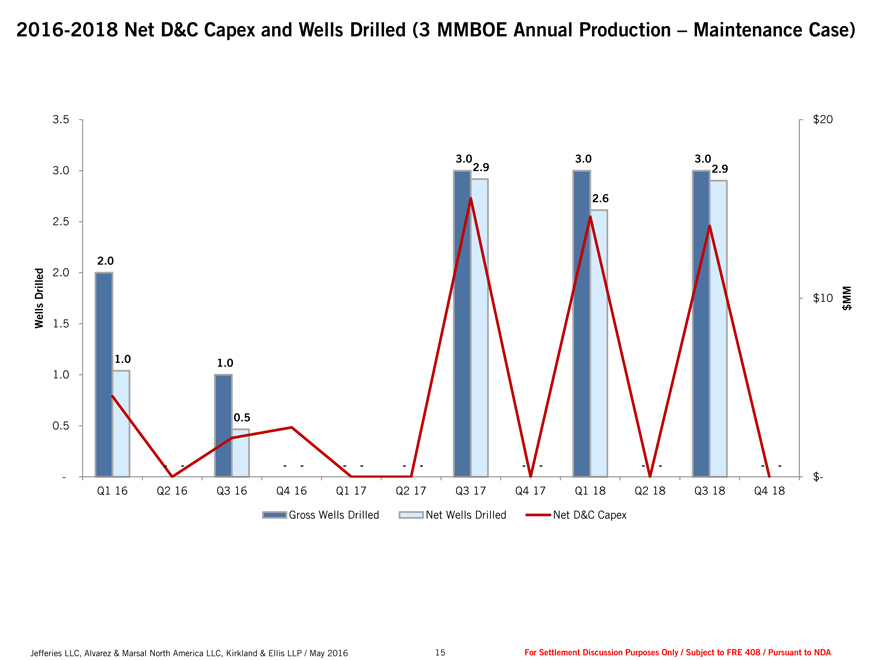
2016-2018 Net D&C Capex and Wells Drilled (3 MMBOE Annual Production – Maintenance Case) 3.5 $20 3.0 3.0 3.0 3.0 2.9 2.9 2.6 2.5 2.0 Drilled 2.0 $10 MM s $ Well 1.5 1.0 1.0 1.0 0.5 0.5 — — — — — — —— $- Q1 16 Q2 16 Q3 16 Q4 16 Q1 17 Q2 17 Q3 17 Q4 17 Q1 18 Q2 18 Q3 18 Q4 18 Gross Wells Drilled Net Wells Drilled Net D&C Capex Jefferies LLC, Alvarez & Marsal North America LLC, Kirkland & Ellis LLP / May 2016 15 For Settlement Discussion Purposes Only / Subject to FRE 408 / Pursuant to NDA
|
|
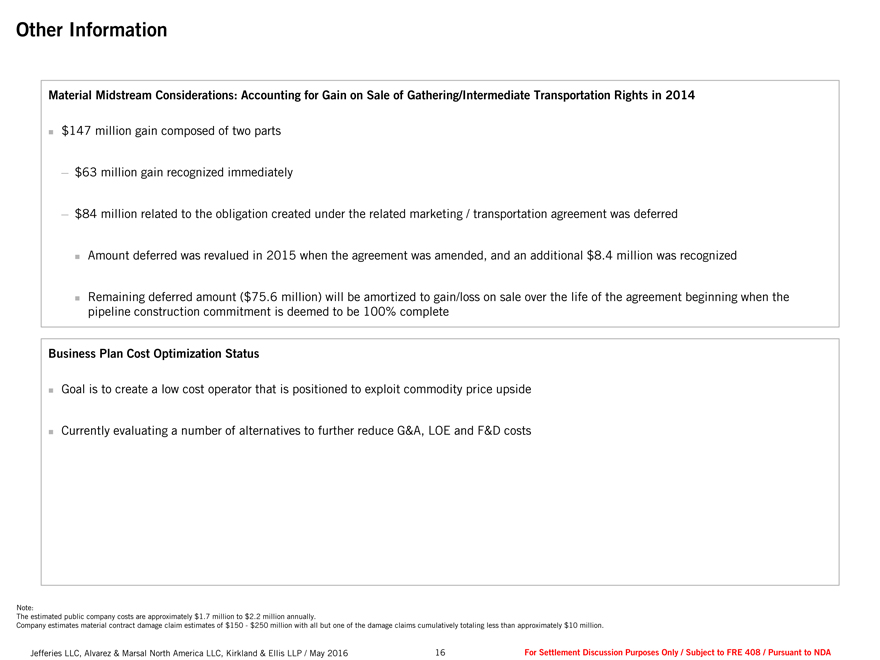
Other Information Material Midstream Considerations: Accounting for Gain on Sale of Gathering/Intermediate Transportation Rights in 2014 ? $147 million gain composed of two parts ? $63 million gain recognized immediately ? $84 million related to the obligation created under the related marketing / transportation agreement was deferred ? Amount deferred was revalued in 2015 when the agreement was amended, and an additional $8.4 million was recognized ? Remaining deferred amount ($75.6 million) will be amortized to gain/loss on sale over the life of the agreement beginning when the pipeline construction commitment is deemed to be 100% complete Business Plan Cost Optimization Status ? Goal is to create a low cost operator that is positioned to exploit commodity price upside ? Currently evaluating a number of alternatives to further reduce G&A, LOE and F&D costs Note: The estimated public company costs are approximately $1.7 million to $2.2 million annually. Company estimates material contract damage claim estimates of $150—$250 million with all but one of the damage claims cumulatively totaling less than approximately $10 million. Jefferies LLC, Alvarez & Marsal North America LLC, Kirkland & Ellis LLP / May 2016 16 For Settlement Discussion Purposes Only / Subject to FRE 408 / Pursuant to NDA
|
|
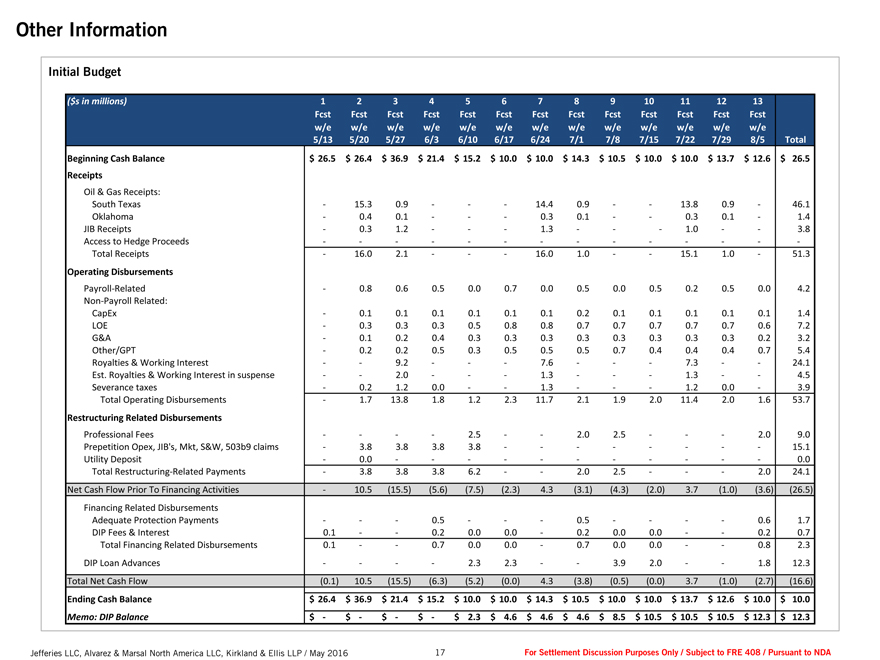
Other Information Initial Budget ($s in millions) 1 2 3 4 5 6 7 8 9 10 11 12 13 Fcst Fcst Fcst Fcst Fcst Fcst Fcst Fcst Fcst Fcst Fcst Fcst Fcst w/e w/e w/e w/e w/e w/e w/e w/e w/e w/e w/e w/e w/e 5/13 5/20 5/27 6/3 6/10 6/17 6/24 7/1 7/8 7/15 7/22 7/29 8/5 Total Beginning Cash Balance $ 26.5 $ 26.4 $ 36.9 $ 21.4 $ 15.2 $ 10.0 $ 10.0 $ 14.3 $ 10.5 $ 10.0 $ 10.0 $ 13.7 $ 12.6 $ 26.5 Receipts Oil & Gas Receipts: South Texas—15.3 0.9 ——14.4 0.9 — 13.8 0.9—46.1 Oklahoma—0.4 0.1 —— 0.3 0.1 — 0.3 0.1—1.4 JIB Receipts—0.3 1.2 —— 1.3 ——1.0 — 3.8 Access to Hedge Proceeds — — — — — — — Total Receipts—16.0 2.1 ——16.0 1.0 — 15.1 1.0—51.3 Operating Disbursements Payroll-Related—0.8 0.6 0.5 0.0 0.7 0.0 0.5 0.0 0.5 0.2 0.5 0.0 4.2 Non-Payroll Related: CapEx—0.1 0.1 0.1 0.1 0.1 0.1 0.2 0.1 0.1 0.1 0.1 0.1 1.4 LOE—0.3 0.3 0.3 0.5 0.8 0.8 0.7 0.7 0.7 0.7 0.7 0.6 7.2 G&A—0.1 0.2 0.4 0.3 0.3 0.3 0.3 0.3 0.3 0.3 0.3 0.2 3.2 Other/GPT—0.2 0.2 0.5 0.3 0.5 0.5 0.5 0.7 0.4 0.4 0.4 0.7 5.4 Royalties & Working Interest — 9.2 —— 7.6 ——7.3 — 24.1 Est. Royalties & Working Interest in suspense — 2.0 —— 1.3 ——1.3 — 4.5 Severance taxes—0.2 1.2 0.0 — 1.3 ——1.2 0.0—3.9 Total Operating Disbursements—1.7 13.8 1.8 1.2 2.3 11.7 2.1 1.9 2.0 11.4 2.0 1.6 53.7 Restructuring Related Disbursements Professional Fees — — 2.5——2.0 2.5 ——2.0 9.0 Prepetition Opex, JIB’s, Mkt, S&W, 503b9 claims—3.8 3.8 3.8 3.8— — — ——15.1 Utility Deposit—0.0 — — — — ——0.0 Total Restructuring-Related Payments—3.8 3.8 3.8 6.2——2.0 2.5 ——2.0 24.1 Net Cash Flow Prior To Financing Activities—10.5 (15.5) (5.6) (7.5) (2.3) 4.3 (3.1) (4.3) (2.0) 3.7 (1.0) (3.6) (26.5) Financing Related Disbursements Adequate Protection Payments ——0.5 — —0.5 — — 0.6 1.7 DIP Fees & Interest 0.1 — 0.2 0.0 0.0 —0.2 0.0 0.0 — 0.2 0.7 Total Financing Related Disbursements 0.1 — 0.7 0.0 0.0 —0.7 0.0 0.0 — 0.8 2.3 DIP Loan Advances — — 2.3 2.3 — 3.9 2.0 — 1.8 12.3 Total Net Cash Flow (0.1) 10.5 (15.5) (6.3) (5.2) (0.0) 4.3 (3.8) (0.5) (0.0) 3.7 (1.0) (2.7) (16.6) Ending Cash Balance $ 26.4 $ 36.9 $ 21.4 $ 15.2 $ 10.0 $ 10.0 $ 14.3 $ 10.5 $ 10.0 $ 10.0 $ 13.7 $ 12.6 $ 10.0 $ 10.0 Memo: DIP Balance $—$—$—$—$ 2.3 $ 4.6 $ 4.6 $ 4.6 $ 8.5 $ 10.5 $ 10.5 $ 10.5 $ 12.3 $ 12.3 Jefferies LLC, Alvarez & Marsal North America LLC, Kirkland & Ellis LLP / May 2016 17 For Settlement Discussion Purposes Only / Subject to FRE 408 / Pursuant to NDA