Attached files
| file | filename |
|---|---|
| EX-31.2 - EXHIBIT 31.2 - Xenia Hotels & Resorts, Inc. | xeniaq110kexhibit312.htm |
| EX-10.1 - EXHIBIT 10.1 - Xenia Hotels & Resorts, Inc. | xeniaq1201610qexhibit101.htm |
| EX-31.1 - EXHIBIT 31.1 - Xenia Hotels & Resorts, Inc. | xeniaq110kexhibit311.htm |
| EX-10.2 - EXHIBIT 10.2 - Xenia Hotels & Resorts, Inc. | xeniaq1201610qexhibit102.htm |
| EX-32.1 - EXHIBIT 32.1 - Xenia Hotels & Resorts, Inc. | xeniaq110kexhibit321.htm |
UNITED STATES
SECURITIES AND EXCHANGE COMMISSION
Washington, D.C. 20549
____________________________
FORM 10-Q
____________________________
(Mark One)
þ QUARTERLY REPORT PURSUANT TO SECTION 13 OR 15(d) OF THE SECURITIES EXCHANGE ACT OF 1934
For the quarterly period ended March 31, 2016
OR
o TRANSITION REPORT PURSUANT TO SECTION 13 OR 15(d) OF THE SECURITIES EXCHANGE ACT OF 1934
For the transition period ended ______ to ______
Commission file number 001-36594
___________________________
Xenia Hotels & Resorts, Inc.
(Exact Name of Registrant as Specified in Its Charter)
_______________________
Maryland | 20-0141677 | |
(State of Incorporation) | (I.R.S. Employer Identification No.) | |
200 S. Orange Avenue Suite 1200, Orlando, Florida | 32801 | |
(Address of Principal Executive Offices) | (Zip Code) | |
(407) 317-6950
(Registrant’s telephone number, including area code)
Indicate by check mark whether the registrant (1) has filed all reports required to be filed by Section 13 or 15(d) of the Securities Exchange Act of 1934 during the preceding 12 months (or for such shorter period that the registrant was required to file such reports), and (2) has been subject to such filing requirements for the past 90 days. þ Yes o No
Indicate by check mark whether the registrant has submitted electronically and posted on its corporate Web site, if any, every Interactive Data File required to be submitted and posted pursuant to Rule 405 of Regulation S-T (§232.405 of this chapter) during the preceding 12 months (or for such shorter period that the registrant was required to submit and post such files). þ Yes o No
Indicate by check mark whether the registrant is a large accelerated filer, an accelerated filer, a non-accelerated filer, or a smaller reporting company. See definition of “large accelerated filer,” “accelerated filer” and “smaller reporting company” in Rule 12b-2 of the Exchange Act.
Large accelerated filer o | Accelerated filer o | Non-accelerated filer þ | Smaller reporting company o | |||
(Do not check if a smaller reporting company) | ||||||
Indicate by check mark whether the registrant is a shell company (as defined in Rule 12b-2 of the Exchange Act). o Yes þ No
As of May 9, 2016, there were 107,955,856 shares of the registrant’s common stock outstanding.
XENIA HOTELS & RESORTS, INC.
TABLE OF CONTENTS
Part I - Financial Information | Page | ||
Item 1. | Financial Statements (unaudited) | ||
Combined Condensed Consolidated Balance Sheets as of March 31, 2016 and December 31, 2015 | |||
Combined Condensed Consolidated Statements of Operations and Comprehensive Loss for the three months ended March 31, 2016 and 2015 | |||
Combined Condensed Consolidated Statements of Changes in Equity for the three months ended March 31, 2016 | |||
Combined Condensed Consolidated Statements of Cash Flows for the three months ended March 31, 2016 and 2015 | |||
Notes to the Combined Condensed Consolidated Financial Statements | |||
Item 2. | Management's Discussion and Analysis of Financial Condition and Results of Operations | ||
Item 3. | Quantitative and Qualitative Disclosures About Market Risk | ||
Item 4. | Controls and Procedures | ||
Part II - Other Information | |||
Item 1. | Legal Proceedings | ||
Item 1A. | Risk Factors | ||
Item 2. | Unregistered Sales of Equity Securities and Use of Proceeds | ||
Item 3. | Defaults Upon Senior Securities | ||
Item 4. | Mine Safety Disclosures | ||
Item 5. | Other Information | ||
Item 6. | Exhibits | ||
Signatures | |||
PART I. FINANCIAL INFORMATION
Item 1. Financial Statements
XENIA HOTELS & RESORTS, INC.
Combined Condensed Consolidated Balance Sheets
As of March 31, 2016 and December 31, 2015
(Dollar amounts in thousands, except per share data)
March 31, 2016 | December 31, 2015 | ||||||
Assets | (Unaudited) | ||||||
Investment properties: | |||||||
Land | $ | 346,412 | 346,412 | ||||
Building and other improvements | 2,863,030 | 2,742,586 | |||||
Construction in progress | — | 169 | |||||
Total | $ | 3,209,442 | 3,089,167 | ||||
Less: accumulated depreciation | (576,539 | ) | (539,021 | ) | |||
Net investment properties | $ | 2,632,903 | 2,550,146 | ||||
Cash and cash equivalents | 159,576 | 122,154 | |||||
Restricted cash and escrows | 74,409 | 77,292 | |||||
Accounts and rents receivable, net of allowance of $236 and $243, respectively | 31,993 | 24,168 | |||||
Intangible assets, net of accumulated amortization of $18,043 and $17,140, respectively | 81,497 | 60,515 | |||||
Deferred tax asset | 2,280 | 2,304 | |||||
Other assets | 21,821 | 40,932 | |||||
Assets held for sale | 85,016 | 128,434 | |||||
Total assets (including $76,929 and $77,140, respectively, related to consolidated variable interest entities) | $ | 3,089,495 | $ | 3,005,945 | |||
Liabilities | |||||||
Debt, net of loan discounts, premiums and unamortized deferred financing costs | $ | 1,290,009 | 1,094,536 | ||||
Accounts payable and accrued expenses | 74,867 | 84,385 | |||||
Distributions payable | 29,882 | 25,684 | |||||
Other liabilities | 42,889 | 27,572 | |||||
Liabilities associated with assets held for sale | 1,655 | 30,410 | |||||
Total liabilities (including $48,615 and $48,582, respectively, related to consolidated variable interest entities) | 1,439,302 | 1,262,587 | |||||
Commitments and contingencies | |||||||
Stockholders' equity | |||||||
Common stock, $0.01 par value, 500,000,000 shares authorized, 108,363,325 and 111,671,372 shares issued and outstanding as of March 31, 2016 and December 31, 2015, respectively | 1,084 | 1,117 | |||||
Additional paid in capital | 1,947,201 | 1,993,760 | |||||
Accumulated other comprehensive (loss) income | (7,891 | ) | 1,543 | ||||
Distributions in excess of retained earnings | (307,706 | ) | (268,991 | ) | |||
Total Company stockholders' equity | $ | 1,632,688 | $ | 1,727,429 | |||
Non-controlling interests | 17,505 | 15,929 | |||||
Total equity | $ | 1,650,193 | $ | 1,743,358 | |||
Total liabilities and equity | $ | 3,089,495 | $ | 3,005,945 | |||
See accompanying notes to the combined condensed consolidated financial statements.
1
XENIA HOTELS & RESORTS, INC.
Combined Condensed Consolidated Statements of Operations and Comprehensive Loss
For the Three Months Ended March 31, 2016 and 2015
(unaudited)
(Dollar amounts in thousands, except per share data)
Three Months Ended March 31, | |||||||
2016 | 2015 | ||||||
Revenues: | |||||||
Rooms revenues | $ | 159,318 | $ | 153,090 | |||
Food and beverage revenues | 63,468 | 62,253 | |||||
Other revenues | 12,249 | 12,531 | |||||
Total revenues | $ | 235,035 | $ | 227,874 | |||
Expenses: | |||||||
Rooms expenses | 36,775 | 35,187 | |||||
Food and beverage expenses | 42,233 | 40,187 | |||||
Other direct expenses | 3,965 | 4,265 | |||||
Other indirect expenses | 57,967 | 53,258 | |||||
Management and franchise fees | 12,248 | 11,451 | |||||
Total hotel operating expenses | $ | 153,188 | $ | 144,348 | |||
Depreciation and amortization | 38,951 | 36,387 | |||||
Real estate taxes, personal property taxes and insurance | 12,033 | 12,193 | |||||
Ground lease expense | 1,353 | 1,275 | |||||
General and administrative expenses | 10,624 | 7,045 | |||||
Acquisition transaction costs | 140 | 29 | |||||
Provision for asset impairment | 7,594 | — | |||||
Separation and other start-up related expenses | — | 25,296 | |||||
Total expenses | $ | 223,883 | $ | 226,573 | |||
Operating income | $ | 11,152 | $ | 1,301 | |||
Gain on sale of investment properties | 882 | — | |||||
Other income | 84 | 2,687 | |||||
Interest expense | (12,840 | ) | (13,181 | ) | |||
Loss on extinguishment of debt | (4,742 | ) | (105 | ) | |||
Loss before income taxes | $ | (5,464 | ) | $ | (9,298 | ) | |
Income tax expense | (3,705 | ) | (5,079 | ) | |||
Net loss from continuing operations | $ | (9,169 | ) | $ | (14,377 | ) | |
Net loss from discontinued operations | — | (489 | ) | ||||
Net loss | $ | (9,169 | ) | $ | (14,866 | ) | |
Less: Net loss attributable to non-controlling interests | 254 | — | |||||
Net loss attributable to the Company | $ | (8,915 | ) | $ | (14,866 | ) | |
2
XENIA HOTELS & RESORTS, INC.
Combined Condensed Consolidated Statements of Operations and Comprehensive Loss
For the Three Months Ended March 31, 2016 and 2015
(unaudited)
(Dollar amounts in thousands, except per share data)
Three Months Ended March 31, | |||||||
2016 | 2015 | ||||||
Basic and diluted earnings per share | |||||||
Loss from continuing operations available to common stockholders | $ | (0.08 | ) | $ | (0.13 | ) | |
Loss from discontinued operations available to common stockholders | — | — | |||||
Net loss per share available to common stockholders | $ | (0.08 | ) | $ | (0.13 | ) | |
Weighted average number of common shares (basic and diluted) | 109,732,721 | 112,964,557 | |||||
Comprehensive Loss: | |||||||
Net loss | $ | (9,169 | ) | $ | (14,866 | ) | |
Other comprehensive loss: | |||||||
Unrealized loss on interest rate derivative instruments | (9,434 | ) | — | ||||
$ | (18,603 | ) | $ | (14,866 | ) | ||
Comprehensive loss attributable to non-controlling interests: | |||||||
Non-controlling interests in consolidated entities | 254 | — | |||||
Comprehensive loss attributable to non-controlling interests | 254 | — | |||||
Comprehensive loss attributable to the Company | $ | (18,349 | ) | $ | (14,866 | ) | |
See accompanying notes to the combined condensed consolidated financial statements.
3
XENIA HOTELS & RESORTS, INC.
Combined Condensed Consolidated Statements of Changes in Equity
For the Three Months Ended March 31, 2016
(unaudited)
(Dollar amounts in thousands, except per share data)
Common Stock | Non-controlling Interests | |||||||||||||||||||||||||||||||||
Shares | Amount | Additional paid in capital | Accumulated other comprehensive income (loss) | Distributions in excess of retained earnings | Operating Partnership | Consolidated Joint Venture | Total Non-controlling Interests | Total | ||||||||||||||||||||||||||
Balance at January 1, 2016 | 111,671,372 | $ | 1,117 | $ | 1,993,760 | $ | 1,543 | $ | (268,991 | ) | $ | 2,593 | $ | 13,336 | $ | 15,929 | $ | 1,743,358 | ||||||||||||||||
Net loss | — | — | — | — | (8,915 | ) | (90 | ) | (164 | ) | (254 | ) | (9,169 | ) | ||||||||||||||||||||
Repurchase of common shares, net | (3,390,500 | ) | (34 | ) | (49,253 | ) | — | — | — | — | — | (49,287 | ) | |||||||||||||||||||||
Dividends, common shares / units ($0.275) | — | — | — | — | (29,800 | ) | (82 | ) | — | (82 | ) | (29,882 | ) | |||||||||||||||||||||
Share-based compensation | 82,453 | 1 | 2,694 | — | — | 1,571 | — | 1,571 | 4,266 | |||||||||||||||||||||||||
Other comprehensive loss | — | — | — | (9,434 | ) | — | — | — | — | (9,434 | ) | |||||||||||||||||||||||
Contributions from non-controlling interests | — | — | — | — | — | — | 341 | 341 | 341 | |||||||||||||||||||||||||
Balance at March 31, 2016 | 108,363,325 | $ | 1,084 | $ | 1,947,201 | $ | (7,891 | ) | $ | (307,706 | ) | $ | 3,992 | $ | 13,513 | $ | 17,505 | $ | 1,650,193 | |||||||||||||||
See accompanying notes to the combined condensed consolidated financial statements.
4
XENIA HOTELS & RESORTS, INC.
Combined Condensed Consolidated Statements of Cash Flows
For the Three Months Ended March 31, 2016 and 2015
(unaudited)
(Dollar amounts in thousands)
Three Months Ended March 31, | |||||||
2016 | 2015 | ||||||
Cash flows from operating activities: | |||||||
Net loss | $ | (9,169 | ) | $ | (14,866 | ) | |
Adjustments to reconcile net loss to net cash provided by operating activities: | |||||||
Depreciation | 38,199 | 35,301 | |||||
Amortization of above and below market leases and other lease tangibles | 775 | 1,047 | |||||
Amortization of debt premiums, discounts, and financing costs | 1,003 | 1,169 | |||||
Loss on extinguishment of debt | 4,742 | 105 | |||||
Gain on sale of investment property, net | (882 | ) | — | ||||
Provision for asset impairment | 7,594 | — | |||||
Share-based compensation expense | 2,697 | 1,674 | |||||
Other non-cash adjustments | 109 | (578 | ) | ||||
Prepayment penalties and defeasance | (4,813 | ) | — | ||||
Changes in assets and liabilities: | |||||||
Accounts and rents receivable | (8,356 | ) | (8,643 | ) | |||
Deferred costs and other assets | 886 | (2,280 | ) | ||||
Accounts payable and accrued expenses | (5,582 | ) | (10,624 | ) | |||
Other liabilities | 6,176 | 2,631 | |||||
Net cash flows provided by operating activities | $ | 33,379 | $ | 4,936 | |||
Cash flows from investing activities: | |||||||
Purchase of investment properties | (116,000 | ) | — | ||||
Capital expenditures and tenant improvements | (7,268 | ) | (17,083 | ) | |||
Investment in development projects | — | (11,473 | ) | ||||
Proceeds from sale of investment properties | 30,899 | — | |||||
Restricted cash and escrows | 4,189 | 4,352 | |||||
Other assets | — | 1,319 | |||||
Net cash flows used in investing activities | $ | (88,180 | ) | $ | (22,885 | ) | |
Cash flows from financing activities: | |||||||
Distribution to InvenTrust Properties Corp. | — | (23,505 | ) | ||||
Contribution from InvenTrust Properties Corp. | — | 176,805 | |||||
Proceeds from mortgage debt and notes payable | 71,258 | 7,465 | |||||
Payoffs of mortgage debt | (27,775 | ) | (26,315 | ) | |||
Principal payments of mortgage debt | (874 | ) | (2,236 | ) | |||
Proceeds from unsecured term loan | 125,000 | — | |||||
Payment of loan fees and deposits | (723 | ) | (2,926 | ) | |||
Contributions from non-controlling interests | 341 | 584 | |||||
Proceeds from issuance of preferred shares, net of offering costs | — | 102 | |||||
Repurchase of common shares | (49,287 | ) | (36,946 | ) | |||
Dividends, common shares/units | (25,684 | ) | — | ||||
Distributions paid to non-controlling interests | (33 | ) | — | ||||
Net cash flows provided by financing activities | $ | 92,223 | $ | 93,028 | |||
Net increase in cash and cash equivalents | 37,422 | 75,079 | |||||
Cash and cash equivalents, at beginning of year | 122,154 | 163,053 | |||||
Cash and cash equivalents, at March 31, 2016 and 2015 | $ | 159,576 | $ | 238,132 | |||
See accompanying notes to the combined condensed consolidated financial statements.
5
XENIA HOTELS & RESORTS, INC.
Combined Condensed Consolidated Statements of Cash Flows - Continued
For the Three Months Ended March 31, 2016 and 2015
(unaudited)
(Dollar amounts in thousands)
Three Months Ended March 31, | |||||||
2016 | 2015 | ||||||
Supplemental disclosure of cash flow information: | |||||||
Cash paid for taxes | $ | 325 | $ | 106 | |||
Cash paid for interest | 10,003 | 11,676 | |||||
Supplemental schedule of non-cash investing and financing activities: | |||||||
Accrued capital expenditures | $ | 1,087 | $ | 6,083 | |||
Assumption of unsecured line of credit facility by InvenTrust Properties Corp. | — | (96,020 | ) | ||||
Non-cash net distributions to InvenTrust Properties Corp. | — | 1,220 | |||||
Distributions payable | 29,882 | 16,720 | |||||
Deposit applied to purchase price of hotel property upon acquisition | 20,000 | — | |||||
See accompanying notes to the combined condensed consolidated financial statements.
6
XENIA HOTELS & RESORTS, INC.
Notes to Combined Condensed Consolidated Financial Statements (unaudited)
March 31, 2016
1. Organization
Xenia Hotels & Resorts, Inc. (the "Company" or "Xenia") is a Maryland corporation that invests primarily in premium full service, lifestyle and urban upscale hotels. Prior to February 3, 2015, Xenia was a wholly owned subsidiary of InvenTrust Properties Corp. ("InvenTrust" formerly known as Inland American Real Estate Trust, Inc.), its former parent.
On February 3, 2015, Xenia was spun off from InvenTrust through a taxable pro rata distribution by InvenTrust of 95% of the outstanding common stock, $0.01 par value per share (the "Common Stock"), of Xenia to holders of record of InvenTrust's common stock as of the close of business on January 20, 2015 (the "Record Date"). Each holder of record of InvenTrust's common stock received one share of Common Stock for every eight shares of InvenTrust’s common stock held at the close of business on the Record Date (the "Distribution"). In lieu of fractional shares, stockholders of InvenTrust received cash. On February 4, 2015, Xenia’s Common Stock began trading on the New York Stock Exchange ("NYSE") under the ticker symbol "XHR." As a result of the Distribution, the Company became a stand-alone, publicly-traded company. Xenia operates as a real estate investment trust ("REIT") for federal income tax purposes.
Substantially all of the Company's assets are held by, and all the operations are conducted through XHR LP (the "Operating Partnership"). XHR GP, Inc. is the sole general partner of XHR LP. XHR GP, Inc. is wholly owned by the Company. As of March 31, 2016, the Company owned 98.9% of the common limited partnership units issued by the Operating Partnership ("common units"). The remaining 1.1% of the common units are owned by the other limited partners. To qualify as a REIT, the Company cannot operate or manage its hotels. Therefore, the Operating Partnership and its subsidiaries lease the hotel properties to XHR Holding Inc. (collectively with its subsidiaries, "XHR Holding"), the Company's taxable REIT subsidiary ("TRS"), which engages third-party eligible independent contractors to manage the hotels.
The accompanying combined condensed consolidated financial statements include the accounts of the Company, the Operating Partnership, XHR Holding, as well as all wholly owned subsidiaries and consolidated investments in real estate entities. The Company's subsidiaries and consolidated investments in real estate entities generally consist of limited liability companies ("LLCs"), limited partnerships ("LPs") and the TRS. The effects of all significant inter-company transactions have been eliminated.
As of March 31, 2016, the Company owned 50 lodging properties, 48 of which were wholly owned, with a total of 12,548 rooms, including a 75% ownership interest in two hotels owned through two investments in real estate entities.
2. Summary of Significant Accounting Policies
The unaudited interim combined condensed consolidated financial statements and related notes have been prepared on an accrual basis of accounting in accordance with accounting principles generally accepted in the United States of America ("GAAP") and in conformity with the rules and regulations of the Securities and Exchange Commission ("SEC") applicable to financial information. Certain information and footnote disclosures normally included in financial statements prepared in accordance with GAAP have been omitted in accordance with the rules and regulations of the SEC. The unaudited financial statements include normal recurring adjustments, which the Company considers necessary for the fair presentation of the combined condensed consolidated balance sheets, combined condensed consolidated statements of operations and comprehensive loss, combined condensed consolidated statements of changes in equity and combined condensed consolidated statements of cash flows for the periods presented. The unaudited combined condensed consolidated financial statements should be read in conjunction with the combined consolidated financial statements and notes thereto as of and for the year ended December 31, 2015, included in the Company's Annual Report on Form 10-K filed with the SEC on March 10, 2016. Operating results for the three months ended March 31, 2016 are not necessarily indicative of actual operating results for the entire year.
Basis of Presentation
As described in Note 1, on February 3, 2015, Xenia was spun off from InvenTrust. Prior to the separation, the Company effectuated certain reorganization transactions which were designed to consolidate the ownership of its hotels into its Operating Partnership, consolidate its TRS lessees in its TRS, facilitate its separation from InvenTrust, and enable the Company to qualify as a REIT for federal income tax purposes. The accompanying combined condensed consolidated financial statements prior to the spin-off have been "carved out" of InvenTrust’s consolidated financial statements and reflect significant assumptions and allocations. The combined condensed consolidated financial statements reflect the operations of the Company after giving effect to the reorganization transactions, the disposition of other hotels previously owned by the Company, and the spin-off, and
7
XENIA HOTELS & RESORTS, INC.
Notes to Combined Condensed Consolidated Financial Statements (unaudited)
March 31, 2016
include allocations of costs from certain corporate and shared functions provided to the Company by InvenTrust, as well as costs associated with participation by certain of the Company's executives in InvenTrust’s benefit plans. Corporate costs directly associated with the Company's principal executive offices, personnel and other administrative costs are reflected as general and administrative expenses on the combined condensed consolidated statements of operations and comprehensive loss. Additionally, prior to the spin-off, InvenTrust allocated to the Company a portion of its corporate overhead costs based upon the Company's percentage share of the average invested assets of InvenTrust, which is reflected in general and administrative expenses. Based on these presentation matters, the financial statements for the three months ended March 31, 2015 may not be comparable.
As InvenTrust was managing various asset portfolios, the extent of services and benefits a portfolio received was based on the size of its assets. Therefore, using average invested assets to allocate costs was a reasonable reflection of the services and other benefits received by the Company and complied with applicable accounting guidance. However, actual costs may have differed from allocated costs if the Company had operated as a stand-alone entity during such period and those differences may have been material.
Each property maintains its own books and financial records and each entity's assets are not available to satisfy the liabilities of other affiliated entities, except as otherwise disclosed in Note 7.
Use of Estimates
The preparation of the combined condensed consolidated financial statements in conformity with U.S. GAAP requires management to make estimates and assumptions that affect the reported amounts of assets and liabilities, disclosure of contingent assets and liabilities, and revenues and expenses. These estimates are prepared using management's best judgment, after considering past, current and expected economic conditions. Actual results could differ from these estimates.
Reclassifications and Revisions
Certain amounts in the 2015 financial statements have been reclassified to conform with the 2016 presentation.
Consolidation
The Company evaluates its investments in partially owned entities to determine whether such entities may be a variable interest entity ("VIE"). If the entity is a VIE, the determination of whether the Company is the primary beneficiary must be made. The primary beneficiary determination is based on a qualitative assessment as to whether the entity has (i) power to direct significant activities of the VIE and (ii) an obligation to absorb losses or the right to receive benefits that could be potentially significant to the VIE. The Company will consolidate a VIE if it is deemed to be the primary beneficiary, as defined in Financial Accounting Standards Board ("FASB") Accounting Standards Codification ("ASC") 810, Consolidation. The equity method of accounting is applied to entities in which the Company is not the primary beneficiary as defined in FASB ASC 810, or the entity is not a VIE and the Company does not have effective control, but can exercise influence over the entity with respect to its operations and major decisions.
On January 1, 2016, the Company adopted ASU 2015-02, Amendments to the Consolidation Analysis ("ASU 2015-02"), which amended the consolidation guidance for VIE's and general partner's investments in limited partnerships and modifies the evaluation of whether limited partnership and similar legal entities are VIEs or voting interest entities. Upon adoption of ASU 2015-02, the Company concluded there was no change required in the accounting of its two previously identified VIEs in our two investments in real estate entities and therefore will continue to consolidate these VIEs for reporting purposes, as further described in Note 5. However, the Company concluded that the Operating Partnership now meets the criteria as a VIE under ASU 2015-02. The Company's significant asset is its investment in the Operating Partnership, as described in Note 1, and consequently, substantially all of the Company's assets and liabilities represent those assets and liabilities of the Operating Partnership. All of the Company's debt is an obligation of the Operating Partnership. As such, there is no change in the presentation of the consolidated financial statements of the Company upon adoption of ASU 2015-02.
Impairment
The Company assesses the carrying values of the respective long-lived assets, whenever events or changes in circumstances indicate that the carrying amounts of these assets may not be fully recoverable, such as a reduction in the expected holding period of the asset or a change in demand for lodging at the Company's hotels. If it is determined that the carrying value is not recoverable because the undiscounted cash flows do not exceed carrying value, the Company records an impairment loss to the extent that the carrying value exceeds fair value. The valuation and possible subsequent impairment of investment properties is
8
XENIA HOTELS & RESORTS, INC.
Notes to Combined Condensed Consolidated Financial Statements (unaudited)
March 31, 2016
a significant estimate that can and does change based on the Company's continuous process of analyzing each property and reviewing assumptions about uncertain inherent factors, as well as the economic condition of the property at a particular point in time.
The use of projected future cash flows and related holding period is based on assumptions that are consistent with the estimates of future expectations and the strategic plan the Company uses to manage its underlying business. However, assumptions and estimates about future cash flows and capitalization rates are complex and subjective. Changes in economic and operating conditions and the Company’s ultimate investment intent that occur subsequent to the impairment analyses could impact these assumptions and result in future impairment charges of the real estate properties.
On a periodic basis, management assesses whether there are any indicators that the carrying value of the Company’s investments in unconsolidated entities may be other than temporarily impaired. To the extent impairment has occurred, the loss is measured as the excess of the carrying value of the investment over the fair value of the investment. The fair value of the underlying investment includes a review of expected discounted cash flows to be received from the investee.
Investment Properties Held for Sale
In determining whether to classify an investment property as held for sale, the Company considers whether: (i) management has committed to a plan to sell the investment property; (ii) the investment property is available for immediate sale, in its present condition; (iii) the Company is actively marketing the investment property for sale at a price that is reasonable in relation to its fair value; (iv) the Company has initiated a program to locate a buyer; (v) the Company believes that the sale of the investment property is probable; (vi) the Company has received a significant non-refundable deposit for the purchase of the property; (vii) actions required for the Company to complete the plan indicate that it is unlikely that any significant changes will be made to the plan.
If all of the above criteria are met, the Company classifies the investment property as held for sale. On the day that these criteria are met, the Company suspends depreciation and amortization on the investment properties held for sale. The investment properties and liabilities associated with those investment properties that are held for sale are classified separately on the combined condensed consolidated balance sheets for the most recent reporting period and recorded at the lesser of the carrying value or fair value less costs to sell. Additionally, if the sale constitutes a strategic shift with a major effect on operations, the operations are classified on the combined condensed consolidated statements of operations and comprehensive loss as discontinued operations for all periods presented.
Share-Based Compensation
The Company has adopted a share-based incentive plan that provides for the grant of stock options, stock awards, restricted stock units, Operating Partnership units and other equity-based awards. Share-based compensation is measured at the estimated fair value of the award on the date of grant, adjusted for forfeitures, and recognized as an expense on a straight-line basis over the longest vesting period for each grant for the entire award. The determination of fair value of these awards is subjective and involves significant estimates and assumptions including expected volatility of the Company's shares, expected dividend yield, expected term and assumptions of whether certain of these awards will achieve parity with other Operating Partnership units or achieve performance thresholds. Share-based compensation is included in general and administrative expenses in the accompanying combined condensed consolidated statements of operations and comprehensive loss and capitalized in building and other improvements in the combined condensed consolidated balance sheets for certain employees that manage property developments, renovations and capital improvements.
Recently Issued Accounting Pronouncements
In May 2014, the Financial Accounting Standards Board ("FASB") issued Accounting Standards Update ("ASU") No. 2014-09, Revenue from Contracts with Customers, which requires an entity to recognize the amount of revenue to which it expects to be entitled for the transfer of promised goods or services to customers. The ASU will replace most existing revenue recognition guidance in GAAP when it becomes effective, although it will not affect the accounting for rental related revenues. The new standard is effective for the Company on January 1, 2018, pursuant to ASU No. 2015-09 which deferred the adoption date by one year. Early adoption is permitted. The Company is evaluating the effect that ASU No. 2014-09 will have on its combined condensed consolidated financial statements and related disclosures. The Company has not yet selected a transition method and is still evaluating the effect of the standard on its ongoing financial reporting.
9
XENIA HOTELS & RESORTS, INC.
Notes to Combined Condensed Consolidated Financial Statements (unaudited)
March 31, 2016
In September 2015, the FASB issued ASU No. 2015-16, Simplifying the Accounting for Measurement-Period Adjustments, which eliminates the requirement for an acquirer in a business combination to account for measurement-period adjustments retrospectively. Instead, acquirers must recognize measurement-period adjustments during the period in which they determine the amounts, including the effect on earnings of any amounts that would have been recorded in previous periods if the accounting had been completed at the acquisition date. This update was effective for interim and annual periods beginning after December 15, 2015, with early adoption permitted. The implementation of ASU 2015-16 on January 1, 2016 had no material impact on the Company's combined condensed consolidated financial statements.
In November 2015, the FASB issued ASU 2015-17, Balance Sheet Classification of Deferred Taxes, which simplifies the presentation of deferred taxes by requiring that deferred tax assets and liabilities be presented as noncurrent on the balance sheet. The new standard is effective for the Company on January 1, 2017. Early adoption is permitted. The Company does not expect ASU No. 2015-17 to have a significant impact on its combined condensed consolidated financial statements and related disclosures.
In March 2016, the FASB issued ASU-2016-09, Improvements to Employee Share-Based Award Payment Accounting, which simplifies various aspects of how share-based payments are accounted for and presented in the financial statements. This standard requires companies to record all of the tax effects related to share-based payments through the income statement, allows companies to elect an accounting policy to either estimate the share based award forfeitures (and expense) or account for forfeitures (and expense) as they occur, and allows companies to withhold up to the maximum individual statutory tax rate the shares upon settlement of an award without causing the award to be classified as liability. This guidance is effective for the Company on January 1, 2017, however, early adoption is permitted. The Company does not expect ASU No. 2016-09 to have a significant impact on its combined condensed consolidated financial statements and related disclosures.
In February 2016, the FASB issued ASU 2016-02, Leases, which replaces ASC Topic 840, Leases, and requires most lessee leases to be recorded on the Company's balance sheet as either operating or financing leases with a right of use asset with a corresponding lease liability measured at present value. Operating leases will be recognized on the income statement on a straight-line basis as lease expense and financing leases will be accounted for similar to the accounting for amortizing debt. ASU 2016-02, allows lessors to capitalize only incremental initial direct leasing costs and will require only tenant payments for tax and insurance to be recognized as lease revenue. Leases with terms of less than 12 months will continue to be accounted for as they are under the current standard. The new standard is effective for the Company on January 1, 2019, with early adoption permitted. The Company is evaluating the effect that ASU 2016-02 will have on its combined condensed consolidated financial statements and related disclosures. The Company has not yet selected a transition method nor has it determined the effect of the standard on its ongoing financial reporting.
3. Acquired Properties
In January 2016, the Company acquired the Hotel Commonwealth located in Boston, Massachusetts for a purchase price of $136 million, excluding closing costs, which were expensed and included in acquisition costs on the combined condensed consolidated statement of operations for the three months ended March 31, 2016. The source of funding was from the $125 million term loan entered into by the Company as further described in Note 7, and a $20 million escrow deposit applied to the purchase price at closing. The hotel has a total of 245-rooms, which includes a 96-room hotel expansion that was completed in January 2016.
The Company records identifiable assets and liabilities, including intangibles, acquired in a business combination at fair value using significant other observable inputs (Level 2) including available market information and appropriate valuation methodologies available. The following reflects the purchase price allocation for the hotel acquired during the three months ended March 31, 2016 (in thousands):
March 31, 2016 | |||
Building and improvements | $ | 103,847 | |
Furniture, fixtures, and equipment | 10,238 | ||
Intangibles and other assets | 21,915 | ||
Total purchase price | $ | 136,000 | |
10
XENIA HOTELS & RESORTS, INC.
Notes to Combined Condensed Consolidated Financial Statements (unaudited)
March 31, 2016
For the property acquired during the three months ended March 31, 2016, total revenues and net loss from the date of acquisition through March 31, 2016 are included in the accompanying combined condensed consolidated statements of operations and comprehensive loss for the three months ended (in thousands):
March 31, 2016 | |||
Revenue | $ | 3,457 | |
Net loss (excluding acquisition costs) | $ | (924 | ) |
The following unaudited condensed pro forma financial information presents the results of operations as if the 2016 and 2015 acquisitions had taken place on January 1, 2015. The unaudited pro forma financial information is not necessarily indicative of what actual results of operations of the Company would have been assuming the 2016 and 2015 acquisitions had taken place on January 1, 2015, nor does it purport to represent the results of operations for future periods. The unaudited condensed proforma financial information is as follows (in thousands, except per share and per share data):
Three Months Ended March 31, | |||||||
2016 | 2015 | ||||||
Revenue | $ | 235,329 | $ | 240,490 | |||
Net loss attributable to common stockholders (1) | $ | (9,172 | ) | $ | (19,235 | ) | |
Net loss per share attributable to common stockholders - basic and diluted | $ | (0.08 | ) | $ | (0.17 | ) | |
Weighted average number of common shares - basic and diluted | 109,732,721 | 112,964,557 | |||||
(1) The pro forma results above exclude acquisition costs.
4. Disposed Properties
In November 2015, the Company entered into a purchase and sale agreement to sell the Hilton University of Florida Conference Center Gainesville hotel, at which time the hotel was determined to have met the held for sale criteria and was presented as assets and liabilities associated with assets held for sale on the Company's combined condensed consolidated balance sheet for all periods presented. In February 2016, the Company sold the Hilton University of Florida Conference Center Gainesville hotel for a sale price of $36 million and recognized a gain of $0.9 million. The Company received net proceeds of $30.9 million, and in conjunction with the sale repaid the $27.8 million outstanding property level mortgage.
Assets and Liabilities Held for Sale
In January 2016, the Company entered into a purchase and sale agreement to sell the DoubleTree by Hilton Hotel Washington DC for a sale price of $65 million, excluding closing costs. The sale of the hotel closed in April 2016.
In February 2016, the Company entered into a purchase and sale agreement to sell the Embassy Suites Baltimore North/Hunt Valley for a sale price of $20 million, excluding closing costs. The sale of the hotel closed in May 2016. As a result of the negotiated sales price, the Company recorded an impairment charge during the three months ended March 31, 2016 of $7.6 million.
During the three months ended March 31, 2016, the Company determined each of the hotels met the held for sale criteria in accordance with its accounting policy, and presented these hotels as assets and liabilities associated with assets held for sale on the Company's combined condensed consolidated balance sheets for all periods presented.
11
XENIA HOTELS & RESORTS, INC.
Notes to Combined Condensed Consolidated Financial Statements (unaudited)
March 31, 2016
The major classes of assets and liabilities associated with assets held for sale as of March 31, 2016 and December 31, 2015 are as follows (in thousands):
March 31, 2016 | December 31, 2015 | |||||||
Land | $ | 27,611 | $ | 28,287 | ||||
Building and other improvements | 97,664 | 161,396 | ||||||
Total | $ | 125,275 | $ | 189,683 | ||||
Less accumulated depreciation | (41,947 | ) | (63,617 | ) | ||||
Net investment properties | $ | 83,328 | $ | 126,066 | ||||
Restricted cash and escrows | — | 305 | ||||||
Accounts and rents receivable, net | 689 | 536 | ||||||
Deferred costs and other assets | 999 | 1,527 | ||||||
Total assets held for sale | $ | 85,016 | $ | 128,434 | ||||
Debt | $ | — | $ | 27,775 | ||||
Accounts payable and accrued expenses | 1,372 | 2,267 | ||||||
Other liabilities | 283 | 368 | ||||||
Total liabilities of assets held for sale | $ | 1,655 | $ | 30,410 | ||||
The operating results of the three hotels sold or held for sale during three months ended March 31, 2016 are included in the Company's combined condensed consolidated financial statements as part of continuing operations in accordance with ASU No. 2014-08 Reporting Discontinued Operations and Disclosures of Disposals of Components of an Entity ("ASU 2014-08"), as they did not represent a strategic shift or have a major effect on the Company's results of operations. The assets and liabilities of the three hotels are included in assets and liabilities associated with assets held for sale at the lesser of their respective net carrying value or their fair value, less estimated selling costs, on the accompanying combined condensed consolidated balance sheets as of March 31, 2016 and December 31, 2015.
Discontinued Operations
In November 2014, 52 lodging properties were sold by InvenTrust (the "Suburban Select Service Portfolio"), which were properties previously overseen by the Company. This disposition represented a strategic shift and had a major effect on the Company's results of operations. Accordingly, the results of operations of these 52 lodging properties were presented as discontinued operations pursuant to ASU 2014-08. During early 2015, $489 thousand in carryover costs related to the Suburban Select Service Portfolio were incurred and have been presented as discontinued operations for the three months ended March 31, 2015.
5. Investment in Real Estate Entities
Consolidated Entities
During 2013, the Company entered into two investments in real estate entities in order to develop the Grand Bohemian Hotel Charleston and the Grand Bohemian Hotel Mountain Brook. The Company has ownership interests of 75% in each real estate entity. These entities are considered VIE's as defined in ASU 2015-02 because the entities did not have enough equity to finance their activities without additional subordinated financial support. The Company determined that it has the power to direct the activities of the VIE's that most significantly impact the VIE's economic performance, as well as the obligation to absorb losses of the VIE's that could potentially be significant to the Company, or the right to receive benefits from the VIE's that could potentially be significant to the Company. As such, the Company has a controlling financial interest and is considered the primary beneficiary of each of these entities. Therefore, these entities are consolidated by the Company.
12
XENIA HOTELS & RESORTS, INC.
Notes to Combined Condensed Consolidated Financial Statements (unaudited)
March 31, 2016
The following are the liabilities of the consolidated VIE's, which are non-recourse to the Company, and the assets that can be used to settle those obligations (in thousands):
March 31, 2016 | December 31, 2015 | ||||||
Net investment properties | $ | 73,695 | $ | 74,592 | |||
Other assets | 3,234 | 2,548 | |||||
Total assets | $ | 76,929 | $ | 77,140 | |||
Mortgages, notes and margins payable | (46,200 | ) | (45,734 | ) | |||
Other liabilities | (2,415 | ) | (2,848 | ) | |||
Total liabilities | $ | (48,615 | ) | $ | (48,582 | ) | |
Net assets | $ | 28,314 | $ | 28,558 | |||
In August 2015, the Grand Bohemian Hotel Charleston began operations as a 50-room boutique lifestyle hotel. The total development cost of the property was $32 million. In October 2015, the Grand Bohemian Hotel Mountain Brook began operations as a 100-room boutique lifestyle hotel. The total development cost of the property was $45 million.
All operations of the two hotels for the three months ended March 31, 2016 were consolidated in the accompanying combined condensed consolidated statements of operations and comprehensive loss, with a corresponding allocation for non-controlling interests.
6. Transactions with Related Parties
The following table summarizes the Company’s related party transactions (in thousands):
Three Months Ended March 31, 2015 | |||
General and administrative allocation (a) | $ | 1,135 | |
Transition services fees (b) | 255 | ||
(a) | General and administrative allocations include costs from certain corporate and shared functions provided to the Company by InvenTrust, as well as costs associated with participation by certain of the Company's executives in InvenTrust's benefit plans. InvenTrust allocated to the Company a portion of its corporate overhead costs which was based upon the Company's percentage share of the average invested assets of InvenTrust. As InvenTrust was managing various asset portfolios, the extent of services and benefits a portfolio received was based on the size of its assets. Therefore, using average invested assets to allocate costs was a reasonable reflection of the services and other benefits received by the Company and complied with applicable accounting guidance. However, actual costs may have differed from allocated costs if the Company had operated as a stand-alone entity during such period and those differences may have been material. Following the spin-off, the Company was not allocated any further general and administrative expenses. |
(b) | In connection with the Company's separation from InvenTrust, the Company entered into a transition services agreement with InvenTrust under which InvenTrust has agreed to provide certain transition services to the Company, including services related to information technology systems, financial reporting and accounting and legal services. The expiration date varied by service provided and the agreement terminates on the earlier of March 31, 2016 or the termination of the last service provided under it. In June 2015, the Company terminated all fee-based services provided under the transition services agreement effective July 31, 2015, and thereafter, no additional fees are expected to be incurred for services provided by InvenTrust. |
As of March 31, 2016 and December 31, 2015, the Company owed $1.7 million and $2.6 million, respectively, to InvenTrust which is included in other liabilities in the combined condensed consolidated balance sheets. As of March 31, 2016, the amount due to InvenTrust was for other taxes paid by InvenTrust on behalf of the Company. As of December 31, 2015, the amount due to InvenTrust was related to purchases of furniture, fixtures and equipment funded by InvenTrust and to taxes paid by InvenTrust on behalf of the Company.
13
XENIA HOTELS & RESORTS, INC.
Notes to Combined Condensed Consolidated Financial Statements (unaudited)
March 31, 2016
7. Debt
Mortgages Payable
Debt as of March 31, 2016 and December 31, 2015 consisted of the following (dollar amounts in thousands):
Balance Outstanding as of | ||||||||||||||
Rate Type | Rate(1) | Maturity Date | March 31, 2016 | December 31, 2015 | ||||||||||
Mortgage Loans | ||||||||||||||
Renaissance Atlanta Waverly Hotel & Convention Center | Fixed | 5.50 | % | 12/6/2016 | $ | 97,000 | $ | 97,000 | ||||||
Renaissance Austin Hotel | Fixed | 5.51 | % | 12/8/2016 | 83,000 | 83,000 | ||||||||
Courtyard Pittsburgh Downtown | Fixed | 4.00 | % | 3/1/2017 | 22,437 | 22,607 | ||||||||
Marriott Griffin Gate Resort & Spa(2) | Variable | 2.94 | % | 3/23/2017 | 34,192 | 34,374 | ||||||||
Courtyard Birmingham Downtown at UAB | Fixed | 5.25 | % | 4/1/2017 | 13,276 | 13,353 | ||||||||
Hilton University of Florida Conference Center Gainesville(3) | Fixed | 6.46 | % | 2/1/2018 | — | 27,775 | ||||||||
Fairmont Dallas | Variable | 2.44 | % | 4/10/2018 | 56,041 | 56,217 | ||||||||
Residence Inn Denver City Center | Variable | 2.69 | % | 4/17/2018 | 45,210 | 45,210 | ||||||||
Marriott Dallas City Center | Variable | 2.69 | % | 5/24/2018 | 40,090 | 40,090 | ||||||||
Bohemian Hotel Savannah Riverfront | Variable | 2.79 | % | 12/17/2018 | 27,480 | 27,480 | ||||||||
Andaz Savannah | Variable | 2.44 | % | 1/14/2019 | 21,500 | 21,500 | ||||||||
Hotel Monaco Denver | Variable | 2.54 | % | 1/17/2019 | 41,000 | 41,000 | ||||||||
Hotel Monaco Chicago | Variable | 2.69 | % | 1/17/2019 | 26,000 | 26,000 | ||||||||
Hyatt Regency Santa Clara | Variable | 2.44 | % | 1/20/2019 | 60,200 | 60,200 | ||||||||
Loews New Orleans Hotel | Variable | 2.79 | % | 2/22/2019 | 37,500 | 37,500 | ||||||||
Andaz Napa | Variable | 2.54 | % | 3/21/2019 | 38,000 | 38,000 | ||||||||
Westin Galleria & Oaks Houston | Variable | 2.94 | % | 5/1/2019 | 110,000 | 110,000 | ||||||||
Marriott Charleston Town Center | Fixed | 3.85 | % | 7/1/2020 | 16,760 | 16,877 | ||||||||
Grand Bohemian Hotel Charleston (JV) | Variable | 2.95 | % | 11/10/2020 | 19,950 | 19,950 | ||||||||
Grand Bohemian Hotel Mountain Brook (JV) | Variable | 2.94 | % | 12/27/2020 | 26,250 | 25,784 | ||||||||
Hotel Palomar Philadelphia(4) | Hedged(8) | 4.14 | % | 1/13/2023 | 60,000 | — | ||||||||
Residence Inn Boston Cambridge | Fixed | 4.48 | % | 10/28/2025 | 63,000 | 63,000 | ||||||||
Grand Bohemian Hotel Orlando(5) | Fixed | 4.53 | % | 3/1/2026 | 60,000 | 49,360 | ||||||||
Total Mortgage Loans | 3.60 | % | (6) | $ | 998,886 | $ | 956,277 | |||||||
Mortgage Loan Premium / (Discounts)(7) | — | — | — | (842 | ) | (661 | ) | |||||||
Unamortized Deferred Financing Costs | — | — | — | (8,035 | ) | (8,305 | ) | |||||||
Senior Unsecured Credit Facility | Variable | 2.19 | % | 2/3/2019 | — | — | ||||||||
Term Loan $175M | Hedged(8) | 2.89 | % | 2/15/2021 | 175,000 | 175,000 | ||||||||
Term Loan $125M(9) | Hedged(8) | 3.73 | % | 10/22/2022 | 125,000 | — | ||||||||
Total Debt, net(3) | 3.52 | % | (6) | $ | 1,290,009 | $ | 1,122,311 | |||||||
(1) | Variable index is one month LIBOR. |
(2) | In March 2016, the Company elected to exercise its rights under the terms of the mortgage loan to extend the maturity date to March 23, 2017. |
(3) | The hotel was sold in February 2016, and the related debt was paid off with proceeds from the sale. The $27.8 million balance of the mortgage was included in liabilities associated with assets held for sale as of December 31, 2015. |
(4) | In January 2016, the Company entered into a $60 million mortgage loan with an interest rate of LIBOR plus 260 basis points, maturing in January 2023. Simultaneously with the closing of the mortgage loan, the Company entered into an interest rate swap to fix LIBOR at 1.54% for the entire term of the loan, for a combined rate of 4.14% as of March 31, 2016. |
(5) | In February 2016, the Company refinanced the mortgage with a new loan bearing a 4.53% fixed interest rate and March 2026 maturity. Additional proceeds |
14
XENIA HOTELS & RESORTS, INC.
Notes to Combined Condensed Consolidated Financial Statements (unaudited)
March 31, 2016
of approximately $11 million were received under the refinanced terms of the mortgage, which increased the principal of the loan from approximately $49 million to $60 million.
(6) | Weighted average interest rate as of March 31, 2016. |
(7) | Loan premiums/(discounts) on assumed mortgages recorded in purchase accounting. |
(8) | LIBOR has been fixed over the life of the loan. |
(9) | Funded $125 million in January 2016 in connection with the acquisition of the Hotel Commonwealth. |
In connection with repaying and refinancing mortgage loans during the three months ended March 31, 2016, the Company incurred prepayment and extinguishment fees of approximately $4.8 million which is included in the loss on extinguishment of debt in the accompanying combined condensed consolidated statements of operations and comprehensive loss for the year ended March 31, 2016. The loss from extinguishment of debt represents the write off of unamortized deferred financing costs incurred when the original agreements were executed as well as loan premiums or discounts and termination penalty payments.
Debt outstanding as of March 31, 2016 and December 31, 2015 were $1,299 million and $1,131 million and had a weighted average interest rate of 3.52% and 3.51% per annum, respectively. Mortgage premiums and discounts was a net $0.8 million and $0.7 million as of March 31, 2016 and December 31, 2015, respectively. The following table shows scheduled debt maturities for the next five years and thereafter (in thousands):
As of March 31, 2016 | Weighted average interest rate | |||||
2016 | $ | 180,000 | 5.50% | |||
2017 | 69,905 | 3.72% | ||||
2018 | 168,821 | 2.62% | ||||
2019 | 334,200 | 2.69% | ||||
2020 | 62,960 | 3.19% | ||||
Thereafter | 483,000 | 3.67% | ||||
Total Debt | 1,298,886 | 3.52% | ||||
Total mortgage premiums and discounts, net | (842 | ) | — | |||
Unamortized deferred financing costs | (8,035 | ) | — | |||
Total Debt, net of loan discounts, premiums and unamortized deferred financing costs | $ | 1,290,009 | 3.52% | |||
Of the total outstanding debt at March 31, 2016, approximately $23.1 million is recourse to the Company. Certain loans have options to extend the maturity dates if exercised by the Company, subject to being compliant with certain covenants and the prepayment of an extension fee. Some of the mortgage loans require compliance with certain covenants, such as debt service coverage ratios, investment restrictions and distribution limitations. As of March 31, 2016, the Company was in compliance with all such covenants.
Senior Unsecured Credit Facility
Prior to the consummation of the spin-off transaction, the Company was allocated $96 million of InvenTrust's revolving credit facility. Effective February 3, 2015, this allocation was terminated and the Company entered into a new $400 million senior unsecured credit facility with a syndicate of banks. The new revolving credit facility includes an uncommitted accordion feature which, subject to certain conditions, allows the Company to increase the aggregate availability by up to an additional $350 million. Borrowings under the revolving credit facility bear interest based on LIBOR plus a margin ranging from 1.50% to 2.45% (or, at the Company's election upon achievement of an investment grade rating from Moody’s Investor Services, Inc. or Standard & Poor’s Rating Services, interest based on LIBOR plus a margin ranging from 0.875% to 1.50%). In addition, until such election, the Company expects to pay an unused commitment fee of up to 0.30% of the unused portion of the credit facility based on the average daily unused portion of the credit facility; thereafter, the Company expects to pay a facility fee ranging between 0.125% and 0.35% based on the Company's debt rating.
As of March 31, 2016, there was no outstanding balance on the senior unsecured facility and during the three months ended March 31, 2016 the Company incurred unused fees of approximately $0.3 million.
15
XENIA HOTELS & RESORTS, INC.
Notes to Combined Condensed Consolidated Financial Statements (unaudited)
March 31, 2016
8. Derivatives
The Company primarily uses interest rate swaps as part of its interest rate risk management strategy. For derivative instruments designated as cash flow hedges, unrealized gains and losses on the effective portion are reported in accumulated other comprehensive income (loss), a component of stockholders’ equity. Unrealized gains and losses on the ineffective portion of all designated hedges are recognized in earnings in the current period. At March 31, 2016, all derivative instruments were designated as cash flow hedges.
At March 31, 2016, the aggregate fair value of interest rate swap liabilities of $7.9 million was included in other liabilities in the accompanying combined condensed consolidated balance sheet. For the three months ended March 31, 2016 and 2015, the Company had an unrealized loss of $9.4 million and $0 million, respectively, that is included in the combined condensed consolidated statements of operations and comprehensive loss. The Company did not reclass any amounts out of comprehensive loss to net loss during the three months ended March 31, 2016.
The following table summarizes the terms of the derivative financial instruments held by the Company and the liability that has been recorded as of March 31, 2016 and December 31, 2015 (in thousands)(1):
Estimated Fair Value | ||||||||||||||||||||||
Hedged Debt | Type | Fixed Rate | Index | Effective Date | Maturity | Notional Amounts | March 31, 2016 | December 31, 2015 | ||||||||||||||
$175M Term Loan | Swap | 1.30% | 1-Month LIBOR + 1.50% | 10/22/2015 | 2/15/2021 | $ | 50,000 | $ | (638 | ) | $ | 604 | ||||||||||
$175M Term Loan | Swap | 1.29% | 1-Month LIBOR + 1.50% | 10/22/2015 | 2/15/2021 | 65,000 | (797 | ) | 817 | |||||||||||||
$175M Term Loan | Swap | 1.29% | 1-Month LIBOR + 1.50% | 10/22/2015 | 2/15/2021 | 60,000 | (737 | ) | 754 | |||||||||||||
$125M Term Loan | Swap | 1.83% | 1-Month LIBOR + 1.80% | 1/15/2016 | 10/22/2022 | 50,000 | (1,827 | ) | (229 | ) | ||||||||||||
$125M Term Loan | Swap | 1.83% | 1-Month LIBOR + 1.80% | 1/15/2016 | 10/22/2022 | 25,000 | (940 | ) | (145 | ) | ||||||||||||
$125M Term Loan | Swap | 1.84% | 1-Month LIBOR + 1.80% | 1/15/2016 | 10/22/2022 | 25,000 | (930 | ) | (126 | ) | ||||||||||||
$125M Term Loan | Swap | 1.83% | 1-Month LIBOR + 1.80% | 1/15/2016 | 10/22/2022 | 25,000 | (930 | ) | (132 | ) | ||||||||||||
Mortgage Debt | Swap | 1.54% | 1-Month LIBOR + 2.60% | 1/13/2016 | 1/13/2023 | 60,000 | (1,092 | ) | — | |||||||||||||
$ | 360,000 | $ | (7,891 | ) | $ | 1,543 | ||||||||||||||||
(1) | There were no amounts recognized in earnings related to hedge ineffectiveness or amounts excluded from hedge ineffectiveness testing during the three months ended March 31, 2016. |
9. Fair Value Measurements
In accordance with FASB ASC 820, Fair Value Measurement and Disclosures, the Company defines fair value based on the price that would be received upon sale of an asset or the exit price that would be paid to transfer a liability in an orderly transaction between market participants at the measurement date. The Company uses a fair value hierarchy that prioritizes observable and unobservable inputs used to measure fair value. The fair value hierarchy consists of three broad levels, which are described below:
• | Level 1 - Quoted prices for identical assets or liabilities in active markets that the entity has the ability to access. |
• | Level 2 - Observable inputs, other than quoted prices included in Level 1, such as quoted prices for similar assets and liabilities in active markets; quoted prices for identical or similar assets and liabilities in markets that are not active; or other inputs that are observable or can be corroborated by observable market data. |
• | Level 3 - Unobservable inputs that are supported by little or no market activity and that are significant to the fair value of the assets and liabilities. This includes certain pricing models, discounted cash flow methodologies and similar techniques that use significant unobservable inputs. |
The Company has estimated the fair value of its financial and non-financial instruments using available market information and valuation methodologies it believes to be appropriate for these purposes. Considerable judgment and a high degree of subjectivity are involved in developing these estimates and, accordingly, they are not necessarily indicative of amounts that would be realized upon disposition.
16
XENIA HOTELS & RESORTS, INC.
Notes to Combined Condensed Consolidated Financial Statements (unaudited)
March 31, 2016
Recurring Measurements
For assets and liabilities measured at fair value on a recurring basis, quantitative disclosure of their fair value is as follows (in thousands):
Fair Value Measurement Date | ||||
March 31, 2016 | ||||
Description | Significant Unobservable Inputs (Level 2) | |||
Liabilities | ||||
Interest rate swaps | (7,891 | ) | ||
Total | $ | (7,891 | ) | |
The fair value of each derivative instrument is based on a discounted cash flow analysis of the expected cash flows under each arrangement. This analysis reflects the contractual terms of the derivative instrument, including the period to maturity, and utilizes observable market-based inputs, including interest rate curves and implied volatilities, which are classified within level 2 of the fair value hierarchy. The Company also incorporates credit value adjustments to appropriately reflect each parties’ nonperformance risk in the fair value measurement, which utilizes level 3 inputs such as estimates of current credit spreads. However, the Company has assessed that the credit valuation adjustments are not significant to the overall valuation of the derivatives. As a result, the Company has determined that its derivative valuations in their entirety are classified within level 2 of the fair value hierarchy.
Non-Recurring Measurements
Investment Properties
During the three months ended March 31, 2016, the Company identified one hotel property that had a reduction in its expected holding period and reviewed the probability of the asset's disposition. The Company recorded an impairment of investment properties of $7.6 million related to hotel property for the three months ended March 31, 2016 based on the estimated fair value using purchase contracts and average selling costs. The property was subsequently sold in May 2016. No impairments were recorded for the three months ended March 31, 2015.
The following table summarizes activity for the Company’s assets measured at fair value on a non-recurring basis as of March 31, 2016 and 2015, respectively (in thousands):
Fair Value at Measurement Date Using | ||||||||
March 31, 2016 | March 31, 2015 | |||||||
Significant Unobservable Inputs (Level 3) | Significant Unobservable Inputs (Level 3) | |||||||
Investment property | $ | 19,749 | $ | — | ||||
Total | $ | 19,749 | $ | — | ||||
Financial Instruments Not Measured at Fair Value
The table below represents the fair value of financial instruments presented at carrying values in the combined condensed consolidated financial statements as of March 31, 2016 and December 31, 2015 (in thousands):
March 31, 2016 | December 31, 2015 | |||||||||||||||
Carrying Value | Estimated Fair Value | Carrying Value | Estimated Fair Value | |||||||||||||
Mortgages payable | $ | 1,298,044 | $ | 1,299,867 | $ | 1,130,616 | $ | 1,137,149 | ||||||||
Total | $ | 1,298,044 | $ | 1,299,867 | $ | 1,130,616 | $ | 1,137,149 | ||||||||
17
XENIA HOTELS & RESORTS, INC.
Notes to Combined Condensed Consolidated Financial Statements (unaudited)
March 31, 2016
The Company estimates the fair value of its mortgages payable using a weighted average effective interest rate of 3.25% and 3.48% per annum as of March 31, 2016 and December 31, 2015, respectively. As of March 31, 2016, the fair value estimate of the unsecured term loan and the fair value estimate of the unsecured credit facility approximated their carrying value. The assumptions reflect the terms currently available on similar borrowing terms to borrowers with credit profiles similar to the Company's. The Company has determined that its debt instrument valuations are classified in Level 2 of the fair value hierarchy.
10. Income Taxes
The Company intends to operate in a manner that will allow the Company to qualify as a REIT under the Internal Revenue Code of 1986, as amended. To qualify as a REIT, the Company cannot operate or manage its hotels. So long as the Company qualifies for taxation as a REIT, it generally will not be subject to federal income tax on taxable income that is currently distributed to its stockholders. A REIT is subject to a number of organizational and operational requirements, including a requirement that it currently distribute at least 90% of its REIT taxable income (subject to certain adjustments) to its stockholders. If the Company fails to qualify as a REIT in any taxable year, without the benefit of certain relief provisions, the Company will be subject to federal, state and local income tax on its taxable income at regular corporate tax rates and will not be eligible to re-elect REIT status during the four years following the failure. Even if the Company qualifies for taxation as a REIT, the Company may be subject to certain state and local taxes on its income, property or net worth and federal income and excise taxes on its undistributed income.
Accordingly, the Company, through its Operating Partnership, leases all of its hotels to subsidiaries of its TRS. The TRS is subject to federal, state and local income tax at regular corporate rates. Lease revenue at the REIT landlord subsidiaries and lease expense at the TRS lessees are eliminated in consolidation for financial statement purposes.
The Company estimated the TRS income tax expense for the three months ended March 31, 2016 using an estimated combined federal and state statutory tax rate of 39.47% and recognized income tax expense of $3.7 million.
During the three months ended March 31, 2015, the Company recognized income tax expense of $5.1 million, of which $2.9 million related to taxes on a one-time gain on the transfer of a hotel resulting in a more optimal structure in connection with the Company's intention to be taxed as a REIT. The Company's effective tax rate differed from the federal statutory rate predominately due to the dividends paid deduction, state income taxes, and changes to valuation allowances.
11. Stockholders' Equity
Common Shares
On February 4, 2015, in conjunction with the listing of the Company's Common Stock on the NYSE, the Company commenced a modified “Dutch Auction” self-tender offer (the “Tender Offer”) to purchase for cash up to $125 million in value of shares of the Company’s Common Stock at a price not greater than $21.00 nor less than $19.00 per share, net to the seller in cash, less any applicable withholding of taxes and without interest. The Tender Offer expired on March 5, 2015. As a result of the Tender Offer, the Company accepted for purchase 1,759,344 shares of its Common Stock at a purchase price of $21.00 per share, for an aggregate purchase price of $36.9 million (excluding fees and expenses relating to the Tender Offer), which was funded from cash on hand. The 1,759,344 shares of Common Stock accepted for purchase in the Tender Offer represented approximately 1.6% of the Company’s Common Stock outstanding as of February 3, 2015, the last day prior to the commencement of the Tender Offer. Stockholders who properly tendered and did not properly withdraw shares of Common Stock in the Tender Offer at or below the final purchase price of $21.00 per share had all of their tendered shares of Common Stock purchased by the Company at $21.00 per share.
Stock Repurchase Program
In December 2015, the Company’s Board of Directors authorized a stock repurchase program (the "Repurchase Program") pursuant to which we are authorized to purchase up to $100 million of the Company’s outstanding Common Stock, in the open market, in privately negotiated transactions or otherwise, including pursuant to Rule 10b5-1 plans. The Repurchase Program does not have an expiration date. The Company is not obligated to repurchase any dollar amount or any number of shares of common stock, and repurchases may be suspended or discontinued at any time. For the three months ended March 31, 2016, 3,390,500 shares had been repurchased under the Repurchase Program, at a weighted average price of $14.54 per share for an aggregate purchase price of $49.3 million. As of March 31, 2016, the Company had approximately $50.7 million remaining under its share repurchase authorization.
18
XENIA HOTELS & RESORTS, INC.
Notes to Combined Condensed Consolidated Financial Statements (unaudited)
March 31, 2016
Distributions
Common Stock
The Company paid the following dividends on Common Stock during the three months ended March 31, 2016:
Dividend per Share/Unit | For the Quarter Ended | Record Date | Payable Date | |||
$0.275 | March 31, 2016 | March 31, 2016 | April 15, 2016 | |||
Non-Controlling Interest of Common Units in Operating Partnership
As of March 31, 2016, the Operating Partnership had 1,221,555 long-term incentive partnership units (“LTIP units”) outstanding, representing a 1.1% partnership interest held by the limited partners. Of the 1,221,555 LTIP units outstanding at March 31, 2016, 85,066 units had vested. Only vested LTIP units may be converted to common units of the Operating Partnership, which in turn can be tendered for redemption as described in Note 13.
As of March 31, 2016, the Company accrued $82 thousand in dividends related to the LTIP units, which were paid in April 2016.
12. Earnings Per Share
Basic earnings per common share is calculated by dividing income or loss available to common stockholders by the weighted-average number of common shares outstanding during the period. Diluted earnings per common share is calculated by dividing income or loss available to common stockholders by the weighted-average number of common shares outstanding during the period, plus any shares that could potentially be outstanding during the period. Any anti-dilutive shares have been excluded from the diluted earnings per share calculation. Unvested share-based awards that contain nonforfeitable rights to dividends or dividend equivalents (whether paid or unpaid) are participating securities and are included in the computation of earnings per share pursuant to the two-class method. Accordingly, distributed and undistributed earnings attributable to unvested share-based compensation (participating securities) have been excluded, as applicable, from net income or loss available to common stockholders used in the basic and diluted earnings per share calculations. Net income or loss figures are presented net of non-controlling interests in the earnings per share calculations.
The following table reconciles net loss to basic and diluted EPS (in thousands, except share and per share data):
Three Months Ended March 31, | |||||||
2016 | 2015 | ||||||
Numerator: | |||||||
Net loss from continuing operations | $ | (9,169 | ) | $ | (14,377 | ) | |
Net loss attributable to non-controlling interests | 254 | — | |||||
Dividends, unvested share-based compensation | (110 | ) | — | ||||
Net loss from continuing operations available to common stockholders | (9,025 | ) | (14,377 | ) | |||
Net loss from discontinued operations, net of tax | — | (489 | ) | ||||
Net loss available to common stockholders | $ | (9,025 | ) | $ | (14,866 | ) | |
Denominator: | |||||||
Weighted average shares outstanding - Basic and Diluted | 109,732,721 | 112,964,557 | |||||
Basic and diluted earnings per share: | |||||||
Loss from continuing operations | $ | (0.08 | ) | $ | (0.13 | ) | |
Loss from discontinued operations, net of tax | $ | — | $ | — | |||
Net loss per share | $ | (0.08 | ) | $ | (0.13 | ) | |
Total weighted average shares for the three months ended March 31, 2016 excludes 387,946 Restricted Stock Units and LTIP Units because the resulting effect would have been anti-dilutive.
19
XENIA HOTELS & RESORTS, INC.
Notes to Combined Condensed Consolidated Financial Statements (unaudited)
March 31, 2016
13. Share Based Compensation
2014 Share Unit Plan
On September 17, 2014, the board of directors of InvenTrust and the Company’s Board of Directors adopted and ratified the Xenia Hotels & Resorts, Inc. 2014 Share Unit Plan (the "2014 Share Unit Plan"). The 2014 Share Unit Plan provided for the grant of notional "share unit" awards to eligible participants. Refer to Exhibit 99.1 of the Company's Registration Statement on Form 10, filed on January 9, 2015, as amended, for additional information regarding the 2014 Share Unit Plan. The 2015 Incentive Award Plan, as defined below, replaced the 2014 Share Unit Plan in connection with the Company’s separation from InvenTrust, and the 2014 Share Unit Plan was terminated in connection with the implementation of the 2015 Incentive Award Plan. Awards outstanding under the 2014 Share Unit Plan at the time of its termination will remain outstanding in accordance with their terms, and the terms and conditions of the 2014 Share Unit Plan will continue to govern such awards.
2015 Incentive Award Plan
On January 9, 2015, the Company adopted, and InvenTrust as its sole common stockholder approved, the Company's 2015 Incentive Award Plan (the "2015 Incentive Award Plan") effective as of February 2, 2015 (the date prior to the date of the Company's separation from InvenTrust), under which the Company may grant cash and equity incentive awards to eligible service providers in order to attract, motivate and retain the talent for which the Company competes. Refer to Exhibit 99.1 of the Company's Registration Statement on Form 10, filed on January 9, 2015, as amended, for additional information regarding the 2015 Incentive Award Plan. The plan allows for the grant of both share-based awards relating to the Company's Common Stock and partnership units ("LTIP units") in the Operating Partnership.
Restricted Stock Units
In March 2016, the Compensation Committee ("the Compensation Committee") of the Board of Directors of the Company granted share units to certain Company employees (the "2016 Restricted Stock Units"). The 2016 Restricted Stock Units include 104,079 restricted stock units that are time-based and vest over a three year period and 51,782 restricted stock units that are performance-based. Both the time-based and performance-based units are subject to continued employment and have a weighted average grant date fair value of $13.09 per share.
Each time-based 2016 Restricted Stock Unit will vest as follows, subject to the employee’s continued service through each applicable vesting date: 33% on February 4, 2017, which is the first anniversary of the vesting commencement date of the award (February 4, 2016), 33% on the second anniversary of the vesting commencement date, and 34% on the third anniversary of the vesting commencement date.
Of the performance-based 2016 Restricted Stock Units, twenty-five percent (25%) are designated as absolute total stockholder return ("TSR") units (the "Absolute TSR Share Units"), and vest based on varying levels of the Company’s TSR over the defined performance period. The other seventy-five percent (75%) of the performance-based 2016 Restricted Stock Units are designated as relative TSR share units (the "Relative TSR Share Units") and vest based on the ranking of the Company’s TSR as compared to its defined peer group over the defined performance period.
LTIP Unit Grants
LTIP Units are a class of limited partnership units in the Operating Partnership. Initially the LTIP Units do not have full parity with common units of the Operating Partnership with respect to liquidating distributions. However, upon the occurrence of certain events described in the Operating Partnership's partnership agreement, the LTIP Units can over time achieve full parity with the common units for all purposes. If such parity is reached, vested LTIP Units may be converted into an equal number of common units on a one for one basis at any time at the request of the LTIP Unit holder or the general partner of the Operating Partnership. Common units are redeemable for cash based on the fair market value of an equivalent number of shares of the Company’s Common Stock, or, at the election of the Company, an equal number of shares of the Company’s Common Stock, each subject to adjustment in the event of stock splits, specified extraordinary distributions or similar events.
In March 2016, the Compensation Committee approved the issuance of 664,515 performance-based LTIP Units (the "2016 Class A LTIP Units") and 78,076 time-based LTIP Units (the "2016 Time-Based LTIP Units") of the Operating Partnership under the 2015 Incentive Award Plan that had a weighted average grant date fair value of $7.86 per unit.
Each award of Time-Based LTIP Units will vest as follows, subject to the executive’s continued service through each applicable vesting date: 33% on February 4, 2017, which is the first anniversary of the vesting commencement date of the award
20
XENIA HOTELS & RESORTS, INC.
Notes to Combined Condensed Consolidated Financial Statements (unaudited)
March 31, 2016
(February 4, 2016), 33% on the second anniversary of the vesting commencement date, and 34% on the third anniversary of the vesting commencement date.
A portion of each award of Class A LTIP Units is designated as a number of “base units.” Twenty-five percent (25%) of the base units are designated as absolute TSR base units, and vest based on varying levels of the Company’s TSR over the defined performance period. The other seventy-five percent (75%) of the base units are designated as relative TSR base units and vest based on the ranking of the Company’s TSR as compared to its defined peer group over the defined performance period.
LTIP Units (other than Class A LTIP Units that have not vested), whether vested or not, receive the same quarterly per-unit distributions as common units in the Operating Partnership, which equal the per-share distributions on the Common Stock of the Company. Class A LTIP Units that have not vested receive a quarterly per-unit distribution equal to 10% of the distribution paid on common units in the Operating Partnership.
The following is a summary of the non-vested incentive awards under the 2014 Share Unit Plan and the 2015 Incentive Award Plan as of March 31, 2016:
2014 Share Unit Plan Share Units | 2015 Incentive Award Plan Restricted Stock Units(1) | 2015 Incentive Award Plan LTIP Units(1) | Total | ||||||||||||
Outstanding as of January 1, 2016 | 342,219 | 84,701 | 498,049 | 924,969 | |||||||||||
Granted | — | 155,861 | 742,591 | 898,452 | |||||||||||
Vested | (94,685 | ) | (22,331 | ) | (61,665 | ) | (178,681 | ) | |||||||
Expired | — | — | (42,486 | ) | (42,486 | ) | |||||||||
Forfeited | — | — | — | — | |||||||||||
Outstanding as of March 31, 2016 | 247,534 | 218,231 | 1,136,489 | 1,602,254 | |||||||||||
Vested as of March 31, 2016 | 103,662 | 22,331 | 85,066 | 211,059 | |||||||||||
Weighted average fair value of outstanding shares/units | $ | 20.18 | $ | 14.97 | $ | 9.86 | $ | 12.09 | |||||||
(1) | Includes time-based and performance-base units. |
The fair value of the time-based awards is determined based on the closing price of the Company’s Common Stock on the grant date and compensation expense is recognized on a straight-line basis over the vesting period. The grant date fair value of performance awards for the 2016 Restricted Stock Units and the 2016 Class A LTIP Units were determined based on a Monte Carlo simulation method with the following assumptions, and compensation expense is recognized on a straight-line basis over the performance period:
Performance Award Grant Date | Percentage of Total Award | Grant Date Fair Value by Component (in dollars) | Volatility | Interest Rate | Dividend Yield | |||||
March 17, 2016 | ||||||||||
Absolute TSR Restricted Stock Units | 25% | $6.88 | 31.42% | 0.50% - 1.14% | 7.12% | |||||
Relative TSR Restricted Stock Units | 75% | $8.85 | 31.42% | 0.50% - 1.14% | 7.12% | |||||
Absolute TSR Class A LTIPs | 25% | $7.06 | 31.42% | 0.50% - 1.14% | 7.12% | |||||
Relative TSR Class A LTIPs | 75% | $8.95 | 31.42% | 0.50% - 1.14% | 7.12% | |||||
The absolute and relative stockholder returns are market conditions as defined by ASC 718, Compensation - Stock Compensation. Market conditions include provisions wherein the vesting condition is met through the achievement of a specific value of the Company’s Common Stock, which is total stockholder return in this case. Market conditions differ from other performance awards under ASC 718 in that the probability of attaining the condition (and thus vesting in the shares) is reflected in the initial grant date fair value of the award. Accordingly, it is not appropriate to reconsider the probability of vesting in the
21
XENIA HOTELS & RESORTS, INC.
Notes to Combined Condensed Consolidated Financial Statements (unaudited)
March 31, 2016
award subsequent to the initial measurement of the award, nor is it appropriate to reverse any of the expense if the condition is not met.
Therefore, once the expense for these awards is measured, the expense must be recognized over the service period regardless of whether the target is met, or at what level the target is met. Expense may only be reversed if the holder of the instrument forfeits the award by leaving the employment of the Company prior to vesting.
For the three months ended March 31, 2016 the Company recognized approximately $2.7 million of share-based compensation expense (net of forfeitures) related to share units, restricted stock units, and LTIP Units provided to certain of its executive officers, other officers and members of management, which included $1.2 million of accelerated share-based compensation expense related to management transition and severance agreements, and capitalized approximately $108 thousand related to restricted stock units provided to certain members of management that oversee development and capital projects on behalf of the Company. As of March 31, 2016, there was $15.4 million of total unrecognized compensation costs related to non-vested restricted share units, Class A LTIP Units and Time-Based LTIP Units issued under the 2014 Share Unit Plan and the 2015 Incentive Award Plan, as applicable, which are expected to be recognized over a remaining weighted-average period of 2.2 additional years.
For the three months ended March 31, 2015, the Company recognized $534 thousand of share-based compensation expense related to stock payments under the 2015 Incentive Award Plan, of which $525 thousand was provided to the board of directors and $9 thousand was provided to certain executive officers. In addition, in connection with the 2014 Share Unit Plan, during the three months ended March 31, 2015 the Company recognized approximately $1.1 million in compensation expense related to restricted stock units provided to certain of its executive officers and members of management and capitalized approximately $88 thousand related to restricted stock units provided to certain members of management that oversee development and capital projects on behalf of the Company. Additionally, this includes a cumulative catch up for compensation expense related to the fourth quarter of 2014 because the effectiveness of the grants was subject to the completion of the spin-off of the Company from InvenTrust, which occurred on February 3, 2015.
14. Commitments and Contingencies
Certain leases and operating agreements require the Company to reserve funds relating to replacements and renewals of the hotels' furniture, fixtures and equipment. As of March 31, 2016 and December 31, 2015, the Company had a balance of $68.4 million and $69.9 million, respectively, in reserves for such future improvements. This amount is included in restricted cash and escrows on the combined condensed consolidated balance sheet as of March 31, 2016.
The Company is subject, from time to time, to various legal proceedings and claims that arise in the ordinary course of business. While the resolution of these matters cannot be predicted with certainty, management believes, based on currently available information, that the final outcome of such matters will not have a material adverse effect on the financial statements of the Company.
In addition, in connection with the Company's separation from InvenTrust, on August 8, 2014, the Company entered into an Indemnity Agreement, as amended, with InvenTrust pursuant to which InvenTrust has agreed to the fullest extent allowed by law or government regulation, to absolutely, irrevocably and unconditionally indemnify, defend and hold harmless the Company and its subsidiaries, directors, officers, agents, representatives and employees (in each case, in such person’s respective capacity as such) and their respective heirs, executors, administrators, successors and assignees from and against all losses, including but not limited to "actions" (as defined in the Indemnity Agreement), arising from: (1) the non-public, formal, fact-finding investigation by the SEC as described in InvenTrust's public filings with the SEC (the "SEC Investigation"); (2) the three related demands (including the Derivative Lawsuit described below) received by InvenTrust ("Derivative Demands") from stockholders to conduct investigations regarding claims similar to the matters that are subject to the SEC Investigation and as described in InvenTrust' public filings with the SEC; (3) the derivative lawsuit filed on March 21, 2013 on behalf of InvenTrust by counsel for stockholders who made the first Derivative Demand (the "Derivative Lawsuit"); and (4) the investigation by the Special Litigation Committee of the board of directors of InvenTrust. In each case, regardless of when or where the loss took place, or whether any such loss, claim, accident, occurrence, event or happening is known or unknown, and regardless of whether such loss, claim, accident, occurrence, event or happening giving rise to the loss existed prior to, on or after February 3, 2015, the separation date or relates to, arises out of or results from actions, inactions, events, omissions, conditions, facts or circumstances occurring or existing prior to, on or after February 3, 2015, the separation date.
22
XENIA HOTELS & RESORTS, INC.
Notes to Combined Condensed Consolidated Financial Statements (unaudited)
March 31, 2016
15. Subsequent Events
In April 2016, the Company closed on the sale of the DoubleTree by Hilton Hotel Washington DC hotel for a sale price of $65 million.
In May 2016, the Company closed on the sale of Embassy Suites Baltimore North/Hunt Valley for a sale price of $20 million.
From April 1, 2016 through May 4, 2016, the Company repurchased an additional 407,469 shares of common stock at a weighted average price of $15.22 per share for an aggregate purchase price of approximately $6.2 million. As of May 4, 2016, the Company had approximately $44.5 million remaining under its share repurchase authorization.
23
Item 2. Management’s Discussion and Analysis of Financial Condition and Results of Operations
Certain statements in this Quarterly Report on Form 10-Q, other than purely historical information, are “forward-looking statements” within the meaning of the Private Securities Litigation Reform Act of 1995, Section 27A of the Securities Act of 1933, as amended, and Section 21E of the Securities Exchange Act of 1934, as amended (the “Exchange Act”). These statements include statements about Xenia’s plans, objectives, strategies, financial performance and outlook, trends, the amount and timing of future cash distributions, prospects or future events and involve known and unknown risks that are difficult to predict. As a result, our actual financial results, performance, achievements or prospects may differ materially from those expressed or implied by these forward-looking statements. In some cases, you can identify forward-looking statements by the use of words such as “may,” “could,” “expect,” “intend,” “plan,” “seek,” “anticipate,” “believe,” “estimate,” “guidance,” “predict,” “potential,” “continue,” “likely,” “will,” “would,” “illustrative” and variations of these terms and similar expressions, or the negative of these terms or similar expressions. Such forward-looking statements are necessarily based upon estimates and assumptions that, while considered reasonable by Xenia and its management based on their knowledge and understanding of the business and industry, are inherently uncertain. These statements are not guarantees of future performance, and stockholders should not place undue reliance on forward-looking statements. There are a number of risks, uncertainties and other important factors, many of which are beyond our control, that could cause our actual results to differ materially from the forward-looking statements contained in this Quarterly Report on Form 10-Q. Such risks, uncertainties and other important factors include, among others: the risks, uncertainties and factors set forth in our filings with the U.S. Securities and Exchange Commission, including our Annual Report on Form 10-K, as may be updated elsewhere in this report; and other Quarterly Reports on Form 10-Q that we have filed or will file with the SEC; business, financial and operating risks inherent to real estate investments and the lodging industry; seasonal and cyclical volatility in the lodging industry; macroeconomic and other factors beyond our control that can adversely affect and reduce demand for hotel rooms; contraction in the global economy or low levels of economic growth; levels of spending in business and leisure segments as well as consumer confidence; declines in occupancy and average daily rate; fluctuations in the supply and demand for hotel rooms; changes in the competitive environment in lodging industry and the markets where we own hotels; events beyond our control, such as war, terrorist attacks, travel-related health concerns and natural disasters; our reliance on third-party hotel management companies to operate and manage our hotels; our ability to maintain good relationships with our third-party hotel management companies and franchisers; our failure to maintain brand operating standards; our ability to maintain our brand licenses at our hotels; relationships with labor unions and changes in labor laws; loss of our senior management team or key personnel; our ability to identify and consummate acquisitions of additional hotels; our ability to integrate and successfully operate any hotel properties acquired in the future and the risks associates with these hotel properties; the impact of hotel renovations, repositioning, redevelopments and re-branding activities; our ability to access capital for renovations and acquisitions on terms and at times that are acceptable to us; the fixed cost nature of hotel ownership; our ability to service our debt; changes in interest rates and operating costs; compliance with regulatory regimes and local laws; uninsured or under insured losses, including those relating to natural disasters or terrorism; changes in distribution channels, such as through internet travel intermediaries; our status as an emerging growth company; the amount of debt that we currently have or may incur in the future; provisions in our debt agreements that may restrict the operation of our business; our separation from InvenTrust, our former parent; potential business conflicts of interests with InvenTrust; our organizational and governance structure; our status as a real estate investment trust (a “REIT”); our taxable REIT subsidiary (“TRS”) lessee structure; the cost of compliance with and liabilities under environmental, health and safety laws; adverse litigation judgments or settlements; changes in real estate and zoning laws and increase in real property tax rates; changes in federal, state or local tax law, including legislative, administrative, regulatory or other actions affecting REITs; changes in governmental regulations or interpretations thereof; and estimates relating to our ability to make distributions to our stockholders in the future.
These factors are not necessarily all of the important factors that could cause our actual financial results, performance, achievements or prospects to differ materially from those expressed in or implied by any of our forward-looking statements. Other unknown or unpredictable factors also could harm our results. All forward-looking statements attributable to us or persons acting on our behalf are expressly qualified in their entirety by the cautionary statements set forth above. Forward-looking statements speak only as of the date they are made, and we do not undertake or assume any obligation to update publicly any of these forward-looking statements to reflect actual results, new information or future events, changes in assumptions or changes in other factors affecting forward-looking statements, except to the extent required by applicable laws. If we update one or more forward-looking statements, no inference should be drawn that we will make additional updates with respect to those or other forward-looking statements.
The following discussion and analysis should be read in conjunction with the Company’s Unaudited Combined Condensed Consolidated Financial Statements and accompanying notes, which appear elsewhere in this Quarterly Report on Form 10-Q.
24
Overview
Xenia Hotels & Resorts, Inc. ("we", "us", "our", "Xenia" or the "Company") is a self-advised and self-administered REIT that invests primarily in premium full service, lifestyle and urban upscale hotels, with a focus on the Top 25 Markets as well as key leisure destinations in the United States. A premium full service hotel refers to a hotel defined as "upper upscale" or "luxury" by STR Inc. ("STR"), but excluding hotels referred to as "lifestyle" hotels. A lifestyle hotel refers to an innovative hotel with a focus on providing a unique and individualized guest experience in a smaller footprint by combining traditional hotel services with modern technologies and placing an emphasis on local influence. An urban upscale hotel refers to a hotel located in an urban or similar high-density commercial area, such as a central business district, and defined as "upscale" or "upper midscale" by STR. As of March 31, 2016, we owned 50 hotels, 48 of which are wholly owned, comprising 12,548 rooms, across 21 states and the District of Columbia, and had a 75% ownership interest in two hotels owned through two consolidated investments in real estate entities. Our hotels are primarily operated by industry leaders such as Marriott ®, Hilton ®, Kimpton ®, Hyatt ®, Starwood ®, Aston ®, Fairmont ® and Loews ®, as well as leading independent management companies.
Basis of Presentation
On February 3, 2015, Xenia was spun off from InvenTrust Properties Corp. ("InvenTrust" formerly known as Inland American Real Estate Trust, Inc.), its former parent. Prior to the separation, we effectuated certain reorganization transactions which were designed to consolidate the ownership of our hotels into our operating partnership; consolidate our TRS lessees in our TRS; facilitate our separation from InvenTrust; and enable us to qualify as a REIT for federal income tax purposes. The accompanying combined condensed consolidated financial statements prior to the spin-off have been "carved out" of InvenTrust’s consolidated financial statements and reflect significant assumptions and allocations. The combined condensed consolidated financial statements reflect our operations after giving effect to the reorganization transactions, the disposition of other hotels previously owned by us, and the spin-off, and include allocations of costs from certain corporate and shared functions provided to us by InvenTrust, as well as costs associated with participation by certain of our executives in InvenTrust’s benefit plans. Corporate costs directly associated with our principal executive offices, personnel and other administrative costs are reflected as general and administrative expenses on the combined condensed consolidated statements of operations and comprehensive loss. Additionally, prior to the spin-off, InvenTrust allocated to us a portion of its corporate overhead costs based upon our percentage share of the average invested assets of InvenTrust, which is reflected in general and administrative expenses. Based on these presentation matters, these financials may not be comparable to prior periods.
Our Revenues and Expenses
Our revenue is primarily derived from hotel operations, including room revenue, food and beverage revenue and other operating department revenue, which consists of parking, telephone, other guest services and tenant leases.
Our operating costs and expenses consist of the costs to provide hotel services, including room expense, food and beverage expense, management fees and other direct and indirect operating expenses. Room expense includes housekeeping wages and associated payroll taxes, room supplies, laundry services and front desk costs.
Food and beverage expense primarily includes the cost of food, beverages and associated labor. Other direct and indirect hotel expenses include labor and other costs associated with the other operating department revenue, as well as labor and other costs associated with general and administrative departments, sales and marketing, information technology and telecommunications, repairs and maintenance, and utility costs. Our hotels are managed by independent, third-party management companies under long-term agreements under which the management companies typically earn base and incentive management fees based on the levels of revenues and profitability of each individual hotel.
Key Indicators of Operating Performance
We measure hotel results of operations and the operating performance of our business by evaluating financial and non-financial metrics such as RevPAR; average daily rate ("ADR"); occupancy rate ("occupancy" or "OCC"); earnings before interest, income taxes, depreciation and amortization ("EBITDA") and Adjusted EBITDA ("Adjusted EBITDA"); and funds from operations ("FFO") and Adjusted FFO ("Adjusted FFO"). We evaluate individual hotel and company-wide performance with comparisons to budgets, prior periods and competing properties. ADR, occupancy and RevPAR may be impacted by macroeconomic factors as well as regional and local economies and events. See "Non-GAAP Financial Measures" for further discussion of the Company's use, definitions and limitations of EBITDA and FFO and Adjusted EBITDA and Adjusted FFO.
25
Results of Operations
Overview
As of March 31, 2016, we owned 50 operating hotels, including two hotels owned through consolidated real estate entities, the Grand Bohemian Hotel Charleston, which was completed and opened to the public on August 27, 2015 and the Grand Bohemian Hotel Mountain Brook, which was completed and opened to the public on October 21, 2015. At March 31, 2015, we owned 46 operating hotels, including two hotels under development owned by two consolidated real estate entities.
Sold properties are excluded from our combined condensed consolidated statements of operations and comprehensive loss as part of continuing operations if they represent a strategic shift or have a major effect on results of operations in accordance with ASU 2014-08, and therefore are reclassified to discontinued operations for all periods presented.
During the three months ended March 31, 2016, we believe the economic environment was favorable, although there were signs of softening trends in the lodging industry. Overall US lodging industry demand increased during the first quarter of 2016, but supply growth outpaced demand growth. As a result, the industry showed a moderate pricing increase in RevPAR of 2.7% for the three months ended March 31, 2016, driven by ADR growth of 3.2% partially offset by a decline in occupancy of 0.5% as reported by STR. RevPAR at the Company’s hotels increased 3.1% for the three months ended March 31, 2016 compared to 2015, which was driven by 5.2% ADR growth offset by a 2.0% decrease in occupancy. The Company continued to see declines in its four Houston area hotels attributable to the volatile energy markets, which had an average decrease of 13.5% in RevPAR compared to the three months ended March 31, 2015 driven by an 11.5% decrease in occupancy and 2.0% decrease in ADR. Additionally, our hotels located in Chicago, Denver, and Pittsburgh were negatively impacted in the first quarter of 2016 due to weak transient and group business as well as significant supply increases as compared to the first quarter of 2015. Several of our California hotels were positively impacted by increased business levels resulting from their recent renovations, particularly as compared to the first quarter of 2015 when business was impacted by the disruption created by the renovations. These increases were offset by renovation disruption at the Marriott Napa Valley Hotel & Spa in the first quarter of this year.
Our hotel portfolio has a focus on the Top 25 Markets as well as key leisure destinations in the United States. The following charts show the geographic diversification of our hotel properties as of March 31, 2016 :
Number of Hotels by Region (1) | Number of Rooms by Region (1) |
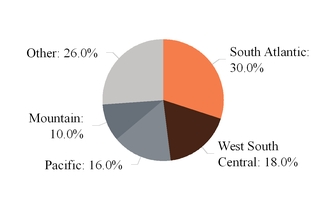
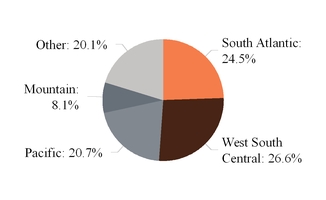
(1) | Represents the diversification of our hotel properties as defined by STR. |
The following table sets forth certain operating information for our 50 and 46 hotel properties owned during the respective years by geographic diversification for the three months ended March 31, 2016 and 2015, respectively:
Three Months Ended March 31, | ||||||||||||||
2016 (2) | 2015 (2)(3)(4) | |||||||||||||
Region (1) | OCC | ADR | RevPAR | OCC | ADR | RevPAR | ||||||||
South Atlantic | 76.2 | % | $186.68 | $142.33 | 77.4 | % | $179.70 | $139.17 | ||||||
West South Central | 70.1 | % | $193.94 | $136.04 | 75.4 | % | $194.69 | $146.79 | ||||||
Pacific | 77.4 | % | $223.13 | $172.77 | 71.4 | % | $191.65 | $136.77 | ||||||
Mountain | 74.3 | % | $177.77 | $132.05 | 80.7 | % | $178.33 | $143.95 | ||||||
Other | 64.4 | % | $163.07 | $105.01 | 65.7 | % | $148.77 | $97.81 | ||||||
Total | 72.4 | % | $191.67 | $138.73 | 73.9 | % | $182.16 | $134.59 | ||||||
26
(1) | Represents our diversification of our hotel properties as defined by STR. |
(2) | For hotels acquired during the period, operating results and statistics are only included since the respective date of acquisition. For hotels disposed of during the period, operating results and statistics are only included through the date of the respective disposition. |
(3) | Upon completion of construction in the third and fourth quarters of 2015 the two hotels under development were included as of the end of the applicable period from the date their respective operations began. |
(4) | The Andaz Napa had 682 room nights out of order in January 2015 as final repairs were completed related to the August 2014 Northern California earthquake. |
Operating Information Comparison
The following table sets forth certain operating information for the three months ended March 31, 2016 and 2015:
Three Months Ended March 31, | |||||||||
2016 | 2015 | Variance | |||||||
Number of properties at January 1 | 50 | 46 | 4 | ||||||
Properties acquired | 1 | — | 1 | ||||||
Properties disposed | (1) | — | (1) | ||||||
Number of properties at March 31 | 50 | 46 | 4 | ||||||
Number of rooms at January 1(1) | 12,548 | 12,636 | (88) | ||||||
Rooms in properties acquired or added to portfolio upon completion of construction (2) | 248 | 3 | 245 | ||||||
Rooms in properties disposed | (248) | — | (248) | ||||||
Number of rooms at March 31 | 12,548 | 12,639 | (91) | ||||||
Portfolio Statistics: | |||||||||
Occupancy (1) (3) | 72.4 | % | 73.9 | % | (2.0)% | ||||
ADR (1) (3) | $ | 191.67 | $ | 182.16 | 5.2% | ||||
RevPAR (1) (3) | $ | 138.73 | $ | 134.59 | 3.1% | ||||
(1) | The results for the three months ended March 31, 2016, include the consolidated operating results of the Grand Bohemian Hotel Charleston that opened on August 27, 2015 and the Grand Bohemian Hotel Mountain Brook that opened on October 21, 2015. |
(2) | The rooms additions include total number of rooms acquired and total number of rooms put into operations upon the completion of construction or renovation. During the three months ended March 31, 2016, the Company acquired the Hotel Commonwealth that added 245 rooms to our portfolio, and three additional rooms were added to the Hyatt Regency Santa Clara upon completion of property improvements. |
(3) | For hotels acquired during the applicable period, only includes operating statistics since the date of acquisition. For hotels disposed of during the period, operating results and statistics are only included through the date of the respective disposition. |
Revenues
Revenues consists of room, food and beverage, and other revenues from our hotels, as follows (in thousands):
Three Months Ended March 31, | |||||||||||
2016 | 2015 | Increase / (Decrease) | Variance | ||||||||
Revenues: | |||||||||||
Room revenues | $ | 159,318 | $ | 153,090 | $6,228 | 4.1% | |||||
Food and beverage revenues | 63,468 | 62,253 | 1,215 | 2.0% | |||||||
Other revenues | 12,249 | 12,531 | (282) | (2.3)% | |||||||
Total revenues | $ | 235,035 | $ | 227,874 | $7,161 | 3.1% | |||||
Room revenues
Room revenues increased by $6.2 million, or 4.1%, to $159.3 million for the three months ended March 31, 2016 from $153.1 million for the three months ended March 31, 2015, of which $11.8 million was contributed by the acquisition of the Hotel Commonwealth in January 2016, the two hotel developments that began operations in the third and fourth quarter of 2015 and the three hotels acquired in July 2015. An additional increase of $6.5 million was contributed by several of our California hotels that were positively impacted by increased business levels resulting from their recent renovations, particularly as
27
compared to the first quarter of 2015 when business was impacted by the disruption created by the renovations, which was offset by renovation disruption at the Marriott Napa Valley Hotel & Spa in the first quarter of this year. These increases were also offset by decreases of $1.2 million attributable to our hotels located in Chicago, Denver, and Pittsburgh which were negatively impacted in the first quarter of 2016 due to weak transient and group business as well as significant supply increases as compared to the first quarter of 2015, a decrease of $2.5 million from four of our hotel properties in the Houston market that have continued to be negatively impacted by the volatility in the energy market and $8.5 million attributed to the disposition of one property in October 2015 and one property in February 2016. The remaining net increase was attributable to our remaining hotels that were owned during the three months ended March 31, 2016 and 2015.
Food and beverage revenues
Food and beverage revenues increased by $1.2 million, or 2.0%, to $63.5 million for the three months ended March 31, 2016 from $62.3 million for the three months ended March 31, 2015, of which $3.8 million was attributable to the three hotels acquired in July 2015 and the Hotel Commonwealth acquired in January 2016 and $2.3 million was attributable to the two hotel developments that began operations in the third and fourth quarter of 2015. These increases were offset by decreases of $4.3 million related to one property disposed of in October 2015 and one property in February 2016, and the remaining $0.6 million net decrease was attributable to the remainder of our portfolio.
Other revenues
Other revenues decreased by $0.3 million, or 2.3%, to $12.2 million for the three months ended March 31, 2016 from $12.5 million for the three months ended March 31, 2015. There was $1.0 million in increases attributable to the three hotels acquired in July 2015 and the Hotel Commonwealth in January 2016 and the two hotel developments that began operations in the third and fourth quarter of 2015. These increases were offset by a net $1.3 million decrease primarily attributable to the disposition of one property in October 2015 and one in February 2016, the four Houston properties that have experienced declines in revenue from the volatility in the energy markets and a net overall decrease in the remainder of our portfolio.
Hotel Operating Expenses
Hotel operating expenses consist of the following (in thousands):
Three Months Ended March 31, | |||||||||||||
2016 | 2015 | Increase / (Decrease) | Variance | ||||||||||
Hotel operating expenses: | |||||||||||||
Room expenses | $ | 36,775 | $ | 35,187 | $ | 1,588 | 4.5% | ||||||
Food and beverage expenses | 42,233 | 40,187 | 2,046 | 5.1% | |||||||||
Other direct expenses | 3,965 | 4,265 | (300 | ) | (7.0)% | ||||||||
Other indirect expenses | 57,967 | 53,258 | 4,709 | 8.8% | |||||||||
Management and franchise fees | 12,248 | 11,451 | 797 | 7.0% | |||||||||
Total hotel operating expenses | $ | 153,188 | $ | 144,348 | $ | 8,840 | 6.1% | ||||||
Total hotel operating expenses
Total hotel operating expenses increased $8.8 million, or 6.1%, to $153.2 million for the three months ended March 31, 2016 from $144.3 million for the three months ended March 31, 2015, of which $14.4 million was primarily attributable to the three hotels acquired in July 2015, the two hotel developments that began operations in the third and fourth quarter of 2015 and the acquisition of the Hotel Commonwealth in January 2016, $3.3 million was attributable to several of our California hotels that were positively impacted by increased business levels resulting from their recent renovations, particularly as compared to the first quarter of 2015 when business was impacted by the disruption created by the renovations. These increases were offset by decreases in expenses from renovation disruption at the Marriott Napa Valley Hotel & Spa in the first quarter of this year. Room expense, food and beverage expense and other operating department costs fluctuate based on various factors, including occupancy, labor costs, utilities and insurance costs. These increases were offset by decreases of $8.9 million attributed to the sale of one hotel in October 2015 and one hotel in February 2016.
Other indirect expense increased $4.7 million, or 8.8%, to $58.0 million for the three months ended March 31, 2016 from $53.3 million for the three months ended March 31, 2015, of which $5.4 million was primarily attributable to the three hotels acquired in July 2015, the two hotel developments that began operations in the third and fourth quarter of 2015 and the acquisition of the Hotel Commonwealth in January 2016, and $1.9 million was attributable to the remainder of our portfolio. These increases were offset by decreases of $2.6 million attributed to the sale of one hotel in October 2015 and one hotel in February 2016.
28
Corporate and Other Expenses
Corporate and other expenses consist of the following (in thousands):
Three Months Ended March 31, | |||||||||||||
2016 | 2015 | Increase / (Decrease) | Variance | ||||||||||
Depreciation and amortization | $ | 38,951 | $ | 36,387 | $ | 2,564 | 7.0% | ||||||
Real estate taxes, personal property taxes and insurance | 12,033 | 12,193 | (160 | ) | (1.3)% | ||||||||
Ground lease expense | 1,353 | 1,275 | 78 | 6.1% | |||||||||
General and administrative expenses | 10,624 | 7,045 | 3,579 | 50.8% | |||||||||
Acquisition transaction costs | 140 | 29 | 111 | 382.8% | |||||||||
Provision for asset impairment | 7,594 | — | 7,594 | 100.0% | |||||||||
Separation and other start-up related expenses | — | 25,296 | (25,296 | ) | (100.0)% | ||||||||
Total corporate and other expenses | $ | 70,695 | $ | 82,225 | $ | (11,530 | ) | (14.0)% | |||||
Depreciation and amortization
Depreciation and amortization expense increased $2.6 million, or 7.0%, to $39.0 million for the three months ended March 31, 2016 from $36.4 million for the three months ended March 31, 2015, of which $3.3 million of the increase was contributed by the three hotels acquired in July 2015, the two hotel developments that began operations in the third and fourth quarter of 2015, and the Hotel Commonwealth acquired in January 2016. The remaining $1.5 million increase is the result of capital expenditures to improve our properties offset by decreases of $2.2 million attributed to the sale of one hotel in October 2015 and one hotel in February 2016.
Real estate taxes, personal property taxes and insurance
Real estate taxes, personal property taxes and insurance expense decreased $0.2 million, or 1.3%, to $12.0 million for the three months ended March 31, 2016 from $12.2 million for the three months ended March 31, 2015, of which $0.6 million was attributable to the sale of one hotel in October 2015 and one hotel in February 2016, offset by the $0.6 million increase from the three hotels acquired in July 2015, the two hotel developments that began operations in the third and fourth quarter of 2015, and the Hotel Commonwealth acquired in January 2016. The remaining decrease of $0.2 million was primarily attributable to a decrease in general liability insurance for the remainder of our hotel portfolio.
Ground lease expense
Ground lease expense increased $0.1 million, or 6.1%, to $1.4 million for the three months ended March 31, 2016 from $1.3 million for the three months ended March 31, 2015, primarily attributable to the acquisition of the Hotel Commonwealth in January 2016.
General and administrative expenses
General and administrative expenses increased $3.6 million, or 50.8%, to $10.6 million for the three months ended March 31, 2016 from $7.0 million for the three months ended March 31, 2015, of which $3.1 million of the increase was attributable to non-recurring management transition and severance costs incurred during the first quarter of 2016.
Acquisition transaction costs
Acquisition transaction costs were $0.1 million during the three months ended March 31, 2016. Typically, acquisition transaction costs consist of legal fees, other professional fees, transfer taxes and other direct costs associated with our pursuit of hotel investments. As a result, these costs vary with our level of ongoing acquisition activity. The primary increase during the three months ended March 31, 2016 was attributable to the acquisition of Hotel Commonwealth in January 2016.
Provision for asset impairment
During the three months ended March 31, 2016, a provision for asset impairment of $7.6 million was recorded on one hotel which was identified to have a reduction in the expected hold period when it met the held for sale criteria, and was written down to its estimated fair value, less costs to sell. The hotel was subsequently sold in May 2016. There were no asset impairments recorded for the three months ended March 31, 2015.
29
Separation and other start-up related expenses
The $25.3 million in separation and other start-up related expenses for the three months ended March 31, 2015, related to fees paid to unrelated third parties attributable to one-time costs incurred related to our spin-off from InvenTrust, the listing of our Common Stock, $0.01 par value per share (the "Common Stock"), on the NYSE, costs related to start-up costs incurred while transitioning to a stand-alone, publicly-traded company and related to the repurchase of common shares in a modified “Dutch Auction” self-tender offer (the “Tender Offer”) that commenced in conjunction with the listing of the Company's Common Stock on the NYSE.
Results of Non-Operating Income and Expenses
Hotel non-operating income and expenses consist of the following (in thousands):
Three Months Ended March 31, | ||||||||||||||
2016 | 2015 | Increase / (Decrease) | Variance | |||||||||||
Non-operating income and expenses: | ||||||||||||||
Gain on sale of investment properties | $ | 882 | $ | — | $ | 882 | 100.0 | % | ||||||
Other income | 84 | 2,687 | (2,603 | ) | (96.9 | )% | ||||||||
Interest expense | (12,840 | ) | (13,181 | ) | 341 | 2.6 | % | |||||||
Loss on extinguishment of debt | (4,742 | ) | (105 | ) | (4,637 | ) | — | |||||||
Income tax expense | (3,705 | ) | (5,079 | ) | 1,374 | 27.1 | % | |||||||
Net loss from discontinued operations | — | (489 | ) | 489 | 100.0 | % | ||||||||
Gain on sale of investment property
Gain on sale of investment property for the three months ended March 31, 2016 was related to the sale of one hotel in February of 2016. There were no sales during the three months ended March 31, 2015.
Other income
Other income decreased $2.6 million, or 96.9%, for the three months ended March 31, 2016, which was primarily attributable to the involuntary loss and business interruption insurance recovery income of $2.3 million that was received for the three months ended March 31, 2015 that was non-recurring in 2016.
Interest expense
Interest expense decreased $0.3 million, or 2.6%, to $12.8 million for the three months ended March 31, 2016 from $13.2 million for the three months ended March 31, 2015. This was primarily the result of a lower weighted average interest rate of 3.52% for the three months ended March 31, 2016 compared to 4.01% for the three months ended March 31, 2015.
Income tax expense
Income tax expense decreased $1.4 million, or 27.1%, to an income tax expense of $3.7 million for the three months ended March 31, 2016 from the $5.1 million expense allocated from InvenTrust for the three months ended March 31, 2015, which was primarily attributable to a one-time $2.9 million tax expense associated with transferring a hotel between entities in connection with electing REIT status during 2015 that was nonrecurring in 2016. Additionally in 2015, the Company was able to utilize net operating loss ("NOL") carry forwards to offset current taxable income. These NOLs were fully utilized during 2015 and were no longer available to offset income tax expense in the first quarter of 2016.
Net loss from discontinued operations
Net loss from discontinued operations decreased $0.5 million, or 100.0%, for the three months ended March 31, 2016. In November 2014, 52 lodging properties were sold by InvenTrust (the "Suburban Select Service Portfolio"), which were properties previously overseen by the Company, and the sale represented a strategic shift and had a major effect on the Company's results of operations. During early 2015, $489 thousand in carryover costs related to the Suburban Select Service Portfolio were incurred and have been presented as discontinued operations for the three months ended March 31, 2015 combined condensed consolidated statements of operations and comprehensive loss.
30
Liquidity and Capital Resources
We expect to meet our short-term liquidity requirements from cash on hand, cash flow from operations, borrowings under our unsecured revolving credit facility and the ability to refinance or extend our maturing debt as it becomes due. The objectives of our cash management policy are to maintain the availability of liquidity and minimize operational costs. Further, we have an investment policy that is focused on the preservation of capital and maximizing the return on new and existing investments.
On a long-term basis, our objectives are to maximize revenue and profits generated by our existing properties and acquired hotels, to further enhance the value of our portfolio and produce an attractive current yield, as well as to generate sustainable and predictable cash flow from our operations to distribute to our stockholders. To the extent we are able to successfully improve the performance of our portfolio, we believe this will result in increased operating cash flows. Additionally, we may meet our long-term liquidity requirements through additional borrowings, the issuance of equity and debt securities, and/or proceeds from the sales of hotels.
We may, from time to time, seek to retire or purchase additional amounts of our outstanding equity through cash purchases and/or exchanges for other securities in open market purchases, privately negotiated transactions or otherwise, including pursuant to a Rule 10b5-1 plan. Such repurchases or exchanges, if any, will depend on prevailing market conditions, our liquidity requirements, contractual restrictions and other factors. The amounts involved may be material. In December 2015, the Company’s Board of Directors authorized a share repurchase program pursuant to which we are authorized to purchase up to $100 million of the Company’s outstanding common stock, par value $0.01, per share, in the open market, in privately negotiated transactions or otherwise, including pursuant to Rule 10b5-1 plans (the "Repurchase Program"). The Repurchase Program does not have an expiration date. The Company is not obligated to repurchase any dollar amount or any number of shares of common stock, and repurchases may be suspended or discontinued at any time. For the three months ended March 31, 2016, 3,390,500 shares had been repurchased under the Repurchase Program, at a weighted average price of $14.54 per share, for an aggregate purchase price of $49.3 million. As of March 31, 2016, the Company had approximately $50.7 million remaining under its share repurchase authorization.
As of March 31, 2016, we had $159.6 million of consolidated cash and cash equivalents and $74.4 million of restricted cash and escrows. The restricted cash as of March 31, 2016 primarily consists of cash held in restricted escrows of $6.0 million for real estate taxes and insurance, and $68.4 million related to lodging furniture, fixtures and equipment reserves as required per the terms of our management and franchise agreements.
Credit facility
We have a $400 million unsecured revolving credit facility with a syndicate of banks. The revolving credit facility includes an uncommitted accordion feature which, subject to certain conditions, allows us to increase the aggregate availability by up to an additional $350 million. As of March 31, 2016, we had no outstanding balance under the unsecured revolving credit facility.
Unsecured Term Loans and Mortgages
In January 2016, we borrowed $125 million on the unsecured term loan with an interest rate of LIBOR plus the applicable rate, as defined per the respective agreement, maturing in October 2022. In December 2015, the Company entered into swap agreements to fix LIBOR at 1.83% for the entire term of the loan. The term loan was obtained in October 2015, however, funding was delayed until January 2016 in connection with the acquisition of the Hotel Commonwealth.
Additionally in January 2016, the Company obtained a $60 million mortgage loan with an interest rate of LIBOR plus 260 basis points and maturing in January 2023. Simultaneously with the closing of the mortgage, the Company entered into an interest rate swap on the same day to fix LIBOR at 1.54% for the entire term of the loan, for a combined rate of 4.14% as of March 31, 2016.
In February 2016, the Company refinanced one mortgage loan to fix the interest rate 4.53% and extend maturity to March 2026. Additional proceeds of approximately $11 million were received under the refinanced terms of the mortgage, which increased the principal of the loan from approximately $49 million to $60 million.
In March 2016, the Company elected to exercise its rights under the terms of the Marriott Griffin Gate Resort & Spa mortgage loan to extend the maturity date to March 2017.
During the three months ended March 31, 2016, the Company paid off one hotel mortgage loan totaling $27.8 million with proceeds from the sale of the collateral property in February. As of March 31, 2016, the remaining debt was $1,299 million and had a weighted average interest rate of 3.52%.
31
Sources and Uses of Cash
Our principal sources of cash are cash flows from operations and borrowings under debt financings including draws on our revolving credit facility. We may also obtain cash in the future from various types of equity offerings or the sale of our hotels. Our principal uses of cash are asset acquisitions, capital investments, routine debt service and debt repayments, operating costs, corporate expenses and dividends. We may also elect to use cash to buy back our common stock under the Repurchase Program.
Comparison of the Three Months Ended March 31, 2016 to the Three Months Ended March 31, 2015
The table below presents summary cash flow information for the combined condensed consolidated statements of cash flows (in thousands):
Three Months Ended March 31, | |||||||
2016 | 2015 | ||||||
Net cash flows provided by operating activities | $ | 33,379 | $ | 4,936 | |||
Net cash flows used in investing activities | (88,180 | ) | (22,885 | ) | |||
Net cash flows provided by financing activities | 92,223 | 93,028 | |||||
Increase in cash and cash equivalents | 37,422 | 75,079 | |||||
Cash and cash equivalents, at beginning of period | 122,154 | 163,053 | |||||
Cash and cash equivalents, at end of period | $ | 159,576 | $ | 238,132 | |||
Operating
• | Cash provided by operating activities was $33.4 million and $4.9 million for the three months ended March 31, 2016 and 2015, respectively. Cash provided by operating activities for the three months ended March 31, 2016 increased due to (i) the non-recurring separation and other start-up related expenses of $25.3 million that were incurred in the first quarter of 2015 related to our separation from InvenTrust and (ii) an increase in cash flows generated from our hotel portfolio including cash flows generated by the three hotels acquired in July 2015, the two hotel developments that began operations in the third and fourth quarter of 2015, and the acquisition of the Hotel Commonwealth in January 2016. These increases were offset by lost operating cash flow attributable to the sale of one hotel in October 2015 and one hotel in February 2016. |
Investing
• | Cash used in investing activities was $88.2 million and $22.9 million for the three months ended March 31, 2016, and 2015, respectively. Cash used in investing activities for the three months ended March 31, 2016 was primarily due to (i) $7.3 million in capital improvements at our hotel properties and (ii) the acquisition of the Hotel Commonwealth for net cash at closing of $116 million, which was offset by (iii) proceeds of $30.9 million from the sale of one hotel in February 2016. Cash used in investing activities during the three months ended March 31, 2015 was primarily due to capital improvements at our hotel and two development properties. |
Financing
• | Cash provided by financing activities was $92.2 million and $93.0 million for the three months ended March 31, 2016, and 2015, respectively. Cash provided by financing activities for the three months ended March 31, 2016 was primarily comprised of (i) proceeds from mortgage debt of $71.3 million and the $125 million funding of the term loan in January 2016, which was partially offset by (i) cash used for mortgage principal payments of $0.9 million, (ii) the payoff of $27.8 million in mortgage loans, (iii) $49.3 million used to repurchase common shares under the Repurchase Program and (iv) the payment of $25.7 million in dividends to common stockholders. Cash provided by financing activities for the three months ended March 31, 2015 was primarily comprised of a net contribution of $153.3 million from InvenTrust and proceeds from mortgage debt of $7.5 million, which was partially offset by cash used for mortgage principal payments of $2.2 million, the payoff a $26.3 million mortgage loan, and $36.9 million related to the repurchase of common shares in the Tender Offer. |
32
Capital Expenditures and Reserve Funds
We maintain each of our properties in good repair and condition and in conformity with applicable laws and regulations, franchise agreements and management agreements. Routine capital expenditures are administered by the property management companies. However, we have approval rights over the capital expenditures as part of the annual budget process for each of our properties. From time to time, certain of our hotels may be undergoing renovations as a result of our decision to upgrade portions of the hotels, such as guest rooms, public space, meeting space and/or restaurants, in order to better compete with other hotels in our markets. In addition, upon the acquisition of a hotel we often are required to complete a property improvement plan in order to bring the hotel up to the respective brand standards. If permitted by the terms of the management agreement, funding for a renovation will first come from the furniture, fixtures and equipment reserves. We are obligated to maintain reserve funds with respect to certain agreements with our hotel management companies, franchisors and lenders to provide funds, generally 3% to 5% of hotel revenues, sufficient to cover the cost of certain capital improvements to the hotels and to periodically replace and update furniture, fixtures and equipment. Certain of the agreements require that we reserve this cash in separate accounts. To the extent that the furniture, fixtures and equipment reserves are not available or adequate to cover the cost of the renovation, we may fund a portion of the renovation with cash on hand, borrowings from our unsecured revolving credit facility and/or other sources of available liquidity. As of March 31, 2016 and December 31, 2015, we held a total of $68.4 million and $69.9 million, respectively, of furniture, fixtures and equipment reserves. We have been and will continue to be prudent with respect to our capital spending, taking into account our cash flows from operations.
During the three months ended March 31, 2016, we made total capital expenditures of $7.3 million. During the three months ended March 31, 2015, we made total capital expenditures of $17.1 million, including $0.7 million for Napa hotel earthquake repairs.
Off-Balance Sheet Arrangements
As of March 31, 2016, we have no off-balance sheet arrangements.
Non-GAAP Financial Measures
We consider the following non-GAAP financial measures useful to investors as key supplemental measures of our operating performance: EBITDA, Adjusted EBITDA, FFO and Adjusted FFO. These non-GAAP financial measures should be considered along with, but not as alternatives to, net income or loss, operating profit, cash from operations, or any other operating performance measure as prescribed per GAAP.
EBITDA and Adjusted EBITDA
EBITDA is a commonly used measure of performance in many industries and is defined as net income or loss (calculated in accordance with GAAP) excluding interest expense, provision for income taxes (including income taxes applicable to sale of assets) and depreciation and amortization. We consider EBITDA useful to an investor regarding our results of operations, in evaluating and facilitating comparisons of our operating performance between periods and between REITs by removing the impact of our capital structure (primarily interest expense) and asset base (primarily depreciation and amortization) from our operating results, even though EBITDA does not represent an amount that accrues directly to common stockholders. In addition, EBITDA is used as one measure in determining the value of hotel acquisitions and dispositions and along with FFO and Adjusted FFO, it is used by management in the annual budget process for compensation programs.
We further adjust EBITDA for certain additional items such as hotel property acquisitions and pursuit costs, amortization of share-based compensation, equity investment adjustments, the cumulative effect of changes in accounting principles, impairment of real estate assets, operating results from properties sold and other costs we believe do not represent recurring operations and are not indicative of the performance of our underlying hotel property entities. We believe Adjusted EBITDA provides investors with another financial measure in evaluating and facilitating comparison of operating performance between periods and between REITs that report similar measures.
33
FFO and Adjusted FFO
We calculate FFO in accordance with standards established by the National Association of Real Estate Investment Trusts (NAREIT), which defines FFO as net income or loss (calculated in accordance with GAAP), excluding real estate-related depreciation, amortization and impairments, gains (losses) from sales of real estate, the cumulative effect of changes in accounting principles, similar adjustments for unconsolidated partnerships and joint ventures, and items classified by GAAP as extraordinary. Historical cost accounting for real estate assets implicitly assumes that the value of real estate assets diminishes predictably over time. Since real estate values instead have historically risen or fallen with market conditions, most industry investors consider presentations of operating results for real estate companies that use historical cost accounting to be insufficient by themselves. We believe that the presentation of FFO provides useful supplemental information to investors regarding our operating performance by excluding the effect of real estate depreciation and amortization, gains (losses) from sales for real estate, impairments of real estate assets, extraordinary items and the portion of these items related to unconsolidated entities, all of which are based on historical cost accounting and which may be of lesser significance in evaluating current performance. We believe that the presentation of FFO can facilitate comparisons of operating performance between periods and between REITs, even though FFO does not represent an amount that accrues directly to common stockholders. Our calculation of FFO may not be comparable to measures calculated by other companies who do not use the NAREIT definition of FFO or do not calculate FFO per diluted share in accordance with NAREIT guidance. Additionally, FFO may not be helpful when comparing us to non-REITs.
We further adjust FFO for certain additional items that are not in NAREIT’s definition of FFO such as hotel property acquisition and pursuit costs, amortization of debt origination costs and share-based compensation, operating results from properties that are sold and other expenses we believe do not represent recurring operations. We believe that Adjusted FFO provides investors with useful supplemental information that may facilitate comparisons of ongoing operating performance between periods and between REITs that make similar adjustments to FFO and is beneficial to investors’ complete understanding of our operating performance.
34
The following is a reconciliation of net loss to EBITDA and Adjusted EBITDA for the three months ended March 31, 2016 and 2015 (in thousands):
Three Months Ended March 31, | |||||||
2016 | 2015 | ||||||
Net loss attributable to the Company | $ | (8,915 | ) | $ | (14,866 | ) | |
Adjustments: | |||||||
Interest expense | 12,840 | 13,181 | |||||
Income tax expense | 3,705 | 5,079 | |||||
Depreciation and amortization related to investment properties | 38,951 | 36,387 | |||||
Adjustments related to non-controlling interests | (312 | ) | — | ||||
EBITDA | $ | 46,269 | $ | 39,781 | |||
Reconciliation to Adjusted EBITDA | |||||||
Impairment of investment properties | 7,594 | — | |||||
Gain on sale of investment property | (882 | ) | — | ||||
Loss on extinguishment of debt | 4,742 | 105 | |||||
Acquisition and pursuit costs | 140 | 29 | |||||
Amortization of share-based compensation expense | 2,697 | 1,674 | |||||
Amortization of above and below market ground leases(1) | 170 | 107 | |||||
Gain from excess property insurance recovery | — | (276 | ) | ||||
Business interruption insurance recoveries, net(2) | — | (2,324 | ) | ||||
EBITDA adjustment for hotels sold prior to spin-off (1) | — | 420 | |||||
Management transition and severance expenses | 1,890 | — | |||||
Other non-recurring expenses(3) | — | 25,296 | |||||
Adjusted EBITDA | $ | 62,620 | $ | 64,812 | |||
(1) | Certain amounts were included or combined in the Adjusted EBITDA reconciliation for the three months ended March 31, 2015 for comparative purposes to the three months ended March 31, 2016. |
(2) | The business interruption insurance recovery for 2014 for the three months ended March 31, 2015 was $3.7 million, which is net of $1.4 million of hotel related expenses attributable to those hotels impacted by the August 2014 Napa Earthquake. |
(3) | For the three months ended March 31, 2015, other non-recurring expenses include one-time costs related to the listing of our common stock on the NYSE, such as legal, audit fees and other professional fees, costs related to a tender offer and other start-up costs incurred while transitioning to a stand-alone, publicly-traded company. |
35
The following is a reconciliation of our GAAP net loss to FFO and Adjusted FFO for the three months ended March 31, 2016 and 2015 (in thousands):
Three Months Ended March 31, | |||||||
2016 | 2015 | ||||||
Net loss attributable to the Company | $ | (8,915 | ) | $ | (14,866 | ) | |
Adjustments: | |||||||
Depreciation and amortization related to investment properties | 38,951 | 36,387 | |||||
Impairment of investment property | 7,594 | — | |||||
Gain on sale of investment property | (882 | ) | — | ||||
Adjustments related to non-controlling interests | (224 | ) | — | ||||
FFO | $ | 36,524 | $ | 21,521 | |||
Reconciliation to Adjusted FFO | |||||||
Loss on extinguishment of debt | $ | 4,742 | $ | 105 | |||
Acquisition and pursuit costs | 140 | 29 | |||||
Loan related costs(1) | 1,003 | 1,169 | |||||
Amortization of share-based compensation expense | 2,697 | 1,674 | |||||
Amortization of above and below market ground leases(2) | 170 | 107 | |||||
Income tax related to restructuring(3) | — | 2,875 | |||||
Business interruption proceeds net of hotel related expenses(4) | — | (2,324 | ) | ||||
FFO adjustment for hotels sold prior to spin-off(2) | — | 420 | |||||
Management transition and severance expenses | 1,890 | — | |||||
Other non-recurring expenses (5) | — | 25,296 | |||||
Adjusted FFO | $ | 47,166 | $ | 50,872 | |||
(1) | Loan related costs included amortization of debt discounts, premiums and deferred loan origination costs. |
(2) | Certain amounts were included or combined in the Adjusted EBITDA reconciliation for the three months ended March 31, 2015 for comparative purposes to the three months ended March 31, 2016. |
(3) | For the three months ended March 31, 2015, the Company recognized income tax expense of $5.1 million, of which $2.9 million related to a gain on the transfer of a hotel between legal entities resulting in a more optimal structure in connection with the Company’s intention to elect to be taxed as a REIT. |
(4) | The business interruption insurance recovery for the three months ended March 31, 2015 was $3.7 million which was net of $1.4 million of hotel related expenses attributable to those hotels impacted by the August 2014 Napa Earthquake. |
(5) | For the three months ended March 31, 2015, other non-recurring expenses include one-time costs related to the listing of our common stock on the NYSE, such as legal, audit fees and other professional fees, costs related to a tender offer and other start-up costs incurred while transitioning to a stand-alone, publicly-traded company. |
Use and Limitations of Non-GAAP Financial Measures
EBITDA, Adjusted EBITDA, FFO, and Adjusted FFO do not represent cash generated from operating activities under GAAP and should not be considered as alternatives to net income or loss, operating profit, cash flows from operations or any other operating performance measure prescribed by GAAP. Although we present and use EBITDA, Adjusted EBITDA, FFO and Adjusted FFO because we believe they are useful to investors in evaluating and facilitating comparisons of our operating performance between periods and between REITs that report similar measures, the use of these non-GAAP measures has certain limitations as analytical tools. These non-GAAP financial measures are not measures of our liquidity, nor are they indicative of funds available to fund our cash needs, including our ability to fund capital expenditures, contractual commitments, working capital, service debt or make cash distributions. These measurements do not reflect cash expenditures for long-term assets and other items that we have incurred and will incur. These non-GAAP financial measures may include funds that may not be available for management’s discretionary use due to functional requirements to conserve funds for capital expenditures, property acquisitions, and other commitments and uncertainties. These non-GAAP financial measures as presented may not be comparable to non-GAAP financial measures as calculated by other real estate companies.
36
We compensate for these limitations by separately considering the impact of these excluded items to the extent they are material to operating decisions or assessments of our operating performance. Our reconciliations to the most comparable GAAP financial measures, and our combined condensed consolidated statements of operations and comprehensive loss, include interest expense, and other excluded items, all of which should be considered when evaluating our performance, as well as the usefulness of our non-GAAP financial measures. These non-GAAP financial measures reflect additional ways of viewing our operations that we believe, when viewed with our GAAP results and the reconciliations to the corresponding GAAP financial measures, provide a more complete understanding of factors and trends affecting our business than could be obtained absent this disclosure. We strongly encourage investors to review our financial information in its entirety and not to rely on a single financial measure.
Critical Accounting Policies and Estimates
The preparation of financial statements in conformity with GAAP requires management to make estimates and assumptions that affect the reported amount of assets and liabilities at the date of our financial statements and the reported amounts of revenues and expenses during the reporting period. Actual amounts may differ significantly from these estimates and assumptions. We evaluate our estimates, assumptions and judgments are reasonable and appropriate on an ongoing basis, based on information that is then available to us as well as our experience and various matters. All of our significant accounting policies, including certain critical accounting policies, are disclosed in our Annual Report on Form 10-K for the year ended December 31, 2015 and Note 2 in the combined condensed consolidated financial statements included herein.
Inflation
We rely on the performance of the hotels to increase revenues to keep pace with inflation. Generally, our hotel operators possess the ability to adjust room rates daily, except for group or corporate rates contractually committed to in advance, although competitive pressures may limit the ability of our operators to raise rates faster than inflation or even at the same rate.
Seasonality
Demand in the lodging industry is affected by recurring seasonal patterns which are greatly influenced by overall economic cycles, the geographic locations of the hotels and the customer mix at the hotels. Generally, our hotels will have lower revenue, operating income and cash flow in the first quarter and higher revenue, operating income and cash flow in the third quarter.
Subsequent Events
In April 2016, the Company closed on the sale of the DoubleTree by Hilton Hotel Washington DC hotel for a sale price of $65 million.
In May 2016, the Company closed on the sale of Embassy Suites Baltimore North/Hunt Valley for a sale price of $20 million.
From April 1, 2016 through May 4, 2016, the Company repurchased an additional 407,469 shares of common stock at a weighted average price of $15.22 per share for an aggregate purchase price of approximately $6.2 million. As of May 4, 2016, the Company had approximately $44.5 million remaining under its share repurchase authorization.
New Accounting Pronouncements Not Yet Implemented
See Note 2 to our combined condensed consolidated financial statements included herein for additional information related to recently issued accounting pronouncements.
Item 3. Quantitative and Qualitative Disclosures About Market Risk
We are subject to market risk associated with changes in interest rates both in terms of variable-rate debt and the price of new fixed-rate debt upon maturity of existing debt and for acquisitions. Our interest rate risk management objectives are to limit the impact of interest rate changes on earnings and cash flows and to lower our overall borrowing costs. If market rates of interest on all of the variable rate debt as of March 31, 2016 permanently increased or decreased by 1%, the increase or decrease in interest expense on the variable rate debt would decrease or increase future earnings and cash flows by approximately $5.8 million per annum. If market rates of interest on all of the variable rate debt as of December 31, 2015 permanently increased or decreased by 1%, the increase or decrease in interest expense on the variable rate debt would decrease or increase future earnings and cash flows by approximately $5.8 million per annum.
With regard to our variable rate financing, we assess interest rate cash flow risk by continually identifying and monitoring changes in interest rate exposures that may adversely impact expected future cash flows and by evaluating hedging opportunities. We maintain risk management control systems to monitor interest rate cash flow risk attributable to both of our outstanding or forecasted debt obligations as well as our potential offsetting hedge positions. The risk management control
37
systems involve the use of analytical techniques, including cash flow sensitivity analysis, to estimate the expected impact of changes in interest rates on our future cash flows.
We monitor interest rate risk using a variety of techniques, including periodically evaluating fixed interest rate quotes on all variable rate debt and the costs associated with converting the debt to fixed rate debt. Also, existing fixed and variable rate loans that are scheduled to mature in the next year or two are evaluated for possible early refinancing or extension due to consideration given to current interest rates. We have taken significant steps in reducing our variable rate debt exposure by paying off property-level mortgage debt and entering into various interest rate swap agreements to hedge the interest rate exposure risk related to several variable rate loans. Refer to Note 7 in the combined consolidated financial statements included herein, for our debt principal amounts and weighted average interest rates by year and expected maturity to evaluate the expected cash flows and sensitivity to interest rate changes. Refer to Note 8 in the combined consolidated financial statements included herein for more information on our interest rate swap derivatives.
We may continue to use derivative instruments to hedge exposures to changes in interest rates on loans secured by our properties. To the extent we do, we are exposed to credit risk and market risk. Credit risk is the failure of the counterparty to perform under the terms of the derivative contract. We maintain credit policies with regard to our counterparties that we believe reduce overall credit risk. These policies include evaluating and monitoring our counterparties' financial condition, including their credit ratings, and entering into agreements with counterparties based on established credit limit policies. Market risk is the adverse effect on the value of a financial instrument that results from a change in interest rates. The market risk associated with interest-rate contracts is managed by establishing and monitoring parameters that limit the types and degree of market risk that may be undertaken.
The following table provides information about our financial instruments that are sensitive to changes in interest rates. For debt obligations outstanding as of March 31, 2016, the following table presents principal repayments and related weighted-average interest rates by contractual maturity dates (in thousands):
2016 | 2017 | 2018 | 2019 | 2020 | Thereafter | Total | Fair Value | ||||||||
Maturing debt (1)(2): | |||||||||||||||
Fixed rate debt (mortgages and term loans) | $180,000 | $35,712 | $— | $— | $16,760 | $483,000 | $715,472 | $663,514 | |||||||
Variable rate debt (mortgage loans) | — | 34,193 | 168,821 | 334,200 | 46,200 | — | 583,414 | 636,353 | |||||||
Unsecured credit facility | — | — | — | — | — | — | — | — | |||||||
Total | $180,000 | $69,905 | $168,821 | $334,200 | $62,960 | $483,000 | $1,298,886 | $1,299,867 | |||||||
Weighted average interest rate on debt: | |||||||||||||||
Fixed rate debt (mortgages and term loans) | 5.50% | 4.46% | — | — | 3.85% | 3.67% | 4.18% | 3.17% | |||||||
Variable rate debt (mortgage loans) | — | 2.94% | 2.62% | 2.69% | 2.94% | — | 2.70% | 3.33% | |||||||
Unsecured credit facility | 2.19% | — | — | — | — | — | — | — | |||||||
(1) | The debt maturity excludes net mortgage premiums and discounts of $0.8 million as of March 31, 2016. |
(2) | See Item 7A of our most recent Annual Report on Form 10-K and Note 7 to our combined condensed consolidated financial statements included herein. |
Item 4. Controls and Procedures
Disclosure Controls and Procedures. As required by Rules 13a-15(b) and 15d-15(b) under the Exchange Act, our management, including our principal executive officer and our principal financial officer evaluated, as of the end of the period covered by this quarterly report, the effectiveness of our disclosure controls and procedures as defined in Rules 13a-15(e) and Rule 15d-15(e) of the Exchange Act. Based on that evaluation, our principal executive officer and our principal financial officer concluded that our disclosure controls and procedures, as of the end of the period covered by this quarterly report, were effective at a reasonable assurance level for the purpose of ensuring that information required to be disclosed by us in this quarterly report is recorded, processed, summarized and reported within the time periods specified by the rules and forms of the Exchange Act and is accumulated and communicated to management, including our principal executive officer and our principal financial officer as appropriate, to allow timely decisions regarding required disclosures.
Changes in Internal Control Over Financial Reporting. There has been no change in the Company's internal control over financial reporting during the Company's most recent fiscal quarter that has materially affected, or is reasonably likely to materially affect, the Company's internal control over financial reporting.
39
Part II. OTHER INFORMATION
Item 1. Legal Proceedings
We are involved in various claims and lawsuits arising in the normal course of business, including proceedings involving tort and other general liability claims, workers’ compensation and other employee claims and claims related to our ownership of certain hotel properties. Most occurrences involving liability, claims of negligence and employees are covered by insurance with solvent insurance carriers. We recognize a liability when we believe the loss is probable and reasonably estimable. We currently believe that the ultimate outcome of such lawsuits and proceedings will not, individually or in the aggregate, have a material effect on our combined condensed consolidated financial position, results of operations or liquidity.
Item 1A. Risk Factors
There have been no material changes from the risk factors previously disclosed in response to Item 1A. to Part I of our Annual Report on Form 10-K for the fiscal year ended December 31, 2015.
Item 2. Unregistered Sales of Equity Securities and Use of Proceeds
Issuer Purchases of Equity Securities
The following table sets forth information regarding the Company's purchases of shares of its common stock pursuant to its Share Repurchase Program during the quarter ended March 31, 2016:
Period | Total Number of Shares Purchased | Weighted Average Price Paid Per Share | Total Numbers of Shares Purchased as Part of Publicly Announced Plans | Maximum Number (or Approximate Dollar Value) of Shares That May Yet Be Purchased Under the Program (in thousands) | ||||||||||
January 1 to January 31, 2016 | 1,335,775 | $ | 14.19 | 1,335,775 | $ | 81,041 | ||||||||
February 1 to February 29, 2016 | 1,414,517 | $ | 14.30 | 1,414,517 | $ | 60,810 | ||||||||
March 1 to March 31, 2016 | 640,208 | $ | 15.77 | 640,208 | $ | 50,712 | ||||||||
Total | 3,390,500 | $ | 14.54 | 3,390,500 | ||||||||||
Item 3. Defaults Upon Senior Securities
None.
Item 4. Mine Safety Disclosures
Not applicable.
Item 5. Other Information
None.
40
Item 6. Exhibits
Exhibit Number | Exhibit Description | |
2.1 | Separation and Distribution Agreement by and between Inland American Real Estate Trust, Inc. (n/k/a InvenTrust Properties Corp.) and Xenia Hotels & Resorts, Inc., dated as of January 20, 2015 (incorporated by reference to Exhibit 2.1 to the Company’s Periodic Report on Form 8-K (File No. 001-36594) filed on January 23, 2015) | |
3.1 | Articles Supplementary of Xenia Hotels and Resorts, Inc., as filed on November 10, 2015 with the Maryland Department of Assessments and Taxation (incorporated by reference to Exhibit 3.1 to the Company’s Quarterly Report on Form 10-Q (File No. 001-36594) filed on November 12, 2015) | |
3.2 | Articles of Restatement of Xenia Hotels & Resorts, Inc., as filed on November 10, 2015 with the Maryland Department of Assessments and Taxation (incorporated by reference to Exhibit 3.2 to the Company’s Quarterly Report on Form 10-Q (File No. 001-36594) filed on November 12, 2015) | |
3.3 | Amended and Restated Bylaws of Xenia Hotels & Resorts, Inc. (incorporated by reference to Exhibit 3.1 to the Company’s Periodic Report on Form 8-K (File No. 001-36594) filed on February 9, 2015) | |
10.1*+ | Form of Time-Based Restricted Stock Unit Agreement | |
10.2*+ | Form of Class A Performance LTIP Unit Agreement (2016) | |
31.1* | Certification of Chief Executive Officer Pursuant to Section 302 of the Sarbanes-Oxley Act of 2002 | |
31.2* | Certification of Chief Financial Officer Pursuant to Section 302 of the Sarbanes-Oxley Act of 2002 | |
32.1* | Certification of Chief Executive Officer and Chief Financial Officer pursuant to Section 906 of the Sarbanes-Oxley Act of 2002 | |
101.INS* | XBRL Instance Document | |
101.SCH* | XBRL Taxonomy Extension Schema Document | |
101.CAL* | XBRL Taxonomy Extension Calculation Linkbase Document | |
101.DEF* | XBRL Taxonomy Extension Definition Linkbase Document | |
101.LAB* | XBRL Taxonomy Extension Label Linkbase Document | |
101.PRE* | XBRL Taxonomy Extension Presentation Linkbase Document | |
* Filed herewith
+ Management contract or compensatory plan
41
SIGNATURES
Pursuant to the requirements of the Securities Exchange Act of 1934, the registrant has duly caused this report to be signed on its behalf by the undersigned thereunto duly authorized.
Xenia Hotels & Resorts, Inc. | |
May 11, 2016 | |
/s/ Marcel Verbaas | |
Marcel Verbaas | |
President and Chief Executive Officer | |
(Principal Executive Officer) | |
/s/ Atish Shah | |
Atish Shah | |
Executive Vice President, Chief Financial Officer and Treasurer | |
(Principal Financial Officer) | |
42
EXHIBIT INDEX | ||
Exhibit Number | Exhibit Description | |
2.1 | Separation and Distribution Agreement by and between Inland American Real Estate Trust, Inc. (n/k/a InvenTrust Properties Corp.) and Xenia Hotels & Resorts, Inc., dated as of January 20, 2015 (incorporated by reference to Exhibit 2.1 to the Company’s Periodic Report on Form 8-K (File No. 001-36594) filed on January 23, 2015) | |
3.1 | Articles Supplementary of Xenia Hotels and Resorts, Inc., as filed on November 10, 2015 with the Maryland Department of Assessments and Taxation (incorporated by reference to Exhibit 3.1 to the Company’s Quarterly Report on Form 10-Q (File No. 001-36594) filed on November 12, 2015) | |
3.2 | Articles of Restatement of Xenia Hotels & Resorts, Inc., as filed on November 10, 2015 with the Maryland Department of Assessments and Taxation (incorporated by reference to Exhibit 3.2 to the Company’s Quarterly Report on Form 10-Q (File No. 001-36594) filed on November 12, 2015) | |
3.3 | Amended and Restated Bylaws of Xenia Hotels & Resorts, Inc. (incorporated by reference to Exhibit 3.1 to the Company’s Periodic Report on Form 8-K (File No. 001-36594) filed on February 9, 2015) | |
10.1*+ | Form of Time-Based Restricted Stock Unit Agreement | |
10.2*+ | Form of Class A Performance LTIP Unit Agreement (2016) | |
31.1* | Certification of Chief Executive Officer Pursuant to Section 302 of the Sarbanes-Oxley Act of 2002 | |
31.2* | Certification of Chief Financial Officer Pursuant to Section 302 of the Sarbanes-Oxley Act of 2002 | |
32.1* | Certification of Chief Executive Officer and Chief Financial Officer pursuant to Section 906 of the Sarbanes-Oxley Act of 2002 | |
101.INS* | XBRL Instance Document | |
101.SCH* | XBRL Taxonomy Extension Schema Document | |
101.CAL* | XBRL Taxonomy Extension Calculation Linkbase Document | |
101.DEF* | XBRL Taxonomy Extension Definition Linkbase Document | |
101.LAB* | XBRL Taxonomy Extension Label Linkbase Document | |
101.PRE* | XBRL Taxonomy Extension Presentation Linkbase Document | |
* | Filed herewith |
+ | Management contract or compensatory plan |
43