Attached files
| file | filename |
|---|---|
| EX-31.1 - EX-31.1 - Xenia Hotels & Resorts, Inc. | d897225dex311.htm |
| EX-23.1 - EX-23.1 - Xenia Hotels & Resorts, Inc. | d897225dex231.htm |
| EX-31.2 - EX-31.2 - Xenia Hotels & Resorts, Inc. | d897225dex312.htm |
| EX-21.1 - EX-21.1 - Xenia Hotels & Resorts, Inc. | d897225dex211.htm |
| EX-32.1 - EX-32.1 - Xenia Hotels & Resorts, Inc. | d897225dex321.htm |
Table of Contents
UNITED STATES
SECURITIES AND EXCHANGE COMMISSION
Washington, DC 20549
Form 10-K
(Mark One)
| þ | ANNUAL REPORT PURSUANT TO SECTION 13 OR 15(d) OF THE SECURITIES EXCHANGE ACT OF 1934 |
For the fiscal year ended December 31, 2014
| ¨ | TRANSITION REPORT PURSUANT TO SECTION 13 OR 15(d) OF THE SECURITIES EXCHANGE ACT OF 1934 |
For the transition period from to
Commission File No. 001-36594
XENIA HOTELS & RESORTS, INC.
(Exact Name of Registrant as Specified in Its Charter)
| Maryland | 20-0141677 | |
| (State or Other Jurisdiction of Incorporation or Organization) |
(IRS Employer Identification No.) | |
| 200 S. Orange Avenue Suite 1200, Orlando, Florida |
32801 | |
| (Address of Principal Executive Offices) | (Zip Code) | |
Registrant’s telephone number, including area code: (407) 317-6950
Securities registered pursuant to Section 12(b) of the Act:
| Title of Each Class |
Name of Each Exchange on Which Registered | |
| Common Stock, $0.01 par value | New York Stock Exchange |
Securities registered pursuant to Section 12(g) of the Act: None
Indicate by check mark if the registrant is a well-known seasoned issuer, as defined in Rule 405 of the Securities Act. Yes ¨ No þ
Indicate by check mark if the registrant is not required to file reports pursuant to Section 13 or Section 15(d) of the Act. Yes ¨ No þ
Indicate by check mark whether the registrant: (1) has filed all reports required to be filed by Section 13 or 15(d) of the Securities Exchange Act of 1934 during the preceding 12 months (or for such shorter period that the registrant was required to file such reports), and (2) has been subject to such filing requirements for the past 90 days. Yes ¨ No þ
Indicate by check mark whether the registrant has submitted electronically and posted on its corporate Web site, if any, every Interactive Data File required to be submitted and posted pursuant to Rule 405 of Regulation S-T (§ 232.405 of this chapter) during the preceding 12 months (or for such shorter period that the registrant was required to submit and post such files). Yes ¨ No ¨
Indicate by check mark if disclosure of delinquent filers pursuant to Item 405 of Regulation S-K is not contained herein, and will not be contained, to the best of the registrant’s knowledge, in definitive proxy or information statements incorporated by reference in Part III of this Form 10-K or any amendment to this Form 10-K. þ
Indicate by check mark whether the registrant is a large accelerated filer, an accelerated filer, a non-accelerated filer, or a smaller reporting company. See definitions of “large accelerated filer,” “accelerated filer” and “smaller reporting company” in Rule 12b-2 of the Exchange Act
| Large accelerated filer | ¨ | Accelerated filer | ¨ | |||
| Non-accelerated filer | þ | Smaller reporting company | ¨ |
Indicate by check mark whether the registrant is a shell company (as defined in Rule 12b-2 of the Act). Yes ¨ No þ
There was no public market for the registrant’s common stock, $0.01 par value per share, as of June 30, 2014, the last business day of the registrant’s most recently completed second fiscal quarter.
As of March 25, 2015, there were 111,664,641 shares of the registrant’s common stock outstanding.
DOCUMENTS INCORPORATED BY REFERENCE
Part III of this Annual Report on Form 10-K incorporates by reference portions of the registrant’s Proxy Statement for its 2015 Annual Meeting of Stockholders, which is expected to be filed on or prior to April 30, 2015.
Table of Contents
XENIA HOTELS & RESORTS, INC.
i
Table of Contents
SPECIAL NOTE REGARDING FORWARD-LOOKING STATEMENTS
Certain statements in this Annual Report on Form 10-K, other than purely historical information, are “forward-looking statements” within the meaning of the Private Securities Litigation Reform Act of 1995, Section 27A of the Securities Act of 1933, as amended, and Section 21E of the Securities Exchange Act of 1934, as amended. These statements include statements about Xenia Hotels & Resorts, Inc.’s (“Xenia”) plans, objectives, strategies, financial performance and outlook, trends, the amount and timing of future cash distributions, prospects or future events and involve known and unknown risks that are difficult to predict. As a result, our actual financial results, performance, achievements or prospects may differ materially from those expressed or implied by these forward-looking statements. In some cases, you can identify forward-looking statements by the use of words such as “may,” “could,” “expect,” “intend,” “plan,” “seek,” “anticipate,” “believe,” “estimate,” “guidance,” “predict,” “potential,” “continue,” “likely,” “will,” “would,” “illustrative” and variations of these terms and similar expressions, or the negative of these terms or similar expressions. Such forward-looking statements are necessarily based upon estimates and assumptions that, while considered reasonable by Xenia and its management based on their knowledge and understanding of the business and industry, are inherently uncertain. These statements are not guarantees of future performance, and stockholders should not place undue reliance on forward-looking statements. There are a number of risks, uncertainties and other important factors, many of which are beyond our control, that could cause our actual results to differ materially from the forward-looking statements contained in this Annual Report on Form 10-K (“Annual Report”). Such risks, uncertainties and other important factors, include, among others, the risks, uncertainties and factors set forth under “Part I–Item IA. Risk Factors” and “Part II–Item 7. Management’s Discussion and Analysis of Financial Condition and Results of Operations,” and the risks and uncertainties related to the following:
| • | business, financial and operating risks inherent to real estate investments and the lodging industry; |
| • | seasonal and cyclical volatility in the lodging industry; |
| • | macroeconomic and other factors beyond our control that can adversely affect and reduce demand for hotel rooms; |
| • | contraction in the global economy or low levels of economic growth; |
| • | levels of spending in business and leisure segments as well as consumer confidence; |
| • | declines in occupancy and average daily rate; |
| • | fluctuations in the supply and demand for hotel rooms; |
| • | changes in the competitive environment in lodging industry and the markets where we own hotels; |
| • | events beyond our control, such as war, terrorist attacks, travel-related health concerns and natural disasters; |
| • | our reliance on third-party hotel management companies to operate and manage our hotels; |
| • | our ability to maintain good relationships with our third-party hotel management companies and franchisors; |
| • | our failure to maintain brand operating standards; |
| • | our ability to maintain our brand licenses at our hotels; |
| • | relationships with labor unions and changes in labor laws; |
| • | loss of our senior management team or key personnel; |
| • | our ability to identify and consummate acquisitions of additional hotels; |
| • | our ability to integrate and successfully operate any hotel properties acquired in the future and the risks associates with these hotel properties; |
ii
Table of Contents
| • | the impact of hotel renovations, repositionings, redevelopments and re-branding activities; |
| • | our ability to access capital for renovations and acquisitions on terms and at times that are acceptable to us; |
| • | the fixed cost nature of hotel ownership; |
| • | our ability to service our debt; |
| • | changes in interest rates and operating costs; |
| • | compliance with regulatory regimes and local laws; |
| • | uninsured or underinsured losses, including those relating to natural disasters or terrorism; |
| • | changes in distribution channels, such as through internet travel intermediaries; |
| • | our status as an emerging growth company; |
| • | the amount of debt that we currently have or may incur in the future; |
| • | provisions in our debt agreements that may restrict the operation of our business; |
| • | our separation from Inland American Real Estate Trust, Inc. (“Inland American”), our former parent, and our ability to operate as a stand-alone public company; |
| • | potential business conflicts of interests with Inland American; |
| • | our organizational and governance structure; |
| • | our status as a real estate investment trust (a “REIT”); |
| • | our taxable REIT subsidiary (“TRS”) lessee structure; |
| • | the cost of compliance with and liabilities under environmental, health and safety laws; |
| • | adverse litigation judgments or settlements; |
| • | changes in real estate and zoning laws and increase in real property tax rates; |
| • | changes in federal, state or local tax law, including legislative, administrative, regulatory or other actions affecting REITs; |
| • | changes in governmental regulations or interpretations thereof; and |
| • | estimates relating to our ability to make distributions to our stockholders in the future. |
These factors are not necessarily all of the important factors that could cause our actual financial results, performance, achievements or prospects to differ materially from those expressed in or implied by any of our forward-looking statements. Other unknown or unpredictable factors also could harm our results. All forward-looking statements attributable to us or persons acting on our behalf are expressly qualified in their entirety by the cautionary statements set forth above. Forward-looking statements speak only as of the date they are made, and we do not undertake or assume any obligation to update publicly any of these forward-looking statements to reflect actual results, new information or future events, changes in assumptions or changes in other factors affecting forward-looking statements, except to the extent required by applicable laws. If we update one or more forward-looking statements, no inference should be drawn that we will make additional updates with respect to those or other forward-looking statements.
BASIS OF PRESENTATION IN THIS ANNUAL REPORT ON FORM 10-K
On February 3, 2015, Xenia Hotels & Resorts, Inc., a Maryland corporation (“Xenia” or the “Company”), was spun-off from Inland American Real Estate Trust, Inc. (“Inland American”), its former parent, through a
iii
Table of Contents
taxable pro-rata distribution by Inland American of 95% of the outstanding common stock, $0.01 par value per share (the “Common Stock”), of Xenia to holders of record of Inland American’s common stock as of the close of business on January 20, 2015 (the “Record Date”). Each holder of record of Inland American’s common stock received one share of Common Stock for every eight shares of Inland American’s common stock held at the close of business on the Record Date (the “Distribution”). In lieu of fractional shares, stockholders of Inland American received cash. On February 4, 2015, Xenia’s Common Stock began trading on the New York Stock Exchange (“NYSE”) under the ticker symbol “XHR.” As a result of the Distribution, the Company became a stand-alone, publicly-traded company.
Prior to and in connection with our separation from Inland American, we effectuated the transactions (the “Reorganization Transactions”) described under “Part I–Item I. Business—Our Structure and Reorganization Transactions—Our Corporate Reorganization.”
Unless otherwise indicated or the context otherwise requires, all information herein reflects the consummation of the Reorganization Transactions, the disposition of other hotels previously owned by us and the completion of our separation from Inland American, which separation occurred on February 3, 2015. References herein to “we,” “our,” “us” and the “Company” refer to Xenia Hotels & Resorts, Inc. and its consolidated subsidiaries, including XHR LP, a Delaware limited partnership, which we refer to as our “operating partnership,” and references to “Xenia Hotels & Resorts, Inc.” refer only to Xenia Hotels & Resorts, Inc., exclusive of its subsidiaries, in each case giving effect to the Reorganization Transactions.
Presentation of historical operating and non-financial data and pro forma financial information
Unless otherwise indicated or the context otherwise requires, (i) operating and non-financial data, including occupancy (as defined below), ADR (as defined below), RevPAR (as defined below), number of hotels, number of rooms and Adjusted EBITDA, disclosed in the sections of this Annual Report on Form 10-K other than the Financial Statement Sections (as defined below) and (ii) pro forma financial information in this Annual Report:
| • | reflect the business and operations of the Company after the consummation of the Reorganization Transactions and immediately following the completion of the separation of the Company from Inland American on February 3, 2015, when we owned 46 premium full service, lifestyle and urban upscale hotels and a majority interest in two hotels under development; |
| • | exclude one hotel sold on May 30, 2014, one hotel sold on August 28, 2014 and one hotel sold on December 31, 2014; |
| • | with respect to the hotel acquired during 2014, give effect to such acquisition as if such acquisition had been consummated on January 1, 2014; |
| • | reflect the issuance on January 5, 2015 of 125 shares of preferred stock of the Company, designated as 12.5% Series A Cumulative Non-Voting Preferred Stock, $0.01 par value per share, with a liquidation preference of $1,000 per share (the “Series A Preferred Stock”), in a private placement to approximately 125 investors who qualify as “accredited investors” (as that term is defined in Rule 501(a) of Regulation D of the Securities Act of 1933, as amended (the “Securities Act”)) for an aggregate purchase price of $125,000, which we issued to facilitate our ability to qualify as a REIT in connection with a potential section 336(e) election under the Internal Revenue Code of 1986, as amended (the “Code”); |
| • | reflect the capital contribution from Inland American of $125.0 million made on February 3, 2015 in connection with our separation from Inland American (the “Capital Contribution”); |
| • | reflect the repayment of approximately $84.0 million of borrowings outstanding under existing mortgage indebtedness, funded by Inland American; |
| • | reflect an additional capital contribution of $16.0 million, all of which the Company intends to use to paydown existing mortgage indebtedness in 2015; |
iv
Table of Contents
| • | reflect a non-cash capital contribution of $96.0 million to settle the Company’s allocated share of Inland American’s unsecured credit facility as of December 31, 2014; |
| • | reflect the Company’s entry into a new $400 million unsecured revolving credit facility; |
| • | reflect the issuance of 113,396,997 shares of our common stock to Inland American pursuant to a stock dividend effectuated prior to the Distribution; |
| • | reflect the distribution of 107,728,104 shares of our common stock to holders of Inland American common stock on February 3, 2015 and 5,669,893 shares retained by Inland American; and |
| • | reflect certain other adjustments as described in “Unaudited Pro Forma Combined Consolidated Financial Statements.” |
Presentation of combined consolidated financial information and certain operating and non-financial data
Unless otherwise indicated or the context otherwise requires, (i) the historical financial data (excluding all pro forma financial data) in this Annual Report and (ii) the operating and non-financial data (but excluding all related data prepared on a pro forma basis), including occupancy, ADR, RevPAR, number of hotels, number of rooms, FFO (as defined below), Adjusted FFO (as defined below) and Adjusted EBITDA, disclosed in “Part II–Item 6. Selected Financial Data” and “Part II–Item 7. Management’s Discussion and Analysis of Financial Condition and Results of Operations” (excluding all pro forma financial data) (collectively, the “Financial Statement Sections”) reflects the combined and consolidated business and operations of the Company prior to consummation of the Reorganization Transactions and the completion of the Company’s separation from Inland American.
The market data and certain other statistical information used throughout this Annual Report are based on independent industry publications, government publications or other published independent sources. These sources generally state that the information they provide has been obtained from sources believed to be reliable, but that the accuracy and completeness of the information are not guaranteed. The forecasts and projections are based on industry surveys and the preparers’ experience in the industry, and there is no assurance that any of the projected amounts will be achieved. We believe that the surveys and market research others have performed are reliable, but we have not independently verified this information. STR. Inc. (“STR”) and PKF Hospitality Research, LLC (“PKF-HR”) are the primary sources for third-party market data and industry statistics and forecasts. STR does not guarantee the performance of any company about which it collects and provides data. The reproduction of STR’s data without their written permission is strictly prohibited. Nothing in the STR or PKF-HR data should be construed as advice. Some data is also based on our good faith estimates.
TRADEMARKS, SERVICE MARKS AND TRADENAMES
Xenia™ and related trademarks, trade names and service marks of Xenia appearing in this Annual Report are the property of Xenia. Unless otherwise noted, all other trademarks, trade names or service marks appearing in this Annual Report are the property of their respective owners, including Marriott International, Inc., Hilton Worldwide Inc., Hyatt Hotels Corporation, Starwood Hotels and Resorts Worldwide, Inc., The Kimpton Hotel & Restaurant Group Inc., Aston Hotels & Resorts LLC, Fairmont Hotels & Resorts and Loews Hotels, or their respective parents, subsidiaries or affiliates (“Brand Companies”). In the event that any of our management agreements or franchise agreements with the Brand Companies are terminated for any reason, the use of all applicable trademarks and service marks owned by the Brand Companies will cease at the hotel where the management agreement or franchise agreement was terminated; all signs and materials bearing the marks and other indicia connecting the hotel to the Brand Companies will be removed (at the hotel’s or our expense).
v
Table of Contents
None of the Brand Companies or their respective directors, officers, agents or employees are issuers of the shares described herein or had responsibility for the creation or contents of this Annual Report. None of the Brand Companies or their respective directors, officers, agents or employees make any representation or warranty as to the accuracy, adequacy or completeness of any of the following information, including any financial information and any projections of future performance. The Brand Companies do not have an exclusive relationship with us and will continue to be engaged in other business ventures, including the acquisition, development, construction, ownership or operation of lodging, residential and vacation ownership properties, which are or may become competitive with the properties held by us.
Except where the context suggests otherwise, we define certain terms in this Annual Report as follows:
| • | “ADR” or “average daily rate” means hotel room revenue divided by total number of rooms sold in a given period; |
| • | “Adjusted FFO” means FFO (as defined below), adjusted for certain items such as hotel property acquisition and pursuit costs and other expenses we believe do not represent recurring operations; |
| • | “Aston,” “Fairmont,” “Hilton,” “Hyatt,” “Kimpton,” “Loews,” “Marriott,” and “Starwood” mean Aston Hotels & Resorts LLC, Fairmont Hotels & Resorts, Hilton Worldwide Inc., Hyatt Hotels Corporation, The Kimpton Hotel & Restaurant Group Inc., Loews Hotels, Marriott International, Inc., and Starwood Hotels and Resorts Worldwide, Inc., respectively, as well as their respective parents, subsidiaries or affiliates; |
| • | “CAGR” means compound annual growth rate; |
| • | “FFO” means a measure that reflects net income or loss (calculated in accordance with U.S. generally accepted accounting principles (“GAAP”)) excluding real estate depreciation and amortization, gains (losses) from sales of real estate, impairments of real estate assets, the cumulative effect of changes in accounting principles and adjustments for unconsolidated partnerships and joint ventures; |
| • | “Inland American” means Inland American Real Estate Trust, Inc., a Maryland corporation that has elected to be taxed and currently qualifies, as a REIT, and that owned 100% of the outstanding shares of the common stock of the Company prior to giving effect to the separation on February 3, 2015, and, as the context may require, its consolidated subsidiaries other than us; |
| • | a “lifestyle” hotel refers to an innovative hotel with a focus on providing a unique and individualized guest experience in a smaller footprint by combining traditional hotel services with modern technologies and placing an emphasis on local influence; |
| • | a “luxury” hotel refers to a luxury hotel as defined by STR; |
| • | “occupancy” means the total number of rooms sold in a given period divided by the total number of rooms available at a hotel or group of hotels; |
| • | a “premium full service hotel” refers to a hotel defined as “upper upscale” or “luxury” by STR; |
| • | “RevPAR” or “revenue per available room” means hotel room revenue divided by room nights available to guests for a given period, and does not include non-room revenues such as food and beverage revenue or other operating revenues; |
| • | “Top 25 Markets” refers to the top 25 U.S. lodging markets as defined by STR; |
| • | “TRS” refers to a taxable REIT subsidiary under the Code. “Our TRS” refers to XHR Holding, Inc., a wholly-owned subsidiary of our operating partnership that will elect to be a TRS of ours; |
vi
Table of Contents
| • | “TRS lessees” refers to the direct and indirect wholly-owned subsidiaries of our TRS; |
| • | an “upper midscale” hotel refers to an upper midscale hotel as defined by STR; |
| • | an “upper upscale” hotel refers to an upper upscale hotel as defined by STR; |
| • | an “upscale” hotel refers to an upscale hotel as defined by STR; and |
| • | an “urban upscale” hotel refers to a hotel located in an urban or similar high-density commercial area, such as a central business district, and defined as “upscale” or “upper midscale” by STR. |
vii
Table of Contents
PART I
Recent Developments
On February 3, 2015, Xenia Hotels & Resorts, Inc., a Maryland corporation, was spun-off from Inland American Real Estate Trust, Inc. (“Inland American”), its former parent, through a taxable pro-rata distribution by Inland American of 95% of the outstanding common stock, $0.01 par value per share (the “Common Stock”), of Xenia to holders of record of Inland American’s common stock as of the close of business on January 20, 2015 (the “Record Date”). Each holder of record of Inland American’s common stock received one share of Common Stock for every eight shares of Inland American’s common stock held at the close of business on the Record Date (the “Distribution”). In lieu of fractional shares, stockholders of Inland American received cash. On February 4, 2015, Xenia’s Common Stock began trading on the New York Stock Exchange (“NYSE”) under the ticker symbol “XHR.” As a result of the Distribution, the Company became a stand-alone, publicly-traded company.
In connection with and in order to effectuate the separation and distribution, we and Inland American entered into a Separation and Distribution Agreement. In addition, we entered into various other agreements with Inland American to effect the separation and provide a framework for our relationship with Inland American post-separation, such as a Transition Services Agreement and an Employee Matters Agreement. These agreements provide for the allocation between us and Inland American of Inland American’s assets, liabilities and obligations (including its properties, employees and tax-related assets and liabilities) attributable to periods prior to, at and after our separation from Inland American and govern certain relationships between us and Inland American after the separation. For more information regarding these agreements, see “Part III-Item 13. Certain Relationships and Related Transactions and Director Independence.”
Effective February 3, 2015, we entered into a $400 million unsecured revolving credit facility with a syndicate of banks. For additional information, see “Part II—Item 7. Management’s Discussion and Analysis of Financial Condition and Results of Operations—Liquidity and Capital Resources—Credit Facility.”
On February 4, 2015, in conjunction with the listing of our common stock on the NYSE, the Company commenced a modified “Dutch Auction” self-tender offer (the “Tender Offer”) to purchase for cash up to $125 million in value of shares of the Company’s common stock at a price not greater than $21.00 nor less than $19.00 per share, net to the seller in cash, less any applicable withholding of taxes and without interest. The Tender Offer expired at 5:00 P.M., New York City Time, on March 5, 2015. As a result of the Tender Offer, the Company accepted for purchase 1,759,344 shares of its common stock at a purchase price of $21.00 per share, for an aggregate purchase price of $36.9 million (excluding fees and expenses relating to the Tender Offer), which was funded from cash on hand. The 1,759,344 shares of common stock accepted for purchase in the Tender Offer represent approximately 1.6% of the Company’s common stock outstanding as of February 3, 2015, the last day prior to the commencement of the Tender Offer. Stockholders who properly tendered and did not properly withdraw shares of common stock in the Tender Offer at or below the final purchase price of $21.00 per share had all of their tendered shares of common stock purchased by the Company at $21.00 per share. Immediately following completion of the Tender Offer, the Company had approximately 111,664,641 shares of common stock outstanding.
On March 2, 2015, we paid off a mortgage in the amount of $26.3 million relating to the Andaz San Diego.
On March 13, 2015, the Company’s Board of Directors authorized a cash dividend of $0.1457 per share of the Company’s Common Stock for the first quarter of 2015. The dividend represents the Company’s anticipated regular quarterly dividend of $0.23 per share, prorated for the period from February 3, 2015, the Distribution date, to March 31, 2015, the last day of the first quarter. The dividend will be paid on April 15, 2015 to all holders of record of the Company’s Common Stock as of the close of business on March 31, 2015. For additional information, see “Part II—Item 5. Market for Registrant’s Common Equity, Related Stockholder Matters and Issuer Purchases of Equity Securities—Dividends.”
1
Table of Contents
Overview
We are a self-advised and self-administered REIT that invests primarily in premium full service, lifestyle and urban upscale hotels, with a focus on the Top 25 Markets as well as key leisure destinations in the United States. As of December 31, 2014, we owned 46 hotels, comprising 12,636 rooms, across 19 states and the District of Columbia, and had a majority interest in two hotels under development. Our hotels are primarily operated by industry leaders such as Marriott, Hilton, Hyatt, Starwood, Kimpton, Aston, Fairmont and Loews, as well as leading independent management companies, under the brands listed in the following table(1):
| Brand Affiliation |
Number of Hotels |
Number of Rooms |
Percentage of Total Rooms |
|||||||||
| Marriott |
||||||||||||
| Autograph Collection(2) |
3 | 437 | 3.5 | % | ||||||||
| Courtyard by Marriott |
4 | 630 | 5.0 | % | ||||||||
| Marriott |
9 | 3,099 | 24.5 | % | ||||||||
| Renaissance |
2 | 1,014 | 8.0 | % | ||||||||
| Residence Inn |
3 | 637 | 5.0 | % | ||||||||
|
|
|
|
|
|
|
|||||||
| Subtotal |
21 | 5,817 | 46.0 | % | ||||||||
| Hilton |
||||||||||||
| DoubleTree |
1 | 220 | 1.7 | % | ||||||||
| Embassy Suites |
1 | 223 | 1.8 | % | ||||||||
| Hampton Inn |
2 | 264 | 2.1 | % | ||||||||
| Hilton |
3 | 669 | 5.3 | % | ||||||||
| Hilton Garden Inn |
2 | 478 | 3.8 | % | ||||||||
| Homewood Suites |
1 | 162 | 1.3 | % | ||||||||
|
|
|
|
|
|
|
|||||||
| Subtotal |
10 | 2,016 | 16.0 | % | ||||||||
| Hyatt |
||||||||||||
| Andaz |
3 | 451 | 3.6 | % | ||||||||
| Hyatt |
1 | 118 | 0.9 | % | ||||||||
| Hyatt Regency |
2 | 1,154 | 9.1 | % | ||||||||
|
|
|
|
|
|
|
|||||||
| Subtotal |
6 | 1,723 | 13.6 | % | ||||||||
| Kimpton |
||||||||||||
| Lorien |
1 | 107 | 0.8 | % | ||||||||
| Monaco |
3 | 605 | 4.8 | % | ||||||||
|
|
|
|
|
|
|
|||||||
| Subtotal |
4 | 712 | 5.6 | % | ||||||||
| Starwood |
||||||||||||
| Westin |
2 | 893 | 7.1 | % | ||||||||
|
|
|
|
|
|
|
|||||||
| Subtotal |
2 | 893 | 7.1 | % | ||||||||
| Aston |
1 | 645 | 5.1 | % | ||||||||
| Fairmont |
1 | 545 | 4.3 | % | ||||||||
| Loews |
1 | 285 | 2.3 | % | ||||||||
|
|
|
|
|
|
|
|||||||
| Total |
46 | 12,636 | 100.0 | % | ||||||||
|
|
|
|
|
|
|
|||||||
| (1) | The table excludes our two hotels under development. |
| (2) | Our two hotels under development are Autograph Collection hotels, which will have a total of 150 rooms. |
2
Table of Contents
The following table sets forth certain information about our portfolio of hotels on a pro forma(1) basis:
| Year Ended December 31, | ||||||||||||
| 2014(3) | 2013 | 2012 | ||||||||||
| Statistical Data: |
||||||||||||
| Number of Hotels(2) |
46 | 45 | 31 | |||||||||
| Number of Rooms(2) |
12,636 | 11,991 | 8,688 | |||||||||
| Occupancy(1) |
76.3 | % | 75.2 | % | 71.5 | % | ||||||
| ADR(1) |
$ | 177.95 | $ | 167.19 | $ | 151.82 | ||||||
| RevPAR(1) |
$ | 135.76 | $ | 125.73 | $ | 108.54 | ||||||
| (1) | Includes full year data for any hotel acquired during the applicable period by including applicable data for such hotels while they were under prior ownership. See “Part II—Item 7. Management’s Discussion and Analysis of Financial Condition and Results of Operations—Results of Operations” for a presentation of such statistics from the date of acquisition of such hotels. For only those hotels operated by Marriott, our historical annual operating results represented here from 2012 to 2013 include a 52-53 week fiscal calendar used by Marriott at that time. |
| (2) | The table excludes our two hotels under development. |
| (3) | Full-year data for 2014 reflects impact by the August 2014 South Napa Earthquake which resulted in damage at two hotels, the Andaz Napa and Marriott Napa Valley Hotel & Spa. The Marriott sustained limited damage, with 4,305 room nights out of order, and fully re-opened in October 2014. The Andaz partially re-opened in December 2014, with a total 17,106 room nights out of order, and fully re-opened in January 2015. |
On a pro forma basis, for the twelve months ended December 31, 2014, we generated pro forma revenues of $919.0 million, pro forma Adjusted EBITDA of $254.8 million, and net income attributable to Company of $44.4 million. In addition, for the twelve months ended December 31, 2014, 76.1% of our pro forma revenues were derived from hotels located in the Top 25 Markets and key leisure destinations. For our definition of Adjusted EBITDA and why we present it as well as a reconciliation of Adjusted EBITDA to net income attributable to Company, the most directly comparable GAAP financial measure, see “Part II–Item 6. Selected Financial Data” and “Part II–Item 6A. Pro Forma Financial Information”. See also “Basis of Presentation in this Annual Report on Form 10-K.” We currently estimate that the damage resulting from the August 2014 earthquake in Northern California at our two hotels, the Marriott Napa Valley & Spa and Andaz Napa, will negatively impact our 2015 Adjusted EBITDA by approximately $4 million to $5 million.
We plan to grow our business through a differentiated acquisition strategy, aggressive asset management and capital investment in our properties. We primarily target markets and sub-markets with particular positive characteristics, such as multiple demand generators, favorable supply and demand dynamics and attractive projected RevPAR growth. We believe our focus on a broader range of markets allows us to evaluate a greater number of acquisition opportunities and thereby be highly selective in our pursuit of only those opportunities which best fit our investment criteria.
We own and pursue hotels in the upscale, upper upscale and luxury segments that are affiliated with premium, leading brands, as we believe that these segments yield attractive risk-adjusted returns. Within these segments, we focus on hotels that will provide guests with a distinctive lodging experience, tailored to reflect local market environments rather than hotels that are heavily dependent on conventions and group business. We also seek properties that exhibit an opportunity for us to enhance operating performance through aggressive asset management and targeted capital investment. By balancing our portfolio between premium full service, lifestyle and urban upscale hotels with these characteristics we believe we are able to achieve strong cash flows and attractive returns.
Since 2010, we have acquired 28 of our hotels, a total of 8,562 rooms, for an aggregate purchase price of approximately $2.0 billion. Additionally, since 2008, we have invested a total of approximately $235 million
3
Table of Contents
during our ownership period in capital expenditures to competitively position our portfolio to increase revenues as well as to keep our hotels well maintained. Our in-house project management team, currently consisting of eight individuals, manages all of our capital expenditure projects, which we believe provides us with a competitive advantage.
We believe that the current market environment presents attractive opportunities for us to acquire additional hotels with significant upside potential that are compatible with our investment strategy. We also believe that current lodging market fundamentals provide meaningful opportunities for revenue and Adjusted EBITDA growth at our existing hotels. We enhance the value of our existing hotels through focused asset management and targeted renovation projects. We believe that by pursuing this strategy, we will strengthen our position as a leading owner of hotel properties across our targeted segments. We believe that our senior management team’s overall lodging experience and proven track record, as well as its in-depth knowledge of our hotels and long-standing and extensive relationships within the lodging industry, enable us to successfully execute on our business strategy to earn returns in excess of our cost of capital and create long-term value for our stockholders.
We intend to elect to be taxed as a REIT under the Code, beginning with our taxable year that commenced on January 5, 2015. To qualify as a REIT, we cannot operate or manage our hotels. Accordingly, we lease all hotels to our “TRS lessees”. All of our hotels are operated pursuant to hotel management agreements with third party management companies. See “Part I–Item 1. Business—Our Tax Status.”
Our Competitive Strengths
We believe the following strengths will help us to achieve strong cash flows and attractive returns:
| • | High Quality Portfolio Operated Under Premium Brands. Substantially all of our hotels operate under premium brands affiliated with industry leaders such as Marriott, Hilton, Hyatt, Starwood, Kimpton, Aston, Fairmont and Loews and are located in urban or densely populated suburban markets that we believe have multiple demand generators and high barriers to entry. Additionally, our portfolio includes lifestyle hotels that seek to attract the next generation traveler (i.e., hotels that offer a distinctive lodging experience, both in terms of “destination” locations and in highly personalized service), such as our Andaz, Kimpton and Autograph Collection hotels. Lifestyle hotels are a fast growing segment in key urban markets that we believe have an attractive investment profile. The following chart represents the brand affiliations of our portfolio as of December 31, 2014. |
Portfolio Breakdown by Brand Affiliation(1)
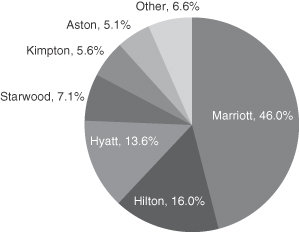
| (1) | Percentages indicate percent of total rooms as of December 31, 2014. Excludes our two hotels under development. |
4
Table of Contents
We believe the quality of our portfolio is evidenced by its RevPAR and the amount by which its RevPAR exceeds the national average. For the years ended December 31, 2013 and 2014, our portfolio generated RevPAR of $125.73 and $135.76, respectively, representing multiples of 1.83x and 1.83x, respectively, of the national average for hotels of all chain scales, as reported by STR. As of December 31, 2014, our portfolio included five luxury hotels, 27 upper upscale hotels, and 12 upscale hotels (one of which was acquired in 2014). Additionally, our hotels are well maintained and competitively positioned, as we have invested an aggregate of $235 million during our ownership period in capital expenditures from January 1, 2008 through December 31, 2014 (excluding our two hotels under construction), as described below.
| Year |
Number of Hotels (1) | Amount Expended(2) ($mm) | ||||||
| 2008 |
5 | $ | 14.2 | |||||
| 2009 |
18 | $ | 30.3 | |||||
| 2010 |
18 | $ | 22.2 | |||||
| 2011 |
21 | $ | 29.1 | |||||
| 2012 |
24 | $ | 51.2 | |||||
| 2013 |
31 | $ | 41.5 | |||||
| 2014 |
45 | $ | 46.6 | |||||
| (1) | Hotels owned as of January 1 of the applicable year. |
| (2) | These amounts do not include meaningful capital expenditures invested by prior owners. |
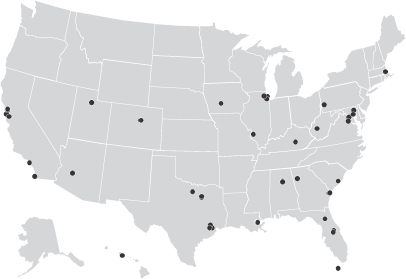
| • | Differentiated Market Strategy That Drives Attractive Growth. Our management team has implemented and executed a strategy of acquiring hotels primarily in the Top 25 Markets and key leisure destinations in the U.S., which has resulted in a diversified portfolio with a national footprint. As of December 31, 2014, we owned 46 hotels, comprising 12,636 rooms, across 19 states and the District of Columbia, and had a majority interest in two hotels under development. As depicted in the map below, the hotels in our portfolio are geographically diverse, and no one market and no individual hotel accounted for more than 14.2% or 6.4%, respectively, of our total pro forma revenue for the year ended December 31, 2014. As of December 31, 2014, our largest concentrations of hotels by room count per state were 24.2% in Texas and 19.1% in California. |
Portfolio Breakdown by Geography
5
Table of Contents
We base our acquisition strategy on the Top 25 Markets because we believe these markets present an attractive risk-adjusted return potential supported by historical and projected favorable supply and demand dynamics and higher projected RevPAR growth at attractive valuations.
Since 2010, we have acquired 28 hotels for an aggregate purchase price of $1,953 million. The following table sets forth additional information regarding recent acquisitions:
| Year |
Number of Assets |
Price ($mm) (1) |
||||||
| 2010 |
3 | $ | 104 | |||||
| 2011 |
3 | $ | 167 | |||||
| 2012 |
7 | $ | 525 | |||||
| 2013 |
14 | $ | 974 | |||||
| 2014 |
1 | $ | 183 | |||||
|
|
|
|
|
|||||
| Total |
28 | $ | 1,953 | |||||
|
|
|
|
|
|||||
| (1) | Includes purchase price plus additional contingent consideration pursuant to the respective purchase and sale agreement. |
| • | Attractive Cash Flow Characteristics. Our strategy focuses on driving strong current income and attractive operating margins, and each type of hotel in our portfolio has characteristics that lead to strong current cash flows. For example, because urban upscale hotels offer limited food outlets and other amenities, we can deliver a satisfying guest experience without the expense of staffing these lower-margin ancillary activities, thereby, resulting in strong bottom line performance. Our lifestyle assets are generally characterized by smaller physical footprints, leading to lower cost bases, and higher RevPAR, in comparison to traditional full-service hotels in their respective markets. Our premium full-service hotels are designed to offer a wide variety of income streams, including restaurants, meeting facilities, parking facilities and ancillary opportunities, and we utilize sophisticated asset management techniques to continually monitor and seek to improve performance from every income stream at these hotels. This combination of factors among differing hotel types ultimately results in strong cash flow generation and growth profile across our portfolio. Further, our aggressive, focused asset management and project management strategies seek to identify opportunities to enhance revenue and improve hotel operating margins. |
| • | Strong and Flexible Balance Sheet with Capacity for Growth. We are well-capitalized and moderately levered, with strong liquidity and access to multiple capital sources. As of December 31, 2014, we have pro forma net debt to pro forma Adjusted EBITDA of 4.4x. This calculation reflects the repayment of approximately $26.3 million of borrowings outstanding under existing mortgage indebtedness repaid on March 2, 2015 and reflects excess cash on hand at the Company of approximately $41.0 million at the time of our separation from Inland American. Concurrent with the listing of our common stock, we entered into an unsecured revolving credit facility pursuant to which we may borrow up to $400 million, which we believe provides us liquidity and flexibility to execute our growth strategy and manage short-term cash flow needs. We also have a well-staggered debt maturity profile. Our flexible capital structure enables us to be opportunistic in making acquisitions and reinvesting in our portfolio and strategic in determining which capital sources to utilize. |
Business and Growth Strategies
Our objective is to invest primarily in premium full service, lifestyle and urban upscale hotels at valuations where we believe we can generate attractive returns on investment and long-term value appreciation and improve the value of our portfolio through aggressive asset management of our existing portfolio and future acquired hotels. We pursue this objective through the following investment and growth strategies:
| • | Pursue Differentiated Investment Strategy Across Targeted Markets. We use our management team’s network of relationships in the lodging industry and our relationships with the 15 hotel |
6
Table of Contents
| management companies that currently manage assets in our portfolio, among others, to continue to source acquisition opportunities. When evaluating opportunities, we consider the following characteristics: |
| • | Market Characteristics. We seek opportunities across a range of urban and dense suburban areas, as well as key leisure destinations, in the United States. We believe that this strategy provides us with a broader range of opportunities and allows us to target markets and sub-markets with particular positive characteristics, such as multiple demand generators, favorable supply and demand dynamics and attractive projected RevPAR growth. We believe assets in the Top 25 Markets present attractive investment opportunities considering the favorable supply and demand dynamics, RevPAR growth trends and attractive valuations. |
| • | Asset Characteristics. We generally pursue hotels in the upscale, upper upscale and luxury segments that are affiliated with leading premium brands, as we believe these segments yield attractive risk-adjusted returns. Further, PKF-HR projects strong RevPAR growth across these segments through 2016. Within these segments, we seek hotels that will provide guests with a distinctive lodging experience, tailored to reflect local market environments rather than invest in properties that are heavily dependent on conventions and group business. We seek properties with desirable locations within their markets, exceptional facilities, and other competitive advantages that are hard to replicate. We also favor properties that can be purchased well below estimated replacement cost. We believe that our focus on premium full service, lifestyle, and urban upscale assets allows us to seek appropriate investments that are well suited for specific markets. |
| • | Operational and Structural Characteristics. We pursue both newly constructed assets that require limited capital investment as well as more mature and complex properties with opportunities for our dedicated asset and project management teams to create value through more active operational oversight and targeted capital expenditures. Additionally, we seek properties that are unencumbered by debt and that will not require joint venture ownership, allowing us maximum operational flexibility. |
We believe that our multi-pronged approach to investing provides us the flexibility to pursue attractive opportunities whenever and wherever they are presented.
| • | Drive Growth through Proactive, Value-Added Asset Management, Project Management and Capital Allocation. We believe that investing in our properties and employing a proactive asset management approach designed to identify investment strategies will optimize internal growth opportunities. Our management team’s extensive industry experience across multiple brands and management companies and our integrated asset management and project management teams, enable us to identify and implement value-added strategies, prudently invest capital in our assets to optimize operating results and leverage best practices across our portfolio. |
| • | Aggressive Asset Management Strategy Drives Performance. Our experienced asset management team focuses on driving property performance through revenue enhancement and cost containment efforts. Our ability to work with a wide variety of management and franchise companies provides us with the opportunity to benchmark performance across our portfolio in order to share best practices. While we do not operate our hotel properties directly, and under the terms of our hotel management agreements our ability to participate in operating decisions regarding our hotels is limited, we conduct regular revenue, sales, and financial performance reviews and also perform in-depth on-site reviews focused on ongoing operating margin improvement initiatives. We interact frequently with our management companies and on-site management personnel, including conducting regular meetings with key executives of our management companies and brands. We work to maximize value of our assets through all aspects of the hotel operation and ancillary real estate opportunities. |
| • | In-House Project Management Provides Better and Faster Capital Plan Execution. By maintaining a dedicated in-house capital planning and project management team, we believe we |
7
Table of Contents
| are able to develop our capital plans and execute our renovation projects at a lower cost and in a more timely manner than if we outsourced these services. In addition, our project management team has extensive experience in the ground-up development of hotel properties, providing both in-depth knowledge of building construction as well as the opportunity for us to evaluate potential development opportunities. We view this as a significant competitive strength relative to many of our peers. |
| • | Rigorous Capital Allocation Strategies Enhance Portfolio Performance. As part of our ongoing asset management activities, we regularly review opportunities to reinvest in our hotels to maintain quality, increase long-term value and generate attractive returns on invested capital. We also may opportunistically dispose of hotels to take advantage of market conditions or in situations where the hotels no longer fit within our strategic objectives. We believe our breadth of experience and integrated in-house asset management and project management teams are instrumental in our ability to acquire and operate assets and to capitalize on redevelopment opportunities. |
| • | Leverage Existing Infrastructure for Growth. Prior to the sale of the Suburban Select Service Portfolio (defined below), our asset management and project management employees were responsible for asset management oversight of a portfolio consisting of substantially more hotels. We have retained all of our asset management and project management employees after our separation from Inland American, who are solely focused on aggressively asset managing our hotels. We believe this continuity will provide us with the capacity to accommodate additional growth without a corresponding increase in employees focusing on asset management and project management. Our core acquisition, asset management and project management teams have been working together for a number of years and have well-established systems and procedures. |
Our Financing Strategy
We maintain a strong, flexible and growth-oriented capital structure that will allow us to access multiple forms of capital and be strategic in determining when to access the debt or equity markets. As of December 31, 2014, we have pro forma net debt to pro forma Adjusted EBITDA of 4.4x. This calculation reflects the repayment of approximately $26.3 million of borrowings outstanding under existing mortgage indebtedness repaid on March 2, 2015 and assumes excess cash on hand at the Company of approximately $41.0 million at the time of our separation from Inland American. Concurrently with the Distribution, we entered into an unsecured revolving credit facility pursuant to which we may borrow up to $400 million, which we believe provides us liquidity and flexibility to execute our growth strategy and manage short-term cash flow needs. We also have a well-staggered debt maturity profile. We believe our moderate leverage and strong liquidity will allow us to be proactive in pursuing our growth strategy.
Competition
The U.S. lodging industry is highly competitive. Our hotels compete with other hotels for guests in each of their markets on the basis of several factors, including, among others, room rates, quality of accommodations, service levels and amenities, location, brand affiliation, reputation and reservation systems. Competition is often specific to the individual markets in which our hotels are located and includes competition from existing and new hotels. We believe that hotels, such as our portfolio of hotels, that are affiliated with leading national brands, will enjoy the competitive advantages associated with operating under such brands. Increased competition could harm our occupancy and revenues and may require us to provide additional amenities or make capital improvements that we otherwise would not have to make, which may materially and adversely affect our operating results and liquidity.
We face competition for the acquisition of hotels from other REITs, private equity firms, institutional investors, hedge funds, specialty finance companies, insurance companies, governmental bodies and other
8
Table of Contents
entities. Some of these competitors have substantially greater financial and operational resources and access to capital than we have and may have greater knowledge of the markets in which we seek to invest. This competition may reduce the number of suitable investment opportunities offered to us and decrease the attractiveness of the terms on which we may acquire our targeted hotel investments, including the cost thereof. In addition, these competitors seek financing through the same channels that we do. Therefore, we compete for funding in a market where funds for real estate investment may decrease, or grow less than the underlying demand.
Seasonality
The lodging industry is seasonal in nature which can be expected to cause fluctuations in our hotel room revenues, occupancy levels, room rates, operating expenses and cash flows. The periods during which our hotels experience higher or lower levels of demand vary from property to property and depend upon location, type of property, and competitive mix within the specific location. Based on historical results for our portfolio, our revenues have been the lowest during the first quarter of each year.
Cyclicality
The hospitality industry is cyclical and generally follows the overall economy. There is a history of increases and decreases in demand for hotel rooms, in occupancy levels and in rates realized by owners of hotels through economic cycles. Variability of results through some of the cycles in the past has been more severe due to changes in the supply of hotel rooms in given markets or in given segments of hotels. The combination of changes in economic conditions and in the supply of hotel rooms can result in significant volatility in results for owners of hotel properties. The costs of running a hotel tend to be more fixed than variable. Because of this, in an environment of declining revenues the rate of decline in earnings will be higher than the rate of decline in revenues. Conversely, in an environment of increasing demand and room rates, the rate of increase in earnings is typically higher than the rate of increase in revenues.
Regulations
General
Our hotels are subject to various U.S. federal, state and local laws, ordinances and regulations, including regulations relating to common areas and fire and safety requirements. We believe that each of our hotels has the necessary permits and approvals to operate its business.
Americans with Disabilities Act
Our hotels must comply with applicable provisions of the Americans with Disabilities Act (the “ADA”), to the extent that such hotels are “public accommodations” as defined by the ADA. The ADA may require removal of structural barriers to access by persons with disabilities in certain public areas of our hotels where such removal is readily achievable. We believe that our hotels are in substantial compliance with the ADA and that we will not be required to make substantial capital expenditures to address the requirements of the ADA. However, non-compliance with the ADA could result in imposition of fines or an award of damages to private litigants. The obligation to make readily achievable accommodations is an ongoing one, and we will continue to assess our hotels and to make alterations as appropriate in this respect.
Environmental Matters
Under various laws relating to the protection of the environment, a current or previous owner or operator (including tenants) of real estate may be liable for contamination resulting from the presence or discharge of hazardous or toxic substances at that property and may be required to investigate and clean up such contamination at that property or emanating from that property. These costs could be substantial and liability
9
Table of Contents
under these laws may attach without regard to whether the owner or operator knew of, or was responsible for, the presence of the contaminants, and the liability may be joint and several. The presence of contamination or the failure to remediate contamination at our hotels may expose us to third-party liability or materially and adversely affect our ability to sell, lease or develop the real estate or to incur debt using the real estate as collateral.
Our hotels are subject to various federal, state, and local environmental, health and safety laws and regulations that address a wide variety of issues, including, but not limited to, storage tanks, air emissions from emergency generators, storm water and wastewater discharges, lead-based paint, mold and mildew and waste management. Our hotels incur costs to comply with these laws and regulations and could be subject to fines and penalties for noncompliance.
Some of our hotels contain asbestos-containing building materials. We believe that the asbestos is appropriately contained, in accordance with current environmental regulations and that we have no need for any immediate remediation or current plans to remove the asbestos. Environmental laws require that owners or operators of buildings with asbestos-containing building materials properly manage and maintain these materials, adequately inform or train those who may come into contact with asbestos and undertake special precautions, including removal or other abatement, in the event that asbestos is disturbed during building renovation or demolition. These laws may impose fines and penalties on building owners or operators for failure to comply with these requirements. In addition, third parties may seek recovery from owners or operators for personal injury associated with exposure to asbestos-containing building materials.
Some of our hotels may contain or develop harmful mold or suffer from other adverse conditions, which could lead to liability for adverse health effects and costs of remediation. The presence of significant mold or other airborne contaminants at any of our hotels could require us to undertake a costly remediation program to contain or remove the mold or other airborne contaminants from the affected hotel or increase indoor ventilation. In addition, the presence of significant mold or other airborne contaminants could expose us to liability from guests or employees at our hotels and others if property damage or health concerns arise.
Insurance
We carry comprehensive general liability, fire, extended coverage, business interruption, rental loss coverage and umbrella liability coverage on all of our hotels and earthquake, wind, flood, hurricane and environmental coverage on hotels in areas where we believe such coverage is warranted, in each case with limits of liability that we deem adequate. Similarly, we are insured against the risk of direct physical damage in amounts we believe to be adequate to reimburse us, on a replacement basis, for costs incurred to repair or rebuild each hotel, including loss of rental income during the reconstruction period. We have selected policy specifications and insured limits which we believe to be appropriate given the relative risk of loss, the cost of coverage and industry practice. We do not carry insurance for generally uninsured losses, including, but not limited to, losses caused by riots, war or acts of God. We believe our hotels are adequately insured.
Employees
As of December 31, 2014, we had 36 employees. None of our employees are covered by collective bargaining agreements. Our third-party managers are responsible for hiring and maintaining the labor force at each of our hotels. Although we do not manage employees at our hotels, we are still subject to the many costs and risks generally associated with the hotel labor force. We believe relations with the employees of these third party managers are good. For a discussion of these relationships, see “Part I—Item 1A. Risk Factors—Risks Related to Our Business and Industry—We are subject to risks associated with the employment of hotel personnel, particularly with hotels that employ unionized labor, which could increase our operating costs, reduce the flexibility of our hotel managers to adjust the size of the workforce at our hotels and could materially and adversely affect our revenues and profitability.”
10
Table of Contents
Employees at certain of our third-party managed hotels are covered by collective bargaining agreements that are subject to review and renewal on a regular basis. For a discussion of these relationships, see “Part I–Item 1A. Risk Factors – Risks Related to Our Business and Industry – We are subject to risks associated with the employment of hotel personnel, particularly with hotels that employ unionized labor, which could increase our operating costs, reduce the flexibility of our hotel managers to adjust the size of the workforce at our hotels and could materially and adversely affect our revenues and profitability.”
Our Structure and Reorganization Transactions
Our History
We were formed as a Delaware corporation in 2007 as a wholly-owned subsidiary of Inland American. Subsequently, we changed our name from Inland American Lodging Group, Inc. to IA Lodging Group, Inc. and converted to a Maryland corporation in 2014. On August 5, 2014, we changed our name to Xenia Hotels & Resorts, Inc.
Our operating partnership was formed as a North Carolina limited partnership in 1994. Our wholly-owned subsidiary is the sole general partner of our operating partnership, and we conduct substantially all of our business through our operating partnership. We own 100% of the units of limited partnership (or “OP Units”) in our operating partnership. On September 17, 2014, our operating partnership was converted to a Delaware limited partnership and changed its name to XHR LP.
Prior to the internal reorganization transactions described below, we owned all of our hotels and certain of our TRS lessees, and our remaining TRS lessees were owned by subsidiaries of Inland American other than us. Prior to the internal reorganization transactions described below and the sale of 52 suburban select service hotels (the “Suburban Select Service Portfolio”), we also owned all of the Suburban Select Service Portfolio and subsidiaries leasing certain hotels in the Suburban Select Service Portfolio, and the remaining subsidiaries leasing the Suburban Select Service Portfolio were owned by subsidiaries of Inland American other than us.
The Suburban Select Service Portfolio was sold on November 17, 2014 to unaffiliated third party purchasers for approximately $1.1 billion, resulting in net proceeds to Inland American of approximately $480 million after prepayment of certain indebtedness and related costs. None of the proceeds from the sale of the Suburban Select Service Portfolio were retained by Xenia. Pursuant to the terms of the Separation and Distribution Agreement we entered into with Inland American in connection with the Distribution (the “Separation and Distribution Agreement”), we have agreed to assume the first $8 million of liabilities (including any related fees and expenses) incurred following the distribution relating to, arising out of or resulting from the ownership, operation or sale of the Suburban Select Service Portfolio and that relate to, arise out of or result from a claim or demand that is made against Xenia or Inland American by any person who is not a party or an affiliate of a party to the Separation and Distribution Agreement, other than liabilities arising from the breach or alleged breach by Inland American of certain fundamental representations made by Inland American to the third party purchasers of the Suburban Select Service Portfolio. We have also agreed to assume and indemnify Inland American for certain tax liabilities attributable to the Suburban Select Service Portfolio. As part of our working capital at the time of the Distribution, Inland American left us with cash estimated to be sufficient to satisfy such tax obligations. The hotels included in the Suburban Select Service Portfolio were not retained by Xenia because such hotels do not generally fit within our investment criteria of investing in premium full service, lifestyle and urban upscale hotels, with a focus on the Top 25 Markets as well as key leisure destinations in the United States. In selecting the hotels to retain in our portfolio, we also took into consideration factors such as supply growth dynamics in various markets, RevPAR and risk-adjusted return potential. We also sold one hotel on May 30, 2014, one hotel on August 28, 2014 and one hotel on December 31, 2014.
11
Table of Contents
Our Corporate Reorganization
On February 3, 2015, we were spun off from Inland American when it distributed to its stockholders one share of our common stock for every eight shares in Inland American common stock. On February 4, 2015, we became a stand-alone, publicly traded company when our common stock began trading on the NYSE under the ticker symbol “XHR.”
Prior to our separation from Inland American, we effectuated certain reorganization transactions which were designed to: consolidate the ownership of our hotels into our operating partnership; consolidate our TRS lessees into our TRS; facilitate our separation from Inland American and the distribution; and enable us to qualify as a REIT for U.S. federal income tax purposes beginning with our short taxable year that commenced on January 5, 2015.
The significant elements of our Reorganization Transactions included:
| • | The company was renamed and converted to a Maryland corporation; |
| • | Our operating partnership was renamed and converted to a Delaware limited partnership; |
| • | Certain of our TRS lessees were transferred from a subsidiary of Inland American into our TRS; |
| • | Certain subsidiaries owning our hotels were transferred to our operating partnership from other subsidiaries of ours, which subsidiaries were transferred to subsidiaries of Inland American other than us; |
| • | We classified and designated 125 shares of Series A Preferred Stock and issued 125 shares to 125 individual investors; |
| • | We issued 113,396,997 shares of our common stock to Inland American pursuant to a stock dividend effectuated prior to the Distribution; and |
| • | Certain subsidiaries that previously owned or leased the Suburban Select Service Portfolio or other hotels previously owned by us were transferred out of our operating partnership and our TRS and into subsidiaries of Inland American. |
12
Table of Contents
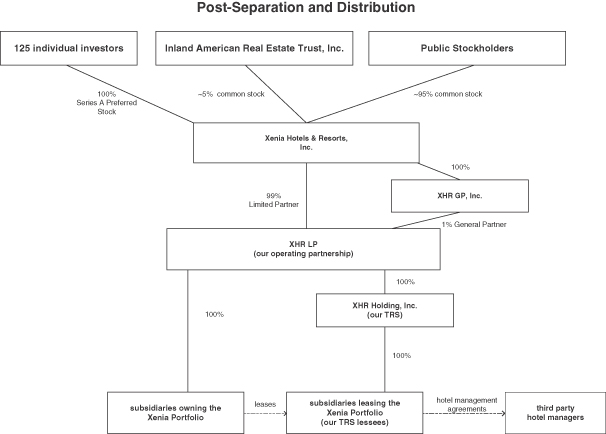
The following chart shows our structure following the Reorganization Transactions, the sale of the Suburban Select Service Portfolio and the Distribution.
Our Tax Status
We intend to elect to be taxed as a REIT under the Code for U.S. federal income tax purposes, beginning with our short taxable year that commenced on January 5, 2015. We believe that we have been organized and will operate in a manner that will allow us to qualify as a REIT for U.S. federal income tax purposes commencing with such short taxable year, and we intend to continue operating in such a manner. To qualify for REIT status, we must meet a number of organizational and operational requirements, including a requirement that we annually distribute to our stockholders at least 90% of our REIT taxable income, determined without regard to the dividends paid deduction and excluding any net capital gains.
We conduct our business through a traditional umbrella partnership real estate investment trust, or UPREIT, in which our hotels are indirectly owned by our operating partnership, through subsidiary limited partnerships, limited liability companies or other legal entities. We own and control 100% of the sole general partner of our operating partnership and own, directly or indirectly, 100% of the OP Units in our operating partnership. In the future, we may issue common or preferred units in our operating partnership from time to time in connection with acquisitions of hotels or for financing, compensation or other reasons.
In order for the income from our hotel operations to constitute “rents from real property” for purposes of the gross income tests required for REIT qualification, we cannot directly or indirectly operate any of our hotels. Accordingly, we lease each of our hotels, and intend to lease any hotels we acquire in the future, to our TRS lessees. As required for our qualification as a REIT, our TRS lessees have engaged third-party hotel management
13
Table of Contents
companies to manage our hotels on market terms. Our TRS lessees pay rent to us that we intend to treat as “rents from real property”. Our TRS, which will own our TRS lessees, is subject to U.S. federal, state and local income taxes applicable to corporations.
Restrictions on Ownership and Transfer of Our Stock
Our charter authorizes our directors to take such actions as are necessary or appropriate to enable us to qualify as a REIT. Furthermore, our charter prohibits any person from actually or constructively owning more than 9.8% in value or in number of shares, whichever is more restrictive, of the outstanding shares of any class or series of our capital stock. Our board of directors, in its sole discretion, may exempt (prospectively or retroactively) a person from the ownership limits if certain conditions are satisfied. However, our board of directors may not grant an exemption from the ownership limits to any proposed transferee whose ownership, direct or indirect, in excess of 9.8% of the value or number of outstanding shares of any class or series of our capital stock, could jeopardize our status as a REIT. These restrictions on transferability and ownership will not apply if our board of directors determines that it is no longer in our best interests to continue to qualify as a REIT or that compliance with such restrictions is no longer required for us to qualify as a REIT. The ownership limits may delay or impede a transaction or a change of control that might be in your best interest.
JOBS Act
As a company with less than $1.0 billion in revenue during our last fiscal year, we qualify as an “emerging growth company,” as defined in the Jumpstart Our Business Startups Act (the “JOBS Act”). Section 107 of the JOBS Act provides that an emerging growth company can take advantage of the extended transition period provided in Section 7(a)(2)(B) of the Securities Act, for complying with new or revised accounting standards. Thus, an emerging growth company can delay the adoption of certain accounting standards until those standards would otherwise apply to private companies. However, we are choosing to “opt out” of such extended transition period, and as a result, we will comply with new or revised accounting standards on the relevant dates on which adoption of such standards is required for non-emerging growth companies. Section 107 of the JOBS Act provides that our decision to opt out of the extended transition period for complying with new or revised accounting standards is irrevocable.
An emerging growth company may also take advantage of reduced reporting requirements that are otherwise applicable to public companies. These provisions include, but are not limited to:
| • | not being required to comply with the auditor attestation requirements of Section 404 of the Sarbanes-Oxley Act of 2002, as amended (the “Sarbanes-Oxley Act”); |
| • | reduced disclosure obligations regarding executive compensation in our periodic reports, proxy statements and registration statements; and |
| • | exemptions from the requirements of holding a nonbinding advisory vote on executive compensation and stockholder approval of any golden parachute payments not previously approved. |
We may take advantage of these provisions until we cease to be an emerging growth company. We will, in general, qualify as an emerging growth company until the earliest of (a) the last day of our fiscal year following the fifth anniversary of the date of our separation from Inland American; (b) the last day of our fiscal year in which we have an annual gross revenue of $1.0 billion or more; (c) the date on which we have, during the previous three-year period, issued more than $1.0 billion in non-convertible debt; and (d) the date on which we are deemed to be a “large accelerated filer” as defined in Rule 12b-2 under the Securities and Exchange Act of 1934 (the “Exchange Act”), which would occur at such time as we (1) have an aggregate worldwide market value of common equity securities held by non-affiliates of $700 million or more as of the last business day of our most recently completed second fiscal quarter, (2) have been required to file annual and quarterly reports under the Exchange Act for a period of at least 12 months and (3) have filed at least one annual report pursuant to the Exchange Act.
14
Table of Contents
As a result of our status as an emerging growth company, the information that we provide to our stockholders may be different than you might receive from other public reporting companies in which you hold equity interests.
Where You Can Find More Information
Our principal executive offices are located at 200 S. Orange Avenue, Suite 1200, Orlando, Florida, 32801, and our telephone number is (407) 317-6950. We maintain a website at www.xeniareit.com. We make available free of charge through our website our Annual Reports on Form 10-K, Quarterly Reports on Form 10-Q, Current Reports on Form 8-K, all amendments to those reports and other filings as soon as reasonably practicable after such material is electronically filed with or furnished to the SEC, and also make available on our website the charters for the audit, compensation and nominating and corporate governance committees of our board of directors and our Code of Ethics and Business Conduct, as well as our Corporate Governance Guidelines. Copies in print of these documents are available upon request to our secretary at the address indicated on the cover of this Annual Report. Way may also use our website as a distribution channel of material company information. Financial and other important information regarding the Company is routinely accessible through and posted on the “Investor Relations” page of our website. In addition, you may automatically receive email alerts and other information about the Company when you enroll your email address by visiting the “Investor Relations” page of our website. The information on our website is not a part of, nor is it incorporated by reference into, this Annual Report.
Copies of any materials that we have filed with the SEC can be viewed at the SEC’s Public Reference Room at 100 F Street NE, Washington, DC 20549. Information regarding the operations of the Public Reference Room can be obtained from the SEC by calling the SEC at 1-800-SEC-0330. Additionally, the SEC maintains a website that contains reports, proxy and other information that we have filed with the SEC. The SEC website can be found at http://www.sec.gov.
15
Table of Contents
In addition to the other information set forth in this Annual Report, you should consider carefully the risks and uncertainties described below, which could materially adversely affect our business, financial condition, results of operations and cash flows.
Risks Related to Our Business and Industry
Our ability to make distributions to our stockholders may be adversely affected by various operating risks common to the lodging industry, including competition, over-building and dependence on business travel and tourism.
We own hotels which have different economic characteristics than many other real estate assets. A typical office property, for example, has long-term leases with third-party tenants, which provides a relatively stable long-term stream of revenue. Hotels, on the other hand, generate revenue from guests that typically stay at the hotel for only a few nights, which causes the room rate and occupancy levels at each of our hotels to change every day, and results in earnings that can be highly volatile.
In addition, our hotels will be subject to various operating risks common to the lodging industry, many of which are beyond our control, including, among others, the following:
| • | changes in general economic conditions, including the severity and duration of any downturn in the U.S. or global economy and financial markets; |
| • | war, political conditions or civil unrest, terrorist activities or threats and heightened travel security measures instituted in response to these events; |
| • | outbreaks of pandemic or contagious diseases, such as norovirus, avian flu, severe acute respiratory syndrome (SARS), H1N1 (swine flu) and Ebola; |
| • | natural or man-made disasters, such as earthquakes, like the one in Napa, California that impacted two of our lodging properties on August 24, 2014, tsunamis, tornados, hurricanes, typhoons, floods, oil spills and nuclear incidents; |
| • | delayed delivery or any material reduction or prolonged interruption of public utilities and services, including water and electric power; |
| • | decreased corporate or government travel-related budgets and spending and cancellations, deferrals or renegotiations of group business; |
| • | decreased need for business-related travel due to innovations in business-related technology; |
| • | low consumer confidence, high levels of unemployment or depressed real estate prices; |
| • | competition from other hotels in the markets in which we operate; |
| • | over-building of hotels in the markets in which we operate, which results in increased supply and will adversely affect occupancy and revenues at our hotels; |
| • | requirements for periodic capital reinvestment to repair and upgrade hotels; |
| • | increases in operating costs due to inflation and other factors that may not be offset by increased room rates; |
| • | change in interest rates and the availability, cost and terms of financing; |
| • | the financial condition and general business condition of the airline, automotive and other transportation-related industries and its impact on travel; |
| • | decreased airline capacities and routes; |
| • | oil prices and travel costs; |
16
Table of Contents
| • | statements, actions or interventions by governmental officials related to travel and corporate travel-related activities and the resulting negative public perception of such travel and activities; and |
| • | risks generally associated with the ownership of hotels and real estate, as we discuss in detail below. |
These factors, and the reputational repercussions of these factors, can adversely affect, and from time to time have adversely affected, individual hotels, particular regions and our business, financial condition, results of operations and our ability to make distributions to our stockholders.
The lodging industry is highly cyclical in nature, and we cannot assure you how long the growth period of the current lodging cycle will last.
Due to its close link with the performance of the general economy, and, specifically, growth in U.S. GDP, the lodging industry is highly cyclical in nature. Demand for products and services provided by the lodging industry generally trails improvement in economic conditions, but since 2010 the lodging industry has recovered faster and stronger than the U.S. economy generally. There can be no assurance of either any further increase in demand for hotel rooms from current levels or of the timing or extent of any such demand growth. If demand weakens, our operating results and profitability could be adversely affected. Though we have seen sustained improvement in economic and industry fundamentals, we cannot assure you that these conditions will continue to improve or that the recovery will remain sustainable. Worsening of the U.S. economy, if experienced, would likely have an adverse impact on the occupancy, ADR and RevPAR of our hotels, and would therefore adversely impact our results of operations and financial condition. In addition, in an economic downturn, luxury, upper upscale and upscale hotels may be more susceptible to a decrease in revenue, as compared to hotels in other categories that have lower room rates.
In addition to general economic conditions, new hotel room supply is an important factor that can affect the lodging industry’s performance and overbuilding has the potential to further exacerbate the negative impact of an economic downturn. Room rates and occupancy, and thus RevPAR, tend to increase when demand growth exceeds supply growth. Although we believe that lodging demand growth will exceed lodging supply growth in 2015 and for the next several years, no assurances can be made that this will be achieved. A reduction or slowdown in growth of lodging demand or increased growth in lodging supply could result in returns that are substantially below expectations or result in losses, which could materially and adversely affect our revenues and profitability as well as limit or slow our future growth.
The seasonality of the lodging industry is expected to cause quarterly fluctuations in our revenues.
The lodging industry is seasonal in nature, which can be expected to cause quarterly fluctuations in our hotel room revenues, occupancy levels, room rates, operating expenses and cash flows. Our quarterly earnings may be adversely affected by factors outside our control, including timing of holidays, weather conditions and poor economic factors in certain markets in which we operate. The periods during which our hotels experience higher or lower levels of demand vary from property to property and depend upon location, type of property and competitive mix within the specific location. Based on historical results, we generally expect our revenue to be lower in the first quarter. This seasonality can be expected to cause periodic fluctuations in a hotel’s room revenues, occupancy levels, room rates and operating expenses. We can provide no assurances that our cash flows will be sufficient to offset any shortfalls that occur as a result of these fluctuations. As a result, we may have to enter into short-term borrowings in certain quarters in order to make distributions to our stockholders, and we can provide no assurances that such borrowings will be available on favorable terms, if at all. Consequently, volatility in our financial performance resulting from the seasonality of the lodging industry could adversely affect our financial condition and results of operations.
We operate in a highly competitive industry.
The lodging industry is highly competitive. Our hotels compete with other hotels based on a number of factors, including room rates, quality of accommodations, service levels and amenities, location, brand affiliation,
17
Table of Contents
reputation and reservation systems. New hotels may be constructed and these additions to supply create new competitors, in some cases without corresponding increases in demand for hotel rooms. Some of our competitors also have greater financial and marketing resources than we do, which could allow them to reduce their rates, offer greater convenience, services or amenities, build new hotels in direct competition with our existing hotels, improve their properties, expand and improve their marketing efforts, all of which could adversely affect the ability of our hotels to attract prospective guests and materially and adversely affect our revenues and profitability as well as limit or slow our future growth.
We also compete for hotel acquisitions with entities that have similar investment objectives as we do. This competition could limit the number of suitable investment opportunities offered to us. It may also increase the bargaining power of property owners seeking to sell to us, making it more difficult for us to acquire new properties on attractive terms or on the terms contemplated in our business plan.
There are inherent risks with investments in real estate, including the relative liquidity of such investments.
Investments in real estate are subject to varying degrees of risk. For example, an investment in real estate cannot generally be quickly sold, and we cannot predict whether we will be able to sell any hotel we desire to for the price or on the terms set by us or acceptable to us, or the length of time needed to find a willing purchaser and to close the sale of the hotel. Moreover, the Code imposes restrictions on a REIT’s ability to dispose of properties that are not applicable to other types of real estate companies. In particular, the tax laws applicable to REITs require that we hold our hotels for investment, rather than primarily for sale in the ordinary course of business, which may cause us to forego or defer sales of hotels that otherwise would be in our best interests. Therefore, we may not be able to vary our portfolio promptly in response to changing economic, financial and investment conditions and dispose of assets at opportune times or on favorable terms, which may adversely affect our cash flows and our ability to make distributions to stockholders.
In addition, our ability to dispose of some of our hotels could be constrained by their tax attributes. Hotels that we own for a significant period of time or that we acquire through tax-deferred contribution transactions in exchange for OP Units in our operating partnership may have low tax bases. If we dispose of these hotels outright in taxable transactions, we may be required to distribute the taxable gain to our stockholders under the requirements of the Code applicable to REITs or to pay tax on that gain, either of which, in turn, would impact our cash flow and increase our leverage. In some cases, we may be restricted from disposing of properties contributed to us in the future in exchange for our OP Units under tax protection agreements with contributors unless we incur additional costs related to indemnifying those contributors. To dispose of low basis or tax-protected hotels efficiently, we may from time to time use like-kind exchanges, which qualify for non-recognition of taxable gain, but can be difficult to consummate and result in the hotel for which the disposed assets are exchanged inheriting their low tax bases and other tax attributes.
Investments in real estate also are subject to adverse changes in general economic conditions. Among the factors that could impact our hotels and the value of an investment in us are:
| • | risks associated with the possibility that cost increases will outpace revenue increases and that in the event of an economic slowdown, the high proportion of fixed costs will make it difficult to reduce costs to the extent required to offset declining revenues; |
| • | changes in tax laws and property taxes, or an increase in the assessed valuation of a property for real estate tax purposes; |
| • | adverse changes in the federal, state or local laws and regulations applicable to us, including those affecting zoning, fuel and energy consumption, water and environmental restrictions, and the related costs of compliance; |
| • | changing market demographics; |
| • | an inability to acquire and finance real estate assets on favorable terms, if at all; |
18
Table of Contents
| • | the ongoing need for owner funded capital improvements and expenditures to maintain or upgrade hotels; |
| • | fluctuations in real estate values or potential impairments in the value of our assets; |
| • | acts of God, such as earthquakes, floods or other uninsured losses; and |
| • | changes in interest rates and availability, cost and terms of financing. |
We are dependent on the performance of the third-party hotel management companies that manage the operations of each of our hotels and could be materially and adversely affected if such third-party managers do not properly manage our hotels or otherwise act in our best interests.
In order for us to qualify as a REIT, third parties must operate our hotels. We lease each of our hotels to our TRS lessees. Our TRS lessees, in turn, have entered into management agreements with third party management companies to operate our hotels. We could be materially and adversely affected if any of our third-party managers fail to provide quality services and amenities, fail to maintain a quality brand name or otherwise fail to manage our hotels in our best interest, and can be financially responsible for the actions and inactions of our third-party managers pursuant to our management agreements. In addition, our hotel managers or their affiliates may manage, and in some cases may own, may have invested in or may have provided credit support or operating guarantees to hotels that compete with our hotels, any of which could result in conflicts of interest. As a result, our hotel managers may make decisions regarding competing lodging facilities that are not in our best interests. From time to time, disputes may arise between us and our third-party managers regarding their performance or compliance with the terms of the hotel management agreements, which in turn could adversely affect our results of operations. If we are unable to reach satisfactory results through discussions and negotiations, we may choose to terminate our management agreement, litigate the dispute or submit the matter to third-party dispute resolution, the outcome of which may be unfavorable to us.
Under the terms of the hotel management agreements, our ability to participate in operating decisions regarding our hotels is limited to certain matters, including approval of the annual operating budget, and we do not have the authority to require any hotel to be operated in a particular manner. While our TRS lessees closely monitor the performance of our third-party managers, our general recourse under most of the hotel management agreements is limited to termination if our third-party managers are not performing adequately. For example, in many of our hotel management agreements, we have a right to terminate a management agreement if the third-party manager fails to achieve certain hotel performance criteria measured over any two consecutive fiscal years, as outlined in the applicable management agreement. However, even if a third-party manager fails to perform under the terms of its respective management agreement, it generally has the option to avoid a performance termination by paying a performance deficit fee as specified in the applicable management agreement.
In the event that we terminate any of our management agreements, we can provide no assurances that we could find a replacement manager or that any replacement manager will be successful in operating our hotels. In addition, many of our existing franchise agreements provide the franchisor with a right of first offer in the event of certain sales or transfers of a hotel and provide that the franchisor has the right to approve any change in the hotel management company engaged to manage the hotel. If any of the foregoing were to occur, it could materially and adversely affect us.
Restrictive covenants in certain of our hotel management and franchise agreements contain provisions limiting or restricting the sale of our hotels, which could materially and adversely affect our profitability.
Hotel management and franchise agreements typically contain restrictive covenants that limit or restrict our ability to sell a hotel without the consent of the hotel management company or franchisor. Many of our franchise agreements provide the franchisor with a right of first offer in the event of certain sales or transfers of a hotel and provide that the franchisor has the right to approve any change in the hotel management company engaged to
19
Table of Contents
manage the hotel. Generally, we may not agree to sell, lease or otherwise transfer particular hotels unless the transferee executes a new agreement or assumes the related hotel management and franchise agreements. If the hotel management company or franchisor does not consent to the sale of our hotels, we may be prohibited from taking actions that would otherwise be in our and our stockholders’ best interests.
Contractual and other disagreements with or involving third-party hotel management companies and franchisors could make us liable to them or result in litigation costs or other expenses.
Our management and franchise agreements require us and third-party hotel managers and franchisors to comply with operational and performance conditions that are subject to interpretation and could result in disagreements. At any given time, we may be in disputes with one or more hotel management company or franchisor. Any such dispute could be very expensive for us, even if the outcome is ultimately in our favor. We cannot predict the outcome of any arbitration or litigation, the effect of any negative judgment against us or the amount of any settlement that we may enter into with any third-party. In the event we terminate a management or franchise agreement early and the manager or franchisor considers such termination to have been wrongful, they may seek damages. Additionally, we may be required to indemnify our third-party hotel managers and franchisors against disputes with third parties, pursuant to our management and franchise agreements. An adverse result in any of these proceedings could materially and adversely affect our revenues and profitability.
If we are unable to maintain good relationships with third-party hotel managers and franchisors, profitability could decrease and our growth potential may be adversely affected.
The success of our respective hotel investments and the value of our franchised properties largely depend on our ability to establish and maintain good relationships with the third-party hotel managers and franchisors of our respective hotel management and franchise agreements. If we are unable to maintain good relationships with third-party hotel managers and franchisors, we may be unable to renew existing management or franchise agreements or expand relationships with them. Additionally, opportunities for developing new relationships with additional third-party managers or franchisors may be adversely affected. This, in turn, could have an adverse effect on our results of operations and our ability to execute our growth strategy.
Costs associated with, or failure to maintain, brand operating standards may materially and adversely affect our results of operations and profitability.
Under the terms of our franchise agreements and certain of our management agreements, we are required to meet specified operating standards and other terms and conditions and compliance with such standards may be costly. We expect that our franchisors will periodically inspect our hotels to ensure that we and the hotel management companies follow brand standards. Failure by us, or any hotel management company that we engage, to maintain these standards or other terms and conditions could result in a franchise license being canceled or the franchisor requiring us to undertake a costly property improvement program. If a franchise license is terminated due to our failure to make required improvements or to otherwise comply with its terms, we also may be liable to the franchisor for a termination payment, which will vary by franchisor and by hotel. If the funds required to maintain brand operating standards are significant, or if a franchise license is terminated, it could materially and adversely affect our results of operations and profitability.
If we were to lose a brand license at one or more of our hotels, the value of the affected hotels could decline significantly and we could incur significant costs to obtain new franchise licenses, which could materially and adversely affect our results of operations and profitability as well as limit or slow our future growth.
If we were to lose a brand license, the underlying value of a particular hotel could decline significantly from the loss of associated name recognition, marketing support, participation in guest loyalty programs and the centralized reservation system provided by the franchisor or brand manager, which could require us to recognize an impairment on the hotel. Furthermore, the loss of a franchise license at a particular hotel could harm our
20
Table of Contents
relationship with the franchisor or brand manager, which could impede our ability to operate other hotels under the same brand, limit our ability to obtain new franchise licenses or brand management agreements from the franchisor or brand in the future on favorable terms, or at all, and cause us to incur significant costs to obtain a new franchise license or brand management agreement for the particular hotel. Accordingly, if we lose one or more franchise licenses or brand management agreement, it could materially and adversely affect our results of operations and profitability as well as limit or slow our future growth.
A substantial number of our hotels operate under the Marriott, Hilton or Hyatt brand families; therefore, we are subject to risks associated with concentrating our portfolio in three brand families.
In our portfolio, 37 of the 46 hotels that we own as of the date of this Annual Report utilize brands owned by Marriott, Hilton or Hyatt. As a result, our success is dependent in part on the continued success of Marriott, Hilton and Hyatt and their respective brands. We believe that building brand value is critical to increase demand and build customer loyalty. Consequently, if market recognition or the positive perception of Marriott, Hilton and/or Hyatt is reduced or compromised, the goodwill associated with the Marriott-, Hilton- and Hyatt-branded hotels in our portfolio may be adversely affected. Furthermore, if our relationship with Marriott, Hilton and/or Hyatt were to deteriorate or terminate as a result of disputes regarding the management of our hotels or for other reasons, Marriott, Hilton and/or Hyatt could, under certain circumstances, terminate our current franchise licenses with them or decline to provide franchise licenses for hotels that we may acquire in the future. If any of the foregoing were to occur, it could materially and adversely affect our results of operations and profitability as well as limit or slow our future growth and impair our ability to compete effectively.
We have a concentration of hotels in Texas and California, which exposes our business to the effects of regional events and occurrences.
We have a concentration of hotels in Texas and California. Specifically, as of December 31, 2014, approximately 43% of rooms in our system were located in Texas and California. The concentration of hotels in a region may expose us to risks of adverse economic developments that are greater than if our portfolio were more geographically diverse. These economic developments include regional economic downturns, significant increases in the number of our competitors’ hotels in these markets and potentially higher local property, sales and income taxes in the geographic markets in which we are concentrated. In addition, our hotels are subject to the effects of adverse acts of nature, such as winter storms, hail storms, strong winds, earthquakes and tornados, which have in the past caused damage such as flooding and other damage to our hotels in specific geographic locations, including in the Texas and California markets. Depending on the severity of these acts of nature, the damage to our hotels could require closure of all or substantially all of our hotels in one or more markets for a period of time while the necessary repairs and renovations, as applicable, are undertaken. Additionally, we cannot assure you that the amount of hurricane, windstorm, earthquake, flood or other casualty insurance maintained for these hotels from time to time would entirely cover damages caused by any such event.
As a result of this geographic concentration of hotels, we will face a greater risk of a negative impact on our revenues in the event these areas are more severely impacted by adverse economic and competitive conditions and extreme weather than other areas in the United States.
The departure of any of our key personnel who have significant experience and relationships in the lodging industry could materially and adversely impede or impair our ability to compete effectively and limit future growth prospects.
We depend on the experience and relationships of our senior management team to manage our day-to-day operations and strategic business direction. Our senior management team has an extensive network of lodging industry contacts and relationships, including relationships with global and national hotel brands, hotel owners, financiers, operators, commercial real estate brokers, developers and management companies. We can provide no assurances that any of our key personnel will continue their employment with us. The loss of services of our
21
Table of Contents
senior management team, or any difficulty attracting and retaining other talented and experienced personnel, could adversely affect our ability to source potential investment opportunities, our relationship with global and national hotel brands and other industry participants and the execution of our business strategy. Further, such a loss could be negatively perceived in the capital markets, which could reduce the market value of our common stock.
Our long-term growth depends in part on successfully identifying and consummating acquisitions of additional hotels and the failure to make such acquisitions could materially impede our growth.
A key element of our business strategy is to invest in premium full service, lifestyle and urban upscale hotels, with a focus on the Top 25 Markets and key leisure destinations in the U.S. We can provide no assurances that we will be successful in identifying attractive hotels or that, once identified, we will be successful in consummating an acquisition. We face significant competition for attractive investment opportunities from other well-capitalized investors, some of which have greater financial resources and a greater access to debt and equity capital to acquire hotels than we do. This competition increases as investments in real estate become increasingly attractive relative to other forms of investment. As a result of such competition, we may be unable to acquire certain hotels that we deem attractive or the purchase price may be significantly elevated or other terms may be substantially more onerous. In addition, we expect to finance future acquisitions through a combination of borrowings under a revolving credit facility that we anticipate will be in place concurrently with the completion of the separation, the use of retained cash flows, and offerings of equity and debt securities, which may not be available on advantageous terms, or at all. Any delay or failure on our part to identify, negotiate, finance on favorable terms, consummate and integrate such acquisitions could materially impede our growth.
Our acquisition, redevelopment, repositioning, renovation and re-branding activities are subject to various risks, any of which could, among other things, result in disruptions to our hotel operations, strain management resources and materially and adversely affect our results of operations and profitability as well as limit or slow our future growth.
We intend to acquire, redevelop, reposition, renovate and re-brand hotels, subject to the availability of attractive hotels or projects and our ability to undertake such activities on satisfactory terms. In deciding whether to undertake such activities, we will make certain assumptions regarding the expected future performance of the hotel or project. However, newly acquired, redeveloped, renovated, repositioned or re-branded hotels may fail to perform as expected and the costs necessary to bring such hotels up to brand standards may exceed our expectations, which may result in the hotels’ failure to achieve projected returns.
In particular, to the extent that we engage in the activities described above, they could pose the following risks to our ongoing operations:
| • | we may abandon such activities and may be unable to recover expenses already incurred in connection with exploring such opportunities; |
| • | acquired, redeveloped, renovated or re-branded hotels may not initially be accretive to our results, and we and the hotel management companies may not successfully manage newly acquired, renovated, redeveloped, repositioned or re-branded hotels to meet our expectations; |
| • | we may be unable to quickly, effectively and efficiently integrate new acquisitions, particularly acquisitions of portfolios of hotels, into our existing operations; |
| • | our redevelopment, repositioning, renovation or re-branding activities may not be completed on schedule, which could result in increased debt service and other costs and lower revenues; and |
| • | management attention may be diverted by our acquisition, redevelopment, repositioning or re-branding activities, which in some cases may turn out to be less compatible with our growth strategy than originally anticipated. |
22
Table of Contents
The occurrence of any of the foregoing events, among others, could materially and adversely affect our results of operations and profitability as well as limit or slow our future growth.
Any difficulties in obtaining capital necessary to make required periodic capital expenditures and renovation of our hotels could materially and adversely affect our financial condition and results of operations.
Ownership of hotels is a capital intensive business that requires significant capital expenditures to operate, maintain and renovate properties. Access to the capital that we need to maintain and renovate existing properties and to acquire new properties is critical to the continued growth of our business and revenues and to remain competitive. We may not be able to fund capital improvements for our existing hotels or acquisitions of new hotels solely from cash provided from our operating activities because we must distribute annually at least 90% of our REIT taxable income to qualify as a REIT and we are subject to tax on any retained income and gains. As a result, our ability to fund capital expenditures, acquisitions or hotel redevelopment through retained earnings may be restricted. Consequently, we may have to draw down on our revolving credit facility or rely upon the availability of debt or equity capital to fund capital improvements and acquisitions. Our ability to access additional capital could also be limited by the terms of our unsecured revolving credit facility, which restricts our ability to incur debt under certain circumstances.
If we are forced to spend larger amounts of cash from operating activities than anticipated to operate, maintain or renovate existing properties, then our ability to use cash for other purposes, including acquisitions of new properties, could be limited and our profits could be reduced. Similarly, if we cannot access the capital we need to fund our operations or implement our growth strategy, we may need to postpone or cancel planned renovations or acquisitions, which could impair our ability to compete effectively and harm our business.
Many real estate costs and certain hotel operating costs are fixed, even if revenue from our hotels decreases.
Many costs, such as real estate taxes, insurance premiums, maintenance costs and certain hotel operating costs generally are more fixed than variable and as a result, are not reduced even when a hotel is not fully occupied, room rates decrease or other circumstances cause a reduction in revenues. Thus, our profits are generally more significantly affected by economic downturns and declines in revenues. If we are unable to offset these costs with sufficient revenues across our portfolio, it could materially and adversely affect our results of operations and profitability.
Operating expenses may increase in the future, which may cause our cash flow and our operating results to decrease.
Operating expenses, such as expenses for fuel, utilities, labor, employee benefits, building materials and insurance are not fixed and may increase in the future. Any increases would cause our cash flow and our operating results to decrease. If we are unable to offset these decreases with sufficient revenues across our portfolio, our ability to pay distributions could be materially and adversely affected.
The land underlying six of our hotels and meeting facilities is subject to a ground lease; if we are found to be in breach of a ground lease or are unable to renew a ground lease, we could be materially and adversely affected.
We lease the land underlying six of our hotels and meeting facilities from third parties. Five of these hotels are subject to ground leases that cover all of the land underlying the respective hotel, and the sixth is subject to a ground lease that covers a portion of the land. Accordingly, we only own a long-term leasehold or similar interest in all or a portion of these six hotels. The average remaining term of the ground leases, assuming no renewal options are exercised, is approximately 45 years. Assuming all renewal options are exercised, the average remaining term is 60 years. If we are found to be in breach of a ground lease, we could lose the right to use the hotel. In addition, unless we can purchase a fee interest in the underlying land and improvements or extend the terms of these leases before their expiration, as to which no assurance can be given, we will lose our right to
23
Table of Contents
operate these properties and our interest in the improvements upon expiration of the leases. Our ability to exercise any extension options relating to our ground leases is subject to the condition that we are not in default under the terms of the ground lease at the time that we exercise such options, and we can provide no assurances that we will be able to exercise any available options at such time. Furthermore, we can provide no assurances that we will be able to renew any ground lease upon its expiration. If we were to lose the right to use a hotel due to a breach or non-renewal of the ground lease, we would be unable to derive income from such hotel, which could adversely affect us.
We will not recognize any increase in the value of the land or improvements subject to our ground leases and may only receive a portion of compensation paid in any eminent domain proceeding with respect to the hotel.
Unless we purchase a fee interest in the land and improvements subject to our ground leases, we will not have any economic interest in the land or improvements at the expiration of our ground leases and therefore we will not share in any increase in value of the land or improvements beyond the term of a ground lease, notwithstanding our capital outlay to purchase our interest in the hotel or fund improvements thereon, and will lose our right to use the hotel. Furthermore, if the state or federal government seizes a hotel subject to a ground lease under its eminent domain power, we may only be entitled to a portion of any compensation awarded for the seizure.
We are subject to risks associated with the employment of hotel personnel, particularly with hotels that employ unionized labor, which could increase our operating costs, reduce the flexibility of our hotel managers to adjust the size of the workforce at our hotels and could materially and adversely affect our revenues and profitability.
We have entered into management agreements with third-party hotel managers to operate our hotels. Our hotel managers are responsible for hiring and maintaining the labor force at each of our hotels. Although we do not directly employ or manage employees at our hotels, we are subject to many of the costs and risks generally associated with the hotel labor force. Increased labor costs due to factors like additional taxes or requirements to incur additional employee benefits costs, including the requirements of the Affordable Care Act, may adversely impact our operating costs. Labor costs can be particularly challenging at those of our hotels with unionized labor, and additional hotels may be subject to new collective bargaining agreements in the future.
From time to time, strikes, lockouts, public demonstrations or other negative actions and publicity may disrupt hotel operations at any of our hotels, negatively impact our reputation or the reputation of our brands, or harm relationships with the labor forces at our hotels. We also may incur increased legal costs and indirect labor costs as a result of contract disputes or other events. Additionally, hotels where our managers have collective bargaining agreements with employees are more highly affected by labor force activities than others. The resolution of labor disputes or new or re-negotiated labor contracts could lead to increased labor costs, either by increases in wages or benefits or by changes in work rules that raise hotel operating costs. Furthermore, labor agreements may limit the ability of our hotel managers to reduce the size of hotel workforces during an economic downturn because collective bargaining agreements are negotiated between the hotel managers and labor unions. We do not have the ability to control the outcome of these negotiations.
Uninsured and underinsured losses at our hotels could materially and adversely affect our revenues and profitability.
We intend to maintain comprehensive insurance on each of our current hotels and any hotels that we acquire, including liability, fire and extended coverage, of the type and amount we believe are customarily obtained for or by hotel owners. There are no assurances that coverage will be available at reasonable rates. Various types of catastrophic losses, like windstorms, earthquakes and floods, losses from foreign terrorist activities may not be insurable or may not be economically insurable. Even when insurable, these policies may have high deductibles and/or high premiums. Lenders may require such insurance. Our failure to obtain such insurance could constitute a default under loan agreements, and/or our lenders may force us to obtain such insurance at unfavorable rates, which could materially and adversely affect our profitability and revenues.
24
Table of Contents
In the event of a substantial loss, our insurance coverage may not be sufficient to cover the full current market value or replacement cost of our lost investment. Should an uninsured loss or a loss in excess of insured limits occur, we could lose all or a portion of the capital we have invested in a hotel, as well as the anticipated future revenue from the hotel. In that event, we might nevertheless remain obligated for any mortgage debt or other financial obligations related to the hotel. Inflation, changes in building codes and ordinances, environmental considerations and other factors might also keep us from using insurance proceeds to replace or renovate a hotel after it has been damaged or destroyed. Under those circumstances, the insurance proceeds we receive might be inadequate to restore our economic position on the damaged or destroyed hotel, which could materially and adversely affect our profitability.
In addition, insurance risks associated with potential terrorism acts could sharply increase the premiums we pay for coverage against property and casualty claims. With the enactment of the Terrorism Risk Insurance Program Reauthorization Act of 2007, United States insurers cannot exclude conventional, chemical, biological, nuclear and radiation terrorism losses. These insurers must make terrorism insurance available under their property and casualty insurance policies; however, this legislation does not regulate the pricing of such insurance. In many cases, mortgage lenders have begun to insist that commercial property owners purchase coverage against terrorism as a condition of providing mortgage loans. Such insurance policies may not be available at a reasonable cost, which could inhibit our ability to finance or refinance our hotels. In such instances, we may be required to provide other financial support, either through financial assurances or self-insurance, to cover potential losses. We may not have adequate coverage for such losses, which could materially and adversely affect our revenues and profitability as well as limit or slow our future growth.
We could incur significant, material costs related to government regulation and litigation with respect to environmental matters, which could materially and adversely affect our revenues and profitability as well as limit or slow our future growth.
Our hotels are subject to various U.S. federal, state and local environmental laws that impose liability for contamination. Under these laws, governmental entities have the authority to require us, as the current owner of a hotel, to perform or pay for the clean-up of contamination (including hazardous substances, asbestos and asbestos-containing materials, waste or petroleum products) at, on, under or emanating from the hotel and to pay for natural resource damages arising from such contamination. Such laws often impose liability without regard to whether the owner or operator or other responsible party knew of, or caused such contamination, and the liability may be joint and several. Because these laws also impose liability on persons who owned a property at the time it became contaminated, it is possible we could incur cleanup costs or other environmental liabilities even after we sell hotels. Contamination at, on, under or emanating from our hotels also may expose us to liability to private parties for costs of remediation and/or personal injury or property damage. In addition, environmental laws may create liens on contaminated sites in favor of the government for damages and costs it incurs to address such contamination. If contamination is discovered on our properties, environmental laws also may impose restrictions on the manner in which the properties may be used or businesses may be operated, and these restrictions may require substantial expenditures. Moreover, environmental contamination can affect the value of a property and, therefore, an owner’s ability to borrow funds using the property as collateral or to sell the property on favorable terms or at all. Furthermore, persons who sent waste to a waste disposal facility, such as a landfill or an incinerator, may be liable for costs associated with cleanup of that facility.
In addition, our hotels are subject to various federal, state, and local environmental, health and safety laws and regulations that address a wide variety of issues, including, but not limited to, storage tanks, air emissions from emergency generators, storm water and wastewater discharges, lead-based paint, mold and mildew, and waste management. Some of our hotels routinely handle and use hazardous or regulated substances and wastes as part of their operations, which substances and wastes are subject to regulation (e.g., swimming pool chemicals). Our hotels incur costs to comply with these environmental, health and safety laws and regulations and could be subject to fines and penalties for non-compliance with applicable requirements.
25
Table of Contents
Certain of our hotels contain, and those that we acquire in the future may contain, or may have contained, asbestos-containing material, or ACM. Federal, state and local environmental, health and safety laws require that ACM be properly managed and maintained, and include requirements to undertake special precautions, such as removal or abatement, if ACM would be disturbed during maintenance, renovation or demolition of a building. Such laws regarding ACM may impose fines and penalties on building owners, employers and operators for failure to comply with these requirements. In addition, third parties may seek recovery from owners or operators for personal injury associated with exposure to asbestos-containing building materials.
When excessive moisture accumulates in buildings or on building materials, mold growth may occur, particularly if the moisture problem remains undiscovered or is not addressed over a period of time. Some molds may produce airborne toxins or irritants. Indoor air quality issues can also stem from inadequate ventilation, chemical contamination from indoor or outdoor sources, and other biological contaminants such as pollen, viruses and bacteria. Indoor exposure to airborne toxins or irritants above certain levels can be alleged to cause a variety of adverse health effects and symptoms, including allergic or other reactions. As a result, the presence of significant mold or other airborne contaminants at any of our hotels could require us to undertake a costly remediation program to contain or remove the mold or other airborne contaminants from the affected property or increase indoor ventilation. In addition, the presence of significant mold or other airborne contaminants could expose us to liability to third parties if property damage or personal injury occurs.
Liabilities and costs associated with environmental contamination at, on, under or emanating from our properties, defending against claims related to alleged or actual environmental issues, or complying with environmental, health and safety laws could be material and could materially and adversely affect us. We can make no assurances that changes in current laws or regulations or future laws or regulations will not impose additional or new material environmental liabilities or that the current environmental condition of our hotels will not be affected by our operations, the condition of the properties in the vicinity of our hotels, or by third parties unrelated to us. The discovery of material environmental liabilities at our properties could subject us to unanticipated significant costs, which could significantly reduce or eliminate our profitability and the cash available for distribution to our stockholders.
Compliance or failure to comply with the Americans with Disabilities Act and other safety regulations and requirements could result in substantial costs.
Under the Americans with Disabilities Act of 1990 and the Accessibility Guidelines promulgated thereunder, which we refer to collectively as the ADA, all public accommodations must meet various federal requirements related to access and use by disabled persons. Compliance with the ADA’s requirements could require removal of access barriers, and non-compliance could result in the U.S. government imposing fines or in private litigants winning damages.
Our hotels also are subject to various federal, state and local regulatory requirements, such as state and local fire and life safety requirements. If we fail to comply with these requirements, we could incur fines or private damage awards. We do not know whether existing requirements will change or whether compliance with future requirements would require significant unanticipated expenditures that would affect our cash flow and results of operations. If we incur substantial costs to comply with the ADA or other safety regulations and requirements, it could materially and adversely affect our revenues and profitability.
We may be subject to unknown or contingent liabilities related to recently acquired hotels and the hotels that we may acquire in the future, which could materially and adversely affect our revenues and profitability growth.
Our recently acquired hotels, and the hotels that we may acquire in the future, may be subject to unknown or contingent liabilities for which we may have no recourse, or only limited recourse, against the sellers. In general, the representations and warranties provided under the transaction agreements related to the purchase of the hotels
26
Table of Contents
we acquire may not survive the completion of the transactions. Furthermore, indemnification under such agreements may be limited and subject to various materiality thresholds, a significant deductible or an aggregate cap on losses. As a result, there is no guarantee that we will recover any amounts with respect to losses due to breaches by the sellers of their representations and warranties. In addition, the total amount of costs and expenses that may be incurred with respect to liabilities associated with these hotels may exceed our expectations, and we may experience other unanticipated adverse effects, all of which could materially and adversely affect our revenues and profitability.
Adverse judgments or settlements resulting from legal proceedings in which we may be involved in the normal course of our business could reduce our profits or limit our ability to operate our business.
In the normal course of our business, we are involved in various legal proceedings. Our third-party managers, whom we indemnify for legal costs resulting from management of our hotels, may also be involved in various legal proceedings relating to the management of our hotels. The outcome of these proceedings cannot be predicted. If any of these proceedings were to be determined adversely to us or our third-party managers or a settlement involving a payment of a material sum of money were to occur, it could materially and adversely affect our profits or ability to operate our business. Additionally, we could become the subject of future claims by third parties, including current or former third-party property owners, guests who use our properties, our employees, our investors or regulators. Any significant adverse judgments or settlements would reduce our profits and could limit our ability to operate our business. Further, we may incur costs related to claims for which we have appropriate third party indemnity, but such third parties fail to fulfill their contractual obligations.
If we fail to establish and maintain an effective system of integrated internal controls, we may not be able to accurately report our financial results.
In connection with operating as a public company, we are required to provide reliable financial statements and reports to our stockholders. To monitor the accuracy and reliability of our financial reporting, we are establishing an internal audit function that will oversee our internal controls. We can provide no assurances that our initial accounting policy framework and accounting procedures manual will be adequate to provide reasonable assurance to our stockholders regarding the reliability of our financial reporting and the preparation of our financial statements. In addition, we are developing and documenting current policies and procedures with respect to company-wide business processes and cycles in order to implement effective internal control over financial reporting. We will establish, or cause our third-party hotel management companies to establish, controls and procedures designed to ensure that hotel revenues and expenses are properly recorded at our hotels. Pursuant to Section 404 of the Sarbanes-Oxley Act of 2002 and beginning with our Annual Report on Form 10-K for the year ending December 31, 2015, our management will be required to report on the effectiveness of our internal control over financial reporting. While we intend to undertake substantial work to comply with Section 404 of the Sarbanes-Oxley Act, we cannot be certain that we will be successful in implementing or maintaining effective internal control over our financial reporting and may determine in the future that our existing internal controls need improvement. If we fail to implement and comply with proper overall controls, we could be materially harmed or we could fail to meet our reporting obligations. In addition, the existence of a material weakness or significant deficiency could result in errors in our financial statements that could require a restatement, cause us to fail to meet our reporting obligations, result in increased costs to remediate any deficiencies, attract regulatory scrutiny or lawsuits and cause investors to lose confidence in our reported financial information, which could lead to a substantial decline in the market price of our common stock.
As an “emerging growth company,” we are permitted to rely on exemptions from certain reporting and disclosure requirements, which may make our future public filings different than that of other public companies.
We are an “emerging growth company” as defined in the JOBS Act, and we are eligible to take advantage of certain exemptions from various reporting and disclosure requirements that are applicable to public companies
27
Table of Contents
that are not emerging growth companies. We will remain an emerging growth company for up to five years, or until the earliest of: (1) the last date of the fiscal year during which we had total annual gross revenues of $1 billion or more; (2) the date on which we have, during the previous three-year period, issued more than $1 billion in non-convertible debt; or (3) the date on which we are deemed to be a “large accelerated filer” as defined under Rule 12b-2 under the Exchange Act. For so long as we remain an emerging growth company, we will not be required to:
| • | have an auditor attestation report on our internal control over financial reporting pursuant to Section 404(b) of the Sarbanes-Oxley Act; |
| • | submit certain executive compensation matters to stockholder advisory votes pursuant to the “say on frequency” and “say on pay” provisions (requiring a non-binding stockholder vote to approve compensation of certain executive officers) and the “say on golden parachute” provisions (requiring a non-binding stockholder vote to approve golden parachute arrangements for certain executive officers in connection with mergers and certain other business combinations) of the Dodd-Frank Wall Street Reform and Consumer Protection Act of 2010; or |
| • | disclose certain executive compensation related items. |
If we choose to take advantage of any or all of these exemptions, the information that we provide you in our future public filings may be different than that of other public companies. The exact implications of the JOBS Act for us are still subject to interpretations and guidance by the SEC and other regulatory agencies. In addition, as our business grows, we may no longer satisfy the conditions of an emerging growth company. We continue to evaluate and monitor developments with respect to these new rules and we cannot assure you that we will be able to take advantage of all of the benefits of the JOBS Act.
In addition, the JOBS Act provides that an emerging growth company may take advantage of an extended transition period for complying with new or revised accounting standards that have different effective dates for public and private companies. This means that an emerging growth company can delay adopting certain accounting standards until such standards are otherwise applicable to private companies. We elected to opt out of this transition period, and will therefore comply with new or revised accounting standards on the applicable dates on which the adoption of these standards is required for non-emerging growth companies. This election is irrevocable.
Market disruptions may adversely impact many aspects of our operating results and operating condition.
During the global economic downturn that began in 2008, the domestic financial markets experienced unusual volatility, uncertainty and a tightening of liquidity in both the investment grade debt and equity capital markets. Credit spreads for major sources of capital widened significantly during the U.S. credit crisis as investors demanded a higher risk premium. If there is volatility and weakness in the capital and credit markets, the availability of debt financing secured by commercial real estate could decline. Our business may be affected by market and economic challenges experienced by the U.S. economy or real estate industry as a whole or by the local economic conditions in the markets in which our hotels are located, including the dislocations in the credit markets and general global economic recession. Specifically, these conditions may have the following consequences:
| • | credit spreads for major sources of capital may widen if stockholders demand higher risk premiums or interest rates could increase, due to inflationary expectations, resulting in an increased cost for debt financing; |
| • | our ability to borrow on terms and conditions that we find acceptable may be limited, which could result in our hotels generating lower overall economic returns and a reduced level of cash flow from what was anticipated at the time we acquired the asset, which could potentially impact our ability to make distributions to our stockholders, or pursue acquisition opportunities, among other things; |
28
Table of Contents
| • | the amount of capital that is available to finance hotels could diminish, which, in turn, could lead to a decline in hotel values generally, slow hotel transaction activity, and reduce the loan to value ratio upon which lenders are willing to lend; |
| • | the value of certain of our hotels may decrease below the amounts we paid for them, which would limit our ability to dispose of hotels at attractive prices or to obtain debt financing secured by these hotels and could reduce our ability to finance our business; |
| • | the value and liquidity of short-term investments, if any, could be reduced as a result of the dislocation of the markets for our short-term investments and increased volatility in market rates for these investments or other factors; and |
| • | one or more counterparties to derivative financial instruments that we may enter into could default on their obligations to us, or could fail, increasing the risk that we may not realize the benefits of these instruments. |
For these and other reasons, we cannot assure you that we will be profitable or that we will realize growth in the value of our investments.
We are increasingly dependent on information technology, and potential cyber-attacks, security problems, or other disruption present risks.
The third-party hotel management companies that operate our hotels rely on information technology networks and systems, including the Internet, to process, transmit and store electronic information, and to manage or support a variety of business processes, including financial transactions and records, personal identifying information, reservations, billing and operating data. They may purchase some of their information technology from vendors, on whom our systems will depend, and the third-party hotel managers will rely on commercially available systems, software, tools and monitoring to provide security for processing, transmission and storage of confidential operator and other customer information. We will depend upon the secure transmission of this information over public networks. Our third-party hotel management companies’ networks and storage applications may be subject to unauthorized access by hackers or others through cyber-attacks, which are rapidly evolving and becoming increasingly sophisticated, or by other means, or may be breached due to operator error, malfeasance or other system disruptions. In some cases, it will be difficult to anticipate or immediately detect such incidents and the damage caused thereby. Any significant breakdown, invasion, destruction, interruption or leakage of our third-party hotel managers’ systems could harm us, and we may be financially responsible for certain damages arising out of the harm such events cause to third parties pursuant to our management agreements.
Changes in distribution channels, including the increasing use of intermediaries by consumers and companies may adversely affect our profitability.
Our rooms are booked through a variety of distribution channels, including hotel websites, travel agents, internet travel intermediaries and meeting procurement firms. If bookings shift to higher cost distribution channels, including internet travel intermediaries and meeting procurement firms, it could materially impact our profits. Additionally, as intermediary bookings increase, these intermediaries may be able to obtain higher commissions, reduced room rates or other significant contract concessions from our brands and management companies. Many of these internet travel intermediaries are viewed as offering hotel rooms in a commodity-like manner, by increasing the importance of price and general indicators of quality (such as “three-star downtown hotel”) at the expense of brand identification. It is possible that consumers and companies will develop brand loyalties to their reservations systems and multi-brand representation rather than to the brands under which our properties are operated. Although most of the business for our hotels is expected to be derived from traditional channels, if the amount of sales made through the intermediaries increases significantly, room revenues may be lower than expected, and our profit may be adversely affected.
29
Table of Contents
Risks Related to our Relationship with Inland American and the Separation
Our historical financial results as a subsidiary of Inland American may not be representative of our results as a separate, stand-alone company.
The historical financial information we have included in this Annual Report has been derived from Inland American’s consolidated financial statements and does not necessarily reflect what our financial position, results of operations or cash flows would have been had we been a separate, stand-alone company during the periods presented. Although Inland American did account for our company as a subsidiary, Inland American did not account for us, and we were not operated, as a separate, stand-alone company for the historical periods presented. The historical costs and expenses reflected in our combined financial statements include an allocation for certain corporate functions historically provided by Inland American, including general corporate expenses, employee benefits and incentives, and interest expense. These allocations were based on what we and Inland American considered to be reasonable reflections of the historical utilization levels of these services required in support of our business. The historical information does not necessarily indicate what our results of operations, financial position, cash flows or costs and expenses will be in the future. Our pro forma adjustments reflect changes that may occur in our funding and operations as a result of the separation. However, there can be no assurances that these adjustments will reflect our costs as a publicly-traded, stand-alone company.
We may be unable to achieve some or all of the benefits that we expect to achieve from our separation from Inland American, and we will no longer enjoy certain benefits from Inland American.
Now that we have separated from Inland American, there is a risk that Xenia may be more susceptible to market fluctuations and other adverse events than we would have been if we were still a part of Inland American. As part of Inland American we were able to enjoy certain benefits from Inland American’s purchasing power and borrowing leverage, and also had access to Inland American’s balance sheet and capital. Following our separation from Inland American, we are a smaller and less diversified company than Inland American, and we do not have access to financial and other resources comparable to those of Inland American prior to the separation. As a separate, stand-alone company, we may be unable to obtain debt or goods, technology and services at prices and on terms as favorable as those available to us prior to the separation, which could materially and adversely affect us. Additionally, we may not be able to achieve the full strategic and financial benefits that we expect will result from our separation from Inland American or such benefits may be delayed or may not occur at all.
We have a limited history operating as an independent public company and have incurred significant costs to create the corporate infrastructure necessary to operate as an independent company. We may be unable to make, on a timely or cost-effective basis, the changes necessary to operate as an independent company, and we may experience increased ongoing costs in connection with being an independent public company.
Historically, we relied on financial, administrative and other resources of Inland American to operate our business. Following the separation from Inland American, we are creating our own financial, administrative and other support systems or contracting with third parties to replace Inland American’s systems. In connection with our separation from Inland American, we entered into an agreement with Inland American under which Inland American has agreed to provide certain transition services to us, including services related to information technology systems, financial reporting and accounting and legal services. The expiration date varies by service provided and the agreement will terminate on the earlier of March 31, 2016 and the termination of the last service provided under it. These services may not be sufficient to meet our needs, and, after our agreement with Inland American expires, we may not be able to replace these services at all or obtain these services at prices and on terms as favorable as we currently have. Additionally, if Inland American does not effectively perform the services that are called for under the Transition Services Agreement, and the other agreements, we may not be able to operate our business effectively and our results of operations could be harmed. Moreover, Inland American’s indemnification obligations to us in the event of a breach by Inland American of its obligations under the Transition Services Agreement is capped at the amounts it receives for providing the services under the
30
Table of Contents
agreement. Any failure or significant downtime in our own financial or administrative systems or in Inland American’s financial or administrative systems during the transitional period could impact our results and/or prevent us from paying our employees, complying with financial and SEC reporting requirements or performing other administrative services on a timely basis and could materially and adversely affect us.
Additionally, following the separation, we are required to develop and implement our own control systems and procedures to assist us in qualifying and maintaining our qualification as a public REIT, satisfying our periodic and current reporting requirements under applicable SEC regulations and complying with NYSE listing standards. As a result, we have placed significant demands on our management to implement and execute appropriate reporting and compliance processes and assess their design, remediate any deficiencies identified and test the operation of such processes.
We may have potential business conflicts of interest with Inland American with respect to our past and ongoing relationships.
Conflicts of interest may arise between Inland American and us in a number of areas relating to our past and ongoing relationships, including:
| • | labor, tax, employee benefit, indemnification and other matters arising from our separation from Inland American; |
| • | intellectual property matters; |
| • | employee recruiting and retention; |
| • | sales or distributions by Inland American of all or any portion of its ownership interest in us, which could be to one of our competitors; |
| • | business combinations involving our company; and |
| • | business opportunities that may be attractive to both Inland American and us. |
We may not be able to resolve any potential conflicts, and, even if we do so, the resolution may be less favorable to us than if we were dealing with a party that was not historically an affiliate of ours.
Potential indemnification liabilities to Inland American pursuant to the Separation and Distribution Agreement could materially adversely affect our operations.
The Separation and Distribution Agreement with Inland American provides for, among other things, the allocation between us and Inland American of Inland American’s assets, liabilities and obligations attributable to periods prior to, at and after the separation, and provisions governing our relationships with Inland American following the separation and distribution. Among other things, the Separation and Distribution Agreement provides indemnification obligations designed to make us financially responsible for all liabilities that may exist relating to the “Xenia Business”, which consists of the business, operations and activities relating primarily to the our portfolio and any other hotels previously owned by Xenia or Inland American prior to the separation, other than the Suburban Select Service Portfolio, whether incurred prior to, at or after the separation and distribution. With respect to the Suburban Select Service Portfolio, notwithstanding the foregoing, we have agreed to assume the first $8 million of liabilities (including any related fees and expenses) incurred following the distribution relating to, arising out of or resulting from the ownership, operation or sale of the Suburban Select Service Portfolio and that relate to, arise out of or result from a claim or demand that is made against Xenia or Inland American by any person who is not a party or an affiliate of a party to the Separation and Distribution Agreement, other than liabilities arising from the breach or alleged breach by Inland American of certain fundamental representations made by Inland American to the third party purchasers of the Suburban Select Service Portfolio. We have also agreed to assume and indemnify Inland American for certain tax liabilities attributable to the Suburban Select Service Portfolio. As part of our working capital at the time of distribution, Inland American left us with cash estimated to be sufficient to satisfy such tax obligations. As a result, we may be responsible for substantial liabilities under the Separation and Distribution Agreement.
31
Table of Contents
In connection with our separation from Inland American, Inland American has agreed to indemnify us for certain pre-distribution liabilities and liabilities related to Inland American assets. However, there can be no assurance that these indemnities will be sufficient to insure us against the full amount of such liabilities, or that Inland American’s ability to satisfy its indemnification obligation will not be impaired in the future.
Pursuant to the Separation and Distribution Agreement, Inland American has agreed to indemnify us for certain liabilities related to Inland American assets. However, third parties could seek to hold us responsible for any of the liabilities that Inland American agrees to retain, and there can be no assurance that Inland American will be able to fully satisfy its indemnification obligations. Moreover, even if we ultimately succeed in recovering from Inland American any amounts for which we are held liable, such indemnification may be insufficient to fully offset the financial impact of such liabilities and/or we may be temporarily required to bear these losses while seeking recovery from Inland American.
Our agreements with Inland American may not reflect terms that would have resulted from arm’s-length negotiations among unaffiliated third parties.
The agreements related to our separation from Inland American, including the Separation and Distribution Agreement, Transition Services Agreement and Employee Matters Agreement, were negotiated in the context of our separation from Inland American while we were still part of and a wholly-owned subsidiary of Inland American and, accordingly, may not reflect terms that would have resulted from arm’s-length negotiations among unaffiliated third parties. The terms of the agreements we negotiated in the context of our separation related to, among other things, allocations of assets, liabilities, rights, indemnifications and other obligations among Inland American and us. For example, when the terms of these agreements were negotiated, we did not have a board of directors that was independent from Inland American.
Risks Related to Debt Financing
Volatility in the financial markets and challenging economic conditions could adversely affect our ability to secure debt financing on attractive terms and our ability to service any future indebtedness that we may incur.
The domestic and international commercial real estate debt markets could become very volatile as a result of, among other things, the tightening of underwriting standards by lenders and credit rating agencies. This could result in less availability of credit and increasing costs for what is available. If the overall cost of borrowing increases, either by increases in the index rates or by increases in lender spreads, the increased costs may result in existing or future acquisitions generating lower overall economic returns and potentially reducing future cash flow available for distribution. If these disruptions in the debt markets were to persist, our ability to borrow monies to finance the purchase of, or other activities related to, real estate assets could be negatively impacted. If we are unable to borrow monies on terms and conditions that we find acceptable, we likely will have to reduce the number of properties we can purchase, and the return on the properties we do purchase may be lower. In addition, we may find it difficult, costly or impossible to refinance indebtedness which is maturing.
Further, economic conditions could negatively impact commercial real estate fundamentals and result in declining values in our real estate portfolio and in the collateral securing any loan investments we may make, which could have various negative impacts. Specifically, the value of collateral securing any loan investment we may make could decrease below the outstanding principal amounts of such loans, requiring us to pledge more collateral.
Our organizational documents have no limitation on the amount of indebtedness we may incur. As a result, we may become highly leveraged in the future, which could materially and adversely affect us.
Our business strategy contemplates the use of both non-recourse secured and unsecured debt to finance long-term growth. In addition, our organizational documents contain no limitations on the amount of debt that we may incur, and our board of directors may change our financing policy at any time without stockholder notice or
32
Table of Contents
approval. As a result, we may be able to incur substantial additional debt, including secured debt, in the future. Incurring debt could subject us to many risks, including the risks that:
| • | our cash flows from operations may be insufficient to make required payments of principal and interest; |
| • | our debt and resulting maturities may increase our vulnerability to adverse economic and industry conditions; |
| • | we may be required to dedicate a substantial portion of our cash flows from operations to payments on our debt, thereby reducing cash available for distribution to our stockholders, funds available for operations and capital expenditures, future business opportunities or other purposes; |
| • | the terms of any refinancing may not be in the same amount or on terms as favorable as the terms of the existing debt being refinanced; |
| • | Xenia may be obligated to repay the debt pursuant to guarantee obligations; and |
| • | the use of leverage could adversely affect our ability to raise capital from other sources or to make distributions to our stockholders and could adversely affect the market price of our common stock. |
If we violate covenants in future agreements relating to indebtedness that we may incur, we could be required to repay all or a portion of our indebtedness before maturity at a time when we might be unable to arrange financing for such repayment on attractive terms, if at all. In addition, indebtedness agreements may require that we meet certain covenant tests in order to make distributions to our stockholders.
If we are unable to repay or refinance our existing debt, we may be unable to sustain or increase distributions to our stockholders and our share price may be adversely affected.
Our existing and future debt may subject us to many risks, including the risks that:
| • | our cash flow from operations will be insufficient to make required payments of principal and interest; |
| • | our debt may increase our vulnerability to adverse economic and industry conditions; |
| • | we may be required to dedicate a substantial portion of our cash flow from operations to payments on our debt, thereby reducing cash available for distribution to our stockholders, funds available for operations and capital expenditures, future business opportunities or other purposes; |
| • | the terms of any refinancing may not be as favorable as the terms of the debt being refinanced; and |
| • | the terms of our debt may limit our ability to make distributions to our stockholders and therefore adversely affect the market price of our shares. |
If we do not have sufficient funds to repay our debt at maturity, it may be necessary to refinance this debt through additional debt financing, or private or public offerings of debt or equity securities. Alternatively, we may need to sell the underlying hotel or, in certain instances, the lender may foreclose. Adverse economic conditions could cause the terms on which we borrow or refinance to be unfavorable. If we are unable to refinance our debt on acceptable terms, we may be forced to dispose of hotels on disadvantageous terms or at times which may not permit us to receive an attractive return on our investments, potentially resulting in losses adversely affecting cash flow from operating activities.
Borrowings may reduce the funds available for distribution and increase the risk of loss since defaults may cause us to lose the properties securing the loans.
We acquired properties by borrowing monies in an amount equal to the fair market value of the acquired properties and we may, in some instances, acquire properties by assuming existing financing. We typically borrow money to finance a portion of the purchase price of assets we acquire. We may also borrow money for
33
Table of Contents
other purposes to, among other things, satisfy the requirement that we distribute at least 90% of our “REIT annual taxable income,” subject to certain adjustments, or as is otherwise necessary or advisable to assure that we continue to qualify as a REIT for U.S. federal income tax purposes. Over the long term, however, payments required on any amounts we borrow reduce the funds available for, among other things, acquisitions, capital expenditures for existing properties or distributions to our stockholders because cash otherwise available for these purposes is used to pay principal and interest on this debt.
If there is a shortfall between the cash flow from a property and the cash flow needed to service mortgage debt on a property, then the amount of cash flow from operations available for distributions to stockholders may be reduced. In addition, incurring mortgage debt increases the risk of loss since defaults on indebtedness secured by a property may result in lenders initiating foreclosure actions. In such a case, we could lose the property securing the loan that is in default, thus reducing the value of your investment. For tax purposes, a foreclosure is treated as a sale of the property or properties for a purchase price equal to the outstanding balance of the debt secured by the property or properties. If the outstanding balance of the debt exceeds our tax basis in the property or properties, we would recognize taxable gain on the foreclosure action and we would not receive any cash proceeds. We also may fully or partially guarantee any monies that subsidiaries borrow to purchase or operate properties. In these cases, we will likely be responsible to the lender for repaying the loans if the subsidiary is unable to do so. If any mortgage contains cross-collateralization or cross-default provisions, more than one property may be affected by a default.
If we are unable to borrow at favorable rates, we may not be able to acquire new properties.
If we are unable to borrow money at favorable rates, we may be unable to acquire additional real estate assets or refinance existing loans at maturity. Further, we may enter into loan agreements or other credit arrangements that require us to pay interest on amounts we borrow at variable or “adjustable” rates. Increases in interest rates will increase our interest costs. If interest rates are higher when we refinance our loans, our expenses will increase, thereby reducing our cash flow and the amount available for distribution to you. Further, during periods of rising interest rates, we may be forced to sell one or more of our properties in order to repay existing loans, which may not permit us to maximize the return on the particular properties being sold.
Interest-only indebtedness may increase our risk of default and ultimately may reduce our funds available for distribution to our stockholders.
We have obtained, and may continue to enter into mortgage indebtedness that does not require us to pay principal for all or a portion of the life of the debt instrument. During the period when no principal payments are required, the amount of each scheduled payment is less than that of a traditional amortizing mortgage loan. The principal balance of the mortgage loan is not reduced (except in the case of prepayments) because there are no scheduled monthly payments of principal required during this period. After the interest-only period, we may be required either to make scheduled payments of principal and interest or to make a lump-sum or “balloon” payment at or prior to maturity. These required principal or balloon payments will increase the amount of our scheduled payments and may increase our risk of default under the related mortgage loan if we do not have funds available or are unable to refinance the obligation.
Existing and future debt agreements may contain, and the credit agreement governing our unsecured revolving credit facility contains, restrictions that may limit our flexibility in operating our business.
The mortgages on our existing hotels, and hotels that we may acquire in the future likely will, contain customary covenants such as those that limit our ability, without the prior consent of the lender, to further mortgage the applicable hotel or to discontinue insurance coverage. In addition, such loans contain negative covenants that, among other things, preclude certain changes of control, inhibit our ability to incur additional indebtedness or, under certain circumstances, restrict cash flow necessary to make distributions to our stockholders.
The credit agreement governing our unsecured revolving credit facility contains customary covenants with which we must comply, which limit the discretion of management with respect to certain business matters. These
34
Table of Contents
covenants place restrictions on, among other things, our ability to incur additional indebtedness, incur liens on assets, enter into new types of businesses, engage in mergers, liquidations or consolidations, sell assets, make restricted payments (including the payment of dividends and other distributions) after the occurrence and during the continuance of a default or event of default, enter into negative pledges or limitations on the ability of subsidiaries to make certain distributions or to guarantee the indebtedness under the credit agreement, engage in certain transactions with affiliates, enter into sale and leaseback transactions, enter into speculative hedging transactions, change our fiscal year and make certain payments and prepayments with respect to subordinated debt. The credit agreement also contains financial covenants relating to our maximum total leverage ratio, maximum secured leverage ratio, maximum secured recourse leverage ratio, minimum fixed charge coverage ratio, minimum consolidated tangible net worth, minimum unsecured interest coverage ratio and setting a minimum number of unencumbered properties we must own and a minimum value for such unencumbered properties. Any other credit facility or secured loans that we enter into may place additional restrictions on us and may require us to meet certain financial ratios and tests. Our continued ability to borrow under the revolving credit facility and any other credit facility that we may obtain will be subject to compliance with these covenants and our ability to meet these covenants will be adversely affected if U.S. lodging fundamentals do not continue to improve when and to the extent that we expect. In addition, our failure to comply with these covenants, as well as our inability to make required payments under the credit agreement or any future debt agreement, could cause an event of default under the credit agreement, which, if not waived, could result in the termination of the financing commitments under the credit agreement and the acceleration of the maturity of the outstanding indebtedness thereunder, or could cause an event of default under such future debt agreement, which could result in the acceleration of the debt and require us to repay such debt with capital obtained from other sources, which may not be available to us or may be available only on unattractive terms. Furthermore, if we default on secured debt, lenders can take possession of the hotel or hotels securing such debt. In addition, the credit agreement contains, and any future debt agreements may contain, cross-default provisions with respect to certain other recourse and non-recourse indebtedness and contain certain other events of default which would similarly, in each case, give the lenders under the credit agreement the right to terminate such financing commitments and accelerate the maturity of such indebtedness under the credit agreement or give the lenders under such other agreement the right to declare a default on its debt and to enforce remedies, including acceleration of the maturity of such debt upon the occurrence of a default under such other indebtedness. If we default on our credit agreement or any other debt agreements, it could materially and adversely affect us.
In addition, in connection with our debt agreements we may enter into lockbox and cash management agreements pursuant to which substantially all of the income generated by our hotel properties will be deposited directly into lockbox accounts and then swept into cash management accounts for the benefit of our lenders and from which cash will be distributed to us only after funding of certain items, which may include payment of principal and interest on our debt, insurance and tax reserves or escrows and other expenses. As a result, we may be forced to borrow additional funds in order to make distributions to our stockholders (including, potentially, to make distributions necessary to allow us to qualify as a REIT).
We may be unable to satisfy our debt obligations upon a change of control.
Under the documents that govern our indebtedness, if we experience a change of control, we could be required to incur certain penalties, fees and other expenses, which may include repayment of the entire principal balance of some of our outstanding indebtedness plus additional fees and interest. We might not have sufficient funds to repay such amounts. Any of these events could have a material adverse impact on our liquidity, business, results of operations and financial condition.
Covenants applicable to current or future debt could restrict our ability to make distributions to our stockholders and, as a result, we may be unable to make distributions necessary to qualify as a REIT, which could materially and adversely affect us and the market price of our common stock.
We intend to operate in a manner so as to qualify as a REIT for U.S. federal income tax purposes. In order to qualify as a REIT, we generally are required to distribute at least 90% of our REIT taxable income, determined
35
Table of Contents
without regard to the dividends paid deduction and excluding net capital gain, each year to our stockholders. To the extent that we satisfy this distribution requirement, but distribute less than 100% of our REIT taxable income, we will be subject to U.S. federal corporate income tax on our undistributed taxable income. In addition, we will be subject to a 4% nondeductible excise tax if the actual amount that we distribute to our stockholders in a calendar year is less than a minimum amount specified under the Code. If, as a result of covenants applicable to our current or future debt, we are restricted from making distributions to our stockholders, we may be unable to make distributions necessary for us to avoid U.S. federal corporate income and excise taxes and maintain our qualification as a REIT, which could materially and adversely affect us.
Increases in interest rates could increase the amount of our debt payments and adversely affect our ability to make distributions to our stockholders.
We have borrowed money, which bears interest at variable rates, and therefore are exposed to increases in costs in a rising interest rate environment. Increases in interest rates would increase our interest expense on any variable rate debt, as well as any debt that must be refinanced at higher interest rates at the time of maturity. Our future earnings and cash flows could be adversely affected due to the increased requirement to service our debt and could reduce the amount we are able to distribute to our stockholders. As of December 31, 2014 approximately $579.0 million, or 48.2% of the total debt bore interest at variable rates.
We may be contractually obligated to purchase property even if we are unable to secure financing for the acquisition.
We may finance all or a portion of the purchase price for properties that we acquire. However, to ensure that our offers are as competitive as possible, we do not expect to enter into contracts to purchase property that include financing contingencies. Thus, we may be contractually obligated to purchase a property even if we are unable to secure financing for the acquisition. In this event, we may choose to close on the property by using cash on hand, which would result in less cash available for our operations and distributions to stockholders. Alternatively, we may choose not to close on the acquisition of the property and default on the purchase contract. If we default on any purchase contract, we could lose our earnest money and become subject to liquidated or other contractual damages and remedies.
To hedge against interest rate fluctuations, we may use derivative financial instruments that may be costly and ineffective.
To the extent consistent with qualifying as a REIT, from time to time, we may use derivative financial instruments to hedge exposures to changes in interest rates on loans secured by our assets. Derivative instruments may include interest rate swap contracts, interest rate cap or floor contracts, futures or forward contracts, options or repurchase agreements. Our actual hedging decisions will be determined in light of the facts and circumstances existing at the time of the hedge and may differ from our currently anticipated hedging strategy. There is no assurance that our hedging strategy will achieve our objectives. We may be subject to costs, such as transaction fees or breakage costs, if we terminate these arrangements.
To the extent that we use derivative financial instruments to hedge against interest rate fluctuations, we will be exposed to credit risk, basis risk and legal enforceability risks. In this context, credit risk is the failure of the counterparty to perform under the terms of the derivative contract. If the fair value of a derivative contract is positive, the counterparty owes us, which creates credit risk for us. If the fair value of a derivative contract is negative, we owe the counterparty, which creates a risk that we may not be able to pay such amounts. Basis risk occurs when the index upon which the contract is based is more or less variable than the index upon which the hedged asset or liability is based, thereby making the hedge less effective. Finally, legal enforceability risks encompass general contractual risks including the risk that the counterparty will breach the terms of, or fail to perform its obligations under, the derivative contract, increasing the risk that we may not realize the benefits of these instruments. There is a risk that counterparties could fail, shut down, file for bankruptcy or be unable to pay out contracts. The failure of a counterparty that holds collateral that we post in connection with an interest rate swap agreement could result in the loss of that collateral.
36
Table of Contents
There can be no assurance that the direct or indirect effects of the Dodd-Frank Wall Street Reform and Consumer Protection Act will not have an adverse effect on our interest rate hedging activities.
Title VII of the Dodd-Frank Act contains a sweeping overhaul of the regulation of privately negotiated derivatives. The provisions of Title VII became effective on July 16, 2011 or, with respect to particular provisions, on such other date specified in the Dodd-Frank Act or by subsequent rulemaking. Pursuant to the regulatory framework established by Title VII of the Dodd-Frank Act, the Commodity Futures Trading Commission, or the CFTC, has been granted broad regulatory authority over “swaps,” which term has been defined in the Dodd-Frank Act and related CFTC rules to include interest rate derivatives such as the ones we may use in our interest rate hedging activities. While the full impact of the Dodd-Frank Act on our interest rate hedging activities cannot be fully assessed until all final implementing rules and regulations are promulgated, the requirements of Title VII may affect our ability to enter into hedging or other risk management transactions, may increase our costs in entering into such transactions, and/or may result in us entering into such transactions on less favorable terms than prior to effectiveness of the Dodd-Frank Act. For example, subject to an exception for end-users of swaps upon which we may seek to rely, we may be required to clear certain interest rate hedging transactions by submitting them to a derivatives clearing organization. In addition, to the extent we are required to clear any such transactions, we will be required to, among other things, post margin in connection with such transactions. The occurrence of any of the foregoing events may have an adverse effect on our business and our stockholders’ return.
Risks Related to Our Status as REIT
Failure to qualify as a REIT, or failure to remain qualified as a REIT, would cause us to be taxed as a regular corporation, which would substantially reduce funds available for distributions to our stockholders.
We believe that our organization and proposed method of operation will enable us to meet the requirements for qualification and taxation as a REIT beginning with our short taxable year that commenced on January 5, 2015. However, we cannot assure you that we will qualify and remain qualified as a REIT.
If we fail to qualify as a REIT in any taxable year, we will face serious tax consequences that will substantially reduce the funds available for distributions to our stockholders because:
| • | we would not be allowed a deduction for dividends paid to stockholders in computing our taxable income and would be subject to U.S. federal income tax at regular corporate rates; |
| • | we could be subject to the U.S. federal alternative minimum tax and possibly increased state and local taxes; and |
| • | unless we are entitled to relief under certain U.S. federal income tax laws, we could not re-elect REIT status until the fifth calendar year after the year in which we failed to qualify as a REIT. |
In addition, if we fail to qualify as a REIT, we will no longer be required to make distributions. As a result of all these factors, our failure to qualify as a REIT could impair our ability to expand our business and raise capital, and it would adversely affect the value of our common stock.
If Inland American failed to qualify as a REIT in its 2011 through 2015 taxable years, we would be prevented from electing to qualify as a REIT.
We believe that from the time of our formation until January 5, 2015, we were treated as a “qualified REIT subsidiary” of Inland American. Under applicable Treasury regulations, if Inland American failed, or fails, to qualify as a REIT in its 2011 through 2015 taxable years, unless Inland American’s failure was subject to relief under U.S. federal income tax laws, we would be prevented from electing to qualify as a REIT prior to the fifth calendar year following the year in which Inland American failed to qualify.
37
Table of Contents
If we and Inland American make a tax election that would, among other things, cause us to have a short taxable year that would end on February 3, 2015 and we fail to qualify as a REIT for that short taxable year, we would be liable for a material corporate income tax and would be precluded from qualifying as a REIT for the following four taxable years.
We and Inland American may make an election under section 336(e) of the Code, (“or a section 336(e) election”), with respect to our separation from Inland American, which would allow us to significantly increase our tax basis in our assets. If that election is made, we would, among other things, be deemed to sell all of our assets to a third party and liquidate on February 3, 2015, the date of the separation. Any gain we recognized in that deemed sale that is attributable to the personal property at our hotels would not be qualifying income for purposes of the 75% and 95% gross income tests applicable to REITs. Pursuant to the Separation and Distribution Agreement, Inland American has agreed to make a section 336(e) election upon our request. Although we currently intend to request that Inland American make a section 336(e) election, no assurance can be provided that we will make that election. We will request that Inland American make a section 336(e) election only if we determine that we can satisfy the 75% and 95% gross income tests for our short taxable year that would end on February 3, 2015, taking into account the nonqualifying gain from the deemed sale of our personal property. No complete assurance can be provided that the IRS would not disagree with our valuation of our personal property and our determination of the gain from the deemed sale of that property. If the IRS successfully asserted that we failed to satisfy one or more of the requirements for REIT qualification for our short taxable year ended on February 3, 2015 and we did not qualify for one of the REIT “savings clauses,” we would be subject to corporate income tax on the deemed sale of our assets pursuant to the section 336(e) election, and that corporate income tax would be material. In addition, we would be precluded from electing REIT status for the four taxable years following that failure.
Even if we qualify as a REIT, we may face other tax liabilities that reduce our cash flows.
Even if we qualify for taxation as a REIT, we may be subject to certain U.S. federal, state and local taxes on our income and assets, including taxes on any undistributed income, tax on income from some activities conducted as a result of a foreclosure, and state or local income, property and transfer taxes. In addition, our TRS, and any other TRS we form, will be subject to regular corporate federal, state and local taxes. Any of these taxes would decrease cash available for distributions to stockholders.
Failure to make required distributions would subject us to federal corporate income tax.
We intend to operate in a manner so as to qualify as a REIT for U.S. federal income tax purposes. In order to qualify as a REIT, we generally are required to distribute at least 90% of our REIT taxable income, determined without regard to the dividends paid deduction and excluding any net capital gain, each year to our stockholders. To the extent that we satisfy this distribution requirement, but distribute less than 100% of our REIT taxable income, we will be subject to U.S. federal corporate income tax on our undistributed taxable income. In addition, we will be subject to a 4% nondeductible excise tax if the actual amount that we pay out to our stockholders in a calendar year is less than a minimum amount specified under the Code.
REIT distribution requirements could adversely affect our liquidity and may force us to borrow funds or sell assets during unfavorable market conditions.
To satisfy the REIT distribution requirements, we may need to borrow funds on a short-term basis or sell assets, even if the then-prevailing market conditions are not favorable for these borrowings or sales. Our cash flows from operations may be insufficient to fund required distributions as a result of differences in timing between the actual receipt of income and the recognition of income for U.S. federal income tax purposes, or the effect of non-deductible capital expenditures, the creation of reserves or required debt service or amortization payments. The insufficiency of our cash flows to cover our distribution requirements could have an adverse impact on our ability to raise short- and long-term debt or sell equity securities in order to fund distributions required to maintain our qualification as a REIT.
38
Table of Contents
The ownership of our TRS and our TRS lessees increases our overall tax liability.
Our TRS and any other of our domestic TRSs will be subject to U.S. federal, state and local income tax on their taxable income, which will consist of the revenues from the hotels leased by our TRS lessees, net of the operating expenses for such hotels and rent payments to us. Accordingly, although our ownership of our TRS lessees will allow us to participate in the operating income from our hotels in addition to receiving rent, that operating income will be fully subject to income tax. The after-tax net income of our TRS lessees is available for distribution to us. If we have any non-U.S. TRSs, then they may be subject to tax in jurisdictions where they operate.
Our TRS lessee structure subjects us to the risk of increased hotel operating expenses that could adversely affect our operating results and our ability to make distributions to stockholders.
Our leases with our TRS lessees require our TRS lessees to pay us rent based in part on revenues from our hotels. Our operating risks include decreases in hotel revenues and increases in hotel operating expenses, including but not limited to the increases in wage and benefit costs, repair and maintenance expenses, energy costs, property taxes, insurance costs and other operating expenses, which would adversely affect our TRS lessees’ ability to pay us rent due under the leases.
Increases in these operating expenses can have a significant adverse impact on our financial condition, results of operations, the market price of our common shares and our ability to make distributions to our stockholders.
Our ownership of our TRS, and any other TRSs we form, will be subject to limitations and our transactions with our TRS, and any other TRSs we form, will cause us to be subject to a 100% penalty tax on certain income or deductions if those transactions are not conducted on arm’s-length terms.
Overall, no more than 25% of the value of a REIT’s assets may consist of stock or securities of one or more TRSs. In addition, the Code limits the deductibility of interest paid or accrued by a TRS to its parent REIT to assure that the TRS is subject to an appropriate level of corporate taxation. The Code also imposes a 100% excise tax on certain transactions between a TRS and its parent REIT that are not conducted on an arm’s-length basis. The 100% tax would apply, for example, to the extent that we were found to have charged our TRS lessees rent in excess of an arm’s-length rent. Furthermore, we will monitor the value of our respective investments in our TRS for the purpose of ensuring compliance with TRS ownership limitations and will structure our transactions with our TRS on terms that we believe are arm’s length to avoid incurring the 100% excise tax described above. There can be no assurance, however, that we will be able to comply with the 25% TRS limitation or to avoid application of the 100% excise tax.
If the leases of our hotels to our TRS lessees are not respected as true leases for U.S. federal income tax purposes, we will fail to qualify as a REIT.
To qualify as a REIT, we must annually satisfy two gross income tests, under which specified percentages of our gross income must be derived from certain sources, such as “rents from real property.” Rents paid to our operating partnership by our TRS lessees pursuant to the leases of our hotels will constitute substantially all of our gross income. In order for such rent to qualify as “rents from real property” for purposes of the gross income tests, the leases must be respected as true leases for U.S. federal income tax purposes and not be treated as service contracts, financing arrangements, joint ventures or some other type of arrangement. If our leases are not respected as true leases for U.S. federal income tax purposes, we will fail to qualify as a REIT.
If any of our current and future hotel management companies do not qualify as “eligible independent contractors,” or if our hotels are not “qualified lodging facilities,” we will fail to qualify as a REIT.
Rent paid by a lessee that is a “related party tenant” of ours will not be qualifying income for purposes of the two gross income tests applicable to REITs. An exception is provided, however, for leases of “qualified lodging
39
Table of Contents
facilities” to a TRS so long as the hotels are managed by an “eligible independent contractor” and certain other requirements are satisfied. We expect to lease all or substantially all of our hotels to our TRS lessees and to engage hotel management companies that qualify as “eligible independent contractors.” Among other requirements, in order to qualify as an eligible independent contractor, the hotel manager must not own, directly or through its stockholders, more than 35% of our outstanding shares, and no person or group of persons can own more than 35% of our outstanding shares and the shares (or ownership interest) of the hotel manager, taking into account certain ownership attribution rules. The ownership attribution rules that apply for purposes of these 35% thresholds are complex, and monitoring actual and constructive ownership of our shares by our hotel managers and their owners may not be practical. Accordingly, there can be no assurance that these ownership levels will not be exceeded.
In addition, for a hotel management company to qualify as an eligible independent contractor, such company or a related person must be actively engaged in the trade or business of operating “qualified lodging facilities” (as defined below) for one or more persons not related to the REIT or its TRSs at each time that such company enters into a hotel management contract with a TRS or its TRS lessee. We believe our current hotel managers operate qualified lodging facilities for certain persons who are not related to us or our TRS. However, no assurances can be provided that any of our current and future hotel managers will in fact comply with this requirement. Failure to comply with this requirement would require us to find other managers for future contracts, and, if we hired a management company without knowledge of the failure, it could jeopardize our status as a REIT.
Finally, each property with respect to which our TRS lessees pay rent must be a “qualified lodging facility.” A “qualified lodging facility” is a hotel, motel or other establishment more than one-half of the dwelling units in which are used on a transient basis, including customary amenities and facilities, provided that no wagering activities are conducted at or in connection with such facility by any person who is engaged in the business of accepting wagers and who is legally authorized to engage in such business at or in connection with such facility. We believe that the hotels that are leased to our TRS lessees are qualified lodging facilities. Although we intend to monitor future acquisitions and improvements of properties, REIT provisions of the Code provide only limited guidance for making determinations under the requirements for qualified lodging facilities, and there can be no assurance that these requirements will be satisfied.
Complying with REIT requirements may force us to forgo and/or liquidate otherwise attractive investment opportunities.
To qualify as a REIT, we must ensure that we meet the REIT gross income tests annually and that at the end of each calendar quarter, at least 75% of the value of our assets consists of cash, cash items, government securities and qualified real estate assets. The remainder of our investment in securities (other than government securities and qualified real estate assets) generally cannot include more than 10% of the outstanding voting securities of any one issuer or more than 10% of the total value of the outstanding securities of any one issuer. In addition, in general, no more than 5% of the value of our assets (other than government securities and qualified real estate assets) can consist of the securities of any one issuer, and no more than 25% of the value of our total assets can be represented by securities of one or more taxable REIT subsidiaries. If we fail to comply with these requirements at the end of any calendar quarter, we must correct the failure within 30 days after the end of the calendar quarter or qualify for certain statutory relief provisions to avoid losing our REIT qualification and suffering adverse tax consequences. As a result, we may be required to liquidate from our portfolio, or contribute to a TRS, otherwise attractive investments in order to maintain our qualification as a REIT. These actions could have the effect of reducing our income and amounts available for distribution to our stockholders. In addition, we may be required to make distributions to stockholders at disadvantageous times or when we do not have funds readily available for distribution, and may be unable to pursue investments that would otherwise be advantageous to us in order to satisfy the source of income or asset diversification requirements for qualifying as a REIT. Thus, compliance with the REIT requirements may hinder our ability to make, and, in certain cases, maintain ownership of, certain attractive investments.
40
Table of Contents
You may be restricted from acquiring or transferring certain amounts of our common stock.
The stock ownership restrictions of the Code for REITs and the 9.8% stock ownership limit in our charter may inhibit market activity in our capital stock and restrict our business combination opportunities.
In order to qualify as a REIT for each taxable year after our first taxable year as a REIT, five or fewer individuals, as defined in the Code, may not own, beneficially or constructively, more than 50% in value of our issued and outstanding stock at any time during the last half of a taxable year. Attribution rules in the Code determine if any individual or entity beneficially or constructively owns our capital stock under this requirement. Additionally, at least 100 persons must beneficially own our capital stock during at least 335 days of a taxable year for each taxable year after our first taxable year as a REIT. To help insure that we meet these tests, our charter restricts the acquisition and ownership of shares of our capital stock.
Our charter authorizes our directors to take such actions as are necessary and desirable to preserve our qualification as a REIT. Unless exempted by our board of directors (prospectively or retroactively), our charter prohibits any person from beneficially or constructively owning more than 9.8% in value or number of shares, whichever is more restrictive, of the outstanding shares of any class or series of our capital stock. Our board of directors may not grant an exemption from these restrictions to any proposed transferee whose ownership in excess of 9.8% of the value of our outstanding shares would result in our failing to qualify as a REIT. These restrictions on transferability and ownership will not apply, however, if our board of directors determines that it is no longer in our best interest to continue to qualify as a REIT or that compliance is no longer required in order for us to qualify as a REIT.
We may pay taxable dividends in our common stock and cash, in which case stockholders may sell shares of our common stock to pay tax on such dividends, placing downward pressure on the market price of our common stock.
We may distribute taxable dividends that are payable in cash and common stock at the election of each stockholder. If we made a taxable dividend payable in cash and common stock, taxable stockholders receiving such dividends will be required to include the full amount of the dividend as ordinary income to the extent of our current and accumulated earnings and profits, as determined for U.S. federal income tax purposes. As a result, stockholders may be required to pay income tax with respect to such dividends in excess of the cash dividends received. If a U.S. stockholder sells the common stock that it receives as a dividend in order to pay this tax, the sales proceeds may be less than the amount included in income with respect to the dividend, depending on the market price of our common stock at the time of the sale. Furthermore, with respect to certain non-U.S. stockholders, we may be required to withhold U.S. federal income tax with respect to such dividends, including in respect of all or a portion of such dividend that is payable in common stock. If we made a taxable dividend payable in cash and our common stock and a significant number of our stockholders determine to sell shares of our common stock in order to pay taxes owed on dividends, it may put downward pressure on the trading price of our common stock. We do not currently intend to pay a taxable dividend of our common stock and cash.
Dividends payable by REITs do not qualify for the reduced tax rates available for some dividends.
The maximum tax rate applicable to “qualified dividend income” payable to U.S. stockholders that are taxed at individual rates is 20%. Dividends payable by REITs, however, are generally not eligible for the reduced rates on qualified dividend income. The more favorable rates applicable to regular corporate qualified dividends could cause investors who are taxed at individual rates to perceive investments in REITs to be relatively less attractive than investments in the stocks of non-REIT corporations that pay dividends treated as qualified dividend income, which could adversely affect the value of the shares of REITs, including our common stock.
Complying with REIT requirements may limit our ability to hedge effectively.
The REIT provisions of the Code may limit our ability to hedge the risks inherent to our operations. Under current law, any income that we generate from derivatives or other transactions intended to hedge our interest
41
Table of Contents
rate risk with respect to borrowings made, or to be made, to acquire or carry real estate assets generally will not constitute gross income for purposes of the 75% and 95% income requirements applicable to REITs. In addition, any income from certain other qualified hedging transactions would generally not constitute gross income for purposes of both the 75% and 95% income tests. However, we may be required to limit the use of hedging techniques that might otherwise be advantageous, which could result in greater risks associated with interest rate or other changes than we would otherwise incur.
The ability of our board of directors to revoke our REIT qualification without stockholder approval may cause adverse consequences to our stockholders.
Our charter provides that our board of directors may revoke or otherwise terminate our REIT election, without the approval of our stockholders, if it determines that it is no longer in our best interest to attempt to, or continue to qualify as a REIT. If we cease to be a REIT, we would become subject to U.S. federal income tax on our taxable income and would no longer be required to distribute most of our taxable income to our stockholders, which may have adverse consequences on our total return to our stockholders.
We may be subject to adverse legislative or regulatory tax changes that could reduce the market price of our common stock.
At any time, the U.S. federal income tax laws governing REITs or the administrative interpretations of those laws may be amended. We cannot predict when or if any new U.S. federal income tax law, regulation, or administrative interpretation, or any amendment to any existing federal income tax law, regulation or administrative interpretation, will be adopted, promulgated or become effective and any such law, regulation, or interpretation may take effect retroactively. We and our stockholders could be adversely affected by any such change in, or any new, U.S. federal income tax law, regulation or administrative interpretation.
Risks Related to Ownership of Our Common Stock and our Corporate Structure
The market price of our shares may fluctuate widely and there can be no assurance that the market for our stock will provide you with adequate liquidity. In addition, the market price of our shares may fluctuate widely.
Prior to our separation from Inland American there was no public market for our common stock, and we cannot predict the prices at which our common stock may trade in the future. The market price of our common stock may fluctuate widely, depending on many factors, some of which may be beyond our control, including:
| • | actual or anticipated differences in our operating results, liquidity, or financial condition; |
| • | changes in our revenues, Adjusted EBITDA, FFO, Adjusted FFO, or earnings estimates; |
| • | publication of research reports about us, our hotels or the lodging or overall real estate industry; |
| • | failure to meet analysts’ revenue or earnings estimates; |
| • | the extent of institutional investor interest in us; |
| • | the reputation of REITs and real estate investments generally and the attractiveness of REIT equity securities in comparison to other equity securities, including securities issued by other real estate companies, and fixed income securities; |
| • | additions and departures of key personnel; |
| • | the performance and market valuations of other similar companies; |
| • | strategic actions by us or our competitors, such as acquisitions or restructurings; |
| • | fluctuations in the stock price and operating results of our competitors; |
42
Table of Contents
| • | the passage of legislation or other regulatory developments that adversely affect us or our industry; |
| • | the realization of any of the other risk factors presented in this Annual Report; |
| • | speculation in the press or investment community; |
| • | changes in accounting principles; |
| • | terrorist acts; and |
| • | general market and economic conditions, including factors unrelated to our operating performance. |
Stock markets in general have experienced volatility that has often been unrelated to the operating performance of a particular company. These broad market fluctuations may adversely affect the trading price of our common stock.
Significant sales of our common stock, or the perception that significant sales of such shares could occur, may cause the price of our common stock to decline significantly.
A large volume of sales of shares of our common stock could decrease the market price of our common stock and could impair our ability to raise additional capital through the sale of equity securities in the future. Even if a substantial number of sales of our shares are not affected, the mere perception of the possibility of these sales could depress the market price of our common stock and have a negative effect on our ability to raise capital in the future. In addition, anticipated downward pressure on our common stock price due to actual or anticipated sales of common stock from this market overhang could cause some institutions or individuals to engage in short sales of our common stock, which may itself cause the price of our common stock to decline.
Our common stock may experience low trading volumes and higher trading price volatility due to the composition of our stockholder base in the months following the distribution.
Inland American is a non-publicly-traded REIT held almost exclusively by non-institutional stockholders, and in the first months after the distribution, a significant portion of our common stock continues to be held by such stockholders. Non-institutional stockholders may not trade with the frequency and predictability of institutional stockholders, which may result in low liquidity and trading price volatility.
Future sales or distributions of our common stock, including the sale by Inland American of the shares of our common stock that it retains after the distribution, may negatively affect the market price of our common stock.
It is possible that some of our large stockholders will sell our common stock received in the distribution. In addition, following the distribution, Inland American has retained ownership of approximately 5% of the outstanding shares of our common stock. Subject to applicable securities laws, Inland American may choose to dispose of some or all of our shares at any time. Any disposition by Inland American, or any significant stockholder, of our common stock in the public market, or the perception that such dispositions could occur, could adversely affect prevailing market prices for our common stock.
Our cash available for distribution to stockholders may not be sufficient to pay distributions at expected or required levels, and we may need external sources in order to make such distributions, or we may not be able to make such distributions at all, which could cause the market price of our common stock to decline significantly.
We intend to pay regular quarterly distributions to holders of our common stock. We have established our initial distribution rate based upon our estimate of the annualized cash flow that will be available for distributions after the separation. All distributions will be made at the discretion of our board of directors and will depend on our
43
Table of Contents
historical and projected results of operations, Adjusted EBITDA, FFO, Adjusted FFO, liquidity and financial condition, REIT qualification, debt service requirements, capital expenditures and operating expenses, prohibitions and other restrictions under financing arrangements and applicable law and other factors as our board of directors may deem relevant from time to time. No assurance can be given that our projections will prove accurate or that any level of distributions will be made or sustained or achieve a market yield. We may not be able to make distributions in the future or may need to consider various funding sources to cover any shortfall, including borrowing under our $400 million unsecured revolving credit facility, selling certain of our assets or using a portion of the net proceeds we receive from future offerings of equity, equity-related or debt securities or declaring taxable share dividends. Any of the foregoing could cause the market price of our common stock to decline significantly.
Future issuances of debt securities, which would rank senior to our common stock upon our liquidation, and future issuances of equity securities (including OP Units), which would dilute the holdings of our existing common stockholders and may be senior to our common stock for the purposes of making distributions, periodically or upon liquidation, may negatively affect the market price of our common stock.
In the future, we may issue debt or equity securities or incur other borrowings. Upon our liquidation, holders of our debt securities and other loans and preferred shares will receive a distribution of our available assets before common stockholders. If we incur debt in the future, our future interest costs could increase, and adversely affect our liquidity, FFO, Adjusted FFO and results of operations. We are not required to offer any additional equity securities to existing common stockholders on a preemptive basis. Therefore, additional common stock issuances, directly or through convertible or exchangeable securities (including OP Units), warrants or options, will dilute the holdings of our existing common stockholders and such issuances or the perception of such issuances may reduce the market price of our common stock. Our outstanding Series A Preferred Stock has a distribution requirement of $15,625 annually, which is required to be paid or set apart for payment before any distributions on our common stock can be made, and any other preferred stock, if issued, would likely have a preference on distribution payments, periodically or upon liquidation, which could eliminate or otherwise limit our ability to make distributions to common stockholders. Because our decision to issue debt or equity securities or incur other borrowings in the future will depend on market conditions and other factors beyond our control, we cannot predict or estimate the amount, timing, nature or success of our future capital raising efforts. Thus, common stockholders bear the risk that our future issuances of debt or equity securities or our incurrence of other borrowings will negatively affect the market price of our common stock.
Your percentage ownership in us may be diluted in the future.
As with any publicly traded company, your percentage ownership in us may be diluted in the future because of equity issuances for acquisitions, capital market transactions or otherwise, including, without limitation, equity awards that may be granted to our directors, officers and employees. Our board of directors has approved an Incentive Award Plan (the “Plan”), which provides for the grant of equity-based awards, including performance awards, stock options, stock appreciation rights, restricted stock and other equity-based and non-equity based awards to our directors, officers and employees. We reserved 7,000,000 shares of our common stock for issuance under the Plan. For a more detailed description of the Plan, see “Part III—Item 12. Security Ownership of Certain Beneficial Owners and Management and Related Stockholder Matters.”
If securities analysts do not publish research or reports about our business or if they downgrade our stock or our sector, our stock price and trading volume could decline.
The trading market for our common stock will rely in part on the research and reports that industry or financial analysts publish about us or our business. We do not control these analysts. Furthermore, if one or more of the analysts who do cover us downgrade our stock or our industry, or the stock of any of our competitors, or publish inaccurate or unfavorable research about our business, the price of our common stock could decline. If one or more of these analysts ceases coverage of us or fails to publish reports on us regularly, we could lose viability in the market, which in turn could cause our stock price or trading volume to decline.
44
Table of Contents
Increases in market interest rates may reduce demand for our common stock and result in a decline in the market price of our common stock.
The market price of our common stock may be influenced by the distribution yield on our common stock (i.e., the amount of our annual distributions as a percentage of the market price of our common stock) relative to market interest rates. An increase in market interest rates, which are currently low compared to historical levels, may lead prospective purchasers of our common stock to expect a higher distribution yield, which we may not be able, or may choose not, to provide. Higher interest rates would also likely increase our borrowing costs and decrease our operating results and cash available for distribution. Thus, higher market interest rates could cause the market price of our common stock to decline.
Our rights and the rights of our stockholders to take action against our directors and officers are limited, which could limit our stockholders’ recourse in the event of actions not in our stockholders’ best interests.
Under Maryland law generally, a director is required to perform his or her duties in good faith, in a manner he or she reasonably believes to be in our best interests and with the care that an ordinarily prudent person in a like position would use under similar circumstances. Under Maryland law, directors are presumed to have acted in accordance with this standard of conduct. In addition, our charter eliminates the liability of our directors and officers to us and our stockholders for money damages, except for liability resulting from:
| • | actual receipt of an improper benefit or profit in money, property or services; or |
| • | active and deliberate dishonesty by the director or officer that was established by a final judgment as being material to the cause of action adjudicated. |
Our charter authorizes us to obligate ourselves and our bylaws obligate us, to the maximum extent permitted by Maryland law in effect from time to time, to indemnify and to pay or reimburse reasonable expenses in advance of final disposition of a proceeding to any present or former director or officer who is made or threatened to be made a party to the proceeding by reason of his or her service to us in that capacity. As a result, we and our stockholders may have more limited rights against our directors and officers than might otherwise exist absent the current provisions in our charter and bylaws.
Certain provisions of Maryland law could inhibit changes in control.
Certain provisions of the Maryland General Corporation Law, or MGCL, may have the effect of deterring a third party from making a proposal to acquire us or of impeding a change in our control under circumstances that otherwise could provide the holders of our common stock with the opportunity to realize a premium over the then-prevailing market price of our common stock, including:
| • | “business combination” provisions that, subject to limitations, prohibit certain business combinations between us and an “interested stockholder” (defined generally as any person who beneficially owns, directly or indirectly, 10% or more of the voting power of our outstanding voting stock or an affiliate or associate of ours who was the beneficial owner, directly or indirectly, of 10% or more of the voting power of our then outstanding voting stock at any time within the two-year period immediately prior to the date in question) for five years after the most recent date on which the stockholder becomes an interested stockholder, and thereafter impose fair price and/or supermajority stockholder voting requirements on these combinations; and |
| • | “control share” provisions that provide that “control shares” of our company (defined as voting shares that, when aggregated with other shares controlled by the stockholder, entitle the stockholder to exercise one of three increasing ranges of voting power in electing directors) acquired in a “control share acquisition” (defined as the direct or indirect acquisition of ownership or control of issued and outstanding control shares) have no voting rights except to the extent approved by our stockholders by the affirmative vote of at least two-thirds of all the votes entitled to be cast on the matter, excluding all interested shares. |
45
Table of Contents
As permitted by Maryland law, we have elected, by resolution of our board of directors, to opt out of the business combination provisions of the MGCL, provided that such business combination has been approved by our board of directors (including a majority of directors who are not affiliated with the interested stockholder), and, pursuant to a provision in our bylaws, to exempt any acquisition of our stock from the control share provisions of the MGCL. However, our board of directors may by resolution elect to repeal the exemption from the business combination provisions of the MGCL and may by amendment to our bylaws opt into the control share provisions of the MGCL at any time in the future.
Certain provisions of the MGCL permit our board of directors, without stockholder approval and regardless of what is currently provided in our charter or bylaws, to adopt certain mechanisms, some of which (for example, a classified board) we do not have. These provisions may have the effect of limiting or precluding a third party from making an acquisition proposal for us or of delaying, deferring or preventing a change in our control under circumstances that otherwise could provide the holders of our common stock with the opportunity to realize a premium over the then current market price. Our charter contains a provision whereby we elect to be subject to the provisions of Title 3, Subtitle 8 of the MGCL relating to the filling of vacancies on our board of directors.
As a holding company with no direct operations, we rely on funds received from our operating partnership to pay liabilities.
As a holding company that conducts substantially all of our operations through our operating partnership, we rely on distributions from our operating partnership to pay any dividends we might declare on shares of our common stock. We also rely on distributions from our operating partnership to meet any of our obligations, including any tax liability on taxable income allocated to us from our operating partnership. In addition, because we are a holding company, your claims as stockholders will be structurally subordinated to all existing and future liabilities and obligations (whether or not for borrowed money) of our operating partnership and its subsidiaries. Therefore, in the event of our bankruptcy, liquidation or reorganization, our assets and those of our operating partnership and its subsidiaries will be able to satisfy the claims of our stockholders only after all of our and our operating partnership’s and its subsidiaries’ liabilities and obligations have been paid in full.
We currently own directly or indirectly 100% of the interests in our operating partnership. However, in connection with our future acquisition of properties or otherwise, we may issue OP Units to third parties. Such issuances would reduce our ownership in our operating partnership. Because you will not directly own units of our operating partnership, you will not have any voting rights with respect to any such issuances or other partnership level activities of our operating partnership.
Our charter places limits on the amount of common stock that any person may own.
No more than 50% of the outstanding shares of our common stock may be beneficially owned, directly or indirectly, by five or fewer individuals at any time during the last half of each taxable year (other than the first taxable year for which an election to be a REIT has been made). Unless exempted by our board of directors, prospectively or retroactively, our charter prohibits any person or group from owning more than 9.8% in value or in number of shares, whichever is more restrictive, of the outstanding shares of any class or series of our capital stock. These provisions may have the effect of delaying, deferring or preventing a change in control of us, including an extraordinary transaction such as a merger, tender offer or sale of all or substantially all of our assets that might involve a premium price for holders of our common stock.
If anyone transfers shares in a way that would violate the ownership limit, or prevent us from qualifying as a REIT under the U.S. federal income tax laws, those shares instead will be transferred to a trust for the benefit of a charitable beneficiary and will be either redeemed by us or sold to a person whose ownership of the shares will not violate the ownership limit. If this transfer to a trust fails to prevent such a violation or our continued qualification as a REIT, then the initial intended transfer shall be null and void from the outset. The intended
46
Table of Contents
transferee of those shares will be deemed never to have owned the shares. Anyone who acquires shares in violation of the ownership limit or the other restrictions on transfer in our charter bears the risk of suffering a financial loss when the shares are redeemed or sold if the market price of our shares falls between the date of purchase and the date of redemption or sale.
Our charter permits our board of directors to issue preferred stock on terms that may subordinate the rights of the holders of our current common stock or discourage a third party from acquiring us.
Our board of directors is permitted, subject to certain restrictions set forth in our charter, to authorize the issuance of up to 500,000,000 shares of common stock and 50,000,000 shares of preferred stock without stockholder approval. To facilitate our ability to qualify as a REIT in connection with a potential section 336(e) election, we issued 125 shares of Series A Preferred Stock to 125 individual investors on January 5, 2015. Further, our board may classify or reclassify any unissued shares of common or preferred stock into other classes or series of stock and establish the preferences, conversion or other rights, voting powers, restrictions, limitations as to dividends and other distributions, qualifications, and terms or conditions of redemption of the stock and may amend our charter from time to time to increase or decrease the aggregate number of shares or the number of shares of any class or series that we have authority to issue without stockholder approval. Thus, our board of directors could authorize us to issue shares of preferred stock with terms and conditions that could subordinate the rights of the holders of our common stock or shares of preferred stock or common stock that could have the effect of delaying, deferring or preventing a change in control of us, including an extraordinary transaction such as a merger, tender offer or sale of all or substantially all of our assets, that might provide a premium price for holders of our common stock.
Our conflict of interest policy may not be successful in eliminating the influence of future conflicts of interest that may arise between us and our directors, officers and employees.
Our conflict of interest policy provides that any transaction, agreement or relationship in which any of our directors, officers or employees has a material direct or indirect pecuniary interest must be approved by a majority of our disinterested directors. Other than this policy, however, we may not adopt additional formal procedures for the review and approval of conflict of interest transactions generally. As such, our policies and procedures may not be successful in eliminating the influence of conflicts of interest.
Conflicts of interest could arise in the future between the interests of our stockholders and the interests of any holders of OP Units in our operating partnership, which may impede business decisions that could benefit our stockholders.
If in the future we have unaffiliated owners of OP Units, conflicts of interest could arise as a result of the relationships between us and our affiliates, on the one hand, and our operating partnership or any partner thereof, on the other. Our directors and officers have duties to us under applicable Maryland law in connection with their management of our company. At the same time, XHR GP, Inc., our wholly-owned subsidiary, as general partner of our operating partnership, has fiduciary duties and obligations to our operating partnership and its limited partners under Delaware law and the partnership agreement of our operating partnership in connection with the management of our operating partnership. Our duties as general partner to our operating partnership and its partners may come into conflict with the duties of our directors and officers to our company. These conflicts may be resolved in a manner that is not in the best interests of our stockholders.
Certain provisions in the partnership agreement for our operating partnership may delay or prevent unsolicited acquisitions of us.
If in the future we have unaffiliated owners of OP Units, provisions in the partnership agreement for our operating partnership may delay or make more difficult unsolicited acquisitions of us or changes in our control. These provisions could discourage third parties from making proposals involving an unsolicited acquisition of us or a change in our control, although some stockholders might consider such proposals, if made, desirable.
47
Table of Contents
Our board of directors may change our investment policies without stockholder approval, which could alter the nature of your investment.
Our investment policies may change over time. The methods of implementing our investment policies may also vary, as new investment techniques are developed. Our investment policies, the methods for implementing them, and our other objectives, policies and procedures may be altered by a majority of the directors without the approval of our stockholders. As a result, the nature of your investment could change without your consent. A change in our investment strategy may, among other things, increase our exposure to interest rate risk, default risk and commercial real property market fluctuations, all of which could materially and adversely affect our ability to achieve our investment objectives.
Our board of directors is expected to approve very broad investment guidelines for us and we expect that the board of directors will not review or approve each investment decision made by our senior management team.
We expect that our board of directors will authorize our senior management team to follow broad investment guidelines and, therefore, we expect that our senior management team will have great latitude in determining the assets that are proper investments for us, as well as the individual investment decisions. Our senior management team may make investments with lower rates of return than those anticipated under current market conditions and/or may make investments with greater risks to achieve those anticipated returns. We expect that our board of directors will not review or approve each proposed investment by our senior management team.
Item 1B. Unresolved Staff Comments
None.
Overview
As of December 31, 2014, we owned a portfolio of 46 hotels, comprising 12,636 rooms, across 19 states and the District of Columbia, and had a majority interest in two hotels under development. For the year ended December 31, 2014, the average occupancy rate for our hotels was 76.3%, and the ADR and RevPAR of our hotels was $177.95 and $135.76, respectively. The following table sets forth certain operating information on a pro forma(1) basis for the years ended December 31, 2014, 2013 and 2012:
| Year Ended December 31, | ||||||||||||
| 2014(3) | 2013 | 2012 | ||||||||||
| Statistical Data: |
||||||||||||
| Number of Hotels(2) |
46 | 45 | 31 | |||||||||
| Number of Rooms(2) |
12,636 | 11,991 | 8,688 | |||||||||
| Occupancy(1) |
76.3 | % | 75.2 | % | 71.5 | % | ||||||
| ADR(1) |
$ | 177.95 | $ | 167.19 | $ | 151.82 | ||||||
| RevPAR(1) |
$ | 135.76 | $ | 125.73 | $ | 108.54 | ||||||
| (1) | Includes full year data for any hotel acquired during the applicable period by including applicable data for such hotels while they were under prior ownership. See “Part II—Item 7. Management’s Discussion and Analysis of Financial Condition and Results of Operations—Results of Operations” for a presentation of such statistics from the date of acquisition of such hotels. For only those hotels operated by Marriott, our historical annual operating results represented here from 2012 to 2013 include a 52-53 week fiscal calendar used by Marriott at that time. |
| (2) | The table excludes our two hotels under development. |
| (3) | Full-year data for 2014 reflects impact by the August 2014 South Napa Earthquake which resulted in damage at two hotels, the Andaz Napa and Marriott Napa Valley Hotel & Spa. The Marriott sustained limited damage, with 4,305 room nights out of order, and fully re-opened in October 2014. The Andaz partially re-opened in December 2014, with a total 17,106 room nights out of order, and fully re-opened in January 2015. |
48
Table of Contents
Geographic Diversification
We believe our portfolio of hotels is geographically diverse. Our management team has implemented and executed a strategy of acquiring hotels in the Top 25 Markets and key leisure destinations in the U.S. As of December 31, 2014, 66% of our rooms are located in the Top 25 Markets. The following table shows the geographic diversification as of December 31, 2014(1):
| Region |
Number of Hotels |
Number of Rooms |
||||||
| South Atlantic |
15 | 3,269 | ||||||
| West South Central |
9 | 3,339 | ||||||
| Pacific |
7 | 3,059 | ||||||
| Mountain |
5 | 1,016 | ||||||
| Other |
10 | 1,953 | ||||||
|
|
|
|
|
|||||
| Total |
46 | 12,636 | ||||||
|
|
|
|
|
|||||
| (1) | The table excludes our two hotels under development. |
Operating Information
The following tables show certain operating information by region on a pro forma(1) basis for the years ended December 31, 2014, 2013 and 2012(2):
| Year Ended December 31, | ||||||||||||||||||||||||||||||||||||
| 2014(3) | 2013 | 2012 | ||||||||||||||||||||||||||||||||||
| Region |
Occupancy | ADR | RevPAR | Occupancy | ADR | RevPAR | Occupancy | ADR | RevPAR | |||||||||||||||||||||||||||
| South Atlantic |
77.4 | % | 172.32 | $ | 133.34 | 75.0 | % | $ | 167.49 | $ | 125.59 | 72.5 | % | $ | 153.18 | $ | 111.12 | |||||||||||||||||||
| West South Central |
72.2 | % | 184.23 | $ | 133.02 | 72.4 | % | $ | 172.20 | $ | 124.73 | 66.3 | % | $ | 157.17 | $ | 104.19 | |||||||||||||||||||
| Pacific |
80.5 | % | 188.40 | $ | 151.60 | 81.1 | % | $ | 172.45 | $ | 139.78 | 78.5 | % | $ | 151.59 | $ | 119.05 | |||||||||||||||||||
| Mountain |
78.7 | % | 167.93 | $ | 132.12 | 75.0 | % | $ | 156.88 | $ | 117.67 | 63.3 | % | $ | 138.02 | $ | 87.32 | |||||||||||||||||||
| Other |
73.7 | % | 165.03 | $ | 121.57 | 73.2 | % | $ | 156.46 | $ | 114.49 | 71.5 | % | $ | 146.48 | $ | 104.71 | |||||||||||||||||||
| Total |
76.3 | % | 177.95 | $ | 135.76 | 75.2 | % | $ | 167.19 | $ | 125.73 | 71.5 | % | $ | 151.84 | $ | 108.54 | |||||||||||||||||||
| (1) | Includes full year data for any hotel acquired during the applicable period by including applicable data for such hotels while they were under prior ownership. See “Part II—Item 7. Management’s Discussion and Analysis of Financial Condition and Results of Operations—Results of Operations” for a presentation of such statistics from the date of acquisition of such hotels. For only those hotels operated by Marriott, our historical annual operating results represented here from 2012 to 2013 include a 52-53 week fiscal calendar used by Marriott at that time. |
| (2) | The table excludes our two hotels under development. |
| (3) | Full-year data for 2014 reflects impact by the August 2014 South Napa Earthquake which resulted in damage at two hotels, the Andaz Napa and Marriott Napa Valley Hotel & Spa. The Marriott sustained limited damage, with 4,305 room nights out of order, and fully re-opened in October 2014. The Andaz partially re-opened in December 2014, with a total 17,106 room nights out of order, and fully re-opened in January 2015. |
49
Table of Contents
Brand Affiliations
Our portfolio of hotels operate under premium brands, with approximately 76% of our rooms operating under Marriott, Hilton or Hyatt brands. The following table sets forth our brand affiliations as of December 31, 2014(1):
| Brand Affiliation |
Number of Hotels |
Number of Rooms |
Percentage of Total Rooms |
|||||||||
| Marriott |
||||||||||||
| Autograph Collection (2) |
3 | 437 | 3.5 | % | ||||||||
| Courtyard by Marriott |
4 | 630 | 5.0 | % | ||||||||
| Marriott |
9 | 3,099 | 24.5 | % | ||||||||
| Renaissance |
2 | 1,014 | 8.0 | % | ||||||||
| Residence Inn |
3 | 637 | 5.0 | % | ||||||||
|
|
|
|
|
|
|
|||||||
| Subtotal |
21 | 5,817 | 46.0 | % | ||||||||
| Hilton |
||||||||||||
| DoubleTree |
1 | 220 | 1.7 | % | ||||||||
| Embassy Suites |
1 | 223 | 1.8 | % | ||||||||
| Hampton Inn |
2 | 264 | 2.1 | % | ||||||||
| Hilton |
3 | 669 | 5.3 | % | ||||||||
| Hilton Garden Inn |
2 | 478 | 3.8 | % | ||||||||
| Homewood Suites |
1 | 162 | 1.3 | % | ||||||||
|
|
|
|
|
|
|
|||||||
| Subtotal |
10 | 2,016 | 16.0 | % | ||||||||
| Hyatt |
||||||||||||
| Andaz |
3 | 451 | 3.6 | % | ||||||||
| Hyatt |
1 | 118 | 0.9 | % | ||||||||
| Hyatt Regency |
2 | 1,154 | 9.1 | % | ||||||||
|
|
|
|
|
|
|
|||||||
| Subtotal |
6 | 1,723 | 13.6 | % | ||||||||
| Kimpton |
||||||||||||
| Lorien |
1 | 107 | 0.8 | % | ||||||||
| Monaco |
3 | 605 | 4.8 | % | ||||||||
|
|
|
|
|
|
|
|||||||
| Subtotal |
4 | 712 | 5.6 | % | ||||||||
| Starwood |
||||||||||||
| Westin |
2 | 893 | 7.1 | % | ||||||||
|
|
|
|
|
|
|
|||||||
| Subtotal |
2 | 893 | 7.1 | % | ||||||||
| Aston |
1 | 645 | 5.1 | % | ||||||||
| Fairmont |
1 | 545 | 4.3 | % | ||||||||
| Loews |
1 | 285 | 2.3 | % | ||||||||
|
|
|
|
|
|
|
|||||||
| Total |
46 | 12,636 | 100.0 | % | ||||||||
|
|
|
|
|
|
|
|||||||
| (1) | Excludes our two hotels under development. |
| (2) | Our two hotels under development are Autograph Collection hotels, which will have a total of 150 rooms. |
50
Table of Contents
Our Hotels
The following table provides a list of our portfolio as of December 31, 2014:
| Hotel |
Rooms | Year Acquired |
State | Region (1) |
Brand Parent Company |
Hotel Management Company (2) |
Chain Scale Segment (3) | |||||||
| Operating Hotels |
||||||||||||||
| Marriott San Francisco Airport Waterfront(4)* |
685 | 2012 | CA | P | Marriott | Marriott | UU | |||||||
| Hyatt Regency Orange County(4)* |
653 | 2008 | CA | P | Hyatt | Hyatt | UU | |||||||
| Aston Waikiki Beach Hotel(6)* |
645 | 2014 | HI | P | Aston | Aston | U | |||||||
| Fairmont Dallas(4)* |
545 | 2011 | TX | WSC | Fairmont | Fairmont | L | |||||||
| Renaissance Atlanta Waverly Hotel & Convention Center(4)* |
522 | 2012 | GA | SA | Marriott | Renaissance | UU | |||||||
| Hyatt Regency Santa Clara(4) (6) |
501 | 2013 | CA | P | Hyatt | Hyatt | UU | |||||||
| Renaissance Austin Hotel(4) |
492 | 2012 | TX | WSC | Marriott | Renaissance | UU | |||||||
| Westin Galleria Houston(4)* |
487 | 2013 | TX | WSC | Starwood | Westin | UU | |||||||
| Marriott Dallas City Center(4)* |
416 | 2010 | TX | WSC | Marriott | Marriott | UU | |||||||
| Marriott Griffin Gate Resort & Spa(4) |
409 | 2012 | KY | ESC | Marriott | Marriott | UU | |||||||
| Westin Oaks Houston at the Galleria(4)* |
406 | 2013 | TX | WSC | Starwood | Westin | UU | |||||||
| Marriott Charleston Town Center(4) (6) |
352 | 2011 | WV | SA | Marriott | Marriott | UU | |||||||
| Marriott Woodlands Waterway Hotel & Convention Center(4) (7)* |
343 | 2007 | TX | WSC | Marriott | Marriott | UU | |||||||
| Hilton Garden Inn Washington DC Downtown(4)* |
300 | 2008 | DC | SA | Hilton | Urgo | U | |||||||
| Marriott Atlanta Century Center / Emory Area(6)* |
287 | 2008 | GA | SA | Marriott | Marriott | UU | |||||||
| Loews New Orleans Hotel(4)* |
285 | 2013 | LA | WSC | Loews | Loews | L | |||||||
| Marriott Napa Valley Hotel & Spa* |
275 | 2011 | CA | P | Marriott | Sage | UU | |||||||
| Hilton University of Florida Conference Center Gainesville(4) (6) |
248 | 2007 | FL | SA | Hilton | Davidson | UU | |||||||
| Grand Bohemian Hotel Orlando, an Autograph Collection Hotel(4)* |
247 | 2012 | FL | SA | Marriott | Kessler | UU | |||||||
| Residence Inn Denver City Center(4)* |
228 | 2013 | CO | M | Marriott | Sage | U | |||||||
| Hilton Suites Phoenix* |
226 | 2008 | AZ | M | Hilton | Hilton | UU | |||||||
| Hotel Monaco Salt Lake City |
225 | 2013 | UT | M | Kimpton | Kimpton | UU | |||||||
| Embassy Suites Baltimore North / Hunt Valley |
223 | 2008 | MD | SA | Hilton | Embassy Suites | UU | |||||||
| Residence Inn Boston Cambridge(4)* |
221 | 2008 | MA | NE | Marriott | Residence Inn | U | |||||||
| DoubleTree by Hilton Hotel Washington DC* |
220 | 2008 | DC | SA | Hilton | Davidson | U | |||||||
| Marriott West Des Moines |
219 | 2010 | IA | WNC | Marriott | Concord | UU | |||||||
| Courtyard Fort Worth Downtown / Blackstone |
203 | 2008 | TX | WSC | Marriott | Courtyard | U | |||||||
| Hilton St. Louis Downtown at the Arch* |
195 | 2012 | MO | WNC | Hilton | Hilton | UU | |||||||
| Hotel Monaco Chicago(4)* |
191 | 2013 | IL | ENC | Kimpton | Kimpton | UU | |||||||
| Hotel Monaco Denver(4)* |
189 | 2013 | CO | M | Kimpton | Kimpton | UU | |||||||
| Residence Inn Baltimore Inner Harbor |
188 | 2008 | MD | SA | Marriott | Urgo | U | |||||||
| Courtyard Pittsburgh Downtown(4) |
182 | 2010 | PA | MA | Marriott | Concord | U | |||||||
| Hilton Garden Inn Chicago North Shore / Evanston(4)* |
178 | 2007 | IL | ENC | Hilton | Interstate | U | |||||||
| Homewood Suites by Hilton Houston Near the Galleria* |
162 | 2008 | TX | WSC | Hilton | White | U | |||||||
| Andaz San Diego(5)* |
159 | 2013 | CA | P | Hyatt | Hyatt | L | |||||||
| Andaz Savannah(4)* |
151 | 2013 | GA | SA | Hyatt | Hyatt | L | |||||||
| Hampton Inn & Suites Denver Downtown(4)* |
148 | 2008 | CO | M | Hilton | Hampton Inn | UM | |||||||
| Andaz Napa(4)* |
141 | 2013 | CA | P | Hyatt | Hyatt | L | |||||||
| Courtyard Kansas City Country Club Plaza |
123 | 2007 | MO | WNC | Marriott | Interstate | U | |||||||
| Courtyard Birmingham Downtown at UAB(4) |
122 | 2008 | AL | ESC | Marriott | Courtyard | U | |||||||
| Hyatt Key West Resort & Spa* |
118 | 2013 | FL | SA | Hyatt | Hyatt | UU | |||||||
| Hampton Inn & Suites Baltimore Inner Harbor |
116 | 2007 | MD | SA | Hilton | Urgo | UM | |||||||
| Bohemian Hotel Celebration, an Autograph Collection Hotel* |
115 | 2013 | FL | SA | Marriott | Kessler | UU | |||||||
| Marriott Chicago at Medical District / UIC* |
113 | 2008 | IL | ENC | Marriott | Davidson | UU | |||||||
| Lorien Hotel & Spa* |
107 | 2013 | VA | SA | Kimpton | Kimpton | UU | |||||||
| Bohemian Hotel Savannah Riverfront, an Autograph Collection Hotel(4) * |
75 | 2012 | GA | SA | Marriott | Kessler | UU | |||||||
| Hotels Under Development |
||||||||||||||
| Grand Bohemian Mountain Brook, an Autograph Collection Hotel(4) (8) |
100 | N/A | AL | ESC | Marriott | Kessler | UU | |||||||
| Grand Bohemian Charleston, an Autograph Collection Hotel(4) (9)* |
50 | N/A | SC | SA | Marriott | Kessler | UU | |||||||
51
Table of Contents
| * | Top 25 Market or key leisure destination. |
| (1) | “ENC” refers to East North Central; “ESC” refers to East South Central; “M” refers to Mountain; “MA” refers to Middle Atlantic; “NE” refers to New England; “P” refers to Pacific; “SA” refers to South Atlantic; “WNC” refers to West North Central; “WSC” refers to West South Central. |
| (2) | “Aston” refers to an affiliate of Aston Hotels & Resorts LLC; “Courtyard” refers to Courtyard Management Corporation; “Concord” refers to Concord Hospitality Enterprises Company; “Davidson” refers to Davidson Hotel Company LLC; “Embassy Suites” refers to Embassy Suites Management LLC; “Fairmont” refers to Fairmont Hotels & Resorts (U.S.) Inc.; “Hampton Inn” refers to Hampton Inns Management LLC ; “Hilton” refers to Hilton Management LLC; “Hyatt” refers to Hyatt Corporation; “Interstate” refers to Interstate Management Company, LLC; “Kessler” refers to Kessler Collection Management, LLC; “Kimpton” refers to Kimpton Hotel & Restaurant Group, LLC; “Loews” refers to Loews New Orleans Hotel Corp.; “Marriott” refers to Marriott Hotel Services, Inc.; “Renaissance” refers to Renaissance Hotel Operating Company; “Residence Inn” refers to Residence Inn by Marriott, Inc.; “ResortQuest” refers to ResortQuest Hawaii, LLC; “Sage” refers to affiliates of Sage Hospitality Resources, LLC, “Urgo” refers to Urgo Hotels LP; “Westin” refers to Westin Operator, LLC; and “White” refers to White Lodging Services Corporation. |
| (3) | “L” refers to Luxury; “UU” refers to Upper Upscale; “U” refers to Upscale; “UM” refers to Upper Midscale. |
| (4) | This property is subject to mortgage debt at December 31, 2014. |
| (5) | On March 2, 2015 we paid off a mortgage in the amount of $26.3 million relating to the Andaz San Diego. |
| (6) | This hotel is subject to a ground lease that covers all of the land underlying the hotel. See “Our Principal Agreements—Ground Leases” for more information. |
| (7) | This hotel is subject to a ground lease that covers a portion of the land underlying the hotel. See “Our Principal Agreements—Ground Leases” for more information. |
| (8) | We own a 75% interest in the Grand Bohemian Mountain Brook, which is expected to open in the fourth quarter of 2015. Our partner for this hotel is Lane Park at Mountain Brook, LLC. Total costs to develop the hotel are estimated to be $43.0 million, of which we have incurred $21.0 million as of December 31, 2014 and our total capital commitment is limited to $9.6 million. The construction loan on this project is $26.3 million, of which $10.1 million in principal amount is outstanding as of December 31, 2014. Borrowings on the interest-only construction loan bear interest at LIBOR plus 2.5% and the loan matures in 2020 with no extension option. We chose to develop this hotel in order to add an asset to our portfolio that is well positioned to experience strong growth and capture market share in a high barrier-to-entry location with a limited supply of upper upscale properties. This opportunity was only available to us as a joint venture. |
| (9) | We own a 75% interest in the Grand Bohemian Charleston, which is expected to open in the third quarter of 2015. Our partner for this hotel is Kessler Meeting Street, LLC. Total costs to develop the hotel are estimated to be $30.0 million, of which we have incurred $18.7 million as of December 31, 2014 and our total capital commitment is limited to $7.2 million. The construction loan on this project is $20.0 million, of which $11.1 million in principal amount is outstanding as of December 31, 2014. Borrowings on the interest-only construction loan bear interest at LIBOR plus 2.5% and the loan matures in 2020 with no extension option. We chose to develop this hotel in order to add an asset to our portfolio that is well positioned to experience strong growth and capture market share in a high barrier-to-entry location with a limited supply of upper upscale properties. This opportunity was only available to us as a joint venture. |
Asset Management
In order to qualify as a REIT, we do not operate our hotel properties, but rather rely on qualified, experienced third-party hotel managers to manage our hotels on a day-to-day basis. As an active owner, we provide direction and oversight to our management companies and on-site property management teams to enhance performance. We have an experienced asset management team that focuses on driving property performance through revenue enhancement and cost containment efforts. Because we work with a wide variety of brand-managed and independent management companies, we actively benchmark performance across our portfolio and seek to extend identified best practices at our hotels. We have frequent interactions with our management companies and on-site management personnel regarding revenue management strategies in an effort to optimize channel distribution and pricing strategies. We regularly conduct sales, marketing, and financial performance reviews designed to identify strengths and weaknesses that can be addressed to enhance property performance. We also conduct periodic on-site meetings with property and regional personnel and in-depth operational reviews focused on identifying new and ongoing margin improvement initiatives.
We meet regularly with key executives of our management companies and brands and participate in various management and brand owner advisory committees at which we provide feedback on hotel-level and corporate programs and initiatives. We strive to negotiate management agreements that provide us with the maximum amount of flexibility with regard to economic terms and owner input. Our asset management team also seeks to enhance value through the optimization of ancillary real estate opportunities.
Project Management
Our asset management team is closely linked with our in-house capital planning and project management team. Together, they are responsible for developing long-term capital plans for each of our properties, taking into
52
Table of Contents
consideration the age of the property, potential performance enhancement, and brand requirements. We believe that by maintaining this function in-house, rather than outsourcing it to third parties, we are able to execute our renovation projects at a lower cost and in a more timely manner. In addition, our project management team has extensive experience in the ground-up development of hotel properties, providing both in-depth knowledge of major building systems as well as the opportunity for us to evaluate potential expansion and development opportunities. We view this as a significant competitive strength.
Our asset management team regularly reviews opportunities to reinvest in our hotels to maintain quality, increase long-term value and generate attractive returns on invested capital. We also review opportunities to dispose of hotels to take advantage of market conditions or in situations where the hotels no longer fit within our strategic objectives. We believe our breadth of experience and integrated in-house asset management and project management teams are instrumental in our ability to acquire and operate assets and to capitalize on redevelopment opportunities.
Since 2008, we have invested a total of approximately $235 million during our ownership period in capital expenditures to competitively position our portfolio to increase revenues as well as to keep our hotels well maintained. During this period, in addition to ongoing renovation projects related to building systems and infrastructure, we have completed guest room renovations at 27 of our hotels, lobby renovations at 22 of our hotels, food and beverage facility renovations at 22 of our hotels and meeting space renovations at 13 of our hotels. In 2015, we currently plan to complete guest room renovations at three hotels and are developing plans for additional renovations to lobbies, food and beverage facilities and/or meeting spaces at six hotels.
Our Principal Agreements
Hotel Management and Franchise Agreements
In order to qualify as a REIT, we cannot directly or indirectly operate any of our hotels. We lease each of our 46 hotels to TRS lessees, which in turn engage property managers to manage our hotels. Each of our hotels is operated pursuant to a hotel management agreement with an independent hotel management company. Approximately half of our hotels, which we refer to as “franchised hotels” are also operated under distinct franchise agreements, a few of which are with an affiliate of the hotel’s management company. Approximately half of our hotels are not subject to a franchise agreement, and instead receive the benefits of one pursuant to the hotel’s management agreement. We refer to these hotels as “brand-managed hotels.”
Below is a general overview of the management and franchise agreements for our hotels, summarizing the principal terms found in each type of agreement.
Management Agreements for Brand-Managed Hotels
Pursuant to our management agreements for brand-managed hotels, the management company controls the day-to-day operations of each hotel, and we are granted limited approval rights with respect to certain of the management company’s actions, including entering into long-term or high value contracts, engaging in certain actions relating to legal proceedings, approving the operating budget, making certain capital expenditures and the hiring of certain management personnel.
As in our franchise agreements described below, we are provided with a variety of services and benefits, including the right to use the name, marks and system of operation of a brand affiliated with the management company, as well as centralized reservation systems, national advertising, marketing programs and publicity designed to increase brand awareness, training of personnel and payroll and accounting services.
Of our brand-managed hotels, approximately half are managed by Marriott, approximately a quarter are managed by Hyatt, and the rest are managed by management companies affiliated with a variety of other brands.
53
Table of Contents
Term
The majority of our management agreements for brand-managed hotels contain an initial term between 20 to 30 years, and have an average remaining initial term of approximately 15 years, assuming no renewal options are exercised by the management company. These agreements generally allow for one or more renewal periods at the option of the management company, for an average remaining term including the exercise of all renewal options of approximately 29 years.
Fees
Our management agreements for brand-managed hotels typically contain a two-tiered fee structure, wherein the management company receives a base management fee and, if certain financial thresholds are met or exceeded, an incentive management fee. The base management fee is typically 3.0% of gross hotel revenues or receipts, but ranges from 2.0% to 7.0%, the highest of which also include fees for additional non-management services. The incentive management fees range from 10% to 40% of the available cash flow or adjusted profit remaining after we receive an annual payment typically equal to 10%-11% of our total capital investment in the hotel. We also pay certain accounting services fees to the management companies in a majority of the agreements.
Termination Events
Performance Termination
Most of our management agreements for our brand-managed hotels align our interests with those of the management company by providing us with a right to terminate the agreement if the management company fails to achieve certain criteria relating to the performance of the hotel. We generally may initiate a performance termination if, during any two consecutive year period, (i) the hotel fails to achieve a specified amount of operating profit, and (ii) certain operating metrics of the hotel, as compared to a competitive set of hotels in the relevant local market as agreed between the parties, fail to exceed a specified threshold as set forth in the applicable management agreement. In substantially all of the management agreements for brand-managed hotels, the management company has a right to avoid a performance termination by paying an amount equal to the amount by which the operating profit for the two year period was less than the performance termination threshold, as set forth in the applicable management agreement.
Early Termination and Liquidated Damages
Subject to certain qualifications, notice requirements and applicable cure periods, the management agreements for our brand-managed hotels are generally terminable by either party upon a material casualty or condemnation of the hotel or the occurrence of certain customary events of default, including, among others: the bankruptcy or insolvency of either party; the failure of either party to make a payment when due, and failure to cure such non-payment after due notice; or breach by either party of covenants or obligations under the management agreement.
Additionally, the management company typically has the right to terminate the management agreement in certain situations, including the occurrence of certain actions with respect to the mortgage or our interference with the management company’s ability to operate the hotel by failing to approve required capital improvements or expenditures or by failing to complete or commence required repair after damage or destruction to the hotel. Most of our agreements do not require payment of liquidated damages in the event of an early termination; however, our Marriott brand-managed hotels require us to establish a reserve fund out of gross revenues to be used in the event of a termination. The fund is to be used to reimburse the management company for all costs and expenses incurred by the management company that relate to (i) the operation of the hotel prior to termination but that accrue after termination, (ii) the management company terminating its employees and/or (iii) the payment of any pending or contingent claims, depending on the agreement.
54
Table of Contents
Sale of a Hotel
Our management agreements for our brand-managed hotels generally provide that we cannot sell a hotel to a person who: (i) does not have sufficient financial resources, (ii) is of bad moral character, (iii) is a competitor, or (iv) is a specially designated national or blocked person, as set forth in the applicable management agreement. Under most agreements, we will default if we proceed with a sale without the management company’s consent and the assignment of the hotel’s management agreement. Some of the agreements provide that our sale or transfer of the hotel to an affiliate does not require us to obtain the consent of the management company.
Management Agreements for Franchised Hotels
Our franchised hotels are managed by various third party management companies, which are either independent or are affiliated with a hotel’s brand. As in our management agreements for brand-managed hotels, the management company controls the day-to-day operations of each hotel, and we are granted limited approval rights with respect to certain of the management company’s actions, including entering into long-term or high value contracts, engaging in certain actions relating to legal proceedings, approving the operating budget, making certain capital expenditures and the hiring of certain management personnel.
Term
Our management agreements for franchised hotels generally contain initial terms between seven and 15 years with an average remaining initial term of approximately five years. Almost all of these agreements either do not contemplate a renewal or extension of the initial term or cannot be extended without our consent, and the rest may be extended at the option of the management company if certain conditions are met. Assuming all renewal or extension options are excised, the average remaining term is approximately eight years.
Fees
Generally, the management agreements for franchised hotels contain a two-tiered fee structure in which the management company receives a base management fee and, if certain financial thresholds are met or exceeded, an incentive management fee, each calculated on a per hotel basis. The base management fees range from 1.5% to 4.0% of gross hotel revenue, with some base fees increasing over time. Almost all of the incentive management fees range from 10% to 30% of net operating income (or other similar metric, as defined in the management agreement) remaining after deducting a priority return typically equal to 10%-11% of our total capital investment in the hotel. We also pay certain accounting services fees to the management companies under a majority of the agreements.
Termination Events
Performance Termination
As with our management agreements for brand-managed hotels, most of the management agreements for franchised hotels provide us with a right to terminate the agreement if the management company fails to achieve certain criteria relating to the performance of the hotel. Generally, we may initiate a performance termination if, during any two consecutive year period, (i) the hotel fails to achieve a specified amount of operating profit, and (ii) certain operating metrics of the hotel, as compared to a competitive set of hotels in the relevant local market as agreed between the parties, fail to exceed a specified threshold as set forth in the applicable management agreement. In some of the management agreements for franchised hotels, the management company has a right, which can usually be exercised no more than once per hotel, to avoid a performance termination by paying an amount specified in the applicable management agreement.
55
Table of Contents
Early Termination and Liquidated Damages
Subject to certain qualifications, notice requirements and applicable cure periods, the management agreements for franchised hotels are generally terminable by either party upon a material casualty or condemnation of the hotel or the occurrence of certain customary events of default, including, among others: the bankruptcy or insolvency of either party; a breach by either party of covenants or obligations under the management agreement, including a failure by us to provide required operating funds or our failure to make a payment when due and failure to cure such non-payment after due notice; a default by either party under the corresponding franchise agreement; a failure of either party to maintain a license for the sale of alcoholic beverages; and a failure by either party to maintain insurance policies required under the management agreement.
In the event that a management company elects to terminate a management agreement due to certain events of default by us, the management company generally may recover a termination fee, as liquidated damages, as set forth in the applicable management agreement. Several of the management agreements for franchised hotels grant us a right to terminate without cause upon notice to the management company. In some instances, such termination requires the payment of a termination fee.
Sale of a Hotel
Under a majority of the management agreements for franchised hotels, in order to sell a hotel, we must terminate the management agreement and pay a fee to the management company. However, in some cases, we may avoid such fees if the new owner is either assigned the agreement or enters into a new agreement with the management company.
Franchise Agreements
Our franchised hotels operate under franchise agreements with Hilton, Marriott and Starwood. Pursuant to our franchise agreements, we are granted rights to use the franchisor’s name, marks and system in the operation of our hotels. Franchisors also provide us with a variety of services and benefits, including centralized reservation systems, national advertising, marketing programs and publicity designed to increase brand awareness, training of personnel and maintenance of operational quality at hotels across the brand system. In return, our TRS lessees, as the franchisees, are required to operate franchised hotels consistent with the applicable brand standards. The franchise agreements generally specify management, operational, record-keeping, accounting, reporting and marketing standards and procedures with which our TRS lessees must comply, and ensure consistency across the brand by outlining standards for guest services, products, signage and furniture, fixtures and equipment, among other things. To ensure our compliance, most of the franchise agreements specify that we must make the hotel available for quality inspections by the franchisor. We are also required to participate in the applicable rewards program for each brand.
Term
A majority of our franchise agreements contain an initial term of 15 to 20 years, with an average remaining initial term of approximately 11 years. Almost all of our franchise agreements do not contemplate any renewals or extensions of the initial term.
Fees
Substantially all of our franchise agreements require that we pay a royalty fee ranging between 4% and 6.5% of the gross room revenue of the applicable hotel and, for certain full service hotels, an additional fee ranging between 2% and 3% on gross food and beverage revenue. We must also pay marketing, reservation or other program fees ranging between 1% and 4.3% of the gross room revenue. In addition, under substantially all of our franchise agreements, the franchisor has the right to require that we renovate guest rooms and public facilities from time to time to comply with then-current brand standards. Under certain agreements, such
56
Table of Contents
expenditures are mandated at set periods, with at least some level of expenditure required every five to six years. Many franchise agreements also require the maintenance of a capital reserve fund ranging between 4% and 6% of gross room revenue to be used for mandated capital expenditures.
Termination Events
Our franchise agreements provide for termination at the applicable franchisor’s option upon the occurrence of certain events, including, among others: the failure to maintain brand standards, the failure to pay royalties and fees or to perform other obligations under the franchise license; bankruptcy; and abandonment of the franchise or a change of control, and in the event of such termination, we are required to pay liquidated damages.
Guarantee and Franchisor Rights
The TRS lessee that is the franchisee is responsible for making all payments to the franchisor under the applicable franchise agreement; however, Xenia Hotels & Resorts, Inc. and/or the corresponding property-owning subsidiary generally guarantee the TRS lessee’s obligations under the franchise agreements. In addition, some of the franchise agreements require that we provide the franchisor with a right of first offer or right of first refusal in the event of certain sales or transfers of a hotel, and almost all of our agreements provide the franchisor the right to approve any change in the hotel’s management company.
TRS Leases
In order for us to qualify as a REIT, neither our company nor any of our subsidiaries, including the operating partnership, may directly or indirectly operate our hotels. Subsidiaries of our operating partnership, as lessors, lease our hotels to our TRS lessees, which, in turn, are parties to the existing hotel management agreements with third-party hotel management companies for each of our hotels.
Ground Leases
The following table summarizes the remaining primary term, renewal rights, purchase rights and monthly base rent as of December 31, 2014 associated with land underlying our hotels and meeting facilities that we lease from third parties:
| Property |
Current Lease Term |
Renewal Rights / Rights |
Current |
Base Rent Increases at |
Lease Type | |||||
| Ground Leases: Entire Property | ||||||||||
| Aston Waikiki Beach Hotel |
December 31, 2057 | No renewal rights (1) | $190,851(2) | Not applicable | Triple Net | |||||
| Hyatt Regency Santa Clara |
April 30, 2035 | 4 x 10 years, 1 x 9 years (3) |
$60,119(4) | No increase unless Lessee exercises its option to expand at which time Base Rent will be increased by $800 for each additional hotel room in excess of 500 | Triple Net | |||||
| Marriott Charleston Town Center |
December 11, 2032 | 4 x 10 years | $4,167 | No increase unless hotel is expanded beyond 356 guest rooms, at which time rent shall increase on a pro rata basis(5) | Triple Net | |||||
| Hilton University of Florida Conference Center Gainesville |
March 31, 2073 | None | $3,333 | Not applicable | Triple Net | |||||
| Marriott Atlanta Century Center / Emory Area |
December 31, 2058 | None | $2,656 | Not applicable | Triple Net | |||||
| Ground Leases: Partial |
||||||||||
| Convention Center at Marriott Woodlands Waterway Hotel & Convention Center |
June 30, 2100 | No renewal rights (6) | $10,168(7) | Not applicable | Triple Net | |||||
57
Table of Contents
| (1) | Tenant has a right of first refusal to purchase the property, which must be exercised within 30 days of receiving the third party’s terms from Landlord. |
| (2) | For and during the period from January 1, 2006 to December 31, 2029, the Minimum Rent for each year is adjusted based on a calculation tied to the Consumer Price Index. The monthly minimum or base rent in this chart is for the period from January 1, 2014 through December 31, 2014. |
| (3) | Tenant has a right of first refusal to purchase all or a portion of certain areas covered by the two separate leases. |
| (4) | Monthly rent also includes variable incentive rent. |
| (5) | If the hotel is increased from 356 rooms to 500 rooms, the new annual base rent will be $71,500. |
| (6) | Tenant has a right of first refusal to purchase the property, which must be exercised within 60 days of receiving the third party’s terms from Landlord. |
| (7) | For and during the period from June 29, 2006 to June 28, 2100, the base rent for each year is adjusted based on a calculation tied to the Consumer Price Index. The monthly minimum or base rent in this chart is for the period from June 29, 2014 through June 28, 2015. |
We are involved in various claims and lawsuits arising in the normal course of business, including proceedings involving tort and other general liability claims, workers’ compensation and other employee claims and claims related to our ownership of certain hotel properties. Most occurrences involving liability, claims of negligence and employees are covered by insurance with solvent insurance carriers. We recognize a liability when we believe the loss is probable and reasonably estimable. We currently believe that the ultimate outcome of such lawsuits and proceedings will not, individually or in the aggregate, have a material effect on our combined consolidated financial position, results of operations or liquidity.
Item 4. Mine Safety Disclosures
Not applicable.
58
Table of Contents
PART II
Item 5. Market for Registrant’s Common Equity, Related Stockholder Matters and Issuer Purchases of Equity Securities
Market Information
Our Common Stock began trading on the NYSE under the ticker symbol “XHR” on February 4, 2015. Our closing market price for our Common Stock on the NYSE was $23.79 per share on March 23, 2015.
Shareholder Information
As of March 25, 2015, there were 31,933 holders of record of our outstanding Common Stock. This stockholder figure does not include a substantially greater number of “street name” holders or beneficial holders of our Common Stock whose shares are held of record by banks, brokers and other financial institutions. In order to comply with certain requirements related to our qualification as a REIT, our charter, subject to certain exceptions, contains restrictions on the number of shares of our stock that a person may own. Our charter provides that no person may beneficially or constructively own more than 9.8% in value or in number of shares, whichever is more restrictive, of the outstanding shares of any class or series of our capital stock.
Dividends
On March 13, 2015, the Company’s Board of Directors authorized a cash dividend of $0.1457 per share of the Company’s Common Stock for the first quarter of 2015. The dividend represents the Company’s anticipated regular quarterly dividend of $0.23 per share, prorated for the period from February 3, 2015, the Distribution date, to March 31, 2015, the last day of the first quarter. The dividend will be paid on April 15, 2015 to all holders of record of the Company’s Common Stock as of the close of business on March 31, 2015. We anticipate making regular quarterly distributions to our stockholders. To qualify as a REIT, we must distribute to our stockholders an amount at least equal to:
i. 90% of our REIT taxable income, determined before the deduction for dividends paid and excluding any net capital gain (which does not necessarily equal net income as calculated in accordance with GAAP); plus
ii. 90% of the excess of our net income from foreclosure property over the tax imposed on such income by the Code; less
iii. any excess non-cash income (as determined under the Code).
Distributions made by us will be authorized and determined by our board of directors, in its sole discretion, out of legally available funds, and will be dependent upon a number of factors, including our actual and projected results of operations, financial condition, cash flows and liquidity, our qualification as a REIT and other tax considerations, capital expenditures and other obligations, debt covenants, contractual prohibitions or other limitations under applicable law and other such matters as our board of directors may deem relevant from time to time. We cannot assure you that our distribution policy will remain the same in the future, or that any estimated distributions will be made or sustained.
Our ability to make distributions to our stockholders will depend upon the performance of our asset portfolio. Distributions will be made in cash to the extent cash is available for distribution. We may not be able to generate sufficient cash flows to pay distributions to our stockholders. To the extent that our cash available for distribution is less than the amount required to be distributed under the REIT provisions of the Code, we may consider various funding sources to cover any shortfall, including borrowing under our $400 million unsecured revolving credit facility, selling certain of our assets or using a portion of the net proceeds we receive from future offerings of equity, equity-related or debt securities or declaring taxable share dividends. In addition, our charter allows us to issue preferred stock that could have a preference over our common stock as to distributions. The terms of our Series A Preferred Stock provide that we may not pay dividends on our common stock unless full cumulative dividends for all prior dividend periods have been or contemporaneously are paid or declared on all outstanding shares of Series A Preferred Stock. We currently have no intention to issue any preferred stock other
59
Table of Contents
than the Series A Preferred Stock currently issued and outstanding, but if we do, the distribution preference on the preferred stock could limit our ability to make distributions to the holders of our common stock. In addition, our board of directors could change our distribution policy in the future.
Share Performance Graph
This information has been omitted as our Common Stock did not begin trading on an exchange on a stand-alone basis until February 4, 2015.
Sale of Unregistered Securities
On January 5, 2015, Xenia issued 125 shares of the Series A Preferred Stock in a private placement to approximately 125 investors who qualify as “accredited investors” (as that term is defined in Rule 501(a) of Regulation D under the Securities Act) for an aggregate purchase price of $125,000, in reliance upon the exemption from the registration requirements of the Securities Act pursuant to Rule 506 of Regulation D, relative to transactions by an issuer not involving any public offering, to the extent an exemption from such registration was required.
60
Table of Contents
Item 6. Selected Financial Data
You should read the following summary historical and pro forma combined consolidated financial and operating data together with “Part II-Item 6. Selected Financial Data,” “Part II-Item 6A. Pro Forma Financial Information,” “Part II-Item 7. Management’s Discussion and Analysis of Financial Condition and Results of Operations,” “Part I-Item 1. Business,” “Part I-Item 2. Properties” and the combined consolidated financial statements and related notes included elsewhere in this Annual Report.
The following table shows our combined consolidated selected financial data relating to our combined consolidated historical financial condition and results of operations for the years ended December 31, 2014, 2013, and 2012 and pro forma financial results of operations for the year ended December 31, 2014. Such selected data should be read in conjunction with “Part II—Item 7. Management’s Discussion and Analysis of Financial Condition and Results of Operations” and the combined consolidated financial statements and related notes appearing elsewhere in this Annual Report (dollar amounts are stated in thousands, except per share data).
| For the year ended December 31, | ||||||||||||||||
| 2014 Pro Forma | 2014 | 2013 | 2012 | |||||||||||||
| Selected Statement of Operations Data: |
||||||||||||||||
| Number of Hotels(4) |
46 | 46 | 45 | 31 | ||||||||||||
| Revenues: |
||||||||||||||||
| Room revenues |
$ | 626,142 | $ | 631,901 | $ | 443,267 | $ | 323,959 | ||||||||
| Food and beverage revenues |
232,978 | 235,066 | 168,368 | 116,260 | ||||||||||||
| Other revenues |
59,912 | 59,699 | 40,236 | 26,661 | ||||||||||||
|
|
|
|
|
|
|
|
|
|||||||||
| Total revenues |
$ | 919,032 | $ | 926,666 | $ | 651,871 | $ | 466,880 | ||||||||
| Operating expenses: |
||||||||||||||||
| Room expenses |
$ | 138,738 | $ | 140,128 | $ | 96,444 | $ | 70,165 | ||||||||
| Food and beverage expenses |
156,179 | 158,243 | 114,011 | 78,080 | ||||||||||||
| Other direct expenses |
33,354 | 33,381 | 24,542 | 17,401 | ||||||||||||
| Other indirect expenses |
213,518 | 217,811 | 157,385 | 117,355 | ||||||||||||
| Management fees |
51,534 | 52,104 | 37,683 | 26,827 | ||||||||||||
|
|
|
|
|
|
|
|
|
|||||||||
| Total hotel operating expenses |
$ | 593,323 | $ | 601,667 | $ | 430,065 | $ | 309,828 | ||||||||
| Depreciation and amortization |
142,398 | 141,807 | 104,229 | 89,629 | ||||||||||||
| Real estate taxes, personal property taxes and insurance |
41,230 | 41,802 | 27,548 | 22,382 | ||||||||||||
| General and administrative expenses |
38,983 | 38,895 | 14,151 | 9,008 | ||||||||||||
| Business management fees |
1,474 | 1,474 | 12,743 | 10,812 | ||||||||||||
| Acquisition transaction costs |
— | 1,192 | 2,275 | 751 | ||||||||||||
| Provision for asset impairments |
— | 5,378 | 49,145 | — | ||||||||||||
|
|
|
|
|
|
|
|
|
|||||||||
| Total expenses |
$ | 817,408 | $ | 832,215 | $ | 640,156 | $ | 442,410 | ||||||||
|
|
|
|
|
|
|
|
|
|||||||||
| Operating income |
$ | 101,624 | $ | 94,451 | $ | 11,715 | $ | 24,470 | ||||||||
|
|
|
|
|
|
|
|
|
|||||||||
| Other income (expense): |
||||||||||||||||
| Gain (loss) on sale of investment properties |
$ | — | $ | 693 | $ | — | $ | (589 | ) | |||||||
| Other (loss) income |
227 | (1,389 | ) | (1,113 | ) | 798 | ||||||||||
| Interest expense |
(51,565 | ) | (57,427 | ) | (52,792 | ) | (45,061 | ) | ||||||||
| Equity in earnings (loss) and gain (loss) and (impairment) of investment in unconsolidated entities, net |
— | 4,216 | (33 | ) | (3,719 | ) | ||||||||||
| Income tax expense |
(5,865 | ) | (5,865 | ) | (3,619 | ) | (3,695 | ) | ||||||||
|
|
|
|
|
|
|
|
|
|||||||||
| Net income (loss) from continuing operations |
$ | 44,421 | $ | 34,679 | $ | (45,842 | ) | $ | (27,796 | ) | ||||||
|
|
|
|
|
|
|
|
|
|||||||||
| Net income (loss) from discontinued operations |
— | 75,120 | (5,626 | ) | (12,661 | ) | ||||||||||
| Less: Net income attributable to noncontrolling interests |
— | — | — | (5,689 | ) | |||||||||||
|
|
|
|
|
|
|
|
|
|||||||||
| Net income (loss) attributable to Company |
$ | 44,421 | $ | 109,799 | $ | (51,468 | ) | $ | (46,146 | ) | ||||||
|
|
|
|
|
|
|
|
|
|||||||||
| Per Share Data: |
||||||||||||||||
| Earnings per share—basic |
$ | .39 | N/A | N/A | N/A | |||||||||||
| Earnings per share—diluted |
$ | .39 | N/A | N/A | N/A | |||||||||||
61
Table of Contents
| As of December 31, | ||||||||||||||||
| 2014 Pro Forma |
2014 | 2013 | 2012 | |||||||||||||
| Selected Balance Sheet Data: |
||||||||||||||||
| Cash and cash equivalents |
$ | 317,657 | $ | 163,053 | $ | 89,169 | $ | 65,004 | ||||||||
| Restricted cash and escrows |
87,296 | 87,296 | 87,804 | 65,847 | ||||||||||||
| Total assets |
3,110,179 | 2,955,751 | 3,756,658 | 2,878,708 | ||||||||||||
| Total debt |
1,172,712 | 1,295,048 | 1,280,220 | 1,011,421 | ||||||||||||
| Total equity |
1,797,685 | 1,520,921 | 1,818,255 | 1,217,977 | ||||||||||||
| Other Financial Data: |
||||||||||||||||
| Adjusted EBITDA(1) |
$ | 254,845 | $ | 316,541 | $ | 243,757 | $ | 201,589 | ||||||||
| Funds from operations(2) |
$ | 186,819 | $ | 152,054 | $ | 152,311 | $ | 114,957 | ||||||||
| Adjusted FFO(2) |
$ | 201,115 | $ | 224,814 | $ | 159,062 | $ | 116,171 | ||||||||
| Operating Data(3): |
||||||||||||||||
| Number of Hotels(4) |
46 | 46 | 45 | 31 | ||||||||||||
| Number of Rooms(4) |
12,636 | 12,636 | 11,991 | 8,688 | ||||||||||||
| Occupancy |
76.3 | % | 76.3 | % | 73.6 | % | 71.4 | % | ||||||||
| ADR |
$ | 177.95 | $ | 177.62 | $ | 161.95 | $ | 150.79 | ||||||||
| RevPAR |
$ | 135.76 | $ | 135.46 | $ | 119.13 | $ | 107.72 | ||||||||
| (1) | EBITDA is a commonly used measure of performance in many industries and is defined as net income or loss (calculated in accordance with GAAP) excluding interest expense, provision for income taxes (including income taxes applicable to sale of assets) and depreciation and amortization. We consider EBITDA useful to an investor regarding our results of operations, in evaluating and facilitating comparisons of our operating performance between periods and between REITs by removing the impact of our capital structure (primarily interest expense) and asset base (primarily depreciation and amortization) from our operating results, even though EBITDA does not represent an amount that accrues directly to common stockholders. In addition, EBITDA is used as one measure in determining the value of hotel acquisitions and dispositions and along with FFO and Adjusted FFO, it is used by management in the annual budget process for compensation programs. |
We further adjust EBITDA for certain additional items such as hotel property acquisitions and pursuit costs, amortization of share-based compensation (if any), equity investment adjustments, the cumulative effect of changes in accounting principles, impairment of real estate assets, and other costs we believe do not represent recurring operations and are not indicative of the performance of our underlying hotel property entities. We believe Adjusted EBITDA provides investors with another financial measure in evaluating and facilitating comparison of operating performance between periods and between REITs that report similar measures.
62
Table of Contents
The following is reconciliation of net income (loss) to EBITDA and Adjusted EBITDA for the years ended December 31, 2014, 2013, and 2012 (in thousands):
| For the year ended December 31, | ||||||||||||||||
| 2014 Pro Forma |
2014 | 2013 | 2012 | |||||||||||||
| Net income (loss) from continuing operations |
$ | 44,421 | $ | 34,679 | $ | (45,842 | ) | $ | (27,796 | ) | ||||||
| Net income (loss) from discontinued operations |
— | 75,120 | (5,626 | ) | (12,661 | ) | ||||||||||
| Net income attributable to noncontrolling interests |
— | — | — | (5,689 | ) | |||||||||||
|
|
|
|
|
|
|
|
|
|||||||||
| Net income (loss) attributable to Company |
$ | 44,421 | $ | 109,799 | $ | (51,468 | ) | $ | (46,146 | ) | ||||||
| Interest expense |
51,565 | 85,724 | 85,701 | 82,986 | ||||||||||||
| Equity in interest expense of joint venture |
— | 31 | 311 | 990 | ||||||||||||
| Income tax expense |
5,865 | 10,433 | 3,043 | 5,718 | ||||||||||||
| Depreciation and amortization related to investment properties |
142,398 | 177,671 | 154,861 | 155,777 | ||||||||||||
| Depreciation and amortization related to investment in unconsolidated entities |
— | 100 | 821 | 1,602 | ||||||||||||
|
|
|
|
|
|
|
|
|
|||||||||
| EBITDA |
$ | 244,249 | $ | 383,758 | $ | 193,269 | $ | 200,927 | ||||||||
|
|
|
|
|
|
|
|
|
|||||||||
| Reconciliation to Adjusted EBITDA |
||||||||||||||||
| Impairment of investment properties |
$ | — | $ | 5,378 | $ | 49,145 | $ | — | ||||||||
| Impairment of investment properties reflected in discontinued operations |
— | — | — | 6,224 | ||||||||||||
| Impairment of investment in unconsolidated entities |
— | — | 1,003 | 2,465 | ||||||||||||
| Gain on sale of investment properties |
— | (136,385 | ) | (1,564 | ) | (6,367 | ) | |||||||||
| (Gain) loss on extinguishment of debt |
113 | 67,105 | 20 | (4,178 | ) | |||||||||||
| (Gain) loss from sale of investment in unconsolidated entities |
— | (4,509 | ) | (487 | ) | 1,402 | ||||||||||
| Acquisition and pursuit costs |
— | 1,194 | 2,371 | 1,116 | ||||||||||||
| Amortization of share-based compensation expense |
4,671 | — | — | — | ||||||||||||
| Other expenses (1) |
5,812 | — | — | — | ||||||||||||
|
|
|
|
|
|
|
|
|
|||||||||
| Adjusted EBITDA |
$ | 254,845 | $ | 316,541 | $ | 243,757 | $ | 201,589 | ||||||||
|
|
|
|
|
|
|
|
|
|||||||||
| (1) | Other expenses includes non-recurring expenses associated with the transition to a publicly-traded stand-alone company and costs related to lender consents required to effectuate the spin-off from Inland American. |
| (2) | We calculate FFO in accordance with standards established by the National Association of Real Estate Investment Trusts (NAREIT), which defines FFO as net income or loss (calculated in accordance with GAAP), excluding real estate-related depreciation, amortization and impairment, gains (losses) from sales of real estate, the cumulative effect of changes in accounting principles, adjustments for unconsolidated partnerships and joint ventures, and items classified by GAAP as extraordinary. Historical cost accounting for real estate assets implicitly assumes that the value of real estate assets diminishes predictably over time. Since real estate values instead have historically risen or fallen with market conditions, most industry investors consider presentations of operating results for real estate companies that use historical cost accounting to be insufficient by themselves. We believe that the presentation of FFO provides useful supplemental information to investors regarding our operating performance by excluding the effect of real estate depreciation and amortization, gains (losses) from sales of real estate, impairments of real estate |
63
Table of Contents
| assets, extraordinary items and the portion of items related to unconsolidated entities, all of which are based on historical cost accounting and which may be of lesser significance in evaluating current performance. We believe that the presentation of FFO can facilitate comparisons of operating performance between periods and between REITs, even though FFO does not represent an amount that accrues directly to common stockholders. Our calculation of FFO may not be comparable to measures calculated by other companies who do not use the NAREIT definition of FFO or do not calculate FFO per diluted share in accordance with NAREIT guidance. Additionally, FFO may not be helpful when comparing us to non-REITs. |
We further adjust FFO for certain additional items that are not in NAREIT’s definition of FFO such as hotel property acquisition and pursuit costs, amortization of share-based compensation (if any), and other expenses we believe do not represent recurring operations. We believe that Adjusted FFO provides investors with useful supplemental information that may facilitate comparisons of ongoing operating performance between periods and between REITs that make similar adjustments to FFO and is beneficial to an investor’s complete understanding of our operating performance.
The following is a reconciliation of our GAAP net income (loss) to FFO and Adjusted FFO for the years ended December 31, 2014, 2013, and 2012 (in thousands):
| For the year ended December 31, | ||||||||||||||||
| 2014 Pro Forma |
2014 | 2013 | 2012 | |||||||||||||
| Net income (loss) from continuing operations |
$ | 44,421 | $ | 34,679 | $ | (45,842 | ) | $ | (27,796 | ) | ||||||
| Net income (loss) from discontinued operations |
— | 75,120 | (5,626 | ) | (12,661 | ) | ||||||||||
| Net income attributable to noncontrolling interests |
— | — | — | (5,689 | ) | |||||||||||
|
|
|
|
|
|
|
|
|
|||||||||
| Net income (loss) attributable to Company |
$ | 44,421 | $ | 109,799 | $ | (51,468 | ) | $ | (46,146 | ) | ||||||
| Depreciation and amortization related to investment properties |
142,398 | 177,671 | 154,861 | 155,777 | ||||||||||||
| Depreciation and amortization related to investment in unconsolidated entities |
— | 100 | 821 | 1,602 | ||||||||||||
| Impairment of investment properties |
— | 5,378 | 49,145 | — | ||||||||||||
| Impairment of investment properties reflected in discontinued operations |
— | — | — | 6,224 | ||||||||||||
| Impairment of investment in unconsolidated entities |
— | — | 1,003 | 2,465 | ||||||||||||
| Gain on sale of investment properties |
— | (136,385 | ) | (1,564 | ) | (6,367 | ) | |||||||||
| Loss (gain) from sale of investment in unconsolidated entities |
— | (4,509 | ) | (487 | ) | 1,402 | ||||||||||
|
|
|
|
|
|
|
|
|
|||||||||
| Funds from operations |
$ | 186,819 | $ | 152,054 | $ | 152,311 | $ | 114,957 | ||||||||
| Reconciliation to Adjusted FFO |
||||||||||||||||
| Loss (gain) on extinguishment of debt |
113 | $ | 67,105 | $ | 20 | $ | (4,178 | ) | ||||||||
| Acquisition and pursuit costs |
— | 1,194 | 2,371 | 1,116 | ||||||||||||
| Amortization of mark to market debt discounts or premium, net |
3,700 | 4,461 | 4,360 | 4,276 | ||||||||||||
| Amortization of share-based compensation |
4,671 | — | — | — | ||||||||||||
| Other Expenses (1) |
5,812 | — | — | — | ||||||||||||
|
|
|
|
|
|
|
|
|
|||||||||
| Adjusted FFO |
$ | 201,115 | $ | 224,814 | $ | 159,062 | $ | 116,171 | ||||||||
|
|
|
|
|
|
|
|
|
|||||||||
| (1) | Other expenses includes non-recurring expenses associated with the transition to a publicly-traded stand-alone company and costs related to lender consents required to effectuate the spin-off from Inland American. |
64
Table of Contents
FFO, Adjusted FFO, EBITDA and Adjusted EBITDA do not represent cash generated from operating activities under GAAP and should not be considered as alternatives to net income or loss, operating profit, cash flows from operations or any other operating performance measure prescribed by GAAP. Although we present and use FFO, Adjusted FFO, EBITDA and Adjusted EBITDA because we believe they are useful to investors in evaluating and facilitating comparisons of our operating performance between periods and between REITs that report similar measures, the use of these non-GAAP measures has certain limitations as analytical tools. These non-GAAP financial measures are not measures of our liquidity, nor are they indicative of funds available to fund our cash needs, including our ability to fund capital expenditures, contractual commitments, working capital, service debt or make cash distributions. These measurements do not reflect cash expenditures for long-term assets and other items that we have incurred and will incur. These non-GAAP financial measures may include funds that may not be available for management’s discretionary use due to functional requirements to conserve funds for capital expenditures, property acquisitions, and other commitments and uncertainties. These non-GAAP financial measures as presented may not be comparable to non-GAAP financial measures as calculated by other real estate companies.
We compensate for these limitations by separately considering the impact of these excluded items to the extent they are material to operating decisions or assessments of our operating performance. Our reconciliations to the most comparable GAAP financial measures, and our combined consolidated statements of operations and cash flows, include interest expense, capital expenditures, and other excluded items, all of which should be considered when evaluating our performance, as well as the usefulness of our non-GAAP financial measures. These non-GAAP financial measures reflect additional ways of viewing our operations that we believe, when viewed with our GAAP results and the reconciliations to the corresponding GAAP financial measures, provide a more complete understanding of factors and trends affecting our business than could be obtained absent this disclosure. We strongly encourage investors to review our financial information in its entirety and not to rely on a single financial measure.
(3) For only those hotels operated by Marriott, our historical annual operating results represented here from 2012 to 2013 include a 52-53 week fiscal calendar used by Marriott at that time.
(4) Number of Hotels and Number of Rooms as of period end which excludes all properties sold as of December 31, 2014.
65
Table of Contents
Item 6A. Pro Forma Financial Information
The following unaudited pro forma combined consolidated balance sheet as of December 31, 2014 and unaudited pro forma combined consolidated statements of operations for the year ended December 31, 2014 have been prepared to reflect the following transactions as if they had occurred on December 31, 2014 for the unaudited pro forma combined consolidated balance sheet and January 1, 2014 for the unaudited pro forma combined consolidated statement of operations:
| • | the separation from Inland American that occurred on February 3, 2015; |
| • | the Capital Contribution from Inland American; |
| • | the issuance of 125 shares of Series A Preferred Stock; |
| • | the repayment of approximately $84.0 million of borrowings outstanding under existing mortgage indebtedness, funded by Inland American; |
| • | an additional capital contribution of $16.0 million, all of which the Company intends to use to paydown existing mortgage indebtedness in 2015; |
| • | the non-cash capital contribution of $96.0 million to settle the Company’s allocated share of Inland American’s unsecured credit facility; |
| • | the Company’s entry into a new $400 million unsecured revolving credit facility; |
| • | the issuance of 113,396,997 shares of our common stock to Inland American pursuant to a stock dividend effectuated prior to the Distribution; and |
| • | the distribution of 107,728,104 shares of our common stock to holders of Inland American common stock on February 3, 2015 and 5,669,893 shares retained by Inland American. |
In addition, the pro forma combined consolidated statements of operations:
| • | reflect the consummation of the acquisition of the Aston Waikiki Beach Hotel (which the Company acquired on February 28, 2014); and |
| • | exclude the operating results of three hotels, one sold on May 30, 2014, one sold on August 28, 2014 and one sold December 31, 2014. |
The unaudited pro forma adjustments are based on preliminary estimates, accounting judgments and currently available information and assumptions that management believes are reasonable. The notes to the unaudited pro forma combined consolidated financial statements provide a detailed discussion of how such adjustments were derived and presented in the unaudited pro forma combined consolidated financial and operating data. The unaudited pro forma combined consolidated financial information should be read in conjunction with “Part I-Item 1. Business-Our Structure and Reorganization Transactions-Our Corporate Reorganization,” “Part II-Item 6. Selected Financial Data,” “Part II-Item 7. Management’s Discussion and Analysis of Financial Conditions and Results of Operations,” “Part III-Item 13. Certain Relationships and Related Transactions and Director Independence” and our combined consolidated financial statements and related notes thereto and the financial statements of the Aston Waikiki Beach Hotel and related notes thereto included in our Registration Statement on Form 10, as amended, originally filed with the SEC on August 11, 2014.
The unaudited pro forma combined consolidated financial statements have been prepared for illustrative purposes only and are not necessarily indicative of our financial position or results of operations had the transactions described above for which we are giving pro forma effect actually occurred on the dates or for the periods indicated, nor is such unaudited pro forma financial information necessarily indicative of the results to be expected for any future period. A number of factors may affect our results. See “Part I—Item 1A. Risk Factors” and “Special Note Regarding Forward-Looking Statements.”
66
Table of Contents
Unaudited Pro Forma Combined Consolidated Balance Sheet
As of December 31, 2014
(in thousands)
| Historical | Capital Contribution and Financing Transactions (2) |
Pro Forma | ||||||||||
| Assets |
||||||||||||
| Investment in hotel properties, net |
$ | 2,582,710 | $ | — | $ | 2,582,710 | ||||||
| Cash and cash equivalents |
163,053 | 154,604 | 317,657 | |||||||||
| Accounts and rents receivable, net |
26,504 | — | 26,504 | |||||||||
| Prepaid expenses and other assets |
183,484 | (176 | ) | 183,308 | ||||||||
|
|
|
|
|
|
|
|||||||
| Total assets |
$ | 2,955,751 | $ | 154,428 | $ | 3,110,179 | ||||||
|
|
|
|
|
|
|
|||||||
| Liabilities and Stockholders’ Equity |
||||||||||||
| Debt |
$ | 1,295,048 | $ | (122,336 | ) | $ | 1,172,712 | |||||
| Accounts payable and accrued expenses |
88,356 | — | 88,356 | |||||||||
| Other liabilities |
51,426 | — | 51,426 | |||||||||
|
|
|
|
|
|
|
|||||||
| Total liabilities |
$ | 1,434,830 | $ | (122,336 | ) | $ | 1,312,494 | |||||
|
|
|
|
|
|
|
|||||||
| Stockholders’ equity: |
||||||||||||
| Capital contributions |
$ | 1,781,427 | $ | 276,940 | $ | 2,058,367 | ||||||
| Additional paid-in capital |
— | — | — | |||||||||
| Accumulated distributions in excess of net income (loss) |
(264,161 | ) | (176 | ) | (264,337 | ) | ||||||
|
|
|
|
|
|
|
|||||||
| Total stockholders’ equity |
$ | 1,517,266 | $ | 276,764 | $ | 1,794,030 | ||||||
| Noncontrolling interests |
3,655 | $ | — | 3,655 | ||||||||
|
|
|
|
|
|
|
|||||||
| Total stockholders’ equity |
$ | 1,520,921 | $ | 276,764 | $ | 1,797,685 | ||||||
|
|
|
|
|
|
|
|||||||
| Total liabilities and stockholders’ equity |
$ | 2,955,751 | $ | 154,428 | $ | 3,110,179 | ||||||
|
|
|
|
|
|
|
|||||||
See notes to unaudited pro forma combined consolidated financial statements.
67
Table of Contents
Unaudited Pro Forma Combined Consolidated Statement of Operations
For the year ended December 31, 2014
(in thousands)
| Historical | Acquisition / Disposition Adjustments (1) |
Capital Contribution and Financing Transactions (2) |
Other Adjustments (4) |
Pro Forma | ||||||||||||||||
| Revenues |
||||||||||||||||||||
| Room revenues |
$ | 631,901 | $ | (5,759 | ) | $ | — | $ | — | $ | 626,142 | |||||||||
| Food and beverage revenues |
235,066 | (2,088 | ) | — | — | 232,978 | ||||||||||||||
| Other revenues |
59,699 | 213 | — | — | 59,912 | |||||||||||||||
|
|
|
|
|
|
|
|
|
|
|
|||||||||||
| Total revenues |
$ | 926,666 | $ | (7,634 | ) | $ | — | $ | — | $ | 919,032 | |||||||||
|
|
|
|
|
|
|
|
|
|
|
|||||||||||
| Expenses |
||||||||||||||||||||
| Hotel operating expenses |
||||||||||||||||||||
| Room expenses |
140,128 | (1,390 | ) | — | — | 138,738 | ||||||||||||||
| Food and beverage expenses |
158,243 | (2,064 | ) | — | — | 156,179 | ||||||||||||||
| Other direct expenses |
33,381 | (27 | ) | — | — | 33,354 | ||||||||||||||
| Other indirect expenses |
217,811 | (4,293 | ) | — | — | 213,518 | ||||||||||||||
| Management fees |
52,104 | (570 | ) | — | — | 51,534 | ||||||||||||||
|
|
|
|
|
|
|
|
|
|
|
|||||||||||
| Total hotel operating expenses |
601,667 | (8,344 | ) | — | — | 593,323 | ||||||||||||||
| Depreciation and amortization |
141,807 | 591 | — | — | 142,398 | |||||||||||||||
| Real estate taxes, personal property taxes and insurance |
41,802 | (572 | ) | — | — | 41,230 | ||||||||||||||
| General and administrative expenses (3) |
38,895 | — | — | 88 | 38,983 | |||||||||||||||
| Business management fees (3) |
1,474 | — | — | — | 1,474 | |||||||||||||||
| Acquisition transaction costs |
1,192 | — | — | (1,192 | ) | — | ||||||||||||||
| Provision for asset impairments |
5,378 | (5,378 | ) | — | — | — | ||||||||||||||
|
|
|
|
|
|
|
|
|
|
|
|||||||||||
| Total operating expenses |
$ | 832,215 | $ | (13,703 | ) | $ | — | $ | (1,104 | ) | $ | 817,408 | ||||||||
|
|
|
|
|
|
|
|
|
|
|
|||||||||||
| Operating income |
$ | 94,451 | $ | 6,069 | $ | — | $ | 1,104 | $ | 101,624 | ||||||||||
|
|
|
|
|
|
|
|
|
|
|
|||||||||||
| Gain on sale of investment properties |
693 | (693 | ) | — | — | — | ||||||||||||||
| Other income (loss) |
(1,389 | ) | 1,086 | 530 | 227 | |||||||||||||||
| Interest expense |
(57,427 | ) | 247 | 5,615 | — | (51,565 | ) | |||||||||||||
| Equity in earnings (loss) and gain (loss) and (impairment) of investment in unconsolidated entities, net |
4,216 | (4,216 | ) | — | — | — | ||||||||||||||
|
|
|
|
|
|
|
|
|
|
|
|||||||||||
| Income before income taxes |
$ | 40,544 | $ | 2,493 | $ | 6,145 | $ | 1,104 | $ | 50,286 | ||||||||||
| Income tax expense |
(5,865 | ) | — | — | — | (5,865 | ) | |||||||||||||
|
|
|
|
|
|
|
|
|
|
|
|||||||||||
| Net income from continuing operations |
$ | 34,679 | $ | 2,493 | $ | 6,145 | $ | 1,104 | $ | 44,421 | ||||||||||
|
|
|
|
|
|
|
|
|
|
|
|||||||||||
| Per Share Data: |
||||||||||||||||||||
| Pro forma basic earnings per share |
N/A | N/A | N/A | N/A | $ | 0.39 | ||||||||||||||
| Pro forma diluted earnings per share |
N/A | N/A | N/A | N/A | $ | 0.39 | ||||||||||||||
| Pro forma weighted average shares outstanding-basic |
N/A | N/A | N/A | N/A | 113,539,285 | |||||||||||||||
| Pro forma weighted average shares outstanding-diluted |
N/A | N/A | N/A | N/A | 114,080,333 | |||||||||||||||
See notes to unaudited pro forma combined consolidated financial statements.
68
Table of Contents
1. Acquisition and Disposition Adjustments
We acquired one hotel on February 28, 2014 and we sold three hotels, one on May 30, 2014, one on August 28, 2014, and one on December 31, 2014. With respect to these transactions, the adjustment gives effect to such transactions as if they had been completed on January 1, 2014.
The following table represents the acquisition and disposition adjustments for the year ended December 31, 2014 (in thousands):
| Disposed Properties |
Acquisitions | Acquisition / Disposition Adjustments |
||||||||||
| Revenue |
||||||||||||
| Room revenues |
$ | (12,200 | ) | $ | 6,441 | $ | (5,759 | ) | ||||
| Food and beverage revenues |
(2,108 | ) | 20 | (2,088 | ) | |||||||
| Other revenues |
(308 | ) | 521 | 213 | ||||||||
|
|
|
|
|
|
|
|||||||
| Total revenues |
$ | (14,616 | ) | $ | 6,982 | $ | (7,634 | ) | ||||
|
|
|
|
|
|
|
|||||||
| Expenses |
||||||||||||
| Hotel operating expenses |
||||||||||||
| Room expenses |
(3,120 | ) | 1,730 | (1,390 | ) | |||||||
| Food and beverage expenses |
(2,073 | ) | 9 | (2,064 | ) | |||||||
| Other direct expenses |
(219 | ) | 192 | (27 | ) | |||||||
| Other indirect expenses |
(5,982 | ) | 1,689 | (4,293 | ) | |||||||
| Management fees |
(716 | ) | 146 | (570 | ) | |||||||
|
|
|
|
|
|
|
|||||||
| Total hotel operating expenses |
(12,110 | ) | 3,766 | (8,344 | ) | |||||||
| Depreciation and amortization |
(860 | ) | 1,451 | 591 | ||||||||
| Real estate taxes, personal property taxes and insurance |
(805 | ) | 233 | (572 | ) | |||||||
| Provision for asset impairments |
(5,378 | ) | — | (5,378 | ) | |||||||
|
|
|
|
|
|
|
|||||||
| Total operating expenses |
$ | (19,153 | ) | $ | 5,450 | $ | (13,703 | ) | ||||
|
|
|
|
|
|
|
|||||||
| Operating income |
$ | 4,537 | $ | 1,532 | $ | 6,069 | ||||||
|
|
|
|
|
|
|
|||||||
| Gain on sale of investment property |
(693 | ) | — | (693 | ) | |||||||
| Other income (loss) |
1,086 | — | 1,086 | |||||||||
| Interest expense |
247 | — | 247 | |||||||||
| Equity in earnings (loss) and gain (loss) and (impairment) of investment in unconsolidated entities, net |
(4,216 | ) | — | (4,216 | ) | |||||||
|
|
|
|
|
|
|
|||||||
| Income before income taxes |
$ | 961 | $ | 1,532 | $ | 2,493 | ||||||
| Income tax expense |
— | — | — | |||||||||
|
|
|
|
|
|
|
|||||||
| Net income from continuing operations |
$ | 961 | $ | 1,532 | $ | 2,493 | ||||||
|
|
|
|
|
|
|
|||||||
During the year ended December 31, 2014, we acquired the following property:
| Property |
Location | Date | Purchase Price (in thousands) |
No. of Rooms | ||||||||||||
| Aston Waikiki Beach Hotel |
Honolulu, HI | Feb 2014 | $ | 183,000 | 645 | |||||||||||
2. Capital Contribution and Financing Transactions
Upon completion of our separation from Inland American, we received a capital contribution of $141.0 million and Inland American funded the paydown of $84.0 million of existing debt. In addition, we settled our $96.0 million allocated portion of Inland American’s unsecured credit facility through a non-cash capital contribution from Inland American.
69
Table of Contents
Interest expense for the year ended December 31, 2014 reflects an adjustment of $5.6 million. This adjustment reflects a decrease in historical interest expense related to the pay down of certain existing fixed and variable debt as well as an increase in interest expense related to the refinancing of certain other variable debt in connection with the separation from Inland American, based on the historical base and LIBOR rates of the respective loans. If market rates of interest on all of the variable rate debt as of December 31, 2014 permanently increased by 0.0125%, interest expense would increase by $46 thousand. If market rates of interest on all variable rate debt as of December 31, 2014 decreased by 0.0125%, interest expense would decrease by $46 thousand.
We entered into a $400 million unsecured revolving credit facility with a syndicate of banks. The revolving credit facility includes an uncommitted accordion feature which, subject to certain conditions, allows us to increase the aggregate availability by up to $350 million. We expect borrowings under the revolving credit facility to bear interest based on LIBOR plus a margin ranging from 1.50% to 2.45% (or, at our election upon achievement of an investment grade rating from Moody’s Investor Services, Inc. or Standard & Poor’s Rating Services, interest based on LIBOR plus a margin ranging from 0.875% to 1.50%). In addition, until such election, the Company expects to pay an unused fee of up to 0.30% of the unused portion of the credit facility based on the average daily unused portion of the credit facility; thereafter, the Company expects to pay a facility fee ranging between 0.125% and 0.35% based on its debt rating.
3. General and Administrative Expenses and Business Management Fee
For the year ended December 31, 2014, pro forma general and administrative expenses and business management fee totaled $40.5 million. This includes allocated general and administrative expenses from Inland American of $16.1 million, an allocated business management fee from Inland American of $1.5 million and administrative expenses directly attributable to the Company of $22.9 million. Both the allocated general and administrative expenses and business manager fee are based upon the Company’s percentage share of the average invested assets of Inland American. The allocated general and administrative expenses relate to certain corporate and shared functions and includes Inland American’s expenses, such as legal and other professional fees related to Inland American’s self-management transactions, transaction readiness, and other legal costs. Following our separation from Inland American, the Company will no longer be allocated a portion of Inland American’s corporate overhead.
Effective with our separation from Inland American, we have assumed responsibility for all corporate functions as a stand-alone entity. We have incurred and expect to incur additional general and administrative expense as a result of becoming a public company, including but not limited to incremental salaries and equity incentives, board of directors’ fees and expenses, director and officer insurance, Sarbanes-Oxley Act of 2002 compliance costs, third-party costs for outsourced services including investor relations, human resources, risk management, information technology, corporate taxes and incremental audit and tax fees and legal costs. We estimate that our first twelve months of corporate general and administrative expenses as a stand-alone entity will be approximately $30.0 million to $34.0 million, including approximately $5.0 million to $7.0 million of non-cash stock-based compensation expense based on equity awards to be granted to certain employees and directors upon separation from Inland American, $500 thousand to $800 thousand of transition services pursuant to our Transition Services Agreement with Inland American and $5.0 million to $7.0 million of non-recurring accounting, information technology, legal, consulting and other general and administrative expenses associated with the transition to a publicly-traded stand-alone company. No pro forma adjustments have been made to our financial statement to reflect the additional costs and expenses described in this paragraph because they are projected amounts based on judgmental estimates and, as such, are not includable as pro forma adjustments.
4. Other Adjustments
We have excluded from the accompanying unaudited combined consolidated pro forma statements $1.2 million of operations acquisition transaction costs and $4.6 million of one-time fees in general and administrative expenses for the year ended December 31, 2014. Additionally, we have included in general and administrative expenses an amortization of share-based compensation pursuant to the share unit awards described elsewhere in
70
Table of Contents
this Annual Report under the heading “Management—Compensation Programs” of $4.7 million for the year ended December 31, 2014. The amortization of share-based compensation assumes that a listing event has occurred, and the share unit awards were made, on January 1, 2014.
We estimate that we will incur a total of $36.0 million to $40.0 million of general and administrative expenses directly related to transaction costs incurred in connection with our separation from Inland American and the listing of our common stock on the NYSE, including investment banking, legal, loan restructuring and listing-related fees. This includes $5.0 million to $7.0 million of general and administrative expenses incurred solely in connection with the listing of our common stock on the NYSE, which we will exclude from the accompanying unaudited combined consolidated pro forma statements of operations in the period those expenses are incurred.
5. Cash Contribution from Inland American
Upon our separation from Inland American, in addition to the capital contribution and the additional capital contribution of $16.0 million, we had over $100 million of cash on hand. This amount is after the reimbursement to Inland American of certain fees and expenses, related to the separation, and before the payment of additional fees and expenses and certain other costs as described in the Separation and Distribution Agreement we entered into with Inland American. See “Part III—Item 13. Certain Relationships and Related Transactions and Director Independence.”
71
Table of Contents
Item 7. Management’s Discussion and Analysis of Financial Condition and Results of Operations
The following discussion and analysis of our financial condition and results of operations should be read in conjunction with “Part I-Item 1A. Risk Factors,” “Part II-Item 6. Selected Financial Data,” “Part II-Item 6A. Pro Forma Financial Information,” “Part I-Item 1. Business,” “Part I-Item 2. Properties” and the historical combined consolidated financial statements, and related notes included elsewhere in this Annual Report. The following discussion and analysis contains forward-looking statements based upon our current expectations, estimates and assumptions that involve risks and uncertainties. Our actual results could differ materially from those discussed in these forward-looking statements due to a variety of risks, uncertainties and other factors, including but not limited to, factors discussed in “Part I-Item 1A. Risk Factors” and “Special Note Regarding Forward-Looking Statements.”
Overview
On February 3, 2015, Xenia Hotels & Resorts, Inc., a Maryland corporation, was spun-off from Inland American Real Estate Trust, Inc. (“Inland American”), its former parent, through a taxable pro-rata distribution by Inland American of 95% of the outstanding common stock, $0.01 par value per share (the “Common Stock”), of Xenia to holders of record of Inland American’s common stock as of the close of business on January 20, 2015 (the “Record Date”). Each holder of record of Inland American’s common stock received one share of Common Stock for every eight shares of Inland American’s common stock held at the close of business on the Record Date (the “Distribution”). In lieu of fractional shares, stockholders of Inland American received cash. On February 4, 2015, Xenia’s Common Stock began trading on the New York Stock Exchange (“NYSE”) under the ticker symbol “XHR.” As a result of the Distribution, the Company became a stand-alone, publicly-traded company.
Xenia Hotels & Resorts, Inc. is a self-advised and self-administered REIT that invests primarily in premium full service, lifestyle and urban upscale hotels, with a focus on the Top 25 Markets as well as key leisure destinations in the United States. A premium full service hotel refers to a hotel defined as “upper upscale” or “luxury” by STR. A lifestyle hotel refers to an innovative hotel with a focus on providing a unique and individualized guest experience in a smaller footprint by combining traditional hotel services with modern technologies and placing an emphasis on local influence. An urban upscale hotel refers to a hotel located in an urban or similar high-density commercial area, such as a central business district, and defined as “upscale” or “upper midscale” by STR. As of December 31, 2014, we owned 46 hotels, comprising 12,636 rooms, across 19 states and the District of Columbia, and had a majority interest in two hotels under development. Our hotels are primarily operated by industry leaders such as Marriott, Hilton, Hyatt, Starwood, Kimpton, Aston, Fairmont and Loews, as well as leading independent management companies.
We plan to grow our business through a differentiated acquisition strategy, aggressive asset management and capital investment in our properties. We primarily target markets and sub-markets with particular positive characteristics, such as multiple demand generators, favorable supply and demand dynamics and attractive projected RevPAR growth. We believe our focus on a broader range of markets allows us to evaluate a greater number of acquisition opportunities and thereby be highly selective in our pursuit of only those opportunities which best fit our investment criteria. We own and pursue hotels in the upscale, upper upscale and luxury segments that are affiliated with premium, leading brands, as we believe that these segments yield attractive risk adjusted returns. Within these segments, we focus on hotels that will provide guests with a distinctive lodging experience, tailored to reflect local market environments rather than hotels that are heavily dependent on conventions and group business. We also seek properties that exhibit an opportunity for us to enhance operating performance through aggressive asset management and targeted capital investment.
Prior to and in connection with our separation from Inland American, we effectuated the Reorganization Transactions described under “Part I-Item I. Business-Our Structure and Reorganization Transactions-Our Corporate Reorganization.” We refer in this Annual Report to all of the hotels owned by Xenia from time to time and prior to the Reorganization Transactions and the disposition of other hotels previously owned by us, as the “Prior Combined Portfolio.”
72
Table of Contents
On September 17, 2014, Inland American entered into a definitive asset purchase agreement to sell a portfolio of 52 select service hotels (the “Suburban Select Service Portfolio”) to unaffiliated third party purchasers for approximately $1.1 billion, and its operating activity has been reflected in discontinued operations. The sale closed on November 17, 2014. None of the proceeds from the sale were retained by Xenia. The sale of the Suburban Select Service Portfolio represents a strategic shift and will have a major impact on the financial statements. As such, these properties are classified as held for sale on the combined consolidated balance sheet as of December 31, 2013. Additionally, the operations of the Suburban Select Service Portfolio are reflected as discontinued operations on the combined consolidated statements of operations for the years ended December 31, 2014, 2013 and 2012.
For more information regarding the Reorganization Transactions, see “Part I-Item I. Business-Our Structure and Reorganization Transactions-Our Corporate Reorganization.” This discussion and analysis reflects the results of operations for the Prior Combined Portfolio. Where indicated, we have supplemented our discussion and analysis of our results of operations to reflect solely the portfolio that the Company owns following the completion of the separation of the Company from Inland American.
Self-Management of Inland American
From our formation in 2007 until March 2014, our management team, which has continuously been dedicated to Inland American’s entire hotel portfolio, including our portfolio and the Suburban Select Service Portfolio, was employed by Inland American’s external manager, Inland American Business Manager and Advisor, Inc. (the “Business Manager”), or one of its affiliates. On March 12, 2014, Inland American entered into a series of agreements and amendments to existing agreements with affiliates of The Inland Group, Inc. pursuant to which Inland American began the process of becoming entirely self-managed (collectively, the “Self-Management Transactions”). After the Self-Management Transactions, our management team and our other employees ceased to be employed by the Business Manager or one of its affiliates and became our employees. In connection with the Self-Management Transactions, Inland American agreed with the Business Manager to terminate the management agreement with the Business Manager, hire all of the Business Manager’s employees, and acquire the assets or rights necessary to conduct the functions previously performed for Inland American by the Business Manager. Prior to the Self-Management Transactions, we were allocated a portion of the business management fee based upon our percentage share of the average invested assets of Inland American. The Self-Management Transactions resulted in a final business management fee incurred in January 2014. As a result, the Company has not been allocated a business management fee after January 2014.
Separation from Inland American
As a result of the separation, we and Inland American operate separately, each as an independent company. In connection with and in order to effectuate the separation and distribution, we and Inland American entered into a Separation and Distribution Agreement. In addition, we entered into various other agreements with Inland American to effect the separation and provide a framework for our relationship with Inland American post-separation, such as a Transition Services Agreement and an Employee Matters Agreement. These agreements provide for the allocation between us and Inland American of Inland American’s assets, liabilities and obligations (including its properties, employees and tax-related assets and liabilities) attributable to periods prior to, at and after our separation from Inland American and govern certain relationships between us and Inland American after the separation. For more information regarding these agreements, see “Part II-Item 13.Certain Relationships and Related Transactions and Director Independence.”
Basis of Presentation
Our financial statements reflect the operations of our portfolio, which, among other things, classifies the Suburban Select Service Portfolio as held for sale as of December 31, 2013, with the related results from operations reported as discontinued operations, and include allocations of costs from certain corporate and shared functions provided to us by Inland American, as well as costs associated with participation by certain of our
73
Table of Contents
executives in Inland American’s benefit plans. Corporate costs directly associated with our principal executive offices, personnel and other administrative costs are reflected as general and administrative expense on the combined consolidated financial statements. Additionally, Inland American allocated to Xenia a portion of corporate overhead costs incurred by Inland American based upon Xenia’s percentage share of the average invested assets of Inland American and which is also reflected in general and administrative expense. As Inland American is managing various asset portfolios, the extent of services and benefits a portfolio receives is based on the size of its assets. We believe that using average invested assets to allocate costs is a reasonable reflection of the services and other benefits received by us and complies with applicable accounting guidance. However, actual costs may have differed from allocated costs if we had operated as a stand-alone entity during such period and those differences may have been material.
Because the historical financial statements represent the financial and operating data of our portfolio and the Company owns solely our portfolio following the separation from Inland American, the historical financial statements included in this Annual Report do not reflect our financial position, results of operations and cash flows as if we had operated as a stand-alone public company during the periods presented. Accordingly, our historical results should not be relied upon as an indicator of future performance.
Acquisition Activity
During the years ended December 31, 2014, 2013 and 2012, we acquired the following hotel properties:
| Property |
Location | Date | Purchase Price (in thousands) |
No. of Rooms | ||||||||
| Aston Waikiki Beach Hotel |
Honolulu, HI | Feb 2014 | $ | 183,000 | 645 | |||||||
| Property |
Location | Date | Purchase Price (in thousands) |
No. of Rooms | ||||||||
| Bohemian Hotel Celebration, an Autograph Collection Hotel |
Celebration, FL | Feb 2013 | $ | 17,500 | 115 | |||||||
| Andaz San Diego |
San Diego, CA | Mar 2013 | 53,000 | 159 | ||||||||
| Residence Inn Denver City Center |
Denver, CO | Apr 2013 | 80,000 | 228 | ||||||||
| Westin Galleria Houston |
Houston, TX | Aug 2013 | 120,000 | 487 | ||||||||
| Westin Oaks Houston at the Galleria |
Houston, TX | Aug 2013 | 100,000 | 406 | ||||||||
| Andaz Savannah |
Savannah, GA | Sep 2013 | 43,000 | 151 | ||||||||
| Andaz Napa |
Napa, CA | Sep 2013 | 72,000 | 141 | ||||||||
| Hyatt Regency Santa Clara |
Santa Clara, CA | Sep 2013 | 93,000 | 501 | ||||||||
| Loews New Orleans Hotel |
New Orleans, LA | Oct 2013 | 74,500 | 285 | ||||||||
| Lorien Hotel & Spa |
Alexandria, VA | Oct 2013 | 45,250 | 107 | ||||||||
| Hotel Monaco Chicago |
Chicago, IL | Nov 2013 | 56,000 | 191 | ||||||||
| Hotel Monaco Denver |
Denver, CO | Nov 2013 | 75,000 | 189 | ||||||||
| Hotel Monaco Salt Lake City |
Salt Lake City, UT | Nov 2013 | 58,000 | 225 | ||||||||
| Hyatt Key West Resort & Spa |
Key West, FL | Nov 2013 | 76,000 | 118 | ||||||||
|
|
|
|
|
|||||||||
| $ | 963,250 | 3,303 | ||||||||||
|
|
|
|
|
|||||||||
74
Table of Contents
| Property |
Location | Date | Purchase Price (in thousands) |
No. of Rooms | ||||||||
| Marriott San Francisco Airport Waterfront |
San Francisco, CA | Mar 2012 | $ | 108,000 | 685 | |||||||
| Hilton St. Louis Downtown at the Arch |
St. Louis, MO | Mar 2012 | 22,600 | 195 | ||||||||
| Renaissance Arboretum Austin Hotel |
Austin, TX | Mar 2012 | 103,000 | 492 | ||||||||
| Renaissance Atlanta Waverly Hotel & Convention Center |
Atlanta, GA | Mar 2012 | 97,000 | 521 | ||||||||
| Marriott Griffin Gate Resort & Spa |
Lexington, KY | Mar 2012 | 62,500 | 409 | ||||||||
| Bohemian Hotel Savannah Riverfront, an Autograph Collection Hotel |
Savannah, GA | Aug 2012 | 45,000 | 75 | ||||||||
| Grand Bohemian Hotel Orlando, an Autograph Collection Hotel |
Orlando, FL | Dec 2012 | 77,000 | 247 | ||||||||
|
|
|
|
|
|||||||||
| $ | 515,100 | 2,624 | ||||||||||
|
|
|
|
|
|||||||||
Market Outlook
The U.S. lodging industry continued to exhibit strong and improving fundamentals throughout 2014, driven by positive broader macroeconomic trends and favorable supply and demand dynamics in our target sub-markets. Lodging demand has historically exhibited a strong correlation to U.S. GDP growth, thus recent growth in corporate earnings and expectations of an acceleration in economic growth bode well for future lodging demand. In particular, growing demand from business travel, a healthy recovery in leisure travel and increased international travel, combined with limited new supply, contributed to a 8.3% RevPAR growth for 2014, for the U.S. lodging industry, led primarily by rate growth. With the expectation for continued growth in travel demand, we expect this trend of rate-driven RevPAR growth to continue in 2015. We believe that supply growth will remain tempered in the near to intermediate-term. Our markets are expected to continue to benefit from broad, positive macroeconomic trends, and a favorable supply / demand imbalance in the U.S. lodging industry, which we believe will continue to drive RevPAR growth.
Our Customers
We generate a significant portion of our revenue from the following broad customer groups: transient business, group business and contract business. Transient business broadly represents individual business or leisure travelers. Business travelers make up the majority of transient demand at our hotels. Therefore, we will be more affected by trends in business travel than trends in leisure demand. Group business represents clusters of guestrooms booked together, usually with a minimum of 10 rooms. Contract business refers to blocks of rooms sold to a specific company for an extended period of time at significantly discounted rates. Airline crews are typical generators of contract demand at some of our hotels. Additionally, contract rates may be utilized by hotels that are located in markets that are experiencing consistently lower levels of demand.
Inflation
We do not believe inflation has had a material effect on our business during the years ended December 31, 2014, 2013, and 2012. Although increases in the rate of inflation typically result in increases in hotel room rates, a severe increase in the rate of inflation has the potential to cause the economy to slow. A slowing of the economy may create a reduction in hotel room rates and consequential decreases in revenues and profitability. See “Part I-Item 1A. Risk Factors-Risks Related to Our Business and Industry.”
Seasonality
The lodging industry is seasonal in nature, which can be expected to cause fluctuations in our hotel room revenues, occupancy levels, room rates, operating expenses and cash flows. The periods during which our hotels experience higher or lower levels of demand vary from property to property and depend upon location, type of
75
Table of Contents
property and competitive mix within the specific location. Based on historical results, our revenues were the lowest during the first quarter of each year. Similarly, we expect our revenues to also be the lowest during the first quarter of each year.
Our Revenues and Expenses
Revenues
Our revenues are derived from hotel operations and are composed of the following sources:
| • | Room revenues - Represents the sale of room rentals at our hotel properties and accounts for a substantial majority of our total revenue. Occupancy and ADR are the major drivers of room revenue. The business mix and distribution channel mix of the hotels are significant determinants of ADR. |
| • | Food and beverage revenues - Occupancy and the type of customer staying at the hotel are the major drivers of food and beverage revenue (i.e., group business typically generates more food and beverage business through catering functions when compared to transient business, which may or may not utilize the hotel’s food and beverage outlets). |
| • | Other revenues - Represents ancillary revenue such as parking, telephone and other guest services, and tenant leases. Occupancy and the nature of the property are the main drivers of other revenue. |
Expenses
Our operating expenses consist of costs to provide hotel services and corporate-level expenses. The following are components of our expenses:
| • | Room expenses - These costs include housekeeping wages and payroll taxes, reservation systems, room supplies, laundry services and front desk costs. Similar to room revenue, occupancy is the major driver of room expense and as a result, room expense has a significant correlation to room revenue. These costs as a percentage of revenue can increase based on increases in salaries and wages, as well as on the level of service and amenities that are provided. |
| • | Food and beverage expenses - These expenses primarily include food, beverage and associated labor costs. Occupancy and the type of customer staying at the hotel are major drivers of food and beverage expense (i.e., catered functions generally are more profitable than on-property food and beverage outlet sales), which correlates closely with food and beverage revenue. |
| • | Other direct expenses - These expenses primarily include labor and other costs associated with other revenues, such as parking, telephone and other guest services. |
| • | Other indirect expenses - These expenses primarily include hotel costs associated with general and administrative, sales and marketing and repairs and maintenance and utility costs. |
| • | Management fees - Base management fees are computed as a percentage of gross revenue. The management fees also include hotel incentive fees, which are typically a percentage of net operating income (or similar measurement of hotel profitability) after we receive a threshold annual payment based on our total capital investment in the hotel. See “Part I-Item 2. Our Principal Agreements.” |
| • | Depreciation and amortization expense - These are non-cash expenses that primarily consist of depreciation of fixed assets such as buildings, furniture, fixtures and equipment at our hotels, as well as certain corporate assets. Amortization expense primarily consists of amortization of acquired above and below market ground leases and acquired advance bookings, which are amortized over the life of the related lease or term. |
| • | General and administrative expenses - General and administrative expenses consist primarily of compensation expense for our corporate staff and personnel supporting our business, office administrative and related expenses and acquisition expenses. Corporate costs directly associated with |
76
Table of Contents
| Xenia’s principal executive offices, personnel and other administrative costs are reflected as general and administrative expense on the combined consolidated financial statements. Additionally, Inland American allocated to Xenia a portion of corporate overhead costs incurred by Inland American which is based upon Xenia’s percentage share of the average invested assets of Inland American and reflected in general and administrative expense. Upon our separation from Inland American, we were no longer allocated a portion of Inland American’s corporate overhead. We will be party to a Transition Services Agreement with Inland American, pursuant to which we will be charged agreed-upon amounts for the corporate services we receive. We anticipate that we will incur non-recurring expenses associated with establishing our own information technology, financial reporting and other public company infrastructure, particularly during 2015. |
| • | Business management fee - During the years ended December 31, 2014, 2013, and 2012, Inland American paid an annual business management fee to the Business Manager based on the average invested assets. We were allocated a portion of the business management fee based upon our percentage share of the average invested assets of Inland American for the years ended December 31, 2014, 2013, and 2012. On March 12, 2014, Inland American entered into the Self-Management Transactions. After the Self-Management Transactions, our management team and our other employees ceased to be employed by the Business Manager or one of its affiliates and became our employees. In connection with the Self-Management Transactions, Inland American agreed with the Business Manager to terminate the management agreement with the Business Manager, hire all of the Business Manager’s employees and acquire the assets or rights necessary to conduct the functions previously performed for Inland American by the Business Manager. The Self-Management Transactions resulted in a final business management fee incurred in January 2014. As a result, we were not allocated a business management fee after January 2014. |
| • | Acquisition transaction costs - Acquisition transaction costs typically consist of legal fees, other professional fees, transfer taxes and other direct costs associated with our pursuit of hotel investments. As a result, these costs will vary depending on our level of ongoing acquisition activity. |
| • | Provision for asset impairment - We hold goodwill, amortizing intangible assets and long-lived assets investments. We assess the carrying values of our long-lived assets and equity method investments and evaluate these assets for impairment as discussed in “Critical Accounting Policies and Estimates.” These evaluations have, in the past, resulted in impairment losses for certain of these assets based on the specific facts and circumstances surrounding those assets and our estimates of the fair value of those assets. Based on economic conditions or other factors applicable to a specific property, we may be required to take additional impairment losses to reflect further declines in our asset and/or investment values. |
Most categories of variable operating expenses, including labor costs such as housekeeping, fluctuate with changes in occupancy. Increases in occupancy are accompanied by increases in most categories of variable operating expenses, while increases in ADR typically only result in increases in limited categories of operating costs and expenses, such as management fees and franchise fees, which are based on hotel revenues. Thus, changes in ADR have a more significant impact on operating margins than changes in occupancy.
Factors that May Affect Results of Operations
The principal factors affecting our operating results include overall demand for hotel rooms compared to the supply of available hotel rooms, economic conditions, and the ability of our third-party management companies to increase or maintain revenues while controlling expenses.
| • | Demand and economic conditions - Consumer demand for lodging, especially business travel, is closely linked to the performance of the overall economy and is sensitive to business and personal discretionary spending levels. Declines in consumer demand due to adverse general economic conditions, risks affecting or reducing travel patterns, lower consumer confidence and adverse political conditions can lower the revenues and profitability of our hotel operations. As a result, changes in |
77
Table of Contents
| consumer demand and general business cycles can subject and have subjected our revenues to significant volatility. See “Part I-Item 1A. Risk Factors-Risks Relating to Our Business and Industry.” |
| • | Supply - New hotel room supply is an important factor that can affect the lodging industry’s performance. Room rates and occupancy, and thus RevPAR, tend to increase when demand growth exceeds supply growth. The addition of new competitive hotels affects the ability of existing hotels to drive growth in RevPAR, and thus profits. New development is driven largely by construction costs, the availability of financing and expected performance of existing hotels. |
| • | Third-party hotel managers - We depend on the performance of third-party hotel management companies that manage the operations of each of our hotels under long-term agreements. Our operating results could be materially and adversely affected if any of our third-party managers fail to provide quality services and amenities, or otherwise fail to manage our hotels in our best interest. We believe we have good relationships with our third-party managers and are committed to the continued growth and development of these relationships. |
| • | Fixed nature of expenses - Many of the expenses associated with operating our hotels are relatively fixed. These expenses include certain personnel costs, rent, property taxes, insurance and utilities, as well as sales and marketing expenses. If we are unable to decrease these costs significantly or rapidly when demand for our hotels decreases, the resulting decline in our revenues can have an adverse effect on our net cash flow, margins and profits. This effect can be especially pronounced during periods of economic contraction or slow economic growth. |
| • | Seasonality - The lodging industry is seasonal in nature, which can be expected to cause fluctuations in our hotel room revenues, occupancy levels, room rates, operating expenses and cash flows. The periods during which our hotels experience higher or lower levels of demand vary from property to property and depend upon location, type of property and competitive mix within the specific location. Based on historical results for our portfolio, our revenues were the lowest during the first quarter of each year. Similarly, we expect our revenues for our portfolio to also be the lowest during the first quarter of each year. |
| • | Competition - The lodging industry is highly competitive. Our hotels compete with other hotels for guests in each of their markets based on a number of factors, including, among others, room rates, quality of accommodations, service levels and amenities, location, brand affiliation, reputation, and reservation systems. Competition is often specific to the individual markets in which our hotels are located and includes competition from existing and new hotels. We believe that hotels, such as those in our portfolio, will enjoy the competitive advantages associated with operating under such brands. |
Key Indicators of Operating Performance
We use a variety of operating and other information to evaluate the financial condition and operating performance of our business. These key indicators include financial information that is prepared in accordance with U.S. GAAP, as well as other financial measures that are not prepared in accordance with U.S. GAAP. In addition, we use other information that may not be financial in nature, including industry statistical information and comparative data. We use this information to measure the performance of individual hotels, groups of hotels and/or our business as a whole. We periodically compare historical information to our internal budgets as well as industry-wide information. We also use these metrics to evaluate the hotels in our portfolio and potential acquisitions to determine each hotel’s contribution to cash flow, its potential to provide attractive long-term total returns and identify potential candidates for disposition.
Occupancy
Occupancy represents the total number of rooms sold divided by the total number of rooms available at a hotel. Occupancy measures the utilization of our hotels’ available capacity. We use occupancy to gauge demand at a specific hotel in a given period. Occupancy levels also help us determine achievable ADR (as defined below) levels as demand for hotel rooms increases or decreases.
78
Table of Contents
Average Daily Rate (“ADR”)
ADR represents hotel room revenue divided by total number of rooms sold in a given period. ADR measures average room price attained by a hotel, and ADR trends provide useful information concerning the pricing environment and the nature of the customer base of a hotel or group of hotels. We use ADR to assess pricing levels that we are able to generate by type of customer, as changes in rates have a different effect on overall revenues and incremental profitability than changes in occupancy, as described above.
Revenue per Available Room (“RevPAR”)
We calculate RevPAR by dividing hotel total rooms revenue by rooms available for the period. RevPAR does not include non-room revenues such as food and beverage revenues or other operating department revenues. We consider RevPAR to be a meaningful indicator of our performance as it provides a metric correlated to two primary and key drivers of operations at our hotels: occupancy and ADR. RevPAR is also a useful indicator in measuring performance over comparable periods for comparable hotels. RevPAR changes that are primarily driven by changes in occupancy have different implications for overall revenues and profitability than changes that are driven primarily by changes in ADR. For example, an increase in occupancy at a hotel would lead to additional variable operating costs (including housekeeping services, utilities and room supplies) and could also result in increased other operating department revenue and expense. Changes in ADR typically have a greater impact on operating margins and profitability as they only have a limited effect on variable operating costs.
Funds From Operations (“FFO”) and Adjusted FFO
FFO is a non-GAAP financial measure that reflects net income or loss (calculated in accordance with GAAP), excluding real estate depreciation and amortization, gains (losses) from sales of real estate, impairments of real estate assets, the cumulative effect of changes in accounting principles and adjustments for unconsolidated partnerships and joint ventures. Historical cost accounting for real estate assets implicitly assumes that the value of real estate assets diminishes predictably over time. Since real estate values instead have historically risen or fallen with market conditions, most industry investors consider presentations of operating results for real estate companies that use historical cost accounting to be insufficient by themselves. By excluding the effect of real estate depreciation and amortization, gains (losses) from sales of real estate, and impairments of real estate assets, all of which are based on historical cost accounting and which may be of lesser significance in evaluating current performance, we believe that FFO provides investors a useful supplemental financial measure in evaluating our operating performance.
We further adjust FFO for certain additional items such as hotel property acquisition and pursuit costs, and other expenses we believe do not represent recurring operations. We believe that Adjusted FFO provides investors with another financial measure that may facilitate comparisons of ongoing operating performance between periods and between REITs that make similar adjustments to FFO and is beneficial to investors’ complete understanding of our operating performance.
Please refer to “Non-GAAP Financial Measures” below for a detailed discussion of the Company’s use, definition and limitations of FFO and Adjusted FFO and a reconciliation of FFO and Adjusted FFO to net income (loss), a GAAP measurement. Other companies may define Adjusted FFO differently.
Earnings before Interest Expense, Taxes, Depreciation and Amortization (“EBITDA”) and Adjusted EBITDA
EBITDA is a non-GAAP financial measure that reflects net income or loss (calculated in accordance with GAAP) excluding interest expense, provision for income taxes, and depreciation and amortization. We consider EBITDA useful to investors in evaluating and facilitating comparisons of our operating performance between periods and between REITs by removing the impact of our capital structure (primarily interest expense) and asset base (primarily depreciation and amortization) from our operating results. In addition, EBITDA is used as one measure in determining the value of hotel acquisitions and dispositions.
79
Table of Contents
We further adjust EBITDA for certain additional items such as hotel property acquisitions and pursuit costs, amortization of share-based compensation (if any), and other costs we believe do not represent recurring operations and are not indicative of the performance of our underlying hotel property entities. We believe Adjusted EBITDA provides investors with another financial measure in evaluating and facilitating comparison of operating performance between periods and between REITs that report similar measures.
Please refer to “Non-GAAP Financial Measures” below for a detailed discussion of the Company’s use, definition and limitations of EBITDA, and Adjusted EBITDA and a reconciliation of EBITDA and Adjusted EBITDA to net income (loss), a U.S. generally accepted accounting principles (“GAAP”) measurement. Other companies may define EBITDA and Adjusted EBITDA differently.
Results of Operations for the Years Ended December 31, 2014, 2013 and 2012
At December 31, 2014, 2013 and 2012, we owned 46, 45, and 31 hotels, respectively, the operating activity of which is reflected in continuing operations on the combined consolidated statements of operations. On November 17, 2014, Inland American sold the Suburban Select Service Portfolio for an aggregate gross disposition price of $1.1 billion. This sale reflects a strategic shift and has a major impact on our combined consolidated financial statements; therefore the operations are reflected as discontinued operations on the combined consolidated statements of operations for the years ended December 31, 2014, 2013, and 2012. Based on when a property was acquired, operating results for certain properties are not comparable for the years ended December 31, 2014, 2013 and 2012. Comparable properties are all properties we have owned and operated for the entirety of the periods being compared and that have not sustained substantial damage, business interruption or undergone large scale renovations during the periods being compared or for which comparable results are not available. Hotel operating income represents the difference between total revenues and total hotel operating expenses.
The following are key hotel operating statistics for all properties owned at December 31, 2014, 2013 and 2012, which excludes all properties sold as of December 31, 2014. Hotel operating income and operating income margin include those hotels classified as continuing operations in accordance with Accounting Standards Update (“ASU”) 2014-08, Reporting Discontinued Operations and Disclosures of Disposals of Components of an Entity:
| For the year ended December 31, | ||||||||||
| 2014 | 2013 | 2012 | Variance from 2013 to 2014 |
Variance from 2012 to 2013 | ||||||
| Number of properties |
46 | 45 | 31 | |||||||
| Occupancy (1) |
76.3% | 73.6% | 71.4% | 3.7% | 3.1% | |||||
| Average Daily Rate (ADR) (1) |
$177.62 | $161.95 | $150.79 | 9.7% | 7.4% | |||||
| Revenue Per Available Room (RevPAR) (1) |
$135.46 | $119.13 | $107.72 | 13.7% | 10.6% | |||||
| Hotel operating income (in thousands) (2) |
$324,999 | $221,806 | $157,052 | 46.5% | 41.2% | |||||
| Hotel operating income margin |
35.1% | 34.0% | 33.6% | 110 bps | 40 bps | |||||
| (1) | For hotels acquired during the applicable period, only includes operating statistics since the date of acquisition. Reflects a January 1 to December 31 fiscal calendar year for all hotels, including those operated by Marriott. |
| (2) | Hotel operating income represents the difference between total revenues and total hotel operating expenses. |
80
Table of Contents
The following are key hotel operating statistics for comparable properties owned at December 31, 2014 and 2013:
| For the year ended December 31, | Variance from 2013 to 2014 | |||||
| 2014 | 2013 | |||||
| Number of properties |
31 | 31 | ||||
| Occupancy |
74.2% | 72.7% | 2.1% | |||
| Average Daily Rate (ADR) |
$167.90 | $159.55 | 5.2% | |||
| Revenue Per Available Room (RevPAR) |
$124.57 | $116.06 | 7.3% | |||
| Hotel operating income (in thousands) (1) |
$205,832 | $186,987 | 10.1% | |||
| Hotel operating income margin |
35.4% | 34.8% | 62 bps | |||
| (1) | Hotel operating income represents the difference between total revenues and total hotel operating expenses. |
The following are key hotel operating statistics for comparable properties owned at December 31, 2013 and 2012:
| For the year ended December 31, | Variance from 2012 to 2013 | |||||
| 2013 | 2012 | |||||
| Number of properties |
24 | 24 | ||||
| Occupancy |
73.1% | 71.8% | 1.8% | |||
| Average Daily Rate (ADR) |
$159.60 | $152.20 | 4.9% | |||
| Revenue Per Available Room (RevPAR) |
$116.64 | $109.30 | 6.7% | |||
| Hotel operating income (in thousands) (1) |
$131,234 | $120,623 | 8.8% | |||
| Hotel operating income margin |
37.0% | 35.9% | 111 bps | |||
| (1) | Hotel operating income represents the difference between total revenues and total hotel operating expenses. |
Combined Consolidated Results of Operations
| (in thousands) Year ended December 31, |
||||||||||||
| 2014 | 2013 | 2012 | ||||||||||
| Net income (loss) from continuing operations |
$ | 34,679 | $ | (45,842 | ) | $ | (27,796 | ) | ||||
| Net income (loss) attributable to Company |
$ | 109,799 | $ | (51,468 | ) | $ | (46,146 | ) | ||||
Net income from continuing operations for the year ended December 31, 2014 was $34.7 million compared to a loss from continuing operations of $45.8 million for the year ended December 31, 2013, representing an increase in income of $80.5 million. This performance was primarily due to a $274.8 million, or 42.2% increase in total revenue, partially offset by the net impact of a $171.6 million, or 39.9%, increase in hotel operating expenses, an increase of $20.5 million, or 9.7%, in other operating expenses and an increase of $2.2 million, or 3.8%, in non-operating expenses.
Net loss from continuing operations for the year ended December 31, 2013 was $45.8 million compared to a loss from continuing operations of $27.8 million for the year ended December 31, 2012, representing a decrease in income of $18.0 million. This performance was primarily due to a $185.0 million, or 39.6%, increase in total revenue, partially offset by the net impact of a $120.2 million, or 38.8%, increase in hotel operating expenses, an increase of $77.5 million, or 58.5%, in other operating expenses and an increase of $5.3 million, or 10.1%, in non-operating expenses.
81
Table of Contents
Revenues
Revenues consists of room, food and beverage, and other departmental revenues from our hotels, as follows (in thousands):
| For the year ended December 31, | 2014 Increase from 2013 |
2013 Increase from 2012 |
||||||||||||||||||
| 2014 | 2013 | 2012 | ||||||||||||||||||
| Number of properties |
46 | 45 | 31 | |||||||||||||||||
| Revenues: |
||||||||||||||||||||
| Room revenues |
$ | 631,901 | $ | 443,267 | $ | 323,959 | $ | 188,634 | $ | 119,308 | ||||||||||
| Food and beverage revenues |
235,066 | 168,368 | 116,260 | 66,698 | 52,108 | |||||||||||||||
| Other revenues |
59,699 | 40,236 | 26,661 | 19,463 | 13,575 | |||||||||||||||
|
|
|
|
|
|
|
|
|
|
|
|||||||||||
| Total revenues |
$ | 926,666 | $ | 651,871 | $ | 466,880 | $ | 274,795 | $ | 184,991 | ||||||||||
|
|
|
|
|
|
|
|
|
|
|
|||||||||||
The following are revenues for comparable properties owned at December 31, 2014 and 2013 and December 31, 2013 and 2012 (in thousands):
| For the year ended December 31, | For the year ended December 31, | |||||||||||||||||||||||||||||||
| 2014 | 2013 | Increase | Variance | 2013 | 2012 | Increase | Variance | |||||||||||||||||||||||||
| Number of comparable properties |
31 | 31 | 24 | 24 | ||||||||||||||||||||||||||||
| Revenues: |
||||||||||||||||||||||||||||||||
| Room revenues |
$ | 395,027 | $ | 368,544 | $ | 26,483 | 7.2 | % | $ | 258,311 | $ | 242,024 | $ | 16,287 | 6.7 | % | ||||||||||||||||
| Food and beverage revenues |
150,799 | 136,450 | 14,349 | 10.5 | % | 77,994 | 76,372 | 1,622 | 2.1 | % | ||||||||||||||||||||||
| Other revenues |
35,181 | 32,212 | 2,969 | 9.2 | % | 18,765 | 18,041 | 724 | 4.0 | % | ||||||||||||||||||||||
|
|
|
|
|
|
|
|
|
|
|
|
|
|
|
|
|
|||||||||||||||||
| Total revenues |
$ | 581,007 | $ | 537,206 | $ | 43,801 | 8.2 | % | $ | 355,070 | $ | 336,437 | $ | 18,633 | 5.5 | % | ||||||||||||||||
|
|
|
|
|
|
|
|
|
|
|
|
|
|
|
|
|
|||||||||||||||||
Room revenues
Room revenues increased by $188.6 million to $631.9 million for the year ended December 31, 2014, of which $26.5 million, or 7.2%, was contributed by our comparable properties and $162.1 million was contributed by the non-comparable properties. The increase from our non-comparable properties is primarily a result of 14 hotels acquired during 2013 and one hotel acquired during 2014. The strong overall demand levels generally allowed the comparable properties to reduce lower rated business while more aggressively targeting business segments that were more financially advantageous for their individual hotels. Several of our larger hotels with meeting space had success in the corporate group market, while other hotels experienced significant strength in the transient market. Business demand levels were sufficient to support higher occupancy in conjunction with the robust ADR growth.
On a comparable properties basis, RevPAR increased 7.3%, as a result of a 5.2% increase in ADR from $159.55 to $167.90 and a 2.1% improvement in occupancy from 72.7% to 74.2% for the year ended December 31, 2013 to December 31, 2014, respectively.
Room revenues increased $119.3 million, or 36.8%, to $443.3 million for the year ended December 31, 2013 from $324.0 million for the year ended December 31, 2012. These increases were primarily a result of 14 hotels acquired during the year ended December 31, 2013. The 14 acquired hotels, which are not comparable year-over-year, contributed $59.7 million to the increase in hotel room revenues.
Room revenues on a comparable basis, increased $16.3 million, or 6.7%, to $258.3 million for the year ended December 31, 2013 from $242.0 million for the year ended December 31, 2012. This increase is due primarily to greater group demand in several markets and the completion of hotel renovations by the beginning of 2013. On a
82
Table of Contents
comparable properties basis, RevPAR increased 6.7%, as a result of a 4.9% increase in ADR from $152.20 to $159.60 and a 1.8% improvement in occupancy from 71.8% to 73.1% for the year ended December 31, 2012 to 2013, respectively.
Food and beverage revenues
Food and beverage revenues increased by $66.7 million to $235.1 million for the year ended December 31, 2014, of which $14.3 million, or 10.5%, was contributed by our comparable properties and $52.4 million was contributed by our non-comparable properties. The increase from our non-comparable properties is primarily a result of 14 hotels acquired during 2013 and one hotel acquired during 2014. The increase from our comparable properties is due primarily to higher banquet food and beverage, and ancillary revenues at these properties, as well as continued good performance in their other food and beverage outlets.
Food and beverage revenues increased $52.1 million, or 44.8%, to $168.4 million for the year ended December 31, 2013 from $116.3 million for the year ended December 31, 2012. These increases were primarily a result of 14 hotels acquired during the year ended December 31, 2013.
Food and beverage revenues on a comparable basis, increased $1.6 million, or 2.1%, to $78.0 million for the year ended December 31, 2013 from $76.4 million for the year ended December 31, 2012. This increase is due primarily to higher catering and banquet revenue from group business.
Other revenues
Other revenues increased by $19.5 million to $59.7 million for the year ended December 31, 2014, of which $3.0 million, or 9.2%, was contributed by our comparable properties and $16.5 million was contributed by our non-comparable properties. The increase from our non-comparable properties is primarily a result of 14 hotels acquired during 2013 and one hotel acquired during 2014. The increase from our comparable properties is due primarily to increased ancillary sources such as tenant leases, parking, telephone and other guest services.
Other revenues increased $13.6 million, or 50.9%, to $40.2 million for the year ended December 31, 2013 from $26.7 million for the year ended December 31, 2012 .These increases were primarily a result of 14 hotels acquired during the year ended December 31, 2013.
Other revenues on a comparable basis, increased $0.7 million, or 4.0%, to $18.8 million for the year ended December 31, 2013 from $18.0 million for the year ended December 31, 2012.
Hotel Operating Expenses
Hotel operating expenses consist of the following (in thousands):
| For the year ended December 31, | 2014 Increase from 2013 |
2013 Increase from 2012 |
||||||||||||||||||
| 2014 | 2013 | 2012 | ||||||||||||||||||
| Number of properties |
46 | 45 | 31 | |||||||||||||||||
| Hotel operating expenses: |
||||||||||||||||||||
| Room expenses |
$ | 140,128 | $ | 96,444 | $ | 70,165 | $ | 43,684 | $ | 26,279 | ||||||||||
| Food and beverage expenses |
158,243 | 114,011 | 78,080 | 44,232 | 35,931 | |||||||||||||||
| Other direct expenses |
33,381 | 24,542 | 17,401 | 8,839 | 7,141 | |||||||||||||||
| Other indirect expenses |
217,811 | 157,385 | 117,355 | 60,426 | 40,030 | |||||||||||||||
| Management fees |
52,104 | 37,683 | 26,827 | 14,421 | 10,856 | |||||||||||||||
|
|
|
|
|
|
|
|
|
|
|
|||||||||||
| Total hotel operating expenses |
$ | 601,667 | $ | 430,065 | $ | 309,828 | $ | 171,602 | $ | 120,237 | ||||||||||
|
|
|
|
|
|
|
|
|
|
|
|||||||||||
83
Table of Contents
The following are hotel operating expenses for comparable properties owned at December 31, 2014 and 2013 and December 31, 2013 and 2012 (in thousands):
| For the year ended December 31, | For the year ended December 31, | |||||||||||||||||||||||||||||||
| 2014 | 2013 | Increase | Variance | 2013 | 2012 | Increase | Variance | |||||||||||||||||||||||||
| Number of comparable properties |
31 | 31 | 24 | 24 | ||||||||||||||||||||||||||||
| Hotel operating expenses: |
||||||||||||||||||||||||||||||||
| Room expenses |
$ | 83,237 | $ | 78,046 | $ | 5,191 | 6.7 | % | $ | 54,496 | $ | 51,951 | $ | 2,545 | 4.9 | % | ||||||||||||||||
| Food and beverage expenses |
97,788 | 91,574 | 6,214 | 6.8 | % | 52,497 | 50,962 | 1,535 | 3.0 | % | ||||||||||||||||||||||
| Other direct expenses |
21,455 | 20,608 | 847 | 4.1 | % | 10,811 | 10,762 | 49 | 0.5 | % | ||||||||||||||||||||||
| Other indirect expenses |
136,530 | 128,604 | 7,926 | 6.2 | % | 83,243 | 81,020 | 2,223 | 2.7 | % | ||||||||||||||||||||||
| Management fees |
36,165 | 31,387 | 4,778 | 15.2 | % | 22,789 | 21,119 | 1,670 | 7.9 | % | ||||||||||||||||||||||
|
|
|
|
|
|
|
|
|
|
|
|
|
|
|
|
|
|||||||||||||||||
| Total hotel operating expenses |
$ | 375,175 | $ | 350,219 | $ | 24,956 | 7.1 | % | $ | 223,836 | $ | 215,814 | $ | 8,022 | 3.7 | % | ||||||||||||||||
|
|
|
|
|
|
|
|
|
|
|
|
|
|
|
|
|
|||||||||||||||||
Hotel operating expenses
Hotel operating expenses on a comparable basis increased $25.0 million, or 7.1%, to $375.2 million for the year ended December 31, 2014 from $350.2 million for the year ended December 31, 2013. The hotel operating expenses increase of 7.1% is comparable to total revenues increase of 8.2%. This increase was primarily due to the operating costs associated with additional revenues, which are generated through volume based expenses and revenue based expenses, support costs, specifically sales and marketing, general and administrative and utilities, and increased incentive management fees as a result of higher profits.
Hotel operating expenses on a comparable basis increased $8.0 million, or 3.7% to $223.8 million for the year ended December 31, 2013 from $215.8 million for the year ended December 31, 2012. The hotel operating expenses increase of 3.7% is comparable to total revenues increase of 5.5%. This increase was primarily due to the operating costs associated with additional revenues, which are generated through volume based expenses and revenue based expenses.
Corporate and Other Expenses
Corporate and other expenses consist of the following (in thousands):
| For the year ended December 31, | 2014 Variance to 2013 |
2013 Variance to 2012 |
||||||||||||||||||
| 2014 | 2013 | 2012 | ||||||||||||||||||
| Depreciation and amortization |
$ | 141,807 | $ | 104,229 | $ | 89,629 | $ | 37,578 | $ | 14,600 | ||||||||||
| Real estate taxes, personal property taxes and insurance |
41,802 | 27,548 | 22,382 | 14,254 | 5,166 | |||||||||||||||
| General and administrative expenses |
38,895 | 14,151 | 9,008 | 24,744 | 5,143 | |||||||||||||||
| Business management fees |
1,474 | 12,743 | 10,812 | (11,269 | ) | 1,931 | ||||||||||||||
| Acquisition transaction costs |
1,192 | 2,275 | 751 | (1,083 | ) | 1,524 | ||||||||||||||
| Provision for asset impairments |
5,378 | 49,145 | — | (43,767 | ) | 49,145 | ||||||||||||||
|
|
|
|
|
|
|
|
|
|
|
|||||||||||
| Total corporate and other expenses |
$ | 230,548 | $ | 210,091 | $ | 132,582 | $ | 20,457 | $ | 77,509 | ||||||||||
|
|
|
|
|
|
|
|
|
|
|
|||||||||||
Depreciation and amortization
Depreciation and amortization expense increased $37.6 million, or 36.1%, to $141.8 million for the year ended December 31, 2014 from $104.2 million for the year ended December 31, 2013. The increase was primarily a result of a full year of depreciation recorded in 2014 for 14 hotels acquired in 2013, and one hotel acquired in 2014.
84
Table of Contents
Depreciation and amortization expense increased $14.6 million, or 16.3%, to $104.2 million for the year ended December 31, 2013 from $89.6 million for the year ended December 31, 2012. Properties acquired in 2013 accounted for an increase in depreciation expense of approximately $11.1 million. This $11.1 million increase was partially offset by the full depreciation of properties with five-year assets placed in service during 2007 and early 2008.
Real estate taxes, personal property taxes, and insurance
Real estate taxes, personal property taxes, and insurance expense increased $14.3 million, or 51.7%, to $41.8 million for the year ended December 31, 2014 from $27.5 million for the year ended December 31, 2013. This increase was primarily a result of 14 hotels acquired during the year ended December 31, 2013, and one hotel acquired during the year ended December 31, 2014. In addition, real estate and personal property taxes increased across the remaining portfolio due to increased assessed property values or tax rates at certain properties, offset by refunds from prior year real estate tax appeals.
Real estate taxes, personal property taxes, and insurance expense increased $5.2 million, or 23.1%, to $27.5 million for the year ended December 31, 2013 from $22.4 million for the year ended December 31, 2012. The increase was primarily a result of 14 hotels acquired during the year ended December 31, 2013, partially offset by real estate tax refunds from prior year real estate tax appeals.
General and administrative expenses
General and administrative expenses consist primarily of compensation expense for our corporate staff and personnel supporting our business, contractual performance obligations, office administrative and related expenses and acquisition expenses. In addition, general and administrative expenses include an allocation of costs by Inland American for certain corporate services and other expenses. The allocation includes costs related to corporate overhead expenses, such as payroll costs for certain of Inland American’s employees (accounting, finance, tax, treasury, and legal) and outside professional services.
General and administrative expense increased $24.7 million, or 174.9%, to $38.9 million for the year ended December 31, 2014 from $14.2 million for the year ended December 31, 2013. Costs incurred in 2014 included legal and other professional fees related to Inland American’s Self-Management Transactions on March 12, 2014, increased corporate staffing, costs related to our separation from Inland American and costs related to the preparation of the listing of our common stock on the NYSE.
General and administrative expense increased $5.1 million, or 57.1%, to $14.2 million for the year ended December 31, 2013 from $9.0 million for the year ended December 31, 2012. The increase was primarily a result of increased legal costs and increased consulting and professional fees due to our large amount of transaction activity and the execution of our portfolio strategy.
Business management fee
Business management fee expense decreased $11.3 million, or 88.4%, to $1.5 million for the year ended December 31, 2014 from $12.7 million for the year ended December 31, 2013. On March 12, 2014, Inland American executed the Self-Management Transactions. In connection with the Self-Management Transactions, Inland American agreed with the Business Manager to terminate the management agreement with the Business Manager, hire all of the Business Manager’s employees and acquire the assets or rights necessary to conduct the functions previously performed for Inland American by the Business Manager. The Self-Management Transactions resulted in a final business management fee incurred in January 2014. As a result, we have not been allocated a business management fee after January 2014.
Business management fee expense increased $1.9 million, or 17.9%, to $12.7 million for the year ended December 31, 2013 from $10.8 million for the year ended December 31, 2012. The business management fee is
85
Table of Contents
allocated to us based on average invested assets as of the last day of the immediately preceding quarter. The increase was primarily a result of 14 hotels acquired during the year ended December 31, 2013, which caused our average invested assets to increase.
Acquisition transaction costs
Acquisition transaction costs decreased $1.1 million, or 47.6% to $1.2 million for the year ended December 31, 2014 from $2.3 million for the year ended December 31, 2013. This decrease in acquisition transition costs was due to a decrease in the volume of acquisition activity during the year ended December 31, 2014.
Acquisition transaction costs increased $1.5 million, or 202.9%, to $2.3 million for the year ended December 31, 2013 from $0.8 million for the year ended December 31, 2012. This increase in acquisition transaction costs was due to costs incurred with the purchase of 14 properties during 2013. Typically, acquisition transaction costs consist of legal fees, other professional fees, transfer taxes and other direct costs associated with our pursuit of hotel investments. As a result, these costs vary with our level of ongoing acquisition activity.
Provision for asset impairment
During the year ended December 31, 2014, a provision for asset impairment of $5.4 million was recorded on certain hotels, which were identified to have a reduction in the expected holding period.
During the year ended December 31, 2013, a provision for asset impairment of $49.1 million was recorded on certain hotels, which were identified to have a reduction in the expected holding period.
During the year ended December 31, 2012, there was no asset impairment recorded in continuing operations. A provision for asset impairment of $6.2 million was recorded in discontinued operations.
Results of Non-operating Income and Expenses
Hotel non-operating income and expenses consist of the following (in thousands):
| For the year ended December 31, | 2014 Variance to 2013 |
2013 Variance to 2012 |
||||||||||||||||||
| 2014 | 2013 | 2012 | ||||||||||||||||||
| Gain (loss) on sale of investment properties |
$ | 693 | $ | — | $ | (589 | ) | $ | 693 | $ | 589 | |||||||||
| Other (loss) income |
(1,389 | ) | (1,113 | ) | 798 | (276 | ) | (1,911 | ) | |||||||||||
| Interest expense |
(57,427 | ) | (52,792 | ) | (45,061 | ) | 4,635 | 7,731 | ||||||||||||
| Equity in earnings (loss) and gain (loss) and impairment of investment in unconsolidated entities, net |
4,216 | (33 | ) | (3,719 | ) | 4,249 | 3,686 | |||||||||||||
| Income tax expense |
(5,865 | ) | (3,619 | ) | (3,695 | ) | 2,246 | (76 | ) | |||||||||||
| Net income (loss) from discontinued operations |
75,120 | (5,626 | ) | (12,661 | ) | 80,746 | 7,035 | |||||||||||||
Interest expense
Interest expense increased $4.6 million, to $57.4 million for the year ended December 31, 2014 from $52.8 million for the year ended December 31, 2013. The increase in interest expense was primarily a result of an increase in debt to $1,295.0 million as of December 31, 2014 from $1,280.2 million as of December 31, 2013.
Interest expense increased $7.7 million to $52.8 million for the year ended December 31, 2013 from $45.1 million for the year ended December 31, 2012. The increase in interest expense was primarily a result of an increase in debt to $1,280.2 million as of December 31, 2013 from $1,011.4 million as of December 31, 2012. This increase was the result of debt incurred in connection with our acquisition of 14 hotels and a $88.6 million allocation of Inland American’s unsecured credit facility.
86
Table of Contents
Equity in earnings (loss) and gain (loss) and (impairment) of investment in unconsolidated entities
Equity in earnings (loss) of investment in unconsolidated entities increased $4.2 million to a gain of $4.2 million from a loss of $0.03 million from the year ended December 31, 2013 to 2014 mainly due to the Company’s purchase of its partners’ interest in one joint venture, which resulted in a $4.5 million gain on the purchase of this investment.
Equity in earnings (loss) of investment in unconsolidated entities increased $3.7 million to a loss of $0.03 million from a loss of $3.7 million from the year ended December 31, 2013 to 2012. During the year ended December 31, 2013, we impaired one joint venture by $1.0 million. The impairment was offset by a gain on the sale of another hotel joint venture of $0.5 million. During the year ended December 31, 2012, we sold a joint venture and incurred a loss of $1.4 million. Additionally, in the same year, we impaired another joint venture by $2.5 million.
Income tax expense
Income tax expense increased $2.2 million to $5.9 million for the year ended December 31, 2014 from $3.6 million for the year ended December 31, 2013. The increase was mainly due to one-time tax expenses related to organizational re-structuring of our TRS leases.
Income tax expense decreased $0.1 million to $3.6 million for the year ended December 31, 2013 from $3.7 million for the year ended December 31, 2012. The decrease was primarily due to an increase in tax deductions for the year ended December 31, 2013, which was partially offset by increased income due to additional hotels.
Net income (loss) from discontinued operations
Net income (loss) from discontinued operations increased by $80.7 million to income of $75.1 million for the year ended December 31, 2014 from a loss of $5.6 million for the year ended December 31, 2013. The increase was mainly due to the sale of the Suburban Select Service Portfolio in 2014. The operations of these properties were reflected as discontinued operations and resulted in net income of $75.1 million, including a gain on sale of $135.7 million.
Net loss from discontinued operations decreased $7.0 million to a loss of $5.6 million for the year ended December 31, 2013 from a loss of $12.7 million for the year ended December 31, 2012. There were three hotels sold in 2013 for a total of $19.8 million compared to 13 hotels sold in 2012 for a total of $131.5 million. The three hotels sold in 2013 recorded a gain on sale of approximately $1.6 million while the 13 properties sold in 2012 generated a gain on sale of approximately $7.0 million. Additionally, the Suburban Select Service Portfolio held for sale and reported as discontinued operations recorded a loss of $7.2 million in 2013 while a loss of $22.1 million was recorded in 2012.
Critical Accounting Policies and Estimates
General
The preparation of combined consolidated financial statements in conformity with U.S. GAAP requires management to make estimates and assumptions that affect the reported amount of assets and liabilities at the date of our financial statements and the reported amounts of revenues and expenses during the reporting period. We consider the following policies critical because they require estimates about matters that are inherently uncertain, involve various assumptions, require management judgment, and because they are important for understanding and evaluating our reported financial results. As a result, these accounting policies could materially affect our financial position, results of operations and related disclosures. We evaluate our estimates, assumptions and judgments on an ongoing basis, based on information that is then available to us, our historical experiences and various matters that we believe are reasonable and appropriate for consideration under the
87
Table of Contents
circumstances. Actual results may differ significantly from these estimates due to changes in judgments, assumptions and conditions as a result of unforeseen events or otherwise, which could have a material impact on financial position or results of operations.
Investment in Hotel Properties
Upon acquisition, we allocate the purchase price of our hotel properties based on the fair value of the acquired land, land improvements, building, furniture, fixtures and equipment and identifiable intangible assets or liabilities. Identifiable intangible assets or liabilities typically arise from contractual arrangements assumed in connection with the transaction, including terms that are above or below market compared to an estimated market agreement at the acquisition date. Any additional amounts are allocated to goodwill as required, based on the remaining purchase price in excess of the fair value of the tangible and intangible assets acquired and liabilities assumed. The allocation of the purchase price to elements of our acquired hotel properties is an area that requires judgment and significant estimates. We expense acquisition costs as incurred. All costs related to finding, analyzing and negotiating a transaction are expensed as incurred as a general and administrative expense, whether or not the acquisition is completed.
Cost Capitalization and Depreciation/Amortization Policies
Our investments in hotel properties are carried at cost and depreciated using the straight-line method over estimated useful lives of 30 years for buildings and improvements, and 5 to 15 years for site improvements and furniture, fixtures and equipment. Intangible assets arising from contractual arrangements are typically amortized over the life of the contract. Renovations, improvements and/or replacements at the hotel properties that improve or extend the life of the assets are capitalized and depreciated over their estimated useful lives, while repairs and maintenance are expensed as incurred. Furniture, fixtures and equipment under capital leases are carried at the present value of the minimum lease payments. Cost capitalization and the estimate of useful lives requires us to make subjective assessments of our properties for the purposes of determining the amount of depreciation expense to reflect each year with respect to the assets. These assessments may impact our results of operations.
Dispositions and Assets Held for Sale
The Company accounts for dispositions in accordance with Financial Accounting Standards Board (“FASB”) Accounting Standards Codification (“ASC”) 360-20, Real Estate Sales. The Company recognizes gain in full when real estate is sold, provided (a) the profit is determinable, that is, the collectability of the sales price is reasonably assured or the amount that will not be collectible can be estimated, and (b) the earnings process is virtually complete, that is, the seller is not obliged to perform significant activities after the sale to earn the profit. The Company recorded certain transactions as discontinued operations for years ended December 31, 2014, 2013 and 2012 in accordance with FASB ASC 205-20, Presentation of Financial Statements-Discontinued Operations.
In April 2014, the FASB issued ASU 2014-08, Reporting Discontinued Operations and Disclosures of Disposals of Components of an Entity, which includes amendments that change the requirements for reporting discontinued operations and require additional disclosures about discontinued operations. Under the new guidance, only disposals representing a strategic shift that has (or will have) a major effect on the entity’s results and operations would qualify as discontinued operations. In addition, ASU 2014-08 expands the disclosure requirements for disposals that meet the definition of a discontinued operation and requires entities to disclose information about disposals of individually significant components that do not meet the definition of discontinued operations. ASU 2014-08 is effective for interim and annual reporting periods in fiscal years that begin after December 15, 2014. We have elected to early adopt ASU 2014-08, effective January 1, 2014. For the year ended December 31, 2014, the operations reflected in discontinued operations are only related to the Suburban Select Service Portfolio classified as discontinued operations at December 31, 2013. All other asset disposals are now included as a component of income from continuing operations.
88
Table of Contents
We will classify a hotel as held for sale when a binding agreement to purchase the property has been signed under which the buyer has committed a significant amount of nonrefundable cash, no significant financing contingencies exist, and the sale is expected to close within one year. If these criteria are met, we will suspend depreciation and amortization of the hotel property and an impairment loss (if any), will be recognized if the fair value less costs to sell is lower than the carrying amount of the hotel. We will classify the loss, together with the related operating results, as discontinued operations on the statements of operations (if the sale represents a strategic shift and has, or will have, a major effect on the entity’s results and operations) and classify the assets and related liabilities as held for sale on the balance sheet.
On September 17, 2014, Inland American entered into a definitive asset purchase agreement to sell the Suburban Select Service Portfolio consisting of 6,976 rooms to unaffiliated third party purchasers for approximately $1.1 billion, which closed on November 17, 2014. In line with the Company’s early adoption of the new accounting standard governing discontinued operations, the Company believes this sale represents a strategic shift that has (or will have) a major effect on the Company’s results and operations, and qualifies as discontinued operations. These hotels have been classified as held for sale on the combined consolidated balance sheet as of December 31, 2013.
Impairment
We review our investments in hotel properties for possible impairment whenever events or changes in circumstances indicate that the carrying value of the hotel properties may not be recoverable. Events or circumstances that may cause a review include, but are not limited to, when a hotel property experiences a current or projected loss from operations, when it becomes more likely than not that a hotel property will be sold before the end of its useful life, adverse changes in the demand for lodging at the properties due to declining national or local economic conditions and/or new hotel construction in markets where the hotels are located. When such conditions exist, we perform an analysis to determine if the estimated undiscounted future cash flows from operations and the proceeds from the ultimate disposition of a hotel exceed its carrying value. If it is determined that the estimated undiscounted future cash flows are less than the carrying amount of the asset, an adjustment to reduce the carrying amount to the related hotel’s estimated fair market value is recorded and an impairment loss recognized. In the evaluation of impairment of our hotel properties, we make many assumptions and estimates including projected cash flows both from operations and eventual disposition, expected useful life and holding period, future required capital expenditures, and fair values, including consideration of capitalization rates, discount rates, and comparable selling prices. The valuation and possible subsequent impairment of investment properties is a significant estimate that can and does change based on our continuous process of analyzing each property and reviewing assumptions about uncertain inherent factors, as well as the economic condition of the property at a particular point in time.
Revenue Recognition
Revenue consists of amounts derived from hotel operations, including the sales of rooms, food and beverage and other ancillary amenities. Revenue is recognized when rooms are occupied and services have been rendered. Cash received prior to guest arrival is recorded as an advance deposit from the guest and recognized as revenue at the time of occupancy. Sales, use, occupancy, and similar taxes are collected and presented on a net basis (excluded from revenues) in the accompanying combined consolidated statements of operations. For retail operations, revenue is recognized on a straight-line basis over the lives of the retail leases. These revenue sources are affected by conditions impacting the travel and hospitality industry as well as competition from other hotels and businesses in similar markets.
In May 2014, the FASB issued ASU 2014-09, Revenue from Contracts with Customers, which requires an entity to recognize the amount of revenue to which it expects to be entitled for the transfer of promised goods or services to customers. The ASU will replace most existing revenue recognition guidance in GAAP when it becomes effective. The new standard is effective for the Company on January 1, 2017. Early application is not permitted. The standard permits the use of either the retrospective or cumulative effect transition method. The
89
Table of Contents
Company is evaluating the effect that ASU 2014-09 will have on its combined consolidated financial statements and related disclosures. The Company has not yet selected a transition method nor has it determined the effect of the standard on its ongoing financial reporting.
Consolidation
We evaluate our investments in limited liability companies and partnerships to determine whether such entities may be a variable interest entity (“VIE”). If the entity is a VIE, the determination of whether we are the primary beneficiary must be made. We will consolidate a VIE if we are deemed to be the primary beneficiary, as defined in FASB ASC 810, Consolidation. The equity method of accounting is applied to entities in which we are not the primary beneficiary as defined FASB ASC 810, or the entity is not a VIE and we do not have effective control, but can exercise influence over the entity with respect to its operations and major decisions.
Income Taxes
We intend to elect to be taxed as a REIT under Sections 856 through 860 of the Code and have operated as such beginning with our taxable year that commenced on January 5, 2015. To qualify as a REIT, we must meet certain organizational and operational requirements, including a requirement to distribute at least 90% of our annual REIT taxable income to our stockholders (which is computed without regard to the dividends paid deduction or net capital gain and which does not necessarily equal net income as calculated in accordance with U.S. GAAP). As a REIT, we generally will not be subject to U.S. federal income tax to the extent we distribute qualifying dividends to our stockholders. If we fail to qualify as a REIT in any taxable year, we will be subject to U.S. federal income tax on our taxable income at regular corporate income tax rates and generally will not be permitted to qualify for treatment as a REIT for U.S. federal income tax purposes for the four taxable years following the year during which qualification is lost unless the IRS grants us relief under certain statutory provisions. Such an event could materially adversely affect our net income and net cash available for distribution to stockholders. However, we intend to organize and operate in such a manner as to qualify for treatment as a REIT. Even if we qualify for taxation as a REIT for U.S. federal income tax purposes, we may still be subject to state and local taxes on our income, assets or net worth, and to federal income and excise taxes on our undistributed income. Additionally, any income earned through TRS is subject to federal, state and local corporate income taxes. Our TRS owns our TRS lessees, which lease our hotels from us and have engaged third party hotel managers to manage our hotels on market terms. Our TRS will pay U.S. federal, state and local income tax on the income (net of lease payment to us, third party management fees and other expenses) from the operations of our hotels.
Non-GAAP Financial Measures
We consider the following non-GAAP financial measures useful to investors as key supplemental measures of our operating performance: FFO, Adjusted FFO, EBITDA, and Adjusted EBITDA. These non-GAAP financial measures should be considered along with, but not as alternatives to, net income or loss, operating profit, cash from operations, or any other operating performance measure as prescribed per GAAP.
Funds From Operations
We calculate FFO in accordance with standards established by the National Association of Real Estate Investment Trusts (NAREIT), which defines FFO as net income or loss (calculated in accordance with GAAP), excluding real estate-related depreciation, amortization and impairment, gains (losses) from sales of real estate, the cumulative effect of changes in accounting principles, adjustments for unconsolidated partnerships and joint ventures, and items classified by GAAP as extraordinary. Historical cost accounting for real estate assets implicitly assumes that the value of real estate assets diminishes predictably over time. Since real estate values instead have historically risen or fallen with market conditions, most industry investors consider presentations of operating results for real estate companies that use historical cost accounting to be insufficient by themselves. We believe that the presentation of FFO provides useful supplemental information to investors regarding our
90
Table of Contents
operating performance by excluding the effect of real estate depreciation and amortization, gains (losses) from sales for real estate, impairments of real estate assets extraordinary items and the portion of items related to unconsolidated entities, all of which are based on historical cost accounting and which may be of lesser significance in evaluating current performance. We believe that the presentation of FFO can facilitate comparisons of operating performance between periods and between REITs, even though FFO does not represent an amount that accrues directly to common stockholders. Our calculation of FFO may not be comparable to measures calculated by other companies who do not use the NAREIT definition of FFO or do not calculate FFO per diluted share in accordance with NAREIT guidance. Additionally, FFO may not be helpful when comparing us to non-REITs.
We further adjust FFO for certain additional items that are not in NAREIT’s definition of FFO such as hotel property acquisition and pursuit costs, amortization of share-based compensation (if any), and other expenses we believe do not represent recurring operations. We believe that Adjusted FFO provides investors with useful supplemental information that may facilitate comparisons of ongoing operating performance between periods and between REITs that make similar adjustments to FFO and is beneficial to investors’ complete understanding of our operating performance.
The following is a reconciliation of our GAAP net income (loss) to FFO and Adjusted FFO for the years ended December 31, 2014, 2013, and 2012 (in thousands):
| Combined Consolidated | ||||||||||||||||
| 2014 Pro Forma |
For the year ended December 31, 2014 |
For the year ended December 31, 2013 |
For the year ended December 31, 2012 |
|||||||||||||
| Net (loss) income attributable to Company |
$ | 44,421 | $ | 109,799 | $ | (51,468 | ) | $ | (46,146 | ) | ||||||
| Depreciation and amortization related to investment properties |
142,398 | 177,671 | 154,861 | 155,777 | ||||||||||||
| Depreciation and amortization related to investment in unconsolidated entities |
— | 100 | 821 | 1,602 | ||||||||||||
| Impairment of investment properties |
— | 5,378 | 49,145 | — | ||||||||||||
| Impairment of investment properties reflected in discontinued operations |
— | — | — | 6,224 | ||||||||||||
| Impairment of investment in unconsolidated entities |
— | — | 1,003 | 2,465 | ||||||||||||
| Gain on sale of investment properties |
— | (136,385 | ) | (1,564 | ) | (6,367 | ) | |||||||||
| Loss (gain) from sale of investment in unconsolidated entities |
— | (4,509 | ) | (487 | ) | 1,402 | ||||||||||
|
|
|
|
|
|
|
|
|
|||||||||
| Funds from operations |
$ | 186,819 | $ | 152,054 | $ | 152,311 | $ | 114,957 | ||||||||
| Reconciliation to Adjusted FFO |
||||||||||||||||
| Loss (gain) on extinguishment of debt |
$ | 113 | $ | 67,105 | $ | 20 | $ | (4,178 | ) | |||||||
| Acquisition and pursuit costs |
— | 1,194 | 2,371 | 1,116 | ||||||||||||
| Amortization of mark to market debt discounts or premium, net |
3,700 | 4,461 | 4,360 | 4,276 | ||||||||||||
| Amortization of share-based compensation expense |
4,671 | — | — | — | ||||||||||||
| Other Expenses (1) |
5,812 | |||||||||||||||
|
|
|
|
|
|
|
|
|
|||||||||
| Adjusted FFO |
$ | 201,115 | $ | 224,814 | $ | 159,062 | $ | 116,171 | ||||||||
|
|
|
|
|
|
|
|
|
|||||||||
| (1) | Other expenses includes non-recurring expenses associated with the transition to a publicly-traded stand-alone company and costs related to lender consents required to effectuate the spin-off from Inland American. |
91
Table of Contents
Earnings Before Interest, Taxes, Depreciation and Amortization
EBITDA is a commonly used measure of performance in many industries and is defined as net income or loss (calculated in accordance with GAAP) excluding interest expense, provision for income taxes (including income taxes applicable to sale of assets) and depreciation and amortization. We consider EBITDA useful to an investor regarding our results of operations, in evaluating and facilitating comparisons of our operating performance between periods and between REITs by removing the impact of our capital structure (primarily interest expense) and asset base (primarily depreciation and amortization) from our operating results, even though EBITDA does not represent an amount that accrues directly to common stockholders. In addition, EBITDA is used as one measure in determining the value of hotel acquisitions and dispositions and along with FFO and Adjusted FFO, it is used by management in the annual budget process for compensation programs.
We further adjust EBITDA for certain additional items such as hotel property acquisitions and pursuit costs, amortization of share-based compensation (if any), equity investment adjustments, the cumulative effect of changes in accounting principles, impairment of real estate assets and other costs we believe do not represent recurring operations and are not indicative of the performance of our underlying hotel property entities. We believe Adjusted EBITDA provides investors with another financial measure in evaluating and facilitating comparison of operating performance between periods and between REITs that report similar measures.
The following is reconciliation of net income (loss) to EBITDA and Adjusted EBITDA for the years ended December 31, 2014, 2013, and 2012 (in thousands):
| Combined Consolidated | ||||||||||||||||
| 2014 Pro Forma |
For the year ended December 31, 2014 |
For the year ended December 31, 2013 |
For the year ended December 31, 2012 |
|||||||||||||
| Net income (loss) attributable to Company |
$ | 44,421 | $ | 109,799 | $ | (51,468 | ) | $ | (46,146 | ) | ||||||
| Interest expense |
51,565 | 85,724 | 85,701 | 82,986 | ||||||||||||
| Equity in interest expense of joint venture |
— | 31 | 311 | 990 | ||||||||||||
| Income tax expense |
5,865 | 10,433 | 3,043 | 5,718 | ||||||||||||
| Depreciation and amortization related to investment properties |
142,398 | 177,671 | 154,861 | 155,777 | ||||||||||||
| Depreciation and amortization related to investment in unconsolidated entities |
— | 100 | 821 | 1,602 | ||||||||||||
|
|
|
|
|
|
|
|
|
|||||||||
| EBITDA |
$ | 244,249 | $ | 383,758 | $ | 193,269 | $ | 200,927 | ||||||||
| Reconciliation to Adjusted EBITDA |
||||||||||||||||
| Impairment of investment properties |
— | 5,378 | 49,145 | — | ||||||||||||
| Impairment of investment properties reflected in discontinued operations |
— | — | — | 6,224 | ||||||||||||
| Impairment of investment in unconsolidated entities |
— | — | 1,003 | 2,465 | ||||||||||||
| Gain on sale of investment properties |
— | (136,385 | ) | (1,564 | ) | (6,367 | ) | |||||||||
| Loss (gain) on extinguishment of debt |
113 | 67,105 | 20 | (4,178 | ) | |||||||||||
| (Gain) loss from sale of investment in unconsolidated entities |
— | (4,509 | ) | (487 | ) | 1,402 | ||||||||||
| Acquisition and pursuit costs |
— | 1,194 | 2,371 | 1,116 | ||||||||||||
| Amortization of share-based compensation expense |
4,671 | — | — | — | ||||||||||||
| Other Expenses (1) |
5,812 | — | — | — | ||||||||||||
|
|
|
|
|
|
|
|
|
|||||||||
| Adjusted EBITDA |
$ | 254,845 | $ | 316,541 | $ | 243,757 | $ | 201,589 | ||||||||
|
|
|
|
|
|
|
|
|
|||||||||
| (1) | Other expenses includes non-recurring expenses associated with the transition to a publicly-traded stand-alone company and costs related to lender consents required to effectuate the spin-off from Inland American. |
92
Table of Contents
Use and Limitations of Non-GAAP Financial Measures
FFO, Adjusted FFO, EBITDA and Adjusted EBITDA do not represent cash generated from operating activities under GAAP and should not be considered as alternatives to net income or loss, operating profit, cash flows from operations or any other operating performance measure prescribed by GAAP. Although we present and use FFO, Adjusted FFO, EBITDA and Adjusted EBITDA because we believe they are useful to investors in evaluating and facilitating comparisons of our operating performance between periods and between REITs that report similar measures, the use of these non-GAAP measures has certain limitations as analytical tools. These non-GAAP financial measures are not measures of our liquidity, nor are they indicative of funds available to fund our cash needs, including our ability to fund capital expenditures, contractual commitments, working capital, service debt or make cash distributions. These measurements do not reflect cash expenditures for long-term assets and other items that we have incurred and will incur. These non-GAAP financial measures may include funds that may not be available for management’s discretionary use due to functional requirements to conserve funds for capital expenditures, property acquisitions, and other commitments and uncertainties. These non-GAAP financial measures as presented may not be comparable to non-GAAP financial measures as calculated by other real estate companies.
We compensate for these limitations by separately considering the impact of these excluded items to the extent they are material to operating decisions or assessments of our operating performance. Our reconciliations to the most comparable GAAP financial measures, and our combined consolidated statements of operations and cash flows, include interest expense, capital expenditures and other excluded items, all of which should be considered when evaluating our performance, as well as the usefulness of our non-GAAP financial measures. These non-GAAP financial measures reflect additional ways of viewing our operations that we believe, when viewed with our GAAP results and the reconciliations to the corresponding GAAP financial measures, provide a more complete understanding of factors and trends affecting our business than could be obtained absent this disclosure. We strongly encourage investors to review our financial information in its entirety and not to rely on a single financial measure.
Liquidity and Capital Resources
As of December 31, 2014, we had $163.1 million of combined consolidated cash and cash equivalents, and $87.3 million of restricted cash and escrows. Restricted cash and escrows primarily consist of cash held in restricted escrows of $10.2 million and lodging furniture, fixtures and equipment reserves of $76.3 million.
Our known short-term liquidity requirements primarily consist of funds necessary to pay for operating expenses, corporate expenses and other expenditures, including property capital expenditures, interest and principal payments on our current indebtedness and dividends on our common stock. Our capital expenditures mainly consist of improvements to hotels, a portion of which is reserved for in restricted escrows. We expect to meet our short term liquidity requirements from cash, cash flow from operations and borrowings under our unsecured revolving credit facility entered into in February 2015.
We finance our business activities primarily with existing cash and cash generated from our operations. The objectives of our cash management policy are to maintain the availability of liquidity and minimize operational costs. Further, we have an investment policy that is focused on the preservation of capital and maximizing the return on new and existing investments.
On a long term basis, our objectives are to maximize revenue and profits generated by our existing properties and acquired hotels, to further enhance the value of our portfolio that produces attractive current yield, and to generate sustainable and predictable cash flow from our operations to distribute to our stockholders. To the extent we are able to successfully improve the performance of our portfolio, we believe this will result in increased operating cash flows. Additionally, we may meet our long-term liquidity requirements through additional borrowings and/or proceeds from the sales of hotels.
93
Table of Contents
On February 4, 2015, in conjunction with the listing of our common stock on the NYSE, the Company commenced a modified “Dutch Auction” self-tender offer (the “Tender Offer”) to purchase for cash up to $125 million in value of shares of the Company’s common stock at a price not greater than $21.00 nor less than $19.00 per share, net to the seller in cash, less any applicable withholding of taxes and without interest. The Tender Offer expired at 5:00 P.M., New York City Time, on March 5, 2015. As a result of the Tender Offer, the Company accepted for purchase 1,759,344 shares of its common stock at a purchase price of $21.00 per share, for an aggregate purchase price of $36.9 million (excluding fees and expenses relating to the Tender Offer), which was funded from cash on hand. The 1,759,344 shares of common stock accepted for purchase in the Tender Offer represent approximately 1.6% of the Company’s common stock outstanding as of February 3, 2015, the last day prior to the commencement of the Tender Offer. Stockholders who properly tendered and did not properly withdraw shares of common stock in the Tender Offer at or below the final purchase price of $21.00 per share had all of their tendered shares of common stock purchased by the Company at $21.00 per share. Following completion of the Tender Offer, the Company had approximately 111,664,641 shares of common stock outstanding.
We anticipate making regular quarterly distributions to our stockholders. On March 13, 2015, our board of directors declared a pro rata initial dividend of $0.1457 per share, payable on April 15, 2015 to stockholders of record as of March 31, 2015 with respect to the period beginning February 3, 2015, the completion of our separation from Inland American, through March 31, 2015 based on a dividend of $0.23 per share for a full quarter. On an annualized basis, this would be $0.92 per share of common stock. We expect that the cash required to fund our dividends will be covered by cash generated by operations.
We may, from time to time, seek to retire or purchase additional amounts of our outstanding equity through cash purchases and/or exchanges for other securities, in open market purchases, privately negotiated transactions or otherwise, including pursuant to a Rule 10b5-1 plan. Such repurchases or exchanges, if any, will depend on prevailing market conditions, our liquidity requirements, contractual restrictions and other factors. The amounts involved may be material.
Credit Facility
Effective February 3, 2015, we entered into a $400 million unsecured revolving credit facility with a syndicate of banks. The revolving credit facility includes an uncommitted accordion feature which, subject to certain conditions, allows us to increase the aggregate availability by up to $350 million. We expect borrowings under the revolving credit facility to bear interest based on LIBOR plus a margin ranging from 1.50% to 2.45% (or, at our election upon achievement of an investment grade rating from Moody’s Investor Services, Inc. or Standard & Poor’s Rating Services, interest based on LIBOR plus a margin ranging from 0.875% to 1.50%). In addition, until such election, we expect to pay an unused fee of up to 0.30% of the unused portion of the credit facility based on the average daily unused portion of the credit facility; thereafter, we expect to pay a facility fee ranging between 0.125% and 0.35% based on the Company’s debt rating.
94
Table of Contents
Borrowings
The table below presents, on a combined consolidated basis, the principal amount, weighted average interest rates and maturity date (by year) on our mortgage debt (dollar amounts are stated in thousands):(1)
| 2015 | 2016 | 2017 | 2018 | 2019 | Thereafter | Total | ||||||||||||||||||||||
| Maturing mortgage debt : |
||||||||||||||||||||||||||||
| Fixed rate debt (mortgage loans) |
$ | 55,859 | $ | 323,124 | $ | 197,830 | $ | 27,775 | $ | — | $ | 17,108 | $ | 621,696 | ||||||||||||||
| Variable rate debt (mortgage loans) (1) |
35,091 | 26,315 | — | 169,672 | 326,700 | 21,214 | 578,992 | |||||||||||||||||||||
|
|
|
|
|
|
|
|
|
|
|
|
|
|
|
|||||||||||||||
| Total mortgage debt (2) |
$ | 90,950 | $ | 349,439 | $ | 197,830 | $ | 197,447 | $ | 326,700 | $ | 38,322 | $ | 1,200,688 | ||||||||||||||
|
|
|
|
|
|
|
|
|
|
|
|
|
|
|
|||||||||||||||
| Weighted average interest rate on debt: |
||||||||||||||||||||||||||||
| Fixed rate debt (mortgage loans) |
5.45 | % | 5.35 | % | 5.18 | % | 6.46 | % | — | % | 3.85 | % | 5.31 | % | ||||||||||||||
| Variable rate debt (mortgage loans) |
2.50 | % | 3.67 | % | — | % | 2.30 | % | 2.52 | % | 2.50 | % | 2.51 | % | ||||||||||||||
| (1) | Debt maturing in 2015 was extended to mature in 2016 and debt maturing in 2016 was paid off on March 2, 2015. |
| (2) | Not included in the above is Xenia’s $96.0 million allocated portion of Inland American’s unsecured credit facility. As of February 3, 2015, we no longer have an allocated portion of the unsecured credit facility. |
The debt maturity excludes mortgage discounts associated with debt assumed at acquisition of which a discount of $1.7 million, net of accumulated amortization, is outstanding as of December 31, 2014. Of the total outstanding debt, approximately $31.3 million is recourse to us.
As of December 31, 2014, we had $91.0 million of mortgage debt maturing through the remainder of 2015, and $349.4 million of mortgage debt maturing in 2016. On March 2, 2015, we paid $26.3 million to retire one mortgage loan and extended the maturity on one mortgage loan totaling $34.9 million by two years.
We currently anticipate that we will be able to repay or refinance all of our debt on a timely basis, and believe we have adequate sources of funds to meet our short term cash needs. However, there can be no assurance that we can obtain such refinancing on satisfactory terms. Volatility in the capital markets could expose us to the risk of not being able to borrow on terms and conditions acceptable to us for future acquisitions or refinancings.
Some of the mortgage loans require compliance with certain covenants, such as debt service ratios, investment restrictions and distribution limitations. As of December 31, 2014, the Company was in compliance with all such covenants, with the potential exception of one hotel which was closed during the fourth quarter due to earthquake damage and reopened in January 2015.
Mortgage loans outstanding as of December 31, 2014 and 2013 were $1.2 billion and $1.7 billion, respectively, and had a weighted average interest rate of 3.96% and 4.73% per annum, respectively. For the years ended December 31, 2014 and 2013, we borrowed approximately $122.9 million and $352.2 million, respectively, secured by mortgages on our properties and assumed $0.0 million and $(15.1) million, respectively, of debt at acquisition.
In May 2013, Inland American entered into an unsecured credit facility in the aggregate amount of $500 million. The credit facility consists of a $300 million unsecured revolving line of credit and the total outstanding term loan is $200 million. The unsecured revolving line of credit matures on May 7, 2016 and the unsecured term loan matures on May 7, 2017. The unsecured credit facility is supported by a pool of unencumbered assets. To the extent the Company’s assets were included within the pool of unencumbered assets, the Company was allocated a portion of the unsecured credit facility. As of December 31, 2014, the Company’s allocated portion of the senior unsecured credit facility was $96.0 million. As of December 31, 2014 there were no outstanding balances on the revolving line of credit and the interest rate of the unsecured term loan was 1.67%. As of February 3, 2015, we no longer have an allocated portion of Inland American’s unsecured credit facility.
95
Table of Contents
Debt as of December 31, 2014 and December 31, 2013 consisted of the following (dollars in thousands):
| Proforma (a) Balance Outstanding as of |
Balance Outstanding as of | |||||||||||||||||||||
| Rate Type (b) |
Rate | Fully Extended Maturity Date (c) |
December 31, 2014 |
Maturity Date |
December 31, 2014 |
December 31, 2013 |
||||||||||||||||
| Mortgage Loans |
||||||||||||||||||||||
| Hilton Garden Inn Washington DC Downtown |
Fixed | 5.450 | % | October 2015 | $ | 55,859 | 10/11/15 | $ | 55,859 | $ | 57,101 | |||||||||||
| Hilton Garden Inn Chicago North Shore/Evanston |
Fixed | 5.939 | % | June 2016 | 18,777 | 06/01/16 | 18,777 | 19,040 | ||||||||||||||
| Fairmont Dallas |
Variable | 2.671 | % | April 2019 | 56,892 | 04/10/18 | 56,892 | 41,879 | ||||||||||||||
| Grand Bohemian Hotel Orlando |
Fixed | 5.820 | % | October 2016 | 50,298 | 10/01/16 | 50,298 | 51,115 | ||||||||||||||
| Marriott Woodlands Waterway Hotel & Convention Center |
Fixed | 4.500 | % | December 2016 | 74,049 | 12/01/16 | 74,049 | 75,313 | ||||||||||||||
| Renaissance Atlanta Waverly Hotel & Convention Center |
Fixed | 5.503 | % | December 2016 | 97,000 | 12/06/16 | 97,000 | 97,000 | ||||||||||||||
| Renaissance Austin Hotel |
Fixed | 5.507 | % | December 2016 | 83,000 | 12/08/16 | 83,000 | 83,000 | ||||||||||||||
| Hyatt Regency Orange County |
Fixed | 5.250 | % | January 2017 | 63,035 | 01/03/17 | 63,035 | 64,254 | ||||||||||||||
| Residence Inn Boston Cambridge |
Fixed | 5.500 | % | February 2017 | 30,674 | 02/01/17 | 30,674 | 31,153 | ||||||||||||||
| Courtyard Pittsburgh Downtown |
Fixed | 4.000 | % | March 2017 | 23,261 | 03/01/17 | 23,261 | 23,851 | ||||||||||||||
| Hampton Inn & Suites Denver Downtown |
Fixed | 5.250 | % | March 2017 | 13,625 | 03/01/17 | 13,625 | 13,886 | ||||||||||||||
| Marriott Griffin Gate Resort & Spa |
Variable | 2.671 | % | March 2017 | 35,091 | 03/23/15 | 35,091 | 35,712 | ||||||||||||||
| Marriott San Francisco Airport Waterfront |
Fixed | 5.400 | % | April 2017 | 53,585 | 04/01/17 | 53,585 | 54,373 | ||||||||||||||
| Courtyard Birmingham Downtown at UAB |
Fixed | 5.250 | % | April 2017 | 13,650 | 04/01/17 | 13,650 | 13,909 | ||||||||||||||
| Bohemian Hotel Savannah Riverfront |
Variable | 2.521 | % | August 2018 | 27,480 | 12/17/18 | 27,480 | 27,480 | ||||||||||||||
| Hilton University of Florida Conference Center Gainesville |
Fixed | 6.455 | % | February 2018 | 27,775 | 02/01/18 | 27,775 | 27,775 | ||||||||||||||
| Andaz San Diego (d) |
Variable | 3.671 | % | March 2018 | — | 03/01/16 | 26,315 | 26,500 | ||||||||||||||
| Residence Inn Denver City Center |
Variable | 2.421 | % | April 2018 | 45,210 | 04/17/18 | 45,210 | 40,000 | ||||||||||||||
| Andaz Savannah |
Variable | 2.171 | % | January 2020 | 21,500 | 01/14/19 | 21,500 | 21,500 | ||||||||||||||
| Hotel Monaco Denver |
Variable | 2.271 | % | January 2020 | 41,000 | 01/17/19 | 41,000 | — | ||||||||||||||
| Andaz Napa (e) |
Variable | 2.271 | % | March 2020 | 30,500 | 03/21/19 | 30,500 | 30,500 | ||||||||||||||
| Marriott Dallas City Center |
Variable | 2.421 | % | May 2020 | 40,090 | 05/24/18 | 40,090 | 34,000 | ||||||||||||||
| Marriott Charleston Town Center |
Fixed | 3.850 | % | July 2020 | 17,108 | 07/01/20 | 17,108 | 17,108 | ||||||||||||||
| Hyatt Regency Santa Clara |
Variable | 2.171 | % | September 2020 | 60,200 | 01/20/19 | 60,200 | 46,500 | ||||||||||||||
| Grand Bohemian Charleston—Kessler JV |
Variable | 2.671 | % | November 2020 | 11,119 | 11/10/20 | 11,119 | 4,389 | ||||||||||||||
| Loews New Orleans Hotel |
Variable | 2.521 | % | November 2020 | 37,500 | 02/22/19 | 37,500 | 37,500 | ||||||||||||||
| Grand Bohemian Mountain Brook—Kessler JV |
Variable | 2.671 | % | December 2020 | 10,095 | 12/27/20 | 10,095 | 1,359 | ||||||||||||||
| Hotel Monaco Chicago |
Variable | 2.421 | % | January 2021 | 26,000 | 01/17/19 | 26,000 | — | ||||||||||||||
| Westin Galleria & Oaks Houston |
Variable | 3.321 | % | May 2021 | 110,000 | 05/01/19 | 110,000 | 110,000 | ||||||||||||||
| Crowne Plaza-Charleston (f) |
— | — | 9,890 | |||||||||||||||||||
| Bohemian Hotel Celebration (g) |
— | — | 9,844 | |||||||||||||||||||
| Marriott West Des Moines (g) |
— | — | 10,257 | |||||||||||||||||||
| Hampton Inn Suites Baltimore Inner Harbor (g) |
— | — | 9,000 | |||||||||||||||||||
| Marriott Chicago @ Medical District (g) |
— | — | 8,382 | |||||||||||||||||||
| Homewood Suites Houston Galleria (g) |
— | — | 14,690 | |||||||||||||||||||
| Marriott Napa Valley Hotel & Spa (g) |
— | — | 39,262 | |||||||||||||||||||
| Courtyard Kansas City Country Club Plaza (g) |
— | — | 12,740 | |||||||||||||||||||
| Hilton St.Louis Downtown (g) |
— | — | 14,690 | |||||||||||||||||||
|
|
|
|
|
|
|
|||||||||||||||||
| Total Mortgage Loans |
$ | 1,174,373 | $ | 1,200,688 | $ | 1,214,952 | ||||||||||||||||
| Mortgage Loan Premium / (Discounts)(h) |
(1,660 | ) | (1,660 | ) | (2,400 | ) | ||||||||||||||||
| Line of Credit Allocation(i) |
— | 96,020 | 67,668 | |||||||||||||||||||
|
|
|
|
|
|
|
|||||||||||||||||
| Total Debt |
$ | 1,172,713 | $ | 1,295,048 | $ | 1,280,220 | ||||||||||||||||
|
|
|
|
|
|
|
|||||||||||||||||
| (a) | Reflects one loan secured by Andaz San Diego as being paid off as of December 31, 2014 and the Company’s allocated portion of Inland American’s unsecured credit facility, for which Xenia was relieved of responsibility upon the Distribution. |
| (b) | Floating index is one month LIBOR. The Company does not have any hedging instruments in place. |
| (c) | Loan extension is at the discretion of Xenia. The majority of loans require minimum Debt Service Coverage Ratio and/or Loan to Value maximums and payment of extension fee. |
96
Table of Contents
| (d) | The Company repaid the mortgage loan on March 2, 2015 which was funded by available cash. |
| (e) | Given the August 2014 earthquake in northern California, we may not be in compliance with certain financial covenants. |
| (f) | The property was disposed on May 30, 2014. |
| (g) | The following loans were paid off on: |
| Property | Date Paid Off | |||
| Bohemian Hotel Celebration |
07/01/14 | |||
| Marriott West Des Moines |
08/01/14 | |||
| Hampton Inn Suites Baltimore Inner Harbor |
10/01/14 | |||
| Marriott Chicago @ Medical District |
10/15/14 | |||
| Homewood Suites Houston Galleria |
10/10/14 | |||
| Marriott Napa Valley Hotel & Spa |
11/17/14 | |||
| Courtyard Kansas City Country Club Plaza |
12/15/14 | |||
| Hilton St.Louis Downtown |
12/15/14 | |||
| (h) | Loan premiums / (discounts) on assumed mortgages recorded in purchase accounting. |
| (i) | Inland American had an unsecured credit facility, of which Xenia was allocated a portion of the outstanding balance at December 31, 2014 and 2013, which excludes an allocation to properties classified as held for sale as of December 31, 2013. |
Capital Expenditures and Reserve Funds
We maintain each of our properties in good repair and condition and in conformity with applicable laws and regulations, franchise agreements and management agreements. Routine capital expenditures are administered by the property management companies. However, we have approval rights over the capital expenditures as part of the annual budget process for each of our properties. From time to time, certain of our hotels may be undergoing renovations as a result of our decision to upgrade portions of the hotels, such as guestrooms, public space, meeting space and/or restaurants, in order to better compete with other hotels in our markets. In addition, upon acquisition of a hotel we often are required to complete a property improvement plan in order to bring the hotel up to the respective brand standards. If permitted by the terms of the management agreement, funding for a renovation will first come from the furniture, fixtures and equipment reserves. We are obligated to maintain reserve funds with respect to certain agreements with our hotel management companies, franchisors and lenders to provide funds, generally 3%-5% of hotel revenues, sufficient to cover the cost of (a) certain non-routine repairs and maintenance to the hotels and (b) replacements and renewals to the hotels’ capital assets. Certain of the agreements require that we reserve this cash in separate accounts. To the extent that the furniture, fixtures and equipment reserves are not available or adequate to cover the cost of the renovation, we will fund all or the remaining portion of the renovation with cash and cash equivalents on hand, our unsecured revolving credit facility and/or other sources of available liquidity. As December 31, 2014 and 2013, we held a total of $76.3 million and $71.5 million, respectively, of furniture, fixtures and equipment reserves. We have been and will continue to be prudent with respect to our capital spending, taking into account our cash flows from operations.
During the year ended December 31, 2014, we made total capital expenditures of $47.3 million. Our total capital expenditures in 2013 and 2012 were $49.8 million and $65.2 million, respectively. For 2015, we anticipate total capital expenditures of approximately $50.0 million to $60.0 million.
97
Table of Contents
Cash Flow Analysis
Comparison of the years ended December 31, 2014, 2013, and 2012
| Year ended December 31, | ||||||||||||
| 2014 | 2013 | 2012 | ||||||||||
| Net cash flows provided by operating activities |
$ | 181,605 | $ | 180,586 | $ | 132,999 | ||||||
| Net cash flows provided by (used in) investing activities |
827,513 | (1,025,559 | ) | (271,030 | ) | |||||||
| Net cash flows provided by (used in) financing activities |
(935,234 | ) | 869,138 | 159,021 | ||||||||
|
|
|
|
|
|
|
|||||||
| Increase in cash and cash equivalents |
73,884 | 24,165 | 20,990 | |||||||||
| Cash and cash equivalents, at beginning of year |
89,169 | 65,004 | 44,014 | |||||||||
|
|
|
|
|
|
|
|||||||
| Cash and cash equivalents, at end of year |
$ | 163,053 | $ | 89,169 | $ | 65,004 | ||||||
|
|
|
|
|
|
|
|||||||
Operating
Cash provided by operating activities was $181.6 million, $180.6 million and $133.0 million for the years ended December 31, 2014, 2013 and 2012, respectively, and was generated primarily from operating income from property operations. The continual increase in cash provided by operating activities year-over-year was primarily due to our acquisitions. We purchased one, 14, and seven hotels during the years ended December 31, 2014, 2013 and 2012, respectively.
Investing
Cash provided by (used in) investing activities was $827.5 million, $(1,025.6) million and $(271.0) million for the years ended December 31, 2014, 2013 and 2012, respectively. Cash used in investing activities was significantly higher in 2013 compared to 2014 and 2012 primarily due to fourteen hotels acquired for cash of $955.5 million during the year ended December 31, 2013. Cash of $191.2 million and $298.2 million was used to purchase one and seven hotels for the years ended December 31, 2014 and 2012, respectively. Cash provided by investing activities for the year ended December 31, 2014 was primarily due to the sale of 55 hotels for a gross disposition price of $1,101 million. None of the proceeds from the sale of these properties were retained by Xenia.
Financing
Cash provided by (used in) financing activities was $(935.2) million, $869.1 million and $159.0 million for the years ended December 31, 2014, 2013 and 2012, respectively. The cash used for the year ended December 31, 2014 was due to the payoffs of mortgages related to the disposition of 55 hotels. Cash provided by financing activities was high for the year ended December 31, 2013 due to the large net contribution of $738.8 million from Inland American as a result of hotel acquisitions. For the year ended December 31, 2012 cash was provided by mortgage proceeds for several hotels.
We consider all demand deposits, money market accounts and investments in certificates of deposit and repurchase agreements with a maturity of three months or less, at the date of purchase, to be cash equivalents. We maintain our cash and cash equivalents at financial institutions. The combined account balances at one or more institutions periodically exceed the Federal Depository Insurance Corporation (“FDIC”) insurance coverage and, as a result, there is a concentration of credit risk related to amounts on deposit in excess of FDIC insurance coverage.
98
Table of Contents
Contractual Obligations
The table below presents, on a combined consolidated basis, obligations and commitments to make future payments under debt obligations (including interest) and lease agreements as of December 31, 2014.
| Payments due by period | ||||||||||||||||||||
| Total | Less than 1 year |
1-3 years | 3-5 years | More than 5 years |
||||||||||||||||
| Long-Term Debt Obligations (1) |
$ | 1,355,330 | $ | 146,550 | $ | 620,167 | $ | 554,842 | $ | 33,771 | ||||||||||
| Ground Lease Payments |
128,237 | 3,256 | 6,512 | 6,512 | 111,957 | |||||||||||||||
|
|
|
|
|
|
|
|
|
|
|
|||||||||||
| Total |
$ | 1,483,567 | $ | 149,806 | $ | 626,679 | $ | 561,354 | $ | 145,728 | ||||||||||
|
|
|
|
|
|
|
|
|
|
|
|||||||||||
| (1) | Includes principal and interest payments, for both variable and fixed rate loans, of $1,200,688 and $154,642, respectively. The variable rate interest payments were calculated based upon the variable rate spread plus 1 month LIBOR as of December 31, 2014. |
Of the total long-term debt obligations, approximately $31.3 million is recourse to us as of December 31, 2014.
Off-Balance Sheet Arrangements
As of December 31, 2014, we have no off-balance sheet arrangements.
Subsequent Events
On January 5, 2015, the Company issued 125 shares of the Series A Preferred Stock in a private placement to approximately 125 investors who qualify as “accredited investors” (as that term is defined in Rule 501(a) of Regulation D under the Securities Act) in reliance upon the exemption from the registration requirements of the Securities Act pursuant to Rule 506 of Regulation D, relative to transactions by an issuer not involving any public offering, to the extent an exemption from such registration was required.
On February 3, 2015, Xenia Hotels & Resorts, Inc., a Maryland corporation, was spun-off from Inland American Real Estate Trust, Inc. (“Inland American”), its former parent, through a taxable pro-rata distribution by Inland American of 95% of the outstanding common stock, $0.01 par value per share (the “Common Stock”), of Xenia to holders of record of Inland American’s common stock as of the close of business on January 20, 2015 (the “Record Date”). Each holder of record of Inland American’s common stock received one share of Common Stock for every eight shares of Inland American’s common stock held at the close of business on the Record Date (the “Distribution”). In lieu of fractional shares, stockholders of Inland American received cash. On February 4, 2015, Xenia’s Common Stock began trading on the New York Stock Exchange (“NYSE”) under the ticker symbol “XHR.” As a result of the Distribution, the Company became a stand-alone, publicly-traded company.
Effective February 3, 2015, we entered into a $400 million unsecured revolving credit facility with a syndicate of banks. The revolving credit facility includes an uncommitted accordion feature which, subject to certain conditions, allows us to increase the aggregate availability by up to $350 million. We expect borrowings under the revolving credit facility to bear interest based on LIBOR plus a margin ranging from 1.50% to 2.45% (or, at our election upon achievement of an investment grade rating from Moody’s Investor Services, Inc. or Standard & Poor’s Rating Services, interest based on LIBOR plus a margin ranging from 0.875% to 1.50%). In addition, until such election, we expect to pay an unused fee of up to 0.30% of the unused portion of the credit facility based on the average daily unused portion of the credit facility; thereafter, we expect to pay a facility fee ranging between 0.125% and 0.35% based on the Company’s debt rating.
On February 4, 2015, in conjunction with the listing of our common stock on the NYSE, the Company commenced a modified “Dutch Auction” self-tender offer (the “Tender Offer”) to purchase for cash up to $125 million in value of shares of the Company’s common stock at a price not greater than $21.00 nor less than $19.00 per share, net to the seller in cash, less any applicable withholding of taxes and without interest. The Tender
99
Table of Contents
Offer expired at 5:00 P.M., New York City Time, on March 5, 2015. As a result of the Tender Offer, the Company accepted for purchase 1,759,344 shares of its common stock at a purchase price of $21.00 per share, for an aggregate purchase price of $36.9 million (excluding fees and expenses relating to the Tender Offer), which was funded from cash on hand. The 1,759,344 shares of common stock accepted for purchase in the Tender Offer represent approximately 1.6% of the Company’s common stock outstanding as of February 3, 2015, the last day prior to the commencement of the Tender Offer. Stockholders who properly tendered and did not properly withdraw shares of common stock in the Tender Offer at or below the final purchase price of $21.00 per share had all of their tendered shares of common stock purchased by the Company at $21.00 per share. Following completion of the Tender Offer, the Company had approximately 111,664,641 shares of common stock outstanding.
Subsequent to December 31, 2014, we paid off the mortgage on the following property below (in thousands). In addition, we extended the maturity on one mortgage loan totaling $34.9 million by one year to March 2016.
| Property |
Date Paid Off | Amount | ||||||
| Andaz San Diego |
3/2/2015 | $ | 26,315 | |||||
|
|
|
|||||||
| $ | 26,315 | |||||||
|
|
|
|||||||
On March 13, 2015, the Company’s Board of Directors authorized a cash dividend of $0.1457 per share of the Company’s Common Stock for the first quarter of 2015. The dividend represents the Company’s anticipated regular quarterly dividend of $0.23 per share, prorated for the period from February 3, 2015, the Distribution date, to March 31, 2015, the last day of the first quarter. The dividend will be paid on April 15, 2015 to all holders of record of the Company’s Common Stock as of the close of business on March 31, 2015. For additional information, see “Part II—Item 5. Market for Registrant’s Common Equity, Related Stockholder Matters and Issuer Purchases of Equity Securities—Dividends.”
100
Table of Contents
Item 7A. Quantitative and Qualitative Disclosures About Market Risk
We are subject to market risk associated with changes in interest rates both in terms of variable-rate debt and the price of new fixed-rate debt upon maturity of existing debt and for acquisitions. Our interest rate risk management objectives are to limit the impact of interest rate changes on earnings and cash flows and to lower our overall borrowing costs. If market rates of interest on all of the variable rate debt as of December 31, 2014 permanently increased by 1%, the increase in interest expense on the variable rate debt would decrease future earnings and cash flows by approximately $5.8 million. If market rates of interest on all of the variable rate debt as of December 31, 2014 permanently decreased by 1%, the decrease in interest expense on the variable rate debt would increase future earnings and cash flows by approximately $5.8 million.
With regard to our variable rate financing, we assess interest rate cash flow risk by continually identifying and monitoring changes in interest rate exposures that may adversely impact expected future cash flows and by evaluating hedging opportunities. We maintain risk management control systems to monitor interest rate cash flow risk attributable to both of our outstanding or forecasted debt obligations as well as our potential offsetting hedge positions. The risk management control systems involve the use of analytical techniques, including cash flow sensitivity analysis, to estimate the expected impact of changes in interest rates on our future cash flows.
We monitor interest rate risk using a variety of techniques, including periodically evaluating fixed interest rate quotes on all variable rate debt and the costs associated with converting the debt to fixed rate debt. Also, existing fixed and variable rate loans that are scheduled to mature in the next year or two are evaluated for possible early refinancing or extension due to consideration given to current interest rates. Refer to our Borrowings table for mortgage debt principal amounts and weighted average interest rates by year and expected maturity to evaluate the expected cash flows and sensitivity to interest rate changes.
We may use financial instruments to hedge exposures to changes in interest rates on loans secured by our properties. To the extent we do, we are exposed to credit risk and market risk. Credit risk is the failure of the counterparty to perform under the terms of the derivative contract. When the fair value of a derivative contract is positive, the counterparty owes us, which creates credit risk for us. When the fair value of a derivative contract is negative, we owe the counterparty and, therefore, it does not possess credit risk. In the alternative, we seek to minimize the credit risk in derivative instruments by entering into transactions with what we believe are high-quality counterparties. Market risk is the adverse effect on the value of a financial instrument that results from a change in interest rates. The market risk associated with interest-rate contracts is managed by establishing and monitoring parameters that limit the types and degree of market risk that may be undertaken.
In the future, we may enter into derivative positions that do not qualify for hedge accounting treatment. The gains or losses resulting from marking-to-market these derivatives at the end of each reporting period are recognized as an increase or decrease in “interest expense” on our combined consolidated statements of operations. In addition, we may in the future be subject to additional expense based on the notional amount of the derivative positions and a specified spread over LIBOR.
101
Table of Contents
Xenia Hotels & Resorts, Inc. and Subsidiaries
Item 8. Combined Consolidated Financial Statements and Supplementary Data
102
Table of Contents
Report of Independent Registered Public Accounting Firm
The Board of Directors
Xenia Hotels & Resorts, Inc.:
We have audited the accompanying combined consolidated balance sheets of Xenia Hotels & Resorts, Inc. and subsidiaries as of December 31, 2014 and 2013, and the related combined consolidated statements of operations, changes in equity, and cash flows for each of the years in the three-year period ended December 31, 2014. In connection with our audits of the combined consolidated financial statements, we also have audited the financial statement schedule III. These combined consolidated financial statements and financial statement schedule III are the responsibility of the Company’s management. Our responsibility is to express an opinion on these combined consolidated financial statements and financial statement schedule III based on our audits.
We conducted our audits in accordance with the standards of the Public Company Accounting Oversight Board (United States). Those standards require that we plan and perform the audit to obtain reasonable assurance about whether the financial statements are free of material misstatement. An audit includes examining, on a test basis, evidence supporting the amounts and disclosures in the financial statements. An audit also includes assessing the accounting principles used and significant estimates made by management, as well as evaluating the overall financial statement presentation. We believe that our audits provide a reasonable basis for our opinion.
In our opinion, the combined consolidated financial statements referred to above present fairly, in all material respects, the financial position of Xenia Hotels & Resorts, Inc. and subsidiaries as of December 31, 2014 and 2013, and the results of their operations and their cash flows for each of the years in the three-year period ended December 31, 2014, in conformity with U.S. generally accepted accounting principles. Also, in our opinion, the related financial statement schedule III, when considered in relation to the basic combined consolidated financial statements taken as a whole, present fairly, in all material respects, the information set forth herein.
As discussed in Note 2 to the combined consolidated financial statements, the Company has changed its method for accounting for discontinued operations in 2014 due to the adoption of Accounting Standards Update 2014-08, Reporting Discontinued Operations and Disclosures of Disposals of Components of an Entity.
/s/ KPMG LLP
Chicago, Illinois
March 27, 2015
103
Table of Contents
XENIA HOTELS & RESORTS, INC.
Combined Consolidated Balance Sheets
As of December 31, 2014 and 2013
(Dollar amounts in thousands)
| December 31, 2014 |
December 31, 2013 |
|||||||
| Assets |
||||||||
| Investment properties: |
||||||||
| Land |
$ | 338,313 | $ | 337,177 | ||||
| Building and other improvements |
2,710,647 | 2,538,589 | ||||||
| Construction in progress |
39,736 | 12,390 | ||||||
|
|
|
|
|
|||||
| Total |
$ | 3,088,696 | $ | 2,888,156 | ||||
| Less accumulated depreciation |
(505,986 | ) | (376,510 | ) | ||||
|
|
|
|
|
|||||
| Net investment properties |
$ | 2,582,710 | $ | 2,511,646 | ||||
| Cash and cash equivalents |
163,053 | 89,169 | ||||||
| Restricted cash and escrows |
87,296 | 87,804 | ||||||
| Investment in unconsolidated entities |
— | 1,736 | ||||||
| Accounts and rents receivable (net of allowance of $251 and $306) |
26,504 | 23,418 | ||||||
| Intangible assets, net |
64,541 | 56,461 | ||||||
| Deferred tax asset |
2,393 | 5,815 | ||||||
| Other assets |
29,254 | 33,693 | ||||||
| Assets held for sale |
— | 946,916 | ||||||
|
|
|
|
|
|||||
| Total assets |
$ | 2,955,751 | $ | 3,756,658 | ||||
|
|
|
|
|
|||||
| Liabilities |
||||||||
| Debt |
$ | 1,295,048 | $ | 1,280,220 | ||||
| Accounts payable and accrued expenses |
88,356 | 73,366 | ||||||
| Other liabilities |
51,426 | 38,811 | ||||||
| Liabilities associated with assets held for sale |
— | 546,006 | ||||||
|
|
|
|
|
|||||
| Total liabilities |
$ | 1,434,830 | $ | 1,938,403 | ||||
|
|
|
|
|
|||||
| Commitments and contingencies |
||||||||
| Stockholders’ Equity |
||||||||
| Preferred stock, $0.01 par value |
$ | — | $ | — | ||||
| Common stock, $0.01 par value |
— | — | ||||||
| Capital contributions |
1,781,427 | 2,190,604 | ||||||
| Accumulated deficit |
(264,161 | ) | (373,960 | ) | ||||
|
|
|
|
|
|||||
| Total Company stockholders’ equity |
$ | 1,517,266 | $ | 1,816,644 | ||||
|
|
|
|
|
|||||
| Noncontrolling interests |
3,655 | 1,611 | ||||||
|
|
|
|
|
|||||
| Total equity |
$ | 1,520,921 | $ | 1,818,255 | ||||
|
|
|
|
|
|||||
| Total liabilities and equity |
$ | 2,955,751 | $ | 3,756,658 | ||||
|
|
|
|
|
|||||
See accompanying notes to the combined consolidated historical financial statements.
104
Table of Contents
XENIA HOTELS & RESORTS, INC.
Combined Consolidated Statements of Operations
For the years ended December 31, 2014, 2013 and 2012
(Dollar amounts in thousands)
| For the year ended December 31, | ||||||||||||
| 2014 | 2013 | 2012 | ||||||||||
| Revenues: |
||||||||||||
| Room revenues |
$ | 631,901 | $ | 443,267 | $ | 323,959 | ||||||
| Food and beverage revenues |
235,066 | 168,368 | 116,260 | |||||||||
| Other revenues |
59,699 | 40,236 | 26,661 | |||||||||
|
|
|
|
|
|
|
|||||||
| Total revenues |
$ | 926,666 | $ | 651,871 | $ | 466,880 | ||||||
|
|
|
|
|
|
|
|||||||
| Expenses: |
||||||||||||
| Room expenses |
140,128 | 96,444 | 70,165 | |||||||||
| Food and beverage expenses |
158,243 | 114,011 | 78,080 | |||||||||
| Other direct expenses |
33,381 | 24,542 | 17,401 | |||||||||
| Other indirect expenses |
217,811 | 157,385 | 117,355 | |||||||||
| Management fees |
52,104 | 37,683 | 26,827 | |||||||||
|
|
|
|
|
|
|
|||||||
| Total hotel operating expenses |
601,667 | 430,065 | 309,828 | |||||||||
| Depreciation and amortization |
141,807 | 104,229 | 89,629 | |||||||||
| Real estate taxes, personal property taxes and insurance |
41,802 | 27,548 | 22,382 | |||||||||
| General and administrative expenses |
38,895 | 14,151 | 9,008 | |||||||||
| Business management fees |
1,474 | 12,743 | 10,812 | |||||||||
| Acquisition transaction costs |
1,192 | 2,275 | 751 | |||||||||
| Provision for asset impairments |
5,378 | 49,145 | — | |||||||||
|
|
|
|
|
|
|
|||||||
| Total expenses |
$ | 832,215 | $ | 640,156 | $ | 442,410 | ||||||
|
|
|
|
|
|
|
|||||||
| Operating income |
$ | 94,451 | $ | 11,715 | $ | 24,470 | ||||||
|
|
|
|
|
|
|
|||||||
| Gain (loss) on sale of investment properties |
693 | — | (589 | ) | ||||||||
| Other income (loss) |
(1,389 | ) | (1,113 | ) | 798 | |||||||
| Interest expense |
(57,427 | ) | (52,792 | ) | (45,061 | ) | ||||||
| Equity in earnings (loss) and gain (loss) and (impairment) of investment in unconsolidated entities, net |
4,216 | (33 | ) | (3,719 | ) | |||||||
|
|
|
|
|
|
|
|||||||
| Income (loss) before income taxes |
$ | 40,544 | $ | (42,223 | ) | $ | (24,101 | ) | ||||
|
|
|
|
|
|
|
|||||||
| Income tax expense |
(5,865 | ) | (3,619 | ) | (3,695 | ) | ||||||
|
|
|
|
|
|
|
|||||||
| Net income (loss) from continuing operations |
$ | 34,679 | $ | (45,842 | ) | $ | (27,796 | ) | ||||
|
|
|
|
|
|
|
|||||||
| Net income (loss) from discontinued operations |
75,120 | (5,626 | ) | (12,661 | ) | |||||||
|
|
|
|
|
|
|
|||||||
| Net income (loss) |
$ | 109,799 | $ | (51,468 | ) | $ | (40,457 | ) | ||||
|
|
|
|
|
|
|
|||||||
| Less: Net income attributable to noncontrolling interests |
— | — | (5,689 | ) | ||||||||
|
|
|
|
|
|
|
|||||||
| Net income (loss) attributable to Company |
$ | 109,799 | $ | (51,468 | ) | $ | (46,146 | ) | ||||
|
|
|
|
|
|
|
|||||||
See accompanying notes to the combined consolidated historical financial statements.
105
Table of Contents
XENIA HOTELS & RESORTS, INC.
Combined Consolidated Statements of Changes in Equity
For the years ended December 31, 2014, 2013 and 2012
(Dollar amounts in thousands)
| Capital Contributions (Distributions) |
Accumulated Deficit |
Non- controlling Interests |
Total | |||||||||||||
| Balance at January 1, 2012 |
$ | 1,524,303 | $ | (276,346 | ) | $ | (286 | ) | $ | 1,247,671 | ||||||
| Net income (loss) |
— | (46,146 | ) | 5,689 | (40,457 | ) | ||||||||||
| Distributions to Inland American |
(1,231,349 | ) | — | — | (1,231,349 | ) | ||||||||||
| Contribution from Inland American |
1,247,515 | — | — | 1,247,515 | ||||||||||||
| Distributions to noncontrolling interest |
— | — | (3,806 | ) | (3,806 | ) | ||||||||||
| Disposal of noncontrolling interest |
$ | — | $ | — | $ | (1,597 | ) | $ | (1,597 | ) | ||||||
|
|
|
|
|
|
|
|
|
|||||||||
| Balance at December 31, 2012 |
$ | 1,540,469 | $ | (322,492 | ) | $ | — | $ | 1,217,977 | |||||||
|
|
|
|
|
|
|
|
|
|||||||||
| Capital Contributions (Distributions) |
Accumulated Deficit |
Non- controlling Interests |
Total | |||||||||||||
| Balance at January 1, 2013 |
1,540,469 | (322,492 | ) | — | 1,217,977 | |||||||||||
| Net loss |
— | (51,468 | ) | — | (51,468 | ) | ||||||||||
| Distributions to Inland American |
(1,621,111 | ) | — | — | (1,621,111 | ) | ||||||||||
| Contribution from Inland American |
2,271,246 | — | — | 2,271,246 | ||||||||||||
| Contribution from noncontrolling interests, net |
— | — | 1,611 | 1,611 | ||||||||||||
|
|
|
|
|
|
|
|
|
|||||||||
| Balance at December 31, 2013 |
$ | 2,190,604 | $ | (373,960 | ) | $ | 1,611 | $ | 1,818,255 | |||||||
|
|
|
|
|
|
|
|
|
|||||||||
| Capital Contributions (Distributions) |
Accumulated Deficit |
Non- controlling Interests |
Total | |||||||||||||
| Balance at January 1, 2014 |
2,190,604 | (373,960 | ) | 1,611 | 1,818,255 | |||||||||||
| Net income |
— | 109,799 | — | 109,799 | ||||||||||||
| Distributions to Inland American |
(4,181,380 | ) | — | — | (4,181,380 | ) | ||||||||||
| Contribution from Inland American |
3,772,203 | — | — | 3,772,203 | ||||||||||||
| Contributions from noncontrolling interests, net |
— | — | 2,044 | 2,044 | ||||||||||||
|
|
|
|
|
|
|
|
|
|||||||||
| Balance at December 31, 2014 |
$ | 1,781,427 | $ | (264,161 | ) | $ | 3,655 | $ | 1,520,921 | |||||||
|
|
|
|
|
|
|
|
|
|||||||||
See accompanying notes to the combined consolidated historical financial statements.
106
Table of Contents
XENIA HOTELS & RESORTS, INC.
Combined Consolidated Statements of Cash Flows
For the years ended December 31, 2014, 2013 and 2012
(Dollar amounts in thousands)
| December 31, 2014 |
December 31, 2013 |
December 31, 2012 |
||||||||||
| Cash flows from operating activities: |
||||||||||||
| Net income (loss) |
$ | 109,799 | $ | (51,468 | ) | $ | (40,457 | ) | ||||
| Adjustments to reconcile net income (loss) to net cash provided by operating activities: |
||||||||||||
| Depreciation and amortization |
177,671 | 154,861 | 155,777 | |||||||||
| Amortization of debt premiums, discounts, and financing costs |
4,461 | 4,360 | 4,276 | |||||||||
| Loss (gain) on extinguishment of debt |
67,105 | 20 | (4,178 | ) | ||||||||
| Gain on sale of property, net |
(136,385 | ) | (1,564 | ) | (6,367 | ) | ||||||
| Provision for asset impairment |
5,378 | 49,145 | 6,224 | |||||||||
| Equity in (earnings) loss and (gain) loss and impairment of investment in unconsolidated entities; net |
(4,216 | ) | 33 | 3,718 | ||||||||
| Distributions from unconsolidated entities |
— | 451 | 666 | |||||||||
| Other non-cash adjustments |
— | (45 | ) | — | ||||||||
| Changes in assets and liabilities: |
||||||||||||
| Accounts and rents receivable, net |
1,005 | (6,831 | ) | (6,768 | ) | |||||||
| Other assets |
11,209 | 2,178 | 7,294 | |||||||||
| Accounts payable and accrued expenses |
6,095 | 27,481 | 8,009 | |||||||||
| Other liabilities |
4,898 | 1,965 | 4,805 | |||||||||
| Prepayment penalties and defeasance |
(65,415 | ) | — | — | ||||||||
|
|
|
|
|
|
|
|||||||
| Net cash flows provided by operating activities |
$ | 181,605 | $ | 180,586 | $ | 132,999 | ||||||
|
|
|
|
|
|
|
|||||||
| Cash flows from investing activities: |
||||||||||||
| Purchase of investment properties |
(178,776 | ) | (942,945 | ) | (270,574 | ) | ||||||
| Acquired goodwill, intangible assets, and intangible liabilities |
(12,410 | ) | (12,534 | ) | (27,631 | ) | ||||||
| Capital expenditures and tenant improvements |
(47,267 | ) | (49,782 | ) | (65,184 | ) | ||||||
| Investment in development projects |
(27,031 | ) | (11,949 | ) | — | |||||||
| Proceeds from sale of investment properties |
1,085,451 | 11,435 | 86,413 | |||||||||
| Acquisition of venture partner’s interest |
(2,944 | ) | — | — | ||||||||
| Proceeds from the sale of and return of capital from unconsolidated entities |
— | 2,366 | 6,405 | |||||||||
| Distributions from unconsolidated entities |
— | 122 | 1,084 | |||||||||
| Contributions to unconsolidated entities |
(30 | ) | — | (146 | ) | |||||||
| Payments from notes receivable |
— | — | 26 | |||||||||
| Payoff of notes receivable |
— | 1,600 | — | |||||||||
| Restricted cash and escrows |
(3,015 | ) | (16,544 | ) | (674 | ) | ||||||
| Other liabilities (assets) |
13,535 | (7,328 | ) | (749 | ) | |||||||
|
|
|
|
|
|
|
|||||||
| Net cash flows provided by (used in) investing activities |
$ | 827,513 | $ | (1,025,559 | ) | $ | (271,030 | ) | ||||
|
|
|
|
|
|
|
|||||||
| Cash flows from financing activities: |
||||||||||||
| Distribution to Inland American |
(4,168,694 | ) | (1,621,111 | ) | (1,231,349 | ) | ||||||
| Contribution from Inland American |
3,779,389 | 2,359,889 | 1,247,515 | |||||||||
| Proceeds from mortgage debt and notes payable |
122,940 | 352,249 | 307,557 | |||||||||
| Payoffs of mortgage debt |
(648,872 | ) | (197,247 | ) | (145,197 | ) | ||||||
| Principal payments of mortgage debt |
(12,067 | ) | (12,481 | ) | (7,972 | ) | ||||||
| Payment of loan fees and deposits |
(2,083 | ) | (3,772 | ) | (6,130 | ) | ||||||
| Distributions paid to noncontrolling interests |
— | — | (3,806 | ) | ||||||||
| Contributions from noncontrolling interests |
2,044 | 1,611 | — | |||||||||
| Payments for contingent consideration |
(7,891 | ) | (10,000 | ) | — | |||||||
| Disposal of noncontrolling interests |
— | — | (1,597 | ) | ||||||||
|
|
|
|
|
|
|
|||||||
| Net cash flows provided by (used in) financing activities |
$ | (935,234 | ) | $ | 869,138 | $ | 159,021 | |||||
|
|
|
|
|
|
|
|||||||
| Net increase in cash and cash equivalents |
73,884 | 24,165 | 20,990 | |||||||||
| Cash and cash equivalents, at beginning of year |
89,169 | 65,004 | 44,014 | |||||||||
|
|
|
|
|
|
|
|||||||
| Cash and cash equivalents, at end of year |
$ | 163,053 | $ | 89,169 | $ | 65,004 | ||||||
|
|
|
|
|
|
|
|||||||
See accompanying notes to the combined consolidated historical financial statements.
107
Table of Contents
XENIA HOTELS & RESORTS, INC.
Combined Consolidated Statements of Cash Flows
Supplemental Cash Flow
For the years ended December 31, 2013, 2012 and 2011
(Dollar amounts in thousands)
| December 31, 2014 |
December 31, 2013 |
December 31, 2012 |
||||||||||
| Supplemental disclosure of cash flow information: |
||||||||||||
| In conjunction with the acquisitions, the Company recorded the following: |
||||||||||||
| Purchase price |
$ | 190,400 | $ | 963,250 | $ | 515,100 | ||||||
| Other assets |
500 | 3,192 | 3,332 | |||||||||
| Real estate taxes |
386 | (3,482 | ) | (388 | ) | |||||||
| Other liabilities |
(100 | ) | (1,459 | ) | — | |||||||
| Assumption of mortgage debt |
— | (15,084 | ) | (232,017 | ) | |||||||
| Escrows |
— | 9,062 | 12,178 | |||||||||
|
|
|
|
|
|
|
|||||||
| Acquisition of investment properties |
$ | 191,186 | $ | 955,479 | $ | 298,205 | ||||||
|
|
|
|
|
|
|
|||||||
| Cash paid for interest, net of interest capitalized |
$ | 79,094 | $ | 80,461 | $ | 78,458 | ||||||
| Cash paid for taxes |
1,525 | 4,673 | 1,539 | |||||||||
| Supplemental schedule of non-cash investing and financing activities: |
||||||||||||
| Accrued capital expenditures |
6,138 | 2,424 | 7,287 | |||||||||
| Property surrendered in exchange for extinguishment of debt |
— | — | 4,178 | |||||||||
| Allocation from Inland American unsecured credit facility |
7,377 | 88,643 | — | |||||||||
| Mortgage assumed by buyer upon disposal of property |
— | 7,683 | 44,159 | |||||||||
| Investment property recorded at consolidation of joint venture |
21,833 | — | — | |||||||||
| Assumption of mortgage debt at consolidation of joint venture |
11,967 | — | — | |||||||||
| Liabilities assumed at consolidation of joint venture |
446 | — | — | |||||||||
108
Table of Contents
XENIA HOTELS & RESORTS, INC.
Notes to Combined Consolidated Financial Statements
(Dollar amounts in thousands)
December 31, 2014, 2013 and 2012
1. Organization
Inland American Real Estate Trust, Inc. (“Inland American”) was formed on October 4, 2004 to acquire and manage a diversified portfolio of commercial real estate, primarily consisting of retail, lodging, office, industrial, and multi-family (both conventional and student housing) properties, located in the United States. Xenia Hotels & Resorts, Inc. (the “Company” or “Xenia”) is a wholly-owned subsidiary of Inland American that invests primarily in premium full service, lifestyle and select service hotels.
On February 3, 2015, Xenia Hotels & Resorts, Inc., a Maryland corporation (“Xenia” or the “Company”), was spun-off from Inland American Real Estate Trust, Inc. (“Inland American”), its former parent, through a taxable pro-rata distribution by Inland American of 95% of the outstanding common stock, $0.01 par value per share (the “Common Stock”), of Xenia to holders of record of Inland American’s common stock as of the close of business on January 20, 2015 (the “Record Date”). Each holder of record of Inland American’s common stock received one share of Common Stock for every eight shares of Inland American’s common stock held at the close of business on the Record Date (the “Distribution”). In lieu of fractional shares, stockholders of Inland American received cash. On February 4, 2015, Xenia’s Common Stock began trading on the New York Stock Exchange (“NYSE”) under the ticker symbol “XHR.” As a result of the Distribution, the Company became a stand-alone, publicly-traded company.
The accompanying combined consolidated financial statements include the accounts of the Company, as well as all wholly owned subsidiaries, consolidated joint venture investments, and taxable real estate investment trust subsidiaries (“TRS”). Wholly owned subsidiaries generally consist of limited liability companies (“LLCs”) and limited partnerships (“LPs”). The effects of all significant intercompany transactions have been eliminated.
Each property is owned by a separate legal entity which maintains its own books and financial records and each entity’s assets are not available to satisfy the liabilities of other affiliated entities, except as otherwise disclosed in Debt Note 8.
As of December 31, 2014, the Company owned 46 lodging properties with 12,636 rooms. As of December 31, 2013, the Company owned 99 lodging properties with 19,337 rooms. As of December 31, 2012, the Company owned 88 lodging properties with 16,345 rooms. As of December 31, 2013, the Company classified 51 hotels with 6,865 rooms as held for sale which are included in the property and room counts for December 31, 2013 and 2012.
2. Summary of Significant Accounting Policies
The accompanying combined consolidated financial statements have been prepared in accordance with U.S. generally accepted accounting principles (“GAAP”) and require management to make estimates and assumptions that affect the reported amounts of assets and liabilities and disclosure of contingent assets and liabilities at the date of the combined consolidated financial statements and the reported amounts of revenues and expenses during the reporting periods. Actual results could differ from those estimates.
Basis of Presentation
The accompanying historical combined consolidated financial statements of the Company have been “carved out” of Inland American’s consolidated financial statements and reflect significant assumptions and allocations. The combined consolidated financial statements reflect the operations of the Company and include allocations of
109
Table of Contents
XENIA HOTELS & RESORTS, INC.
Notes to Combined Consolidated Financial Statements
(Dollar amounts in thousands)
December 31, 2014, 2013 and 2012
costs from certain corporate and shared functions provided to the Company by Inland American, as well as costs associated with participation by certain of the Company’s executives in Inland American’s benefit plans. Corporate costs directly associated with the Company’s principal executive offices, personnel and other administrative costs are reflected as general and administrative expense on the combined consolidated financial statements. Additionally, Inland American allocated to the Company a portion of corporate overhead costs incurred by Inland American based upon the Company’s percentage share of the average invested assets of Inland American and which is reflected in general and administrative expense. As Inland American is managing various asset portfolios, the extent of services and benefits a portfolio receives is based on the size of its assets. Therefore, using average invested assets to allocate costs is a reasonable reflection of the services and other benefits received by the Company and complies with applicable accounting guidance. However, actual costs may have differed from allocated costs if the Company had operated as a standalone entity during such period and those differences may have been material.
Revenue Recognition
Revenue consists of amounts derived from hotel operations, including the sales of rooms, food and beverage and other ancillary amenities. Revenue is recognized when rooms are occupied and services have been rendered. Cash received prior to guest arrival is recorded as an advance from the guest and recognized as revenue at the time of occupancy. Sales, use, occupancy, and similar taxes are collected and presented on a net basis (excluded from revenues) in the accompanying combined consolidated statements of operations. For retail operations, revenue is recognized on a straight-line basis over the lives of the retail leases. These revenue sources are affected by conditions impacting the travel and hospitality industry as well as competition from other hotels and businesses in similar markets.
Consolidation
The Company evaluates its investments in limited liability companies and partnerships to determine whether such entities may be a variable interest entity (“VIE”). If the entity is a VIE, the determination of whether the Company is the primary beneficiary must be made. The primary beneficiary determination is based on a qualitative assessment as to whether the entity has (i) power to direct significant activities of the VIE and (ii) an obligation to absorb losses or the right to receive benefits that could be potentially significant to the VIE. The Company will consolidate a VIE if it is deemed to be the primary beneficiary, as defined in Financial Accounting Standards Board (“FASB”) Accounting Standards Codification (“ASC”) 810, Consolidation. The equity method of accounting is applied to entities in which the Company is not the primary beneficiary as defined in FASB ASC 810, or the entity is not a VIE and the Company does not have effective control, but can exercise influence over the entity with respect to its operations and major decisions.
Reclassifications and Revisions
Certain reclassifications have been made to the combined consolidated statements of operations for the years ended December 31, 2014, 2013 and 2012 to disaggregate real estate taxes, personal property taxes, and insurance and acquisition transaction costs. Additionally, the combined consolidated statement of cash flows for the year ended December 31, 2012 was revised to adjust cash received from an asset disposal out of operating activities and into investing activities. The impact of the revision was not material to the Company’s combined consolidated financial statements for the year ended December 31, 2012.
110
Table of Contents
XENIA HOTELS & RESORTS, INC.
Notes to Combined Consolidated Financial Statements
(Dollar amounts in thousands)
December 31, 2014, 2013 and 2012
Certain reclassifications have been made to the 2013 and 2012 combined consolidated financial statements to conform to the 2014 presentations. These reclassifications primarily represent reclassifications of revenue and expenses to discontinued operations on the combined consolidated statements of operations for the years ended December 31, 2014, 2013 and 2012, and reclassifications of assets and liabilities to held for sale on the combined consolidated balance sheets as of December 31, 2013.
Capitalization and Depreciation
Real estate is reflected at cost less accumulated depreciation. Ordinary repairs and maintenance are expensed as incurred.
Depreciation expense is computed using the straight line method. Building and other improvements are depreciated based upon estimated useful lives of 30 years for building and improvements and 5-15 years for furniture, fixtures and equipment and site improvements.
Loan fees are amortized on a straight-line basis, which approximates the effective interest method, over the life of the related loan as a component of interest expense.
Direct and indirect costs that are clearly related to the construction and improvements of investment properties are capitalized. Costs incurred for property taxes and insurance are capitalized during periods in which activities necessary to get the property ready for its intended use are in progress. Interest costs are also capitalized during such periods.
Investment Properties Held for Sale
In determining whether to classify an investment property as held for sale, the Company considers whether: (i) management has committed to a plan to sell the investment property; (ii) the investment property is available for immediate sale, in its present condition; (iii) the Company has initiated a program to locate a buyer; (iv) the Company believes that the sale of the investment property is probable; (v) the Company has received a significant non-refundable deposit for the purchase of the property; (vi) the Company is actively marketing the investment property for sale at a price that is reasonable in relation to its fair value; and (vii) actions required for the Company to complete the plan indicate that it is unlikely that any significant changes will be made to the plan.
If all of the above criteria are met, the Company classifies the investment property as held for sale. On the day that these criteria are met, the Company suspends depreciation on the investment properties held for sale, including depreciation for additions, as well as on the amortization of acquired in-place leases. The investment properties and liabilities associated with those investment properties that are held for sale are classified separately on the combined consolidated balance sheets for the most recent reporting period and recorded at the lesser of the carrying value or fair value less costs to sell. Additionally, if the sale constitutes a strategic shift with a major effect on operations, the operations are classified on the combined consolidated statements of operations as discontinued operations for all periods presented.
Disposition of Real Estate
The Company accounts for dispositions in accordance with FASB ASC 360-20, Real Estate Sales. The Company recognizes gain in full when real estate is sold, provided (a) the profit is determinable, that is, the collectability of
111
Table of Contents
XENIA HOTELS & RESORTS, INC.
Notes to Combined Consolidated Financial Statements
(Dollar amounts in thousands)
December 31, 2014, 2013 and 2012
the sales price is reasonably assured or the amount that will not be collectible can be estimated, and (b) the earnings process is virtually complete, that is, the seller is not obliged to perform significant activities after the sale to earn the profit. Prior to 2014, the Company recorded all dispositions as discontinued operations for the applicable periods presented. Upon the adoption of Accounting Standards Update (“ASU”) 2014-08, Reporting Discontinued Operations and Disclosures of Disposals of Components of an Entity, the Company records a disposition as discontinued operations only if it represents a strategic shift and has (or will have) a major effect on the Company’s results and operations. During 2014, the Company recorded the sale of the Suburban Select Service Portfolio as discontinued operations. Other dispositions in 2014 are still classified as continuing operations.
Impairment
The Company assesses the carrying values of the respective long-lived assets, whenever events or changes in circumstances indicate that the carrying amounts of these assets may not be fully recoverable, such as a reduction in the expected holding period of the asset or a change in demand for lodging at the Company’s hotels. If it is determined that the carrying value is not recoverable because the undiscounted cash flows do not exceed carrying value, the Company records an impairment loss to the extent that the carrying value exceeds fair value. The valuation and possible subsequent impairment of investment properties is a significant estimate that can and does change based on the Company’s continuous process of analyzing each property and reviewing assumptions about uncertain inherent factors, as well as the economic condition of the property at a particular point in time.
The use of projected future cash flows and related holding period is based on assumptions that are consistent with the estimates of future expectations and the strategic plan the Company uses to manage its underlying business. However, assumptions and estimates about future cash flows and capitalization rates are complex and subjective. Changes in economic and operating conditions and the Company’s ultimate investment intent that occur subsequent to the impairment analyses could impact these assumptions and result in future impairment charges of the real estate properties.
On a periodic basis, management assesses whether there are any indicators that the carrying value of the Company’s investments in unconsolidated entities may be other than temporarily impaired. To the extent impairment has occurred, the loss is measured as the excess of the carrying value of the investment over the fair value of the investment. The fair value of the underlying investment includes a review of expected cash flows to be received from the investee.
Acquisition of Real Estate
The Company allocates the purchase price of each acquired business (as defined in the accounting guidance related to business combinations, FASB ASC 805—Business Combinations) between tangible and intangible assets at full fair value at the date of the transaction. Such tangible and intangible assets include land, building and improvements, acquired above market and below market leases, in-place lease value, customer relationships, and any assumed financing that is determined to be above or below market terms. Any additional amounts are allocated to goodwill as required, based on the remaining purchase price in excess of the fair value of the tangible and intangible assets acquired and liabilities assumed. The allocation of the purchase price is an area that requires judgment and significant estimates.
The Company engages a third party to assist in the allocation of the purchase price to land, building, and other assets as stated above. The Company determines whether any financing assumed is above or below market based
112
Table of Contents
XENIA HOTELS & RESORTS, INC.
Notes to Combined Consolidated Financial Statements
(Dollar amounts in thousands)
December 31, 2014, 2013 and 2012
upon comparison to similar financing terms for similar investment properties. The Company allocates a portion of the purchase price to the estimated acquired in-place lease costs based on estimated lease execution costs for similar leases as well as lost rent payments during assumed lease up period when calculating as if vacant fair values. The Company also evaluates each acquired lease based upon current market rates at the acquisition date and considers various factors including geographical location, size and location of leased space within the investment property, tenant profile, and the credit risk of the tenant in determining whether the acquired lease is above or below market lease costs. After an acquired lease is determined to be above or below market, the Company allocates a portion of the purchase price to such above or below acquired lease costs based upon the present value of the difference between the contractual lease rate and the estimated market rate. For below market leases with fixed rate renewals, renewal periods are included in the calculation of below market in-place lease values. The determination of the discount rate used in the present value calculation is based upon the “risk free rate” and current interest rates. This discount rate is a significant factor in determining the market valuation which requires judgment of subjective factors such as market knowledge, economics, demographics, location, visibility, age and physical condition of the property.
The Company expenses acquisition costs of all transactions as incurred. This includes all costs related to finding, analyzing and negotiating a transaction, whether or not the acquisition is completed.
Cash and Cash Equivalents
The Company considers all demand deposits, money market accounts and investments in certificates of deposit and repurchase agreements purchased with a maturity of three months or less, at the date of purchase, to be cash equivalents. The Company maintains its cash and cash equivalents at financial institutions. The combined account balances at one or more institutions periodically exceed the Federal Depository Insurance Corporation (“FDIC”) insurance coverage and, as a result, there is a concentration of credit risk related to amounts on deposit in excess of FDIC insurance coverage. The Company believes that the risk is not significant, as the Company does not anticipate the financial institutions’ non-performance.
Restricted Cash and Escrows
Restricted cash and escrows primarily consist of cash held in escrow comprised of lenders’ restricted escrows of $5,759 and $13,595, post acquisition escrows of $4,437 and $0, and lodging furniture, fixtures and equipment reserves of $76,280 and $71,458 as of December 31, 2014 and 2013, respectively. As of December 31, 2014 and 2013, the restricted cash balance was $820 and $2,751, respectively.
Goodwill
The excess of the cost of an acquired entity over the net of the amounts assigned to assets acquired (including identified intangible assets) and liabilities assumed is recorded as goodwill. Goodwill is recognized and allocated to specific properties. The Company tests goodwill for impairment annually or more frequently if events or changes in circumstances indicate impairment.
In accordance with FASB ASC 350, Intangibles—Goodwill and Other, the Company tests goodwill for impairment by making a qualitative assessment of whether it is more likely than not that the specific property’s fair value is less than its carrying amount before application of the two-step goodwill impairment test. The two-step goodwill test is not performed for those assets where it is concluded that it is not more likely than not that the fair value of a specific property is less than its carrying amount. For those specific properties where this is not the case, the two step procedure detailed below is followed in order to determine goodwill impairment.
113
Table of Contents
XENIA HOTELS & RESORTS, INC.
Notes to Combined Consolidated Financial Statements
(Dollar amounts in thousands)
December 31, 2014, 2013 and 2012
In the first step, the Company compares the estimated fair value of each property with goodwill to the carrying value of the property’s assets, including goodwill. The fair value is based on estimated future cash flow projections that utilize discount and capitalization rates, which are generally unobservable in the market place (Level 3 inputs), but approximate the inputs the Company believes would be utilized by market participants in assessing fair value. The estimates of future cash flows are based on a number of factors, including the historical operating results, known trends, and market/economic conditions. If the carrying amount of the property’s assets, including goodwill, exceeds its estimated fair value, the second step of the goodwill impairment test is performed to measure the amount of impairment loss, if any. In this second step, if the implied fair value of goodwill is less than the carrying amount of goodwill, an impairment charge is recorded in an amount equal to that excess. The Company tested goodwill for impairment as of December 31, 2014, 2013 and 2012 and recorded no impairment to goodwill as of December 31, 2014, 2013 and 2012.
Income Taxes
The Company intends to elect to be taxed as, and operate in a manner that will allow the Company to qualify as, a real estate investment trust (“REIT”) under the Internal Revenue Code of 1986, as amended, for federal income tax purposes. If the Company qualifies for taxation as a REIT, the Company generally will not be subject to federal income tax on taxable income that is distributed to stockholders. A REIT is subject to a number of organizational and operational requirements, including a requirement that it currently distributes at least 90% of its REIT taxable income (subject to certain adjustments) to its stockholders (the “90% Distribution Requirement”). If the Company fails to qualify as a REIT in any taxable year, without the benefit of certain relief provisions, the Company will be subject to federal and state income tax on its taxable income at regular corporate tax rates. Even if the Company qualifies for taxation as a REIT, the Company may be subject to certain state and local taxes on its income, property or net worth and federal income and excise taxes on its undistributed income.
The Company has elected to treat one of its consolidated subsidiaries, and may in the future elect to treat newly formed subsidiaries, as a taxable REIT subsidiary pursuant to the Internal Revenue Code. Taxable REIT subsidiaries may participate in non-real estate related activities and/or perform non-customary services for tenants and are subject to federal and state income tax at regular corporate tax rates. The Company’s hotels are leased to certain of the Company’s taxable REIT subsidiaries. Lease revenue from these taxable REIT subsidiaries and its wholly-owned subsidiaries is eliminated in consolidation for financial statement.
The Company accounts for income taxes using the asset and liability method under which deferred tax assets and liabilities are recognized for the estimated future tax consequences attributed to differences between the financial statement carrying amounts of existing assets and liabilities and their respective tax basis. Deferred tax assets and liabilities are measured using enacted tax rates in effect for the year in which those temporary differences are expected to be recovered or settled.
Deferred tax assets are recognized only to the extent that it is more likely than not that they will be realized based on consideration of available evidence, including future reversal of existing taxable temporary differences, future projected taxable income, and tax-planning strategies. In assessing the realizability of deferred tax assets, management considers whether it is more likely than not that some portion or all of the deferred tax assets will not be realized. The ultimate realization of deferred tax assets is dependent upon the generation of future taxable income during the periods in which those temporary differences become deductible. The Company’s analysis in determing the deferred tax asset valuation allowance involves management judgment and assumptions.
114
Table of Contents
XENIA HOTELS & RESORTS, INC.
Notes to Combined Consolidated Financial Statements
(Dollar amounts in thousands)
December 31, 2014, 2013 and 2012
Income tax expense in the combined consolidated financial statements was calculated on a “carve-out” basis from Inland American.
Involuntary Conversion
On August 24, 2014, Napa, California experienced a 6.0 magnitude earthquake that impacted two lodging properties. The Company recorded involuntary losses of $8,961 which represents the book value of the properties and equipment written off for the property damage. As it is probable that the Company will receive insurance proceeds to compensate for the property damages, the Company also recorded an offsetting insurance recovery receivable of $8,961, of which $5,961 is a remaining receivable at December 31, 2014. Any amount expected to be received above the recorded involuntary loss will be treated as a gain and will not be recorded until contingencies are resolved. The involuntary loss and insurance recovery income were recorded in other income on the combined consolidated statements of operations.
The Company will not record an insurance recovery receivable for business interruption losses until the recovery is estimable and it is probable that the Company will be compensated to the extent of estimated business interruption losses. Any proceeds in excess of estimated business interruption losses will be recorded upon receipt.
Discontinued Operations
In April 2014, the FASB issued ASU 2014-08, Reporting Discontinued Operations and Disclosures of Disposals of Components of an Entity, which includes amendments that change the requirements for reporting discontinued operations and require additional disclosures about discontinued operations. Under the new guidance, only disposals representing a strategic shift that has (or will have) a major effect on the entity’s results and operations would qualify as discontinued operations. In addition, ASU 2014-08 expands the disclosure requirements for disposals that meet the definition of a discontinued operation and requires entities to disclose information about disposals of individually significant components that do not meet the definition of discontinued operations. ASU 2014-08 is effective for interim and annual reporting periods in fiscal years that begin after December 15, 2014. The Company has elected to early adopt ASU 2014-08. Effective January 1, 2014 asset disposals will be included as a component of income from continuing operations unless the disposal represents a strategic shift and has (or will have) a major effect on the entity’s results and operations.
On September 17, 2014, the Company classified 52 select-service hotels (the “Suburban Select Service Portfolio”) consisting of 6,976 rooms as held for sale on the combined consolidated balance sheet as of December 31, 2013. The sale of these assets represents a strategic shift and will have a major impact on the financial statements. The portfolio was sold on November 17, 2014. The operations of these 52 select service hotels are reflected as discontinued operations on the combined consolidated statements of operations for the years ended December 31, 2014, 2013 and 2012.
Recently Issued Accounting Pronouncements
In May 2014, the FASB issued ASU 2014-09, Revenue from Contracts with Customers, which requires an entity to recognize the amount of revenue to which it expects to be entitled for the transfer of promised goods or services to customers. The ASU will replace most existing revenue recognition guidance in GAAP when it becomes effective. The new guidance establishes a new control-based revenue recognition model, changes the
115
Table of Contents
XENIA HOTELS & RESORTS, INC.
Notes to Combined Consolidated Financial Statements
(Dollar amounts in thousands)
December 31, 2014, 2013 and 2012
basis for deciding when revenue is recognized over time or at a point in time and will expand disclosures about revenue. The new standard is effective for annual reporting periods beginning after December 15, 2016, and interim periods within those years. Early adoption is not permitted. The standard permits the use of either the retrospective or cumulative effect transition method. The Company is evaluating the effect that ASU No. 2014-09 will have on its combined consolidated financial statements and related disclosures. The Company has not yet selected a transition method nor has it determined the effect of the standard on its ongoing financial reporting.
In February 2015, the FASB issued ASU 2015-02, Consolidation (Topic 810): Amendments to the Consolidation Analysis, which amends the consolidation requirements in ASC 810, Consolidation. This ASU affects reporting entities that are required to evaluate whether they should consolidate certain legal entities. All legal entities are subject to reevaluation under the revised consolidation model. Specifically, the amendments: (i) modify the evaluation of whether limited partnerships and similar legal entities are variable interest entities (“VIEs”) or voting interest entities, (ii) eliminate the presumption that a general partner should consolidate a limited partnership, (iii) affect the consolidated analysis of reporting entities that are involved with VIEs, particularly those that have fee arrangements and related party relationships and (iv) provide a scope exception for certain entities. The standard is effective for annual reporting periods beginning after December 15, 2015 and interim periods within those years. Early adoption is allowed. The standard may be applied retrospectively or through a cumulative effect adjustment to retained earnings as of the beginning of the fiscal year of adoption. The Company is evaluating the impacts, if any, the adoption of this accounting standard will have on the Company’s financial position and results of operations.
Share Based Compensation
During 2014, the Company maintained the Xenia Hotels & Resorts, Inc. 2014 Share Unit Plan (the “Lodging Plan”). Each Share Unit Plan provides for the grant of “share unit” awards to eligible participants. The value of a “share unit” was determined based on a phantom capitalization of the Company’s lodging business and does not necessarily correspond to the value of a share of common stock of Xenia. Vesting of the share units granted in 2014 is conditioned upon the occurrence of a triggering event, such as a listing or a change in control of the applicable business, and if no triggering event occurs within five years following the applicable grant date, then the share units are forfeited. The Company does not recognize share based compensation expense until the occurrence of a triggering event.
As of December 31, 2014, awards covering 817,640 share units were outstanding under the Lodging Plan. As a triggering event did not occur in 2014, the Company did not recognize share based compensation expense for the year ended December 31, 2014.
Segment Information
Management evaluates the Company’s hotels as a single industry segment because all of the hotels have similar economic characteristics and provide similar services to similar types of customers.
116
Table of Contents
XENIA HOTELS & RESORTS, INC.
Notes to Combined Consolidated Financial Statements
(Dollar amounts in thousands)
December 31, 2014, 2013 and 2012
3. Acquired Properties
During 2014 the Company acquired one lodging property and one retail property for a purchase price of $190,400. The Company records identifiable assets, liabilities, and goodwill acquired in a business combination at fair value. For properties acquired during the year ended December 31, 2014, the Company recorded revenue of $35,236 and net income of $7,440, not including related expensed acquisition costs. During the year ended December 31, 2014, the Company incurred $1,192 in acquisition costs. The following is a summary of acquisitions for the year ended December 31, 2014:
| Property |
Date | Purchase Price |
Rooms / Square Feet (unaudited) |
|||||||||
| Aston Waikiki Beach Hotel |
2/28/2014 | $ | 183,000 | 645 Rooms | ||||||||
| Key West Bottling Court |
11/25/2014 | 7,400 | 13,332 Square feet | |||||||||
|
|
|
|||||||||||
| Total |
$ | 190,400 | ||||||||||
|
|
|
|||||||||||
On February 21, 2014, the Company purchased their partners’ interest in one joint venture, which resulted in the Company obtaining control of the venture. Therefore, during the year ended December 31, 2014, the Company consolidated this entity, recorded the assets and liabilities of the joint venture at fair value, and recorded a gain of $4,509 on the purchase of this investment. This gain is shown within equity in earnings (loss) and gain (loss) and (impairment) of investment in unconsolidated entities, net on the combined consolidated statement of operations and is the result of stepping up the original investment to fair value in connection with gaining control of the joint venture.
The following table summarizes the estimated fair value of the assets acquired and liabilities assumed in the Company’s 2014 acquisitions of Aston Waikiki Beach Hotel and Key West Bottling Court:
| 2014 Acquisitions | ||||
| Land |
$ | 4,200 | ||
| Building |
146,695 | |||
| Furniture, fixtures, and equipment |
27,087 | |||
|
|
|
|||
| Total fixed assets |
$ | 177,982 | ||
|
|
|
|||
| Below market ground lease |
9,516 | |||
| Net other assets and liabilities |
2,902 | |||
|
|
|
|||
| Total |
$ | 190,400 | ||
|
|
|
|||
The acquired properties are included in the Company’s results of operations based on the date of acquisition. The following unaudited pro-forma results of operations reflect these transactions as if each had occurred on January 1, 2013. The pro-forma information is not necessarily indicative of the results that actually would have occurred nor does it indicate future operating results.
| For the year ended December 31, | ||||||||
| 2014 | 2013 | |||||||
| (unaudited) | (unaudited) | |||||||
| Revenues |
$ | 934,006 | $ | 692,648 | ||||
| Net income (loss) attributable to Company |
$ | 111,392 | $ | (41,536 | ) | |||
117
Table of Contents
XENIA HOTELS & RESORTS, INC.
Notes to Combined Consolidated Financial Statements
(Dollar amounts in thousands)
December 31, 2014, 2013 and 2012
During 2013, the Company acquired 14 lodging properties for a purchase price of $963,250. The Company records identifiable assets, liabilities, and goodwill acquired in a business combination at fair value. For properties acquired during the year ended December 31, 2013, the Company recorded revenue of $96,480 and net income of $9,788, not including related expensed acquisition costs in 2013. During the year ended December 31, 2013, the Company incurred $2,275 in acquisition costs. The following is a summary of acquisitions for the year ended December 31, 2013:
| Property |
Date | Purchase Price |
Rooms (unaudited) |
|||||||||
| Bohemian Hotel Celebration, an Autograph Collection Hotel |
2/7/2013 | $ | 17,500 | 115 | ||||||||
| Andaz San Diego |
3/4/2013 | 53,000 | 159 | |||||||||
| Residence Inn Denver City Center |
4/17/2013 | 80,000 | 228 | |||||||||
| Westin Galleria Houston |
8/22/2013 | 120,000 | 487 | |||||||||
| Westin Oaks Houston at the Galleria |
8/22/2013 | 100,000 | 406 | |||||||||
| Andaz Savannah |
9/10/2013 | 43,000 | 151 | |||||||||
| Andaz Napa |
9/20/2013 | 72,000 | 141 | |||||||||
| Hyatt Regency Santa Clara |
9/20/2013 | 93,000 | 501 | |||||||||
| Loews New Orleans Hotel |
10/11/2013 | 74,500 | 285 | |||||||||
| Lorien Hotel & Spa |
10/24/2013 | 45,250 | 107 | |||||||||
| Hotel Monaco Chicago |
11/1/2013 | 56,000 | 191 | |||||||||
| Hotel Monaco Denver |
11/1/2013 | 75,000 | 189 | |||||||||
| Hotel Monaco Salt Lake City |
11/1/2013 | 58,000 | 225 | |||||||||
| Hyatt Key West Resort & Spa |
11/15/2013 | 76,000 | 118 | |||||||||
|
|
|
|
|
|||||||||
| $ | 963,250 | 3,303 | ||||||||||
|
|
|
|
|
|||||||||
The following tables summarize the estimated fair value of the assets acquired and liabilities assumed in the Company’s 2013 acquisitions:
| 2013 Acquisitions | ||||
| Land |
$ | 109,859 | ||
| Building |
735,133 | |||
| Furniture, fixtures, and equipment |
113,520 | |||
|
|
|
|||
| Total fixed assets |
$ | 958,512 | ||
|
|
|
|||
| Goodwill |
10,960 | |||
| Net other assets and liabilities |
(6,222 | ) | ||
|
|
|
|||
| Total |
$ | 963,250 | ||
|
|
|
|||
The acquired properties are included in the Company’s results of operations based on their date of acquisition.
During 2012, the Company acquired seven lodging properties for a purchase price of $515,100. The Company records identifiable assets, liabilities, and goodwill acquired in a business combination at fair value. For properties acquired during the year ended December 31, 2012, the Company recorded revenue of $113,351 and
118
Table of Contents
XENIA HOTELS & RESORTS, INC.
Notes to Combined Consolidated Financial Statements
(Dollar amounts in thousands)
December 31, 2014, 2013 and 2012
net income of $3,363, not including related expensed acquisition costs in 2012. During the year ended December 31, 2012, the Company incurred $751 in acquisition costs. The following is a summary of acquisitions for the year ended December 31, 2012:
| Property |
Date | Purchase Price | Rooms (unaudited) |
|||||||||
| Marriott San Francisco Airport Waterfront |
3/23/2012 | $ | 108,000 | 685 | ||||||||
| Hilton St. Louis Downtown at the Arch |
3/23/2012 | 22,600 | 195 | |||||||||
| Renaissance Arboretum Austin Hotel |
3/23/2012 | 103,000 | 492 | |||||||||
| Renaissance Atlanta Waverly Hotel & Convention Center |
3/23/2012 | 97,000 | 521 | |||||||||
| Marriott Griffin Gate Resort & Spa |
3/23/2012 | 62,500 | 409 | |||||||||
| Bohemian Hotel Savannah Riverfront, an Autograph Collection Hotel |
8/9/2012 | 45,000 | 75 | |||||||||
| Grand Bohemian Hotel Orlando, an Autograph Collection Hotel |
12/27/2012 | 77,000 | 247 | |||||||||
|
|
|
|
|
|||||||||
| $ | 515,100 | 2,624 | ||||||||||
|
|
|
|
|
|||||||||
The following table summarizes the estimated fair value of the assets acquired and liabilities assumed in the Company’s 2012 acquisitions:
| 2012 Acquisitions | ||||
| Land |
$ | 73,890 | ||
| Building |
384,829 | |||
| Furniture, fixtures, and equipment |
39,573 | |||
|
|
|
|||
| Total fixed assets |
$ | 498,292 | ||
|
|
|
|||
| Goodwill |
23,435 | |||
| Net other assets and liabilities |
(6,627 | ) | ||
|
|
|
|||
| Total |
$ | 515,100 | ||
|
|
|
|||
The acquired properties are included in the Company’s results of operations based on their date of acquisition.
4. Dispositions
During the year ended December 31, 2014, Inland American sold 55 lodging properties with 7,457 rooms (unaudited) for a gross disposition price of $1,101,450 and received net proceeds of $1,085,451. In relation to the properties sold in 2014, the Company prepaid $95,306 of mortgage debt secured by 9 properties through defeasance. The Company incurred $8,042 in costs to defease these loans. These properties were sold prior to December 31, 2014.
| Property |
Date | Gross Disposition Price | Rooms (unaudited) | |||||||||
| Crowne Plaza Charleston (1) |
05/2014 | $ | 13,250 | 166 | ||||||||
| Doubletree Suites Atlanta Galleria (1) |
08/2014 | 12,600 | 154 | |||||||||
| Suburban Select Service Portfolio—52 |
11/2014 | 1,071,000 | 6,976 | |||||||||
| Holiday Inn—Secaucus (1) |
12/2014 | 4,600 | 161 | |||||||||
|
|
|
|
|
|||||||||
| Total |
$ | 1,101,450 | 7,457 | |||||||||
|
|
|
|
|
|||||||||
| (1) | included in net income (loss) from continuing operations in the combined consolidated statement of operations. |
| (2) | included in net income (loss) from discontinued operations in the combined consolidated statement of operations. |
119
Table of Contents
XENIA HOTELS & RESORTS, INC.
Notes to Combined Consolidated Financial Statements
(Dollar amounts in thousands)
December 31, 2014, 2013 and 2012
The Company sold three lodging properties for a gross disposition price of $19,800 during the year ended December 31, 2013 and received net proceeds of $11,435.
| Property |
Date | Gross Disposition Price | Rooms (unaudited) | |||||||||
| Baymont Inn—Jacksonville |
02/2013 | $ | 3,500 | 118 | ||||||||
| Homewood Suites—Durham |
03/2013 | 8,300 | 96 | |||||||||
| Fairfield Inn-Ann Arbor |
08/2013 | 8,000 | 109 | |||||||||
|
|
|
|
|
|||||||||
| Total |
$ | 19,800 | 323 | |||||||||
|
|
|
|
|
|||||||||
The Company sold thirteen lodging properties for a gross disposition price of $131,500 during the year ended December 31, 2012 and received net proceeds of $86,413.
| Property |
Date | Gross Disposition Price | Rooms (unaudited) | |||||||||
| Hilton Garden Inn—Akron |
07/2012 | $ | 15,500 | 121 | ||||||||
| Lodging portfolio—12 properties |
09/2012 | 116,000 | 1,643 | |||||||||
|
|
|
|
|
|||||||||
| Total |
$ | 131,500 | 1,764 | |||||||||
|
|
|
|
|
|||||||||
The Company has presented separately as discontinued operations in all periods the results of operations for the Suburban Select Service Portfolio and held for sale assets in combined consolidated statement of operations. The components of the Company’s discontinued operations are presented below and include the results of operations for the respective periods that the Company owned such assets or was involved with the operations of such ventures during the years ended December 31, 2014, 2013 and 2012.
| Year ended December 31, 2014 |
Year ended December 31, 2013 |
Year ended December 31, 2012 |
||||||||||
| Revenues |
$ | 224,490 | $ | 232,521 | $ | 266,594 | ||||||
| Depreciation and amortization expense |
36,049 | 50,614 | 66,335 | |||||||||
| Other expenses |
146,006 | 156,751 | 178,289 | |||||||||
| Provision for asset impairment |
— | — | 6,224 | |||||||||
|
|
|
|
|
|
|
|||||||
| Operating income from discontinued operations |
42,435 | 25,156 | 15,746 | |||||||||
|
|
|
|
|
|
|
|||||||
| Interest expense and other |
(33,048 | ) | (32,922 | ) | (37,580 | ) | ||||||
| Income tax benefit (expense) |
(4,568 | ) | 576 | (2,022 | ) | |||||||
| Gain on sale of properties, net |
135,692 | 1,564 | 6,985 | |||||||||
| Gain (loss) on extinguishment of debt |
(65,391 | ) | — | 4,239 | ||||||||
| Loss on transfer of assets |
— | — | (29 | ) | ||||||||
|
|
|
|
|
|
|
|||||||
| Net income (loss) from discontinued operations |
$ | 75,120 | $ | (5,626 | ) | $ | (12,661 | ) | ||||
|
|
|
|
|
|
|
|||||||
The Company classified 52 select service lodging properties as held for sale as of September 30, 2014, and the operations are reflected as discontinued operations on the combined consolidated statements of operations for the
120
Table of Contents
XENIA HOTELS & RESORTS, INC.
Notes to Combined Consolidated Financial Statements
(Dollar amounts in thousands)
December 31, 2014, 2013 and 2012
years December 31, 2014, 2013 and 2012. These 52 select service lodging properties represent a strategic shift and will also have a major impact on the consolidated financial statements. These 52 properties were sold on November 17, 2014.
Net cash provided by operating activities from the properties classified as held for sale for the years ended December 31, 2014, 2013 and 2012 was ($18,167), $41,901 and $35,078, respectively. Net cash provided by (used in) investing activities from the properties classified as held for sale for the years ended December 31, 2014, 2013 and 2012 was $1,043,343, ($6,022) and ($17,625), respectively.
5. Investment in Partially Owned Entities
Consolidated Entities
During the fourth quarter of 2013, the Company entered into two joint ventures to each develop a lodging property. The Company has ownership interests of 75% in each joint venture. These entities are considered VIEs as defined in FASB ASC 810 because the entities do not have enough equity to finance their activities without additional subordinated financial support. The Company determined that it has the power to direct the activities of VIEs that most significantly impact the VIEs’ economic performance, as well as the obligation to absorb losses of the VIEs that could potentially be significant to the VIEs or the right to receive benefits from the VIEs that could potentially be significant to the VIEs. As such, the Company has a controlling financial interest and is considered the primary beneficiary of each of these entities. Therefore, these entities are consolidated by the Company.
For these VIEs where the Company is the primary beneficiary, the following are the liabilities of the consolidated VIEs, which are not recourse to the Company, and the assets that can be used only to settle those obligations.
| December 31, 2014 | December 31, 2013 | |||||||
| Net investment properties |
$ | 39,736 | $ | 12,390 | ||||
| Other assets |
1,318 | — | ||||||
|
|
|
|
|
|||||
| Total assets |
$ | 41,054 | $ | 12,390 | ||||
| Mortgages, notes and margins payable |
(21,214 | ) | (5,749 | ) | ||||
| Other liabilities |
(6,465 | ) | (350 | ) | ||||
|
|
|
|
|
|||||
| Total liabilities |
$ | (27,679 | ) | $ | (6,099 | ) | ||
|
|
|
|
|
|||||
| Net assets |
$ | 13,375 | $ | 6,291 | ||||
|
|
|
|
|
|||||
Unconsolidated Entities
The entities listed below are owned by the Company and other unaffiliated parties in joint ventures. Net income, distributions and capital transactions for these properties are allocated to the Company and its joint venture partners in accordance with the respective partnership agreements. These entities are not consolidated by the Company and the equity method of accounting is used to account for these investments. Under the equity method of accounting, the net equity investment of the Company and the Company’s share of net income or loss from the unconsolidated entity are reflected in the combined consolidated balance sheets and the combined consolidated statements of operations.
121
Table of Contents
XENIA HOTELS & RESORTS, INC.
Notes to Combined Consolidated Financial Statements
(Dollar amounts in thousands)
December 31, 2014, 2013 and 2012
| Entity |
Description |
Ownership % | Investment at December 31, 2014 |
Investment at December 31, 2013 |
||||||||||
| Unconsolidated entities (a) |
Various real estate investments | Various | $ | — | $ | 1,736 | ||||||||
| a. | On February 21, 2014 the Company purchased its partners’ interest in one joint venture, which resulted in the Company obtaining control of the venture. Therefore, during the year ended December 31, 2014, the Company consolidated this entity, recorded the assets and liabilities of the joint venture at fair value, and recorded a gain of $4,509 on the purchase of this investment. At December 31, 2014, the Company no longer held any investments in unconsolidated entities. |
| For the year ended December 31, 2013, the Company recorded an impairment of $1,003 on a lodging joint venture and a gain of $487 on the sale of three lodging joint ventures. Gains and impairments of unconsolidated joint ventures are included in equity in earnings (loss), and gain , (loss) and (impairment) of investment in unconsolidated entities, net, on the combined consolidated statement of operations. |
In total, the Company recorded an impairment of $0, $1,003 and $2,465 related to one of its unconsolidated entities for the years ended December 31, 2014, 2013 and 2012, respectively.
Combined Financial Information
The following table presents the combined financial information for the Company’s investment in unconsolidated entities.
| Balance as of December 31, 2013 |
||||
| Balance Sheet: |
||||
| Assets: |
||||
| Real estate assets, net of accumulated depreciation |
$ | 14,400 | ||
| Other assets |
1,352 | |||
|
|
|
|||
| Total assets |
$ | 15,752 | ||
|
|
|
|||
| Liabilities and Equity: |
||||
| Mortgage debt |
$ | 12,230 | ||
| Other liabilities |
229 | |||
| Equity |
3,293 | |||
|
|
|
|||
| Total liabilities and equity |
$ | 15,752 | ||
|
|
|
|||
| Company’s share of equity |
$ | 1,729 | ||
| Net excess of cost of investments over net assets (net of accumulated depreciation of $1) |
7 | |||
|
|
|
|||
| Carrying value of investments in unconsolidated entities |
$ | 1,736 | ||
|
|
|
|||
122
Table of Contents
XENIA HOTELS & RESORTS, INC.
Notes to Combined Consolidated Financial Statements
(Dollar amounts in thousands)
December 31, 2014, 2013 and 2012
| Statements of Operations: |
January 1— February 20, 2014 |
For the year ended December 31, 2013 |
For the year ended December 31, 2012 |
|||||||||
| Revenues |
$ | 932 | $ | 7,950 | $ | 16,083 | ||||||
| Expenses: |
||||||||||||
| Interest expense and loan cost amortization |
43 | 636 | 2,030 | |||||||||
| Depreciation and amortization |
129 | 1,127 | 2,746 | |||||||||
| Operating expenses, ground rent and general and administrative expenses |
802 | 4,905 | 10,731 | |||||||||
| Termination fee |
325 | — | — | |||||||||
|
|
|
|
|
|
|
|||||||
| Total expenses |
1,299 | 6,668 | 15,507 | |||||||||
|
|
|
|
|
|
|
|||||||
| Net income (loss) |
$ | (367 | ) | $ | 1,282 | $ | 576 | |||||
|
|
|
|
|
|
|
|||||||
| Company’s share of net income (loss), net of excess basis depreciation of $0, $33 and $340 |
$ | (293 | ) | $ | 484 | $ | 147 | |||||
The unconsolidated entities had total third party mortgage debt of $12,230 at December 31, 2013, the entirety of which matured in 2014. Of the total outstanding debt, none was recourse to the Company.
6. Transactions with Related Parties
The following table summarizes the Company’s related party transactions for the years ended December 31, 2014, 2013 and 2012.
| For the years ended | ||||||||||||
| December 31, 2014 |
December 31, 2013 |
December 31, 2012 |
||||||||||
| General and administrative allocation (a) |
$ | 20,747 | $ | 11,658 | $ | 7,096 | ||||||
| Business management fee (b) |
1,474 | 12,743 | 10,812 | |||||||||
| Loan placement fees (c) |
68 | 208 | 716 | |||||||||
| (a) | General and administrative expense includes allocations of costs from certain corporate and shared functions provided to the Company by Inland American, as well as costs associated with participation by certain of the Company’s executives in Inland American’s benefit plans, . Inland American allocated to the Company a portion of corporate overhead costs incurred by Inland American which is based upon the Company’s percentage share of the average invested assets of Inland American. As Inland American is managing various asset portfolios, the extent of services and benefits a portfolio receives is based on the size of its assets. The Company believes that using average invested assets to allocate costs is a reasonable reflection of the services and other benefits received by the Company and complies with applicable accounting guidance. However, actual costs may have differed from allocated costs if the Company had operated as a standalone entity during such period and those differences may have been material. Amounts are inclusive of allocations to discontinued operations. |
| (b) | During the years ended December 31, 2014, 2013 and 2012, Inland American paid an annual business management fee to its external manager, Inland American Business Manager and Advisor, Inc. (the “Business Manager”) based on the average invested assets. The Company was allocated a portion of the business management fee based upon its percentage share of the average invested assets of Inland American for the years ended December 31, 2014, 2013 and 2012. On March 12, 2014, Inland American entered into a |
123
Table of Contents
XENIA HOTELS & RESORTS, INC.
Notes to Combined Consolidated Financial Statements
(Dollar amounts in thousands)
December 31, 2014, 2013 and 2012
| series of agreements and amendments to existing agreements with affiliates of The Inland Group, Inc. pursuant to which Inland American began the process of becoming entirely self-managed (collectively, the “Self-Management Transactions”). In connection with the Self-Management Transactions, Inland American agreed with the Business Manager to terminate its management agreement with the Business Manager. The Self-Management Transactions resulted in a final business management fee incurred in January 2014. As a result, the Company has not been allocated a business management fee after January 2014. |
| (c) | The Company pays a related party of Inland American 0.2% of the principal amount of each loan placed for the Company. Such costs are capitalized as loan fees and amortized over the respective loan term. |
As of December 31, 2014, the Company owed approximately $12,700 to Inland American for transaction costs associated with the spin-off which is reflected in Other liabilities on the combined consolidated balance sheets. The liability was paid concurrent with the Company’s separation. There were no liabilities due to Inland American as of December 31, 2013.
7. Intangible Assets and Goodwill
The following table summarizes the Company’s identified intangible assets, intangible liabilities and goodwill as of December 31, 2014 and 2013.
| Balance as of December 31, 2014 |
Balance as of December 31, 2013 |
|||||||
| Intangible assets: |
||||||||
| Acquired in-place lease |
$ | 3,127 | $ | 522 | ||||
| Acquired above market lease |
548 | 95 | ||||||
| Acquired below market ground lease |
20,026 | 10,536 | ||||||
| Advance bookings |
13,870 | 13,666 | ||||||
| Accumulated amortization |
(15,143 | ) | (10,471 | ) | ||||
|
|
|
|
|
|||||
| Net intangible assets |
22,428 | 14,348 | ||||||
| Goodwill |
42,113 | 42,113 | ||||||
|
|
|
|
|
|||||
| Total intangible assets, net |
$ | 64,541 | $ | 56,461 | ||||
|
|
|
|
|
|||||
| Intangible liabilities: |
||||||||
| Acquired below market lease |
$ | (4,631 | ) | $ | (4,258 | ) | ||
| Acquired above market ground lease |
(258 | ) | (258 | ) | ||||
| Accumulated amortization |
677 | 304 | ||||||
|
|
|
|
|
|||||
| Intangible liabilities, net |
$ | (4,212 | ) | $ | (4,212 | ) | ||
|
|
|
|
|
|||||
The portion of the purchase price allocated to acquired above market lease costs and acquired below market lease costs are amortized on a straight line basis over the life of the related lease, including the respective renewal period for below market lease costs with fixed rate renewals, as an adjustment to other revenues. Amortization pertaining to the above market lease costs was applied as a reduction to other revenues. Amortization pertaining to the below market lease costs was applied as an increase to other revenues. The portion of the purchase price allocated to acquired in-place lease intangibles is amortized on a straight line basis over the life of the related lease and is recorded as amortization expense. The portion of the purchase price allocated to acquired below market ground lease is amortized on a straight line basis over the life of the related lease and is recorded as other indirect expense. The portion of the purchase price allocated to advance bookings is amortized on a straight line basis over three years and is recorded as depreciation and amortization.
124
Table of Contents
XENIA HOTELS & RESORTS, INC.
Notes to Combined Consolidated Financial Statements
(Dollar amounts in thousands)
December 31, 2014, 2013 and 2012
The following table summarizes the amortization related to acquired above and below market lease costs and acquired in-place lease intangibles for the years ended December 31, 2014 and 2013. There was no amortization for the year ended December 31, 2012.
| For the years ended | ||||||||
| December 31, 2014 | December 31, 2013 | |||||||
| Amortization of: |
||||||||
| Acquired above market lease costs |
$ | (173 | ) | $ | (5 | ) | ||
| Acquired below market lease costs |
370 | 48 | ||||||
|
|
|
|
|
|||||
| Net rental income increase |
$ | 197 | $ | 43 | ||||
|
|
|
|
|
|||||
| Acquired in-place lease intangibles |
$ | 594 | $ | 48 | ||||
The following table presents the amortization during the next five years and thereafter related to intangible assets and liabilities at December 31, 2014.
| 2015 | 2016 | 2017 | 2018 | 2019 | Thereafter | Total | ||||||||||||||||||||||
| Amortization of: |
||||||||||||||||||||||||||||
| Acquired above market lease costs |
$ | (130 | ) | $ | (113 | ) | $ | (43 | ) | $ | (31 | ) | $ | (29 | ) | $ | (24 | ) | $ | (370 | ) | |||||||
| Acquired below market lease costs |
282 | 248 | 243 | 196 | 195 | 3,048 | 4,212 | |||||||||||||||||||||
|
|
|
|
|
|
|
|
|
|
|
|
|
|
|
|||||||||||||||
| Net other revenues increase |
$ | 152 | $ | 135 | $ | 200 | $ | 165 | $ | 166 | $ | 3,024 | $ | 3,842 | ||||||||||||||
|
|
|
|
|
|
|
|
|
|
|
|
|
|
|
|||||||||||||||
| Acquired in-place lease intangibles |
$ | 785 | $ | 710 | $ | 662 | $ | 190 | $ | 96 | $ | 41 | $ | 2,484 | ||||||||||||||
| Advance bookings |
2,377 | 1,379 | 11 | — | — | — | 3,767 | |||||||||||||||||||||
| Acquired below market ground lease |
(426 | ) | (426 | ) | (426 | ) | (426 | ) | (426 | ) | (13,677 | ) | (15,807 | ) | ||||||||||||||
8. Debt
During the years ended December 31, 2014 and 2013, the following debt transactions occurred:
| Balance at December 31, 2012 |
$ | 1,572,663 | ||
| New financings |
352,229 | |||
| Allocation of unsecured credit facility |
88,643 | |||
| Paydown of debt |
(61,536 | ) | ||
| Assumed financings, net of discount |
15,084 | |||
| Extinguishment of debt |
(155,855 | ) | ||
| Amortization of discount/premium |
1,514 | |||
| Held for sale |
(532,522 | ) | ||
|
|
|
|||
| Balance at December 31, 2013 |
$ | 1,280,220 | ||
| New financings |
122,940 | |||
| Allocation of unsecured credit facility |
7,377 | |||
| Paydown of debt |
(13,079 | ) | ||
| Assumed financings, net of discount |
12,084 | |||
| Extinguishment of debt |
(115,338 | ) | ||
| Amortization of discount/premium |
844 | |||
|
|
|
|||
| Balance at December 31, 2014 |
$ | 1,295,048 | ||
|
|
|
125
Table of Contents
XENIA HOTELS & RESORTS, INC.
Notes to Combined Consolidated Financial Statements
(Dollar amounts in thousands)
December 31, 2014, 2013 and 2012
Of the debt balance at December 31, 2013, $532,522 related to properties classified as held for sale. There were no properties classified as held for sale at December 31, 2014.
Mortgages Payable
Mortgage loans outstanding as of December 31, 2014 and 2013 were $1,200,688 and $1,726,550 and had a weighted average interest rate of 3.96% and 4.73% per annum, respectively. Of these mortgage loans outstanding at December 31, 2013 approximately $511,598 related to properties held for sale. Mortgage premium and discount, net, was a discount of $1,660 and $2,451 as of December 31, 2014 and 2013. Of this mortgage discount, net, a discount of $51 related to properties held for sale at December 31, 2013. As of December 31, 2014, scheduled maturities for the Company’s outstanding mortgage indebtedness had various due dates through December 2020, as follows:
| As of December 31, 2014 |
Weighted average interest rate |
|||||||
| 2015 |
$ | 90,950 | 4.31 | % | ||||
| 2016 |
349,439 | 5.22 | % | |||||
| 2017 |
197,830 | 5.18 | % | |||||
| 2018 |
197,447 | 2.88 | % | |||||
| 2019 |
326,700 | 2.52 | % | |||||
| Thereafter |
38,322 | 3.10 | % | |||||
|
|
|
|||||||
| Total |
$ | 1,200,688 | 3.96 | % | ||||
|
|
|
|||||||
The amount maturing in 2015 represents two separate mortgages with maturity dates in 2015. On March 2, 2015, one of these mortgages was extended to 2016. It is anticipated that the Company will be able to repay, refinance or extend the maturities and the Company believes it has adequate sources of funds to meet short term cash needs related to these refinancings. Of the total outstanding debt, approximately $31,285 is recourse to the Company.
Some of the mortgage loans require compliance with certain covenants, such as debt service ratios, investment restrictions and distribution limitations. As of December 31, 2014, the Company was in compliance with all such covenants, with the potential exception of one hotel which was closed during the fourth quarter due to earthquake damage and reopened in January 2015.
Unsecured credit facility
In May 2013, Inland American entered into an unsecured credit facility in the aggregate amount of $500,000. The credit facility consists of a $300,000 unsecured revolving line of credit and the total outstanding term loan is $200,000. The unsecured line of credit matures on May 7, 2016 and the unsecured term loan matures on May 7, 2017. To the extent the Company’s assets were included within the pool of unencumbered assets, the Company was allocated its proportionate share of the unsecured credit facility. The Company’s allocated portion of the unsecured credit facility as of December 31, 2014 was $96,020. As of December 31, 2014, there was no outstanding balance on the revolving line of credit. As of December 31, 2014, the interest rate of the unsecured term loan was 1.67%.
The Company’s allocated portion of the unsecured credit facility as of December 31, 2013 was $88,643. Of the allocated portion at December 31, 2013, approximately $20,975 related to properties held for sale. As of December 31, 2013, the interest rates of the revolving line of credit and unsecured term loan were 1.60% and 1.67%, respectively.
126
Table of Contents
XENIA HOTELS & RESORTS, INC.
Notes to Combined Consolidated Financial Statements
(Dollar amounts in thousands)
December 31, 2014, 2013 and 2012
9. Fair Value Measurements
In accordance with FASB ASC 820, Fair Value Measurement and Disclosures, the Company defines fair value based on the price that would be received upon sale of an asset or the exit price that would be paid to transfer a liability in an orderly transaction between market participants at the measurement date. The Company uses a fair value hierarchy that prioritizes observable and unobservable inputs used to measure fair value. The fair value hierarchy consists of three broad levels, which are described below:
| • | Level 1—Quoted prices for identical assets or liabilities in active markets that the entity has the ability to access. |
| • | Level 2—Observable inputs, other than quoted prices included in Level 1, such as quoted prices for similar assets and liabilities in active markets; quoted prices for identical or similar assets and liabilities in markets that are not active; or other inputs that are observable or can be corroborated by observable market data. |
| • | Level 3—Unobservable inputs that are supported by little or no market activity and that are significant to the fair value of the assets and liabilities. This includes certain pricing models, discounted cash flow methodologies and similar techniques that use significant unobservable inputs. |
The Company has estimated the fair value of its financial and non-financial instruments using available market information and valuation methodologies the Company believes to be appropriate for these purposes. Considerable judgment and a high degree of subjectivity are involved in developing these estimates and, accordingly, they are not necessarily indicative of amounts that would be realized upon disposition.
Non-Recurring Measurements
Level 3
The following table summarizes activity for the Company’s assets measured at fair value on a non-recurring basis. The Company recognized certain impairment charges to reflect the investments at their fair values for the years ended December 31, 2014 and 2013. The asset groups that were reflected at fair value through this evaluation are:
| As of December 31, 2014 | As of December 31, 2013 | |||||||||||||||
| Fair Value Measurements Using Significant Unobservable Inputs (Level 3) |
Total Impairment Losses |
Fair Value Measurements Using Significant Unobservable Inputs (Level 3) |
Total Impairment Losses |
|||||||||||||
| Investment properties |
$ | 17,200 | $ | 5,378 | $ | 44,575 | $ | 49,145 | ||||||||
| Investment in unconsolidated entities |
— | — | 1,794 | 1,003 | ||||||||||||
|
|
|
|
|
|
|
|
|
|||||||||
| Total |
$ | 17,200 | $ | 5,378 | $ | 46,369 | $ | 50,148 | ||||||||
|
|
|
|
|
|
|
|
|
|||||||||
Investment Properties
During the years ended December 31, 2014 and 2013, the Company identified certain properties which may have a reduction in the expected holding period and reviewed the probability of these assets’ dispositions. The Company’s estimated fair value relating to the investment properties’ impairment analysis was based on a
127
Table of Contents
XENIA HOTELS & RESORTS, INC.
Notes to Combined Consolidated Financial Statements
(Dollar amounts in thousands)
December 31, 2014, 2013 and 2012
comparison of letters of intent or purchase contracts, broker opinions of value and ten-year discounted cash flow models, which include contractual inflows and outflows over a specific holding period. The cash flows consist of observable inputs such as contractual revenues and unobservable inputs, such as forecasted revenues and expenses. These unobservable inputs are based on market conditions and the Company’s expected growth rates. For the years ended December 31, 2014 and 2013, the Company estimated fair value using letters of intent and purchase contracts.
For the years ended, December 31, 2014, 2013 and 2012, the Company recorded an impairment of investment properties of $5,378, $49,145 and $0, respectively. Certain properties have been disposed and were impaired prior to disposition and the related impairment charge of $0, $0 and $6,224 was included in discontinued operations for the years ended December 31, 2014, 2013 and 2012, respectively.
Investment in Unconsolidated Entities
For the years ended December 31, 2014 and 2013, the Company identified certain investments in unconsolidated entities that may be other than temporarily impaired. The Company’s estimated fair value relating to the investment in unconsolidated entities’ impairment analysis was based on analyzing each joint venture partner’s respective waterfall distribution, letters of intent or purchase contracts, broker opinions of value, and expected future cash distributions of the Company’s interest in the underlying assets of the investment using a net asset value model. The net asset value model utilizes an income capitalization analysis and consists of unobservable inputs such as forecasted net operating income and capitalization rates based on market conditions. For the years ended December 31, 2014 and 2013, the Company estimated fair value using letters of intent and purchase contracts.
For the years ended December 31, 2014, 2013 and 2012, the Company recorded an impairment of $0, $1,003 and $2,465, respectively, related to one of its unconsolidated entities.
Financial Instruments not Measured at Fair Value
The table below represents the fair value of financial instruments presented at carrying values in the Company’s combined consolidated financial statements as of December 31, 2014 and 2013.
| December 31, 2014 | December 31, 2013 | |||||||||||||||
| Carrying Value | Estimated Fair Value | Carrying Value | Estimated Fair Value | |||||||||||||
| Mortgages payable |
$ | 1,200,688 | $ | 1,194,237 | $ | 1,726,550 | $ | 1,713,871 | ||||||||
| Unsecured credit facility |
96,020 | 96,020 | 88,643 | 88,643 | ||||||||||||
The Company estimates the fair value of its mortgages payable using a weighted average effective interest rate of 3.96% per annum. The fair value estimate of the unsecured credit facility approximates the carrying value. The assumptions reflect the terms currently available on similar borrowing terms to borrowers with credit profiles similar to the Company’s. The Company has determined that its debt instrument valuations are classified in Level 2 of the fair value hierarchy.
10. Income Taxes
The Company intends to elect to be taxed as, and operate in a manner that will allow the Company to qualify as, a real estate investment trust (“REIT”) under the Internal Revenue Code of 1986, as amended, for federal income
128
Table of Contents
XENIA HOTELS & RESORTS, INC.
Notes to Combined Consolidated Financial Statements
(Dollar amounts in thousands)
December 31, 2014, 2013 and 2012
tax purposes. If the Company qualifies for taxation as a REIT, the Company generally will not be subject to U.S. federal corporate income tax on its net taxable income that is currently distributed to its stockholders. A REIT is subject to a number of organizational and operational requirements, including a requirement that it currently distributes at least 90% of its REIT taxable income (subject to certain adjustments) to its stockholders. If the Company fails to qualify as a REIT in any taxable year, without the benefit of certain relief provisions, the Company will be subject to federal and state income tax on its taxable income at regular corporate tax rates. Even if the Company qualifies for taxation as a REIT, the Company also may be subject to certain federal, state, and local taxes on its income and assets, including (1) alternative minimum taxes, (2) taxes on any undistributed income, (3) taxes related to its taxable REIT subsidiaries, (4) certain state or local income taxes, (5) franchise taxes, (6) property taxes, and (7) transfer taxes.
The Company intends to elect to treat certain of its consolidated subsidiaries, and may in the future elect to treat newly formed subsidiaries, as taxable REIT subsidiaries pursuant to the Internal Revenue Code. Taxable REIT subsidiaries may participate in non-real estate related activities and/or perform non-customary services for tenants and are subject to federal and state income tax at regular corporate tax rates. The Company’s hotels are leased to certain of the Company’s taxable REIT subsidiaries. Lease revenue from these taxable REIT subsidiaries and its wholly-owned subsidiaries are eliminated in consolidation for financial statement purposes.
The benefit (provision) for income taxes related to continuing operations consists of the following:
| Years Ended December 31, | ||||||||||||
| 2014 | 2013 | 2012 | ||||||||||
| Current: |
||||||||||||
| Federal |
$ | (1,340 | ) | $ | (709 | ) | $ | 1,574 | ||||
| State |
(1,102 | ) | (1,225 | ) | (347 | ) | ||||||
|
|
|
|
|
|
|
|||||||
| Total current |
$ | (2,442 | ) | $ | (1,934 | ) | $ | 1,227 | ||||
|
|
|
|
|
|
|
|||||||
| Deferred: |
||||||||||||
| Federal |
$ | (3,303 | ) | $ | (1,501 | ) | $ | (5,207 | ) | |||
| State |
(120 | ) | (184 | ) | 285 | |||||||
|
|
|
|
|
|
|
|||||||
| Total deferred |
$ | (3,423 | ) | $ | (1,685 | ) | $ | (4,922 | ) | |||
|
|
|
|
|
|
|
|||||||
| Total tax benefit (provision) |
$ | (5,865 | ) | $ | (3,619 | ) | $ | (3,695 | ) | |||
| Total tax benefit (provision) attributable to discontinued operations |
$ | (4,568 | ) | $ | 576 | $ | (2,022 | ) | ||||
Below is a reconciliation between the benefit (provision) for income taxes and the amount computed by applying the federal statutory income tax rate to the income or loss for continuing operations before income taxes:
| Years Ended December 31, | ||||||||||||||||||||||||
| 2014 | 2013 | 2012 | ||||||||||||||||||||||
| Book Income before Taxes |
$ | 40,544 | $ | (42,223 | ) | $ | (24,101 | ) | ||||||||||||||||
| Benefit (provision) for income taxes at statutory rate |
(14,199 | ) | 35.00 | % | 14,778 | 35.00 | % | 8,435 | 35.00 | % | ||||||||||||||
| Tax benefit related to REIT operations |
8,786 | -21.66 | % | (17,241 | ) | -40.83 | % | (11,112 | ) | -46.11 | % | |||||||||||||
| Income for which no federal tax benefit was recognized |
(3,092 | ) | 7.62 | % | (617 | ) | -1.46 | % | (18 | ) | -0.07 | % | ||||||||||||
| Valuation allowances |
3,496 | -8.62 | % | 117 | 0.28 | % | (605 | ) | -2.51 | % | ||||||||||||||
| State tax (provision) benefit, net of federal |
(1,015 | ) | 2.50 | % | (642 | ) | -1.52 | % | (820 | ) | -3.40 | % | ||||||||||||
| Other |
159 | -0.39 | % | (14 | ) | -0.03 | % | 425 | 1.76 | % | ||||||||||||||
|
|
|
|
|
|
|
|||||||||||||||||||
| Total Tax Expense |
$ | (5,865 | ) | 14.45 | % | $ | (3,619 | ) | -8.56 | % | $ | (3,695 | ) | -15.33 | % | |||||||||
|
|
|
|
|
|
|
|||||||||||||||||||
129
Table of Contents
XENIA HOTELS & RESORTS, INC.
Notes to Combined Consolidated Financial Statements
(Dollar amounts in thousands)
December 31, 2014, 2013 and 2012
Deferred tax assets and liabilities are included within deferred costs and other assets and other liabilities in the combined consolidated balance sheets, respectively, and are attributed to the activity of the Company’s taxable REIT subsidiaries. The components of the deferred tax assets and liabilities at December 31, 2014 and 2013 were as follows:
| 2014 | 2013 | |||||||
| Net operating loss |
$ | 6,471 | $ | 9,234 | ||||
| Deferred income |
1,833 | 2,389 | ||||||
| Basis difference on property |
— | 3,449 | ||||||
| Depreciation expense |
1,066 | 986 | ||||||
| Miscellaneous |
201 | 431 | ||||||
|
|
|
|
|
|||||
| Total deferred tax assets |
9,571 | 16,489 | ||||||
| Less: Valuation allowance |
(7,178 | ) | (10,674 | ) | ||||
|
|
|
|
|
|||||
| Net deferred tax assets |
$ | 2,393 | $ | 5,815 | ||||
|
|
|
|
|
|||||
At December 31, 2014, the Company had U.S. federal and state net operating loss carryforwards of approximately $16.9 million and $27.8 million, respectively which begin to expire in 2023. Of the Company’s U.S. federal net operating loss carryforwards, $11.2 million are subject to limitation and the Company has established a valuation allowance against such amounts.
Deferred tax assets are recognized only to the extent that it is more likely than not that they will be realized based on consideration of available evidence, including future reversal of existing taxable temporary differences, future projected taxable income, and tax-planning strategies. In assessing the realizability of deferred tax assets, management considers whether it is more likely than not that some portion or all of the deferred tax assets will not be realized. The ultimate realization of deferred tax assets is dependent upon the generation of future taxable income during the periods in which those temporary differences become deductible. The Company has considered various factors, including future reversals of existing taxable temporary differences, projected future taxable income, and tax-planning strategies in making this assessment.
Based upon tax-planning strategies and projections for future taxable income over the periods in which the deferred tax assets are deductible, management believes it is more likely than not that the Company will realize the benefits of these deductible differences, net of the existing valuation allowance of $7,178, at December 31, 2014. The amount of the deferred tax assets considered realizable, however, could be reduced in the near term if estimates of future taxable income during the carryforward period are reduced.
During 2014 the Company reversed $3.5 million of valuation allowance associated with a basis difference on certain property. In connection with the disposal of the property held by a TRS at a taxable loss in 2014, the Company has determined that such difference will be fully realized.
Uncertain Tax Positions
The Company had no unrecognized tax benefits as of or during the three year period ended December 31, 2014. The Company expects no significant increases or decreases in unrecognized tax benefits due to changes in tax positions within one year of December 31, 2014. The Company has no material interest or penalties relating to income taxes recognized in the combined consolidated statements of operations for the years ended
130
Table of Contents
XENIA HOTELS & RESORTS, INC.
Notes to Combined Consolidated Financial Statements
(Dollar amounts in thousands)
December 31, 2014, 2013 and 2012
December 31, 2014, 2013 and 2012 or in the combined consolidated balance sheets as of December 31, 2014 and 2013. As of December 31, 2014, the Company’s 2014, 2013, and 2012 tax years remain subject to examination by U.S. and various state tax jurisdictions.
11. Commitments and Contingencies
Certain leases and operating agreements require the Company to reserve funds relating to replacements and renewals of the hotels’ furniture, fixtures and equipment. As of December 31, 2014 the Company has funded $76,280 in reserves for future improvements. This amount is included in restricted cash and escrows on the combined consolidated balance sheet as of December 31, 2014.
The Company is subject, from time to time, to various legal proceedings and claims that arise in the ordinary course of business. While the resolution of these matters cannot be predicted with certainty, management believes, based on currently available information, that the final outcome of such matters will not have a material adverse effect on the financial statements of the Company.
In addition, in connection with the Company’s separation from Inland American, on August 8, 2014, the Company has entered into an Indemnity Agreement with Inland American pursuant to which Inland American has agreed, to the fullest extent allowed by law or government regulation, to absolutely, irrevocably and unconditionally indemnify, defend and hold harmless the Company and its subsidiaries, directors, officers, agents, representatives and employees (in each case, in such person’s respective capacity as such) and their respective heirs, executors, administrators, successors and assignees from and against all losses, including but not limited to “actions” (as defined in the Indemnity Agreement), arising from: (1) the ongoing non-public, formal, fact-finding investigation by the SEC as described in Inland American’s public filings with the SEC (the “SEC Investigation”); (2) the three related demands (including the Derivative Lawsuit described below) received by Inland American (“Derivative Demands”) from stockholders to conduct investigations regarding claims similar to the matters that are subject to the SEC Investigation and as described in Inland American’s public filings with the SEC; (3) the derivative lawsuit filed on March 21, 2013 on behalf of Inland American by counsel for stockholders who made the first Derivative Demand (the “Derivative Lawsuit”); and (4) the investigation by the Special Litigation Committee of the board of directors of Inland American. In each case, regardless of when or where the loss took place, or whether any such loss, claim, accident, occurrence, event or happening is known or unknown, and regardless of whether such loss, claim, accident, occurrence, event or happening giving rise to the loss existed prior to, on or after February 3, 2015, the separation date or relates to, arises out of or results from actions, inactions, events, omissions, conditions, facts or circumstances occurring or existing prior to, on or after February 3, 2015, the separation date.
131
Table of Contents
XENIA HOTELS & RESORTS, INC.
Notes to Combined Consolidated Financial Statements
(Dollar amounts in thousands)
December 31, 2014, 2013 and 2012
Ground Leases
The following table summarizes the remaining primary term, renewal rights, purchase rights and monthly base rent as of December 31, 2014 associated with land underlying the Company’s hotels and meeting facilities that the Company leases from third parties:
| Property |
Current Lease Term Expiration |
Renewal Rights / Purchase Rights |
Current Monthly Minimum or Base Rent |
Base Rent Increases at Renewal |
Lease Type |
|||||||||
| Aston Waikiki Beach Hotel |
December 31, 2057 | No renewal rights (1) |
$ | 191 | (2) | Not applicable | Triple Net | |||||||
| Hyatt Regency Santa Clara |
April 30, 2035 | 4 x 10 years, 1 x 9 years (3) |
$ | 60 | (4) | No increase unless lessee exercises its option to expand at which time base rent will be increased by $800 for each additional hotel room in excess of 500 | Triple Net | |||||||
| Marriott Charleston Town Center |
December 11, 2032 | 4 x 10 years | $ | 4 | No increase unless hotel is expanded beyond 356 guest rooms, at which time rent shall increase on a pro rata basis (5) | Triple Net | ||||||||
| Hilton University of Florida Conference Center Gainesville |
March 31, 2073 | None | $ | 3 | Not applicable | Triple Net | ||||||||
| Marriott Atlanta Century Center / Emory Area |
December 31, 2058 | None | $ | 3 | Not applicable | Triple Net | ||||||||
| Convention Center at Marriott Woodlands Waterway Hotel & Convention Center |
June 30, 2100 | No renewal rights (6) |
$ | 10 | (7) | Not applicable | Triple Net | |||||||
| (1) | Tenant has a right of first refusal to purchase the property, which must be exercised within 30 days of receiving the third party’s terms from landlord. |
| (2) | For and during the period from January 1, 2006 to December 31, 2029, the minimum rent for each year is adjusted based on a calculation tied to the Consumer Price Index. The monthly minimum or base rent in this chart is for the period from January 1, 2014 through December 31, 2014. |
| (3) | Tenant has a right of first refusal to purchase all or a portion of certain areas covered by the two separate leases. |
| (4) | In addition to minimum rent, the Company may owe variable incentive rent. |
| (5) | If the hotel is increased from 356 rooms to 500 rooms, the new annual base rent will be $71,500. |
| (6) | Tenant has a right of first refusal to purchase the property, which must be exercised within 60 days of receiving the third party’s terms from landlord. |
| (7) | For and during the period from June 29, 2006 to June 28, 2100, the base rent for each year is adjusted based on a calculation tied to the Consumer Price Index. The monthly minimum or base rent in this chart is for the period from June 29, 2014 through June 28, 2015. |
All of the Company’s ground leases are accounted for as operating leases. For lease agreements with scheduled rent increases, we recognize the lease expense ratably over the term of the lease. During the years ended December 31, 2014, 2013 and 2012, we recognized ground lease expense of $4,230, $836 and $318, respectively, which is included in other indirect expenses on the combined consolidated statements of operations.
132
Table of Contents
XENIA HOTELS & RESORTS, INC.
Notes to Combined Consolidated Financial Statements
(Dollar amounts in thousands)
December 31, 2014, 2013 and 2012
As of December 31, 2014, future minimum ground lease payments are as follows:
| 2015 |
$ | 3,256 | ||
| 2016 |
3,256 | |||
| 2017 |
3,256 | |||
| 2018 |
3,256 | |||
| 2019 |
3,256 | |||
| Thereafter |
111,957 | |||
|
|
|
|||
| Total |
$ | 128,237 | ||
|
|
|
12. Assets and Liabilities Held for Sale
In accordance with GAAP, the Company classifies assets as held for sale when certain criteria are met. Once the criteria are met, the Company suspends depreciation and amortization on the assets held for sale. The assets and liabilities associated with those investment properties that are held for sale are classified separately on the combined consolidated balance sheets for all reporting periods and recorded at the lesser of the carrying value or fair value less costs to sell. This criteria was met in 2014 and the combined consolidated balance sheet at December 31, 2013 was recast to reflect these assets and liabilities as held for sale and were recorded at their carrying value. Additionally, the operations for those investment properties classified as held for sale are classified on the combined consolidated statements of operations as discontinued operations for all periods presented. There were no properties classified as held for sale at December 31, 2014.
On September 17, 2014, Inland American entered into a purchase agreement to sell a portfolio of lodging assets, consisting of 52 select service lodging properties with 6,976 rooms in a transaction valued at approximately $1,100,000. The sale closed in a single transaction on November 17, 2014 with a gross disposition price of $1,071,000, with net proceeds from the sale resulting in a gain. These hotels have been classified as held for sale on the combined consolidated balance sheet as of December 31, 2013 and the operations are reflected as discontinued operations on the combined consolidated statements of operations for the years ended December 31, 2014, 2013 and 2012.
The major classes of assets and liabilities associated with the held for sale assets as of December 31, 2013 are as follows:
| December 31, 2013 | ||||
| Land |
$ | 172,039 | ||
| Building and other improvements |
1,107,058 | |||
|
|
|
|||
| Total |
$ | 1,279,097 | ||
| Less accumulated depreciation |
(343,070 | ) | ||
|
|
|
|||
| Net investment properties |
$ | 936,027 | ||
| Accounts and rents receivable, net |
4,023 | |||
| Deferred costs and other assets |
6,866 | |||
|
|
|
|||
| Total assets |
$ | 946,916 | ||
|
|
|
|||
| Debt |
$ | 532,522 | ||
| Accounts payable and accrued expenses |
3,231 | |||
| Other liabilities |
10,253 | |||
|
|
|
|||
| Total liabilities |
$ | 546,006 | ||
|
|
|
|||
133
Table of Contents
XENIA HOTELS & RESORTS, INC.
Notes to Combined Consolidated Financial Statements
(Dollar amounts in thousands)
December 31, 2014, 2013 and 2012
13. Subsequent Events
On January 5, 2015, the Company issued 125 shares of the Series A Preferred Stock in a private placement to approximately 125 investors who qualify as “accredited investors” (as that term is defined in Rule 501(a) of Regulation D under the Securities Act) in reliance upon the exemption from the registration requirements of the Securities Act pursuant to Rule 506 of Regulation D, relative to transactions by an issuer not involving any public offering, to the extent an exemption from such registration was required.
On February 3, 2015, Xenia Hotels & Resorts, Inc., a Maryland corporation, was spun-off from Inland American Real Estate Trust, Inc. (“Inland American”), its former parent, through a taxable pro-rata distribution by Inland American of 95% of the outstanding common stock, $0.01 par value per share (the “Common Stock”), of Xenia to holders of record of Inland American’s common stock as of the close of business on January 20, 2015 (the “Record Date”). Each holder of record of Inland American’s common stock received one share of Common Stock for every eight shares of Inland American’s common stock held at the close of business on the Record Date (the “Distribution”). In lieu of fractional shares, stockholders of Inland American received cash. On February 4, 2015, Xenia’s Common Stock began trading on the New York Stock Exchange (“NYSE”) under the ticker symbol “XHR.” As a result of the Distribution, the Company became a stand-alone, publicly-traded company.
Effective February 3, 2015, the Company entered into a $400 million unsecured revolving credit facility with a syndicate of banks. The revolving credit facility includes an uncommitted accordion feature which, subject to certain conditions, allows us to increase the aggregate availability by up to $350 million. The Company expects borrowings under the revolving credit facility to bear interest based on LIBOR plus a margin ranging from 1.50% to 2.45% (or, at our election upon achievement of an investment grade rating from Moody’s Investor Services, Inc. or Standard & Poor’s Rating Services, interest based on LIBOR plus a margin ranging from 0.875% to 1.50%). In addition, until such election, the Company expects to pay an unused fee of up to 0.30% of the unused portion of the credit facility based on the average daily unused portion of the credit facility; thereafter, the Company expects to pay a facility fee ranging between 0.125% and 0.35% based on the Company’s debt rating.
On February 4, 2015, in conjunction with the listing of our common stock on the NYSE, the Company commenced a modified “Dutch Auction” self-tender offer (the “Tender Offer”) to purchase for cash up to $125 million in value of shares of the Company’s common stock at a price not greater than $21.00 nor less than $19.00 per share, net to the seller in cash, less any applicable withholding of taxes and without interest. The Tender Offer expired at 5:00 P.M., New York City Time, on March 5, 2015. As a result of the Tender Offer, the Company accepted for purchase 1,759,344 shares of its common stock at a purchase price of $21.00 per share, for an aggregate purchase price of $36.9 million (excluding fees and expenses relating to the Tender Offer), which was funded from cash on hand. The 1,759,344 shares of common stock accepted for purchase in the Tender Offer represent approximately 1.6% of the Company’s common stock outstanding as of February 3, 2015, the last day prior to the commencement of the Tender Offer. Stockholders who properly tendered and did not properly withdraw shares of common stock in the Tender Offer at or below the final purchase price of $21.00 per share had all of their tendered shares of common stock purchased by the Company at $21.00 per share. Immediately following completion of the Tender Offer, the Company had approximately 111,664,641 shares of common stock outstanding.
On March 2, 2015, the Company paid $26.3 million to retire a mortgage related to Andaz San Diego and extended the maturity on one loan of $34.9 million by one year to March 2016.
134
Table of Contents
XENIA HOTELS & RESORTS, INC.
Notes to Combined Consolidated Financial Statements
(Dollar amounts in thousands)
December 31, 2014, 2013 and 2012
On March 13, 2015, the Company’s Board of Directors authorized a cash dividend of $0.1457 per share of the Company’s Common Stock for the first quarter of 2015. The dividend represents the Company’s anticipated regular quarterly dividend of $0.23 per share, prorated for the period from February 3, 2015, the Distribution date, to March 31, 2015, the last day of the first quarter. The dividend will be paid on April 15, 2015 to all holders of record of the Company’s Common Stock as of the close of business on March 31, 2015. For additional information, see “Part II—Item 5. Market for Registrant’s Common Equity, Related Stockholder Matters and Issuer Purchases of Equity Securities – Dividends.”
14. Quarterly Operating Results (Unaudited)
The following represents the results of operations, for each quarterly period, during 2014 and 2013.
| For the quarter ended | ||||||||||||||||
| December 31, 2014 |
September 30, 2014 |
June 30, 2014 |
March 31, 2014 |
|||||||||||||
| Total revenues |
$ | 229,939 | $ | 231,090 | $ | 247,112 | $ | 218,525 | ||||||||
| Net (loss) income from continuing operations |
(6,017 | ) | 5,718 | 24,343 | 10,635 | |||||||||||
| Net income (loss) from discontinued operations |
81,120 | 3,774 | (1,460 | ) | (8,314 | ) | ||||||||||
| Net income attributable to Company |
75,102 | 9,493 | 22,884 | 2,320 | ||||||||||||
| For the quarter ended | ||||||||||||||||
| December 31, 2013 |
September 30, 2013 |
June 30, 2013 |
March 31,2013 |
|||||||||||||
| Total revenues |
$ | 205,058 | $ | 156,676 | $ | 158,822 | $ | 131,315 | ||||||||
| Net (loss) income from continuing operations |
(16,278 | ) | (28,304 | ) | 7,025 | (8,285 | ) | |||||||||
| Net (loss) income from discontinued operations |
(5,045 | ) | 1,880 | 1,829 | (4,290 | ) | ||||||||||
| Net (loss) income attributable to Company |
(21,323 | ) | (26,424 | ) | 8,855 | (12,576 | ) | |||||||||
135
Table of Contents
XENIA HOTELS & RESORTS, INC.
Schedule III
Real Estate and Accumulated Depreciation
(Dollar amounts in thousands)
December 31, 2014
| Initial Cost (A) | Gross amount at which carried at end of period |
|||||||||||||||||||||||||||||||||||||||||||||||
| Encumbrance | Land | Buildings and Improvements |
Adjustments to Land Basis (C) |
Adjustments to Basis (C) |
Land and Improvements |
Buildings and Improvements (D) |
Total (D,E) | Accumulated Depreciation (D,F) |
Year of Original Construction |
Date of Acquisition |
Life on Which Depreciation in Latest Income Statement is Computed |
|||||||||||||||||||||||||||||||||||||
| Andaz Napa Valley |
$ | 30,500 | $ | 10,150 | $ | 57,012 | $ | — | $ | (779 | ) | $ | 10,150 | $ | 56,233 | $ | 66,383 | $ | 4,117 | 2009 | 9/20/2013 | 5 - 30 years | ||||||||||||||||||||||||||
| Andaz San Diego |
26,315 | 6,949 | 43,430 | — | 382 | 6,949 | 43,812 | 50,761 | 4,077 | 1914 | 3/4/2013 | 5 - 30 years | ||||||||||||||||||||||||||||||||||||
| Andaz Savannah |
21,500 | 2,680 | 36,212 | — | 106 | 2,680 | 36,318 | 38,998 | 1,984 | 2009 | 9/10/2013 | 5 - 30 years | ||||||||||||||||||||||||||||||||||||
| Aston Waikiki Beach Hotel |
— | — | 171,989 | — | — | — | 171,989 | 171,989 | 6,955 | 1969 | 2/28/2014 | 5 - 30 years | ||||||||||||||||||||||||||||||||||||
| Bohemian Hotel Celebration, an Autograph Collection Hotel |
— | 1,232 | 19,000 | — | 231 | 1,232 | 19,231 | 20,463 | 1,810 | 1999 | 2/6/2013 | 5 - 30 years | ||||||||||||||||||||||||||||||||||||
| Bohemian Hotel Savannah, an Autograph Collection Hotel |
27,480 | 2,300 | 24,240 | — | 640 | 2,300 | 24,880 | 27,180 | 3,531 | 2009 | 8/9/2012 | 5 - 30 years | ||||||||||||||||||||||||||||||||||||
| Courtyard Birmingham Downtown at UAB |
13,650 | — | 20,810 | 1,553 | 2,072 | 1,553 | 22,882 | 24,435 | 8,740 | 2005 | 2/8/2008 | 5 - 30 years | ||||||||||||||||||||||||||||||||||||
| Courtyard Fort Worth Downtown/Blackstone |
— | 774 | 45,820 | — | 4,521 | 774 | 50,341 | 51,115 | 17,798 | 1929 | 2/8/2008 | 5 - 30 years | ||||||||||||||||||||||||||||||||||||
| Courtyard Kansas City Country Club Plaza |
— | 3,426 | 16,349 | — | 3,517 | 3,426 | 19,866 | 23,292 | 7,853 | 1926 | 7/1/2007 | 5 - 30 years | ||||||||||||||||||||||||||||||||||||
| Courtyard Pittsburgh Downtown |
23,261 | 2,700 | 33,086 | — | 2,186 | 2,700 | 35,272 | 37,972 | 7,674 | 1898/1902 | 5/11/2010 | 5 - 30 years | ||||||||||||||||||||||||||||||||||||
| DoubleTree by Hilton Hotel |
— | 25,857 | 56,964 | — | 3,484 | 25,857 | 60,448 | 86,305 | 20,684 | 1960 | 2/8/2008 | 5 - 30 years | ||||||||||||||||||||||||||||||||||||
| Embassy Suites Baltimore North/Hunt Valley |
— | 2,429 | 38,927 | — | 4,969 | 2,429 | 43,896 | 46,325 | 17,077 | 1985 | 2/8/2008 | 5 - 30 years | ||||||||||||||||||||||||||||||||||||
| Fairmont Dallas |
56,892 | 8,700 | 60,634 | — | 13,157 | 8,700 | 73,791 | 82,491 | 15,830 | 1968 | 8/1/2011 | 5 - 30 years | ||||||||||||||||||||||||||||||||||||
136
Table of Contents
XENIA HOTELS & RESORTS, INC.
Schedule III
Real Estate and Accumulated Depreciation
(Dollar amounts in thousands)
December 31, 2014
| Initial Cost (A) | Gross amount at which carried at end of period |
|||||||||||||||||||||||||||||||||||||||||||||||
| Encumbrance | Land | Buildings and Improvements |
Adjustments to Land Basis (C) |
Adjustments to Basis (C) |
Land and Improvements |
Buildings and Improvements (D) |
Total (D,E) | Accumulated Depreciation (D,F) |
Year of Original Construction |
Date of Acquisition |
Life on Which Depreciation in Latest Income Statement is Computed |
|||||||||||||||||||||||||||||||||||||
| Grand Bohemian Hotel Orlando, an Autograph Collection Hotel |
$ | 50,298 | $ | 7,739 | $ | 75,510 | $ | — | $ | 6,076 | $ | 7,739 | $ | 81,586 | $ | 89,325 | $ | 8,902 | 2001 | 12/27/2012 | 5 - 30 years | |||||||||||||||||||||||||||
| Hampton Inn & Suites Baltimore Inner Harbor Baltimore, MD |
— | 1,700 | 21,067 | — | 1,743 | 1,700 | 22,810 | 24,510 | 7,186 | 1906 | 7/1/2007 | 5 - 30 years | ||||||||||||||||||||||||||||||||||||
| Hampton Inn & Suites Denver Downtown |
13,626 | 6,144 | 26,472 | — | 2,365 | 6,144 | 28,837 | 34,981 | 10,365 | 1989 | 2/8/2008 | 5 - 30 years | ||||||||||||||||||||||||||||||||||||
| Hilton Garden Inn Chicago North Shore/Evanston |
18,777 | 2,920 | 27,995 | — | 4,403 | 2,920 | 32,398 | 35,318 | 10,181 | 2001 | 7/1/2007 | 5 - 30 years | ||||||||||||||||||||||||||||||||||||
| Hilton Garden Inn Washington DC Downtown |
55,859 | 18,800 | 64,359 | — | 5,418 | 18,800 | 69,777 | 88,577 | 24,752 | 2000 | 2/8/2008 | 5 - 30 years | ||||||||||||||||||||||||||||||||||||
| Hilton St. Louis Downtown at the Arch |
— | 780 | 22,031 | — | 4,153 | 780 | 26,184 | 26,964 | 3,577 | 1888 | 3/23/2012 | 5 - 30 years | ||||||||||||||||||||||||||||||||||||
| Hilton Suites Phoenix |
— | 5,114 | 57,105 | (1,702 | ) | (35,637 | ) | 3,412 | 21,468 | 24,880 | 772 | 1990 | 2/8/2008 | 5 - 30 years | ||||||||||||||||||||||||||||||||||
| Hilton University of Florida Conference Center Gainesville |
27,775 | — | 50,407 | — | 6,101 | — | 56,508 | 56,508 | 20,460 | 2000 | 9/13/2007 | 5 - 30 years | ||||||||||||||||||||||||||||||||||||
| Homewood Suites by Hilton Houston near the Galleria |
— | 1,655 | 30,587 | — | 2,190 | 1,655 | 32,777 | 34,432 | 12,511 | 2006 | 2/8/2008 | 5 - 30 years | ||||||||||||||||||||||||||||||||||||
| Hotel Monaco Chicago |
26,000 | 15,056 | 40,841 | — | 429 | 15,056 | 41,270 | 56,326 | 2,628 | 1912 | 11/1/2013 | 5 - 30 years | ||||||||||||||||||||||||||||||||||||
| Hotel Monaco Denver |
41,000 | 5,742 | 69,158 | — | 240 | 5,742 | 69,398 | 75,140 | 3,937 | 1917/1937 | 11/1/2013 | 5 - 30 years | ||||||||||||||||||||||||||||||||||||
| Hotel Monaco Salt Lake City |
— | 1,777 | 56,156 | — | 181 | 1,777 | 56,337 | 58,114 | 3,177 | 1924 | 11/1/2013 | 5 - 30 years | ||||||||||||||||||||||||||||||||||||
137
Table of Contents
XENIA HOTELS & RESORTS, INC.
Schedule III
Real Estate and Accumulated Depreciation
(Dollar amounts in thousands)
December 31, 2014
| Initial Cost (A) | Gross amount at which carried at end of period |
|||||||||||||||||||||||||||||||||||||||||||||||
| Encumbrance | Land | Buildings and Improvements |
Adjustments to Land Basis (C) |
Adjustments to Basis (C) |
Land and Improvements |
Buildings and Improvements (D) |
Total (D,E) | Accumulated Depreciation (D,F) |
Year of Original Construction |
Date of Acquisition |
Life on Which Depreciation in Latest Income Statement is Computed |
|||||||||||||||||||||||||||||||||||||
| Hyatt Key West Resort & Spa |
$ | — | $ | 40,986 | $ | 34,529 | $ | — | $ | 620 | $ | 40,986 | $ | 35,149 | $ | 76,135 | $ | 2,104 | 1988 | 11/15/2013 | 5 - 30 years | |||||||||||||||||||||||||||
| Hyatt Regency Orange County |
63,036 | 18,688 | 93,384 | — | 27,974 | 18,688 | 121,358 | 140,046 | 42,644 | 1987/2002 | 10/2/2008 | 5 - 30 years | ||||||||||||||||||||||||||||||||||||
| Hyatt Regency Santa Clara |
60,200 | — | 100,227 | — | 6,054 | — | 106,281 | 106,281 | 6,515 | 1986 | 9/20/2013 | 5 - 30 years | ||||||||||||||||||||||||||||||||||||
| Key West Bottling Court Retail Center |
— | 4,144 | 2,682 | — | — | 4,144 | 2,682 | 6,826 | 7 | 1953 | 11/25/2014 | 5 - 30 years | ||||||||||||||||||||||||||||||||||||
| Loews New Orleans |
37,500 | 3,529 | 70,652 | — | 3,193 | 3,529 | 73,845 | 77,374 | 3,790 | 1972 | 10/11/2013 | 5 - 30 years | ||||||||||||||||||||||||||||||||||||
| Lorien Hotel & Spa |
— | 4,365 | 40,888 | — | 87 | 4,365 | 40,975 | 45,340 | 2,934 | 2009 | 10/24/2013 | 5 - 30 years | ||||||||||||||||||||||||||||||||||||
| Marriott Atlanta Century Center / Emory Area |
— | — | 36,571 | — | 3,624 | — | 40,195 | 40,195 | 17,232 | 1974 | 2/8/2008 | 5 - 30 years | ||||||||||||||||||||||||||||||||||||
| Marriott Charleston Town Center |
17,108 | — | 26,647 | — | 8,026 | — | 34,673 | 34,673 | 8,203 | 1982 | 2/25/2011 | 5 - 30 years | ||||||||||||||||||||||||||||||||||||
| Marriott Chicago at Medical District/UIC |
— | 8,831 | 17,911 | — | 5,514 | 8,831 | 23,425 | 32,256 | 10,443 | 1988 | 2/8/2008 | 5 - 30 years | ||||||||||||||||||||||||||||||||||||
| Marriott Dallas City Center |
40,090 | 6,300 | 45,158 | — | 16,927 | 6,300 | 62,085 | 68,385 | 17,283 | 1980 | 9/30/2010 | 5 - 30 years | ||||||||||||||||||||||||||||||||||||
| Marriott Griffin Gate Resort & Spa |
35,091 | 8,638 | 54,960 | 1,498 | 6,395 | 10,136 | 61,355 | 71,491 | 9,093 | 1981 | 3/23/2012 | 5 - 30 years | ||||||||||||||||||||||||||||||||||||
| Marriott Napa Valley Hotel & Spa |
— | 14,800 | 57,223 | — | 1,569 | 14,800 | 58,792 | 73,592 | 9,176 | 1979 | 8/26/2011 | 5 - 30 years | ||||||||||||||||||||||||||||||||||||
| Marriott San Francisco Airport Waterfront |
53,585 | 36,700 | 72,370 | — | 7,493 | 36,700 | 79,863 | 116,563 | 10,448 | 1985 | 3/23/2012 | 5 - 30 years | ||||||||||||||||||||||||||||||||||||
| Marriott West Des Moines |
— | 3,410 | 15,416 | — | 5,381 | 3,410 | 20,797 | 24,207 | 5,260 | 1981 | 5/11/2010 | 5 - 30 years | ||||||||||||||||||||||||||||||||||||
138
Table of Contents
XENIA HOTELS & RESORTS, INC.
Schedule III
Real Estate and Accumulated Depreciation
(Dollar amounts in thousands)
December 31, 2014
| Initial Cost (A) | Gross amount at which carried at end of period |
|||||||||||||||||||||||||||||||||||||||||||||||
| Encumbrance | Land | Buildings and Improvements |
Adjustments to Land Basis (C) |
Adjustments to Basis (C) |
Land and Improvements |
Buildings and Improvements (D) |
Total (D,E) | Accumulated Depreciation (D,F) |
Year of Original Construction |
Date of Acquisition |
Life on Which Depreciation in Latest Income Statement is Computed |
|||||||||||||||||||||||||||||||||||||
| Marriott Woodlands Waterway Hotel & Convention Center |
$ | 74,049 | $ | 5,500 | $ | 98,886 | $ | — | $ | 27,490 | $ | 5,500 | $ | 126,376 | $ | 131,876 | $ | 41,250 | 2002 | 11/21/2007 | 5 - 30 years | |||||||||||||||||||||||||||
| Renaissance Atlanta Waverly Hotel & Convention Center |
97,000 | 6,834 | 90,792 | — | 6,442 | 6,834 | 97,234 | 104,068 | 13,374 | 1983 | 3/23/2012 | 5 - 30 years | ||||||||||||||||||||||||||||||||||||
| Renaissance Austin Hotel |
83,000 | 10,656 | 97,960 | — | 8,140 | 10,656 | 106,100 | 116,756 | 14,393 | 1986 | 3/23/2012 | 5 - 30 years | ||||||||||||||||||||||||||||||||||||
| Residence Inn Baltimore Inner Harbor |
— | — | 55,410 | — | 4,071 | — | 59,481 | 59,481 | 21,004 | 2005 | 2/8/2008 | 5 - 30 years | ||||||||||||||||||||||||||||||||||||
| Residence Inn Boston Cambridge |
30,674 | 10,346 | 72,735 | — | 4,015 | 10,346 | 76,750 | 87,096 | 24,509 | 1999 | 2/8/2008 | 5 - 30 years | ||||||||||||||||||||||||||||||||||||
| Residence Inn Denver City Center |
45,210 | 5,291 | 74,638 | — | 101 | 5,291 | 74,739 | 80,030 | 5,520 | 2006 | 4/17/2013 | 5 - 30 years | ||||||||||||||||||||||||||||||||||||
| Westin Galleria Houston |
60,000 | 7,842 | 112,850 | — | 754 | 7,842 | 113,604 | 121,446 | 7,496 | 1977 | 8/22/2013 | 5 - 30 years | ||||||||||||||||||||||||||||||||||||
| Westin Oaks Houston at the Galleria |
50,000 | 4,261 | 96,090 | — | 489 | 4,261 | 96,579 | 100,840 | 6,730 | 1971 | 8/22/2013 | 5 - 30 years | ||||||||||||||||||||||||||||||||||||
| Land Raleigh, NC |
— | 1,219 | — | — | — | 1,219 | — | 1,219 | — | NA | 7/1/2007 | NA | ||||||||||||||||||||||||||||||||||||
|
|
|
|
|
|
|
|
|
|
|
|
|
|
|
|
|
|
|
|||||||||||||||||||||||||||||||
| Totals |
$ | 1,179,476 | $ | 336,964 | $ | 2,534,140 | $ | 1,349 | $ | 176,507 | $ | 338,313 | $ | 2,710,647 | $ | 3,048,960 | $ | 505,986 | ||||||||||||||||||||||||||||||
|
|
|
|
|
|
|
|
|
|
|
|
|
|
|
|
|
|
|
|||||||||||||||||||||||||||||||
Notes:
| (A) | The initial cost to the Company represents the original purchase price of the property, including amounts incurred subsequent to acquisition which were contemplated at the time the property was acquired. |
| (B) | The aggregate cost of real estate owned at December 31, 2014 for federal income tax purposes was approximately $3,178,113 (unaudited). |
| (C) | Cost capitalized subsequent to acquisition includes payments under master lease agreements as well as additional tangible costs associated with investment properties, including any earnout of tenant space. |
139
Table of Contents
XENIA HOTELS & RESORTS, INC.
Schedule III
Real Estate and Accumulated Depreciation
(Dollar amounts in thousands)
December 31, 2014
| (D) | Reconciliation of real estate owned (includes continuing operations and operations of assets classified as held for sale): |
| 2014 | 2013 | 2012 | ||||||||||
| Balance at January 1 |
$ | 2,875,766 | $ | 3,249,004 | $ | 2,837,907 | ||||||
| Acquisitions and capital improvements |
226,511 | 1,039,254 | 563,603 | |||||||||
| Disposals and write-offs |
(53,317 | ) | (133,395 | ) | (152,506 | ) | ||||||
| Properties classified as held for sale |
— | (1,279,097 | ) | — | ||||||||
|
|
|
|
|
|
|
|||||||
| Balance at December 31 |
$ | 3,048,960 | $ | 2,875,766 | $ | 3,249,004 | ||||||
|
|
|
|
|
|
|
|||||||
| (E) | Reconciliation of accumulated depreciation (includes continuing operations and operations of assets classified as held for sale): |
| 2014 | 2013 | 2012 | ||||||||||
| Balance at January 1 |
$ | 376,510 | $ | 603,912 | $ | 465,528 | ||||||
| Depreciation expense, continuing operations |
137,476 | 101,015 | 154,076 | |||||||||
| Depreciation expense, properties classified as held for sale |
— | 50,356 | — | |||||||||
| Accumulated depreciation, properties classified as held for sale |
— | (343,070 | ) | — | ||||||||
| Disposals and write-offs |
(8,000 | ) | (35,703 | ) | (15,692 | ) | ||||||
|
|
|
|
|
|
|
|||||||
| Balance at December 31 |
$ | 505,986 | $ | 376,510 | $ | 603,912 | ||||||
|
|
|
|
|
|
|
|||||||
| (F) | Depreciation is computed based upon the following estimated lives: |
| Buildings and improvements |
30 years | |
| Tenant improvements |
Life of the lease | |
| Furniture, fixtures & equipment |
5 - 15 years |
140
Table of Contents
Item 9. Changes in and Disagreements with Accountants on Accounting and Financial Disclosure
None.
Item 9A. Controls and Procedures
Evaluation of Disclosure on Controls and Procedures
As required by Rules 13a-15(b) and 15d-15(b) under the Exchange Act, our management, including our principal executive officer and our principal financial officer evaluated as of December 31, 2014, the effectiveness of our disclosure controls and procedures as defined in Rules 13a-15(e) and Rule 15d-15(e) of the Exchange Act. Based on that evaluation, our principal executive officer and our principal financial officer concluded that our disclosure controls and procedures, as of December 31, 2014, were effective for the purpose of ensuring that information required to be disclosed by us in this Annual Report is recorded, processed, summarized and reported within the time periods specified by the rules and forms of the Exchange Act and is accumulated and communicated to management, including the principal executive officer and our principal financial officer as appropriate to allow timely decisions regarding required disclosures.
Management’s Annual Report on Internal Control Over Financial Reporting
This Annual Report does not include a report of management’s assessment regarding internal control over financial reporting or an attestation report of our registered public accounting firm due to a transition period established by rules of the SEC for newly public companies.
Changes in Internal Control over Financial Reporting
There has been no change in our internal control over financial reporting during the fourth quarter of 2014 that has materially affected, or is reasonably likely to materially affect, our internal control over financial reporting.
None.
141
Table of Contents
PART III
Item 10. Directors, Executive Officers and Corporate Governance
The information called for by this Item is contained in our definitive Proxy Statement for our 2015 Annual Meeting of Stockholders, and is incorporated herein by reference.
Item 11. Executive Compensation
The information called for by this Item is contained in our definitive Proxy Statement for our 2015 Annual Meeting of Stockholders, and is incorporated herein by reference.
Item 12. Security Ownership of Certain Beneficial Owners and Management and Related Stockholder Matters.
The following table provides information regarding our equity compensation plans as of December 31, 2014:
| Plan Category |
Number of Share Units to be Issued Upon Exercise of Outstanding Options, Warrants and Rights (2) |
Weighted Average Exercise Price of Outstanding Options, Warrants and Rights ($) |
Number of Share Units Remaining Available for Future Issuance Under Equity Compensation Plans (3) |
|||||||||
| Equity compensation plans approved by stockholders (1) |
817,640 | — | 240,361,574 | |||||||||
| Equity compensation plans not approved by stockholders |
— | — | — | |||||||||
| Total |
817,640 | — | 240,361,574 | |||||||||
| (1) | Consists of the Xenia Hotels & Resorts, Inc. 2014 Share Unit Plan (the “Share Unit Plan”). The Share Unit Plan was adopted by the board of directors of Inland American prior to our separation from Inland American, and adopted and ratified by our Board, and provides for the grant of notional “share unit” awards to eligible participants. The value of each share unit is equal to $10.00 and was determined by reference to the third-party valuation performed for Inland American as of December 31, 2013. Subject to applicable vesting conditions, each share unit represents the right to receive a cash payment, or, to the extent provided in the applicable award agreement, shares of our common stock, in an amount equal to the fair market value of the share unit on a specified date. On January 9, 2015, in connection with our separation from Inland American, the Share Unit Plan was terminated and no new share unit awards will be granted thereunder. |
| (2) | As of December 31, 2014, the number of share units subject to each award reflects the value of the award, and did not necessarily correspond to an equivalent number of shares of common stock of the Company. |
| (3) | The number of share units available under the Share Unit Plan was established solely as a means to enable the Company to measure the change in value over time of the share unit awards granted under the Share Unit Plan, and, as of December 31, 2014, did not necessarily correspond to an equivalent number of shares of common stock of the Company. |
The remaining information called for by this Item is contained in our definitive Proxy Statement for our 2015 Annual Meeting of Stockholders, and is incorporated herein by reference.
Item 13. Certain Relationships and Related Transactions
The information called for by this Item is contained in our definitive Proxy Statement for our 2015 Annual Meeting of Stockholders, and is incorporated herein by reference.
Item 14. Principal Accounting Fees and Services.
The information called for by this Item is contained in our definitive Proxy Statement for our 2015 Annual Meeting of Stockholders, and is incorporated herein by reference.
142
Table of Contents
PART IV
Item 15: Exhibits and Financial Statement Schedule
| (a) | List of documents filed as a part of this Annual Report: |
| 1) | Financial Statements. |
Report of Independent Registered Public Accounting Firm
The consolidated financial statements of the Company are set forth under Item 8 of this Annual Report.
| 2) | Financial Statement Schedules. The following financial statement schedule is filed herein on pages 136 through 140: |
Schedule III – Real Estate and Accumulated Depreciation
All other schedules are omitted because they are not applicable or the required information is included in the consolidated financial statements or notes thereto.
| 3) | Exhibits. The following exhibits are filed (or incorporated by reference herein) as a part of this Annual Report. |
| Exhibit |
Exhibit Description | |||
| 2.1 | Separation and Distribution Agreement by and between Inland American Real Estate Trust, Inc. and Xenia Hotels & Resorts, Inc., dated as of January 20, 2015 (incorporated by reference to Exhibit 2.1 to the Company’s Periodic Report on Form 8-K (File No. 001-36594) filed on January 23, 2015) | |||
| 3.1 | Articles of Amendment and Restatement of Xenia Hotels & Resorts, Inc. (incorporated by reference to Exhibit 3.1 to the Company’s Periodic Report on Form 8-K (File No. 001-36594) filed on February 2, 2015) | |||
| 3.2 | Amended and Restated Bylaws of Xenia Hotels & Resorts, Inc. (incorporated by reference to Exhibit 3.1 to the Company’s Periodic Report on Form 8-K (File No. 001-36594) filed on February 9, 2015) | |||
| 10.1 | Third Amended and Restated Agreement of Limited Partnership of XHR LP, dated as of September 17, 2014 (incorporated by reference to Exhibit 10.1 to Amendment No. 1 to the Company’s Registration Statement on Form 10 (File No. 001-36594) filed on October 9, 2014) | |||
| 10.2 | Transition Services Agreement by and between Inland American Real Estate Trust, Inc. and Xenia Hotels & Resorts, Inc., dated as of February 3, 2015 (incorporated by reference to Exhibit 10.1 to the Company’s Periodic Report on Form 8-K (File No. 001-36594) filed on February 9, 2015) | |||
| 10.3 | Executive Employment Agreement, dated July 1, 2014, between Xenia Hotels & Resorts, Inc., XHR Management, LLC and Marcel Verbaas (incorporated by reference to Exhibit 10.3 to Amendment No. 3 to the Company’s Registration Statement on Form 10 (File No. 001-36594) filed on January 9, 2015)+ | |||
| 10.4 | Executive Employment Agreement, dated July 1, 2014, between Xenia Hotels & Resorts, Inc., XHR Management, LLC and Barry A.N. Bloom (incorporated by reference to Exhibit 10.4 to Amendment No. 3 to the Company’s Registration Statement on Form 10 (File No. 001-36594) filed on January 9, 2015)+ | |||
| 10.5 | Executive Employment Agreement, dated July 1, 2014, between Xenia Hotels & Resorts, Inc., XHR Management, LLC and Andrew J. Welch (incorporated by reference to Exhibit 10.5 to Amendment No. 3 to the Company’s Registration Statement on Form 10 (File No. 001-36594) filed on January 9, 2015)+ | |||
143
Table of Contents
| 10.6 | Executive Employment Agreement, dated July 1, 2014, between Xenia Hotels & Resorts, Inc., XHR Management, LLC and Philip A. Wade (incorporated by reference to Exhibit 10.6 to Amendment No. 3 to the Company’s Registration Statement on Form 10 (File No. 001-36594) filed on January 9, 2015)+ | |||
| 10.7 | Indemnity Agreement, dated August 8, 2014, between Inland American Real Estate Trust, Inc. and Xenia Hotels & Resorts, Inc. (incorporated by reference to Exhibit 10.7 to Amendment No. 1 to the Company’s Registration Statement on Form 10 (File No. 001-36594) filed on October 9, 2014) | |||
| 10.8 | First Amendment to Indemnity Agreement by and between Inland American Real Estate Trust, Inc. and Xenia Hotels & Resorts, Inc., dated as of February 3, 2015 (incorporated by reference to Exhibit 10.3 to the Company’s Periodic Report on Form 8-K (File No. 001-36594) filed on February 9, 2015) | |||
| 10.9 | The Xenia Hotels & Resorts, Inc. 2014 Share Unit Plan (incorporated by reference to Exhibit 10.8 to Amendment No. 2 to the Company’s Registration Statement on Form 10 (File No. 001-36594) filed on November 25, 2014)+ | |||
| 10.10 | Form of Xenia Hotels & Resorts, Inc. Share Unit Award Agreement (Annual Award) (incorporated by reference to Exhibit 10.9 to Amendment No. 2 to the Company’s Registration Statement on Form 10 (File No. 001-36594) filed on November 25, 2014)+ | |||
| 10.11 | Form of Xenia Hotels & Resorts, Inc. Share Unit Award Agreement (Contingency) (incorporated by reference to Exhibit 10.10 to Amendment No. 2 to the Company’s Registration Statement on Form 10 (File No. 001-36594) filed on November 25, 2014)+ | |||
| 10.12 | Form of Xenia Hotels & Resorts, Inc. Share Unit Award Agreement (Transaction) (incorporated by reference to Exhibit 10.11 to Amendment No. 2 to the Company’s Registration Statement on Form 10 (File No. 001-36594) filed on November 25, 2014)+ | |||
| 10.13 | Xenia Hotels & Resorts, Inc. Director Compensation Program (incorporated by reference to Exhibit 10.12 to Amendment No. 2 to the Company’s Registration Statement on Form 10 (File No. 001-36594) filed on November 25, 2014)+ | |||
| 10.14 | Employee Matters Agreement by and between Inland American Real Estate Trust, Inc. and Xenia Hotels & Resorts, Inc., dated as of February 3, 2015 (incorporated by reference to Exhibit 10.2 to the Company’s Periodic Report on Form 8-K (File No. 001-36594) filed on February 9, 2015) | |||
| 10.15 | Xenia Hotels & Resorts, Inc., XHR Holding, Inc. and XHR LP 2015 Incentive Award Plan (incorporated by reference to Exhibit 10.14 to Amendment No. 3 to the Company’s Registration Statement on Form 10 (File No. 001-36594) filed on January 9, 2015)+ | |||
| 10.16 | Form of Indemnification Agreement entered into between Xenia Hotels & Resorts, Inc. and each of its directors and executive officers (incorporated by reference to Exhibit 10.15 to Amendment No. 3 to the Company’s Registration Statement on Form 10 (File No. 001-36594) filed on January 9, 2015) | |||
| 10.17 | Revolving Credit Agreement by and among XHR LP, a syndicate of bank lenders, J.P. Morgan Securities LLC, Wells Fargo Securities, LLC, and KeyBanc Capital Markets Inc., as joint lead arrangers and joint bookrunners, JPMorgan Chase Bank, N.A., as administrative agent, Wells Fargo Bank, N.A. and KeyBank National Association, as co-syndication agents, and Bank of America, N.A. and Citibank, N.A., as documentation agents, dated as of February 3, 2015 (incorporated by reference to Exhibit 10.4 to the Company’s Periodic Report on Form 8-K (File No. 001-36594) filed on February 9, 2015) | |||
| 10.18 | Parent Guaranty by Xenia Hotels & Resorts, Inc. for the benefit of JPMorgan Chase Bank, N.A., as administrative agent, dated as of February 3, 2015 (incorporated by reference to Exhibit 10.5 to the Company’s Periodic Report on Form 8-K (File No. 001-36594) filed on February 9, 2015) | |||
| 10.19 | Form of Stock Payment Award Grant Notice and Agreement (incorporated by reference to Exhibit 10.6 to the Company’s Periodic Report on Form 8-K (File No. 001-36594) filed on February 9, 2015)+ | |||
144
Table of Contents
| 21.1* | Subsidiaries of Xenia Hotels & Resorts, Inc. | |
| 23.1* | Consent of KPMG LLP | |
| 31.1* | Certification of Chief Executive Officer Pursuant to Section 302 of the Sarbanes-Oxley Act of 2002 | |
| 31.2* | Certification of Chief Financial Officer Pursuant to Section 302 of the Sarbanes-Oxley Act of 2002 | |
| 32.1* | Certification of Chief Executive Officer and Chief Financial Officer pursuant to Section 906 of the Sarbanes-Oxley Act of 2002 | |
| * | Filed herewith |
| + | Management contract or compensatory plan |
145
Table of Contents
Pursuant to the requirements of Section 13 or 15(d) of the Securities Exchange Act of 1934, the registrant has duly caused this report to be signed on its behalf by the undersigned, thereunto duly authorized.
| XENIA HOTELS & RESORTS, INC. | ||
| By: |
/s/ MARCEL VERBAAS | |
| Marcel Verbaas | ||
| Director, President and Chief Executive Officer | ||
| Date: |
March 27, 2015 | |
Pursuant to the requirements of the Securities Exchange Act of 1934, this report has been signed below by the following persons on behalf of the registrant and in the capacities and on the dates indicated.
| Signature |
Title |
Date | ||||
| By: | /s/ MARCEL VERBAAS |
Director, President and Chief Executive Officer (principal executive officer) | March 27, 2015 | |||
| Name: | Marcel Verbaas | |||||
| By: | /s/ ANDREW J. WELCH |
Executive Vice President, Chief Financial Officer and Treasurer (principal financial officer and principal accounting officer) | March 27, 2015 | |||
| Name: | Andrew J. Welch | |||||
| By: | /s/ JEFFREY H. DONAHUE |
Director | March 27, 2015 | |||
| Name: | Jeffrey H. Donahue | |||||
| By: | /s/ JOHN H. ALSCHULER, JR. |
Director | March 27, 2015 | |||
| Name: | John H. Alschuler, Jr. | |||||
| By: | /s/ KEITH E. BASS |
Director | March 27, 2015 | |||
| Name: | Keith E. Bass | |||||
| By: | /s/ THOMAS M. GARTLAND |
Director | March 27, 2015 | |||
| Name: | Thomas M. Gartland | |||||
| By: | /s/ BEVERLY K. GOULET |
Director | March 27, 2015 | |||
| Name: | Beverly K. Goulet | |||||
| By: | /s/ DENNIS D. OKLAK |
Director | March 27, 2015 | |||
| Name: | Dennis D. Oklak | |||||
| By: | /s/ MARY ELIZABETH McCORMICK |
Director | March 27, 2015 | |||
| Name: | Mary Elizabeth McCormick | |||||
146