Attached files
| file | filename |
|---|---|
| 8-K - 8-K - TIPTREE INC. | a51020168-k.htm |

May 2016 Financial information for the three months ended March 31, 2016 NASDAQ: TIPT INVESTOR PRESENTATION - FIRST QUARTER, 2016 Exhibit 99.1

1 LIMITATIONS ON THE USE OF INFORMATION This presentation has been prepared by Tiptree Financial Inc. (“Tiptree Financial”) and Tiptree Operating Company, LLC (the “Company”) solely for informational purposes, and not for the purpose of updating any information or forecast with respect to Tiptree Financial, its subsidiaries or any of its affiliates or any other purpose. This information is subject to change without notice and should not be relied upon for any purpose. Neither Tiptree Financial nor any of its affiliates makes any representation or warranty, express or implied, as to the accuracy or completeness of the information contained herein and no such party shall have any liability for such information. In furnishing this information and making any oral statements, neither Tiptree Financial, its subsidiaries nor any of its affiliates undertakes any obligation to provide the recipient with access to any additional information or to update or correct such information. The information herein or in any oral statements (if any) are prepared as of the date hereof or as of such earlier dates as presented herein; neither the delivery of this document nor any other oral statements regarding the affairs of Tiptree Financial or its affiliates shall create any implication that the information contained herein or the affairs of Tiptree Financial, its subsidiaries or its affiliates have not changed since the date hereof or after the dates presented herein (as applicable); that such information is correct as of any time subsequent to its date; or that such information is an indication regarding the performance of Tiptree Financial or any of its affiliates since the time of Tiptree Financial’s latest public filings or disclosure. These materials and any related oral statements are not all-inclusive and shall not be construed as legal, tax, investment or any other advice. You should consult your own counsel, accountant or business advisors. Tiptree Financial files public reports with the Securities and Exchange Commission (“SEC”) on EDGAR. The information contained herein should be read in conjunction with and is qualified by Tiptree Financial’s public filings. Performance information is historical and is not indicative of, nor does it guarantee future results. There can be no assurance that similar performance may be experienced in the future. Certain market data and industry data used in this presentation were obtained from reports of governmental agencies and industry publications and surveys. Industry publications and third-party research, surveys and reports generally indicate that their information has been obtained from sources believed to be reliable. We believe the data from third-party sources to be reliable based upon our management’s knowledge of the industry, but have not independently verified such data and as such, make no guarantees as to its accuracy, completeness or timeliness. SPECIAL NOTE REGARDING FORWARD-LOOKING STATEMENTS This document contains "forward-looking statements" which involve risks, uncertainties and contingencies, many of which are beyond Tiptree Financial's control, which may cause actual results, performance, or achievements to differ materially from anticipated results, performance, or achievements. All statements contained herein that are not clearly historical in nature are forward-looking, and the words "anticipate," "believe," "estimate," "expect,“ “intend,” “may,” “might,” "plan," “project,” “should,” "target,“ “will,” or similar expressions are intended to identify forward-looking statements. Such forward-looking statements include, but are not limited to, statements about Tiptree Financial's plans, objectives, expectations and intentions. The forward-looking statements are not guarantees of future performance and are subject to risks, uncertainties and other factors, many of which are beyond our control, are difficult to predict and could cause actual results to differ materially from those expressed or forecast in the forward-looking statements. Our actual results could differ materially from those anticipated in these forward- looking statements as a result of various factors, including, but not limited to those described in the section entitled “Risk Factors” in Tiptree Financial’s Annual Report on Form 10-K, and as described in the Tiptree Financial’s other filings with the SEC. Readers are cautioned not to place undue reliance on these forward-looking statements, which speak only as to the date of this release. The factors described therein are not necessarily all of the important factors that could cause actual results or developments to differ materially from those expressed in any of our forward-looking statements. Other unknown or unpredictable factors also could affect our forward-looking statements. Consequently, our actual performance could be materially different from the results described or anticipated by our forward-looking statements. Given these uncertainties, you should not place undue reliance on these forward- looking statements. Except as required by the federal securities laws, we undertake no obligation to update any forward-looking statements. NOT AN OFFER OR A SOLICIATION This document does not constitute an offer or invitation for the sale or purchase of securities or to engage in any other transaction with Tiptree Financial, its subsidiaries or its affiliates. The information in this document is not targeted at the residents of any particular country or jurisdiction and is not intended for distribution to, or use by, any person in any jurisdiction or country where such distribution or use would be contrary to local law or regulation. NON-U.S. GAAP MEASURES In this document, we sometimes use financial measures derived from consolidated financial data but not presented in our financial statements prepared in accordance with U.S. generally accepted accounting principles (GAAP). Certain of these data are considered “non-GAAP financial measures” under the U.S. Securities and Exchange Commission rules. These non-GAAP financial measures supplement our GAAP disclosures and should not be considered an alternative to the GAAP measure. Management's reasons for using these non-GAAP financial measures and the reconciliations to their most directly comparable GAAP financial measures are posted in the Appendix. We use non-GAAP financial measures including the following: • EBITDA and Adjusted EBITDA on a consolidated basis and Segment EBITDA and Segment Adjusted EBITDA on a segment basis; • Net revenues and adjusted net revenues for our Fortegra subsidiary.; • Net operating income ("NOI") for our Care subsidiary; and • Adjusted EBITDA and NOI margin. DISCLAIMER

OVERVIEW Key Highlights

3 EXECUTING ON OUR 2016 PRIORITIES þ Fortegra Adjusted EBITDA up 46% and adjusted net revenues up 15% from $26.7 to $30.7mm þ Acquired 2 seniors housing properties ($55mm assets), achieved 58% NOI growth from prior year þ Further invested in residential NPLs, bringing total to $52mm þ Effective April 5, Telos Asset Management launched Telos 7 CLO, with Tiptree investment of $26mm in subordinated notes þ Completed tax restructuring to form consolidated group, further simplifying our structure & resulting in go-forward efficiencies þ Effective April 8th, sold Star Asia investment for $13.4 million, 49% above 2015 year-end book value þ Exited tax-exempt portfolio managed by MFCA for $8.9mm cash proceeds þ Returned $1.8mm to shareholders through buy-backs and dividends Investing in core businesses Re-deploying capital to attractive returning investments Revenue $131.8 million 48% Net Income $5.6 million 6.7x Adjusted EBITDA (1) For a reconciliation of Adjusted EBITDA to GAAP revenues and net income, see the Appendix. (1) $15.3 million 18%

4 STRATEGIC PRIORITIES GOING FORWARD þ As of May 10th, A.M. Best upgraded Fortegra to A- (excellent) ¨ Opens up new channel opportunities and allows for further distribution of core product offering ¨ Expanded written premiums provide opportunity to increase investment portfolio ¨ Re-deploy $22 million proceeds raised through sale of tax- exempt MCFA portfolio and Star Asia investments ¨ Continue growth in margins at specialty finance and seniors housing businesses ¨ Grow asset management business through Telos 7 launch and additional investments in Credit Opportunities Fund ¨ Continue to evaluate liquidation of non-core, capital intensive or lower returning assets ¨ Use excess liquidity from available cash generated at subsidiaries including Fortegra investments, Care & Telos cash distributions, cash payments on principal investments, and capital from non-core assets ¨ Continue focus on high returning cash flow businesses ¨ Evaluate new strategic acquisitions to create long term value Invest in core businesses Opportunistically acquire and invest Re-deploy capital to attractive returning investments 1 2 3 Focused on growing revenues, Adjusted EBITDA, and optimizing capital allocation 1Q15 1Q16 $177.6 $207.7 Fortegra Investments (1) (1) Includes available for sale securities, trading assets and unrestricted cash

Three Months Ended March 31, 2016 FINANCIAL RESULTS
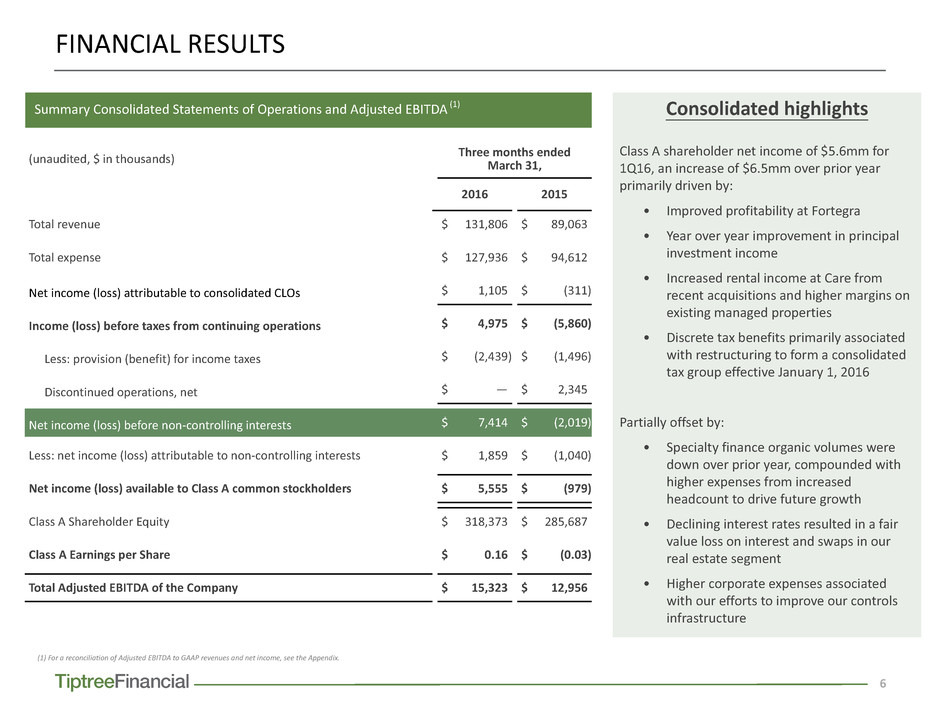
6 Consolidated highlights Class A shareholder net income of $5.6mm for 1Q16, an increase of $6.5mm over prior year primarily driven by: • Improved profitability at Fortegra • Year over year improvement in principal investment income • Increased rental income at Care from recent acquisitions and higher margins on existing managed properties • Discrete tax benefits primarily associated with restructuring to form a consolidated tax group effective January 1, 2016 Partially offset by: • Specialty finance organic volumes were down over prior year, compounded with higher expenses from increased headcount to drive future growth • Declining interest rates resulted in a fair value loss on interest and swaps in our real estate segment • Higher corporate expenses associated with our efforts to improve our controls infrastructure Summary Consolidated Statements of Operations and Adjusted EBITDA (1) FINANCIAL RESULTS (unaudited, $ in thousands) Three months endedMarch 31, 2016 2015 Total revenue $ 131,806 $ 89,063 Total expense $ 127,936 $ 94,612 Net income (loss) attributable to consolidated CLOs $ 1,105 $ (311) Income (loss) before taxes from continuing operations $ 4,975 $ (5,860) Less: provision (benefit) for income taxes $ (2,439) $ (1,496) Discontinued operations, net $ — $ 2,345 Net income (loss) before non-controlling interests $ 7,414 $ (2,019) Less: net income (loss) attributable to non-controlling interests $ 1,859 $ (1,040) Net income (loss) available to Class A common stockholders $ 5,555 $ (979) Class A Shareholder Equity $ 318,373 $ 285,687 Class A Earnings per Share $ 0.16 $ (0.03) Total Adjusted EBITDA of the Company $ 15,323 $ 12,956 (1) For a reconciliation of Adjusted EBITDA to GAAP revenues and net income, see the Appendix.

7 $12.0 $0.6 $(0.7) $0.6 $2.1 $1.9 $1.7 $0.3 $8.2 Revenues SEGMENT REVENUES AND ADJUSTED EBITDA PERFORMANCE ($ in millions) Real Estate: 250.0% Corporate, Principal Inv.: 105% Specialty Finance: (U%) Insurance & Insurance Services: 46.3% Asset Management: (10.5%) $4.8 $15.3 Cont. Ops.: 222% increase Adjusted EBITDA 1Q161Q15 Disc. Ops. (PFG): (U%) (1) $8.2 $(6.5) $13.0 72.4 89.3 6.3 16.6 9.4 13.9 1.0 2.0 10.0 Real Estate: 47.9% Corporate & Other: F% Specialty Finance: 163% Insurance & Insurance Services: 23.4% Asset Management: F%$(0.3) $1.1 Income attributable toconsolidated CLOs: F% F% is favorable versus prior year; (U)% is unfavorable versus prior year (1) Adjusted EBITDA includes income from continuing and discontinuing operations - see appendix for reconciliation 1Q161Q15 $131.8 $89.1 Adjusted EBITDA from continuing operations grew by $10.5mm + Insurance: Fortegra growth driven by increases in net revenues and margin expansion related to disciplined cost control + Real estate: up $1.5mm as margins improve at existing properties and acquisitions increased overall revenues + Principal investments: increases driven by unrealized gains, lower fair value marks on CLO sub-notes and earnings on Telos 7 and COF warehouses - Corporate: higher payroll, audit and consulting expenses driven by efforts to improve controls and reporting infrastructure 48% increase driven by organic growth at subsidiaries, returns on principal investments and acquisitions in the specialty finance and real estate segments + Insurance revenue improvement driven by credit protection, specialty products and higher investment returns + Improved principal investment performance from unrealized gains on invested assets - Unfavorable mortgage market dampened organic origination growth over prior year
Opportunities for Growth SEGMENT PERFORMANCE
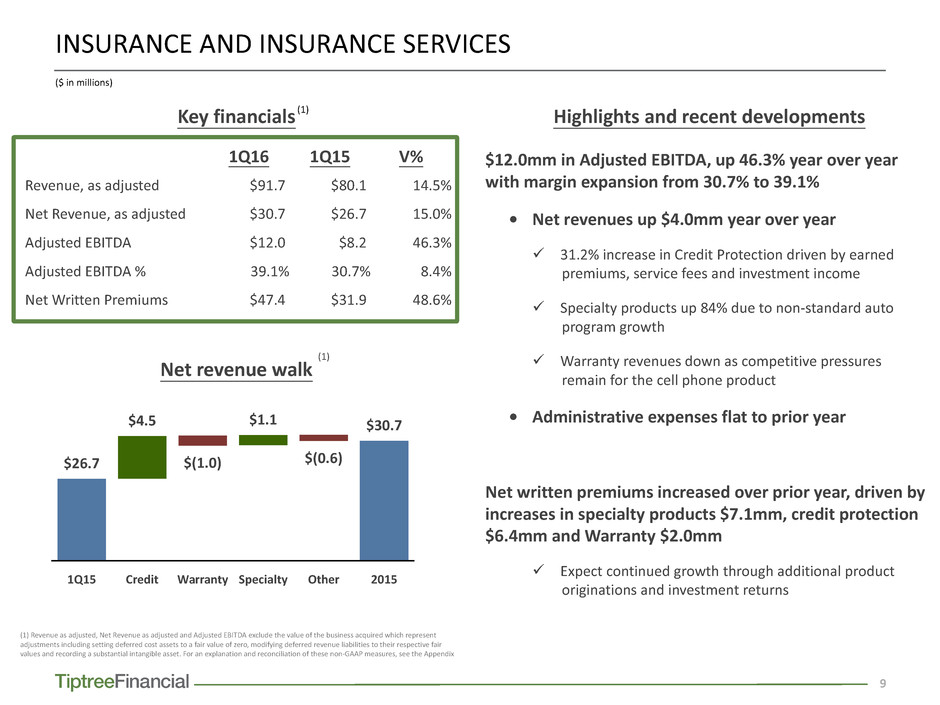
9 Highlights and recent developments 1Q16 1Q15 V% Revenue, as adjusted $91.7 $80.1 14.5% Net Revenue, as adjusted $30.7 $26.7 15.0% Adjusted EBITDA $12.0 $8.2 46.3% Adjusted EBITDA % 39.1% 30.7% 8.4% Net Written Premiums $47.4 $31.9 48.6% (1) Revenue as adjusted, Net Revenue as adjusted and Adjusted EBITDA exclude the value of the business acquired which represent adjustments including setting deferred cost assets to a fair value of zero, modifying deferred revenue liabilities to their respective fair values and recording a substantial intangible asset. For an explanation and reconciliation of these non-GAAP measures, see the Appendix Key financials $12.0mm in Adjusted EBITDA, up 46.3% year over year with margin expansion from 30.7% to 39.1% • Net revenues up $4.0mm year over year ü 31.2% increase in Credit Protection driven by earned premiums, service fees and investment income ü Specialty products up 84% due to non-standard auto program growth ü Warranty revenues down as competitive pressures remain for the cell phone product • Administrative expenses flat to prior year Net written premiums increased over prior year, driven by increases in specialty products $7.1mm, credit protection $6.4mm and Warranty $2.0mm ü Expect continued growth through additional product originations and investment returns Net revenue walk 1Q15 Credit Warranty Specialty Other 2015 $26.7 $4.5 $(1.0) $1.1 $(0.6) $30.7 (1) (1) INSURANCE AND INSURANCE SERVICES ($ in millions)

10 Single-Family Mortgage Originations 1Q15 2Q15 3Q15 4Q15 1Q162Q16 E 3Q16 E 4Q16 E 165 269 271 211 164 266 271 239 229 394 239 508 164 435 163 374 167 331 178 444 142 413 128 367 Highlights and recent developments 1Q16 1Q15 V% Revenue $16.6 $6.3 163 % Adjusted EBITDA $(0.7) $0.6 (217)% Average earning assets $57.0 $45.8 24 % Mortgage volume $332.8 $180.4 84 % Mortgage margin (bps) (1) 404.5 225.8 179 bps Mortgage headcount (2) 502.0 121.0 315 % Key financials $0.7mm Adjusted EBITDA loss driven by higher expense growth relative to volume increases • Personnel expenses: invested in marketing and additional headcount, a 19.5% increase over prior year, to produce future originations. Growth in volume tends to lag the hiring of new loan officers as the full ramp up of productivity takes 4-6 months • Professional & other expenses: slight increases over prior year in audit and internal control fees • Mortgage revenues: market mortgage originations were down 16% year-over-year, driven primarily by a drop in refinance volumes which dampened our organic originations excluding the impact of the Reliance acquisition • Lending revenues: Siena average earning assets increased by 24%, slightly offset by reduced one-time fees against prior year Market indicators SPECIALTY FINANCE Small Business Lending Index (SBLI) 160 150 140 130 120 110 100 Jan- 14 Jul-1 4 Jan- 15 Jul-1 5 Jan- 16 (1) Mortgage margin represents revenues less interest expense divided by origination volume for the period (2) For comparative purposes, total headcount of our mortgage businesses, including Reliance, in the first quarter of 2015 was 420 persons. (3) Fannie May- April 2016 Housing Forecast; (4)Thomson Reuters/PayNet; ($ in millions) (4)(3) Purchase Refinance
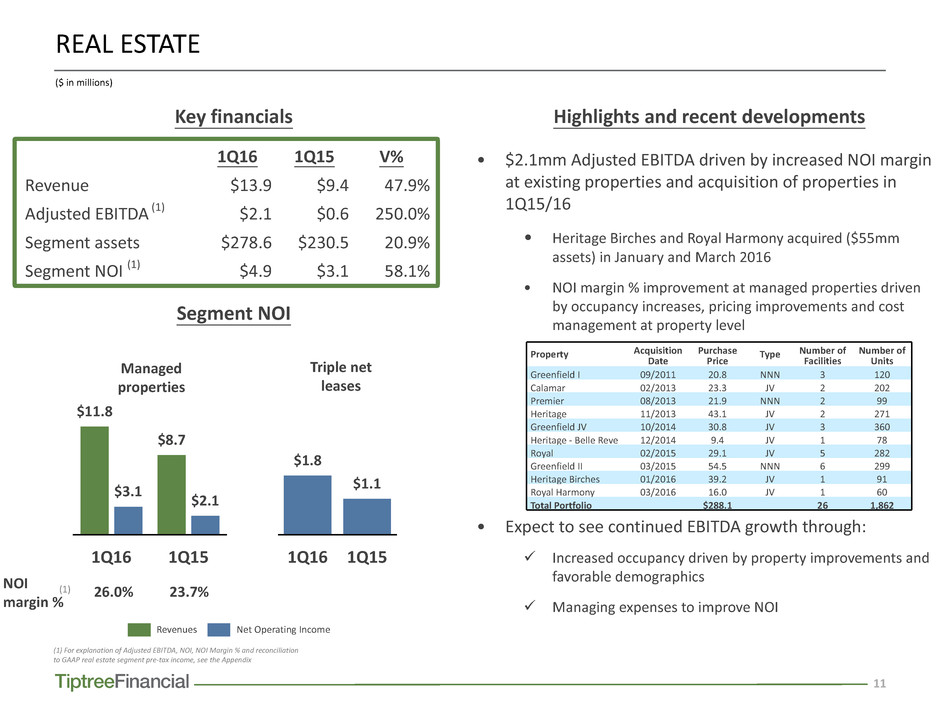
11 1Q16 1Q15 $1.8 $1.1 Highlights and recent developments 1Q16 1Q15 V% Revenue $13.9 $9.4 47.9% Adjusted EBITDA (1) $2.1 $0.6 250.0% Segment assets $278.6 $230.5 20.9% Segment NOI (1) $4.9 $3.1 58.1% Key financials • $2.1mm Adjusted EBITDA driven by increased NOI margin at existing properties and acquisition of properties in 1Q15/16 • Heritage Birches and Royal Harmony acquired ($55mm assets) in January and March 2016 • NOI margin % improvement at managed properties driven by occupancy increases, pricing improvements and cost management at property level • Expect to see continued EBITDA growth through: ü Increased occupancy driven by property improvements and favorable demographics ü Managing expenses to improve NOI Segment NOI REAL ESTATE ($ in millions) (1) For explanation of Adjusted EBITDA, NOI, NOI Margin % and reconciliation to GAAP real estate segment pre-tax income, see the Appendix Property Acquisition Date Purchase Price Type Number of Facilities Number of Units Greenfield I 09/2011 20.8 NNN 3 120 Calamar 02/2013 23.3 JV 2 202 Premier 08/2013 21.9 NNN 2 99 Heritage 11/2013 43.1 JV 2 271 Greenfield JV 10/2014 30.8 JV 3 360 Heritage - Belle Reve 12/2014 9.4 JV 1 78 Royal 02/2015 29.1 JV 5 282 Greenfield II 03/2015 54.5 NNN 6 299 Heritage Birches 01/2016 39.2 JV 1 91 Royal Harmony 03/2016 16.0 JV 1 60 Total Portfolio $288.1 26 1,862 1Q16 1Q15 $11.8 $8.7 $3.1 $2.1 Managed properties Triple net leases Revenues Net Operating Income NOI margin % 26.0% 23.7%(1)
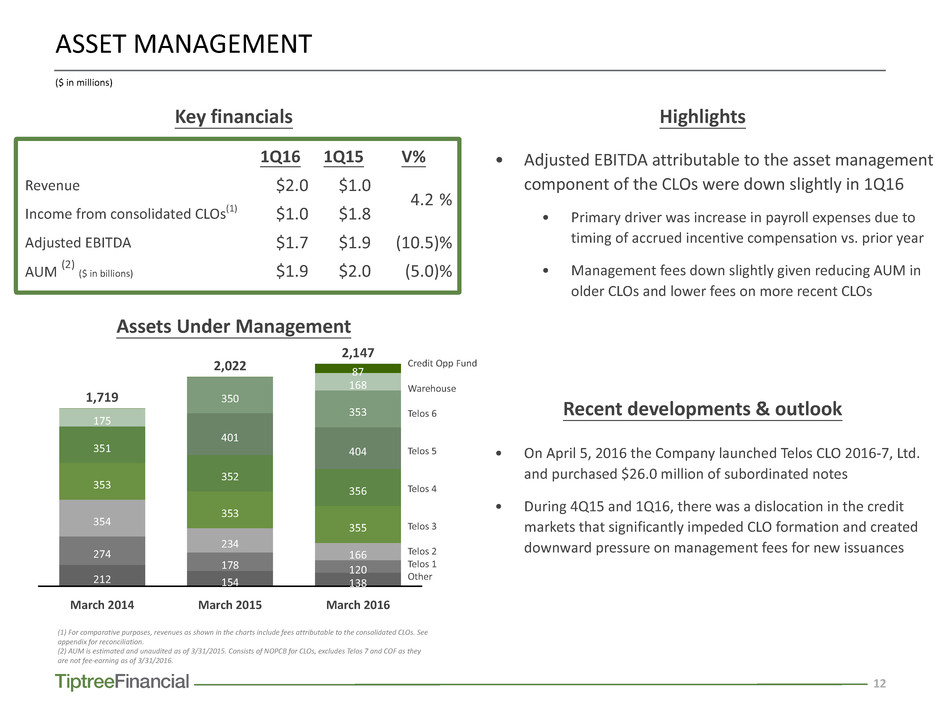
12 Highlights 1Q16 1Q15 V% Revenue $2.0 $1.0 4.2 % Income from consolidated CLOs(1) $1.0 $1.8 Adjusted EBITDA $1.7 $1.9 (10.5)% AUM (2) ($ in billions) $1.9 $2.0 (5.0)% Key financials • Adjusted EBITDA attributable to the asset management component of the CLOs were down slightly in 1Q16 • Primary driver was increase in payroll expenses due to timing of accrued incentive compensation vs. prior year • Management fees down slightly given reducing AUM in older CLOs and lower fees on more recent CLOs • On April 5, 2016 the Company launched Telos CLO 2016-7, Ltd. and purchased $26.0 million of subordinated notes • During 4Q15 and 1Q16, there was a dislocation in the credit markets that significantly impeded CLO formation and created downward pressure on management fees for new issuances Assets Under Management ASSET MANAGEMENT ($ in millions) March 2014 March 2015 March 2016 212 154 138 274 178 120 354 234 166 353 353 355 351 352 356 401 404 350 2,022 353 175 1,719 168 87 2,147 Credit Opp Fund Warehouse Telos 6 Telos 5 Telos 4 Telos 3 Telos 2 Telos 1 Other (1) For comparative purposes, revenues as shown in the charts include fees attributable to the consolidated CLOs. See appendix for reconciliation. (2) AUM is estimated and unaudited as of 3/31/2015. Consists of NOPCB for CLOs, excludes Telos 7 and COF as they are not fee-earning as of 3/31/2016. Recent developments & outlook
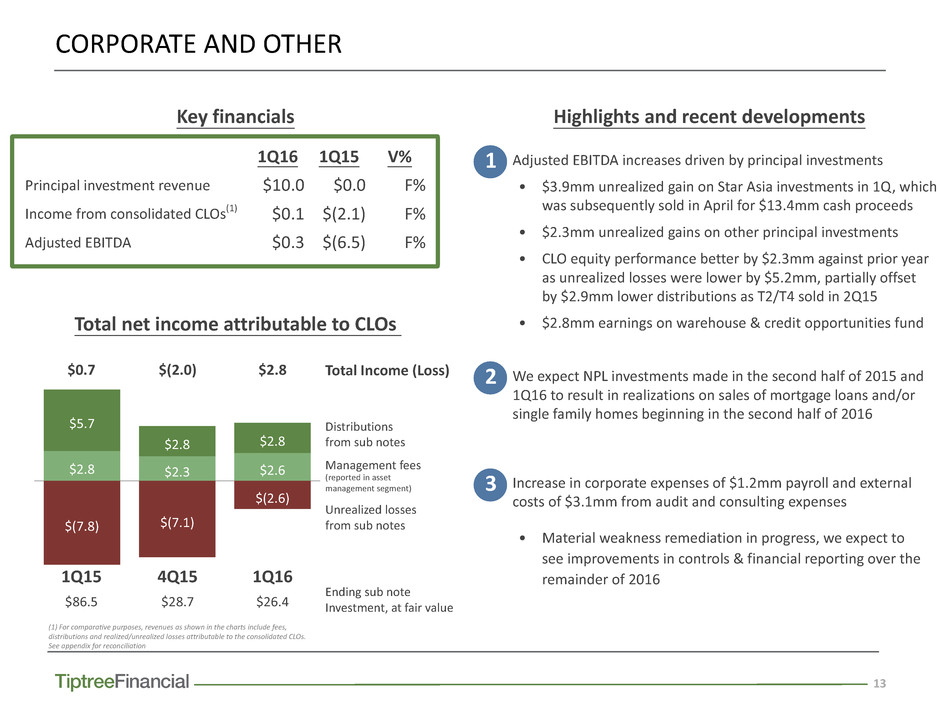
13 1Q16 1Q15 V% Principal investment revenue $10.0 $0.0 F% Income from consolidated CLOs(1) $0.1 $(2.1) F% Adjusted EBITDA $0.3 $(6.5) F% Key financials • Adjusted EBITDA increases driven by principal investments • $3.9mm unrealized gain on Star Asia investments in 1Q, which was subsequently sold in April for $13.4mm cash proceeds • $2.3mm unrealized gains on other principal investments • CLO equity performance better by $2.3mm against prior year as unrealized losses were lower by $5.2mm, partially offset by $2.9mm lower distributions as T2/T4 sold in 2Q15 • $2.8mm earnings on warehouse & credit opportunities fund • We expect NPL investments made in the second half of 2015 and 1Q16 to result in realizations on sales of mortgage loans and/or single family homes beginning in the second half of 2016 • Increase in corporate expenses of $1.2mm payroll and external costs of $3.1mm from audit and consulting expenses • Material weakness remediation in progress, we expect to see improvements in controls & financial reporting over the remainder of 2016 Highlights and recent developments CORPORATE AND OTHER 1 2 $2.8 $2.3 $2.6 $5.7 $2.8 $2.8 $(7.8) $(7.1) $(2.6) Distributions from sub notes Management fees (reported in asset management segment) Unrealized losses from sub notes 1Q164Q151Q15 3 Total net income attributable to CLOs Ending sub note Investment, at fair value$26.4$28.7$86.5 (1) For comparative purposes, revenues as shown in the charts include fees, distributions and realized/unrealized losses attributable to the consolidated CLOs. See appendix for reconciliation Total Income (Loss)$2.8$(2.0)$0.7

14 Adjusted EBITDA WELL POSITIONED FOR 2016 AND BEYOND Adjusted EBITDA is expected to benefit from: • Continued revenue growth of Fortegra, combined with disciplined expense management, driving positive improvements • Better performance in specialty finance as a result of investment in sales in Q1 to generate improved volumes and margins while maintaining cost focus • Growing rental income from our real estate portfolio combined with investments to increase occupancy and stabilize income • Investment income from principal investments Expect to benefit from re-investing our primary sources of liquidity including Fortegra investments, Care & Telos cash distributions, cash payments on principal investments, and capital from non-core assets 1Q16 1Q15 $131.8 $89.1 Total Revenue 1Q16 1Q15 $15.3 $13.0 Looking ahead ... $1.1 $(0.3) Income from consolidated CLOs Recent events ü Significant improvement in revenues, net earnings and Adjusted EBITDA from continuing ops as a result of the actions taken in late 2015 and 1Q16 ü Raised $22mm from exiting non-core assets ü Continued to re-invest in core segments through seniors housing acquisitions, investments in NPLs and launch of Telos 7 CLO

APPENDIX
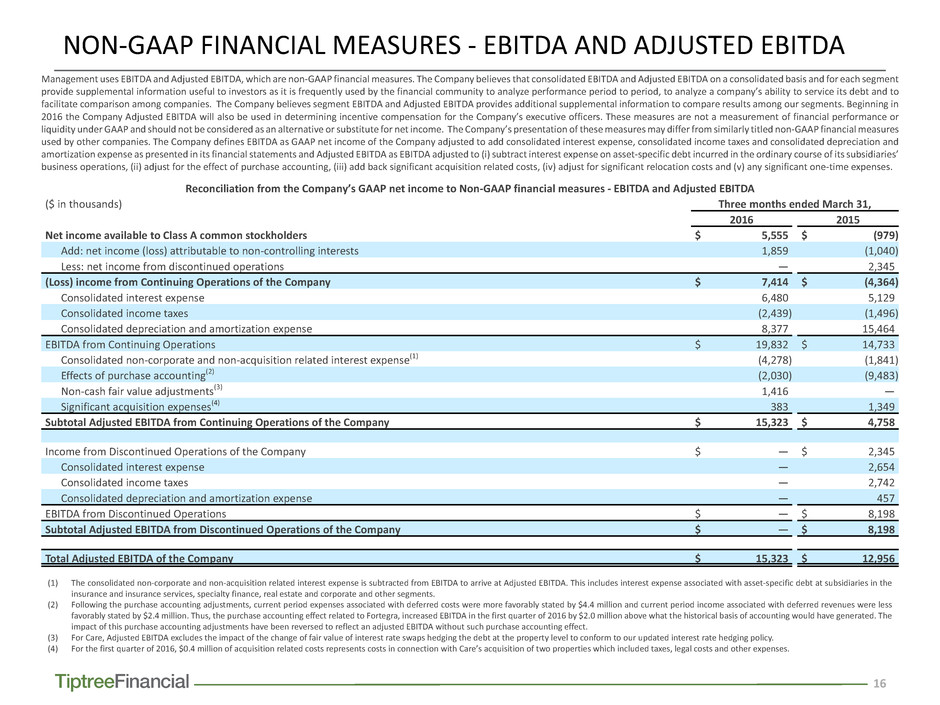
16 Management uses EBITDA and Adjusted EBITDA, which are non-GAAP financial measures. The Company believes that consolidated EBITDA and Adjusted EBITDA on a consolidated basis and for each segment provide supplemental information useful to investors as it is frequently used by the financial community to analyze performance period to period, to analyze a company’s ability to service its debt and to facilitate comparison among companies. The Company believes segment EBITDA and Adjusted EBITDA provides additional supplemental information to compare results among our segments. Beginning in 2016 the Company Adjusted EBITDA will also be used in determining incentive compensation for the Company’s executive officers. These measures are not a measurement of financial performance or liquidity under GAAP and should not be considered as an alternative or substitute for net income. The Company’s presentation of these measures may differ from similarly titled non-GAAP financial measures used by other companies. The Company defines EBITDA as GAAP net income of the Company adjusted to add consolidated interest expense, consolidated income taxes and consolidated depreciation and amortization expense as presented in its financial statements and Adjusted EBITDA as EBITDA adjusted to (i) subtract interest expense on asset-specific debt incurred in the ordinary course of its subsidiaries’ business operations, (ii) adjust for the effect of purchase accounting, (iii) add back significant acquisition related costs, (iv) adjust for significant relocation costs and (v) any significant one-time expenses. NON-GAAP FINANCIAL MEASURES - EBITDA AND ADJUSTED EBITDA Reconciliation from the Company’s GAAP net income to Non-GAAP financial measures - EBITDA and Adjusted EBITDA ($ in thousands) Three months ended March 31, 2016 2015 Net income available to Class A common stockholders $ 5,555 $ (979) Add: net income (loss) attributable to non-controlling interests 1,859 (1,040) Less: net income from discontinued operations — 2,345 (Loss) income from Continuing Operations of the Company $ 7,414 $ (4,364) Consolidated interest expense 6,480 5,129 Consolidated income taxes (2,439) (1,496) Consolidated depreciation and amortization expense 8,377 15,464 EBITDA from Continuing Operations $ 19,832 $ 14,733 Consolidated non-corporate and non-acquisition related interest expense(1) (4,278) (1,841) Effects of purchase accounting(2) (2,030) (9,483) Non-cash fair value adjustments(3) 1,416 — Significant acquisition expenses(4) 383 1,349 Subtotal Adjusted EBITDA from Continuing Operations of the Company $ 15,323 $ 4,758 Income from Discontinued Operations of the Company $ — $ 2,345 Consolidated interest expense — 2,654 Consolidated income taxes — 2,742 Consolidated depreciation and amortization expense — 457 EBITDA from Discontinued Operations $ — $ 8,198 Subtotal Adjusted EBITDA from Discontinued Operations of the Company $ — $ 8,198 Total Adjusted EBITDA of the Company $ 15,323 $ 12,956 (1) The consolidated non-corporate and non-acquisition related interest expense is subtracted from EBITDA to arrive at Adjusted EBITDA. This includes interest expense associated with asset-specific debt at subsidiaries in the insurance and insurance services, specialty finance, real estate and corporate and other segments. (2) Following the purchase accounting adjustments, current period expenses associated with deferred costs were more favorably stated by $4.4 million and current period income associated with deferred revenues were less favorably stated by $2.4 million. Thus, the purchase accounting effect related to Fortegra, increased EBITDA in the first quarter of 2016 by $2.0 million above what the historical basis of accounting would have generated. The impact of this purchase accounting adjustments have been reversed to reflect an adjusted EBITDA without such purchase accounting effect. (3) For Care, Adjusted EBITDA excludes the impact of the change of fair value of interest rate swaps hedging the debt at the property level to conform to our updated interest rate hedging policy. (4) For the first quarter of 2016, $0.4 million of acquisition related costs represents costs in connection with Care’s acquisition of two properties which included taxes, legal costs and other expenses.

17 Management uses EBITDA and Adjusted EBITDA, which are non-GAAP financial measures. The Company believes that consolidated EBITDA and Adjusted EBITDA on a consolidated basis and for each segment provide supplemental information useful to investors as it is frequently used by the financial community to analyze performance period to period, to analyze a company’s ability to service its debt and to facilitate comparison among companies. The Company believes segment EBITDA and Adjusted EBITDA provides additional supplemental information to compare results among our segments. Beginning in 2016 the Company Adjusted EBITDA will also be used in determining incentive compensation for the Company’s executive officers. These measures are not a measurement of financial performance or liquidity under GAAP and should not be considered as an alternative or substitute for net income. The Company’s presentation of these measures may differ from similarly titled non- GAAP financial measures used by other companies. The Company defines EBITDA as GAAP net income of the Company adjusted to add consolidated interest expense, consolidated income taxes and consolidated depreciation and amortization expense as presented in its financial statements and Adjusted EBITDA as EBITDA adjusted to (i) subtract interest expense on asset-specific debt incurred in the ordinary course of its subsidiaries’ business operations, (ii) adjust for the effect of purchase accounting, (iii) add back significant acquisition related costs, (iv) adjust for significant relocation costs and (v) any significant one-time expenses. NON-GAAP FINANCIAL MEASURES - EBITDA AND ADJUSTED EBITDA ($ in thousands) Segment EBITDA and Adjusted EBITDA - Three Months Ended March 31, 2016 and March 31, 2015 Insurance and insurance services Specialty finance Real estate Asset management Corporate and other Totals Three Months Ended March 31, Three Months Ended March 31, Three Months Ended March 31, Three Months Ended March 31, Three Months Ended March 31, Three Months Ended March 31, 2016 2015 2016 2015 2016 2015 2016 2015 2016 2015 2016 2015 Pre-tax income/(loss) $ 8,997 $ 4,026 $ (983) $ 435 $ (3,859) $ (4,181) $ 1,660 $ 1,874 $ (840) $ (8,014) $ 4,975 $ (5,860) Add back: Interest expense 1,155 1,739 1,185 511 1,854 1,330 — — 2,286 1,549 6,480 5,129 Depreciation and amortization expenses 3,983 11,954 202 122 4,130 3,388 — — 62 — 8,377 15,464 Segment EBITDA $ 14,135 $ 17,719 $ 404 $ 1,068 $ 2,125 $ 537 $ 1,660 $ 1,874 $ 1,508 $ (6,465) $ 19,832 $ 14,733 EBITDA adjustments: Asset-specific debt interest (99) — (1,134) (511) (1,854) (1,330) — — (1,191) — (4,278) (1,841) Effects of purchase accounting (2,030) (9,483) — — — — — — — — (2,030) (9,483) Non-cash fair value adjustments — — — — 1,416 — — — — — 1,416 — Significant acquisition expenses — — — — 383 1,349 — — — — 383 1,349 Segment Adjusted EBITDA $ 12,006 $ 8,236 $ (730) $ 557 $ 2,070 $ 556 $ 1,660 $ 1,874 $ 317 $ (6,465) $ 15,323 $ 4,758

18 Fortegra presents As Adjusted Net revenues which is a Non-GAAP financial measure to provide investors with additional information to analyze its performance from period to period. Management also uses this measures to assess performance and to allocate resources in managing its businesses. However, investors should not consider this Non-GAAP financial measures as a substitute for the financial information that Fortegra reports in accordance with U.S. GAAP. This Non-GAAP financial measure reflects subjective determinations by Fortegra management, and may differ from similarly titled Non-GAAP financial measures presented by other companies. See the below table for a reconciliation from GAAP Total revenues to As Adjusted Net revenues. NON-GAAP FINANCIAL INFORMATION- INSURANCE & INSURANCE SERVICES (1) Includes net realized and unrealized gains and (losses) on investments. (2) Represents service fee revenues that would have been recognized had purchase accounting effects not been recorded. Deferred service fee liabilities at the acquisition date were reduced to reflect the purchase accounting fair value. (3) Represents ceding commission revenues that would have been recognized had purchase accounting effects not been recorded. Deferred ceding commissions liabilities at the acquisition date were reduced to reflect the purchase accounting fair value. (4) Represents additional commissions expense that would have been recorded without purchase accounting; the values of deferred commission assets were eliminated in purchase accounting. (5) Represents the removal of net additional depreciation and amortization expense that would not have been recorded without purchase accounting; fixed assets and amortizing intangible assets were adjusted in purchase accounting based on fair value analyses. (6) Represents additional premium tax and other acquisition expenses that would have been recorded without purchase accounting; values of deferred acquisition costs were eliminated in purchase accounting. Three months ended March 31, 2016 Three months ended March 31, 2015 ($ in thousands) GAAP Adjustments Non-GAAP As Adjusted GAAP Adjustments Non-GAAP As Adjusted Revenues: Earned premiums $ 44,615 $ — $ 44,615 $ 37,353 $ — $ 37,353 Service and administrative fees 30,310 2,196 (2) 32,506 21,927 6,150 (2) 28,077 Ceding commissions 10,703 191 (3) 10,894 9,937 1,602 (3) 11,539 Interest income (1) 3,420 — 3,420 1,225 — 1,225 Other Income 264 — 264 1,937 — 1,937 Total revenues 89,312 2,387 91,699 72,379 7,752 80,131 Less: Commission expense 33,038 4,263 (4) 37,301 16,528 16,854 (4) 33,382 Member benefit claims 5,750 — 5,750 7,579 — 7,579 Net losses and loss adjustment expenses 17,948 — 17,948 12,450 — 12,450 Net revenues 32,576 (1,876) 30,700 35,822 (9,102) 26,720 Expenses: Interest expense 1,155 — 1,155 1,739 — 1,739 Payroll and employee commissions 9,587 — 9,587 10,405 — 10,405 Depreciation and amortization expenses 3,983 (1,487) (5) 2,496 11,954 (9,389) (5) 2,565 Other expenses 8,854 153 (6) 9,007 7,698 816 (6) 8,514 Total operating expenses 23,579 (1,334) 22,245 31,796 (8,573) 23,223 Income before taxes from continuing operations $ 8,997 $ (542) $ 8,455 $ 4,026 $ (529) $ 3,497 EBITDA 14,135 (2,029) 12,105 17,718 (9,918) 7,801 Asset-specific debt interest (99) (99) Effects of purchase accounting (2,030) (9,483) 434 Adjusted EBITDA $ 12,006 $ 12,006 $ 8,235 $ 8,235 Adjusted EBITDA % (adjusted EBITDA over net revenues as adjusted) 39.1% 30.8%
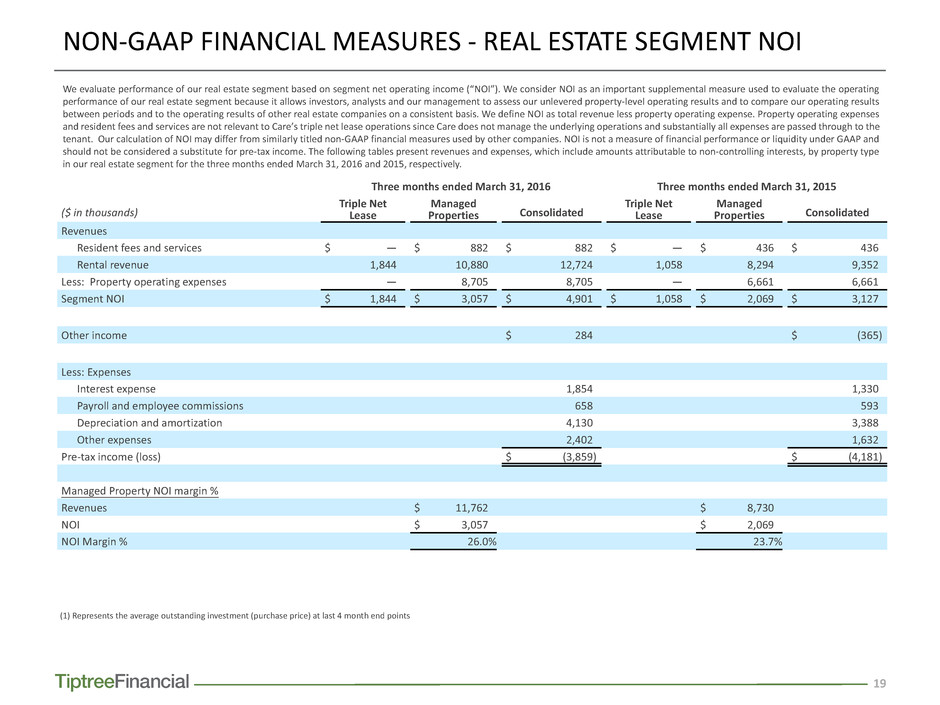
19 NON-GAAP FINANCIAL MEASURES - REAL ESTATE SEGMENT NOI We evaluate performance of our real estate segment based on segment net operating income (“NOI”). We consider NOI as an important supplemental measure used to evaluate the operating performance of our real estate segment because it allows investors, analysts and our management to assess our unlevered property-level operating results and to compare our operating results between periods and to the operating results of other real estate companies on a consistent basis. We define NOI as total revenue less property operating expense. Property operating expenses and resident fees and services are not relevant to Care’s triple net lease operations since Care does not manage the underlying operations and substantially all expenses are passed through to the tenant. Our calculation of NOI may differ from similarly titled non-GAAP financial measures used by other companies. NOI is not a measure of financial performance or liquidity under GAAP and should not be considered a substitute for pre-tax income. The following tables present revenues and expenses, which include amounts attributable to non-controlling interests, by property type in our real estate segment for the three months ended March 31, 2016 and 2015, respectively. Three months ended March 31, 2016 Three months ended March 31, 2015 ($ in thousands) Triple Net Lease Managed Properties Consolidated Triple Net Lease Managed Properties Consolidated Revenues Resident fees and services $ — $ 882 $ 882 $ — $ 436 $ 436 Rental revenue 1,844 10,880 12,724 1,058 8,294 9,352 Less: Property operating expenses — 8,705 8,705 — 6,661 6,661 Segment NOI $ 1,844 $ 3,057 $ 4,901 $ 1,058 $ 2,069 $ 3,127 Other income $ 284 $ (365) Less: Expenses Interest expense 1,854 1,330 Payroll and employee commissions 658 593 Depreciation and amortization 4,130 3,388 Other expenses 2,402 1,632 Pre-tax income (loss) $ (3,859) $ (4,181) Managed Property NOI margin % Revenues $ 11,762 $ 8,730 NOI $ 3,057 $ 2,069 NOI Margin % 26.0% 23.7% (1) Represents the average outstanding investment (purchase price) at last 4 month end points

20 NON-GAAP FINANCIAL MEASURES - CLOs MANAGED BY THE COMPANY The Company deconsolidated the results of Telos 1, Telos 2, Telos 3 and Telos 4 for the period that we did not own the subordinated notes for the three months ended March 31, 2016 but not for the prior year period. The table below shows the results attributable to the CLOs both on a consolidated basis and an unconsolidated basis, which is a non-GAAP measure, for the three months ended March 31, 2016. Management believes is helpful to investors for year-over-year comparative purposes, given that Telos 2 and Telos 4 were not deconsolidated until Q2 2015 when we sold our retained interests in each CLO. Notes: (1) Represents amounts from Telos 1, Telos 2, Telos 3 and Telos 4, which have been deconsolidated for the period that we did not own the subordinated notes. See Note 16—Assets and Liabilities of Consolidated CLOs, in the Form 10-Q for the quarter ended March 31, 2016, regarding the deconsolidation of certain of our CLOs. (2) Includes amounts from Telos 2 and Telos 4 of $1.2 million which were deconsolidated and sold in the second quarter of 2015. (3) Management fees to Telos are shown net of any management fee participation by Telos to others. ($ in thousands) Net Income attributable to CLOs managed by the Company Three months ended March 31, 2016 2015 Consolidated Not consolidated(1) Non-GAAP total Consolidated(2) Not consolidated(1) Non-GAAP total Management fees paid by the CLOs to the Company(3) $ 669 $ 1,951 $ 2,620 $ 1,837 $ 984 $ 2,821 Distributions from the subordinated notes held by the Company 2,749 72 2,821 5,657 69 5,726 Realized and unrealized (losses) gains on subordinated notes held by the Company (2,313) (292) (2,605) (7,805) — (7,805) Net (loss) income attributable to the CLOs $ 1,105 $ 1,731 $ 2,836 $ (311) $ 1,053 $ 742

21 TIPTREE FINANCIAL INC. AND THE COMPANY - BOOK VALUE PER SHARE Tiptree Financial’s book value per share was $9.12 as of March 31, 2016 compared with $8.96 as of December 31, 2015. Total stockholders’ equity for the Company was $388.2 million as of March 31, 2016, which comprised total stockholders’ equity of $409.7 million adjusted for $18.6 million attributable to non-controlling interest at subsidiaries that are not wholly owned by the Company and net assets of $2.9 million wholly owned by Tiptree Financial Inc. Total stockholders’ equity for the Company was $369.7 million as of December 31, 2015, which comprised total stockholders’ equity of $397.7 million adjusted for $15.6 million attributable to non-controlling interest at subsidiaries that are not wholly owned by the Company, such as Siena, Luxury and Care and net assets of $12.5 million wholly owned by Tiptree Financial Inc. Additionally, the Company’s book value per share is based upon Class A common shares outstanding, plus Class A common stock issuable upon exchange of partnership units of TFP. The total shares as of March 31, 2016 and December 31, 2015 were 42.96 million and 42.95 million, respectively. Tiptree Financial’s Class A book value per common share and the Company’s book value per share are presented below. Book value per share - Tiptree Financial (in thousands, except per share data) March 31, 2016 December 31, 2015 Total stockholders’ equity of Tiptree Financial $ 318,373 $ 312,840 Class A common stock outstanding 34,915 34,900 Class A book value per common share $ 9.12 $ 8.96 Book value per share - the Company Total stockholders' equity $ 409,718 $ 397,694 Less non-controlling interest at subsidiaries that are not wholly owned 18,624 15,576 Less net asset or (liability) wholly owned by Tiptree Financial 2,927 12,456 Total stockholders’ equity $ 388,167 $ 369,662 Class A common stock outstanding 34,915 34,900 Class A common stock issuable upon exchange of partnership units of TFP 8,049 8,049 Total shares 42,964 42,949 Company book value per share $ 9.03 $ 8.61 (1) See Note 25—Earnings per Share, in the Form 10-Q for the three months ended March 31, 2016, for further discussion of potential dilution from warrants.
