Attached files
| file | filename |
|---|---|
| EX-99.1 - EXHIBIT 99.1 - UCP, Inc. | a3312016ucppressrelease.htm |
| 8-K - 8-K - UCP, Inc. | ucp8-kq12016results.htm |

1Q16 Earnings Presentation May 9 , 2016

U Forward-Looking Statements We make forward-looking statements in this presentation that are subject to risks and uncertainties. These forward-looking statements include information about possible or assumed future results of our business, beliefs, expectations or intentions, financial condition, liquidity, results of operations, cash flow and plans and objectives. When we use the words “believe,” “expect,” “anticipate,” “estimate,” “plan,” “project,” “goal,” “potential,” “predict,” “continue,” “intend,” “should,” “may” or similar expressions, we intend to identify forward- looking statements. Statements regarding the following subjects, among others, may be forward-looking: economic changes, either nationally or in the markets in which we operate, including declines in employment, volatility of mortgage interest rates and inflation; downturns in the homebuilding industry, either nationally or in the markets in which we operate; continued volatility and uncertainty in the credit markets and broader financial markets; our business operations; changes in our business and investment strategy; availability of land to acquire and our ability to acquire such land on favorable terms or at all; availability, terms and deployment of capital; disruptions in the availability of mortgage financing or increases in the number of foreclosures in our markets; shortages of or increased prices for labor, land or raw materials used in housing construction; delays or restrictions in land development or home construction or reduced consumer demand resulting from adverse weather and geological conditions or other events outside our control; the cost and availability of insurance and surety bonds; changes in, or the failure or inability to comply with, governmental laws and regulations; the timing of receipt of regulatory approvals and the opening of communities; the degree and nature of our competition; our leverage and debt service obligations; our future operating expenses, which may increase disproportionately to our revenue; our ability to achieve operational efficiencies with future revenue growth; our relationship, and actual and potential conflicts of interest, with PICO Holdings Inc.; and availability of qualified personnel and our ability to retain our key personnel. The forward-looking statements are based on our beliefs, assumptions and expectations of our future performance, taking into account all information currently available to us. Forward-looking statements are not predictions of future events. These beliefs, assumptions and expectations can change as a result of many possible events or factors, not all of which are known to us. If a change occurs, our business, financial condition, liquidity and results of operations may vary materially from those expressed in our forward-looking statements. Any forward-looking statement speaks only as of the date on which it is made. New risks and uncertainties arise over time, and it is not possible for us to predict those events or how they may affect us. Except as required by law, we are not obligated to, and do not intend to, update or revise any forward-looking statements, whether as a result of new information, future events or otherwise. 2

U 1Q 2016 Goals & Accomplishments - Adj. Gross Margin* +130 bps - SG&A % Revenue (990) bps - EPS improved to $0.01 - Strong backlog, land inventory & capital base Momentum 1 Discipline 2 Transformation 3 - Homebuilding Revenue +60% - Homes Delivered +37% * Homebuilding adjusted gross margin is a non-U.S. GAAP financial measure. A discussion of homebuilding adjusted gross margin is included in the Appendix hereto, as well as a reconciliation between homebuilding gross margin and adjusted homebuilding gross margin. . 3

U 1Q 2016 Homebuilding Revenue Dynamics Homebuilding Revenue Homes Delivered Average Selling Price Mix of Homes Delivered by Region Homes Delivered $360k $370k 4

U Gross Margin Expansion 5 Highlights Consolidated Adj. Gross Margin Consolidated Gross Margin* Disciplined and strengthened margin profile 1Q16 adjusted homebuilding gross margin up 130 basis points year-over-year Balanced and efficient relationship between pre-sales and spec Enhanced product offerings with coveted amenities at attractive margins * Homebuilding adjusted gross margin is a non-U.S. GAAP financial measure. A discussion of homebuilding adjusted gross margin is included in the Appendix hereto, as well as a reconciliation between homebuilding gross margin and adjusted homebuilding gross margin. .

U SG&A Improvement 6 SG&A as % of Total Revenue G&A as % of Total Revenue Highlights 1Q16 SG&A as a percent of total revenue improved 990 bps G&A reduced to 10.7% compared to 16.8% in 1Q15 More efficient cost base to leverage our rising revenue and deliveries

U Markets, New Orders & Backlog UCP Homebuilding Markets Net New Home Orders Land Inventory by Region $360k $370k 7 Southeast Southern California Central Valley Pacific Northwest UCP Note: ‘Land inventory’ denotes owned & controlled lots as of March 31, 2016. Backlog Units SF Bay Area

1Q 2016 Highlights • Net income increased to $0.2 million, or net income attributable to shareholders of UCP of $0.1 per share • Total consolidated revenue grew 56.8% to $68.2 million • Revenue from homebuilding increased 60.0% to $68.2 million • Homes delivered grew 36.9% to 167 units • Adjusted homebuilding gross margin percentage increased 130 bps to 19.9% • Selling, general and administrative expense as a percentage of total revenue improved to 16.6%, compared to 26.5% • Backlog units expanded 37.7% to 307 units • Average active selling communities of 28, compared to 25 1Q16 Compared to 1Q15 8

U Balance Sheet Strength 9 Solid capital position and leverage metrics to execute growth objectives Note: The ratio of net-debt-to-capital is a non-U.S. GAAP financial measure. A discussion of net-debt-to-capital is included in the Appendix hereto, as well as a reconciliation between net-debt-to-capital and debt-to-capital. . Net Debt- Capital Ratio ($ millions) 3/31/2016 12/31/2015 Debt $158.6 $156.0 Equity $217.8 $217.4 Total Capital $376.4 $373.4 Ratio of Debt-to-Capital 42.1% 41.8% Debt $158.6 $156.0 Net Cash and Cash Equivalents $30.7 $40.7 Less: Restricted Cash and Minimum Liquidity Requirement $15.9 $15.9 Unrestricted Cash and Cash Equivalents $14.8 $24.8 Net Debt $143.8 $131.1 Equity $217.8 $217.4 Total Adjusted Capital $361.6 $348.5 Ratio of Net Debt-to-Capital 39.8% 37.6%

U Strong Track Record of Growth 1Q16 represented UCP’s continued momentum in growing revenues Growing Business with Disciplined Focus $360k $370k 10 Strong growth track record 1Q deliveries of 167 homes, up from 122 homes in 1Q15 Invested significant time, capital and energy to build a platform for sustained success Scalable corporate infrastructure built to support growth

U Financial Summary 11

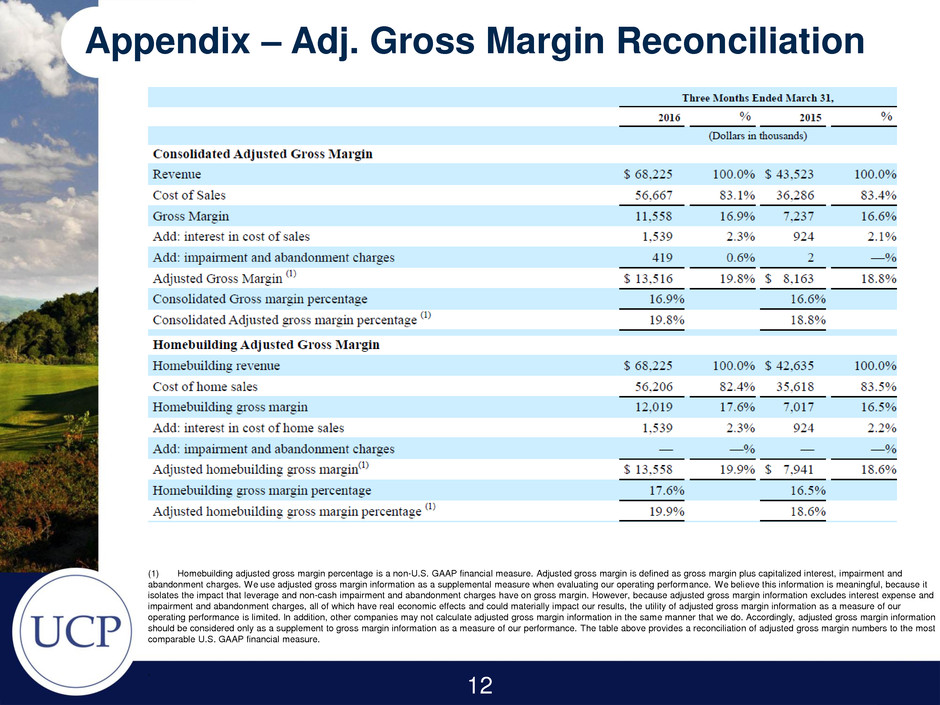
U Appendix – Adj. Gross Margin Reconciliation 12 (1) Homebuilding adjusted gross margin percentage is a non-U.S. GAAP financial measure. Adjusted gross margin is defined as gross margin plus capitalized interest, impairment and abandonment charges. We use adjusted gross margin information as a supplemental measure when evaluating our operating performance. We believe this information is meaningful, because it isolates the impact that leverage and non-cash impairment and abandonment charges have on gross margin. However, because adjusted gross margin information excludes interest expense and impairment and abandonment charges, all of which have real economic effects and could materially impact our results, the utility of adjusted gross margin information as a measure of our operating performance is limited. In addition, other companies may not calculate adjusted gross margin information in the same manner that we do. Accordingly, adjusted gross margin information should be considered only as a supplement to gross margin information as a measure of our performance. The table above provides a reconciliation of adjusted gross margin numbers to the most comparable U.S. GAAP financial measure. .

U Appendix – Ratio of Net Debt to Capital 13
