Attached files
| file | filename |
|---|---|
| 8-K - FORM 8-K - UMB FINANCIAL CORP | d156864d8k.htm |
| EX-99.1 - EX-99.1 - UMB FINANCIAL CORP | d156864dex991.htm |
| EX-99.3 - EX-99.3 - UMB FINANCIAL CORP | d156864dex993.htm |
 UMB
Financial Annual Meeting of Shareholders
April 26, 2016 More Defines Us Exhibit 99.2 |
 Cautionary
Notice about Forward-Looking Statements 2
This presentation contains, and our other communications may contain,
forward-looking statements within the meaning of the Private Securities
Litigation Reform Act of 1995. These statements can be identified by the fact that they
do not relate strictly to historical or current facts—such as our
statements about expected cost savings and other results of efficiency initiatives and
our statements about asset sensitivity. Forward-looking statements
often use words such as “believe,” “expect,”
“anticipate,” “intend,” “estimate,” “project,” “outlook,” “forecast,” “target,” “trend,” “plan,” “goal,” or other words
of comparable meaning or future-tense or conditional verbs such as “may,” “will,” “should,” “would,” or “could.” Forward-looking statements convey our expectations, intentions, or forecasts about future events, circumstances, results, or aspirations.
All forward-looking statements are subject to assumptions, risks, and
uncertainties, which may change over time and many of which are beyond our
control. You should not rely on any forward-looking statement as a prediction or
guarantee about the future. Our actual future objectives, strategies,
plans, prospects, performance, condition, or results may differ materially from those
set forth in any forward-looking statement. Some of the factors that
may cause actual results or other future events, circumstances, or aspirations to
differ from those in forward-looking statements are described in our
Annual Report on Form 10-K for the year ended December 31, 2015, our subsequent
Quarterly Reports on Form 10-Q or Current Reports on Form 8-K, or
other applicable documents that are filed or furnished with the Securities and Exchange Commission (SEC). Any forward-looking statement made by us or on our behalf speaks only as of the date that it was made. We do not undertake to update any
forward- looking
statement to reflect the impact of events, circumstances, or results that arise after the date that the statement was made. You, however, should consult further disclosures (including disclosures of a forward-looking nature) that we may make in any subsequent Annual Report on Form 10-K, Quarterly Report on Form 10-Q, Current Report on Form 8-K, or other applicable document that is filed or furnished with the
SEC. |
 Agenda Evolution 2015 Highlights Questions & Answers 2016 and Beyond More Defines Us |
 $19.39
$38.34 $1.37 Billion $2.30 Billion 4 A Quick Look Back Book Value Market Capitalization Total Deposits $5.9 billion $15.1 billion Total Loans $3.4 billion $9.4 billion 2005 2015 At December 31, Assets Under Management $8.2 billion $40.0 billion Total Revenue $440.2 million $878.5 million UMB +7.1% Industry Median +4.0% Compound Annual Growth Rate: UMB +7.2% Industry Median +2.0% (1) Industry is defined as all publicly-traded banks with data available for each period. Source: SNL Financial.
(1) (1) |
 5 Consistent Loan Growth End-of-Period Total Loans (1) ($ in billions) 10 Year Growth +177.9% (2) (1) Includes loans held for sale. (2) On 5/31/15, we closed the acquisition of Marquette Financial Companies and loans with an acquired value of $980.4 million were added to the UMB
portfolio.
At 12/31/15, the acquired loans plus production in the legacy Marquette channels totaled $982.1 million. (3) Industry is defined as all publicly traded banks with loan data for 2005 and 2015. Source: SNL Financial. The 10-year industry (3) median increase in loan balances = 73.4% $3.4 $3.8 $3.9 $4.4 $4.3 $4.6 $5.0 $5.7 $6.5 $7.5 $9.4 |
 6 Consistent Underwriting Standards History of Net Charge-Offs Non-Performing Loans vs. Banking Industry UMBF Industry Median (3) (1) Commercial includes C&I, Commercial credit card, CRE, RE Construction, asset-based, and factoring loans. (2) Other includes Consumer, Residential RE, HELOC, and DDA Charge- offs. (3) Industry is defined as all publicly-traded banks with data available for each period. Source: SNL Financial.
0.17% 0.54% 0.49% 0.65% 0.29% 2.46% 2.47% 1.19% ($ in thousands) 2007 2008 2009 2010 2011 2012 2013 2014 2015 Commercial Loans (1) 1,569 $ 2,943 $ 4,113 $ 6,007 $ 11,880 $ 7,310 $ 3,881 $ 6,459 $ 3,415 $ Consumer Credit Card 4,577 6,839 12,291 14,279 11,127 9,382 8,811 8,301 6,753 Other (2) 2,127 1,973 3,854 1,411 1,128 1,399 1,483 851 329 Total Net Charge-Offs 8,273 $ 11,755 $ 20,258 $ 21,697 $ 24,135 $ 18,091 $ 14,175 $ 15,611 $ 10,497 $ Average Total Loans ($ in millions) 3,901.9 $ 4,193.9 $ 4,383.6 $ 4,490.6 $ 4,756.2 $ 5,251.3 $ 6,221.3 $ 6,975.3 $ 8,425.1 $ NCOs as % of Avg Loans 0.21% 0.28% 0.47% 0.48% 0.51% 0.35% 0.23% 0.22% 0.12% |
 Consistency
Leads to Revenue Growth $440.2
$472.2 $521.5 $587.8 $613.2 $671.0 $731.3 $778.2 $825.1 $848.7 $878.5 Total Revenue Trends ($ in thousands) 10 Year Growth +99.6% 7 57.2% 54.0% 55.4% 53.2% 50.6% 53.7% 56.7% 58.9% 59.6% 58.8% 53.1% Net Interest Income Noninterest Income NIM |
 Agenda Evolution 2015 Highlights Questions & Answers 2016 and Beyond More Defines Us |
 9 2015 Highlights • We closed on our acquisition of Marquette Financial Companies on May 31, 2015 o Expanded presence in key banking markets o Added new specialty finance businesses • Announced a company-wide efficiency initiative o Identified $32.9 million in annual cost savings, to be fully realized beginning in 2017
o Streamlined our organizational structure o Strengthened our commitment to operating more efficiently o No compromise in customer service |
 10 2015 Results At-A-Glance All comparisons are full-year 2015 vs. full-year 2014 $0.59 $0.60 $0.78 $0.46 $0.76 $0.65 $0.52 $0.74 2014 2015 Diluted Earnings Per Share $2.65 $2.44 4Q 3Q 2Q 1Q Net Income: $116.1 million, a year-over-year decrease of $4.6 million Primary drivers: • Higher Expenses +$38.1
million o
$28.7 million increased expense related to acquisition of Marquette
• Lower noninterest Income
-$32.2 million o Scout revenue -$36.1 million Partially offset by: • Higher net interest income
+$62.0 million o Growing loan balances +26.3% Legacy UMB loans +13.2% Added $1.0 billion in higher-yielding Marquette loans • Initiation of efficiency initiatives o Recognized $9.5 million in cost savings in 2015 |
 Agenda Evolution 2015 Highlights Questions & Answers 2016 and Beyond More Defines Us |
 12 1 st Quarter 2016 Results Return on average equity $0.52 $0.74 $0.74 $0.76 $0.65 $0.78 $0.46 $0.59 $0.60 2014 2015 2016 4Q 3Q 2Q 1Q Diluted Earnings Per Share All comparisons are first quarter 2016 vs. first quarter 2015 1Q’16: 7.51% 4Q’15: 6.15% Return on average assets 1Q’16: 0.75% 4Q’15: 0.63% Net Income: $36.2 million, a year-over-year increase of $2.5 million Primary drivers: • Higher net interest income
+$27.5 million o Growing loan balances +29.4% Legacy UMB loans +16.0% Partially offset by: • Higher expenses +$16.3
million o
$11.3 million increased expense related to acquisition of Marquette
• Lower noninterest Income
-$8.9 million o Scout revenue -$8.7 million • Continued progress on efficiency initiatives o Recognized $4.9 million in cost savings in 1Q’16 |
 13 A Few Highlights • Healthcare Services o HSA deposits reached $1.4 billion; investment assets of $140.4 million +36.7% o Deposits & assets have increased 43x
from 2005 levels • Institutional Banking o New investment banking team in Dallas – builds on growth platform in Texas • FDIC Sweep product – averaged nearly $41 billion in balances
• Credit & Debit Cards o Record purchase volume of $2.7 billion
+14.1% o Direct Cash™ Visa ® card launched • Fund Services o Added 80 new funds serviced over the past 12 months
• Scout o 9 funds rated by Morningstar: 5 have an overall rating of 4 stars and 1, the Core Plus Bond Fund, has 5 stars
(1) o Assets under management of $27.3 billion All comparisons are first quarter 2016 vs. first quarter 2015 (1) See disclosures on slides 14 and 15. |
 Morningstar Ratings The Overall Morningstar Rating™ for a fund is derived from the weighted-average of the performance figures associated with its 3-, 5- and 10-year (if applicable) Morningstar Rating metrics. For each fund with at least a 3-year history, Morningstar calculates a Morningstar Rating™ based on a Morningstar
Risk-Adjusted Return measure that accounts for variations in a fund's
monthly performance (including the effects of sales charges, loads and redemption fees), placing more emphasis on downward variations and rewarding consistent performance. The top 10% of the funds in a broad asset class receive 5 stars, the next 22.5% receive 4 stars, the next 35% receive 3 stars, the next 22.5%
receive 2 stars and the bottom 10% receive 1 star. (Each share class is
counted as a fraction of one fund within this scale and rated separately, which may cause slight variations in the distribution percentages.) As of 3/31/16, the Scout Emerging Markets Fund received the following star ratings among U.S. domiciled Diversified Emerging Markets Funds for
the following time periods: 4 stars (among 591 funds) for the 3-yr
period. As of 3/31/16, the Scout Global Equity Fund received the
following star ratings among U.S. domiciled World Stock Funds for the following time periods: 4 stars (among 991 funds) for the 3-yr period. As of 3/31/16, the Scout Small Cap Fund received the following star ratings among U.S. domiciled Small Growth Funds for the following time
periods: 4 stars (among 658 funds) for the 3- yr, 4 stars (among 588
funds) for the 5-yr and 3 stars (among 423 funds) for the 10 year periods. As of 3/31/16, the Scout Core Bond Fund - Institutional Class received the following star ratings among U.S. domiciled Intermediate-Term Bond Funds for the following time periods: 3 stars (among 951 funds) for the 3-yr, 3 stars (among 827 funds) for the 5-yr and 5 stars (among 602 funds) for the 10 year
periods. As
of 3/31/16, the Scout Core Plus Bond Fund - Institutional Class received the following star ratings among U.S. domiciled Intermediate-Term Bond Funds for the following time periods: 3 stars (among 951 funds) for the 3-yr, 5 stars (among 827 funds) for the 5-yr and 5 stars (among 602 funds) for the 10 year
periods. As of 3/31/16, the Scout Low Duration Bond Fund received the
following star ratings among U.S. domiciled Short-Term Bond Funds for the following time periods: 4 stars (among 490 funds) for the 3-yr period. The funds may have experienced negative performance during one or more of the time periods represented by the Morningstar rating shown. © 2016 Morningstar, Inc. All Rights Reserved. The information contained herein: (1) is proprietary to Morningstar and/or its content
providers; (2) may not be copied or distributed; and (3) is not warranted
to be accurate, complete or timely. Neither Morningstar nor its content providers are responsible for any damages or losses arising from any use of this information. Past performance is no guarantee of future results. The Morningstar Rating may differ among share classes of a mutual fund as a result of different
sales loads and/or expense structures. It may be based, in part, on the
performance of a predecessor Fund. NOT FDIC INSURED • NO BANK
GUARANTEE • MAY LOSE VALUE Morningstar
ratings based on a risk-adjusted performance as of March 31, 2016 Fund Name Category Overall Rating Funds in Category Fund Name Category Overall Rating Funds in Category Scout Emerging Markets Diversified Emerging Mrkts 591 Scout Core Bond - Institutional Class Intermediate-Term Bond 951 Scout Global Equity World Stock 991 Scout Core Plus Bond - Institutional Class Intermediate-Term Bond 951 Scout Small Cap Small Growth 658 Scout Low Duration Bond Short-Term Bond 490 |
 Important
Disclosures 15
Each Fund’s Prospectus or Summary Prospectus, available by calling 800.996.2862 or
visiting scoutinv.com, includes investment objectives, risks, fees, expenses
and other important information. Please read and consider carefully before investing. Risk considerations: Stock fund values fluctuate and investors may lose principal value. Small-cap and mid-cap stocks are more susceptible to market
volatility due to risks such as lack of management experience, product diversification,
financial resources, competitive strength and liquidity. Real Estate
Investment Trusts (REITS) may be affected by economic conditions including credit risk,
interest rate risk and other factors that affect property values, rents
or occupancies of real estate. Groups of stocks, such as value and growth, go in
and out of favor, which may cause certain funds to underperform other
equity funds. Foreign investments present additional risk due to currency fluctuations, economic and political factors, government regulations, differences in
accounting standards, and other factors. Investments in emerging markets
involve even greater risks. Focusing on particular countries, regions, industries, sectors or types of investments may cause greater risk of adverse developments in certain funds.
The return of principal in a fixed income fund is not guaranteed. Fixed income funds
have the same issuer, interest rate, inflation and credit risks that are
associated with underlying fixed income securities owned by the fund. Mortgage- and Asset-Backed Securities are subject to prepayment risk and the risk of default on the underlying mortgages or other assets. High yield securities involve greater risk than investment grade securities and tend to be more sensitive to economic conditions and credit risk. An unconstrained investment approach can create considerable exposure to certain types of securities,
such as derivatives, that present significant volatility, particularly
over short periods of time. Derivatives, such as options, futures
contracts, currency forwards or swap agreements, may involve greater risks than if the Fund invested in the referenced obligation directly. Derivatives are subject to risks, such as market risk, liquidity risk, interest rate risk, credit risk and management risk.
Derivative investments
could lose more than the principal amount invested. Certain funds may use derivative for hedging purposes or as part of the fund's investment strategy. The use of leverage, derivatives and short sales could accelerate losses to the Fund. These losses could exceed the original amount invested. Certain funds may, at times, experience higher-than-average portfolio turnover, which may generate significant taxable gains and increased trading expenses, which, in turn, may lower the fund’s return. The Scout Funds are distributed by UMB Distribution Services LLC, an affiliate of UMB Financial Corp., and managed by Scout Investments, Inc., a
subsidiary of UMB Financial
Corp.
|
 16 2016 Priorities 1. Improve operating metrics • Efficiency – continue to deliver cost savings begun in 2015 • Acquisitions
– fully integrate our Marquette franchises and look for additional opportunity • Balance sheet optimization – continue to shift earning assets into loans • Capital – maintain strong position 2. Maintain investment in our future growth • Investment management – focus on continued performance and strong distribution efforts • Fund and sustain our other high margin growth businesses |
 Agenda Evolution 2015 Highlights Questions & Answers 2016 and Beyond More Defines Us |
 2015
Annual Report 18 |
 19 More defines us Responsive Focused Nimble Count on More – Our promise to listen, then deliver service that exceeds expectations “All in”– committed to maximize efficiency and meet the challenges of the environment Streamlined communication and decision- making; leaner and more competitive |
 20 More defines us Potential Committed Our unique business model fuels our success Passionate and engaged associates committed to deliver results for customers, communities, shareholders, and one another |
 21 More Than an Institution – Our People Continuity – We’re in it for the long run 3,830 Associates Associate Average Tenure All Associates Commercial Bankers Loan Committee Line of Business Leaders 8.4 years 8.7 years 13.4 years 18.8 years |
 22 Caring for Our Communities Community volunteer time: 9,540 hours |
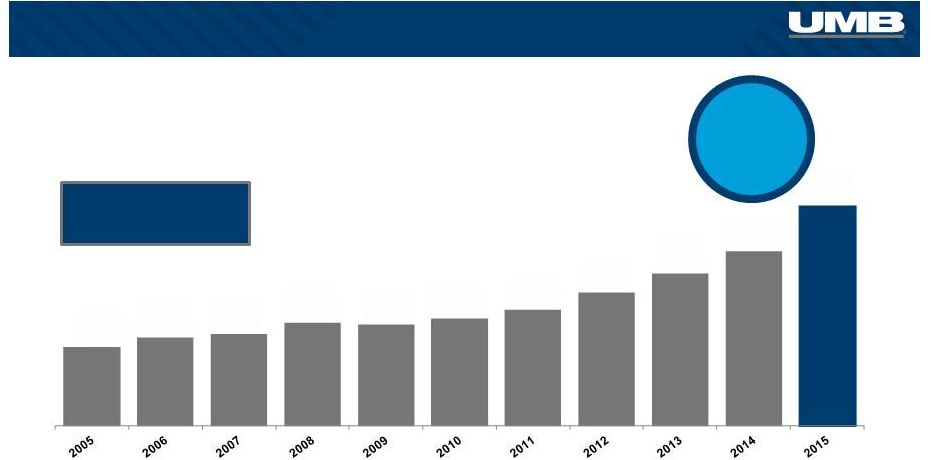
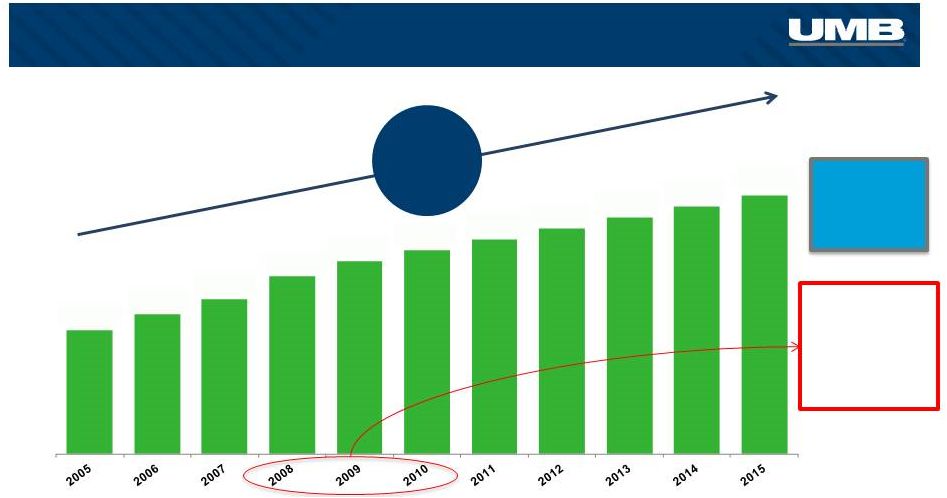 23 Returning Value to Shareholders Dividend increase = 108.8% Nearly 60% of banks decreased dividends between 2008 and 2010 Industry Median -4.2% decrease Industry is defined as all publicly traded banks with dividends reported in 2005. Source: SNL Financial
$0.455 $0.515 $0.570 $0.655 $0.710 $0.750 $0.790 $0.830 $0.870 $0.910 $0.950 |
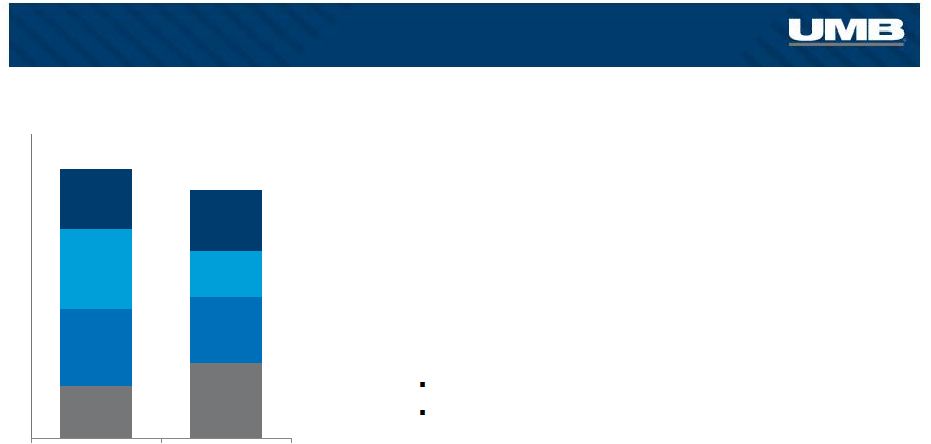
 24 December 31, 2005 – December 31, 2015 Reinvesting all cash dividends +72.9% Total Shareholder Return $100 UMBF |
 25 December 31, 2005 – December 31, 2015 Reinvesting all cash dividends +72.9% +102.4% Total Shareholder Return $100 UMBF S&P 500 |
 26 December 31, 2005 – December 31, 2015 Reinvesting all cash dividends +72.9% +102.4% -6.2% Total Shareholder Return $100 UMBF S&P 500 SNL U.S. Bank |
 27 Stock Price Change December 31, 2005 – December 31, 2015 +63.7% +45.7% -29.6% -26.0% S&P 500 UMBF SNL U.S. Bank KBW Nasdaq Bank |
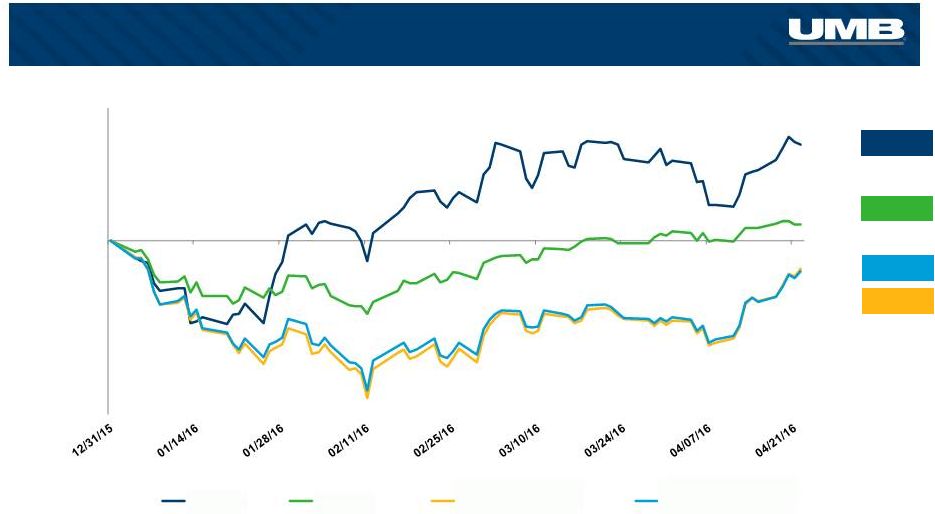 28 Year-to-Date 2016 +2.3% +13.8% Recent Stock Performance -4.4% -4.0% UMBF S&P 500 KBW Nasdaq Bank SNL U.S. Bank |
 Agenda Evolution 2015 Highlights Questions & Answers 2016 and Beyond More Defines Us |
 Questions & Answers |
 UMB
Financial Annual Meeting of Shareholders
April 26, 2016 More Defines Us |