Attached files
| file | filename |
|---|---|
| EX-31.1 - EX-31.1 - ADESTO TECHNOLOGIES Corp | d153286dex311.htm |
| EX-32.2 - EX-32.2 - ADESTO TECHNOLOGIES Corp | d153286dex322.htm |
| EX-31.2 - EX-31.2 - ADESTO TECHNOLOGIES Corp | d153286dex312.htm |
| EX-32.1 - EX-32.1 - ADESTO TECHNOLOGIES Corp | d153286dex321.htm |
| EX-23.1 - EX-23.1 - ADESTO TECHNOLOGIES Corp | d153286dex231.htm |
| EX-10.7 - EX-10.7 - ADESTO TECHNOLOGIES Corp | d153286dex107.htm |
Table of Contents
UNITED STATES
SECURITIES AND EXCHANGE COMMISSION
Washington, D.C. 20549
Form 10-K
(Mark One)
| x | ANNUAL REPORT PURSUANT TO SECTION 13 OR 15(d) OF THE SECURITIES EXCHANGE ACT OF 1934 |
For the fiscal year ended December 31, 2015
OR
| ¨ | TRANSITION REPORT PURSUANT TO SECTION 13 OR 15(d) OF THE SECURITIES EXCHANGE ACT OF 1934 |
For the transition period from to
001- 37582
(Commission File No.)
ADESTO TECHNOLOGIES CORPORATION
(Exact name of Registrant as specified in its charter)
| Delaware | 16-1755067 | |
| (State or other jurisdiction of incorporation or organization) |
(I.R.S. Employer Identification No.) |
| 1250 Borregas Avenue Sunnyvale, California |
94089 | |
| (Address of principal executive offices) | (Zip Code) |
(408) 400-0578
(Registrant’s telephone number, including area code)
Securities registered pursuant to Section 12(b) of the Act:
| Title of each class |
Name of each exchange on which registered | |
| Common Stock, par value $0.0001 per share | The NASDAQ Stock Market LLC |
Securities registered pursuant to Section 12(g) of the Act:
None
Indicate by check mark if the Registrant is a well-known seasoned issuer, as defined in Rule 405 of the Securities Act. Yes ¨ No x
Indicate by check mark if the Registrant is not required to file reports pursuant to Section 13 or Section 15(d) of the Act. Yes ¨ No x
Indicate by check mark whether the registrant (1) has filed all reports required to be filed by Section 13 or 15(d) of the Securities Exchange Act of 1934 (Exchange Act) during the preceding 12 months (or for such shorter period that the registrant was required to file such reports), and (2) has been subject to such filing requirements for the past 90 days. Yes x No ¨
Indicate by check mark whether the registrant has submitted electronically and posted on its corporate Website, if any, every Interactive Data File required to be submitted and posted pursuant to Rule 405 of Regulation S-T (§ 232.405 of this chapter) during the preceding 12 months (or for such shorter period that the registrant was required to submit and post such files). Yes x No ¨
Indicate by check mark if disclosure of delinquent filers pursuant to Item 405 of Regulation S-K is not contained herein, and will not be contained, to the best of Registrant’s knowledge, in definitive proxy or information statements incorporated by reference in Part III of this Form 10-K or any amendment to this Form 10-K. x
Indicate by check mark whether the registrant is a large accelerated filer, an accelerated filer, a non-accelerated filer, or a smaller reporting company. See definitions of “large accelerated filer,” “accelerated filer,” and “smaller reporting company” in Rule 12b-2 of the Exchange Act. (Check one):
| Large accelerated filer | ¨ | Accelerated filer | ¨ | |||
| Non-accelerated filer | x (Do not check if a smaller reporting Company) | Small reporting company | ¨ | |||
Indicate by check mark whether the Registrant is a shell company (as defined in Rule 12b-2 of the Exchange Act). Yes ¨ No x
The aggregate market value of voting stock held by non-affiliates of the Registrant on October 27, 2015, based on the closing price of $5.90 for shares of the Registrant’s common stock as reported by the The NASDAQ Capital Market, was approximately $56.3 million. The Registrant has elected to use October 27, 2015 as the calculation date, which was the initial trading date of the Registrant’s common stock on the The NASDAQ Capital Market, because on June 30, 2015 (the last business day of the Registrant’s most recently completed second fiscal quarter), the Registrant was a privately-held company. Shares of common stock held by each executive officer, director and their affiliated holders have been excluded in that such persons may be deemed to be affiliates. This determination of affiliate status is not necessarily a conclusive determination for other purposes. The registrant has no non-voting common equity.
As of March 27, 2016, there were approximately 15.0 million shares of the Registrant’s Common Stock outstanding.
DOCUMENTS INCORPORATED BY REFERENCE
Portions of the Registrant’s definitive Proxy Statement for the Registrant’s 2016 Annual Meeting of Stockholders are incorporated by reference in Part III of this Annual Report on Form 10-K to the extent stated herein. The Proxy Statement will be filed with the Securities and Exchange Commission pursuant to Regulation 14A within 120 days of the Registrant’s fiscal year ended December 31, 2015.
Table of Contents
Table of Contents
SPECIAL NOTE REGARDING FORWARD-LOOKING STATEMENTS
This report contains forward-looking statements. All statements contained in this report other than statements of historical fact, including statements regarding our future results of operations and financial position, our business strategy and plans and our objectives for future operations, are forward-looking statements. The words “believe,” “may,” “will,” “potentially,” “estimate,” “continue,” “anticipate,” “intend,” “could,” “would,” “project,” “plan,” “expect,” “seek” and similar expressions are intended to identify forward-looking statements. We have based these forward-looking statements largely on our current expectations and projections about future events and trends that we believe may affect our financial condition, results of operations, business strategy, short-term and long-term business operations and objectives and financial needs. These forward-looking statements are subject to a number of risks, uncertainties and assumptions, including those described in the “Risk Factors” section and elsewhere in this report. Moreover, we operate in a very competitive and rapidly changing environment, and new risks emerge from time to time. It is not possible for our management to predict all risks, nor can we assess the impact of all factors on our business or the extent to which any factor, or combination of factors, may cause actual results to differ materially from those contained in any forward-looking statements we may make. In light of these risks, uncertainties and assumptions, the forward-looking events and circumstances discussed in this report may not occur and actual results could differ materially and adversely from those anticipated or implied in the forward-looking statements.
You should not rely upon forward-looking statements as predictions of future events. Although we believe that the expectations reflected in the forward-looking statements are reasonable, we cannot guarantee that the future results, levels of activity, performance or events and circumstances reflected in the forward-looking statements will be achieved or occur. We undertake no obligation to update publicly any forward-looking statements for any reason after the date of this report to conform these statements to actual results or to changes in our expectations, except as required by law.
As used in this report, the terms “Adesto,” “we,” “us,” and “our” mean Adesto Technologies Corporation and its subsidiaries unless the context indicates otherwise.
1
Table of Contents
| ITEM 1. | BUSINESS |
Overview
We are a leading provider of application-specific and ultra-low power non-volatile memory products. We optimize our non-volatile memory products for Internet of Things, or IoT, applications including current and next-generation Internet-connected devices in the consumer, industrial, medical and wearables markets. We combine our non-volatile memory design capabilities with proprietary intellectual property and differentiated technology platforms to deliver high-performance products that dramatically reduce the overall energy consumption of our customers’ systems and extend battery life. Our products feature embedded intelligence in a small form factor and high reliability.
We sell our products directly to leading original equipment manufacturers and original design manufacturers, or OEMs and ODMs, respectively that manufacture products for our end customers. In general, we work directly with our customers to have our non-volatile memory, or NVM, devices designed into and qualified for their products, which we refer to as design wins. Although we maintain direct sales, support and development relationships with our end customers, most of our products are sold to those end customers through distributors.
We were originally incorporated in California in January 2006, and reincorporated in Delaware in October 2015. In 2012, we purchased certain flash memory product assets from Atmel Corporation. Since the acquisition, we improved certain features of the acquired products, enhanced their capabilities for low-power IoT applications, accelerated development of other select products, and introduced our next-generation DataFlash and Fusion Flash products based on the acquired technology, which we refer to as our new products. We completed our initial public offering, or IPO, of common stock in October 2015.
Our principal executive offices are located at 1250 Borregas Avenue, Sunnyvale, California 94089 and our telephone number is (408) 400-0578. Our website is www.adestotech.com. The contents of our website are not incorporated into, or otherwise to be regarded as part of, this Annual Report on Form 10-K.
Our Products
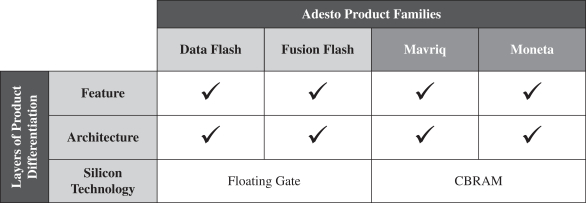
We offer four product families, DataFlash, Fusion Flash, Mavriq and Moneta, which are manufactured using two technology platforms: industry-standard “floating gate” technology and our proprietary Conductive Bridging RAM, or CBRAM, technology. We optimize our products to operate at a wide voltage range, allowing continued operation even as the battery discharges and reaches very low power levels, where commodity NVM devices typically fail. Operating intelligence, such as low power mode, is designed into our products to help systems save energy. Our components allow for greater storage efficiency than competing commodity NVM products in logging small packets of data for the IoT. This reduces microcontroller unit burden on system resources and allows for less frequent re-write cycles, enabling dramatic increases in battery life and enhancing the reliability of the flash memory components. By incorporating power management features in our NVM products, we enable our customers to reduce the number of components included in and the overall footprint of their systems, thereby lowering the total cost of their systems.
Standard Serial Flash Products
DataFlash. Our DataFlash family of NVM products contains smart features that reduce power requirements and improve system efficiencies, and is especially well suited for data-logging applications, such as industrial automation, home automation sensing and health and fitness tracking.
Fusion Flash. Our Fusion Flash product family combines industry-standard sector sizes and read/write commands with new features, such as wide voltage, ultra-deep power down mode and flexible erase capability. The Fusion Flash family of memory products is designed for use in a wide variety of high-volume consumer applications, such as wearables, mobile and other applications requiring energy conservation and in which
2
Table of Contents
program code is copied from flash into embedded RAM for execution. Its features can extend the life of battery-operated devices, such as Bluetooth 4.0 products, DECT ULE (Ultra Low Energy) products, ZigBee RF4CE, Z-Wave and other Wi-Fi and Wi-Fi-direct applications.
Key features provided by our DataFlash and Fusion Flash product families include ultra-deep power down, which assists in system-level energy savings, and wide supply voltage range operation, which can maximize battery life. Our DataFlash product family also has byte-write capability, which enables management of the NVM system resources with a much simpler stack and allows for a smaller software footprint in the controller’s Static Random Access Memory, or SRAM, making more resources available for higher priority operations and lowering energy consumption.
CBRAM-based Products
Mavriq. Our Mavriq family of memory products provides robust, embedded or stand-alone storage technology. These products feature wide voltage range operation, low energy write and ultra-fast write speeds, enabling extended battery life in connected devices and other energy-conscious applications. Our specialty Mavriq medical products are specifically designed to survive the extreme conditions of sterilization. They have passed both gamma and e-beam sterilization testing and are compatible across the sterilization conditions of heat, pressure and irradiation. With functional and electrical compatibility with competing serial memory products, our low-energy Mavriq memory solutions are well matched to the new design requirements of IoT and other applications such as camera sensors, Bluetooth low energy devices, wearables, gaming components, printer cartridges, medical equipment and other devices that leverage its unique capabilities.
Moneta. With the ability to read and write at 50-100x lower power than comparable memory products, the Moneta family of memory products meets the requirements of new, ultra-low energy IoT electronics and enables applications in innovative energy harvesting and other low energy system designs. By consuming less energy during standard operation, these products can extend battery life and/or allow customers flexibility to use smaller batteries to power their systems. In addition to their inherent low power technology capability, Moneta products employ innovative features to save energy, automatically switching to deep power down between transactions, and providing an ultra-deep power down mode. Our Moneta products make energy efficient battery-operated and battery-free designs possible, by enabling the lowest power read, write and standby NVM operations. Applications for these products include retail beacons, wearable medical and fitness devices, industrial and environmental sensors, agricultural monitors and other extreme low energy/long battery life, or energy harvesting systems.
Our Technology
Our product families are based on multiple layers of innovation and differentiation arising from feature sets and architectures that are built on two fundamental silicon technology platforms: industry-standard floating gate and our proprietary CBRAM. We believe these areas of differentiation enable us to address the specific needs of the IoT market.
3
Table of Contents
We offer over 100 products across our product families. Each product family utilizes technologies that differentiate it from competing commodity products and provides value to our customers.
Key components of our DataFlash and Fusion Flash architectures include small page write operation, auto-erase and ultra-deep power down modes to reduce standby energy consumption. Both families also include wide voltage input-output interface, which helps extend battery life. In addition, our DataFlash family incorporates dual SRAM, buffers that enable utilization of a single, very low pin-count memory device for all NVM needs related to data and code storage, reducing the overall required footprint of the system.
Key components of our Mavriq and Moneta architectures include low-energy read and ultra-fast direct write capability and the ability to switch to deep power down between transactions to extend battery life. In addition, the Moneta memory products’ low power capability is ideal for energy harvesting applications.
Customers
Our end customers include leading tier-1 OEMs and ODMs that use our products across multiple industries and applications, including next-generation Internet-connected appliances, wearables, smart meters, sensors and medical devices. We have also secured a number of reference design wins for Bluetooth 4.0 applications. During the year ended December 31, 2015, more than 400 end customers purchased our products. We generate a substantial amount of our revenue from sales of our products to three independent, non-exclusive distributors, which many of our end customers use as an alternative means of fulfillment to direct purchases from us. For the year ended December 31, 2015, sales of our products to Arrow Electronics, SAS Electronic Company, and Avnet Inc. accounted for approximately 17%, 12% and 11% of our revenue. For the year ended December 31, 2014, sales of our products to Arrow Electronics, Avnet Inc. and ATM Electronic Corporation accounted for approximately 20%, 20% and 14% of our revenue. Revenue from these same distributors comprised 25%, 9% and 12% of our revenue for the year ended December 31, 2013, respectively. One end customer accounted for 10% or more of our revenue in 2015 and no end customer accounted for 10% or more of our revenue for 2014 and 2013. A majority of our revenue for the year ended December 31, 2015 was generated by approximately 20 end customers.
Sales
We sell our products through our worldwide sales organization and through our channel of representatives and distributors to OEMs and ODMs. End customers primarily fulfill and procure product orders through our distribution partners. We have sales personnel covering three primary regions, the Americas, APAC and EMEA. We have sales personnel in North America, United Kingdom, France, Hong Kong, Singapore, South Korea, Japan and Taiwan.
Manufacturing
We employ a fabless manufacturing business model and rely on third-party suppliers for all phases of the manufacturing process, including fabrication, assembly and testing. Our fabless business model allows us to leverage the expertise of industry-leading suppliers in such areas as fabrication, assembly, quality control and assurance, reliability and testing, and avoid the significant costs and risks associated with owning and operating such manufacturing operations. These suppliers also are responsible for procurement of raw materials used in the production of our products. As a result, we are able to focus our resources on product design, additional quality assurance, marketing and customer support.
We do not have a guaranteed level of production capacity from any of our suppliers’ facilities for the production of our DataFlash and Fusion Flash products. We carefully qualify each of our suppliers and their subcontractors and processes to ensure they meet our standards for quality and reliability.
4
Table of Contents
Wafer Fabrication
We currently manufacture the majority of our floating gate solutions in 110nm silicon wafer production process geometries utilizing the services of United Microelectronics Corporation in Taiwan. In early 2015, we commenced developing our first floating gate technology-based flash products in a 65nm process node at XMC, a foundry in Wuhan, China. Our CBRAM-based products are manufactured in 130nm silicon wafer production process geometries by Altis Semiconductor S.N.C., or Altis, in Corbeil-Essonnes, France. On February 25, 2015, we signed an agreement with Tower Jazz Panasonic Semiconductor Company (TPSCo) to manufacture our 45 nm CBRAM products at TPSCo’s 300 nm fabrication facility in Hokuriku, Japan.
Assembly, Testing and Wafer Probe
We maintain multiple sources for assembly and final testing of our products. However, Amkor Technology, Inc. in Taiwan, Korea and the Philippines currently provides substantially all of our assembly and final test services. Our wafer probing is performed by King Yuan Electronics Co., Ltd. in Taiwan. We continually monitor the manufacturing and test of our products at all of our contractors to ensure that our manufacturing and testing procedures are properly implemented. As part of our total quality assurance program, our quality management system has been certified to ISO 9001:2000 standards. Our foundry, assembly and test vendors are also ISO 9001 certified.
Research and Development
We believe that our continued success depends on our ability to both introduce improved versions of our existing solutions and to develop new solutions for the markets that we serve. Through our research and development efforts, we intend to continually expand our portfolio of patents to enhance our intellectual property position. As of December 31, 2015, we had a core team of 49 engineers involved in research and development, 30 of whom have advanced degrees, located in our research and development design center at our headquarters in Sunnyvale, California and at our facility in France. For the years ended December 31, 2015, 2014 and 2013, our research and development expense was $12.8 million, $14.4 million and $15.0 million, respectively.
Competition
We operate in the highly competitive global semiconductor market in general and the semiconductor memory market in particular. We expect competition to increase and intensify as more and larger semiconductor companies enter our markets. Increased competition could result in price pressure, reduced profitability and loss of market share, any of which could materially and adversely affect our business, revenue and operating results.
Currently, our competitors range from large, international companies offering a wide range of commodity NVM products to companies specializing in other alternative, specialized emerging memory technologies. Our primary competitors in the NVM market include Macronix International Co. Ltd., Microchip Technology Inc., Micron Technology, Inc., Spansion Inc. (recently acquired by Cypress Semiconductor Corporation), STMicroelectronics NV and Winbond Electronics Corp. Among these large memory suppliers, we compete primarily as an overall value proposition and not on a product or technology basis. We expect competition in our current markets to increase in the future as existing competitors improve or expand their product offerings and as new companies enter these markets.
Our ability to compete successfully depends on elements both within and outside of our control, including industry and general economic trends. Many of our competitors are substantially larger, have greater financial, technical, marketing, distribution, customer support and other resources, are more established than we are, and have significantly better brand recognition and broader product offerings which may enable them to better withstand adverse economic or market conditions in the future.
5
Table of Contents
Our ability to compete successfully in the rapidly evolving memory market depends on several factors, including:
| • | performance of our products, as measured by speed; |
| • | energy consumption of our products; |
| • | the ease of implementation of our products by customers; |
| • | the strength of customer relationships; |
| • | reputation and reliability; |
| • | customer support; |
| • | our products’ cost effectiveness for the total solution relative to that of our competitors; |
| • | our success in designing and manufacturing new products that anticipate the memory and integration needs of our customers’ current and future products and applications; and |
| • | the design, manufacture, commercialization and market adoption of our CBRAM technology that anticipate the power, performance, reliability and integration needs of our customers’ next-generation and application-specific products and applications. |
We believe we compete favorably with respect to each of these factors.
Intellectual Property
Our success depends in part on our ability to protect our products and technologies from unauthorized third-party copying and use. To accomplish this, we rely on a combination of intellectual property rights, including patents, trade secrets, copyrights and trademarks, as well as customary contractual protections. As of December 31, 2015, we held 106 patents that expire at various times between June 2020 and April 2034 and had 46 U.S. patent applications pending. We also held 36 foreign patents that expire at various times between May 2021 and July 2032 and had 32 foreign patent applications pending.
We seek to file for patents that have broad application in the semiconductor industry and that would provide a competitive advantage. However, there can be no assurance that our pending patent application or any future applications will be approved, that any issued patents will provide us with competitive advantages or will not be challenged by third parties, or that the patents of others will not have an adverse effect on our ability to do business. In addition, there can be no assurance that others will not independently develop substantially equivalent intellectual property or otherwise gain access to our trade secrets or intellectual property, or disclose such intellectual property or trade secrets, or that we can effectively protect our intellectual property.
In addition to intellectual property that we developed, we have acquired and licensed technology from third parties for incorporation in our products. In January 2007, we entered into a license agreement with Axon Technologies Corp. Pursuant to this license agreement, we have rights in Axon’s patents and trade secrets covering, among other things, Axon’s programmable metallization cell, or PMC, technology, which is a component of our CBRAM technology. This license provides us with broad rights to use and sub-license this technology, and we have the exclusive right to make, have made by authorized foundries or integrated device manufacturers, use, sell, lease, offer for sale, and import products covered by Axon’s licensed patents and trade secrets in certain fields of use. The license will last for the lifetime of the licensed patents, which currently ends in September 2026. We pay a royalty for use of the licensed intellectual property in our products. In July 2012, we purchased certain flash memory product assets from Atmel Corporation. As part of the asset purchase, Atmel granted us non-exclusive, perpetual and irrevocable licenses to its patent portfolio for development of flash memory products.
6
Table of Contents
Employees
As of December 31, 2015, we had 95 employees. Of these full-time employees, 49 were engaged in research and development, 28 in sales and marketing, 7 in operations and support and 11 in general and administrative capacities. Of our employees, 83 were based in the United States, 3 were based in the United Kingdom, 3 were based in France, 5 were based in China, and 1 was based in Hong Kong. None of our employees are represented by a labor union. We have not experienced any work stoppages. We consider our relations with our employees to be good.
Financial Information about Segments and Geographic Areas
We manage our operations and allocate resources as a single reporting segment. Financial information about our segment and geographic areas is incorporated herein by reference to Note 6 of Notes to Consolidated Financial Statements under Part II, Item 8. In addition, financial information regarding our operations, assets and liabilities, including our revenue and net loss for the years ended December 31, 2015, 2014, and 2013 and our total assets as of December 31, 2015 and 2014, is included in our Consolidated Financial Statements in Part II, Item 8 of this Annual Report on Form 10-K.
Available Information
We make available our Annual Reports on Form 10-K, Quarterly Reports on Form 10-Q, Current Reports on Form 8-K and amendments to those reports filed or furnished pursuant to Section 13(a) or Section 15(d) of the Securities Exchange Act of 1934, as amended, free of charge on our website at www.adestotech.com, as soon as reasonably practicable after they are electronically filed with or furnished to the Securities and Exchange Commission or SEC. Additionally, copies of materials filed by us with the SEC may be accessed at the SEC’s Public Reference Room at 100 F Street, N.E., Washington, D.C. 20549 or at www.sec.gov. For information about the SEC’s Public Reference Room, contact 1-800-SEC-0330.
The contents of the websites referred to above are not incorporated into this report. Further, our references to the URLs for these websites are intended to be inactive textual references only.
7
Table of Contents
| ITEM 1A. | RISK FACTORS |
An investment in our common stock involves a high degree of risk. You should carefully consider the risks and uncertainties described below, together with all of the other information in this Annual Report on Form 10-K, including the section titled “Management’s Discussion and Analysis of Financial Condition and Results of Operations” and our consolidated financial statements and related notes, before making a decision to invest in our common stock. Our business, operating results, financial condition, or prospects could be materially and adversely affected by any of these risks and uncertainties. If any of these risks actually occurs, the trading price of our common stock could decline and you might lose all or part of your investment. Our business, operating results, financial performance, or prospects could also be harmed by risks and uncertainties not currently known to us or that we currently do not believe are material.
Risks Related to Our Business and Our Industry
We have a history of losses which may continue in the future, and we cannot be certain that we will achieve or sustain profitability.
We have incurred net losses since our inception. We incurred net losses of $8.4 million, $8.9 million, and $8.2 million for the years ended December 31, 2015, 2014 and 2013, respectively. As of December 31, 2015, we had an accumulated deficit of $82.5 million. We expect to incur significant expenses related to the continued development and expansion of our business, including in connection with our efforts to pursue opportunities in emerging IoT markets, develop and improve upon our products and technology, maintain and enhance our research and development and sales and marketing activities and hire additional personnel. Further, revenue may not grow or revenue may decline for a number of possible reasons, many of which are outside our control, including a decline in demand for our products, increased competition, business conditions that adversely affect the semiconductor memory industry, including reduced demand for products in the end markets that we serve, or our failure to capitalize on growth opportunities. If we fail to generate sufficient revenue to support our operations, we may not be able to achieve or sustain profitability.
We may be unable to match production with customer demand for a variety of reasons including our inability to accurately forecast customer demand or the capacity constraints of contract manufacturers, which could adversely affect our operating results.
We make planning and spending decisions, including determining production levels, production schedules, component procurement commitments, personnel needs and other resource requirements, based on our estimates of product demand and customer requirements. Our products are typically purchased pursuant to individual purchase orders. While our customers may provide us with their demand forecasts, they are not contractually committed to buy any quantity of products beyond purchase orders. Furthermore, many of our customers may increase, decrease, cancel or delay purchase orders already in place without significant penalty. The short-term nature of commitments by our customers and the possibility of unexpected changes in demand for their products reduce our ability to accurately estimate future customer requirements. On occasion, customers may require rapid increases in production, which can strain our resources, necessitate more onerous procurement commitments and reduce our gross margin. If we overestimate customer demand, we may purchase products that we may not be able to sell, which could result in decreases in our prices or write-downs of unsold inventory. Conversely, if we underestimate customer demand or if sufficient manufacturing capacity was unavailable, we would lose sales opportunities and could lose market share or damage our customer relationships. The rapid pace of innovation in our industry could also render significant portions of our inventory obsolete. Excess or obsolete inventory levels could result in unexpected expenses or write-downs of inventory values that could adversely affect our business, operating results and financial condition.
8
Table of Contents
Our quarterly operating results or other operating metrics may fluctuate significantly, which could cause the trading price of our common stock to decline.
Our quarterly operating results and other operating metrics have fluctuated in the past and may continue to fluctuate from quarter to quarter. We expect that this trend will continue as a result of a number of factors, many of which are outside of our control and may be difficult to predict, including:
| • | the receipt, reduction, delay or cancellation of orders by large customers; |
| • | the gain or loss of significant customers and distributors; |
| • | the timing and success of our launch of new or enhanced products and those of our competitors; |
| • | market acceptance of our products and our customers’ products; |
| • | the level of growth or decline in the IoT market; |
| • | the timing and extent of research and development and sales and marketing expenditures; |
| • | the amount and timing of operating expenses related to the maintenance and expansion of our business, operations and infrastructure; |
| • | changes in our product mix; |
| • | our ability to reduce the manufacturing costs of our products; |
| • | competitive pressures resulting in lower than expected average selling prices; |
| • | fluctuations in sales by and inventory levels of OEMs and ODMs who incorporate our memory products in their products; |
| • | cyclical and seasonal fluctuations in our markets; |
| • | fluctuations in the manufacturing yields of our third-party contract manufacturers; |
| • | events that impact the availability of production capacity at our third-party subcontractors and other interruptions in the supply chain including due to geopolitical events, natural disasters, materials shortages, bankruptcy or other causes; |
| • | supply constraints for and changes in the cost of the other components incorporated into our customers’ products; |
| • | the timing of expenses related to the acquisition of technologies or businesses; |
| • | product rates of return or price concessions in excess of those expected or forecasted; |
| • | costs associated with the repair and replacement of defective products; |
| • | unexpected inventory write-downs or write-offs; |
| • | costs associated with litigation over intellectual property rights and other litigation; |
| • | the length and unpredictability of the purchasing and budgeting cycles of our customers; |
| • | loss of key personnel or the inability to attract qualified engineers; and |
| • | geopolitical events, such as war, threat of war or terrorist actions, or the occurrence of natural disasters. |
Any one of the factors above or the cumulative effect of some of the factors above may result in significant fluctuations in our operating results.
The semiconductor memory industry is highly cyclical and our markets may experience significant cyclical fluctuations in demand as a result of changing economic conditions, budgeting and buying patterns of customers and others factors. As a result of these and other factors affecting demand for our products and our results of
9
Table of Contents
operations in any given period, the results of any prior quarterly or annual periods should not be relied upon as indicative of our future revenue or operating performance. Fluctuations in our revenue and operating results could also cause our stock price to decline.
We rely on third parties to manufacture, package, assemble and test the semiconductor components comprising our products, which exposes us to a number of risks, including reduced control over manufacturing and delivery timing and potential exposure to price fluctuations, which could result in a loss of revenue or reduced profitability.
As a fabless semiconductor company, we outsource the manufacturing, packaging, assembly and testing of our semiconductor components to third-party foundries and assembly and testing service providers. We use two foundries, United Microelectronics Corporation in Taiwan and XMC in Wuhan, China, for the production of our flash memory products and a single foundry, Altis Semiconductor S.N.C. in France, for our Mavriq and Moneta products. Our primary assembly and testing contractor in 2015 was Amkor Technology, Inc. in Taiwan, Korea and the Philippines. Our wafer probing is performed by King Yuan Electronics Co., Ltd. in Taiwan.
Relying on third-party manufacturing, assembly and testing presents a number of risks, including but not limited to:
| • | capacity and materials shortages during periods of high demand; |
| • | reduced control over delivery schedules, inventories and quality; |
| • | the unavailability of, or potential delays in obtaining access to, key process technologies; |
| • | the inability to achieve required production or test capacity and acceptable yields on a timely basis; |
| • | misappropriation of our intellectual property; |
| • | the third parties’ ability to perform its obligations due to bankruptcy or other financial constraints; |
| • | limited warranties on wafers or products supplied to us; and |
| • | potential increases in prices. |
Any of the foregoing risks may affect our ability to meet customer demand. For example, one of our silicon wafer suppliers suddenly declared bankruptcy in December 2013 and abruptly shut down its foundry. As a result, we were unable to fulfill a portion of our customers’ orders in 2014 while we transitioned wafer production to a new foundry. Based on the average selling prices then in effect for those wafers, we estimate that the potential loss of revenue exceeded $10.0 million.
We currently do not have long-term supply contracts with our third-party contract manufacturers for our DataFlash and Fusion Flash products, including United Microelectronics Corporation and Amkor Technology, Inc. Therefore, they are not obligated to perform services or supply components to us for any specific period, in any specific quantities, or at any specific price, except as may be provided in a particular purchase order. During periods of high demand and tight inventories, our third-party foundries and assembly and testing contractors may allocate capacity to the production of other companies’ components while reducing deliveries to us, or significantly raise their prices. In particular, they may allocate capacity to other customers that are larger and better financed than us or that have long-term agreements, decreasing the capacity available to us. Shortages of capacity available to us may be caused by the actions of their other, large customers that may be difficult to predict, such as major product launches. If we need other foundries or assembly and test contractors because of increased demand, or if we are unable to obtain timely and adequate deliveries from our providers, we might not be able to cost-effectively and quickly retain other vendors to satisfy our requirements. Because the lead-time needed to establish a relationship with a new third-party supplier could be several quarters, there is no readily available alternative source of supply for any specific component. In addition, the time and expense to qualify a new foundry could result in additional expense, diversion of resources or lost sales, any of which would negatively impact our financial results.
10
Table of Contents
In the event that we expand production of a component to include a new contract manufacturer, as we expect to do with our current and future CBRAM-based products, it may take approximately 18 to 24 months to allow a transition from our current foundry or assembly services provider to the new provider. We may experience difficulty migrating our proprietary CBRAM technology platform and, consequently, may experience reduced yields, delays in component deliveries and increased research and development expense. The inability by us or our third-party manufacturers to effectively and efficiently transition our technology to their infrastructure may adversely affect our operating results and our gross margin. There can be no assurance that we will be able to find suitable replacements for our third-party contract manufacturers.
If any of our current or future foundry partners or assembly and test subcontractors significantly increases the costs of wafers or other materials, interrupts or reduces our supply, including for reasons outside of their control, or if any of our relationships with our suppliers is terminated, our operating results could be adversely affected. Such occurrences could also damage our customer relationships, result in lost revenue, cause a loss in market share or damage our reputation.
The market for semiconductor memory products is characterized by declines in average selling prices, which we expect to continue, and which could negatively affect our revenue and margins.
Our customers expect the average selling price of our products to decrease year-over-year and we expect this trend to continue. When such pricing declines occur, we may not be able to mitigate the effects by selling more or higher margin units, or by reducing our manufacturing costs. In such circumstances, our operating results could be materially and adversely affected. Our legacy and new flash memory products have experienced declining average selling prices over their life cycle. The rate of decline may be affected by a number of factors, including relative supply and demand, the level of competition, production costs and technological changes. As a result of the decreasing average selling prices of our products following their launch, our ability to increase or maintain our margins depends on our ability to introduce new or enhanced products with higher average selling prices and to reduce our per-unit cost of sales and our operating costs. We may not be able to reduce our costs as rapidly as companies that operate their own manufacturing, assembly and testing facilities, and our costs may even increase because we do not operate our own manufacturing, assembly or testing facilities, which could also reduce our gross margins. In addition, our new or enhanced products may not be as successful or enjoy as high margins as we expect. If we are unable to offset any reductions in average selling prices by introducing new products with higher average selling prices or reducing our costs, our revenue and margins will be negatively affected and may decrease.
The semiconductor memory market is highly cyclical and has experienced severe downturns in the past, generally as a result of wide fluctuations in supply and demand, constant and rapid technological change, continuous new product introductions and price erosion. During downturns, periods of intense competition, or the presence of oversupply in the industry, the selling prices for our products may decline at a high rate over relatively short time periods as compared to historical rates of decline. We are unable to predict selling prices for any future periods and may experience unanticipated, sharp declines in selling prices for our products.
Our growth depends on the growth and development of the emerging IoT industry, and if the market does not develop as we expect, our business prospects may be harmed.
Our products are increasingly being utilized in IoT edge devices. The IoT industry is nascent and is characterized by rapidly changing technologies, devices and connectivity requirements, evolving industry standards and changing customer demands. The continued development of IoT depends in part on significant growth in the number of connected devices. Such growth is affected by various factors, including the continued growth in the use of mobile operator networks and the Internet to connect an increasing number and variety of devices, price reductions for key hardware and software components, innovation of other components of the IoT nodes toward low-power formats, and the continued development of IoT standards and protocols. Without these continued developments, IoT might not gain widespread market acceptance and our business could suffer. Security and privacy concerns, evolving business practices and consumer preferences may also slow the growth
11
Table of Contents
and development of IoT. Because our revenue growth ultimately depends upon the success of IoT, our business may suffer as a result of slowing or declining growth in IoT adoption. Even if the IoT industry does develop, we may not be well positioned or able to penetrate and capitalize on this new market. As a result of these factors, the future revenue and income potential of our business is uncertain.
The markets for our products are evolving, and changing market conditions, such as the introduction of new technologies or changes in customer preferences, may negatively affect demand for our products. If we fail to properly anticipate or respond to changing market conditions, our business prospects and results of operations will suffer.
The NVM industry is subject to constant and rapid changes in technology, frequent new product introductions, short product life cycles, rapid product obsolescence and evolving technical standards. New technologies may be introduced that make the current technologies on which our products are based less competitive or obsolete or require us to make changes to our technology that could be expensive and time consuming to implement. Due to the evolving nature of our markets, our future success depends on our ability to accurately anticipate and respond to changes in industry standards, technological requirements, customer and consumer preferences and other market conditions. Our technologies could become obsolete sooner than we expect because of faster than anticipated, or unanticipated, changes in one or more of the industry standards and technological requirements. We may be unable to develop and introduce new or enhanced technologies that satisfy customer requirements and achieve market acceptance in a timely manner or at all, succeed in commercializing the technologies on which we have focused our research and development expenditures to develop, and anticipate new industry standards and technological changes. If we fail to adapt successfully to technological changes or fail to obtain access to important new technologies, we may be unable to retain customers or attract new customers. Any decrease in demand for our products, or the need for low-power products in general, due to the emergence of competing technologies, changes in customer preferences and requirements or other factors, could adversely affect our business, results of operations and prospects.
We must continuously develop new and enhanced products, and if we are unable to successfully market our new and enhanced products for which we incur significant expenses to develop, our results of operations and financial condition will be materially adversely affected.
In order to compete effectively in our markets, we must continually design, develop and introduce new and improved products with improved features in a cost-effective manner in response to changing technologies and market demand. This requires us to devote substantial financial and other resources to research and development. We are developing next-generation products, which we expect to be one of the drivers of our revenue growth in the future. However, we may not succeed in developing and marketing these new and enhanced products. We also face the risk that customers may not value or be willing to bear the cost of incorporating our new and enhanced products into their products, particularly if they believe their customers are satisfied with current solutions. Regardless of the improved features or superior performance of our new and enhanced products, customers may be unwilling to adopt our solutions due to design or pricing constraints, or because they do not want to rely on a single or limited supply source. Because of the extensive time and resources that we invest in developing new and enhanced products, if we are unable to sell customers new generations of our products, our revenue could decline and our business, financial condition, results of operations and cash flows would be negatively affected. For example, we generated limited revenue from sales of our Mavriq products to date. While we expect revenue from our Mavriq products to grow, we may not be able to materially increase our revenue from this product family. Similarly, any of our more recently-introduced products or product families based on CBRAM or floating gate architecture may not achieve market acceptance and contribute significantly to our revenue. If we are unable to successfully develop and market our new and enhanced products that we have incurred significant expenses developing, our results of operations and financial condition will be materially and adversely affected.
12
Table of Contents
Our success and future revenue depend on our ability to secure design wins and on our customers’ ability to successfully sell the products that incorporate our solutions. Securing design wins is a lengthy, expensive and competitive process, and may not result in actual orders and sales, which could cause our revenue to decline.
We sell to customers that incorporate our NVM into their products. A design win occurs after a customer has tested our product, verified that it meets the customer’s requirements, qualified our solutions for their products and placed an order for the purchase of our products. Our customers may need several months to years to test, evaluate and adopt our product and additional time to begin volume production of the product that incorporates our solution. Due to this generally lengthy design cycle, we may experience significant delays from the time we increase our operating expenses and make investments in our products to the time that we generate revenue from sales of these products. Moreover, even if a customer selects our solution, we cannot guarantee that this will result in any sales of our products, as the customer may ultimately change or cancel its product plans, or efforts by our customer to market and sell its product may not be successful. We may not generate any revenue from design wins after incurring the associated costs, which would cause our business and operating results to suffer.
If a current or prospective customer designs a competitor’s solution into its product, it becomes significantly more difficult for us to sell our solutions to that customer because changing suppliers involves significant time, cost, effort and risk for the customer even if our solutions remain compatible with their product design. If current or prospective customers do not include our solutions in their products and we fail to achieve a sufficient number of design wins, our results of operations and business may be harmed.
We rely on our relationships with OEMs and ODMs to enhance our solutions and market position, and our failure to continue to develop or maintain such relationships in the future would harm our ability to remain competitive.
We develop our products for leading OEMs and ODMs that serve a variety of end markets and are developing devices for wearables, sensors, Bluetooth 4.0 and other IoT applications. For each application, manufacturers create products that incorporate specialized semiconductor technology, which makers of memory products use as the basis for their products. These manufacturers set the specifications for many of the key components to be used on each generation of their products and, in the case of memory components, generally qualify only a few vendors to provide memory components for their products. As each new generation of their products is released, vendors are validated in a similar fashion. We must work closely with semiconductor manufacturers to ensure our products become qualified for use in their products. As a result, maintaining close relationships with leading product manufacturers that are developing devices for wearables, Bluetooth 4.0 and other IoT applications is crucial to the long-term success of our business. We could lose these relationships for a variety of reasons, including our failure to qualify as a vendor, our failure to demonstrate the value of our new solutions, declines in product quality, or if OEMs or ODMs seek to work with vendors with broader product suites, greater production capacity or greater financial resources. If our relationships with key industry participants were to deteriorate or if our solutions were not qualified by our customers, our market position and revenue could be materially and adversely affected.
Changes to industry standards and technical requirements relevant to our products and markets could adversely affect our business, results of operations and prospects.
Our products are only a part of larger electronic systems. All products incorporated into these systems must comply with various industry standards and technical requirements created by regulatory bodies or industry participants in order to operate efficiently together. Industry standards and technical requirements in our markets are evolving and may change significantly over time. For our products, the industry standards are developed by the Joint Electron Device Engineering Council, an industry trade organization. In addition, large industry-leading semiconductor and electronics companies play a significant role in developing standards and technical requirements for the product ecosystems within which our products can be used. Our customers also may design certain specifications and other technical requirements specific to their products and solutions. These technical requirements may change as the customer introduces new or enhanced products and solutions.
13
Table of Contents
Our ability to compete in the future will depend on our ability to identify and comply with evolving industry standards and technical requirements. The emergence of new industry standards and technical requirements could render our products incompatible with products developed by other suppliers or make it difficult for our products to meet the requirements of certain of our customers in consumer, industrial, IoT and other markets. As a result, we could be required to invest significant time and effort and to incur significant expense to redesign our products to ensure compliance with relevant standards and requirements. If our products are not in compliance with prevailing industry standards and technical requirements for a significant period of time, we could miss opportunities to achieve crucial design wins, our revenue may decline and we may incur significant expenses to redesign our products to meet the relevant standards, which could adversely affect our business, results of operations and prospects.
If sales of our customers’ products decline or if their products do not achieve market acceptance, our business and operating results could be adversely affected.
Our revenue depends on our customers’ ability to commercialize their products successfully. The markets for our customers’ products are extremely competitive and are characterized by rapid technological change. Competition in our customers’ markets is based on a variety of factors including price, performance, product quality, marketing and distribution capability, customer support, name recognition and financial strength. As a result of rapid technological change, the markets for our customers’ products are characterized by frequent product introductions, short product life cycles, fluctuating demand and increasing product capabilities. As a result, our customers’ products may not achieve market success or may become obsolete. We cannot assure you that our customers will dedicate the resources necessary to promote and commercialize their products, successfully execute their business strategies for such products, or be able to manufacture such products in quantities sufficient to meet demand or cost-effectively manufacture products at a high volume. Our customers do not have contracts with us that require them to manufacture, distribute or sell any products. Moreover, our customers may develop internally, or in collaboration with our competitors, technology that they may utilize instead of the technology available to them through us. Our customers’ failure to achieve market success for their products, including as a result of general declines in our customers’ markets or industries, could negatively affect their willingness to utilize our products, which may result in a decrease in our revenue and negatively affect our business and operating results.
Our revenue also depends on the timely introduction, quality and market acceptance of our customers’ products that incorporate our solutions. Our customers’ products are often very complex and subject to design complexities that may result in design flaws, as well as potential defects, errors and bugs. We have in the past been subject to delays and project cancellations as a result of design flaws in the products developed by our customers. For example, in 2014 flaws in one of our customer’s products that were unrelated to our memory solutions generated negative publicity for our customer and delayed the product’s release until it could be redesigned. In the past, we have also been subject to delays and project cancellations as a result of changing market requirements, such as the customer adding a new feature, or because a customer’s product fails their end customer’s evaluation or field trial. Customer products may also be delayed due to issues with other vendors of theirs. We incur significant design and development costs in connection with designing our solutions for customers’ products. If our customers discover design flaws, defects, errors or bugs in their products, or if they experience changing market requirements, failed evaluations or field trials, or issues with other vendors, they may delay, change or cancel a project. If we have already incurred significant development costs, we may not be able to recoup those costs, which in turn would adversely affect our business and financial results.
We face competition and expect competition to increase in the future. If we fail to compete effectively, our revenue growth and results of operations will be materially and adversely affected.
The global semiconductor market in general, and the semiconductor memory market in particular, are highly competitive. We expect competition to increase and intensify as other semiconductor companies enter our markets, many of which have greater financial and other resources with which to pursue technology development, product design, manufacturing, marketing and sales and distribution of their products. Increased
14
Table of Contents
competition could result in price pressure, reduced profitability and loss of market share, any of which could materially and adversely affect our business, revenue and operating results. Currently, our competitors range from large, international companies offering a wide range of semiconductor products to companies specializing in other alternative, specialized emerging memory technologies. Our primary competitors include Macronix International Co. Ltd., Microchip Technology Inc., Micron Technology, Inc., Spansion Inc. (recently acquired by Cypress Semiconductor Corporation), STMicroelectronics NV and Winbond Electronics Corp. In addition, as the IoT market opportunity grows, we expect new entrants will enter these markets and existing competitors, including leading semiconductor companies, may make significant investments to compete more effectively against our products. These competitors could develop technologies or architectures that make our products or technologies obsolete.
Our ability to compete successfully depends on factors both within and outside of our control, including:
| • | the functionality and performance of our products and those of our competitors; |
| • | our relationships with our customers and other industry participants; |
| • | prices of our products and prices of our competitors’ products; |
| • | our ability to develop innovative products; |
| • | our ability to retain high-level talent, including our management team and engineers; and |
| • | the actions of our competitors, including merger and acquisition activity, launches of new products and other actions that could change the competitive landscape. |
Competition could result in pricing pressure, reduced revenue and profitability and loss of market share, any of which could materially and adversely affect our business, results of operations and prospects. In the event of a market downturn, competition in the markets in which we operate may intensify as our customers reduce their purchase orders. Our competitors that are significantly larger and have greater financial, technical, marketing, distribution, customer support and other resources or more established market recognition than us may be better positioned to accept lower prices and withstand adverse economic or market conditions.
Our customers require our products and our third-party contractors to undergo a lengthy and expensive qualification process. If we are unsuccessful or delayed in qualifying any of our products with a customer, our business and operating results would suffer.
Prior to selecting and purchasing our products, our customers typically require that our products undergo extensive qualification processes, which involve testing of our products in the customers’ systems, as well as testing for reliability. This qualification process may continue for several months or years. However, obtaining the requisite qualifications for a memory product does not assure any sales of the product. Even after successful qualification and sales of a product to a customer, a subsequent revision in our third-party contractors’ manufacturing process or our selection of a new contract manufacturer may require a new qualification process, which may result in delays and excess or obsolete inventory. After our products are qualified and selected, it can and often does take several months or more before the customer commences volume production of systems that incorporate our products. Despite these uncertainties, we devote substantial resources, including design, engineering, sales, marketing and management efforts, to qualify our products with customers in anticipation of sales. If we are unsuccessful or delayed in qualifying any of our products with a customer, sales of those products may be precluded or delayed, which may impede our growth and harm our business.
Our costs may increase substantially if our third-party manufacturing contractors do not achieve satisfactory product yields or quality.
The fabrication process is extremely complicated and small changes in design, specifications or materials can result in material decreases in product yields or even the suspension of production. From time to time, the third-party foundries that we contract to manufacture our products may experience manufacturing defects and
15
Table of Contents
reduced manufacturing yields related to errors or problems in their manufacturing processes or the interrelationship of their processes with our designs. In some cases, our third-party foundries may not be able to detect these defects early in the fabrication process or determine the cause of such defects in a timely manner.
Generally, in pricing our products, we assume that manufacturing yields will continue to improve, even as the complexity of our products increases. Once our products are initially qualified with our third-party foundries, minimum acceptable yields are established. We are responsible for the costs of the units if the actual yield is above the minimum. If actual yields are below the minimum we are not required to purchase the units. Typically, minimum acceptable yields for our new products are generally lower at first and gradually improve as we achieve full production. Unacceptably low product yields or other product manufacturing problems could substantially increase overall production time and costs and adversely impact our operating results. Product yield losses will increase our costs and reduce our gross margin. In addition to significantly harming our results of operations and cash flow, poor yields may delay shipment of our products and harm our relationships with existing and potential customers.
The complexity of our products may lead to errors, defects and bugs, which could negatively impact our reputation with customers and result in liability.
Products as complex as ours may contain errors, defects and bugs when first introduced to customers or as new versions are released. Our products have in the past experienced such errors, defects and bugs. Delivery of products with production defects or reliability, quality or compatibility problems could significantly delay or hinder market acceptance of the products or result in a costly recall and could damage our reputation and adversely affect our ability to retain existing customers and attract new customers. Errors, defects or bugs could cause problems with the functionality of our products, resulting in interruptions, delays or cessation of sales of these products to our customers. We may also be required to make significant expenditures of capital and resources to resolve such problems. We cannot assure you that problems will not be found in new products, both before and after commencement of commercial production, despite testing by us, our suppliers or our customers. Any such problems could result in:
| • | delays in development, manufacture and roll-out of new products; |
| • | additional development costs; |
| • | loss of, or delays in, market acceptance; |
| • | diversion of technical and other resources from our other development efforts; |
| • | claims for damages by our customers or others against us; and |
| • | loss of credibility with our current and prospective customers. |
Any such event could have a material adverse effect on our business, financial condition and results of operations.
We may experience difficulties in transitioning to new wafer fabrication process technologies or in achieving higher levels of design integration, which may result in reduced manufacturing yields, delays in product deliveries and increased expenses.
We aim to use the most advanced manufacturing process technology appropriate for our solutions that is available from our third-party foundries. As a result, we periodically evaluate the benefits of migrating our solutions to other technologies in order to improve performance and reduce costs. These ongoing efforts require us from time to time to modify the manufacturing processes for our products and to redesign some products, which in turn may result in delays in product deliveries. We may face difficulties, delays and increased expense as we transition our products to new processes, and potentially to new foundries. We will depend on our third-party foundries as we transition to new processes. We cannot assure you that our third-party foundries will be
16
Table of Contents
able to effectively manage such transitions or that we will be able to maintain our relationship with our third-party foundries or develop relationships with new third-party foundries. If we or any of our third-party foundries experience significant delays in transitioning to new processes or fail to efficiently implement transitions, we could experience reduced manufacturing yields, delays in product deliveries and increased expenses, any of which could harm our relationships with our customers and our operating results.
As smaller line width geometry manufacturing processes become more prevalent, we intend to move our future products to increasingly smaller geometries in order to reduce costs while integrating greater levels of functionality into our products. This transition will require us and our third-party foundries to migrate to new designs and manufacturing processes for smaller geometry products. We may not be able to achieve smaller geometries with higher levels of design integration or to deliver new integrated products on a timely basis. We periodically evaluate the benefits, on a product-by-product basis, of migrating to smaller geometry process technologies to reduce our costs and increase performance. We are dependent on our relationships with our third-party foundries to transition to smaller geometry processes successfully. We cannot assure you that our third-party foundries will be able to effectively manage any such transition. If we or our third-party foundries experience significant delays in any such transition or fail to implement a transition, our business, financial condition and results of operations could be materially harmed.
If we fail to hire additional finance personnel and strengthen our financial reporting systems and infrastructure, we may not be able to timely and accurately report our financial results or comply with the requirements of being a public company, including compliance with the Sarbanes-Oxley Act and SEC reporting requirements.
We intend to hire additional accounting and finance staff with technical accounting, SEC reporting and Sarbanes-Oxley Act compliance expertise. Any inability to recruit and retain such staff would have an adverse impact on our ability to accurately and timely prepare our financial statements. We may be unable to locate and hire qualified professionals with requisite technical and public company experience when and as needed. In addition, new employees will require time and training to learn our business and operating processes and procedures. If our finance and accounting organization is unable for any reason to respond adequately to the increased demands from being a public company, the quality and timeliness of our financial reporting may suffer, which could result in the identification of material weaknesses in our internal controls. For example, in 2015, our independent registered public accounting firm identified in their report to our audit committee that we had a material weakness in our internal control over financial reporting as of December 31, 2014 due to our lack of sufficient, qualified personnel in accounting and financial reporting functions with sufficient experience and expertise with respect to the application of GAAP (as defined below) and related financial reporting, which led to a delay in the closing of our books and resulted in a number of post-closing adjustments to our consolidated financial statements as of and for the years ended December 31, 2013 and 2014. Any consequences resulting from inaccuracies or delays in our reported financial statements could cause the trading price of our common stock to decline and could harm our business, operating results and financial condition.
If we fail to strengthen our financial reporting systems, infrastructure and internal control over financial reporting to meet the demands placed upon us as a public company, including the requirements of the Sarbanes-Oxley Act, we may be unable to report our financial results timely and accurately and prevent fraud. We expect to incur significant expense and devote substantial management effort toward ensuring compliance with Section 404.
A breach of our security systems may damage our reputation and adversely affect our business.
Our security systems are designed to protect our customers’, suppliers’ and employees’ confidential information, as well as maintain the physical security of our facilities. We also rely on a number of third-party “cloud-based” service providers of corporate infrastructure services relating to, among other things, human resources, electronic communication services and some finance functions, and we are, of necessity, dependent on the security systems of these providers. Any security breaches or other unauthorized access by third parties to the
17
Table of Contents
systems of our cloud-based service providers or the existence of computer viruses in their data or software could expose us to a risk of information loss and misappropriation of confidential information. Accidental or willful security breaches or other unauthorized access by third parties to our information systems or facilities, or the existence of computer viruses in our data or software, could expose us to a risk of information loss and misappropriation of proprietary and confidential information belonging to us, our customers or our suppliers. Any theft or misuse of this information could result in, among other things, unfavorable publicity, damage to our reputation, difficulty in marketing our products, allegations by our customers that we have not performed our contractual obligations, litigation by affected parties and possible financial obligations for liabilities and damages related to the theft or misuse of this information, any of which could have a material adverse effect on our business, financial condition, our reputation, and our relationships with our customers and partners. Since the techniques used to obtain unauthorized access or to sabotage systems change frequently and are often not recognized until launched against a target, we may be unable to anticipate these techniques or to implement adequate preventative measures.
Failure to protect our intellectual property could substantially harm our business.
Our success and ability to compete depend in part upon our ability to protect our intellectual property. We rely on a combination of intellectual property rights, including patents, mask work protection, copyrights, trademarks, trade secrets and know-how, in the United States and other jurisdictions. The steps we take to protect our intellectual property rights may not be adequate, particularly in foreign jurisdictions such as China. Any patents we hold may not adequately protect our intellectual property rights or our products against competitors, and third parties may challenge the scope, validity or enforceability of our issued patents. In addition, other parties may independently develop similar or competing technologies designed around any patents or patent applications that we hold. Some of our products and technologies are not covered by any patent or patent application, as we do not believe patent protection of these products and technologies is critical to our business strategy at this time. A failure to timely seek patent protection on products or technologies generally precludes us from seeking future patent protection on these products or technologies.
In addition to patents, we also rely on contractual protections with our customers, suppliers, distributors, employees and consultants, and we implement security measures designed to protect our trade secrets and know-how. However, we cannot assure you that these contractual protections and security measures will not be breached, that we will have adequate remedies for any such breach or that our customers, suppliers, distributors, employees or consultants will not assert rights to intellectual property or damages arising out of such contracts.
We may initiate claims against third parties to protect our intellectual property rights if we are unable to resolve matters satisfactorily through negotiation. Litigation brought to protect and enforce our intellectual property rights could be costly, time-consuming and distracting to management. It could also result in the impairment or loss of portions of our intellectual property, as an adverse decision could limit our ability to assert our intellectual property rights, limit the value of our technology or otherwise negatively impact our business, financial condition and results of operations. Additionally, any enforcement of our patents or other intellectual property may provoke third parties to assert counterclaims against us. Our failure to secure, protect and enforce our intellectual property rights could materially harm our business.
We may face claims of intellectual property infringement, which could be time-consuming, costly to defend or settle, result in the loss of significant rights, harm our relationships with our customers and distributors, or otherwise materially adversely affect our business, financial condition and results of operations.
The semiconductor memory industry is characterized by companies that hold patents and other intellectual property rights and that vigorously pursue, protect and enforce intellectual property rights. These companies include patent holding companies or other adverse patent owners who have no relevant product revenue and against whom our own patents may provide little or no deterrence. From time to time, third parties may assert against us and our customers’ patent and other intellectual property rights to technologies that are important to our business.
18
Table of Contents
Claims that our products, processes or technology infringe third-party intellectual property rights, regardless of their merit or resolution, could be costly to defend or settle and could divert the efforts and attention of our management and technical personnel. We may also be obligated to indemnify our customers or business partners in connection with any such litigation, which could result in increased costs. Infringement claims also could harm our relationships with our customers or distributors and might deter future customers from doing business with us. If any such proceedings result in an adverse outcome, we could be required to:
| • | cease the manufacture, use or sale of the infringing products, processes or technology; |
| • | pay substantial damages for infringement; |
| • | expend significant resources to develop non-infringing products, processes or technology, which may not be successful; |
| • | license technology from the third-party claiming infringement, which license may not be available on commercially reasonable terms, or at all; |
| • | cross-license our technology to a competitor to resolve an infringement claim, which could weaken our ability to compete with that competitor; or |
| • | pay substantial damages to our customers to discontinue their use of or to replace infringing technology sold to them with non-infringing technology, if available. |
Any of the foregoing results could have a material adverse effect on our business, financial condition and results of operations. Furthermore, our exposure to the foregoing risks may also be increased as a result of acquisitions of other companies or technologies. For example, we may have a lower level of visibility into the development process with respect to intellectual property or the care taken to safeguard against infringement risks with respect to the acquired company or technology. In addition, third parties may make infringement and similar or related claims after we have acquired technology that had not been asserted prior to the acquisition.
We rely upon third-party licensed technology to develop our products. If licenses of third-party technology are inadequate, our ability to develop and commercialize our products or product enhancements could be negatively impacted.
Our products incorporate technology licensed from third parties. In connection with our acquisition of certain flash memory assets from Atmel Corporation in 2012, we obtained a perpetual license to Atmel’s flash memory technology. In addition, a component of our CBRAM technology is licensed from Axon Technology Corp. While we believe these licenses enable us to develop our products and pursue our current product strategies, these licenses may not provide us with the benefits we expect from them. From time to time, we may be required to license additional technology from third parties to develop our products or product enhancements. However, these third-party licenses may not be available to us on commercially reasonable terms or at all. Our inability to obtain third-party licenses necessary to develop products and product enhancements could require us to obtain substitute technology at a greater cost or of lower quality or performance standards or delay product development. Any of these results may limit our ability to develop new products, which could harm our business, financial condition and results of operations.
Our success depends on our ability to attract and retain key employees, and our failure to do so could harm our ability to grow our business and execute our business strategies.
Our success depends on our ability to attract and retain our key employees, including our management team and experienced engineers. Competition for personnel in the semiconductor technology field is intense, and the availability of suitable and qualified candidates is limited. We compete to attract and retain qualified research and development personnel with other semiconductor companies, universities and research institutions, particularly those in the San Francisco Bay Area where our headquarters is located. The members of our management and key employees are at-will employees and although we recently issued refresh equity awards to
19
Table of Contents
our personnel in connection with our initial public offering in October 2015, there can be no assurance that these awards will be effective to retain our key employees. If we lose the services of any key senior management member or employee, we may not be able to locate suitable or qualified replacements, and may incur additional expenses to recruit and train new personnel, which could severely impact our business and prospects. The loss of the services of one or more of our key employees, especially our key engineers, or our inability to attract and retain qualified engineers, could harm our business, financial condition and results of operations.
We may not be able to effectively manage our growth, and we may need to incur significant expenditures to address the additional operational and control requirements of our growth, either of which could harm our business and operating results.
As we continue to expand our business, we expect our headcount and overall size of our operations to grow significantly. To effectively manage our growth, we must continue to expand our operational, engineering and financial systems, procedures and controls and to improve our accounting and other internal management systems. This may require substantial managerial and financial resources, and our efforts in this regard may not be successful. Our current systems, procedures and controls may not be adequate to support our future operations. If we fail to adequately manage our growth, or to improve our operational, financial and management information systems, or fail to effectively motivate or manage our new and future employees, the quality of our products and the management of our operations could suffer, which could adversely affect our operating results.
We have expanded in the past and may continue to expand in the future through acquisitions of, or investments in, other companies, each of which may divert our management’s attention, result in additional dilution to stockholders or use resources that are necessary to operate our business.
In the past, we have grown our business through acquisitions and we may in the future seek to acquire or invest in businesses, products or technologies that we believe could complement or expand our business, enhance our technical capabilities or otherwise offer growth opportunities. For example, in September 2012, we purchased certain flash memory product assets from Atmel Corporation, which brought us a large customer base for products, a world-wide sales and distribution network and products and technology to further broaden our technology platform offerings. Such acquisitions or investments could create risks for us, including:
| • | difficulties in assimilating acquired personnel, operations and technologies or realizing synergies expected in connection with an acquisition, particularly with acquisitions of companies with large and widespread operations, complex products or that operate in markets in which we historically have had limited experience; |
| • | unanticipated costs or liabilities, including possible litigation, associated with the acquisition; |
| • | incurrence of acquisition-related costs; |
| • | diversion of management’s attention from other business concerns; |
| • | use of resources that are needed in other parts of our business; and |
| • | use of substantial portions of our available cash to consummate an acquisition. |
A significant portion of the purchase price of companies we acquire may be allocated to acquired goodwill, which must be assessed for impairment at least annually. If such acquisitions do not yield expected returns, we may be required to take charges to our earnings based on this impairment assessment process, which could harm our results of operations.
We may be unable to complete acquisitions at all or on commercially reasonable terms, which could limit our future growth. Acquisitions could also result in dilutive issuances of equity securities or the incurrence of additional debt, which could adversely affect our operating results and result in a decline in our stock price and further restrict our ability to pursue business opportunities, including potential acquisitions. In addition, if an acquired business fails to meet our expectations, our operating results may suffer.
20
Table of Contents
We have operations outside of the United States and intend to expand our international operations, which exposes us to significant risks.
We have limited operations in Europe and Asia. We intend to expand our operations in Asia. The success of our business depends, in large part, on our ability to operate successfully from geographically disparate locations and to further expand our international operations and sales. Operating in international markets requires significant resources and management attention and subjects us to regulatory, economic and political risks that are different from those we face in the United States. We cannot be sure that further international expansion will be successful. In addition, we face risks in doing business internationally that could expose us to reduced demand for our products, lower prices for our products or other adverse effects on our operating results. Among the risks we believe are most likely to affect us are:
| • | difficulties, inefficiencies and costs associated with staffing and managing foreign operations; |
| • | longer and more difficult customer qualification and credit checks; |
| • | greater difficulty collecting accounts receivable and longer payment cycles; |
| • | the need for various local approvals to operate in some countries; |
| • | difficulties in entering some foreign markets without larger-scale local operations; |
| • | compliance with local laws and regulations; |
| • | unexpected changes in regulatory requirements, including the elimination of tax holidays; |
| • | reduced protection for intellectual property rights in some countries; |
| • | adverse tax consequences as a result of repatriating cash generated from foreign operations to the United States; |
| • | adverse tax consequences, including potential additional tax exposure if we are deemed to have established a permanent establishment outside of the United States; |
| • | the effectiveness of our policies and procedures designed to ensure compliance with the Foreign Corrupt Practices Act of 1977 and similar regulations; |
| • | fluctuations in currency exchange rates, which could increase the prices of our products to customers outside of the United States, increase the expenses of our international operations by reducing the purchasing power of the U.S. dollar and expose us to foreign currency exchange rate risk if, in the future, we denominate our international sales in currencies other than the U.S. dollar; |
| • | new and different sources of competition; and |
| • | political and economic instability, and terrorism. |
Our failure to manage any of these risks successfully could harm our operations and reduce our revenue.
In order to comply with environmental laws and regulations, we may need to modify our activities or incur substantial costs, and if we fail to comply with environmental regulations we could be subject to substantial fines or be required to have our suppliers alter their processes.
The semiconductor memory industry is subject to a variety of international, federal, state and local governmental regulations directed at preventing or mitigating environmental harm, as well as to the storage, discharge, handling, generation, disposal and labeling of toxic or other hazardous substances. Failure to comply with environmental regulations could subject us to civil or criminal sanctions and property damage or personal injury claims. Compliance with current or future environmental laws and regulations could restrict our ability to expand our business or require us to modify processes or incur other substantial expenses which could harm our business. In response to environmental concerns, some customers and government agencies impose requirements
21
Table of Contents
for the elimination of hazardous substances, such as lead (which is widely used in soldering connections in the process of semiconductor packaging and assembly), from electronic equipment. For example, the European Union, or EU, adopted its Restriction on Hazardous Substance Directive which prohibits, with specified exceptions, the sale in the EU market of new electrical and electronic equipment containing more than agreed levels of lead or other hazardous materials and China has enacted similar regulations. Environmental laws and regulations such as these could become more stringent over time, causing a need to redesign technologies, imposing greater compliance costs and increasing risks and penalties associated with violations, which could seriously harm our business.
The issuance of new accounting standards or future interpretations of existing accounting standards could adversely affect our operating results.
We prepare our financial statements in accordance with accounting principles generally accepted in the United States of America, or GAAP. A change in those principles could have a significant effect on our reported results and might affect our reporting of transactions completed before a change is announced. GAAP is issued and subject to interpretation by the Financial Accounting Standards Board, the SEC and various other bodies formed to promulgate and interpret accounting principles. A change in these principles or interpretations could have a significant effect on our reported financial results, and could affect the reporting of transactions completed before the announcement of a change. The issuance of new accounting standards or future interpretations of existing accounting standards, or changes in our business practices or estimates, could result in future changes in our revenue recognition or other accounting policies that could have a material adverse effect on our results of operations.
Our management team has limited experience managing a public company.
Most members of our management team have limited experience managing a publicly-traded company, interacting with public company investors, and complying with the increasingly complex laws pertaining to public companies. Our management team may not successfully or efficiently manage our transition to being a public company subject to significant regulatory oversight and reporting obligations under the federal securities laws and the continuous scrutiny of securities analysts and investors. These new obligations and constituents require significant attention from our senior management and could divert their attention away from the day-to-day management of our business, which could adversely affect our business, financial condition, and operating results.
Some of our facilities and the facilities of our suppliers are located near known earthquake fault zones, and the occurrence of an earthquake or other catastrophic disaster could damage our facilities, which could cause us to curtail our operations.
Our principal offices, and our contract manufacturers’ and suppliers’ facilities in Asia, are located near known earthquake fault zones and, therefore, are vulnerable to damage from earthquakes. We are also vulnerable to damage from other types of disasters, such as power loss, fire, floods and similar events. If any such disaster were to occur, our ability to operate our business could be seriously impaired. In addition, we may not have adequate insurance to cover our losses resulting from disasters or other similar significant business interruptions. Any significant losses that are not recoverable under our insurance policies could seriously impair our business and financial condition.
We may not be able to secure additional financing on favorable terms, or at all, to meet our future capital needs.
We have funded our operations since inception through equity financings, our borrowing arrangements and our initial public offering in October 2015. We have incurred net losses and negative cash flows from operating activities since our inception, and we expect we will continue to incur operating and net losses and negative cash
22
Table of Contents
flows from operations for the foreseeable future. We do not know when or if our operations will generate sufficient cash to fund our ongoing operations. In the future, we may require additional capital to fund our ongoing operations, respond to business opportunities, challenges, acquisitions or unforeseen circumstances and may determine to engage in equity or debt financings or enter into credit facilities, but we may not be able to timely secure additional debt or equity financing or raise additional capital in the public market on favorable terms or at all.
Our current term loan facility limits our ability to incur indebtedness, and these restrictions are subject to a number of qualifications and exceptions subject to the consent of our lender. Any additional debt financing obtained by us in the future could also involve restrictive covenants relating to our capital-raising activities and other financial and operational matters, which may make it more difficult for us to obtain additional capital and to pursue business opportunities, including potential acquisitions.
If we raise additional funds through issuances of equity, convertible debt securities or other securities convertible into equity, our existing stockholders could suffer significant dilution in their percentage ownership of our company, and any new equity securities we issue could have rights, preferences and privileges senior to those of holders of our common stock. If we are unable to obtain adequate financing or financing on terms satisfactory to us, when we require it, our ability to continue to grow or support our business and to respond to business challenges could be significantly limited.
Provisions of our debt agreements may restrict our ability to pursue our business strategies.
Borrowings under our $15.0 million term loan facility are collateralized by substantially all of our assets. Our term loan facility restricts our ability to, among other things:
| • | dispose of or sell assets; |
| • | consolidate or merge with other entities; |
| • | incur additional indebtedness; |
| • | create liens on our assets; |
| • | pay dividends; |
| • | make investments; |
| • | enter into transactions with affiliates; and |
| • | redeem subordinated indebtedness. |
These restrictions are subject to certain exceptions. In addition, our term loan facility requires us to comply with a minimum quarterly adjusted EBITDA covenant (measured on a trailing three-month basis) and a minimum monthly liquidity ratio. The operating and financial restrictions and covenants in the term loan facility, as well as any future financing agreements that we may enter into, may restrict our ability to finance our operations, engage in business activities or expand or fully pursue our business strategies. Our ability to comply with these covenants may be affected by events beyond our control, and we may not be able to meet those covenants as we failed to do as of September 30, 2015. A breach of any of these covenants could result in a default under the credit facility, which could cause all of the outstanding indebtedness thereunder to either (i) become immediately due and payable or (ii) increase by five percent of the interest rate charged during the period of the unremedied breach
Our ability to use net operating losses to offset future taxable income may be subject to certain limitations.
In general, under Section 382 of the U.S. Internal Revenue Code of 1986, as amended, or the Code, a corporation that undergoes an “ownership change” is subject to limitations on its ability to utilize its pre-change net operating losses, or NOLs, to offset future taxable income, and tax credits to offset tax. In addition, although
23
Table of Contents
we do not expect to undergo an ownership change, we may experience an ownership change in the future, and our ability to utilize our NOLs and tax credits could be further limited by Section 382 of the Code. Future changes in our stock ownership, many of which are outside of our control, could result in an ownership change under Section 382 of the Code. Our net operating losses and tax credits could also be impaired under state laws. As a result, we might not be able to utilize a material portion of our state NOLs and tax credits.
If we are unable to implement and maintain effective internal control over financial reporting in the future, investors may lose confidence in the accuracy and completeness of our financial reports and the market price of our common stock may be negatively affected.
As a public company, we are required to maintain internal controls over financial reporting and to report any material weaknesses in such internal controls. Section 404 of the Sarbanes-Oxley Act requires that we evaluate and determine the effectiveness of our internal control over financial reporting and, beginning with our annual report for the fiscal year ending December 31, 2016, provide a management report on our internal control over financial reporting, which must be attested to by our independent registered public accounting firm to the extent we are no longer an “emerging growth company,” as defined by the JOBS Act. If we have one or more material weaknesses in our internal control over financial reporting, we may not detect errors on a timely basis and our financial statements may be materially misstated. We are in the process of designing and implementing our internal control over financial reporting required to comply with this obligation, which process will be time consuming, costly and complicated. If we identify material weaknesses in our internal control over financial reporting, if we are unable to comply with the requirements of Section 404 in a timely manner, if we are unable to determine that our internal control over financial reporting is effective, or if our independent registered public accounting firm is unable to express an opinion as to the effectiveness of our internal control over financial reporting, investors may lose confidence in the accuracy and completeness of our financial reports, the market price of our common stock could be negatively affected, and we could become subject to investigations by the NASDAQ Stock Market, the SEC or other regulatory authorities, which could require additional financial and management resources.
Regulations related to “conflict minerals” may force us to incur additional expenses, may make our supply chain more complex and may result in damage to our reputation with customers.
Pursuant to the Dodd-Frank Act, the SEC has adopted requirements for companies that use certain minerals and metals, known as conflict minerals, in their products, whether or not these products are manufactured by third parties. These requirements will require companies to diligence, disclose and report whether or not such minerals originate from the Democratic Republic of Congo and adjoining countries. The implementation of these requirements could adversely affect the sourcing, availability and pricing of minerals used in the manufacture of our products, and affect our costs and relationships with customers, distributors and suppliers as we must obtain additional information from them to ensure our compliance with the disclosure requirement. In addition, we will incur additional costs to comply with the disclosure requirements, including costs related to determining the source of any of the relevant minerals and metals used in our products. Since our supply chain is complex, we may not be able to sufficiently verify the origins for these minerals and metals used in our products through the due diligence procedures that we implement, which may harm our reputation. In such event, we may also face difficulties in satisfying customers who require that all of the components of our products are certified as conflict mineral free and these customers may discontinue, or materially reduce, purchases of our products, which could result in a material adverse effect on our results of operations and our financial condition may be adversely affected.
We are an emerging growth company. We cannot be certain if the reduced disclosure requirements applicable to emerging growth companies will make our common stock less attractive to investors.
We are an emerging growth company. Under the JOBS Act, emerging growth companies can delay adopting new or revised accounting standards until such time as those standards apply to private companies. For as long as we continue to be an emerging growth company, we also intend to take advantage of certain other exemptions
24
Table of Contents
from various reporting requirements that are applicable to other public companies including the exemption from the auditor attestation requirements of Section 404 of the Sarbanes-Oxley Act, the reduced disclosure obligations regarding executive compensation, and exemptions from the requirements of holding a nonbinding advisory vote on executive compensation and stockholder approval of any golden parachute payments not previously approved. We cannot predict if investors will find our common stock less attractive because we will rely on these exemptions. If some investors find our common stock less attractive as a result, there may be a less active trading market for our common stock and our stock price may be more volatile.
We will remain an emerging growth company until the earlier of (1) the last day of the fiscal year (a) following the fifth anniversary of our initial public offering, (b) in which we have total annual gross revenue of at least $1.0 billion or (c) in which we become a large accelerated filer, which means that we have been public for at least 12 months, have filed at least one annual report and the market value of our common stock that is held by non-affiliates exceeds $700 million as of the last day of our then most recently completed second fiscal quarter, and (2) the date on which we have issued more than $1.0 billion in non-convertible debt during the prior three-year period.
Risks Related to Ownership of Our Common Stock
The market price of our common stock has been and will likely continue to be volatile, and you could lose all or part of your investment.
The market price of our common stock has been, and will likely continue to be, volatile. Since shares of our common stock were sold in our initial public offering in October 2015 at a price of $5.00 per share, our stock price has fluctuated significantly. In addition to the factors discussed in this Annual Report on Form 10-K, the market price of our common stock may fluctuate significantly in response to numerous factors, many of which are beyond our control, including:
| • | overall performance of the equity markets in general, in our industry or in the markets we address; |
| • | our operating performance and the performance of other similar companies; |
| • | changes in the estimates of our results of operations that we provide to the public, our failure to meet these projected results or changes in recommendations by securities analysts that elect to follow our common stock; |
| • | announcements of technological innovations, new products or enhancements to products, acquisitions, strategic alliances or significant agreements by us or by our competitors; |
| • | announcements of new business partners, on the termination of existing business partner arrangements or changes to our relationships with such business partners; |
| • | recruitment or departure of key personnel; |
| • | announcements of litigation or claims against us; |
| • | changes in legal requirements relating to our business; |
| • | the economy as a whole, market conditions in our industry, and the industries of our customers and end customers; |
| • | trading activity by our principal stockholders; |
| • | the expiration of contractual lock-up or market standoff agreements; and |
| • | sales of shares of our common stock by us or our stockholders. |
In addition, the stock markets have experienced extreme price and volume fluctuations that have affected and continue to affect the market prices of equity securities of many technology companies. Stock prices of many technology companies have fluctuated in a manner unrelated or disproportionate to the operating performance of
25
Table of Contents
those companies. In the past, stockholders have filed securities class action litigation following periods of market volatility. If we were to become involved in securities litigation, it could subject us to substantial costs, divert resources and the attention of management from our business, and adversely affect our business.
lf securities analysts do not publish research or reports about our business or if they downgrade our stock, the price of our stock could decline.
The trading market for our common stock rely in part on the research and reports that industry or financial analysts publish about us or our business. We do not control these analysts. If few analysts cover our company, the price and trading volume of our stock could suffer. If one or more of the analysts who cover us downgrade our stock, or publish unfavorable research about our business, our stock price would likely decline rapidly. If one or more of these analysts cease coverage of our company or fail to publish regularly, we could lose visibility in the market, which in turn could cause our stock price to decline.
Future sales of shares by existing stockholders could cause our stock price to decline.
If our existing stockholders sell, or indicate an intention to sell, substantial amounts of our common stock in the public market after the contractual lock-up and other legal restrictions on resale lapse, the trading price of our common stock could decline below the initial public offering price and our ability to raise capital through the sale of equity securities could be impaired. As of December 31, 2015, we have outstanding 14,974,718 shares of common stock. Of these outstanding shares, all of the 5,192,184 shares of common stock sold in our initial public offering are freely tradable. All of our executive officers and directors and the holders of substantially all of our capital stock prior to our IPO are subject to lock-up agreements with the underwriters that restrict their ability to sell shares in the public market for 180 days from the date of the Company’s final prospectus dated October 26, 2015 and filed with the SEC on October 27, 2015. Needham & Company, LLC and Oppenheimer &Co. Inc. may, however, in their sole discretion, permit shares to be sold prior to the expiration of the lock-up agreements.
After the lock-up agreements entered into in connection with our IPO expire, an additional 9,782,534 shares will be eligible for sale in the public market, 5,242,787 of which are held by directors, executive officers and other affiliates and will be subject to volume limitations under Rule 144 under the Securities Act and various vesting agreements. In addition, 411,514 shares subject to outstanding warrants and the 2,611,493 shares subject to outstanding options and reserved for future issuance under our 2015 Equity Incentive Plan, will be eligible for sale in the public market to the extent permitted by the provisions of various vesting agreements, the lock-up agreements and Rules 144 and 701 under the Securities Act. If these additional shares are sold, or if it is perceived that they will be sold, in the public market, the trading price of our common stock could decline.
Certain holders of shares of our common stock have registration rights. Registration of these shares under the Securities Act would result in the shares becoming freely tradable without restriction under the Securities Act, except for shares held by our affiliates as defined in Rule 144 under the Securities Act. Sales of securities by any of these stockholders could adversely affect the trading price of our common stock.
We do not intend to pay dividends for the foreseeable future.
We have never declared nor paid cash dividends on our capital stock. We currently intend to retain any future earnings to finance the operation and expansion of our business, and we do not expect to declare or pay any dividends in the foreseeable future. In addition, our ability to pay cash dividends on our capital stock is restricted by the terms of our term loan facility and is likely to be restricted by any future debt financing arrangement. Any return to stockholders will therefore be limited to increases in the price of our common stock, if any.
26
Table of Contents
Provisions in our amended and restated certificate of incorporation and bylaws or Delaware law might discourage, delay or prevent a change of control of our company or changes in our management.
Delaware corporate law and our amended and restated certificate of incorporation and bylaws contain provisions that could discourage, delay or prevent a change in control of our company or changes in our board of directors that the stockholders of our company may deem advantageous. Among other things, these provisions:
| • | establish a classified board of directors so that not all members of our board are elected at one time; |
| • | provide that directors may be removed only “for cause” and only with the approval of stockholders representing 66 2/3 percent of our outstanding common stock; |
| • | require super-majority voting to amend some provisions in our amended and restated certificate of incorporation and bylaws; |
| • | authorize the issuance of “blank check” preferred stock that our board could issue to increase the number of outstanding shares and to discourage a takeover attempt; |
| • | eliminate the ability of our stockholders to call special meetings of stockholders; |
| • | prohibit stockholder action by written consent, which means that all stockholder actions will be required to be taken at a meeting of our stockholders; |
| • | provide that our board of directors is expressly authorized to make, alter or repeal our bylaws; and |
| • | establish advance notice requirements for nominations for election to our board or for proposing matters that can be acted upon by stockholders at stockholder meetings. |
These provisions may frustrate or prevent any attempts by our stockholders to replace or remove our current management by making it more difficult for stockholders to replace members of our board of directors, which is responsible for appointing the members of our management. In addition, we are governed by the provisions of Section 203 of the Delaware General Corporation Law, which generally prohibits a Delaware corporation from engaging in a broad range of business combinations with any “interested” stockholder for a period of three years following the date on which the stockholder became an “interested” stockholder. Any delay or prevention of a change of control transaction or changes in our management could cause the market price of our common stock to decline.
| ITEM 1B. | UNRESOLVED STAFF COMMENTS |
None.
| ITEM 2. | PROPERTIES |
We lease approximately 22,000 square feet in Sunnyvale, California for our corporate headquarters, pursuant to a noncancelable lease, which expires in July 2016.
Our new corporate headquarters, consisting of approximately 34,000 square feet in Santa Clara, California, is leased through July 2023. We believe that our existing facilities are adequate to meet our current needs, and we intend to add or change facilities as needs require. We believe that, if required, suitable additional or substitute space would be available to accommodate expansion of our operations.
| ITEM 3. | LEGAL PROCEEDINGS |
We are not currently a party to any legal proceedings which, if determined adversely to us, would individually or in the aggregate have a material adverse effect on our business, operating results, financial condition or cash flows. We may, from time to time, become involved in legal proceedings arising in the ordinary course of our business and as our business grows, we may become a party to an increasing number of legal proceedings.
| ITEM 4. | MINE SAFETY DISCLOSURES |
Not applicable.
27
Table of Contents
ITEM 5. MARKET FOR REGISTRANT’S COMMON EQUITY, RELIATED STOCKHOLDER MATTERS AND ISSUER PURCHASES OF EQUITY SECURITIES
Market Information for Common Stock
Our common stock has been listed on the NASDAQ Capital Market under the symbol “IOTS” since October 27, 2015, the date of our initial public offering. Prior to our initial public offering, there was no public market for our common stock.
The following table sets forth for the indicated periods the high and low closing sales prices of our common stock as reported by the NASDAQ Capital Market.
| High | Low | |||||||
| Year ended December 31, 2015 |
||||||||
| Fourth quarter (from October 27, 2015) |
$ | 8.18 | $ | 5.23 | ||||
The last reported sale price for our common stock on the NASDAQ Capital Market was $7.71 per share on December 31, 2015.
Holders of Record
As of March 27, 2016, there were 42 registered stockholders of record of our common stock. Because many of our shares of common stock are held by brokers or other institutions on behalf of stockholders, we are unable to estimate the total number of stockholders represented by the record holders.
Dividend Policy
We have never declared or paid any cash dividends on our capital stock. We currently intend to retain any future earnings and do not expect to pay any cash dividends on our common stock for the foreseeable future. Any determination to pay dividends in the future will be at the discretion of our board of directors. In addition, the terms of our $15.0 million term loan facility currently prohibit us from paying dividends.
Securities Authorized for Issuance under Equity Compensation Plans
The information concerning our equity compensation plans is incorporated by reference herein to the section of the Proxy Statement entitled “Equity Compensation Plan Information.”
Stock Performance Graph
This performance graph shall not be deemed “filed” for purposes of Section 18 of the Exchange Act or otherwise subject to the liabilities under that Section, and shall not be deemed to be incorporated by reference into any filing of Symantec under the Securities Act or the Exchange Act.
The graph below compares the cumulative total stockholder return on our common stock with the cumulative total return on the NASDAQ Composite Index and the PHLX Semiconductor Index for the period from October 27, 2015 (the date our common stock commenced trading on the NASDAQ Capital Market) to December 31, 2015, the end of our last fiscal year. The comparisons in the graph below are based on historical data and are not intended to forecast or be indicative of future stock price performance of our common stock.
28
Table of Contents
COMPARISON OF 2 MONTH CUMULATIVE TOTAL RETURN*
Among Adesto Technologies Corp, the NASDAQ Composite Index
and the PHLX Semiconductor Index
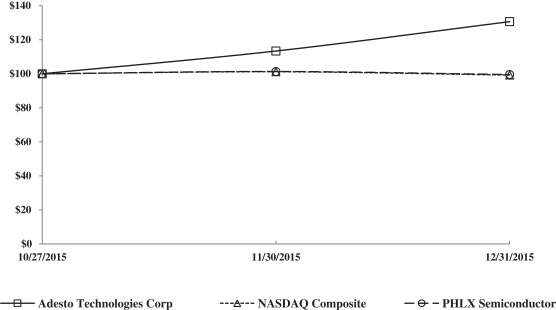
| * | $100 invested on 10/27/15 in stock or 10/31/15 in index, including reinvestment of dividends. Fiscal year ending December 31. |
Recent Sale of Unregistered Securities and Use of Proceeds
Recent Sale of Unregistered Securities
From October 1, 2015 until October 27, 2015 (the date of the filing of our registration statement on Form S-8, No. 333-207630), we granted stock options to purchase 1,515 shares of our common stock to our employees under the 2007 Equity Incentive Plan and awarded 880,072 restricted stock units to our employees under the 2015 Equity Incentive Plan. These issuances were undertaken in reliance upon the exemption from registration requirements of Rule 701 of the Securities Act.
During the three months ended December 31, 2015, we issued 102,289 shares of common stock pursuant to the cashless net exercise of warrants to purchase shares of our common stock. The shares of common stock issued in the above transactions were not registered under the Securities Act in reliance upon exemptions from registration under Section 4(2) of the Securities Act or Regulation D promulgated thereunder.
Use of Proceeds
On October 30, 2015, we completed our initial public offering in which we sold 5,000,000 shares of common stock at a price to the public of $5.00 per share. On November 4, 2015, we completed the sale of an additional 192,184 shares of common stock pursuant to the underwriters’ overallotment option. The aggregate offering price for shares sold by us in the offering was approximately $26.0 million. The offer of up to 5,750,000 shares in the initial public offering, for a proposed maximum aggregate offering price of $28.75 million, were registered under the Securities Act pursuant to a registration statement on Form S-1 (File No. 333-206940) that was declared effective by the Securities and Exchange Commission on October 26, 2015. Needham & Company,
29
Table of Contents
LLC, Oppenheimer & Co. Inc. and Roth Capital Partners, LLC were the underwriters for the offering. Following the sale of 5,192,184 shares in connection with the closing of the initial public offering and the sale of the shares subject to the overallotment option, the offering terminated. We raised approximately $22.1 million in net proceeds after deducting underwriting discounts and commissions of approximately $1.8 million and other offering expenses of approximately $2.0 million.
There has been no material change in the planned use of proceeds from our initial public offering as described in our final prospectus filed with the Securities and Exchange Commission on October 27, 2015 pursuant to Rule 424(b). None of the proceeds from the initial public offering was used during the fourth quarter of 2015.
Purchases of Equity Securities by the Issuer and Affiliated Purchasers
None.
| ITEM 6. | SELECTED FINANCIAL DATA |
We derived the selected consolidated statements of operations data for the years ended December 31, 2015, 2014, and 2013 and the selected consolidated balance sheets data as of December 31, 2015 and 2014 from our audited consolidated financial statements included elsewhere in this Annual Report on Form 10-K. Our historical results are not necessarily indicative of the results to be expected in the future. You should read the following summary consolidated financial data in conjunction with the section entitled “Management’s Discussion and Analysis of Financial Condition and Results of Operations” and our consolidated financial statements, related notes and other financial information included elsewhere in this Annual Report on Form 10-K.
Consolidated Statements of Operations Data:
| Year Ended December 31, | ||||||||||||
| 2015 | 2014 | 2013 | ||||||||||
| (in thousands, except share and per share data) | ||||||||||||
| Revenue |
$ | 43,259 | $ | 41,465 | $ | 49,684 | ||||||
| Cost of revenue |
24,775 | 25,532 | 29,738 | |||||||||
|
|
|
|
|
|
|
|||||||
| Gross profit |
18,484 | 15,933 | 19,946 | |||||||||
|
|
|
|
|
|
|
|||||||
| Operating expenses: |
||||||||||||
| Research and development |
12,795 | 14,410 | 15,033 | |||||||||
| Sales and marketing |
8,345 | 7,211 | 8,094 | |||||||||
| General and administrative |
3,978 | 2,356 | 2,677 | |||||||||
|
|
|
|
|
|
|
|||||||
| Total operating expenses |
25,118 | 23,977 | 25,804 | |||||||||
|
|
|
|
|
|
|
|||||||
| Loss from operations |
(6,634 | ) | (8,044 | ) | (5,858 | ) | ||||||
|
|
|
|
|
|
|
|||||||
| Other income (expense): |
||||||||||||
| Interest expense, net |
(1,115 | ) | (864 | ) | (2,731 | ) | ||||||
| Other income (expense), net |
(695 | ) | 114 | 508 | ||||||||
|
|
|
|
|
|
|
|||||||
| Total other income (expense), net |
(1,810 | ) | (750 | ) | (2,223 | ) | ||||||
|
|
|
|
|
|
|
|||||||
| Loss before provision for (benefit from) for income taxes |
(8,444 | ) | (8,794 | ) | (8,081 | ) | ||||||
| Provision for (benefit from) income taxes |
(61 | ) | 140 | 72 | ||||||||
|
|
|
|
|
|
|
|||||||
| Net loss attributable to common stockholders |
$ | (8,383 | ) | $ | (8,934 | ) | $ | (8,153 | ) | |||
|
|
|
|
|
|
|
|||||||
| Net loss per share attributable to common stockholders |
||||||||||||
| Basic and diluted |
$ | (2.79 | ) | $ | (16.48 | ) | $ | (15.14 | ) | |||
|
|
|
|
|
|
|
|||||||
| Weighted average number of shares used in computing net loss per share attributable to common stockholders |
||||||||||||
| Basic and diluted |
3,007,929 | 542,248 | 538,388 | |||||||||
|
|
|
|
|
|
|
|||||||
30
Table of Contents
Consolidated Balance Sheets Data:
| December 31, | ||||||||
| 2015 | 2014 | |||||||
| (in thousands) | ||||||||
| Cash and cash equivalents |
$ | 23,089 | $ | 5,972 | ||||
| Total assets |
49,938 | 31,447 | ||||||
| Current liabilities |
17,644 | 21,634 | ||||||
| Debt |
13,420 | 10,749 | ||||||
| Preferred stock warrant liability |
— | 122 | ||||||
| Convertible preferred stock |
— | 78,467 | ||||||
| Total stockholders’ equity (deficit) |
24,479 | (70,252 | ) | |||||
In April 2015 we entered into a three-year $15.0 million term loan facility. As of December 31, 2015, we had gross borrowings of $14.0 million outstanding under our term loan facility, of which $5.6 million is included in current liabilities.
31
Table of Contents
| ITEM 7. | MANAGEMENT’S DISCUSSION AND ANALYSIS OF FINANCIAL CONDITION AND RESULTS OF OPERATIONS |
You should read the following discussion and analysis of our financial condition and results of operations together with the consolidated financial statements and related notes that are included elsewhere in this Annual Report on Form 10-K. This discussion contains forward-looking statements based upon current plans, expectations and beliefs that involve risks and uncertainties. Our actual results may differ materially from those anticipated in these forward-looking statements as a result of various factors, including those set forth under “Risk Factors” and in other parts of this Annual Report on Form 10-K.
Overview
We are a leading provider of application-specific and ultra-low power non-volatile memory, or NVM, products. We optimize our NVM products for Internet of Things, or IoT, applications including current and next-generation Internet-connected devices in the consumer, industrial, medical and wearables markets. We combine our NVM design capabilities with proprietary intellectual property and differentiated technology platforms to deliver high-performance products that dramatically reduce the overall energy consumption of our customers’ systems and extend battery life. Our products feature embedded intelligence in a small form factor and high reliability.
Our revenue is derived from the sale of our NVM products, primarily our standard serial flash memory products, which represented substantially all of our revenue for the year ended December 31, 2015. On September 28, 2012, we purchased certain flash memory product assets from Atmel Corporation, or Atmel. The products we acquired as part of the acquisition were approaching the end of their life cycle and experiencing annual revenue declines. While we provide support for these products, we have not invested further in their research and development. Revenue from these legacy products have declined to $3.4 million from $13.0 million for the years ended December 31, 2015 and 2014, respectively. We expect that revenue from these products will continue to decline in the future. Since the acquisition, we have invested in developing new products that are better suited for low-power, high-growth applications, accelerated development of select products and introduced new products based on the acquired technology. In 2013, we introduced the first of our next-generation DataFlash and Fusion Flash products, which have similar functionality to our legacy products, but also offer enhanced features such as ultra-deep power down and wide supply voltage range operation. Revenue from our next-generation NVM products were $39.9 million and $28.5 million for the years ended December 31, 2015 and 2014, respectively. We had been exclusively developing products based on CBRAM technology prior to the acquisition of assets from Atmel, and have shipped more than 5.0 million units of our CBRAM-based products through 2015. We continue to develop and enhance our families of CBRAM-based products, although revenue associated with these products has not been material to date. We have made and continue to make these upfront investments because we believe that the introduction of any fundamentally new semiconductor technology must necessarily go through a lengthy customer evaluation process and several cycles of improvement in the field before it can be widely adopted or generate material revenue.
For the year ended December 31, 2015, our products were sold to approximately 500 end customers, 52 of which are large multi-national companies. In general, we work directly with our customers to have our NVM devices designed into and qualified for their products. Although we maintain direct sales, support and development relationships with our customers, once our products are designed into a customer’s product, we sell a majority of our products to those customers through distributors. We generated 73%, 70%, and 72% of our revenue from distributors during the years ended December 31, 2015, 2014, and 2013, respectively. Sales to three distributors generated approximately 40%, 54%, and 46% of our revenue during the years ended December 31, 2015, 2014, and 2013, respectively. Additionally, we derived approximately 80%, 82%, and 85% of our revenue internationally during the years ended December 31, 2015, 2014 and 2013, respectively, the majority of which was recognized in the Asia Pacific, or APAC, region. Revenue by geography is recognized based on the region to which our products are sold, and not to where the end products are shipped.
32
Table of Contents
We employ a fabless manufacturing strategy and use market-leading suppliers for all phases of the manufacturing process, including wafer fabrication, assembly, testing and packaging. This strategy significantly reduces the capital investment that would otherwise be required to operate manufacturing facilities of our own.
Factors Affecting Our Performance
Product adoption in new markets and applications. We optimize our products to meet the technical requirements of the emerging IoT market. The growth in the IoT market is dependent on many factors, most of which are outside of our control. Should the IoT market not develop or develop more slowly, our financial results could be adversely affected.
Ability to attract and retain customers that make large orders. In 2015, our products were sold to approximately 500 end customers, of which approximately 20 generated more than half our revenue. One end customer accounted for 10% or more of our revenue in 2015 and no end customer accounted for 10% or more of our revenue for 2014 and 2013. While we expect the composition of our customers to change over time, our business and operating results will depend on our ability to continually target new and retain existing customers that make large orders, particularly those in growth markets which are less dependent on macroeconomic conditions.
Design wins with new and existing customers. We believe our solutions significantly improve the performance and potentially lower the system cost of our customers’ designs, particularly if we are part of the early design phase. Accordingly, we work closely with our customers and targeted prospects to understand their product roadmaps and strategies. We consider design wins to be critical to our future success. We define a design win as the successful completion of the evaluation stage, where a customer has tested our product, verified that our product meets its requirements and qualified our NVM device for their products. The number of our design wins has grown from 32 in 2013 to 65 in 2014 and to 135 in 2015, including 6, 63 and 125 design wins for new products, respectively. The revenue that we generate, if any, from each design win can vary significantly. Our long-term sales expectations are based on forecasts from customers, internal estimates of customer demand factoring in expected time to market for end customer products incorporating our solutions and associated revenue potential and internal estimates of overall demand based on historical trends.
Pricing, product cost and gross margins of our products. Our gross margin has been and will continue to be affected by a variety of factors, including the timing of changes in pricing, shipment volumes, new product introductions, changes in product mixes, changes in our purchase price of fabricated wafers and assembly and test service costs, manufacturing yields and inventory write downs, if any. In general, newly introduced products and products with higher performance and more features tend to be priced higher than older, more mature products. Average selling prices in the semiconductor industry typically decline as products mature. Consistent with this historical trend, we expect that the average selling prices of our products will decline as they mature. In the normal course of business, we will seek to offset the effect of declining average selling prices on existing products by reducing manufacturing costs and introducing new and higher value-added products. If we are unable to maintain overall average selling prices or offset any declines in average selling prices with realized savings on product costs, our gross margin will decline.
Investment in growth. We have invested, and intend to continue to invest, in expanding our operations, increasing our headcount, developing our products and differentiated technologies to support our growth and expanding our infrastructure. We expect our total operating expenses to increase significantly in the foreseeable future to meet our growth objectives. We plan to continue to invest in our sales and support operations throughout the world, with a particular focus in the near term of adding additional sales and field applications personnel in APAC to further broaden our support and coverage of our existing customer base, in addition to developing new customer relationships and generating design wins. We also intend to continue to invest additional resources in research and development to support the development of our products and differentiated technologies. Any investments we make in our sales and marketing organization or research and development will occur in advance of experiencing any benefits from such investments, and the return on these investments may be lower than we expect. In addition, as we invest in expanding our operations internationally, our business
33
Table of Contents
and results will become further subject to the risks and challenges of international operations, including higher operating expenses and the impact of legal and regulatory developments outside the United States.
Components of Our Results of Operations
Revenue
We derive substantially all of our revenue through the sale of our NVM products to OEMs and ODMs, primarily through distributors. We generated 73%, 70%, and 72% of our revenue from distributors during the years ended December 31, 2015, 2014, and 2013, respectively. We recognize revenue from product sales when persuasive evidence of an arrangement exists and all other revenue recognition criteria are met. We sell the majority of our products to distributors and generally recognize revenue when we ship the product directly to the distributors.
Because our distributors market and sell their products worldwide, our revenue by geographic location is not necessarily indicative of where our customers’ product sales and design win activity occur, but rather of where their manufacturing operations occur.
Cost of Revenue and Gross Margin
Cost of revenue primarily consists of costs paid to our third-party manufacturers for wafer fabrication, assembly and testing of our NVM products, write-downs of inventory for excess and obsolete inventories including write-downs of inventory for products based on CBRAM technology and accruals for future losses on CBRAM wafer purchase commitments to the extent our costs exceed the market price for such products. To a lesser extent, cost of revenue also includes depreciation of test equipment and expenses relating to manufacturing support activities, including personnel-related costs, logistics and quality assurance and shipping.
Our gross margin has been and will continue to be affected by a variety of factors, including the timing of changes in pricing, shipment volumes, new product introductions, changes in product mixes, changes in our purchase price of fabricated wafers and assembly and test service costs, manufacturing yields and inventory write downs, if any. We expect our gross margin to fluctuate over time depending on the factors described above.
Operating Expenses
Our operating expenses consist of research and development, sales and marketing and general and administrative expense. Personnel-related costs, including salaries, benefits, bonuses and stock-based compensation, are the most significant component of each of our operating expense categories. In addition, in the near term we expect to hire additional personnel, primarily in our selling and marketing functions, and increase research and development expenditures, such as prototype wafers, associated with the implementation of our CBRAM technology in a manufacturing facility in Asia. Accordingly, we expect our operating expenses to increase as we invest in these initiatives.
Research and Development. Our research and development expenses consist primarily of personnel-related costs for the design and development of our products and technologies. Additional research and development expenses include product prototypes, mask costs, external test and characterization expenses, depreciation, amortization of design tool software licenses, amortization of acquisition-related intangible assets and allocated overhead expenses. We also incur costs related to outsourced research and development activities. We expect research and development expenses to increase in absolute dollars for the foreseeable future as we continue to improve our product features, increase our portfolio of solutions and implement our CBRAM manufacturing technology in a new manufacturing facility.
Sales and Marketing. Sales and marketing expenses consist primarily of personnel-related costs for our sales, business development, marketing, and applications engineering activities, third-party sales representative
34
Table of Contents
commissions, promotional and other marketing expenses, amortization of acquisition-related intangible assets and travel expenses. We expect sales and marketing expenses to increase in absolute dollars for the foreseeable future as we continue to expand our direct sales teams, primarily in the Asia Pacific Region, and increase our marketing activities.
General and Administrative. General and administrative expenses consist primarily of personnel-related costs, consulting expenses and professional fees. Professional fees principally consist of legal, audit, tax and accounting services. We expect general and administrative expenses to increase in absolute dollars for the foreseeable future as we hire additional personnel, make improvements to our infrastructure and incur significant additional costs for the compliance requirements of operating as a public company, including higher legal, insurance and accounting expenses.
Other Income (Expense), Net
Other income (expense), net is comprised of interest income (expense) and other income (expense). Interest expense consists of interest on our outstanding debt. Other expense, net consists primarily of the change in fair value of our preferred stock warrant liability and foreign exchange gains or losses. Our foreign currency exchange gains and losses relate to transactions and asset and liability balances denominated in currencies other than the U.S. dollar. We expect our foreign currency gains and losses to continue to fluctuate in the future due to changes in foreign currency exchange rates.
Prior to our IPO, we classified our preferred stock warrants as a liability on our consolidated balance sheets and recorded changes in fair value at each balance sheet date with the corresponding change recorded as other income (expense). We recorded a final adjustment to the fair value of the warrants as of the closing of our initial public offering on October 30, 2015 and the warrants will no longer be subject to fair value accounting thereafter due to their conversion into warrants to purchase common stock.
Provision for Income Taxes
Provision for income taxes consists primarily of U.S. federal and state income taxes in the United States and income taxes in certain foreign jurisdictions in which we conduct business. We have a full valuation allowance for deferred tax assets, including net operating loss carryforwards, and tax credits related primarily to research and development. We expect to maintain this full valuation allowance for the foreseeable future.
35
Table of Contents
Results of Operations
The following table sets forth our consolidated results of operations for the periods shown:
| Year Ended December 31, | ||||||||||||
| 2015 | 2014 | 2013 | ||||||||||
| (dollars in thousands) | ||||||||||||
| Revenue |
$ | 43,259 | $ | 41,465 | $ | 49,684 | ||||||
| Cost of revenue |
24,775 | 25,532 | 29,738 | |||||||||
|
|
|
|
|
|
|
|||||||
| Gross profit |
18,484 | 15,933 | 19,946 | |||||||||
|
|
|
|
|
|
|
|||||||
| Operating expenses: |
||||||||||||
| Research and development |
12,795 | 14,410 | 15,033 | |||||||||
| Sales and marketing |
8,345 | 7,211 | 8,094 | |||||||||
| General and administrative |
3,978 | 2,356 | 2,677 | |||||||||
|
|
|
|
|
|
|
|||||||
| Total operating expenses |
25,118 | 23,977 | 25,804 | |||||||||
|
|
|
|
|
|
|
|||||||
| Loss from operations |
(6,634 | ) | (8,044 | ) | (5,858 | ) | ||||||
|
|
|
|
|
|
|
|||||||
| Other income (expense): |
||||||||||||
| Interest expense, net |
(1,115 | ) | (864 | ) | (2,731 | ) | ||||||
| Other income (expense), net |
(695 | ) | 114 | 508 | ||||||||
|
|
|
|
|
|
|
|||||||
| Total other income (expense), net |
(1,810 | ) | (750 | ) | (2,223 | ) | ||||||
|
|
|
|
|
|
|
|||||||
| Loss before provision for (benefit from) for income taxes |
(8,444 | ) | (8,794 | ) | (8,081 | ) | ||||||
| Provision for (benefit from) income taxes |
(61 | ) | 140 | 72 | ||||||||
|
|
|
|
|
|
|
|||||||
| Net loss attributable to common stockholders |
$ | (8,383 | ) | $ | (8,934 | ) | $ | (8,153 | ) | |||
|
|
|
|
|
|
|
|||||||
| Net loss per share attributable to common stockholders |
||||||||||||
| Basic and diluted |
$ | (2.79 | ) | $ | (16.48 | ) | $ | (15.14 | ) | |||
|
|
|
|
|
|
|
|||||||
| Weighted average number of shares used in computing net loss per share attributable to common stockholders |
||||||||||||
| Basic and diluted |
3,007,929 | 542,248 | 538,388 | |||||||||
|
|
|
|
|
|
|
|||||||
Comparison of Years Ended December 31, 2015, 2014 and 2013
Revenue
| Year ended December 31, | Change 2015-2014 | Change 2014-2013 | ||||||||||||||||||||||||||
| 2015 | 2014 | 2013 | Amount | % | Amount | % | ||||||||||||||||||||||
| (dollars in thousands) | ||||||||||||||||||||||||||||
| Revenue |
$ | 43,259 | $ | 41,465 | $ | 49,684 | $ | 1,794 | 4 | % | $ | (8,219 | ) | (17 | %) | |||||||||||||
| Revenue by category of products: |
||||||||||||||||||||||||||||
| Legacy Products |
3,385 | 13,006 | 43,715 | (9,621 | ) | (74 | %) | (30,709 | ) | (70 | %) | |||||||||||||||||
| New Products |
39,874 | 28,459 | 5,969 | 11,415 | 40 | % | 22,490 | 377 | % | |||||||||||||||||||
| Year Ended December 31, | ||||||||||||
| 2015 | 2014 | 2013 | ||||||||||
| (in thousands) | ||||||||||||
| United States |
$ | 8,831 | $ | 7,318 | $ | 7,679 | ||||||
| Rest of Americas |
602 | 751 | 900 | |||||||||
| Europe |
4,817 | 7,261 | 8,370 | |||||||||
| Asia Pacific |
28,711 | 25,885 | 32,467 | |||||||||
| Rest of world |
298 | 250 | 268 | |||||||||
|
|
|
|
|
|
|
|||||||
| Total |
$ | 43,259 | $ | 41,465 | $ | 49,684 | ||||||
|
|
|
|
|
|
|
|||||||
36
Table of Contents
Revenue increased by $1.8 million, or 4%, for 2015 as compared to 2014. The increase was due primarily to an increase in sales of our standard serial data flash products as well as an increase in sales to direct customers. In addition, we believe that revenue for the year ended December 31, 2014 was adversely impacted by the bankruptcy in December 2013 of one of our wafer fabrication suppliers, which as further explained below caused us to be unable to fulfill a portion of our customers’ orders in 2014 while we transitioned wafer production to a new foundry. There was no corresponding impact for the year ended December 31, 2015.
Revenue decreased by $8.2 million, or 17%, for 2014 as compared to 2013. The decrease was due primarily to a significant interruption in 2014 in our ability to supply sufficient legacy products to meet market demand as a result of the sudden declaration of bankruptcy in December 2013 by one of our wafer fabrication suppliers. Due to the bankruptcy, the supplier shut down its foundry and was unable to deliver to us wafers that were in production at that time and, therefore, we were unable to fulfill a portion of our customers’ orders in 2014 while we transitioned wafer production to a new foundry. Based on the average selling prices then in effect for those wafers, we estimate that the potential loss of revenue from sales of these legacy products exceeded $10.0 million. We believe the potential loss primarily impacted the first two quarters of 2014, as the process of transitioning our wafer production to another foundry, which began before the bankruptcy, was largely completed by the end of the first half of 2014.
Cost of Revenue and Gross Margin
| Year ended December 31, | Change 2015-2014 | Change 2014-2013 | ||||||||||||||||||||||||||
| 2015 | 2014 | 2013 | Amount | % | Amount | % | ||||||||||||||||||||||
| (dollars in thousands) | ||||||||||||||||||||||||||||
| Cost of revenue |
$ | 24,775 | $ | 25,532 | $ | 29,738 | $ | (757 | ) | (3 | %) | $ | (4,206 | ) | (14 | %) | ||||||||||||
| Gross Profit |
18,484 | 15,933 | 19,946 | 2,551 | 16 | % | (4,013 | ) | (20 | %) | ||||||||||||||||||
| Gross Margin |
43 | % | 38 | % | 40 | % | ||||||||||||||||||||||
Cost of revenue decreased by $0.8 million, or 3%, for 2015 as compared to 2014 due primarily to a decrease in inventory write-downs of $4.5 million offset by $2.8 million for additional costs paid to our third-party manufacturers for wafer fabrication, assembly and testing of our products, an increase in spending on manufacturing support activities of $0.7 million and write-downs of inventory of $0.3 million for obsolete inventories.
Gross margin increased in 2015 as compared to 2014 due primarily from increased revenues and the benefit from sale of previously written-down products.
Cost of revenue decreased by $4.2 million, or 14%, for 2014 as compared to 2013 due primarily to $5.2 million in lower costs associated with a decrease in product revenue, partially offset by a $1.1 million increase in spending on manufacturing support activities.
Gross margin decreased in 2014 as compared to 2013 due primarily to the increase in spending on manufacturing support activities allocated across lower revenue.
Operating Expenses
| Year ended December 31, | Change 2015-2014 | Change 2014-2013 | ||||||||||||||||||||||||||
| 2015 | 2014 | 2013 | Amount | % | Amount | % | ||||||||||||||||||||||
| (dollars in thousands) | ||||||||||||||||||||||||||||
| Operating expenses: |
||||||||||||||||||||||||||||
| Research and development |
$ | 12,795 | $ | 14,410 | $ | 15,033 | $ | (1,615 | ) | (11 | %) | $ | (623 | ) | (4 | %) | ||||||||||||
| Sales and marketing |
8,345 | 7,211 | 8,094 | 1,134 | 16 | % | (883 | ) | (11 | %) | ||||||||||||||||||
| General and administrative |
3,978 | 2,356 | 2,677 | 1,622 | 69 | % | (321 | ) | (12 | %) | ||||||||||||||||||
|
|
|
|
|
|
|
|
|
|
|
|||||||||||||||||||
| Total operating expenses |
$ | 25,118 | $ | 23,977 | $ | 25,804 | $ | 1,141 | 5 | % | $ | (1,827 | ) | (7 | %) | |||||||||||||
|
|
|
|
|
|
|
|
|
|
|
|||||||||||||||||||
37
Table of Contents
Research and Development. Research and development expense decreased $1.6 million in 2015 as compared to 2014, due to a $1.0 million decrease in personnel-related costs as a result of lower headcount and $0.6 million decrease in mask costs and product prototype expense due to lower product tapeout activity. Research and development expense decreased $0.6 million in 2014 as compared to 2013, due to a $0.9 million decrease in personnel-related costs associated with a reduction in headcount associated with the completion of certain development activities, partially offset by higher personnel-related costs in our international operations.
Sales and Marketing. Sales and marketing expense increased $1.1 million in 2015 as compared to 2014, primarily due to personnel-related costs associated with increased headcount. Sales and marketing expense decreased $0.9 million in 2014 as compared to 2013, due primarily to a $0.8 million increase in personnel-related costs in connection with increased headcount and a $0.2 million increase in promotional and marketing costs that was more than offset by a decrease of $2.1 million in amortization of acquisition-related intangible assets, primarily customer backlog, which had an estimated useful life of 12 months, ending September 30, 2013. As a result, there was no amortization expense related to customer backlog in 2014.
General and Administrative. General and administrative expenses increased $1.6 million in 2015 as compared to 2014, due primarily to an increase in accounting, tax, and audit expense of $0.7 million, a $0.7 million increase in personnel-related costs associated with an increase in headcount and a $0.2 million non-cash increase in rent expense related to our new facility. General and administrative expenses decreased $0.3 million in 2014 as compared to 2013, due primarily to lower consulting expenses.
Other Income (Expense), Net
| Year ended December 31, | Change 2015-2014 | Change 2014-2013 | ||||||||||||||||||||||||||
| 2015 | 2014 | 2013 | Amount | % | Amount | % | ||||||||||||||||||||||
| (dollars in thousands) | ||||||||||||||||||||||||||||
| Interest expense, net |
$ | (1,115 | ) | $ | (864 | ) | $ | (2,731 | ) | $ | (251 | ) | 29 | % | $ | 1,867 | 68 | % | ||||||||||
| Other income (expense), net |
(695 | ) | 114 | 508 | (809 | ) | (710 | %) | (394 | ) | (78 | %) | ||||||||||||||||
|
|
|
|
|
|
|
|
|
|
|
|||||||||||||||||||
| Total other income (expense), net |
$ | (1,810 | ) | $ | (750 | ) | $ | (2,223 | ) | $ | (1,060 | ) | 141 | % | $ | 1,473 | 66 | % | ||||||||||
|
|
|
|
|
|
|
|
|
|
|
|||||||||||||||||||
Interest expense, net increased $0.3 million in 2015 as compared to 2014 due to increased levels of debt outstanding. Interest expense net decreased $1.9 million in 2014, as compared to 2013, due to lower interest rates charged on lower levels of outstanding debt.
Other income (expense), net decreased $0.8 million in 2015 as compared to 2014 due primarily to a change in the fair market value of our preferred stock warrants of $0.9 million. Other income (expense), net decreased $0.4 million in 2014, as compared to 2013, due primarily to a $1.0 million change in fair value of our preferred stock warrant liability offset primarily by a decrease of $0.3 million in bank fees.
Provision for (Benefit from) Income Taxes
| Year ended December 31, | Change 2015-2014 | Change 2014-2013 | ||||||||||||||||||||||||||
| 2015 | 2014 | 2013 | Amount | % | Amount | % | ||||||||||||||||||||||
| (dollars in thousands) | ||||||||||||||||||||||||||||
| Provision for (benefit from) income taxes |
$ | (61 | ) | $ | 140 | $ | 72 | $ | (201 | ) | (144 | %) | $ | 68 | 94 | % | ||||||||||||
We recorded a benefit from income taxes in 2015 due to a reduction in tax expense related to our French subsidiary in 2015 compared to 2014.
Our provision for income taxes increased due to a higher level of taxes in a foreign jurisdiction in 2014 as compared to 2013.
38
Table of Contents
Liquidity and Capital Resources
Since inception, we have funded our operations primarily with gross proceeds from the sale of an aggregate of $78.5 million of convertible preferred stock, $22.5 million of term debt associated with the acquisition of the certain flash memory product assets from Atmel Corporation, and net proceeds from our initial public offering on October 30, 2015 of $22.1 million. Our principal source of liquidity as of December 31, 2015 consisted of cash and cash equivalents of $23.1 million. We did not have any borrowing capacity available under our credit facility as of December 31, 2015. Our outstanding borrowings under this credit facility as of December 31, 2015 were $14.0 million. Substantially all of our cash and cash equivalents are held in the United States.
We believe our existing cash and cash equivalents will be sufficient to meet our anticipated cash needs over the next 12 months. Our future capital requirements will depend on many factors, including our growth rate, the timing and extent of our spending to support research and development activities, the timing and cost of establishing additional sales and marketing capabilities, the introduction of new and enhanced products and our costs to implement new manufacturing technologies. In the event that additional financing is required from outside sources, we may not be able to raise it on terms acceptable to us or at all. Any additional debt financing obtained by us in the future could also involve restrictive covenants relating to our capital-raising activities and other financial and operational matters, which may make it more difficult for us to obtain additional capital and to pursue business opportunities, including potential acquisitions. Additionally, if we raise additional funds through further issuances of equity, convertible debt securities or other securities convertible into equity, our existing stockholders could suffer significant dilution in their percentage ownership of our company, and any new equity securities we issue could have rights, preferences and privileges senior to those of holders of our common stock. If we are unable to obtain adequate financing or financing on terms satisfactory to us, when we require it, our ability to continue to grow or support our business and to respond to business challenges could be significantly limited.
Our cash flows for the periods indicated were as follows:
| Year ended December 31, | ||||||||||||
| 2015 | 2014 | 2013 | ||||||||||
| (in thousands) | ||||||||||||
| Cash flows used in operating activities |
$ | (7,127 | ) | $ | (580 | ) | $ | (689 | ) | |||
| Cash flows provided by (used in) investing activities |
(559 | ) | (760 | ) | 1,761 | |||||||
| Cash flows provided by (used in) financing activities |
25,141 | (4,229 | ) | 10,531 | ||||||||
Cash Flows from Operating Activities
Our primary source of cash from operating activities has been from cash collections from our customers. We expect cash inflows from operating activities to be affected by increases in sales and timing of collections. Our primary uses of cash from operating activities have been for personnel costs and investments in research and development and sales and marketing. Net cash used in operating activities for the periods presented consisted of net losses adjusted for certain noncash items and changes in working capital. Within changes in working capital, changes in accounts receivable, inventory and accounts payable generally account for the largest adjustments, as we typically use more cash to fund accounts receivable and build inventory as our business grows. Increases in accounts payable typically provides more cash as we do more business with our contract foundries and other third parties, depending on the timing of payments.
During the year ended December 31, 2015, cash used in operating activities was $7.1 million, primarily due to a net loss of $8.4 million, partially offset by non-cash charges of $4.9 million, primarily depreciation and amortization and stock-based compensation, and a net change in our net operating assets and liabilities of $3.6 million. The change in our net operating assets and liabilities was primarily due to a $4.5 million increase in accounts receivable due to the timing of revenue during the fourth quarter of 2015 and a $1.0 million increase in prepaid expenses and other current assets partially offset by a $1.9 million increase in accounts payable.
39
Table of Contents
During the year ended December 31, 2014, cash used in operating activities was $0.6 million, primarily due to a net loss of $8.9 million, partially offset by non-cash charges of $3.2 million, primarily depreciation and amortization and stock-based compensation, and a net change in our net operating assets and liabilities of $5.2 million. The change in our net operating assets and liabilities was primarily due to a $2.9 million decrease in inventory and a $2.9 million decrease in accounts receivable reflecting lower levels of revenue and a $0.8 million decrease in prepaid expenses and other current assets partially offset by a $1.2 million decrease in accounts payable primarily attributable to a reduction in wafer and other inventory purchases and timing of payments.
During the year ended December 31, 2013, cash used in operating activities was $0.7 million, primarily from a net loss of $8.2 million, non-cash charges of $4.4 million primarily related to depreciation and amortization, amortization of debt discount, and stock based compensation and a net increase in our net operating assets and liabilities of $3.0 million. The change in our net operating assets and liabilities was primarily due to a $6.5 million increase in accounts payable primarily attributable to inventory purchases and timing of payments, a $0.7 million increase in employee-related liabilities, and a decrease of $3.2 million in accounts receivable reflecting higher cash collections from customers partially offset by a $5.2 million increase in inventory in support of higher sales and a $2.0 million decrease in accrued expenses and other liabilities.
Cash Flows from Investing Activities
Our investing activities consist primarily of purchases of property and equipment. We expect to continue to make significant capital expenditures to support continued growth of our business. During the year ended December 31, 2015, cash used in investing activities was $0.6 million related primarily to the purchase of equipment. During the year ended December 31, 2014, cash used in investing activities was $0.8 million related primarily to the purchase of equipment. During the year ended December 31, 2013, cash provided by investing activities was $1.8 million, related to the increase in restricted cash of $4.0 million, partially offset by purchase of equipment of $2.2 million.
Cash Flows from Financing Activities
Cash flows from financing activities primarily include net proceeds from issuance of convertible preferred stock, proceeds and payments related to our term loans and our credit facilities, as well as the net proceeds from our IPO on October 30, 2015.
During the year ended December 31, 2015, cash provided by financing activities was $25.1 million, due primarily to $22.1 million received from the net proceeds from our IPO and $15.0 million from our term loan with Opus Bank, partially offset by payments of $11.9 million on our loans with both Bridge Bank and Opus Bank.
During the year ended December 31, 2014, cash used in financing activities was $4.2 million, due primarily to $6.9 million in principal payments on outstanding borrowings offset by proceeds of $2.7 million from additional borrowings under our prior credit facility.
During the year ended December 31, 2013, cash provided by financing activities was $10.5 million, consisting of $17.4 million in net proceeds from issuance of convertible notes payable, convertible preferred stock and exercises of stock options, and $14.9 million in proceeds from a new term loan facility, offset by $21.7 million in principal payments on loan obligations.
Off Balance Sheet Arrangements
During the periods presented, we did not have any relationships with unconsolidated entities or financial partnerships, such as entities often referred to as structured finance or special purpose entities, which would have been established for the purpose of facilitating off balance sheet arrangements or other contractually narrow or limited purpose.
40
Table of Contents
Credit Facility
In April 2015, we entered into a three-year $15.0 million credit agreement, or the new term loan facility, which replaced our prior senior secured revolving credit and term loan facility. The agreement provides for a senior secured term loan facility, in an aggregate principal amount of up to $15.0 million to be used for general corporate purposes including working capital, to repay certain indebtedness and for capital expenditures and other expenses. Interest will accrue on any outstanding borrowings at a rate equal to (a) the higher of (i) the prime rate (as publicly announced from time to time by the Wall Street Journal) and (ii) 3.25% plus (b) (i) 1.00% if our cash and cash equivalents are greater than 125% of the outstanding principal of our borrowings under the new term loan facility, or (ii) 2.00% if our cash and cash equivalents are less than or equal to 125% of such borrowings. Indebtedness we incur under this agreement is secured by substantially all of our assets and contains financial covenants requiring us to maintain a monthly asset coverage ratio after September 30, 2015 of not less than 1.10 to 1.00, and quarterly adjusted EBITDA (measured on a trailing three-month basis) of $1 through March 31, 2016 and increasing to higher levels thereafter. This quarterly EBITDA covenant is removed if the asset coverage ratio is met at all times during any particular quarter. The agreement contains customary affirmative and negative covenants, including covenants that limit or restrict our ability to, among other things, incur additional indebtedness, grant liens, make investments, repurchase stock, pay dividends, transfer assets, merge or consolidate and make acquisitions. Upon an occurrence of an event of default, we could be required to pay interest on all outstanding obligations under the agreement at a rate of five percent above the otherwise applicable interest rate, and the lender may accelerate our obligations under the agreement. As of December 31, 2015, we were in compliance with all financial covenants and restrictions and had gross borrowings of $14.0 million outstanding. We may not draw additional funds under the new term loan facility and our borrowings mature on April 30, 2018.
Contractual Obligations and Commitments
The following is a summary of our contractual obligations and commitments as of December 31, 2015:
| Payments due by period | ||||||||||||||||||||
| Contractual Obligations | Total | Less than 1 year | 1 – 3 Years | 4 – 5 Years | More than 5 Years | |||||||||||||||
| (in thousands) | ||||||||||||||||||||
| Operating leases (1) |
$ | 9,054 | $ | 856 | $ | 3,543 | $ | 2,536 | $ | 2,119 | ||||||||||
| Inventory -related commitments (2) |
2,928 | 2,928 | — | — | — | |||||||||||||||
| Financing arrangements (3) |
14,000 | 6,000 | 8,000 | — | — | |||||||||||||||
| Capital leases (4) |
18 | 18 | — | — | — | |||||||||||||||
|
|
|
|
|
|
|
|
|
|
|
|||||||||||
| Total contractual cash obligations |
$ | 26,000 | $ | 9,802 | $ | 11,543 | $ | 2,536 | $ | 2,119 | ||||||||||
|
|
|
|
|
|
|
|
|
|
|
|||||||||||
| (1) | Operating leases primarily relate to our leases of office space with terms expiring through July 31, 2023. |
| (2) | Represents outstanding purchase orders for wafer commitments that we have placed with our suppliers as of December 31, 2015. |
| (3) | Financing arrangements represent debt maturities under our term loan. |
| (4) | Capital lease obligations relate to the lease of certain equipment with terms that expire in 2016. |
As of December 31, 2015 we had a liability of $11,000 for uncertain tax positions.
Internal Control Over Financial Reporting
Our management and independent registered public accounting firm did not and were not required to perform an evaluation of our internal control over financial reporting as of and for the years ended December 31, 2015, 2014, and 2013 in accordance with the provisions of the JOBS Act.
41
Table of Contents
| ITEM 7A. | Quantitative and Qualitative Disclosures about Market Risk |
We are exposed to market risks in the ordinary course of our business. These risks primarily include foreign exchange rate and interest rate sensitivities as follows:
Foreign Currency Risk
Our results of operations and cash flows are subject to fluctuations due to changes in foreign currency exchange rates.
The majority of our revenue is denominated in U.S. dollars. Our expenses are generally denominated in the currencies in which our operations are located, which is primarily in the United States and to a lesser extent in EMEA and APAC. Our results of operations and cash flows are, therefore, subject to fluctuations due to changes in foreign currency exchange rates and may be adversely affected in the future due to changes in foreign exchange rates. The effect of a hypothetical 10% change in foreign currency exchanges rates applicable to our business would not have a material impact on our historical consolidated financial statements.
We have not hedged exposures denominated in foreign currencies or used any other derivative financial instruments. Although we transact the substantial majority of our business in U.S. dollars, future fluctuations in the value of the U.S. dollar may affect the competitiveness of our products and thus may impact our results of operations and cash flows.
Interest Rate Sensitivity
We had cash and cash equivalents of $23.1 million as of December 31, 2015, consisting of bank deposits and money market funds. Such interest-earning instruments carry a degree of interest rate risk. To date, fluctuations in interest income have not been significant. We also had total outstanding gross debt of $14.0 million offset by a debt discount of $0.6 million, as of December 31, 2015. The outstanding debt relates to a term loan described in section entitled “Management’s Discussion and Analysis of Financial Condition and Results Of Operations – Credit Facility.”
We do not enter into investments for trading or speculative purposes and have not used any derivative financial instruments to manage our interest rate risk exposure. We have not been exposed to, nor do we anticipate being exposed to, material risks due to changes in interest rates. Our exposure to interest rates relates to the change in the amounts of interest we must pay on our variable rate borrowings. A hypothetical 10% increase in our borrowing rates would not have a material impact on interest expense on our principal balances as of December 31, 2015.
Critical Accounting Policies and Estimates
During year ended December 31, 2015 there were no significant changes to our critical accounting policies and estimates as described in financial statements contained in our prospectus dated October 26, 2015 and filed with the SEC pursuant to Rule 424(b) under the Securities Act with the SEC on October 27, 2015.
Our consolidated financial statements and the related notes are prepared in accordance with GAAP. The preparation of our consolidated financial statements requires us to make estimates and assumptions that affect the reported amounts of our assets, liabilities, revenue, costs and expenses and related disclosures. We base our estimates on our historical experience and various other assumptions that we believe are reasonable under the circumstances. Our actual results could differ materially from these estimates. To the extent that there are material differences between our estimates and our actual results, our future financial statements will be affected.
The critical accounting policies involving judgments and estimate that we believe have the most impact on our consolidated financial statements are discussed below.
42
Table of Contents
Revenue Recognition
We recognize revenue from product sales when persuasive evidence of an arrangement exists, the selling price is fixed or determinable, transfer of title occurs, and the collectibility of the resulting receivable is reasonably assured. Due to the historical immaterial level of product returns under warranty, we do not record a reserve for estimated returns under warranty.
Generally, we meet these conditions upon shipment because, in most cases, title and risk of loss passes to the customer at that time. In addition, we estimate and record provisions for future returns and other charges against revenue at the time of shipment, consistent with the terms of sale. We sell products to distributors at the price listed in our distributor price book. At the time of sale we record a sales reserve for ship from stock and debits, or SSDs, stock rotation rights and any special programs approved by management. We offset the sales reserve against revenue, producing the revenue amount reported in the consolidated statements of operations.
The market price for our products can be significantly different from the book price at which we sold the product to a distributor. When the market price, as compared to our original book price, of a particular distributor’s sales opportunity to their customers would result in low or negative margins for our distributor, we negotiate SSDs with the distributor. Our management analyzes our SSD history to develop current SSD rates that form the basis of the SSD revenue reserve recorded each period. We obtain the historical SSD rates from our distributor’s records and our internal records.
We typically grant payment terms of between 30 and 60 days to our customers. Our customers generally pay within those terms. Distributors are invoiced for shipments at listed book price. When the distributors pay the invoice, they may claim debits for SSDs previously authorized by us when appropriate. Once claimed, we process the requests against prior authorizations and reduce reserves previously established for that customer.
The revenue we record for sales to our distributors is net of estimated provisions for these programs. When determining this net revenue, we must make significant judgments and estimates. We base our estimates on historical experience rates, the levels of inventory held by our distributors, current trends and other related factors. However, because of the inherent nature of estimates, there is a risk that there could be significant differences between actual amounts and our estimates. Our consolidated financial condition and operating results depend on our ability to make reliable estimates and we believe that such estimates are reasonable.
Inventories
We record inventories at the lower of standard cost (which generally approximates actual cost on a first-in, first-out basis) or market value. The carrying value of inventory is adjusted for excess and obsolete inventory based on inventory age, shipment history and the forecast of demand over a specific future period. At the point of loss recognition, a new lower cost basis for that inventory is established and subsequent changes in facts and circumstances do not result in the restoration or increase in that new cost basis. The semiconductor markets that we serve are volatile and actual results may vary from forecast or other assumptions, potentially affecting our assessment of excess and obsolete inventory which could have a material effect on our results of operations.
Accounting for Income Taxes
We account for income taxes using an asset and liability approach, which requires recognition of deferred tax assets and liabilities for the expected future tax consequences of events that have been recognized in the consolidated financial statements, but have not been reflected in our taxable income. Valuation allowances are established to reduce deferred tax assets as necessary when in management’s estimate, based on available objective evidence, it is more likely than not that we will not generate sufficient taxable income in future periods to realize the benefit of our deferred tax assets. We include interest and penalties related to unrecognized tax benefits in income tax expense. We recognize in our consolidated financial statements the impact of a tax position that based on its technical merits is more likely than not to be sustained upon examination. The valuation allowance as of December 31, 2015 was approximately $32.8 million.
43
Table of Contents
Stock-based Compensation
Stock-based compensation costs related to stock options granted to employees are measured at the date of grant based on the estimated fair value of the award, net of estimated forfeitures. We estimate the grant date fair value, and the resulting stock-based compensation expense, using the Black-Scholes option-pricing model. We recognize compensation costs for awards with service and performance vesting conditions on an accelerated method under the graded vesting method over the requisite service period of the award. For stock options with no performance condition, we recognize compensation costs on a straight-line basis over the requisite service period of the award, which is generally the vesting term of four years.
The Black-Scholes option-pricing model requires the use of highly subjective assumptions which determine the fair value of stock-based awards.
The assumptions used in our option-pricing model represent management’s best estimates. These estimates are complex, involve a number of variables, uncertainties and assumptions and the application of management’s judgment, so that they are inherently subjective. If factors change and different assumptions are used, our stock-based compensation expense could be materially different in the future.
These assumptions are estimated as follows:
| • | Fair Value of Common Stock. Prior to our IPO in October 2015, we estimated the fair value of our common stock using various valuation methodologies, including valuation analyses performed by third-party valuation firms. After the initial public offering, we used the publicly quoted price as the fair value of our common stock. |
| • | Risk-Free Interest Rate. We base the risk-free interest rate used in the Black-Scholes option-pricing model on the implied yield available on U.S. Treasury zero-coupon issues with an equivalent remaining term of the options for each option group. |
| • | Expected Term. The expected term represents the period that our stock-based awards are expected to be outstanding. Because of the limitations on the sale or transfer or our common stock as a privately held company, we do not believe our historical exercise pattern is indicative of the pattern we will experience as a publicly traded company. We have consequently used the Staff Accounting Bulletin, or SAB 110, Simplified Method to calculate the expected term, which is the average of the contractual term and vesting period. We plan to continue to use the SAB 110 Simplified Method until we have sufficient trading history as a publicly traded company. |
| • | Volatility. We determine the price volatility factor based on the historical volatilities of our peer group as we did not have a sufficient trading history for our common stock. Industry peers consist of several public companies in the technology industry that provide similar services with comparable characteristics including enterprise value, risk profiles and position within the industry. We intend to continue to consistently apply this process using the same or similar public companies until a sufficient amount of historical information regarding the volatility of our own common stock share price becomes available, or unless circumstances change such that the identified companies are no longer similar to us, in which case, more suitable companies whose share prices are publicly available would be utilized in the calculation. |
| • | Dividend Yield. The expected dividend assumption is based on our current expectations about our anticipated dividend policy. We currently do not expect to issue any dividends. |
In addition to assumptions used in the Black-Scholes option-pricing model, we must also estimate a forfeiture rate to calculate the stock-based compensation for our awards. We will continue to use judgment in evaluating the assumptions related to our stock-based compensation on a prospective basis. As we continue to accumulate additional data, we may have refinements to our estimates, which could materially impact our future stock-based compensation expense.
44
Table of Contents
We estimate the fair value of the restricted stock units, or RSUs, using the closing market price of our common stock on the date of grant. Our initial grants of RSUs typically vest over a two-year period.
The fair value of the employee stock options was estimated using the following assumptions for the periods presented:
| Year Ended December 31, | ||||||||||||
| 2015 | 2014 | 2013 | ||||||||||
| Volatility |
40 | % | 67 | % | 63 | % | ||||||
| Expected dividend yield |
— | — | — | |||||||||
| Risk-free rate |
1.59 | % | 1.84 | % | 1.06 | % | ||||||
| Expected term (in years) |
5 | 6 | 6 | |||||||||
For the years ended December 31, 2015, 2014 and 2013, stock-based compensation expense was $0.8 million, $0.2 million and $0.2 million respectively. As of December 31, 2015, we had approximately $0.6 million of total unrecognized compensation expense related to stock options, net of related forfeiture estimates, which we expect to recognize over a weighted-average period of approximately 2 years. The intrinsic value of all outstanding options as of December 31, 2015 was $4.2 million based on the market price of our common stock of $7.71 per share. As of December 31, 2015 the total unrecognized compensation cost related to RSU’s and ESPP was $4.8 million and $0.1 million, respectively, and these amounts are expected to be recognized over 1.8 years and 0.5 years, respectively.
45
Table of Contents
| ITEM 8. | FINANCIAL STATEMENTS AND SUPPLEMENTARY DATA |
INDEX TO CONSOLIDATED FINANCIAL STATEMENTS
| Page | ||||
| 47 | ||||
| 48 | ||||
| 49 | ||||
| 50 | ||||
| Consolidated Statements of Convertible Preferred Stock and Stockholders’ Equity (Deficit) |
51 | |||
| 52 | ||||
| 53 | ||||
46
Table of Contents
REPORT OF INDEPENDENT REGISTERED PUBLIC ACCOUNTING FIRM
To the Board of Directors and Stockholders of
Adesto Technologies Corporation
We have audited the accompanying consolidated balance sheets of Adesto Technologies Corporation and its subsidiaries (the “Company”) as of December 31, 2015 and 2014, and the related consolidated statements of operations, comprehensive loss, convertible preferred stock and stockholders’ equity (deficit) and cash flows for each of the three years in the period ended December 31, 2015. These consolidated financial statements are the responsibility of the Company’s management. Our responsibility is to express an opinion on these consolidated financial statements based on our audits.
We conducted our audits in accordance with the standards of the Public Company Accounting Oversight Board (United States). Those standards require that we plan and perform the audit to obtain reasonable assurance about whether the financial statements are free of material misstatement. The Company is not required to have, nor were we engaged to perform, an audit of the Company’s internal control over financial reporting. Our audits included consideration of internal control over financial reporting as a basis for designing audit procedures that are appropriate in the circumstances, but not for the purpose of expressing an opinion on the effectiveness of the Company’s internal control over financial reporting. Accordingly, we express no such opinion. An audit also includes examining, on a test basis, evidence supporting the amounts and disclosures in the financial statements, assessing the accounting principles used and significant estimates made by management, as well as evaluating the overall financial statement presentation. We believe that our audits provide a reasonable basis for our opinion.
In our opinion, the consolidated financial statements referred to above present fairly, in all material respects, the financial position of Adesto Technologies Corporation and its subsidiaries as of December 31, 2015 and 2014, and the results of their operations and their cash flows for each of the three years in the period ended December 31, 2015 in conformity with accounting principles generally accepted in the United States of America.
/s/ Burr Pilger Mayer, Inc.
San Jose, California
March 30, 2016
47
Table of Contents
ADESTO TECHNOLOGIES CORPORATION
CONSOLIDATED BALANCE SHEETS
(in thousands, except share and per share data)
| December 31, | ||||||||
| 2015 | 2014 | |||||||
| Assets |
||||||||
| Current assets: |
||||||||
| Cash and cash equivalents |
$ | 23,089 | $ | 5,972 | ||||
| Accounts receivable, net |
6,536 | 1,994 | ||||||
| Inventories |
7,368 | 7,453 | ||||||
| Prepaid expenses |
1,155 | 239 | ||||||
| Deferred tax asset, current |
— | 291 | ||||||
| Other current assets |
1,186 | 1,095 | ||||||
|
|
|
|
|
|||||
| Total current assets |
39,334 | 17,044 | ||||||
| Property and equipment, net |
909 | 1,725 | ||||||
| Deferred tax assets, non-current |
— | 1,861 | ||||||
| Intangible assets, net |
9,559 | 10,795 | ||||||
| Other non-current assets |
114 | — | ||||||
| Goodwill |
22 | 22 | ||||||
|
|
|
|
|
|||||
| Total assets |
$ | 49,938 | $ | 31,447 | ||||
|
|
|
|
|
|||||
| Liabilities, Convertible Preferred Stock and Stockholders’ Equity (Deficit) |
||||||||
| Current liabilities: |
||||||||
| Revolving line of credit |
$ | — | $ | 4,273 | ||||
| Accounts payable |
9,680 | 7,814 | ||||||
| Income taxes payable |
52 | 134 | ||||||
| Accrued compensation and benefits |
893 | 877 | ||||||
| Accrued expenses and other current liabilities |
1,413 | 1,334 | ||||||
| Deferred tax liability, current |
— | 726 | ||||||
| Term loan, current |
5,606 | 6,476 | ||||||
|
|
|
|
|
|||||
| Total current liabilities |
17,644 | 21,634 | ||||||
| Preferred stock warrant liability |
— | 122 | ||||||
| Term loan, non-current |
7,814 | — | ||||||
| Deferred tax liability, non-current |
1 | 1,453 | ||||||
| Other liabilities, non-current |
— | 23 | ||||||
|
|
|
|
|
|||||
| Total liabilities |
25,459 | 23,232 | ||||||
|
|
|
|
|
|||||
| Commitments and contingencies (See Note 7) |
||||||||
| Convertible preferred stock: |
||||||||
| Convertible preferred stock, no par value, no shares and 4,653,586 shares authorized as of December 31, 2015 and 2014; no shares and 4,419,853 shares issued and outstanding as of December 31, 2015 and 2014. |
— | 78,467 | ||||||
|
|
|
|
|
|||||
| Stockholders’ equity (deficit): |
||||||||
| Preferred stock, no par value, 5,000,000 and no shares authorized as of December 31, 2015 and 2014; no shares issued and outstanding as of December 31, 2015 and 2014 |
— | — | ||||||
| Common stock, $0.0001 par value, 100,000,000 and 6,666,666 shares authorized as of December 31, 2015 and 2014, respectively; 14,974,718 and 559,554 shares issued and outstanding as of December 31, 2015 and 2014, respectively |
2 | — | ||||||
| Additional paid-in capital |
107,167 | 3,912 | ||||||
| Accumulated other comprehensive loss |
(146 | ) | (3 | ) | ||||
| Accumulated deficit |
(82,544 | ) | (74,161 | ) | ||||
|
|
|
|
|
|||||
| Total stockholders’ equity (deficit) |
24,479 | (70,252 | ) | |||||
|
|
|
|
|
|||||
| Total liabilities, convertible preferred stock and stockholders’ equity (deficit) |
$ | 49,938 | $ | 31,447 | ||||
|
|
|
|
|
|||||
See accompanying Notes to Consolidated Financial Statements
48
Table of Contents
ADESTO TECHNOLOGIES CORPORATION
CONSOLIDATED STATEMENTS OF OPERATIONS
(in thousands, except share and per share data)
| Year Ended December 31, | ||||||||||||
| 2015 | 2014 | 2013 | ||||||||||
| Revenue |
$ | 43,259 | $ | 41,465 | $ | 49,684 | ||||||
| Cost of revenue |
24,775 | 25,532 | 29,738 | |||||||||
|
|
|
|
|
|
|
|||||||
| Gross profit |
18,484 | 15,933 | 19,946 | |||||||||
|
|
|
|
|
|
|
|||||||
| Operating expenses: |
||||||||||||
| Research and development |
12,795 | 14,410 | 15,033 | |||||||||
| Sales and marketing |
8,345 | 7,211 | 8,094 | |||||||||
| General and administrative |
3,978 | 2,356 | 2,677 | |||||||||
|
|
|
|
|
|
|
|||||||
| Total operating expenses |
25,118 | 23,977 | 25,804 | |||||||||
|
|
|
|
|
|
|
|||||||
| Loss from operations |
(6,634 | ) | (8,044 | ) | (5,858 | ) | ||||||
|
|
|
|
|
|
|
|||||||
| Other income (expense): |
||||||||||||
| Interest expense, net |
(1,115 | ) | (864 | ) | (2,731 | ) | ||||||
| Other income (expense), net |
(695 | ) | 114 | 508 | ||||||||
|
|
|
|
|
|
|
|||||||
| Total other income (expense), net |
(1,810 | ) | (750 | ) | (2,223 | ) | ||||||
|
|
|
|
|
|
|
|||||||
| Loss before provision for (benefit from) for income taxes |
(8,444 | ) | (8,794 | ) | (8,081 | ) | ||||||
| Provision for (benefit from) income taxes |
(61 | ) | 140 | 72 | ||||||||
|
|
|
|
|
|
|
|||||||
| Net loss |
$ | (8,383 | ) | $ | (8,934 | ) | $ | (8,153 | ) | |||
|
|
|
|
|
|
|
|||||||
| Net loss per share |
||||||||||||
| Basic and diluted |
$ | (2.79 | ) | $ | (16.48 | ) | $ | (15.14 | ) | |||
|
|
|
|
|
|
|
|||||||
| Weighted average number of shares used in computing net loss per share |
||||||||||||
| Basic and diluted |
3,007,929 | 542,248 | 538,388 | |||||||||
|
|
|
|
|
|
|
|||||||
See accompanying Notes to Consolidated Financial Statements
49
Table of Contents
ADESTO TECHNOLOGIES CORPORATION
CONSOLIDATED STATEMENTS OF COMPREHENSIVE LOSS
(in thousands)
| Year Ended December 31, | ||||||||||||
| 2015 | 2014 | 2013 | ||||||||||
| Net loss |
$ | (8,383 | ) | $ | (8,934 | ) | $ | (8,153 | ) | |||
| Other comprehensive income (loss), net of tax: |
||||||||||||
| Foreign currency translation adjustment |
(143 | ) | 63 | (58 | ) | |||||||
|
|
|
|
|
|
|
|||||||
| Comprehensive loss, net of tax |
$ | (8,526 | ) | $ | (8,871 | ) | $ | (8,211 | ) | |||
|
|
|
|
|
|
|
|||||||
See accompanying Notes to Consolidated Financial Statements
50
Table of Contents
ADESTO TECHNOLOGIES CORPORATION
CONSOLIDATED STATEMENTS OF CONVERTIBLE PREFERRED STOCK AND
STOCKHOLDERS’ EQUITY (DEFICIT)
(in thousands, except share data)
| Stockholders’ Equity (Deficit) | ||||||||||||||||||||||||||||||||||
| Accumulated | ||||||||||||||||||||||||||||||||||
| Additional | Other | Total | ||||||||||||||||||||||||||||||||
| Convertible Preferred Stock | Common Stock | Paid-In | Comprehensive | Accumulated | Stockholders’ | |||||||||||||||||||||||||||||
| Shares | Amount | Shares | Amount | Capital | Loss | Deficit | Equity (Deficit) | |||||||||||||||||||||||||||
| Balances as of December 31, 2012 |
3,648,741 | $ | 60,366 | 536,763 | $ | — | $ | 3,462 | $ | (8 | ) | $ | (57,074 | ) | $ | (53,620 | ) | |||||||||||||||||
| Issuance of convertible preferred stock, net of exchange of liability due to investors |
771,112 | 18,101 | — | — | — | — | — | — | ||||||||||||||||||||||||||
| Options exercised |
— | — | 2,393 | — | 6 | — | — | 6 | ||||||||||||||||||||||||||
| Stock-based compensation |
— | — | — | — | 164 | — | — | 164 | ||||||||||||||||||||||||||
| Foreign currency translation adjustments |
— | — | — | — | — | (58 | ) | — | (58 | ) | ||||||||||||||||||||||||
| Net loss |
— | — | — | — | — | — | (8,153 | ) | (8,153 | ) | ||||||||||||||||||||||||
|
|
|
|
|
|
|
|
|
|
|
|
|
|
|
|
|
|||||||||||||||||||
| Balances as of December 31, 2013 |
4,419,853 | 78,467 | 539,156 | — | 3,632 | (66 | ) | (65,227 | ) | (61,661 | ) | |||||||||||||||||||||||
| Options exercised |
— | — | 20,398 | — | 34 | — | — | 34 | ||||||||||||||||||||||||||
| Stock-based compensation |
— | — | — | — | 246 | — | — | 246 | ||||||||||||||||||||||||||
| Foreign currency translation adjustments |
— | — | — | — | — | 63 | — | 63 | ||||||||||||||||||||||||||
| Net loss |
— | — | — | — | — | — | (8,934 | ) | (8,934 | ) | ||||||||||||||||||||||||
|
|
|
|
|
|
|
|
|
|
|
|
|
|
|
|
|
|||||||||||||||||||
| Balances as of December 31, 2014 |
4,419,853 | $ | 78,467 | 559,554 | — | 3,912 | (3 | ) | (74,161 | ) | (70,252 | ) | ||||||||||||||||||||||
| Proceeds from initial public offering, net of issuance costs |
— | — | 5,192,184 | 1 | 22,100 | — | — | 22,101 | ||||||||||||||||||||||||||
| Conversion of convertible preferred stock upon completion of initial public offering |
(4,419,853 | ) | (78,467 | ) | 9,114,739 | 1 | 78,466 | — | — | 78,467 | ||||||||||||||||||||||||
| Reclassification of warrant liability to additional paid-in capital upon closing of initial public offering |
— | — | 1,892 | — | — | 1,892 | ||||||||||||||||||||||||||||
| Cashless exercise of common stock warrants upon completing of initial public offering |
— | — | 102,289 | — | — | — | — | — | ||||||||||||||||||||||||||
| Options exercised |
— | — | 5,952 | — | 10 | — | — | 10 | ||||||||||||||||||||||||||
| Stock-based compensation |
— | — | — | — | 787 | — | — | 787 | ||||||||||||||||||||||||||
| Foreign currency translation adjustments |
— | — | — | — | — | (143 | ) | — | (143 | ) | ||||||||||||||||||||||||
| Net loss |
— | — | — | — | — | — | (8,383 | ) | (8,383 | ) | ||||||||||||||||||||||||
|
|
|
|
|
|
|
|
|
|
|
|
|
|
|
|
|
|||||||||||||||||||
| Balances as of December 31, 2015 |
— | $ | — | 14,974,718 | $ | 2 | $ | 107,167 | $ | (146 | ) | $ | (82,544 | ) | $ | 24,479 | ||||||||||||||||||
|
|
|
|
|
|
|
|
|
|
|
|
|
|
|
|
|
|||||||||||||||||||
See accompanying Notes to Consolidated Financial Statements
51
Table of Contents
ADESTO TECHNOLOGIES CORPORATION
CONSOLIDATED STATEMENTS OF CASH FLOWS
(in thousands)
| Year Ended December 31, | ||||||||||||
| 2015 | 2014 | 2013 | ||||||||||
| Cash flows from operating activities: |
||||||||||||
| Net loss |
$ | (8,383 | ) | $ | (8,934 | ) | $ | (8,153 | ) | |||
| Adjustments to reconcile net loss to net cash used in operating activities: |
||||||||||||
| Stock-based compensation expense |
787 | 246 | 164 | |||||||||
| Depreciation and amortization |
1,453 | 1,780 | 1,071 | |||||||||
| Amortization of intangible assets |
1,236 | 1,236 | 3,320 | |||||||||
| Amortization of debt discount |
504 | 115 | 1,071 | |||||||||
| Deferred income taxes |
(26 | ) | 14 | 13 | ||||||||
| Changes in fair value of preferred stock warrant liability |
907 | (206 | ) | (1,200 | ) | |||||||
| Changes in assets and liabilities: |
||||||||||||
| Accounts receivable |
(4,542 | ) | 2,894 | 3,161 | ||||||||
| Inventories |
85 | 2,922 | (5,199 | ) | ||||||||
| Prepaid expenses and other current assets |
(1,004 | ) | 760 | (170 | ) | |||||||
| Accounts payable |
1,866 | (1,236 | ) | 6,512 | ||||||||
| Accrued compensation and benefits |
(42 | ) | (330 | ) | 715 | |||||||
| Accrued expenses and other liabilities |
32 | 159 | (1,994 | ) | ||||||||
|
|
|
|
|
|
|
|||||||
| Net cash used in operating activities |
(7,127 | ) | (580 | ) | (689 | ) | ||||||
|
|
|
|
|
|
|
|||||||
| Cash flows from investing activities |
||||||||||||
| Acquisition of property and equipment |
(559 | ) | (760 | ) | (2,239 | ) | ||||||
| Change in restricted cash |
— | — | 4,000 | |||||||||
|
|
|
|
|
|
|
|||||||
| Net cash provided by (used in) investing activities |
(559 | ) | (760 | ) | 1,761 | |||||||
|
|
|
|
|
|
|
|||||||
| Cash flows from financing activities |
||||||||||||
| Proceeds from initial public offering, net of issuance costs |
22,101 | — | — | |||||||||
| Proceeds from issuance of common stock from stock option exercises |
10 | 34 | 6 | |||||||||
| Proceeds from issuance of convertible preferred stock, net of issuance costs |
— | — | 12,365 | |||||||||
| Proceeds from convertible notes payable |
— | — | 5,000 | |||||||||
| Proceeds from term loan, net |
14,903 | — | 8,910 | |||||||||
| Proceeds from revolving line of credit |
— | 2,660 | 5,980 | |||||||||
| Payments on revolving line of credit |
(4,273 | ) | (4,462 | ) | — | |||||||
| Payments on term loan |
(7,600 | ) | (2,461 | ) | (21,730 | ) | ||||||
|
|
|
|
|
|
|
|||||||
| Net cash provided by (used in) financing activities |
25,141 | (4,229 | ) | 10,531 | ||||||||
|
|
|
|
|
|
|
|||||||
| Effect of exchange rates on cash and cash equivalents |
(338 | ) | (39 | ) | (23 | ) | ||||||
|
|
|
|
|
|
|
|||||||
| Net increase (decrease) in cash and cash equivalents |
17,117 | (5,608 | ) | 11,580 | ||||||||
| Cash and cash equivalents - beginning of period |
5,972 | 11,580 | — | |||||||||
|
|
|
|
|
|
|
|||||||
| Cash and cash equivalents - end of period |
$ | 23,089 | $ | 5,972 | $ | 11,580 | ||||||
|
|
|
|
|
|
|
|||||||
| Supplemental disclosures of other cash flow information: |
||||||||||||
| Cash paid for interest expense |
$ | 521 | $ | 760 | $ | 1,983 | ||||||
| Noncash investing and financing activities: |
||||||||||||
| Conversion of convertible notes payable to Series D-1 convertible preferred stock, including interest |
$ | — | $ | — | $ | 5,236 | ||||||
| Release of liability in conjunction with exercise of preferred stock warrant |
$ | — | $ | — | $ | 500 | ||||||
| Acquisition of property and equipment under capital leases |
$ | — | $ | — | $ | 113 | ||||||
| Issuance of preferred stock warrants in connection with term loan |
$ | 863 | $ | 66 | $ | 619 | ||||||
| Conversion of convertible preferred stock to common stock |
$ | 78,467 | $ | — | $ | — | ||||||
| Reclassification of warrant liability to additional paid-in-capital upon closing of initial public offering |
$ | 1,892 | $ | — | $ | — | ||||||
See accompanying Notes to Consolidated Financial Statements
52
Table of Contents
ADESTO TECHNOLOGIES CORPORATION
NOTES TO CONSOLIDATED FINANCIAL STATEMENTS
Note 1. Organization and Summary of Significant Accounting Policies
Organization and Nature of Operations.
Adesto Technologies Corporation (together with its subsidiaries; “Adesto”, “we”, “our”, “us” or the “Company”) was incorporated in the state of California in January 2006 and reincorporated in Delaware in October 2015. We are a leading provider of application-specific and ultra-low power non-volatile memory (“NVM”) products. Our corporate headquarters are located in Sunnyvale, California.
On September 28, 2012, we purchased certain flash memory product assets from Atmel Corporation and our financial results include the operating results of those assets from the date of acquisition.
The Company completed its initial public offering (“IPO”) of common stock on October 30, 2015. The Company sold 5,192,184 shares, including 192,184 shares for the underwriters’ option to purchase additional shares. The shares were sold at an initial public offering price of $5.00 per share for net proceeds of $22.1 million to the Company, after deducting underwriting discounts and commissions and offering expenses.
Basis of Presentation.
The consolidated financial statements include the results of our operations, and the operations of our wholly owned subsidiaries. All intercompany balances and transactions have been eliminated.
Reverse Stock Split.
On October 1, 2015, we effected a 1-for-33 reverse stock split of our common stock and convertible preferred stock (collectively, “Capital Stock”). On the effective date of the reverse stock split, (i) each 33 shares of outstanding Capital Stock were reduced to one share of Capital Stock; (ii) the number of shares of Capital Stock into which each outstanding warrant or option to purchase Capital Stock is exercisable were proportionately reduced on a 33-to-1 basis; (iii) the exercise price of each outstanding warrant or option to purchase Capital Stock were proportionately increased on a 1-to-33 basis; and (iv) each 33 shares of authorized Capital Stock were reduced to one share of Capital Stock. All of the share numbers, share prices, and exercise prices have been adjusted, on a retroactive basis, to reflect this 1-for-33 reverse stock split. The par value of the common stock and convertible preferred stock were not adjusted as a result of the reverse stock split.
Use of Estimates.
The preparation of consolidated financial statements in conformity with accounting principles generally accepted in the United States of America (“U.S. GAAP”) requires management to make estimates, judgments and assumptions that affect the reported amount of assets, liabilities, revenue and expenses and related disclosures of contingent assets and liabilities. On an on-going basis, we evaluate those estimates, including those related to allowances for doubtful accounts, reserves for sales, warranty accrual, inventory write-downs, valuation of long-lived assets, including property and equipment and identifiable intangible assets and goodwill, loss on purchase commitments, valuation of deferred taxes and contingencies. In addition, we use assumptions when employing the Black-Scholes option-pricing model to calculate the fair value of stock options granted and to estimate the carrying value of our convertible preferred stock warrant liability. We base our estimates of the carrying value of certain assets and liabilities on historical experience and on various other assumptions that are believed to be reasonable under the circumstances, when these carrying values are not readily available from other sources. Actual results could differ from these estimates.
53
Table of Contents
Revenue Recognition and Accounts Receivable Allowances.
We recognize revenue from product sales when persuasive evidence of an arrangement exists, the selling price is fixed or determinable, transfer of title occurs, and the collectibility of the resulting receivable is reasonably assured. Due to the historical immaterial level of product returns under warranty, we do not record a reserve for estimated returns under warranty at the time of revenue recognition.
Generally, we meet product sale revenue recognition conditions upon shipment because, in most cases, title and risk of loss passes to the customer at that time. In addition, we estimate and record provisions for future returns and other charges against revenue at the time of shipment, consistent with the terms of sale. We sell products to distributors at the price listed in our distributor price book. At the time of sale, we record a sales reserve for ship from stock and debits (“SSDs”), stock rotation rights and any special programs approved by management. We offset the sales reserve against recorded revenues, producing the revenue amount reported in our consolidated statements of operations.
The market price for our products can differ significantly from the book price at which we sold the product to the distributor. When the market price of a particular distributor’s sales opportunity to their customers would result in low or negative margins for the distributor, as compared to our original book price, we negotiate SSDs with the distributor. Management analyzes our SSD history to develop current SSD rates that form the basis of the SSD revenue reserve recorded each period. We obtain the historical SSD rates from the distributor’s records and our internal records.
We typically grant payment terms of between 30 and 60 days to our customers. Our customers generally pay within those terms. Distributors are invoiced for shipments at listed book price. When the distributors pay the invoice, they may claim debits for SSDs previously authorized by us when appropriate. Once claimed, we process the requests against prior authorizations and adjust reserves previously established for that customer.
The revenue we record for sales to our distributors is net of estimated provisions for these programs. Determining net revenue requires significant judgments and estimates on our part. We base our estimates on historical experience rates, the levels of inventory held by our distributors, current trends and other related factors. Because of the inherent nature of estimates, there is a risk actual amounts may differ materially from our estimates. Our consolidated financial condition and operating results depend on our ability to make reliable estimates. We believe that such estimates are reasonable.
We also monitor collectibility of accounts receivable primarily through review of our accounts receivable aging. When facts and circumstances indicate the collection of specific amounts or from specific customers is at risk, we assess the impact on amounts recorded for bad debts and, if necessary, record a charge in the period such determination is made. As of December 31, 2015 and 2014, there was no allowance for doubtful accounts.
Shipping Costs.
We charge shipping costs to cost of revenue as incurred.
Product Warranty.
Our products are sold with a limited warranty for a period of one year, warranting that the product conforms to specifications and is free from material defects in design, materials and workmanship. To date, we have had insignificant returns of any defective production parts. During the year ended December 31, 2015, we recorded $250,000 for a specific potential warranty claim. As of December 31, 2015, no costs have been incurred relating to this potential warranty claim.
54
Table of Contents
Income Taxes.
We account for income taxes using an asset and liability approach, which requires recognition of deferred tax assets and liabilities for the expected future tax consequences of events that have been recognized in the consolidated financial statements, but have not been reflected in our taxable income. Valuation allowances are established to reduce deferred tax assets as necessary when in management’s estimate, based on available objective evidence, it is more likely than not that we will not generate sufficient taxable income in future periods to realize the benefit of our deferred tax assets. We include interest and penalties related to unrecognized tax benefits in income tax expense. We recognize in our consolidated financial statements the impact of a tax position that based on its technical merits is more likely than not to be sustained upon examination.
Foreign Currency Translation.
The functional currency of our foreign subsidiaries is the local currency. In consolidation, we translate assets and liabilities at exchange rates in effect at the consolidated balance sheet date. We translate revenue and expense accounts at the average exchange rates during the period in which the transaction takes place. Net gains or losses from foreign currency translation of assets and liabilities were a loss of $0.1 million, a gain of $0.1 million, and a loss of $0.1 million for the years ended December 31, 2015, 2014, and 2013, respectively, and are included in the cumulative translation adjustment component of accumulated other comprehensive income, net of tax, a component of stockholders’ equity (deficit). Net gains and losses arising from transactions denominated in currencies other than the functional currency were a $0.1 million loss, a $0.1 million loss, and a $0.1 million gain for the years ended December 31, 2015, 2014, and 2013, respectively, and are included in other income (expense), net.
Cash and Cash Equivalents.
We consider all highly liquid investments with an initial maturity of 90 days or less at the date of purchase to be cash equivalents. We maintain such funds in overnight cash deposits.
Property and Equipment.
Property and equipment are carried at cost less accumulated depreciation and amortization. Depreciation and amortization are computed using the straight-line method over the estimated useful lives of the assets or the term of the related lease, whichever is shorter. Estimates of useful lives are as follows:
| Estimated useful lives | ||
| Machinery and equipment |
2-5 years | |
| Furniture and fixtures |
3 years | |
| Leasehold improvements |
Shorter of lease term or 5 years | |
| Computer software |
3 years |
Inventories.
We record inventories at the lower of standard cost (which generally approximates actual cost on a first-in, first-out basis) or market value. On a quarterly basis, we analyze inventories on a part-by-part basis. The carrying value of inventory is adjusted for excess and obsolete inventory based on inventory age, shipment history and the forecast of demand over a specific future period. At the point of loss recognition, a new lower cost basis for that inventory is established and subsequent changes in facts and circumstances do not result in the restoration or increase in that new cost basis. The semiconductor markets that we serve are volatile and actual results may vary from forecast or other assumptions, potentially affecting our assessment of excess and obsolete inventory which could have a material effect on our results of operations.
55
Table of Contents
Long-Lived Assets.
We evaluate our long-lived assets, including property and equipment, for impairment whenever events or changes in circumstances indicate that the carrying value of these assets may not be recoverable. We recognize an impairment loss when the net book value of such assets exceeds the estimated future undiscounted cash flows attributable to the asset. If impairment is indicated, we write the asset down to its estimated fair value. For all periods presented, we have not recognized any impairment losses on our long-lived assets.
Purchased Intangible Assets.
Purchased intangible assets are amortized over their useful lives unless these lives are determined to be indefinite. Purchased intangible assets with definite lives are carried at cost less accumulated amortization. Amortization is computed over the estimated useful lives of the respective assets as follows:
| Years | ||||
| Developed technology |
10 | |||
| Customer relationships |
12 | |||
| Customer backlog |
1 | |||
| Non-compete agreement |
5 | |||
Goodwill.
Goodwill represents the excess of the cost of an acquisition over the sum of the amounts assigned to tangible and identifiable intangible assets acquired less liabilities assumed.
We evaluate our goodwill, at a minimum, on an annual basis and whenever events or changes in circumstances indicate that the carrying amount may not be recoverable. We perform our annual goodwill impairment test as of November 1 of each year.
When evaluating goodwill for impairment, we may initially perform a qualitative assessment which includes a review and analysis of certain quantitative factors to estimate if a reporting units’ fair value significantly exceeds its carrying value. When the estimate of a reporting unit’s fair value appears more likely than not to be less than its carrying value based on this qualitative assessment, we continue to the first step of two steps impairment test. The first step requires a comparison of the fair value of the reporting unit to its net book value, including goodwill. The fair value of the reporting units is determined based on a weighting of income and market approaches. Under the income approach, we calculate the fair value of a reporting unit based on the present value of estimated future cash flows. Under the market approach, we estimate the fair value based on market multiples of revenue or earnings for comparable companies. Determining the fair value of a reporting unit is judgmental in nature and involves the use of significant estimates and assumptions. These estimates and assumptions include revenue growth rates and operating margins used to calculate projected future cash flows, risk-adjusted discount rates, and future economic and market conditions and determination of appropriate market comparables. We base these fair value estimates on reasonable assumptions but that are unpredictable and inherently uncertain. Actual future results may differ from those estimates. A potential impairment exists if the fair value of the reporting unit is lower than its net book value. The second step of the process is only performed if a potential impairment exists, and it involves determining the difference between the fair values of the reporting unit’s net assets, other than goodwill, and the fair value of the reporting unit, and, if the difference is less than the net book value of goodwill, an impairment charge is recorded. In the event that we determine that the value of goodwill has become impaired, we record a charge for the amount of impairment during the fiscal quarter in which the determination is made. We operate in one reporting unit. We conducted our annual goodwill impairment analysis in the fourth quarters of 2015, 2014, and 2013 and no goodwill impairment was indicated.
Research and Development Expenses.
Research and development expenditures are expensed as incurred.
56
Table of Contents
Stock-based Compensation.
We account for stock-based compensation using the fair value method. We determine fair value for stock options awarded to employees at the grant date using the Black-Scholes option-pricing model, which requires us to make various assumptions, including the fair value of the underlying common stock, expected future share price volatility and expected term. We determine the fair value of stock options awarded to non-employees at each vesting date using the Black-Scholes option-pricing model, and re-measure fair value at each reporting period until the services required under the arrangement are completed. Fair value is recognized as an expense on a straight-line basis over the requisite service period, which is generally the vesting period. We are required to estimate the expected forfeiture rate and only recognize expense for those stock-based awards expected to vest. We estimate the forfeiture rate based on historical experience of our stock-based awards that are granted, exercised and cancelled. If the actual forfeiture rate is materially different from our estimate, stock-based compensation expense in future periods could be significantly different from what was recorded in the current period.
Preferred Stock Warrant Liability.
We account for outstanding warrants to purchase preferred stock that are contingently redeemable as a liability on the consolidated balance sheets at their estimated fair value because the warrants are contingently redeemable and, therefore, may obligate us to transfer assets at some point in the future. The preferred stock warrants are recorded at fair value upon issuance and are subject to re-measurement to fair value at each reporting date, with any change in fair value recognized in the consolidated statements of operations as a component of other income (expense), net. We determine fair value of the preferred stock warrants using the Black-Scholes option-pricing model, which requires us to make various assumptions, including expected future share price volatility and expected term. The preferred stock warrant liability will be re-measured to its fair value at each reporting date until the earlier of the (i) exercise of the warrants, (ii) expiration of the warrants, or (iii) other triggering events as applicable to the terms of the warrant agreements, including the completion of an initial public offering, at which time the preferred stock issuable upon exercise of the warrants will become common stock and the related liability will be reclassified to additional paid-in capital in stockholders’ equity (deficit).
Concentration of Risk.
Our products are primarily manufactured, assembled and tested by third-party foundries and other contractors in Asia and we are heavily dependent on a single foundry in Taiwan for the manufacture of wafers and a single contractor in the Philippines for assembly and testing of our products. We do not have long-term agreements with either of these suppliers. A significant disruption in the operations of these parties would adversely impact the production of our products for a substantial period of time, which could have a material adverse effect on our business, financial condition, operating results and cash flows.
Financial instruments that potentially subject us to significant concentrations of credit risk consist principally of cash and cash equivalents and accounts receivables. We place substantially all of our cash and cash equivalents on deposit with a reputable, high credit quality financial institution in the United States of America. We believe that the bank that holds substantially all of our cash and cash equivalents is financially sound and, accordingly, subject to minimal credit risk. Deposits held with the bank may exceed the amount of insurance provided on such deposits.
We generally do not require collateral or other security in support of accounts receivable. We periodically review the need for an allowance for doubtful accounts by considering factors such as historical experience, credit quality, the age of the accounts receivable balances and current economic conditions that may affect a customer’s ability to pay. As a result of our favorable collection experience and customer concentration, there was no allowance for doubtful accounts as of December 31, 2015 and 2014.
57
Table of Contents
Customer concentrations as a percentage of total revenue were as follows:
| Year Ended December 31, | ||||||||||||
| 2015 | 2014 | 2013 | ||||||||||
| Customer A |
17 | % | 20 | % | 25 | % | ||||||
| Customer B |
12 | % | * | * | ||||||||
| Customer C |
11 | % | 20 | % | * | |||||||
| Customer D |
* | 14 | % | 12 | % | |||||||
| * | less than 10% |
Customer concentrations as a percentage of gross accounts receivable were as follows:
| Year Ended December 31, | ||||||||||||
| 2015 | 2014 | 2013 | ||||||||||
| Customer A |
16 | % | 20 | % | 26 | % | ||||||
| Customer B |
14 | % | * | * | ||||||||
| Customer C |
13 | % | 10 | % | 13 | % | ||||||
| Customer D |
10 | % | * | * | ||||||||
| * | less than 10% |
Net Loss per Share.
Basic net loss per share is calculated by dividing the net loss by the weighted average number of common shares outstanding during the period, without consideration for potentially dilutive securities. Diluted net loss per share is computed by dividing the net loss by the weighted average number of common shares and potentially dilutive common stock equivalents outstanding for the period determined using the treasury-stock and if-converted methods. For purposes of the diluted net loss per share calculation, convertible preferred stock, common stock options, and warrants are considered to be potentially dilutive securities.
Loss Contingencies.
We are or have been subject to claims arising in the ordinary course of business. We evaluate contingent liabilities, including threatened or pending litigation, for potential losses. If the potential loss from any claim or legal proceedings is considered probable and the amount can be estimated, we accrue a liability for the estimated loss. Because of uncertainties related to these matters, accruals are based upon the best information available. For potential losses for which there is a reasonable possibility (meaning the likelihood is more than remote but less than probable) that a loss exists, we will disclose an estimate of the potential loss or range of such potential loss or include a statement that an estimate of the potential loss cannot be made. As additional information becomes available, we reassess the potential liability related to pending claims and litigation and may revise our estimates, which could materially impact our consolidated financial statements.
Recent Accounting Pronouncements.
In August 2014, the Financial Accounting Standards Board (“FASB”) issued Accounting Standard Update (“ASU”) No. 2014-15, Disclosure of Uncertainties About an Entity’s Ability to Continue as a Going Concern. The amendments require management to perform interim and annual assessments of an entity’s ability to continue as a going concern and provide guidance on determining when and how to disclose going concern uncertainties in the financial statements. ASU 2014-15 applies to all entities and is effective for annual and
58
Table of Contents
interim reporting periods ending after December 15, 2016, with early adoption permitted. We are currently evaluating the impact that this new guidance will have on our consolidated financial statements.
In April 2015, the FASB issued ASU 2015-03, “Simplifying the Presentation of Debt Issuance Costs”, which simplifies the presentation of debt issuance costs. ASU 2015-03 is effective for annual reporting periods beginning after December 15, 2015 and interim periods within those years, with early adoption permitted. We are currently evaluating the impact of adoption this guidance on our consolidated financial statements.
Income Tax Classification Guidance. In November 2015, the FASB issued ASU 2015-17, Balance Sheet Classification of Deferred Taxes, amending Accounting Standards Codification (“ASC 740”). Upon adoption, this topic supersedes the existing guidance under ASC 740 and aims to simplify the accounting for income taxes. Currently, U.S. GAAP requires an entity to separate deferred income tax assets and liabilities into current and noncurrent amounts in a classified statement of financial position. This amendment requires that deferred tax assets and liabilities be classified as noncurrent. This ASU is effective for annual periods beginning after December 15, 2016 (including interim reporting periods within those periods), or the first quarter 2017 for Adesto. Early adoption is permitted as of the beginning of an interim or annual reporting period. Adesto early adopted this ASU at the beginning of its fourth quarter of 2015 and applied it prospectively. No prior periods were retrospectively adjusted.
Inventory Measurement Guidance. In July 2015, the FASB issued ASU 2015-11, Simplifying the Measurement of Inventory, amending ASC 330. Upon adoption, this topic supersedes the existing guidance under ASC 330 and aims to simplify the subsequent measurement of inventory. Currently, inventory can be measured at the lower of cost or market, which could result in several potential outcomes, as market could be replacement cost, net realizable value or net realizable value less an approximately normal profit margin. The major amendments would be as follows: 1. Inventory should be measured at the lower of cost or net realizable value. 2. Net realizable value is the estimated selling price in the ordinary course of business less reasonably predictable costs of completion, disposal and transportation. 3. The amendment does not apply to inventory measured under LIFO or the retail inventory method. 4. The amendment does apply to all other inventory, which includes inventory measured via FIFO or average cost. Adesto plans to adopt this guidance effective for periods beginning after December 15, 2016 (including interim reporting periods within those fiscal years), or the first quarter 2017 and does not expect it to have a material effect on its consolidated financial statements.
Revenue Recognition Guidance. In May 2014, the FASB issued ASU 2014-09, Revenue from Contracts with Customers, creating ASC Topic 606. Upon adoption, this topic supersedes the existing guidance under ASC 605 and aims to simplify the number of requirements to follow for revenue recognition and make revenue recognition more comparable across various entities, industries, jurisdictions and capital markets. There are 5 core principles: 1. Identify the contract(s) with a customer. 2. Identify the performance obligations in the contract. 3. Determine the transaction price. 4. Allocate the transaction price to performance obligations in the contract. 5. Recognize revenue when (or as) the entity satisfies a performance obligation. Additional considerations under this update include: accounting for costs to obtain or fulfill a contract with a customer and additional quantitative and qualitative disclosures. Adesto plans to adopt this guidance effective for periods beginning after December 15, 2017 (including interim reporting periods within those periods), or the first quarter 2018 and is currently evaluating the impact on its consolidated financial statements.
In February 2016, the FASB issued ASU 2016-02, Leases. This ASU requires lease assets and lease liabilities arising from leases, including operating leases, to be recognized on the balance sheet, ASU 2016-02 will become effective for the Company on January 1, 2019. Adesto is currently evaluating the impact of this guidance on its consolidated financial statements.
59
Table of Contents
Note 2. Balance Sheet Components.
Accounts Receivable, Net.
Accounts receivable, net consisted of the following (in thousands):
| December 31, | ||||||||
| 2015 | 2014 | |||||||
| Accounts receivable |
$ | 10,936 | $ | 6,079 | ||||
| Allowance for SSD, price protection, right of return and other activities |
(4,400 | ) | (4,085 | ) | ||||
|
|
|
|
|
|||||
| Total accounts receivable, net |
$ | 6,536 | $ | 1,994 | ||||
|
|
|
|
|
|||||
Inventories.
Inventories consisted of the following (in thousands):
| December 31, | ||||||||
| 2015 | 2014 | |||||||
| Raw materials |
$ | 1,149 | $ | 728 | ||||
| Work-in-process |
4,844 | 4,707 | ||||||
| Finished goods |
1,375 | 2,018 | ||||||
|
|
|
|
|
|||||
| Total inventories |
$ | 7,368 | $ | 7,453 | ||||
|
|
|
|
|
|||||
For the year ended December 31, 2015, we realized a benefit of $0.9 million from sales of previously reserved products. For the years ended December 31, 2014 and 2013 we recorded inventory write-downs of $3.6 million and $4.2 million, respectively. Inventory write-downs were primarily associated with products built in excess of customer demand which resulted in excess inventory levels, legacy products for which no demand exists and lower of cost or market write-downs associated with CBRAM products for which costs exceeded market value.
Other Current Assets.
Other current assets consisted of the following (in thousands):
| December 31, | ||||||||
| 2015 | 2014 | |||||||
| Foreign research credit receivable |
$ | 1,063 | $ | 947 | ||||
| Other current assets |
123 | 148 | ||||||
|
|
|
|
|
|||||
| Total other current assets |
$ | 1,186 | $ | 1,095 | ||||
|
|
|
|
|
|||||
Property and Equipment, Net.
Property and equipment, net consisted of the following (in thousands):
| December 31, | ||||||||
| 2015 | 2014 | |||||||
| Machinery and equipment |
$ | 6,627 | $ | 6,114 | ||||
| Furniture and fixtures |
77 | 77 | ||||||
| Leasehold improvements |
141 | 146 | ||||||
| Computer software |
668 | 668 | ||||||
| Construction in progress |
52 | — | ||||||
|
|
|
|
|
|||||
| Property and equipment, at cost |
7,565 | 7,005 | ||||||
| Accumulated depreciation and amortization |
(6,656 | ) | (5,280 | ) | ||||
|
|
|
|
|
|||||
| Property and equipment, net |
$ | 909 | $ | 1,725 | ||||
|
|
|
|
|
|||||
60
Table of Contents
Depreciation and amortization expense of property and equipment for the years ended December 31, 2015, 2014, and 2013 was $1.5 million, $1.8 million, and $1.1 million, respectively.
Accrued Expenses and Other Current Liabilities.
Accrued expenses and other current liabilities consisted of the following (in thousands):
| December 31, | ||||||||
| 2015 | 2014 | |||||||
| Accrual for losses on wafer purchase commitments |
$ | — | $ | 583 | ||||
| Accrued sales commission payable |
300 | 315 | ||||||
| Accrued manufacturing expenses |
271 | — | ||||||
| Deferred rent |
196 | — | ||||||
| Other accrued liabilities |
646 | 436 | ||||||
|
|
|
|
|
|||||
| Total accrued expenses and other current liabilities |
$ | 1,413 | $ | 1,334 | ||||
|
|
|
|
|
|||||
Note 3. Fair Value Measurements.
Fair value is defined as the exchange price that would be received from selling an asset or paid to transfer a liability in the principal or most advantageous market for the asset or liability in an orderly transaction between market participants on the measurement date. We measure financial assets and liabilities at fair value at each reporting period using a fair value hierarchy which requires us to maximize the use of observable inputs and minimize the use of unobservable inputs when measuring fair value. A financial instrument’s classification within the fair value hierarchy is based upon the lowest level of input that is significant to the fair value measurement. Three levels of inputs may be used to measure fair value:
Level 1. Quoted prices in active markets for identical assets or liabilities.
Level 2 . Quoted prices for similar assets and liabilities in active markets or inputs other than quoted prices which are observable for the assets or liabilities, either directly or indirectly through market corroboration, for substantially the full term of the financial instruments.
Level 3. Unobservable inputs which are supported by little or no market activity and which are significant to the fair value of the assets or liabilities.
Financial liabilities measured at fair value on a recurring basis were as follows:
| Fair Value Measurement at Reporting Date Using | ||||||||||||||||
| Quoted Prices in Active Markets for Identical Assets (Level 1) |
Significant Other Observable Inputs (Level 2) |
Significant Unobservable Inputs (Level 3) |
Total | |||||||||||||
| (in thousands) | ||||||||||||||||
| As of December 31, 2015 |
||||||||||||||||
| Assets: |
||||||||||||||||
| Money market funds |
$ | — | $ | 20,007 | $ | — | $ | 20,007 | ||||||||
|
|
|
|
|
|
|
|
|
|||||||||
| As of December 30, 2014 |
||||||||||||||||
| Liabilities: |
||||||||||||||||
| Preferred stock warrant liability |
$ | — | $ | — | $ | 122 | $ | 122 | ||||||||
|
|
|
|
|
|
|
|
|
|||||||||
As of December 31, 2014, we used the Black-Scholes option-pricing model to determine the fair value of the warrants to purchase preferred stock, including the consideration of underlying common stock price, a risk-free interest rate, expected term and expected volatility. Certain inputs used in the model are unobservable. The fair
61
Table of Contents
values could change significantly based on future market conditions. The following table presents quantitative information about the inputs used for our fair value measurements classified in Level 3 of the fair value hierarchy as of December 31, 2014. All preferred stock warrants were converted on the effective date of the IPO.
The following table represents quantitative information about the inputs used for our fair value measurements classified in Level 3 of the fair value hierarchy as of October 30, 2015 (completion of IPO) and December 31, 2015.
| October 30, | December 31, | |||
| 2015 | 2014 | |||
| Volatility |
67% - 102% | 40% | ||
| Expected dividend yield |
— | — | ||
| Risk-free rate |
0.59% - 2.19% | 1.74% | ||
| Expected term (in years) |
1.4 - 9.0 | 6 |
The following table sets forth a reconciliation the changes in fair value of preferred stock warrants (in thousands):
| Balance as of December 31, 2012 |
$ | 843 | ||
| Issuance of preferred stock warrants |
619 | |||
| Change in fair value of preferred stock warrants |
(1,200 | ) | ||
|
|
|
|||
| Balance as of December 31, 2013 |
262 | |||
| Issuance of preferred stock warrants |
66 | |||
| Change in fair value of preferred stock warrants |
(206 | ) | ||
|
|
|
|||
| Balance as of December 31, 2014 |
122 | |||
| Issuance of preferred stock warrants |
863 | |||
| Change in fair value of preferred stock warrants |
907 | |||
| Conversion of warrants upon IPO |
(1,892 | ) | ||
|
|
|
|||
| Balance as of December 31, 2015 |
$ | — | ||
|
|
|
Note 4. Purchased Intangible Assets.
In 2012, in connection with our purchase of the serial flash memory product line assets from Atmel Corporation, we recorded $16.4 million of intangible assets.
Intangible assets are as follows (in thousands):
| December 31, 2015 | ||||||||||||||
| Estimated Useful Life (in Years) |
Gross Carrying Amount |
Accumulated Amortization |
Net Carrying Amount |
|||||||||||
| Developed technology |
10 | $ | 4,282 | $ | 1,392 | $ | 2,890 | |||||||
| Customer relationships |
12 | 9,011 | 2,440 | 6,571 | ||||||||||
| Customer backlog |
1 | 2,779 | 2,779 | — | ||||||||||
| Non-compete agreement |
5 | 282 | 184 | 98 | ||||||||||
|
|
|
|
|
|
|
|||||||||
| Total intangible assets subject to amortization |
$ | 16,354 | $ | 6,795 | $ | 9,559 | ||||||||
|
|
|
|
|
|
|
|||||||||
62
Table of Contents
| December 31, 2014 | ||||||||||||
| Gross Carrying Amount |
Accumulated Amortization |
Net Carrying Amount |
||||||||||
| Developed technology |
$ | 4,282 | $ | 964 | $ | 3,318 | ||||||
| Customer relationships |
9,011 | 1,689 | 7,322 | |||||||||
| Customer backlog |
2,779 | 2,779 | — | |||||||||
| Non-compete agreement |
282 | 127 | 155 | |||||||||
|
|
|
|
|
|
|
|||||||
| Total intangible assets subject to amortization |
$ | 16,354 | $ | 5,559 | $ | 10,795 | ||||||
|
|
|
|
|
|
|
|||||||
We recorded amortization expense related to the acquisition-related intangible assets as follows (in thousands):
| Year Ended December 31, | ||||||||||||
| 2015 | 2014 | 2013 | ||||||||||
| Operating expense category: |
||||||||||||
| Research and development |
$ | 429 | $ | 429 | $ | 429 | ||||||
| Sales and marketing |
807 | 807 | 2,891 | |||||||||
|
|
|
|
|
|
|
|||||||
| Total |
$ | 1,236 | $ | 1,236 | $ | 3,320 | ||||||
|
|
|
|
|
|
|
|||||||
The annual expected amortization expense of acquisition-related intangible assets subject to amortization as of December 31, 2015 is as follows (in thousands):
| Year Ended December 31, |
||||
| 2016 |
$ | 1,236 | ||
| 2017 |
1,221 | |||
| 2018 |
1,179 | |||
| 2019 |
1,179 | |||
| 2020 |
1,179 | |||
| Thereafter |
3,565 | |||
|
|
|
|||
| Total |
$ | 9,559 | ||
|
|
|
|||
Note 5. Borrowings.
Bridge Bank Loan.
In October 2013, we entered into the Business Financing Agreement (the “BFA”) with Bridge Bank N.A. The agreement consists of both a revolving credit facility under which we may borrow up to 80% of eligible accounts receivable but not to exceed $7.5 million and a term loan in the amount of $9.0 million. Interest on the revolving credit facility accrues at the bank’s prime rate, which under the BFA shall not be less than 3.25%, plus 1.25% while interest on the term loan accrues at the bank’s prime rate plus 3%. Under the term loan, we are required to make interest only payments through April 2014 and principal payments of $300,000 monthly thereafter plus interest. Borrowings under the BFA are secured by all of our assets and are subject to certain financial covenants, including maintaining minimum levels of EBITDA on a quarterly basis and a certain minimum asset coverage ratio based on the ratio of unrestricted cash plus certain accounts receivable to total outstanding under the agreement.
In 2014, we were not in compliance with certain financial covenants. As a result, in October 2014, we entered into the First Business Financing Modification Agreement (the “BFA Modification”) under which the covenant defaults were waived. The BFA Modification (i) increases the interest rate charged on the term loan from the bank’s prime rate plus 3% to the bank’s prime rate plus 4% declining to the bank’s prime rate plus 3% upon the
63
Table of Contents
raising of additional equity of not less than $2.5 million, (ii) requires us to continue to maintain certain minimum levels of EBITDA and asset coverage ratios, (iii) requires us to maintain unrestricted cash of not less than $4.25 million until that point at which we either receive additional equity of not less than $5.0 million or maintain a debt service coverage ratio of not less than 1.00 to 1.00 (based on the ratio of EBITDA to current portion of total amounts outstanding under the BFA Modification plus period-to-date interest expense payments) for two consecutive quarters.
In addition, under the BFA the bank was paid a facility fee of $82,500 at closing. Under the BFA Modification, the bank was paid an additional facility fee of $50,000 and received a warrant to purchase 1,488 shares of our Series E convertible preferred stock. The facility fees and the value of the warrant, $0.1 million, were recorded as a debt discount and were being amortized over the life of the agreement. Amortization of debt discount was immaterial during 2013, $0.1 million in 2014, and $0.1 million in 2015.
As of December 31, 2014, we were not in compliance with the financial covenants of the agreements and all amounts due under the agreement are shown as current on the consolidated balance sheets. Borrowings of $10.9 million under this facility were repaid in full in April 2015.
Opus Bank Term Loan.
In April 2015, we entered into a three-year $15.0 million credit agreement, or the new term loan facility, which replaced our prior senior secured revolving credit and term loan facility. The agreement provides for a senior secured term loan facility, in an aggregate principal amount of up to $15.0 million to be used for general corporate purposes including working capital, to repay certain indebtedness and for capital expenditures and other expenses. Interest will accrue on any outstanding borrowings at a rate equal to (a) the higher of (i) the prime rate (as publicly announced from time to time by the Wall Street Journal) and (ii) 3.25% plus (b) (i) 1.00% if our cash equivalents are greater than 125% of the outstanding principal of our borrowings under the new term loan facility, or (ii) 2.00% if our cash and cash equivalents are less than or equal to 125% of such borrowings. Indebtedness we incur under this agreement is secured by substantially all of our assets and contains financial covenants requiring us to maintain a monthly asset coverage ratio after September 30, 2015 of not less than 1.10 to 1.00, and quarterly adjusted EBITDA (measured on a trailing three-month basis) of $1 through March 31, 2016 and increasing to higher levels thereafter. This quarterly EBITDA covenant is removed if the asset coverage ratio is met at all times during any particular quarter. The agreement contains customary affirmative and negative covenants, including covenants that limit or restrict our ability to, among other things, incur additional indebtedness, grant liens, make investments, repurchase stock, pay dividends, transfer assets, merge or consolidate and make acquisitions. Upon an occurrence of an event of default, we could be required to pay interest on all outstanding obligations under the agreement at a rate of five percent above the otherwise applicable interest rate, and the lender may accelerate our obligations under the agreement. As of December 31, 2015, we were in compliance with all financial covenants and restrictions and had borrowings of $14.0 million outstanding. We may not draw additional funds under the new term loan facility and our borrowings mature on April 30, 2018.
In connection with the new term loan facility, Opus Bank received a warrant to purchase 31,897 shares of Series E convertible preferred stock. Upon the completion of our initial public offering on October 30, 2015 the preferred stock warrants were converted into 315,282 of our common stock warrants. In addition, we paid financing costs of $0.1 million. The financing costs and the value of the warrant, $0.9 million, were recorded as a debt discount and are being amortized over the life of the agreement. Amortization of debt discount was $0.4 million in 2015. As of December 31, 2015, the remaining unamortized debt discount was $0.6 million.
64
Table of Contents
Outstanding borrowings consisted of the following (in thousands):
| December 31, | ||||||||
| 2015 | 2014 | |||||||
| Revolving line of credit |
$ | — | $ | 4,273 | ||||
| Term loan, current |
5,606 | 6,476 | ||||||
| Term loan, non-current |
7,814 | — | ||||||
|
|
|
|
|
|||||
| Total |
$ | 13,420 | $ | 10,749 | ||||
|
|
|
|
|
|||||
Future repayments on outstanding borrowings (excluding unamortized discount of $0.6 million as of December 31, 2015) are as follows: (in thousands)
| Year ending December 31, |
||||
| 2016 |
$ | 6,000 | ||
| 2017 |
6,000 | |||
| 2018 |
2,000 | |||
|
|
|
|||
| $ | 14,000 | |||
|
|
|
|||
Interest expense incurred under our borrowings was $1.1 million, $0.8 million, and $2.7 million for the years ended December 31, 2015, 2014, and 2013, respectively.
Note 6. Segment Information.
We operate in one business segment, application-specific and feature-rich, ultra-low power NVM products. Our chief decision-maker, the President and Chief Executive Officer, evaluates our performance based on company-wide consolidated results. Revenue is evaluated based on product category and by geographic region.
Product revenue from customers is designated based on the geographic region to which the product is delivered. Revenue by geographic region was as follows (in thousands):
| Year Ended December 31, | ||||||||||||
| 2015 | 2014 | 2013 | ||||||||||
| (in thousands) | ||||||||||||
| United States |
$ | 8,831 | $ | 7,318 | $ | 7,679 | ||||||
| Rest of Americas |
602 | 751 | 900 | |||||||||
| Europe |
4,817 | 7,261 | 8,370 | |||||||||
| Asia Pacific |
28,711 | 25,885 | 32,467 | |||||||||
| Rest of world |
298 | 250 | 268 | |||||||||
|
|
|
|
|
|
|
|||||||
| Total |
$ | 43,259 | $ | 41,465 | $ | 49,684 | ||||||
|
|
|
|
|
|
|
|||||||
Long-lived assets are attributed to the geographic region were they are located. Long-lived assets by geographic region were as follows (in thousands):
| December 31, | ||||||||
| 2015 | 2014 | |||||||
| United States |
$ | 369 | $ | 620 | ||||
| Asia Pacific |
538 | 1,105 | ||||||
| Europe |
2 | — | ||||||
|
|
|
|
|
|||||
| Total property and equipment, net |
$ | 909 | 1,725 | |||||
|
|
|
|
|
|||||
65
Table of Contents
Note 7. Commitments and Contingencies.
Operating Leases.
On November 2, 2015, the Company extended the lease for its headquarters by six months to July 2016 by entering into that certain Amendment to Commercial Sublease, dated November 2, 2015, between the Company and eGain Corporation. The Amendment provides for a base rent during the extension period of $47,087 per month.
Additionally, on November 2, 2015, the Company entered into a lease with Peterson Ridge LLC pursuant to which the Company has leased a new headquarters facility, consisting of an aggregate of approximately 34,000 square feet of space in Santa Clara, California. The initial term of the lease commenced on November 2, 2015 and is scheduled to end on July 31, 2023 and may be extended, at the Company’s option, for an additional five-year period following the initial lease term.
Pursuant to the lease, monthly base rental payments due under the lease are expected to be approximately $93,000 per month between August 1, 2016 and February 27, 2017, with annual increases of approximately 3% thereafter. The Company must also pay for certain other operating costs under the lease, including operating expenses, taxes, assessments, insurance, utilities, securities and property management fees. Peterson Ridge LLC is obligated to reimburse the Company for up to $2,521,051 of the Company’s out-of-pocket costs associated with any tenant improvements, as defined in the lease.
Rent expense under operating leases for 2015, 2014, and 2013 was $1.0 million, $0.7 million, and $0.7 million, respectively. Future minimum lease payments under operating leases for 2016 is $0.8 million.
| Total | 2016 | 2017 | 2018 | 2019 | 2020 | Thereafter | ||||||||||||||||||||||
| (in thousands) | ||||||||||||||||||||||||||||
| Operating leases |
$ | 9,054 | $ | 856 | $ | 1,154 | $ | 1,177 | $ | 1,213 | $ | 1,249 | $ | 3,405 | ||||||||||||||
Capital Leases.
We have entered into various lease agreements for equipment and software under capital leases with terms of between 24 to 48 months. The equipment and software under the leases are collateral for the lease obligations and are included within property, plant and equipment, net, on the consolidated balance sheets. Future minimum commitments for capital leases as of December 31, 2015 are as follows (in thousands):
| Payments due in 2016 |
$ | 18 | ||
|
|
|
|||
| Total minimum lease payments |
18 | |||
| Less: Amounts representing interest |
(2 | ) | ||
|
|
|
|||
| Present value of capital lease obligations and current portion of capital lease obligations |
$ | 16 | ||
|
|
|
Obligations under capital leases are included in accrued expenses and other current liabilities in the consolidated balance sheets.
Equipment acquired under capital leases is included in property and equipment, net and consisted of the following (in thousands):
| December 31, | ||||||||
| 2015 | 2014 | |||||||
| Computer software |
$ | 108 | $ | 108 | ||||
| Office Equipment |
49 | 49 | ||||||
| Machinery and equipment |
44 | 44 | ||||||
|
|
|
|
|
|||||
| Property and equipment, at cost |
201 | 201 | ||||||
| Accumulated depreciation and amortization |
(189 | ) | (114 | ) | ||||
|
|
|
|
|
|||||
| Property and equipment, net |
$ | 12 | $ | 87 | ||||
|
|
|
|
|
|||||
66
Table of Contents
Purchase Commitments.
As of December 31, 2015 we had purchase commitments with our third-party foundries of $2.9 million due within one year.
Litigation.
Although we are not currently subject to any litigation, and no litigation is currently threatened against us, we may be subject to legal proceedings, claims and litigation, including intellectual property litigation, arising in the ordinary course of business. Such matters are subject to many uncertainties and outcomes and are not predictable with assurance. We accrue amounts that we believe are adequate to address any liabilities related to legal proceedings and other loss contingencies that we believe will result in a probable loss that is reasonably estimable.
Indemnification.
During the normal course of business, we may make certain indemnities, commitments and guarantees which may include intellectual property indemnities to certain of our customers in connection with the sales of our products and indemnities for liabilities associated with the infringement of other parties’ technology based upon our products. Our exposure under these indemnification provisions is generally limited to the total amount paid by a customer under the agreement. However, certain agreements include indemnification provisions that could potentially expose us to losses in excess of the amount received under the agreement. In addition, we indemnify our officers, directors and certain key employees while they are serving in good faith in such capacities.
We have not recorded any liability for these indemnities, commitments and guarantees in the accompanying consolidated balance sheets. Where necessary, we accrue for losses for any known contingent liabilities, including those that may arise from indemnification provisions, when future payment is probable.
Note 8. Convertible Preferred Stock and Convertible Preferred Stock Warrants
Convertible Preferred Stock.
Upon the filing of our Certificate of Amendment to our Restated Certificate of Incorporation on October 23, 2015, the definition of “qualified IPO” was amended such that each share of Series A, Series B, Series C, Series D, and Series D-1 will automatically convert at the then effective conversion rate into shares of common stock upon the closing of a firm commitment underwritten initial public offering pursuant to an effective registration statement under the Securities Act of 1933, with gross proceeds to us of not less than $20 million, and each share of Series E will automatically convert on 1-to-9.8841 basis in the event of such qualified IPO.
In connection with the completion of the Company’s IPO on October 30, 2015 all 4,419,853 of its previously outstanding shares of convertible preferred stock were converted into common stock. Convertible preferred stock as of December 31, 2014 consisted of the following (in thousands, except share data).
| Shares Authorized |
Shares Issued and Outstanding |
Aggregate Liquidation Value |
Carrying Value |
|||||||||||||
| (in thousands, except shares) | ||||||||||||||||
| Series A |
1,087,663 | 1,082,248 | $ | 12,000 | $ | 11,836 | ||||||||||
| Series B |
1,311,000 | 1,303,616 | 15,900 | 15,815 | ||||||||||||
| Series C |
837,962 | 837,957 | 19,357 | 19,257 | ||||||||||||
| Series D |
518,342 | 446,565 | 14,000 | 13,958 | ||||||||||||
| Series D-1 |
222,861 | 222,668 | 5,236 | 5,236 | ||||||||||||
| Series E |
675,758 | 526,799 | 61,932 | 12,365 | ||||||||||||
|
|
|
|
|
|
|
|
|
|||||||||
| Total |
4,653,586 | 4,419,853 | $ | 128,425 | $ | 78,467 | ||||||||||
|
|
|
|
|
|
|
|
|
|||||||||
67
Table of Contents
Preferred Stock Warrants.
As of the dates below, outstanding preferred stock warrants and associated fair values are as follows (fair value in thousands):
| Fair Value | ||||||||||||||||||||||||
| Number | At Conversion | |||||||||||||||||||||||
| Class of | of | October 30, | December 31, | Exercise | Issuance | Expiration | ||||||||||||||||||
| Shares |
Shares | 2015 | 2014 | Price | Date | Date | ||||||||||||||||||
| Series B |
7,378 | $ | 53 | $ | 6 | $ | 12.1968 | 2010 | 2017 | |||||||||||||||
| Series D |
74,141 | 109 | 60 | $ | 31.3500 | 2012-2013 | 2019 | |||||||||||||||||
| Series E |
329,995 | 1,730 | 56 | $ | 23.5125 | 2014-2015 | 2022-2024 | |||||||||||||||||
|
|
|
|
|
|
|
|||||||||||||||||||
| 411,514 | $ | 1,892 | $ | 122 | ||||||||||||||||||||
|
|
|
|
|
|
|
|||||||||||||||||||
In connection with a capital lease financing in January 2008, we issued a warrant to purchase 5,411 shares of Series A at $11.088 per share. In January 2015, this warrant expired unexercised.
In connection with a capital lease financing in February 2010, we issued a warrant to purchase 7,378 shares of Series B at $12.1968 per share. The warrants are exercisable any time at the option of the holder and expire at the earlier of February 2017, an initial public offering, or an acquisition. This warrant was initially valued at $57,000 and recorded as a liability.
In connection with a term loan financing with Opus Bank, in September 2012 we issued a warrant to purchase 35,885 shares of Series D at a price per share of $31.35. In addition, in connection with a first amendment of the term loan financing with Opus Bank, on each of March 31, 2013 and June 30, 2013 we issued to Opus Bank a warrant to purchase 17,942 shares of Series D at a price per share of $31.35. The warrants were exercisable any time at the option of the holder and expire at the earlier of September 2019, an initial public offering, or an acquisition. The warrants were initially valued at $1.3 million and recorded as a liability.
In connection with a BFA Modification agreement with Bridge Bank, in October 2014 we issued a warrant to purchase 1,488 shares of Series E at a price per share of $23.5125. The warrant was exercisable any time at the option of the holder and expires at the earlier of October 2024, an initial public offering, or an acquisition. The warrant was initially valued at $0.1 million and recorded as a liability.
In connection with our term loan negotiated with Opus Bank in May 2015 we issued a warrant to purchase 31,897 shares of Series E at a price of $23.5125. The warrant was exercisable any time at the option of the holder and expires at the earlier of October 2022, an initial public offering, or an acquisition. The warrant was initially valued at $0.9 million and was recorded as a liability.
As of December 31, 2014, the fair value of preferred stock warrants was $0.1 million and classified as a long-term liability, as the warrants primarily expire in periods beyond one year from December 31, 2014. The warrants were subject to re-measurement at each balance sheet date with any change in fair value recognized as a component of other income (expense), net in our consolidated statements of operations.
Concurrent with the close of our IPO on October 30, 2015, all preferred stock warrants were converted into warrants to purchase a total of 411,514 shares of common stock and accordingly, the liability of $1,892,000 was reclassified to additional paid-in capital.
During the year ended December 31, 2015, we recorded expense of $0.9 million for the change in fair value of these warrants. During the years ended December 31, 2014 and 2013, we recorded income of $0.2 million and $1.2 million, respectively, for the change in fair value of these warrants.
68
Table of Contents
Note 9. Common Stock, Common Stock Warrants and Stock Option Plan.
Common Stock.
We were authorized to issue 100,000,000 shares of common stock with $0.0001 par value per share as of December 31, 2015 and 6,666,666 shares of common stock with no par value per share as of December 31, 2014. Each holder of common stock is entitled to one vote per share. The holders of common stock are also entitled to receive dividends, when and if declared by our Board of Directors, subject to the consent of two-thirds of the outstanding preferred stock and their preferential dividend rights.
Common Stock Reserved for Future Issuance.
As of December 31, 2015 and 2014, we had reserved shares of common stock for future issuances as follows:
| December 31, | ||||||||
| 2015 | 2014 | |||||||
| Convertible preferred stock |
— | 9,114,739 | ||||||
| Warrants to purchase preferred stock |
— | 86,046 | ||||||
| Warrants to purchase common stock |
411,514 | 218,618 | ||||||
| Stock option plan: |
||||||||
| Options outstanding |
796,356 | 604,412 | ||||||
| Options available for future grants |
1,814,846 | 148,633 | ||||||
| Shares available for ESPP |
149,747 | — | ||||||
|
|
|
|
|
|||||
| Total |
3,172,463 | 10,172,448 | ||||||
|
|
|
|
|
|||||
Upon completion of our IPO on October 30, 2015 all shares of our preferred stock were converted into 9,114,739 shares of common stock.
Common Stock Warrants.
The following common stock warrants were outstanding as of December 31, 2015 and were the result of a conversion of preferred stock warrants upon the completion of our IPO on October 30, 2015.
| Total amount of securities issuable under the outstanding warrants |
Exercise Price |
Issuance Date |
Expiration Date | |||
| 7,378 |
$ 12.20 | 2010 | 2017 | |||
| 74,141 |
$ 31.35 | 2012-2013 | 2019 | |||
| 329,995 |
$ 2.38 | 2014-2015 | 2022-2024 | |||
|
|
||||||
| 411,514 |
||||||
|
|
As of December 31, 2014, outstanding common stock warrants were as follows:
| Total amount of |
Exercise Price |
Issuance Date |
Expiration Date | |||
| 114,784 |
$ 1.98 | 2009 | 2016 | |||
| 28,696 |
$ 1.98 | 2011 | 2016 | |||
| 75,138 |
$ 3.96 | 2011 | 2018 | |||
|
|
||||||
| 218,618 |
||||||
|
|
69
Table of Contents
Common stock warrants are exercisable at the option of the holder any time after the date of issuance into shares of our common stock. The aggregate amount of shares of common stock that would be issued is determined by dividing the exercisable price by the conversion price applicable on the date of conversion multiplied by the number of warrants exercised. When a public market exists for our common stock, the conversion price is equal to certain quoted prices for our common stock five trading days prior to the date of conversion. When no public market exists for our common stock, the fair value is determined by our Board of Directors. When a warrant is exercised in connection with our initial public offering, the conversion price is equal to the per share offering price to the public in the initial public offering.
In connection with our IPO on October 30, 2015, 218,618 common stock warrants were net exercised based on the initial public offering price of $5.00 per share, resulting in the issuance of 102,289 shares of our common stock.
Employee Benefit Plans
2007 Equity Incentive Plan.
In 2007, our Board of Directors and shareholders approved the 2007 Equity Incentive Plan (the “2007 Plan”) under which 272,727 shares of common stock were reserved and available for the issuance of stock options and restricted stock to eligible participants. The 2007 Plan was subsequently amended to increase the number of shares of common stock reserved for issuance under the 2007 Plan to 787,878 and during the year ended December 31, 2015, the number of shares reserved for issuance under the 2007 Plan was increased to 2,651,515. Options and restricted stock awards were granted at a price per share not less than the 85% of the fair value at the date of grant or award, respectively. Restricted stock awarded to persons controlling more than 10% of our stock were granted at a price per share not less than the 100% of the fair value at the date of the award. Options that were granted to new employees generally vest over a four-year period with 25% vesting at the end of one year and the remaining to vest monthly thereafter, while options that were granted to existing employees generally vest over a four-year period. Options granted generally are exercisable up to 10 years from the date of grant. As of October 26, 2015, no shares were available for grant under the 2007 Plan and all outstanding options would continue to be governed and remain outstanding in accordance with their existing terms. In addition, any shares subject to outstanding awards under the 2007 Plan that are issuable upon the exercise of options that expire or become unexercisable for any reason without having been exercised in full will be available for future grant and issuance under the 2015 Plan (as defined below).
2015 Equity Incentive Plan
In September 2015, our Board of Directors adopted, and in October 2015 our stockholders approved, our 2015 Equity Incentive Plan. The 2015 Equity Incentive Plan became effective on the date immediately prior to the date of our initial public offering. As a result, 1,813,272 shares of common stock previously reserved but unissued under the 2007 Plan on the effective date of the 2015 Equity Incentive Plan became reserved for issuance under our 2015 Equity Incentive Plan, and we ceased granting awards under our 2007 Plan. The number of shares reserved for issuance under our 2015 Equity Incentive Plan will increase automatically on the 1st day of January of each of 2016 through 2025 by the number of shares equal to 4% of the total outstanding shares of our common stock as of the immediately preceding December 31. However, our Board of Directors may reduce the amount of the increase in any particular year.
Our 2015 Equity Incentive Plan authorizes the award of stock options, restricted stock awards, stock appreciation rights, restricted stock units, performance awards and stock bonuses. No person will be eligible to receive more than 2,000,000 shares in any calendar year under our 2015 Equity Incentive Plan other than a new employee of ours, who will be eligible to receive no more than 4,000,000 shares under the plan in the calendar year in which the employee commences employment. The aggregate number of shares of our common stock that may be subject to awards granted to any one non-employee director pursuant to the 2015 Equity Incentive Plan in any calendar year shall not exceed 300,000. Our 2015 Equity Incentive Plan provides that no more than 25,000,000 shares will be issued as incentive stock options.
70
Table of Contents
2015 Employee Stock Purchase Plan
In September 2015, our Board of Directors adopted, and in October 2015 our stockholders approved, our 2015 Employee Stock Purchase Plan (“ESPP”). The 2015 Employee Stock Purchase Plan became effective on the date of our initial public offering. We reserved 150,000 shares of our common stock for issuance under our 2015 Employee Stock Purchase Plan. The number of shares reserved for issuance under our 2015 Employee Stock Purchase Plan will increase automatically on the 1st day of January following the first offering date by the number of shares equal to 1% of the total outstanding shares of our common stock as of the immediately preceding December 31 (rounded to the nearest whole share). However, our Board of Directors may reduce the amount of the increase in any particular year. The aggregate number of shares issued over the term of our 2015 Employee Stock Purchase Plan will not exceed 2,250,000 shares of our common stock.
Under our 2015 Employee Stock Purchase Plan, eligible employees will be able to acquire shares of our common stock by accumulating funds through payroll deductions. Eligible employees will be able to select a rate of payroll deduction up to 15% of their base cash compensation. The purchase price for shares of our common stock purchased under our 2015 Employee Stock Purchase Plan will be 85% of the lesser of the fair market value of our common stock on (i) the first trading day of the applicable offering period and (ii) the last trading day of each purchase period in the applicable offering period. Except for the first offering period, each offering period will run for no more than six months, with purchases occurring every six months. The first offering period began upon the effective date of our IPO and will end on June 30, 2016.
No participant will have the right to purchase shares of our common stock in an amount that has a fair market value greater than $25,000, determined as of the first day of the applicable purchase period, for each calendar year in which that right is outstanding. In addition, no participant will be permitted to purchase more than 2,500 shares during any one purchase period or a lesser amount determined by our compensation committee.
Our 2015 Employee Stock Purchase Plan will continue until the earlier to occur of its termination by our Board of Directors, the issuance of all shares reserved for issuance under it or the tenth anniversary of its effective date.
A summary of stock option activity under the 2007 Plan and the 2015 Plan is as follows:
| Stock Options | ||||||||||||||||
| Shares | Weighted- Average Exercise Price |
Weighted- Average Remaining Contractual Term (Years) |
Aggregrate Instrinsic Value |
|||||||||||||
| (aggregate intrinsic value in thousands) | ||||||||||||||||
| Outstanding as of December 31, 2012 |
369,682 | $ | 2.29 | — | $ | — | ||||||||||
| Granted |
228,288 | 5.61 | ||||||||||||||
| Exercised |
(2,393 | ) | 2.60 | |||||||||||||
| Canceled |
(30,312 | ) | 2.78 | |||||||||||||
|
|
|
|||||||||||||||
| Outstanding as of December 31, 2013 |
565,265 | $ | 3.60 | 5.9 | $ | — | ||||||||||
| Granted |
110,085 | 1.65 | ||||||||||||||
| Exercised |
(20,398 | ) | 1.66 | |||||||||||||
| Canceled |
(50,540 | ) | 3.96 | |||||||||||||
|
|
|
|||||||||||||||
| Outstanding as of December 31, 2014 |
604,412 | $ | 1.57 | 6.8 | $ | — | ||||||||||
| Granted |
202,662 | 5.18 | ||||||||||||||
| Exercised |
(5,952 | ) | 1.67 | |||||||||||||
| Canceled |
(4,766 | ) | 2.31 | |||||||||||||
|
|
|
|||||||||||||||
| Outstanding as of December 31, 2015 |
796,356 | $ | 2.49 | 6.5 | $ | 4,157 | ||||||||||
|
|
|
|||||||||||||||
| Options vested and expected to vest as of December 31, 2015 |
765,222 | $ | 2.41 | 6.4 | $ | 4,056 | ||||||||||
|
|
|
|||||||||||||||
| Options vested and exercisable as of December 31, 2015 |
556,072 | $ | 1.83 | 5.5 | $ | 3,270 | ||||||||||
|
|
|
|||||||||||||||
71
Table of Contents
| Restricted stock units | ||||||||||||||||
| Shares | Weighted- Average Exercise Price |
Weighted- Average Remaining Contractual Term (Years) |
Aggregrate Instrinsic Value |
|||||||||||||
| (aggregate intrinsic value in thousands) | ||||||||||||||||
| Outstanding as of December 31, 2014 |
— | — | — | — | ||||||||||||
| Granted |
880,072 | 5.95 | — | — | ||||||||||||
| Released |
— | — | — | — | ||||||||||||
| Forfeited/expired |
(5,564 | ) | 5.95 | — | — | |||||||||||
|
|
|
|||||||||||||||
| Outstanding as of December 31, 2015 |
874,508 | $ | 5.95 | 1.8 | $ | 6,742 | ||||||||||
|
|
|
|||||||||||||||
Additional information regarding stock options outstanding and vested as of December 31, 2015 is summarized below:
| Options Outstanding | Options Vested and Exercisable |
|||||||||||||||||||||
| Exercise Prices | Number of Stock Options Outstanding |
Weighted- Average Remaining Contractual Life (Years) |
Weighted- Average Exercise Price per Share |
Shares subject to Stock Options |
Weighted- Average Exercise Price per Share |
|||||||||||||||||
| $0.99 | 63,696 | 0.1 | $ | 0.99 | 63,696 | $ | 0.99 | |||||||||||||||
| $1.65 | 533,379 | 6.1 | 1.65 | 436,776 | 1.65 | |||||||||||||||||
| $3.30 | 143,992 | 9.3 | 3.30 | 48,227 | 3.30 | |||||||||||||||||
| $10.00 | 55,289 | 9.3 | 10.00 | 7,373 | 10.00 | |||||||||||||||||
|
|
|
|
|
|||||||||||||||||||
| $0.99-$10.00 | 796,356 | 6.5 | $ | 2.49 | 556,072 | $ | 1.83 | |||||||||||||||
|
|
|
|
|
|||||||||||||||||||
Note 10. Stock-based Compensation.
We record stock-based compensation based on fair value as of the grant date using the Black-Scholes option-pricing model. We recognize such costs as compensation expense on a straight-line basis over the employee’s requisite service period, which is generally four years. Our valuation assumptions are as follows:
Fair value of common stock. Prior to our IPO in October 2015, we estimated the fair value of our common stock using various valuation methodologies, including valuation analyses performed by third-party valuation firms. After the initial public offering, we used the publicly quoted price as the fair value of our common stock.
Risk-free interest rate. We base the risk-free interest rate used in the Black-Scholes option-pricing model on the implied yield available on U.S. Treasury zero-coupon issues with an equivalent expected term of the options for each option group.
Expected term. The expected term represents the period that our stock-based awards are expected to be outstanding. The expected term assumption is based on the simplified method in which the expected term is equal to the average of the stock-based award’s weighted-average vesting period and its contractual term. We expect to continue using the simplified method until sufficient information about historical behavior is available.
Volatility. We determine volatility based on the historical stock volatilities of a group of publicly listed guideline companies over a period equal to the expected terms of the options, as we do not have sufficient trading history to determine the volatility of our common stock.
Dividend yield. We have never declared or paid any cash dividend and do not currently plan to pay a cash dividend in the foreseeable future. Consequently, we used an expected dividend yield of zero.
72
Table of Contents
The following table summarizes the weighted-average assumptions used in the Black-Scholes option-pricing model to determine fair value of stock options:
| Year Ended December 31, | ||||||||||||
| 2015 | 2014 | 2013 | ||||||||||
| Volatility |
40 | % | 67 | % | 63 | % | ||||||
| Expected dividend yield |
— | — | — | |||||||||
| Risk-free rate |
1.59 | % | 1.84 | % | 1.06 | % | ||||||
| Expected term (in years) |
5 | 6 | 6 | |||||||||
The following table presents the effects of stock-based compensation for stock options, restricted stock units, and ESPP (in thousands):
| Year Ended December 31, | ||||||||||||
| 2015 | 2014 | 2013 | ||||||||||
| Cost of revenue |
$ | 19 | $ | 4 | $ | 1 | ||||||
| Research and development |
263 | 86 | 95 | |||||||||
| Sales and marketing |
153 | 30 | 13 | |||||||||
| General and administrative |
352 | 126 | 55 | |||||||||
|
|
|
|
|
|
|
|||||||
| Total |
$ | 787 | $ | 246 | $ | 164 | ||||||
|
|
|
|
|
|
|
|||||||
Stock-based compensation expense capitalized to inventories was not material during the years ended December 31, 2015, 2014 and 2013.
We did not realize any income tax benefit from stock option exercises in either of the periods presented due to recurring losses and valuation allowances.
As of December 31, 2015, the total unrecognized compensation cost related to stock options, net of estimated forfeitures, was approximately $0.6 million, and this amount is expected to be recognized over a weighted-average period of approximately 2 years. As of December 31, 2015 the total unrecognized compensation cost related to RSU’s and ESPP was $4.8 million and $0.1 million, respectively, and these amounts are expected to be recognized over 1.8 years and 0.5 years, respectively.
Stock Option Repricing.
In August 2014, our Board of Directors approved a common stock option repricing program whereby previously granted and unexercised options held by current employees with exercise prices above $1.65 per share were repriced on a one-for-one basis to $1.65 per share which represented the per share fair value of our common stock as of the date of the repricing. There was no other modification to the vesting schedule of the previously issued options. As a result, 387,749 unexercised options originally granted to purchase common stock at prices ranging from $1.98 to $5.61 per share were repriced under this program.
We treated the repricing as a modification of the original awards and calculated additional compensation costs for the difference between the fair value of the modified award and the fair value of the original award on the modification date. The repricing resulted in incremental stock-based compensation expense of $0.2 million. Expense related to vested shares was expensed on the repricing date and expense related to unvested shares is being amortized over the remaining vesting period of such stock options.
73
Table of Contents
Note 11. Income Taxes.
The components of our income (loss) before provision for (benefit from) income taxes are as follows (in thousands):
| Year Ended December 31, | ||||||||||||
| 2015 | 2014 | 2013 | ||||||||||
| (unaudited) | ||||||||||||
| United States |
$ | (9,232 | ) | $ | (7,885 | ) | $ | (8,149 | ) | |||
| Foreign |
788 | (909 | ) | 68 | ||||||||
|
|
|
|
|
|
|
|||||||
| Loss before provision for (benefit from) income taxes |
$ | (8,444 | ) | $ | (8,794 | ) | $ | (8,081 | ) | |||
|
|
|
|
|
|
|
|||||||
The provision for (benefit from) income taxes consisted of the following (in thousands):
| Year Ended December 31, | ||||||||||||
| 2015 | 2014 | 2013 | ||||||||||
| Current: |
||||||||||||
| Federal |
$ | — | $ | — | $ | — | ||||||
| State |
3 | 3 | 1 | |||||||||
| Foreign |
(38 | ) | 123 | 58 | ||||||||
|
|
|
|
|
|
|
|||||||
| Total current provision for (benefit from) income taxes |
(35 | ) | 126 | 59 | ||||||||
|
|
|
|
|
|
|
|||||||
| Deferred: |
||||||||||||
| Federal |
(26 | ) | 14 | 13 | ||||||||
| State |
— | — | — | |||||||||
|
|
|
|
|
|
|
|||||||
| Total deferred provision for (benefit from) income taxes |
(26 | ) | 14 | 13 | ||||||||
|
|
|
|
|
|
|
|||||||
| Total |
$ | (61 | ) | $ | 140 | $ | 72 | |||||
|
|
|
|
|
|
|
|||||||
The provision for income taxes is comprised of estimates of current taxes due in domestic and foreign jurisdictions.
The reconciliation of the federal statutory income tax to our effective tax is as follows (in thousands):
| Year Ended December 31, | ||||||||||||
| 2015 | 2014 | 213 | ||||||||||
| Federal tax at statutory rate |
$ | (2,871 | ) | $ | (2,989 | ) | $ | (2,772 | ) | |||
| State taxes |
(155 | ) | (185 | ) | (167 | ) | ||||||
| Foreign rate differential |
(233 | ) | 310 | 29 | ||||||||
| Nondeductible expenses |
161 | 92 | 96 | |||||||||
| Research and development credit |
(153 | ) | (481 | ) | — | |||||||
| Stock compensation |
109 | 74 | 52 | |||||||||
| Change in valuation allowance |
3,081 | 3,319 | 2,834 | |||||||||
|
|
|
|
|
|
|
|||||||
| Total |
$ | (61 | ) | $ | 140 | $ | 72 | |||||
|
|
|
|
|
|
|
|||||||
74
Table of Contents
Deferred income taxes reflect the net tax effects of temporary differences between the carrying amounts of assets and liabilities for financial reporting purposes and the amounts used for income tax purposes. Significant components of our deferred tax assets and liabilities are as follows (in thousands):
| December 31, | ||||||||
| 2015 | 2014 | |||||||
| Deferred tax assets: |
||||||||
| Net operating loss carryforwards |
$ | 25,814 | $ | 22,688 | ||||
| Accruals and reserves |
3,893 | 4,241 | ||||||
| Amortization of intangible assets |
1,198 | 2,648 | ||||||
| Tax credit carryforwards |
2,441 | 2,127 | ||||||
| Depreciation |
414 | 99 | ||||||
| Other |
181 | 22 | ||||||
|
|
|
|
|
|||||
| Gross deferred tax assets |
33,941 | 31,825 | ||||||
| Valuation allowance |
(32,753 | ) | (29,673 | ) | ||||
|
|
|
|
|
|||||
| Total deferred tax assets |
1,188 | 2,152 | ||||||
|
|
|
|
|
|||||
| Deferred tax liabilities: |
||||||||
| Reserves and allowances |
(1,188 | ) | (2,152 | ) | ||||
| Amortization of intangible assets |
(1 | ) | (27 | ) | ||||
|
|
|
|
|
|||||
| Total deferred tax liabilities |
(1,189 | ) | (2,179 | ) | ||||
|
|
|
|
|
|||||
| Net deferred tax liability |
$ | (1 | ) | $ | (27 | ) | ||
|
|
|
|
|
|||||
In accordance with ASC 740, Income Taxes, a valuation allowance is provided when it is more likely than not that the deferred tax assets will not be realized. Based on our review of both the positive and negative evidence, which includes our historical operating performance, reported cumulative net losses since inception and difficulty in accurately forecasting its results, we have concluded that it is more likely than not that the we will not be able to realize all of our U.S. deferred tax assets. Therefore, we have established a valuation allowance to offset net deferred tax assets as of December 31, 2015, 2014 and 2013 due to the uncertainty of realizing future tax benefits from our net operating loss (“NOL”) carryforwards and other deferred tax assets. The net change in the total valuation allowance for the years ended December 31, 2015, 2014, and 2013 was an increase of approximately $3.1 million, $3.3 million, and $2.7 million, respectively.
Our foreign deferred tax assets are immaterial and have not been included in the provision calculations. We reassess the need for our valuation allowance on a quarterly basis.
Based on our review discussed above, the realization of deferred tax assets is dependent on improvements over present levels of consolidated pre-tax income. Until we are consistently profitable in the U.S., we will not realize our deferred tax assets. Deferred income taxes have not been provided on the cumulative undistributed earnings of foreign subsidiaries. The amount of such earnings as of December 31, 2015 was $2.3 million. These earnings have been permanently reinvested and we do not plan to initiate any action that would precipitate the payment of income tax thereon. It is not practicable to estimate the amount of additional tax that might be payable on undistributed foreign earnings.
In November 2015, the FASB issued ASU 2015-17, Balance Sheet Classification of Deferred Taxes. This ASU requires that all deferred tax assets and liabilities, along with any related valuation allowance be classified as noncurrent on the balance sheet. We early adopted this standard at the beginning of its fourth quarter of 2015 and applied it prospectively. No prior periods were retrospectively adjusted.
As of December 31, 2015, we had federal and state NOL carryforwards of $67.1 million and $51.5 million available to offset future taxable income. The federal NOL carryforwards will expire at various dates beginning in 2027, if not utilized. The state NOL carryforward will expire at various dates beginning in 2017, if not utilized. In addition, as of December 31, 2015, we had federal and state research and development tax credit
75
Table of Contents
carryforwards of $2.8 million and $3.2 million. The federal research and development credit carryforwards will expire beginning in 2027 if not utilized. The state research and development tax credit carryforwards do not expire.
Utilization of NOL carryforwards and credits may be subject to substantial annual limitation due to the ownership change limitations provided by the Internal Revenue Code of 1986, as amended and similar state provisions. The annual limitation may result in the expiration of NOLs and credits before utilization.
ASC 740-10 clarifies the accounting for uncertainties in income taxes by prescribing guidance for the recognition, de-recognition and measurement in our financial statements of income tax positions taken in previously filed tax returns or tax positions expected to be taken in tax returns, including a decision whether to file or not to file in a particular jurisdiction. ASC 740-10 requires the disclosure of any liability created for unrecognized tax benefits. The application of ASC 740-10 may also affect the tax bases of assets and liabilities and therefore may change or create deferred tax liabilities or assets.
A reconciliation of the beginning and ending amount of unrecognized tax benefits is as follows (in thousands):
| Balance as of December 31, 2012 |
$ | 1,595 | ||
| Tax positions related to the current year: |
||||
| Additions |
615 | |||
|
|
|
|||
| Balance as of December 31, 2013 |
2,210 | |||
| Tax positions related to the current year: |
||||
| Additions |
774 | |||
|
|
|
|||
| Balance as of December 31, 2014 |
2,984 | |||
| Tax positions related to the current year: |
||||
| Additions |
436 | |||
| Tax positions related to the prior year: |
||||
| Reductions |
(285 | ) | ||
|
|
|
|||
| Balance as of December 31, 2015 |
$ | 3,135 | ||
|
|
|
Our total amounts of unrecognized tax benefits that, if recognized, that would affect its tax rate are $11,000 and $132,000 as of December 31, 2015 and 2014, respectively.
While it is often difficult to predict the final outcome of any particular uncertain tax position, we do not believe it is reasonably possible that the total amount of unrecognized tax benefit as of December 31, 2015 will materially change in the next twelve months.
Our policy is to classify interest and penalties associated with unrecognized tax positions, if any, as components of our income tax provision. Interest and penalties were not significant during the year ended December 31, 2015.
We file federal, state and foreign income tax returns in jurisdictions with varying statutes of limitations. Due to our net operating loss carryforwards, our income tax returns generally remain subject to examination by federal and most state authorities. In our foreign jurisdictions, the 2012 through 2015 tax years remain subject to examination by their respective tax authorities.
76
Table of Contents
Note 12. Net Loss Per Share.
The following outstanding common stock equivalents were excluded from the computation of diluted net loss per share for the periods presented because including them would have been antidilutive:
| Year Ended December 31, | ||||||||||||
| 2015 | 2014 | 2013 | ||||||||||
| Preferred stock |
— | 9,114,739 | 9,114,739 | |||||||||
| Stock options |
796,356 | 549,906 | 565,268 | |||||||||
| Restricted stock unit |
874,508 | — | — | |||||||||
| Preferred stock warrants |
— | 86,930 | 84,558 | |||||||||
| Common stock warrants |
411,514 | 218,618 | 218,618 | |||||||||
|
|
|
|
|
|
|
|||||||
| 2,082,378 | 9,970,193 | 9,983,183 | ||||||||||
|
|
|
|
|
|
|
|||||||
Note 13. Other Income (Expense), Net.
Other income (expense), net consisted of the following (in thousands):
| Year Ended December 31, | ||||||||||||
| 2015 | 2014 | 2013 | ||||||||||
| Revaluation of convertible preferred stock warrant liability |
$ | (907 | ) | $ | 206 | $ | 1,200 | |||||
| Other income (expense) |
212 | (92 | ) | (692 | ) | |||||||
|
|
|
|
|
|
|
|||||||
| Other income (expense), net |
$ | (695 | ) | $ | 114 | $ | 508 | |||||
|
|
|
|
|
|
|
|||||||
Note 14. Subsequent Events.
On February 25, 2016, we signed an agreement with Tower Jazz Panasonic Semiconductor Company (“TPSCo”) to manufacture Adesto’s 45 nm CBRAM products at TPSCo’s 300 nm fabrication facility in Hokuriku, Japan.
Note 15. Selected Unaudited Quarterly Financial Data
The following tables show a summary of the Company’s unaudited quarterly financial information for each of the four quarters of 2015 and 2014 (in thousands, except per share amounts):
| Three Months Ended | ||||||||||||||||
| December 31, | September 30, | June 30, | March 31, | |||||||||||||
| 2015 | 2015 | 2015 | 2015 | |||||||||||||
| Revenue |
$ | 11,826 | $ | 11,143 | $ | 10,600 | $ | 9,690 | ||||||||
| Gross profit |
$ | 5,397 | $ | 5,033 | $ | 4,194 | $ | 3,860 | ||||||||
| Net loss |
$ | (3,264 | ) | $ | (1,076 | ) | $ | (1,766 | ) | $ | (2,277 | ) | ||||
| Net loss per share - basic and diluted |
$ | (0.32 | ) | $ | (1.90 | ) | $ | (3.14 | ) | $ | (4.07 | ) | ||||
| Three Months Ended | ||||||||||||||||
| December 31, | September 30, | June 30, | March 31, | |||||||||||||
| 2014 | 2014 | 2014 | 2014 | |||||||||||||
| Revenue |
$ | 10,369 | $ | 10,034 | $ | 10,332 | $ | 10,730 | ||||||||
| Gross profit |
$ | 4,204 | $ | 3,701 | $ | 3,258 | $ | 4,770 | ||||||||
| Net loss |
$ | (1,380 | ) | $ | (2,371 | ) | $ | (3,006 | ) | $ | (2,177 | ) | ||||
| Net loss per share - basic and diluted |
$ | (2.50 | ) | $ | (4.40 | ) | $ | (5.57 | ) | $ | (4.04 | ) | ||||
| ITEM 9. | CHANGES IN AND DISAGREEMENTS WITH ACCOUNTANTS ON ACCOUNTING AND FINANCIAL DISCLOSURE |
None
77
Table of Contents
| ITEM 9A. | CONTROLS AND PROCEDURES |
Evaluation of Disclosure Controls and Procedures
We maintain “disclosure controls and procedures,” as such term is defined in Rule 13a-15(e) under the Securities Exchange Act of 1934 (the “Exchange Act”), that are designed to ensure that information required to be disclosed by us in reports that we file or submit under the Exchange Act is recorded, processed, summarized, and reported within the time periods specified in Securities and Exchange Commission rules and forms, and that such information is accumulated and communicated to our management, including our Chief Executive Officer (“CEO”) and Chief Financial Officer (“CFO”), as appropriate, to allow timely decisions regarding required disclosure.
Our management is responsible for establishing and maintaining our disclosure controls and procedures. Our CEO and CFO have evaluated the effectiveness of our disclosure controls and procedures as of December 31, 2015 and have concluded that these controls and procedures were effective. We believe that a control system, no matter how well designed and operated, can only provide reasonable assurance and cannot provide absolute assurance that the objectives of the control system are met, and no evaluation of controls can provide absolute assurance that all control issues and instances of fraud, if any, within a company have been detected. Our CEO and CFO have concluded that our consolidated financial statements for the periods covered by and included in this Annual Report on Form 10-K are fairly stated in all material respects in accordance with generally accepted accounting principles in the United States.
Exemption from Management’s Report on Internal Control over Financial Reporting
This report does not include a report of management’s assessment regarding internal control over financial reporting or an attestation report of our independent registered public accounting firm due to a transition period established by rules of the SEC for newly public companies.
Changes in Internal Control over Financial Reporting
We have previously reported on-going remediation efforts relating to the material weakness identified as of December 31, 2014 due to our lack of sufficient, qualified personnel in accounting and financial reporting functions with sufficient experience and expertise with respect to the application of U.S. GAAP and related financial reporting, which led to a delay in the closing of our books and resulted in a number of post-closing adjustments to our consolidated financial statements as of and for the years ended December 31, 2013 and 2014. During 2015, we hired additional qualified personnel in the accounting and financial reporting functions with such experience and expertise to remediate the material weakness. As of December 31, 2015, we have determined that the new controls are effectively designed and have demonstrated effective operation for a sufficient period of time to enable management to conclude the material weakness identified in 2015 has been remediated.
As required by Rule 13a-15(d) of the Exchange Act, our management, including our CEO and CFO, conducted an evaluation of our “internal control over financial reporting” as defined in Exchange Act Rule 13a-15(f) to determine whether any changes in our internal controls over financial reporting occurred during the three months ended December 31, 2015 that materially affected, or are reasonably likely to materially affect, our internal control over financial reporting. Based on that evaluation, other than as described above, there have been no such changes during the three months ended December 31, 2015.
| ITEM 9B. | OTHER INFORMATION |
None
78
Table of Contents
| ITEM 10. | DIRECTORS, EXECUTIVE OFFICERS AND CORPORATE GOVERNANCE |
The information required by this item is incorporated herein by reference to information contained in the Proxy Statement for our 2016 Annual Meeting of Stockholders.
We have adopted codes of ethics, our Code of Business Conduct and Ethics for employees, which applies to all employees, including our principal executive officers, our principal financial officer and all other executive officers, and our Code of Business Conduct and Ethics for Directors, which applies to our board of directors. The Codes of Business Conduct and Ethics are available on our website at www.ir.adestotech.com under “Corporate Governance.” We intend to satisfy the disclosure requirement under Item 5.05 of Form 8-K regarding amendment to, or waiver from, a provision of our Code of Business Conduct and Ethics by posting such information on our website at the address and location specified above.
| ITEM 11. | EXECUTIVE COMPENSATION |
The information required by this item is incorporated herein by reference to information contained in the Proxy Statement for our 2016 Annual Meeting of Stockholders.
ITEM 12. SECURITY OWNERSHIP OF CERTAIN BENEFICIAL OWNERS AND MANAGEMENT AND RELATED STOCKHOLDER MATTERS
The information required by this item is incorporated herein by reference to information contained in the Proxy Statement for our 2016 Annual Meeting of Stockholders.
| ITEM 13. | CERTAIN RELATIONSHIPS AND RELATED TRANSACTIONS, AND DIRECTOR INDEPENDENCE |
The information required by this item is incorporated herein by reference to information contained in the Proxy Statement for our 2016 Annual Meeting of Stockholders.
| ITEM 14. | PRINCIPAL ACCOUNTANT FEES AND SERVICES |
The information required by this item is incorporated herein by reference to information contained in the Proxy Statement for our 2016 Annual Meeting of Stockholders.
79
Table of Contents
| ITEM 15. | EXHIBITS AND FINANCIAL STATEMENT SCHEDULES |
We have filed the following documents as a part of this Annual Report on Form 10-K:
(a) Financial Statements
| Page | ||||
| 47 | ||||
| 48 | ||||
| 49 | ||||
| 50 | ||||
| Consolidated Statements of Convertible Preferred Stock and Stockholders’ Equity (Deficit) |
51 | |||
| 52 | ||||
| 53 | ||||
(b) Financial Statement Schedules
All schedules have been omitted because the required information is not present or not present in amounts sufficient to require submission of the schedules or because the information required is included in the Consolidated Financial Statements or notes thereto.
(c) Exhibits
The list of exhibits filed with this report is set forth in the Exhibit Index following the signature pages and is incorporated herein by reference.
80
Table of Contents
SIGNATURES
Pursuant to the requirements of Section 13 or 15(d) of the Securities Exchange Act of 1934, the Registrant has duly caused this Annual Report on Form 10-K to be signed on its behalf by the undersigned, thereunto duly authorized, in Sunnyvale, California, on the 30th day of March 2016.
| ADESTO TECHNOLOGIES CORPORATION | ||
| By: | /s/ Narbeh Derhacobian | |
| Narbeh Derhacobian Chief Executive Officer | ||
POWER OF ATTORNEY
KNOW ALL PERSONS BY THESE PRESENTS, that each person whose signature appears below hereby constitutes and appoints Narbeh Derhacobian and Ron Shelton, and each of them, as his true and lawful attorneys-in-fact, proxies and agents, each with full power of substitution, for him in any and all capacities, to sign any and all amendments to this Annual Report on Form 10-K, and to file the same, with all exhibits thereto and other documents in connection therewith, with the Securities and Exchange Commission, granting unto said attorneys-in-fact, proxies and agents full power and authority to do and perform each and every act and thing requisite and necessary to be done in connection therewith, as fully for all intents and purposes as he might or could do in person, hereby ratifying and confirming all that said attorneys-in-fact, proxies and agents, or their or his substitute or substitutes, may lawfully do or cause to be done by virtue hereof.
Pursuant to the requirements of the Securities Exchange Act of 1934, this report has been signed below by the following persons on behalf of the Registrant and in the capacities and on the dates indicated.
| Signature |
Title |
Date | ||
| /s/ Narbeh Derhacobian Narbeh Derhacobian |
President, Chief Executive Officer and Director (Principal Executive Officer) |
March 30, 2016 | ||
| /s/ Ron Shelton Ron Shelton |
Chief Financial Officer (Principal Accounting and Financial Officer) |
March 30, 2016 | ||
| /s/ Nelson Chan Nelson Chan |
Director | March 30, 2016 | ||
| /s/ Barry Cox Barry Cox |
Chairman | March 30, 2016 | ||
| /s/ Keith Crandell Keith Crandell |
Director | March 30, 2016 | ||
| /s/ Francis Lee Francis Lee |
Director | March 30, 2016 | ||
| /s/ Kevin Palatnik Kevin Palatnik |
Director | March 30, 2016 | ||
81
Table of Contents
EXHIBIT INDEX
| Exhibit | Incorporated by Reference | Filed | ||||||||||
| Number |
Description of Exhibit |
Form | File No. | Exhibit | Filing Date | Herewith | ||||||
| 3.1 | Restated Certificate of Incorporation. | S-1/A | 333-206940 | 3.02 | 10/5/2015 | |||||||
| 3.2 | Amended and Restated Bylaws. | S-1/A | 333-206940 | 3.04 | 10/5/2015 | |||||||
| 4.2 | Fourth Amended and Restated Investors’ Rights Agreement | S-1 | 333-206940 | 4.01 | 9/14/2015 | |||||||
| 10.1+ | Form of Indemnification Agreement. | S-1/A | 333-206940 | 10.01 | 10/5/2015 | |||||||
| 10.2+ | 2007 Equity Incentive Plan and form of option grant. | S-1 | 333-206940 | 10.02 | 9/14/2015 | |||||||
| 10.3+ | 2015 Equity Incentive Plan and form of equity awards. | S-1/A | 333-206940 | 10.03 | 10/5/2015 | |||||||
| 10.4+ | 2015 Employee Stock Purchase Plan. | S-1/A | 333-206940 | 10.04 | 10/5/2015 | |||||||
| 10.5+ | Amended and Restated Employment Agreement, by and between the Registrant and Narbeh Derhacobian, dated August 16, 2013. | S-1 | 333-206940 | 10.08 | 9/14/2015 | |||||||
| 10.6+ | Offer Letter, dated May 30, 2013, by and between the Registrant and Ron Shelton. | S-1 | 333-206940 | 10.09 | 9/14/2015 | |||||||
| 10.7+ | Amended and Restated Offer of Employment, dated August 16, 2013, between the Registrant and Ishai Naveh. | X | ||||||||||
| 10.8 | Standard Industrial/Commercial Multi-Tenant Lease by and between the Registrant and DeGuigne Ventures, LLC dated May 3, 2011. | S-1 | 333-206940 | 10.05 | 9/14/2015 | |||||||
| 10.9 | Amendment to Commercial Sublease by and between the Registrant and eGain Corporation, dated November 2, 2015. | 8-K | 001-37582 | 10.1 | 11/2/2015 | |||||||
| 10.10 | Lease by and between the Registrant and Peterson Ridge LLC, dated November 2, 2015. | 8-K | 001-37582 | 10.2 | 11/2/2015 | |||||||
| 10.11 | Credit Agreement, dated April 30, 2015, among the Registrant, Artemis Acquisition LLC and Opus Bank. | S-1 | 333-206940 | 10.11 | 9/14/2015 | |||||||
| 10.12 | Cell Library License Agreement by and between the Registrant and Atmel Corporation, dated September 28, 2012. | S-1 | 333-206940 | 10.12 | 9/14/2015 | |||||||
| 10.13 | Process Technology and IP License Agreement by and between the Registrant and Atmel Corporation, dated September 28, 2012. | S-1 | 333-206940 | 10.13 | 9/14/2015 | |||||||
82
Table of Contents
| Exhibit | Incorporated by Reference | Filed | ||||||||||
| Number |
Description of Exhibit |
Form | File No. | Exhibit | Filing Date | Herewith | ||||||
| 23.1 | Consent of Independent Registered Public Accounting Firm. | X | ||||||||||
| 24.1 | Power of Attorney (see page 81 of this report). | X | ||||||||||
| 31.1 | Certification of Periodic Report by Principal Executive Officer under Section 302 of the Sarbanes-Oxley Act of 2002. | X | ||||||||||
| 31.2 | Certification of Periodic Report by Principal Financial Officer under Section 302 of the Sarbanes-Oxley Act of 2002. | X | ||||||||||
| 32.1* | Certification of Chief Executive Officer Pursuant to 18 U.S.C. Section 1350 as Adopted Pursuant to Section 906 of the Sarbanes-Oxley Act of 2002. | X | ||||||||||
| 32.2* | Certification of Chief Financial Officer Pursuant to 18 U.S.C. Section 1350 as Adopted Pursuant to Section 906 of the Sarbanes-Oxley Act of 2002. | X | ||||||||||
| 101.INS | XBRL Instance Document. | X | ||||||||||
| 101.SCH | XBRL Taxonomy Extension Schema Document. | X | ||||||||||
| 101.CAL | XBRL Taxonomy Extension Calculation Linkbase Document. | X | ||||||||||
| 101.DEF | XBRL Taxonomy Extension Definition Linkbase Document. | X | ||||||||||
| 101.LAB | XBRL Taxonomy Extension Label Linkbase Document. | X | ||||||||||
| 101.PRE | XBRL Taxonomy Extension Presentation Linkbase Document. | X | ||||||||||
| + | Indicates a management contract or compensatory plan. |
| * | As contemplated by Securities Exchange Commission Release No. 33-8212, these exhibits are furnished with this Annual Report on Form 10-K and are not deemed filed with the Securities and Exchange Commission and are not incorporated by reference in any filing of Adesto Technologies Corporation under the Securities Act of 1933, as amended, or the Exchange Act of 1934, whether made before or after the date hereof and irrespective of any general incorporation language in such filings. |
83