Attached files
| file | filename |
|---|---|
| EX-32.2 - EX-32.2 - ADESTO TECHNOLOGIES Corp | iots-20191231ex32297a582.htm |
| EX-32.1 - EX-32.1 - ADESTO TECHNOLOGIES Corp | iots-20191231ex321775f45.htm |
| EX-31.2 - EX-31.2 - ADESTO TECHNOLOGIES Corp | iots-20191231ex3127a6850.htm |
| EX-31.1 - EX-31.1 - ADESTO TECHNOLOGIES Corp | iots-20191231ex311db8db5.htm |
| EX-23.1 - EX-23.1 - ADESTO TECHNOLOGIES Corp | iots-20191231ex2312bee47.htm |
| EX-4.4 - EX-4.4 - ADESTO TECHNOLOGIES Corp | iots-20191231ex44e022a1c.htm |
UNITED STATES
SECURITIES AND EXCHANGE COMMISSION
Washington, D.C. 20549
Form 10-K
(Mark One)
☒ ANNUAL REPORT PURSUANT TO SECTION 13 OR 15(d) OF THE SECURITIES EXCHANGE ACT OF 1934
For the fiscal year ended December 31, 2019
OR
☐ TRANSITION REPORT PURSUANT TO SECTION 13 OR 15(d) OF THE SECURITIES EXCHANGE ACT OF 1934
For the transition period from to
001-37582
(Commission File No.)
ADESTO TECHNOLOGIES CORPORATION
(Exact name of Registrant as specified in its charter)
|
Delaware |
16-1755067 |
|
(State or other jurisdiction of |
(I.R.S. Employer |
|
3600 Peterson Way |
95054 |
|
(Address of principal executive offices) |
(Zip Code) |
(408) 400-0578
(Registrant’s telephone number, including area code)
Securities registered pursuant to Section 12(b) of the Act:
|
Title of each class |
Name of each exchange on which registered |
|
|
Common Stock, par value $0.0001 per share |
The Nasdaq Stock Market |
Securities registered pursuant to Section 12(g) of the Act:
None
Indicate by check mark if the Registrant is a well-known seasoned issuer, as defined in Rule 405 of the Securities Act. Yes ☐ No ☒
Indicate by check mark if the Registrant is not required to file reports pursuant to Section 13 or Section 15(d) of the Act. Yes ☐ No ☒
Indicate by check mark whether the registrant (1) has filed all reports required to be filed by Section 13 or 15(d) of the Securities Exchange Act of 1934 (Exchange Act) during the preceding 12 months (or for such shorter period that the registrant was required to file such reports), and (2) has been subject to such filing requirements for the past 90 days. Yes ☒ No ☐
Indicate by check mark whether the registrant has submitted electronically every Interactive Data File required to be submitted pursuant to Rule 405 of Regulation S-T (§232.405 of this chapter) during the preceding 12 months (or for such shorter period that the registrant was required to submit such files). Yes ☒ No ☐
Indicate by check mark whether the registrant is a large accelerated filer, an accelerated filer, a non-accelerated filer, a smaller reporting company, or emerging growth company. See definitions of “large accelerated filer,” “accelerated filer,” “smaller reporting company,” and “emerging growth company” in Rule 12b‑2 of the Exchange Act.
|
Large accelerated filer |
☐ |
|
Accelerated filer |
☒ |
|
|
|
|
|
|
|
Non-accelerated filer |
☐ |
|
Smaller reporting company |
☐ |
|
|
|
|
|
|
|
|
|
|
Emerging growth company |
☒ |
If an emerging growth company, indicate by check mark if the registrant has elected not to use the extended transition period for complying with any new or revised financial accounting standards provided pursuant to Section 13(a) of the Exchange Act. ☒
Indicate by check mark whether the Registrant is a shell company (as defined in Rule 12b‑2 of the Exchange Act). Yes ☐ No ☒
The aggregate market value of voting stock held by non-affiliates of the Registrant on June 30, 2019, based on the closing price of $8.15 for shares of the Registrant’s common stock as reported by The Nasdaq Stock Market, was approximately $216.8 million. Shares of common stock held by each executive officer, director and their affiliated holders have been excluded on the grounds that such persons may be deemed to be affiliates. This determination of affiliate status is not necessarily a conclusive determination for other purposes. The registrant has no non-voting common equity.
As of March 6, 2020, there were 30,792,551 shares of the Registrant’s common stock outstanding.
DOCUMENTS INCORPORATED BY REFERENCE
The registrant intends to file a definitive proxy statement pursuant to Regulation 14A within 120 days after the end of the fiscal year ended December 31, 2019. Portions of such proxy statement are incorporated by reference into Part II and Part III of this Annual Report on Form 10-K.
SPECIAL NOTE REGARDING FORWARD-LOOKING STATEMENTS
This report contains forward-looking statements. All statements contained in this report other than statements of historical fact, including statements regarding our future results of operations and financial position, our business strategy and plans and our objectives for future operations, are forward-looking statements. The words “believe,” “may,” “will,” “potentially,” “estimate,” “continue,” “anticipate,” “intend,” “could,” “would,” “project,” “plan,” “expect,” “seek” and similar expressions are intended to identify forward-looking statements. We have based these forward-looking statements largely on our current expectations and projections about future events and trends that we believe may affect our financial condition, results of operations, business strategy, short-term and long-term business operations and objectives and financial needs. These forward-looking statements are subject to a number of risks, uncertainties and assumptions, including those described in the “Risk Factors” section and elsewhere in this report. Moreover, we operate in a very competitive and rapidly changing environment, and new risks emerge from time to time. It is not possible for our management to predict all risks, nor can we assess the impact of all factors on our business or the extent to which any factor, or combination of factors, may cause actual results to differ materially from those contained in any forward-looking statements we may make. In light of these risks, uncertainties and assumptions, the forward-looking events and circumstances discussed in this report may not occur and actual results could differ materially and adversely from those anticipated or implied in the forward-looking statements.
You should not rely upon forward-looking statements as predictions of future events. Although we believe that the expectations reflected in the forward-looking statements are reasonable, we cannot guarantee that the future results, levels of activity, performance or events and circumstances reflected in the forward-looking statements will be achieved or occur. We undertake no obligation to update publicly any forward-looking statements for any reason after the date of this report to conform these statements to actual results or to changes in our expectations, except as required by law.
As used in this report, the terms “Adesto,” “we,” “us,” and “our” mean Adesto Technologies Corporation and its subsidiaries unless the context indicates otherwise.
1
Overview
We are a leading provider of innovative, application-specific semiconductors and embedded systems that provide the key building blocks of Internet of Things (IoT) edge devices operating on networks worldwide. Our broad portfolio of semiconductor and embedded technologies are optimized for connected IoT devices used in industrial, consumer, communications and medical applications. Through expert design, systems expertise and proprietary intellectual property, we enable our customers to differentiate their systems where it matters most for IoT: longer battery life, greater reliability, integrated intelligence and lower cost. Through our solutions, we enable seamless access to data and control of ‘things’ in the connected world.
‘Internet of Things’ describes the technology paradigm that infuses intelligence and connectivity in the physical world to transform human experience and enhance business outcomes. The ability to integrate sensing and control technologies with communication functions is allowing ordinary objects to interact with their environment and communicate in a broad network. The Internet connected people together, and IoT is connecting things. IoT transformation is occurring across many segments from consumer markets to healthcare to the broad industrial segment.
We have deep experience across a variety of technologies used in IoT deployments in many segments. Our products are shipping in a broad range of connected products from smart utility meters to wearable fitness trackers and medical monitors to home automation and building control systems to satellite communications and fleet management.
Our customers use our broad portfolio of products and systems to design and build solutions within their own end markets. Our products are designed to deliver system performance and cost advantages to the end customers in their IoT deployments. These products can be classified into three broad groups: Application Specific Non-Volatile Memory, Embedded Systems, and Application Specific Integrated Circuits (ASICs).
Non-Volatile Memory (NVM) is a key component in every system design. It sits at the core of every system and stores critical programs and data, controls how the system boots, and affects overall performance. We design and deliver ultra-low power, smart NVM devices that enable a new class of connected applications. We sell our NVM devices to leading original equipment manufacturers (OEMs) and original design manufacturers (ODMs) who select our memories because of their distinct advantages for specific applications. Unlike commodity NVM devices, our value-add products are designed with the target system requirements in mind, enabling significant improvements in system performance and power consumption.
Our Embedded Systems offerings consist of edge devices (chips for communication and control, including narrowband transceivers for Free Topology (FT) and power line communications as well as edge gateways (for bridging between networks), and software and management tools to manage the deployment of these solutions. Our solutions are used by a wide array of OEMs and system integrators across a broad spectrum of Industrial IoT (IIoT) markets.
With our Application-Specific Integrated Circuit (ASIC) and RF/mixed-signal intellectual property (IP) solutions, we help our customers who include OEMs, service providers, semiconductor vendors, and systems houses to design more optimized solutions for their end-markets. We complement their in-house system application knowledge and combine our IP with theirs to design and deliver exclusive, custom chips. By shrinking customers’ systems into custom ASICs, we can significantly cut their product unit costs, while boosting their product performance and reliability and providing product differentiation and protection. We combine our expertise in chip design and supply chain management to deliver finished products that help customers optimize their bills of materials (BOMs) and electronic system designs. We receive non-recurring engineering (NRE) revenue for designing each ASIC along with license fees for any of our IP which is incorporated into the ASIC, and once the customer transitions to production, we supply the actual ASICs for the life of the product. Our ASIC team has completed over 200 successful chips designed in a broad
2
range of applications. Our custom ASICs, which are capable of integration with our embedded offerings, enable Adesto to provide unique future differentiation for our IIoT customers.
The IIoT is a key area for Adesto, and this is where our solutions converge to provide unique value. The IIoT refers to communities of rules-based, self-directed devices that reside in commercial or industrial environments and operate with little or no human interaction. These devices are found in environments that are often harsh in nature (e.g., extreme temperature, vibration, noise, humidity, dust) with intermittent connectivity. Specialized requirements of the IIoT include non-compromising control capability, proven reliability, hardened security, and product longevity. Unlike the consumer IoT, the IIoT has many business logic and mission critical requirements and long product lifecycles. The nature of evolving commercial and industrial environments means that IIoT systems must integrate decades of existing and in-service infrastructure that is already deployed in the field. When these solutions are connected, they generally communicate with protocols developed over many years which are often dedicated to specific applications. In IIoT deployments, new systems which require utilizing Internet Protocol (TCP/IP based networks) must interoperate with systems running mature operational technology protocols such as LonWorks, BacNet and Modbus. We believe that bridging this gap is an opportunity for Adesto.
In addition to the IIoT, significant markets for our ASIC and IP solutions include the communications market – both wireless and wireline – and certain consumer segments. The emergence of new communications standards including 5G, next-generation DSL, as well as the demand for broader, cheaper satellite broadband access, coupled with the need to provide security of information are just a few of the emerging trends that will drive demand for new high-performance, highly reliable, and highly integrated solutions that can be facilitated by an ASIC.
We were originally incorporated in California in January 2006 and reincorporated in Delaware in October 2015. We completed our initial public offering, or IPO, of common stock in October 2015. Prior to 2018, our business was solely focused on designing and delivering application-specific NVM products. In May 2018, we completed the acquisition of S3 Asic Semiconductors Limited, or S3 Semiconductors, a provider of analog, mixed-signal and radio frequency (“RF”) custom ASICs and IP cores. This transaction formed the basis of our ASIC business. In September 2018, we completed the acquisition of Echelon Corporation, a pioneer in developing open-standard control networking platforms. This transaction formed the basis of our Embedded Systems business. These acquisitions have changed our business profile significantly. We now offer a broad array of semiconductor and embedded systems products that provide powerful advantages to our IoT customers. Our solutions go far beyond memory devices and include application-specific semiconductors for communication and control at the edge of IoT, smart gateways, network management platforms and tools for our customers to deploy our solutions within their businesses. We believe there is unique value to be gained as we look to future roadmaps that leverage combined solutions.
Our principal executive offices are located at 3600 Peterson Way, Santa Clara, California 95054 and our main telephone number is (408) 400‑0578. We also have regional offices in China, the Czech Republic, Ireland, Portugal, Taiwan, and the United Kingdom. Our website is www.adestotech.com. The contents of our website are not incorporated into, or otherwise to be regarded as part of, this Annual Report on Form 10‑K.
On February 20, 2020, we entered into an Agreement and Plan of Merger (“Merger Agreement”) with Dialog Semiconductor plc, or Dialog, and Azara Acquisition Corp., a wholly owned direct or indirect subsidiary of Dialog (“Merger Sub”), pursuant to which Merger Sub will, pursuant to the terms of, and subject to the conditions specified in, the Merger Agreement, merge with and into us (“Merger”), and we will be the surviving corporation in the Merger and become a wholly owned direct or indirect subsidiary of Dialog. Upon the terms and subject to the conditions set forth in the Merger Agreement, at the effective time of the Merger, each share of our common stock (subject to certain exceptions) issued and outstanding immediately prior to the effective time of the Merger will be canceled and automatically converted into the right to receive $12.55 in cash, without interest and subject to any required tax withholding. Our Board of Directors has unanimously determined that the Merger is advisable and fair to, and in the best interests of, us and our stockholders, and unanimously recommended the adoption of the Merger Agreement by the
3
holders of our common stock. The Merger is expected to close in the third quarter of 2020, subject to customary regulatory approvals and customary closing conditions. For more information see Note 17, “Subsequent Event,” in the notes to our consolidated financial statements.
Our Solutions
Our broad product portfolio includes non-volatile memory devices, analog and mixed-signal ASICs and IP cores, standard communication and control chips for IoT edge, communication modules, gateways and edge-servers. We also provide software, software development kits (SDKs), tools, and other solutions to help customers get to market quickly and easily with our products.
Memory Products
Most IoT edge and other electronic systems require NVMs to store executable firmware, update this firmware over the air (OTA) and log important data collected at the edge for future upload into the cloud. Our NVM products are created with specific features in mind and improve performance while dramatically reducing energy consumption and extending battery life. Reliability, enhanced security, product longevity and system cost are other decision factors for all customers, and particularly for IIoT applications. We optimize each product family for specific applications such as Execute-in-Place operation, datalogging and battery-operated devices.
Our products allow for greater efficiency than competing commodity NVM products in storing small packets of data for the IoT. This simplifies the microcontroller operation for data-logging, enables dramatic increases in battery life and enhances the reliability of the flash memory components. By incorporating power management features in our NVM products, we enable our customers to reduce the number of components and the overall footprint of their systems, thereby lowering the total cost of their systems. Some of our products can significantly improve system performance and power consumption by enabling the use of intelligent design to accelerate data handling capability between microprocessor and memory components.
Adesto’s value-add NVM products include:
DataFlash. Our DataFlash family is specially designed for data-logging applications such as smart meters, industrial and home automation sensing, health and fitness tracking. This family features byte-write capability and integrated Static Random Access Memory (SRAM), simplifying and minimizing the associated software stack. Offloading the MCU also reduces the overall system energy consumption.
Dual/Quad SPI Memory. Our Fusion Serial Flash family – including the new FusionHD product – is designed for compatibility, featuring industry standard features and pin outs that can work in any new or pre-existing design. In addition, we offer advanced features such as small page erase, security features, battery health monitoring and ultra-deep power down modes which allow battery operated devices to be designed more cost effectively and maximize the battery life. These devices are designed for use in a wide variety of industrial and consumer applications including wearables, IoT edge products and RF modules.
Octal xSPI Memory. Our EcoXiP double data rate (DDR) octal interface product family represents a new generation of non-volatile memory products ideal for execute-in-place (XiP) applications in embedded IoT systems. Unlike other NVM devices which are primarily in sleep mode, EcoXiP is intended to be active during system operation. EcoXiP features enable significant reduction in operating power while improving processor performance. EcoXiP’s unique concurrent read and write feature simplifies the software and hardware impact of implementing Over-the-Air (OTA) updates and offers system designers increased flexibility for adding additional code or data logging memory to a system. A proprietary pre-fetching scheme to optimize throughput is another key performance innovation. EcoXiP also offers best-in-class power management features.
4
In addition to value-add and application-specific memories, Adesto offers high-quality standard serial flash devices with industry standard features to store boot or program code with a low-pin-count standard serial interface. Adesto’s standard serial flash products are used in a variety of applications including smart home applications, consumer electronics, and industrial applications which demand quality and performance.
Adesto offers a variety of advanced package options for most of its product line. These include wafer-level Chip Scale Package (CSP) for very small footprint applications and Known Good Die (KGD) for incorporation into System-in-Package (SiP) and Multi-Chip Module (MCM) solutions.
In addition, Adesto provides our patented Conductive Bridging RAM (CBRAM) technology. This Resistive RAM (RRAM) technology has ultra-low power consumption and also has the unique ability to survive in harsh environments and withstand medical sterilization procedures. Commercial products using CRAM are shipping today. CBRAM is targeted for use as embedded memory in battery operated products such as medical and sensor devices.
Embedded Systems Solutions
Our embedded components, modules, edge servers and software enable OEMs and system integrators to quickly develop IIoT devices for their end users. With Adesto’s embedded solutions, OEMs, application developers, and integrators can rapidly build innovative and interoperable solutions that meet the unique requirements of the IIoT, such as automation and control, industrial-strength reliability, and scalability. Our solutions enable customers to reduce energy consumption, capital and operating costs, and maintenance; more accurately control business-critical conditions; establish a platform for additional networked applications; and collect data for better asset utilization, increased efficiencies, and powerful predictive analytics. We categorize our products in a three-tier architecture: an edge device tier, an edge server tier, and a management tier.
Edge Device Tier. Products in the edge device tier include chips, Systems on Chips (SoCs), and protocol stacks for control and communications which are embedded in Industrial IoT devices such as load controllers, lighting ballasts, meters, and thermostats to enable them to act as peers working together to collect data and take cooperative action. These individual devices are managed by edge servers, such as our SmartServer™ IoT edge server. Devices in this tier include Free Topology (FT) transceivers, power line communications transceivers and Neuron controllers.
Free Topology Transceivers. Adesto’s Free Topology (FT) technology is widely used to connect ‘things’ in industrial environments including buildings, machines, and cities. FT wiring is designed for flexible device installation since it doesn’t require a strict set of wiring rules. It is also designed to simplify network expansion by eliminating restrictions on wire routing, splicing, and device placement. Our customer programmable FT 6000 family of Smart Transceiver SoCs, including the FT 6050, integrate the scheduler, IO blocks, and communications protocol in a single package.
Power Line Communications Transceivers. Our power line communications solutions are designed for industrial applications including smart grid, automated metering infrastructure (AMI), solar and alternative energy management and industrial automation. Products include the SM2400 family, a universal communications platform that supports industry standard OFDM protocols such as G3-PLC, PRIME and robust proprietary modes for harsh network conditions.
Neuron Controllers. Our Neuron line of controllers incorporates communication and control functions on a single chip, in both hardware and firmware, to facilitate the design of a LonTalk, LonTalk/IP or BACnet/IP device. Neuron processors can interface at a wide range of data rates with a wide variety of media transceivers, including twisted pair, RF, IR, fiber-optics, and coaxial.
5
Edge Server Tier. At the edge server tier, various control technologies and protocols are unified and supervised so that local decisions can be made at the edge device tier level. An example of an edge server is the SmartServer™ IoT. Other products in this tier include the i.LON 700 edge router and network interface. In general, these products communicate southbound to control protocols such as LonWorks technology, BACnet, and Open Smart Grid Protocol (OSGP) and northbound to remote clients, web applications, and cloud services through an IP interface. They feature open APIs for control and IoT use cases.
Management Tier. At the management tier, our solutions connect the edge server tiers to enterprise software / cloud / information technology solutions, so business rules can be established for the control system, and operational data can be archived for later analysis. Products in this tier include the IzoT Net Server and Commissioning Tool which enable IoT network deployment, the SmartServer IoT Central Management System (CMS) which allows devices connected to the SmartServer to be easily accessed, and application programming interfaces (APIs) for developers and integrators to create custom solutions.
Analog, Mixed-Signal and RF ASIC and IP Products
We provide analog, mixed-signal and RF ASICs and IP blocks, and manage every aspect of supplying high-quality devices to our customers.
Full Custom ASICs. Our custom ASICs are analog-intensive mixed-signal solutions that provide OEMs with many advantages, often enabling them to reduce bill-of-materials costs by 80% or more while creating smaller systems with fewer components. In addition, custom ASICs can provide systems with significant performance enhancements, lower power consumption, greater reliability and less risk of obsolescence. A sample of our portfolio of full-custom ASICs includes:
|
· |
Satellite L-band transceivers |
|
· |
Analog-baseband ASIC for broadband wireless access |
|
· |
Embedded ASIC for critical industrial flow-control |
|
· |
Precision digitization ASIC for portable DNA sequencing |
|
· |
Mixed-signal ASIC with machine learning for a consumer Augmented Reality (AR) application |
|
· |
Wireless power transmit/receive ASICs |
Analog, Mixed-Signal and RF IP Cores. We leverage our high-quality, silicon-proven IP blocks in custom ASIC designs and we also license our IP to third parties. Our continually growing portfolio of analog and mixed signal IP cores offers class-leading performance, power consumption and area. Products include:
|
· |
Analog-Front-End (AFE) IP optimized for communications applications such as LTE-A,802.11ac/ax and G.Fast, multi-mode GNSS, and PLC comprising data convertors, clocking and auxiliary circuitry tailored for exact performance, power and area |
|
· |
Data Converters including Analog to Digital Converters (ADCs) and Digital to Analog Converters (DACs) targeting high-speed applications and high-precision applications |
6
|
· |
Power and Reference IP including a comprehensive portfolio of both linear regulators and DC-DC converters in addition to Power-on-Reset and reference circuitry; as well as a silicon-proven customizable Power Management IC solution targeting portable consumer devices |
|
· |
RF building blocks including Low Noise Amplifiers (LNAs), Mixers, Variable Gain Amplifiers (VGAs) rectifiers, transmitters, and power amplifiers targeting cellular, satellite, digital video broadcasting (DVB) and IMS Multimedia Subsystem (IMS) applications |
|
· |
Clock IP comprising versatile programmable Phase Locked Loops (PLLs) with low jitter and low power, ideal for power constrained applications |
|
· |
Embedded sensor IP that provides for real-time precision temperature sensing for SoC performance optimization and characterization |
Customers
For our semiconductor products, our end customers include leading tier‑1 OEMs and ODMs that use our products across multiple industries and applications. During the year ended December 31, 2019, more than 5,000 end customers purchased our products.
We generate most of our revenue from sales of our NVM products to independent, non-exclusive distributors of our memory products, which many of our end customers use as an alternative means of fulfillment to direct purchases from us. For the year ended December 31, 2019, sales of our products to Action Technology (HK) Co. Ltd. and Arrow Electronics accounted for approximately 16% and 13%, respectively, of our revenue. For the year ended December 31, 2018, sales of our products to Arrow Electronics accounted for approximately 17% of our revenue. For the year ended December 31, 2017, sales of our products to Arrow Electronics and SAS Electronic Company accounted for approximately 18% and 10%, respectively, of our revenue. No end customers provided 10% or more of our revenues for the years 2019, 2018, and 2017. A majority of our revenue for 2019 was generated by approximately 25 end customers.
For our embedded systems products, during the year ended December 31, 2019, we had two customers that accounted for a significant portion of our revenues: Avnet Europe Comm VA (“Avnet”), the primary distributor of our IIoT products in Europe and Japan, and Weikeng, the primary distributor in China and Southeast Asia.
For our ASIC products, our customers include tier-one satellite operators such as Inmarsat and Iridium, industrial customers such as Flowserve, and wireless access customers. Initial revenues are achieved during the design phase of the ASIC when our engineering teams are working closely with our customers to architect and implement the most effective ASIC solution which will meet the customers’ requirements. Each ASIC project is underpinned by a specific contract covering the scope of the ASIC development, the NRE fees and any applicable IP license fees. The NRE and IP license fees are payable upon the successful achievement of project milestones as defined in the contract.
Sales
We sell our products through our worldwide sales organization and through our channel of representatives and distributors. We organize our sales resources by region, within which sales personnel may work directly with large OEM customers. We have sales personnel covering the Americas, Asia Pacific and Europe, Middle East and Africa.
We also work closely with select partners who lead in their markets to demonstrate to potential customers the value of our combined solutions. This includes microcontroller vendors, cloud providers, system integrators, and others.
7
We work directly with customers to have our NVM devices designed into and qualified for their products, which we refer to as design wins. Although we maintain direct sales, support and development relationships with our end customers, most of our NVM products are sold to end customers through our distribution partners.
We sell our embedded platform to OEMs and system integrators in the building, lighting, and industrial controls markets directly and through distribution worldwide. These efforts are supported with application engineering, technical support, and industry experts working out of the U.S. as well as China, Japan, South Korea, Malaysia, the Netherlands, and the United Kingdom. Regional sales personnel work directly with large OEM customers such as Honeywell, Schneider, Parker Hannifin, Trane, and others.
Our IP products are sold to third parties primarily through our Design & Reuse web portal and through representatives located in the United States and Asia. In certain cases we are able to upsell to complete ASIC delivery by leveraging our IP.
Manufacturing
Semiconductor Manufacturing
For our semiconductor products including edge devices, ASICs and NVMs, we employ a fabless manufacturing business model and rely on third-party suppliers for all phases of the manufacturing process, including fabrication, assembly and testing. Our fabless business model allows us to leverage the expertise of industry-leading suppliers in such areas as fabrication, assembly, quality control and assurance, reliability and testing, and avoid the significant costs and risks associated with owning and operating such manufacturing operations. These suppliers also are responsible for procurement of raw materials used in the production of our products. As a result, we are able to focus our resources on product design, additional quality assurance, marketing and customer support.
We do not have a guaranteed level of production capacity from any of our suppliers’ facilities for the production of our products. We carefully qualify each of our suppliers and their subcontractors and processes to ensure they meet our standards for quality and reliability.
Wafer Fabrication. We currently manufacture the majority of our semiconductor product at United Microelectronics Corporation (UMC) in Taiwan. In addition to UMC, we use other foundries including XMC, a foundry in Wuhan, China, Semiconductor Manufacturing International Corporation (SMIC) based in Shanghai, China, Taiwan Semiconductor Manufacturing (TSMC) in Taiwan, Winbond Corporation in Taiwan and others.
Assembly, Testing and Wafer Probe. We maintain multiple sources for assembly and final testing of our products. Amkor Technology, Inc. in Taiwan, Korea and the Philippines, Deca Technologies in the Philippines, as well as Greatek Electronics Inc. in Taiwan currently provide substantially all of our assembly and final test services for our NVM products. Our wafer probing is performed by King Yuan Electronics Co., Ltd. in Taiwan and Teraprobe in Japan. Assembly of our ASIC products is done through Advanced Semiconductor Engineering (ASE) in Taiwan. We continually monitor the manufacturing and testing of our products at all of our contractors to ensure that our manufacturing and testing procedures are properly implemented. Based on industry standard requirements, we perform reliability stress testing on the products that we produce and sell. Through this testing, we can detect and accelerate the presence of defects that may arise over the life of a product. As part of our total quality assurance program, our quality management system has been certified to ISO 9001:2115 standards. Our foundry, assembly and test vendors are also ISO 9001 certified.
8
System-Level Manufacturing
We use design and manufacturing services from third parties where it reduces our costs and takes advantage of consolidated purchasing power. We outsource all of our system-level manufacturing and limit our internal supply chain activities to quality inspection, system integration, custom configuration, final testing, and order fulfillment. We maintain work in process and finished good inventory in order to quickly respond to customer orders placed with relatively short delivery schedule.
For products requiring board level manufacturing, we utilize both third-party ODMs and contract electronic manufacturers (CEMs). CEMs procure component level materials and assemble, test, and inspect the final products to our design specifications. Our ODM vendors perform the same services as CEMs but also provide design services to our product requirements.
Research and Development
We believe that our continued success depends on our ability to both introduce improved versions of our existing solutions and to develop new solutions for the markets that we serve. We have made and intend to continue to make investments in product development, while implementing strategies for overall product development cost reduction where appropriate. As we continue with product and technology development, we will file the appropriate patent disclosures to protect our innovation and enhance our intellectual property position.
As of December 31, 2019, we had a core team of 134 engineers involved in research and development primarily located in our research and development design center at our headquarters in Santa Clara (California), Dublin (Ireland), Cork (Ireland), Prague (Czech Republic), and Lisbon (Portugal). For the years ended December 31, 2019, 2018, and 2017, our research and development expense was $30.9 million, $20.3 million, and $13.6 million, respectively.
Marketing
Our marketing efforts focus on two key elements: awareness and demand generation/sales enablement. From an awareness perspective, we seek to generate visibility and credibility of our brand, the products and solutions that we offer, and the capabilities and benefits that they bring. Our marketing program comprises press releases, advertising, collateral, published technical and thought-leadership papers, newsletters, and customer case studies describing the benefits our customers are seeing from implementing our solutions. We also participate in industry events and trade shows, speak at relevant industry conferences, and are continually enhancing our global websites.
Marketing also focuses on making it easier for our sales teams and partners to sell our solutions. We do this through a variety of demand generation and sales enablement activities such as webinars/seminars, lead-generation from our participation at industry exhibitions and conferences, and the production of focused selling tools. We enable our sales teams through a systematic pipeline management process, whereby prospects are identified, qualified, and tracked, with the expectation that a portion of these opportunities are ultimately closed.
Competition
We operate in the highly competitive global embedded electronics market as well as the semiconductor memory and ASIC markets. We expect competition to increase and intensify as more and larger companies enter our markets. Increased competition could result in price pressure, reduced profitability and loss of market share, any of which could materially and adversely affect our business, revenue and operating results.
NVM
9
Our NVM competitors range from large, international companies offering a wide range of commodity NVM products to companies specializing in other alternative, emerging memory technologies. Our primary competitors in the NVM market include Macronix International Co. Ltd., Micron Technology, Inc., Cypress Semiconductor Corporation, Winbond Electronics Corp., GigaDevices and several China based suppliers who primarily cater to the local markets. Among these large memory suppliers, we compete primarily on an overall value proposition and not on a product or technology basis. We expect competition in our current markets to increase in the future as existing competitors improve or expand their product offerings and as new companies enter these markets.
Embedded Systems
Our key competitors for our Smart Transceiver SoCs include established companies which make wireless and wired communications transceivers, SoCs and Systems on Modules (SoMs) such as Semtech, Maxim Integrated Products, STMicroelectronics, Texas Instruments, and NXP. We also see competition from embedded control companies like Freescale Semiconductor and Intel Corporation. In addition, the market has attracted and will continue to attract well-funded, venture-backed start-up companies. Key industry standard and trade group competitors include BACnet, KNX, DALI, DeviceNet, HART, Profibus, ZigBee, and the ZWave Alliance.
ASICs
Our custom ASIC competition comes from a range of custom ASIC and design service providers both small and large including Global Unichip Corp. (GUC), eASIC (acquired by Intel Corporation in 2018), Faraday, Open-Silicon (now SiFive), and Ansem. A range of large diverse semiconductor companies including Microsemi (a Microchip company), On Semiconductor, Socionext, Megachips, Toshiba, and others also provide ASIC design services and support. We have transitioned from a design services model to a full turn-key ASIC supply model, which enables us to compete favorably. We also have unique relationships with foundries and deep supply chain expertise. Our broad mixed-signal and RF IP portfolio together with our embedded mixed-signal ASIC design expertise enables us to sustain a competitive advantage.
IP Products
We compete against large companies that offer a broad range of analog and mix-signal IP cores, including electronic design automation (“EDA”) companies such as Cadence Design Systems and Synopsys. We also see competition from smaller dedicated providers of specific categories of IP cores such as data converters. We expect competition to continue, but believe we compete favorably in this market by providing high-quality, highly reliable products that are easy to integrate into designs, with highly responsive and experienced customer support directly from our design engineers.
Competitive Factors
Our ability to compete successfully depends on elements both within and outside of our control, including industry and general economic trends. Many of our competitors are substantially larger, have greater financial, technical, marketing, distribution, customer support and other resources, are more established than we are, and have significantly better brand recognition and broader product offerings which may enable them to better withstand adverse economic or market conditions in the future. In each of our markets, our competitors include both small companies as well as some of the largest companies in the electronics industry, operating either alone or together with trade associations and partners. To maintain and improve our competitive position, we must keep pace with the evolving needs of our customers and continue to develop and introduce new products, features, and services in a timely and efficient manner. Our ability to compete successfully in the rapidly evolving embedded and semiconductor markets depend on several factors, including:
10
|
· |
the price and features of our products such as adaptability, scalability, functionality, ease of use, the ability to integrate with other products, and conformance with established industry standards; |
|
· |
performance of our semiconductor products, as measured by speed, energy consumption and other factors; |
|
· |
the ease of implementation of our products by customers; |
|
· |
the strength of our customer relationships; |
|
· |
our customer service and support; |
|
· |
our products’ cost effectiveness for the total solution relative to that of our competitors; |
|
· |
our ability to anticipate changes in customer requirements and to develop new or improved products that meet these requirements in a timely manner; |
|
· |
our market awareness and product reputation; and |
|
· |
warranties, indemnities, and other contractual terms. |
We believe we compete favorably with respect to each of these factors.
Additionally, while our embedded product implementations are proprietary to Adesto and are often protected by unique, patented processes, key technologies such as LonWorks and IzoT are open, meaning that many of our basic control networking patents are broadly licensed without royalties or license fees. For instance, all of the network management commands required to develop software that competes with our IzoT Net Server software are published. As a result, our customers are capable of developing hardware and software solutions that compete with many of our products.
Government Regulation
Many of our products and the markets and industries in which they are used are subject to U.S. and foreign regulation as well as local, industry-specific codes and requirements. For example, the power line medium, which is the communications medium used by some of our products, is subject to special regulations in North America, Europe, and Japan. In general, these regulations limit the ability of companies to use power lines as a communication medium. In addition, some of our competitors have attempted to use regulatory actions to reduce the market opportunity for our products or to increase the market opportunity for their own products. We have resisted these efforts and will continue to oppose competitors' efforts to use regulation to impede competition in the markets for our products. Our business might also be affected by other regulatory factors, including public utility commission or similar approvals and government mandates. This could lead to an extension of the sales cycle or even cancellation of a customer's order.
In addition, the market for our products might experience a movement toward standards-based protocols driven by governmental action. To the extent that we do not adopt such protocols or do not succeed in achieving adoption of other protocols we use as standards or de facto standards, sales of our products might be adversely affected. The adoption of voluntary standards or the passage of governmental regulations that are incompatible with our products or technology could limit the market opportunity for our products, which could harm our revenues, results of operations, and financial condition.
11
Intellectual Property
Our success depends in part on our ability to protect our products and technologies from unauthorized third-party copying and use. To accomplish this, we rely on a combination of intellectual property rights, including patents, trade secrets, copyrights and trademarks, as well as customary contractual protections. As of December 31, 2019, we held 164 patents that expire at various times between April 2020 and December 2037 and had 26 U.S. patent applications pending. We also held 55 foreign patents that expire at various times between April 2021 and December 2035 and had 24 foreign patent applications pending.
We seek to file for patents that have broad application in the semiconductor and embedded systems industries and that would provide a competitive advantage. However, there can be no assurance that our pending patent application or any future applications will be approved, that any issued patents will provide us with competitive advantages or will not be challenged by third parties, or that the patents of others will not have an adverse effect on our ability to do business. In addition, there can be no assurance that others will not independently develop substantially equivalent intellectual property or otherwise gain access to our trade secrets or intellectual property, or disclose such intellectual property or trade secrets, or that we can effectively protect our intellectual property.
In addition to the intellectual property that we developed, we have acquired and licensed technology from third parties for incorporation in our products. In January 2007, we entered into a license agreement with Axon Technologies Corp. Pursuant to this license agreement, we have rights in Axon’s patents and trade secrets covering, among other things, Axon’s programmable metallization cell, or PMC, technology, which is a component of our Conductive Bridging Random Access Memory, or CBRAM, technology. This license provides us with broad rights to use and sub-license this technology, and we have the exclusive right to make, have made by authorized foundries or integrated device manufacturers, use, sell, lease, offer for sale, and import products covered by Axon’s licensed patents and trade secrets in certain fields of use. The license will last for the lifetime of the licensed patents, which currently ends in September 2026. We pay a royalty for use of the licensed intellectual property in our products. In July 2012, we purchased certain flash memory product assets from Atmel Corporation. As part of the asset purchase, Atmel granted us non-exclusive, perpetual and irrevocable licenses to its patent portfolio for development of flash memory products. In December 2017, we entered into a license agreement with TowerJazz Panasonic Semiconductor Company. The license is for two years and is a non-exclusive, non-transferable, non-assignable license to use and evaluate certain TowerJazz technologies.
We also hold several trademarks in the United States and select foreign countries, many of which are registered, including Adesto, the Adesto logo, Echelon, the Echelon logo, Lumewave, LumInsight, LonBuilder, LonTalk, LonWorks, Neuron, LON, LonPoint, LonMaker, IzoT, LNS, LonManager, Digital Home, and NodeBuilder.
Employees
As of December 31, 2019, we had 260 employees. Of these full-time employees, 134 were engaged in research and development, 68 in sales and marketing, 28 in operations and support and 30 in general and administrative capacities. The substantial majority of our employees are based in the United States and Europe, although we have small numbers of personnel in Asia. We have not experienced any work stoppages. We consider our relations with our employees to be good.
Available Information
We make available our Annual Reports on Form 10‑K, Quarterly Reports on Form 10‑Q, Current Reports on Form 8‑K and amendments to those reports filed or furnished pursuant to Section 13(a) or Section 15(d) of the Securities Exchange Act of 1934, as amended, free of charge on our website at www.adestotech.com, as soon as reasonably practicable after they are electronically filed with or furnished to the Securities and Exchange Commission or SEC. Additionally, copies of materials filed by us with the SEC may be accessed at the SEC’s website at www.sec.gov.
12
The contents of the websites referred to above are not incorporated into this report. Further, our references to the URLs for these websites are intended to be inactive textual references only.
An investment in our common stock involves a high degree of risk. You should carefully consider the risks and uncertainties described below, together with all of the other information in this Annual Report on Form 10‑K, including the section titled “Management’s Discussion and Analysis of Financial Condition and Results of Operations” and our consolidated financial statements and related notes, before making a decision to invest in our common stock. Our business, operating results, financial condition, or prospects could be materially and adversely affected by any of these risks and uncertainties. If any of these risks actually occur, the trading price of our common stock could decline and you might lose all or part of your investment. Our business, operating results, financial performance, or prospects could also be harmed by risks and uncertainties not currently known to us or that we currently do not believe are material.
Risks Related to the Merger
The announcement and pendency of our agreement to be acquired by Dialog Semiconductor plc could have an adverse effect on our business.
On February 20, 2020, we entered into the Merger Agreement with Dialog and Merger Sub, pursuant to which Merger Sub will, pursuant to the terms of, and subject to the conditions specified in, the Merger Agreement, merge with and into us, and we will be the surviving corporation in the Merger and become a wholly owned direct or indirect subsidiary of Dialog. Upon the terms and subject to the conditions set forth in the Merger Agreement, at the effective time of the Merger, each share of our common stock (subject to certain exceptions) issued and outstanding immediately prior to the effective time of the Merger will be canceled and automatically converted into the right to receive $12.55 in cash, without interest and subject to any required tax withholding.
Uncertainty about the effect of the proposed Merger on our employees, customers, partners and suppliers may have an adverse effect on our business and operations that may be material to our company. Our employees may experience uncertainty about their roles following the Merger. There can be no assurance we will be able to attract and retain key talent, including senior leaders, to the same extent that we have previously been able to attract and retain employees. Any loss or distraction of such employees could have a material and adverse effect on our business and operations. In addition, we have diverted, and will continue to divert, significant management attention and resources towards the completion of the Merger, which could materially and adversely affect our business and operations. It is also possible that lawsuits related to the Merger may be filed against us and our Board of Directors, which could result in material and adverse effects on us, our business and the Merger. These or other related lawsuits could require management to devote significant time and resources in defense thereof.
Our customers may experience uncertainty associated with the Merger, including with respect to concerns about possible changes to our products. Similarly, our partners and suppliers may experience uncertainty associated with the Merger, including with respect to current or future business relationships with us. Uncertainty may cause customers to refrain from purchasing our products, and partners and suppliers may seek to change existing business relationships, which could result in an adverse effect on our business, operations, financial condition and prospects in a way that may be material to our company.
Pursuant to the terms of the Merger Agreement, we are subject to certain restrictions on the conduct of our business, including the ability in certain cases to enter into contracts, incur indebtedness or incur capital expenditures, until the Merger becomes effective or the Merger Agreement is terminated. These restrictions may prevent us from taking actions with respect to our business that we may consider advantageous and may result in our inability to respond effectively to competitive pressures and industry developments, and may otherwise harm our business and operations.
13
The failure to complete the merger with Dialog could adversely affect our business.
Completion of the Merger with Dialog is subject to conditions beyond our control that may prevent, delay, or otherwise adversely affect its completion in a material way. Such conditions include the adoption of the Merger Agreement by the holders of a majority of the shares of our outstanding common stock, the expiration or termination of the waiting period applicable to the completion of the Merger under the Hart-Scott-Rodino Antitrust Improvements Act of 1976, as amended, without the imposition of a “burdensome condition” (as defined in the Merger Agreement), and clearance from the Committee on Foreign Investment in the United States (“CFIUS”). If the Merger is not completed, the share price of our common stock may drop to the extent that the current market price of our common stock reflects an assumption that a transaction will be completed. In addition, the Merger Agreement provides that we will be required to pay Dialog a termination fee of $15.76 million in certain circumstances. Further, a failure to complete the Merger may result in negative publicity and a negative impression of us in the investment community. Any disruption to our business resulting from the announcement or pendency of the Merger or from intensifying competition from our competitors, including any adverse changes in our relationships with our customers, partners, and suppliers, could continue or accelerate in the event of a failure to complete the Merger. There can be no assurance that our business, these relationships, or our financial condition will not be adversely affected, as compared to the condition prior to the announcement of the Merger, if the Merger is not consummated.
The Merger Agreement limits our ability to pursue alternative transactions, which could deter a third-party from proposing an alternative transaction.
The Merger Agreement contains provisions that, subject to the exceptions set forth in the next paragraph, limit our ability to solicit, initiate, knowingly encourage or knowingly facilitate, or engage in any discussions or negotiations regarding, or furnish information in response to inquiries with respect to, an alternative transaction. It is possible that these or other provisions in the Merger Agreement might discourage a potential competing acquirer that might have an interest in acquiring all or a significant part of our outstanding common stock from considering or proposing an acquisition or might result in a potential competing acquirer proposing to pay a lower per share price to acquire our common stock than it might otherwise have proposed to pay.
Under the terms of the Merger Agreement, however, Adesto has the right to engage in negotiations with, and provide information, to a third party that makes an unsolicited proposal that is received prior to the approval of the Merger by Adesto stockholders, if our board of directors determines in good faith, after consultation with our financial advisor and outside legal counsel, that (a) such proposal constitutes, or could reasonably be expected to result in, a superior offer and (b) failure to take such action could reasonably be expected to be inconsistent with its directors’ fiduciary obligations under applicable Delaware law.
We will incur substantial transaction fees and costs in connection with the Merger.
We have and expect to continue to incur significant costs, expenses and fees for professional services and other transaction costs in connection with the Merger. A material portion of these expenses are payable by us whether or not the Merger is completed. Further, while we have assumed that a certain amount of transaction expenses will be incurred, factors beyond our control could affect the total amount or the timing of these expenses. Many of the expenses that will be incurred, by their nature, are difficult to estimate accurately. These expenses may exceed the costs historically borne by us. These costs could adversely affect our business, financial condition, operating results and cash flows.
14
Risks Related to Our Business and Our Industry
We have a history of losses which may continue in the future, and we cannot be certain that we will achieve or sustain profitability.
We have incurred net losses since our inception. We incurred net losses of $26.9 million, $21.4 million, and $5.7 million for the years ended December 31, 2019, 2018 and 2017, respectively. As of December 31, 2019, we had an accumulated deficit of $147.9 million. We expect to incur significant expenses related to the continued development and expansion of our business, including in connection with our efforts to pursue opportunities in emerging IoT markets, develop and improve upon our products and technology, maintain and enhance our research and development and sales and marketing activities and hire additional personnel. Further, revenue may not grow or revenue may decline for a number of possible reasons, many of which are outside our control, including a decline in demand for our products, increased competition, business conditions that adversely affect the semiconductor industry, including reduced demand for products in the end markets that we serve, or our failure to capitalize on growth opportunities. If we fail to generate sufficient revenue to support our operations, we may not be able to achieve or sustain profitability.
We rely on third parties to manufacture, package, assemble and test the semiconductor components comprising our products, which exposes us to a number of risks, including reduced control over manufacturing and delivery timing and potential exposure to price fluctuations, which could result in a loss of revenue or reduced profitability.
As a fabless semiconductor company, we outsource the manufacturing, packaging, assembly and testing of our semiconductor components to, and rely on a limited number of, third-party foundries and assembly and testing service providers. For example, we use three foundries, United Microelectronics Corporation in Taiwan, and XMC and SMIC in China, for the production of our flash memory products and a single foundry, Altis Semiconductor S.N.C. in France (acquired by X-FAB Silicon Foundries in 2016), for our Mafraq and Moneta products. Our primary assembly and testing contractors are Amkor Technology, Inc. in Taiwan, Korea, the Philippines, and Malaysia and Greatek Electronics in Taiwan. Our wafer probing is performed by King Yuan Electronics Co., Ltd. in Taiwan.
Relying on third-party manufacturing, assembly and testing presents a number of risks, including but not limited to:
|
· |
capacity and materials shortages during periods of high demand; |
|
· |
reduced control over delivery schedules, inventories and quality; |
|
· |
the unavailability of, or potential delays in obtaining access to, key process technologies; |
|
· |
the inability to achieve required production or test capacity and acceptable yields on a timely basis; |
|
· |
misappropriation of our intellectual property; |
|
· |
the third parties’ ability to perform their obligations due to bankruptcy or other financial constraints; |
|
· |
limited warranties on wafers or products supplied to us; |
|
· |
potential increases in prices; and |
|
· |
potential manufacturing disruptions (including natural disasters or international health emergencies such as the recent coronavirus (or COVID-19)). |
We currently do not have long-term supply contracts with our third-party contract manufacturers for the products we sell to generate the bulk of our revenue, our NVM products, including United Microelectronics Corporation and Amkor Technology, Inc. Therefore, they are not obligated to perform services or supply components to us for any specific period, in any specific quantities, or at any specific price, except as may be provided in a particular purchase order. During periods of high demand and tight inventories, our third-party foundries and assembly and testing contractors may allocate capacity to the production of other companies’ components while reducing deliveries to us, or significantly raise their prices. In particular, they may allocate capacity to other customers that are larger and better financed than us or that have long-term agreements, decreasing the capacity available to us. Shortages of capacity
15
available to us may be caused by the actions of their other, large customers that may be difficult to predict, such as major product launches. If we need other foundries or assembly and test contractors because of increased demand, or if we are unable to obtain timely and adequate deliveries from our providers, we might not be able to cost-effectively and quickly retain other vendors to satisfy our requirements. Because the lead-time needed to establish a relationship with a new third-party supplier could be several quarters, there is no readily available alternative source of supply for any specific component. In addition, the time and expense to qualify a new foundry could result in additional expense, diversion of resources or lost sales, any of which would negatively impact our financial results.
In the event that we expand production of a component to include a new contract manufacturer, it may take approximately 18 to 24 months to allow a transition from our current foundry or assembly services provider to the new provider. We may experience difficulty migrating production to a new contract manufacturer and, consequently, may experience reduced yields, delays in component deliveries and increased research and development expense. The inability by us or our third-party manufacturers to effectively and efficiently transition our technology to their infrastructure may adversely affect our operating results and our gross margin. There can be no assurance that we will be able to find suitable replacements for our third-party contract manufacturers.
If any of our current or future foundry partners or assembly and test subcontractors significantly increases the costs of wafers or other materials, interrupts or reduces our supply, including for reasons outside of their control, or if any of our relationships with our suppliers is terminated, our operating results could be adversely affected. During 2017, one of our foundry partners increased the costs of wafers to us. Although such increase did not have a material impact on our results of operations for the year ended December 31, 2019, and is not expected to have a material impact in the near term, there can be no assurances that any additional increases will not have a material adverse impact on our future operating results. Any increases could also damage our customer relationships, result in lost revenue, cause a loss in market share or damage our reputation.
Outbreak of health epidemics such as the COVID-19 may adversely affect our business, results of operations and financial condition.
Any outbreaks of contagious diseases and other adverse public health developments in countries or regions where we, our customers or our suppliers operate or are considering operations could have a material and adverse effect on our business, results of operations and financial condition. For example, the recent outbreak of COVID-19 has resulted in significant governmental measures being implemented to control the spread of the virus, including quarantines, travel restrictions, manufacturing restrictions, declarations of national emergency and states of emergency, business shutdowns, cancellation of conference and industry trade shows and restrictions on the movement of employees in many regions of China and certain other countries, including the United States. The Mobile World Congress 2020, an industry trade show that is an important event for our customers and suppliers, was cancelled due to health concerns arising from COVID-19. Participation by our customers and suppliers in other industry trade show events such as Embedded World 2020 was significantly reduced due to health concerns arising from COVID-19, and other events have been postponed such as Light + Building 2020 due to similar health concerns. COVID-19, or similar or related diseases, may result in a widespread health crisis that could adversely affect the economies and financial markets of many countries, resulting in an economic downturn that could affect our suppliers’ supply to us and demand for our customers’ products. Any of these events could materially and adversely affect our business, results of operations and financial condition. The extent of the impact will depend on future developments, which are highly uncertain and cannot be predicted.
We may be unable to match production with customer demand for a variety of reasons, including our inability to accurately forecast customer demand or the capacity constraints of contract manufacturers, which could adversely affect our operating results.
We make planning and spending decisions, including determining production levels, production schedules, component procurement commitments, personnel needs and other resource requirements, based on our estimates of
16
product demand and customer requirements. Our products are typically purchased pursuant to individual purchase orders. While our customers may provide us with their demand forecasts, they are not contractually committed to buy any quantity of products beyond purchase orders. Furthermore, many of our customers may increase, decrease, cancel or delay purchase orders already in place without significant penalty. The short-term nature of commitments by our customers and the possibility of unexpected changes in demand for their products reduce our ability to accurately estimate future customer requirements. On occasion, customers may require rapid increases in production, which can strain our resources, necessitate more onerous procurement commitments and reduce our gross margin. If we overestimate customer demand, we may purchase products that we may not be able to sell, which could result in decreases in our prices or write-downs of unsold inventory. Conversely, if we underestimate customer demand or if sufficient manufacturing capacity was unavailable, we would lose sales opportunities and could lose market share or damage our customer relationships. The rapid pace of innovation in our industry could also render significant portions of our inventory obsolete. Excess or obsolete inventory levels could result in unexpected expenses or write-downs of inventory values that could adversely affect our business, operating results and financial condition.
Our quarterly operating results or other operating metrics may fluctuate significantly, which could cause the trading price of our common stock to decline.
Our quarterly operating results and other operating metrics have fluctuated in the past and may continue to fluctuate from quarter to quarter. We expect that this trend will continue as a result of a number of factors, many of which are outside of our control and may be difficult to predict, including:
|
· |
the impact of our announced Merger with Dialog; |
|
· |
the receipt, reduction, delay or cancellation of orders by large customers, a limited number of which we rely upon for a significant portion of our revenue; |
|
· |
the gain or loss of significant customers and distributors; |
|
· |
the timing and success of our launch of new or enhanced products and those of our competitors; |
|
· |
market acceptance of our products and our customers’ products; |
|
· |
the level of growth or decline in the IoT market; |
|
· |
the timing and extent of research and development and sales and marketing expenditures; |
|
· |
the amount and timing of operating expenses related to the maintenance and expansion of our business, operations and infrastructure; |
|
· |
changes in our product mix; |
|
· |
our ability to reduce the manufacturing costs of our products; |
|
· |
competitive pressures resulting in lower than expected average selling prices; |
|
· |
fluctuations in sales by and inventory levels of OEMs and ODMs who incorporate our products in their products; |
|
· |
cyclical and seasonal fluctuations in our markets; |
|
· |
fluctuations in the manufacturing yields of our third-party contract manufacturers; |
|
· |
events that impact the availability of production capacity at our third-party subcontractors and other interruptions in the supply chain including due to geopolitical events, natural disasters, international health emergencies such as COVID-19, materials shortages, bankruptcy or other causes; |
|
· |
supply constraints for and changes in the cost of the other components incorporated into our customers’ products; |
|
· |
the timing of expenses related to the acquisition and integration of technologies or businesses; |
|
· |
product rates of return or price concessions in excess of those expected or forecasted; |
|
· |
costs associated with the repair and replacement of defective products; |
|
· |
unexpected inventory write-downs or write-offs; |
|
· |
costs associated with litigation over intellectual property rights and other litigation; |
|
· |
the length and unpredictability of the purchasing and budgeting cycles of our customers; |
17
|
· |
loss of key personnel or the inability to attract qualified engineers; and |
|
· |
geopolitical events, such as war, threat of war or terrorist actions, the occurrence of natural disasters , or international health emergencies such as COVID-19. |
Any one of the factors above or other factors not currently known to us or that we currently deem immaterial or the cumulative effect of some of such factors may result in significant fluctuations in our operating results.
The semiconductor industry is highly cyclical and our markets may experience significant cyclical fluctuations in demand as a result of changing economic conditions, budgeting and buying patterns of customers and other factors. As a result of these and other factors affecting demand for our products and our results of operations in any given period, the results of any prior quarterly or annual periods should not be relied upon as indicative of our future revenue or operating performance. Fluctuations in our revenue and operating results could also cause our stock price to decline.
We may experience difficulties in realizing the expected benefits of the acquisitions of S3 and Echelon and may continue to incur significant acquisition-related costs and transition costs in connection with these completed acquisitions.
We completed the acquisition of S3 on May 9, 2018, and the acquisition of Echelon on September 14, 2018. The integration of these businesses with ours has resulted in and continues to result in substantial financial costs and the investment of personnel time and attention and other resources. The success of each acquisition depends in part on our ability to realize the anticipated business opportunities, including certain cost savings and operational efficiencies or synergies, and growth prospects from combining the respective companies with Adesto in an efficient and effective manner. We may never realize these business opportunities and growth prospects and, we may incur additional costs to maintain employee morale and to retain key employees. Our management cannot ensure that the elimination of duplicative costs or the realization of other efficiencies will offset the transaction and integration costs in the near term or at all.
Moreover, risks specific to the acquired businesses and the sectors of the semiconductor market in which they compete could also delay or prevent our achievement of the expected benefits from the respective acquisition.
The market for semiconductor products is characterized by declines in average selling prices, which we expect to continue, and which could negatively affect our revenue and margins.
Our customers expect the average selling price of our products to decrease year-over-year and we expect this trend to continue. When such pricing declines occur, we may not be able to mitigate the effects by selling more or higher margin units, or by reducing our manufacturing costs. In such circumstances, our operating results could be materially and adversely affected. Our flash memory products have experienced declining average selling prices over their life cycle. The rate of decline may be affected by a number of factors, including relative supply and demand, the level of competition, production costs and technological changes. As a result of the decreasing average selling prices of our products following their launch, our ability to increase or maintain our margins depends on our ability to introduce new or enhanced products with higher average selling prices and to reduce our per-unit cost of sales and our operating costs. We may not be able to reduce our costs as rapidly as companies that operate their own manufacturing, assembly and testing facilities, and our costs may even increase because we do not operate our own manufacturing, assembly or testing facilities, which could also reduce our gross margins. In addition, our new or enhanced products may not be as successful or enjoy as high margins as we expect. If we are unable to offset any reductions in average selling prices by introducing new products with higher average selling prices or reducing our costs, our revenue and margins will be negatively affected and may decrease.
The semiconductor market is highly cyclical and has experienced severe downturns in the past, generally as a result of wide fluctuations in supply and demand, constant and rapid technological change, continuous new product introductions and price erosion. During downturns, periods of intense competition, or the presence of oversupply in the
18
industry, the selling prices for our products may decline at a high rate over relatively short time periods as compared to historical rates of decline. We are unable to predict selling prices for any future periods and may experience unanticipated, sharp declines in selling prices for our products.
Our prospects for growth depend on the growth and development of the emerging IoT industry, and if the market does not develop as we expect, our business prospects may be harmed.
Our products are increasingly being utilized in IoT edge devices. The IoT industry is nascent and is characterized by rapidly changing technologies, devices and connectivity requirements, evolving industry standards and changing customer demands. The continued development of IoT depends in part on significant growth in the number of connected devices. Such growth is affected by various factors, including the continued growth in the use of mobile operator networks and the Internet to connect an increasing number and variety of devices, price reductions for key hardware and software components, innovation of other components of the IoT nodes toward low-power formats, and the continued development of IoT standards and protocols. Without these continued developments, IoT might not gain widespread market acceptance and our business could suffer. Security and privacy concerns, evolving business practices and consumer preferences may also slow the growth and development of IoT. Because our revenue growth ultimately depends upon the success of IoT, our business may suffer as a result of slowing or declining growth in IoT adoption. Even if the IoT industry does develop, we may not be well positioned or able to penetrate and capitalize on this new market. As a result of these factors, the future revenue and income potential of our business is uncertain.
The markets for our products are evolving, and changing market conditions, such as the introduction of new technologies or changes in customer preferences, may negatively affect demand for our products. If we fail to properly anticipate or respond to changing market conditions, our business prospects and results of operations will suffer.
The semiconductor industry is subject to constant and rapid changes in technology, frequent new product introductions, short product life cycles, rapid product obsolescence and evolving technical standards. New technologies may be introduced that make the current technologies on which our products are based less competitive or obsolete or require us to make changes to our technology that could be expensive and time consuming to implement. Due to the evolving nature of our markets, our future success depends on our ability to accurately anticipate and respond to changes in industry standards, technological requirements, customer and consumer preferences and other market conditions. Our technologies could become obsolete sooner than we expect because of faster than anticipated, or unanticipated, changes in one or more of the industry standards and technological requirements. We may be unable to develop and introduce new or enhanced technologies that satisfy customer requirements and achieve market acceptance in a timely manner or at all, succeed in commercializing the technologies on which we have focused our research and development expenditures to develop or otherwise made significant investments to acquire, and anticipate new industry standards and technological changes. If we fail to adapt successfully to technological changes or fail to obtain access to important new technologies, we may be unable to retain customers or attract new customers. Any decrease in demand for our products, or the need for low-power products in general, due to the emergence of competing technologies, changes in customer preferences and requirements or other factors, could adversely affect our business, results of operations and prospects.
We must continuously develop new and enhanced products, and if we are unable to successfully market our new and enhanced products for which we incur significant expenses to develop, our results of operations and financial condition will be materially adversely affected.
In order to compete effectively in our markets, we must continually design, develop and introduce new and improved products with improved features in a cost-effective manner in response to changing technologies and market demand. This requires us to devote substantial financial and other resources to research and development. We have developed and are continuing to develop next-generation products, such as our Moneta and EcoXiP products, which we expect to be one of the drivers of our future revenue growth. However, we may not succeed in developing and marketing these new and enhanced products. We also face the risk that customers may not value or be willing to bear the cost of
19
incorporating our new and enhanced products into their products, particularly if they believe their customers are satisfied with current solutions. Regardless of the improved features or superior performance of our new and enhanced products, customers may be unwilling to adopt our solutions due to design or pricing constraints, or because they do not want to rely on a single or limited supply source. Because of the extensive time and resources that we invest in developing new and enhanced products, if we are unable to sell customers new generations of our products, our revenue could decline and our business, financial condition, results of operations and cash flows would be negatively affected. For example, we have generated limited revenue from sales of our Mavriq products to date. While we expect revenue from our Mavriq products to grow, we may not be able to materially increase our revenue from this product family. Similarly, any of our more recently-introduced products or product families, such as Moneta and EcoXiP, may not achieve market acceptance and contribute significantly to our revenue. If we are unable to successfully develop and market our new and enhanced products that we have incurred significant expenses developing, our results of operations and financial condition will be materially and adversely affected.
Our success and future revenue depend on our ability to secure design wins and on our customers’ ability to successfully sell the products that incorporate our solutions. Securing design wins is a lengthy, expensive and competitive process, and may not result in actual orders and sales, which could cause our revenue to decline.
We sell to customers that incorporate our products into their products. A design win occurs after a customer has tested our product, verified that it meets the customer’s requirements, qualified our solutions for their products and placed an order for the purchase of our products. Our customers may need several months to years to test, evaluate and adopt our product and additional time to begin volume production of the product that incorporates our solution. Due to this generally lengthy design cycle, we may experience significant delays from the time we increase our operating expenses and make investments in our products to the time that we generate revenue from sales of these products. Moreover, even if a customer selects our solution, we cannot guarantee that this will result in any sales of our products, as the customer may ultimately change or cancel its product plans, or efforts by our customer to market and sell its product may not be successful. We may not generate any revenue from design wins after incurring the associated costs, which would cause our business and operating results to suffer.
If a current or prospective customer designs a competitor’s solution into its product, it becomes significantly more difficult for us to sell our solutions to that customer because changing suppliers involves significant time, cost, effort and risk for the customer even if our solutions remain compatible with their product design. If current or prospective customers do not include our solutions in their products and we fail to achieve a sufficient number of design wins, our results of operations and business may be harmed.
We rely on our relationships with a limited number of OEMs and ODMs to enhance our solutions and market position, and our failure to continue to develop or maintain such relationships in the future would harm our ability to remain competitive.
We develop our products for a limited number of leading OEMs and ODMs that serve a variety of end markets and are developing devices for wearables, sensors, Bluetooth 4.0 and other IoT applications. For each application, manufacturers create products that incorporate specialized semiconductor technology, which makers of semiconductor products use as the basis for their products. These manufacturers set the specifications for many of the key components to be used on each generation of their products and, in the case of memory components, generally qualify only a few vendors to provide memory components for their products. As each new generation of their products is released, vendors are validated in a similar fashion. We must work closely with semiconductor manufacturers to ensure our products become qualified for use in their products. As a result, maintaining close relationships with leading product manufacturers that are developing devices for wearables, Bluetooth 4.0 and other IoT applications is crucial to the long-term success of our business. We could lose these relationships for a variety of reasons, including our failure to qualify as a vendor, our failure to demonstrate the value of our new solutions, declines in product quality, or if OEMs or ODMs seek to work with vendors with broader product suites, greater production capacity or greater financial resources. If our
20
relationships with key industry participants were to deteriorate or if our solutions were not qualified by our customers, our market position and revenue could be materially and adversely affected.
Our business is dependent on selling through distributors.
Sales through distributors accounted for approximately 62% and 65% of our revenues during the fiscal year ended December 31, 2019 and 2018 , respectively. We do not have long-term agreements with our distributors, and we and our distributors may each terminate our relationship with little or no advance notice.
Any future adverse conditions in the U.S. or global economies or in the U.S. or global credit markets could materially impact the operations of our distributors. Any deterioration in the financial condition of our distributors or any disruption in the operations of our distributors could adversely impact the flow of our products to our end customers and adversely impact our results of operation. In addition, during an industry or economic downturn, it is possible there will be an oversupply of products and a decrease in demand for our products from our distributors, which could reduce our revenues in a given period. Violations of the Foreign Corrupt Practices Act and similar regulations, or similar laws, by our distributors could have a material adverse impact on our business.
Changes to industry standards and technical requirements relevant to our products and markets could adversely affect our business, results of operations and prospects.
Our products are only a part of larger electronic systems. All products incorporated into these systems must comply with various industry standards and technical requirements created by regulatory bodies or industry participants in order to operate efficiently together. Industry standards and technical requirements in our markets are evolving and may change significantly over time. For our products, the industry standards are developed by the Joint Electron Device Engineering Council, an industry trade organization. In addition, large industry-leading semiconductor and electronics companies play a significant role in developing standards and technical requirements for the product ecosystems within which our products can be used. Our customers also may design certain specifications and other technical requirements specific to their products and solutions. These technical requirements may change as the customer introduces new or enhanced products and solutions.
Our ability to compete in the future will depend on our ability to identify and comply with evolving industry standards and technical requirements. The emergence of new industry standards and technical requirements could render our products incompatible with products developed by other suppliers or make it difficult for our products to meet the requirements of certain of our customers in consumer, industrial, IoT and other markets. As a result, we could be required to invest significant time and effort and to incur significant expense to redesign our products to ensure compliance with relevant standards and requirements. If our products are not in compliance with prevailing industry standards and technical requirements for a significant period of time, we could miss opportunities to achieve crucial design wins, our revenue may decline and we may incur significant expenses to redesign our products to meet the relevant standards, which could adversely affect our business, results of operations and prospects.
If sales of our customers’ products decline or if their products do not achieve market acceptance, our business and operating results could be adversely affected.
Our revenue depends on our customers’ ability to commercialize their products successfully. The markets for our customers’ products are extremely competitive and are characterized by rapid technological change. Competition in our customers’ markets is based on a variety of factors including price, performance, product quality, marketing and distribution capability, customer support, name recognition and financial strength. As a result of rapid technological change, the markets for our customers’ products are characterized by frequent product introductions, short product life cycles, fluctuating demand and increasing product capabilities. As a result, our customers’ products may not achieve market success or may become obsolete. We cannot assure you that our customers will dedicate the resources necessary to promote and commercialize their products, successfully execute their business strategies for such products, or be able
21
to manufacture such products in quantities sufficient to meet demand or cost-effectively manufacture products at a high volume. Our customers do not have contracts with us that require them to manufacture, distribute or sell any products. Moreover, our customers may develop internally, or in collaboration with our competitors, technology that they may utilize instead of the technology available to them through us. Our customers’ failure to achieve market success for their products, including as a result of general declines in our customers’ markets or industries, could negatively affect their willingness to utilize our products, which may result in a decrease in our revenue and negatively affect our business and operating results.
Our revenue also depends on the timely introduction, quality and market acceptance of our customers’ products that incorporate our solutions. Our customers’ products are often very complex and subject to design complexities that may result in design flaws, as well as potential defects, errors and bugs. We have in the past been subject to delays and project cancellations as a result of design flaws in the products developed by our customers. For example, in 2014, flaws in one of our customer’s products that were unrelated to our solutions generated negative publicity for our customer and delayed the product’s release until it could be redesigned. In the past, we have also been subject to delays and project cancellations as a result of changing market requirements, such as the customer adding a new feature, or because a customer’s product fails their end customer’s evaluation or field trial. Customer products may also be delayed due to issues with other vendors of theirs. We incur significant design and development costs in connection with designing our solutions for customers’ products. If our customers discover design flaws, defects, errors or bugs in their products, or if they experience changing market requirements, failed evaluations or field trials, or issues with other vendors, they may delay, change or cancel a project. If we have already incurred significant development costs, we may not be able to recoup those costs, which in turn would adversely affect our business and financial results.
We face competition and expect competition to increase in the future. If we fail to compete effectively, our revenue growth and results of operations will be materially and adversely affected.
The global semiconductor market in general, and the IoT semiconductor market in particular, are highly competitive. We expect competition to increase and intensify as other semiconductor companies enter our markets, many of which have greater financial and other resources with which to pursue technology development, product design, manufacturing, marketing and sales and distribution of their products. Increased competition could result in price pressure, reduced profitability and loss of market share, any of which could materially and adversely affect our business, revenue and operating results. Currently, our competitors range from large, international companies offering a wide range of semiconductor products or systems to companies specializing in other alternative, specialized emerging memory technologies. Our primary competitors include GigaDevice Semiconductor, Macronix International Co. Ltd., Microchip Technology Inc., Micron Technology, Inc., Cypress Semiconductor Corporation, Winbond Electronics Corp ., Cree Inc., Digi International, General Electric, Maxim Integrated Products, Philips, Siemens, Silver Spring Networks, STMicroelectronics, Telensa, Texas Instruments, Tridium, On Semiconductor, Socionext, Ansem, IC Sense and Verisilicon. Key industry standard and trade group competitors include BACnet, DALI, DeviceNet, HART, Konnex, Profibus, ZigBee, and the ZWave Alliance in the IoT market. Each of these standards and/or alliances is backed by one or more competitors. In addition, as the IoT market opportunity grows, we expect new entrants will enter these markets and existing competitors, including leading semiconductor companies, may make significant investments to compete more effectively against our products. These competitors could develop technologies or architectures that make our products or technologies obsolete.
Our ability to compete successfully depends on factors both within and outside of our control, including:
|
· |
the functionality and performance of our products and those of our competitors; |
|
· |
our relationships with our customers and other industry participants; |
|
· |
prices of our products and prices of our competitors’ products; |
|
· |
our ability to develop innovative products; |
|
· |
our ability to retain high-level talent, including our management team and engineers; and |
22
|
· |
the actions of our competitors, including merger and acquisition activity, launches of new products and other actions that could change the competitive landscape. |
Competition could result in pricing pressure, reduced revenue and profitability and loss of market share, any of which could materially and adversely affect our business, results of operations and prospects. In the event of a market downturn, competition in the markets in which we operate may intensify as our customers reduce their purchase orders. Our competitors that are significantly larger and have greater financial, technical, marketing, distribution, customer support and other resources or more established market recognition than us may be better positioned to accept lower prices and withstand adverse economic or market conditions.
Our customers require our products and our third-party contractors to undergo a lengthy and expensive qualification process. If we are unsuccessful or delayed in qualifying any of our products with a customer, our business and operating results would suffer.
Prior to selecting and purchasing our products, our customers typically require that our products undergo extensive qualification processes, which involve testing of our products in the customers’ systems, as well as testing for reliability. This qualification process may continue for several months or years. However, obtaining the requisite qualifications for a product does not assure any sales of the product. Even after successful qualification and sales of a product to a customer, a subsequent revision in our third-party contractors’ manufacturing process or our selection of a new contract manufacturer may require a new qualification process, which may result in delays and excess or obsolete inventory. After our products are qualified and selected, it can and often does take several months or more before the customer commences volume production of systems that incorporate our products. Despite these uncertainties, we devote substantial resources, including design, engineering, sales, marketing and management efforts, to qualify our products with customers in anticipation of sales. If we are unsuccessful or delayed in qualifying any of our products with a customer, sales of those products may be precluded or delayed, which may impede our growth and harm our business.
Our costs may increase substantially if our third-party manufacturing contractors do not achieve satisfactory product yields or quality.
The fabrication process is extremely complicated and small changes in design, specifications or materials can result in material decreases in product yields or even the suspension of production. From time to time, the third-party foundries that we contract to manufacture our products may experience manufacturing defects and reduced manufacturing yields related to errors or problems in their manufacturing processes or the interrelationship of their processes with our designs. In some cases, our third-party foundries may not be able to detect these defects early in the fabrication process or determine the cause of such defects in a timely manner.
Generally, in pricing our products, we assume that manufacturing yields will continue to improve, even as the complexity of our products increases. Once our products are initially qualified with our third-party foundries, minimum acceptable yields are established. We are responsible for the costs of the units if the actual yield is above the minimum. If actual yields are below the minimum we are not required to purchase the units. Typically, minimum acceptable yields for our new products are generally lower at first and gradually improve as we achieve full production. Unacceptably low product yields or other product manufacturing problems could substantially increase overall production time and costs and adversely impact our operating results. Product yield losses will increase our costs and reduce our gross margin. In addition to significantly harming our results of operations and cash flow, poor yields may delay shipment of our products and harm our relationships with existing and potential customers.
The complexity of our products may lead to errors, defects and bugs, which could negatively impact our reputation with customers and result in liability.
Products as complex as ours may contain errors, defects and bugs when first introduced to customers or as new versions are released. Our products have in the past experienced such errors, defects and bugs. Delivery of products with
23
production defects or reliability, quality or compatibility problems could significantly delay or hinder market acceptance of the products or result in a costly recall and could damage our reputation and adversely affect our ability to retain existing customers and attract new customers. Errors, defects or bugs could cause problems with the functionality of our products, resulting in interruptions, delays or cessation of sales of these products to our customers. We may also be required to make significant expenditures of capital and resources to resolve such problems. We cannot assure you that problems will not be found in new products, both before and after commencement of commercial production, despite testing by us, our suppliers or our customers. Any such problems could result in:
|
· |
delays in development, manufacture and roll-out of new products; |
|
· |
additional development costs; |
|
· |
loss of, or delays in, market acceptance; |
|
· |
diversion of technical and other resources from our other development efforts; |
|
· |
claims for damages by our customers or others against us; and |
|
· |
loss of credibility with our current and prospective customers. |
Any such event could have a material adverse effect on our business, financial condition and results of operations.
If our IoT solutions become subject to cyber-attacks, or if public perception is that they are vulnerable to cyber-attacks, our reputation and business would suffer.
We have designed our IoT products, including our outdoor lighting solutions products acquired from Echelon, to interoperate with other third-party products and systems. Although we attempt to safeguard our products and solutions from cybersecurity threats, the potential for cyber security attacks and other incidents continues to evolve in scope and frequency.
Advances in and expanding availability of technical tools to enable cybersecurity attacks, and increasing sophistication of the threats, deepen the risk of potential security incidents. This risk expands as new protocols and devices are implemented into our products and systems, and as customer requirements evolve. Should our products, or the combination of our products into third party systems, fail to prevent or be unable to withstand any such threats or cyber-attacks, or if our partners or customers fail to safeguard applicable technologies, products or the systems with adequate security policies and measures or otherwise, our business and reputation may be harmed.
We have attempted to design certain of our products to prevent and monitor unauthorized access, misuse, modification or other activities related to those products and the systems into which the products are intended to be placed. Despite our security measures, our products or systems may be subject to unauthorized break ins, viruses, disruptions, high-jacking, cyber terrorism, misuse, tampering, other unauthorized access or modification, or unauthorized access to, or acquisition, loss, or alteration of, data. Should our products fail to perform, be unable to withstand a cyber-attack, or otherwise suffer a security incident, or be perceived to have suffered any kind of security vulnerability or cyber incidents, we could face legal liability, and encounter material adverse financial and reputational harm.
In addition, we believe that there could be incidents of security breaches in the future which could receive significant publicity and visibility. Any such publicity or visibility, regardless of whether the problem is due or related to the performance or security measures of our products or systems, could have a negative effect on public confidence, or cause a perception that our solutions are or could be subject to similar attacks or breaches, and our business, results of operations and financial condition may be materially and adversely affected. Such an event could also result in a material adverse effect on the market price of our common stock, independent of the direct effects on our business.
24
Furthermore, because some of the information collected by some of our solutions is or may be considered personal data or otherwise may be alleged to be confidential or proprietary to our customers or third parties, a cyber-attack or other data security incident, including any unauthorized access to, loss of, or acquisition of data collected or maintained by our solutions, could violate, or be alleged to violate, applicable privacy, consumer or information security laws, regulations or other obligations. Any of the foregoing could cause us to face regulatory investigations and enforcement actions, private litigation, and other financial or legal liability, as well as harm to our reputation and business, any of which could have a material adverse effect on our business and financial performance.
We are subject to governmental regulation and other legal obligations, particularly related to privacy, data protection and information security, and our actual or perceived failure to comply with such obligations could adversely affect our business and operating results.
Personal privacy, data protection and information security are significant issues in the United States and the other jurisdictions where we offer our products and services. The regulatory framework for privacy and security issues worldwide is rapidly evolving and is likely to remain uncertain for the foreseeable future. Our handling of data is subject to a variety of laws and regulations, including regulation by various government agencies and various state, local and foreign bodies and agencies.
The United States federal and various state and foreign governments have adopted or proposed limitations on the collection, distribution, use and storage of personal information of individuals, including end-customers and employees. In the United States, the Federal Trade Commission and many state attorneys general are applying federal and state consumer protection laws to the online collection, use and dissemination of data. Additionally, many foreign countries and governmental bodies, including in Australia, the European Union ("EU"), India, Japan and numerous other jurisdictions in which we operate or conduct our business, have laws and regulations concerning the collection and use of personal information obtained from their residents or by businesses operating within their jurisdiction. These laws and regulations often are more restrictive than those in the United States. Such laws and regulations may require companies to implement new privacy and security policies, permit individuals to access, correct and delete personal information stored or maintained by such companies, inform individuals of security breaches that affect their personal information, and, in some cases, obtain individuals’ consent to use personal information for certain purposes.
We also expect that there will continue to be new proposed laws, regulations and industry standards concerning privacy, data protection and information security in the United States, the EU and other jurisdictions, and we cannot yet determine the impact of such future laws, regulations and standards may have on our business. For example, in June 2018, California passed the California Consumer Privacy Act which provides new data privacy rights for consumers and new operational requirements for companies effective in 2020. Additionally, we expect that existing laws, regulations and standards may be interpreted differently in the future. There remains significant uncertainty surrounding the regulatory framework for the future of personal data transfers from the EU to the United States with regulations such as the recently adopted General Data Protection Regulation (“GDPR”) which imposes more stringent EU data protection requirements, provides an enforcement authority, and imposes large penalties for noncompliance. Future laws, regulations, standards and other obligations, including the adoption of the GDPR, as well as changes in the interpretation of existing laws, regulations, standards and other obligations could impair our ability to collect, use or disclose information relating to individuals, which could decrease demand for our products, require us to restrict our business operations, increase our costs and impair our ability to maintain and grow our customer base and increase our revenue.
Although we are working to comply with those federal, state and foreign laws and regulations, industry standards, contractual obligations and other legal obligations that apply to us, those laws, regulations, standards and obligations are evolving and may be modified, interpreted and applied in an inconsistent manner from one jurisdiction to another, and may conflict with one another, other requirements or legal obligations, our practices or the features of our products. As such, we cannot assure ongoing compliance with all such laws or regulations, industry standards, contractual obligations and other legal obligations. Any failure or perceived failure by us to comply with federal, state or foreign laws or regulations, industry standards, contractual obligations or other legal obligations, or any actual or
25
suspected security incident, whether or not resulting in unauthorized access to, or acquisition, release or transfer of personal information or other data, may result in governmental enforcement actions and prosecutions, private litigation, fines and penalties or adverse publicity and could cause our customers to lose trust in us, which could have an adverse effect on our reputation and business. Any inability to adequately address privacy and security concerns, even if unfounded, or comply with applicable laws, regulations, policies, industry standards, contractual obligations or other legal obligations could result in additional cost and liability to us, damage our reputation, inhibit sales, and adversely affect our business and operating results.
We may experience difficulties in transitioning to new wafer fabrication process technologies or in achieving higher levels of design integration, which may result in reduced manufacturing yields, delays in product deliveries and increased expenses.
We aim to use the most advanced manufacturing process technology appropriate for our solutions that is available from our third-party foundries. As a result, we periodically evaluate the benefits of migrating our solutions to other technologies in order to improve performance and reduce costs. These ongoing efforts require us from time to time to modify the manufacturing processes for our products and to redesign some products, which in turn may result in delays in product deliveries. We may face difficulties, delays and increased expense as we transition our products to new processes, and potentially to new foundries. We will depend on our third-party foundries as we transition to new processes. We cannot assure you that our third-party foundries will be able to effectively manage such transitions or that we will be able to maintain our relationship with our third-party foundries or develop relationships with new third-party foundries. If we or any of our third-party foundries experience significant delays in transitioning to new processes or fail to efficiently implement transitions, we could experience reduced manufacturing yields, delays in product deliveries and increased expenses, any of which could harm our relationships with our customers and our operating results.
As smaller line width geometry manufacturing processes become more prevalent, we intend to move our future products to increasingly smaller geometries in order to reduce costs while integrating greater levels of functionality into our products. This transition will require us and our third-party foundries to migrate to new designs and manufacturing processes for smaller geometry products. We may not be able to achieve smaller geometries with higher levels of design integration or to deliver new integrated products on a timely basis. We periodically evaluate the benefits, on a product-by-product basis, of migrating to smaller geometry process technologies to reduce our costs and increase performance. We are dependent on our relationships with our third-party foundries to transition to smaller geometry processes successfully. We cannot assure you that our third-party foundries will be able to effectively manage any such transition. If we or our third-party foundries experience significant delays in any such transition or fail to implement a transition, our business, financial condition and results of operations could be materially harmed.
If we fail to retain qualified finance personnel and strengthen our financial reporting systems and infrastructure, we may not be able to timely and accurately report our financial results or comply with the requirements of being a public company, including compliance with the Sarbanes-Oxley Act and SEC reporting requirements.
If we remain an independent public company, our ability to timely and accurately report our financial results and comply with the requirements of being a public company depends on our maintaining adequate numbers of accounting and finance staff with technical accounting, Securities and Exchange Commission reporting and Sarbanes-Oxley Act compliance expertise. Any inability to recruit or retain qualified accounting and finance staff would have an adverse impact on our ability to accurately and timely prepare our financial statements. We may be unable to hire qualified professionals with requisite technical and public company experience when and as needed, including following any significant acquisitions such as our acquisitions of S3 and Echelon in 2018, which increased the size of our operations and the requirements on our finance and accounting organization. In addition, new employees will require time and training to learn our business and operating processes and procedures. If our finance and accounting organization is unable for any reason to meet the demands of being a public company or increased requirements following any significant acquisitions, the quality and timeliness of our financial reporting may suffer, which could result in the identification of material weaknesses in our internal controls. Any consequences resulting from inaccuracies
26
or delays in our reported financial statements could cause the trading price of our common stock to decline and could harm our business, operating results and financial condition.
If we fail to strengthen our financial reporting systems, infrastructure and internal control over financial reporting to meet the demands placed upon us as a public company, including the requirements of the Sarbanes-Oxley Act, we may be unable to report our financial results timely and accurately and prevent fraud. We expect to incur significant expense and devote substantial management effort toward ensuring compliance with the internal control over financial reporting requirements of the Sarbanes-Oxley Act, particularly with respect to the requirement for an attestation report by our independent registered public accounting firm, which we expect to be required to comply with beginning with our fiscal year ending December 31, 2020, if we remain an independent public company.
A breach of our security systems may damage our reputation and adversely affect our business.
Our security systems are designed to protect our customers’, suppliers’ and employees’ confidential information, as well as maintain the physical security of our facilities. We also rely on a number of third-party “cloud-based” service providers of corporate infrastructure services relating to, among other things, human resources, electronic communication services and some finance functions, and we are, of necessity, dependent on the security systems of these third-party providers. Any security breaches or other unauthorized access by third parties to the systems of our cloud-based service providers or the existence of computer viruses in their data or software could expose us to a risk of information loss and misappropriation of confidential information. Accidental or willful security breaches or other unauthorized access by third parties to our information systems or facilities, or the existence of computer viruses in our data or software, could expose us to a risk of information loss and misappropriation of proprietary and confidential information belonging to us, our customers or our suppliers. Any theft or misuse of this information could result in, among other things, unfavorable publicity, damage to our reputation, difficulty in marketing our products, allegations by our customers that we have not performed our contractual obligations, litigation by affected parties and possible financial obligations for liabilities and damages related to the theft or misuse of this information, any of which could have a material adverse effect on our business, financial condition, our reputation, and our relationships with our customers and partners. Since the techniques used to obtain unauthorized access or to sabotage systems change frequently and are often not recognized until launched against a target, we may be unable to anticipate these techniques or to implement adequate preventative measures.
Failure to protect our intellectual property could substantially harm our business.
Our success and ability to compete depend in part upon our ability to protect our intellectual property. We rely on a combination of intellectual property rights, including patents, mask work protection, copyrights, trademarks, trade secrets and know-how, in the United States and other jurisdictions. The steps we take to protect our intellectual property rights may not be adequate, particularly in foreign jurisdictions such as China. Any patents we hold may not adequately protect our intellectual property rights or our products against competitors and third parties may challenge the scope, validity or enforceability of our issued patents. In addition, other parties may independently develop similar or competing technologies designed around any patents or patent applications that we hold. Some of our products and technologies are not covered by any patent or patent application, as we do not believe patent protection of these products and technologies is critical to our business strategy at this time. A failure to timely seek patent protection on products or technologies generally precludes us from seeking future patent protection on these products or technologies.
In addition to patents, we also rely on contractual protections with our customers, suppliers, distributors, employees and consultants, and we implement security measures designed to protect our trade secrets and know-how. However, we cannot assure you that these contractual protections and security measures will not be breached, that we will have adequate remedies for any such breach or that our customers, suppliers, distributors, employees or consultants will not assert rights to intellectual property or damages arising out of such contracts.
27
We may initiate claims against third parties to protect our intellectual property rights if we are unable to resolve matters satisfactorily through negotiation. Litigation brought to protect and enforce our intellectual property rights could be costly, time-consuming and distracting to management. It could also result in the restructuring or loss of portions of our intellectual property, as an adverse decision could limit our ability to assert our intellectual property rights, limit the value of our technology or otherwise negatively impact our business, financial condition and results of operations. Additionally, any enforcement of our patents or other intellectual property may provoke third parties to assert counterclaims against us. Our failure to secure, protect and enforce our intellectual property rights could materially harm our business.
We may face claims of intellectual property infringement, which could be time-consuming, costly to defend or settle, result in the loss of significant rights, harm our relationships with our customers and distributors, or otherwise materially adversely affect our business, financial condition and results of operations.
The semiconductor industry is characterized by companies that hold patents and other intellectual property rights and that vigorously pursue, protect and enforce intellectual property rights. These companies include patent holding companies or other adverse patent owners who have no relevant product revenue and against whom our own patents may provide little or no deterrence. From time to time, third parties may assert against us and our customers’ patent and other intellectual property rights to technologies that are important to our business.
Claims that our products, processes or technology infringe third-party intellectual property rights, regardless of their merit or resolution, could be costly to defend or settle and could divert the efforts and attention of our management and technical personnel. We may also be obligated to indemnify our customers or business partners in connection with any such litigation, which could result in increased costs. Infringement claims also could harm our relationships with our customers or distributors and might deter future customers from doing business with us. If any such proceedings result in an adverse outcome, we could be required to:
|
· |
cease the manufacture, use or sale of the infringing products, processes or technology; |
|
· |
pay substantial damages for infringement; |
|
· |
expend significant resources to develop non-infringing products, processes or technology, which may not be successful; |
|
· |
license technology from the third-party claiming infringement, which license may not be available on commercially reasonable terms, or at all; |
|
· |
cross-license our technology to a competitor to resolve an infringement claim, which could weaken our ability to compete with that competitor; or |
|
· |
pay substantial damages to our customers to discontinue their use of or to replace infringing technology sold to them with non-infringing technology, if available. |
Any of the foregoing results could have a material adverse effect on our business, financial condition and results of operations. Furthermore, our exposure to the foregoing risks may also be increased as a result of acquisitions of other companies or technologies. For example, we may have a lower level of visibility into the development process with respect to intellectual property or the care taken to safeguard against infringement risks with respect to the acquired company or technology. In addition, third parties may make infringement and similar or related claims after we have acquired technology that had not been asserted prior to the acquisition.
We rely upon third-party licensed technology to develop our products. If licenses of third-party technology are inadequate, our ability to develop and commercialize our products or product enhancements could be negatively impacted.
Our products incorporate technology licensed from third parties. In connection with our acquisition of certain flash memory assets from Atmel Corporation ("Atmel") in 2012, we obtained a perpetual license to Atmel’s flash memory technology. In addition, a component of our CBRAM technology is licensed from Axon Technologies
28
Corporation. While we believe these licenses enable us to develop our products and pursue our current product strategies, these licenses may not provide us with the benefits we expect from them. From time to time, we may be required to license additional technology from third parties to develop our products or product enhancements. However, these third-party licenses may not be available to us on commercially reasonable terms or at all. Our inability to obtain third-party licenses necessary to develop products and product enhancements could require us to obtain substitute technology at a greater cost or of lower quality or performance standards or delay product development. Any of these results may limit our ability to develop new products, which could harm our business, financial condition and results of operations.
We have expanded in the past and expect to continue to expand in the future through acquisitions of, or investments in, other companies, each of which may divert our management’s attention, result in additional dilution to stockholders or use resources that are necessary to operate our business,.
We have grown our business through acquisitions and, subject to Dialog’s approval in accordance with the Merger Agreement, we may continue to evaluate and enter into discussions regarding potential strategic transactions. We completed the acquisition of S3 in May 2018 and the acquisition of Echelon in September 2018. These transactions are and any new acquisitions or investments could be material to our financial condition and results of operations. The process of integrating businesses and technology can create unforeseen operating difficulties and expenditures as could the integration of any future acquisitions. Such transactions could create risks for us, including:
|
· |
difficulties in assimilating acquired personnel, operations and technologies or realizing synergies expected in connection with an acquisition, particularly with acquisitions of companies with large and widespread operations, complex products or that operate in markets in which we historically have had limited experience; |
|
· |
unanticipated costs or liabilities, including possible litigation associated with the acquisition; |
|
· |
failure to realize expected revenue growth and higher than expected operating, transaction and integration costs; |
|
· |
incurrence of acquisition-related costs; |
|
· |
inability to maintain, develop and deepen relationships with end customers of newly acquired businesses and otherwise expand our sales channels; |
|
· |
diversion of management’s attention from other business concerns; |
|
· |
use of resources that are needed in other parts of our business; and |
|
· |
use of substantial portions of our available cash to consummate an acquisition. |
Our failure to address these risks or other problems encountered in connection with our past or future acquisitions and investments could cause us to fail to realize the anticipated benefits of these acquisitions or investments, cause us to incur unanticipated liabilities and harm our business generally. Future acquisitions could also result in the use of substantial amounts of our cash and cash equivalents, dilutive issuances of our equity securities, the incurrence of debt, contingent liabilities, amortization expenses or the write-off of goodwill, any of which could harm our financial condition. We do not have an extensive history of acquiring other companies and managing integrations, and the risk of failing to achieve the anticipated benefits and synergies of our acquisitions of S3 and Echelon may be increased by the risks inherent to managing concurrent integrations. Also, the anticipated benefits of any acquisitions may not materialize, may be less beneficial, or may develop more slowly, than we expect. If we do not receive the benefits anticipated from these acquisitions and investments, or if the achievement of these benefits is delayed, our operating results may be adversely affected and our stock price could decline.
In our embedded systems business, we are increasingly dependent on third-party developers.
We are increasingly reliant on various third parties for the development of software used in our embedded systems products. There is a risk that the software provided by these third parties could contain errors or defects that could adversely impact the quality of our products. In addition, these third parties may use open source or other code that contains security flaws, which may cause our products to be more prone to hacking or other security incidents. We may
29
also be negatively impacted by employee turnover or other challenges that these third-party developers face in their own businesses. Third parties may also choose not to develop software for our products if we do not have adequate market share or sufficient perception of future success. The materialization of any of these risks would impact our ability to deliver quality products on a timely basis, which could adversely impact our reputation and brand and harm our business and results of operations.
In addition, many of these third-party developers are located in markets that are subject to political risk, intellectual property misappropriation, corruption, infrastructure problems, natural disasters and international health emergencies such as COVID-19, in addition to country specific privacy and data security risks, given current legal and regulatory environments. The failure of these third parties to meet their obligations and adequately deploy business continuity plans in the event of a crisis and/or the development of significant disagreements, natural or man-made disasters or other factors that materially disrupt our ongoing relationship with these developers could negatively affect our operations.
Our success depends on our ability to attract and retain key employees, and our failure to do so could harm our ability to grow our business and execute our business strategies.
Our success depends on our ability to attract and retain our key employees, including our management team and experienced engineers. Competition for personnel in the semiconductor technology field is intense, and the availability of suitable and qualified candidates is limited. We compete to attract and retain qualified research and development personnel with other semiconductor companies, universities and research institutions, particularly those in the San Francisco Bay Area where our headquarters is located. The members of our management and key employees are at-will employees. In addition, our management and employees, including those recently added from S3 and Echelon, may experience uncertainty about their future roles with us as we integrate the acquired businesses into our existing organizational structure. We must continue to attract and motivate all our employees and keep them focused on our strategies and goals following the acquisitions. If we lose the services of any key senior management member or employee, we may not be able to locate suitable or qualified replacements, and may incur additional expenses to recruit and train new personnel, which could severely impact our business and prospects. The loss of the services of one or more of our key employees, especially our key engineers, or our inability to attract and retain qualified engineers, could harm our business, financial condition and results of operations.
We may not be able to effectively manage our growth, and we may need to incur significant expenditures to address the additional operational and control requirements of our growth, either of which could harm our business and operating results.
We expect to increase headcount and the overall size of our operations to support our growth. To effectively manage our growth, we must continue to expand our operational, engineering and financial systems, procedures and controls and to improve our accounting and other internal management systems if we remain an independent public company. This may require substantial managerial and financial resources, and our efforts in this regard may not be successful. Our current systems, procedures and controls may not be adequate to support our future operations. If we fail to adequately manage our growth, or to improve our operational, financial and management information systems, or fail to effectively motivate or manage our new and future employees, the quality of our products and the management of our operations could suffer, which could adversely affect our operating results.
We have operations outside of the United States and intend to expand our international operations, which exposes us to significant risks.
With the acquisitions of S3 and Echelon, we expanded our global footprint beyond the limited operations we once had in Europe and Asia. We intend to further expand our operations in Asia. The success of our business depends, in large part, on our ability to operate successfully from geographically disparate locations and to further expand our international operations and sales. Operating in international markets requires significant resources and management attention and subjects us to regulatory, economic and political risks that are different from those we face in the United
30
States. We cannot be sure that further international expansion will be successful. In addition, we face risks in doing business internationally that could expose us to reduced demand for our products, lower prices for our products or other adverse effects on our operating results. Among the risks we believe are most likely to affect us are:
|
· |
difficulties, inefficiencies and costs associated with staffing and managing foreign operations; |
|
· |
longer and more difficult customer qualification and credit checks; |
|
· |
greater difficulty collecting accounts receivable and longer payment cycles; |
|
· |
the need for various local approvals to operate in some countries; |
|
· |
difficulties in entering some foreign markets without larger-scale local operations; |
|
· |
compliance with local laws and regulations; |
|
· |
unexpected changes in regulatory requirements, including the elimination of tax holidays; |
|
· |
reduced protection for intellectual property rights in some countries; |
|
· |
adverse tax consequences as a result of repatriating cash generated from foreign operations to the United States; |
|
· |
adverse tax consequences, including potential additional tax exposure if we are deemed to have established a permanent establishment outside of the United States; |
|
· |
adverse tax consequences, including potential additional tax costs, resulting from the new tax legislation signed into law on December 22, 2017, that imposes a minimum domestic tax on the earnings of foreign subsidiaries; |
|
· |
the effectiveness of our policies and procedures designed to ensure compliance with the Foreign Corrupt Practices Act of 1977 and similar regulations; |
|
· |
the imposition of tariffs or other trade barriers on the importation of our products; |
|
· |
fluctuations in currency exchange rates, which could increase the prices of our products to customers outside of the United States, increase the expenses of our international operations by reducing the purchasing power of the U.S. dollar and expose us to foreign currency exchange rate risk if, in the future, we denominate our international sales in currencies other than the U.S. dollar; |
|
· |
new and different sources of competition; and |
|
· |
political and economic instability, and terrorism. |
Our failure to manage any of these risks successfully could harm our operations and reduce our revenue.
Because our business is highly dependent on growth in the electronics manufacturing supply chain in China, any slowdown in this growth could adversely affect our business and operating results.
Our business is highly dependent upon the economy and the business environment in China, which has recently been adversely affected by the COVID-19 outbreak. In particular, our growth strategy is based upon the assumption that demand in China for devices that use semiconductors will continue to grow. Therefore, any slowdown in the growth of consumer demand in China, including as a result of COVID-19 or otherwise, for products that use semiconductors, such as computers, mobile phones or other consumer electronics, could have a serious adverse effect on our business. In addition, our business plan assumes that an increasing number of non-Chinese integrated device manufacturers, fabless semiconductor companies and systems companies will establish operations in China. That assumption may not prove to be correct as a result of the outbreak of COVID-19, or other reasons. Any decline in the rate of migration to China of semiconductor design companies or companies that require semiconductors as components for their products could adversely affect our business and operating results.
Significant tariffs or other restrictions on Chinese imports, and any related counter-measures taken by China, may materially harm our revenue and results of operations. In March 2018, the United States imposed a 25% tariff on steel imports and a 10% tariff on aluminum imports and announced additional tariffs on goods imported from China specifically, as well as certain other countries. The materials subject to these tariffs to date do not constitute a significant percentage of our raw material costs. However, if retaliatory trade measures taken by China or other countries in
31
response to the tariffs cause the cost of our products to increase, we may be required to raise our prices, which may result in the loss of customers and harm to our operating performance and reputation.
In order to comply with environmental laws and regulations, we may need to modify our activities or incur substantial costs, and if we fail to comply with environmental regulations we could be subject to substantial fines or be required to have our suppliers alter their processes.
The semiconductor industry is subject to a variety of international, federal, state and local governmental regulations directed at preventing or mitigating environmental harm, as well as to the storage, discharge, handling, generation, disposal and labeling of toxic or other hazardous substances. Failure to comply with environmental regulations could subject us to civil or criminal sanctions and property damage or personal injury claims. Compliance with current or future environmental laws and regulations could restrict our ability to expand our business or require us to modify processes or incur other substantial expenses which could harm our business. In response to environmental concerns, some customers and government agencies impose requirements for the elimination of hazardous substances, such as lead (which is widely used in soldering connections in the process of semiconductor packaging and assembly), from electronic equipment. For example, the EU adopted its Restriction on Hazardous Substance Directive which prohibits, with specified exceptions, the sale in the EU market of new electrical and electronic equipment containing more than agreed levels of lead or other hazardous materials and China has enacted similar regulations. Environmental laws and regulations such as these could become more stringent over time, causing a need to redesign technologies, imposing greater compliance costs and increasing risks and penalties associated with violations, which could seriously harm our business.
The issuance of new accounting standards or future interpretations of existing accounting standards could adversely affect our operating results.
We prepare our financial statements in accordance with accounting principles generally accepted in the United States of America (“GAAP”). A change in those principles could have a significant effect on our reported results and might affect our reporting of transactions completed before a change is announced. GAAP is issued and subject to interpretation by the Financial Accounting Standards Board, the Public Company Accounting Oversight Board, the SEC and various other bodies formed to promulgate and interpret accounting principles. A change in these principles or interpretations could have a significant effect on our reported financial results, and could affect the reporting of transactions completed before the announcement of a change. The issuance of new accounting standards or future interpretations of existing accounting standards, or changes in our business practices or estimates, could result in future changes in our revenue recognition or other accounting policies that could have a material adverse effect on our results of operations.
Our substantial level of indebtedness could adversely affect our financial condition.
We have a substantial amount of indebtedness, which will require significant interest payments. We have approximately $80.5 million aggregate principal amount of indebtedness outstanding as of December 31, 2019, representing the 4.25% Convertible Senior Notes due 2024 (“Notes”) we issued in September 2019. Our substantial level of indebtedness could have important consequences, including the following:
|
· |
we must use a substantial portion of our cash flow from operations to pay interest and principal on the Notes, which will reduce funds available to us for other purposes such as working capital, capital expenditures, other general corporate purposes and potential acquisitions; |
|
· |
our ability to refinance such indebtedness or to obtain additional financing for working capital, capital expenditures, acquisitions or general corporate purposes may be impaired; |
|
· |
we will be exposed to fluctuations in interest rates; |
32
|
· |
our leverage may be greater than that of some of our competitors, which may put us at a competitive disadvantage and reduce our flexibility in responding to current and changing industry and financial market conditions; |
|
· |
we may be more vulnerable to the economic downturns and adverse developments in our business; |
|
· |
we may be unable to comply with financial and other restrictive covenants in our debt agreements, which could result in an event of default that, if not cured or waived, may result in acceleration of certain of our debt and would have an adverse effect on our business and prospects and could force us into bankruptcy or liquidation; and |
|
· |
in the event of the insolvency, liquidation, reorganization, dissolution or other winding up of our business, if there are not sufficient assets remaining to pay all creditors, then all or a portion of the amounts due on the Notes then outstanding would remain unpaid. |
We may be able to incur substantial additional indebtedness in the future, subject to the restrictions contained in our existing credit facility and the terms of any of our other indebtedness. For example, we may incur additional debt to fund our business and strategic initiatives. If we incur additional debt and other obligations, the risks associated with our substantial leverage and the ability to service such debt would increase.
Our ability to meet expenses, to remain in compliance with our covenants under our debt arrangements and to make future principal and interest payments in respect of our debt arrangements depends on, among other things, our operating performance, competitive developments and financial market conditions, all of which are significantly affected by financial, business, economic and other factors. We are not able to control many of these factors. Accordingly, our cash flow may not be sufficient to allow us to pay principal and interest on our debt and meet our other obligations.
We may not be able to secure additional financing on favorable terms, or at all, to meet our future capital needs.
We have funded our operations since inception through equity financings, our borrowing arrangements, our public offerings of common stock in October 2015, June 2017, and July 2018, and issuance of the Notes. We have incurred net losses and negative cash flows from operating activities since our inception, and we expect we will continue to incur operating and net losses and negative cash flows from operations for the foreseeable future. We do not know when or if our operations will generate sufficient cash to fund our ongoing operations. In the future, we may require additional capital to fund our ongoing operations, respond to business opportunities, challenges, acquisitions or unforeseen circumstances and may determine to engage in equity or debt financings or enter into credit facilities, but we may not be able to timely secure additional debt or equity financing or raise additional capital in the public market on favorable terms or at all.
Our current credit facility limits our ability to incur indebtedness, and these restrictions are subject to a number of qualifications and exceptions subject to the consent of our lender. Any additional debt financing obtained by us in the future could also involve restrictive covenants relating to our capital-raising activities and other financial and operational matters, which may make it more difficult for us to obtain additional capital and to pursue business opportunities, including potential acquisitions.
If we raise additional funds through issuances of equity, convertible debt securities or other securities convertible into equity, our existing stockholders could suffer significant dilution in their percentage ownership of our company, and any new equity securities we issue could have rights, preferences and privileges senior to those of holders of our common stock. If we are unable to obtain adequate financing or financing on terms satisfactory to us, when we require it, our ability to continue to grow or support our business and to respond to business challenges could be significantly limited.
33
Our ability to use net operating losses to offset future taxable income may be subject to certain limitations.
In general, under Sections 382 and 383 of the U.S. Internal Revenue Code of 1986, as amended (“the Code”), a corporation that undergoes an “ownership change” is subject to limitations on its ability to utilize its pre-change net operating losses (“NOLs”) and certain other tax credit carryforwards (including research credit carryforwards) to offset its post-change taxable income or taxes. The Company does not expect to undergo an ownership change (other than the ownership change that will result from the closing of the Merger). The potential change in our stock ownership that would result from the closing of the merger could constitute an ownership change under Section 382 of the Code and could cause our ability to utilize our NOLs and tax credits to be further limited. Our NOLs and tax credits could also be impaired under state laws. As a result of the foregoing limitations, we might not be able to utilize a material portion of our federal and/or state NOLs and tax credits.
If we are unable to maintain effective internal control over financial reporting, investors may lose confidence in the accuracy and completeness of our financial reports and the market price of our common stock may be negatively affected.
As a public company, we are required to maintain internal controls over financial reporting and to report any material weaknesses in such internal controls. We are required under Section 404 of the Sarbanes-Oxley Act to evaluate and determine the effectiveness of our internal control over financial reporting and provide a management report on our internal control over financial reporting. In addition, beginning with our fiscal year ending December 31, 2020, should we remain an independent public company, we expect that we will be required to have our independent registered public accounting firm issue an attestation report regarding management’s report on our internal control over financial reporting pursuant to Section 404(b) of the Sarbanes-Oxley Act. If we have one or more material weaknesses in our internal control over financial reporting, we may not detect errors on a timely basis and our financial statements may be materially misstated. If we identify material weaknesses in our internal control over financial reporting, if we are unable to determine that our internal control over financial reporting is effective, or if our independent registered public accounting firm is unable to express an unqualified opinion as to the effectiveness of our internal control over financial reporting, investors may lose confidence in the accuracy and completeness of our financial reports, the market price of our common stock could be negatively affected, and we could become subject to investigations by the Nasdaq Stock Market, the SEC or other regulatory authorities, which could require additional financial and management resources.
If our goodwill or intangible assets become impaired, we may be required to record a significant charge to earnings.
We review our intangible assets for impairment when events or changes in circumstances indicate the carrying value may not be recoverable. Goodwill is required to be tested for impairment at least annually. As of December 31, 2019, we had a net total of $67.7 million of goodwill and other intangible assets.
In connection with our ongoing operations, additional insight could be gained that may impact: (1) identified intangible assets; (2) the estimated total value assigned to intangible assets; and (3) the estimated useful life of each category of intangible assets. An adverse change in market conditions, particularly if such change has the effect of changing one of our critical assumptions or estimates, could result in a change to the estimation of fair value that could result in an impairment charge to our goodwill or intangible assets. Any such material charges may have a material negative impact on our operating results.
Regulations related to “conflict minerals” may force us to incur additional expenses, may make our supply chain more complex and may result in damage to our reputation with customers.
Pursuant to the Dodd-Frank Act, the SEC has adopted requirements for companies that use certain minerals and metals, known as conflict minerals, in their products, whether or not these products are manufactured by third parties. These requirements require companies to diligence, disclose and report whether or not such minerals originate from the Democratic Republic of Congo and adjoining countries. The implementation of these requirements could adversely
34
affect the sourcing, availability and pricing of minerals used in the manufacture of our products, and affect our costs and relationships with customers, distributors and suppliers as we must obtain additional information from them to ensure our compliance with the disclosure requirement. In addition, we incur additional costs to comply with the disclosure requirements, including costs related to determining the source of any of the relevant minerals and metals used in our products. Since our supply chain is complex, we may not be able to sufficiently verify the origins for these minerals and metals used in our products through the due diligence procedures that we implement, which may harm our reputation. In such event, we may also face difficulties in satisfying customers who require that all of the components of our products are certified as conflict mineral free and these customers may discontinue, or materially reduce, purchases of our products, which could result in a material adverse effect on our results of operations and our financial condition may be adversely affected.
Some of our facilities and the facilities of our suppliers are located near known earthquake fault zones, and the occurrence of an earthquake or other catastrophic disaster could damage our facilities, which could cause us to curtail our operations.
Our principal offices, and our contract manufacturers’ and suppliers’ facilities in Asia, are located near known earthquake fault zones and, therefore, are vulnerable to damage from earthquakes. We are also vulnerable to damage from other types of disasters, such as power loss, fire, floods and similar events. If any such disaster were to occur, our ability to operate our business could be seriously impaired. In addition, we may not have adequate insurance to cover our losses resulting from disasters or other similar significant business interruptions. Any significant losses that are not recoverable under our insurance policies could seriously impair our business and financial condition.
Risks Related to Ownership of Our Common Stock
The market price of our common stock has been and will likely continue to be volatile, and you could lose all or part of your investment.
The market price of our common stock has been, and will likely continue to be, volatile. Since shares of our common stock were sold in our initial public offering in October 2015 at a price of $5.00 per share, our stock price has fluctuated significantly. In addition to the factors discussed in this Annual Report on Form 10‑K, the market price of our common stock may fluctuate significantly in response to numerous factors, many of which are beyond our control, including:
|
· |
the impact of our announced Merger with Dialog; |
|
· |
overall performance of the equity markets in general, in our industry or in the markets we address; |
|
· |
our operating performance and the performance of other similar companies; |
|
· |
changes in the estimates of our results of operations that we provide to the public, our failure to meet these projected results or changes in recommendations by securities analysts that elect to follow our common stock; |
|
· |
announcements of technological innovations, new products or enhancements to products, acquisitions, strategic alliances or significant agreements by us or by our competitors; |
|
· |
announcements of new business partners, on the termination of existing business partner arrangements or changes to our relationships with such business partners; |
|
· |
recruitment or departure of key personnel; |
|
· |
announcements of litigation or claims against us; |
|
· |
changes in legal requirements relating to our business; |
|
· |
the economy as a whole, market conditions in our industry, and the industries of our customers and end customers |
|
· |
natural disasters or international health emergencies such as COVID-19; |
|
· |
trading activity by our principal stockholders; |
|
· |
any further issuances of securities, including by conversion of the Notes in certain circumstances; |
35
|
· |
the expiration of contractual lock-up or market standoff agreements; and |
|
· |
sales of shares of our common stock by us or our stockholders. |
In addition, the stock markets have experienced extreme price and volume fluctuations that have affected and continue to affect the market prices of equity securities of many technology companies. Stock prices of many technology companies have fluctuated in a manner unrelated or disproportionate to the operating performance of those companies. In the past, stockholders have filed securities class action litigation following periods of market volatility. If we were to become involved in securities litigation, it could subject us to substantial costs, divert resources and the attention of management from our business, and adversely affect our business.
If securities analysts do not publish research or reports about our business or if they downgrade our stock, the market price of our stock could decline.
The trading market for our common stock relies in part on the research and reports that industry or financial analysts publish about us or our business. We do not control these analysts. If few analysts cover our company, the price and trading volume of our stock could suffer. If one or more of the analysts who cover us downgrade our stock, or publish unfavorable research about our business, our stock price would likely decline rapidly. If one or more of these analysts cease coverage of our company or fail to publish regularly, we could lose visibility in the market, which in turn could cause our stock price to decline.
We do not intend to pay dividends for the foreseeable future.
We have never declared nor paid cash dividends on our capital stock. We currently intend to retain any future earnings to finance the operation and expansion of our business, and we do not expect to declare or pay any dividends in the foreseeable future. Under the terms of the Merger Agreement, from February 20, 2020 until the effective time of the Merger, we may not declare any dividend or make any other distribution in respect of any shares of capital stock without Dialog’s prior written consent. In addition, our ability to pay cash dividends on our capital stock is likely to be restricted by any future debt financing arrangement. Any return to stockholders will therefore be limited to increases in the price of our common stock, if any.
Provisions in our restated certificate of incorporation and amended and restated bylaws or Delaware law might discourage, delay or prevent a change of control of our company or changes in our management.
Delaware corporate law and our restated certificate of incorporation and amended and restated bylaws contain provisions that could discourage, delay or prevent a change in control of our company or changes in our board of directors that the stockholders of our company may deem advantageous. Among other things, these provisions:
|
· |
establish a classified board of directors so that not all members of our board are elected at one time; |
|
· |
provide that directors may be removed only “for cause” and only with the approval of stockholders representing sixty-six percent (66%) of our outstanding common stock; |
|
· |
require super-majority voting to amend some provisions in our restated certificate of incorporation and amended and restated bylaws; |
|
· |
authorize the issuance of “blank check” preferred stock that our board could issue to increase the number of outstanding shares and to discourage a takeover attempt; |
|
· |
eliminate the ability of our stockholders to call special meetings of stockholders; |
|
· |
prohibit stockholder action by written consent, which means that all stockholder actions will be required to be taken at a meeting of our stockholders; |
|
· |
provide that our board of directors is expressly authorized to make, alter or repeal our bylaws; and |
|
· |
establish advance notice requirements for nominations for election to our board or for proposing matters that can be acted upon by stockholders at stockholder meetings. |
36
These provisions may frustrate or prevent any attempts by our stockholders to replace or remove our current management by making it more difficult for stockholders to replace members of our board of directors, which is responsible for appointing the members of our management. In addition, we are governed by the provisions of Section 203 of the Delaware General Corporation Law, which generally prohibits a Delaware corporation from engaging in a broad range of business combinations with any “interested” stockholder for a period of three years following the date on which the stockholder became an “interested” stockholder. Any delay or prevention of a change of control transaction or changes in our management could cause the market price of our common stock to decline.
Risks Related to the Notes
Servicing our debt requires a significant amount of cash, and we may not have sufficient cash flow from our business to pay our substantial debt.
Should we remain an independent public company, our ability to make scheduled payments of the principal of, to pay interest on or to refinance our indebtedness, including the Notes, depends on our future performance, which is subject to economic, financial, competitive and other factors beyond our control. Our business may not continue to generate cash flow from operations in the future sufficient to service our debt and make necessary capital expenditures. If we are unable to generate such cash flow, we may be required to adopt one or more alternatives, such as selling assets, restructuring debt or obtaining additional equity capital on terms that may be onerous or highly dilutive. Our ability to refinance our indebtedness will depend on the capital markets and our financial condition at such time. We may not be able to engage in any of these activities or engage in these activities on desirable terms, which could result in a default on our debt obligations.
We may not have the ability to raise the funds necessary to settle conversions of the Notes in cash or to repurchase the Notes upon a fundamental change, and any future debt may contain limitations on our ability to pay cash upon conversion or repurchase of the Notes.
Holders of Notes will have the right to require us to repurchase all or a portion of their Notes upon the occurrence of a fundamental change before the maturity date, such as the Merger, at a fundamental change repurchase price equal to 100% of the principal amount of the Notes to be repurchased, plus accrued and unpaid interest, if any. In addition, should we remain an independent public company, upon conversion of the Notes, unless we elect to deliver solely shares of our common stock to settle such conversion (other than paying cash in lieu of delivering any fractional share), we will be required to make cash payments in respect of the Notes being converted. However, we may not have enough available cash or be able to obtain financing at the time we are required to make repurchases of the Notes surrendered therefor or pay cash with respect to the Notes being converted.
In addition, our ability to repurchase the Notes or to pay cash upon conversions of the Notes may be limited by law, regulatory authority, or any agreements governing our future indebtedness. Our failure to repurchase the Notes at a time when the repurchase is required by the applicable indenture or to pay any cash upon conversions of Notes as required by the indenture would constitute a default under the applicable indenture. A default under the applicable indenture or the fundamental change itself could also lead to a default under agreements governing any future indebtedness. If the payment of the related indebtedness were to be accelerated after any applicable notice or grace periods, we may not have sufficient funds to repay the indebtedness and repurchase the Notes or to pay cash upon conversions of the Notes.
The conditional conversion feature of the Notes, if triggered, may adversely affect our financial condition and operating results.
In the event the conditional conversion feature of the Notes is triggered, including as a result of the Merger, holders of notes will be entitled to convert their notes at any time during specified periods at their option. If one or more
37
holders elect to convert their Notes, unless we elect to satisfy our conversion obligation by delivering solely shares of our common stock (other than paying cash in lieu of delivering any fractional share), we would be required to settle a portion or all of our conversion obligation in cash, which could adversely affect our liquidity. In addition, even if holders do not elect to convert their Notes, we could be required under applicable accounting rules to reclassify all or a portion of the outstanding principal of the Notes as a current rather than long-term liability, which would result in a material reduction of our net working capital.
The accounting method for convertible debt securities that may be settled in cash, such as the Notes, could have a material effect on our reported financial results should we remain an independent public company.
In May 2008, the Financial Accounting Standards Board (“FASB”), issued FASB Staff Position No. APB 14-1, Accounting for Convertible Debt Instruments That May Be Settled in Cash Upon Conversion (Including Partial Cash Settlement), which has subsequently been codified as Accounting Standards Codification 470-20, Debt with Conversion and Other Options (“ASC 470-20”). Under ASC 470-20, an entity must separately account for the liability and equity components of the convertible debt instruments (such as the Notes) that may be settled entirely or partially in cash upon conversion in a manner that reflects the issuer’s economic interest cost. The effect of ASC 470-20 on the accounting for the Notes is that the equity component is required to be included in the additional paid-in capital section of stockholders’ equity on our consolidated balance sheet at issuance, and the value of the equity component would be treated as original issue discount for purposes of accounting for the debt component of the Notes. As a result we are required to record a greater amount of non-cash interest expense in current periods presented as a result of the amortization of the discounted carrying value of the Notes to their face amount over the term of the Notes. We will report larger net losses or lower net income in our financial results because ASC 470-20 will require interest to include both the current period’s amortization of the debt discount and the instrument’s non-convertible coupon interest rate, which could adversely affect our reported or future financial results, the trading price of our common stock and the trading price of the Notes.
In addition, under certain circumstances, convertible debt instruments (such as the Notes) that may be settled entirely or partly in cash are currently accounted for utilizing the treasury stock method, the effect of which is that the shares issuable upon conversion of the Notes are not included in the calculation of diluted net income per share except to the extent that the conversion value of the Notes exceeds their principal amount. Under the treasury stock method, for diluted net income per share purposes, the transaction is accounted for as if the number of shares of common stock that would be necessary to settle such excess, if we elected to settle such excess in shares, are issued. We cannot be sure that the accounting standards in the future will continue to permit the use of the treasury stock method. If we are unable or otherwise elect not to use the treasury stock method in accounting for the shares issuable upon conversion of the Notes, then our diluted earnings per share would be adversely affected.
In July 2019, the FASB issued an exposure draft that proposes to change the accounting for the convertible debt instruments described above. Under the exposure draft, an entity may no longer be required to separately account for the liability and equity components of convertible debt instruments. This could have the impact of reducing non-cash interest expense, and thereby increasing net income or decreasing net loss. Additionally, as currently proposed, the treasury stock method for calculating earnings per share will no longer be allowed for convertible debt instruments whose principal amount may be settled using shares. Rather, the if-converted method may be required, which would increase the total number of potential dilutive common shares and could decrease our diluted weighted-average earnings per share. We cannot be sure that this exposure draft will be issued, or will be issued in its current format. We also cannot be sure whether other changes may be made to the current accounting standards related to the Notes, or otherwise, that could have an adverse impact on our financial statements.
38
Future sales of our common stock or equity-linked securities in the public market could lower the market price for our common stock and adversely impact the trading price of the Notes.
Pursuant to the terms of the Merger Agreement, from February 20, 2020 until the effective time of the Merger, we generally may not sell, issue, grant or authorize the sale, issuance or grant of any shares of our common stock or other security, or any option, performance stock unit, restricted stock award or other equity-based compensation award, or right to acquire any capital stock or other security; or any instrument convertible into or exchangeable for any capital stock or other security, other than the issuance of shares upon the valid exercise of outstanding options, or the vesting or scheduled settlement of other outstanding equity awards or outstanding warrants, or the conversion of the Notes, in each case in accordance with their terms.
We may sell additional shares of our common stock or equity-linked securities to raise capital, however, should we remain an independent public company. In addition, a substantial number of shares of our common stock is reserved for issuance upon the exercise of stock options and upon conversion of the Notes, which, as noted in the paragraph above, are issuable pursuant to the terms of the Merger Agreement. We cannot predict the size of future issuances or the effect, if any, that they may have on the market price for our common stock. The issuance and sale of substantial amounts of our common stock or equity-linked securities, or the perception that such issuances and sales may occur, could adversely affect the trading price of the Notes and the market price of our common stock and impair our ability to raise capital through the sale of additional equity or equity-linked securities.
Provisions in the indenture for the Notes may deter or prevent a business combination that may be favorable to holders of the Notes or our stockholders.
If a fundamental change occurs prior to the maturity date, such as the Merger, holders of the Notes will have the right, at their option, to require us to repurchase all or a portion of their notes. In addition, if a make-whole fundamental change occurs prior the maturity date, such as the Merger, we will in some cases be required to increase the conversion rate for a holder that elects to convert its notes in connection with such make-whole fundamental change. Furthermore, the indenture for the Notes will prohibit us from engaging in certain mergers or acquisitions unless, among other things, the surviving entity assumes our obligations under the Notes, which we expect to occur in connection with the closing of the Merger. These and other provisions in the indenture could deter or prevent a third party from acquiring us even when the acquisition may be favorable to holders of the Notes or our stockholders.
The capped call transactions may affect the value of the Notes and our common stock.
In connection with the pricing of the Notes, we entered into capped call transactions with Credit Suisse Capital LLC and Société Générale, or the option counterparties. The capped call transactions cover, subject to customary adjustments, the number of shares of our common stock that was initially underlie the Notes. The capped call transactions are expected generally to reduce the potential dilution to our common stock as a result of any conversion of the Notes.
In connection with establishing their initial hedges of the capped call transactions, the option counterparties or their respective affiliates purchased/will purchase shares of our common stock and/or entered/will enter into various derivative transactions with respect to our common stock concurrently with or shortly after the pricing of the Notes. This activity could increase (or reduce the size of any decrease in) the market price of our common stock or the Notes at that time.
In addition, should we remain an independent public company, we expect the option counterparties or their respective affiliates may modify their hedge positions by entering into or unwinding various derivatives with respect to our common stock and/or purchasing or selling our common stock in secondary market transactions following the pricing of the Notes and prior to the maturity date (and are likely to do so on each exercise date for the capped call
39
transactions, which are expected to occur during each 30 trading day period beginning on the 31st scheduled trading day prior to the maturity date of the Notes, or following any termination of any portion of the capped call transactions in connection with any repurchase, redemption or conversion of the Notes). This activity could also cause or avoid an increase or a decrease in the market price of our common stock or the Notes, which could affect the holder of the Notes’ ability to convert the Notes and, to the extent the activity occurs during any observation period related to a conversion of notes, it could affect the amount and value of the consideration that the holder of the Notes will receive upon conversion of the Notes.
The potential effect, if any, of these transactions and activities on the market price of our common stock, should we remain an independent public company, or the Notes will depend in part on market conditions and cannot be ascertained at this time. Any of these activities could adversely affect the value of our common stock and the value of the Notes (and as a result, the amount and value of the consideration that the holder of the Notes would receive upon the conversion of any notes) and, under certain circumstances, the holder of the Notes’ ability to convert the notes.
We are subject to counterparty risk with respect to the capped call transactions.
The option counterparties to the capped call transactions we have entered into are financial institutions, and we are subject to the risk that one or more of the option counterparties may default or otherwise fail to perform, or may exercise certain rights to terminate, their obligations under the capped call transactions. Our exposure to the credit risk of the option counterparties will not be secured by any collateral. If an option counterparty to one or more capped call transactions becomes subject to insolvency proceedings, we will become an unsecured creditor in those proceedings with a claim equal to our exposure at the time under such transaction. Our exposure will depend on many factors but, generally, our exposure will increase if the market price or the volatility of our common stock increases, should we remain an independent public company. In addition, upon a default or other failure to perform, or a termination of obligations, by an option counterparty, we may suffer more dilution than we currently anticipate with respect to our common stock, should we remain an independent public company. We can provide no assurances as to the financial stability or viability of the option counterparties.
ITEM 1B. UNRESOLVED STAFF COMMENTS
None.
We lease approximately 34,000 square feet in Santa Clara, California for our corporate headquarters, pursuant to a noncancelable lease, which expires in July 2023. We lease approximately 8,437 square feet in Dublin, Ireland for our operations, pursuant to a noncancelable lease, which expires in November 2033. As part of our acquisition of S3 Semiconductors, we also acquired design centers with leased properties in Cork, Ireland, Lisbon, Portugal and Prague, Czech Republic. We also acquired a 31,778 square foot leased facility in Santa Clara, California as part of the Echelon acquisition. The lease was terminated in July 2019 and was not renewed. We believe that our existing facilities are adequate to meet our current needs, and we intend to add or change facilities as needs require. We believe that, if required, suitable additional or substitute space would be available to accommodate expansion of our operations.
We are not currently a party to any legal proceedings which, if determined adversely to us, would individually or in the aggregate have a material adverse effect on our business, operating results, financial condition or cash flows. We may, from time to time, become involved in legal proceedings arising in the ordinary course of our business and as our business grows, we may become a party to an increasing number of legal proceedings.
40
41
ITEM 5. MARKET FOR REGISTRANT’S COMMON EQUITY, RELIATED STOCKHOLDER MATTERS AND ISSUER PURCHASES OF EQUITY SECURITIES
Market Information for Common Stock
Our common stock has been listed on The Nasdaq Stock Market under the symbol “IOTS” since October 27, 2015, the date of our initial public offering. Prior to our initial public offering, there was no public market for our common stock.
As of February 28, 2020, there were 26 registered stockholders of record of our common stock. Because many of our shares of common stock are held by brokers or other institutions on behalf of stockholders, we are unable to estimate the total number of stockholders represented by the record holders.
The information required concerning the sale of our equity securities will be included in an amendment to this Annual Report on Form 10-K or incorporated by reference from our Proxy Statement to be filed with the SEC for our 2019 Annual Meeting of Stockholders within 120 days after the end of our fiscal year ended December 31, 2019.
Dividend Policy
We have never declared or paid any cash dividends on our capital stock. We currently intend to retain any future earnings and do not expect to pay any cash dividends on our common stock for the foreseeable future. Any determination to pay dividends in the future will be at the discretion of our board of directors, subject to restrictions that may be imposed by applicable laws or agreements binding on us.
Stock Performance Graph
This performance graph shall not be deemed “filed” for purposes of Section 18 of the Securities Exchange Act of 1934 (Exchange Act) or otherwise subject to the liabilities under that Section, and shall not be deemed to be incorporated by reference into any filing of Adesto under the Securities Act of 1933 or the Exchange Act.
The graph below compares the cumulative total stockholder return on our common stock with the cumulative total return on the Nasdaq Composite Index and the PHLX Semiconductor Index for the period from October 27, 2015 (the date our common stock commenced trading on The Nasdaq Capital Market) to December 31, 2019, the end of our
42
last fiscal year. The comparisons in the graph below are based on historical data and are not intended to forecast or be indicative of future stock price performance of our common stock.
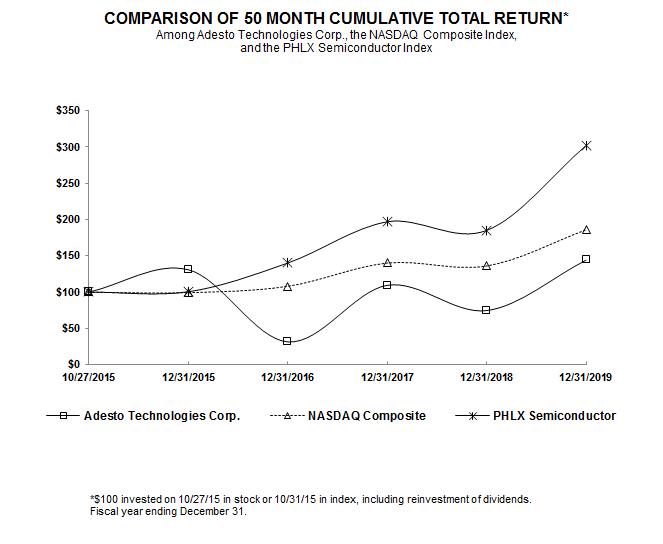
Recent Sale of Unregistered Securities and Use of Proceeds
None.
Purchases of Equity Securities by the Issuer and Affiliated Purchasers
None.
43
ITEM 6. SELECTED FINANCIAL DATA
We have derived the selected consolidated statements of operations data for the years ended December 31, 2019, 2018, and 2017, and the consolidated balance sheet data as of December 31, 2019 and 2018 from our audited consolidated financial statements included elsewhere in this Annual Report on Form 10-K. The consolidated statements of operations data for the years ended December 31, 2016 and 2015 and the consolidated balance sheet data as of December 31, 2017, 2016 and 2015 have been derived from our audited consolidated financial statements not included in this Annual Report on Form 10-K. You should read the following selected consolidated financial data below in conjunction with the section entitled “Management’s Discussion and Analysis of Financial Condition and Results of Operations” and our consolidated financial statements, related notes and other financial information included elsewhere in this Annual Report on Form 10-K. The selected consolidated financial data in this section are not intended to replace our consolidated financial statements and the related notes, and are qualified in their entirety by the consolidated financial statements and related notes included elsewhere in this Annual Report on Form 10-K. Our historical results are not necessarily indicative of the results that may be expected for any period in the future.
Consolidated Statements of Operations Data:
|
|
|
Year Ended December 31, |
|||||||||||||
|
|
|
2019 |
|
2018 |
|
2017 |
|
2016 |
|
2015 |
|||||
|
|
|
(in thousands, except share and per share data) |
|||||||||||||
|
Revenue, net |
|
$ |
118,166 |
|
$ |
83,490 |
|
$ |
56,112 |
|
$ |
43,968 |
|
$ |
43,259 |
|
Cost of revenue |
|
|
61,461 |
|
|
47,429 |
|
|
28,637 |
|
|
22,618 |
|
|
24,775 |
|
Gross profit |
|
|
56,705 |
|
|
36,061 |
|
|
27,475 |
|
|
21,350 |
|
|
18,484 |
|
Operating expenses: |
|
|
|
|
|
|
|
|
|
|
|
|
|
|
|
|
Research and development |
|
|
30,942 |
|
|
20,273 |
|
|
13,623 |
|
|
15,412 |
|
|
12,311 |
|
Selling, general and administrative |
|
|
32,307 |
|
|
22,592 |
|
|
17,461 |
|
|
16,968 |
|
|
11,571 |
|
Amortization of intangible assets |
|
|
7,153 |
|
|
3,871 |
|
|
1,222 |
|
|
1,235 |
|
|
1,236 |
|
Acquisition related expenses |
|
|
227 |
|
|
7,029 |
|
|
— |
|
|
— |
|
|
— |
|
Impairment and other charges |
|
|
1,694 |
|
|
2,680 |
|
|
— |
|
|
— |
|
|
— |
|
Gain from settlement with former foundry supplier |
|
|
— |
|
|
— |
|
|
— |
|
|
(1,962) |
|
|
— |
|
Total operating expenses |
|
|
72,323 |
|
|
56,445 |
|
|
32,306 |
|
|
31,653 |
|
|
25,118 |
|
Loss from operations |
|
|
(15,618) |
|
|
(20,384) |
|
|
(4,831) |
|
|
(10,303) |
|
|
(6,634) |
|
Other income (expense): |
|
|
|
|
|
|
|
|
|
|
|
|
|
|
|
|
Interest expense, net |
|
|
(10,964) |
|
|
(3,791) |
|
|
(753) |
|
|
(1,275) |
|
|
(1,115) |
|
Other income (expense), net |
|
|
(90) |
|
|
2,656 |
|
|
(3) |
|
|
(50) |
|
|
(695) |
|
Total other (expense), net |
|
|
(11,054) |
|
|
(1,135) |
|
|
(756) |
|
|
(1,325) |
|
|
(1,810) |
|
Loss before provision for (benefit from) for income taxes |
|
|
(26,672) |
|
|
(21,519) |
|
|
(5,587) |
|
|
(11,628) |
|
|
(8,444) |
|
Provision for (benefit from) income taxes |
|
|
184 |
|
|
(79) |
|
|
101 |
|
|
(16) |
|
|
(61) |
|
Net loss |
|
$ |
(26,856) |
|
$ |
(21,440) |
|
$ |
(5,688) |
|
$ |
(11,612) |
|
$ |
(8,383) |
|
Net loss per share: |
|
|
|
|
|
|
|
|
|
|
|
|
|
|
|
|
Basic and diluted |
|
$ |
(0.90) |
|
$ |
(0.85) |
|
$ |
(0.31) |
|
$ |
(0.77) |
|
$ |
(2.79) |
|
Weighted average number of shares used in computing net loss per share: |
|
|
|
|
|
|
|
|
|
|
|
|
|
|
|
|
Basic and diluted |
|
|
29,902,351 |
|
|
25,144,562 |
|
|
18,591,308 |
|
|
15,085,973 |
|
|
3,007,929 |
44
Consolidated Balance Sheets Data:
|
|
|
December 31, |
|||||||||||||
|
Consolidated Balance Sheets Data: |
|
2019 |
|
2018 |
|
2017 |
|
2016 |
|
2015 |
|||||
|
|
|
(in thousands) |
|||||||||||||
|
Cash, cash equivalents and restricted cash |
|
$ |
21,262 |
|
$ |
9,088 |
|
$ |
30,078 |
|
$ |
19,719 |
|
$ |
23,089 |
|
Total assets |
|
|
167,202 |
|
|
137,188 |
|
|
60,812 |
|
|
46,183 |
|
|
49,938 |
|
Current liabilities |
|
|
45,272 |
|
|
40,766 |
|
|
14,474 |
|
|
15,408 |
|
|
17,644 |
|
Debt |
|
|
56,589 |
|
|
29,559 |
|
|
13,334 |
|
|
18,048 |
|
|
13,420 |
|
Total stockholders' equity (deficit) |
|
|
58,776 |
|
|
62,742 |
|
|
32,950 |
|
|
16,365 |
|
|
24,479 |
In September 2019 we issued $80.5 million of convertible senior notes which carry an annual interest rate of 4.25% with interest being paid semiannually each March and September beginning in March 2020. In May 2018, we entered into a $35.0 million term loan with Tennenbaum Capital Partners, LLC (“Tennenbaum”) which was repaid in September 2019. As of December 31, 2019, we had $80.5 million of gross convertible notes outstanding.
ITEM 7. MANAGEMENT’S DISCUSSION AND ANALYSIS OF FINANCIAL CONDITION AND RESULTS OF OPERATIONS
You should read the following discussion and analysis of our financial condition and results of operations together with the consolidated financial statements and related notes that are included elsewhere in this Annual Report on Form 10‑K. This discussion contains forward-looking statements based upon current plans, expectations and beliefs that involve risks and uncertainties. Our actual results may differ materially from those anticipated in these forward-looking statements as a result of various factors, including those set forth under “Risk Factors” and in other parts of this Annual Report on Form 10‑K.
Overview
We are a leading provider of innovative, application-specific semiconductors and embedded systems that provide the key building blocks of Internet of Things (IoT) edge devices operating on networks worldwide. Our broad portfolio of semiconductor and embedded technologies are optimized for connected IoT devices used in industrial, consumer, communications and medical applications. Through expert design, systems expertise and proprietary intellectual property, we enable our customers to differentiate their systems where it matters most for IoT: longer battery life, greater reliability, integrated intelligence and lower cost. Through our solutions, we enable seamless access to data and control of ‘things’ in the connected world.
Our revenue is primarily derived from the sale of our NVM products, specifically our serial flash memory products, which represented a majority of our revenue for the year ended December 31, 2019. In recent years, we have invested in developing and commercializing new flash memory products that are well suited for low-power, high-growth applications. In 2013, we introduced the first of our next-generation DataFlash and Fusion Serial Flash products. Revenue from our next-generation NVM products were $73.8 million and $64.1 million for the years ended December 31, 2019 and 2018, respectively. With the acquisition of S3 Semiconductors, in May 2018, we expanded our product offering and began selling analog, mixed-signal and radio frequency ASICs and IP blocks, and managing the supply of high-quality devices to our customers. We acquired 100% of the issued capital of Echelon Corporation on September 14, 2018. During the years ended December 31, 2019 and 2018, S3 Semiconductors and Echelon revenues were approximately $44.3 and $19.3 million, respectively, following their respective acquisitions.
For the year ended December 31, 2019, our products were sold to more than 5,000 end customers. In general, we work directly with our customers to have our NVM devices designed into and qualified for their products. Although we maintain direct sales, support and development relationships with our customers, once our products are designed into a customer’s product, we sell a majority of our products to those customers through distributors. We generated 62%,
45
65% and 74% of our revenue from distributors during the years ended December 31, 2019, 2018 and 2017, respectively. Sales to three distributors generated approximately 38%, 31% and 38% of our revenue during the years ended December 31, 2018, 2017 and 2016, respectively. Additionally, we derived approximately 73%, 72% and 79% of our revenue internationally during the years ended December 31, 2019, 2018 and 2017, respectively, the majority of which was recognized in the Asia Pacific, or APAC, region. Revenue by geography is recognized based on the region to which our products are sold, and not to where the end products are shipped.
We employ a fabless manufacturing strategy and use market-leading suppliers for all phases of the manufacturing process, including wafer fabrication, assembly, testing and packaging. This strategy significantly reduces the capital investment that would otherwise be required to operate manufacturing facilities of our own.
On February 20, 2020, we entered into the Merger Agreement with Dialog and Merger Sub, pursuant to which Merger Sub will, pursuant to the terms of and subject to the conditions specified in the Merger Agreement, merge with and into us, and we will be the surviving corporation of the Merger and become a wholly owned direct or indirect subsidiary of Dialog . Upon the terms and subject to the conditions set forth in the Merger Agreement, at the effective time of the Merger, each share of our common stock (subject to certain exceptions) issued and outstanding immediately prior to the effective time of the Merger will be canceled and automatically converted into the right to receive $12.55 in cash, without interest and subject to any required tax withholding. Our Board of Directors has unanimously determined that the Merger is advisable and fair to, and in the best interests of, us and our stockholders, and unanimously recommended the adoption of the Merger Agreement by the holders of our common stock. The Merger is expected to close in the third quarter of 2020, subject to customary regulatory approvals and customary closing conditions. For more information see Note 17, “Subsequent Event,” in the notes to our consolidated financial statements.
Factors Affecting Our Performance
Product adoption in new markets and applications. We optimize our products to meet the technical requirements of the emerging IoT market. The growth in the IoT market is dependent on many factors, most of which are outside of our control. Should the IoT market not develop or develop more slowly, our financial results could be adversely affected.
Ability to attract and retain customers that make large orders. In 2019, our products were sold to more than 5,000 end customers, of which approximately 25 generated more than half our revenue. One end customer accounted for 10% or more of our revenue in 2019. No end customer accounted for 10% or more of our revenue in 2018 and 2017. While we expect the composition of our customers to change over time, especially given our recent acquisitions, our business and operating results will depend on our ability to continually target new and retain existing customers that place large orders, particularly those in growth markets which are less dependent on macroeconomic conditions.
Design wins with new and existing customers. We believe our solutions significantly improve the performance and potentially lower the system cost of our customers’ designs, particularly if we are part of the early design phase. Accordingly, we work closely with our customers and targeted prospects to understand their product roadmaps and strategies. We consider design wins to be critical to our future success. We define a design win as the successful completion of the evaluation stage, where a customer has tested our product, verified that our product meets its requirements and qualified our NVM device for their products. The number of our design wins has grown from 417 in 2018 to 570 in 2018. We had 459 additional design wins in 2019. The revenue that we generate, if any, from each design win can vary significantly. Our long-term sales expectations are based on forecasts from customers, internal estimates of customer demand factoring in expected time to market for end customer products incorporating our solutions and associated revenue potential and internal estimates of overall demand based on historical trends.
Pricing, product cost and gross margins of our products. Our gross margin has been and will continue to be affected by a variety of factors, including the timing of changes in pricing, shipment volumes, new product
46
introductions, changes in product mixes, changes in our purchase price of fabricated wafers and assembly and test service costs, the cost of raw materials for our embedded systems products, manufacturing yields and inventory write downs, if any. In general, newly introduced products and products with higher performance and more features tend to be priced higher than older, more mature products. Average selling prices in the semiconductor industry typically decline as products mature. Consistent with this historical trend, we expect that the average selling prices of our products will decline as they mature. In the normal course of business, we will seek to offset the effect of declining average selling prices on existing products by reducing manufacturing costs and introducing new and higher value-added products. More recently, certain of our suppliers have increased costs although this increase did not have a material impact on our results of operations for the year ended December 31, 2019. If we are unable to maintain overall average selling prices or offset any declines in average selling prices with realized savings on product costs, our gross margin will decline.
Investment in growth. We have invested, and intend to continue to invest, in expanding our operations, increasing our headcount, developing our products and differentiated technologies to support our growth and expanding our infrastructure. We expect our total operating expenses to increase in the foreseeable future to meet our growth objectives. We plan to continue to invest in our sales and support operations throughout the world, with a particular focus in adding additional sales and field applications personnel to further broaden our support and coverage of our existing customer base, in addition to developing new customer relationships and generating design wins. We also intend to continue to invest additional resources in research and development to support the development of our products and differentiated technologies. Any investments we make in our sales and marketing organization or research and development will occur in advance of experiencing any benefits from such investments, and the return on these investments may be lower than we expect. In addition, as we invest in expanding our operations internationally, our business and results will become further subject to the risks and challenges of international operations, including higher operating expenses and the impact of legal and regulatory developments outside the United States.
Components of Our Results of Operations
Revenue
For the year ended December 31, 2019 we derived approximately 62% of our revenue through the sale of our NVM products to OEMs and ODMs, primarily through distributors. We generated 62%, 65%, and 74% of our revenue from distributors for the years ended December 31, 2019, 2018, and 2017, respectively. We derived approximately 38% and 23% of our revenue from the operations of S3 Semiconductors and Echelon during the years ended December 31, 2019 and 2018, respectively. Revenue is recognized when control of the promised goods or services is transferred to customers, in an amount that reflects the consideration we expect to be entitled to in exchange for those goods or services. We sell the majority of our NVM products to distributors and generally recognize revenue when we ship the product directly to the distributors since title and risk of loss transfers at that time.
Because our distributors market and sell their products worldwide, our revenue by geographic location is not necessarily indicative of where our end customers’ product sales and design win activity occur, but rather of where their manufacturing operations occur.
Cost of Revenue and Gross Margin
Cost of revenue primarily consists of costs paid to our third-party manufacturers for wafer fabrication, assembly and testing of our NVM products, raw material purchases for embedded products, and write-downs of NVM and embedded inventory for excess and obsolete inventories. To a lesser extent, cost of revenue also includes depreciation of test equipment and expenses relating to manufacturing support activities, including personnel-related costs for both NVM and embedded products, logistics and quality assurance and shipping. Cost of revenue for ASIC and IP products is driven primarily by personnel-related costs including outside consultants along with facilities costs.
47
Our gross margin has been and will continue to be affected by a variety of factors, including the timing of changes in pricing, shipment volumes, new product introductions, changes in product mix, changes in our purchase price of fabricated wafers and assembly and test service costs, manufacturing yields and inventory write downs, if any. We expect our gross margin to fluctuate over time depending on the factors described above.
Operating Expenses
Our operating expenses consist of research and development, selling, general and administrative expense, amortization of intangible assets, acquisition related expenses and impairment and other charges. Personnel-related costs, including salaries, benefits, bonuses and stock-based compensation, are the most significant component of each of our operating expense categories. In addition, in the near term we expect to hire additional personnel, primarily in our selling and marketing functions, and increase research and development expenditures. Accordingly, we expect our operating expenses to increase in absolute dollars as we invest in these initiatives.
Research and Development. Our research and development expenses consist primarily of personnel-related costs for the design and development of our products and technologies. Additional research and development expenses include product prototype costs, amortization of mask costs and other materials costs, external test and characterization expenses, depreciation, amortization of design tool software licenses, amortization of acquisition-related intangible assets and allocated overhead expenses. We also incur costs related to outsourced research and development activities and joint venture activities. We expect research and development expenses to increase in absolute dollars for the foreseeable future as we continue to improve our product features and increase our portfolio of solutions.
Selling, general and administrative. Selling, general, and administrative expenses consist primarily of personnel-related costs for our sales, business development, marketing, and applications engineering activities, third-party sales representative commissions, promotional and other marketing expenses, amortization of acquisition-related intangible assets and travel expenses. General and administrative expenses consist primarily of personnel-related costs, consulting expenses and professional fees. Professional fees principally consist of legal, audit, tax and accounting services. We expect sales, general and administrative expenses to increase in absolute dollars for the foreseeable future as we hire additional personnel, increase our marketing activities, and make improvements to our infrastructure and incur additional costs for legal, insurance and accounting expenses associated with our recent acquisitions.
Amortization of intangible assets. Amortization of intangible assets is the periodic expense related to the use of intangible assets created as a result of the Atmel, S3 Semiconductors and Echelon acquisitions. The periodic expense is based on useful lives determined as part of the initial valuation of the assets acquired.
Acquisition related expenses. Acquisition related expenses are those costs incurred as a result of the S3 Semiconductors and Echelon acquisition and include banking fees, legal, accounting, and tax fees, and certain professional fees including costs related to the valuation of each acquisition.
Impairment and other charges. Impairment and other charges are costs incurred related to write-downs of certain equipment and assets, terminated projects and excess facilities.
Other Income (Expense), Net
Other income (expense), net is comprised of interest income (expense) and other income (expense). Interest expense consists of cash interest on our outstanding debt and the amortization of debt discount. Other expense, net consists of foreign exchange gains and losses and the change in the fair value of the earn-out liability which was part of the S3 Semiconductors share purchase agreement. The earn-out liability is tied to certain financial performance criteria defined in the S3 Semiconductors share purchase agreement. Our foreign currency exchange gains and losses relate to
48
transactions and asset and liability balances denominated in currencies other than the U.S. dollar. We expect our foreign currency gains and losses to continue to fluctuate in the future due to changes in foreign currency exchange rates.
Provision for (Benefit from) Income Taxes
Provision for (benefit from) income taxes consists primarily of U.S. federal and state income taxes in the United States and income taxes in certain foreign jurisdictions in which we conduct business. We have a full valuation allowance for deferred tax assets, including net operating loss carryforwards, and tax credits related primarily to research and development. We expect to maintain this full valuation allowance for the foreseeable future.
Results of Operations
The following table sets forth our consolidated results of operations for the periods shown:
|
|
|
Year Ended December 31, |
|||||||
|
|
|
2019 |
|
2018 |
|
2017 |
|||
|
|
|
(in thousands, except share and per share data) |
|||||||
|
Revenue, net |
|
$ |
118,166 |
|
$ |
83,490 |
|
$ |
56,112 |
|
Cost of revenue |
|
|
61,461 |
|
|
47,429 |
|
|
28,637 |
|
Gross profit |
|
|
56,705 |
|
|
36,061 |
|
|
27,475 |
|
Operating expenses: |
|
|
|
|
|
|
|
|
|
|
Research and development |
|
|
30,942 |
|
|
20,273 |
|
|
13,623 |
|
Selling, general and administrative |
|
|
32,307 |
|
|
22,592 |
|
|
17,461 |
|
Amortization of intangible assets |
|
|
7,153 |
|
|
3,871 |
|
|
1,222 |
|
Acquisition related expenses |
|
|
227 |
|
|
7,029 |
|
|
— |
|
Impairment and other charges |
|
|
1,694 |
|
|
2,680 |
|
|
— |
|
Total operating expenses |
|
|
72,323 |
|
|
56,445 |
|
|
32,306 |
|
Loss from operations |
|
|
(15,618) |
|
|
(20,384) |
|
|
(4,831) |
|
Other income (expense): |
|
|
|
|
|
|
|
|
|
|
Interest expense, net |
|
|
(10,964) |
|
|
(3,791) |
|
|
(753) |
|
Other income (expense), net |
|
|
(90) |
|
|
2,656 |
|
|
(3) |
|
Total other income (expense), net |
|
|
(11,054) |
|
|
(1,135) |
|
|
(756) |
|
Loss before provision for (benefit from) for income taxes |
|
|
(26,672) |
|
|
(21,519) |
|
|
(5,587) |
|
Provision for (benefit from) income taxes |
|
|
184 |
|
|
(79) |
|
|
101 |
|
Net loss attributable to common stockholders |
|
$ |
(26,856) |
|
$ |
(21,440) |
|
$ |
(5,688) |
|
Net loss per share: |
|
|
|
|
|
|
|
|
|
|
Basic and diluted |
|
$ |
(0.90) |
|
$ |
(0.85) |
|
$ |
(0.31) |
|
Weighted average number of shares used in computing net |
|
|
|
|
|
|
|
|
|
|
loss per share: |
|
|
|
|
|
|
|
|
|
|
Basic and diluted |
|
|
29,902,351 |
|
|
25,144,562 |
|
|
18,591,308 |
Comparison of Years Ended December 31, 2019, 2018 and 2017
Revenue, net
|
|
|
|
|
|
|
|
|
|
|
|
|
||||||||||
|
|
|
Year ended December 31, |
|
Change 2019 - 2018 |
|
|
Change 2018 - 2017 |
|
|||||||||||||
|
|
|
2019 |
|
2018 |
|
2017 |
|
Amount |
|
% |
|
|
Amount |
|
% |
|
|||||
|
Revenue, net |
|
$ |
118,166 |
|
$ |
83,490 |
|
$ |
56,112 |
|
$ |
34,676 |
|
42 |
% |
|
$ |
27,378 |
|
49 |
% |
49
|
|
|
Year ended December 31, |
|||||||
|
|
|
2019 |
|
2018 |
|
2017 |
|||
|
|
|
(in thousands) |
|||||||
|
United States |
|
$ |
31,887 |
|
$ |
23,188 |
|
$ |
11,667 |
|
Rest of Americas |
|
|
5,217 |
|
|
2,790 |
|
|
245 |
|
Europe |
|
|
20,942 |
|
|
17,514 |
|
|
9,546 |
|
Asia Pacific |
|
|
59,167 |
|
|
39,463 |
|
|
34,263 |
|
Rest of world |
|
|
953 |
|
|
535 |
|
|
391 |
|
Total |
|
$ |
118,166 |
|
$ |
83,490 |
|
$ |
56,112 |
Revenue increased by $34.7 million, or 42%, for 2019 as compared to 2018. This increase was due primarily to increased shipments of Standard Flash products to Tier 1 OEM customers along with full year of revenue contribution from the S3 Semiconductors and Echelon acquisitions of $44.3 million.
Revenue increased by $27.4 million, or 49%, for 2018 as compared to 2017. This increase was due primarily to increased shipments of Standard Flash products to Tier 1 OEM customers along with contributions from the S3 Semiconductors and Echelon acquisitions of $19.3 million.
Cost of Revenue and Gross Margin
|
|
|
Year ended December 31, |
|
|
Change 2019 - 2018 |
|
Change 2018 - 2017 |
|
|||||||||||||
|
|
|
|
|
|
|
|
|
|
|
|
|
|
|
|
|
|
|
|
|
|
|
|
|
|
2019 |
|
2018 |
|
2017 |
|
|
Amount |
|
% |
|
Amount |
|
% |
|
|||||
|
Cost of revenue |
|
$ |
61,461 |
|
$ |
47,429 |
|
$ |
28,637 |
|
|
$ |
14,032 |
|
30 |
% |
$ |
18,792 |
|
66 |
% |
|
Gross profit |
|
|
56,705 |
|
|
36,061 |
|
|
27,475 |
|
|
|
20,644 |
|
57 |
% |
|
8,586 |
|
31 |
% |
|
Gross margin |
|
|
48 |
% |
|
43 |
% |
|
49 |
% |
|
|
|
|
|
|
|
|
|
|
|
Cost of revenue increased by $14.0 million, or 30%, for 2019 as compared to 2018. This increase was due primarily to increased shipments of our NVM products together with a full year of costs associated with revenues from our ASIC and Embedded products.
Our gross margin percentage increased from 43% to 48%, or 5 percentage points, for 2019 as compared to 2018. This increase was due primarily to a higher percentage of our overall revenue being derived from our ASIC and Embedded products, which generally carry higher gross margins than our memory products.
Cost of revenue increased by $18.8 million, or 66%, for 2018 as compared to 2017. This increase was due primarily to increased shipments of Standard Flash product to Tier 1 OEM customers which carry a higher average unit cost, increased expenses related to our operations organization, and costs associated with our revenues from ASIC and Embedded products.
Our gross margin percentage decreased from 49% to 43%, or 6 percentage points, for 2018 as compared to 2017. This decrease was due primarily to product mix impacts as we generated a higher proportion of our revenues from sales to Tier 1 OEM customer of Standard Flash memory products which generally carry lower gross margins than our other memory products along with increased expenses within our operations organization.
Operating Expenses
|
|
|
|
|
|
|
|
|
|
|||||||||||||
|
|
|
Year ended December 31, |
|
Change 2019 - 2018 |
|
|
Change 2018 - 2017 |
|
|||||||||||||
|
|
|
2019 |
|
2018 |
|
2017 |
|
Amount |
|
% |
|
|
Amount |
|
% |
|
|||||
|
Operating expenses: |
|
|
|
|
|
|
|
|
|
|
|
|
|
|
|
|
|
|
|
|
|
50
|
Research and development |
|
$ |
30,942 |
|
$ |
20,273 |
|
$ |
13,623 |
|
$ |
10,669 |
|
53 |
% |
|
$ |
6,650 |
|
49 |
% |
|
Selling, general and administrative |
|
|
32,307 |
|
|
22,592 |
|
|
17,461 |
|
|
9,715 |
|
43 |
|
|
|
5,131 |
|
29 |
|
|
Amortization of intangible assets |
|
|
7,153 |
|
|
3,871 |
|
|
1,222 |
|
|
3,282 |
|
85 |
|
|
|
2,649 |
|
217 |
|
|
Acquisition related expenses |
|
|
227 |
|
|
7,029 |
|
|
— |
|
|
(6,802) |
|
(97) |
|
|
|
7,029 |
|
100 |
|
|
Impairment and other charges |
|
|
1,694 |
|
|
2,680 |
|
|
— |
|
|
(986) |
|
(37) |
|
|
|
2,680 |
|
100 |
|
|
Total operating expenses |
|
$ |
72,323 |
|
$ |
56,445 |
|
$ |
32,306 |
|
$ |
15,878 |
|
28 |
% |
|
$ |
24,139 |
|
75 |
% |
Research and Development. Research and development expense increased by $10.7 million, or 53%, in 2019 as compared to 2018. This increase was due primarily to an increase in personnel related costs of $6.8 million and an increase in outside services of $3.8 million. Both of these increases resulted from our acquisitions of S3 Semiconductor and Echelon.
Research and development expense increased by $6.7 million, or 49%, in 2018 as compared to 2017. This increase was due primarily to an increase in outside consulting costs of $2.7 million, an increase in personnel related costs of $2.0 million, an increase in facilities costs related primarily to our S3 Semiconductors and Echelon acquisitions of $0.6 million, an increase in depreciation and amortization of $0.5 million, an increase in materials costs of $0.4 million, and an increase in travel and other outside services of $0.4 million.
Selling, General and Administrative.
Selling, general and administrative expense increased by $9.7 million, or 43%, in 2019 as compared to 2018. This increase was primarily due to an increase in personnel related expenses of $7.0 million, an increase in outside services of $2.4 million, and an increase in travel expense of $0.4 all driven by our S3 Semiconductor and Echelon acquisitions.
Selling, general and administrative expense increased by $5.1 million, or 29%, in 2018 as compared to 2017. This increase was primarily due to an increase in personnel related expenses of $2.4 million, an increase in facilities related costs of $0.9 million, an increase in consulting expense of $0.7 million, and increase in travel and tradeshows of $0.6 million, an increase in accounting and tax services of $0.4 million, and an increase in third party rep commissions of $0.1 million.
Amortization of Intangible Assets. Amortization of intangible assets increased by $3.3 million, or 85%, for 2019 as compared to 2018. This increase was primarily due to a full year of amortization of intangible assets related to the acquisitions of S3 Semiconductors and Echelon in 2018. Amortization of intangible assets increased by $2.6 million, or 217%, for 2018 as compared to 2017. This increase was due primarily to additional amortization related to the S3 Semiconductors acquisition of $1.6 million and to the Echelon acquisition of $1.1 million.
Acquisition Related Expenses. Acquisition related expenses decreased by $6.8 million for 2019 as compared to 2018. The decrease was due primarily to significantly less acquisition related activity in 2019 compared to 2018 during which we completed two acquisitions. Acquisition related expenses increased by $7.0 million for 2018 as compared to 2017. The increase was due primarily to banking fees incurred of $2.7 million, severance payments related to the Echelon acquisition of $1.9 million, legal fees of $1.8 million, professional services including valuation services of $0.3 million and accounting and tax fees of $0.3 million. There were no acquisition related expenses incurred in 2017.
Impairment and Other Charges. Impairment and other charges decreased by $1.0 million for 2019 as compared to 2018. This decrease was due to expenses and costs related to exiting the lighting business which was part of the Echelon acquisition. Impairment and other charges increased by $2.7 million for 2018 as compared to 2017. The increase was due primarily to write-downs of certain fixed and intangible assets of $1.5 million, costs related to excess facilities of $0.6 million, the cost of exiting a development agreement associated with certain memory products of $0.4
51
million, and costs associated with exiting the lighting business acquired from Echelon of $0.2 million. There were no impairment charges incurred in 2017.
Other Income (Expense), Net
|
|
|
|
|
|
|
|
|
|
|||||||||||||
|
|
|
Year ended December 31, |
|
Change 2019 - 2018 |
|
|
Change 2018 - 2017 |
|
|||||||||||||
|
|
|
2019 |
|
2018 |
|
2017 |
|
Amount |
|
% |
|
|
Amount |
|
% |
|
|||||
|
Interest expense, net |
|
$ |
(10,964) |
|
|
(3,791) |
|
|
(753) |
|
$ |
(7,173) |
|
(189) |
% |
|
$ |
(3,038) |
|
(403) |
% |
|
Other income (expense), net |
|
|
(90) |
|
|
2,656 |
|
|
(3) |
|
|
(2,746) |
|
(103) |
|
|
|
2,659 |
|
NM |
|
|
Total other income (expense), net |
|
$ |
(11,054) |
|
$ |
(1,135) |
|
$ |
(1,325) |
|
$ |
(9,919) |
|
(874) |
% |
|
$ |
(379) |
|
(50) |
% |
Interest expense, net increased by $7.2 million or 189% in 2019 as compared to 2018 primarily due to additional cash interest of $1.0 million and amortization of debt discount of $6.2 million as we paid off the Tennenbaum loan and issued $80.5 million of senior convertible notes.
Interest expense, net increased by $3.0 million or 403% in 2018 as compared to 2017 primarily due to additional cash interest of $2.1 million and amortization of debt discount of $1.0 million as we increased our level of indebtedness during the year in connection with the S3 Semiconductors acquisition.
Other income (expense), net decreased by $2.7 million in 2019 as compared to 2018 due primarily to a decrease in the fair value of an earn-out liability incurred in connection with the S3 Semiconductors acquisition that occurred in 2018 but not in 2019.
Other income (expense), net increased by $2.7 million in 2018 as compared to 2017 due primarily to changes in the fair value of an earn-out liability incurred in connection with the S3 Semiconductors acquisition.
Provision for (Benefit from) Income Taxes
|
|
|
|
|
|
|
|
|
|
|
|
|||||||||||
|
|
|
Year ended December 31, |
|
|
Change 2019 - 2018 |
|
|
|
Change 2018 - 2017 |
|
|||||||||||
|
|
|
2019 |
|
2018 |
|
2017 |
|
Amount |
|
% |
|
|
Amount |
|
% |
|
|||||
|
Provision for (benefit from) income taxes |
|
$ |
184 |
|
$ |
(79) |
|
$ |
101 |
|
$ |
(263) |
|
(333) |
% |
|
$ |
180 |
|
178 |
% |
Our provision for income taxes increased by $0.3 million in 2019 as compared to 2018 due primarily to provisions related to our foreign subsidiaries.
Our benefit from income taxes increased by $0.2 million in 2018 as compared to 2017 due primarily to benefits related to our foreign subsidiaries.
Liquidity and Capital Resources
Our principal source of liquidity as of December 31, 2019 consisted of cash, cash equivalents and restricted cash of $21.7 million. Our outstanding convertible debt as of December 31, 2019 had a face value of $80.5 million. Substantially all of our cash and cash equivalents are held in the United States.
We believe our existing cash and cash equivalents will be sufficient to meet our anticipated cash needs over the next 12 months, if we remain independent. Our future capital requirements will depend on many factors, including our growth rate, the timing and extent of our spending to support research and development activities, the timing and cost of establishing additional sales and marketing capabilities, the introduction of new and enhanced products and our costs to implement new manufacturing technologies. In the event that additional financing is required from outside sources, we
52
may not be able to raise it on terms acceptable to us or at all. Any additional debt financing obtained by us in the future could also involve restrictive covenants relating to our capital-raising activities and other financial and operational matters, which may make it more difficult for us to obtain additional capital and to pursue business opportunities, including potential acquisitions. Additionally, if we raise additional funds through further issuances of equity, convertible debt securities or other securities convertible into equity, our existing stockholders could suffer significant dilution in their percentage ownership of our company, and any new equity securities we issue could have rights, preferences and privileges senior to those of holders of our common stock. If we are unable to obtain adequate financing or financing on terms satisfactory to us, when we require it, our ability to continue to grow or support our business and to respond to business challenges could be significantly limited.
Our cash flows for the periods indicated were as follows:
|
|
|
Year ended December 31, |
|||||||
|
|
|
2019 |
|
2018 |
|
2017 |
|||
|
Cash flows used in operating activities |
|
$ |
(11,851) |
|
$ |
(17,679) |
|
$ |
(189) |
|
Cash flows used in investing activities |
|
|
(4,974) |
|
|
(65,952) |
|
|
(3,552) |
|
Cash flows provided by financing activities |
|
|
29,120 |
|
|
62,864 |
|
|
14,165 |
Cash Flows from Operating Activities
Our primary source of cash from operating activities has been from cash collections from our customers. We expect cash inflows from operating activities to be affected by increases in sales and timing of collections. Our primary uses of cash from operating activities have been for personnel costs, investments in research and development and sales and marketing, and procurement of inventory. Net cash used in operating activities for the periods presented consisted of net losses adjusted for certain noncash items and changes in working capital. Within changes in working capital, changes in accounts receivable, inventory and accounts payable generally account for the largest adjustments, as we typically use more cash to fund accounts receivable and build inventory as our business grows. Increases in accounts payable typically provides more cash as we do more business with our contract foundries and other third parties, depending on the timing of payments.
During the year ended December 31, 2019, cash used in operating activities was $11.9 million and was due primarily to a net loss of $26.9 million, a decrease from the revaluation of the earn-out liability of $0.3 million, a decrease in deferred taxes of $0.4 million and an increase in net assets and liabilities of $9.3 million offset by non-cash charges of 5.7 million for stock-based compensation, $3.2 million for depreciation and amortization, $7.2 million for amortization of intangible assets, $6.4 million for the amortization of debt discount, $1.7 million for impairment and other charges and $0.8 million for a prepayment premium and other costs related to early debt extinguishment. The increase in net assets and liabilities is due primarily to an increase in accounts receivable of $17.3 million, an increase in inventories of $1.4 million, and a reduction in price reserves and other liabilities of $2.4 million partially offset by a decrease in prepaid expenses and other non-current assets of $0.5 million and an increase in accounts payable, accrued expenses and other liabilities of $11.3 million.
During the year ended December 31, 2018, cash used in operating activities was $17.7 million and was due primarily to a net loss of $21.4 million, the revaluation of the earn-out liability of $2.6 million, change in deferred taxes of $0.2 million and an increase in net assets and liabilities of $6.7 million partially offset by non-cash charges of $3.2 million for stock-based compensation expense, $2.4 million for depreciation and amortization, $3.9 million for amortization of intangible assets, $1.1 for the amortization of debt discount, and impairment and other losses of $2.7 million. The increase in net assets and liabilities is due primarily to an increase in accounts receivable of $11.3 million, an increase in inventories of $7.1 million partially offset by a decrease in prepaid expenses and other current assets of $1.5 million and an increase in accounts payable, accrued expenses and other liabilities of $10.2 million.
53
During the year ended December 31, 2017, cash used in operating activities was $0.2 million and was due primarily to a net loss of $5.7 million and an increase in net assets and liabilities of $0.7 million partially offset by non-cash charges of $3.5 million for stock-based compensation expense, $1.4 million for depreciation and amortization, $1.2 million for the amortization of intangible assets, and $82,000 for the amortization of debt discount. The increase in net assets and liabilities is due primarily to an increase in accounts receivable of $2.6 million, an increase in inventory of $0.6 million, an increase in prepaids and other current assets of $0.5 million, an increase in other non-current assets of $0.3 million and a decrease in deferred rent of $0.4 million all partially offset by an increase in accounts payable and accrued compensation and other expenses of $3.7 million.
Cash Flows from Investing Activities
During the year ended December 31, 2019, cash used in investing activities was $5.0 million and was due primarily to the purchase of property and equipment for $4.5 million and an investment in an unconsolidated subsidiary of $0.5 million.
During the year ended December 31, 2018, cash used in investing activities was $66.0 million and was due primarily to the S3 Semiconductors acquisition for $34.6 million, net of cash, the Echelon acquisition for $28.8 million, net of cash, purchases of property and equipment for $3.2 million and an additional investment in an unconsolidated affiliate for $0.6 million partially offset by maturities of short-term investments of $1.3 million. During the year ended December 31, 2017, cash used in investing activities was $3.6 million, of which $2.9 million was related to the purchase of equipment, $0.4 million was related to the acquisition of a technology license, and $0.3 million was related to the issuance of a note receivable.
Cash Flows from Financing Activities
During the year ended December 31, 2019 cash provided by financing activities was $29.1 million and was due primarily to proceeds from the issuance of convertible senior notes net of issuance costs of $77.0 million and the proceeds from the exercise of stock options and RSU’s net of taxes of $1.0 million offset by the repayment of the Tennenbaum loan of $35.5 million, a payment against the earn-out liability of $7.2 million, and the purchase of capped calls associated with the issuance of the convertible senior notes of $6.2 million.
During the year ended December 31, 2018, cash provided by financing activities was $62.9 million and was due primarily to $42.7 million received from the proceeds of a follow-on offering to fund our Echelon acquisition, net proceeds of $33.6 million from a new term loan with Tennenbaum to fund our S3 Semiconductors acquisition, net proceeds of $0.4 million from the exercise of employee stock options and our employee stock purchase plan partially offset by the repayment of our Bridge Bank term loan for $12.0 million, the repayment of our Bridge Bank line of credit for $1.5 million, and a repayment of $0.3 million on our Tennenbaum term loan.
During the year ended December 31, 2017, cash provided by financing activities was $14.2 million, due primarily to $18.4 million received from the net proceeds of our follow-on public offering of our common stock and $0.5 million from the exercise of stock options and purchases made through the employee stock purchase plan offset by tax settlements associated with the release of restricted stock units partially offset by net repayments of $4.4 million and $0.3 million, respectively, on our term loan and revolving line of credit.
Off Balance Sheet Arrangements
During the periods presented, we did not have any relationships with unconsolidated entities or financial partnerships, such as entities often referred to as structured finance or special purpose entities, which would have been established for the purpose of facilitating off balance sheet arrangements or other contractually narrow or limited purpose.
54
Credit Facility
Western Alliance Bank Term Loan.
The Company was a party to that certain Business Financing Agreement dated July 7, 2016 and that certain Second Business Financing Modification Agreement, dated September 29, 2017, by and between Western Alliance Bank and the Company (“Credit Facility”). The Credit Facility provided for (i) a term loan of up to $18.0 million (the “Term Loan”) and (ii) a revolving credit line advance (the “Line of Credit”) in the aggregate amount of the lower of (x) $5.0 million and (y) 80% of certain of the Company’s receivables. The Term Loan bore interest at a rate per annum equal to the greater of the prime rate or 3.5%, plus 0.75% and was scheduled to mature in June 2019. The Line of Credit bore interest at a rate per annum equal to the greater of the prime rate or 3.5% plus 0.50%, and was scheduled to mature in July 2018. We made interest-only payments on the Term Loan from July 2016 through September 2016 and began making interest payments and principal payments in 33 equal monthly installments starting October 2016. Prior to the Amendment, the Credit Facility provided that any indebtedness we incurred thereunder was collateralized by substantially all assets of the Company and any domestic subsidiaries, subject to certain customary exceptions. We paid a facility fee of $150,000 as well as a $25,000 diligence fee upon entry into the Credit Facility and an additional $10,000 on July 7, 2017. Additional fees of $25,000 were incurred in connection with the amendment. These fees were recorded as a debt discount and were amortized over the life of the agreement.
Borrowings of $12.0 million under this facility were repaid in full in May 2018. In connection with the repayment of this facility, the remaining unamortized debt discount of $66,000 was recorded as interest expense in the consolidated statements of operations.
Tennenbaum Capital Partners, LLC Term Loan.
On May 8, 2018, we entered into a credit agreement with Tennenbaum (“Credit Agreement”). The Credit Agreement provides for a first lien senior secured term loan of $35.0 million (“Term Loan”). The Term Loan bears interest at a rate per annum equal to the sum of the Libor Rate (2.8125% on December 31, 2018) plus 8.75% and is payable in consecutive quarterly installments starting December 31, 2018. The Term Loan was scheduled to mature May 8, 2022. The Credit Agreement provided that any indebtedness we incurred thereunder was collateralized by substantially all assets of the Company and any domestic subsidiaries, subject to certain customary exceptions.
The Credit Agreement contains customary representations and warranties and affirmative and negative covenants, including maximum consolidated leverage ratios and minimum liquidity. Upon an occurrence of an event of default, under the Credit Facility we could be required to pay interest on all outstanding obligations under the agreement at a rate of 2% above the otherwise applicable interest rate, and the lender may accelerate our obligations under the agreement. As of December 31, 2018, we were in compliance with all financial covenants and restrictions.
In connection with the Credit Agreement, Tennenbaum received a warrant to purchase 850,000 shares of common stock at an exercise price of $8.62 and a term of six years. We paid financing costs of $1.4 million. The financing costs and the value of the warrant, $4.8 million, were recorded as a debt discount and were being amortized over the life of the agreement. Amortization of debt discount was $1.2 million prior to the loan payoff with the remaining $3.6 million of unamortized debt discount being recognized as interest expense for the year ended December 31, 2019. Borrowings of $33.8 million under this term loan were repaid in full on September 23, 2019 along with a contractual prepayment premium of $0.7 million which represented 2% of the outstanding loan balance.
Senior Convertible Notes
On September 23, 2019, we completed offering of $80.5 million aggregate principal amount of the Notes. The Notes were sold pursuant to an indenture, dated September 23, 2019, between the Company and U.S. Bank National
55
Association. The Notes are senior, unsecured obligations of the Company. The Notes pay interest at a rate equal to 4.25% per year. Interest on the Notes is payable semiannually in arrears on March 15 and September 15 of each year, beginning March 15, 2020. Interest accrues on the Notes from the last date to which interest has been paid or duly provided for or, if no interest has been paid or duly provided for, from September 23, 2019. Unless earlier converted, redeemed or repurchased, the Notes mature on September 15, 2024. In connection with the pricing of the Notes, we entered into privately negotiated capped call transactions with each of Credit Suisse Capital LLC and Société Générale.
In accounting for the issuance of the Notes, we separated the Notes into liability and equity components. The carrying amounts of the liability components of the Notes were calculated by measuring the fair value of similar debt instruments that do not have an associated convertible feature. The carrying amount of the equity component represents the conversion option and was determined by deducting the fair value of the liability component from the par value of the respective Notes. This difference represents the debt discount that is amortized to interest expense over the respective term of the Notes using the effective interest rate method. The carrying amount of the equity component that represents the conversion option was $22.6 million gross and $21.6 million net of issuance costs. The equity component is recorded in additional paid-in capital and is not remeasured as long as it continue to meet the conditions for equity classification.
Contractual Obligations and Commitments
The following is a summary of our contractual obligations and commitments as of December 31, 2019:
|
|
|
|
|
|
Payments due by period |
||||||||||
|
Contractual Obligations |
|
Total |
|
2020 |
|
2021 - 2022 |
|
2023 - 2024 |
|
After 2024 |
|||||
|
|
|
(in thousands) |
|||||||||||||
|
Operating leases (1) |
|
$ |
8,452 |
|
$ |
2,006 |
|
$ |
3,246 |
|
$ |
1,238 |
|
$ |
1,962 |
|
Inventory-related commitments (2) |
|
|
8,841 |
|
|
8,841 |
|
|
— |
|
|
— |
|
|
— |
|
Financing arrangements (3) |
|
|
80,500 |
|
|
— |
|
|
— |
|
|
80,500 |
|
|
— |
|
Interest obligation on financing arrangements |
|
|
16,992 |
|
|
3,421 |
|
|
10,264 |
|
|
3,307 |
|
|
— |
|
Total contractual cash obligations |
|
$ |
114,785 |
|
$ |
14,268 |
|
$ |
13,510 |
|
$ |
85,045 |
|
$ |
1,962 |
|
(1) |
Operating leases primarily relate to our leases of office space with terms expiring through November 27, 2033. |
|
(2) |
Represents outstanding purchase orders for wafer commitments that we have placed with our suppliers as of December 31, 2019. |
|
(3) |
Financing arrangements represent debt maturities under our convertible senior notes. |
As of December 31, 2019 we had a liability of $266,000 for uncertain tax positions.
In May 2018, we entered into a new $35.0 million credit facility and terminated of our existing credit facility, which included paying off the outstanding term loan thereunder. In September 2019, we completed an offering of $80.5 million aggregate principal amount of the Notes and repaid in full the outstanding amounts under the $35.0 million credit facility.
ITEM 7A. Quantitative and Qualitative Disclosures about Market Risk
We are exposed to market risks in the ordinary course of our business. These risks primarily include foreign exchange rate and interest rate sensitivities as follows:
56
Foreign Currency Risk
Our results of operations and cash flows are subject to fluctuations due to changes in foreign currency exchange rates.
The majority of our revenue is denominated in U.S. dollars. Our expenses are generally denominated in the currencies in which our operations are located, which is primarily in the United States and to a lesser extent in Europe, Middle East and Africa, or EMEA, and APAC. Our results of operations and cash flows are, therefore, subject to fluctuations due to changes in foreign currency exchange rates and may be adversely affected in the future due to changes in foreign exchange rates. The effect of a hypothetical 10% change in foreign currency exchanges rates applicable to our business would not have a material impact on our historical consolidated financial statements.
We have not hedged exposures denominated in foreign currencies or used any other derivative financial instruments. Although we transact the substantial majority of our business in U.S. dollars, future fluctuations in the value of the U.S. dollar may affect the competitiveness of our products and thus may impact our results of operations and cash flows.
Interest Rate Sensitivity
We had cash, cash equivalents and restricted cash of $21.7 million as of December 31, 2019, consisting of bank deposits, money market funds and U.S. government securities. Such interest-earning instruments carry a degree of interest rate risk. To date, fluctuations in interest income have not been significant. We also had total outstanding gross convertible notes of $80.5 million, with a fixed interest rate of 4.25%, partially offset by an unamortized debt discount of approximately $23.9 million as of December 31, 2019.
We do not enter into investments for trading or speculative purposes and have not used any derivative financial instruments to manage our interest rate risk exposure. We have not been exposed to, nor do we anticipate being exposed to, material risks due to changes in interest rates. Our exposure to interest rates relates to the change in the amounts of interest we must pay on our variable rate borrowings. A hypothetical 10% increase in our borrowing rates would result in a $0.3 million increase in cash interest expense on our principal balances as of December 31, 2019.
Critical Accounting Policies and Estimates
Our consolidated financial statements and the related notes are prepared in accordance with U.S. GAAP. The preparation of our consolidated financial statements requires us to make estimates and assumptions that affect the reported amounts of our assets, liabilities, revenue, costs and expenses and related disclosures. We base our estimates on our historical experience and various other assumptions that we believe are reasonable under the circumstances. Our actual results could differ materially from these estimates. To the extent that there are material differences between our estimates and our actual results, our future financial statements will be affected.
The critical accounting policies involving judgments and estimates that we believe have the most impact on our consolidated financial statements are discussed below.
Revenue from contracts with customers
Revenue is recognized when control of the promised goods or services is transferred to customers, in an amount that reflects the consideration we expect to be entitled to in exchange for those goods or services. Sales of products with alternative use account for the majority of our revenue and are recognized at a point in time.
57
Taxes assessed by a governmental authority that are both imposed on and concurrent with a specific revenue-producing transaction, that are collected by us from a customer and deposited with the relevant government authority, are excluded from revenue. Our revenue arrangements do not contain significant financing components.
Revenue is recognized over a period of time when it is assessed that performance obligations are satisfied over a period rather than at a point in time. When any of the following criteria is fulfilled, revenue is recognized over a period of time:
|
(a) |
The customer simultaneously receives and consumes the benefits provided by the performance as Adesto performs. |
|
(b) |
Adesto’s performance creates or enhances an asset (for example, work in process) that the customer controls as the asset is created or enhanced. |
|
(c) |
Adesto’s performance does not create an asset with an alternative use, and Adesto has an enforceable right to payment for performance completed to date. |
If revenue is recognized over a period of time, we would then select an appropriate method for measuring progress toward complete satisfaction of the performance obligation, usually hours incurred to date relative to the total expected hours to the satisfaction of that performance obligation. Typically, our revenue from NVM and Embedded Systems products is recognized at a point in time. Revenues from our ASIC and IP solutions products are generally recognized over of period of time.
Sales to certain distributors are made under arrangements which provide the distributors with price adjustments, price protection, stock rotation and other allowances under certain circumstances. These adjustments and allowances are accounted for as variable consideration. We estimate these amounts based on the expected amount to be provided to customers and reduce revenue recognized. We believe that there will not be significant changes to our estimates of variable consideration.
If a customer pays consideration, or Adesto has a right to an amount of consideration that is unconditional before we transfer a good or service to the customer, those amounts are classified as deferred income/ advances received from customers which are included in other current liabilities or other long-term liabilities when the payment is made or it is due, whichever is earlier.
If the arrangement includes variable contingent consideration, we recognize revenue over time if we can reasonably measure its progress, or we are capable of providing reliable information that would be required to apply an appropriate method of measuring progress. To date, we have not had any arrangements incorporating contingent consideration.
Sales commissions are owed and are recorded at the time of sell through of our products to end customers. These costs are recorded within selling, general and administrative expenses.
We do not disclose the value of unsatisfied performance obligations for (i) contracts with an original expected length of one year or less and (ii) contracts for which we recognize revenue at the amount to which we have the right to invoice for services performed.
We typically grant payment terms of between 30 and 60 days to our customers. Our customers generally pay within those terms. Distributors are invoiced for shipments at listed book price. When the distributors pay the invoice, they may claim debits for stock and debits (“SSDs”) previously authorized by us when appropriate. Once claimed, we process the requests against prior authorizations and reduce reserves previously established for that customer.
58
The revenue we record for sales to our distributors is net of estimated provisions for these programs. Determining net revenue requires significant judgments and estimates on our part. We base our estimates on historical experience rates, the levels of inventory held by our distributors, current trends and other related factors. Because of the inherent nature of estimates, there is a risk actual amounts may differ materially from our estimates. Our consolidated financial condition and operating results depend on our ability to make reliable estimates. We believe that such estimates are reasonable.
We also monitor collectability of accounts receivable primarily through review of our accounts receivable aging. When facts and circumstances indicate the collection of specific amounts or from specific customers is at risk, we assess the impact on amounts recorded for bad debts and, if necessary, record a charge in the period such determination is made. As of December 31, 2019 and 2018, the allowance for doubtful accounts was $60,000 and $30,000, respectively.
Inventories
We record inventories at the lower of standard cost (which generally approximates actual cost on a first-in, first-out basis) or net realizable value (“NRV”). NRV is the estimated selling price in the ordinary course of business less reasonably predictable costs of completion, disposal and transportation. On a quarterly basis, we analyze inventories on a part-by-part basis. The carrying value of inventory is adjusted for excess and obsolete inventory based on inventory age, shipment history and the forecast of demand over a specific future period. At the point of loss recognition, a new lower cost basis for that inventory is established and subsequent changes in facts and circumstances do not result in the restoration or increase in that new cost basis. The markets that we serve are volatile and actual results may vary from forecast or other assumptions, potentially affecting our assessment of excess and obsolete inventory which could have a material effect on our results of operations.
Income Taxes
We account for income taxes using an asset and liability approach, which requires recognition of deferred tax assets and liabilities for the expected future tax consequences of events that have been recognized in the consolidated financial statements, but have not been reflected in our taxable income. Valuation allowances are established to reduce deferred tax assets as necessary when in management’s estimate, based on available objective evidence, it is more likely than not that we will not generate sufficient taxable income in future periods to realize the benefit of our deferred tax assets. We include interest and penalties related to unrecognized tax benefits in income tax expense. We recognize in our consolidated financial statements the impact of a tax position that based on its technical merits is more likely than not to be sustained upon examination. The valuation allowance as of December 31, 2019 was approximately $44.3 million.
Stock-based Compensation
Stock-based compensation costs related to stock options granted to employees are measured at the date of grant based on the estimated fair value of the award, net of estimated forfeitures. We estimate the grant date fair value, and the resulting stock-based compensation expense, using the Black-Scholes option-pricing model. We recognize compensation costs for awards with service and performance vesting conditions on an accelerated method under the graded vesting method over the requisite service period of the award. For stock options with no performance condition, we recognize compensation costs on a straight-line basis over the requisite service period of the award, which is generally the vesting term of four years.
The Black-Scholes option-pricing model requires the use of highly subjective assumptions which determine the fair value of stock-based awards.
The assumptions used in our option-pricing model represent management’s best estimates. These estimates are complex, involve a number of variables, uncertainties and assumptions and the application of management’s judgment, so that they are inherently subjective. If factors change and different assumptions are used, our stock-based compensation expense could be materially different in the future.
59
These assumptions are estimated as follows:
|
· |
Fair Value of Common Stock. We used the publicly quoted price as the fair value of our common stock. |
|
· |
Risk-Free Interest Rate. We base the risk-free interest rate used in the Black-Scholes option-pricing model on the implied yield available on U.S. Treasury zero-coupon issues with an equivalent remaining term of the options for each option group. |
|
· |
Expected Term. The expected term represents the period that our stock-based awards are expected to be outstanding. We use the Staff Accounting Bulletin, or SAB 110, Simplified Method to calculate the expected term, which is the average of the contractual term and vesting period. We plan to continue to use the SAB 110 Simplified Method until we have sufficient trading history as a publicly traded company. |
|
· |
Volatility. We determine the price volatility factor based on the historical volatilities of our publicly traded common stock from the date of our IPO. |
|
· |
Dividend Yield. The expected dividend assumption is based on our current expectations about our anticipated dividend policy. We currently do not expect to issue any dividends. |
In addition to assumptions used in the Black-Scholes option-pricing model, we must also estimate a forfeiture rate to calculate the stock-based compensation for our awards. We will continue to use judgment in evaluating the assumptions related to our stock-based compensation on a prospective basis. As we continue to accumulate additional data, we may have refinements to our estimates, which could materially impact our future stock-based compensation expense.
We estimate the fair value of the restricted stock units, or RSUs, using the closing market price of our common stock on the date of grant. Our grants of RSUs typically can vest over a two-year or four-year period.
During 2018 and 2019 our compensation committee granted RSUs that do not begin vesting until certain performance goals are met. All performance goals must be met in order for the shares to begin vesting. Vesting would begin on the one year anniversary of the grant date. As a result of these performance based vesting conditions we valued these RSUs using Monte Carlo simulation techniques to establish a fair value per share at the time of the grant.
The fair value of the employee stock options was estimated using the following assumptions for the periods presented:
|
|
|
Year Ended December 31, |
|
||||
|
|
|
2019 |
|
2018 |
|
2017 |
|
|
Volatility |
|
65 |
% |
72 |
% |
86 |
% |
|
Expected dividend yield |
|
— |
|
— |
|
— |
|
|
Risk-free rate |
|
2.22 |
% |
2.85 |
% |
2.15 |
% |
|
Expected term (in years) |
|
6 |
|
6 |
|
6 |
|
For the years ended December 31, 2019, 2018 and 2017, stock-based compensation expense was $5.7 million, $3.2 million and $3.5 million respectively. As of December 31, 2019, we had approximately $2.2 million of total unrecognized compensation expense related to stock options, net of related forfeiture estimates, which we expect to recognize over a weighted-average period of approximately 2.1 years. The intrinsic value of all outstanding options as of December 31, 2019 was $7.1 million based on the market price of our common stock of $8.50 per share. As of December 31, 2019, the total unrecognized compensation cost related to RSU’s and our 2015 Employee Stock Purchase Plan was $6.7 million and $44,000, respectively, and these amounts are expected to be recognized over 2.2 years and 0.1 years, respectively.
60
ITEM 8. FINANCIAL STATEMENTS AND SUPPLEMENTARY DATA
INDEX TO CONSOLIDATED FINANCIAL STATEMENTS
|
|
Page |
| 62 | |
| 63 | |
| 64 | |
| 65 | |
| 66 | |
| 67 | |
| 68 |
61
REPORT OF INDEPENDENT REGISTERED PUBLIC ACCOUNTING FIRM
To the Stockholders and Board of Directors of
Adesto Technologies Corporation
Opinion on the Consolidated Financial Statements
We have audited the accompanying consolidated balance sheets of Adesto Technologies Corporation and its subsidiaries (the “Company”) as of December 31, 2019 and 2018, the related consolidated statements of operations, comprehensive loss, stockholders’ equity and cash flows for each of the three years in the period ended December 31, 2019, and the related notes (collectively referred to as the “consolidated financial statements”). In our opinion, the consolidated financial statements present fairly, in all material respects, the financial position of the Company as of December 31, 2019 and 2018, and the results of its operations and its cash flows for each of the three years in the period ended December 31, 2019, in conformity with accounting principles generally accepted in the United States of America.
Change in Accounting Principle
As discussed in Note 1 to the consolidated financial statements, the Company changed its method of accounting for leases in 2019 due to the adoption of the new lease standard.
Basis for Opinion
These consolidated financial statements are the responsibility of the Company’s management. Our responsibility is to express an opinion on these consolidated financial statements based on our audits. We are a public accounting firm registered with the Public Company Accounting Oversight Board (United States) (“PCAOB”) and are required to be independent with respect to the Company in accordance with the U.S. federal securities laws and the applicable rules and regulations of the Securities and Exchange Commission and the PCAOB.
We conducted our audits in accordance with the standards of the PCAOB. Those standards require that we plan and perform the audit to obtain reasonable assurance about whether the consolidated financial statements are free of material misstatement, whether due to error or fraud. The Company is not required to have, nor were we engaged to perform, an audit of its internal control over financial reporting. As part of our audits, we are required to obtain an understanding of internal control over financial reporting, but not for the purpose of expressing an opinion on the effectiveness of the Company’s internal control over financial reporting. Accordingly, we express no such opinion.
Our audits included performing procedures to assess the risks of material misstatement of the consolidated financial statements, whether due to error or fraud, and performing procedures that respond to those risks. Such procedures included examining, on a test basis, evidence regarding the amounts and disclosures in the consolidated financial statements. Our audits also included evaluating the accounting principles used and significant estimates made by management, as well as evaluating the overall presentation of the consolidated financial statements. We believe that our audits provide a reasonable basis for our opinion.
/s/ BPM LLP
We have served as the Company’s auditor since 2015.
San Jose, California
March 16, 2020
62
ADESTO TECHNOLOGIES CORPORATION
(in thousands, except share and per share data)
|
|
|
December 31, |
|
||||
|
|
|
2019 |
|
2018 |
|
||
|
Assets |
|
|
|
|
|
|
|
|
Current assets: |
|
|
|
|
|
|
|
|
Cash and cash equivalents |
|
$ |
21,262 |
|
$ |
8,630 |
|
|
Restricted cash |
|
|
460 |
|
|
458 |
|
|
Accounts receivable, net |
|
|
40,492 |
|
|
23,211 |
|
|
Inventories |
|
|
20,023 |
|
|
18,635 |
|
|
Prepaid expenses |
|
|
2,052 |
|
|
1,668 |
|
|
Other current assets |
|
|
249 |
|
|
871 |
|
|
Total current assets |
|
|
84,538 |
|
|
53,473 |
|
|
Property and equipment, net |
|
|
8,113 |
|
|
7,085 |
|
|
Intangible assets, net |
|
|
29,108 |
|
|
36,261 |
|
|
Other non-current assets |
|
|
2,503 |
|
|
1,729 |
|
|
Operating lease right-of-use asset |
|
|
4,300 |
|
|
— |
|
|
Goodwill |
|
|
38,640 |
|
|
38,640 |
|
|
Total assets |
|
$ |
167,202 |
|
$ |
137,188 |
|
|
Liabilities and Stockholders' Equity |
|
|
|
|
|
|
|
|
Current liabilities: |
|
|
|
|
|
|
|
|
Accounts payable |
|
$ |
22,844 |
|
$ |
16,146 |
|
|
Accrued compensation and benefits |
|
|
5,279 |
|
|
4,038 |
|
|
Accrued expenses and other current liabilities |
|
|
9,368 |
|
|
5,172 |
|
|
Price adjustments and other revenue reserves |
|
|
3,640 |
|
|
4,819 |
|
|
Earn-out liability, current |
|
|
2,911 |
|
|
10,450 |
|
|
Operating lease liabilities, current |
|
|
1,230 |
|
|
— |
|
|
Term loan, current |
|
|
— |
|
|
141 |
|
|
Total current liabilities |
|
|
45,272 |
|
|
40,766 |
|
|
Term loan, non-current |
|
|
— |
|
|
29,418 |
|
|
Convertible long-term debt |
|
|
56,589 |
|
|
— |
|
|
Operating lease liabilities, non-current |
|
|
4,726 |
|
|
— |
|
|
Deferred rent, non-current |
|
|
— |
|
|
1,947 |
|
|
Deferred tax liability, non-current |
|
|
1,363 |
|
|
1,735 |
|
|
Other non-current liabilities |
|
|
476 |
|
|
580 |
|
|
Total liabilities |
|
|
108,426 |
|
|
74,446 |
|
|
Commitments and contingencies (See Note 9) |
|
|
|
|
|
|
|
|
Stockholders' equity: |
|
|
|
|
|
|
|
|
Preferred stock, $0.0001 par value, 5,000,000 shares authorized as of December 31, 2019 and 2018; no shares issued and outstanding as of December 31, 2019 and 2018 |
|
|
— |
|
|
— |
|
|
Common stock, $0.0001 par value, 100,000,000 shares authorized; 30,268,685 and 29,442,065 shares issued and outstanding as of December 31, 2019 and 2018, respectively |
|
|
3 |
|
|
3 |
|
|
Additional paid-in capital |
|
|
206,356 |
|
|
184,158 |
|
|
Accumulated other comprehensive income (loss) |
|
|
309 |
|
|
(135) |
|
|
Accumulated deficit |
|
|
(147,892) |
|
|
(121,284) |
|
|
Total stockholders' equity |
|
|
58,776 |
|
|
62,742 |
|
|
Total liabilities and stockholders’ equity |
|
$ |
167,202 |
|
$ |
137,188 |
|
See accompanying Notes to Consolidated Financial Statements
63
ADESTO TECHNOLOGIES CORPORATION
CONSOLIDATED STATEMENTS OF OPERATIONS
(in thousands, except share and per share data)
|
|
|
Year Ended December 31, |
|||||||
|
|
|
2019 |
|
2018 |
|
2017 |
|||
|
Revenue, net |
|
$ |
118,166 |
|
$ |
83,490 |
|
$ |
56,112 |
|
Cost of revenue |
|
|
61,461 |
|
|
47,429 |
|
|
28,637 |
|
Gross profit |
|
|
56,705 |
|
|
36,061 |
|
|
27,475 |
|
Operating expenses: |
|
|
|
|
|
|
|
|
|
|
Research and development |
|
|
30,942 |
|
|
20,273 |
|
|
13,623 |
|
Selling, general and administrative |
|
|
32,307 |
|
|
22,592 |
|
|
17,461 |
|
Amortization of intangible assets |
|
|
7,153 |
|
|
3,871 |
|
|
1,222 |
|
Acquisition related expenses |
|
|
227 |
|
|
7,029 |
|
|
— |
|
Impairment and other charges |
|
|
1,694 |
|
|
2,680 |
|
|
— |
|
Total operating expenses |
|
|
72,323 |
|
|
56,445 |
|
|
32,306 |
|
Loss from operations |
|
|
(15,618) |
|
|
(20,384) |
|
|
(4,831) |
|
Other income (expense): |
|
|
|
|
|
|
|
|
|
|
Interest expense, net |
|
|
(10,964) |
|
|
(3,791) |
|
|
(753) |
|
Other income (expense), net |
|
|
(90) |
|
|
2,656 |
|
|
(3) |
|
Total other income (expense), net |
|
|
(11,054) |
|
|
(1,135) |
|
|
(756) |
|
Loss before provision for (benefit from) income taxes |
|
|
(26,672) |
|
|
(21,519) |
|
|
(5,587) |
|
Provision for (benefit from) income taxes |
|
|
184 |
|
|
(79) |
|
|
101 |
|
Net loss |
|
$ |
(26,856) |
|
$ |
(21,440) |
|
$ |
(5,688) |
|
Net loss per share: |
|
|
|
|
|
|
|
|
|
|
Basic and diluted |
|
$ |
(0.90) |
|
$ |
(0.85) |
|
$ |
(0.31) |
|
Weighted average number of shares used in computing net loss per share: |
|
|
|
|
|
|
|
|
|
|
Basic and diluted |
|
|
29,902,351 |
|
|
25,144,562 |
|
|
18,591,308 |
See accompanying Notes to Consolidated Financial Statements
64
ADESTO TECHNOLOGIES CORPORATION
CONSOLIDATED STATEMENTS OF COMPREHENSIVE LOSS
(in thousands)
|
|
|
Year Ended December 31, |
|||||||
|
|
|
2019 |
|
2018 |
|
2017 |
|||
|
Net loss |
|
$ |
(26,856) |
|
$ |
(21,440) |
|
$ |
(5,688) |
|
Other comprehensive income (loss), net of tax: |
|
|
|
|
|
|
|
|
|
|
Foreign currency translation adjustment |
|
|
444 |
|
|
160 |
|
|
(65) |
|
Comprehensive loss |
|
$ |
(26,412) |
|
$ |
(21,280) |
|
$ |
(5,753) |
See accompanying Notes to Consolidated Financial Statements
65
ADESTO TECHNOLOGIES CORPORATION
CONSOLIDATED STATEMENTS OF STOCKHOLDERS’ EQUITY
(in thousands, except share data)
|
|
|
Stockholders' Equity |
|||||||||||||||
|
|
|
|
|
|
|
|
|
|
|
Accumulated |
|
|
|
|
|
|
|
|
|
|
|
|
|
|
|
Additional |
|
Other |
|
|
|
|
Total |
|||
|
|
|
Common Stock |
|
Paid-In |
|
Comprehensive |
|
Accumulated |
|
Stockholders’ |
|||||||
|
|
|
Shares |
|
Amount |
|
Capital |
|
Loss |
|
Deficit |
|
Equity |
|||||
|
Balances as of December 31, 2016 |
|
15,494,308 |
|
|
2 |
|
|
110,749 |
|
|
(230) |
|
|
(94,156) |
|
|
16,365 |
|
Proceeds from follow-on offering, net of issuance costs |
|
5,000,000 |
|
|
— |
|
|
18,363 |
|
|
— |
|
|
— |
|
|
18,363 |
|
Cashless exercise of common stock warrants |
|
10,223 |
|
|
— |
|
|
— |
|
|
— |
|
|
— |
|
|
— |
|
Options exercised |
|
230,123 |
|
|
— |
|
|
442 |
|
|
— |
|
|
— |
|
|
442 |
|
Employee stock purchase plan |
|
110,711 |
|
|
— |
|
|
339 |
|
|
— |
|
|
— |
|
|
339 |
|
Restricted stock units, net of taxes paid related to net settlement of equity awards |
|
446,468 |
|
|
— |
|
|
(308) |
|
|
— |
|
|
— |
|
|
(308) |
|
Stock-based compensation |
|
— |
|
|
— |
|
|
3,502 |
|
|
— |
|
|
— |
|
|
3,502 |
|
Foreign currency translation adjustments |
|
— |
|
|
— |
|
|
— |
|
|
(65) |
|
|
— |
|
|
(65) |
|
Net loss |
|
— |
|
|
— |
|
|
— |
|
|
— |
|
|
(5,688) |
|
|
(5,688) |
|
Balances as of December 31, 2017 |
|
21,291,833 |
|
|
2 |
|
|
133,087 |
|
|
(295) |
|
|
(99,844) |
|
|
32,950 |
|
Proceeds from offering, net of issuance costs |
|
7,705,000 |
|
|
1 |
|
|
42,658 |
|
|
— |
|
|
— |
|
|
42,659 |
|
Issuance of warrants |
|
— |
|
|
— |
|
|
4,799 |
|
|
— |
|
|
— |
|
|
4,799 |
|
Options exercised |
|
112,965 |
|
|
— |
|
|
280 |
|
|
— |
|
|
— |
|
|
280 |
|
Employee stock purchase plan |
|
125,567 |
|
|
— |
|
|
550 |
|
|
— |
|
|
— |
|
|
550 |
|
Restricted stock units, net of taxes paid related to net settlement of equity awards |
|
206,700 |
|
|
— |
|
|
(424) |
|
|
— |
|
|
— |
|
|
(424) |
|
Stock-based compensation |
|
— |
|
|
— |
|
|
3,208 |
|
|
— |
|
|
— |
|
|
3,208 |
|
Foreign currency translation adjustments |
|
— |
|
|
— |
|
|
— |
|
|
160 |
|
|
— |
|
|
160 |
|
Net loss |
|
— |
|
|
— |
|
|
— |
|
|
— |
|
|
(21,440) |
|
|
(21,440) |
|
Balances as of December 31, 2018 |
|
29,442,065 |
|
$ |
3 |
|
$ |
184,158 |
|
$ |
(135) |
|
$ |
(121,284) |
|
$ |
62,742 |
|
ASC 842 adoption adjustment |
|
— |
|
|
— |
|
|
— |
|
|
— |
|
|
248 |
|
|
248 |
|
Options exercised |
|
112,647 |
|
|
— |
|
|
378 |
|
|
— |
|
|
— |
|
|
378 |
|
Employee stock purchase plan |
|
283,931 |
|
|
— |
|
|
1,193 |
|
|
— |
|
|
— |
|
|
1,193 |
|
Restricted stock units, net of taxes paid related to net settlement of equity awards |
|
430,042 |
|
|
— |
|
|
(582) |
|
|
— |
|
|
— |
|
|
(582) |
|
Stock-based compensation |
|
— |
|
|
— |
|
|
5,697 |
|
|
— |
|
|
— |
|
|
5,697 |
|
Foreign currency translation adjustments |
|
— |
|
|
— |
|
|
— |
|
|
444 |
|
|
— |
|
|
444 |
|
Purchase of capped calls |
|
— |
|
|
— |
|
|
(6,150) |
|
|
— |
|
|
— |
|
|
(6,150) |
|
Equity component of convertible senior notes (net of costs of $1 million) |
|
— |
|
|
— |
|
|
21,662 |
|
|
— |
|
|
— |
|
|
21,662 |
|
Net loss |
|
— |
|
|
— |
|
|
— |
|
|
— |
|
|
(26,856) |
|
|
(26,856) |
|
Balances as of December 31, 2019 |
|
30,268,685 |
|
$ |
3 |
|
$ |
206,356 |
|
$ |
309 |
|
$ |
(147,892) |
|
$ |
58,776 |
See accompanying Notes to Consolidated Financial Statements
66
ADESTO TECHNOLOGIES CORPORATION
CONSOLIDATED STATEMENTS OF CASH FLOWS
(in thousands)
|
|
|
Year Ended December 31, |
|||||||
|
|
|
2019 |
|
2018 |
|
2017 |
|||
|
Cash flows from operating activities: |
|
|
|
|
|
|
|
|
|
|
Net loss |
|
$ |
(26,856) |
|
$ |
(21,440) |
|
$ |
(5,688) |
|
Adjustments to reconcile net loss to net cash used in operating activities: |
|
|
|
|
|
|
|
|
|
|
Stock-based compensation expense |
|
|
5,697 |
|
|
3,208 |
|
|
3,502 |
|
Depreciation and amortization |
|
|
3,222 |
|
|
2,379 |
|
|
1,384 |
|
Amortization of intangible assets |
|
|
7,153 |
|
|
3,871 |
|
|
1,222 |
|
Amortization of debt discount |
|
|
6,408 |
|
|
1,125 |
|
|
82 |
|
Deferred income taxes |
|
|
(372) |
|
|
(184) |
|
|
(1) |
|
Prepayment premium and related costs of early extinguishment of debt |
|
|
784 |
|
|
— |
|
|
— |
|
Gain on sale of equipment |
|
|
— |
|
|
(18) |
|
|
— |
|
Changes in fair value of earn-out liability |
|
|
(320) |
|
|
(2,569) |
|
|
— |
|
Impairment and other losses |
|
|
1,694 |
|
|
2,680 |
|
|
— |
|
Changes in assets and liabilities: |
|
|
|
|
|
|
|
|
|
|
Accounts receivable |
|
|
(17,281) |
|
|
(11,331) |
|
|
(2,557) |
|
Inventories |
|
|
(1,388) |
|
|
(7,111) |
|
|
(632) |
|
Prepaid expenses and other current assets |
|
|
238 |
|
|
1,539 |
|
|
(478) |
|
Other non-current assets |
|
|
260 |
|
|
(11) |
|
|
(270) |
|
Accounts payable |
|
|
7,070 |
|
|
5,174 |
|
|
2,521 |
|
Accrued compensation and benefits |
|
|
1,241 |
|
|
1,424 |
|
|
1,015 |
|
Accrued expenses and other current liabilities |
|
|
2,959 |
|
|
(719) |
|
|
58 |
|
Price adjustments and other revenue reserves |
|
|
(1,179) |
|
|
4,819 |
|
|
— |
|
Other non-current liabilities |
|
|
(1,181) |
|
|
(58) |
|
|
75 |
|
Deferred rent |
|
|
— |
|
|
(457) |
|
|
(422) |
|
Net cash used in operating activities |
|
|
(11,851) |
|
|
(17,679) |
|
|
(189) |
|
Cash flows from investing activities: |
|
|
|
|
|
|
|
|
|
|
Acquisition of property and equipment |
|
|
(4,517) |
|
|
(3,208) |
|
|
(2,868) |
|
Acquisition of Echelon, net of cash acquired |
|
|
— |
|
|
(28,836) |
|
|
— |
|
Acquisition of S3 Semiconductors, net of cash acquired |
|
|
— |
|
|
(34,616) |
|
|
(350) |
|
Maturities of short-term investments |
|
|
— |
|
|
1,274 |
|
|
— |
|
Investment in unconsolidated affiliate |
|
|
(457) |
|
|
(566) |
|
|
(334) |
|
Net cash used in investing activities |
|
|
(4,974) |
|
|
(65,952) |
|
|
(3,552) |
|
Cash flows from financing activities: |
|
|
|
|
|
|
|
|
|
|
Proceeds from public offering, net of underwriting discounts and commissions |
|
|
— |
|
|
42,659 |
|
|
18,363 |
|
Proceeds from exercise of stock options and employee stock purchase plan |
|
|
1,571 |
|
|
830 |
|
|
781 |
|
Tax withholdings related to net share settlement of restricted stock units |
|
|
(582) |
|
|
(424) |
|
|
(308) |
|
Proceeds from revolving line of credit |
|
|
— |
|
|
— |
|
|
30,598 |
|
Payments on revolving line of credit |
|
|
— |
|
|
(1,500) |
|
|
(30,905) |
|
Proceeds from term loan, net of fees |
|
|
— |
|
|
33,591 |
|
|
12,000 |
|
Proceeds from issuance of convertible senior notes, net of issuance costs |
|
|
76,992 |
|
|
— |
|
|
— |
|
Payments on term loan |
|
|
(35,492) |
|
|
(12,292) |
|
|
(16,364) |
|
Purchase of capped calls |
|
|
(6,150) |
|
|
— |
|
|
— |
|
Payment on earn-out liability |
|
|
(7,219) |
|
|
— |
|
|
— |
|
Net cash provided by financing activities |
|
|
29,120 |
|
|
62,864 |
|
|
14,165 |
|
Effect of exchange rates on cash, cash equivalents and restricted cash |
|
|
339 |
|
|
(223) |
|
|
(65) |
|
Net increase (decrease) in cash, cash equivalents and restricted cash |
|
|
12,634 |
|
|
(20,990) |
|
|
10,359 |
|
Cash, cash equivalents and restricted cash - beginning of year |
|
|
9,088 |
|
|
30,078 |
|
|
19,719 |
|
Cash, cash equivalents and restricted cash - end of year |
|
$ |
21,722 |
|
$ |
9,088 |
|
$ |
30,078 |
|
Supplemental disclosures of other cash flow information: |
|
|
|
|
|
|
|
|
|
|
Cash paid for interest expense |
|
$ |
2,882 |
|
$ |
2,800 |
|
$ |
695 |
|
Supplemental disclosures of non-cash investing and financing information: |
|
|
|
|
|
|
|
|
|
|
Purchase of property and equipment included in accounts payable |
|
$ |
372 |
|
$ |
533 |
|
$ |
420 |
|
Fair value of warrants issued in connection with term loan |
|
|
— |
|
|
4,799 |
|
|
363 |
|
Accrued deferred financing costs |
|
|
— |
|
|
— |
|
|
125 |
|
Equity component of convertible senior notes |
|
|
21,662 |
|
|
— |
|
|
— |
See accompanying Notes to Consolidated Financial Statements
67
ADESTO TECHNOLOGIES CORPORATION
NOTES TO CONSOLIDATED FINANCIAL STATEMENTS
Note 1. Organization and Summary of Significant Accounting Policies.
Organization and Nature of Operations.
Adesto Technologies Corporation (together with its subsidiaries; “Adesto”, “we”, “our”, “us” or the “Company”) was incorporated in the state of California in January 2006 and reincorporated in Delaware in October 2015. We are a leading provider of innovative, application-specific semiconductor and systems for the Internet of Things era. Our corporate headquarters are located in Santa Clara, California.
On May 9, 2018 we acquired 100% of the issued capital of S3 Asic Semiconductors Limited and on September 14, 2018 we acquired 100% of the issued capital of Echelon Corporation. Our financial results include the operating results of those entities from the date of acquisition.
On February 20, 2020, we entered into a definitive merger agreement with Dialog Semiconductor plc, a company incorporated in England and Wales. According to the terms of the merger Dialog, will acquire 100% of the issued capital of the Company (see Note 17, Subsequent Event).
Liquidity.
Since inception we have funded our operations primarily through sales of common and preferred stock and borrowing arrangements. As of December 31, 2019, our principal sources of liquidity consisted of cash, cash equivalents and restricted cash of $21.7 million. In addition, we have incurred net losses since our inception, and as of December 31, 2019 have an accumulated deficit of approximately $147.9 million. We expect to continue to incur operating losses and negative cash flows from operations through March 31, 2021 if we remain independent.
We believe our existing cash and cash equivalents will be sufficient to meet our anticipated cash needs over the next 12 months if we remain independent. Our future capital requirements will depend on many factors, including our growth rate, the timing and extent of our spending to support research and development activities, the timing and cost of establishing additional sales and marketing capabilities, the introduction of new and enhanced products and our costs to implement new manufacturing technologies. In the event that additional financing is required from outside sources, we may not be able to raise it on terms acceptable to us or at all. Any additional debt financing obtained by us in the future could also involve restrictive covenants relating to our capital-raising activities and other financial and operational matters, which may make it more difficult for us to obtain additional capital and to pursue business opportunities, including potential acquisitions. Additionally, if we raise additional funds through further issuances of equity, convertible debt securities or other securities convertible into equity, our existing stockholders could suffer significant dilution in their percentage ownership of our company, and any new equity securities we issue could have rights, preferences and privileges senior to those of holders of our common stock. If we are unable to obtain adequate financing or financing on terms satisfactory to us, when we require it, our ability to continue to grow or support our business and to respond to business challenges could be significantly limited.
Basis of Presentation.
The consolidated financial statements include the results of our operations and the operations of our wholly owned subsidiaries. All intercompany balances and transactions have been eliminated.
68
Recent Accounting Pronouncements.
In August 2018, the Financial Accounting Standards Board (“FASB”) issued Accounting Standards Update (“ASU”) No. 2018-13, Fair Value Measurement Disclosure Framework - Changes to the Disclosure Requirements for Fair Value Measurement. As part of the FASB's disclosure framework project, it has eliminated, amended and added disclosure requirements for fair value measurements. Entities will no longer be required to disclose the amount of, and reasons for, transfers between Level 1 and Level 2 of the fair value hierarchy, the policy of timing of transfers between levels of the fair value hierarchy and the valuation processes for Level 3 fair value measurements. Public companies will be required to disclose the range and weighted average used to develop significant unobservable inputs for Level 3 fair value measurements. This ASU is effective for public entities for annual and interim periods beginning after December 15, 2019. Early adoption is permitted as of the beginning of any interim or annual reporting period. This ASU will have an impact on the Company's disclosures.
In January 2017, the FASB issued ASU No. 2017-04, Intangibles—Goodwill and Other (Topic 350): Simplifying the Test for Goodwill Impairment. This ASU eliminates Step 2 from the goodwill impairment test. Instead, an entity should recognize an impairment charge for the amount by which the carrying value exceeds the reporting unit’s fair value, not to exceed the total amount of goodwill allocated to that reporting unit. This ASU is effective for annual or any interim goodwill impairment tests in fiscal years beginning after December 15, 2019. The Company is currently evaluating the effect of the adoption of this ASU but anticipates that the adoption will not have a material impact on its consolidated financial statements.
In June 2016, the FASB issued ASU No. 2016-13, Financial Instruments—Credit Losses (Topic 326): Measurement of Credit Losses on Financial Instruments. This ASU requires instruments measured at amortized cost to be presented at the net amount expected to be collected. Entities are also required to record allowances for available-for-sale debt securities rather than reduce the carrying amount. This ASU is effective for fiscal years beginning after December 15, 2019, including interim periods within those fiscal years. The Company expects that the adoption will not have a material impact on its consolidated financial statements.
Recently Adopted Accounting Pronouncements.
Adoption of ASC 842:
We adopted ASU No. 2016-02, Leases (“Topic 842”), as of January 1, 2019, using the modified retrospective approach. The modified retrospective approach provides a method for recording existing leases at the beginning of the period of adoption. In addition, we elected the package of practical expedients permitted under the transition guidance within the new standard, which among other things, allowed us to carry forward the historical lease classification and we elected the hindsight practical expedient to determine the lease term for existing leases. We determined that most renewal options would not be reasonably certain in determining the expected lease term. The comparative information has not been restated and continues to be reported under the accounting standards in effect for those periods.
Adoption of the new standard resulted in the recording of right of use assets of $4.9 million and lease liabilities of $7.0 million and eliminating deferred rent of $2.4 million, as of January 1, 2019. The standard did not have an impact on our consolidated results of operations or cash flows.
69
The effect of the changes made to our consolidated January 1, 2019 balance sheet for the adoption of the new lease standard was as follows (in thousands):
|
|
|
Balance as of |
|
Adjustments |
|
Balance as of |
|||
|
|
|
|
December 31, |
|
Due to |
|
January 1, |
||
|
|
|
2018 |
|
ASC 842 |
|
2019 |
|||
|
Operating lease right-of-use assets |
|
$ |
— |
|
$ |
4,877 |
|
$ |
4,877 |
|
Total assets |
|
$ |
137,188 |
|
$ |
4,877 |
|
$ |
142,065 |
|
Operating lease liabilities, current |
|
$ |
— |
|
$ |
1,116 |
|
$ |
1,116 |
|
Operating lease liabilities, non-current |
|
$ |
— |
|
$ |
5,917 |
|
$ |
5,917 |
|
Deferred rent |
|
$ |
2,404 |
|
|
(2,404) |
|
|
— |
|
Total liabilities |
|
$ |
74,446 |
|
$ |
4,629 |
|
$ |
79,075 |
|
Accumulated deficit |
|
$ |
(121,284) |
|
$ |
248 |
|
$ |
(121,036) |
|
Total stockholders' equity |
|
$ |
62,742 |
|
$ |
248 |
|
$ |
62,990 |
|
Total liabilities and stockholders' equity |
|
$ |
137,188 |
|
$ |
4,877 |
|
$ |
142,065 |
Adoption of ASC 606:
In May 2014, the FASB issued an ASU on revenue from contracts with customers, ASU No. 2014-09, Revenue from Contracts with Customers (“Topic 606”). This standard update outlines a single comprehensive model for entities to use in accounting for revenue arising from contracts with customers. The guidance is effective for annual reporting periods including interim reporting reports beginning after December 15, 2017. Collectively, we refer to Topic 606, its related amendments and Subtopic 340-40 as the “new standard”.
On January 1, 2018, we adopted the new standard using the modified retrospective method applied to all contracts that are not completed contracts at the date of initial application (i.e., January 1, 2018). Results for reporting periods after January 1, 2018 are presented under the new standard, while prior period amounts are not adjusted and continue to be reported in accordance with our historic accounting. There was no impact on the opening accumulated deficit as of January 1, 2018 due to the adoption of the new standard. We reclassified the allowance for ship from SSDs, price protection, rights of return and other activities to current liabilities presented as "Price adjustments and other revenue reserves" from the allowance for accounts receivable due to the adoption of the new standard.
We recorded a cumulative effect adjustment to our January 1, 2018 consolidated balance sheet for the impact of the reclassification of the allowance for SSDs, price protection, rights of return and other activities to current liabilities presented as “Price adjustments and other revenue reserves”. The cumulative effect of the changes made to our January 1, 2018 consolidated balance sheet for the adoption of the new revenue standard were as follows (in thousands):
|
|
|
Balance as of |
|
Adjustments |
|
Balance as of |
|||
|
|
|
|
December 31, |
|
|
Due to |
|
|
January 1, |
|
|
|
2017 |
|
ASC 606 |
|
2018 |
|||
|
Accounts receivable, net |
|
$ |
8,668 |
|
$ |
3,832 |
|
$ |
12,500 |
|
Price adjustments and other revenue reserves |
|
$ |
— |
|
$ |
(3,832) |
|
$ |
(3,832) |
70
In accordance with the new standard requirements, the disclosure of the impact of adoption on select consolidated balance sheet line items was as follows (in thousands):
|
|
|
As of December 31, 2019 |
|||||||
|
|
|
|
As |
|
Balances without |
|
Effect of |
||
|
|
|
Reported |
|
ASC 606 |
|
Change |
|||
|
Accounts receivable, net |
|
$ |
40,492 |
|
$ |
36,852 |
|
$ |
(3,640) |
|
Price adjustments and other revenue reserves |
|
$ |
3,640 |
|
$ |
— |
|
$ |
3,640 |
|
|
|
|
|
|
|
|
|
|
|
|
|
|
As of December 31, 2018 |
|||||||
|
|
|
As |
|
Balances without |
|
Effect of |
|||
|
|
|
Reported |
|
ASC 606 |
|
Change |
|||
|
Accounts receivable, net |
|
$ |
23,211 |
|
$ |
18,392 |
|
$ |
(4,819) |
|
Price adjustments and other revenue reserves |
|
$ |
4,819 |
|
$ |
— |
|
$ |
4,819 |
Revenue from contracts with customers.
Revenue is recognized when control of the promised goods or services is transferred to customers, in an amount that reflects the consideration we expect to be entitled to in exchange for those goods or services. Sales of products with alternative use account for the majority of our revenue and are recognized at a point in time, the timing of such recognition remained the same under Topic 606.
Taxes assessed by a governmental authority that are both imposed on and concurrent with a specific revenue-producing transaction, that are collected by us from a customer and deposited with the relevant government authority, are excluded from revenue. Our revenue arrangements do not contain significant financing components.
Revenue is recognized over a period of time when it is assessed that performance obligations are satisfied over a period rather than at a point in time. When any of the following criteria is fulfilled, revenue is recognized over a period of time:
|
(a) |
The customer simultaneously receives and consumes the benefits provided by the performance as Adesto performs. |
|
(b) |
Adesto’s performance creates or enhances an asset (for example, work in process) that the customer controls as the asset is created or enhanced. |
|
(c) |
Adesto’s performance does not create an asset with an alternative use, and Adesto has an enforceable right to payment for performance completed to date. |
If revenue is recognized over a period of time, we would then select an appropriate method for measuring progress toward complete satisfaction of the performance obligation, usually costs incurred to date relative to the total expected costs to the satisfaction of that performance obligation. Typically, our revenue from NVM and Embedded Systems products is recognized at a point in time. Revenues from our ASIC and IP solutions products are generally recognized over a period of time.
Sales to certain distributors are made under arrangements which provide the distributors with price adjustments, price protection, stock rotation and other allowances under certain circumstances. These adjustments and allowances are accounted for as variable consideration. We estimate these amounts based on the expected amount to be provided to customers and reduce revenue recognized. We believe that there will not be significant changes to our estimates of variable consideration.
71
If a customer pays consideration, or Adesto has a right to an amount of consideration that is unconditional before we transfer a good or service to the customer, those amounts are classified as deferred income/ advances received from customers which are included in other current liabilities or other long-term liabilities when the payment is made or it is due, whichever is earlier.
If the arrangement includes variable contingent consideration, we recognize revenue over time if we can reasonably measure its progress, or we are capable of providing reliable information that would be required to apply an appropriate method of measuring progress. To date, we have not had any arrangements incorporating contingent consideration.
Sales commissions are owed and are recorded at the time of sell through of our products to end customers. These costs are recorded within selling, general and administrative expenses.
The Company has entered into, and will continue to enter into, development agreements. Typically, revenue is recognized over time on a percentage of completion basis based on resources expended to date as compared to budgeted resources. Cost associated with these contracts can be classified as cost of revenue or research and development expense depending on the terms of the contract.
We do not disclose the value of unsatisfied performance obligations for (i) contracts with an original expected length of one year or less and (ii) contracts for which we recognize revenue at the amount to which we have the right to invoice for services performed.
Timing of Revenue Recognition.
|
|
|
|
2019 |
|
2018 |
||
|
|
|
|
(in thousands) |
||||
|
Products transferred at a point in time |
|
|
$ |
99,799 |
|
$ |
72,323 |
|
Products and services transferred over time |
|
|
|
18,367 |
|
|
11,167 |
|
|
|
|
$ |
118,166 |
|
$ |
83,490 |
The following table reflects the changes in our contract assets, which we classify as accounts receivable, unbilled and our contract liabilities which we classify as deferred revenue:
|
|
|
Year ended December 31, |
|||||||
|
|
|
2019 |
|
2018 |
|
Change |
|||
|
|
|
(in thousands) |
|||||||
|
Contract assets: |
|
|
|
|
|
|
|
|
|
|
Accounts receivable, unbilled |
|
$ |
1,353 |
|
$ |
751 |
|
$ |
602 |
|
Contract liabilities: |
|
|
|
|
|
|
|
|
|
|
Deferred revenue |
|
$ |
415 |
|
$ |
1,848 |
|
$ |
(1,433) |
Accounts receivable, unbilled represents revenue recognized on certain development contracts for which invoicing has not yet occurred based on the terms of the development contract. As of December 31, 2019 and 2018, we had $1.4 million and $0.8 million, respectively, classified as unbilled accounts receivable.
Deferred revenue represents amounts invoiced to customers for certain development contracts for which revenue has yet to be recognized based on actual development hours performed. Typically, the timing of invoicing is based on the terms of the contract. As of December 31, 2019 and 2018, we had $0.4 million and $1.8 million, respectively, classified as deferred revenue.
72
Reclassifications.
Certain reclassifications have been made to prior periods’ consolidated financial statements to conform to the current period presentation. These reclassifications did not result in any change in previously reported total assets, stockholders’ equity or net loss.
Use of Estimates.
The preparation of consolidated financial statements in conformity with U.S. GAAP requires management to make estimates, judgments and assumptions that affect the reported amount of assets, liabilities, revenue and expenses and related disclosures of contingent assets and liabilities. On an on-going basis, we evaluate those estimates, including those related to allowances for doubtful accounts, price adjustments and other revenue reserves, warranty accrual, inventory write-downs, valuation of long-lived assets, including property and equipment and identifiable intangible assets and goodwill, loss on purchase commitments, valuation of deferred taxes and contingencies. In addition, we use assumptions when employing the Black-Scholes option-pricing model to calculate the fair value of stock options granted and Monte Carlo simulation techniques to value certain restricted stock units with market-based vesting conditions. We base our estimates of the carrying value of certain assets and liabilities on historical experience and on various other assumptions that are believed to be reasonable under the circumstances, when these carrying values are not readily available from other sources. Actual results could differ from these estimates.
Product Warranty.
Our non-volatile memory (“NVM”) products are sold with a limited warranty for a period of one year, warranting that the product conforms to specifications and is free from material defects in design, materials and workmanship. To date, we have had insignificant returns of any defective production parts. During the year ended December 31, 2015, we recorded $250,000 for a specific potential warranty claim. During the years ended December 31, 2017 and 2016, $185,000 and $41,000, respectively, has been incurred relating to this potential warranty claim and during the year ended December 31, 2017 we recorded $27,000 for an additional potential warranty claim. During 2019 and 2018, we did not record any additional liability related to potential warranty claims. As of December 31, 2019 and 2018, the warranty accrual related to NVM products was $51,000 and $51,000, respectively, and is included in accrued expenses and other current liabilities on the consolidated balance sheets.
At the time of the Echelon acquisition we recorded a warranty liability of $401,000 related to Echelon products. For the period ended December 31, 2018, we recorded additional warranty expense of $53,000. As of December 31, 2019, the warranty accrual related to Echelon products was $453,000 of which $186,000 is recorded in accrued expenses and other current liabilities on the consolidated balance sheets and $267,000 is recorded in other long-term liabilities on the consolidated balance sheets. As of December 31, 2018, the warranty accrual related to Echelon products was $454,000 of which $215,000 was recorded in accrued expenses and other current liabilities on the consolidated balance sheets and $239,000 was recorded in other long-term liabilities.
Income Taxes.
We account for income taxes using an asset and liability approach, which requires recognition of deferred tax assets and liabilities for the expected future tax consequences of events that have been recognized in the consolidated financial statements, but have not been reflected in our taxable income. Valuation allowances are established to reduce deferred tax assets as necessary when in management’s estimation, based on available objective evidence, it is more likely than not that we will not generate sufficient taxable income in future periods to realize the benefit of our deferred tax assets. We include interest and penalties related to unrecognized tax benefits in income tax expense. We recognize in our consolidated financial statements the impact of a tax position that based on its technical merits is more likely than not to be sustained upon examination.
73
Foreign Currency Translation.
The functional currency of our foreign subsidiaries is the local currency. In consolidation, we translate assets and liabilities at exchange rates in effect at the consolidated balance sheet date. We translate revenue and expense accounts at the average exchange rates during the period in which the transaction takes place. We had a net gain from foreign currency translation of assets and liabilities of $0.4 million for the year ended December 31, 2019. We had a net gain from foreign currency translation of assets and liabilities of $0.2 million for the year ended December 31, 2018. We had a net loss from foreign currency translation of assets and liabilities of $0.1 million for the year ended December 31, 2017. We had a net loss of $0.4 million arising from transactions denominated in currencies other than the functional currency for the year ended December 31, 2019. We had a net gain of $69,000 arising from transactions denominated in currencies other than the functional currency for the year ended December 31, 2018 and we had a net loss arising from transactions denominated in currencies other than the functional currency of $4,000 for the year ended December 31, 2017. These transaction gains and losses are included in other income (expense), net in the consolidated statements of operations.
Cash, Cash Equivalents and Restricted Cash.
We consider all highly liquid investments with an initial maturity of 90 days or less at the date of purchase to be cash equivalents. We maintain such funds in overnight cash deposits.
Property and Equipment.
Property and equipment are carried at cost less accumulated depreciation and amortization. Depreciation and amortization are computed using the straight-line method over the estimated useful lives of the assets or the term of the related lease, whichever is shorter. Estimates of useful lives are as follows:
|
|
|
|
|
|
|
Estimated useful lives |
|
Machinery and equipment |
|
2-10 years |
|
Furniture and fixtures |
|
2-3 years |
|
Leasehold improvements |
|
Shorter of lease term or estimated useful lives |
Inventories.
We record inventories at the lower of standard cost (which generally approximates actual cost on a first-in, first-out basis) or net realizable value. Net realizable value is the estimated selling price in the ordinary course of business less reasonably predictable costs of completion, disposal and transportation. On a quarterly basis, we analyze inventories on a part-by-part basis. The carrying value of inventory is adjusted for excess and obsolete inventory based on the forecast of demand over a specific future period. At the point of loss recognition, a new lower cost basis for that inventory is established and subsequent changes in facts and circumstances do not result in the restoration or increase in that new cost basis. The markets that we serve are volatile and actual results may vary from forecast or other assumptions, potentially affecting our assessment of excess and obsolete inventory which could have a material effect on our results of operations.
Long-Lived Assets.
We evaluate our long-lived assets, including property and equipment, for impairment whenever events or changes in circumstances indicate that the carrying value of these assets may not be recoverable. We recognize an impairment loss when the net book value of such assets exceeds the estimated future undiscounted cash flows attributable to the asset. If impairment is indicated, we write the asset down to its estimated fair value. We recognized an
74
impairment of $1.7 million and $2.7 million on certain long-lived assets for the years ended December 31, 2019, and December 31, 2018 , respectively.
Purchased Intangible Assets.
Purchased intangible assets are amortized over their useful lives unless these lives are determined to be indefinite. Purchased intangible assets with definite lives are carried at cost less accumulated amortization. Amortization is computed using the straight-line method over the estimated useful lives of the respective assets as follows:
|
|
|
Years |
|
Developed technology |
|
4 - 10 |
|
Customer relationships |
|
7 - 12 |
|
Customer backlog |
|
1 |
|
Contract backlog |
|
0.5 |
|
Non-compete agreement |
|
2 - 5 |
|
Trademarks |
|
8 - 12 |
Goodwill.
Goodwill represents the excess of the cost of an acquisition over the sum of the amounts assigned to tangible and identifiable intangible assets acquired less liabilities assumed.
We evaluate our goodwill, at a minimum, on an annual basis and whenever events or changes in circumstances indicate that the carrying amount may not be recoverable. We perform our annual goodwill impairment test as of November 1 of each year.
When evaluating goodwill for impairment, we may initially perform a qualitative assessment which includes a review and analysis of certain quantitative factors to estimate if a reporting units’ fair value significantly exceeds its carrying value. When the estimate of a reporting unit’s fair value appears more likely than not to be less than its carrying value based on this qualitative assessment, we continue to the first step of two steps impairment test. The first step requires a comparison of the fair value of the reporting unit to its net book value, including goodwill. The fair value of the reporting units is determined based on a weighting of income and market approaches. Under the income approach, we calculate the fair value of a reporting unit based on the present value of estimated future cash flows. Under the market approach, we estimate the fair value based on market multiples of revenue or earnings for comparable companies. Determining the fair value of a reporting unit is judgmental in nature and involves the use of significant estimates and assumptions. These estimates and assumptions include revenue growth rates and operating margins used to calculate projected future cash flows, risk-adjusted discount rates, and future economic and market conditions and determination of appropriate market comparables. We base these fair value estimates on reasonable assumptions but that are unpredictable and inherently uncertain. Actual future results may differ from those estimates. A potential impairment exists if the fair value of the reporting unit is lower than its net book value. The second step of the process is only performed if a potential impairment exists, and it involves determining the difference between the fair values of the reporting unit’s net assets, other than goodwill, and the fair value of the reporting unit, and, if the difference is less than the net book value of goodwill, an impairment charge is recorded. In the event that we determine that the value of goodwill has become impaired, we record a charge for the amount of impairment during the fiscal quarter in which the determination is made. We operate in one reporting unit. We conducted our annual goodwill impairment analysis in the fourth quarters of 2019, 2018, and 2017 and no goodwill impairment was indicated.
Research and Development Expenses.
Research and development expenditures are expensed as incurred.
75
Stock-based Compensation.
We account for stock-based compensation using the fair value method. We determine fair value for stock options awarded to employees at the grant date using the Black-Scholes option-pricing model, which requires us to make various assumptions, including the fair value of the underlying common stock, expected future share price volatility and expected term. We determine the fair value of stock options awarded to non-employees at each vesting date using the Black-Scholes option-pricing model, and re-measure fair value at each reporting period until the services required under the arrangement are completed. Fair value is recognized as an expense on a straight-line basis over the requisite service period, which is generally the vesting period. We are required to estimate the expected forfeiture rate and only recognize expense for those stock-based awards expected to vest. We estimate the forfeiture rate based on historical experience of our stock-based awards that are granted, exercised and cancelled. If the actual forfeiture rate is materially different from our estimate, stock-based compensation expense in future periods could be significantly different from what was recorded in the current period.
Time-based restricted stock units (“RSUs”) are valued at the grant date fair value of the underlying common shares. Performance-based RSUs are valued using the Monte Carlo simulation technique. The Monte Carlo simulation model incorporates assumptions for the holding period, risk-free interest rate, stock price volatility and dividend yield.
Concentration of Risk.
Our products are primarily manufactured, assembled and tested by third-party foundries and other contractors in Asia and we are heavily dependent on a single foundry in Taiwan for the manufacture of wafers and a single contractor in the Philippines for assembly and testing of our products. We do not have long-term agreements with either of these suppliers. A significant disruption in the operations of these parties would adversely impact the production of our products for a substantial period of time, which could have a material adverse effect on our business, financial condition, operating results and cash flows.
Financial instruments that potentially subject us to significant concentrations of credit risk consist principally of cash and cash equivalents and accounts receivables. We place substantially all of our cash and cash equivalents on deposit with three reputable, high credit quality financial institution in the United States of America. We believe that the banks that hold substantially all of our cash and cash equivalents are financially sound and, accordingly, subject to minimal credit risk. Deposits held with the banks may exceed the amount of insurance provided on such deposits.
We generally do not require collateral or other security in support of accounts receivable. We periodically review the need for an allowance for doubtful accounts by considering factors such as historical experience, credit quality, the age of the accounts receivable balances and current economic conditions that may affect a customer’s ability to pay. As a result of our favorable collection experience and customer concentration, there was no allowance for doubtful accounts as of December 31, 2017.. We recorded an allowance for doubtful accounts of $60,000 and $30,000 for the years ended December 31, 2019 and December 31, 2018.
Customer concentrations as a percentage of revenue, net were as follows:
|
|
|
Year Ended December 31, |
|
||||
|
|
|
|
|
||||
|
|
|
2019 |
|
2018 |
|
2017 |
|
|
Customer A |
|
13 |
% |
17 |
% |
18 |
% |
|
Customer B |
|
* |
|
* |
|
10 |
% |
|
Customer C |
|
16 |
% |
* |
|
* |
|
* less than 10%
76
Customer concentrations as a percentage of gross accounts receivable were as follows:
|
|
|
Year Ended December 31, |
|
||||
|
|
|
2019 |
|
2018 |
|
2017 |
|
|
Customer A |
|
* |
|
* |
|
31 |
% |
|
Customer B |
|
45 |
% |
13 |
% |
* |
|
* less than 10%
Net Loss per Share.
Basic net loss per share is calculated by dividing the net loss by the weighted average number of common shares outstanding during the period, without consideration for potentially dilutive securities. Diluted net loss per share is computed by dividing the net loss by the weighted average number of common shares and potentially dilutive common stock equivalents outstanding for the period determined using the treasury-stock and if-converted methods. For purposes of the diluted net loss per share calculation, common stock options, RSUs, and common stock warrants are considered to be potentially dilutive securities.
Loss Contingencies.
We are or have been subject to claims arising in the ordinary course of business. We evaluate contingent liabilities, including threatened or pending litigation, for potential losses. If the potential loss from any claim or legal proceedings is considered probable and the amount can be estimated, we accrue a liability for the estimated loss. Because of uncertainties related to these matters, accruals are based upon the best information available. For potential losses for which there is a reasonable possibility (meaning the likelihood is more than remote but less than probable) that a loss exists, we will disclose an estimate of the potential loss or range of such potential loss or include a statement that an estimate of the potential loss cannot be made. As additional information becomes available, we reassess the potential liability related to pending claims and litigation and may revise our estimates, which could materially impact our consolidated financial statements
Note 2. Acquisitions.
Echelon Corporation.
On September 14, 2018, we acquired 100% of the issued capital of Echelon Corporation, a Delaware corporation (“Echelon”), pursuant to the terms of an Agreement and Plan of Merger (the “Merger Agreement”) dated as of June 28, 2018. The purchase price was approximately $44.1 million paid in cash.
The assets and liabilities of Echelon were recorded in our consolidated balance sheet as of the acquisition date, at their respective fair values. Fair value is estimated based on one or a combination of income, cost and/or market approaches, as determined based on the nature of the asset or liability, and the level of inputs available. With respect to assets and liabilities, the determination of fair value requires management to make subjective judgments as to projections of future operating performance, the appropriate discount rate to apply, long-term growth rates, and other factors, which affect the amounts recorded in the purchase price allocation. The excess of the consideration transferred over the fair value of the identifiable assets, net of liabilities, is recorded as goodwill, which is indicative of the expected continued growth and development of Echelon. The purchase price allocation that follows is based on these estimated fair values of assets acquired and liabilities assumed.
77
The following table summarizes the fair values of assets acquired and liabilities assumed (in thousands):
|
Cash |
|
$ |
15,270 |
|
Short term investments |
|
|
1,274 |
|
Accounts receivable |
|
|
3,020 |
|
Inventories |
|
|
5,710 |
|
Other current assets |
|
|
2,845 |
|
Property and equipment, net |
|
|
614 |
|
Intangible assets |
|
|
17,690 |
|
Goodwill |
|
|
4,266 |
|
Other non-current assets |
|
|
252 |
|
Accounts payable |
|
|
(3,630) |
|
Other current liabilities |
|
|
(2,642) |
|
Other non-current liabilities |
|
|
(563) |
|
Fair value net assets acquired |
|
$ |
44,106 |
Intangible assets reflect the following:
|
|
|
Fair Value |
|
Useful |
|
|
Customer relationships |
|
$ |
6,520 |
|
7 |
|
Developed technology |
|
|
10,670 |
|
4 |
|
Trademarks |
|
|
500 |
|
8 |
|
Total acquired intangible assets |
|
$ |
17,690 |
|
|
S3 Asic Semiconductors Limited.
On May 9, 2018, we acquired 100% of the issued capital of S3 Asic Semiconductors Limited, a private company limited by shares and incorporated in Ireland (“S3 Semiconductors”), pursuant to the Share Purchase Agreement dated May 9, 2018 (the “Agreement”). S3 Semiconductors is headquartered in Ireland and its subsidiaries are in the United States, Portugal and the Czech Republic. S3 Semiconductors and its subsidiaries are engaged in the business of providing advanced mixed signal semiconductor devices and intellectual property to customers in the industrial and communications markets. The aggregate consideration was approximately $35.0 million in cash and contingent consideration in the form of a $15.0 million earn-out. The earn-out is based on achievement of certain milestones through 2019, including minimum total revenue targets, revenue derived from sales of semiconductor devices and new customer engagements with minimum value thresholds. Based on revised estimates of performance against the earn-out thresholds we recorded a change in the fair value of the earn-out liability to approximately $10.5 million as of December 31, 2018. During 2019 we revalued the earn-out liability and recorded a reduction in that liability of approximately $0.3 million. In October 2019, we paid approximately $7.2 million against the liability and as of December 31, 2019 we estimated the fair value of the earn-out liability to $2.9 million.
The assets and liabilities of S3 Semiconductors were recorded in our consolidated balance sheet as of the acquisition date, at their respective fair values. Fair value is estimated based on one or a combination of income, cost and/or market approaches, as determined based on the nature of the asset or liability, and the level of inputs available. With respect to assets and liabilities, the determination of fair value requires management to make subjective judgments as to projections of future operating performance, the appropriate discount rate to apply, long-term growth rates, and other factors, which affect the amounts recorded in the purchase price allocation. The excess of the consideration transferred over the fair value of the identifiable assets, net of liabilities, is recorded as goodwill, which is indicative of the expected continued growth and development of S3 Semiconductors. The purchase price allocation that follows is based on these estimated fair values of assets acquired and liabilities assumed.
78
The following table summarizes the fair values of assets acquired and liabilities assumed (in thousands):
|
Cash |
|
$ |
267 |
|
Accounts receivable |
|
|
192 |
|
Other current assets |
|
|
883 |
|
Property and equipment, net |
|
|
191 |
|
Intangible assets |
|
|
15,340 |
|
Goodwill |
|
|
34,352 |
|
Accounts payable |
|
|
(37) |
|
Deferred revenue |
|
|
(129) |
|
Earn-out liability, current |
|
|
(10,218) |
|
Other current liabilities |
|
|
(761) |
|
Deferred tax liability |
|
|
(1,918) |
|
Earn-out liability, non-current |
|
|
(3,279) |
|
Fair value of net assets acquired |
|
$ |
34,883 |
Intangible assets reflect the following:
|
|
|
|
|
|
|
|
|
|
Fair Value |
|
Useful |
|
|
Customer relationships |
|
$ |
12,880 |
|
7 |
|
Contract backlog |
|
|
210 |
|
0.5 |
|
Developed technology |
|
|
1,080 |
|
5 |
|
Non-compete agreements |
|
|
380 |
|
2 |
|
Trademarks |
|
|
790 |
|
12 |
|
Total acquired intangible assets |
|
$ |
15,340 |
|
|
Pro forma results of operations have not been presented because the effect of the acquisition was not material to the Company’s financial results.
Note 3. Balance Sheet Components.
Accounts Receivable, Net.
Accounts receivable, net consisted of the following (in thousands):
|
|
|
December 31, |
||||
|
|
|
2019 |
|
2018 |
||
|
Accounts receivable |
|
$ |
39,199 |
|
$ |
22,490 |
|
Accounts receivable, unbilled |
|
|
1,353 |
|
|
751 |
|
Allowance for doubtful accounts |
|
|
(60) |
|
|
(30) |
|
Total accounts receivable, net |
|
$ |
40,492 |
|
$ |
23,211 |
79
Inventories.
Inventories consisted of the following (in thousands):
|
|
|
December 31, |
||||
|
|
|
2019 |
|
2018 |
||
|
Raw materials |
|
$ |
6,081 |
|
$ |
1,427 |
|
Work-in-process |
|
|
6,715 |
|
|
11,451 |
|
Finished goods |
|
|
7,227 |
|
|
5,757 |
|
Total inventories |
|
$ |
20,023 |
|
$ |
18,635 |
For the year ended December 31, 2019, we did not realize a benefit from the sales of previously written-down products. For the years ended December 31, 2018 and 2017, we realized a benefit of $1.3 million and $1.3 million, respectively, from sales of previously written-down products. Inventory write-downs were primarily associated with products built in excess of customer demand which resulted in excess inventory levels and legacy products for which no demand exists.
Property and Equipment, Net.
Property and equipment, net consisted of the following (in thousands):
|
|
|
December 31, |
||||
|
|
|
2019 |
|
2018 |
||
|
Machinery and equipment |
|
$ |
17,522 |
|
$ |
15,537 |
|
Leasehold improvements |
|
|
4,445 |
|
|
4,422 |
|
Computer software |
|
|
4,142 |
|
|
3,760 |
|
Furniture and fixtures |
|
|
733 |
|
|
372 |
|
Construction in progress |
|
|
115 |
|
|
52 |
|
Property and equipment, at cost |
|
|
26,957 |
|
|
24,143 |
|
Accumulated depreciation and amortization |
|
|
(18,844) |
|
|
(17,058) |
|
Property and equipment, net |
|
$ |
8,113 |
|
$ |
7,085 |
The Company incurs costs for the fabrication of masks used by its foundry partners to manufacture its products. Beginning the first fiscal quarter of 2017, the Company capitalizes mask costs that are expected to be utilized in production manufacturing as the Company’s product development process has become more predictable and thus supports capitalization of the mask. The capitalized mask costs begin depreciating to cost of revenue once the products go into production. Depreciation is computed using the straight-line method over a three-year period which is the expected useful life of the mask. Previously mask sets were expensed to research and development.
Depreciation and amortization expense of property and equipment for the years ended December 31, 2019, 2018, and 2017 was $3.2 million, $2.4 million, and $1.4 million, respectively.
80
Accrued Expenses and Other Current Liabilities.
Accrued expenses and other current liabilities consisted of the following (in thousands):
|
|
|
December 31, |
||||
|
|
|
2019 |
|
2018 |
||
|
Accrued sales commission payable |
|
$ |
389 |
|
$ |
387 |
|
Accrued manufacturing expenses |
|
|
1,106 |
|
|
692 |
|
Deferred rent, current portion |
|
|
— |
|
|
514 |
|
Liabilities to certain customers |
|
|
4,144 |
|
|
366 |
|
Warranty reserve |
|
|
513 |
|
|
505 |
|
Deferred revenue, current portion |
|
|
415 |
|
|
1,848 |
|
Income tax payable |
|
|
132 |
|
|
172 |
|
Interest payable |
|
|
950 |
|
|
— |
|
Other accrued liabilities |
|
|
1,719 |
|
|
688 |
|
Total accrued expenses and other current liabilities |
|
$ |
9,368 |
|
$ |
5,172 |
Note 4. Fair Value Measurements.
Fair value is defined as the exchange price that would be received from selling an asset or paid to transfer a liability in the principal or most advantageous market for the asset or liability in an orderly transaction between market participants on the measurement date. We measure financial assets and liabilities at fair value at each reporting period using a fair value hierarchy which requires us to maximize the use of observable inputs and minimize the use of unobservable inputs when measuring fair value. A financial instrument’s classification within the fair value hierarchy is based upon the lowest level of input that is significant to the fair value measurement. Three levels of inputs may be used to measure fair value:
Level 1. Quoted prices in active markets for identical assets or liabilities.
Level 2 . Quoted prices for similar assets and liabilities in active markets or inputs other than quoted prices which are observable for the assets or liabilities, either directly or indirectly through market corroboration, for substantially the full term of the financial instruments.
Level 3. Unobservable inputs which are supported by little or no market activity and which are significant to the fair value of the assets or liabilities.
81
Financial assets and liabilities measured at fair value on a recurring basis were as follows:
|
|
|
Fair Value Measurement at Reporting Date Using |
||||||||||
|
|
|
|
|
|
Significant |
|
|
|
|
|
|
|
|
|
|
Quoted Prices in |
|
Other |
|
Significant |
|
|
|
|||
|
|
|
Active Markets |
|
Observable |
|
Unobservable |
|
|
|
|||
|
|
|
for Identical |
|
Inputs |
|
Inputs |
|
|
|
|||
|
|
|
Assets (Level 1) |
|
(Level 2) |
|
(Level 3) |
|
Total |
||||
|
|
|
(in thousands) |
||||||||||
|
As of December 31, 2019 |
|
|
|
|
|
|
|
|
|
|
|
|
|
Assets: |
|
|
|
|
|
|
|
|
|
|
|
|
|
Money market funds |
|
$ |
460 |
|
$ |
— |
|
$ |
— |
|
$ |
460 |
|
U.S. government securities |
|
|
300 |
|
|
— |
|
|
— |
|
|
300 |
|
|
|
$ |
760 |
|
$ |
— |
|
$ |
— |
|
$ |
760 |
|
Liabilities: |
|
|
|
|
|
|
|
|
|
|
|
|
|
Earn-out liability |
|
$ |
— |
|
$ |
— |
|
$ |
2,911 |
|
$ |
2,911 |
|
|
|
|
|
|
|
|
|
|
|
|
|
|
|
As of December 31, 2018 |
|
|
|
|
|
|
|
|
|
|
|
|
|
Assets: |
|
|
|
|
|
|
|
|
|
|
|
|
|
Money market funds |
|
$ |
458 |
|
$ |
— |
|
$ |
— |
|
$ |
458 |
|
U.S. government securities |
|
|
1,282 |
|
|
— |
|
|
— |
|
|
1,282 |
|
|
|
$ |
1,740 |
|
$ |
— |
|
$ |
— |
|
$ |
1,740 |
|
Liabilities: |
|
|
|
|
|
|
|
|
|
|
|
|
|
Earn-out liability |
|
$ |
— |
|
$ |
— |
|
$ |
10,450 |
|
$ |
10,450 |
As of December 31, 2019, we had an earn-out liability of $2.9 million and as of December 31, 2018, we had an earn-out liability of $10.5 million. All of the earn-out liability was related to the acquisition of S3 Semiconductors which was completed in May 2018 (see Note 2). The earn-out liability was calculated using the present value of a probability weighted income approach.
Changes in the earn-out liability during 2019 was as follows:
|
Balance as of January 1, 2019 |
|
$ |
10,450 |
|
Payments |
|
|
(7,219) |
|
Change in fair value |
|
|
(320) |
|
Change in foreign currency exchange rate |
|
|
— |
|
Balance as of December 31, 2019 |
|
$ |
2,911 |
|
|
|
|
|
|
Changes in the earn-out liability during 2018 was as follows: |
|
|
|
|
Balance as of January 1, 2018 |
|
$ |
— |
|
Acquisitions |
|
|
13,497 |
|
Change in fair value |
|
|
(2,569) |
|
Change in foreign currency exchange rate |
|
|
(478) |
|
Balance as of December 31, 2018 |
|
$ |
10,450 |
As of December 31, 2017, we had no financial liabilities measured at fair value on a recurring basis.
The Company’s cash equivalents include U.S. government securities with a minimum and weighted average credit rating of A-1+. The Company values these securities based on pricing from pricing vendors, who may use quoted prices in active markets for identical assets (Level 1 inputs) or inputs other than quoted prices that are observable either directly or indirectly (Level 2 inputs) in determining fair value. As of December 31, 2019, the Company classified all of
82
its fixed income securities as having Level 1 inputs. The Company's procedures include controls to ensure that appropriate fair values are recorded by comparing prices obtained from a third party independent source.
Note 5. Purchased Intangible Assets and Goodwill
In connection with our purchase of the serial flash memory product line assets from Atmel Corporation, we recorded $16.4 million of intangible assets.
In connection with the acquisition of S3 (Note 2), we recorded $15.3 million of intangible assets.
In connection with the acquisition of Echelon (Note 2), we recorded $17.7 million of intangible assets
Intangible assets, net are as follows (in thousands):
|
|
|
|
|
December 31, 2019 |
|||||||
|
|
|
Estimated Useful |
Gross Carrying |
|
Accumulated |
|
Net Carrying |
||||
|
Developed technology |
|
4 - 10 |
|
$ |
16,032 |
|
$ |
6,905 |
|
$ |
9,127 |
|
Customer relationships |
|
7 - 12 |
|
|
28,411 |
|
|
9,608 |
|
|
18,803 |
|
Customer backlog |
|
1 |
|
|
2,779 |
|
|
2,779 |
|
|
— |
|
Contract backlog |
|
0.5 |
|
|
210 |
|
|
210 |
|
|
— |
|
Non-compete agreement |
|
2 - 5 |
|
|
662 |
|
|
588 |
|
|
74 |
|
Trademarks |
|
8 - 12 |
|
|
1,290 |
|
|
186 |
|
|
1,104 |
|
Total intangible assets subject to amortization |
|
|
|
$ |
49,384 |
|
$ |
20,276 |
|
$ |
29,108 |
|
|
|
|
|
December 31, 2018 |
|||||||
|
|
|
Estimated Useful |
|
Gross Carrying |
|
Accumulated |
|
Net Carrying |
|||
|
Developed technology |
|
4 - 10 |
|
$ |
16,032 |
|
$ |
3,593 |
|
$ |
12,439 |
|
Customer relationships |
|
7 - 12 |
|
|
28,411 |
|
|
6,085 |
|
|
22,326 |
|
Customer backlog |
|
1 |
|
|
2,779 |
|
|
2,779 |
|
|
— |
|
Contract backlog |
|
0.5 |
|
|
210 |
|
|
210 |
|
|
— |
|
Non-compete agreement |
|
2 - 5 |
|
|
662 |
|
|
398 |
|
|
264 |
|
Trademarks |
|
8 - 12 |
|
|
1,290 |
|
|
58 |
|
|
1,232 |
|
Total intangible assets subject to amortization |
|
|
|
$ |
49,384 |
|
$ |
13,123 |
|
$ |
36,261 |
83
The estimated future amortization expense of acquisition-related intangible assets subject to amortization as of December 31, 2019 is as follows (in thousands):
|
Year Ended December 31, |
|
|
|
|
|
2020 |
|
$ |
7,036 |
|
|
2021 |
|
|
6,962 |
|
|
2022 |
|
|
6,070 |
|
|
2023 |
|
|
3,736 |
|
|
2024 |
|
|
3,463 |
|
|
Thereafter |
|
|
1,841 |
|
|
Total |
|
$ |
29,108 |
|
Note 6. Investment in Unconsolidated Affiliates.
During 2019 and 2018, we made investments in Semitech Semiconductor Pty. Ltd., an Australian corporation (“Semitech”), as part of a license and development agreement dated April 16, 2016. Semitech has developed Narrowband-Power Line Communications (“N-PLC”) products and market knowledge in the N-PLC devices space and plans to sell its products into the Smart Grid, Solar, Smart Lighting and Industrial space. Investments during 2016 through June 14, 2017 were recorded as notes receivable. On June 15, 2017, $0.4 million of notes receivable and accrued interest were converted into 233,335 shares of preferred stock in Semitech. In June 2018, we converted $0.5 million of notes receivable and accrued interest into 312,076 shares of preferred stock in Semitech. None of the notes receivable were converted into shares of preferred stock during the year ended December 31, 2019. This investment is recorded at cost in other non-current assets on the consolidated balance sheets as of December 31, 2019 and 2018 in the amount of $0.9 million and $0.9 million, respectively. As of December 31, 2019 and 2018, we held investments in notes receivable in the amount of $0.7 million and $0.2 million, respectively, which were classified in other non-current assets on the consolidated balance sheets.
Note 7. Borrowings.
Western Alliance Bank Term Loan.
The Company was a party to that certain Business Financing Agreement dated July 7, 2016 and that certain Second Business Financing Modification Agreement, dated September 29, 2017, by and between Western Alliance Bank and the Company (“Credit Facility”). The Credit Facility provided for (i) a term loan of up to $18.0 million (the “Term Loan”) and (ii) a revolving credit line advance (the “Line of Credit”) in the aggregate amount of the lower of (x) $5.0 million and (y) 80% of certain of the Company’s receivables. The Term Loan bore interest at a rate per annum equal to the greater of the prime rate or 3.5%, plus 0.75% and was scheduled to mature in June 2019. The Line of Credit bore interest at a rate per annum equal to the greater of the prime rate or 3.5% plus 0.50%), and was scheduled to mature in July 2018. We made interest-only payments on the Term Loan from July 2016 through September 2016 and began making interest payments and principal payments in 33 equal monthly installments starting October 2016. Prior to the Amendment, the Credit Facility provided that any indebtedness we incurred thereunder was collateralized by substantially all assets of the Company and any domestic subsidiaries, subject to certain customary exceptions. We paid a facility fee of $150,000 as well as a $25,000 diligence fee upon entry into the Credit Facility and an additional $10,000 on July 7, 2017. Additional fees of $25,000 were incurred in connection with the amendment. These fees were recorded as a debt discount and were amortized over the life of the agreement.
Borrowings of $12.0 million under this facility were repaid in full in May 2018. In connection with the repayment of this facility, the remaining unamortized debt discount of $66,000 was recorded as interest expense in the consolidated statements of operations.
84
Tennenbaum Capital Partners, LLC Term Loan.
On May 8, 2018, we entered into a credit agreement with Tennenbaum Capital Partners, LLC (“Tennenbaum”) (“Credit Agreement”). The Credit Agreement provides for a first lien senior secured term loan of $35.0 million (“Term Loan”). The Term Loan bears interest at a rate per annum equal to the sum of the Libor Rate (2.4375% on December 31, 2018) plus 8.75% and is payable in consecutive quarterly installments starting December 31, 2018. The Term Loan is scheduled to mature on May 8, 2022. The Credit Agreement provided that any indebtedness we incurred thereunder was collateralized by substantially all assets of the Company and any domestic subsidiaries, subject to certain customary exceptions.
The Credit Agreement contains customary representations and warranties and affirmative and negative covenants, including maximum consolidated leverage ratios and minimum liquidity. Upon an occurrence of an event of default, under the Credit Facility we could be required to pay interest on all outstanding obligations under the agreement at a rate of 2% above the otherwise applicable interest rate, and the lender may accelerate our obligations under the agreement. As of December 31, 2018, we were in compliance with all of the financial covenants and restrictions.
In connection with the Credit Agreement, Tennenbaum received a warrant to purchase 850,000 shares of common stock at an exercise price of $8.62 and a term of six years. The fair value of the warrant was $4.9 million and was calculated using the Black-Scholes option pricing model. The inputs used in calculating fair value were: initial exercise price of $8.30, stock price of $8.70, volatility of 70%, term of 6 years and a risk-free interest rate of 2.87%. In addition, we paid financing costs of $1.4 million. The financing costs and the value of the warrant, $4.8 million, were recorded as a debt discount and are being amortized over the life of the Credit Agreement. During the year ended December 31, 2018, the amortization of debt discount was $1.1 million and the unamortized debt discount was $5.1 million as of December 31, 2018.
Borrowings of $33.8 million under this facility were repaid in full in September 2019. In addition, the Company was required to pay a prepayment premium of $0.7 million. In connection with the repayment of this facility, the remaining balance of the debt discount was recognized as interest expense. Amortization of debt discount was $5.1 million and $1.1 million for the years ended December 31, 2019 and 2018, respectively.
Convertible Notes.
On September 23, 2019, the Company completed an offering of $80.5 million aggregate principal amount of 4.25% Convertible Senior Notes due 2024 (the "Notes"). The Notes were sold pursuant to an indenture between the Company and U.S. Bank National Association (the “Trustee”). The Notes are senior, unsecured obligations of the Company. The Notes pay interest at a rate equal to 4.25% per year. Interest on the Notes is payable semiannually in arrears on March 15 and September 15 of each year, beginning March 15, 2020. Interest accrues on the Notes from the last date to which interest has been paid or duly provided for or, if no interest has been paid or duly provided for, from September 23, 2019. Unless earlier converted, redeemed or repurchased, the Notes mature on September 15, 2024.
The implied estimated effective rate of the liability component of the Notes is 12.3%.
The Notes are convertible into Company common stock at an initial conversion rate of 83.3021 shares per $1,000 principal amount of Notes, subject to adjustment upon certain events.
The Notes are convertible, in whole or in part, at the option of the holder, at any time prior to the close of business on the business day immediately preceding June 15, 2024, but only in the following circumstances:
(1) during any calendar quarter commencing after the calendar quarter ending on December 31, 2019 (and only during such calendar quarter), if the last reported sale price of the Company’s common stock for each of at least 20 trading days (whether or not consecutive) during the 30 consecutive trading days ending on, and including, the last
85
trading day of the immediately preceding calendar quarter is greater than 130% of the conversion price on such trading day;
(2) during the five business day period immediately after any ten consecutive trading day period (the five consecutive trading day period being referred to as the ‘‘measurement period’’) in which the trading price per $1,000 principal amount of the Notes for each trading day of the measurement period was less than 98% of the product of the last reported sale price of the Company’s common stock and the conversion rate on such trading day;
(3) upon the occurrence of certain specified corporate events, including fundamental changes (as described in the Indenture); or
(4) if the Company calls the Notes for redemption.
In addition, regardless of the foregoing circumstances, holders may convert their Notes at any time on or after June 15, 2024 and prior to the close of business on the day immediately preceding the maturity date of the Notes. Upon conversion, the Company may elect to settle by paying or delivering either solely cash, shares of Company common stock or a combination of cash and shares of common stock.
In accounting for the issuance of the Notes, we separated the Notes into liability and equity components. The carrying amounts of the liability components of the Notes were calculated by measuring the fair value of similar debt instruments that do not have an associated convertible feature. The carrying amount of the equity component represents the conversion option and was determined by deducting the fair value of the liability component from the par value of the respective Notes. The difference represents the debt discount that is amortized to interest expense over the respective terms of the Notes using the effective interest method. The carrying amount of the equity component that represents the conversion option was $22.6 million gross and $21.6 million net of issuance costs. The equity component is recorded in additional paid-in capital and is not remeasured as long as it continues to meet the conditions for equity classification.
The Indenture contains covenants that, among other things, restricts the Company’s ability to merge, consolidate or sell, or otherwise dispose of, all or substantially all of its assets. These limitations are subject to a number of important qualifications and exceptions.
The Indenture contains customary Events of Default (as defined in the Indenture), including default in the event the Company fails to pay interest on the Notes when due, and such failure continues for 30 days, or the Company fails to pay the principal of the Notes when due, including at maturity, upon redemption or otherwise; failure to comply with covenants and other obligations under the Indenture, including delivery of required notices and obligations in connection with conversion, in certain cases subject to notice and grace periods; payment defaults and accelerations with respect to other indebtedness of the Company and its significant subsidiaries in the aggregate principal amount of $15.0 million or more; failure by the Company or its significant subsidiaries to pay certain final judgments aggregating in excess of $15.0 million within 60 consecutive days of such final judgment; and specified events involving bankruptcy, insolvency or reorganization of the Company or its significant subsidiaries.
Upon an Event of Default, the trustee or the holders of at least 25% in aggregate principal amount of the Notes then outstanding may declare all the Notes to be due and payable immediately. In the case of Events of Default relating to bankruptcy, insolvency or reorganization, all outstanding Notes will become due and payable immediately without further action or notice.
On September 18, 2019, in connection with the pricing of the Notes, the Company entered into privately negotiated capped call transactions (the “Base Capped Call Transactions”) with each of Credit Suisse Capital LLC and Société Générale (the “option counterparties). On September 19, 2019, in connection with the exercise of the option in full by the initial purchasers, Adesto entered into additional privately negotiated capped call transactions (the
86
“Additional Capped Call Transactions,” and together with the Base Capped Call Transactions, the “Capped Call Transactions”) with each of the option counterparties.
The Capped Call Transactions relating to the Notes will initially cover, subject to customary anti-dilution adjustments, the number of shares of common stock that initially underlie the Notes. The cap price of the Capped Call Transactions is initially $15.86 per share of common stock, representing a premium of 75.0% above the last reported sales price of $9.06 per share of common stock on September 18, 2019, and is subject certain adjustments under the terms of the Capped Call Transactions. The Capped Call Transactions are expected generally to reduce the potential dilution to the common stock as a result of any conversion of the Notes and/or offset any cash payments that Adesto would be required to make in excess of the principal amount upon conversion of the Notes, as the case may be, with such reduction or offset subject to a cap based on the cap price.
In connection with establishing their initial hedges of the Capped Call Transactions, the Company expects that the option counterparties or their respective affiliates will purchase shares of common stock and/or enter into various derivative transactions with respect to common stock concurrently with, or shortly after, the pricing of the Notes. This activity could increase (or reduce the size of any decrease in) the market price of common stock or Notes at that time.
In addition, the Company expects that the option counterparties or their respective affiliates may modify their hedge positions by entering into or unwinding various derivatives with respect to common stock and/or purchasing or selling common stock in secondary market transactions following the pricing of the Notes and prior to the maturity of the Notes. This activity could cause or avoid an increase or decrease in the market price of common stock or the Notes which could affect holders’ ability to convert the Notes.
The Capped Call Transactions are separate transactions entered into by Adesto with the option counterparties, are not part of the terms of the Notes, and will not affect any holder’s rights under the Notes. Holders of the Notes will not have any right with respect to the Capped Calls Transactions. The premium paid for the purchase of the capped calls in the amount of $6.2 million has been recorded as a reduction to additional paid-in capital and will not be remeasured.
The following table summarizes information about the equity and liability components of the Notes (in thousands):
|
|
|
December 31, |
|
|
|
|
2019 |
|
|
Liability component: |
|
|
|
|
Principal amount |
|
$ |
80,500 |
|
Unamortized discount |
|
|
(21,529) |
|
Unamortized issuance costs |
|
|
(2,382) |
|
Total convertible senior notes |
|
$ |
56,589 |
|
|
|
|
|
|
Equity component , net of issuance costs |
|
$ |
21,662 |
Outstanding borrowings consisted of the following (in thousands):
|
|
|
December 31, |
|
||||
|
|
|
2019 |
|
2018 |
|
||
|
Term loan, current |
|
$ |
— |
|
$ |
141 |
|
|
Term loan, non-current |
|
|
— |
|
|
29,418 |
|
|
Convertible notes |
|
|
56,589 |
|
|
— |
|
|
Total |
|
$ |
56,589 |
|
$ |
29,559 |
|
87
Future repayments on the outstanding convertible notes are as follows: (in thousands)
|
Year Ended December 31, |
|
|
|
|
|
2020 |
|
$ |
— |
|
|
2021 |
|
|
— |
|
|
2022 |
|
|
— |
|
|
2023 |
|
|
— |
|
|
2024 |
|
|
80,500 |
|
|
|
|
$ |
80,500 |
|
Interest expense incurred under our borrowings was $11.0 million, $3.9 million, and $0.8 million for the years ended December 31, 2019, 2018, and 2017, respectively.
Note 8. Segment Information.
We operate in one business segment: application-specific semiconductors and embedded systems. Our chief decision-maker, the President and Chief Executive Officer, evaluates our performance based on company-wide consolidated results. Revenue is evaluated based on product category and by geographic region.
Product revenue from customers is designated based on the geographic region to which the product is delivered. Revenue by geographic region was as follows (in thousands):
|
|
|
Year Ended December 31, |
|
|||||||
|
|
|
|
|
|||||||
|
|
|
2019 |
|
2018 |
|
2017 |
|
|||
|
United States |
|
$ |
31,887 |
|
$ |
23,188 |
|
$ |
11,667 |
|
|
Rest of Americas |
|
|
5,217 |
|
|
2,790 |
|
|
245 |
|
|
Europe |
|
|
20,942 |
|
|
17,514 |
|
|
9,546 |
|
|
Asia Pacific |
|
|
59,167 |
|
|
39,463 |
|
|
34,263 |
|
|
Rest of world |
|
|
953 |
|
|
535 |
|
|
391 |
|
|
Total |
|
$ |
118,166 |
|
$ |
83,490 |
|
$ |
56,112 |
|
Long-lived assets are attributed to the geographic region were they are located. Long-lived assets by geographic region were as follows (in thousands):
|
|
|
December 31, |
||||
|
|
|
2019 |
|
2018 |
||
|
United States |
|
$ |
3,248 |
|
$ |
3,879 |
|
Asia Pacific |
|
|
4,093 |
|
|
2,968 |
|
Europe |
|
|
772 |
|
|
238 |
|
Total property and equipment, net |
|
$ |
8,113 |
|
$ |
7,085 |
Note 9. Commitments and Contingencies.
Operating Leases.
We lease certain manufacturing facilities, warehouses, office space, and equipment under non-cancelable operating leases that expire at various times up to November 2033 and have options to renew most leases, with rentals to be negotiated. Certain of our leases contain provisions for rental adjustments. Operating lease rentals are expensed on a straight-line basis over the life of the lease beginning on the date we take possession of the property. At lease inception, we determine the lease term by assuming the exercise of those renewal options that are reasonably assured. The exercise
88
of lease renewal options is at our sole discretion. The lease term is used to determine whether a lease is financing or operating and is used to calculate straight-line rent expense. Additionally, the depreciable life of leasehold improvements is limited by the expected lease term. Leases with an initial term of 12 months or less are not recorded on the balance sheet; we recognize lease expense for these leases on a straight-line basis over the lease term.
The following table reflects our lease assets and our lease liabilities at December 31, 2019 and January 1, 2019 (in thousands).
|
|
|
December 31, |
|
January 1, |
||
|
|
|
2019 |
|
2019 |
||
|
Assets: |
|
|
|
|
|
|
|
Operating lease right-of-use assets |
|
$ |
4,300 |
|
$ |
4,877 |
|
|
|
|
|
|
|
|
|
Liabilities: |
|
|
|
|
|
|
|
Operating lease liabilities, current |
|
$ |
1,230 |
|
$ |
1,116 |
|
Operating lease liabilities, non-current |
|
$ |
4,726 |
|
$ |
5,917 |
Lease Costs:
The components of lease costs were as follows (in thousands):
|
|
|
Year Ended |
|
|
|
|
December 31, |
|
|
|
|
2019 |
|
|
Operating lease cost |
|
$ |
2,156 |
As of December 31, 2019, the maturity of operating lease liabilities was as follows (in thousands):
|
(In thousands) |
|
|
|
|
2020 |
|
$ |
2,006 |
|
2021 |
|
|
1,693 |
|
2022 |
|
|
1,553 |
|
2023 |
|
|
1,016 |
|
2024 |
|
|
222 |
|
Thereafter |
|
|
1,962 |
|
Total lease payments |
|
|
8,452 |
|
Less: Interest |
|
|
(2,496) |
|
Present value of lease liabilities |
|
$ |
5,956 |
Lease Term and Discount Rate:
|
|
|
December 31, |
|
|
|
|
2019 |
|
|
Weighted-average remaining lease term (in years) |
|
7.0 |
|
|
Weighted-average discount rate |
|
11.56 |
% |
Other Information:
Supplemental 2019 cash flow information related to leases was as follows (in thousands):
|
|
Year Ended |
|
|
|
December 31, 2019 |
|
89
|
Operating cash outflows from operating leases |
$ |
2,156 |
|
Right-of-use assets obtained in exchange for new operating lease liabilities |
$ |
— |
Rent expense under operating leases for 2019, 2018, and 2017 was $2.2 million, $2.0 million, and $1.0 million, respectively.
Purchase Commitments.
As of December 31, 2019, we had purchase commitments with our third-party foundries of $8.8 million due within one year.
Litigation.
We are subject to legal proceedings, claims and litigation, including intellectual property litigation, arising in the ordinary course of business. Such matters are subject to many uncertainties and outcomes and are not predictable with assurance. We accrue amounts that we believe are adequate to address any liabilities related to legal proceedings and other loss contingencies that we believe will result in a probable loss that is reasonably estimable.
Indemnification.
During the normal course of business, we may make certain indemnities, commitments and guarantees which may include intellectual property indemnities to certain of our customers in connection with the sales of our products and indemnities for liabilities associated with the infringement of other parties’ technology based upon our products. Our exposure under these indemnification provisions is generally limited to the total amount paid by a customer under the agreement. However, certain agreements include indemnification provisions that could potentially expose us to losses in excess of the amount received under the agreement. In addition, we indemnify our officers, directors and certain key employees while they are serving in good faith in such capacities.
We have not recorded any liability for these indemnities, commitments and guarantees in the accompanying consolidated balance sheets. Where necessary, we accrue for losses for any known contingent liabilities, including those that may arise from indemnification provisions, when future payment is probable.
Note 10. Common Stock, Common Stock Warrants and Stock Option Plan.
Common Stock.
We were authorized to issue 100,000,000 shares of common stock with $0.0001 par value per share as of December 31, 2019 and 2018. Each holder of common stock is entitled to one vote per share. As of December 31, 2019, no dividends have been declared by the Board of Directors, however, the holders of common stock are also entitled to receive dividends, when and if declared by our Board of Directors.
We completed a follow-on offering of our common stock in June 2017. We sold 5,000,000 shares, including 625,000 shares upon exercise of the underwriters’ option to purchase additional shares. The shares were sold at a public offering price of $4.00 per share for net proceeds of $18.4 million to us, after deducting underwriting discounts and commissions and offering expenses.
We completed another follow-on offering of our common stock in July 2018. We sold 7,705,000 shares, including 1,005,000 shares upon exercise of the underwriters’ option to purchase additional shares. The shares were sold at a public offering price of $6.00 per share for net proceeds of $42.7 million to us, after deducting underwriting discounts, commissions and offering expenses.
90
We completed an offering of $80.5 million of convertible senior notes in September 2019. In conjunction with this issuance we reserved 8,885,204 shares of common stock.
Common Stock Reserved for Future Issuance.
As of December 31, 2019 and 2018, we had reserved shares of common stock for future issuances as follows:
|
|
|
December 31, |
||
|
|
|
2019 |
|
2018 |
|
Warrants to purchase common stock |
|
1,165,282 |
|
1,239,423 |
|
Options outstanding |
|
1,929,391 |
|
1,865,415 |
|
Restricted stock units outstanding |
|
1,451,507 |
|
1,154,980 |
|
Shares available for future grants |
|
288,813 |
|
96,515 |
|
Shares available for ESPP |
|
373,428 |
|
362,938 |
|
Shares reserved for issuance upon conversion of the Notes |
|
8,885,204 |
|
0 |
|
Total |
|
14,093,625 |
|
4,719,271 |
Common Stock Warrants.
In connection with the conversion of preferred stock warrants upon the completion of our IPO on October 30, 2015, the following common stock warrants were outstanding:
|
As of December 31, 2019 |
|
|
|
|
|
|
|
|
Total amount of securities issuable |
|
|
|
|
|
|
|
|
under the outstanding warrants |
|
Exercise Price |
|
Issuance Date |
|
Expiration Date |
|
| 315,282 |
|
$ |
2.38 |
|
2014-2015 |
|
2022-2024 |
| 850,000 |
|
$ |
8.62 |
|
2018 |
|
2024 |
| 1,165,282 |
|
$ |
6.93 |
|
|
|
|
|
As of December 31, 2018 |
|
|
|
|
|
|
|
|
Total amount of securities issuable |
|
|
|
|
|
|
|
|
under the outstanding warrants |
|
Exercise Price |
|
Issuance Date |
|
Expiration Date |
|
| 74,141 |
|
$ |
30.35 |
|
2012-2013 |
|
2019 |
| 315,282 |
|
$ |
2.38 |
|
2014-2015 |
|
2022-2024 |
| 850,000 |
|
$ |
8.62 |
|
2018 |
|
2024 |
| 1,239,423 |
|
$ |
8.33 |
|
|
|
|
Common stock warrants are exercisable at the option of the holder any time after the date of issuance into shares of our common stock. During 2019, 74,141 common stock warrants expired unexercised on September 27, 2019.
Employee Benefit Plans.
2007 Equity Incentive Plan.
In 2007, our Board of Directors and shareholders approved the 2007 Equity Incentive Plan (the “2007 Plan”) under which 272,727 shares of common stock were reserved and available for the issuance of stock options and restricted stock to eligible participants. The 2007 Plan was subsequently amended to increase the number of shares of common stock reserved for issuance under the 2007 Plan to 787,878 and during the year ended December 31, 2015, the number of shares reserved for issuance under the 2007 Plan was increased to 2,651,515. Options and restricted stock awards were granted at a price per share not less than the 85% of the fair value at the date of grant or award, respectively. Restricted stock awarded to persons controlling more than 10% of our stock were granted at a price per
91
share not less than the 100% of the fair value at the date of the award. Options that were granted to new employees generally vest over a four-year period with 25% vesting at the end of one year and the remaining to vest monthly thereafter, while options that were granted to existing employees generally vest over a four-year period. Options granted generally are exercisable up to 10 years from the date of grant. As of October 26, 2015, no shares were available for grant under the 2007 Plan and all outstanding options would continue to be governed and remain outstanding in accordance with their existing terms. In addition, any shares subject to outstanding awards under the 2007 Plan that are issuable upon the exercise of options that expire or become unexercisable for any reason without having been exercised in full will be available for future grant and issuance under the 2015 Plan (as defined below).
2015 Equity Incentive Plan.
In September 2015, our Board of Directors adopted, and in October 2015 our stockholders approved, our 2015 Equity Incentive Plan. The 2015 Equity Incentive Plan became effective on the date immediately prior to the date of our IPO. As a result, 1,813,272 shares of common stock previously reserved but unissued under the 2007 Plan on the effective date of the 2015 Equity Incentive Plan became reserved for issuance under our 2015 Equity Incentive Plan, and we ceased granting awards under our 2007 Plan. The number of shares reserved for issuance under our 2015 Equity Incentive Plan will increase automatically on the 1st day of January of each of 2016 through 2025 by the number of shares equal to 4% of the total outstanding shares of our common stock as of the immediately preceding December 31. However, our Board of Directors may reduce the amount of the increase in any particular year.
Our 2015 Equity Incentive Plan authorizes the award of stock options, restricted stock awards, stock appreciation rights, RSUs, performance awards and stock bonuses. No person will be eligible to receive more than 2,000,000 shares in any calendar year under our 2015 Equity Incentive Plan other than a new employee of ours, who will be eligible to receive no more than 4,000,000 shares under the plan in the calendar year in which the employee commences employment. The aggregate number of shares of our common stock that may be subject to awards granted to any one non-employee director pursuant to the 2015 Equity Incentive Plan in any calendar year shall not exceed 300,000. Our 2015 Equity Incentive Plan provides that no more than 25,000,000 shares will be issued as incentive stock options.
2015 Employee Stock Purchase Plan.
In September 2015, our Board of Directors adopted, and in October 2015 our stockholders approved, our 2015 Employee Stock Purchase Plan (“ESPP”). The 2015 Employee Stock Purchase Plan became effective on the date of our IPO. We reserved 150,000 shares of our common stock for issuance under our 2015 Employee Stock Purchase Plan. The number of shares reserved for issuance under our 2015 Employee Stock Purchase Plan will increase automatically on the 1st day of January following the first offering date by the number of shares equal to 1% of the total outstanding shares of our common stock as of the immediately preceding December 31 (rounded to the nearest whole share). However, our Board of Directors may reduce the amount of the increase in any particular year. The aggregate number of shares issued over the term of our 2015 Employee Stock Purchase Plan will not exceed 2,250,000 shares of our common stock.
Under our 2015 Employee Stock Purchase Plan, eligible employees will be able to acquire shares of our common stock by accumulating funds through payroll deductions. Eligible employees will be able to select a rate of payroll deduction up to 15% of their base cash compensation. The purchase price for shares of our common stock purchased under our 2015 Employee Stock Purchase Plan will be 85% of the lesser of the fair market value of our common stock on (i) the first trading day of the applicable offering period and (ii) the last trading day of each purchase period in the applicable offering period. Except for the first offering period, each offering period will run for no more than six months, with purchases occurring every six months. The first offering period began upon the effective date of our IPO and was originally set to end on June 30, 2016. During 2019 and 2018, we issued 283,931 and 125,567 shares of common stock, respectively, in conjunction with the ESPP.
92
No participant will have the right to purchase shares of our common stock in an amount that has a fair market value greater than $25,000, determined as of the first day of the applicable purchase period, for each calendar year in which that right is outstanding. In addition, no participant will be permitted to purchase more than 2,500 shares during any one purchase period or a lesser amount determined by our compensation committee.
Our 2015 Employee Stock Purchase Plan will continue until the earlier to occur of its termination by our Board of Directors, the issuance of all shares reserved for issuance under it or the tenth anniversary of its effective date.
93
A summary of stock option and RSUs activity under the 2007 Plan and the 2015 Equity Incentive Plan is as follows:
|
|
|
Stock Options |
||||||||
|
|
|
|
|
|
|
|
Weighted- |
|
|
|
|
|
|
|
|
Weighted- |
|
Average |
|
|
|
|
|
|
|
|
|
Average |
|
Remaining |
|
Aggregate |
||
|
|
|
|
|
Exercise |
|
Contractual |
|
Intrinsic |
||
|
|
|
Shares |
|
Price |
|
Term (Years) |
|
Value |
||
|
|
|
(aggregate intrinsic value in thousands) |
||||||||
|
Outstanding as of December 31, 2016 |
|
991,895 |
|
$ |
2.68 |
|
6.3 |
|
$ |
161 |
|
Granted |
|
835,480 |
|
|
4.30 |
|
|
|
|
|
|
Exercised |
|
(230,123) |
|
|
1.92 |
|
|
|
|
|
|
Canceled |
|
(36,799) |
|
|
4.16 |
|
|
|
|
|
|
Outstanding as of December 31, 2017 |
|
1,560,453 |
|
|
3.63 |
|
7.6 |
|
$ |
4,632 |
|
Granted |
|
479,375 |
|
|
7.25 |
|
|
|
|
|
|
Exercised |
|
(112,965) |
|
|
2.48 |
|
|
|
|
|
|
Canceled |
|
(61,448) |
|
|
3.65 |
|
|
|
|
|
|
Outstanding as of December 31, 2018 |
|
1,865,415 |
|
|
4.63 |
|
7.6 |
|
$ |
1,540 |
|
Granted |
|
189,856 |
|
|
6.16 |
|
|
|
|
|
|
Exercised |
|
(112,647) |
|
|
3.36 |
|
|
|
|
|
|
Canceled |
|
(13,233) |
|
|
6.53 |
|
|
|
|
|
|
Outstanding as of December 31, 2019 |
|
1,929,391 |
|
$ |
4.84 |
|
6.9 |
|
$ |
7,146 |
|
Options vested and expected to vest as of December 31, 2019 |
|
1,875,980 |
|
$ |
4.80 |
|
6.9 |
|
$ |
7,029 |
|
Options vested and exercisable as of December 31, 2019 |
|
1,248,054 |
|
$ |
4.23 |
|
6.3 |
|
$ |
5,408 |
|
|
|
Restricted Stock Units |
||||||||
|
|
|
|
|
|
|
|
Weighted- |
|
|
|
|
|
|
|
|
Weighted- |
|
Average |
|
|
|
|
|
|
|
|
|
Average |
|
Remaining |
|
Aggregate |
||
|
|
|
|
|
Grant Date |
|
Contractual |
|
Intrinsic |
||
|
|
|
Shares |
|
Fair Value |
|
Term (Years) |
|
Value |
||
|
|
|
(aggregate intrinsic value in thousands) |
||||||||
|
Outstanding as of December 31, 2016 |
|
490,954 |
|
$ |
5.80 |
|
0.5 |
|
$ |
908 |
|
Granted |
|
541,513 |
|
|
2.88 |
|
|
|
|
|
|
Released |
|
(497,009) |
|
|
5.64 |
|
|
|
|
|
|
Forfeited/expired |
|
(25,564) |
|
|
5.98 |
|
|
|
|
|
|
Outstanding as of December 31, 2017 |
|
509,984 |
|
|
2.84 |
|
1.4 |
|
$ |
3,288 |
|
Granted |
|
925,578 |
|
|
6.55 |
|
|
|
|
|
|
Released |
|
(264,568) |
|
|
4.02 |
|
|
|
|
|
|
Forfeited/expired |
|
(15,924) |
|
|
8.34 |
|
|
|
|
|
|
Outstanding as of December 31, 2018 |
|
1,154,980 |
|
|
5.50 |
|
1.4 |
|
$ |
5,082 |
|
Granted |
|
978,851 |
|
|
6.35 |
|
|
|
|
|
|
Released |
|
(512,703) |
|
|
5.31 |
|
|
|
|
|
|
Forfeited/expired |
|
(169,621) |
|
|
5.15 |
|
|
|
|
|
|
Outstanding as of December 31, 2019 |
|
1,451,507 |
|
$ |
6.18 |
|
1.3 |
|
$ |
12,314 |
Certain of the RSUs that were released in 2017, 2018 and 2019 were net-share settled such that we withheld shares with value equivalent to the employees’ minimum statutory obligation for the applicable income and other employment taxes and remitted the cash to the appropriate taxing authorities. The total shares withheld were based on the value of the RSUs on their release date as determined by our closing stock price. These net-share settlements had the
94
effect of share repurchases as they reduced and retired the number of shares that would have otherwise been issued as a result of the release and did not represent an expense to us. During the year ended December 31, 2019, 512,703 shares of RSUs were released and, of those, we withheld 82,861 shares to satisfy $0.6 million of employees' minimum tax obligation on the released RSUs. During the year ended December 31, 2018, 264,568 shares of RSUs were released and, of those, we withheld 66,272 shares to satisfy $0.4 million of employees’ minimum tax obligation on the released RSUs. During the year ended December 31, 2017, 134,541 shares of RSUs were released and, of those, we withheld 50,541 shares to satisfy $0.1 million of employees’ minimum tax obligation on the released RSUs.
Additional information regarding stock options outstanding and vested as of December 31, 2019 is summarized below:
|
|
|
|
|
|
|
|
|
|
Options Vested and |
|||
|
|
|
Options Outstanding |
|
Exercisable |
||||||||
|
|
|
|
|
Weighted- |
|
Weighted- |
|
|
|
Weighted- |
||
|
|
|
Number of |
|
Average |
|
Average |
|
Shares |
|
Average |
||
|
|
|
Stock |
|
Remaining |
|
Exercise |
|
subject |
|
Exercise |
||
|
|
|
Options |
|
Contractual |
|
Price per |
|
to Stock |
|
Price per |
||
|
Range of Exercise Prices |
|
Outstanding |
|
Life (Years) |
|
Share |
|
Options |
|
Share |
||
|
$1.60 |
|
4,417 |
|
6.8 |
|
$ |
1.60 |
|
3,416 |
|
$ |
1.60 |
|
$1.65 |
|
268,559 |
|
3.2 |
|
|
1.65 |
|
268,559 |
|
|
1.65 |
|
$3.30 - $3.48 |
|
212,307 |
|
5.9 |
|
|
3.40 |
|
208,584 |
|
|
3.40 |
|
$3.55 |
|
370,275 |
|
7.2 |
|
|
3.55 |
|
245,596 |
|
|
3.55 |
|
$3.60 - $4.58 |
|
155,365 |
|
7.4 |
|
|
3.76 |
|
109,460 |
|
|
3.66 |
|
$5.25 |
|
216,993 |
|
7.2 |
|
|
5.25 |
|
136,051 |
|
|
5.25 |
|
$5.30 - $5.87 |
|
205,018 |
|
9.1 |
|
|
5.76 |
|
42,531 |
|
|
5.56 |
|
$6.15 - $8.10 |
|
183,651 |
|
8.3 |
|
|
6.62 |
|
81,611 |
|
|
6.48 |
|
$8.45 |
|
239,413 |
|
8.3 |
|
|
8.45 |
|
89,777 |
|
|
8.45 |
|
$8.55 - $10.00 |
|
73,393 |
|
6.5 |
|
|
9.63 |
|
62,469 |
|
|
9.79 |
|
$1.60-$10.00 |
|
1,929,391 |
|
6.9 |
|
$ |
4.84 |
|
1,248,054 |
|
$ |
4.23 |
Note 11. Stock-based Compensation.
We record stock-based compensation based on fair value as of the grant date using the Black-Scholes option-pricing model for stock options granted and the Monte Carlo simulation techniques for certain RSUs with performance-based vesting conditions. We recognize such costs as compensation expense on a straight-line basis over the employee’s requisite service period, which is generally four years. Our valuation assumptions are as follows:
Risk-free interest rate. We base the risk-free interest rate used in the Black-Scholes option-pricing model on the implied yield available on U.S. Treasury zero-coupon issues with an equivalent expected term of the options for each option group.
Expected term. The expected term represents the period that our stock-based awards are expected to be outstanding. The expected term assumption is based on the simplified method in which the expected term is equal to the average of the stock-based award’s weighted-average vesting period and its contractual term. We expect to continue using the simplified method until sufficient information about historical behavior is available.
Volatility. We determine volatility based on the historical stock volatility of our publicly traded stock.
Dividend yield. We have never declared or paid any cash dividend and do not currently plan to pay a cash dividend in the foreseeable future. Consequently, we used an expected dividend yield of zero.
95
The following table summarizes the weighted-average assumptions used in the Black-Scholes option-pricing model to determine fair value of stock options:
|
|
|
Year Ended December 31, |
|||||
|
|
|
2019 |
|
2018 |
|
2017 |
|
|
Volatility |
|
65 |
% |
72 |
% |
86 |
% |
|
Expected dividend yield |
|
— |
|
— |
|
— |
|
|
Risk-free rate |
|
2.22 |
% |
2.85 |
% |
2.15 |
% |
|
Expected term (in years) |
|
6 |
|
6 |
|
6 |
|
The weighted-average grant date fair value of the options granted under the 2015 Equity Incentive Plan as calculated using the Black-Scholes option-pricing model was $3.68, $4.59 and $3.11 per share for the years ended December 31, 2019, 2018 and 2017, respectively.
On April 1, 2017, our compensation committee granted 204,220 RSUs that do not begin vesting unless certain performance goals are met. All performance goals must be met in order for the shares to begin vesting. Vesting would begin on the one-year anniversary of the grant date. These performance goals relate to a) the price performance of our common stock one year from the grant date as compared to a threshold established by our compensation committee and b) revenue, gross profit and EBITDA performance relative to plan targets for fiscal 2017 established by our compensation committee. As a result of these performance-based vesting conditions we valued these RSUs using Monte Carlo simulation techniques to establish a fair value per share of $0.81 at the time of grant. As of April 1, 2018, all of the performance goals had been met and 204,220 RSUs began vesting.
On April 1, 2018, our compensation committee granted 102,283 RSUs that do not begin vesting unless certain performance goals are met. Vesting will not begin unless the stock performance goals are met and the number of shares eligible to begin vesting are based on Adesto’s share performance as compared to the Russell 2000 stock index which is the performance threshold established by the compensation committee. The evaluation period for the stock performance is from April 2, 2018 through March 31, 2019. Vesting begins on the one-year anniversary of the grant date with 20% of the shares vesting immediately and the remaining 80% of the shares vesting over the next eight quarters. As a result of these performance-based vesting conditions we valued these RSUs using Monte Carlo simulation techniques to establish a fair value per share of $4.92 at the time of grant. As of December 31, 2019, Adesto's share price did not meet the performance threshold and the PRSU's were not awarded.
On March 25, 2019, our compensation committee granted 147,954 RSUs that do not begin vesting unless certain performance goals are met. Vesting of these shares will not begin unless the stock price performance goals are met and the number of shares eligible to begin vesting are based on Adesto's share performance as compared to the Russell 2000 stock index which is the performance threshold established by the compensation committee. The evaluation period for the stock performance is from March 15, 2019 through March 15, 2020. Vesting would begin on the one-year anniversary of the grant date with 20% of the shares vesting immediately and the remaining 80% of the shares vesting over the next eight quarters. As a result of these performance-based vesting conditions we valued these RSUs using Monte Carlo simulation techniques to establish a fair value per share of $4.05 at the time of grant. Expense for these RSUs is being amortized over three years.
96
The following table presents the effects of stock-based compensation for stock options, RSUs, and ESPP (in thousands):
|
|
|
Year Ended December 31, |
|||||||
|
|
|
|
|||||||
|
|
|
2019 |
|
2018 |
|
2017 |
|||
|
Cost of revenue |
|
$ |
290 |
|
$ |
190 |
|
$ |
112 |
|
Research and development |
|
|
2,119 |
|
|
1,203 |
|
|
1,172 |
|
Selling, general and administrative |
|
|
3,288 |
|
|
1,815 |
|
|
2,218 |
|
Total |
|
$ |
5,697 |
|
$ |
3,208 |
|
$ |
3,502 |
Stock-based compensation expense capitalized to inventories was not material during the years ended December 31, 2019, 2018 and 2017.
We did not realize any income tax benefit from stock option exercises in any of the periods presented due to recurring losses and valuation allowances.
As of December 31, 2019, the total unrecognized compensation cost related to stock options, net of estimated forfeitures, was approximately $2.2 million, and this amount is expected to be recognized over a weighted-average period of approximately 2.1 years.
As of December 31, 2019, the total unrecognized compensation cost related to RSUs and ESPP was $6.7 million and $44,000, respectively, and these amounts are expected to be recognized over 2.2 years and 0.2 years, respectively.
Note 12. Income Taxes.
The components of our income (loss) before provision for (benefit from) income taxes are as follows (in thousands):
|
|
|
Year Ended December 31, |
|||||||
|
|
|
2019 |
|
2018 |
|
2017 |
|||
|
United States |
|
$ |
(28,736) |
|
$ |
(23,170) |
|
$ |
(5,974) |
|
Foreign |
|
|
2,064 |
|
|
1,651 |
|
|
387 |
|
Loss before provision for (benefit from) income taxes |
|
$ |
(26,672) |
|
$ |
(21,519) |
|
$ |
(5,587) |
97
The provision for (benefit from) income taxes consisted of the following (in thousands):
|
|
|
Year Ended December 31, |
|||||||
|
|
|
2019 |
|
2018 |
|
2017 |
|||
|
Current: |
|
|
|
|
|
|
|
|
|
|
Federal |
|
$ |
1 |
|
$ |
1 |
|
$ |
— |
|
State |
|
|
13 |
|
|
12 |
|
|
3 |
|
Foreign |
|
|
513 |
|
|
92 |
|
|
98 |
|
Total current provision for (benefit from) income taxes |
|
|
527 |
|
|
105 |
|
|
101 |
|
Deferred: |
|
|
|
|
|
|
|
|
|
|
Federal |
|
|
— |
|
|
— |
|
|
— |
|
State |
|
|
— |
|
|
— |
|
|
— |
|
Foreign |
|
|
(343) |
|
|
(184) |
|
|
— |
|
Total deferred provision for (benefit from) income taxes |
|
|
(343) |
|
|
(184) |
|
|
— |
|
Total |
|
$ |
184 |
|
$ |
(79) |
|
$ |
101 |
The reconciliation of the federal statutory income tax to our effective tax is as follows (in thousands):
|
|
|
Year Ended December 31, |
|||||||
|
|
|
2019 |
|
2018 |
|
2017 |
|||
|
Federal tax at statutory rate |
|
$ |
(5,601) |
|
$ |
(4,519) |
|
$ |
(1,896) |
|
State taxes - current |
|
|
14 |
|
|
13 |
|
|
— |
|
State taxes - deferred |
|
|
(947) |
|
|
(12,354) |
|
|
(877) |
|
Foreign rate differential |
|
|
25 |
|
|
(199) |
|
|
(46) |
|
Nondeductible expenses |
|
|
83 |
|
|
251 |
|
|
453 |
|
Research and development credit |
|
|
(685) |
|
|
(174) |
|
|
(174) |
|
Stock compensation |
|
|
30 |
|
|
47 |
|
|
218 |
|
Change in federal rate |
|
|
— |
|
|
(2,191) |
|
|
12,231 |
|
Transaction costs |
|
|
— |
|
|
1,615 |
|
|
— |
|
Change in valuation allowance |
|
|
7,265 |
|
|
17,432 |
|
|
(9,808) |
|
Total |
|
$ |
184 |
|
$ |
(79) |
|
$ |
101 |
98
Deferred income taxes reflect the net tax effects of temporary differences between the carrying amounts of assets and liabilities for financial reporting purposes and the amounts used for income tax purposes. Significant components of our deferred tax assets and liabilities are as follows (in thousands):
|
|
|
December 31, |
||||
|
|
|
2019 |
|
2018 |
||
|
Deferred tax assets: |
|
|
|
|
|
|
|
Net operating loss carryforwards |
|
$ |
32,868 |
|
$ |
31,399 |
|
Accruals and reserves |
|
|
1,799 |
|
|
1,528 |
|
Amortization of intangible assets |
|
|
— |
|
|
— |
|
Tax credit carryforwards |
|
|
14,644 |
|
|
13,081 |
|
Depreciation |
|
|
— |
|
|
280 |
|
Deferred revenue |
|
|
27 |
|
|
123 |
|
Lease liability |
|
|
862 |
|
|
— |
|
Other |
|
|
3,275 |
|
|
1,093 |
|
Gross deferred tax assets |
|
|
53,475 |
|
|
47,504 |
|
Valuation allowance |
|
|
(46,350) |
|
|
(43,957) |
|
Total deferred tax assets |
|
|
7,125 |
|
|
3,547 |
|
Deferred tax liabilities: |
|
|
|
|
|
|
|
Fixed assets |
|
|
(85) |
|
|
— |
|
Right-of-use assets |
|
|
(487) |
|
|
— |
|
Convertible notes |
|
|
(4,629) |
|
|
— |
|
Amortization of intangible assets |
|
|
(3,278) |
|
|
(5,282) |
|
Total deferred tax liabilities |
|
|
(8,479) |
|
|
(5,282) |
|
Net deferred tax liability |
|
$ |
(1,354) |
|
$ |
(1,735) |
In accordance with Accounting Standards Codification (“ASC”) 740, Income Taxes, a valuation allowance is provided when it is more likely than not that the deferred tax assets will not be realized. Based on our review of both the positive and negative evidence, which includes our historical operating performance, reported cumulative net losses since inception and difficulty in accurately forecasting its results, we have concluded that it is more likely than not that the we will not be able to realize all of our U.S. deferred tax assets. Therefore, we have established a valuation allowance to offset net deferred tax assets as of December 31, 2019, 2018 and 2017 due to the uncertainty of realizing future tax benefits from our net operating loss (“NOL”) carryforwards and other deferred tax assets. The net change in the total valuation allowance for the years ended December 31, 2019, 2018, and 2017 was an increase of $2.4 million, an increase of $17.4 million and a decrease of $9.8 million.
As of December 31, 2019, we had federal and state NOL carryforwards of $123.0 million and $97.2 million available to offset future taxable income. The federal NOL carryforwards will expire at various dates beginning in 2027, if not utilized. The state NOL carryforward will expire at various dates beginning in 2019, if not utilized. In addition, as of December 31, 2019, we had federal and state research and development tax credit carryforwards of $5.6 million and $23.3 million. The federal research and development credit carryforwards will expire beginning in 2027 if not utilized. The state research and development tax credit carryforwards do not expire.
Utilization of NOL carryforwards and credits may be subject to substantial annual limitation due to the ownership change limitations provided by the Internal Revenue Code of 1986, as amended and similar state provisions. The annual limitation may result in the expiration of NOLs and credits before utilization. The acquired tax attributes of Echelon have been written down by the ownership change limitations.
ASC 740‑10 clarifies the accounting for uncertainties in income taxes by prescribing guidance for the recognition, de-recognition and measurement in our financial statements of income tax positions taken in previously filed tax returns or tax positions expected to be taken in tax returns, including a decision whether to file or not to file in a
99
particular jurisdiction. ASC 740‑10 requires the disclosure of any liability created for unrecognized tax benefits. The application of ASC 740‑10 may also affect the tax bases of assets and liabilities and therefore may change or create deferred tax liabilities or assets.
A reconciliation of the beginning and ending amount of unrecognized tax benefits is as follows (in thousands):
|
Balance as of December 31, 2016 |
|
$ |
3,590 |
|
Tax positions related to the current year: |
|
|
|
|
Additions |
|
|
665 |
|
Tax positions related to the prior year: |
|
|
|
|
Reductions |
|
|
(8) |
|
Balance as of December 31, 2017 |
|
|
4,247 |
|
Tax positions related to the current year: |
|
|
|
|
Additions |
|
|
459 |
|
Echelon acquisition |
|
|
5,938 |
|
Tax positions related to the prior year: |
|
|
|
|
Reductions |
|
|
(8) |
|
Balance as of December 31, 2018 |
|
|
10,636 |
|
Tax positions related to the current year: |
|
|
|
|
Additions |
|
|
1,751 |
|
Tax positions related to the prior year: |
|
|
|
|
Reductions |
|
|
(72) |
|
Balance as of December 31, 2019 |
|
$ |
12,315 |
Our total amounts of unrecognized tax benefits that, if recognized, would affect our tax rate are $266,000 and $361,000 as of December 31, 2019 and 2018, respectively.
While it is often difficult to predict the final outcome of any particular uncertain tax position, we do not believe it is reasonably possible that the total amount of unrecognized tax benefit as of December 31, 2019 will materially change in the next twelve months.
Our policy is to classify interest and penalties associated with unrecognized tax positions, if any, as components of our income tax provision. Interest and penalties were not significant during the year ended December 31, 2019.
We file federal, state and foreign income tax returns in jurisdictions with varying statutes of limitations. Due to our net operating loss and credit carryforwards, our income tax returns generally remain subject to examination by federal, state and international authorities.
In December 2017, the Tax Cuts and Jobs Act (the “2017 Tax Act”) was enacted. The 2017 Tax Act includes a number of changes to existing U.S. tax laws that impact us, most notably a reduction of the U.S. corporate income tax rate from 35 percent to 21 percent for tax years beginning after December 31, 2017. We measure deferred tax assets and liabilities using enacted tax rates that will apply in the years in which the temporary differences are expected to be recovered or paid. Accordingly, our deferred tax assets and liabilities were remeasured to reflect the reduction in the U.S. corporate income tax rate from 35 percent to 21 percent, resulting in a $12.2 million decrease in net deferred tax assets for the year ended December 31, 2017 and a corresponding $12.2 million decrease in the valuation allowance as of December 31, 2017.
On December 22, 2017, Staff Accounting Bulletin No. 118 ("SAB 118") was issued to address the application of U.S. GAAP in situations when a registrant does not have the necessary information available, prepared, or analyzed (including computations) in reasonable detail to complete the accounting for certain income tax effects of the 2017 Tax Act. In accordance with SAB 118, we had determined that the provisional amount related to the mandatory deemed
100
repatriation of deferred foreign income was $0.2 million based on cumulative foreign earnings of $0.8 million. In the fourth quarter of 2018 the calculation of the mandatory deemed repatriation of deferred foreign income was finalized, and the change to the original estimate was immaterial.
In January 2018, the FASB released guidance on the accounting for tax on the global intangible low-taxed income ("GILTI") provisions of the 2017 Tax Act. The GILTI provisions impose a tax on foreign income in excess of a deemed return on tangible assets of foreign corporations. The guidance indicates that either accounting for deferred taxes related to GILTI inclusions or to treat any taxes on GILTI inclusions as period cost are both acceptable methods subject to an accounting policy election. Effective the first quarter of 2018, we elected to treat any potential GILTI inclusions as a period cost as we did not have a material impact from GILTI inclusions.
Note 13. Net Loss Per Share.
The following outstanding common stock equivalents were excluded from the computation of diluted net loss per share for the periods presented because including them would have been antidilutive:
|
|
|
|
Year Ended December 31, |
||||
|
|
|
|
2019 |
|
2018 |
|
2017 |
|
Stock options |
|
|
1,929,391 |
|
1,865,415 |
|
1,560,453 |
|
Restricted stock units |
|
|
1,451,507 |
|
1,154,980 |
|
509,894 |
|
Common stock warrants |
|
|
1,165,282 |
|
1,239,423 |
|
389,423 |
|
Shares from the convertible senior notes |
|
|
6,705,819 |
|
— |
|
— |
|
|
|
|
11,251,999 |
|
4,259,818 |
|
2,459,770 |
Note 14. Related Party Transactions.
The Company purchases certain wafers from Altis Semiconductor S.N.C., which was acquired by X-FAB Silicon Foundries in 2016, who is a stockholder of the Company. There were no payments made during the year ended December 31, 2019 and 2018 and total payments made during the year ended December 31, 2017 were $200,000. As of December 31, 2019 and 2018, there were no invoices included within accounts payable on the consolidated balance sheets.
On July 27, 2019, Susan Uthayakumar, the president of Schneider Electric, Canada joined the Company’s board of directors. The Company, through Echelon, sells Embedded Systems products to Schneider Electric. From September 14, 2018 (the date on which the Company acquired 100% of the issued capital of Echelon) and through the period ending December 31, 2019, the Company has recognized revenues of approximately $0.6 million from Schneider Electric. As of December 31, 2019 we had approximately $7,000 of outstanding accounts receivable with Schneider Electric.
Note 15. Selected Unaudited Quarterly Financial Data.
The following tables show a summary of the Company’s unaudited quarterly financial information:
|
|
|
Three Months Ended |
||||||||||
|
|
|
December 31, |
|
September 30, |
|
June 30, |
|
March 31, |
||||
|
|
|
2019 |
|
2019 |
|
2019 |
|
2019 |
||||
|
Revenue, net |
|
$ |
27,870 |
|
$ |
32,028 |
|
$ |
30,155 |
|
$ |
28,113 |
|
Gross profit |
|
$ |
12,792 |
|
$ |
16,247 |
|
$ |
14,446 |
|
$ |
13,220 |
|
Net loss |
|
$ |
(7,918) |
|
$ |
(7,568) |
|
$ |
(4,310) |
|
$ |
(7,060) |
|
Net loss per share - Basic and diluted |
|
$ |
(0.26) |
|
$ |
(0.25) |
|
$ |
(0.14) |
|
$ |
(0.24) |
101
|
|
|
Three Months Ended |
||||||||||
|
|
|
December 31, |
|
September 30, |
|
June 30, |
|
March 31, |
||||
|
|
|
2018 |
|
2018 |
|
2018 |
|
2018 |
||||
|
Revenue, net |
|
$ |
28,078 |
|
$ |
21,927 |
|
$ |
18,183 |
|
$ |
15,302 |
|
Gross profit |
|
$ |
11,534 |
|
$ |
9,583 |
|
$ |
7,764 |
|
$ |
7,180 |
|
Net loss |
|
$ |
(6,883) |
|
$ |
(8,397) |
|
$ |
(5,058) |
|
$ |
(1,102) |
|
Net loss per share - Basic and diluted |
|
$ |
(0.23) |
|
$ |
(0.30) |
|
$ |
(0.24) |
|
$ |
(0.05) |
Note 16. Restructuring
During 2019, the Company made the decision to close the lighting business which was acquired as part of the Echelon acquisition in September 2018. The lighting disposal liabilities, expected to be resolved in the next 12 months, include accrued costs for certain estimated warranty expenses, employee severance, additional inventory write-downs, additional bad debts, and additional materials at our subcontractors which have yet to be delivered. The Company recorded a restructuring expense of $1.7 million during the year ended December 31, 2019.
Note 17. Subsequent Event
On February 20, 2020, the Company, Dialog Semiconductor plc, a company incorporated in England and Wales (“ Parent ”), and Azara Acquisition Corp. (“ Merger Sub ”), a Delaware corporation and a wholly owned direct or indirect subsidiary of Parent (“ Merger Sub ”), entered into an Agreement and Plan of Merger (the“ Merger Agreement ”). The Board of Directors of the Company has unanimously determined that the Merger is advisable and fair to, and in the best interests of, the Company and its stockholders, and unanimously recommended the adoption of the Merger Agreement by the holders of the Company’s common stock (the “ Shares ”).
Pursuant to the terms of, and subject to the conditions specified in, the Merger Agreement, Merger Sub will merge with and into the Company, and the Company will become a wholly owned direct or indirect subsidiary of Parent (the “ Merger ”). If the Merger is consummated, each Share outstanding as of immediately prior to the effective time of the Merger (other than (i) shares held, directly or indirectly, by any wholly owned subsidiary of the Company, (ii) shares held by the Company (or held in the Company’s treasury) or held, directly or indirectly by Parent, Merger Sub or any other wholly owned subsidiary of Parent and (iii) stockholders of the Company who are entitled to and who properly exercise appraisal rights under Delaware law) will be converted into the right to receive $12.55 in cash, without interest and subject to any required tax withholding.
The consummation of the Merger is subject to the satisfaction or waiver of customary closing conditions, including, among other things, (i) the adoption of the Merger Agreement by the holders of a majority of the Company’s Shares outstanding on the record date; ; (ii) the expiration or termination of the waiting period under the Hart-Scott-Rodino Antitrust Improvements Act of 1976, as amended without the imposition of a Burdensome Condition (as defined in the Merger Agreement); (iii) obtainment of CFIUS Approval (as defined in the Merger Agreement); (iv) the absence of any order or other legal restraint or injunction preventing the consummation of the Merger and the absence of any law making the consummation of the Merger illegal, in any case, by any court or governmental entity having jurisdiction over the parties to the Merger Agreement; (v) the absence of certain legal proceedings brought by certain governmental entities relating to the Merger; (vi) the continued accuracy of the Company’s representations and warranties, subject to specified materiality qualifications; (vii) the performance of the Company’s obligations and covenants under the Merger Agreement (to be performed at or prior to the consummation of the Merger) in all material respects and (vii) the absence of a Material Adverse Effect (as defined in the Merger Agreement). The transaction is not subject to a financing condition. The dates for the closing the Merger and for the Company’s special meeting of stockholders to vote on the adoption of the Merger Agreement have not yet been determined.
The Company has made customary representations and warranties in the Merger Agreement and has agreed to customary covenants, including (i) subject to certain limitations set forth in the Merger Agreement, to conduct the
102
business and operations of the Company and its subsidiaries, in all material respects, in the ordinary course and in accordance with past practices prior to the consummation of the Merger and (ii) to not engage in certain specified transactions or activities prior to the consummation of the Merger without Parent’s prior written consent. In addition, the Company has agreed (i) not to solicit, initiate, knowingly encourage, or knowingly facilitate any alternative acquisition proposals or acquisition inquiries or take any action that could reasonably be expected to lead to an acquisition proposal or acquisition inquiry; (ii) not to furnish or otherwise provide access to any information regarding the Company or its subsidiaries to any person or entity in connection with or in response to an acquisition proposal or acquisition inquiry; (iii) not to engage in discussions or negotiations with any person or entity with respect to any acquisition proposal or acquisition inquiry; (iv) not to approve, endorse or recommend any acquisition proposal; and (v) not to enter into any letter of intent, memorandum of understanding, agreement in principle or similar document or any contract constituting or relating directly or indirectly to, or that contemplates or is intended or could reasonably be expected to result directly or indirectly in, an acquisition transaction, subject to customary exceptions in the exercise of the Board’s fiduciary duties. In addition, the Company has agreed to file a proxy statement and cause a special stockholders meeting to be held regarding the adoption of the Merger Agreement; and subject to certain customary exceptions, that the Board will unanimously recommend that the stockholders of the Company approve the adoption of the Merger Agreement and to not withdraw or modify that recommendation.
The Merger Agreement contains customary termination rights for the parties, including the right to terminate the Merger Agreement if the Merger has not been consummated at or prior to 11:59 p.m. (California time) on August 20, 2020 (or, if so extended by either party in accordance with the terms of the Merger Agreement, November 20, 2020) (the “ End Date ”). The Merger Agreement provides that the Company will be required to pay Parent a termination fee of $15.76 million if the Merger Agreement is terminated under certain circumstances, including by the Company to accept a Superior Offer (as defined in the Merger Agreement) and enter into a definitive agreement providing for consummation of the transaction contemplated by such Superior Offer. The Merger Agreement also provides that Parent will be required to pay to the Company a termination fee of $15.76 million if the Merger is not consummated due to a failure to obtain CFIUS Approval prior to the End Date.
ITEM 9. CHANGES IN AND DISAGREEMENTS WITH ACCOUNTANTS ON ACCOUNTING AND FINANCIAL DISCLOSURE
None.
ITEM 9A. CONTROLS AND PROCEDURES
Disclosure Controls and Procedures
We maintain “disclosure controls and procedures,” as such term is defined in Rule 13a‑15(e) under the Securities Exchange Act of 1934 (the “Exchange Act”), that are designed to ensure that information required to be disclosed by us in reports that we file or submit under the Exchange Act is recorded, processed, summarized, and reported within the time periods specified in Securities and Exchange Commission rules and forms, and that such information is accumulated and communicated to our management, including our Chief Executive Officer (“CEO”) and Chief Financial Officer (“CFO”), as appropriate, to allow timely decisions regarding required disclosure.
Our management is responsible for establishing and maintaining our disclosure controls and procedures. Under the supervision and with the participation of our management, including our CEO and CFO, we conducted an evaluation of the effectiveness of our disclosure controls and procedures as of December 31, 2019. Based on this evaluation, our CEO and CFO concluded that our disclosure controls and procedures were effective as of December 31, 2019.
Management’s Report on Internal Control over Financial Reporting
Our management is responsible for establishing and maintaining adequate internal control over financial reporting, as such term is defined in Rule 13a‑15(f) of the Exchange Act. Under the supervision and with the participation of the CEO and CFO, our management conducted an assessment of the effectiveness of internal control
103
over financial reporting based upon the framework in “Internal Control — Integrated Framework (2013)” issued by the Committee of Sponsoring Organizations of the Treadway Commission. Based on that assessment, our management concluded that the Company’s internal control over financial reporting was effective as of December 31, 2019 to provide reasonable assurance regarding the reliability of financial reporting and the preparation of financial statements in accordance with U.S. GAAP.
Changes in Internal Control over Financial Reporting
As required by Rule 13a‑15(d) of the Exchange Act, our management, including our CEO and CFO, conducted an evaluation of our “internal control over financial reporting” as defined in Exchange Act Rule 13a‑15(f) to determine whether any changes in our internal controls over financial reporting occurred during the three months ended December 31, 2019 that materially affected, or are reasonably likely to materially affect, our internal control over financial reporting. Based on that evaluation, other than as described above, there have been no such changes during the three months ended December 31, 2019.
None
104
Item 10. Directors, Executive Officers and Corporate Governance
The information required by this item is incorporated herein by reference to information contained in the Proxy Statement for our 2020 Annual Meeting of Stockholders.
Item 11. Executive Compensation
The information required by this item is incorporated herein by reference to information contained in the Proxy Statement for our 2020 Annual Meeting of Stockholders.
Item 12. Security Ownership of Certain Beneficial Owners and Management and Related Stockholder Matters
The information required by this item is incorporated herein by reference to information contained in the Proxy Statement for our 2020 Annual Meeting of Stockholders.
Item 13. Certain Relationships and Related Transactions, and Director Independence
The information required by this item is incorporated herein by reference to information contained in the Proxy Statement for our 2020 Annual Meeting of Stockholders.
Item 14. Principal Accountant Fees and Services
The information required by this item is incorporated herein by reference to information contained in the Proxy Statement for our 2020 Annual Meeting of Stockholders.
ITEM 15. EXHIBITS AND FINANCIAL STATEMENT SCHEDULES
We have filed the following documents as a part of this Annual Report on Form 10‑K:
(a) Financial Statements
|
|
Page |
| 62 | |
| 63 | |
| 64 | |
| 65 | |
| 66 | |
| 67 | |
| 68 |
(b) Financial Statement Schedules
All schedules have been omitted because the required information is either not required, not applicable or because the information required is included in the Consolidated Financial Statements or notes thereto.
105
(c) Exhibits
|
Exhibit |
|
|
|
|
|
|
|
Incorporated by Reference |
|
Filed |
||
|
Number |
Description of Exhibit |
Form |
File No. |
Exhibit |
Filing Date |
Herewith |
||||||
|
3.1 |
|
|
S‑1/A |
|
333206940 |
|
3.02 |
|
10/5/2015 |
|
|
|
|
3.2 |
|
|
S‑1/A |
|
333206940 |
|
3.04 |
|
10/5/2015 |
|
|
|
|
4.2 |
|
|
S‑1 |
|
333206940 |
|
4.01 |
|
9/14/2015 |
|
|
|
|
|
|
|
|
|
|
|
|
|
|
|
|
|
|
4.3 |
|
|
8-K |
|
001-37582 |
|
4.1 |
|
9/24/2019 |
|
|
|
|
|
|
|
|
|
|
|
|
|
|
|
|
|
|
4.4 |
|
|
|
|
|
|
|
|
|
|
X |
|
|
|
|
|
|
|
|
|
|
|
|
|
|
|
|
10.1+ |
|
|
S‑1/A |
|
333206940 |
|
10.01 |
|
10/5/2015 |
|
|
|
|
10.2+ |
|
|
S‑1 |
|
333206940 |
|
10.02 |
|
9/14/2015 |
|
|
|
|
10.3+ |
|
|
S‑1/A |
|
333206940 |
|
10.03 |
|
10/5/2015 |
|
|
|
|
10.4+ |
|
|
S‑1/A |
|
333206940 |
|
10.04 |
|
10/5/2015 |
|
|
|
|
10.5+ |
|
|
S‑1 |
|
333206940 |
|
10.08 |
|
9/14/2015 |
|
|
|
|
10.6+ |
|
Offer Letter, dated May 30, 2013, by and between the Registrant and Ron Shelton. |
|
S‑1 |
|
333206940 |
|
10.09 |
|
9/14/2015 |
|
|
|
10.7+ |
|
Offer Letter, dated August 28, 2015, by and between the Registrant and Gideon Intrater. |
|
10-K |
|
001-37582 |
|
10.7 |
|
3/18/2019 |
|
|
|
10.8 |
|
Lease by and between the Registrant and Peterson Ridge LLC, dated November 2, 2015. |
|
8‑K |
|
00137582 |
|
10.2 |
|
11/6/2015 |
|
|
106
|
Exhibit |
|
|
|
|
|
|
|
Incorporated by Reference |
|
Filed |
||
|
Number |
Description of Exhibit |
Form |
File No. |
Exhibit |
Filing Date |
Herewith |
||||||
|
10.9 |
|
|
10‑Q |
|
00137582 |
|
10.1 |
|
11/14/2016 |
|
|
|
|
10.10 |
|
|
10-K |
|
00137582 |
|
10.10 |
|
3/24/2017 |
|
|
|
|
10.11 |
|
|
S‑1 |
|
333206940 |
|
10.12 |
|
9/14/2015 |
|
|
|
|
10.12 |
|
|
S‑1 |
|
333206940 |
|
10.13 |
|
9/14/2015 |
|
|
|
|
|
|
|
|
|
|
|
|
|
|
|
|
|
|
10.13 |
|
|
8-K |
|
00137582 |
|
10.1 |
|
10/05/2017 |
|
|
|
|
|
|
|
|
|
|
|
|
|
|
|
|
|
|
10.14+ |
|
Form of Principal Officer Change in Control and Severance Agreement |
|
8-K |
|
00137582 |
|
10.1 |
|
8/04/2017 |
|
|
|
|
|
|
|
|
|
|
|
|
|
|
|
|
|
10.15+ |
|
Form of Executive Officer Change in Control and Severance Agreement |
|
10-K |
|
001-37582 |
|
10.15 |
|
3/18/2019 |
|
|
|
|
|
|
|
|
|
|
|
|
|
|
|
|
|
10.16+ |
|
Form of executive officer performance-based restricted stock units award agreement |
|
10‑Q |
|
00137582 |
|
10.3 |
|
5/15/2017 |
|
|
|
|
|
|
|
|
|
|
|
|
|
|
|
|
|
10.17+ |
|
Form of Executive Officer Change in Control and Severance Agreement |
|
10‑K |
|
00137582 |
|
10.15 |
|
3/13/2018 |
|
|
|
|
|
|
|
|
|
|
|
|
|
|
|
|
|
10.18+ |
|
|
10-Q |
|
00137582 |
|
10.1 |
|
5/10/2019 |
|
|
|
|
|
|
|
|
|
|
|
|
|
|
|
|
|
|
10.19+ |
|
|
10-Q |
|
001-37582 |
|
10.2 |
|
5/10/2019 |
|
|
|
|
|
|
|
|
|
|
|
|
|
|
|
|
|
|
10.20 |
|
|
8-K |
|
001-37582 |
|
99.1 |
|
9/24/2019 |
|
|
|
|
|
|
|
|
|
|
|
|
|
|
|
|
|
|
10.21 |
|
|
8-K |
|
001-37582 |
|
99.2 |
|
9/24/2019 |
|
|
|
|
|
|
|
|
|
|
|
|
|
|
|
|
|
107
|
Exhibit |
|
|
|
|
|
|
|
Incorporated by Reference |
|
Filed |
||
|
Number |
Description of Exhibit |
Form |
File No. |
Exhibit |
Filing Date |
Herewith |
||||||
|
23.1 |
|
|
|
|
|
|
|
|
|
|
X |
|
|
|
|
|
|
|
|
|
|
|
|
|
|
|
|
24.1 |
|
|
|
|
|
|
|
|
|
|
X |
|
|
|
|
|
|
|
|
|
|
|
|
|
|
|
|
31.1 |
|
|
|
|
|
|
|
|
|
|
X |
|
|
|
|
|
|
|
|
|
|
|
|
|
|
|
|
31.2 |
|
|
|
|
|
|
|
|
|
|
X |
|
|
|
|
|
|
|
|
|
|
|
|
|
|
|
|
32.1* |
|
|
|
|
|
|
|
|
|
|
X |
|
|
|
|
|
|
|
|
|
|
|
|
|
|
|
|
32.2* |
|
|
|
|
|
|
|
|
|
|
X |
|
|
|
|
|
|
|
|
|
|
|
|
|
|
|
|
101.INS |
|
XBRL Instance Document. |
|
|
|
|
|
|
|
|
|
X |
|
|
|
|
|
|
|
|
|
|
|
|
|
|
|
101.SCH |
|
XBRL Taxonomy Extension Schema Document. |
|
|
|
|
|
|
|
|
|
X |
|
|
|
|
|
|
|
|
|
|
|
|
|
|
|
101.CAL |
|
XBRL Taxonomy Extension Calculation Linkbase Document. |
|
|
|
|
|
|
|
|
|
X |
|
|
|
|
|
|
|
|
|
|
|
|
|
|
|
101.DEF |
|
XBRL Taxonomy Extension Definition Linkbase Document. |
|
|
|
|
|
|
|
|
|
X |
|
|
|
|
|
|
|
|
|
|
|
|
|
|
|
101.LAB |
|
XBRL Taxonomy Extension Label Linkbase Document. |
|
|
|
|
|
|
|
|
|
X |
|
|
|
|
|
|
|
|
|
|
|
|
|
|
|
101.PRE |
|
XBRL Taxonomy Extension Presentation Linkbase Document. |
|
|
|
|
|
|
|
|
|
X |
+ Indicates a management contract or compensatory plan.
* As contemplated by Securities and Exchange Commission Release No. 33‑8212, these exhibits are furnished with this Annual Report on Form 10‑K and are not deemed filed with the Securities and Exchange Commission and are not incorporated by reference in any filing of Adesto Technologies Corporation under the Securities
108
Act of 1933, or the Securities Exchange Act of 1934, whether made before or after the date hereof and irrespective of any general incorporation language in such filings.
None.
109
SIGNATURES
Pursuant to the requirements of Section 13 or 15(d) of the Securities Exchange Act of 1934, the Registrant has duly caused this Annual Report on Form 10‑K to be signed on its behalf by the undersigned, thereunto duly authorized, in Santa Clara, California, on the 16th day of March 2020.
|
|
ADESTO TECHNOLOGIES CORPORATION |
|
|
|
|
|
|
|
By: |
/s/ Narbeh Derhacobian |
|
|
|
Narbeh Derhacobian |
KNOW ALL PERSONS BY THESE PRESENTS, that each person whose signature appears below hereby constitutes and appoints Narbeh Derhacobian and Ron Shelton, and each of them, as his true and lawful attorneys-in-fact, proxies and agents, each with full power of substitution, for him in any and all capacities, to sign any and all amendments to this Annual Report on Form 10‑K, and to file the same, with all exhibits thereto and other documents in connection therewith, with the Securities and Exchange Commission, granting unto said attorneys-in-fact, proxies and agents full power and authority to do and perform each and every act and thing requisite and necessary to be done in connection therewith, as fully for all intents and purposes as he might or could do in person, hereby ratifying and confirming all that said attorneys-in-fact, proxies and agents, or their or his substitute or substitutes, may lawfully do or cause to be done by virtue hereof.
Pursuant to the requirements of the Securities Exchange Act of 1934, this report has been signed below by the following persons on behalf of the Registrant and in the capacities and on the dates indicated.
|
Signature |
|
Title |
|
Date |
|
/s/ Narbeh Derhacobian |
President, Chief Executive Officer and Director |
March 16, 2020 |
||
|
Narbeh Derhacobian |
(Principal Executive Officer) |
|||
|
/s/ Ron Shelton |
Chief Financial Officer |
March 16, 2020 |
||
|
Ron Shelton |
(Principal Accounting and Financial Officer) |
|||
|
/s/ Nelson Chan |
Director |
March 16, 2020 |
||
|
Nelson Chan |
||||
|
/s/ Herve Fages |
Director |
March 16, 2020 |
||
|
Herve Fages |
||||
|
/s/ Francis Lee |
Director |
March 16, 2020 |
||
|
Francis Lee |
||||
|
/s/ Kevin Palatnik |
Director |
March 16, 2020 |
||
|
Kevin Palatnik |
||||
|
/s/ Susan Uthayakumar |
Director |
March 16, 2020 |
||
|
Susan Uthayakumar |
110