Attached files
| file | filename |
|---|---|
| 8-K - 8-K, CHCO CHICAGO INVESTOR PRESENTATION - CITY HOLDING CO | form8-kchiinvestor32016.htm |

Stephens, Inc. Chicago & Milwaukee March 17, 2016

Forward looking statements • This presentation contains certain forward-looking statements that are included pursuant to the safe harbor provisions of the Private Securities Litigation Reform Act of 1995. Such information involves risks and uncertainties that could result in the Company's actual results differing from those projected in the forward-looking statements. Important factors that could cause actual results to differ materially from those discussed in such forward-looking statements include, but are not limited to, (1) the Company may incur additional loan loss provision due to negative credit quality trends in the future that may lead to a deterioration of asset quality; (2) the Company may incur increased charge- offs in the future; (3) the Company could have adverse legal actions of a material nature; (4) the Company may face competitive loss of customers; (5) the Company may be unable to manage its expense levels; (6) the Company may have difficulty retaining key employees; (7) changes in the interest rate environment may have results on the Company’s operations materially different from those anticipated by the Company’s market risk management functions; (8) changes in general economic conditions and increased competition could adversely affect the Company’s operating results; (9) changes in regulations and government policies affecting bank holding companies and their subsidiaries, including changes in monetary policies, could negatively impact the Company’s operating results; (10) the Company may experience difficulties growing loan and deposit balances; (11) the current economic environment poses significant challenges for us and could adversely affect our financial condition and results of operations; (12) the effects of the Dodd-Frank Wall Street Reform and Consumer Protection Act (the “Dodd- Frank Act”) and the regulations promulgated and to be promulgated thereunder, which may subject the Company and its subsidiaries to a variety of new and more stringent legal and regulatory requirements which adversely affect their respective business; and (13) the impact of new minimum capital thresholds established as a part of the implementation of Basel III capital reforms; and (14) other risk factors relating to the banking industry or the Company as detailed from time to time in the Company’s reports filed with the Securities and Exchange Commission, including those risk factors included in the disclosures under the heading “ITEM 1A Risk Factors” of the Company’s Annual Report on Form 10-K for the fiscal year ended December 31, 2015. Forward-looking statements made herein reflect management's expectations as of the date such statements are made. Such information is provided to assist stockholders and potential investors in understanding current and anticipated financial operations of the Company and is included pursuant to the safe harbor provisions of the Private Securities Litigation Reform Act of 1995. The Company undertakes no obligation to update any forward-looking statement to reflect events or circumstances that arise after the date such statements are made. 2

• Total Assets $3.7 bil • Branches 85 • FTE 853 • Market Cap $711 mil • Institutional Ownership 61% • Average Daily Volume $3.6 mil Date: March 4, 2016 3
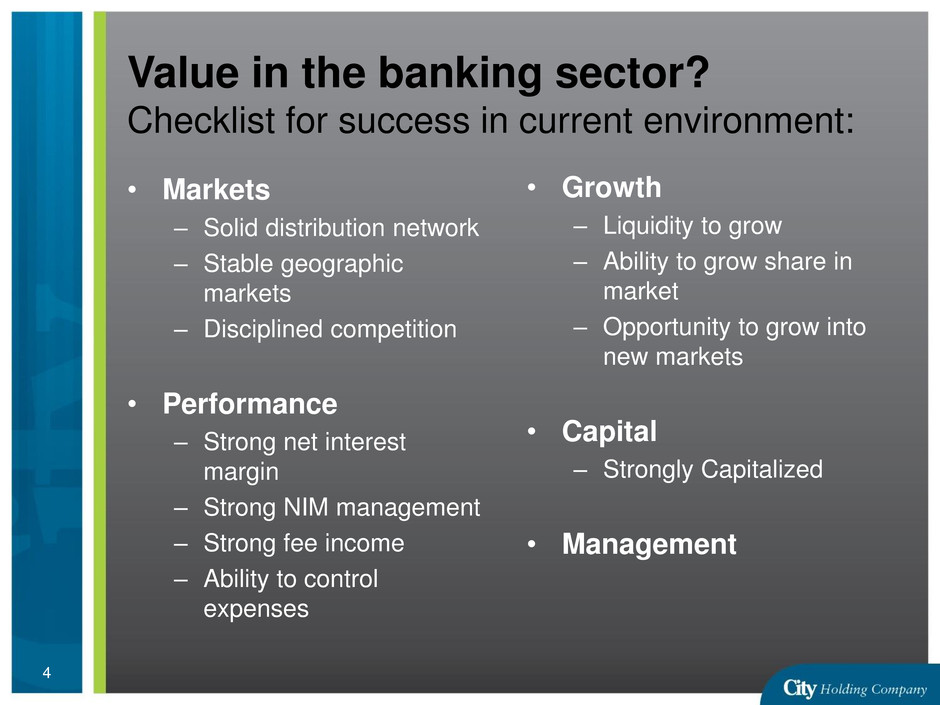
Value in the banking sector? Checklist for success in current environment: • Markets – Solid distribution network – Stable geographic markets – Disciplined competition • Performance – Strong net interest margin – Strong NIM management – Strong fee income – Ability to control expenses • Growth – Liquidity to grow – Ability to grow share in market – Opportunity to grow into new markets • Capital – Strongly Capitalized • Management 4

City Holding Company • Markets: Operates an extremely strong retail/commercial franchise in stable markets with disciplined competition • Asset Quality: Strong compared to peers and City’s management has recognized and dealt with issues • Performance: Has consistently outperformed peers with respect to earnings, capital, and liquidity • Growth: Growing and succeeding in slow- growth stable markets with targeted expansion into new markets 5

City National Markets 1st Branch Share & 2nd Deposit Share (10%) In Charleston MSA/Huntington MSA; $10.5 Billion 1st Branch Share & 31% Deposit Share $2.0 Billion 2nd Branch Share & 2nd Deposit Share (15%) in Staunton MSA $1.4 Billion 2nd Branch Share & 6% Deposit Share in Winchester VA & Morgan, Berkeley & Jefferson Co. WV $4.3 Billion 6

Market Position Market Population Deposits ($mm) Deposit Share National/ Regional Banks Deposit Share Branches Branch Share Branch Rank Beckley/Lewisburg WV 175,000 $703 29% 24% 16 25% 1 Huntington/Ashland MSA 365,000 575 11% 27% 19 15% 1 Charleston MSA 240,000 523 10% 60% 11 15% 1 Winchester/Martinsburg 351,000 344 6% 39% 12 9% 3 Valley Region 205,000 259 12% 31% 8 14% 3 Lexington Ky Region 494,000 145 2% 42% 3 2% 17 7 Note: Green highlight indicates market expansion as a result of acquisitions.

Bank Director ranked City: CHCO: A High Performing Bank 8 • #3 of largest 150 US banks in 2010 • #8 among US Banks with assets between $1B - $5B in 2011 • #19 among US Banks with assets between $1B - $5B in 2012 • #5 among US Banks with assets between $1B - $5B in 2013 • Named City 10th on the “Nifty Fifty” for best use of capital in 2013 & 2014

ROA -1.50% -1.00% -0.50% 0.00% 0.50% 1.00% 1.50% 2.00% 2008 2009 2010 2011 2012 2013 2014 2015 CHCO W/O Merger Costs $1B - $5B Peer Data as of December 31, 2015 9

ROTCE -10.0% -5.0% 0.0% 5.0% 10.0% 15.0% 20.0% 2008 2009 2010 2011 2012 2013 2014 2014 CHCO W/O Merger Costs $1B - $5B Peer Data as of December 31, 2015 10

The key to City’s success: an enviable deposit franchise • Branches 85 • Average Deposits per Branch $36 MM • Average Households per Branch 1,900 • Average Deposit Share 12.9% • Average Household Share* 20% * - Excludes Coastal & Lexington-Fayette Regions 11

Low cost and stable funding: 11% 17% 18% 10% 11% 18% 10% 4% 0.4% 1% 0.4% Equity Non Interest DDA Interest DDA Savings MMS CDs Jumbos Customer Repos FHLB Other Trust Preferred Data: December 31, 2015 12

Reported NIM and NIM Excluding Acquisition Accretion, Interest rate floors, and PSL’s: 3.48% 3.00% 3.50% 4.00% 4.50% 5.00% 2006 2007 2008 2009 2010 2011 2012 2013 2014 2015 $1 to $5B Peer CHCO CHCO excluding PSLs, floors & accretion Peer Data as of December 31, 2015 March 2008 thru June 2011: NIM supported by Interest Rate Floors 2013 & 2014: NIM supported by Accretion from acquisitions 13
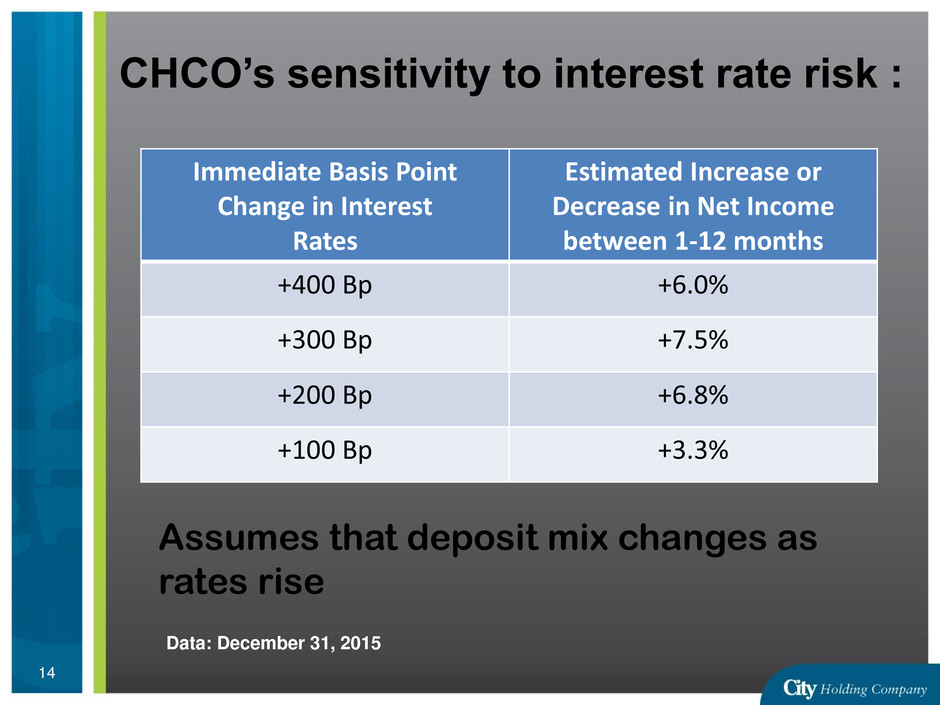
CHCO’s sensitivity to interest rate risk : Immediate Basis Point Change in Interest Rates Estimated Increase or Decrease in Net Income between 1-12 months +400 Bp +6.0% +300 Bp +7.5% +200 Bp +6.8% +100 Bp +3.3% Data: December 31, 2015 Assumes that deposit mix changes as rates rise 14

Strong deposit franchise drives top decile non-interest revenue: 31.7% 68.2% City Holding Company Non Interest Income Net Interest Income *As of December 31, 2015. Non-interest income excludes investment gains/(losses) & gain from sale of insurance division. Sample of 278 reporting publicly traded banks and thrifts with assets between $1 and $10 billion as of December 31, 2015, excluding investment gains/(losses) 22.8% 77.2% Peer Group Non Interest Income Net Interest Income 15

Non-interest income is branch driven: 2009 2010 2011 2012 2013 2014 2015 Bankcard Revenues $9.0 $9.9 $11.1 $12.4 $13.5 $15.1 $15.9 Service Charges $36.0 $30.1 $27.0 $26.3 $27.6 $26.6 $26.3 Insurance $5.6 $5.5 $5.9 $6.1 $5.8 $6.0 SOLD Investment Management $2.3 $2.8 $3.1 $3.8 $4.0 $4.6 $5.1 BOLI $3.3 $3.4 $3.2 $3.0 $3.4 $3.1 $3.4 16

CityInsurance • Sold in January 2015 at after-tax gain of $5.8MM • CityInsurance had revenues of $6.0 million and expenses of $4.2 million during 2014 • City’s decision to sell was due to rapidly consolidating insurance industry. • Retrospectively, the timing was excellent – the downturn in the coal business likely would have significantly hurt profitability 17
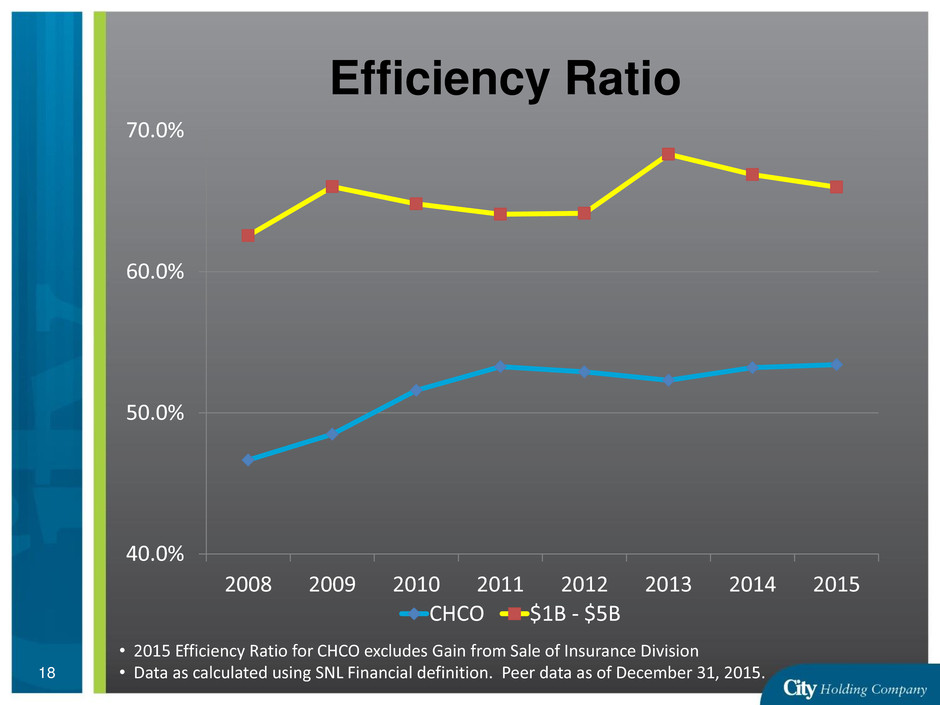
Efficiency Ratio 40.0% 50.0% 60.0% 70.0% 2008 2009 2010 2011 2012 2013 2014 2015 CHCO $1B - $5B • 2015 Efficiency Ratio for CHCO excludes Gain from Sale of Insurance Division • Data as calculated using SNL Financial definition. Peer data as of December 31, 2015. 18

Charge-off trends: 0.00% 0.50% 1.00% 1.50% 2.00% 2.50% 3.00% 2008 2009 2010 2011 2012 2013 2014 2015 CHCO Net Charge-off % Industry Source: FDIC, All Insured Depository Institutions Peer data as of September 30, 2015 19

Non-performing assets & OREO 0.00% 0.50% 1.00% 1.50% 2.00% 2.50% 3.00% 3.50% 4.00% 2008 2009 2010 2011 2012 2013 2014 2015 CHCO NPA/Assets Industry Source: FDIC, All Insured Depository Institutions Peer data as of September 30, 2015 20

2015 Charge-offs 21 Net C/O Bp Residential Mortgages $0.945 MM 7 bp Home Equity $0.312 MM 21 bp Commercial & Industrial $4.977MM 300 bp Commercial RE $0.214 MM 2 bp Consumer/OD $0.646 MM 161 bp Total $7.094 MM 25 bp Net Charge-offs in 2015 for C&I loans were primarily related to a single coal-mining equipment customer. City’s total exposure to the Mining Sector at year-end was less than $10 million.

Growth: CHCO is positioned to achieve “reasonable growth” in its core franchise • Commercial • Retail Lending • Trust & Investment Management • Deposits 22

Commercial loan growth: Success achieved due to community bank orientation, strong team, strong underwriting, and strong local economies -4.00% -2.00% 0.00% 2.00% 4.00% 6.00% 8.00% 10.00% 12.00% 14.00% 16.00% 18.00% 2005 2006 2007 2008 2009 2010 2011 2012 2013 2014 2015 Growth percentages exclude acquisitions in 2005, 2012, 2013 & 2015 23

Commercial Loan Growth targeted to new markets Key Loan Markets Percent of Commercial Portfolio Core West Virginia Markets – dating to 1870 52% Virginia/Eastern Panhandle Markets – acquires 2012/13 20% Charlotte LPO – de novo 2006 8% Lexington, KY – acquired 2015 11% Columbus, OH & Pittsburgh PA 9% 24

Retail loan growth Adjustable Rate Mortgages, Home Equity Loans, Installment credit $1,000 $1,100 $1,200 $1,300 $1,400 $1,500 $1,600 Sep-14 Dec-14 Mar-15 Jun-15 Sep-15 Dec-15 Loans $M M Residential Real Estate Home Equity Consumer 25 Growth percentages exclude acquisition in the 4th quarter of 2015

Trust AUM & Revenues: Strong growth AUM CAGR 11.7% and Revenue CAGR 10.2% (Dec 31, 2006-Dec 31, 2015) $- $1,000 $2,000 $3,000 $4,000 $5,000 $6,000 $0 $200 $400 $600 $800 $1,000 2006 2007 2008 2009 2010 2011 2012 2013 2014 2015 R ev e n u e s A UM $M M AUM (MM$) Revenues 26
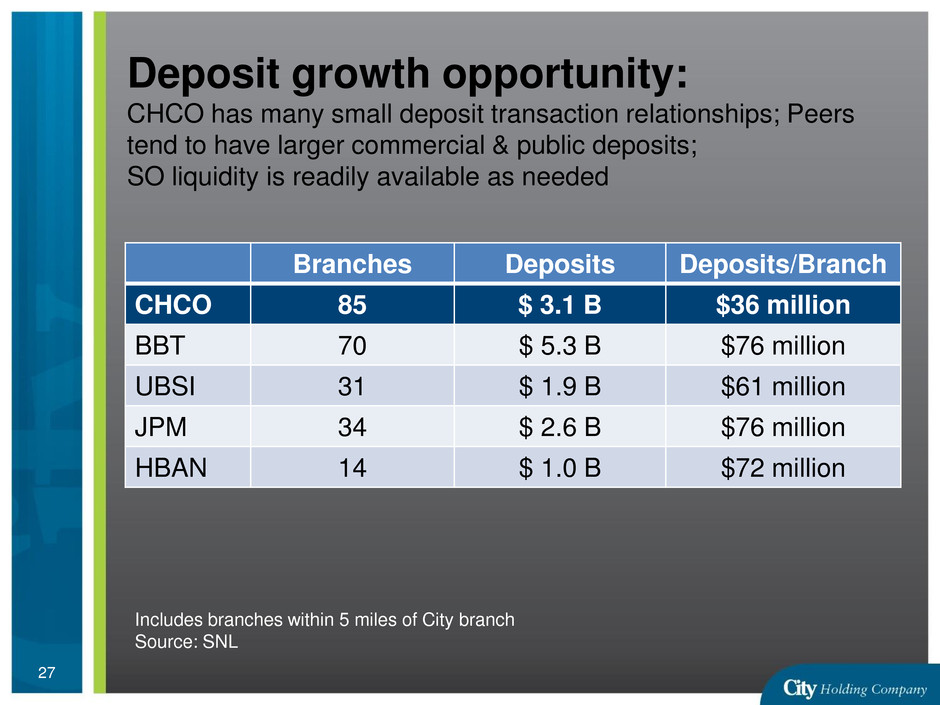
Deposit growth opportunity: CHCO has many small deposit transaction relationships; Peers tend to have larger commercial & public deposits; SO liquidity is readily available as needed Branches Deposits Deposits/Branch CHCO 85 $ 3.1 B $36 million BBT 70 $ 5.3 B $76 million UBSI 31 $ 1.9 B $61 million JPM 34 $ 2.6 B $76 million HBAN 14 $ 1.0 B $72 million Includes branches within 5 miles of City branch Source: SNL 27

Acquisition philosophy: • Opportunities have increased • Actively looking • Size: Generally $100MM to $1B • Historically less acquisitive than peers because City’s strategy is driven by creating shareholder value – not merely size driven • Acquisitions must truly be strategic or meaningfully accretive 28

Acquisition territory: 29
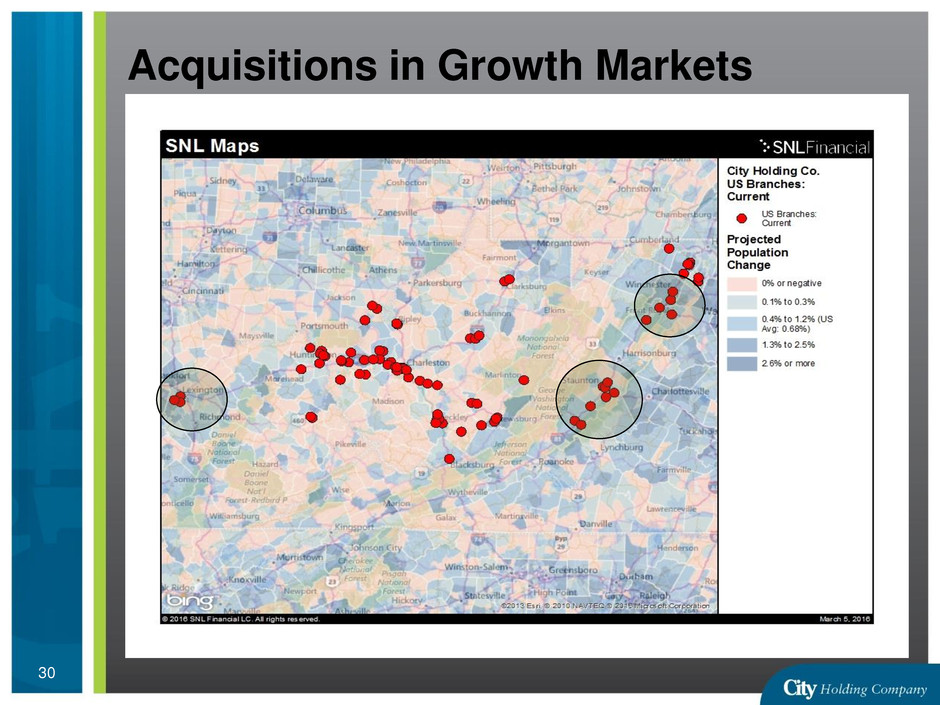
Acquisitions in Growth Markets 30

Virginia Savings Bank • Closed May 31, 2012 • 5 branches in Winchester, VA market • VSB was an underperforming small bank with little market visibility but some great talent • Projected Population growth of 5.0% over 5 yrs • City’s strategy has been increased visibility, significant improvements in retail banking products & facilities, and increased liquidity to provide for retail lending 31

Community Bank • Closed January 10, 2013 • 9 branches in Virginia • Community was a poorly performing bank with significant asset quality problems but good retail distribution and some great talent. • City was a significant shareholder of Community. • Projected Population growth of 3.1% over 5 years in Staunton, VA region • City’s strategy has been to resolve asset quality problems, close underperforming banks, exit unprofitable indirect auto lending business, and provide liquidity to fund retail loans 32
Branches from American Founders Bank • Closed November 6, 2015 • 3 branches in Lexington, KY – $119 million in loans (chosen by City) – $145 million in deposits – 3,100 households – Strong talent • Projected Population growth of 4.3% over 5 years in Lexington-Fayette, KY region, with exceptional demographics in terms of income, education and age distribution • City’s strategy is to provide additional liquidity for retail lending and to allow the commercial team to continue with their success while providing access to capital to make larger loans 33

Facility Enhancements Woodstock, Virginia BEFORE AFTER 34

Facility Enhancements Winchester, Virginia BEFORE AFTER 35
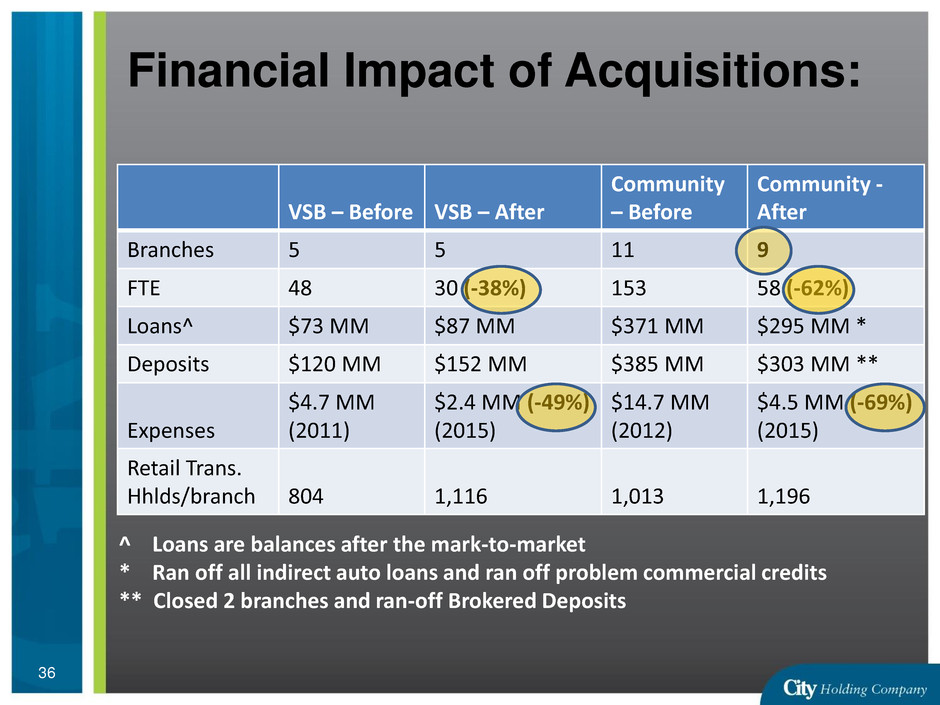
Financial Impact of Acquisitions: VSB – Before VSB – After Community – Before Community - After Branches 5 5 11 9 FTE 48 30 (-38%) 153 58 (-62%) Loans^ $73 MM $87 MM $371 MM $295 MM * Deposits $120 MM $152 MM $385 MM $303 MM ** Expenses $4.7 MM (2011) $2.4 MM (-49%) (2015) $14.7 MM (2012) $4.5 MM (-69%) (2015) Retail Trans. Hhlds/branch 804 1,116 1,013 1,196 ^ Loans are balances after the mark-to-market * Ran off all indirect auto loans and ran off problem commercial credits ** Closed 2 branches and ran-off Brokered Deposits 36

Tangible Common Equity: strong following acquisitions in 2012, 2013 & 2015 6.00% 7.00% 8.00% 9.00% 10.00% 11.00% 2008 2009 2010 2011 2012 2013 2014 2015 37

Share Count: strong capital and high profitability allow aggressive share repurchases 12,000,000 13,000,000 14,000,000 15,000,000 16,000,000 17,000,000 18,000,000 2006 2007 2008 2009 2010 2011 2012 2013 2014 2015 Average Shares Outstanding 38

Cash Dividends/Share Declared & Dividend Payout Ratio 0% 10% 20% 30% 40% 50% 60% 70% 80% 90% $0.00 $0.20 $0.40 $0.60 $0.80 $1.00 $1.20 $1.40 $1.60 $1.80 2 0 0 4 2 0 0 5 2 0 0 6 2 0 0 7 2 0 0 8 2 0 0 9 2 0 1 0 2 0 1 1 2 0 1 2 2 0 1 3 2 0 1 4 2 0 1 5 D ivide n d P ay ou t R at io Ca sh D ivide n d s/ Sh ar e D e cl ar e d Dividends/Share Dividend Payout Ratio 39

An experienced management team TITLE EXPERIENCE AGE JOINED CEO PPLS; CHCO CFO; PHD 53 2001 EVP – Retail PPLS 60 2001 EVP – Commercial One Valley; BB&T, CPA 66 2004 CFO Public Accounting, CPA 50 2005 SVP - Operations CHCO 52 1989 SVP - Branches Cardinal 44 2013 SVP – Branches BB&T 47 2001 SVP – CCO United Bankshares, CPA 42 1998 SVP Consumer Bank One 49 2001 SVP Mortgage United Bankshares 64 2004 SVP Trust City National Bank 61 1985 Treasurer City National Bank 49 1990 Legal Counsel Dinsmore Shohl 40 2010 40
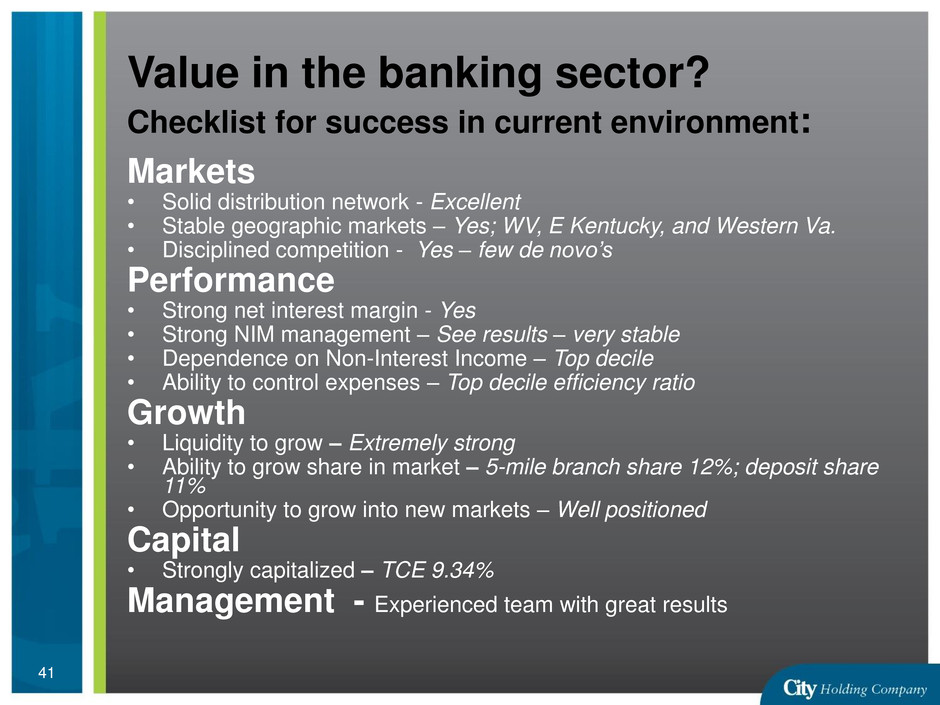
Value in the banking sector? Checklist for success in current environment: Markets • Solid distribution network - Excellent • Stable geographic markets – Yes; WV, E Kentucky, and Western Va. • Disciplined competition - Yes – few de novo’s Performance • Strong net interest margin - Yes • Strong NIM management – See results – very stable • Dependence on Non-Interest Income – Top decile • Ability to control expenses – Top decile efficiency ratio Growth • Liquidity to grow – Extremely strong • Ability to grow share in market – 5-mile branch share 12%; deposit share 11% • Opportunity to grow into new markets – Well positioned Capital • Strongly capitalized – TCE 9.34% Management - Experienced team with great results 41

Industry Challenges in 2015: • Economic Activity & Loan Growth • Mortgage Banking Slowdown • Branch Fees are stagnant • Loan Competition – Terms & Price • Regulatory Compliance • Future Regulatory Agenda 42 Challenges specific to CHCO: • Downturn in Mining

CHCO overcomes challenges thru: • Excellent distribution network • Exceptional Customer Depth driving strong non-interest income • Markets characterized by disciplined competition • Industry leading profitability achieved from strong non-interest income and discipline in managing expenses • Strong liquidity from a strong depository base • Strong capital levels coupled with capital-generating capacity • Well regarded Common stock valued in acquisitions • Limited exposure to coal-based businesses • Increasing exposure to higher growth markets • Sufficient size to easily address regulatory challenges confronting smaller banks • Strong and stable management team 43

Accretion from Acquisitions $0 $2,000 $4,000 $6,000 $8,000 $10,000 $12,000 $14,000 $16,000 2012 2013 2014 2015 2016 2017 2018 Historical Forecasted 44

Growth per share (12/31/10 – 12/31/15): • Loans per share: 8.8% CAGR • Deposits per share: 6.8% CAGR • Non-interest inc per share*: 0.8% CAGR • Expenses per share**: 3.7% CAGR Implication: While CHCO operates in relatively low growth markets, high profitability allows share repurchases, which have driven core earnings despite the economic environment of the last several years *-Excludes gain from Sale of Insurance Division **-Excludes one-time merger expenses 45

CHCO represents good value and stability • Pricing Metrics*: • Price to Book: 168% • Price to Tangible Book: 207% • Price to 2016 Projected Earnings** 13.8x • Dividend Yield 3.7% • Div Payout Ratio** 54% • Tangible Capital/Tangible Assets*** 9.34% • Institutional Ownership 61% * Based on Price of $46.31 (3/04/16) ** Based on analyst estimate of $3.35 for 2016 (average of 4) *** December 31, 2015 46

Average Daily Volume and Short Position in CHCO 0 10 20 30 40 50 60 20,000 30,000 40,000 50,000 60,000 70,000 80,000 90,000 100,000 110,000 Da y s t o Co v e r A v er a ge Dail y V ol u m e Volume Days to cover At February12, 2016: 1,114,763 shares shorted 14,999,420 shares outstanding 47

Questions? 48
