Attached files
| file | filename |
|---|---|
| EX-32.B - EXHIBIT 32.B - CITY HOLDING CO | exhibit32b12-31x2017.htm |
| EX-32.A - EXHIBIT 32.A - CITY HOLDING CO | exhibit32a12-31x2017.htm |
| EX-31.B - EXHIBIT 31.B - CITY HOLDING CO | exhibit31b12-31x2017.htm |
| EX-31.A - EXHIBIT 31.A - CITY HOLDING CO | exhibit31a12-31x2017.htm |
| EX-23 - EXHIBIT 23 - CITY HOLDING CO | exhibit2312-31x2017.htm |
| EX-21 - EXHIBIT 21 - CITY HOLDING CO | exhibit2112-31x17.htm |
UNITED STATES
SECURITIES AND EXCHANGE COMMISSION
Washington, D.C. 20549
FORM 10-K
(Mark One)
[X] Annual Report Pursuant to Section 13 or 15(d) of the Securities Exchange Act of 1934
For The Fiscal Year Ended December 31, 2017
OR
[ ] Transition Report Pursuant to Section 13 or 15(d) of the Securities Exchange Act of 1934
For The Transition Period From ____________To_____________.
Commission File number 0-11733

CITY HOLDING COMPANY
(Exact name of registrant as specified in its charter)
West Virginia | 55-0619957 |
(State or other jurisdiction of incorporation or organization) | (I.R.S. Employer Identification No.) |
25 Gatewater Road | |
Charleston, West Virginia | 25313 |
(Address of principal executive offices) | (Zip Code) |
(304) 769-1100
(Registrant’s telephone number, including area code)
Securities registered pursuant to Section 12(b) of the Act:
Title of Each Class: | Name of Each Exchange on Which Registered: |
Common Stock, $2.50 par value | NASDAQ Global Select Market |
Securities registered pursuant to Section 12(g) of the Act:
None
Indicate by check mark if the registrant is a well-known seasoned issuer, as defined in Rule 405 of the Securities Act:
Yes | [X] | No | [ ] |
Indicate by check mark if the registrant is not required to file reports pursuant to Section 13 or 15(d) of the Act:
Yes | [ ] | No | [ X ] |
Indicate by check mark whether the registrant (1) has filed all reports required to be filed by Section 13 or 15(d) of the Securities Exchange Act of 1934 during the preceding 12 months (or for such shorter period that the registrant was required to file such reports), and (2) has been subject to such filing requirements for the past 90 days.
Yes | [X] | No | [ ] |
Indicate by check mark whether the registrant has submitted electronically and posted on its corporate Web site, if any, every Interactive Data File required to be submitted and posted pursuant to Rule 405 of Regulation S-T (§232.405 of this chapter) during the preceding 12 months (or for such shorter period that the registrant was required to submit and post such files).
Yes | [X] | No | [ ] |
Indicate by check mark if disclosure of delinquent filers pursuant to Item 405 of Regulation S-K (§229.405 of this chapter) is not contained herein, and will not be contained, to the best of the registrant’s knowledge, in definitive proxy or information statements incorporated by reference in Part III of this Form 10-K or any amendment to this Form 10-K. [ ]
Indicate by check mark whether the registrant is a large accelerated filer, an accelerated filer, a non-accelerated filer, or a smaller reporting company. See definition of “large accelerated filer,” “accelerated filer” and “smaller reporting company” in Rule 12b-2 of the Exchange Act. (Check one):
Large accelerated filer [X] | Accelerated filer [ ] |
Non-accelerated filer [ ] | Smaller reporting company [ ] |
Emerging growth company [ ] | |
If an emerging growth company, indicate by check mark if the registrant has elected not to use the extended transition period for complying with any new or revised financial accounting standards provided pursuant to Section 13(a) of the Exchange Act. [ ]
Indicate by check mark whether the registrant is a shell company (as defined in Rule 12b-2 of the Act).
Yes | [ ] | No | [X] |
As of June 30, 2017, the last business day of the registrant’s most recently completed second quarter, the aggregate market value of the shares of common stock held by non-affiliates, based upon the closing price per share of the registrant’s common stock as reported on the Nasdaq Global Select Market, was approximately $989.4 million. (Registrant has assumed that all of its executive officers and directors are affiliates. Such assumption shall not be deemed to be conclusive for any other purpose.)
As of February 27, 2018, there were 15,508,904 shares of the Company’s common stock, $2.50 par value, outstanding.
DOCUMENTS INCORPORATED BY REFERENCE
Portions of the Proxy Statement for the 2018 annual shareholders’ meeting to be held on April 19, 2018 are incorporated by reference into Part III, Items 10, 11, 12, 13, and 14.
FORM 10-K INDEX
PART I | Pages | |
Item 1. | ||
Item 1A. | ||
Item 1B. | ||
Item 2. | ||
Item 3. | ||
Item 4. | ||
PART II | ||
Item 5. | ||
Item 6. | ||
Item 7. | ||
Item 7A. | ||
Item 8. | ||
Item 9. | ||
Item 9A. | ||
Item 9B. | ||
Part III | ||
Item 10. | ||
Item 11. | ||
Item 12. | ||
Item 13. | ||
Item 14. | ||
Part IV | ||
Item 15. | ||
Item 16. | ||
FORWARD-LOOKING STATEMENTS
This Annual Report on Form 10-K contains certain forward-looking statements that are included pursuant to the safe harbor provisions of the Private Securities Litigation Reform Act of 1995. Such information involves risks and uncertainties that could cause the Company’s actual results to differ from those projected in the forward-looking information. Important factors that could cause actual results to differ materially from those discussed in such forward-looking statements include, but are not limited to those set forth in the Company’s Annual Report on Form 10-K under “Risk Factors” and the following: (1) the Company may incur additional loan loss provision due to negative credit quality trends in the future that may lead to a deterioration of asset quality; (2) the Company may incur increased charge-offs in the future; (3) the Company could have adverse legal actions of a material nature; (4) the Company may face competitive loss of customers; (5) the Company may be unable to manage its expense levels; (6) the Company may have difficulty retaining key employees; (7) changes in the interest rate environment may have results on the Company’s operations materially different from those anticipated by the Company’s market risk management functions; (8) changes in general economic conditions and increased competition could adversely affect the Company’s operating results; (9) changes in regulations and government policies affecting bank holding companies and their subsidiaries, including changes in monetary policies, could negatively impact the Company’s operating results; (10) the Company may experience difficulties growing loan and deposit balances; (11) deterioration in the financial condition of the U.S. banking system may impact the valuations of investments the Company has made in the securities of other financial institutions resulting in either actual losses or other than temporary impairments on such securities; (12) the effects of the Wall Street Reform and Consumer Protection Act (the “Dodd-Frank Act”) and the regulations promulgated and to be promulgated thereunder, which may subject the Company and its subsidiaries to a variety of new and more stringent legal and regulatory requirements which adversely affect their respective businesses; (13) the impact of new minimum capital thresholds established as a part of the implementation of Basel III capital reforms; and (14) other risk factors relating to the banking industry. Forward-looking statements made herein reflect management's expectations as of the date such statements are made. Such information is provided to assist stockholders and potential investors in understanding current and anticipated financial operations of the Company and is included pursuant to the safe harbor provisions of the Private Securities Litigation Reform Act of 1995. The Company undertakes no obligation to update any forward-looking statement to reflect events or circumstances that arise after the date such statements are made.
PART I
Item 1.Business
City Holding Company (the “Company” or "City Holding" or the "Parent Company") is a financial holding company headquartered in Charleston, West Virginia. The Company conducts its principal activities through its wholly-owned subsidiary, City National Bank of West Virginia (“City National”). City National provides banking, trust and investment management and other financial solutions through its network of 86 bank branches and 839 full-time equivalent associates located in West Virginia, Virginia, Kentucky and southeastern Ohio. The Company’s business activities are currently limited to one reportable business segment, which is community banking.
On October 16, 2017, the Company announced it will break ground in early 2018 on its new branch office located in Morgantown, West Virginia.

Rendition of the Company's Morgantown branch expected to open in 2018.
The principal products produced and services rendered by City National include:
• | Commercial Banking - City National offers a full range of commercial banking services to corporations and other business customers. Loans are provided for a variety of business purposes, including financing for commercial and industrial projects, income producing commercial real estate, owner-occupied real estate and construction and land development. City National also provides deposit services for commercial customers, including treasury management, lockbox and other cash management services. City National provides merchant credit card services through an agreement with a third party vendor. |
• | Consumer Banking - City National provides banking services to consumers, including checking, savings and money market accounts as well as certificates of deposit and individual retirement accounts. In addition, City National provides consumers with installment and real estate loans and lines of credit. City National also offers credit cards through an agreement with a third party vendor. |
• | Mortgage Banking - City National provides mortgage banking services, including fixed and adjustable-rate mortgages, construction financing, production of conventional and government insured mortgages, secondary marketing and mortgage servicing. |
• | Wealth Management and Trust Services - City National offers specialized services and expertise in the areas of wealth management, trust, investment and custodial services for commercial and individual customers. These services include the administration of personal trusts and estates as well as the management of investment accounts for individuals, employee benefit plans and charitable foundations. City National also provides corporate trust and institutional custody, financial and estate planning and retirement plan services. |
City National’s customer base is diverse and no single depositor could have a material adverse effect on liquidity, capital, or other elements of financial performance. Although no portion of City National’s loan portfolio is concentrated within a single industry or group of related industries, it historically has held residential mortgage loans as a significant portion of its loan portfolio. At December 31, 2017, approximately 51% of the Company’s loan portfolio was categorized as residential mortgage and home equity loans. However, due to the fractured nature of residential mortgage lending, there is no concentration of credits that would be considered materially detrimental to the Company’s financial position or operating results.
1
The Company’s business is not seasonal and has no significant foreign sources or applications of funds. There are no anticipated material capital expenditures, or any expected material effects on earnings or the Company’s competitive position as a result of compliance with federal, state and local provisions enacted or adopted relating to environmental protection.
City National’s loan portfolio is comprised of commercial and industrial, commercial real estate, residential real estate, home equity, consumer loans and demand deposit account ("DDA") overdrafts.
The commercial and industrial loan portfolio consists of loans to corporate and other legal entity borrowers primarily in small to mid-size industrial and commercial companies. Commercial and industrial loans are considered to contain a higher level of risk than other loan types, although care is taken to minimize these risks. Numerous risk factors impact this portfolio including industry specific risks such as the economy, new technology, labor rates and cyclicality, as well as customer specific factors, such as cash flow, financial structure, operating controls and asset quality. As of December 31, 2017, City National reported $208.5 million of loans classified as “Commercial and Industrial.”
Commercial real estate loans consist of commercial mortgages, which generally are secured by nonresidential and multi-family residential properties. Commercial real estate loans are to many of the same customers and carry similar industry risks as the commercial and industrial loans. As of December 31, 2017, City National reported $1.28 billion of loans classified as “Commercial Real Estate.”
City National diversifies risk within the commercial and industrial and commercial real estate portfolios by closely monitoring industry concentrations (against internally designated percents of risk-based capital) and portfolios to ensure that it does not exceed established lending guidelines. Diversification is intended to limit the risk of loss from any single unexpected economic event or trend. Underwriting standards require a comprehensive credit analysis and independent evaluation of all larger balance commercial loans by the loan committee prior to approval.
City National categorizes commercial loans by industry according to the North American Industry Classification System (NAICS) to monitor the portfolio for possible concentrations in one or more industries. As of December 31, 2017, City National's loans to borrowers within the Lessors of Nonresidential Buildings categories exceeded 10% of total loans (13%). No other industry classification exceeded 10% of total loans at December 31, 2017. Management also monitors non-owner occupied commercial real estate as a percent of risk-based capital (based upon regulatory guidance). At December 31, 2017, the company had $967.5 million of commercial loans classified as non-owner occupied and was within its designated concentration threshold.
Residential real estate loans represent loans to consumers that are secured by a first lien on residential property. Residential real estate loans provide for the purchase or refinance of a residence and first-lien home equity loans allow consumers to borrow against the equity in their home. These loans primarily consist of single family 3 and 5 year adjustable rate mortgages with terms that amortize up to 30 years. City National also offers fixed-rate residential real estate loans that are sold in the secondary market that are not included on the Company's balance sheet and City National does not retain the servicing rights to these loans. Residential mortgage loans are generally underwritten to comply with Fannie Mae guidelines, while the home equity loans are underwritten with typically less documentation, but with lower loan-to-value ratios and shorter maturities. As of December 31, 2017, City National reported $1.47 billion of loans classified as “Residential Real Estate.”
City National's home equity loans represent loans to consumers that are secured by a second (or junior) lien on a residential property. Home equity loans allow consumers to borrow against the equity in their home without paying off an existing first lien. These loans consist of home equity lines of credit ("HELOC") and amortized home equity loans that require monthly installment payments. Home equity loans are underwritten with less documentation, similar loan-to-value ratios and similar terms than residential real estate loans. The amount of credit extended is directly related to the value of the real estate at the time the loan is made. As of December 31, 2017, City National reported $139.5 million of loans classified as “Home Equity.”
All mortgage loans, whether fixed rate or adjustable rate, are originated in accordance with acceptable industry standards and comply with regulatory requirements. Fixed rate loans are processed and underwritten in accordance with Fannie Mae and Freddie Mac guidelines, while adjustable rate loans are underwritten in accordance with City National's internal loan policy.
Consumer loans may be secured by automobiles, boats, recreational vehicles, certificates of deposit and other personal property or they may be unsecured. The Company monitors the risk associated with these types of loans by monitoring such factors as portfolio growth, lending policies and economic conditions. Underwriting standards are continually evaluated and modified based upon these factors. As of December 31, 2017, City National reported $29.2 million of loans classified as “Consumer.”
2
DDA overdraft balances reflect demand deposit accounts that have been overdrawn by deposit customers and have been reclassified as loans. As of December 31, 2017, City National reported $4.4 million of loans classified as “DDA Overdrafts.”
City National’s loan underwriting guidelines and standards are updated periodically and revisions are presented for approval by City Holding Company's Board of Directors. The purpose of the underwriting guidelines and standards is to grant loans on a sound and collectible basis; to invest available funds in a safe, profitable manner; to serve the legitimate credit needs of the communities in City National's primary market area; and to ensure that all loan applicants receive fair and equal treatment in the lending process. It is the intent of the underwriting guidelines and standards to: (i) minimize loan losses by carefully investigating the credit history of each applicant; (ii) verify the source of repayment and the ability of the applicant to repay; (iii) collateralize those loans in which collateral is deemed to be required; (iv) exercise care in the documentation of the application, review, approval, and origination process; and (v) administer a comprehensive loan collection program. The above underwriting guidelines are adhered to and subjected to the experience, background and personal judgment of the loan officer assigned to the loan application.
Market Area
City National operates a network of 86 bank branches primarily along the I-64 corridor from Lexington, Kentucky through Lexington, Virginia and along the I-81 corridor through the Shenandoah Valley from Lexington, Virginia to Martinsburg, West Virginia. City National's branch network includes 57 branches in West Virginia, 14 branches in Virginia, 12 branches in Kentucky and 3 branches in Ohio. City National provides credit, deposit and investment advisory products and services to a broad geographical area that includes many rural and small community markets in addition to larger cities including Charleston (WV), Huntington (WV), Martinsburg (WV), Winchester (VA), Staunton (VA), Virginia Beach (VA), Ashland (KY) and Lexington (KY).
City National also provides commercial products and services to customers that are outside of its branches' geographical footprint, such as the Columbus, Ohio, Charlotte, North Carolina and Pittsburgh, Pennsylvania markets. These loans are diversified across a broad base of industry types, such as multi-family housing, properties leased to government, nursing homes, grocery and retail stores, and other commercial and industrial loans. At December 31, 2017, the outstanding balance of commercial loans to markets outside of the geographical footprint of the bank's branches was approximately $428 million, or 29% of City National's outstanding commercial loan balances.
City National has approximately 12% of the deposit market share in the counties of West Virginia it serves. In Virginia, City National has approximately 9% of the deposit market share along the I-81 corridor which its thirteen bank branches serve. In Kentucky, City National has approximately 4% of the deposit market share in the counties where its twelve bank branches serve. In Ohio, City National has approximately 16% of the deposit market share in the county where its three bank branches serve.
According to the most recent U.S. Census Bureau estimates (2016), in the counties where City National's bank branches are located, West Virginia’s population was approximately 1.0 million and has increased 0.5% since 2010. The population in the counties City National serves in Virginia along the I-81 corridor have increased 4.1% since 2010, which is more comparable to the national average increase of approximately 5.5%. The population in the counties that City National serves in Kentucky increased 4.0% since 2010 and in Lawrence County, Ohio, where City National's three bank branches are located, the population has decreased 2.5% since 2010.
Competition
As noted previously, the Company’s principal markets are located in West Virginia and contiguous markets in the surrounding states of Virginia, Kentucky and Ohio. The majority of the Company’s bank branches are located in the areas of Charleston (WV), Huntington (WV), Beckley (WV), Lewisburg (WV), Martinsburg (WV), Lexington (KY) and along the I-81 corridor in Virginia where there is a significant presence of other financial service providers. In its markets, the Company competes with national, regional, and local community banks for deposits, credit and trust and investment management customers. In addition to traditional banking organizations, the Company competes with credit unions, finance companies, insurance companies and other financial service providers who are able to provide specialty financial services to targeted customer groups. As further discussed below, changes in laws and regulations enacted in recent years have increased the competitive environment the Company and its subsidiaries faces to retain and attract customers.
3
Regulation and Supervision
Overview: The Company, as a registered financial holding company, and City National, as an insured depository institution, operate in a highly regulated environment and are regularly examined by federal regulators. The following description briefly discusses certain provisions of federal and state laws and regulations to which the Company and City National are subject and the potential impact of such provisions. These federal and state laws and regulations are designed to reduce potential loss exposure to the depositors of such depository institutions and to the Federal Deposit Insurance Corporation’s insurance fund and are not intended to protect the Company’s security holders. Proposals to change the laws and regulations governing the banking industry are frequently raised in Congress, in state legislatures, and before the various bank regulatory agencies. The likelihood and timing of any changes and the impact such changes might have on the Company are impossible to determine with any certainty. A change in applicable laws or regulations, or a change in the way such laws or regulations are interpreted by regulatory agencies or courts, may have a material impact on the business, operations and earnings of the Company. To the extent that the following information describes statutory or regulatory provisions, it is qualified entirely by reference to the particular statute and/or regulation.
As a financial holding company, the Company is regulated under the Bank Holding Company Act of 1956, as amended (the “BHCA”), and is subject to inspection, examination and supervision by the Board of Governors of the Federal Reserve Board. The BHCA provides generally for “umbrella” regulation of bank holding companies such as the Company by the Federal Reserve Board, and for functional regulation of banking activities by bank regulators, securities activities by securities regulators, and insurance activities by insurance regulators. The Company is also under the jurisdiction of the Securities and Exchange Commission (“SEC”) and is subject to the disclosure and regulatory requirements of the Securities Act of 1933, as amended, and the Securities Exchange Act of 1934, as amended, as administered by the SEC. The Company is listed on the Nasdaq Global Select Market ("NASDAQ") under the trading symbol “CHCO,” and is subject to the rules of the NASDAQ for listed companies.
City National is organized as a national banking association under the National Bank Act. It is subject to regulation and examination by the Office of the Comptroller of the Currency (“OCC”) and the Federal Deposit Insurance Corporation (“FDIC”). The OCC's supervision and regulation of banks is primarily intended to protect the interests of depositors. The National Bank Act generally requires each national bank to maintain reserves against deposits, restricts the nature and amount of loans that may be made and the interest that may be charged, and restricts investments and other activities.
In general, the BHCA limits the business of bank holding companies to banking, managing or controlling banks and other activities that the Federal Reserve Board has determined to be so closely related to banking as to be a proper incident thereto. Under the BHCA, bank holding companies that qualify and elect to be financial holding companies may engage in any activity, or acquire and retain the shares of a company engaged in any activity, that is either (i) financial in nature or incidental to such financial activity (as determined by the Federal Reserve Board in consultation with the OCC) or (ii) complementary to a financial activity and does not pose a substantial risk to the safety and soundness of depository institutions or the financial system generally (as solely determined by the Federal Reserve Board). Activities that are financial in nature include, among other things, securities underwriting and dealing, insurance underwriting and making merchant banking investments.
The BHCA generally limits acquisitions by bank holding companies that are not qualified as financial holding companies to commercial banks and companies engaged in activities that the Federal Reserve Board has determined to be so closely related to banking as to be a proper incident thereto. The Federal Reserve Board has the power to order any bank holding company or its subsidiaries to terminate any activity or to terminate its ownership or control of any subsidiary when the Federal Reserve Board has reasonable grounds to believe that continuation of such activity or such ownership or control constitutes a serious risk to the financial soundness, safety or stability of any bank subsidiary of the bank holding company.
The International Money Laundering Abatement and Anti-Terrorist Financing Act of 2001 (“Patriot Act”) was adopted in response to the September 11, 2001 terrorist attacks. The Patriot Act provides law enforcement with greater powers to investigate terrorism and prevent future terrorist acts. Among the broad-reaching provisions contained in the Patriot Act are several designed to deter terrorists’ ability to launder money in the United States and provide law enforcement with additional powers to investigate how terrorists and terrorist organizations are financed. The Patriot Act creates additional requirements for banks, which were already subject to similar regulations. The Patriot Act authorizes the Secretary of Treasury to require financial institutions to take certain “special measures” when the Secretary suspects that certain transactions or accounts are related to money laundering. These special measures may be ordered when the Secretary suspects that a jurisdiction outside of the United States, a financial institution operating outside of the United States, a class of transactions involving a jurisdiction outside of the United States or certain types of accounts are of “primary money laundering concern.” The special measures include the following: (a) require financial institutions to keep records and report on transactions or accounts at issue; (b) require financial institutions to obtain and retain information related to the beneficial ownership of any account opened or maintained by foreign persons; (c) require financial institutions to identify each customer who is permitted to use a payable-through or correspondent account and obtain certain information from each customer permitted to use the account; and (d) prohibit or
4
impose conditions on the opening or maintaining of correspondent or payable-through accounts. Failure of a financial institution to maintain and implement adequate programs to combat money laundering and terrorist financing, or to comply with all of the relevant laws or regulations, could have serious legal and reputational consequences for the institution.
The Company and its subsidiary bank and subsidiaries are affiliates within the meaning of the Federal Reserve Act. The Federal Reserve Act imposes limitations on a bank with respect to extensions of credit to, investments in, and certain other transactions with, its parent bank holding company and the holding company’s other subsidiaries. Furthermore, bank loans and extensions of credit to affiliates are also subject to various collateral requirements. Further, the authority of City National to extend credit to the Company's directors, executive officers and principal shareholders, including their immediate family members, corporations and other entities that they control, is subject to substantial restrictions and requirements of the Federal Reserve Act and Regulation O promulgated thereafter. These statutes and regulations impose specific limits on the amount of loans City National may make to directors and other insiders, and specify approval procedures that must be followed in making loans that exceed certain amounts.
The Community Reinvestment Act of 1977 (“CRA”) requires depository institutions to assist in meeting the credit needs of their market areas consistent with safe and sound banking practice. Under the CRA, each depository institution is required to help meet the credit needs of its market areas by, among other things, providing credit to low- and moderate-income individuals and communities. Depository institutions are periodically examined for compliance with the CRA and are assigned ratings. In order for a financial holding company to commence any new activity permitted by the BHCA, or to acquire any company engaged in any new activity permitted by the BHCA, each insured depository institution subsidiary of the financial holding company must have received a rating of at least “satisfactory” in its most recent examination under the CRA. Furthermore, banking regulators take into account CRA ratings when considering approval of a proposed transaction. Depository institutions are typically examined for CRA compliance every three years, although the frequency is at the OCC's discretion. City National received a "satisfactory" rating on its most recent CRA examination in 2015.
On July 21, 2010, sweeping financial regulatory reform legislation entitled the “Dodd-Frank Wall Street Reform and Consumer Protection Act” (the “Dodd-Frank Act”) was signed into law. The Dodd-Frank Act implements far-reaching changes across the financial regulatory landscape, including provisions that accomplish the following:
• | Centralize responsibility for consumer financial protection by creating a new agency, the Consumer Financial Protection Bureau, which has rule making authority for a wide range of consumer protection laws that apply to all banks and has broad powers to supervise and enforce consumer protection laws; |
• | Change standards for Federal preemption of state laws related to federally chartered institutions and their subsidiaries; |
• | Require the OCC to seek to make its capital requirements for national banks countercyclical so that capital requirements increase in times of economic expansion and decrease in times of economic contraction; |
• | Require financial holding companies, such as the Company, to be well-capitalized and well-managed. Bank holding companies and banks must also be both well-capitalized and well-managed to maintain their status as financial holding companies; |
• | Provide for an increase in the FDIC assessment for depository institutions with assets of $10 billion or more, increase the minimum reserve ratio for the deposit insurance fund from 1.15% to 1.35% and changes in the basis for determining FDIC premiums from deposits to assets; |
• | Provide for new disclosure and other requirements relating to executive compensation and corporate governance. These disclosures and requirements apply to all public companies, not just financial institutions; |
• | Permanently increase the $250,000 limit for federal deposit insurance and increase the cash limit of Securities Investor Protection Corporation protection from $100,000 to $250,000; |
• | Repeal the federal prohibitions on the payment of interest on demand deposits; |
• | Amend the Electronic Fund Transfer Act (EFTA) to, among other things, give the Federal Reserve the authority to establish rules regarding interchange fees charged for electronic debit transactions by payment card issuers having assets over $10 billion and to enforce a new statutory requirement that such fees be reasonable and proportional to the actual cost of a transaction to the issuer; |
• | Enhance the requirements for certain transactions with affiliates under the Federal Reserve Act, including an expansion of the “covered transactions” definition and increase the amount of time for which collateral requirements regarding covered transactions must be maintained; |
• | Strengthen the existing limits on a depository institution’s credit exposure to one borrower by expanding the scope of limitations to include credit exposure arising from derivative transactions, repurchase agreements, and securities lending and borrowing transactions; |
• | Strengthen loan restrictions to insiders by expanding the types of transactions subject to various limits, including derivative transactions, repurchase agreements, reverse repurchase agreements, and securities lending or borrowing transactions. Additionally, restrictions on certain asset sales to and from an insider to an institution, including |
5
requirements that such sales be on market terms and approved by the institution’s board of directors in certain situations are to be put in place; and
• | Increase the authority of the Federal Reserve to examine the Company and its non-bank subsidiaries. |
On December 10, 2013 the Federal Reserve adopted the final rules implementing the Volcker Rule, which amends the BHCA to require the federal financial regulatory agencies to adopt rules that prohibit banks and their affiliates from engaging in proprietary trading and investing in and sponsoring certain unregistered investment companies (defined as hedge funds and private equity funds). The Volcker Rule, which became effective in July 2015, does not significantly impact the operations of the Company or City National.
In 2013, the Consumer Financial Protection Bureau (the "CFPB") issued eight final regulations governing mainly consumer mortgage lending. The first of these rules was issued on January 10, 2013, and included the ability to repay and qualified mortgage rule. This rule imposes additional requirements on banks, including rules designed to require banks to ensure borrowers' ability to repay their mortgage, and took effect January 10, 2014. The same day, the CFPB also finalized a rule on escrow accounts for higher priced mortgage loans and a rule expanding the scope of the high-cost mortgage provision in the Truth In Lending Act. On January 17, 2013, the CFPB issued its final rules implementing provisions of the Dodd-Frank Act that relate to mortgage servicing, which took effect on January 10, 2014. On January 18, 2013, the CFPB issued a final appraisal rule under the Equal Credit Opportunity Act and six federal agencies, including the CFPB, issued an interagency rule on appraisals for higher-priced mortgage loans. On November 20, 2013, the CFPB issued its final rule on integrated mortgage disclosures under the Truth In Lending Act and the Real Estate Settlement Procedures Act, for which compliance was required by October 3, 2015.
Banking regulatory agencies have increasingly used a general consumer protection statute to address unethical or otherwise bad business practices that may not necessarily fall directly under the purview of a specific banking or consumer finance law. Prior to the Dodd-Frank Act, there was little formal guidance to provide insight to the parameters for compliance with the "unfair or deceptive acts or practices" ("UDAP") law. However, the UDAP provisions have been expanded under the Dodd-Frank Act to apply to "unfair, deceptive or abusive acts or practices", which has been delegated to the CFPB for supervision.
Uncertainty remains as to the future impact of the Dodd-Frank Act, which could have a material adverse impact either on the financial services industry as a whole, or on the Company’s business, results of operations and financial condition. Provisions in the legislation that affect deposit insurance assessments, payment of interest on demand deposits and interchange fees could increase the costs associated with deposits as well as place limitations on certain revenues those deposits may generate. Provisions in the legislation that require revisions to the capital requirements of the Company and City National could require the Company and City National to seek other sources of capital in the future.
Capital Adequacy: Federal banking regulations set forth capital adequacy guidelines, which are used by regulatory authorities to assess the adequacy of capital in examining and supervising a bank holding company and its insured depository institutions.
In July 2013, the Federal Reserve published the final rules that established a new comprehensive capital framework for banking organizations, commonly referred to as Basel III. These final rules substantially revised the risk-based capital requirements applicable to bank holding companies and depository institutions. The final rule became effective January 1, 2015 for smaller, non-complex banking organizations with full implementation by January 1, 2019.
Regulatory guidelines require the Company to maintain a minimum common equity tier I ("CET 1") capital ratio of 5.75% and a total capital to risk-adjusted assets ratio of 9.25%, with at least one-half of capital consisting of tangible common stockholders’ equity, and a minimum Tier 1 leverage ratio of 7.25%. Similarly, City National is also required to maintain minimum capital levels as set forth by various regulatory agencies. Under capital adequacy guidelines, City National is required to maintain minimum CET 1, total capital, Tier 1 capital, and leverage ratios of 5.75%, 9.25%, 7.25%, and 4.0%, respectively. To be classified as “well capitalized,” City National must maintain CET 1, total capital, Tier 1 capital, and leverage ratios of 6.5%, 10.0%, 8.0%, and 5.0%, respectively.
When fully phased in on January 1, 2019, the Basel III Capital Rules will require City Holding and City National to maintain (i) a minimum ratio of CET 1 to risk-weighted assets of at least 4.5%, plus a 2.5% "capital conservation buffer" (which is added to the 4.5% CET 1 ratio as that buffer is phased in, effectively resulting in a minimum ratio of CET 1 to risk-weighted assets of at least 7.0% upon full implementation), (ii) a minimum ratio of Tier 1 capital to risk-weighted assets of at least 6.0%, plus the capital conservation buffer (which is added to the 6.0% Tier 1 capital ratio as that buffer is phased in, effectively resulting in a minimum Tier 1 capital ratio of 8.5% upon full implementation), (iii) a minimum ratio of total capital (that is, Tier 1 plus Tier 2) to risk-weighted assets of at least 8.0%, plus the capital conservation buffer (which is added to the 8.0% total capital ratio as that buffer is phased in, effectively resulting in a minimum total capital ratio of 10.5% upon full implementation) and
6
(iv) a minimum leverage ratio of 4.0%, calculated as the ratio of Tier 1 capital to average assets (as compared to the previous minimum leverage ratio of 3.0% for banking organizations that either have the highest supervisory rating or have implemented the appropriate federal regulatory authority's risk-adjusted measure for market risk).
The implementation of the capital conservation buffer began on January 1, 2016 at the 0.625% level and will be phased in over a four-year period (increasing by that amount on each subsequent January 1, until it reaches 2.5% on January 1, 2019). The Basel III Capital Rules also provide for a “countercyclical capital buffer” that is applicable to only certain covered institutions and does not have any current applicability to City Holding Company or City National Bank.
The aforementioned capital conservation buffer is designed to absorb losses during periods of economic stress. Banking institutions with a ratio of CET 1 capital to risk-weighted assets above the minimum but below the conservation buffer (or below the combined capital conservation buffer and countercyclical capital buffer, when the latter is applied) will face constraints on dividends, equity repurchases and compensation based on the amount of the shortfall.
The Company’s regulatory capital ratios for both City Holding and City National are illustrated in the following tables (dollars in thousands):
December 31, 2017 | Actual | Minimum Required - Basel III Phase-In Schedule | Minimum Required - Basel III Fully Phased-In (*) | Required to be Considered Well Capitalized | |||||||||||||||||||||||
Capital Amount | Ratio | Capital Amount | Ratio | Capital Amount | Ratio | Capital Amount | Ratio | ||||||||||||||||||||
CET 1 Capital | |||||||||||||||||||||||||||
City Holding Company | $ | 430,154 | 15.1 | % | $ | 163,441 | 5.750 | % | $ | 198,972 | 7.0 | % | $ | 184,760 | 6.5 | % | |||||||||||
City National Bank | 338,105 | 12.0 | % | 162,164 | 5.750 | % | 197,418 | 7.0 | % | 183,316 | 6.5 | % | |||||||||||||||
Tier 1 Capital | |||||||||||||||||||||||||||
City Holding Company | 446,154 | 15.7 | % | 206,078 | 7.250 | % | 241,609 | 8.5 | % | 227,397 | 8.0 | % | |||||||||||||||
City National Bank | 338,105 | 12.0 | % | 204,468 | 7.250 | % | 239,721 | 8.5 | % | 225,620 | 8.0 | % | |||||||||||||||
Total Capital | |||||||||||||||||||||||||||
City Holding Company | 465,292 | 16.4 | % | 262,927 | 9.250 | % | 298,458 | 10.5 | % | 284,246 | 10.0 | % | |||||||||||||||
City National Bank | 357,243 | 12.7 | % | 260,873 | 9.250 | % | 296,126 | 10.5 | % | 282,025 | 10.0 | % | |||||||||||||||
Tier 1 Leverage Ratio | |||||||||||||||||||||||||||
City Holding Company | 446,154 | 11.0 | % | 161,834 | 4.000 | % | 161,834 | 4.0 | % | 202,293 | 5.0 | % | |||||||||||||||
City National Bank | 338,105 | 8.5 | % | 159,625 | 4.000 | % | 159,625 | 4.0 | % | 199,531 | 5.0 | % | |||||||||||||||
(*) Represents the minimum required capital levels as of January 1, 2019 when Basel III Capital Rules have been fully phased in. | |||||||||||||||||||||||||||
7
December 31, 2016 | Actual | Minimum Required - Basel III Phase-In Schedule | Minimum Required - Basel III Fully Phased-In (*) | Required to be Considered Well Capitalized | |||||||||||||||||||||||
Capital Amount | Ratio | Capital Amount | Ratio | Capital Amount | Ratio | Capital Amount | Ratio | ||||||||||||||||||||
CET 1 Capital | |||||||||||||||||||||||||||
City Holding Company | $ | 371,677 | 13.3 | % | $ | 142,845 | 5.125 | % | $ | 195,105 | 7.0 | % | $ | 181,169 | 6.5 | % | |||||||||||
City National Bank | 310,912 | 11.2 | % | 141,860 | 5.125 | % | 193,761 | 7.0 | % | 179,921 | 6.5 | % | |||||||||||||||
Tier 1 Capital | |||||||||||||||||||||||||||
City Holding Company | 387,677 | 13.9 | % | 184,653 | 6.625 | % | 236,913 | 8.5 | % | 222,977 | 8.0 | % | |||||||||||||||
City National Bank | 318,872 | 11.5 | % | 183,381 | 6.625 | % | 235,281 | 8.5 | % | 221,441 | 8.0 | % | |||||||||||||||
Total Capital | |||||||||||||||||||||||||||
City Holding Company | 408,406 | 14.7 | % | 240,397 | 8.625 | % | 292,658 | 10.5 | % | 278,722 | 10.0 | % | |||||||||||||||
City National Bank | 338,675 | 12.2 | % | 238,741 | 8.625 | % | 290,641 | 10.5 | % | 276,801 | 10.0 | % | |||||||||||||||
Tier 1 Leverage Ratio | |||||||||||||||||||||||||||
City Holding Company | 387,677 | 10.1 | % | 153,864 | 4.000 | % | 153,864 | 4.0 | % | 192,330 | 5.0 | % | |||||||||||||||
City National Bank | 318,872 | 8.3 | % | 153,088 | 4.000 | % | 153,088 | 4.0 | % | 191,359 | 5.0 | % | |||||||||||||||
(*) Represents the minimum required capital levels as of January 1, 2019 when Basel III Capital Rules have been fully phased in. | |||||||||||||||||||||||||||
Management believes that, as of December 31, 2017, City Holding and City National would meet all capital adequacy requirements under Basel III on a fully phased-in basis as if such requirements had been in effect.
Additionally, federal banking laws require regulatory authorities to take “prompt corrective action” with respect to depository institutions that do not satisfy minimum capital requirements. The extent of these powers depends upon whether the institutions in question are “well capitalized”, “adequately capitalized”, “undercapitalized”, “significantly undercapitalized” or “critically undercapitalized”, as such terms are defined under uniform regulations defining such capital levels issued by each of the federal banking agencies. As an example, a depository institution that is not well capitalized is generally prohibited from accepting brokered deposits and offering interest rates on deposits higher than the prevailing rate in its market. Additionally, a depository institution is generally prohibited from making any capital distribution (including payment of a dividend) or paying any management fee to its holding company, may be subject to asset growth limitations and may be required to submit capital restoration plans if the depository institution is considered undercapitalized.
Dividends and Other Payments: The Company is a legal entity separate and distinct from City National. Dividends from City National are essentially the sole source of cash for the Company. The right of the Company, and shareholders of the Company, to participate in any distribution of the assets or earnings of City National through the payment of such dividends or otherwise is necessarily subject to the prior claims of creditors of City National, except to the extent that claims of the Company in its capacity as a creditor may be recognized. Moreover, there are various legal limitations applicable to the payment of dividends to the Company as well as the payment of dividends by the Company to its shareholders.
City National is subject to various statutory restrictions on its ability to pay dividends to the Company. Specifically, the approval of the OCC is required prior to the payment of dividends by City National in excess of its earnings retained in the current year plus retained net profits for the preceding two years. The payment of dividends by the Company and City National may also be limited by other factors, such as requirements to maintain adequate capital above regulatory guidelines. The OCC has the authority to prohibit any bank under its jurisdiction from engaging in an unsafe or unsound practice in conducting its business. Depending upon the financial condition of City National, the payment of dividends could be deemed to constitute such an unsafe or unsound practice. The Federal Reserve Board and the OCC have indicated their view that it generally would be an unsafe and unsound practice to pay dividends except out of current operating earnings. The Federal Reserve Board has stated that, as a matter of prudent banking, a bank or bank holding company should not maintain its existing rate of cash dividends on common stock unless (1) the organization’s net income available to common shareholders over the past year has been sufficient to fully fund the dividends and (2) the prospective rate of earnings retention appears consistent with the organization’s capital needs, asset quality, and overall financial condition. Moreover, the Federal Reserve Board has indicated that bank holding companies should serve as a source of managerial and financial strength to their subsidiary banks. Accordingly, the Federal Reserve Board has stated that a bank holding company should not maintain a level of cash dividends to its shareholders that
8
places undue pressure on the capital of its bank subsidiaries, or that can be funded only through additional borrowings or other arrangements that may undermine the bank holding company’s ability to serve as a source of financial strength.
At December 31, 2017, City National could pay dividends up to $75.0 million without prior regulatory permission. No dividends were paid in 2017 that required regulatory approval. During 2017, the Company used cash obtained from these dividends primarily to: (1) pay common dividends to shareholders and (2) remit interest payments on the Company’s junior subordinated debentures. Management believes that the Company’s available cash balance, together with cash dividends from City National, is adequate to satisfy its funding and cash needs in 2018.
Under federal law, City National may not, subject to certain limited exceptions, make loans or extensions of credit to, or invest in the securities of, or take securities of the Company as collateral for loans to any borrower. City National is also subject to collateral security requirements for any loans or extensions of credit permitted by such exceptions.
Governmental Policies
The Federal Reserve Board regulates money and credit and interest rates in order to influence general economic conditions. These policies have a significant influence on overall growth and distribution of bank loans, investments and deposits and affect interest rates charged on loans or paid for time and savings deposits. Federal Reserve monetary policies have had a significant effect on the operating results of banks in the past and are expected to continue to do so in the future.
In view of changing conditions in the national economy and in money markets, as well as the effect of credit policies by monetary and fiscal authorities, including the Federal Reserve Board, it is difficult to predict the impact of possible future changes in interest rates, deposit levels, and loan demand, or their effect on the Company's business and earnings or on the financial condition of the Company's various customers.
Deposit Insurance
Substantially all of the deposits of City National are insured up to applicable limits by the Deposit Insurance Fund (“DIF”) of the FDIC and are subject to deposit insurance assessments to maintain the DIF. Deposit insurance assessments are based on average total assets minus average tangible equity. In October 2010, the FDIC adopted a new DIF restoration plan to ensure that the fund reserve ratio reaches 1.35% by September 30, 2020, as required by the Dodd-Frank Act. In August 2016, the FDIC announced that the DIF reserve ratio had surpassed 1.15% as of June 30, 2016. As a result, beginning in the third quarter of 2016, the range of initial assessment ranges for all institutions were adjusted downward. In March 2016, the FDIC adopted a final rule increasing the reserve ratio for the DIF to 1.35% of total insured deposits.
FDIC insurance expense totaled $1.3 million, $1.6 million and $1.8 million in 2017, 2016, and 2015, respectively. FDIC insurance expense includes deposit assessments and Financing Corporation ("FICO") assessments related to outstanding FICO bonds.
Under the Federal Deposit Insurance Act, as amended (“FDIA"), the FDIC may terminate deposit insurance upon finding that an institution has engaged in unsafe or unsound practices, is in unsafe or unsound condition to continue operations, or has violated any applicable law, regulation, rule, order or condition imposed by the FDIC.
Cybersecurity
In March 2015, federal regulators issued two statements regarding cybersecurity: (i) a statement indicating that financial institutions should design multiple layers of security controls to establish lines of defense and to ensure that their risk management processes also address the risk posed by compromised customer credentials, including security measures to reliably authenticate customers accessing internet-based services of the financial institutions and (ii) a statement indicating the expectation of a financial institution's management to maintain a sufficient business continuity planning process to ensure rapid recovery, resumption and maintenance of the financial institution's operations after a cyber-attack involving destructive malware. A financial institution is also expected to develop appropriate processes to: (a) enable recovery of data and business operations, (b) address rebuilding network capabilities, and (c) restore data if the financial institution or any of its critical service providers fall victim to this type of cyber-attack.
In October 2016, the federal banking agencies issued an advance notice of proposed rulemaking on enhanced cybersecurity risk–management and resilience standards that would apply to large and interconnected banking organizations and to services provided by third parties to these firms. These enhanced standards would apply only to banks and bank holding companies with total consolidated assets of $50 billion or more; however, it is unclear as to whether any such standards would be applied, and in what form, in the future to smaller banks and bank holding companies.
9
If the Company does not comply with this regulatory guidance, it could be subject to various regulatory sanctions, as well as financial penalties. The Company believes that it is in compliance with this guidance.
Future Legislation
Various other legislative and regulatory initiatives, including proposals to overhaul the banking regulatory system and to limit the investments that a depository institution may make with insured funds, are from time to time introduced in Congress and state legislatures, as well as regulatory agencies. Such legislation may change banking statutes and the operating environment of the Company and its subsidiaries in substantial and unpredictable ways, and could increase or decrease the cost of doing business, limit or expand permissible activities or affect the competitive balance in the financial services industry generally. The Company cannot determine the ultimate effect that such potential legislation, if enacted, would have upon its financial condition or operations.
10
Executive Officers of the Registrant
At December 31, 2017, the executive officers of the Company were as follows:
Name | Age | Business Experience |
Charles R. Hageboeck, Ph.D. | 55 | President and Chief Executive Officer, City Holding Company and City National Bank, Charleston, WV since February 1, 2005. Executive Vice President and Chief Financial Officer, City Holding Company and City National Bank, Charleston, WV from June 2001 – January 2005. |
Craig G. Stilwell | 62 | Executive Vice President of Retail Banking, City Holding Company and City National Bank, Charleston, WV since February 2005. Executive Vice President of Marketing & Human Resources, City Holding Company and City National Bank, Charleston, WV from May 2001 – February 2005. |
John A. DeRito | 67 | Executive Vice President of Commercial Banking, City Holding Company and City National Bank, Charleston, WV since June 2004. |
David L. Bumgarner | 52 | Senior Vice President and Chief Financial Officer, City Holding Company and City National Bank, Charleston, WV since February 2005. |
Jeffrey D. Legge | 53 | Senior Vice President, Chief Administration Officer and Chief Information Officer, City Holding Company and City National Bank, Charleston, WV since December 2005. |
Employees
The Company had 839 full-time equivalent employees at December 31, 2017.
Available Information
The Company files annual, quarterly and current reports, proxy statements and other information with the Securities and Exchange Commission. You may read and copy any document the Company files at the SEC Public Reference Room at 100 F Street, N. E., Washington, D.C. 20549. Please call the SEC at 1-800-SEC-0330 for further information on the public reference room. The Company's SEC filings are also available to the public at the SEC's website at www.sec.gov.
The Company’s Internet website address is www.bankatcity.com. The Company makes available free of charge through its website its annual report, quarterly reports, current reports and amendments to those reports filed or furnished pursuant to Section 13(a) or 15(d) of the Securities Exchange Act of 1934, as amended, as soon as reasonably practicable after such documents are electronically filed with, or furnished to, the Securities and Exchange Commission. The information on the Company’s website is not, and shall not be deemed to be, a part of this report or incorporated into any other filing with the Securities and Exchange Commission. Copies of the Company’s annual report will be made available, free of charge, upon written request.
11
Statistical Information
The information noted below is provided pursuant to Guide 3 -- Statistical Disclosure by Bank Holding Companies.
Description of Information | Page Reference | |||
1. | Distribution of Assets, Liabilities and Stockholders' | |||
Equity; Interest Rates and Interest Differential | ||||
a. | Average Balance Sheets | |||
b. | Analysis of Net Interest Earnings | |||
c. | Rate Volume Analysis of Changes in Interest Income and Expense | |||
2. | Investment Portfolio | |||
a. | Book Value of Investments | |||
b. | Maturity Schedule of Investments | |||
c. | Securities of Issuers Exceeding 10% of Stockholders’ Equity | |||
3. | Loan Portfolio | |||
a. | Types of Loans | |||
b. | Maturities and Sensitivity to Changes in Interest Rates | |||
c. | Risk Elements | |||
d. | Other Interest Bearing Assets | None | ||
4. | Summary of Loan Loss Experience | |||
5. | Deposits | |||
a. | Breakdown of Deposits by Categories, Average Balance And Average Rate Paid | |||
b. | Maturity Schedule of Time Certificates of Deposit and Other Time Deposits of $100,000 or More | |||
6. | Return on Equity and Assets | |||
7. | Short-term Borrowings | |||
12
Item 1A.Risk Factors
An investment in the Company’s common stock is subject to risks inherent to the Company’s business. The material risks and uncertainties that management believes affect the Company are described below. The risks and uncertainties described below are not the only ones facing the Company. Additional risks and uncertainties that management is not aware of or focused on or that management currently deems immaterial may also impair the Company’s business operations. You should carefully consider the risks described below, as well as the other information included or incorporated by reference in this Annual Report on Form 10-K, before making an investment in the Company’s common stock. If any of the following risks occur, the Company’s financial condition and results of operations could be materially and adversely affected, and you could lose all or part of your investment. In this section, the term "Company" includes City National unless the circumstances dictate otherwise.
Economic Conditions in the Company's Market Areas Could Negatively Impact the Company's Business and Financial Condition
The Company’s business is concentrated in West Virginia, Virginia, Kentucky and southeastern Ohio. As a result, the Company’s results of operation, cash flows and financial condition are affected by local and regional economic conditions. A downturn in the economies within the Company’s market area, or in any one of them, could negatively impact the Company’s results of operation and financial condition. Some examples of economic deterioration include declines in economic growth, declines in consumer and business confidence, increases in inflation, increases in the cost of capital and credit, and limitations in the availability of credit. The Company’s financial performance generally, and the ability of its customers to pay interest on and repay principal of outstanding loans to City National, is highly dependent on the strength of the economic and business environment in the market areas where the Company operates and in the United States as a whole. Additionally, the value of collateral securing loans made and held by City National is impacted by the strength of the economy. Deteriorating economic conditions in the Company’s market areas could cause declines in the overall quality of the loan portfolio requiring charge-off of a greater percentage of loans and/or an increase in the allowance for loan losses, which could negatively impact the Company’s results of operations and financial condition.
While the economic and business environment in West Virginia, Virginia, Kentucky and southeastern Ohio have shown improvement since the recession of 2007 to 2009, there can be no assurance that such improvement will continue or that the economies in the Company’s market areas, or the United States as a whole, will not slip into recession. Such a lack of continued economic improvement or slippage into recession could adversely affect the Company’s results of operation and financial condition. An economic slowdown could have the following consequences:
• | Loan delinquencies may increase; |
• | Problem assets and foreclosures may increase; |
• | Demand for the products and services of City National may decline; and |
• | Collateral (including real estate) for loans made by City National may decline in value, in turn reducing customers’ borrowing power, and making existing loans less secure. |
The oil, natural gas and coal industries, and businesses ancillary thereto, play an important role in the economies of West Virginia, Virginia, Kentucky and southeastern Ohio. The volatility in oil and gas prices since 2014 has negatively impacted oil and gas and other businesses in the Company’s market areas. Additionally, the coal industry continues to be in decline as a result of increased environmental and safety regulatory burden, increased competition from alternative energy sources and a decline in demand for coal. The Company's exposure to coal industry specific loans as of December 31, 2017 is less than $10 million. Prolonged low oil and gas prices, and continued decline in the coal industry, could result in downward pressure on businesses in the Company’s market area which could negatively affect City National’s customers (both individuals and businesses). As a result the Company’s operating results and financial condition could be negatively impacted.
The Value of Real Estate Collateral May Fluctuate Significantly Resulting in an Under-Collateralized Loan Portfolio
The market value of real estate, particularly real estate held for investment, can fluctuate significantly in a short period of time as a result of market conditions in the geographic area in which the real estate is located. If the value of the real estate serving as collateral for the Company's loan portfolio were to decline materially, a significant part of the Company's loan portfolio could become under-collateralized. If the loans that are collateralized by real estate become troubled during a time when market conditions are declining or have declined, then, in the event of foreclosure, we may not be able to realize the amount of collateral that we anticipated at the time of originating the loan. This could have a material adverse effect on the Company's provision for loan losses and the Company's operating results and financial condition.
13
The Value of the Company’s Common Stock Fluctuates
The market for the Company’s common stock may experience significant price and volume fluctuations in response to a number of factors including actual or anticipated quarterly variations in operating results, changes in expectations of future financial performance, changes in estimates by securities analysts, governmental regulatory action, banking industry reform measures, customer relationship developments and other factors, many of which will be beyond the Company’s control.
Furthermore, the stock market in general, and the market for financial institutions in particular, have experienced extreme volatility that often has been unrelated to the operating performance of particular companies. These broad market and industry fluctuations may adversely affect the trading price of the Company’s common stock, regardless of actual operating performance.
The Trading Volume In The Company’s Common Stock Is Less Than That Of Other Larger Financial Services Companies
Although the Company’s common stock is listed for trading on the Nasdaq Global Select Market, the trading volume in its common stock is less than that of other larger financial services companies. A public trading market having the desired characteristics of depth, liquidity and orderliness depends on the presence in the marketplace of willing buyers and sellers of the Company’s common stock at any given time. This presence depends on the individual decisions of investors and general economic and market conditions over which the Company has no control. Given the lower trading volume of the Company’s common stock, significant sales of the Company’s common stock, or the expectation of these sales, could cause the Company’s stock price to fall.
Future Sales of Shares of the Company’s Common Stock Could Negatively Affect its Market Price
Future sales of substantial amounts of the Company’s common stock, or the perception that such sales could occur, could adversely affect the market price of the Company’s common stock in the open market. We make no prediction as to the effect, if any, that future sales of shares, or the availability of shares for future sale, will have on the market price of the Company’s common stock.
Shares of the Company’s Common Stock Are Not FDIC Insured
Neither the FDIC nor any other governmental agency insures the shares of the Company’s common stock. Therefore, the value of your shares in the Company will be based on their market value and may decline.
The Company’s Ability To Pay Dividends Is Limited
Although the Board of Directors has declared cash dividends in the past, the current ability to pay dividends is largely dependent upon the receipt of dividends from City National. Federal laws impose restrictions on the ability of City National to pay dividends. Holders of shares of the Company’s common stock are entitled to dividends if, and when, they are declared by the Company’s Board of Directors out of funds legally available for that purpose. Additional restrictions are placed upon the Company by the policies of federal regulators, including the Federal Reserve Board’s November 14, 1985 policy statement, which provides that bank holding companies should pay dividends only out of the past year’s net income, and then only if their prospective rate of earnings retention appears consistent with their capital needs, asset quality, and overall financial condition. In general, future dividend policy is subject to the discretion of the Board of Directors and will depend upon a number of factors, including the Company’s and City National’s future earnings, capital requirements, regulatory constraints and financial condition.
The Company and City National are Extensively Regulated
The Company operates in a highly regulated environment and is subject to supervision and regulation by a number of governmental regulatory agencies, including the Federal Reserve Board, the OCC and the FDIC. Regulations adopted by these agencies, which are generally intended to provide protection for depositors and customers rather than for the benefit of shareholders, govern a comprehensive range of matters including but not limited to (i) ownership and control of the Company's shares, (ii) acquisition of other companies and businesses, (iii) permissible activities to engage in, (iv) maintenance of adequate capital levels and (v) other operational aspects. The bank regulatory agencies possess broad authority to prevent or remedy unsafe or unsound practices or violations of law.
The Dodd-Frank Act instituted major changes to the bank and financial institutions regulatory regimes in light of the past performance of, and government intervention in, the financial services sector. Other changes to statutes, regulations or regulatory policies, including changes in interpretation or implementation of statutes, regulations or policies, could affect the Company in substantial and unpredictable ways. Such changes could subject the Company to reduced revenues, additional
14
costs, limit the types of financial services and products the Company may offer and/or increase the ability of non-banks to offer competing financial services and products, among other things. Failure to comply with laws, regulations or policies could result in sanctions by regulatory agencies, civil money penalties and/or reputation damage, which could have a material adverse effect on the Company's business, financial condition and results of operations.
Proposals to change the laws and regulations governing financial institutions are frequently raised in Congress and before bank regulatory authorities. Changes in applicable laws or regulations could materially affect the Company’s business, and the likelihood of any major changes in the future and their effects are impossible to determine. Moreover, it is impossible to predict the ultimate form any proposed legislation might take or how it might affect the Company.
The Company Is Subject To Lending Risk
There are inherent risks associated with the Company’s lending activities. These risks include, among other things, the impact of changes in interest rates and changes in the economic conditions in the markets where the Company operates. Increases in interest rates and/or weakening economic conditions could adversely impact the ability of borrowers to repay outstanding loans or the value of the collateral securing these loans. The Company is also subject to various laws and regulations that affect its lending activities. Failure to comply with applicable laws and regulations could subject the Company to regulatory enforcement action that could result in the assessment of significant civil money penalties against the Company.
The Company is Subject to Interest Rate Risk
Changes in monetary policy, including changes in interest rates, could influence not only the interest the Company receives on loans and securities and the amount of interest it pays on deposits and borrowings, but such changes could also affect (i) the Company’s ability to originate loans and obtain deposits, (ii) the fair value of the Company’s financial assets and liabilities, and (iii) the average duration of the Company’s mortgage-backed securities portfolio. The Company’s earnings and cash flows are largely dependent upon its net interest income. Net interest income is the difference between interest income earned on interest-earning assets, such as loans and securities, and interest expense paid on interest-bearing liabilities, such as deposits and borrowed funds. Interest rates are highly sensitive to many factors that are beyond the Company’s control, including general economic conditions and policies of various governmental and regulatory agencies and, in particular, the Board of Governors of the Federal Reserve System. If the interest rates paid on deposits and other borrowings increase at a faster rate than the interest rates received on loans and other investments, the Company’s net interest income, and therefore earnings, could be adversely affected. Earnings also could be adversely affected if the interest rates received on loans and other investments fall more quickly than the interest rates paid on deposits and other borrowings.
Although management believes it has implemented effective asset and liability management strategies, including the use of derivatives as hedging instruments, to reduce the potential effects of changes in interest rates on the Company’s results of operations, any substantial, unexpected, prolonged change in market interest rates could have a material adverse effect on the Company’s financial condition and results of operations. See the section captioned “Risk Management” in Item 7. Management’s Discussion and Analysis of Financial Condition and Results of Operations located elsewhere in this report for further discussion related to the Company’s management of interest rate risk.
The Company May Be Adversely Affected By The Soundness Of Other Financial Institutions
Financial services institutions are interrelated as a result of trading, clearing, counterparty, and other relationships. The Company has exposure to many different industries and counterparties, and routinely executes transactions with counterparties in the financial services industry, including commercial banks, brokers and dealers, investment banks, and other institutional clients. Many of these transactions expose the Company to credit risk in the event of a default by a counterparty or client. In addition, the Company’s credit risk may be exacerbated when the collateral held by the Company cannot be realized upon or is liquidated at prices not sufficient to recover the full amount of the credit or derivative exposure due to the Company. Any such losses could have a material adverse effect on the Company’s business, financial condition and results of operations.
The Company’s Allowance for Loan Losses May Not Be Sufficient
The Company maintains an allowance for loan losses, which is a reserve established through a provision for loan losses charged to expense that represents management’s best estimate of probable losses in the existing portfolio of loans. The allowance, in the judgment of management, is necessary to provide for estimated loan losses and risks inherent in the loan portfolio. The level of the allowance reflects management’s continuing evaluation of industry concentrations; specific credit risks; loan loss experience; current loan portfolio quality; present economic, political and regulatory conditions; and unidentified losses inherent in the current loan portfolio. The determination of the appropriate level of the allowance for loan losses inherently involves a high degree of subjectivity and requires the Company to make significant estimates of current credit risks and future trends, all
15
of which may undergo material changes. Changes in economic conditions affecting borrowers, new information regarding existing loans, identification of additional problem loans and other factors, both within and outside of the Company’s control, may require an increase in the allowance for loan losses. In addition, bank regulatory agencies periodically review the Company’s allowance for loan losses and may require an increase in the provision for loan losses or the recognition of further loan charge-offs, based on judgments different than those of management. In addition, if charge-offs in future periods exceed the allowance for loan losses, the Company will need additional provisions to increase the allowance for loan losses. Any increases in the allowance for loan losses will result in a decrease in net income and capital, and may have a material adverse effect on the Company’s financial condition and results of operations.
Management evaluates the adequacy of the allowance for loan losses at least quarterly, which includes testing certain individual loans as well as collective pools of loans for impairment. This evaluation includes an assessment of actual loss experience within each category of the portfolio; individual commercial and commercial real estate loans that exhibit credit weakness; current economic events, including employment statistics, trends in bankruptcy filings, and other pertinent factors; industry or geographic concentrations; and regulatory guidance. See the section captioned “Allowance and Provision for Loan Losses” in Item 7. Management’s Discussion and Analysis of Financial Condition and Results of Operations located elsewhere in this report for further discussion related to the Company’s process for determining the appropriate level of the allowance for loan losses.
Customers May Default On the Repayment of Loans
City National’s customers may default on the repayment of loans, which may negatively impact the Company’s earnings due to loss of principal and interest income. Increased operating expenses may result from management's allocation time and resources to the collection and work-out of the loan. Collection efforts may or may not be successful causing the Company to write off the loan or repossess the collateral securing the loan, which may or may not exceed the balance of the loan.
Due To Increased Competition, the Company May Not Be Able To Attract and Retain Banking Customers At Current Levels
The Company faces competition from the following:
• | local, regional and national banks; |
• | savings and loans associations; |
• | Internet banks; |
• | credit unions; |
• | finance companies; |
• | fin-tech companies: and |
• | brokerage firms serving the Company’s market areas. |
In particular, City National’s competitors include several major national financial and banking companies whose greater resources may afford them a marketplace advantage by enabling them to maintain numerous banking locations and mount extensive promotional and advertising campaigns. Additionally, banks and other financial institutions may have products and services not offered by the Company, which may cause current and potential customers to choose those institutions. Areas of competition include interest rates for loans and deposits, efforts to obtain deposits and range and quality of services provided. If the Company is unable to attract new and retain current customers, loan and deposit growth could decrease causing the Company’s results of operations and financial condition to be negatively impacted.
Emergence of Nonbank Alternatives to the Financial System
Consumers may decide not to use banks to complete their financial transactions. Technology and other changes, including the emergence of “fin–tech companies” are allowing parties to complete financial transactions through alternative methods that historically have involved banks. For example, consumers can also complete transactions, such as paying bills and/or transferring funds directly without the assistance of banks. The process of eliminating banks as intermediaries, known as “disintermediation,” could result in the loss of fee income, as well as the loss of customer deposits and the related income generated from those deposits. The loss of these revenue streams and the lower cost of deposits as a source of funds could have a material adverse effect on our financial condition and results of operations.
16
The Company May Be Required To Write Down Goodwill And Other Intangible Assets, Causing Its Financial Condition And Results To Be Negatively Affected
When the Company acquires a business, a portion of the purchase price of the acquisition is allocated to goodwill and other identifiable intangible assets. The excess of the purchase price over the fair value of the net identifiable tangible and intangible assets acquired determines the amount of the purchase price that is allocated to goodwill acquired. At December 31, 2017, the Company’s goodwill and other identifiable intangible assets were approximately $79 million. Under current accounting standards, if the Company determines goodwill or intangible assets are impaired, it would be required to write down the value of these assets. The Company conducts an annual review to determine whether goodwill and other identifiable intangible assets are impaired. The Company recently completed such an impairment analysis and concluded that no impairment charge was necessary for the year ended December 31, 2017. The Company cannot provide assurance whether it will be required to take an impairment charge in the future. Any impairment charge would have a negative effect on its shareholders’ equity and financial results and may cause a decline in the Company's stock price.
Acquisition Opportunities May Present Challenges
Any future acquisitions may result in unforeseen difficulties, which could require significant time and attention from the Company's management that would otherwise be directed at developing its existing business. In addition, the Company could discover undisclosed liabilities resulting from any acquisitions for which it may become responsible. Further, the benefits that the Company anticipates from these acquisitions may not develop.
System Failure or Cybersecurity Breaches of the Company's Network Security Could Subject the Company to Increased Operating Costs, as Well as Litigation and Other Potential Losses
The computer systems and network infrastructure that the Company uses could be vulnerable to unforeseen hardware and cybersecurity issues, including “hacking” and “identity theft.” The Company's operations are dependent upon its ability to protect its computer equipment against damage from fire, power loss, telecommunications failure or a similar catastrophic event. Any damage or failure that causes an interruption in the Company's operations could have an adverse effect on its financial condition and results of operations. In addition, the Company's operations are dependent upon its ability to protect the computer systems and network infrastructure utilized by the Company, including our Internet banking activities, against damage from physical break-ins, cybersecurity breaches and other disruptive problems caused by the Internet or other users. Such computer break-ins and other disruptions would jeopardize the security of information stored in and transmitted through the Company's computer systems and network infrastructure, which may result in significant liability to the Company, damage its reputation and inhibit current and potential customers from its using Internet banking services.
Despite efforts to ensure the integrity of our systems, we will not be able to anticipate all security breaches of these types, nor will we be able to implement guaranteed preventive measures against such security breaches. Persistent attackers may succeed in penetrating defenses given enough resources, time and motive. The techniques used by cyber criminals change frequently, may not be recognized until launched and can originate from a wide variety of sources, including outside groups such as external service providers, organized crime affiliates, terrorist organizations or hostile foreign governments. These risks may increase in the future as we continue to increase our mobile-payment and other Internet-based product offerings and expand our internal usage of web-based products and applications.
A successful attack to our system security could cause us serious negative consequences, including significant disruption of operations, misappropriation of confidential information, or damage to our computers or systems or those of our customers and counterparties. A successful security breach could result in violations of applicable privacy and other laws, financial loss to us or to our customers, loss of confidence in our security measures, significant litigation exposure, and harm to our reputation, all of which could have a material adverse effect on the Company.
The Company's Risk Management Practices May Prove to be Inadequate or Not Fully Effective
The Company's risk management framework seeks to mitigate risk and appropriately balance risk and return. The Company has established policies and procedures intended to identify, monitor and manage the types of risk which it is subject to, including credit risk, market risk, liquidity risk, operational risk and reputational risk. Although the Company has devoted significant resources to develop its risk management policies and procedures and expects to continue to do so in the future, these policies and procedures, as well as its risk management techniques, may not be fully effective. In addition, as regulations and markets in which the Company operates continue to evolve, its risk management framework may not always keep sufficient pace with those changes. If the Company's risk management framework does not effectively identify or mitigate its risks, the Company could suffer unexpected losses and could be materially adversely affected. Management of the Company's risks in some cases depends upon the use of analytical and/or forecasting models. If the models the Company uses to mitigate these
17
risks are inadequate, it may incur increased losses. In addition, there may be risks that exist, or that develop in the future, that the Company has not appropriately anticipated, identified or mitigated.
The Company’s Controls and Procedures May Fail or Be Circumvented
Any failure or circumvention of the Company’s controls and procedures or failure to comply with regulations related to controls and procedures could have a material adverse effect on the Company’s business, results of operations and financial condition. Management regularly reviews and updates the Company’s internal controls, disclosure controls and procedures, and corporate governance policies and procedures. Any system of controls, no matter how well designed and operated, is based in part on certain assumptions and can provide only reasonable, not absolute, assurances that the objectives of the system are met.
Significant Legal Actions Could Result in Substantial Liabilities
From time to time, the Company is subject to claims related to its operations. These claims and legal actions, including supervisory actions by its regulators, could involve large monetary claims and cause the Company to incur significant defense expenses. As a result, the Company may be exposed to substantial liabilities, which could negatively affect its shareholders’ equity and financial results.
The Company Relies Heavily on Its Management Team, and the Unexpected Loss of Key Management May Adversely Affect Its Operations
The Company's success to date has been strongly influenced by its ability to attract and to retain senior management experienced in banking in the markets it serves. The Company's ability to retain executive officers and the current management teams will continue to be important to the successful implementation of its strategies. The Company has employment agreements with these key employees in the event of a change of control, as well as confidential information, non-solicitation and non-competition agreements related to its stock options. No other employment agreements exist with key employees. The unexpected loss of services of any key management personnel, or the inability to recruit and retain qualified personnel in the future, could have an adverse effect on the Company's business and financial results.
Item 1B.Unresolved Staff Comments
None.
Item 2.Properties
City National owns the Company’s executive office, located at 25 Gatewater Road, Charleston, West Virginia. This facility houses the Company's executive and administrative personnel. City National owns sixty-five bank branch locations and leases twenty-one bank branch locations, pursuant to operating leases. All of the properties are suitable and adequate for their current operations.
Item 3.Legal Proceedings
The Company is engaged in various legal actions that it deems to be in the ordinary course of business. As these legal actions are resolved, the Company could realize positive and/or negative impact to its financial performance in the period in which these legal actions are ultimately decided. There can be no assurance that current actions will have immaterial results, either positive or negative, or that no material actions may be presented in the future.
Item 4.Mine Safety Disclosures
None.
18
PART II
Item 5.Market for Registrant's Common Equity, Related Stockholder Matters, and Issuer Purchases of Equity Securities
Common Stock Market and Dividends
The Company’s common stock trades on the NASDAQ Global Select Market under the symbol "CHCO". This table sets forth the cash dividends declared per share and information regarding the closing market prices per share of the Company’s common stock for the periods indicated. The price ranges are based on transactions as reported on the NASDAQ Global Select Market. At February 27, 2018, there were 2,606 shareholders of record.
Cash Dividends Per Share | Market Value | ||||||||
Low | High | ||||||||
2017 | |||||||||
Fourth Quarter | $ | 0.46 | $ | 65.50 | $ | 73.98 | |||
Third Quarter | 0.44 | 59.94 | 71.91 | ||||||
Second Quarter | 0.44 | 61.34 | 72.78 | ||||||
First Quarter | 0.44 | 60.86 | 67.93 | ||||||
2016 | |||||||||
Fourth Quarter | $ | 0.43 | $ | 48.49 | $ | 68.29 | |||
Third Quarter | 0.43 | 44.53 | 50.60 | ||||||
Second Quarter | 0.43 | 43.06 | 50.14 | ||||||
First Quarter | 0.43 | 40.82 | 47.78 | ||||||
The Company generally pays dividends on a quarterly basis. As noted in the section captioned "Dividends and Other Payments" included in Item 1. Business, the section captioned "Liquidity" included in Item 7. Management’s Discussion and Analysis of Financial Condition and Results of Operations and in Note Seventeen of Notes to Consolidated Financial Statements, the Company’s ability to pay dividends to its shareholders is dependent upon the ability of City National to pay dividends to the Company.
At-The-Market Common Stock Offering
On December 19, 2016, the Company announced that it had filed a prospectus supplement to its existing shelf registration statement on Form S-3 for the sale of its common stock having an aggregate value of up to $55 million through an "at-the-market" equity offering program. Through the year ended December 31, 2017, the Company has sold approximately 548,000 common shares at a weighted average price of $64.82, net of broker fees. The Company has sold no shares since the first quarter of 2017. To date, the Company has received $36.4 million in gross proceeds. Under the program, the Company has the ability to receive an additional $18.6 million in gross proceeds from the sale of common shares.
19
Stock-Based Compensation Plan
Information regarding stock-based compensation awards outstanding and available for future grants as of December 31, 2017, segregated between stock-based compensation plans approved by shareholders and stock-based compensation plans not approved by shareholders, is presented in the table below. Additional information regarding stock-based compensation plans is presented in Note Thirteen, Employee Benefit Plans, of Notes to Consolidated Financial Statements.
Plan Category | Number of Shares to be Issued Upon Exercise of Outstanding Awards (a) | Weighted-average exercise price of outstanding awards (b) | Number of securities remaining available for future issuance under equity compensation plans (excluding securities reflected in column (a)) (c) | ||||
Plans approved by shareholders | 87,605 | $ | 47.15 | 559,815 | |||
Plans not approved by shareholders | — | — | — | ||||
Total | 87,605 | $ | 47.15 | 559,815 | |||
Stock Performance
The following graph sets forth the cumulative total shareholder return (assuming reinvestment of dividends) to the Company’s shareholders during the five-year period ended December 31, 2017, as well as an overall stock market index (The Nasdaq Stock Market Index) and the Company’s Peer Group ("Peer Group"). The Peer Group consists of twenty-three banking institutions that (i) are over $2 billion but less than $9.5 billion in assets, (ii) have a return on average assets and a return on average equity performance ratios greater than 0%, (iii) derive at least fifteen percent of their total revenues from non-interest income, (iv) have a loan portfolio comprised of less than eighty-five percent commercial loans, (v) have more than thirty branches, and (vi) are headquartered in Delaware, Illinois, Indiana, Kentucky, Maryland, North Carolina, Ohio, Pennsylvania, Tennessee, Virginia and New York (excluding New York City), excluding: companies in top 5 metro areas (MSAs), thrifts and thinly traded companies. The trading symbols for such financial institutions include: AROW, BUSE, CTBI, FBK, FBNC, FCBC, FCF, FISI, FMBH, FRME, GABC, PEBO, PRK, RBCAA, SASR, SRCE, STBA, SYBT, THFF, TMP, UCFC, UVSP and WSFS. The stock performance shown on the graph below is not necessarily indicative of future price performance.
20
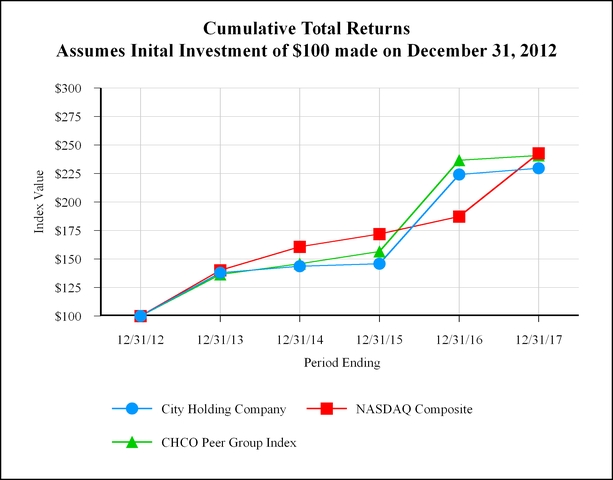
2012 | 2013 | 2014 | 2015 | 2016 | 2017 | |
City Holding Company | $100.00 | $137.91 | $143.58 | $145.85 | $224.10 | $229.56 |
NASDAQ Composite | $100.00 | $140.12 | $160.78 | $171.97 | $187.22 | $242.71 |
Peer Group | $100.00 | $136.43 | $145.94 | $156.66 | $236.53 | $240.82 |
This graph shall not be deemed to be incorporated by reference into any filing under the Securities Act of 1933, as amended, or the Securities Exchange Act of 1934, as amended, unless the Company specifically incorporates this report by reference. It will not be otherwise filed under such Acts.
21
Item 6.Selected Financial Data
Table One
Five-Year Financial Summary
(in thousands, except per share data)
2017 | 2016 | 2015(2) | 2014 | 2013(1) | |||||||||||
Summary of Operations | |||||||||||||||
Total interest income | $ | 142,930 | $ | 132,152 | $ | 127,074 | $ | 129,566 | $ | 138,539 | |||||
Total interest expense | 16,805 | 13,207 | 11,830 | 11,960 | 13,301 | ||||||||||
Net interest income | 126,125 | 118,945 | 115,244 | 117,606 | 125,238 | ||||||||||
Provision for loan losses | 3,006 | 4,395 | 6,988 | 4,054 | 6,848 | ||||||||||
Total non-interest income | 63,607 | 58,825 | 67,206 | 58,722 | 58,006 | ||||||||||
Total non-interest expenses | 95,981 | 96,164 | 92,951 | 95,041 | 102,906 | ||||||||||
Income before income taxes | 90,745 | 77,211 | 82,511 | 77,233 | 73,490 | ||||||||||
Income tax expense | 36,435 | 25,083 | 28,414 | 24,271 | 25,275 | ||||||||||
Net income available to common shareholders | 54,310 | 52,128 | 54,097 | 52,962 | 48,215 | ||||||||||
Per Share Data | |||||||||||||||
Net income basic | $ | 3.49 | $ | 3.46 | $ | 3.54 | $ | 3.40 | $ | 3.07 | |||||
Net income diluted | 3.48 | 3.45 | 3.53 | 3.38 | 3.04 | ||||||||||
Cash dividends declared | 1.78 | 1.72 | 1.68 | 1.60 | 1.48 | ||||||||||
Book value per share | 32.17 | 29.25 | 27.62 | 25.79 | 24.61 | ||||||||||
Selected Average Balances | |||||||||||||||
Total loans | $ | 3,082,448 | $ | 2,920,837 | $ | 2,691,304 | $ | 2,593,597 | $ | 2,523,755 | |||||
Securities | 582,124 | 495,206 | 383,685 | 365,904 | 360,860 | ||||||||||
Interest-earning assets | 3,691,714 | 3,426,158 | 3,084,722 | 2,968,706 | 2,905,783 | ||||||||||
Deposits | 3,298,385 | 3,166,817 | 2,947,543 | 2,824,985 | 2,821,573 | ||||||||||
Long-term debt | 16,495 | 16,495 | 16,495 | 16,495 | 16,495 | ||||||||||
Total shareholders’ equity | 492,668 | 431,031 | 415,051 | 395,940 | 373,102 | ||||||||||
Total assets | 4,079,674 | 3,835,081 | 3,564,730 | 3,404,818 | 3,378,351 | ||||||||||
Selected Year-End Balances | |||||||||||||||
Net loans | $ | 3,108,574 | $ | 3,026,496 | $ | 2,843,283 | $ | 2,631,916 | $ | 2,585,622 | |||||
Securities | 628,985 | 539,604 | 471,318 | 354,686 | 370,120 | ||||||||||
Interest-earning assets | 3,784,453 | 3,611,706 | 3,345,136 | 3,016,477 | 2,986,194 | ||||||||||
Deposits | 3,315,634 | 3,231,653 | 3,083,975 | 2,872,787 | 2,785,133 | ||||||||||
Long-term debt | 16,495 | 16,495 | 16,495 | 16,495 | 16,495 | ||||||||||
Total shareholders’ equity | 502,507 | 442,438 | 419,272 | 390,853 | 387,623 | ||||||||||
Total assets | 4,132,281 | 3,984,403 | 3,714,059 | 3,461,633 | 3,368,238 | ||||||||||
Performance Ratios | |||||||||||||||
Return on average assets | 1.33 | % | 1.36 | % | 1.52 | % | 1.56 | % | 1.43 | % | |||||
Return on average equity | 11.0 | 12.1 | 13.0 | 13.4 | 12.9 | ||||||||||
Return on average tangible common equity | 13.1 | 14.8 | 15.8 | 16.5 | 16.2 | ||||||||||
Net interest margin | 3.46 | 3.50 | 3.76 | 3.98 | 4.33 | ||||||||||
Efficiency ratio | 51.5 | 54.8 | 53.7 | 53.7 | 55.8 | ||||||||||
Dividend payout ratio | 51.0 | 49.7 | 47.5 | 47.1 | 48.2 | ||||||||||
22
Asset Quality | ||||||||||||||||
Net charge-offs to average loans | 0.13 | % | 0.13 | % | 0.29 | % | 0.18 | % | 0.20 | % | ||||||
Provision for loan losses to average loans | 0.10 | 0.15 | 0.26 | 0.16 | 0.27 | |||||||||||
Allowance for loan losses to nonperforming loans | 178.39 | 140.10 | 110.37 | 127.62 | 90.25 | |||||||||||
Allowance for loan losses to total loans | 0.60 | 0.65 | 0.67 | 0.76 | 0.79 | |||||||||||
Consolidated Capital Ratios | ||||||||||||||||
CET 1 Capital | 15.1 | % | 13.3 | % | 13.7 | % | * | * | ||||||||
Tier 1 Capital | 15.7 | 13.9 | 14.3 | 13.4 | 13.0 | |||||||||||
Total Capital | 16.3 | 14.7 | 15.1 | 14.2 | 13.8 | |||||||||||
Tier 1 Leverage | 11.0 | 10.2 | 10.2 | 9.9 | 9.8 | |||||||||||
Average equity to average assets | 12.1 | 11.2 | 11.6 | 11.6 | 11.0 | |||||||||||
Tangible equity to tangible assets (end of period) | 10.5 | 9.3 | 9.3 | 9.3 | 9.5 | |||||||||||
Full-time equivalent employees | 839 | 847 | 853 | 889 | 923 | |||||||||||
*Basel III CET 1 ratio requirements were effective beginning January 1, 2015 and were not required for prior periods. | ||||||||||||||||
(1) - In January 2013, the Company acquired Community Financial Corporation and its wholly owned subsidiary, Community Bank. | ||||||||||||||||
(2) - In January 2015, the Company sold its insurance operations, CityInsurance. In November 2015, the Company acquired three branches in Lexington, Kentucky from American Founder's Bank. | ||||||||||||||||
23
Item 7.Management's Discussion and Analysis of Financial Condition and Results of Operations
CITY HOLDING COMPANY
City Holding Company (the “Company”), a West Virginia corporation headquartered in Charleston, West Virginia, is a registered financial holding company under the Bank Holding Company Act and conducts its principal activities through its wholly owned subsidiary, City National Bank of West Virginia ("City National"). City National is a retail and consumer-oriented community bank with 86 bank branches in West Virginia (57), Virginia (14), Kentucky (12) and Ohio (3). City National provides credit, deposit, and trust and investment management services to its customers in a broad geographical area that includes many rural and small community markets in addition to larger cities including Charleston (WV), Huntington (WV), Martinsburg (WV), Winchester (VA), Staunton (VA), Virginia Beach (VA), Ashland (KY) and Lexington (KY). In the Company's key markets, the Company's primary subsidiary, City National, generally ranks in the top three relative to deposit market share and the top two relative to branch share (Charleston/Huntington MSA, Beckley/Lewisburg counties, Staunton MSA and Winchester, VA/WV Eastern Panhandle counties). In addition to its branch network, City National's delivery channels include automated-teller-machines ("ATMs"), interactive-teller-machines ("ITMs"), mobile banking, debit cards, interactive voice response systems, and Internet technology. The Company’s business activities are currently limited to one reportable business segment, which is community banking.
In January 2015, the Company sold its insurance operations, CityInsurance, to The Hilb Group effective January 1, 2015. As a result of this sale, the Company recognized a one-time after tax gain of $5.8 million in the first quarter of 2015.
On November 6, 2015, the Company purchased three branch locations from American Founders Bank, Inc. (“AFB”) located in Lexington, Kentucky. The Company acquired approximately $119 million in performing loans and assumed deposit liabilities of approximately $145 million. The Company paid AFB a deposit premium of 5.5% on non-time deposits and 1.0% on premium loan balances acquired.
CRITICAL ACCOUNTING POLICIES
The accounting policies of the Company conform to U.S. generally accepted accounting principles and require management to make estimates and develop assumptions that affect the amounts reported in the financial statements and related footnotes. These estimates and assumptions are based on information available to management as of the date of the financial statements. Actual results could differ significantly from management’s estimates. As this information changes, management’s estimates and assumptions used to prepare the Company’s financial statements and related disclosures may also change. The most significant accounting policies followed by the Company are presented in Note One of the Notes to Consolidated Financial Statements included herein. Based on the valuation techniques used and the sensitivity of financial statement amounts to the methods, assumptions, and estimates underlying those amounts, management has identified: (i) the determination of the allowance for loan losses and (ii) income taxes to be the accounting areas that require the most subjective or complex judgments and, as such, could be most subject to revision as new information becomes available.
The Allowance and Provision for Loan Losses section of this Annual Report on Form 10-K provides management’s analysis of the Company’s allowance for loan losses and related provision. The allowance for loan losses is maintained at a level that represents management’s best estimate of probable losses in the loan portfolio. Management’s determination of the appropriateness of the allowance for loan losses is based upon an evaluation of individual credits in the loan portfolio, historical loan loss experience, current economic conditions, and other relevant factors. This determination is inherently subjective, as it requires material estimates including the amounts and timing of future cash flows expected to be received on impaired loans that may be susceptible to significant change. The allowance for loan losses related to loans considered to be impaired is generally evaluated based on the discounted cash flows using the impaired loan’s initial effective interest rate or the fair value of the collateral for certain collateral dependent loans. The allowance not specifically allocated to individual credits is generally determined by analyzing potential exposure and other qualitative factors that could negatively impact the overall credit risk of the loan portfolio. Loans not individually evaluated for impairment are grouped by pools with similar risk characteristics and the related historical loss rates are adjusted to reflect current inherent risk factors, such as unemployment, overall economic conditions, concentrations of credit, loan growth, classified and impaired loan trends, staffing, adherence to lending policies, and loss trends.
The Income Taxes section of this Annual Report on Form 10-K provides management’s analysis of the Company’s income taxes. The Company is subject to federal and state income taxes in the jurisdictions in which it conducts business. In computing the provision for income taxes, management must make judgments regarding interpretation of laws in those jurisdictions. Because the application of tax laws and regulations for many types of transactions is susceptible to varying interpretations, amounts reported in the financial statements could be changed at a later date upon final determinations by taxing
24
authorities. On a quarterly basis, the Company estimates its annual effective tax rate for the year and uses that rate to provide for income taxes on a year-to-date basis. The Company's unrecognized tax benefits could change over the next twelve months as a result of various factors. The Company is currently open to audit under the statute of limitations by the Internal Revenue Service and various state taxing authorities for the years ended December 31, 2014 through 2016.
FINANCIAL SUMMARY
The Company’s financial performance over the previous three years is summarized in the following table:
2017 | 2016 | 2015 | |||||||
Net income available to common shareholders (in thousands) | $ | 54,310 | $ | 52,128 | $ | 54,097 | |||
Earnings per common share, basic | $ | 3.49 | $ | 3.46 | $ | 3.54 | |||
Earnings per common share, diluted | $ | 3.48 | $ | 3.45 | $ | 3.53 | |||
ROA* | 1.33 | % | 1.36 | % | 1.52 | % | |||
ROE* | 11.0 | % | 12.1 | % | 13.0 | % | |||
ROATCE* | 13.1 | % | 14.8 | % | 15.8 | % | |||
*ROA (Return on Average Assets) is a measure of the effectiveness of asset utilization. ROE (Return on Average Equity) is a measure of the return on shareholders’ investment. ROATCE (Return on Average Tangible Common Equity) is a measure of the return on shareholders’ equity less intangible assets.
The Company’s tax equivalent net interest income increased $7.8 million, or 6.5%, from $119.8 million in 2016 to $127.6 million in 2017 (see Net Interest Income). The Company’s provision for loan losses decreased $1.4 million from $4.4 million in 2016 to $3.0 million in 2017 (see Allowance and Provision for Loan Losses). Non-interest income increased $4.8 million and non-interest expense decreased $0.2 million (see Non-Interest Income and Expense). As a result of a reduction in the corporate income tax rate effective January 1, 2018, the Company reassessed its deferred tax assets and liabilities, which resulted in additional deferred income taxes of $7.1 million (see Income Taxes). As a result, the Company's net income increased $2.2 million from $52.1 million in 2016 to $54.3 million in 2017 and the Company achieved a return on assets of 1.33%, a return on tangible equity of 13.1% and an efficiency ratio of 51.5%.
BALANCE SHEET ANALYSIS
Selected balance sheet fluctuations are summarized in the following table (in millions):
December 31, | |||||||||||
2017 | 2016 | $ Change | % Change | ||||||||
Investment securities | $ | 629.0 | $ | 539.6 | $ | 89.4 | 16.6 | % | |||
Gross loans | 3,127.4 | 3,046.2 | 81.2 | 2.7 | |||||||
Deferred tax assets, net | 11,913 | 28,043 | (16.1 | ) | (57.4 | ) | |||||
Total deposits | 3,315.6 | 3,231.7 | 83.9 | 2.6 | |||||||
Shareholders' equity | 502.5 | 442.4 | 60.1 | 13.6 | |||||||
Investment securities increased $89 million, or 16.6%, from $540 million at December 31, 2016, to $629 million at December 31, 2017. During 2017, in conjunction with its interest rate risk management strategy, the Company elected to grow investment balances and maintain cash balances to enhance net interest income.
Gross loans increased $81 million, or 2.7%, from $3.05 billion at December 31, 2016 to $3.13 billion at December 31, 2017. Commercial loans increased $70.9 million (5.0%) and residential real estate loans increased $16.8 million (1.2%) from December 31, 2016 to December 31, 2017.
Deferred tax assets decreased $16 million, or (57.4)%, from $28 million at December 31, 2016 to $12 million at December 31, 2017. This is primarily due to the remeasurement of the Company's net deferred tax assets associated with the
25
enactment of the Tax Cuts and Jobs Act ("TCJA"). This remeasurement decreased the Company's net deferred tax assets by $7.1 million. In addition, the deferred tax asset associated with other-than-temporarily impaired investment securities decreased by $3.4 million due to the sales of those securities during the year (see Income taxes).
Total deposits increased $84 million, or 2.6%, from $3.23 billion at December 31, 2016 to $3.32 billion at December 31, 2017. The increase is due to growth in interest bearing demand deposits of $73.4 million and growth in time deposits of $42.1 million. These increases were partially offset by decreases in savings deposit accounts ($25.8 million) and noninterest-bearing deposits ($5.6 million).
Shareholders' equity increased $60.1 million from December 31, 2016 to December 31, 2017 (see Capital Resources).
26
TABLE TWO
AVERAGE BALANCE SHEETS AND NET INTEREST INCOME
(In thousands)
2017 | 2016 | 2015 | ||||||||||||||||||||||||
Average Balance | Interest | Yield/ Rate | Average Balance | Interest | Yield/ Rate | Average Balance | Interest | Yield/ Rate | ||||||||||||||||||
Assets | ||||||||||||||||||||||||||
Loan portfolio(1): | ||||||||||||||||||||||||||
Residential real estate(2),(3) | $ | 1,598,579 | $ | 63,649 | 3.98 | % | $ | 1,565,079 | $ | 60,736 | 3.88 | % | $ | 1,474,631 | $ | 57,692 | 3.91 | % | ||||||||
Commercial, financial, and agriculture(3),(4) | 1,450,144 | 58,243 | 4.02 | 1,318,094 | 52,812 | 4.01 | 1,175,707 | 52,177 | 4.44 | |||||||||||||||||
Installment loans to individuals(3),(5) | 33,725 | 2,514 | 7.45 | 37,664 | 2,917 | 7.75 | 40,966 | 3,442 | 8.40 | |||||||||||||||||
Previously securitized loans(6) | — | 1,346 | — | — | 1,673 | — | — | 1,796 | — | |||||||||||||||||
Total loans | 3,082,448 | 125,752 | 4.08 | 2,920,837 | 118,138 | 4.04 | 2,691,304 | 115,107 | 4.28 | |||||||||||||||||
Securities: | ||||||||||||||||||||||||||
Taxable | 492,783 | 14,387 | 2.92 | 444,110 | 12,392 | 2.79 | 352,296 | 10,830 | 3.07 | |||||||||||||||||
Tax-exempt(7) | 89,341 | 4,163 | 4.66 | 51,096 | 2,494 | 4.88 | 31,389 | 1,749 | 5.57 | |||||||||||||||||
Total securities | 582,124 | 18,550 | 3.19 | 495,206 | 14,886 | 3.01 | 383,685 | 12,579 | 3.28 | |||||||||||||||||
Deposits in depository institutions | 27,142 | 85 | 0.31 | 10,115 | — | — | 9,733 | — | — | |||||||||||||||||
Total interest-earning assets | 3,691,714 | 144,387 | 3.91 | 3,426,158 | 133,024 | 3.88 | 3,084,722 | 127,686 | 4.14 | |||||||||||||||||
Cash and due from banks | 85,473 | 95,295 | 180,965 | |||||||||||||||||||||||
Bank premises and equipment | 73,540 | 76,056 | 76,136 | |||||||||||||||||||||||
Other assets | 249,193 | 257,525 | 243,902 | |||||||||||||||||||||||
Less: allowance for loan losses | (20,246 | ) | (19,953 | ) | (20,995 | ) | ||||||||||||||||||||
Total assets | $ | 4,079,674 | $ | 3,835,081 | $ | 3,564,730 | ||||||||||||||||||||
Liabilities | ||||||||||||||||||||||||||
Interest-bearing demand deposits | $ | 705,412 | 643 | 0.09 | % | $ | 685,399 | 615 | 0.09 | % | $ | 644,961 | 505 | 0.08 | % | |||||||||||
Savings deposits | 832,512 | 1,311 | 0.16 | 772,296 | 975 | 0.13 | 706,926 | 712 | 0.10 | |||||||||||||||||
Time deposits(3) | 1,067,181 | 12,872 | 1.21 | 1,029,172 | 10,462 | 1.02 | 1,005,232 | 9,669 | 0.96 | |||||||||||||||||
Short-term borrowings | 230,529 | 1,214 | 0.53 | 176,065 | 472 | 0.27 | 145,199 | 327 | 0.23 | |||||||||||||||||
Long-term debt | 16,495 | 765 | 4.64 | 16,495 | 683 | 4.14 | 16,495 | 617 | 3.74 | |||||||||||||||||
Total interest-bearing liabilities | 2,852,129 | 16,805 | 0.59 | 2,679,427 | 13,207 | 0.49 | 2,518,813 | 11,830 | 0.47 | |||||||||||||||||
Noninterest-bearing demand deposits | 693,280 | 679,950 | 590,424 | |||||||||||||||||||||||
Other liabilities | 41,597 | 44,673 | 40,442 | |||||||||||||||||||||||
Total shareholders’ equity | 492,668 | 431,031 | 415,051 | |||||||||||||||||||||||
Total liabilities and shareholders’ equity | $ | 4,079,674 | $ | 3,835,081 | $ | 3,564,730 | ||||||||||||||||||||
Net interest income | $ | 127,582 | $ | 119,817 | $ | 115,856 | ||||||||||||||||||||
Net yield on earning assets | 3.46 | % | 3.50 | % | 3.76 | % | ||||||||||||||||||||
1. | For purposes of this table, non-accruing loans have been included in average balances and loan fees, which are immaterial, have been included in interest income. |
2.Includes the Company's residential real estate and home equity loan categories.
3. | Included in the above table are the following amounts (in thousands) for the accretion of the fair value adjustments related to the Company's recent acquisitions: |
2017 | 2016 | 2015 | |||||||||
Residential real estate | $ | 530 | $ | 698 | $ | 893 | |||||
Commercial, financial, and agriculture | 1,345 | 1,505 | 4,830 | ||||||||
Installment loans to individuals | 44 | 112 | 275 | ||||||||
Time deposits | 16 | 592 | 687 | ||||||||
Total | $ | 1,935 | $ | 2,907 | $ | 6,685 | |||||
27
4.Includes the Company’s commercial and industrial and commercial real estate loan categories.
5.Includes the Company’s consumer and DDA overdrafts loan categories.
6.Effective January 1, 2012, the carrying value of the Company's previously securitized loans was reduced to $0.
7.Computed on a fully federal tax-equivalent basis assuming a tax rate of approximately 35%.
NET INTEREST INCOME
2017 vs. 2016
The Company's net interest income increased from $118.9 million for the year ended December 31, 2016 to $126.1 million for the year ended December 31, 2017. The Company’s tax equivalent net interest income increased $7.8 million, or 6.5%, from $119.8 million in 2016 to $127.6 million in 2017. This increase was due primarily to higher average balances on commercial loans ($132.0 million) which increased interest income by $5.1 million, and residential real estate loans ($33.5 million) which increased interest income by $1.3 million as compared to the year ended December 31, 2016. Increased interest yields on residential real estate loans also increased net interest income by $1.8 million compared to the year ended December 31, 2016. In addition, higher average investment balances ($86.9 million) increased investment income by $3.2 million. These increases were partially offset by increased interest expense on interest bearing deposits ($3.0 million), primarily due to an increase in the cost of funds, and lower accretion from fair value adjustments on recent acquisitions ($1.0 million). The Company’s reported net interest margin decreased from 3.50% for the year ended December 31, 2016 to 3.46% for the year ended December 31, 2017. Excluding the favorable impact of the accretion from fair value adjustments, the net interest margin would have been 3.40% for the year ended December 31, 2017 and 3.41% for the year ended December 31, 2016.
Average interest-earning assets increased $266 million from 2016 to 2017, due to increases in commercial, financial, and agriculture loans ($132 million), investment securities ($87 million) and residential real estate loans ($34 million). Average interest-bearing liabilities increased $173 million from 2016 due to increases in savings deposits ($60 million), short-term borrowings ($54 million), time deposits ($38 million) and interest-bearing demand deposits ($20 million).
2016 vs. 2015
The Company's net interest income increased from $115.2 million for the year ended December 31, 2015 to $118.9 million for the year ended December 31, 2016. The Company’s tax equivalent net interest income increased $4.0 million, or 3.4%, from $115.9 million in 2015 to $119.8 million in 2016. This increase was due primarily to an increase in average loan balances from organic growth ($127 million) and from loans associated with the acquisition of three branches in the Lexington, Kentucky market in November 2015 (approximately $102 million in loans) contributing additional net interest income of $9.0 million in 2016. In addition, higher average investment balances ($111.5 million) increased net interest income by $3.9 million. During 2016, in conjunction with its interest rate risk management strategy, the Company elected to grow investment balances and reduce cash balances to enhance net interest income. As part of this strategy, the Company purchased tax-exempt municipal securities to improve its earnings by lowering its effective income tax rate. As a result of this strategy, the Company's overnight borrowings increased during 2016 . These increases in net interest income were partially offset by lower accretion from fair value adjustments on recent acquisitions that decreased net interest income $3.8 million ($6.7 million in 2015 compared to $2.9 million in 2016) and margin compression, which lowered net interest income $3.9 million. The Company’s reported net interest margin decreased from 3.76% for the year ended December 31, 2015 to 3.50% for the year ended December 31, 2016. Excluding the favorable impact of the accretion from fair value adjustments on recent acquisitions, the net interest margin would have been 3.41% for the year ended December 31, 2016 and 3.54% for the year ended December 31, 2015. This decrease was primarily caused by loan yields (excluding accretion) compressing from 4.05% for the year ended December 31, 2015 to 3.96% for the year ended December 31, 2016 and by the yield on investment securities decreasing from 3.28% to 3.01% for the same period.
Average interest-earning assets increased $341 million from 2015 to 2016, due to increases in commercial, financial,
and agriculture loans ($142 million), investment securities ($112 million) and residential real estate loans ($90 million). Average
interest-bearing liabilities increased $161 million from 2015 due to increases in savings deposits ($65 million), interest-bearing
demand deposits ($40 million), short-term borrowings ($31 million) and time deposits ($24 million).
28
TABLE THREE
RATE/VOLUME ANALYSIS OF CHANGES IN INTEREST INCOME AND INTEREST EXPENSE
(In thousands)
2017 vs. 2016 Increase (Decrease) Due to Change In: | 2016 vs. 2015 Increase (Decrease) Due to Change In: | |||||||||||||||||
Volume | Rate | Net | Volume | Rate | Net | |||||||||||||
Interest-earning assets: | ||||||||||||||||||
Loan portfolio | ||||||||||||||||||
Residential real estate | $ | 1,300 | $ | 1,613 | $ | 2,913 | $ | 3,539 | $ | (495 | ) | $ | 3,044 | |||||
Commercial, financial, and agriculture | 5,291 | 140 | 5,431 | 6,319 | (5,684 | ) | 635 | |||||||||||
Installment loans to individuals | (305 | ) | (98 | ) | (403 | ) | (277 | ) | (248 | ) | (525 | ) | ||||||
Previously securitized loans | — | (327 | ) | (327 | ) | — | (123 | ) | (123 | ) | ||||||||
Total loans | 6,286 | 1,328 | 7,614 | 9,581 | (6,550 | ) | 3,031 | |||||||||||
Securities: | ||||||||||||||||||
Taxable | 1,358 | 637 | 1,995 | 2,822 | (1,260 | ) | 1,562 | |||||||||||
Tax-exempt(1) | 1,867 | (198 | ) | 1,669 | 1,098 | (353 | ) | 745 | ||||||||||
Total securities | 3,225 | 439 | 3,664 | 3,920 | (1,613 | ) | 2,307 | |||||||||||
Deposits in depository institutions | $ | — | $ | 85 | $ | 85 | $ | — | $ | — | $ | — | ||||||
Total interest-earning assets | $ | 9,511 | $ | 1,852 | $ | 11,363 | $ | 13,501 | $ | (8,163 | ) | $ | 5,338 | |||||
Interest-bearing liabilities: | ||||||||||||||||||
Interest-bearing demand deposits | $ | 18 | $ | 10 | $ | 28 | $ | 32 | $ | 78 | $ | 110 | ||||||
Savings deposits | 76 | 260 | 336 | 66 | 197 | 263 | ||||||||||||
Time deposits | 386 | 2,024 | 2,410 | 230 | 563 | 793 | ||||||||||||
Short-term borrowings | 146 | 596 | 742 | 70 | 75 | 145 | ||||||||||||
Long-term debt | — | 82 | 82 | — | 66 | 66 | ||||||||||||
Total interest-bearing liabilities | $ | 626 | $ | 2,972 | $ | 3,598 | $ | 398 | $ | 979 | $ | 1,377 | ||||||
Net Interest Income | $ | 8,885 | $ | (1,120 | ) | $ | 7,765 | $ | 13,103 | $ | (9,142 | ) | $ | 3,961 | ||||
1. | Fully federal taxable equivalent using a tax rate of approximately 35%. |
29
Non-GAAP Financial Measures
Management of the Company uses measures in its analysis of the Company's performance other than those in accordance with generally accepted accounting principals in the United States of America ("GAAP"). These measures are useful when evaluating the underlying performance of the Company's operations. The Company's management believes that these non-GAAP measures enhance comparability of results with prior periods and demonstrate the effects of significant gains and charges in the current period. The Company's management believes that investors may use these non-GAAP financial measures to evaluate the Company's financial performance without the impact of those items that may obscure trends in the Company's performance. These disclosures should not be viewed as a substitute for financial measures determined in accordance with GAAP, nor are they comparable to non-GAAP financial measures that may be presented by other companies. The following table reconciles fully taxable equivalent net interest income and fully taxable equivalent net interest income excluding accretion with net interest income as derived from the Company's financial statements (in thousands):
TABLE FOUR
NON-GAAP FINANCIAL MEASURES
(In thousands)
2017 | 2016 | 2015 | |||||||
Net interest income ("GAAP") | $ | 126,125 | $ | 118,945 | $ | 115,244 | |||
Taxable equivalent adjustment | 1,457 | 872 | 612 | ||||||
Net interest income, fully taxable equivalent | $ | 127,582 | $ | 119,817 | $ | 115,856 | |||
Average interest earning assets | $ | 3,691,714 | $ | 3,426,158 | $ | 3,084,722 | |||
Net interest margin | 3.46 | % | 3.50 | % | 3.76 | % | |||
Net interest income ("GAAP") | $ | 126,125 | $ | 118,945 | $ | 115,244 | |||
Taxable equivalent adjustment | 1,457 | 872 | 612 | ||||||
Accretion related to fair value adjustments | (1,935 | ) | (2,907 | ) | (6,685 | ) | |||
Net interest income, fully taxable equivalent, excluding accretion | $ | 125,647 | $ | 116,910 | $ | 109,171 | |||
Net interest margin (excluding accretion) | 3.40 | % | 3.41 | % | 3.54 | % | |||
Income Tax Expense ("GAAP") | $ | 36,435 | $ | 25,083 | $ | 28,414 | |||
FIN 48 | 331 | 554 | 592 | ||||||
Impact of effective tax rate decrease on deferred taxes | (7,069 | ) | — | — | |||||
Sale of insurance operations | $ | — | $ | — | $ | (1,282 | ) | ||
Income tax expense, excluding the impact of FIN 48, effective tax rate decrease on deferred taxes, and sale of insurance operations | $ | 29,697 | $ | 25,637 | $ | 27,724 | |||
Effective tax rate ("GAAP") | 40.2 | % | 32.5 | % | 33.6 | % | |||
Effective tax rate, excluding FIN 48, effective tax rate decrease, and sale of insurance operations | 32.7 | % | 33.2 | % | 34.4 | % | |||
NON-INTEREST INCOME AND NON-INTEREST EXPENSE
2017 vs. 2016
Selected income statement fluctuations are summarized in the following table (dollars in millions):
30
For the year ended December 31, | |||||||||||
2017 | 2016 | $ Change | % Change | ||||||||
Net investment security gains | $ | 4.5 | $ | 3.5 | $ | 1.0 | 27.4 | % | |||
Non-interest income, excluding net investment securities gains | 59.1 | 55.3 | 3.8 | 6.9 | |||||||
Non-interest expense | 96.0 | 96.2 | (0.2 | ) | (0.2 | ) | |||||
During the years ended December 31, 2017 and 2016, the Company realized investment gains of $4.5 million and $3.5 million, respectively, from the sale of pools of trust preferred securities, which represented a partial recovery of impairment charges previously recognized.
Exclusive of these gains, non-interest income increased $3.8 million to $59.1 million for the year ended December 31, 2017 as compared to $55.3 million for the year ended December 31, 2016. This is primarily due to increases in service charges of $1.9 million, or 7.0%, bank owned life insurance of $0.9 million, or 26.6% (primarily due to death benefit proceeds), trust revenues of $0.7 million, or 12.5%, and bankcard revenue of $0.6 million, or 3.7%.
Non-interest expenses decreased $0.2 million from $96.2 million for the year ended December 31, 2016 to $96.0 million for the year ended December 31, 2017. This is primarily due to decreases in occupancy related expenses of $0.6 million, or 5.6%, bankcard expenses of $0.5 million, or 12.0%, and FDIC insurance of $0.3 million, or 16.9%. These decreases were partially offset by increases in equipment and software related expenses of $0.5 million, or 7.2%, advertising of $0.3 million, or 11.8%, salaries and employee benefits of $0.2 million, or 0.3%, telecommunciation expenses of $0.2 million, or 9.7%, and repossessed asset losses, net of expenses, of $0.2 million or 17.4%.
2016 vs. 2015
Selected income statement fluctuations are summarized in the following table (dollars in millions):
For the year ended December 31, | |||||||||||
2016 | 2015 | $ Change | % Change | ||||||||
Net investment security gains | $ | 3.5 | $ | 2.1 | $ | 1.4 | 66.7 | % | |||
Gain on sale of insurance division | — | 11.1 | (11.1 | ) | (100.0 | ) | |||||
Non-interest income, excluding net investment securities gains and gain on sale of insurance division | 55.3 | 54.0 | 1.3 | 2.4 | |||||||
Non-interest expense | 96.2 | 93.0 | 3.2 | 3.4 | |||||||
During the years ended December 31, 2016 and 2015, the Company realized investment gains of $3.5 million and $2.1 million, respectively, from the call or sale of trust preferred securities, which represented a partial recovery of impairment charges previously recognized.
During the year ended December 31, 2015, the Company sold its insurance operations, CityInsurance, which resulted in the recognition of a pre-tax gain of $11.1 million.
Exclusive of these gains, non-interest income increased $1.3 million to $55.3 million for the year ended December 31, 2016 as compared to $54.0 million for the year ended December 31, 2015. This is primarily due to increases in bankcard revenue of $0.6 million, or 3.9%, trust revenues of $0.4 million, or 8.8%, and service charges of $0.4 million, or 1.5%.
Non-interest expenses increased $3.2 million from the year ended December 31, 2015 to the year ended December 31, 2016. During 2015, the Company recognized $0.6 million of acquisition and integration expenses associated with the acquisition of three branches in Lexington, Kentucky. Excluding acquisition related expenses, non-interest expenses increased $3.8 million from $92.4 million for the year ended December 31, 2015 to $96.2 million for the year ended December 31, 2016. This increase was largely due to an increase in salaries and employee benefits ($2.1 million) due to salary adjustments and increased health insurance costs. In addition, non-interest expenses increased $1.7 million due to the annual operating costs of the three branches acquired in November 2015 and from an increase of $0.5 million in bankcard expenses due to increased transaction volumes.
31
INCOME TAXES
The Company recorded income tax expense of $36.4 million, $25.1 million and $28.4 million in 2017, 2016 and 2015, respectively. The Company’s effective tax rates for 2017, 2016 and 2015 were 40.2%, 32.5% and 34.4%, respectively. A reconciliation of the effective tax rate to the statutory rate is included in Note Twelve of the Notes to Consolidated Financial Statements. On December 22, 2017, the President signed the Tax Cut and Jobs Act ("TCJA") into law. Among other things, the TCJA reduced the corporate income tax rate from 35% to 21%, effective January 1, 2018. This change required management to remeasure its deferred tax assets and liabilities at the new income tax rate. The provisional amount recorded as a result of the remeasurement was $7.1 million. Management continues to evaluate the TCJA and refine calculations which could potentially impact the measurement of these balances. In addition, during the years ended December 31, 2017, 2016 and 2015, the Company reduced income tax expense by $0.3 million, $0.5 million and $0.6 million, respectively due to the recognition of previously unrecognized tax positions resulting from the close of the statute of limitations for previous tax years. Also, as a result of differences between the book and tax basis of the assets that were sold in conjunction with the sale of CityInsurance, the Company’s income tax expense increased by $1.1 million during the year ended December 31, 2015. Exclusive of these items, the Company’s tax rate from operations was 32.7%, 33.2% and 33.6% for the years ended December 31, 2017, 2016 and 2015, respectively.
Deferred income taxes reflect the net tax effects of temporary differences between the carrying amount of assets and liabilities for financial reporting purposes and the amounts used for income tax purposes. The Company’s net deferred tax assets decreased from $28.0 million at December 31, 2016 to $11.9 million at December 31, 2017. The decrease is primarily driven by the income tax rate decrease as a result of the enactment of the TCJA. The components of the Company’s net deferred tax assets are disclosed in Note Twelve of the Notes to Consolidated Financial Statements. Realization of the most significant net deferred tax assets is primarily dependent on future events taking place that will reverse the current deferred tax assets. The deferred tax asset and/or liability associated with unrealized securities losses is the tax impact of the unrealized gains and/or losses on the Company’s available-for-sale security portfolio. At December 31, 2017 and 2016, the Company had a deferred tax asset of $0.2 million and $1.3 million, respectively, associated with unrealized securities losses. The impact of the Company’s unrealized losses is noted in the Company’s Consolidated Statements of Changes in Shareholders’ Equity as an adjustment to Accumulated Other Comprehensive Income (Loss). This deferred tax asset would be realized if the unrealized securities losses on the Company's securities were realized from either the sales or maturities of the related securities. At December 31, 2017 and 2016, the Company had a deferred tax asset of $0.4 million and $3.8 million, respectively, associated with other-than-temporarily impaired securities. The decrease of $3.4 million is primarily due to sales of other-than-temporarily impaired securities. The deferred tax asset associated with the allowance for loan losses decreased from $7.3 million at December 31, 2016 to $4.4 million at December 31, 2017. The decrease of $2.9 million is primarily due to the income tax rate decrease associated with the TCJA. The deferred tax asset associated with the allowance for loan losses is expected to be realized as additional loan charge-offs, which have already been provided for within the Company’s financial statements, are recognized for tax purposes. The Company believes that it is more likely than not that each of the deferred tax assets will be realized and that no valuation allowance was necessary as of December 31, 2017 or 2016.
LIQUIDITY
The Company evaluates the adequacy of liquidity at both the Parent Company level and at the banking subsidiary level. At the Parent Company level, the principal source of cash is dividends from its banking subsidiary, City National. Dividends paid by City National to the Parent Company are subject to certain legal and regulatory limitations. Generally, any dividends in amounts that exceed the earnings retained by City National in the current year plus retained net profits for the preceding two years must be approved by regulatory authorities. At December 31, 2017, City National could pay dividends up to $75.0 million without prior regulatory permission.
During 2017, the Parent Company used cash obtained from the dividends received primarily to: (1) pay common dividends to shareholders, (2) remit interest payments on the Company’s junior subordinated debentures and (3) fund repurchases
of the Company's common shares. Additional information concerning sources and uses of cash by the Parent Company is reflected in Note Nineteen of the Notes to Consolidated Financial Statements.
On December 19, 2016, the Company announced that it had filed a prospectus supplement to its existing shelf registration statement on Form S-3 for the sale of its common stock having an aggregate value of up to $55 million through an “at-the-market” equity offering program. Through the year ended December 31, 2017, the Company has sold approximately 548,000 common shares at a weighted average price of $64.82, net of broker fees. The Company has sold no shares since the first quarter of 2017. To date, the Company has received $36.4 million in gross proceeds. Under the program, the Company has the ability to receive an additional $18.6 million in gross proceeds from the sale of common shares.
32
Over the next 12 months, the Parent Company has an obligation to remit interest payments approximating $0.8 million on the junior subordinated debentures held by City Holding Capital Trust III. Additionally, the Parent Company anticipates continuing the payment of dividends, which are expected to approximate $28.6 million on an annualized basis for 2018 based on common shareholders of record at December 31, 2017 at a dividend rate of $1.84 for 2018. However, interest payments on the debentures can be deferred for up to five years under certain circumstances and dividends to shareholders can, if necessary, be suspended. In addition to these anticipated cash needs, the Parent Company has operating expenses and other contractual obligations, which are estimated to require $1.4 million of additional cash over the next 12 months. As of December 31, 2017, the Parent Company reported a cash balance of $59.0 million and management believes that the Parent Company’s available cash balance, together with cash dividends from City National, will be adequate to satisfy its funding and cash needs over the next twelve months.
Excluding the interest and dividend payments discussed above, the Parent Company has no significant commitments or obligations in years after 2018 other than the repayment of its $16.5 million obligation under the debentures held by City Holding Capital Trust III. However, this obligation does not mature until June 2038, or earlier at the option of the Parent Company. It is expected that the Parent Company will be able to obtain the necessary cash, either through dividends obtained from City National or the issuance of other debt, to fully repay the debentures at their maturity.
City National manages its liquidity position in an effort to effectively and economically satisfy the funding needs of its customers and to accommodate the scheduled repayment of borrowings. Funds are available to City National from a number of sources, including depository relationships, sales and maturities within the investment securities portfolio, and borrowings from the Federal Home Loan Bank ("FHLB") and other financial institutions. As of December 31, 2017, City National’s assets are significantly funded by deposits and capital. City National maintains borrowing facilities with the FHLB and other financial institutions that can be accessed as necessary to fund operations and to provide contingency funding mechanisms. As of December 31, 2017, City National had the capacity to borrow an additional $1.6 billion from the FHLB and other financial institutions under existing borrowing facilities. City National maintains a contingency funding plan, incorporating these borrowing facilities, to address liquidity needs in the event of an institution-specific or systemic financial industry crisis. Also, although it has no current intention to do so, City National could liquidate its unpledged securities, if necessary, to provide an additional funding source. City National also segregates certain mortgage loans, mortgage-backed securities, and other investment securities in a separate subsidiary so that it can separately monitor the asset quality of these primarily mortgage-related assets, which could be used to raise cash through securitization transactions or obtain additional equity or debt financing if necessary.
The Company manages its asset and liability mix to balance its desire to maximize net interest income against its desire to minimize risks associated with capitalization, interest rate volatility, and liquidity. With respect to liquidity, the Company has chosen a conservative posture and believes that its liquidity position is strong. As illustrated in the Consolidated Statements of Cash Flows, the Company generated $77.8 million of cash from operating activities during 2017, primarily from interest income received on loans and investments, net of interest expense paid on deposits and borrowings.
The Company has obligations to extend credit, but these obligations are primarily associated with existing home equity loans that have predictable borrowing patterns across the portfolio. The Company has investment security balances with carrying values that totaled $629.0 million at December 31, 2017, and that greatly exceeded the Company’s non-deposit sources of borrowing, which totaled $268.7 million.
The Company’s net loan to asset ratio is 75.2% as of December 31, 2017 and deposit balances fund 80.2% of total assets as compared to 69.9% for its peers (Bank Holding Company Peer Group with assets ranging from $3 billion to $10 billion). Further, the Company’s deposit mix has a very high proportion of transaction and savings accounts that fund 54.0% of the Company’s total assets and the Company uses time deposits over $250,000 to fund 2.8% of total assets compared to its peers, which fund 13.1% of total assets with such deposits.
INVESTMENTS
The Company’s investment portfolio increased $89 million, or 16.5%, from $540 million at December 31, 2016, to $629 million at December 31, 2017. During 2017, in conjunction with its interest rate risk management strategy, the Company elected to grow investment balances (primarily mortgage-backed and municipal securities) and maintain cash balances to enhance net interest income. As part of this strategy, the Company increased its tax-exempt municipal securities to improve its earnings by lowering its effective income tax rate.
33
The investment portfolio is structured to provide flexibility in managing liquidity needs and interest rate risk, while providing acceptable rates of return.
The majority of the Company’s investment securities continue to be mortgage-backed securities. The mortgage-backed securities in which the Company has invested are predominantly underwritten to the standards of, and guaranteed by government-sponsored agencies such as Fannie Mae ("FNMA") and Freddie Mac ("FHLMC").
The Company's municipal bond portfolio of $96.2 million as of December 31, 2017 has an average tax equivalent yield of 4.43% with an average maturity of 12.2 years. The average dollar amount invested in each security is $0.5 million. The portfolio has 66% rated "A" or better and the remaining portfolio is unrated, as the issuances represented small issuances of revenue bonds. Additional credit support was been purchased by the issuer for 35% of the portfolio, while 65% has no additional credit support. Management does underwrite 100% of the portfolio on an annual basis, using the same guidelines that are used to underwrite its commercial loans. Revenue bonds were 71% of the portfolio, while the remaining 29% were general obligation bonds. Geographically, the portfolio supports the Company's footprint, with 70% of the portfolio being from municipalities throughout West Virginia, and the remainder from communities in Ohio, Indiana, and various other states.
34
TABLE FIVE
INVESTMENT PORTFOLIO
The carrying value of the Company's securities are presented in the following table (in thousands):
Carrying Values as of December 31, | |||||||||
2017 | 2016 | 2015 | |||||||
Securities available-for-sale: | |||||||||
Obligations of states and political subdivisions | $ | 96,196 | $ | 82,368 | $ | 50,697 | |||
U.S. Treasuries and U.S. government agencies | 2 | 3 | 5 | ||||||
Mortgage-backed securities: | |||||||||
U.S. government agencies | 419,347 | 330,814 | 288,197 | ||||||
Private label | 652 | 942 | 1,231 | ||||||
Trust preferred securities | 4,736 | 6,662 | 5,858 | ||||||
Corporate securities | 22,268 | 23,574 | 18,693 | ||||||
Total Debt Securities available-for-sale | 543,201 | 444,363 | 364,681 | ||||||
Marketable equity securities | 5,699 | 4,231 | 3,273 | ||||||
Investment funds | 1,489 | 1,489 | 1,512 | ||||||
Total Securities Available-for-Sale | 550,389 | 450,083 | 369,466 | ||||||
Securities held-to-maturity: | |||||||||
Mortgage backed securities | 60,449 | 71,169 | 84,937 | ||||||
Trust preferred securities | 4,000 | 4,000 | 4,000 | ||||||
Total Securities Held-to-Maturity | 64,449 | 75,169 | 88,937 | ||||||
Other investment securities: | |||||||||
Non-marketable equity securities | 14,147 | 14,352 | 12,915 | ||||||
Total Other Investment Securities | 14,147 | 14,352 | 12,915 | ||||||
Total Securities | $ | 628,985 | $ | 539,604 | $ | 471,318 | |||
Included in non-marketable equity securities in the table above at December 31, 2017 are $5.9 million of Federal Home Loan Bank stock and $8.2 million of Federal Reserve Bank stock. At December 31, 2017, there were no securities of any non-governmental issuers whose aggregate carrying or estimated fair value exceeded 10% of shareholders’ equity.
35
The weighted average yield of the Company's investment portfolio is presented in the following table (dollars in thousands):
Within | After One But | After Five But | After | |||||||||||||||||
One Year | Within Five Years | Within Ten Years | Ten Years | |||||||||||||||||
Amount | Yield | Amount | Yield | Amount | Yield | Amount | Yield | |||||||||||||
Securities available-for-sale: | ||||||||||||||||||||
Obligations of states and political subdivisions | $ | 2,601 | 3.20 | % | $ | 10,915 | 3.32 | % | $ | 14,551 | 3.02 | % | $ | 68,129 | 3.17 | % | ||||
U.S. Treasuries and U.S. government agencies | — | — | 2 | 1.97 | — | — | — | — | ||||||||||||
Mortgage-backed securities: | ||||||||||||||||||||
U.S. government agencies | 374 | 1.18 | 2,588 | 2.19 | 44,347 | 2.32 | 372,038 | 2.61 | ||||||||||||
Private label | 31 | 3.65 | — | — | — | — | 621 | 3.91 | ||||||||||||
Trust preferred securities | — | — | — | — | — | — | 4,736 | 3.16 | ||||||||||||
Corporate securities | — | — | 2,350 | 4.98 | 16,551 | 5.04 | 3,367 | 5.36 | ||||||||||||
Total Debt Securities available-for-sale | 3,006 | 2.95 | 15,855 | 3.38 | 75,449 | 3.05 | 448,891 | 2.73 | ||||||||||||
Securities held-to-maturity: | ||||||||||||||||||||
U.S. government agencies | — | — | — | — | — | — | 60,449 | 7.01 | ||||||||||||
Trust preferred securities | — | — | — | — | — | — | 4,000 | 9.30 | ||||||||||||
Total Securities Held-to-Maturity | — | — | — | — | — | — | 64,449 | 7.15 | ||||||||||||
Total debt securities | $ | 3,006 | 2.95 | % | $ | 15,855 | 3.38 | % | $ | 75,449 | 3.05 | % | $ | 513,340 | 3.28 | % | ||||
Weighted-average yields on tax-exempt obligations of states and political subdivisions have been computed on a taxable-equivalent basis using the federal statutory tax rate of 35%. Average yields on investments available-for-sale are computed based on amortized cost. Mortgage-backed securities have been allocated to their respective maturity groupings based on their contractual maturity.
TABLE SIX
LOAN PORTFOLIO
The composition of the Company’s loan portfolio as of the dates indicated follows (in thousands):
2017 | 2016 | 2015 | 2014 | 2013 | |||||||||||
Residential real estate | $ | 1,468,278 | $ | 1,451,462 | $ | 1,383,133 | $ | 1,294,576 | $ | 1,204,450 | |||||
Home equity | 139,499 | 141,965 | 147,036 | 145,604 | 146,090 | ||||||||||
Commercial and industrial | 208,484 | 185,667 | 165,340 | 140,548 | 156,777 | ||||||||||
Commercial real estate | 1,277,576 | 1,229,516 | 1,127,581 | 1,028,755 | 1,048,573 | ||||||||||
Consumer | 29,162 | 32,545 | 36,083 | 39,705 | 46,402 | ||||||||||
DDA overdrafts | 4,411 | 5,071 | 3,361 | 2,802 | 3,905 | ||||||||||
Gross loans | $ | 3,127,410 | $ | 3,046,226 | $ | 2,862,534 | $ | 2,651,990 | $ | 2,606,197 | |||||
$ change from the preceding year | $ | 81,184 | $ | 183,692 | $ | 210,544 | $ | 45,793 | $ | 459,828 | |||||
% change from the preceding year | 2.7 | % | 6.4 | % | 7.9 | % | 1.8 | % | 21.4 | % | |||||
Residential real estate loans increased $17 million from December 31, 2016 to $1.47 billion at December 31, 2017. Residential real estate loans represent loans to consumers that are secured by a first lien on residential property. Residential real estate loans provide for the purchase or refinance of a residence and first-lien home equity loans allow consumers to borrow against the equity in their home. These loans primarily consist of single family 3 and 5 year adjustable rate mortgages with terms that amortize up to 30 years. City National also offers fixed-rate residential real estate loans that are sold in the secondary market that are not included on the Company's balance sheet once sold and City National does not retain the servicing rights to these loans. Residential mortgage loans are generally underwritten to comply with Fannie Mae guidelines, while the home equity loans are underwritten with typically less documentation, but with lower loan-to-value ratios and shorter maturities. At December 31, 2017, $25 million of the residential real estate loans were for properties under construction.
36
Home equity loans decreased $2 million from December 31, 2016 to $139 million at December 31, 2017. City National's home equity loans represent loans to consumers that are secured by a second (or junior) lien on a residential property. Home equity loans allow consumers to borrow against the equity in their home without paying off an existing first lien. These loans consist of home equity lines of credit ("HELOC") and amortized home equity loans that require monthly installment payments. Home equity loans are underwritten with less documentation, lower loan-to-value ratios and for shorter terms than residential real estate loans. The amount of credit extended is directly related to the value of the real estate at the time the loan is made.
The commercial and industrial ("C&I") loan portfolio consists of loans to corporate borrowers primarily in small to mid-size industrial and commercial companies. Collateral securing these loans includes equipment, machinery, inventory, receivables and vehicles. C&I loans are considered to contain a higher level of risk than other loan types, although care is taken to minimize these risks. Numerous risk factors impact this portfolio, including industry specific risks such as economy, new technology, labor rates and cyclicality, as well as customer specific factors, such as cash flow, financial structure, operating controls and asset quality. C&I loans increased $23 million to $208.5 million at December 31, 2017.
Commercial real estate loans consist of commercial mortgages, which generally are secured by nonresidential and multi-family residential properties, including hotel/motel and apartment lending. Commercial real estate loans are to many of the same customers and carry similar industry risks as C&I loans, but have different collateral risk. Commercial real estate loans increased $48 million to $1.28 billion at December 31, 2017. At December 31, 2017, $29 million of the commercial real estate loans were for commercial properties under construction.
The Company categorizes commercial loans by industry according to the North American Industry Classification System (NAICS) to monitor the portfolio for possible concentrations in one or more industries. Management monitors industry concentrations against internally designated percents of risk-based capital. As of December 31, 2017, City National was within its internally designated concentration limits. As of December 31, 2017, City National's loans to borrowers within the Lessors of Nonresidential Buildings categories exceeded 10% of total loans (13%). No other industry classification exceeded 10% of total loans as of December 31, 2017. Management also monitors non-owner occupied commercial real estate as a percent of risk based capital (based upon regulatory guidance). At December 31, 2017, the Company had $967.5 million of commercial loans classified as non-owner occupied and was within its designated concentration threshold.
Consumer loans may be secured by automobiles, boats, recreational vehicles and other personal property. City National monitors the risk associated with these types of loans by monitoring such factors as portfolio growth, lending policies and economic conditions. Underwriting standards are continually evaluated and modified based upon these factors. Consumer loans decreased $3 million from 2016 to $29.2 million at December 31, 2017.
The following table shows the scheduled maturity of loans outstanding as of December 31, 2017 (in thousands):
Within One Year | After One But Within Five Years | After Five Years | Total | |||||||||
Residential real estate | $ | 136,998 | $ | 497,978 | $ | 833,302 | $ | 1,468,278 | ||||
Home equity | 17,968 | 48,066 | 73,465 | 139,499 | ||||||||
Commercial and industrial | 71,514 | 108,163 | 28,807 | 208,484 | ||||||||
Commercial real estate | 303,820 | 572,489 | 401,267 | 1,277,576 | ||||||||
Consumer | 15,805 | 16,981 | 787 | 33,573 | ||||||||
Total loans | $ | 546,105 | $ | 1,243,677 | $ | 1,337,628 | $ | 3,127,410 | ||||
Loans maturing after one year with interest rates that are: | ||||||||||||
Fixed until maturity | $ | 338,163 | ||||||||||
Variable or adjustable | 2,243,142 | |||||||||||
Total | $ | 2,581,305 | ||||||||||
37
ALLOWANCE AND PROVISION FOR LOAN LOSSES
Management systematically monitors the loan portfolio and the appropriateness of the allowance for loan losses (“ALLL”) on a quarterly basis to provide for probable losses incurred in the portfolio. Management assesses the risk in each loan type based on historical delinquency and loss trends, the general economic environment of its local markets, individual loan performance, and other relevant factors. Individual credits in excess of $1 million are selected at least annually for detailed loan reviews, which are utilized by management to assess the risk in the portfolio and the appropriateness of the allowance. Due to the nature of commercial lending, evaluation of the appropriateness of the allowance as it relates to these loan types is often based more upon specific credit review, with consideration given to the potential impairment of certain credits and historical loss rates, adjusted for general economic conditions and other inherent risk factors. Conversely, due to the homogeneous nature of the real estate and installment portfolios, the portions of the allowance allocated to those portfolios are primarily based on prior loss history of each portfolio, adjusted for general economic conditions and other inherent risk factors. Risk factors considered by the Company in completing this analysis include: (1) unemployment and economic trends in the Company’s markets, (2) concentrations of credit, if any, among any industries, (3) trends in loan growth, loan mix, delinquencies, losses or credit impairment, (4) adherence to lending policies and others. Each risk factor is designated as low, moderate/increasing, or high based on the Company’s assessment of the risk to loss associated with each factor. Each risk factor is then weighted to consider probability of occurrence.
The allowance not specifically allocated to individual credits is generally determined by analyzing potential exposure and other qualitative factors that could negatively impact the overall credit risk of the loan portfolio. Loans not individually evaluated for impairment are grouped by pools with similar risk characteristics and the related historical loss rates are adjusted to reflect current inherent risk factors, such as unemployment, overall economic conditions, concentrations of credit, loan growth, classified and impaired loan trends, staffing, adherence to lending policies, and loss trends.
Determination of the allowance for loan losses is subjective in nature and requires management to periodically reassess the validity of its assumptions. Differences between actual losses and estimated losses are assessed such that management can timely modify its evaluation model to ensure that adequate provision has been made for risk in the total loan portfolio.
As a result of the Company’s analysis of the appropriateness of the ALLL, the Company recorded a provision for loan losses of $3.0 million, $4.4 million and $7.0 million for the years ended December 31, 2017, 2016 and 2015, respectively.
The provision for loan losses recorded in 2017 reflects the revisions to the regulatory rating of a shared national credit ("SNC") in which the Company is a participant, changes in the quality of the portfolio and general improvement in the Company's historical loss rates used to compute the allowance not specifically allocated to individual credits. SNCs are credit facilities greater than $20 million that are shared by three or more federally supervised financial institutions and are reviewed annually by regulatory authorities at the agent bank level. The SNC that the Company is a participant is for a local customer that outgrew the lending limit of the Company and involves three local banks. The reserve recorded in 2017 of $1.1 million related to this SNC reflects the loss factors associated with the rating assigned to this SNC as a result of the current year review by the Office of the Comptroller of the Currency ("OCC"). The Company's balance outstanding at December 31, 2017 associated with this SNIC was $27.7 million, with an additional commitment of $6.2 million related to a line of credit to the borrower. As of December 31, 2017, the SNC was performing in accordance with terms and its debt service coverage ratios were acceptable. Changes in the amount of the allowance and related provision are based on the Company's detailed systematic methodology and are directionally consistent with changes in the composition and quality of the Company's loan portfolio. The Company believes its methodology for determining the adequacy of its ALLL adequately provides for probable losses inherent in the loan portfolio and produces a provision and allowance for loan losses that is directionally consistent with changes in asset quality and loss experience.
The Company had net charge-offs of $3.9 million in each of the years ended December 31, 2017 and 2016. Net charge-offs in 2017 consisted primarily of net charge-offs on residential real estate loans of $1.3 million, DDA overdraft loans of $1.3 million, and commercial real estate loans of $0.6 million.
Based on the Company’s analysis of the appropriateness of the allowance for loan losses and in consideration of the known factors utilized in computing the allowance, management believes that the allowance for loan losses as of December 31, 2017 is adequate to provide for probable losses inherent in the Company’s loan portfolio. Future provisions for loan losses will be dependent upon trends in loan balances including the composition of the loan portfolio, changes in loan quality and loss experience trends, and recoveries of previously charged-off loans, among other factors.
38
TABLE SEVEN
ANALYSIS OF THE ALLOWANCE FOR LOAN LOSSES
An analysis of changes in the Company's allowance for loan losses follows (dollars in thousands):
2017 | 2016 | 2015 | 2014 | 2013 | |||||||||||
Balance at beginning of period | $ | 19,730 | $ | 19,251 | $ | 20,074 | $ | 20,575 | $ | 18,809 | |||||
Charge-offs: | |||||||||||||||
Commercial and industrial | (400 | ) | (148 | ) | (5,768 | ) | (323 | ) | (1,040 | ) | |||||
Commercial real estate | (720 | ) | (1,676 | ) | (580 | ) | (2,001 | ) | (2,187 | ) | |||||
Residential real estate | (1,637 | ) | (1,734 | ) | (1,144 | ) | (1,762 | ) | (2,181 | ) | |||||
Home equity | (403 | ) | (390 | ) | (312 | ) | (309 | ) | (295 | ) | |||||
Consumer | (60 | ) | (126 | ) | (210 | ) | (188 | ) | (454 | ) | |||||
DDA overdrafts | (2,714 | ) | (1,412 | ) | (1,414 | ) | (1,415 | ) | (1,483 | ) | |||||
Total charge-offs | (5,934 | ) | (5,486 | ) | (9,428 | ) | (5,998 | ) | (7,640 | ) | |||||
Recoveries: | |||||||||||||||
Commercial and industrial | 58 | 14 | 74 | 89 | 84 | ||||||||||
Commercial real estate | 112 | 487 | 366 | 113 | 785 | ||||||||||
Residential real estate | 294 | 187 | 199 | 187 | 234 | ||||||||||
Home equity | 45 | — | — | — | — | ||||||||||
Consumer | 63 | 118 | 186 | 204 | 327 | ||||||||||
DDA overdrafts | 1,462 | 764 | 792 | 850 | 1,128 | ||||||||||
Total recoveries | 2,034 | 1,570 | 1,617 | 1,443 | 2,558 | ||||||||||
Net charge-offs | (3,900 | ) | (3,916 | ) | (7,811 | ) | (4,555 | ) | (5,082 | ) | |||||
Provision for loan losses | 2,845 | 4,232 | 6,435 | 3,771 | 6,251 | ||||||||||
Provision for acquired loans | 161 | 163 | 553 | 283 | 597 | ||||||||||
Balance at end of period | $ | 18,836 | $ | 19,730 | $ | 19,251 | $ | 20,074 | $ | 20,575 | |||||
As a Percent of Average Total Loans: | |||||||||||||||
Net charge-offs | 0.13 | % | 0.13 | % | 0.29 | % | 0.18 | % | 0.20 | % | |||||
Provision for loan losses | 0.10 | % | 0.15 | % | 0.26 | % | 0.16 | % | 0.27 | % | |||||
As a Percent of Non-Performing Loans: | |||||||||||||||
Allowance for loan losses | 178.39 | % | 140.10 | % | 110.37 | % | 127.62 | % | 90.25 | % | |||||
39
TABLE EIGHT
NON-ACCRUAL AND PAST-DUE LOANS
The Company's nonperforming assets and past-due loans were as follows (dollars in thousands):
2017 | 2016 | 2015 | 2014 | 2013 | |||||||||||
Non-accrual loans | $ | 10,297 | $ | 13,701 | $ | 16,948 | $ | 15,306 | $ | 22,361 | |||||
Accruing loans past due 90 days or more | 262 | 382 | 495 | 423 | 436 | ||||||||||
Total non-performing loans | $ | 10,559 | $ | 14,083 | $ | 17,443 | $ | 15,729 | $ | 22,797 | |||||
Other real estate owned ("OREO") | 3,585 | 4,588 | 6,519 | 8,180 | 8,470 | ||||||||||
Total non-performing assets | $ | 14,144 | $ | 18,671 | $ | 23,962 | $ | 23,909 | $ | 31,267 | |||||
As a Percentage of Total Loans and OREO | |||||||||||||||
Non-performing assets | 0.45 | % | 0.61 | % | 0.84 | % | 0.90 | % | 1.20 | % | |||||
2017 | 2016 | 2015 | 2014 | 2013 | |||||||||||
Past-due loans | $ | 10,964 | $ | 8,594 | $ | 9,164 | $ | 10,666 | $ | 19,492 | |||||
As a Percentage of Total Loans | |||||||||||||||
Past-due loans | 0.35 | % | 0.28 | % | 0.32 | % | 0.40 | % | 0.75 | % | |||||
The Company’s ratio of non-performing assets to total loans and other real estate owned decreased from 0.61% at December 31, 2016 to 0.45% at December 31, 2017. Total past due loans increased from $8.6 million, or 0.28% of total loans outstanding, at December 31, 2016 to $11.0 million, or 0.35% of total loans outstanding, at December 31, 2017.
Interest on loans is accrued and credited to operations based upon the principal amount outstanding. The accrual of interest income is generally discontinued when a loan becomes 90 days past due as to principal or interest unless the loan is well collateralized and in the process of collection. When interest accruals are discontinued, interest credited to income in the current year that is unpaid and deemed uncollectible is charged to operations. Prior-year interest accruals that are unpaid and deemed uncollectible are charged to the allowance for loan losses, provided that such amounts were specifically reserved.
TABLE NINE
IMPAIRED LOANS
Information pertaining to the Company's impaired loans is included in the following table (in thousands):
2017 | 2016 | 2015 | 2014 | 2013 | |||||||||||
Impaired loans with a valuation allowance | $ | 5,782 | $ | 2,832 | $ | — | $ | 1,392 | $ | 3,416 | |||||
Impaired loans with no valuation allowance | 3,885 | 4,749 | 8,482 | 5,377 | 9,178 | ||||||||||
Total impaired loans | $ | 9,667 | $ | 7,581 | $ | 8,482 | $ | 6,769 | $ | 12,594 | |||||
Allowance for loan losses allocated to impaired loans | $ | 647 | $ | 665 | $ | — | $ | 252 | $ | 880 | |||||
Interest income forgone on non-accrual and impaired loans | $ | 200 | $ | 400 | $ | 800 | $ | 500 | $ | 600 | |||||
Impaired loans with a valuation allowance at the end of 2017 and 2016 were comprised of one commercial borrowing relationship that was evaluated during that year and determined that an allowance was necessary, as the present value of expected cash flows was less than the outstanding amount of the loan.
There were no commitments to provide additional funds on non-accrual, impaired, or other potential problem loans at December 31, 2017 and 2016.
40
TABLE TEN
RESTRUCTURED LOANS
The following table sets forth the Company’s troubled debt restructurings ("TDRs") (in thousands):
2017 | 2016 | 2015 | 2014 | 2013 | |||||||||||
Accruing | |||||||||||||||
Commercial and industrial | $ | 135 | $ | 42 | $ | 58 | $ | 73 | $ | 88 | |||||
Commercial real estate | 8,381 | 5,525 | 1,746 | 2,263 | 1,783 | ||||||||||
Residential real estate | 21,005 | 20,424 | 17,796 | 17,946 | 18,651 | ||||||||||
Home equity | 3,047 | 3,105 | 2,659 | 2,673 | 2,859 | ||||||||||
Consumer | — | — | — | — | — | ||||||||||
$ | 32,568 | $ | 29,096 | $ | 22,259 | $ | 22,955 | $ | 23,381 | ||||||
Non-Accruing | |||||||||||||||
Commercial and industrial | $ | — | $ | — | $ | — | $ | — | $ | — | |||||
Commercial real estate | — | — | — | — | — | ||||||||||
Residential real estate | 84 | 391 | 191 | 545 | 1,693 | ||||||||||
Home equity | 50 | 30 | 34 | 15 | 14 | ||||||||||
Consumer | — | — | — | — | — | ||||||||||
$ | 134 | $ | 421 | $ | 225 | $ | 560 | $ | 1,707 | ||||||
Regulatory guidance requires loans to be accounted for as collateral-dependent loans when borrowers have filed Chapter 7 bankruptcy, the debt has been discharged by the bankruptcy court and the borrower has not reaffirmed the debt. The filing of bankruptcy is deemed to be evidence that the borrower is in financial difficulty and the discharge of the debt by the bankruptcy court is deemed to be a concession granted to the borrower.
The Company's troubled debt restructurings ("TDRs") related to its borrowers who had filed for Chapter 7 bankruptcy protection make up 74% of the Company's total TDRs as of December 31, 2017. The average age of these TDRs was 12.1 years; the average current balance as a percentage of the original balance was 68.2%; and the average loan-to-value ratio was 65.4% as of December 31, 2017. Of the total 461 Chapter 7 related TDRs, 31 had an estimated loss exposure based on the current balance and appraised value at December 31, 2017.
41
TABLE ELEVEN
ALLOCATION OF THE ALLOWANCE FOR LOAN LOSSES
The allocation of the allowance for loan losses by portfolio segment and the percent of loans in each category to total loans is shown in the table below (dollars in thousands). The allocation of a portion of the allowance in one portfolio segment does not preclude its availability to absorb losses in other portfolio segments.
2017 | 2016 | 2015 | 2014 | 2013 | |||||||||||||||||||||
Amount | Percent of Loans in Each Category to Total Loans | Amount | Percent of Loans in Each Category to Total Loans | Amount | Percent of Loans in Each Category to Total Loans | Amount | Percent of Loans in Each Category to Total Loans | Amount | Percent of Loans in Each Category to Total Loans | ||||||||||||||||
Commercial and industrial | $ | 4,571 | 7 | % | $ | 4,206 | 6 | % | $ | 3,271 | 6 | % | $ | 1,582 | 5 | % | $ | 1,139 | 6 | % | |||||
Commercial real estate | 6,183 | 41 | 6,573 | 40 | 6,985 | 39 | 8,845 | 39 | 10,775 | 40 | |||||||||||||||
Residential real estate | 5,212 | 47 | 6,680 | 48 | 6,778 | 48 | 7,208 | 49 | 6,057 | 46 | |||||||||||||||
Home equity | 1,138 | 4 | 1,417 | 5 | 1,463 | 5 | 1,495 | 5 | 1,672 | 6 | |||||||||||||||
Consumer | 62 | 1 | 82 | 1 | 97 | 2 | 85 | 2 | 77 | 2 | |||||||||||||||
DDA overdrafts | 1,670 | — | 772 | — | 657 | — | 859 | — | 855 | — | |||||||||||||||
Allowance for Loan Losses | $ | 18,836 | 100 | % | $ | 19,730 | 100 | % | $ | 19,251 | 100 | % | $ | 20,074 | 100 | % | $ | 20,575 | 100 | % | |||||
The allowance attributed to the commercial and industrial loan portfolio increased $0.4 million from $4.2 million at December 31, 2016 to $4.6 million at December 31, 2017. The increase is primarily attributable to an increase in the amount of loans classified as special mention and substandard as well as loan growth in this portfolio.
The allowance attributed to the commercial real estate loan portfolio decreased $0.4 million from $6.6 million at December 31, 2016 to $6.2 million at December 31, 2017. This decrease is primarily attributable to improvements in the historical loss rates in the portfolio.
The allowance attributed to the residential real estate portfolio decreased $1.5 million from $6.7 million at December 31, 2016 to $5.2 million at December 31, 2017. The decrease is primarily attributable to improvements in the historical loss rates in the portfolio.
The allowance attributed to the home equity portfolio decreased $0.3 million from $1.4 million at December 31, 2016 to $1.1 million at December 31, 2017.
The allowance attributed to the consumer portfolio decreased $0.02 million from $0.08 million at December 31, 2016 to $0.06 million at December 31, 2017.
The allowance attributed to DDA overdrafts increased $0.9 million from $0.8 million at December 31, 2016 to $1.7 million at December 31, 2017. This increase is primarily attributable to an increase in the historical loss rate in the portfolio.
GOODWILL
The Company evaluates the recoverability of goodwill and indefinite lived intangible assets annually as of November 30th, or more frequently if events or changes in circumstances warrant, such as a material adverse change in the business. Goodwill is considered to be impaired when the carrying value of a reporting unit exceeds its estimated fair value. Indefinite-lived intangible assets are considered impaired if their carrying value exceeds their estimated fair value. As described in Note One of the Notes to Consolidated Financial Statements, the Company conducts its business activities through one reportable business segment – community banking. Fair values are estimated by reviewing the Company’s stock price as it compares to book value and the Company’s reported earnings. In addition, the impact of future earnings and activities are considered in the Company’s analysis. The Company had approximately $76 million of goodwill at December 31, 2017 and 2016, respectively, and no impairment was required to be recognized in 2017 or 2016, as the estimated fair value of the Company has continued to exceed its book value.
42
CERTIFICATES OF DEPOSIT
Scheduled maturities of time certificates of deposit of $100,000 or more at December 31, 2017 are summarized in the table below (in thousands). The Company has time certificates of deposit that meet or exceed the FDIC insurance limit of $250,000 totaling $122.4 million (approximately 11% of total time deposits).
TABLE TWELVE
MATURITY DISTRIBUTION OF CERTIFICATES OF DEPOSIT OF $100,000 OR MORE
Amounts | Percentage | ||||
Three months or less | $ | 62,114 | 13 | % | |
Over three months through six months | 56,382 | 12 | % | ||
Over six months through twelve months | 122,015 | 26 | % | ||
Over twelve months | 220,617 | 49 | % | ||
Total | $ | 461,128 | 100 | % | |
FAIR VALUE MEASUREMENTS
The Company determines the fair value of its financial instruments based on the fair value hierarchy established in ASC Topic 820, whereby the fair value of certain assets and liabilities is an exit price, representing the amount that would be received to sell an asset or paid to transfer a liability in an orderly transaction between market participants. ASC Topic 820 establishes a three-level hierarchy for disclosure of assets and liabilities recorded at fair value. The hierarchy classification is based on whether the inputs in the methodology for determining fair value are observable or unobservable. Observable inputs reflect market-based information obtained from independent sources (Level 1 or Level 2), while unobservable inputs reflect management’s estimate of market data (Level 3). Assets and liabilities that are actively traded and have quoted prices or observable market data require a minimal amount of subjectivity concerning fair value. Management’s judgment is necessary to estimate fair value when quoted prices or observable market data are not available.
At December 31, 2017, approximately 14% of total assets, or $565 million, consisted of financial instruments recorded at fair value. Most of these financial instruments used valuation methodologies involving observable market data, collectively Level 1 and Level 2 measurements, to determine fair value. At December 31, 2017, approximately $14 million of derivative liabilities were recorded at fair value using methodologies involving observable market data. The Company does not believe that any changes in the unobservable inputs used to value the financial instruments mentioned above would have a material impact on the Company’s results of operations, liquidity, or capital resources. See Note Eighteen of the Notes to Consolidated Financial Statements for additional information regarding ASC Topic 820 and its impact on the Company’s financial statements.
CONTRACTUAL OBLIGATIONS
The Company has various financial obligations that may require future cash payments according to the terms of the obligations. Demand, both noninterest- and interest-bearing, and savings deposits are, generally, payable immediately upon demand at the request of the customer. Therefore, the contractual maturity of these obligations is presented in the following table as “less than one year.” Time deposits, typically certificates of deposit, are customer deposits that are evidenced by an agreement between the Company and the customer that specify stated maturity dates and early withdrawals by the customer are subject to penalties assessed by the Company. Short-term borrowings and long-term debt represent borrowings of the Company and have stated maturity dates. Capital and operating leases between the Company and the lessor have stated expiration dates and renewal terms.
43
TABLE THIRTEEN
CONTRACTUAL OBLIGATIONS
The composition of the Company's contractual obligations as of December 31, 2017 is presented in the following table (in thousands):
Contractual Maturity in | |||||||||||||||
Less than One Year | Between One and Three Years | Between Three and Five Years | Greater than Five Years | Total | |||||||||||
Noninterest-bearing demand deposits | $ | 666,639 | $ | — | $ | — | $ | — | $ | 666,639 | |||||
Interest-bearing demand deposits(1) | 770,396 | — | — | — | 770,396 | ||||||||||
Savings deposits(1) | 797,632 | — | — | — | 797,632 | ||||||||||
Time deposits(1) | 575,361 | 464,728 | 59,906 | 271 | 1,100,266 | ||||||||||
Short-term borrowings(1) | 322,199 | — | — | — | 322,199 | ||||||||||
Long-term debt(1) | 718 | 1,436 | 1,436 | 27,983 | 31,573 | ||||||||||
Real estate leases | 982 | 1,600 | 1,261 | 5,692 | 9,535 | ||||||||||
Total Contractual Obligations | $ | 3,133,927 | $ | 467,764 | $ | 62,603 | $ | 33,946 | $ | 3,698,240 | |||||
(1) | Includes interest on both fixed- and variable-rate obligations. The interest associated with variable-rate obligations is based upon interest rates in effect at December 31, 2017. The contractual amounts to be paid on variable-rate obligations are affected by market interest rates that could materially affect the contractual amounts to be paid. |
The Company’s liability for uncertain tax positions at December 31, 2017 was $1.9 million pursuant to ASC Topic 740. This liability represents an estimate of tax positions that the Company has taken in its tax returns that may ultimately not be sustained upon examination by tax authorities. As the ultimate amount and timing of any future cash settlements cannot be predicted with reasonable reliability, this estimated liability has been excluded from the contractual obligations table.
OFF–BALANCE SHEET ARRANGEMENTS
As disclosed in Note Fifteen of the Notes to Consolidated Financial Statements, the Company has also entered into agreements with its customers to extend credit or to provide conditional commitments to provide payment on drafts presented in accordance with the terms of the underlying credit documents (including standby and commercial letters of credit). The Company also provides overdraft protection to certain demand deposit customers that represent an unfunded commitment. As a result of the Company’s off-balance sheet arrangements for 2017 and 2016, no material revenue, expenses, or cash flows were recognized. In addition, the Company had no other indebtedness or retained interests nor entered into agreements to extend credit or provide conditional payments pursuant to standby and commercial letters of credit.
CAPITAL RESOURCES
During 2017, Shareholders’ Equity increased $60 million, or 13.6%, from $442 million at December 31, 2016 to $503
million at December 31, 2017. This increase was primarily due to net income of $54 million and the issuance of common shares of $28 million, partially offset by cash dividends declared of $28 million.
On September 24, 2014, the Company announced that the Board of Directors authorized the Company to buy back up to 1,000,000 shares of its common shares (approximately 7% of outstanding shares) in open market transactions at prices that are accretive to the earnings per share of continuing shareholders. No time limit was placed on the duration of the share repurchase program. During the year ended December 31, 2016, the Company repurchased approximately 231,000 common shares at a weighted average price of $43.34. During the year ended December 31, 2017, the Company did not repurchase any common shares. At December 31, 2017, the Company could repurchase approximately 279,000 shares under the current plan.
On December 19, 2016, the Company announced that it had filed a prospectus supplement to its existing shelf registration statement on Form S-3 for the sale of its common stock having an aggregate value of up to $55 million through an "at-the-market" equity offering program. Through the year ended December 31, 2017, the Company has sold approximately 548,000 common shares at a weighted average price of $64.82, net of broker fees. The Company has sold no shares since the first quarter of 2017. To date, the Company has received $36.4 million in gross proceeds. Under the program, the Company has the ability to receive an additional $18.6 million in gross proceeds from the sale of common shares.
44
In July 2013, the Federal Reserve published the final rules that established a new comprehensive capital framework for banking organizations, commonly referred to as Basel III. These final rules substantially revised the risk-based capital requirements applicable to bank holding companies and depository institutions. The final rule became effective January 1, 2015 for smaller, non-complex banking organizations with full implementation by January 1, 2019.
Regulatory guidelines require the Company to maintain a minimum common equity tier I ("CET 1") capital ratio of 5.75% and a total capital to risk-adjusted assets ratio of 9.25%, with at least one-half of capital consisting of tangible common stockholders’ equity, and a minimum Tier I leverage ratio of 7.25%. Similarly, City National is also required to maintain minimum capital levels as set forth by various regulatory agencies. Under capital adequacy guidelines, City National is required to maintain minimum CET 1, total capital, Tier I capital, and leverage ratios of 5.75%, 9.25%, 7.25%, and 4.0%, respectively. To be classified as “well capitalized,” City National must maintain CET 1, total capital, Tier I capital, and leverage ratios of 6.5%, 10.0%, 8.0%, and 5.0%, respectively.
When fully phased in on January 1, 2019, the Basel III Capital Rules will require City Holding and City National to maintain (i) a minimum ratio of CET 1 to risk-weighted assets of at least 4.5%, plus a 2.5% "capital conservation buffer" (which is added to the 4.5% CET 1 ratio as that buffer is phased in, effectively resulting in a minimum ratio of CET 1 to risk-weighted assets of at least 7.0% upon full implementation), (ii) a minimum ratio of Tier 1 capital to risk-weighted assets of at least 6.0%, plus the capital conservation buffer (which is added to the 6.0% Tier 1 capital ratio as that buffer is phased in, effectively resulting in a minimum Tier 1 capital ratio of 8.5% upon full implementation), (iii) a minimum ratio of total capital (that is, Tier 1 plus Tier 2) to risk-weighted assets of at least 8.0%, plus the capital conservation buffer (which is added to the 8.0% total capital ratio as that buffer is phased in, effectively resulting in a minimum total capital ratio of 10.5% upon full implementation) and (iv) a minimum leverage ratio of 4.0%, calculated as the ratio of Tier 1 capital to average assets (as compared to the previous minimum leverage ratio of 3.0% for banking organizations that either have the highest supervisory rating or have implemented the appropriate federal regulatory authority's risk-adjusted measure for market risk).
The implementation of the capital conservation buffer began on January 1, 2016 at the 0.625% level and will be phased in over a four-year period (increasing by that amount on each subsequent January 1, until it reaches 2.5% on January 1, 2019). The Basel III Capital Rules also provide for a “countercyclical capital buffer” that is applicable to only certain covered institutions and does not have any current applicability to City Holding Company or City National Bank.
The aforementioned capital conservation buffer is designed to absorb losses during periods of economic stress. Banking institutions with a ratio of CET 1 capital to risk-weighted assets above the minimum but below the conservation buffer (or below the combined capital conservation buffer and countercyclical capital buffer, when the latter is applied) will face constraints on dividends, equity repurchases and compensation based on the amount of the shortfall.
45
The Company’s regulatory capital ratios for both City Holding and City National are illustrated in the following table:
December 31, 2017 | Actual | Minimum Required - Basel III Phase-In Schedule | Minimum Required - Basel III Fully Phased-In (*) | Required to be Considered Well Capitalized | |||||||||||||||||||||||
Capital Amount | Ratio | Capital Amount | Ratio | Capital Amount | Ratio | Capital Amount | Ratio | ||||||||||||||||||||
CET 1 Capital | |||||||||||||||||||||||||||
City Holding Company | $ | 430,154 | 15.1 | % | $ | 163,441 | 5.750 | % | $ | 198,972 | 7.0 | % | $ | 184,760 | 6.5 | % | |||||||||||
City National Bank | 338,105 | 12.0 | % | 162,164 | 5.750 | % | 197,418 | 7.0 | % | 183,316 | 6.5 | % | |||||||||||||||
Tier 1 Capital | |||||||||||||||||||||||||||
City Holding Company | 446,154 | 15.7 | % | 206,078 | 7.250 | % | 241,609 | 8.5 | % | 227,397 | 8.0 | % | |||||||||||||||
City National Bank | 338,105 | 12.0 | % | 204,468 | 7.250 | % | 239,721 | 8.5 | % | 225,620 | 8.0 | % | |||||||||||||||
Total Capital | |||||||||||||||||||||||||||
City Holding Company | 465,292 | 16.4 | % | 262,927 | 9.250 | % | 298,458 | 10.5 | % | 284,246 | 10.0 | % | |||||||||||||||
City National Bank | 357,243 | 12.7 | % | 260,873 | 9.250 | % | 296,126 | 10.5 | % | 282,025 | 10.0 | % | |||||||||||||||
Tier 1 Leverage Ratio | |||||||||||||||||||||||||||
City Holding Company | 446,154 | 11.0 | % | 161,834 | 4.000 | % | 161,834 | 4.0 | % | 202,293 | 5.0 | % | |||||||||||||||
City National Bank | 338,105 | 8.5 | % | 159,625 | 4.000 | % | 159,625 | 4.0 | % | 199,531 | 5.0 | % | |||||||||||||||
(*) Represents the minimum required capital levels as of January 1, 2019 when Basel III Capital Rules have been fully phased in. | |||||||||||||||||||||||||||
December 31, 2016: | Actual | Minimum Required - Basel III Phase-In Schedule | Minimum Required - Basel III Fully Phased-In (*) | Required to be Considered Well Capitalized | |||||||||||||||||||||||
Capital Amount | Ratio | Capital Amount | Ratio | Capital Amount | Ratio | ||||||||||||||||||||||
CET 1 Capital | |||||||||||||||||||||||||||
City Holding Company | $ | 371,677 | 13.3 | % | $ | 142,845 | 5.125 | % | $ | 195,105 | 7.0 | % | $ | 181,169 | 6.5 | % | |||||||||||
City National Bank | 310,912 | 11.2 | % | 141,860 | 5.125 | % | 193,761 | 7.0 | % | 179,921 | 6.5 | % | |||||||||||||||
Tier 1 Capital | |||||||||||||||||||||||||||
City Holding Company | 387,677 | 13.9 | % | $ | 184,653 | 6.625 | % | $ | 236,913 | 8.5 | % | $ | 222,977 | 8.0 | % | ||||||||||||
City National Bank | 318,872 | 11.5 | % | 183,381 | 6.625 | % | 235,281 | 8.5 | % | 221,441 | 8.0 | % | |||||||||||||||
Total Capital | |||||||||||||||||||||||||||
City Holding Company | 408,406 | 14.7 | % | 240,397 | 8.625 | % | 292,658 | 10.5 | % | 278,722 | 10.0 | % | |||||||||||||||
City National Bank | 338,675 | 12.2 | % | 238,741 | 8.625 | % | 290,641 | 10.5 | % | 276,801 | 10.0 | % | |||||||||||||||
Tier 1 Leverage Ratio | |||||||||||||||||||||||||||
City Holding Company | 387,677 | 10.1 | % | 153,864 | 4.000 | % | 153,864 | 4.0 | % | 192,330 | 5.0 | % | |||||||||||||||
City National Bank | 318,872 | 8.3 | % | 153,088 | 4.000 | % | 153,088 | 4.0 | % | 191,359 | 5.0 | % | |||||||||||||||
As of December 31, 2017, management believes that City Holding Company, and its banking subsidiary, City National, were “well capitalized.” City Holding is subject to regulatory capital requirements administered by the Federal Reserve, while City National is subject to regulatory capital requirements administered by the OCC and the FDIC. Regulatory agencies can initiate certain mandatory actions if either City Holding or City National fails to meet the minimum capital requirements, as shown above. As of December 31, 2017, management believes that City Holding and City National meet all capital adequacy requirements.
46
LEGAL ISSUES
The Company is engaged in various legal actions that it deems to be in the ordinary course of business. As these legal actions are resolved, the Company could realize impacts to its financial performance in the period in which these legal actions are determined to be probable and reasonably estimated. There can be no assurance that current actions will have immaterial results, or that no material actions may be presented in the future.
RECENT ACCOUNTING PROCOUNCEMENTS AND DEVELOPMENTS
Note One, “Recent Accounting Pronouncements,” of the Notes to Consolidated Financial Statements discusses recently issued new accounting pronouncements and their expected impact on the Company’s consolidated financial statements.
47
Item 7A.Quantitative and Qualitative Disclosures About Market Risk
Market risk is the risk of loss due to adverse changes in current and future cash flows, fair values, earnings or capital due to adverse movements in interest rates and other factors, including foreign exchange rates, underlying credit risk and commodity prices. Because the Company has no significant foreign exchange activities and holds no commodities, interest rate risk represents the primary risk factor affecting the Company’s balance sheet and net interest margin. Significant changes in interest rates by the Federal Reserve could result in similar changes in LIBOR interest rates, prime rates, and other benchmark interest rates that could materially affect the estimated fair value of the Company’s investment securities portfolio, interest paid on the Company’s short-term and long-term borrowings, interest earned on the Company’s loan portfolio and interest paid on its deposit accounts. The Company utilizes derivative instruments, primarily interest rate swaps, to help manage its interest rate risk on commercial loans.
The Company’s Asset and Liability Committee (“ALCO”) has been delegated the responsibility of managing the Company’s interest-sensitive balance sheet accounts to maximize earnings while managing interest rate risk. ALCO, comprised of various members of executive and senior management, is also responsible for establishing policies to monitor and limit the Company’s exposure to interest rate risk and to manage the Company’s liquidity position. ALCO satisfies its responsibilities through quarterly meetings during which product pricing issues, liquidity measures and interest sensitivity positions are monitored.
In order to measure and manage its interest rate risk, the Company uses an asset/liability management simulation software model to periodically update the interest sensitivity position of the Company’s balance sheet. The model is also used to perform analyses that measure the impact on net interest income and capital as a result of various changes in the interest rate environment. Such analyses quantify the effects of various interest rate scenarios on projected net interest income.
The Company’s policy objective is to avoid negative fluctuations in net income or the economic value of equity of more than 15% within a 12-month period, assuming an immediate parallel increase or decrease of 400 basis points. The Company measures the long-term risk associated with sustained increases and decreases in rates through analysis of the impact to changes in rates on the economic value of equity.
The following table summarizes the sensitivity of the Company’s net income to various interest rate scenarios. The results of the sensitivity analyses presented below differ from the results used internally by ALCO in that, in the analyses below, interest rates are assumed to have an immediate and sustained parallel shock. The Company recognizes that rates are volatile, but rarely move with immediate and parallel effects. Internally, the Company considers a variety of interest rate scenarios that are deemed to be possible while considering the level of risk it is willing to assume in “worst-case” scenarios such as shown by the following:
Immediate Basis Point Change in Interest Rates | Implied Federal Funds Rate Associated with Change in Interest Rates | Estimated Increase (Decrease) in Net Income Over 12 Months | ||
December 31, 2017 | ||||
+400 | 5.50 | % | +4.0 | % |
+300 | 4.50 | +5.9 | ||
+200 | 3.50 | +6.2 | ||
+100 | 2.50 | +4.7 | ||
-50 | 1.00 | -6.0 | ||
-100 | 0.50 | -12.3 | ||
December 31, 2016 | ||||
+400 | 4.75 | % | +8.0 | % |
+300 | 3.75 | +9.9 | ||
+200 | 2.75 | +9.7 | ||
+100 | 1.75 | +6.2 | ||
-50 | 0.25 | -6.1 | ||
-100 | (0.25 | ) | -9.5 | |
These estimates are highly dependent upon assumptions made by management, including, but not limited to, assumptions regarding the manner in which interest-bearing demand deposit and savings deposit accounts reprice in different interest rate scenarios, changes in the composition of deposit balances, pricing behavior of competitors, prepayments of loans and deposits
48
under alternative rate environments, and new business volumes and pricing. As a result, there can be no assurance that the estimates above will be achieved in the event that interest rates increase during 2018 and beyond. The estimates above do not necessarily imply that the Company will experience increases in net income if market interest rates rise. The table above indicates how the Company’s net income and the economic value of equity behave relative to an increase or decrease in rates compared to what would otherwise occur if rates remain stable.
Based upon the estimates above, the Company believes that its net income is positively correlated with increasing rates as compared to the level of net income the Company would expect if interest rates remain flat or decrease.
49
Item 8.Financial Statements and Supplementary Data
REPORT ON MANAGEMENT’S ASSESSMENT OF INTERNAL CONTROL OVER FINANCIAL REPORTING
The management of City Holding Company is responsible for the preparation, integrity, and fair presentation of the consolidated financial statements included in this annual report. The consolidated financial statements of City Holding Company have been prepared in accordance with U.S. generally accepted accounting principles and necessarily include some amounts that are based on the best estimates and judgments of management.
The management of City Holding Company is responsible for establishing and maintaining adequate internal control over financial reporting that is designed to produce reliable financial statements in conformity with U.S. generally accepted accounting principles. The system of internal control over financial reporting is evaluated for effectiveness by management and tested for reliability through a program of internal audits with actions taken to correct potential deficiencies as they are identified. Because of inherent limitations in any internal control system, no matter how well designed, misstatements due to error or fraud may occur and not be detected, including the possibility of the circumvention or overriding of controls. Accordingly, even an effective internal control system can provide only reasonable assurance with respect to financial statement preparation. Further, because of changes in conditions, internal control effectiveness may vary over time.
Management assessed the effectiveness of the Company's internal control over financial reporting as of December 31, 2017 based upon the criteria set forth by the Committee of Sponsoring Organizations of the Treadway Commission (COSO) in Internal Control - Integrated Framework (2013 Framework). Based on our assessment, management believes that, as of December 31, 2017, the Company's system of internal control over financial reporting is effective based on those criteria. Ernst & Young LLP, the Company’s independent registered public accounting firm, has issued an attestation report on the effectiveness of internal control over financial reporting. This report appears on page 51.
February 28, 2018
s/ Charles R. Hageboeck | /s/ David L. Bumgarner | ||
Charles R. Hageboeck | David L. Bumgarner | ||
President & Chief Executive Officer | Chief Financial Officer | ||
50
REPORT OF ERNST & YOUNG LLP, INDEPENDENT REGISTERED PUBLIC ACCOUNTING FIRM
Audit Committee of the Board of Directors and the
Shareholders of City Holding Company and Subsidiaries
Opinion on Internal Control over Financial Reporting
We have audited City Holding Company and subsidiaries’ internal control over financial reporting as of December 31, 2017, based on criteria established in Internal Control - Integrated Framework issued by the Committee of Sponsoring Organizations of the Treadway Commission (2013 framework) (the COSO criteria). In our opinion, City Holding Company and subsidiaries (the Company) maintained, in all material respects, effective internal control over financial reporting as of December 31, 2017, based on the COSO criteria.
We also have audited, in accordance with the standards of the Public Company Accounting Oversight Board (United States) (PCAOB), the consolidated balance sheets as of December 31, 2017 and 2016, the related consolidated statements of income, comprehensive income, changes in shareholders' equity and cash flows for each of the three years in the period ended December 31, 2017, and the related notes (collectively referred to as the "consolidated financial statements") of the Company and our report dated February 28, 2018, expressed an unqualified opinion thereon.
Basis for Opinion
The Company's management is responsible for maintaining effective internal control over financial reporting and for its assessment of the effectiveness of internal control over financial reporting included in the accompanying Report on Management’s Assessment of Internal Control over Financial Reporting. Our responsibility is to express an opinion on the Company’s internal control over financial reporting based on our audit. We are a public accounting firm registered with the PCAOB and are required to be independent with respect to the Company in accordance with the U.S. federal securities laws and the applicable rules and regulations of the Securities and Exchange Commission and the PCAOB.
We conducted our audit in accordance with the standards of the PCAOB. Those standards require that we plan and perform the audit to obtain reasonable assurance about whether effective internal control over financial reporting was maintained in all material respects.
Our audit included obtaining an understanding of internal control over financial reporting, assessing the risk that a material weakness exists, testing and evaluating the design and operating effectiveness of internal control based on the assessed risk, and performing such other procedures as we considered necessary in the circumstances. We believe that our audit provides a reasonable basis for our opinion.
Definition and Limitations of Internal Control over Financial Reporting
A company’s internal control over financial reporting is a process designed to provide reasonable assurance regarding the reliability of financial reporting and the preparation of financial statements for external purposes in accordance with generally accepted accounting principles. A company’s internal control over financial reporting includes those policies and procedures that (1) pertain to the maintenance of records that, in reasonable detail, accurately and fairly reflect the transactions and dispositions of the assets of the company; (2) provide reasonable assurance that transactions are recorded as necessary to permit preparation of financial statements in accordance with generally accepted accounting principles, and that receipts and expenditures of the company are being made only in accordance with authorizations of management and directors of the company; and (3) provide reasonable assurance regarding prevention or timely detection of unauthorized acquisition, use, or disposition of the company’s assets that could have a material effect on the financial statements.
Because of its inherent limitations, internal control over financial reporting may not prevent or detect misstatements. Also, projections of any evaluation of effectiveness to future periods are subject to the risk that controls may become inadequate because of changes in conditions, or that the degree of compliance with the policies or procedures may deteriorate.
/s/ Ernst & Young LLP | |
Charleston, West Virginia | |
February 28, 2018 | |
51
REPORT OF ERNST & YOUNG LLP, INDEPENDENT REGISTERED PUBLIC ACCOUNTING FIRM
Audit Committee of the Board of Directors and the
Shareholders of City Holding Company and Subsidiaries
Opinion on the Financial Statements
We have audited the accompanying consolidated balance sheets of City Holding Company and subsidiaries (the Company) as of December 31, 2017 and 2016, the related consolidated statements of income, comprehensive income, changes in shareholders’ equity and cash flows for each of the three years in the period ended December 31, 2017, and the related notes (collectively referred to as the "consolidated financial statements"). In our opinion, the consolidated financial statements present fairly, in all material respects, the financial position of the Company at December 31, 2017 and 2016, and the results of its operations and its cash flows for each of the three years in the period ended December 31, 2017, in conformity with U.S. generally accepted accounting principles.
We also have audited, in accordance with the standards of the Public Company Accounting Oversight Board (United States) (PCAOB), the Company's internal control over financial reporting as of December 31, 2017, based on criteria established in Internal Control - Integrated Framework issued by the Committee of Sponsoring Organizations of the Treadway Commission (2013 framework), and our report dated February 28, 2018 expressed an unqualified opinion thereon.
Basis for Opinion
These financial statements are the responsibility of the Company's management. Our responsibility is to express an opinion on the Company's financial statements based on our audits. We are a public accounting firm registered with the PCAOB and are required to be independent with respect to the Company in accordance with the U.S. federal securities laws and the applicable rules and regulations of the Securities and Exchange Commission and the PCAOB.
We conducted our audits in accordance with the standards of the PCAOB. Those standards require that we plan and perform the audit to obtain reasonable assurance about whether the financial statements are free of material misstatement, whether due to error or fraud. Our audits included performing procedures to assess the risks of material misstatement of the financial statements, whether due to error or fraud, and performing procedures that respond to those risks. Such procedures included examining, on a test basis, evidence regarding the amounts and disclosures in the financial statements. Our audits also included evaluating the accounting principles used and significant estimates made by management, as well as evaluating the overall presentation of the financial statements. We believe that our audits provide a reasonable basis for our opinion.
/s/ Ernst & Young LLP | |
We have served as the Company's auditor since 1982. | |
Charleston, West Virginia | |
February 28, 2018 | |
52
PART I, ITEM 1 – FINANCIAL STATEMENTS
CONSOLIDATED BALANCE SHEETS
CITY HOLDING COMPANY AND SUBSIDIARIES
(in thousands)
December 31, 2017 | December 31, 2016 | |||||
Assets | ||||||
Cash and due from banks | $ | 54,450 | $ | 62,263 | ||
Interest-bearing deposits in depository institutions | 28,058 | 25,876 | ||||
Cash and Cash Equivalents | 82,508 | 88,139 | ||||
Investment securities available for sale, at fair value | 550,389 | 450,083 | ||||
Investment securities held-to-maturity, at amortized cost (approximate fair value at December 31, 2017 and 2016 - $65,646 and $76,445, respectively) | 64,449 | 75,169 | ||||
Other securities | 14,147 | 14,352 | ||||
Total Investment Securities | 628,985 | 539,604 | ||||
Gross loans | 3,127,410 | 3,046,226 | ||||
Allowance for loan losses | (18,836 | ) | (19,730 | ) | ||
Net Loans | 3,108,574 | 3,026,496 | ||||
Bank owned life insurance | 103,440 | 100,732 | ||||
Premises and equipment, net | 72,682 | 75,165 | ||||
Accrued interest receivable | 9,223 | 8,408 | ||||
Deferred tax asset, net | 11,913 | 28,043 | ||||
Goodwill and other intangible assets, net | 78,595 | 79,135 | ||||
Other assets | 36,361 | 38,681 | ||||
Total Assets | $ | 4,132,281 | $ | 3,984,403 | ||
Liabilities | ||||||
Deposits: | ||||||
Noninterest-bearing | $ | 666,639 | $ | 672,286 | ||
Interest-bearing: | ||||||
Demand deposits | 769,245 | 695,891 | ||||
Savings deposits | 796,275 | 822,057 | ||||
Time deposits | 1,083,475 | 1,041,419 | ||||
Total Deposits | 3,315,634 | 3,231,653 | ||||
Short-term borrowings: | ||||||
Federal Home Loan Bank advances | 54,000 | 64,100 | ||||
Securities sold under agreements to repurchase | 198,219 | 184,205 | ||||
Long-term debt | 16,495 | 16,495 | ||||
Other liabilities | 45,426 | 45,512 | ||||
Total Liabilities | 3,629,774 | 3,541,965 | ||||
Shareholders’ Equity | ||||||
Preferred stock, par value $25 per share: 500,000 shares authorized; none issued | — | — | ||||
Common stock, par value $2.50 per share: 50,000,000 shares authorized; 19,047,548 shares and 18,606,944 shares issued at December 31, 2017 and 2016, less 3,429,519 and 3,478,511 shares in treasury, respectively | 47,619 | 46,518 | ||||
Capital surplus | 140,960 | 112,873 | ||||
Retained earnings | 444,481 | 417,017 | ||||
Treasury stock | (124,909 | ) | (126,958 | ) | ||
Accumulated other comprehensive loss: | ||||||
Unrealized loss on securities available-for-sale | (611 | ) | (2,352 | ) | ||
Underfunded pension liability | (5,033 | ) | (4,660 | ) | ||
Total Accumulated Other Comprehensive Loss | (5,644 | ) | (7,012 | ) | ||
Total Shareholders’ Equity | 502,507 | 442,438 | ||||
Total Liabilities and Shareholders’ Equity | $ | 4,132,281 | $ | 3,984,403 | ||
See notes to consolidated financial statements.
53
CONSOLIDATED STATEMENTS OF INCOME
CITY HOLDING COMPANY AND SUBSIDIARIES
(in thousands, except earnings per share data)
Year Ended December 31 | |||||||||
2017 | 2016 | 2015 | |||||||
Interest Income | |||||||||
Interest and fees on loans | $ | 125,752 | $ | 118,138 | $ | 115,107 | |||
Interest on investment securities: | |||||||||
Taxable | 14,387 | 12,392 | 10,830 | ||||||
Tax-exempt | 2,706 | 1,622 | 1,137 | ||||||
Interest on deposits in depository institutions | 85 | — | — | ||||||
Total Interest Income | 142,930 | 132,152 | 127,074 | ||||||
Interest Expense | |||||||||
Interest on deposits | 14,826 | 12,052 | 10,886 | ||||||
Interest on short-term borrowings | 1,214 | 472 | 327 | ||||||
Interest on long-term debt | 765 | 683 | 617 | ||||||
Total Interest Expense | 16,805 | 13,207 | 11,830 | ||||||
Net Interest Income | 126,125 | 118,945 | 115,244 | ||||||
Provision for loan losses | 3,006 | 4,395 | 6,988 | ||||||
Net Interest Income After Provision for Loan Losses | 123,119 | 114,550 | 108,256 | ||||||
Non-interest Income | |||||||||
Gains on sale of investment securities | 4,476 | 3,513 | 2,130 | ||||||
Service charges | 28,574 | 26,703 | 26,316 | ||||||
Bankcard revenue | 17,120 | 16,515 | 15,894 | ||||||
Trust and investment management fee income | 6,269 | 5,573 | 5,124 | ||||||
Bank owned life insurance | 4,212 | 3,326 | 3,374 | ||||||
Gain on sale of insurance division | — | — | 11,084 | ||||||
Other income | 2,956 | 3,195 | 3,284 | ||||||
Total Non-interest Income | 63,607 | 58,825 | 67,206 | ||||||
Non-interest Expense | |||||||||
Salaries and employee benefits | 51,057 | 50,883 | 47,847 | ||||||
Occupancy related expenses | 9,557 | 10,119 | 9,756 | ||||||
Equipment and software related expenses | 7,732 | 7,211 | 6,609 | ||||||
FDIC insurance expense | 1,348 | 1,622 | 1,794 | ||||||
Advertising | 2,914 | 2,606 | 2,446 | ||||||
Bankcard expenses | 3,924 | 4,458 | 4,119 | ||||||
Postage, delivery, and statement mailings | 2,094 | 2,080 | 2,123 | ||||||
Office supplies | 1,437 | 1,364 | 1,350 | ||||||
Legal and professional fees | 1,956 | 1,882 | 1,534 | ||||||
Telecommunications | 1,988 | 1,813 | 1,765 | ||||||
Repossessed asset losses, net of expenses | 735 | 890 | 1,264 | ||||||
Merger related costs | — | — | 598 | ||||||
Other expenses | 11,239 | 11,236 | 11,746 | ||||||
Total Non-interest Expense | 95,981 | 96,164 | 92,951 | ||||||
Income Before Income Taxes | 90,745 | 77,211 | 82,511 | ||||||
54
Income tax expense | 36,435 | 25,083 | 28,414 | ||||||
Net Income Available to Common Shareholders | $ | 54,310 | $ | 52,128 | $ | 54,097 | |||
Average shares outstanding, basic | 15,412 | 14,900 | 15,123 | ||||||
Effect of dilutive securities | 24 | 13 | 48 | ||||||
Average shares outstanding, diluted | 15,436 | 14,913 | 15,171 | ||||||
Basic earnings per common share | $ | 3.49 | $ | 3.46 | $ | 3.54 | |||
Diluted earnings per common share | $ | 3.48 | $ | 3.45 | $ | 3.53 | |||
Dividends declared per common share | $ | 1.78 | $ | 1.72 | $ | 1.68 | |||
See notes to consolidated financial statements.
55
CONSOLIDATED STATEMENTS OF COMPREHENSIVE INCOME
CITY HOLDING COMPANY AND SUBSIDIARIES
(in thousands)
Year Ended December 31 | |||||||||
2017 | 2016 | 2015 | |||||||
Net income available to common shareholders | $ | 54,310 | $ | 52,128 | $ | 54,097 | |||
Available-for-Sale Securities | |||||||||
Unrealized (loss) gain on available-for-sale securities arising during period | 7,396 | (1,685 | ) | 1,713 | |||||
Reclassification adjustment for net gains | (4,476 | ) | (3,513 | ) | (2,130 | ) | |||
Other comprehensive (loss) income related to available-for-sale securities | 2,920 | (5,198 | ) | (417 | ) | ||||
Defined Benefit Pension Plan | |||||||||
Amortization of actuarial net gains | 849 | 847 | 975 | ||||||
Recognition of unrealized losses | (11 | ) | (690 | ) | (40 | ) | |||
Change in underfunded pension liability | 838 | 157 | 935 | ||||||
Other comprehensive (loss) income before income taxes | 3,758 | (5,041 | ) | 518 | |||||
Tax effect | (1,391 | ) | 1,861 | (191 | ) | ||||
Other comprehensive (loss) income, net of tax | 2,367 | (3,180 | ) | 327 | |||||
Comprehensive income, net of tax | $ | 56,677 | $ | 48,948 | $ | 54,424 | |||
See notes to consolidated financial statements.
56
CONSOLIDATED STATEMENTS OF CHANGES IN SHAREHOLDERS’ EQUITY
CITY HOLDING COMPANY AND SUBSIDIARIES
(dollars in thousands)
Common Stock | Capital Surplus | Retained Earnings | Treasury Stock | Accumulated Other Comprehensive Loss | Total Shareholders’ Equity | |||||||||||||
Balances at December 31, 2014 | $ | 46,249 | $ | 107,370 | $ | 362,211 | $ | (120,818 | ) | $ | (4,159 | ) | $ | 390,853 | ||||
Net income available to common shareholders | — | — | 54,097 | — | — | 54,097 | ||||||||||||
Other comprehensive income | — | — | — | — | 327 | 327 | ||||||||||||
Cash dividends declared ($1.68 per share) | — | — | (25,618 | ) | — | — | (25,618 | ) | ||||||||||
Stock-based compensation expense, net | — | 1,456 | — | — | — | 1,456 | ||||||||||||
Restricted awards granted | (1,190 | ) | — | 1,527 | — | 337 | ||||||||||||
Exercise of 81,500 stock options | — | (602 | ) | — | 3,581 | — | 2,979 | |||||||||||
Exercise of 61,796 warrants | — | (765 | ) | — | 2,661 | — | 1,896 | |||||||||||
Purchase of 150,385 treasury shares | — | — | — | (7,055 | ) | — | (7,055 | ) | ||||||||||
Balances at December 31, 2015 | $ | 46,249 | $ | 106,269 | $ | 390,690 | $ | (120,104 | ) | $ | (3,832 | ) | $ | 419,272 | ||||
Common Stock | Capital Surplus | Retained Earnings | Treasury Stock | Accumulated Other Comprehensive Loss | Total Shareholders’ Equity | |||||||||||||
Balances at December 31, 2015 | $ | 46,249 | $ | 106,269 | $ | 390,690 | $ | (120,104 | ) | $ | (3,832 | ) | $ | 419,272 | ||||
Net income available to common shareholders | — | — | 52,128 | — | — | 52,128 | ||||||||||||
Other comprehensive income | — | — | — | — | (3,180 | ) | (3,180 | ) | ||||||||||
Cash dividends declared ($1.72 per share) | — | — | (25,801 | ) | — | — | (25,801 | ) | ||||||||||
Stock-based compensation expense, net | — | 1,979 | — | — | — | 1,979 | ||||||||||||
Restricted awards granted | — | (1,706 | ) | — | 1,745 | — | 39 | |||||||||||
Issuance of 107,662 shares of common stock | 269 | 6,595 | — | — | — | 6,864 | ||||||||||||
Exercise of 32,750 stock options | — | (264 | ) | — | 1,419 | — | 1,155 | |||||||||||
Purchase of 231,132 treasury shares | — | — | (10,018 | ) | — | (10,018 | ) | |||||||||||
Balances at December 31, 2016 | $ | 46,518 | $ | 112,873 | $ | 417,017 | $ | (126,958 | ) | $ | (7,012 | ) | $ | 442,438 | ||||
Common Stock | Capital Surplus | Retained Earnings | Treasury Stock | Accumulated Other Comprehensive Loss | Total Shareholders’ Equity | |||||||||||||
Balances at December 31, 2016 | $ | 46,518 | $ | 112,873 | $ | 417,017 | $ | (126,958 | ) | $ | (7,012 | ) | $ | 442,438 | ||||
Net income available to common shareholders | — | — | 54,310 | — | — | 54,310 | ||||||||||||
Other comprehensive income | — | — | — | — | 2,367 | 2,367 | ||||||||||||
Reclassification of residual tax effect of corporate tax rate reduction | — | — | 999 | — | (999 | ) | — | |||||||||||
Cash dividends declared ($1.78 per share) | — | — | (27,845 | ) | — | — | (27,845 | ) | ||||||||||
Stock-based compensation expense, net | — | 2,097 | — | — | — | 2,097 | ||||||||||||
Restricted awards granted | — | (1,351 | ) | — | 1,351 | — | — | |||||||||||
Issuance of 440,604 shares of common stock | 1,101 | 27,307 | — | — | — | 28,408 | ||||||||||||
Exercise of 16,639 stock options | — | 34 | — | 698 | — | 732 | ||||||||||||
Balances at December 31, 2017 | $ | 47,619 | $ | 140,960 | $ | 444,481 | $ | (124,909 | ) | $ | (5,644 | ) | $ | 502,507 | ||||
See notes to consolidated financial statements.
57
CONSOLIDATED STATEMENTS OF CASH FLOWS
CITY HOLDING COMPANY AND SUBSIDIARIES
(in thousands)
Year Ended December 31 | |||||||||
2017 | 2016 | 2015 | |||||||
Net income available to common shareholders | $ | 54,310 | $ | 52,128 | $ | 54,097 | |||
Adjustments to reconcile net income to net cash provided by operating activities: | |||||||||
Amortization and accretion | 1,005 | 838 | (4,589 | ) | |||||
Provision for loan losses | 3,006 | 4,395 | 6,988 | ||||||
Depreciation of premises and equipment | 5,884 | 6,235 | 6,088 | ||||||
Deferred income tax expense | 14,909 | 3,817 | 6,627 | ||||||
Net periodic employee benefit cost | 298 | 515 | 836 | ||||||
Realized investment securities gains | (4,476 | ) | (3,978 | ) | (2,130 | ) | |||
Net investment securities impairment losses | — | 465 | — | ||||||
Stock-based compensation expense | 2,097 | 2,018 | 1,793 | ||||||
Excess tax benefit from stock-compensation expense | (558 | ) | — | — | |||||
Increase in value of bank-owned life insurance | (2,708 | ) | (3,071 | ) | (3,374 | ) | |||
Proceeds from life insurance | 1,717 | 258 | 571 | ||||||
Originations of loans held for sale | (16,451 | ) | (17,981 | ) | (17,849 | ) | |||
Proceeds from loans held for sale | 19,290 | 16,572 | 18,668 | ||||||
Gain on sale of loans | (516 | ) | (374 | ) | (367 | ) | |||
Gain on sale of insurance division | — | — | (11,084 | ) | |||||
Asset write down | — | 444 | 1,449 | ||||||
Change in accrued interest receivable | (815 | ) | (976 | ) | (375 | ) | |||
Change in other assets | 1,277 | (1,556 | ) | (976 | ) | ||||
Change in other liabilities | (426 | ) | 5,581 | (8,478 | ) | ||||
Net Cash Provided by Operating Activities | 77,843 | 65,330 | 47,895 | ||||||
Proceeds from sales of securities available-for-sale | 5,776 | 30,850 | 389 | ||||||
Proceeds from maturities and calls of securities available-for-sale | 86,276 | 78,720 | 55,726 | ||||||
Proceeds from maturities and calls of securities held-to-maturity | 10,580 | 13,479 | 13,191 | ||||||
Purchases of securities available-for-sale | (187,031 | ) | (196,150 | ) | (175,271 | ) | |||
Purchases of securities held-to-maturity | — | — | (10,392 | ) | |||||
Net increase in loans | (85,489 | ) | (183,511 | ) | (100,130 | ) | |||
Purchases of premises and equipment | (6,574 | ) | (5,517 | ) | (3,014 | ) | |||
Disposals of premises and equipment | 3,057 | 836 | 141 | ||||||
Proceeds from sale of CityInsurance | — | — | 15,250 | ||||||
Acquisition of American Founders Bank, Inc., including cash acquired of $561 | — | — | 20,030 | ||||||
Net Cash Used in Investing Activities | (173,405 | ) | (261,293 | ) | (184,080 | ) | |||
Net (decrease) increase in noninterest-bearing deposits | (5,647 | ) | 200,984 | 52,230 | |||||
Net increase (decrease) in interest-bearing deposits | 89,644 | (52,714 | ) | 18,544 | |||||
Net increase in short-term borrowings | 3,914 | 93,436 | 14,780 | ||||||
Issuance of common stock | 28,408 | 6,864 | — | ||||||
Purchases of treasury stock | — | (10,018 | ) | (7,055 | ) | ||||
Proceeds from exercise of stock options | 732 | 1,155 | 2,979 | ||||||
Proceeds from exercise of warrants | — | — | 1,896 | ||||||
Dividends paid | (27,120 | ) | (25,718 | ) | (25,304 | ) | |||
Net Cash Provided by Financing Activities | 89,931 | 213,989 | 58,070 | ||||||
(Decrease) Increase in Cash and Cash Equivalents | (5,631 | ) | 18,026 | (78,115 | ) | ||||
Cash and cash equivalents at beginning of period | 88,139 | 70,113 | 148,228 | ||||||
Cash and Cash Equivalents at End of Period | $ | 82,508 | $ | 88,139 | $ | 70,113 | |||
See notes to consolidated financial statements.
58
NOTES TO CONSOLIDATED FINANCIAL STATEMENTS
CITY HOLDING COMPANY AND SUBSIDIARIES
NOTE ONE – SUMMARY OF SIGNIFICANT ACCOUNTING AND REPORTING POLICIES
Summary of Significant Accounting and Reporting Policies: The accounting and reporting policies of City Holding Company and its subsidiaries (the “Company”) conform with U. S. generally accepted accounting principles and require management to make estimates and develop assumptions that affect the amounts reported in the financial statements and related footnotes. Actual results could differ from management’s estimates. The following is a summary of the more significant policies.
Principles of Consolidation: The consolidated financial statements include the accounts of City Holding Company and its wholly owned subsidiaries. All significant intercompany accounts and transactions have been eliminated in the consolidated financial statements.
The Company determines whether it has a controlling financial interest in an entity by first evaluating whether the entity is a voting interest entity or a variable interest entity in conformity with U. S. generally accepted accounting principles. Voting interest entities are entities in which the total equity investment at risk is sufficient to enable the entity to finance itself independently and provides the equity holders with the obligation to absorb losses, the right to receive residual returns and the right to make decisions about the entity’s activities. The Company consolidates voting interest entities in which it has all, or at least a majority of, the voting interest. As defined in applicable accounting standards, variable interest entities (VIEs) are entities that lack one or more of the characteristics of a voting interest entity. A controlling financial interest in a VIE is present when an enterprise has both the power to direct the activities of the VIE that most significantly impact the VIE’s economic performance and an obligation to absorb losses or the right to receive benefits that could potentially be significant to the VIE. The enterprise with a controlling financial interest, known as the primary beneficiary, consolidates the VIE. The Company’s wholly owned subsidiary, City Holding Capital Trust III, is a VIE for which the Company is not the primary beneficiary. Accordingly, the accounts of this entity are not included in the Company’s consolidated financial statements.
Certain amounts in the prior year financial statements have been reclassified to conform to the current year presentation. Such reclassifications had no impact on shareholders’ equity or net income for any period.
Description of Principal Markets and Services: The Company is a registered financial holding company under the Bank Holding Company Act headquartered in Charleston, West Virginia, and conducts its principal activities through its wholly-owned subsidiary, City National Bank of West Virginia (“City National”). City National is a retail and consumer-oriented community bank with 86 banking offices in West Virginia, Virginia, Kentucky and southeastern Ohio. City National provides credit, deposit, and trust and investment management services to its customers. In addition to its branch network, City National's delivery channels include ATMs, mobile banking, debit cards, interactive voice response systems and Internet technology. The Company conducts its business activities through one reportable business segment - community banking.
In January 2015, the Company sold its insurance operations, CityInsurance, to The Hilb Group, effective January 1, 2015. As a result of this sale, the Company recognized a one-time, after tax gain of $5.8 million.
Cash and Due from Banks: The Company considers cash, due from banks, and interest-bearing deposits in depository institutions as cash and cash equivalents. City National is required to maintain an average reserve balance with the Federal Reserve Bank of Richmond to compensate for services provided by the Federal Reserve and to meet statutory required reserves for demand deposits.
Securities: Management determines the appropriate classification of securities at the time of purchase. If management has the intent and the Company has the ability at the time of purchase to hold debt securities to maturity, they are classified as investment securities held-to-maturity and are stated at amortized cost, adjusted for amortization of premiums and accretion of discounts. Debt securities which the Company may not hold to maturity are classified as investment securities available-for-sale along with the Company’s investment in equity securities. Securities available-for-sale are carried at fair value, with the unrealized gains and losses, net of tax, reported in comprehensive income. Securities classified as available-for-sale include securities that management intends to use as part of its asset/liability management strategy and that may be sold in response to changes in interest rates, resultant prepayment risk, and other factors.
The Company utilizes a third party pricing service provider to value its investment portfolio. Annually, the Company obtains an independent auditor’s report from its third party pricing service provider regarding its controls over valuation of investment securities. Although an unqualified opinion regarding the design and operating effectiveness of controls was issued, the report did contain caveats and disclaimers regarding the pricing information, such as the Company should review market
59
values for reasonableness. On a quarterly basis, the Company selects a sample of its debt securities and reprices those securities with a third party that is independent of the primary pricing service provider to verify the reasonableness of the fair values.
Also, on a quarterly basis, the Company performs a review of investment securities to determine if any unrealized losses are other than temporarily impaired. Management considers the following, among other things, in its determination of the nature of the unrealized losses: (i) the length of time and the extent to which the fair value has been less than cost; (ii) the financial condition, capital strength, and near–term (within 12 months) prospects of the issuer, including any specific events which may influence the operations of the issuer such as changes in technology that may impair the earnings potential of the investment or the discontinuance of a segment of the business that may affect the future earnings potential; (iii) the historical volatility in the market value of the investment and/or the liquidity or illiquidity of the investment; (iv) adverse conditions specifically related to the security, an industry, or a geographic area; and (v) the intent and ability of the Company to retain its investment in the issuer for a period of time sufficient to allow for any anticipated recovery in fair value. The Company continues to actively monitor the market value of these investments along with the financial strength of the issuers behind these securities, as well as its entire investment portfolio. Based on the market information available, the Company believes that (i) the declines in fair value are temporary, driven by fluctuations in the interest rate environment and not due to the credit worthiness of the issuers, (ii) the Company does not have the intent to sell any of the securities classified as available for sale, and (iii) it is more likely than not that the Company will not have to sell any such securities before recovery of cost. The Company cannot guarantee that such securities will recover and if additional information becomes available in the future to suggest that the losses are other than temporary, the Company may need to record impairment charges in the future.
The specific identification method is used to determine the cost basis of securities sold. Certain investment securities that do not have readily determinable fair values and for which the Company does not exercise significant influence are carried at cost and classified as other investment securities on the Consolidated Balance Sheets. These cost-method investments are reviewed for impairment at least annually or sooner if events or changes in circumstances indicate the carrying value may not be recoverable.
Loans: Loans, excluding previously securitized loans, which are discussed separately below, are reported at the principal amount outstanding, net of unearned income. Portfolio loans include those for which management has the intent and the Company has the ability to hold for the foreseeable future, or until maturity or payoff. The foreseeable future is based upon management’s judgment of current business strategies and market conditions, the type of loan, asset/liability management, and liquidity.
Interest income on loans is accrued and credited to operations based upon the principal amount outstanding, using methods that generally result in level rates of return. Loan origination fees, and certain direct costs, are deferred and amortized as an adjustment to the yield over the term of the loan. The accrual of interest income generally is discontinued when a loan becomes 90 days past due as to principal or interest for all loan types. However, any loan may be placed on non-accrual if the Company receives information that indicates that it is probable a borrower will be unable to meet the contractual terms of their respective loan agreement. Other indicators considered for placing a loan on non-accrual status include the borrower’s involvement in bankruptcies, foreclosures, repossessions, litigation and any other situation resulting in doubt as to whether full collection of contractual principal and interest is attainable. When interest accruals are discontinued, unpaid interest recognized in income in the current year is reversed, and interest accrued in prior years is charged to the allowance for loan losses. Management may elect to continue the accrual of interest when the estimated net realizable value of collateral exceeds the principal balance and related accrued interest, and the loan is in process of collection.
Generally for all loan classes, interest income during the period the loan is non-performing is recorded on a cash basis after recovery of principal is reasonably assured. Cash payments received on nonperforming loans are typically applied directly against the outstanding principal balance until the loan is fully repaid. Generally, loans are restored to accrual status when the obligation is brought current, has performed in accordance with the contractual terms for a reasonable period of time, and the ultimate collectability of the total contractual principal and interest is no longer in doubt.
Generally, all loan types are considered past due when the contractual terms of a loan are not met and the borrower is 30 days or more past due on a payment. Furthermore, residential and home equity loans are generally subject to charge-off when the loan becomes 120 days past due, depending on the estimated fair value of the collateral less cost to dispose, versus the outstanding loan balance. Commercial loans are generally charged off when the loan becomes 120 days past due and consumer loans are generally charged off when the loan becomes 120 days past due.
Acquired Loans: In determining the estimated fair value of the acquired loans, management considered several factors, such as estimated future credit losses, estimated prepayments, remaining lives of the acquired loans, estimated value of the underlying collateral and the present value of the cash flows expected to be received. For smaller loans not specifically reviewed, management grouped the loans into their respective homogeneous loan pool and applied a loss estimate accordingly.
60
Acquired loans are accounted for using one of the two following accounting standards:
(1) | ASC Topic 310-20 is used to value loans that do not have evidence of credit quality deterioration. For these loans, the difference between the fair value of the loan and the amortized cost of the loan is amortized or accreted into income using the interest method. |
(2) | ASC Topic 310-30 is used to value loans that have evidence of credit quality deterioration. For these loans, the expected cash flows that exceed the fair value of the loan represent the accretable yield, which is recognized as interest income on a level-yield basis over the expected cash flow periods of the loans. The non-accretable difference represents the difference between the contractually required principal and interest payments and the cash flows expected to be collected based upon management’s estimation. Subsequent decreases in the expected cash flows will require the Company to evaluate the need for additions to the Company’s allowance for loan losses. Subsequent increases in the expected cash flows will result in a reversal of the provision for loan losses to the extent of prior charges with a corresponding adjustment to the accretable yield, which will result in the recognition of additional interest income over the remaining lives of the loans. |
Allowance for Loan Losses: The allowance for loan losses is maintained at a level that represents management’s best estimate of probable losses in the loan portfolio. Management’s determination of the appropriateness of the allowance for loan losses is based upon an evaluation of individual credits in the loan portfolio, historical loan loss experience, current economic conditions, and other relevant factors. This determination is inherently subjective, as it requires material estimates including the amounts and timing of future cash flows expected to be received on impaired loans that may be susceptible to significant change. These evaluations are conducted at least quarterly and more frequently if deemed necessary. The allowance for loan losses related to loans considered to be impaired is generally evaluated based on the discounted cash flows using the impaired loans' initial effective interest rate or the fair value of the collateral for certain collateral dependent loans. Loan losses are charged against the allowance and recoveries of amounts previously charged off are credited to the allowance. A provision for loan losses is charged to operations based on management’s periodic evaluation of the appropriateness of the allowance after considering factors noted above, among others.
In evaluating the appropriateness of its allowance for loan losses, the Company stratifies the loan portfolio into six major groupings, including commercial real estate, commercial and industrial, residential real estate, home equity, and others. Historical loss experience, as adjusted, is applied to the then outstanding balance of loans in each classification to estimate probable losses inherent in each segment of the portfolio. Historical loss experience is adjusted using a systematic weighted probability of potential risk factors that could result in actual losses deviating from prior loss experience. Risk factors considered by the Company in completing this analysis include: (1) unemployment and economic trends in the Company’s markets, (2) concentrations of credit, if any, among any industries, (3) trends in loan growth, loan mix, delinquencies, losses or credit impairment, (4) adherence to lending policies and others. Each risk factor is designated as low, moderate/increasing, or high based on the Company’s assessment of the risk to loss associated with each factor. Each risk factor is then weighted to consider probability of occurrence.
Additionally, all commercial loans within the portfolio are subject to internal risk grading. Risk grades are generally assigned by the primary lending officer and are periodically evaluated by the Company’s internal loan review process. Based on an individual loan’s risk grade, estimated loss percentages are applied to the outstanding balance of the loan to determine the amount of probable loss.
Premises and Equipment: Premises and equipment are stated at cost less accumulated depreciation. Depreciation is computed primarily by the straight-line method over the estimated useful lives of the assets. Depreciation of leasehold improvements is computed using the straight-line method over the lesser of the term of the respective lease or the estimated useful life of the respective asset. Maintenance and repairs are charged to expense as incurred, while improvements that extend the useful life of premises and equipment are capitalized and depreciated over the estimated remaining life of the asset.
Other Real Estate Owned: Other real estate owned (“OREO”) is comprised principally of commercial and residential real estate properties obtained in partial or total satisfaction of loan obligations. OREO acquired in settlement of indebtedness is included in Other Assets at the lower of estimated fair value of the asset, less estimated selling costs or the carrying amount of the loan. Changes to the value subsequent to transfer are recorded in non-interest expense, along with direct operating expenses. Gains or losses not previously recognized from sales of OREO are recognized in non-interest expense on the date of the sale. As of December 31, 2017 and 2016, the amount of OREO included in Other Assets was $3.6 million and $4.6 million, respectively.
Goodwill and Other Intangible Assets: Goodwill is the excess of the cost of an acquisition over the fair value of tangible and intangible assets acquired. Goodwill is not amortized. Intangible assets represent purchased assets that also lack
61
physical substance, but can be separately distinguished from goodwill because of contractual or other legal rights or because the asset is capable of being sold or exchanged either on its own or in combination with a related contract, asset or liability. Intangible assets with determinable useful lives, such as core deposits, are amortized over their estimated useful lives.
The Company performs an annual review for impairment in the recorded value of goodwill and indefinite lived intangible assets. Goodwill is tested for impairment between the annual tests if an event occurs or circumstances change that more than likely reduce the fair value of a reporting unit below its carrying value. An indefinite-lived intangible asset is tested for impairment between the annual tests if an event occurs or circumstances change indicating that the asset might be impaired.
Securities Sold Under Agreements to Repurchase: Securities sold under agreements to repurchase are accounted for as collateralized financing transactions and are recorded at the amounts at which the securities were sold plus accrued interest. Securities sold primarily consists of U.S. government, federal agency, and municipal securities pledged as collateral under these financing arrangements and cannot be repledged or sold, unless replaced by the secured party.
Derivative Financial Instruments: The Company enters into derivative transactions principally to protect against the risk of adverse price or interest rate movements on the value of certain assets and liabilities and on future cash flows. All derivative instruments are carried at fair value on the balance sheet. As of December 31, 2017 and 2016, the Company has derivative instruments not included in hedge relationships. These derivatives consist of interest rate swaps used for interest rate management purposes and derivatives executed with commercial banking customers to facilitate their interest rate management strategies. The change in the fair value of these derivative instruments is reflected in the statements of income. As of December 31, 2017, the Company also has a derivative instrument that is included in hedge relationships. This derivative consists of an interest rate swap used for interest rate management purposes on commercial real estate loans. The change in the fair value of these derivative instruments and net swap settlements are reflected in the statements as non-interest expense. The Company also has an interest rate swap for the purpose of hedging changes in LIBOR related to commercial real estate loans. Hedge ineffectiveness is assessed quarterly and any ineffectiveness is recorded as non-interest expense.
Trust Assets: Assets held in a fiduciary or agency capacity for customers are not included in the accompanying financial statements since such items are not assets of the Company. Trust and investment management fees are generally based on the market value of the assets within a trust account and recognized over time as the services are provided.
Income Taxes: The consolidated provision for income taxes is based upon reported income and expense. Deferred income taxes are provided for temporary differences between financial reporting and tax bases of assets and liabilities, computed using enacted tax rates. The income tax effects related to settlements of share-based compensation awards are reported in earnings as an increase (or decrease) to income tax expense. The Company files a consolidated income tax return. The respective subsidiaries generally provide for income taxes on a separate return basis and remit amounts determined to be currently payable to the Parent Company.
The Company and its subsidiaries are subject to examinations and challenges from federal and state taxing authorities regarding positions taken in returns. Uncertain tax positions are initially recognized in the consolidated financial statements when it is more likely than not the position will be sustained upon examination. These positions are initially and subsequently measured as the largest amount of tax benefit that is greater than 50% likely of being realized upon ultimate settlement with the taxing authority and assuming full knowledge of the position and all relevant facts by the taxing authority.
The Company invests in certain limited partnerships that operate qualified low-income housing tax credit developments. These investments are considered variable interest entities for which the Company is not the primary beneficiary. The tax credits are reflected in the Consolidated Statements of Income as a reduction in income tax expense. The unamortized amount of the investments is recorded within Other Assets within the Consolidated Balance Sheets. The Company’s investments in affordable housing limited partnerships were $1.3 million and $0.3 million at December 31, 2017 and 2016, respectively.
The Company adopted ASU No. 2018-02, "Income Statement - Reporting Comprehensive Income (Topic 220), Reclassification of Certain Tax Effects from Accumulated Other Comprehensive Income." This standard permits entities to reclassify the stranded tax effects resulting from the Tax Cuts and Jobs Act ("TCJA") from accumulated other comprehensive income to retained earnings. As a result of adopting this standard, the Company reclassified approximately $1.0 million from accumulated other comprehensive income to retained earnings. This reclassification was comprised of the stranded tax effects relating to the Company's unrealized gains and losses on its available-for-sale investment securities and its underfunded defined benefit pension plans.
Advertising Costs: Advertising costs are expensed as incurred.
62
Stock-Based Compensation: Compensation expense related to stock options and restricted stock awards issued to employees is based upon the fair value of the award at the date of grant. The fair value of stock options is estimated utilizing a Black Scholes pricing model, while the fair value of restricted stock awards is based upon the stock price at the date of grant. Compensation expense is recognized on a straight line basis over the vesting period for options and the respective period for stock awards.
Basic and Diluted Earnings per Common Share: Basic earnings per share is computed by dividing net income by the weighted-average number of shares of common stock outstanding, excluding participating securities. Diluted earnings per share is computed by dividing net income by the weighted-average number of shares outstanding, excluding participating securities, increased by the number of shares of common stock which would be issued assuming the exercise of stock options and other common stock equivalents.
Recent Accounting Pronouncements: In May 2014, the FASB issued ASU No. 2014-09, "Revenue from Contracts with Customers (Topic 606)." This standard clarifies the principles for recognizing revenue and developed a common revenue standard. The core principle of the standard is that an entity should recognize revenue to depict the transfer of promised goods or services to customers in an amount that reflects the consideration to which the entity expects to be entitled in exchange for those goods and services. To achieve that core principle, an entity should apply the following steps: (i) identifying the contractor contracts with a customer, (ii) identify the performance obligations in the contract, (iii) determine the transaction price, (iv) allocate the transaction price to the performance obligations in the contract and (v) recognize revenue when (or as) the entity satisfies a performance obligation. This ASU became effective for the Company on January 1, 2018. The Company's largest source of revenue is comprised of net interest income on financial assets and financial liabilities, which is explicitly excluded from the scope of ASU 2014-09, and non-interest income. For the year ended December 31, 2017, the Company's significant sources of non-interest income were: service charges, bankcard revenue, trust and investment management fee income and bank owned life insurance (which is also excluded from the scope of ASU 2014-09). The Company evaluated the terms of the contracts supporting each of these revenue streams not excluded and determined that ASU 2014-09 would not significantly change the way the Company recognizes the revenue from each stream and, therefore, will not have a material impact on the Company's financial statements or disclosures. The Company will adopt this standard using the modified retrospective approach, but does not anticipate recording a cumulative effect adjustment to opening retained earnings given the immaterial impact.
In January 2016, the FASB issued ASU No. 2016-01, "Financial Instruments—Overall (Subtopic 825-10): Recognition and Measurement of Financial Assets and Financial Liabilities." This standard makes several modifications to Subtopic 825-10 including the elimination of the available-for-sale classification of equity investments, and requires equity investments with readily determinable fair values to be measured at fair value with changes in fair value recognized in net income. This ASU became effective for the Company for interim and annual periods on January 1, 2018. The adoption of ASU No. 2016-01 is not expected to have a material impact on the Company's financial statements.
In February 2016, the FASB issued ASU No. 2016-02, “Leases (Topic 842).” This standard requires organizations to recognize lease assets and lease liabilities on the balance sheet and disclose key information about leasing requirements for leases that were historically classified as operating leases under previous generally accepted accounting principals. This ASU will become effective for the Company for interim and annual periods on January 1, 2019. Management has performed a preliminary analysis of the standard and does not expect a material impact as as a result of the adoption of ASU No. 2016-02 on the Company's financial statements.
In March 2016, the FASB issued ASU No. 2016-09, “Compensation-Stock Compensation (Topic 718): Improvements to Employee Share Based Accounting.” This standard makes several modifications to the accounting for share-based payment transactions, including the income tax consequences, classification of awards as either equity or liabilities, and classification on the statement of cash flows. This ASU became effective for the Company for interim and annual periods on January 1, 2017. The adoption of ASU No. 2016-09 did not have a material impact on the Company’s financial statements.
In April 2016, the FASB issued ASU No. 2016-10, “Revenue from Contracts with Customers (Topic 606): Identifying Performance Obligations and Licensing.” This standard was issued to clarify Revenue from Contracts with Customers (Topic 606) related to: (i) identifying performance obligations; and (ii) the licensing implementation guidance. The effective date is the same as the effective date of ASU 2014-09, "Revenue from Contracts with Customers (Topic 606)," as discussed above. ASU 2016-10 is not expected to have a significant impact on the Company's financial statements.
In June 2016, the FASB issued ASU No. 2016-13, "Financial Instruments - Credit Losses (Topic 326): Measurement of Credit Losses on Financial Instruments." This standard replaces the incurred loss impairment methodology in current GAAP with a methodology that reflects expected credit losses and requires consideration of a broader range of reasonable and supportable information to inform credit loss estimates. The amendments in this update require a financial asset (or a group of financial assets) measured at amortized cost basis to be presented at the net amount expected to be collected. The new current expected
63
credit losses model (CECL) will apply to the allowance for loan losses, available-for-sale and held to maturity debt securities, purchased financial assets with credit deterioration and certain off-balance sheet credit exposures. This ASU will become effective for the Company for interim and annual periods on January 1, 2020. Management is currently evaluating the potential impact of ASU No. 2016-13 on the Company's financial statements.
In August 2016, the FASB issued ASU No. 2016-15, "Statement of Cash Flows (Topic 230): Classification of Certain Cash Receipts and Cash Payments." This amendment addresses existing diversity in practice regarding how certain receipts and payments are presented in the statement of cash flows. Issues addressed in this amendment include debt prepayment and extinguishment costs, proceeds from the settlement of insurance claims, proceeds from the settlement of bank-owned life insurance policies, and separately identifiable cash flows and application of the predominance principle and their classifications in the statement of cash flows. This ASU became effective for the Company for interim and annual periods on January 1, 2018. The adoption of ASU No. 2016-15 is not expected to have a material impact on the Company's financial statements.
In October 2016, the FASB issued ASU No. 2016-16, "Income Taxes (Topic 740): Intra-Entity Transfers of Assets Other Than Inventory." This amendment improves the accounting for the income tax consequences of intra-entity transfers of assets other than inventory. Issues addressed in this amendment include the recognition of income tax consequences of an intra-entity transfer of an asset other than inventory when the transfer occurs. This ASU became effective for the Company on January 1, 2018. The adoption of ASU No. 2016-16 is not expected to have a material impact on the Company's financial statements.
In December 2016, the FASB issued ASU No. 2016-20, "Technical Corrections and Improvements to Topic 606, Revenue from Contracts with Customers." This amendment provides clarification for multiple aspects of Update 2014-09, “Compensation-Stock Compensation (Topic 718): Improvements to Employee Share Based Accounting” including the scope of guarantee fees, impairment testing of contract costs and the accrual of advertising costs. This ASU became effective for the Company on January 1, 2018. The adoption of ASU No. 2016-20 is not expected to have a material impact on the Company's financial statements.
In January 2017, the FASB issued ASU No. 2017-01, "Business Combinations (Topic 805): Clarifying the Definition of a Business." This amendment clarifies the definition of a business with the objective of adding guidance to assist entities with evaluating whether transactions should be accounted for as acquisitions (or disposals) of assets or businesses. This ASU became effective for the Company on January 1, 2018. The adoption of ASU No. 2017-01 is not expected to have a material impact on the Company's financial statements.
In January 2017, the FASB issued ASU No. 2017-04, "Intangibles—Goodwill and Other (Topic 350): Simplifying the Test for Goodwill Impairment." This amendment simplifies the measurement of goodwill by eliminating Step 2 from the goodwill impairment test. This ASU will become effective for the Company on January 1, 2020. The adoption of ASU No. 2017-04 is not expected to have a material impact on the Company's financial statements.
In March 2017, the FASB issued ASU No. 2017-07, "Compensation—Retirement Benefits (Topic 715): Improving the Presentation of Net Periodic Pension Cost and Net Periodic Postretirement Benefit Cost." This amendment requires that an employer disaggregate the service cost component from the other components of net benefit cost and also provides explicit guidance on how to present the service cost component and the other components of net benefit cost in the income statement. This ASU will become effective for the Company on January 1, 2018. The adoption of ASU No. 2017-07 is not expected to have a material impact on the Company's financial statements.
In March 2017, the FASB issued ASU No. 2017-08, "Receivables—Nonrefundable Fees and Other Costs (Subtopic 310-20): Premium Amortization on Purchased Callable Debt Securities." The amendments in this update shorten the amortization period for certain callable debt securities held at a premium and require the premium to be amortized to the earliest call date. This ASU will become effective for the Company on January 1, 2019. The adoption of ASU No. 2017-08 is not expected to have a material impact on the Company's financial statements.
In May 2017, the FASB issued ASU No. 2017-09, "Compensation—Stock Compensation (Topic 718): Scope of Modification Accounting." This amendment provides guidance about which changes to the terms or conditions of a share-based payment award require an entity to apply modification accounting in ASU No. 2016-09. This ASU became effective for the Company on January 1, 2018. The adoption of ASU No. 2017-09 is not expected to have a material impact on the Company’s financial statements.
In August 2017, the FASB issued ASU No. 2017-12, "Derivatives and Hedging (Topic 815): Targeted Improvements to Accounting for Hedging Activities." This amendment expands and refines hedge accounting for both nonfinancial and financial risk components and aligns the recognition and presentation of the effects of the hedging instrument and the hedged item in the
64
financial statements. This ASU will become effective for the Company on January 1, 2019. The adoption of ASU No. 2017-12 is not expected to have a material impact on the Company's financial statements.
In September 2017, the FASB issued ASU No. 2017-13, "Revenue Recognition (Topic 605), Revenue from Contracts with Customers (Topic 606), Leases (Topic 840), and Leases (Topic 842)." This amendment provides modifications to previously issued ASUs 2014-09 and 2016-02. The adoption of ASU No. 2017-13 did not expected to have a material impact on the Company's financial statements.
In November 2017, the FASB issued ASU No. 2017-14, "Income Statement - Reporting Comprehensive Income (Topic 220), Revenue Recognition (Topic 605), and Revenue from Contracts with Customers (Topic 606)." This amendment supersedes various SEC paragraphs and amends an SEC paragraph pursuant to the issuance of Staff Accounting Bulletin No. 116. The adoption of ASU No. 2017-14 is not expected to have a material impact on the Company's financial statements.
In February 2018, the FASB issued ASU No. 2018-02, "Income Statement - Reporting Comprehensive Income (Topic 220): Reclassification of Certain Tax Effects from Accumulated Other Comprehensive Income." This amendment permits entities to reclassify tax effects stranded in accumulated other comprehensive income as a result of the Tax Cuts and Jobs Act ("TCJA") to retained earnings. The guidance is effective for all entities for fiscal years beginning after December 15, 2018, and interim periods within those fiscal years, with early adoption permissible. The Company decided to early adopt this amendment as of December 31, 2017 and the December 31, 2017 balance sheet and the statement of changes in shareholders' equity for the year ended December 31, 2017 reflect this adoption.
Statements of Cash Flows: Cash paid for interest, including interest paid on long-term debt and trust preferred securities, was $16.4 million, $13.1 million, and $11.8 million in 2017, 2016, and 2015, respectively. During 2017, 2016 and 2015, the Company paid $22.6 million, $16.3 million, and $26.3 million, respectively, for income taxes.
NOTE TWO – RESTRICTIONS ON CASH AND DUE FROM BANKS
City National is required to maintain an average reserve balance with the Federal Reserve Bank of Richmond to compensate for services provided by the Federal Reserve and to meet statutory required reserves for demand deposits. The average amounts of the reserve balances for the years ended December 31, 2017 and 2016 were approximately $37.8 million and $33.3 million, respectively.
65
NOTE THREE –INVESTMENTS
The aggregate carrying and approximate market values of securities follow (in thousands). Fair values are based on quoted market prices, where available. If quoted market prices are not available, fair values are based on quoted market prices of comparable financial instruments.
December 31, 2017 | December 31, 2016 | |||||||||||||||||||||||
Amortized Cost | Gross Unrealized Gains | Gross Unrealized Losses | Estimated Fair Value | Amortized Cost | Gross Unrealized Gains | Gross Unrealized Losses | Estimated Fair Value | |||||||||||||||||
Securities available-for-sale: | ||||||||||||||||||||||||
U.S. Treasuries and U.S. | ||||||||||||||||||||||||
government agencies | $ | 2 | $ | — | $ | — | $ | 2 | $ | 3 | $ | — | $ | — | $ | 3 | ||||||||
Obligations of states and | ||||||||||||||||||||||||
political subdivisions | 94,552 | 2,051 | 407 | 96,196 | 83,248 | 594 | 1,474 | 82,368 | ||||||||||||||||
Mortgage-backed securities: | ||||||||||||||||||||||||
U.S. government agencies | 425,559 | 1,093 | 7,305 | 419,347 | 335,867 | 1,507 | 6,560 | 330,814 | ||||||||||||||||
Private label | 649 | 3 | — | 652 | 941 | 1 | — | 942 | ||||||||||||||||
Trust preferred | ||||||||||||||||||||||||
securities | 4,764 | 26 | 54 | 4,736 | 6,052 | 1,164 | 554 | 6,662 | ||||||||||||||||
Corporate securities | 21,916 | 475 | 123 | 22,268 | 23,925 | 127 | 478 | 23,574 | ||||||||||||||||
Total Debt Securities | 547,442 | 3,648 | 7,889 | 543,201 | 450,036 | 3,393 | 9,066 | 444,363 | ||||||||||||||||
Marketable equity securities | 2,136 | 3,563 | — | 5,699 | 2,136 | 2,095 | — | 4,231 | ||||||||||||||||
Investment funds | 1,525 | — | 36 | 1,489 | 1,525 | — | 36 | 1,489 | ||||||||||||||||
Total Securities | ||||||||||||||||||||||||
Available-for-Sale | $ | 551,103 | $ | 7,211 | $ | 7,925 | $ | 550,389 | $ | 453,697 | $ | 5,488 | $ | 9,102 | $ | 450,083 | ||||||||
December 31, 2017 | December 31, 2016 | |||||||||||||||||||||||
Amortized Cost | Gross Unrealized Gains | Gross Unrealized Losses | Estimated Fair Value | Amortized Cost | Gross Unrealized Gains | Gross Unrealized Losses | Estimated Fair Value | |||||||||||||||||
Securities held-to-maturity: | ||||||||||||||||||||||||
U.S. government agencies | $ | 60,449 | $ | 1,222 | $ | 25 | $ | 61,646 | $ | 71,169 | $ | 1,346 | $ | 70 | $ | 72,445 | ||||||||
Trust preferred securities | 4,000 | — | — | 4,000 | 4,000 | — | — | 4,000 | ||||||||||||||||
Total Securities | ||||||||||||||||||||||||
Held-to-Maturity | $ | 64,449 | $ | 1,222 | $ | 25 | $ | 65,646 | $ | 75,169 | $ | 1,346 | $ | 70 | $ | 76,445 | ||||||||
Other investment securities: | ||||||||||||||||||||||||
Non-marketable equity securities | $ | 14,147 | $ | — | $ | — | $ | 14,147 | $ | 14,352 | $ | — | $ | — | $ | 14,352 | ||||||||
Total Other Investment | ||||||||||||||||||||||||
Securities | $ | 14,147 | $ | — | $ | — | $ | 14,147 | $ | 14,352 | $ | — | $ | — | $ | 14,352 | ||||||||
Marketable equity securities consist of investments made by the Company in equity positions of various community banks. Included within this portfolio are ownership positions in the following community bank holding companies: First National Corporation (FXNC) (4%) and Eagle Financial Services, Inc. (EFSI) (1.5%). Securities with limited marketability, such as stock in the Federal Reserve Bank ("FRB") or the Federal Home Loan Bank ("FHLB"), are carried at cost and are reported as non-marketable equity securities in the table above.
At December 31, 2017 and 2016, there were no securities of any non-governmental issuer whose aggregate carrying value or estimated fair value exceeded 10% of shareholders' equity.
66
Certain investment securities owned by the Company were in an unrealized loss position (i.e., amortized cost basis exceeded the estimated fair value of the securities) as of December 31, 2017 and 2016. The following table shows the gross unrealized losses and fair value of the Company’s investments aggregated by investment category and length of time that individual securities have been in a continuous unrealized loss position (in thousands):
December 31, 2017 | ||||||||||||||||||
Less Than Twelve Months | Twelve Months or Greater | Total | ||||||||||||||||
Estimated Fair Value | Unrealized Loss | Estimated Fair Value | Unrealized Loss | Estimated Fair Value | Unrealized Loss | |||||||||||||
Securities available-for-sale: | ||||||||||||||||||
Obligations of states and political subdivisions | $ | 4,913 | $ | 28 | $ | 19,440 | $ | 379 | $ | 24,353 | $ | 407 | ||||||
Mortgage-backed securities: | ||||||||||||||||||
U.S. Government agencies | 172,807 | 1,887 | 140,226 | 5,418 | 313,033 | 7,305 | ||||||||||||
Trust preferred securities | 4,475 | 54 | — | — | 4,475 | 54 | ||||||||||||
Corporate securities | 3,357 | 49 | 2,350 | 74 | 5,707 | 123 | ||||||||||||
Investment funds | 1,500 | 36 | — | — | 1,500 | 36 | ||||||||||||
Total | $ | 187,052 | $ | 2,054 | $ | 162,016 | $ | 5,871 | $ | 349,068 | $ | 7,925 | ||||||
December 31, 2016 | ||||||||||||||||||
Less Than Twelve Months | Twelve Months or Greater | Total | ||||||||||||||||
Estimated Fair Value | Unrealized Loss | Estimated Fair Value | Unrealized Loss | Estimated Fair Value | Unrealized Loss | |||||||||||||
Securities available-for-sale: | ||||||||||||||||||
Obligations of states and political subdivisions | $ | 35,108 | $ | 1,474 | $ | — | $ | — | $ | 35,108 | $ | 1,474 | ||||||
Mortgage-backed securities: | ||||||||||||||||||
U.S. Government agencies | 225,530 | 6,099 | 8,527 | 461 | 234,057 | 6,560 | ||||||||||||
Trust preferred securities | — | — | 4,971 | 554 | 4,971 | 554 | ||||||||||||
Corporate securities | 14,306 | 478 | — | — | 14,306 | 478 | ||||||||||||
Investment funds | 1,500 | 36 | — | — | 1,500 | 36 | ||||||||||||
Total | $ | 276,444 | $ | 8,087 | $ | 13,498 | $ | 1,015 | $ | 289,942 | $ | 9,102 | ||||||
During the years ended December 31, 2017 and 2015, the Company had no credit-related net investment impairment losses. During the year ended December 31, 2016 the Company recorded $0.5 million in credit-related net investment impairment losses. The charges deemed to be other-than-temporary were related to pooled bank trust preferred securities and were based on the Company’s quarterly reviews of its investment securities for indications of losses considered to be other-than-temporary. At December 31, 2017, the cumulative amount of credit-related investment impairment losses that have been recognized by the Company on investments that remain in the Company's investment portfolio as of that date was $1.8 million ($0.2 million related to the Company's debt securities and $1.6 million related to the Company's equity securities).
Declines in the fair value of held-to-maturity and available-for-sale securities below their cost that are deemed to be other-than-temporary would be reflected in earnings as realized losses. In estimating other-than-temporary impairment losses, management considers, among other things (i) the length of time and the extent to which the fair value has been less than cost, (ii) the financial condition, capital strength, and near-term (within 12 months) prospects of the issuer, including any specific events which may influence the operations of the issuer such as changes in technology that may impair the earnings potential of the investment or the discontinuance of a segment of the business that may affect the future earnings potential; (iii) the historical volatility in the market value of the investment and/or the liquidity or illiquidity of the investment; (iv) adverse conditions specifically related to the security, an industry, or a geographic area; or (v) the intent to sell the investment security and if it’s more likely than not that the Company will not have to sell the security before recovery of its cost basis. In addition, management also employs a continuous monitoring process in regards to its marketable equity securities, specifically its portfolio of regional community bank holdings. Although the regional community bank stocks that are owned by the Company are
67
publicly traded, the trading activity for these stocks is minimal, with trading volumes of less than 0.4% of each respective company being traded on a daily basis. As part of management’s review process for these securities, management reviews the financial condition of each respective regional community bank for any indications of financial weakness.
Management has the ability and intent to hold the securities classified as held-to-maturity until they mature, at which time the Company expects to receive full value for the securities. Furthermore, as of December 31, 2017, management does not intend to sell an impaired security and it is not more than likely that it will be required to sell the security before the recovery of its amortized cost basis. The unrealized losses on debt securities are primarily the result of interest rate changes, credit spread fluctuations on agency-issued mortgage related securities, general financial market uncertainty and unprecedented market volatility. These conditions will not prohibit the Company from receiving its contractual principal and interest payments on its debt securities. The fair value is expected to recover as the securities approach their maturity date or repricing date. As of December 31, 2017, management believes the unrealized losses detailed in the table above are temporary and no additional impairment loss has been recognized in the Company’s consolidated income statement. Should the impairment of any of these securities become other-than-temporary, the cost basis of the investment will be reduced and the resulting loss will be recognized in net income in the period the other-than-temporary impairment is identified, while any noncredit loss will be recognized in other comprehensive income.
The amortized cost and estimated fair value of debt securities at December 31, 2017, by contractual maturity, are shown in the following table (in thousands). Expected maturities will differ from contractual maturities because the issuers of the securities may have the right to prepay obligations without prepayment penalties. Mortgage-backed securities have been allocated to their respective maturity groupings based on their contractual maturity.
Cost | Estimated Fair Value | |||||
Securities Available-for-Sale | ||||||
Due in one year or less | $ | 3,002 | $ | 3,005 | ||
Due after one year through five years | 15,824 | 15,854 | ||||
Due after five years through ten years | 76,555 | 75,450 | ||||
Due after ten years | 452,061 | 448,892 | ||||
$ | 547,442 | $ | 543,201 | |||
Securities Held-to-Maturity | ||||||
Due in one year or less | $ | — | $ | — | ||
Due after one year through five years | — | — | ||||
Due after five years through ten years | — | — | ||||
Due after ten years | 64,449 | 65,646 | ||||
$ | 64,449 | $ | 65,646 | |||
Gross gains and gross losses realized by the Company from investment security transactions are summarized in the table below (in thousands):
For the year ended December 31, | |||||||||
2017 | 2016 | 2015 | |||||||
Gross realized gains | $ | 4,476 | $ | 3,978 | $ | 2,142 | |||
Gross realized losses | — | (465 | ) | (12 | ) | ||||
Investment security gains (losses) | $ | 4,476 | $ | 3,513 | $ | 2,130 | |||
The carrying value of securities pledged to secure public deposits and for other purposes as required or permitted by law approximated $429 million and $337 million at December 31, 2017 and 2016, respectively.
68
NOTE FOUR –LOANS
The following summarizes the Company’s major classifications for loans (in thousands):
December 31, 2017 | December 31, 2016 | |||||
Residential real estate | $ | 1,468,278 | $ | 1,451,462 | ||
Home equity | 139,499 | 141,965 | ||||
Commercial and industrial | 208,484 | 185,667 | ||||
Commercial real estate | 1,277,576 | 1,229,516 | ||||
Consumer | 29,162 | 32,545 | ||||
DDA overdrafts | 4,411 | 5,071 | ||||
Gross loans | 3,127,410 | 3,046,226 | ||||
Allowance for loan losses | (18,836 | ) | (19,730 | ) | ||
Net loans | $ | 3,108,574 | $ | 3,026,496 | ||
Construction loans of $25.3 million and $14.2 million are included within residential real estate loans at December 31, 2017 and December 31, 2016, respectively. Construction loans of $28.9 million and $12.8 million are included within commercial real estate loans at December 31, 2017 and December 31, 2016, respectively. The Company’s commercial and residential real estate construction loans are primarily secured by real estate within the Company’s principal markets. These loans were originated under the Company’s loan policy, which is focused on the risk characteristics of the loan portfolio, including construction loans. Adequate consideration has been given to these loans in establishing the Company’s allowance for loan losses.
NOTE FIVE –ALLOWANCE FOR LOAN LOSSES
Management systematically monitors the loan portfolio and the appropriateness of the allowance for loan losses on a quarterly basis to provide for probable losses inherent in the portfolio. Management assesses the risk in each loan type based on historical trends, the general economic environment of its local markets, individual loan performance and other relevant factors.
Individual credits in excess of $1 million are selected at least annually for detailed loan reviews, which are utilized by management to assess the risk in the portfolio and the appropriateness of the allowance. Due to the nature of commercial lending, evaluation of the appropriateness of the allowance as it relates to these types of loan types is often based more upon specific credit reviews, with consideration given to the potential impairment of certain credits and historical loss rates, adjusted for economic conditions and other inherent risk factors.
The following summarizes the activity in the allowance for loan loss, by portfolio segment (in thousands). The allocation of a portion of the allowance in one portfolio segment does not preclude its availability to absorb losses in other portfolio segments. The following also presents the balance in the allowance for loan loss disaggregated on the basis of the Company’s impairment measurement method and the related recorded investment in loans, by portfolio segment (in thousands).
Commercial and industrial | Commercial real estate | Residential real estate | Home equity | Consumer | DDA overdrafts | Total | |||||||||||||||
December 31, 2017 | |||||||||||||||||||||
Allowance for loan loss | |||||||||||||||||||||
Beginning balance | $ | 4,206 | $ | 6,573 | $ | 6,680 | $ | 1,417 | $ | 82 | $ | 772 | $ | 19,730 | |||||||
Charge-offs | (400 | ) | (720 | ) | (1,637 | ) | (403 | ) | (60 | ) | (2,714 | ) | (5,934 | ) | |||||||
Recoveries | 58 | 112 | 294 | 45 | 63 | 1,462 | 2,034 | ||||||||||||||
Provision | 707 | 57 | (125 | ) | 79 | (23 | ) | 2,150 | 2,845 | ||||||||||||
Provision for acquired loans with deteriorated credit quality | — | 161 | — | — | — | — | 161 | ||||||||||||||
Ending balance | $ | 4,571 | $ | 6,183 | $ | 5,212 | $ | 1,138 | $ | 62 | $ | 1,670 | $ | 18,836 | |||||||
69
Commercial and industrial | Commercial real estate | Residential real estate | Home equity | Consumer | DDA overdrafts | Total | |||||||||||||||
December 31, 2016 | |||||||||||||||||||||
Allowance for loan loss | |||||||||||||||||||||
Beginning balance | $ | 3,271 | $ | 6,985 | $ | 6,778 | $ | 1,463 | $ | 97 | $ | 657 | $ | 19,251 | |||||||
Charge-offs | (148 | ) | (1,676 | ) | (1,734 | ) | (390 | ) | (126 | ) | (1,412 | ) | (5,486 | ) | |||||||
Recoveries | 14 | 487 | 187 | — | 118 | 764 | 1,570 | ||||||||||||||
Provision | 1,069 | 614 | 1,449 | 344 | (7 | ) | 763 | 4,232 | |||||||||||||
Provision for acquired loans with deteriorated credit quality | — | 163 | — | — | — | — | 163 | ||||||||||||||
Ending balance | $ | 4,206 | $ | 6,573 | $ | 6,680 | $ | 1,417 | $ | 82 | $ | 772 | $ | 19,730 | |||||||
As of December 31, 2017 | |||||||||||||||||||||
Allowance for loan loss | |||||||||||||||||||||
Evaluated for impairment: | |||||||||||||||||||||
Individually | $ | — | $ | 647 | $ | — | $ | — | $ | — | $ | — | $ | 647 | |||||||
Collectively | 4,567 | 5,313 | 5,112 | 1,138 | 58 | 1,670 | 17,858 | ||||||||||||||
Acquired with deteriorated credit quality | 4 | 223 | 100 | — | 4 | — | 331 | ||||||||||||||
Total | $ | 4,571 | $ | 6,183 | $ | 5,212 | $ | 1,138 | $ | 62 | $ | 1,670 | $ | 18,836 | |||||||
Loans | |||||||||||||||||||||
Evaluated for impairment: | |||||||||||||||||||||
Individually | $ | 849 | $ | 8,818 | $ | — | $ | — | $ | — | $ | — | $ | 9,667 | |||||||
Collectively | 207,429 | 1,263,076 | 1,465,685 | 139,499 | 29,046 | 4,411 | 3,109,146 | ||||||||||||||
Acquired with deteriorated credit quality | 206 | 5,682 | 2,593 | — | 116 | — | 8,597 | ||||||||||||||
Total | $ | 208,484 | $ | 1,277,576 | $ | 1,468,278 | $ | 139,499 | $ | 29,162 | $ | 4,411 | $ | 3,127,410 | |||||||
As of December 31, 2016 | |||||||||||||||||||||
Allowance for loan loss | |||||||||||||||||||||
Evaluated for impairment: | |||||||||||||||||||||
Individually | $ | — | $ | 665 | $ | — | $ | — | $ | — | $ | — | $ | 665 | |||||||
Collectively | 4,200 | 5,788 | 6,589 | 1,417 | 82 | 772 | 18,848 | ||||||||||||||
Acquired with deteriorated credit quality | 6 | 120 | 91 | — | — | — | 217 | ||||||||||||||
Total | $ | 4,206 | $ | 6,573 | $ | 6,680 | $ | 1,417 | $ | 82 | $ | 772 | $ | 19,730 | |||||||
Loans | |||||||||||||||||||||
Evaluated for impairment: | |||||||||||||||||||||
Individually | $ | 1,611 | $ | 5,970 | $ | — | $ | — | $ | — | $ | — | $ | 7,581 | |||||||
Collectively | 183,741 | 1,216,050 | 1,448,830 | 141,965 | 32,545 | 5,071 | 3,028,202 | ||||||||||||||
Acquired with deteriorated credit quality | 315 | 7,496 | 2,632 | — | — | — | 10,443 | ||||||||||||||
Total | $ | 185,667 | $ | 1,229,516 | $ | 1,451,462 | $ | 141,965 | $ | 32,545 | $ | 5,071 | $ | 3,046,226 | |||||||
70
Credit Quality Indicators
All non-commercial loans are evaluated based on payment history. All commercial loans within the portfolio are subject to internal risk grading. The Company’s internal risk ratings for commercial loans are: Exceptional, Good, Acceptable, Pass/Watch, Special Mention, Substandard and Doubtful. Each internal risk rating is defined in the loan policy using the following criteria: balance sheet yields, ratios and leverage, cash flow spread and coverage, prior history, capability of management, market position/industry, potential impact of changing economic, legal, regulatory or environmental conditions, purpose structure, collateral support, and guarantor support. Risk grades are generally assigned by the primary lending officer and are periodically evaluated by the Company’s internal loan review process. Based on an individual loan’s risk grade, estimated loss percentages are applied to the outstanding balance of the loan to determine the amount of probable loss.
The Company categorizes loans into risk categories based on relevant information regarding the customer’s debt service ability, capacity, overall collateral position along with other economic trends, and historical payment performance. The risk grades for each credit are updated when the Company receives current financial information, the loan is reviewed by the Company’s internal loan review/credit administration departments, or the loan becomes delinquent or impaired. The risk grades are updated a minimum of annually for loans rated exceptional, good, acceptable, or pass/watch. Loans rated special mention, substandard or doubtful are reviewed at least quarterly. The Company uses the following definitions for its risk ratings:
Risk Rating | Description |
Pass Ratings: | |
(a) Exceptional | Loans classified as exceptional are secured with liquid collateral conforming to the internal loan policy. Loans rated within this category pose minimal risk of loss to the bank and the risk grade within this pool of loans is generally updated on an annual basis. |
(b) Good | Loans classified as good have similar characteristics that include a strong balance sheet, satisfactory debt service coverage ratios, strong management and/or guarantors, and little exposure to economic cycles. Loans within this category are generally reviewed on an annual basis. Loans in this category generally have a low chance of loss to the bank. |
(c) Acceptable | Loans classified as acceptable have acceptable liquidity levels, adequate debt service coverage ratios, experienced management, and have average exposure to economic cycles. Loans within this category generally have a low risk of loss to the bank. |
(d) Pass/watch | Loans classified as pass/watch have erratic levels of leverage and/or liquidity, cash flow is volatile and the borrower is subject to moderate economic risk. A borrower in this category poses a low to moderate risk of loss to the bank. |
Special mention | Loans classified as special mention have a potential weakness(es) that deserves management's close attention. The potential weakness could result in deterioration of the loan repayment or the bank's credit position at some future date. A loan rated in this category poses a moderate loss risk to the bank. |
Substandard | Loans classified as substandard reflect a customer with a well defined weakness that jeopardizes the liquidation of the debt. Loans in this category have the possibility that the bank will sustain some loss if the deficiencies are not corrected and the bank's collateral value is weakened by the financial deterioration of the borrower. |
Doubtful | Loans classified as doubtful have all the weaknesses inherent in those classified as substandard, with the added characteristics that make collection of the full contract amount highly improbable. Loans rated in this category are most likely to cause the bank to have a loss due to a collateral shortfall or a negative capital position. |
71
The following table presents the Company's commercial loans by credit quality indicators, by class (in thousands):
Commercial and industrial | Commercial real estate | Total | |||||||
December 31, 2017 | |||||||||
Pass | $ | 175,951 | $ | 1,231,256 | $ | 1,407,207 | |||
Special mention | 25,872 | 8,068 | 33,940 | ||||||
Substandard | 6,661 | 38,252 | 44,913 | ||||||
Doubtful | — | — | — | ||||||
Total | $ | 208,484 | $ | 1,277,576 | $ | 1,486,060 | |||
December 31, 2016 | |||||||||
Pass | $ | 176,823 | $ | 1,178,288 | $ | 1,355,111 | |||
Special mention | 2,427 | 16,031 | 18,458 | ||||||
Substandard | 6,417 | 35,197 | 41,614 | ||||||
Doubtful | — | — | — | ||||||
Total | $ | 185,667 | $ | 1,229,516 | $ | 1,415,183 | |||
The following table presents the Company's non-commercial loans by payment performance, by class (in thousands):
Performing | Non-Performing | Total | |||||||
December 31, 2017 | |||||||||
Residential real estate | $ | 1,465,445 | $ | 2,833 | $ | 1,468,278 | |||
Home equity | 139,239 | 260 | 139,499 | ||||||
Consumer | 29,162 | — | 29,162 | ||||||
DDA overdrafts | 4,411 | — | 4,411 | ||||||
Total | $ | 1,638,257 | $ | 3,093 | $ | 1,641,350 | |||
December 31, 2016 | |||||||||
Residential real estate | $ | 1,447,087 | $ | 4,375 | $ | 1,451,462 | |||
Home equity | 141,834 | 131 | 141,965 | ||||||
Consumer | 32,545 | — | 32,545 | ||||||
DDA overdrafts | 5,071 | — | 5,071 | ||||||
Total | $ | 1,626,537 | $ | 4,506 | $ | 1,631,043 | |||
72
Aging Analysis of Accruing and Non-Accruing Loans
The following presents an aging analysis of the Company’s accruing and non-accruing loans, by class (in thousands). The purchased credit-impaired loan column represents the purchased credit-impaired loans that the Company acquired that are contractually past due, but are still performing in accordance with the Company's initial expectations.
December 31, 2017 | ||||||||||||||||||
Accruing | ||||||||||||||||||
Current | 30-59 days | 60-89 days | Over 90 days | Non-accrual | Total | |||||||||||||
Residential real estate | $ | 1,458,746 | $ | 5,990 | $ | 709 | $ | 19 | $ | 2,814 | $ | 1,468,278 | ||||||
Home equity | 138,480 | 671 | 88 | 92 | 168 | 139,499 | ||||||||||||
Commercial and industrial | 206,447 | 549 | 1 | 142 | 1,345 | 208,484 | ||||||||||||
Commercial real estate | 1,269,520 | 1,841 | 245 | — | 5,970 | 1,277,576 | ||||||||||||
Consumer | 29,108 | 39 | 13 | 2 | — | 29,162 | ||||||||||||
DDA overdrafts | 3,849 | 541 | 14 | 7 | — | 4,411 | ||||||||||||
Total | $ | 3,106,150 | $ | 9,631 | $ | 1,070 | $ | 262 | $ | 10,297 | $ | 3,127,410 | ||||||
December 31, 2016 | ||||||||||||||||||
Accruing | ||||||||||||||||||
Current | 30-59 days | 60-89 days | Over 90 days | Non-accrual | Total | |||||||||||||
Residential real estate | $ | 1,441,086 | $ | 5,364 | $ | 637 | $ | 73 | $ | 4,302 | $ | 1,451,462 | ||||||
Home equity | 141,192 | 423 | 219 | 31 | 100 | 141,965 | ||||||||||||
Commercial and industrial | 183,615 | 94 | — | — | 1,958 | 185,667 | ||||||||||||
Commercial real estate | 1,221,344 | 553 | — | 278 | 7,341 | 1,229,516 | ||||||||||||
Consumer | 32,506 | 38 | 1 | — | — | 32,545 | ||||||||||||
DDA overdrafts | 4,472 | 595 | 4 | — | — | 5,071 | ||||||||||||
Total | $ | 3,024,215 | $ | 7,067 | $ | 861 | $ | 382 | $ | 13,701 | $ | 3,046,226 | ||||||
73
The following presents the Company’s impaired loans, by class (in thousands):
December 31, 2017 | December 31, 2016 | |||||||||||||||||
Unpaid | Unpaid | |||||||||||||||||
Recorded | Principal | Related | Recorded | Principal | Related | |||||||||||||
Investment | Balance | Allowance | Investment | Balance | Allowance | |||||||||||||
With no related allowance recorded: | ||||||||||||||||||
Commercial and industrial | $ | 849 | $ | 3,013 | $ | — | $ | 1,611 | $ | 3,775 | $ | — | ||||||
Commercial real estate | 3,036 | 4,861 | — | 3,138 | 4,963 | — | ||||||||||||
Total | $ | 3,885 | $ | 7,874 | $ | — | $ | 4,749 | $ | 8,738 | $ | — | ||||||
With an allowance recorded: | ||||||||||||||||||
Commercial and industrial | $ | — | $ | — | $ | — | $ | — | $ | — | $ | — | ||||||
Commercial real estate | 5,782 | 5,782 | 647 | 2,832 | 2,832 | 665 | ||||||||||||
Total | $ | 5,782 | $ | 5,782 | $ | 647 | $ | 2,832 | $ | 2,832 | $ | 665 | ||||||
The following table presents information related to the average recorded investment and interest income recognized on the Company’s impaired loans, by class (in thousands):
For the year ended | ||||||||||||
December 31, 2017 | December 31, 2016 | |||||||||||
Average | Interest | Average | Interest | |||||||||
Recorded | Income | Recorded | Income | |||||||||
Investment | Recognized | Investment | Recognized | |||||||||
With no related allowance recorded: | ||||||||||||
Commercial and industrial | $ | 1,086 | $ | — | $ | 2,099 | $ | — | ||||
Commercial real estate | 4,534 | 69 | 4,039 | 14 | ||||||||
Total | $ | 5,620 | $ | 69 | $ | 6,138 | $ | 14 | ||||
With an allowance recorded: | ||||||||||||
Commercial and industrial | $ | — | $ | — | $ | — | $ | — | ||||
Commercial real estate | 4,307 | 149 | 1,419 | 24 | ||||||||
Total | $ | 4,307 | $ | 149 | $ | 1,419 | $ | 24 | ||||
If the Company's non-accrual and impaired loans had been current in accordance with their original terms, approximately $0.2 million, $0.4 million and $0.8 million of interest income would have been recognized during the years ended December 31, 2017, 2016 and 2015, respectively. There were no commitments to provide additional funds on non-accrual, impaired or other potential problem loans at December 31, 2017.
Loan Modifications
The Company’s policy on loan modifications typically does not allow for modifications that would be considered a concession from the Company. However, when there is a modification, the Company evaluates each modification to determine if the modification constitutes a troubled debt restructuring (“TDR”) in accordance with ASU 2011-02, whereby a modification of a loan would be considered a TDR when both of the following conditions are met: (1) a borrower is experiencing financial difficulty and (2) the modification constitutes a concession. When determining whether the borrower is experiencing financial difficulties, the Company reviews whether the debtor is currently in payment default on any of its debt or whether it is probable that the debtor would be in payment default in the foreseeable future without the modification. Other indicators of financial difficulty include whether the debtor has declared or is in the process of declaring bankruptcy, the debtor’s ability to continue as a going concern, or the debtor’s projected cash flow to service its debt (including principal and interest) in accordance with the contractual terms for the foreseeable future, without a modification.
Regulatory guidance requires loans to be accounted for as collateral-dependent loans when borrowers have filed Chapter 7 bankruptcy, the debt has been discharged by the bankruptcy court and the borrower has not reaffirmed the debt. The filing of bankruptcy is deemed to be evidence that the borrower is in financial difficulty and the discharge of the debt by the bankruptcy court is deemed to be a concession granted to the borrower.
74
The following tables set forth the Company’s TDRs (in thousands):
December 31, 2017 | December 31, 2016 | |||||||||||||||||
Non- | Non- | |||||||||||||||||
Accruing | Accruing | Total | Accruing | Accruing | Total | |||||||||||||
Commercial and industrial | $ | 135 | $ | — | $ | 135 | $ | 42 | $ | — | $ | 42 | ||||||
Commercial real estate | 8,381 | — | 8,381 | 5,525 | — | 5,525 | ||||||||||||
Residential real estate | 21,005 | 84 | 21,089 | 20,424 | 391 | 20,815 | ||||||||||||
Home equity | 3,047 | 50 | 3,097 | 3,105 | 30 | 3,135 | ||||||||||||
Consumer | — | — | — | — | — | — | ||||||||||||
$ | 32,568 | $ | 134 | $ | 32,702 | $ | 29,096 | $ | 421 | $ | 29,517 | |||||||
New TDRs | New TDRs | |||||||||||||||
For the year ended | For the year ended | |||||||||||||||
December 31, 2017 | December 31, 2016 | |||||||||||||||
Pre | Post | Pre | Post | |||||||||||||
Modification | Modification | Modification | Modification | |||||||||||||
Outstanding | Outstanding | Outstanding | Outstanding | |||||||||||||
Number of | Recorded | Recorded | Number of | Recorded | Recorded | |||||||||||
Contracts | Investment | Investment | Contracts | Investment | Investment | |||||||||||
Commercial and industrial | — | $ | — | $ | — | — | $ | — | $ | — | ||||||
Commercial real estate | 2 | 3,098 | 3,003 | 2 | 5,021 | 4,366 | ||||||||||
Residential real estate | 33 | 3,987 | 3,987 | 37 | 3,812 | 3,812 | ||||||||||
Home equity | 13 | 271 | 271 | 9 | 221 | 221 | ||||||||||
Consumer | — | — | — | — | — | — | ||||||||||
48 | $ | 7,356 | $ | 7,261 | 48 | $ | 9,054 | $ | 8,399 | |||||||
75
NOTE SIX – PREMISES AND EQUIPMENT
A summary of premises and equipment and related accumulated depreciation is summarized as follows (in thousands):
Estimated Useful Life | 2017 | 2016 | |||||
Land | $ | 32,647 | $ | 31,546 | |||
Buildings and improvements | 10 to 30 yrs. | 90,261 | 88,698 | ||||
Equipment | 3 to 7 yrs. | 39,763 | 40,157 | ||||
162,671 | 160,401 | ||||||
Less: accumulated depreciation | (89,989 | ) | (85,236 | ) | |||
$ | 72,682 | $ | 75,165 | ||||
The depreciation expense for the years ended December 31, 2017, 2016, and 2015 was $5.9 million, $6.2 million, and $6.1 million, respectively.
NOTE SEVEN – GOODWILL AND OTHER INTANGIBLE ASSETS
The Company completed its annual assessment of the carrying value of goodwill during 2017 and concluded that its carrying value was not impaired. The following table presents a roll forward of the Company's goodwill activity (in thousands):
2017 | 2016 | |||||
Beginning balance | $ | 76,196 | $ | 76,256 | ||
Adjustments to goodwill acquired in conjunction with the acquisition of AFB | — | (60 | ) | |||
Ending balance | $ | 76,196 | $ | 76,196 | ||
The Company believes that the customer relationships with the deposits acquired have an intangible value. In connection with acquisitions, the Company recorded a core deposit intangible, which represented the value that the acquiree had with their deposit customers. The fair value was estimated based on a discounted cash flow methodology that considered the type of deposit, estimated deposit retention, the cost of the deposit base and an alternate cost of funds. The following tables present the details of the Company's core deposit intangibles (in thousands):
2017 | 2016 | |||||
Gross carrying amount | $ | 9,802 | $ | 9,802 | ||
Accumulated amortization | (7,403 | ) | (6,863 | ) | ||
$ | 2,399 | $ | 2,939 | |||
Beginning balance | $ | 2,939 | $ | 3,536 | ||
Amortization expense | (540 | ) | (597 | ) | ||
Ending balance | $ | 2,399 | $ | 2,939 | ||
76
The core deposit intangible amortization expense for the year ended December 31, 2015 was $0.7 million. The core deposit intangibles are being amortized over ten years. The estimated amortization expense for core deposit intangible assets for each of the next five years is as follows (in thousands):
2018 | $ | 506 | |
2019 | 454 | ||
2020 | 416 | ||
2021 | 382 | ||
2022 | 296 | ||
Thereafter | 345 | ||
$ | 2,399 | ||
NOTE EIGHT – SCHEDULED MATURITIES OF TIME DEPOSITS
Scheduled maturities of the Company's time deposits outstanding at December 31, 2017 are summarized as follows (in thousands):
2018 | $ | 565,554 | |
2019 | 278,970 | ||
2020 | 179,724 | ||
2021 | 26,474 | ||
2022 | 32,484 | ||
Over five years | 269 | ||
$ | 1,083,475 | ||
The Company's time deposits that meet or exceed the FDIC insurance limit of $250,000 were $122.4 million and $104.8 million at December 31, 2017 and 2016, respectively.
77
NOTE NINE – SHORT-TERM DEBT
A summary of the Company's short-term borrowings are as follows (dollars in thousands):
2017 | 2016 | 2015 | |||||||
Balance at end of year: | |||||||||
Federal Home Loan Bank advances | $ | 54,000 | $ | 64,100 | $ | 13,000 | |||
Securities sold under agreements to repurchase | 198,219 | 184,205 | 141,869 | ||||||
Avg. outstanding during the year: | |||||||||
Federal Home Loan Bank advances | $ | 46,639 | $ | 18,850 | $ | 1,159 | |||
Securities sold under agreements to repurchase | 183,890 | 157,215 | 143,847 | ||||||
Federal Funds purchased | — | — | 193 | ||||||
Max. outstanding at any month end: | |||||||||
Federal Home Loan Bank advances | $ | 126,500 | $ | 88,600 | $ | 13,000 | |||
Securities sold under agreements to repurchase | 257,034 | 184,205 | 166,507 | ||||||
Weighted-average interest rate: | |||||||||
During the year: | |||||||||
Federal Home Loan Bank advances | 1.30 | % | 0.66 | % | 0.53 | % | |||
Securities sold under agreements to repurchase | 0.33 | 0.22 | 0.22 | ||||||
Federal Funds purchased | — | — | 0.64 | ||||||
End of the year: | |||||||||
Federal Home Loan Bank advances | 1.57 | % | 0.77 | % | 0.51 | % | |||
Securities sold under agreements to repurchase | 0.31 | 0.19 | 0.20 | ||||||
Through City National, the Company has purchased 59,087 shares of Federal Home Loan Bank (“FHLB”) stock at par value as of December 31, 2017. Such purchases are required based on City National’s maximum borrowing capacity with the FHLB. Additionally, FHLB stock entitles the Company to dividends declared by the FHLB and provides an additional source of short-term and long-term funding, in the form of collateralized advances. Financing obtained from the FHLB is based, in part, on the amount of qualifying collateral available, specifically 1-4 family residential mortgages, other residential mortgages, and commercial real estate and other non-residential mortgage loans. Collateral pledged to the FHLB included approximately $2.0 billion at December 31, 2017 and $1.9 billion at December 31, 2016 in investment securities and one-to-four-family residential property loans. In addition to the short-term financing discussed above and long-term financing (see Note Ten) City National had an additional $1.6 billion available from unused portions of lines of credit with the FHLB and other financial institutions at both December 31, 2017 and 2016.
NOTE TEN – LONG-TERM DEBT
The components of the Company's long-term debt are summarized below (dollars in thousands):
2017 | 2016 | |||||
Junior subordinated debentures owed to City Holding Capital Trust III, due 2038, interest at a rate of 5.09% and 4.35%, respectively | $ | 16,495 | $ | 16,495 | ||
The Company formed a statutory business trust, City Holding Capital Trust III (“Capital Trust III”), under the laws of Delaware. Capital Trust III was created for the exclusive purpose of (i) issuing trust-preferred capital securities (“Capital Securities”), which represent preferred undivided beneficial interests in the assets of the trust, (ii) using the proceeds from the sale of the Capital Securities to acquire junior subordinated debentures (“Debentures”) issued by the Company, and (iii) engaging
78
in only those activities necessary or incidental thereto. The trust is considered a variable interest entity for which the Company is not the primary beneficiary. Accordingly, the accounts of the trusts are not included in the Company’s consolidated financial statements.
Distributions on the Debentures are cumulative and will be payable quarterly at an interest rate of 3.50% over the three month LIBOR rate, reset quarterly. Interest payments are due in March, June, September and December. The debentures mature in June 2038, or earlier at the option of the Parent Company. The Debentures are redeemable prior to maturity at the option of the Company (i) in whole or at any time or in part from time-to-time, or (ii) in whole, but not in part, at any time within 90 days following the occurrence and during the continuation of certain pre-defined events.
Payments of distributions on the Capital Securities and payments on redemption of the Capital Securities are guaranteed by the Company. The Company also entered into an agreement as to expenses and liabilities with the trust pursuant to which it agreed, on a subordinated basis, to pay any cost, expenses or liabilities of the trust other than those arising under the trust preferred securities. The obligations of the Company under the junior subordinated debentures, the related indentures, the trust agreement establishing the trust and the guarantees and the agreements as to expenses and liabilities, in the aggregate, constitute a full and unconditional guarantee by the Company of the trust’s obligations under the trust preferred securities. The Capital Securities issued by the statutory business trusts qualify as Tier 1 capital for the Company under current Federal Reserve Board guidelines.
NOTE ELEVEN – DERIVATIVE INSTRUMENTS
As of December 31, 2017 and 2016, the Company has derivative financial instruments not included in hedge relationships. These derivatives consist of interest rate swaps used for interest rate management purposes and derivatives executed with commercial banking customers to facilitate their interest rate management strategies. For the majority of these instruments the Company acts as an intermediary for its customers. Changes in the fair value of the underlying derivative contracts for the most part offset each other and do not significantly impact the Company's results of operations.
The Company also has an interest rate swap that serves as a fair value hedge for changes in long term fixed interest rates related to commercial real estate loans. Hedge ineffectiveness is assessed quarterly and any ineffectiveness is recorded as non-interest expense. For the years ended December 31, 2017, 2016 and 2015, the hedge ineffectiveness was less than $0.1 million.
The following table summarizes the notional and fair value of these derivative instruments (in thousands):
December 31, 2017 | December 31, 2016 | ||||||||||||||
Notional Amount | Fair Value | Notional Amount | Fair Value | ||||||||||||
Non-hedging interest rate derivatives: | |||||||||||||||
Customer counterparties: | |||||||||||||||
Loan interest rate swap - assets | $ | 225,480 | $ | 4,877 | $ | 234,806 | $ | 7,352 | |||||||
Loan interest rate swap - liabilities | 314,450 | 9,513 | 207,201 | 8,111 | |||||||||||
Non-hedging interest rate derivatives: | |||||||||||||||
Financial institution counterparties: | |||||||||||||||
Loan interest rate swap - assets | 320,949 | 9,591 | 207,201 | 8,111 | |||||||||||
Loan interest rate swap - liabilities | 218,924 | 4,877 | 241,995 | 7,360 | |||||||||||
Derivatives designated as hedges of fair value: | |||||||||||||||
Financial institution counterparties: | |||||||||||||||
Loan interest rate swap - assets | 4,326 | 34 | — | — | |||||||||||
Loan interest rate swap - liabilities | — | — | 4,626 | 12 | |||||||||||
79
The following table summarizes the change in fair value of these derivative instruments (in thousands):
Year Ended December 31, | |||||||||
2017 | 2016 | 2015 | |||||||
Change in Fair Value Non-Hedging Interest Rate Derivatives: | |||||||||
Other income - derivative assets | $ | (3,379 | ) | $ | 3,904 | $ | 1,030 | ||
Other income - derivative liabilities | 3,379 | (3,904 | ) | (1,030 | ) | ||||
Other expense - derivative liabilities | 86 | (52 | ) | (61 | ) | ||||
Change in Fair Value Hedging Interest Rate Derivatives: | |||||||||
Hedged item - derivative asset | $ | 38 | (36 | ) | 25 | ||||
Other income (expense) - derivative liability with financial institution counterparties | — | 13 | (12 | ) | |||||
Other income (expense) - derivative asset with financial institution counterparties | 8 | — | — | ||||||
Certain financial instruments, including derivatives, may be eligible for offset in the consolidated balance sheet and/or subject to master netting arrangements. The Company's derivative transactions with financial institution counterparties are generally executed under International Swaps and Derivative Association ("ISDA") master agreements which include "right of setoff" provisions. In such cases there is generally a legally enforceable right to offset recognized amounts and there may be an intention to settle such amounts on a net basis. Nonetheless, the Company does not generally offset financial instruments for financial reporting purposes. Information about financial instruments that are eligible for offset in the consolidated balance sheet as of December 31, 2017 is presented in the following tables (in thousands):
80
Gross Amounts | |||||||||||||||||||||
Not Offset in the Statement | |||||||||||||||||||||
of Financial Position | |||||||||||||||||||||
Total | |||||||||||||||||||||
of Gross | |||||||||||||||||||||
Amounts | |||||||||||||||||||||
Not Offset in | |||||||||||||||||||||
the Statement | |||||||||||||||||||||
of Financial | |||||||||||||||||||||
Position | |||||||||||||||||||||
Netting | Including | ||||||||||||||||||||
Gross | Net Amounts | Adjustment | Applicable | ||||||||||||||||||
Amounts | of Assets | per | Netting | ||||||||||||||||||
Gross | Offset in the | presented in | Applicable | Agreement | |||||||||||||||||
Amounts of | Statement of | the Statement | Master | Fair Value | and Fair | ||||||||||||||||
Recognized | Financial | of Financial | Netting | of Financial | Value of | ||||||||||||||||
Description | Assets | Position | Position | Arrangements | Collateral | Collateral | Net Amount | ||||||||||||||
(a) | (b) | (c)=(a)-(b) | (d) | (c)-(d)* | |||||||||||||||||
Non-hedging derivative assets: | |||||||||||||||||||||
Interest rate swap agreements - customer counterparties | $ | 4,877 | $ | — | $ | 4,877 | $ | — | $ | 4,877 | $ | 4,877 | $ | — | |||||||
Interest rate swap agreements - financial institution counterparties | 9,591 | — | 9,591 | — | — | — | 9,591 | ||||||||||||||
Hedging derivative assets: | |||||||||||||||||||||
Interest rate swap agreements - financial institution counterparties | $ | 34 | $ | — | $ | 34 | $ | — | $ | 56 | $ | 56 | $ | — | |||||||
Non-hedging derivative liabilities: | |||||||||||||||||||||
Interest rate swap agreements - customer counterparties | $ | 9,513 | $ | — | $ | 9,513 | $ | — | $ | 9,513 | $ | 9,513 | $ | — | |||||||
Interest rate swap agreements -financial institution counterparties | $ | 4,877 | $ | — | $ | 4,877 | $ | — | $ | 15,661 | $ | 15,661 | $ | — | |||||||
* For instances where the fair value of financial collateral meets or exceeds the amounts presented in the Statement of Financial Position, a value of zero is displayed to represent full collateralization. | |||||||||||||||||||||
81
NOTE TWELVE – INCOME TAXES
Deferred income taxes reflect the net tax effects of temporary differences between the carrying amounts of assets and liabilities for financial reporting purposes and the amounts used for income tax purposes. Significant components of the Company’s deferred tax assets and liabilities are as follows (in thousands):
2017 | 2016 | |||||
Previously securitized loans | $ | 441 | $ | 3,950 | ||
Allowance for loan losses | 4,385 | 7,303 | ||||
Deferred compensation payable | 2,517 | 4,099 | ||||
Underfunded pension liability | 1,527 | 2,739 | ||||
Accrued expenses | 1,057 | 1,721 | ||||
Impaired asset losses | 607 | 4,625 | ||||
Unrealized securities losses | 166 | 1,338 | ||||
Intangible assets | 438 | 1,312 | ||||
Other | 3,136 | 4,716 | ||||
Total Deferred Tax Assets | 14,274 | 31,803 | ||||
Other | 2,361 | 3,760 | ||||
Total Deferred Tax Liabilities | 2,361 | 3,760 | ||||
Net Deferred Tax Assets | $ | 11,913 | $ | 28,043 | ||
No valuation allowance for deferred tax assets was recorded at December 31, 2017 and 2016 as the Company believes it is more likely than not that all of the deferred tax assets will be realized because they were supported by recoverable taxes paid in prior years.
On December 22, 2017, the President signed the Tax Cut and Jobs Act ("TCJA") into law. Among other things, the TCJA reduced the corporate income tax rate from 35% to 21%, effective January 1, 2018. As a result of this decrease in the corporate income tax, the Company reassessed its deferred tax assets and liabilities, which resulted in a charge to earnings of $7.1 million. This provisional amount is included in total deferred tax expense in the table below. Significant components of the provision for income taxes are as follows (in thousands):
2017 | 2016 | 2015 | |||||||
Current: | |||||||||
Federal | $ | 20,090 | $ | 20,100 | $ | 20,830 | |||
State | 1,436 | 1,166 | 957 | ||||||
Total current tax expense | 21,526 | 21,266 | 21,787 | ||||||
Total deferred tax expense | 14,909 | 3,817 | 6,627 | ||||||
Income tax expense | $ | 36,435 | $ | 25,083 | $ | 28,414 | |||
82
A reconciliation of the significant differences between the federal statutory income tax rate and the Company’s effective income tax rate is as follows (in thousands):
2017 | 2016 | 2015 | |||||||
Computed federal taxes at statutory rate | $ | 31,761 | $ | 27,025 | $ | 28,879 | |||
State income taxes, net of federal tax benefit | 1,321 | 888 | 887 | ||||||
Tax effects of: | |||||||||
Tax-exempt interest income | (1,098 | ) | (708 | ) | (498 | ) | |||
Bank-owned life insurance | (1,474 | ) | (1,164 | ) | (1,181 | ) | |||
Change in tax rate | 7,070 | — | — | ||||||
Other items, net | (1,145 | ) | (958 | ) | 327 | ||||
Income tax expense | $ | 36,435 | $ | 25,083 | $ | 28,414 | |||
The entire amount of the Company’s unrecognized tax benefits, if recognized, would favorably affect the Company’s effective tax rate. The Company anticipates that it will release $0.5 million over the next 12 months. A reconciliation of the beginning and ending balance of unrecognized tax benefits is as follows (in thousands):
2017 | 2016 | |||||
Beginning balance | $ | 1,847 | $ | 2,164 | ||
Additions for current year tax positions | 325 | 339 | ||||
Additions for prior year tax positions | 226 | 196 | ||||
Decreases related to lapse of applicable statute of limitation | (509 | ) | (852 | ) | ||
Ending balance | $ | 1,889 | $ | 1,847 | ||
Interest and penalties on income tax uncertainties are included in income tax expense. During 2017, 2016 and 2015, the provision related to interest and penalties was $0.1 million in each period. The balance of accrued interest and penalties at December 31, 2017 and 2016 was $0.3 million.
The Company is currently open to audit under the statute of limitations by the Internal Revenue Service and state taxing authorities for the years ended December 31, 2014 through 2016.
NOTE THIRTEEN – EMPLOYEE BENEFIT PLANS
Pursuant to the terms of the City Holding Company 2003 Incentive Plan and the City Holding Company 2013 Incentive Plan (the "2003 Plan" and "2013 Plan", respectively), the Compensation Committee of the Board of Directors, or its delegate, may, from time-to-time, grant stock options, stock appreciation rights (“SARs”), or stock awards to employees, directors and individuals who provide service to the Company (collectively, "Plan Participants"). The 2003 Plan expired in April of 2013 and the 2013 Plan was approved by the shareholders in April 2013. A maximum of 750,000 shares of the Company’s common stock may be issued under the 2013 Plan upon the exercise of stock options, SARs and stock awards, subject to certain limitations. These limitations may be adjusted in the event of a change in the number of outstanding shares of common stock by reason of a stock dividend, stock split or other similar event. Specific terms of options and SARs awarded, including vesting periods, exercise prices (stock price at date of grant) and expiration dates are determined at the date of grant and are evidenced by agreements between the Company and the awardee. The exercise price of the option grants equals the market price of the Company’s stock on the date of grant. All incentive stock options and SARs will be exercisable up to 10 years from the date granted and all options and SARs are exercisable for the period specified in the individual agreement. As of December 31, 2017, 559,815 shares were still available to be issued under the 2013 Plan.
Each award from the 2003 Plan and 2013 Plan is evidenced by an award agreement that specifies the option price, the duration of the option, the number of shares to which the option pertains, and such other provisions as the Compensation Committee, or its delegate, determines. The option price for each grant is equal to the fair market value of a share of the Company’s common stock on the date of the grant. Options granted expire at such time as the Compensation Committee, or its delegate, determines at the date of the grant and in no event does the exercise period exceed a maximum of ten years. Upon a change-in-control of the Company, as defined in the 2003 Plan and 2013 Plan, all outstanding options and awards shall immediately vest.
83
Certain stock options and restricted stock awards have performance-based vesting requirements. These shares will vest in three separate annual installments of approximately 33.33% per installment on the third, fourth and fifth anniversaries of the grant date, subject further to performance-based vesting requirements. The performance-based vesting requirements are as follows:
* | First Installment – the mean return on average assets of the Company (excluding merger and acquisition expenses and other nonrecurring items as determined by the Board of Directors of the Company) of the three years immediately prior to the vesting date is equal to or exceeds the median return on average assets over the 20 year period immediately preceding the vesting date of all FDIC insured depository institutions. |
* | Second Installment – the mean return on average assets of the Company (excluding merger and acquisition expenses and other nonrecurring items as determined by the Board of Directors of the Company) of the four years immediately prior to the vesting date is equal to or exceeds the median return on average assets over the 20 year period immediately preceding the vesting date of all FDIC insured depository institutions. |
* | Third Installment – the mean return on average assets of the Company (excluding merger and acquisition expenses and other nonrecurring items as determined by the Board of Directors of the Company) of the five years immediately prior to the vesting date is equal to or exceeds the median return on average assets over the 20 year period immediately preceding the vesting date of all FDIC insured depository institutions. |
Stock Options
A summary of the Company’s stock option activity and related information is presented below:
2017 | 2016 | 2015 | |||||||||||||
Options | Weighted-Average Exercise Price | Options | Weighted-Average Exercise Price | Options | Weighted-Average Exercise Price | ||||||||||
Outstanding at January 1 | 86,613 | $ | 41.08 | 95,015 | $ | 38.38 | 167,554 | $ | 36.74 | ||||||
Granted | 17,631 | 66.32 | 24,348 | 43.73 | 12,961 | 46.41 | |||||||||
Exercised | (16,639 | ) | 35.91 | (32,750 | ) | 35.28 | (81,500 | ) | 36.63 | ||||||
Forfeited | — | — | — | — | (4,000 | ) | 31.66 | ||||||||
Outstanding at December 31 | 87,605 | $ | 47.15 | 86,613 | $ | 41.08 | 95,015 | $ | 38.38 | ||||||
Exercisable at end of year | 7,887 | $ | 37.37 | 3,000 | $ | 29.45 | 19,750 | $ | 34.54 | ||||||
Nonvested at beginning of year | 83,613 | 41.47 | 75,265 | 39.38 | 77,804 | 36.76 | |||||||||
Granted during the year | 17,631 | 66.32 | 24,348 | 43.73 | 12,961 | 46.41 | |||||||||
Vested during the year | (21,526 | ) | 37.31 | (16,000 | ) | 35.09 | (15,500 | ) | 32.09 | ||||||
Forfeited during the year | — | — | — | — | — | — | |||||||||
Nonvested at end of year | 79,718 | $ | 48.08 | 83,613 | $ | 41.47 | 75,265 | $ | 39.38 | ||||||
84
Information regarding stock option exercises and stock-based compensation expense associated with stock options is provided in the following table (in millions):
For the year ended December 31, | |||||||||
2017 | 2016 | 2015 | |||||||
Proceeds from stock option exercises | $ | 0.6 | $ | 1.2 | $ | 3.0 | |||
Intrinsic value of stock options exercised | 0.5 | 0.6 | 0.9 | ||||||
Stock-based compensation expense associated with stock options | $ | 0.2 | $ | 0.2 | $ | 0.2 | |||
Income tax benefit recognized related to stock-based compensation | 0.1 | 0.1 | 0.1 | ||||||
At period-end: | 2017 | ||||||||
Unrecognized stock-based compensation expense | $ | 0.4 | |||||||
Weighted average period in which the above amount is expected to be recognized | 2.6 | years | |||||||
Shares issued in connection with stock option exercises are issued from available treasury shares. If no treasury shares are available, new shares would be issued from available authorized shares. During 2017, 2016 and 2015, all shares issued in connection with stock option exercises and restricted stock awards were issued from available treasury stock. For the stock options that have performance-based criteria, management has evaluated those criteria and has determined that, as of December 31, 2017, the criteria were probable of being met.
Additional information regarding the Company's stock options outstanding and exercisable at December 31, 2017, is provided in the following table:
Ranges of Exercise Prices | No. of Options Outstanding | Weighted-Average Exercise Price | Weighted-Average Remaining Contractual Life (Months) | Aggregate Intrinsic Value (in thousands) | No. of Options Currently Exercisable | Weighted-Average Exercise Price of Options Currently Exercisable | Weighted-Average Remaining Contractual Life (Months) | Aggregate Intrinsic Value of Options Currently Exercisable (in thousands) | |||||||||||
$ 30.00 - 34.99 | 500 | $ | 30.38 | 0.9 | $ | 19 | 500 | $ | 30.38 | 0.9 | $ | 19 | |||||||
35.00 - 39.99 | 20,854 | 37.13 | 4.9 | 633 | 5,379 | 35.39 | 4.2 | 173 | |||||||||||
40.00 - 44.99 | 35,659 | 43.95 | 7.6 | 839 | 2,008 | 44.43 | 6.2 | 46 | |||||||||||
45.00 - 49.99 | 12,961 | 46.61 | 7.2 | 270 | — | — | — | — | |||||||||||
50.00 - 69.99 | 17,631 | 66.32 | 9.2 | $ | 20 | — | — | — | — | ||||||||||
87,605 | $ | 1,781 | 7,887 | $ | 238 | ||||||||||||||
The fair value of the options is estimated at the date of grant using a Black-Scholes option-pricing model. The following weighted average assumptions were used to estimate the fair value of options granted by the Company:
Year ended December 31, | ||||||
2017 | 2016 | 2015 | ||||
Risk-free interest rate | 2.12 | % | 1.43 | % | 1.95 | % |
Expected dividend yield | 2.60 | % | 3.86 | % | 3.50 | % |
Volatility factor | 25.80 | % | 30.76 | % | 45.40 | % |
Expected life of option | 7.0 years | 7.0 years | 7.0 years | |||
Restricted Shares
The Company measures compensation expense with respect to restricted shares in an amount equal to the fair value of the common stock covered by each award on the date of grant. The restricted shares awarded become fully vested after various
85
periods of continued employment from the respective dates of grant. The Company is entitled to an income tax deduction in an amount equal to the taxable income reported by the holders of the restricted shares when the restrictions are released and the shares are issued. Compensation is charged to expense over the respective vesting periods.
Restricted shares are generally forfeited if officers and employees terminate prior to the lapsing of restrictions. The Company records forfeitures of restricted stock as treasury share repurchases and any compensation cost previously recognized is reversed in the period of forfeiture. Recipients of restricted shares do not pay any cash consideration to the Company for the shares, have the right to vote all shares subject to such grant and receive all dividends with respect to such shares, whether or not the shares have vested. For the restricted shares that have performance-based criteria, management has evaluated those criteria and has determined that, as of December 31, 2017, the criteria were probable of being met.
A summary of the Company’s restricted shares activity and related information is presented below:
2017 | 2016 | 2015 | |||||||||||||
Restricted Awards | Average Market Price at Grant | Restricted Awards | Average Market Price at Grant | Restricted Awards | Average Market Price at Grant | ||||||||||
Outstanding at January 1 | 180,622 | 172,921 | 163,431 | ||||||||||||
Granted | 28,839 | $ | 64.42 | 30,601 | $ | 46.39 | 26,840 | $ | 46.45 | ||||||
Forfeited/Vested | (39,428 | ) | (22,900 | ) | (17,350 | ) | |||||||||
Outstanding at December 31 | 170,033 | 180,622 | 172,921 | ||||||||||||
Information regarding stock-based compensation associated with restricted shares is provided in the following table (in millions):
For the year ended December 31, | |||||||||
2017 | 2016 | 2015 | |||||||
Stock-based compensation expense associated with restricted shares | $ | 1.5 | $ | 1.4 | $ | 1.2 | |||
At period-end: | 2017 | ||||||||
Unrecognized stock-based compensation expense | $ | 3.2 | |||||||
Weighted average period in which the above amount is expected to be recognized | 3.2 | years | |||||||
401(k) Plan
The Company provides retirement benefits to its employees through the City Holding Company 401(k) Plan and Trust (“the 401(k) Plan”), which is intended to be compliant with Employee Retirement Income Security Act (ERISA) section 404(c). The Company’s total expense associated with the retirement benefit plan approximated $0.8 million in 2017, $0.8 million in 2016, and $0.7 million in 2015. The total number of shares of the Company’s common stock held by the 401(k) Plan as of December 31, 2017 and 2016 was 228,662 and 238,647, respectively.
Defined Benefit Plans
The Company maintains two defined benefit pension plans (“the Defined Benefit Plans”), which were inherited from the Company's acquisition of the plan sponsors (Horizon Bancorp, Inc. and Community Financial Corporation). The Horizon Defined Benefit Plan was frozen in 1999 and maintains a December 31st year-end for purposes of computing its benefit obligations. The Community Defined Benefit Plan was frozen in 2012 and maintains a December 31st year-end for purposes of computing its benefit obligations.
86
Primarily as a result of the interest rate environment over the past several years and a revised mortality table issued in 2014, the benefit obligation exceeded the estimated fair value of plan assets as of December 31, 2017 and December 31, 2016. The following table summarizes activity within the Company's Defined Benefit Plans (dollars in thousands):
Pension Benefits | ||||||
2017 | 2016 | |||||
Change in fair value of plan assets: | ||||||
Fair value at beginning of measurement period | $ | 17,117 | $ | 17,435 | ||
Actual gain (loss) on plan assets | 1,890 | 669 | ||||
Contributions | — | — | ||||
Benefits paid | (2,647 | ) | (987 | ) | ||
Fair value at end of measurement period | 16,360 | 17,117 | ||||
Change in benefit obligation: | ||||||
Benefit obligation at beginning of measurement period | (19,742 | ) | (19,700 | ) | ||
Interest cost | (772 | ) | (820 | ) | ||
Actuarial (loss) gain | (392 | ) | (263 | ) | ||
Assumption changes | (614 | ) | 54 | |||
Benefits paid | 2,647 | 987 | ||||
Settlement loss | 385 | — | ||||
Benefit obligation at end of measurement period | (18,488 | ) | (19,742 | ) | ||
Funded status | $ | (2,128 | ) | $ | (2,625 | ) |
Weighted-average assumptions for benefit obligation: | ||||||
Discount rate | 3.38 | % | 4.01 | % | ||
Expected long-term rate of return | 6.56 | % | 5.83 | % | ||
Weighted-average assumptions for net periodic pension cost: | ||||||
Discount rate | 4.02 | % | 4.26 | % | ||
Expected long-term rate of return | 5.83 | % | 5.75 | % | ||
Based on the funding status of the Horizon Defined Benefit Plan, no contributions were required during the years ended December 31, 2017 and 2016, and no contributions are anticipated being required for the year ending December 31, 2018. Based on the funding status of the Community Defined Benefit plan, no contributions were required during the year ended December 31, 2017. During 2017, the Company initiated the process to terminate the Community Defined Benefit plan. The Company anticipates making a $1.7 million contribution in late 2018 or early 2019 (which has been accrued at December 31, 2017), when the termination process is expected to be completed.
87
The following table presents the components of the net periodic pension cost of the Company's Defined Benefit Plans (in thousands):
2017 | 2016 | 2015 | |||||||
Components of net periodic benefit: | |||||||||
Interest cost | $ | 772 | $ | 820 | $ | 813 | |||
Expected return on plan assets | (1,219 | ) | (1,154 | ) | (937 | ) | |||
Settlement | (104 | ) | — | — | |||||
Net amortization and deferral | 849 | 849 | 960 | ||||||
Net Periodic Pension Cost | $ | 298 | $ | 515 | $ | 836 | |||
Amounts related to the Company's Defined Benefit Pension Plans recognized as a component of other comprehensive income were as follows (in thousands):
2017 | 2016 | 2015 | |||||||
Net actuarial gain (loss) | $ | 838 | $ | 157 | $ | 935 | |||
Deferred tax (expense) benefit | (1,211 | ) | (58 | ) | (345 | ) | |||
Other comprehensive income (loss), net of tax | $ | (373 | ) | $ | 99 | $ | 590 | ||
Amounts recognized as a component of accumulated other comprehensive loss as of December 31, 2017 and 2016 were as follows (in thousands):
2017 | 2016 | |||||
Net actuarial loss | $ | 6,560 | $ | 7,399 | ||
Deferred tax benefit | (1,527 | ) | (2,739 | ) | ||
Amounts included in accumulated other comprehensive loss, net of tax | $ | 5,033 | $ | 4,660 | ||
The following table summarizes the expected benefits to be paid in each of the next five years and in the aggregate for the five years thereafter (in thousands):
Plan Year Ending December 31, | Expected Benefits to be Paid | ||
2018 | $ | 1,057 | |
2019 | 4,658 | ||
2020 | 931 | ||
2021 | 936 | ||
2022 | 938 | ||
2023 through 2026 | 4,721 | ||
88
The major categories of assets in the Company’s Defined Benefit Plans as of year-end are presented in the following table (in thousands). Assets are segregated by the level of the valuation inputs within the fair value hierarchy established by ASC Topic 820 utilized to measure fair value (See Note Eighteen).
Total | Level 1 | Level 2 | Level 3 | |||||||||
2017 | ||||||||||||
Cash and cash equivalents | $ | 1,202 | $ | 1,202 | $ | — | $ | — | ||||
Mutual funds/Investment funds | 5,421 | 5,206 | 215 | — | ||||||||
Common stocks | 5,575 | 3,763 | 1,812 | — | ||||||||
Mortgage-backed securities | 301 | — | 301 | — | ||||||||
U.S. Treasuries | 1,277 | — | 1,277 | — | ||||||||
Corporate bonds | 1,223 | — | 1,223 | — | ||||||||
Alternative investments** | 1,361 | 759 | — | — | ||||||||
Total | $ | 16,360 | $ | 10,930 | $ | 4,828 | $ | — | ||||
2016 | ||||||||||||
Cash and cash equivalents | $ | 2,101 | $ | 2,101 | $ | — | $ | — | ||||
Mutual funds/Investment funds | 6,063 | 5,797 | 266 | — | ||||||||
Common stocks | 4,284 | 3,103 | 1,181 | — | ||||||||
Mortgage-backed securities | 514 | — | 514 | — | ||||||||
U.S. Treasuries | 971 | — | 971 | — | ||||||||
Corporate bonds | 1,597 | — | 1,597 | — | ||||||||
Alternative investments** | 1,587 | 972 | — | — | ||||||||
Total | $ | 17,117 | $ | 11,973 | $ | 4,529 | $ | — | ||||
** Includes an investment of $602 and $615 at December 31, 2017 and 2016, respectively, that has not been categorized in the fair value hierarchy, as permitted by ASU No. 2015-07. | ||||||||||||
Horizon Defined Benefit Plan (Investment Strategy)
The Horizon Defined Benefit Plan is administered by the West Virginia Bankers Association (“WVBA”) and all investment policies and strategies are established by the WVBA Pension Committee. The policy established by the Pension Committee is to invest assets per target allocations, as detailed in the table below. The assets are reallocated periodically to meet these target allocations. The investment policy is reviewed periodically, under the advisement of a certified investment advisor, to determine if the policy should be revised.
The overall investment return goal is to achieve a return greater than a blended mix of the S&P 500 and the Barclay's Capital Aggregate Bond Index, which is tailored to the same asset mix of the retirement plan assets, by 0.5% annualized after fees over a rolling five years moving average basis. Allowable assets include cash equivalents, fixed income securities, equity securities, alternative investments, mutual funds, exchange-traded funds, managed separate accounts, investment partnerships and commingled funds. Prohibited investments include, but are not limited to, private placements, limited partnerships, venture capital investments, direct investment in private real estate properties and residual remics. Unless explicitly authorized by the Pension Committee, the use of leverage or speculative use of derivatives is prohibited unless as part of an alternative asset program or as means for real asset managers to hedge investment risk or replicate investment positions at a lower cost than would otherwise be created in a cash market. Managers using derivatives must have systems in place to rigorously analyze and monitor duration, liquidity and counter-party credit risk in order to minimize the risk associated with the use of derivatives. Prohibited transactions include, but are not limited to, short selling and margin transactions.
In order to achieve a prudent level of portfolio diversification, the securities of any one company are not to exceed more than 15% of the cost and/or market value of the total retirement plan assets, and no more than 25% of the total retirement plan assets are to be invested in any one industry (other than securities of the U.S. government or agencies thereof). Exchange traded index funds are allowable investments and are not subject to these restrictions.
89
The expected long-term rate of return for the plan’s assets is based on the expected return of each of the categories, weighted based on the median of the target allocation for each class, noted in the table below. The target, allowable, and current allocation percentages of plan assets are as follows:
Target Allocation 2017 | Allowable- Allocation Range | Percentage of Plan Assets At December 31 | |||||
2017 | 2016 | ||||||
Equity securities | 60.0 | % | 35-88% | 55 | % | 48 | % |
Fixed income securities | 20.0 | % | 10-40% | 23 | % | 25 | % |
Cash and cash equivalents | 5.0 | % | 2-20% | 9 | % | 15 | % |
Alternative investments | 15.0 | % | 0-25% | 13 | % | 12 | % |
Total | 100.0 | % | 100 | % | 100 | % | |
Community Defined Benefit Plan (Investment Strategy)
The Community Defined Benefit Plan is administered by the Virginia Bankers Association ("VBA") and all investment polices are established by the Board of Directors of the VBA Benefits Corporation. The investment goal is to provide asset allocation models with varying degrees of investment return and risk consistent with each bank's funding objectives and participant demographics. The Board of Directors shall at least annually review the overall investment program, and each investment alternative, to ensure the current investment mix will achieve the goals of the Plan and participating banks.
The performance goal for the investments of the Plan is to exceed the investment benchmarks over the most recent three and five year periods, while taking less risk than the market. Approved asset classes include equity securities, fixed income securities and cash equivalents.
The Plan's investment portfolio contains a mix of large-cap, mid-cap, small-cap and international equities and intermediate and short-term bonds. Allocations to the equity and fixed income asset classes may vary within a range of + or - 5% of the noted target. The expected long-term rate of return for the plan’s assets is based on the expected return of each of the categories, weighted based on the median of the target allocation for each class, noted in the table below. During 2016, the Plan's investment portfolio allocation was changed from 25% equity securities/75% fixed income securities to 40% equity securities/60% fixed income securities. The target, allowable, and current allocation percentages of plan assets are as follows:
Target Allocation 2017 | Allowable- Allocation Range | Percentage of Plan Assets At December 31 | |||||
2017 | 2016 | ||||||
Equity securities | 40 | % | 29%-51% | 39 | % | 41 | % |
Fixed income securities | 60 | % | 49%-71% | 61 | % | 59 | % |
100 | % | 100 | % | 100 | % | ||
Pentegra Defined Benefit Plan
In addition, the Company and its subsidiary participate in the Pentegra Defined Benefit Plan for Financial Institutions ("The Pentegra DB Plan"), a tax-qualified defined benefit pension plan. The Pentegra DB Plan's Employer Identification Number is 13-5645888 and the Plan Number is 333. The Pentegra DB Plan operates as a multi-employer plan for accounting purposes and as a multiple-employer plan under the Employee Retirement Income Security Act of 1974 and the Internal Revenue Code. There are no collective bargaining agreements in place that require contributions to the Pentegra DB Plan. The Pentegra DB Plan is a single plan under Internal Revenue Code Section 413(c) and, as a result, all of the assets stand behind all of the liabilities. Accordingly, under the Pentegra DB Plan, contributions made by a participating employer may be used to provide benefits to participants of other participating employers. The funded status as of July 1, 2017 (the latest available valuation report) was 98.87%. It is the policy of the Company to fund the normal cost of the Pentegra DB Plan on an annual basis. Other than for normal plan expenses, no contributions were required for the years ended December 31, 2017, 2016 and 2015. The benefits of the Pentegra DB Plan were frozen prior to the acquisition of Classic Bancshares in 2005, and it is the intention of the Company to fund benefit amounts when assets of the plan are sufficient.
90
Employment Contracts
The Company has entered into employment contracts with certain of its current executive officers. The employment contracts provide for, among other things, the payment of termination compensation in the event an executive officer either voluntarily or involuntarily terminates his employment with the Company for other than “Just Cause.” The cost of these benefits was previously accrued for each executive and is included in Other Liabilities within the Consolidated Balance Sheets. The liability was $2.0 million at both December 31, 2017 and 2016 and is fully vested, and therefore no charge to operations was incurred for the years ended December 31, 2017 and December 31, 2016.
Other Post-Retirement Benefit Plans
Certain entities previously acquired by the Company had entered into individual deferred compensation and supplemental retirement agreements with certain current and former directors and officers. The Company has assumed the liabilities associated with these agreements, the cost of which is being accrued over the period of active service from the date of the respective agreement. The cost of such agreements approximated $0.3 million during 2017, $0.3 million during 2016, and $0.2 million during 2015, respectively. The liability for such agreements approximated $5.7 million and $6.2 million at December 31, 2017 and December 31, 2016, respectively and is included within Other Liabilities in the accompanying Consolidated Balance Sheets.
To assist in funding the above liabilities, the acquired entities had insured the lives of certain current and former directors and officers. The Company is the current owner and beneficiary of insurance policies with a cash surrender value approximating $7.0 million and $8.2 million at December 31, 2017 and 2016, respectively, which is included in Other Assets in the accompanying Consolidated Balance Sheets.
NOTE FOURTEEN – RELATED PARTY TRANSACTIONS
City National has granted loans to certain non-executive officers and directors of the Company and its subsidiaries, and to their associates totaling $12.4 million at December 31, 2017 and $13.5 million at December 31, 2016. The loans were made in the ordinary course of business and on substantially the same terms, including interest rates and collateral, as those prevailing at the same time for comparable transactions with third-party lending arrangements. These relationships had unfunded commitments of $17.8 million and $23.0 million at December 31, 2017 and December 31, 2016. During 2017, total principal additions were less than $0.1 million and total principal reductions were $1.2 million.
NOTE FIFTEEN – COMMITMENTS AND CONTINGENCIES
The Company is a party to certain financial instruments with off-balance sheet risk in the normal course of business to meet the financing needs of its customers. The Company has entered into agreements with its customers to extend credit or provide conditional commitment to provide payment on drafts presented in accordance with the terms of the underlying credit documents. The Company also provides overdraft protection to certain demand deposit customers that represent an unfunded commitment. Overdraft protection commitments, which are included with other commitments below, are uncollateralized and are paid at the Company’s discretion. Conditional commitments generally include standby and commercial letters of credit. Standby letters of credit represent an obligation of the Company to a designated third party contingent upon the failure of a customer of the Company to perform under the terms of the underlying contract between the customer and the third party. Commercial letters of credit are issued specifically to facilitate trade or commerce. Under the terms of a commercial letter of credit, drafts will be drawn when the underlying transaction is consummated, as intended, between the customer and a third party. The funded portion of these financial instruments is reflected in the Company’s balance sheet, while the unfunded portion of these commitments is not reflected in the balance sheet.
91
The table below presents a summary of the contractual obligations of the Company resulting from significant commitments (in thousands):
December 31, 2017 | December 31, 2016 | |||||
Commitments to extend credit: | ||||||
Home equity lines | $ | 194,477 | $ | 185,553 | ||
Commercial real estate | 66,901 | 98,883 | ||||
Other commitments | 184,895 | 203,103 | ||||
Standby letters of credit | 7,151 | 5,014 | ||||
Commercial letters of credit | 831 | 1,859 | ||||
Loan commitments and standby and commercial letters of credit have credit risks essentially the same as those involved in extending loans to customers and are subject to the Company’s standard credit policies. Collateral is obtained based on management’s credit assessment of the customer. Management does not anticipate any material losses as a result of these commitments.
In addition, the Company is engaged in various legal actions that it deems to be in the ordinary course of business. As these legal actions are resolved, the Company could realize positive and/or negative impact to its financial performance in the period in which these legal actions are ultimately decided. There can be no assurance that current actions will have immaterial results, either positive or negative, or that no material actions may be presented in the future.
NOTE SIXTEEN – PREFERRED STOCK
The Company’s Board of Directors has the authority to issue preferred stock, and to determine the designation, preferences, rights, dividends and all other attributes of such preferred stock, without any vote or action by the shareholders. As of December 31, 2017, no such shares were outstanding, nor were any expected to be issued.
NOTE SEVENTEEN – REGULATORY REQUIREMENTS AND CAPITAL RATIOS
The principal source of income and cash for City Holding (the “Parent Company”) is dividends from City National. Dividends paid by City National to the Parent Company are subject to certain legal and regulatory limitations. Generally, any dividends in amounts that exceed the earnings retained by City National in the current year plus retained net profits for the preceding two years must be approved by regulatory authorities. Approval is also required if dividends declared would cause City National’s regulatory capital to fall below specified minimum levels. At December 31, 2017, City National could pay dividends up to $75.0 million without prior regulatory permission.
During 2017, the Parent Company used cash obtained from the dividends received primarily to: (1) pay common dividends to shareholders and (2) remit interest payments on the Company’s junior subordinated debentures. As of December 31, 2017, the Parent Company reported a cash balance of approximately $59.0 million. Management believes that the Parent Company’s available cash balance, together with cash dividends from City National, is adequate to satisfy its funding and cash needs in 2018.
In July 2013, the Federal Reserve published the final rules that established a new comprehensive capital framework for banking organizations, commonly referred to as Basel III. These final rules substantially revised the risk-based capital requirements applicable to bank holding companies and depository institutions. The final rule became effective January 1, 2015 for smaller, non-complex banking organizations with full implementation by January 1, 2019.
Regulatory guidelines require the Company to maintain a minimum common equity tier I ("CET 1") capital ratio of 5.75% and a total capital to risk-adjusted assets ratio of 9.25%, with at least one-half of capital consisting of tangible common stockholders’ equity, and a minimum Tier I leverage ratio of 7.25%. Similarly, City National is also required to maintain minimum capital levels as set forth by various regulatory agencies. Under capital adequacy guidelines, City National is required to maintain minimum CET 1, total capital, Tier I capital, and leverage ratios of 5.75%, 9.25%, 7.25%, and 4.0%, respectively. To be classified as “well capitalized,” City National must maintain CET 1, total capital, Tier I capital, and leverage ratios of 6.5%, 10.0%, 8.0%, and 5.0%, respectively.
When fully phased in on January 1, 2019, the Basel III Capital Rules will require City Holding and City National to maintain (i) a minimum ratio of CET 1 to risk-weighted assets of at least 4.5%, plus a 2.5% "capital conservation buffer" (which
92
is added to the 4.5% CET 1 ratio as that buffer is phased in, effectively resulting in a minimum ratio of CET 1 to risk-weighted assets of at least 7.0% upon full implementation), (ii) a minimum ratio of Tier 1 capital to risk-weighted assets of at least 6.0%, plus the capital conservation buffer (which is added to the 6.0% Tier 1 capital ratio as that buffer is phased in, effectively resulting in a minimum Tier 1 capital ratio of 8.5% upon full implementation), (iii) a minimum ratio of total capital (that is, Tier 1 plus Tier 2) to risk-weighted assets of at least 8.0%, plus the capital conservation buffer (which is added to the 8.0% total capital ratio as that buffer is phased in, effectively resulting in a minimum total capital ratio of 10.5% upon full implementation) and (iv) a minimum leverage ratio of 4.0%, calculated as the ratio of Tier 1 capital to average assets (as compared to the previous minimum leverage ratio of 3.0% for banking organizations that either have the highest supervisory rating or have implemented the appropriate federal regulatory authority's risk-adjusted measure for market risk).
The implementation of the capital conservation buffer began on January 1, 2016 at the 0.625% level and will be phased in over a four-year period (increasing by that amount on each subsequent January 1, until it reaches 2.5% on January 1, 2019). The Basel III Capital Rules also provide for a “countercyclical capital buffer” that is applicable to only certain covered institutions and does not have any current applicability to City Holding Company or City National Bank.
The aforementioned capital conservation buffer is designed to absorb losses during periods of economic stress. Banking institutions with a ratio of CET 1 capital to risk-weighted assets above the minimum but below the conservation buffer (or below the combined capital conservation buffer and countercyclical capital buffer, when the latter is applied) will face constraints on dividends, equity repurchases and compensation based on the amount of the shortfall.
The Company’s regulatory capital ratios for both City Holding and City National are illustrated in the following tables (in thousands):
December 31, 2017 | Actual | Minimum Required - Basel III Phase-In Schedule | Minimum Required - Basel III Fully Phased-In (*) | Required to be Considered Well Capitalized | |||||||||||||||||||||||
Capital Amount | Ratio | Capital Amount | Ratio | Capital Amount | Ratio | Capital Amount | Ratio | ||||||||||||||||||||
CET 1 Capital | |||||||||||||||||||||||||||
City Holding Company | $ | 430,154 | 15.1 | % | $ | 163,441 | 5.75 | % | $ | 198,972 | 7.0 | % | $ | 184,760 | 6.5 | % | |||||||||||
City National Bank | 338,105 | 12.0 | % | 162,164 | 5.75 | % | 197,418 | 7.0 | % | 183,316 | 6.5 | % | |||||||||||||||
Tier 1 Capital | |||||||||||||||||||||||||||
City Holding Company | 446,154 | 15.7 | % | 206,078 | 7.25 | % | 241,609 | 8.5 | % | 227,397 | 8.0 | % | |||||||||||||||
City National Bank | 338,105 | 12.0 | % | 204,468 | 7.25 | % | 239,721 | 8.5 | % | 225,620 | 8.0 | % | |||||||||||||||
Total Capital | |||||||||||||||||||||||||||
City Holding Company | 465,292 | 16.4 | % | 262,927 | 9.25 | % | 298,458 | 10.5 | % | 284,246 | 10.0 | % | |||||||||||||||
City National Bank | 357,243 | 12.7 | % | 260,873 | 9.25 | % | 296,126 | 10.5 | % | 282,025 | 10.0 | % | |||||||||||||||
Tier 1 Leverage Ratio | |||||||||||||||||||||||||||
City Holding Company | 446,154 | 11.0 | % | 161,834 | 4.00 | % | 161,834 | 4.0 | % | 202,293 | 5.0 | % | |||||||||||||||
City National Bank | 338,105 | 8.5 | % | 159,625 | 4.00 | % | 159,625 | 4.0 | % | 199,531 | 5.0 | % | |||||||||||||||
(*) Represents the minimum required capital levels as of January 1, 2019 when Basel III Capital Rules have been fully phased in. | |||||||||||||||||||||||||||
93
December 31, 2016: | Actual | Minimum Required - Basel III Phase-In Schedule | Minimum Required - Basel III Fully Phased-In (*) | Required to be Considered Well Capitalized | |||||||||||||||||||||||
Capital Amount | Ratio | Capital Amount | Ratio | Capital Amount | Ratio | Capital Amount | Ratio | ||||||||||||||||||||
CET 1 Capital | |||||||||||||||||||||||||||
City Holding Company | $ | 371,677 | 13.3 | % | $ | 142,845 | 5.125 | % | $ | 195,105 | 7.0 | % | $ | 181,169 | 6.5 | % | |||||||||||
City National Bank | 310,912 | 11.2 | % | 141,860 | 5.125 | % | 193,761 | 7.0 | % | 179,921 | 6.5 | % | |||||||||||||||
Tier 1 Capital | |||||||||||||||||||||||||||
City Holding Company | 387,677 | 13.9 | % | 184,653 | 6.625 | % | 236,913 | 8.5 | % | 222,977 | 8.0 | % | |||||||||||||||
City National Bank | 318,872 | 11.5 | % | 183,381 | 6.625 | % | 235,281 | 8.5 | % | 221,441 | 8.0 | % | |||||||||||||||
Total Capital | |||||||||||||||||||||||||||
City Holding Company | 408,406 | 14.7 | % | 240,397 | 8.625 | % | 292,658 | 10.5 | % | 278,722 | 10.0 | % | |||||||||||||||
City National Bank | 338,675 | 12.2 | % | 238,741 | 8.625 | % | 290,641 | 10.5 | % | 276,801 | 10.0 | % | |||||||||||||||
Tier 1 Leverage Ratio | |||||||||||||||||||||||||||
City Holding Company | 387,677 | 10.1 | % | 153,864 | 4.000 | % | 153,864 | 4.0 | % | 192,330 | 5.0 | % | |||||||||||||||
City National Bank | 318,872 | 8.3 | % | 153,088 | 4.000 | % | 153,088 | 4.0 | % | 191,359 | 5.0 | % | |||||||||||||||
(*) Represents the minimum required capital levels as of January 1, 2019 when Basel III Capital Rules have been fully phased in. | |||||||||||||||||||||||||||
As of December 31, 2017, management believes that City Holding Company, and its banking subsidiary, City National, were “well capitalized.” City Holding is subject to regulatory capital requirements administered by the Federal Reserve, while City National is subject to regulatory capital requirements administered by the Office of the Comptroller of the Currency (“OCC”) and the Federal Deposit Insurance Corporation (“FDIC”). Regulatory agencies can initiate certain mandatory actions if either City Holding or City National fails to meet the minimum capital requirements, as shown above. As of December 31, 2017, management believes that City Holding and City National meet all capital adequacy requirements.
NOTE EIGHTEEN –FAIR VALUE MEASUREMENTS
Fair value of an asset or liability is the price that would be received to sell that asset or paid to transfer that liability (an exit price) in the principal or most advantageous market for the asset or liability in an orderly transaction between market participants on the measurement date. ASC Topic 820 establishes a fair value hierarchy for valuation inputs that gives the highest priority to quoted prices in active markets for identical assets or liabilities and the lowest priority to unobservable inputs. The fair value hierarchy is as follows:
Level 1: Quoted prices (unadjusted) for identical assets or liabilities in active markets that the entity has the ability to access as of the measurement date.
Level 2: Significant other observable inputs other than Level 1 prices, such as quoted prices for similar assets or liabilities, quoted prices in markets that are less active, and other inputs that are observable or can be corroborated by observable market data.
Level 3: Significant unobservable inputs that reflect a company’s own assumptions about the assumptions that market participants would use in pricing an asset or liability.
The Company bases fair value of assets and liabilities on quoted market prices, prices for similar assets or liabilities, quoted prices in markets that are not active, and other inputs that are observable or can be corroborated by observable market data. If such information is not available, fair value is based upon internally developed models that primarily use, as inputs, observable market-based parameters. Valuation adjustments may be made to ensure that financial instruments are recorded at fair value. These adjustments may include amounts to reflect counterparty credit quality and the Company’s creditworthiness, among other things, as well as unobservable parameters. Any such valuation adjustments are applied consistently over time. The Company’s valuation methodologies may produce a fair value calculation that may not be indicative of net realizable value or reflective of future fair values. While management believes the Company’s valuation methodologies are appropriate and consistent with other market participants, the use of different methodologies or assumptions to determine fair value of certain financial instruments could result in a different estimate of fair value at the reporting date. Furthermore, the reported fair value amounts have not been comprehensively revalued since the presentation dates, and therefore, estimates of fair value after the
94
balance sheet date may differ significantly from the amount presented herein. A more detailed description of the valuation methodologies used for assets and liabilities measured at fair value, as well as the general classification of such instruments pursuant to the valuation hierarchy, is set forth below.
Financial Assets and Liabilities
The Company used the following methods and significant assumptions to estimate fair value for financial assets and liabilities measured on a recurring basis.
Securities Available for Sale. Securities available for sale are reported at fair value utilizing Level 1, Level 2, and Level 3 inputs. The fair value of securities available for sale is determined by utilizing a market approach by obtaining quoted prices on nationally recognized securities exchanges (other than forced or distressed transactions) that occur in sufficient volume or matrix pricing, which is a mathematical technique used widely in the industry to value debt securities without relying exclusively on quoted prices for the specific securities but rather by relying on the securities’ relationship to other benchmark quoted securities. If such measurements are unavailable, the security is classified as Level 3. Significant judgment is required to make this determination.
The Company utilizes a third party pricing service provider to value its Level 1 and Level 2 investment securities. Annually, the Company obtains an independent auditor’s report from its third party pricing service provider regarding its controls over investment securities. Although no control deficiencies were noted, the report did contain caveats and disclaimers regarding the pricing information, such as the Company should review fair values for reasonableness. On a quarterly basis, the Company selects a sample of its debt securities and reprices those securities with a third party that is independent of the primary pricing service provider to verify the reasonableness of the fair values. In addition, the Company selects a sample of securities and reviews the underlying support from the primary pricing service provider.
The Company has determined that its pooled trust preferred securities are priced using Level 3 inputs in accordance with ASC Topic 820 and guidance issued by the SEC. The Company has determined that there are few observable transactions and market quotations available for pooled trust preferred securities and they are not reliable for purposes of determining fair value of trust preferred securities held at December 31, 2017. Due to these circumstances, the Company has elected to utilize an income valuation approach produced by a third party pricing source. This third party model utilizes deferral and default probabilities for the underlying issuers, estimated prepayment rates and assumes no future recoveries of any defaults or deferrals. The Company then compares the values provided by the third party model with other external sources. At such time as there are observable transactions or quoted prices that are associated with an orderly and active market for pooled trust preferred securities, the Company will incorporate such market values in its estimate of fair values for these securities.
Derivatives. Derivatives are reported at fair value utilizing Level 2 inputs. The Company utilizes a market approach by obtaining dealer quotations to value its customer interest rate swaps. These quotes utilize the overnight indexed swap ("OIS") curve as a basis for discounting cash flows. The OIS curve is based on the Federal Funds rate. The Company’s derivatives are included within its Other Assets and Other Liabilities in the accompanying consolidated balance sheets. Derivative assets are typically secured through securities with financial counterparties or cross collateralization with a borrowing customer. Derivative liabilities are typically secured through the Company pledging securities to financial counterparties or, in the case of a borrowing customer, by the right of setoff. The Company considers such factors such as the likelihood of default by itself and its counterparties, right of setoff, and remaining maturities in determining the appropriate fair value adjustments. All derivative counterparties approved by the Company's Asset and Liability Committee ("ALCO") are regularly reviewed, and appropriate business action is taken to adjust the exposure to certain counterparties, if necessary. Counterparty exposure is evaluated by netting positions that are subject to master netting agreements, as well as considering the amount of marketable collateral securing the position. This approach used to estimate impacted exposures to counterparties is also used by the Company to estimate its own credit risk in derivative liability positions. To date, no material losses have been incurred due to a counterparty's inability to pay any undercollateralized position. There was no significant change in the value of derivative assets and liabilities attributed to credit risk during the year ended December 31, 2017.
The Company may be required, from time to time, to measure certain financial assets and financial liabilities at fair value on a nonrecurring basis. Financial assets measured at fair value on a nonrecurring basis include impaired loans reported at the fair value of the underlying collateral if repayment is expected solely from the collateral. Collateral values are estimated using Level 2 inputs based on observable market data for real estate collateral or Level 3 inputs for non-real estate collateral. The following table presents the Company's assets and liabilities measured at fair value (in thousands):
95
Total | Level 1 | Level 2 | Level 3 | Total Gains (Losses) | |||||||||||
December 31, 2017 | |||||||||||||||
Recurring fair value measurements | |||||||||||||||
Financial Assets | |||||||||||||||
U.S. Government agencies | $ | 2 | $ | — | $ | 2 | $ | — | |||||||
Obligations of states and political subdivisions | 96,196 | — | 96,196 | — | |||||||||||
Mortgage-backed securities: | |||||||||||||||
U.S. Government agencies | 419,347 | — | 419,347 | — | |||||||||||
Private label | 652 | — | 652 | — | |||||||||||
Trust preferred securities | 4,736 | — | 4,475 | 261 | |||||||||||
Corporate securities | 22,268 | — | 22,268 | — | |||||||||||
Marketable equity securities | 5,699 | 5,699 | — | — | |||||||||||
Investment funds | 1,489 | 1,489 | — | — | |||||||||||
Derivative assets | 14,502 | — | 14,502 | — | |||||||||||
Financial Liabilities | |||||||||||||||
Derivative liabilities | 14,390 | — | 14,390 | — | |||||||||||
Nonrecurring fair value measurements | |||||||||||||||
Financial Assets | |||||||||||||||
Impaired loans | $ | 9,020 | $ | — | $ | — | $ | 9,020 | $ | (647 | ) | ||||
Non-Financial Assets | |||||||||||||||
Other real estate owned | 3,585 | — | — | 3,585 | (374 | ) | |||||||||
Other assets | — | — | — | — | (170 | ) | |||||||||
96
Total | Level 1 | Level 2 | Level 3 | Total Gains (Losses) | |||||||||||
December 31, 2016 | |||||||||||||||
Recurring fair value measurements | |||||||||||||||
Financial Assets | |||||||||||||||
U.S. Government agencies | $ | 3 | $ | — | $ | 3 | $ | — | |||||||
Obligations of states and political subdivisions | 82,368 | — | 82,368 | — | |||||||||||
Mortgage-backed securities: | |||||||||||||||
U.S. Government agencies | 330,814 | — | 330,814 | — | |||||||||||
Private label | 942 | — | 942 | — | |||||||||||
Trust preferred securities | 6,662 | — | 4,127 | 2,535 | |||||||||||
Corporate securities | 23,574 | — | 23,574 | — | |||||||||||
Marketable equity securities | 4,231 | 4,231 | — | — | |||||||||||
Investment funds | 1,489 | 1,489 | — | — | |||||||||||
Derivative assets | 15,463 | — | 15,463 | — | |||||||||||
Financial Liabilities | |||||||||||||||
Derivative liabilities | 15,483 | — | 15,483 | — | |||||||||||
Nonrecurring fair value measurements | |||||||||||||||
Financial Assets | |||||||||||||||
Impaired loans | $ | 6,916 | $ | — | $ | — | $ | 6,916 | $ | (665 | ) | ||||
Non-Financial Assets | |||||||||||||||
Other real estate owned | 4,588 | — | — | 4,588 | (665 | ) | |||||||||
Other assets | 625 | — | — | 625 | (444 | ) | |||||||||
The table below presents a reconcilement of the Company’s financial assets and liabilities measured at fair value on a recurring basis using significant unobservable inputs (Level 3), which consist solely of trust preferred securities (in thousands):
2017 | 2016 | |||||
Beginning balance | $ | 2,535 | $ | 2,096 | ||
Impairment losses on investment securities | — | (465 | ) | |||
Gains on sale of investment securities | — | 3,978 | ||||
Included in other comprehensive income | (974 | ) | (3,074 | ) | ||
Dispositions | (1,300 | ) | — | |||
Transfers into Level 3 | — | — | ||||
Ending Balance | $ | 261 | $ | 2,535 | ||
The Company utilizes a third party model to compute the present value of expected cash flows which considers the
structure and term of pooled trust preferred securities and the financial condition of the underlying issuers. Specifically, the third party model details interest rates, principal balances of note classes and underlying issuers, the timing and amount of interest and principal payments of the underlying issuers, and the allocation of the payments to the note classes. The current estimate of expected cash flows is based on the most recent trustee reports and any other relevant market information including announcements of interest payment deferrals or defaults of underlying trust preferred securities. For issuing banks that have defaulted, management generally assumes no recovery. For issuing banks that have deferred interest payments, management excludes the collateral balance
97
associated with these banks and assumes no recoveries of such collateral balance in the future. The exclusion of such issuing banks in a current deferral position is based on such bank experiencing a certain level of financial difficulty that raises doubt about its ability to satisfy its contractual debt obligation, and accordingly, the Company excludes the associated collateral balance from its estimate of expected cash flows. Other assumptions used in the estimate of expected cash flows include expected future default rates and prepayments.
The table below presents a reconcilement of the Company's financial assets and liabilities measured at fair value on a nonrecurring basis using significant unobservable inputs (Level 3), which solely relates to impaired loans that were remeasured and reported at fair value through a specific valuation allowance allocation of the allowance for loan losses based upon the fair value of the underlying collateral (in thousands). The fair value of impaired loans is estimated using one of several methods, including collateral value, liquidation value and discounted cash flows. The significant unobservable inputs used in the fair value measurement of collateral for collateral-dependent impaired loans primarily relate to discounts applied to the customers’ reported amount of collateral. The amount of collateral discount depends upon the marketability of the underlying collateral. During December 31, 2017 and 2016, collateral discounts ranged from 20% to 30%. During December 31, 2017 and 2016, the Company had no Level 2 financial assets and liabilities that were measured on a nonrecurring basis.
2017 | 2016 | |||||
Beginning balance | $ | 6,916 | $ | 8,482 | ||
Loans classified as impaired during the period | 3,098 | 2,832 | ||||
Specific valuation allowance allocations | (94 | ) | (665 | ) | ||
3,004 | 2,167 | |||||
(Additional) reduction in specific valuation allowance allocations | (19 | ) | — | |||
Paydowns, payoffs, other activity | (881 | ) | (3,733 | ) | ||
Ending balance | $ | 9,020 | $ | 6,916 | ||
Non-Financial Assets and Liabilities
The Company has no non-financial assets or liabilities measured at fair value on a recurring basis. Certain non-financial assets measured at fair value on a non-recurring basis include other real estate owned (“OREO”), which is measured at the lower of cost or fair value, and goodwill and other intangible assets, which are measured at fair value and evaluated at least annually for impairment. The table below presents OREO that was remeasured and reported at fair value based on significant unobservable inputs (Level 3) (in thousands):
2017 | 2016 | |||||
Beginning Balance | $ | 4,588 | $ | 6,518 | ||
OREO remeasured at initial recognition: | ||||||
Carrying value of foreclosed assets prior to remeasurement | 3,066 | 3,151 | ||||
Charge-offs recognized in the allowance for loan losses | (1,117 | ) | — | |||
Fair value | 1,949 | 3,151 | ||||
OREO remeasured subsequent to initial recognition: | ||||||
Carrying value of foreclosed assets prior to remeasurement | 1,464 | 1,228 | ||||
Fair value | 1,090 | 563 | ||||
Write-downs included in other non-interest expense | (374 | ) | (665 | ) | ||
Disposals | (2,578 | ) | (4,416 | ) | ||
Ending Balance | $ | 3,585 | $ | 4,588 | ||
During the year ended December 31, 2017, the Company recognized a $0.1 million gain on the sale of a facility that formerly housed certain bank operations. During December 31, 2016 the Company recognized a $0.4 million impairment on
98
this facility. During the year ended December 31, 2015, the Company recognized a $1.4 million loss relating to a partnership investment. Based on the Company's annual assessment for impairment in the recorded value of goodwill and indefinite lived intangible assets, no impairment was recorded during the years ended December 31, 2017 and 2016.
ASC Topic 825 “Financial Instruments,” as amended, requires disclosure of fair value information about financial instruments, whether or not recognized in the balance sheet, for which it is practicable to estimate that value. In cases where quoted market prices are not available, fair values are based on estimates using present value or other valuation techniques. Those techniques are significantly affected by the assumptions used, including discount rate and estimate of future cash flows. In that regard, the derived fair value estimates cannot be substantiated by comparison to independent markets and, in many cases, could not be realized in immediate settlement of the instrument. ASC Topic 825 excludes certain financial instruments and all nonfinancial instruments from its disclosure requirements. Accordingly, the aggregate fair value amounts presented do not represent the underlying value of the Company. The following methods and assumptions were used in estimating fair value for financial instruments:
Cash and cash equivalents: Due to their short-term nature, the carrying amounts reported in the Consolidated Balance Sheets approximate fair value.
Securities: The fair value of securities are generally based on quoted market prices or matrix pricing, which is a mathematical technique used widely in the industry to value debt securities without relying exclusively on quoted prices for the specific securities but rather by relying on the securities’ relationship to other benchmark quoted securities.
Other securities: It is not practicable to determine the fair value of the Company's other securities, which consist of FRB and FHLB stock, due to restrictions placed on its transferability.
Net loans: The fair value of the loan portfolio is estimated by discounting the expected future cash flows using the current interest rates at which similar loans would be made to borrowers for the same remaining maturities. Loans were first segregated by type such as commercial, real estate and consumer, and were then further segmented into fixed, adjustable and variable rate categories. Expected future cash flows were projected based on contractual cash flows, adjusted for estimated prepayments.
Accrued interest receivable: The carrying amount of accrued interest receivable approximates fair value.
Deposits: The fair values of demand deposits (e.g., interest and noninterest-bearing checking, regular savings, and other money market demand accounts) are, by definition, equal to their carrying values. The fair values of time deposits were estimated using discounted cash flow analyses. The discount rates used were based on rates currently offered for deposits with similar remaining maturities. The fair values of the time deposit liabilities do not take into consideration the value of the Company’s long-term relationships with depositors, which may have significant value.
Short-term debt: Securities sold under agreements to repurchase and Federal Home Loan Bank advances represent borrowings with original maturities of less than 90 days. The carrying amount of borrowings under purchase agreements approximate their fair value.
Long-term debt: The fair value of long-term borrowings is estimated using discounted cash flow analyses based on the Company’s current incremental borrowing rates for similar types of borrowing arrangements and market conditions of similar debt instruments.
Commitments and letters of credit: The fair values of commitments are estimated based on fees currently charged to enter into similar agreements, taking into consideration the remaining terms of the agreements and the counterparties’ credit standing. The fair value of letters of credit is based on fees currently charged for similar agreements or on the estimated cost to terminate them or otherwise settle the obligations with the counterparties at the reporting date. The amounts of fees currently charged on commitments and letters of credit are deemed insignificant, and therefore, the estimated fair values and carrying values have not been reflected in the following table.
The following table represents the estimates of fair value of financial instruments (in thousands). This table excludes financial instruments for which the carrying amount approximates fair value. For short-term financial assets such as cash and cash equivalents, the carrying amount is a reasonable estimate of fair value due to the relatively short time between the origination of the instrument and its expected realization. For financial liabilities such as noninterest-bearing demand, interest-bearing demand and savings deposits, the carrying amount is a reasonable estimate of fair value due to these products having no stated maturity.
99
Carrying Amount | Fair Value | Level 1 | Level 2 | Level 3 | |||||||||||
December 31, 2017 | |||||||||||||||
Assets: | |||||||||||||||
Cash and cash equivalents | $ | 82,508 | $ | 82,508 | $ | 82,508 | $ | — | $ | — | |||||
Securities available-for-sale | 550,389 | 550,389 | 7,188 | 542,940 | 261 | ||||||||||
Securities held-to-maturity | 64,449 | 65,646 | — | 65,646 | — | ||||||||||
Other securities | 14,147 | 14,147 | — | 14,147 | — | ||||||||||
Net loans | 3,108,574 | 3,014,425 | — | — | 3,090,471 | ||||||||||
Accrued interest receivable | 9,223 | 9,223 | 9,223 | — | — | ||||||||||
Derivative assets | 14,502 | 14,502 | — | 14,502 | — | ||||||||||
Liabilities: | |||||||||||||||
Deposits | 3,315,634 | 3,309,910 | 2,232,159 | 1,077,751 | — | ||||||||||
Short-term debt | 252,219 | 252,219 | — | 252,219 | — | ||||||||||
Long-term debt | 16,495 | 16,444 | — | 16,444 | — | ||||||||||
Derivative liabilities | 14,390 | 14,390 | — | 14,390 | — | ||||||||||
December 31, 2016 | |||||||||||||||
Assets: | |||||||||||||||
Cash and cash equivalents | $ | 88,139 | $ | 88,139 | $ | 88,139 | $ | — | $ | — | |||||
Securities available-for-sale | 450,083 | 450,083 | 5,720 | 441,828 | 2,535 | ||||||||||
Securities held-to-maturity | 75,169 | 76,445 | — | 76,445 | — | ||||||||||
Other securities | 14,352 | 14,352 | — | 14,352 | — | ||||||||||
Net loans | 3,026,496 | 3,014,425 | — | — | 3,014,425 | ||||||||||
Accrued interest receivable | 8,408 | 8,408 | 8,408 | — | — | ||||||||||
Derivative assets | 15,463 | 15,463 | — | 15,463 | — | ||||||||||
Liabilities: | |||||||||||||||
Deposits | 3,231,653 | 3,232,970 | 2,190,234 | 1,042,736 | — | ||||||||||
Short-term debt | 248,305 | 248,305 | — | 248,305 | — | ||||||||||
Long-term debt | 16,495 | 16,455 | — | 16,455 | — | ||||||||||
Derivative liabilities | 15,483 | 15,483 | — | 15,483 | — | ||||||||||
100
NOTE NINETEEN –CITY HOLDING COMPANY (PARENT COMPANY ONLY) FINANCIAL INFORMATION
Condensed Balance Sheets
The following table presents the condensed balance sheets of City Holding Company, parent company only (in thousands):
December 31 | ||||||
2017 | 2016 | |||||
Assets | ||||||
Cash | $ | 59,031 | $ | 26,520 | ||
Securities available-for-sale | 5,699 | 4,231 | ||||
Investment in subsidiaries | 459,150 | 430,769 | ||||
Deferred tax assets, net | — | 1,459 | ||||
Fixed assets | 6 | 7 | ||||
Other assets | 2,989 | 2,584 | ||||
Total Assets | $ | 526,875 | $ | 465,570 | ||
Liabilities | ||||||
Junior subordinated debentures | $ | 16,495 | $ | 16,495 | ||
Dividends payable | 7,184 | 6,459 | ||||
Deferred tax liability | 436 | — | ||||
Accrued interest payable | 45 | 36 | ||||
Other liabilities | 208 | 142 | ||||
Total Liabilities | 24,368 | 23,132 | ||||
Total Shareholders’ Equity | 502,507 | 442,438 | ||||
Total Liabilities and Shareholders’ Equity | $ | 526,875 | $ | 465,570 | ||
Junior subordinated debentures represent the Parent Company’s amounts owed to City Holding Capital Trust III.
On December 19, 2016, the Company announced that it had filed a prospectus supplement to its existing shelf registration statement on Form S-3 for the sale of its common stock having an aggregate value of up to $55 million through an “at-the-market” equity offering program. Through the year ended December 31, 2017, the Company has sold approximately 548,000 common shares at a weighted average price of $64.82, net of broker fees. The Company has sold no shares since the first quarter of 2017. To date the Company has received $36.4 million in gross proceeds. Under the program, the Company has the ability to receive an additional $18.6 million in gross proceeds from the sale of common shares.
101
Condensed Statements of Comprehensive Income
The following table presents the condensed statements of comprehensive income of City Holding Company, parent company only (in thousands):
Year Ended December 31 | |||||||||
2017 | 2016 | 2015 | |||||||
Income | |||||||||
Dividends from subsidiaries | $ | 30,000 | $ | 8,600 | $ | 48,950 | |||
Investment securities gains | 200 | — | — | ||||||
Other income | 115 | 320 | 22 | ||||||
30,315 | 8,920 | 48,972 | |||||||
Expenses | |||||||||
Interest expense | 765 | 683 | 618 | ||||||
Other expenses | 1,636 | 1,957 | 1,170 | ||||||
2,401 | 2,640 | 1,788 | |||||||
Income Before Income Tax Benefit and Equity in Undistributed Net Income of Subsidiaries | 27,914 | 6,280 | 47,184 | ||||||
Income tax benefit | (1,197 | ) | (1,096 | ) | (795 | ) | |||
Income Before Equity in Undistributed Net Income of Subsidiaries | 29,111 | 7,376 | 47,979 | ||||||
Equity in undistributed net income of subsidiaries | 25,199 | 44,752 | 6,118 | ||||||
Net Income | $ | 54,310 | $ | 52,128 | $ | 54,097 | |||
Total Comprehensive Income | $ | 56,677 | $ | 48,948 | $ | 54,424 | |||
102
Condensed Statements of Cash Flows
The following table presents the condensed statements of cash flows of City Holding Company, parent company only (in thousands):
Year Ended December 31 | |||||||||
2017 | 2016 | 2015 | |||||||
Operating Activities | |||||||||
Net income | $ | 54,310 | $ | 52,128 | $ | 54,097 | |||
Adjustments to reconcile net income to net cash provided by operating activities: | |||||||||
Realized investment securities gains | (200 | ) | — | — | |||||
Provision for deferred income taxes | 1,347 | (241 | ) | (148 | ) | ||||
Amortization and accretion | — | (5 | ) | — | |||||
Stock based compensation | 2,097 | 2,018 | 3 | ||||||
Depreciation | 1 | 1 | 1 | ||||||
Asset write down | — | 444 | — | ||||||
Change in other assets | (405 | ) | 260 | 13,338 | |||||
Change in other liabilities | (1,660 | ) | (2,288 | ) | 462 | ||||
Equity in undistributed net income | (25,199 | ) | (44,752 | ) | (6,118 | ) | |||
Net Cash Provided by Operating Activities | 30,291 | 7,565 | 61,635 | ||||||
Investing Activities | |||||||||
Proceeds from sales of available for sale securities | 200 | — | — | ||||||
Net Cash Provided by Investing Activities | 200 | — | — | ||||||
Financing Activities | |||||||||
Dividends paid | (27,120 | ) | (25,718 | ) | (25,304 | ) | |||
Issuance of common stock | 28,408 | 6,864 | — | ||||||
Purchases of treasury stock | — | (10,018 | ) | (7,055 | ) | ||||
Exercise of stock options | 732 | 1,155 | 2,979 | ||||||
Exercise of warrants | — | — | 1,896 | ||||||
Net Cash Provided by (Used in) Financing Activities | 2,020 | (27,717 | ) | (27,484 | ) | ||||
Increase (decrease) in Cash and Cash Equivalents | 32,511 | (20,152 | ) | 34,151 | |||||
Cash and cash equivalents at beginning of year | 26,520 | 46,672 | 12,521 | ||||||
Cash and Cash Equivalents at End of Year | $ | 59,031 | $ | 26,520 | $ | 46,672 | |||
103
NOTE TWENTY – SUMMARIZED QUARTERLY FINANCIAL INFORMATION (UNAUDITED)
A summary of selected quarterly financial information (unaudited) is presented below (in thousands, except for per share data):
First Quarter | Second Quarter | Third Quarter | Fourth Quarter | |||||||||
2017 | ||||||||||||
Interest income | $ | 34,214 | $ | 35,298 | $ | 36,366 | $ | 37,053 | ||||
Taxable equivalent adjustment | 357 | 370 | 358 | 371 | ||||||||
Interest income (FTE) | 34,571 | 35,668 | 36,724 | 37,424 | ||||||||
Interest expense | 3,767 | 4,036 | 4,340 | 4,664 | ||||||||
Net interest income | 30,804 | 31,632 | 32,384 | 32,760 | ||||||||
Provision for loan losses | 681 | 510 | 1,393 | 422 | ||||||||
Investment securities gains | 4,276 | — | — | 200 | ||||||||
Non-interest income | 14,231 | 14,921 | 14,611 | 15,367 | ||||||||
Non-interest expense | 24,600 | 24,176 | 24,309 | 22,893 | ||||||||
Income before income tax expense | 24,030 | 21,867 | 21,293 | 25,012 | ||||||||
Income tax expense | 7,647 | 6,812 | 7,003 | 14,972 | ||||||||
Taxable equivalent adjustment | (357 | ) | (370 | ) | (358 | ) | (371 | ) | ||||
Net income available to common shareholders | $ | 16,026 | $ | 14,685 | $ | 13,932 | $ | 9,669 | ||||
Net earnings allocated to common shareholders | $ | 15,849 | $ | 14,531 | $ | 13,778 | $ | 9,560 | ||||
Basic earnings per common share | $ | 1.04 | $ | 0.94 | $ | 0.89 | $ | 0.62 | ||||
Diluted earnings per common share | 1.04 | 0.94 | 0.89 | 0.62 | ||||||||
Average common shares outstanding: | ||||||||||||
Basic | 15,252 | 15,462 | 15,485 | 15,472 | ||||||||
Diluted | 15,277 | 15,487 | 15,505 | 15,497 | ||||||||
2016 | ||||||||||||
Interest income | $ | 32,289 | $ | 32,932 | $ | 33,046 | $ | 33,884 | ||||
Taxable equivalent adjustment | 192 | 195 | 224 | 258 | ||||||||
Interest income (FTE) | 32,481 | 33,127 | 33,270 | 34,142 | ||||||||
Interest expense | 3,169 | 3,264 | 3,268 | 3,504 | ||||||||
Net interest income | 29,312 | 29,863 | 30,002 | 30,638 | ||||||||
Provision for loan losses | 539 | 1,122 | 1,432 | 1,301 | ||||||||
Investment securities gains | — | 845 | 2,668 | — | ||||||||
Non-interest income | 13,127 | 13,736 | 14,079 | 14,371 | ||||||||
Non-interest expense | 24,140 | 24,283 | 25,284 | 22,456 | ||||||||
Income before income tax expense | 17,760 | 19,039 | 20,033 | 21,252 | ||||||||
Income tax expense | 5,866 | 6,303 | 6,577 | 6,338 | ||||||||
Taxable equivalent adjustment | (192 | ) | (195 | ) | (224 | ) | (258 | ) | ||||
Net income available to common shareholders | $ | 11,702 | $ | 12,541 | $ | 13,232 | $ | 14,656 | ||||
Net earnings allocated to common shareholders | $ | 11,571 | $ | 12,391 | $ | 13,075 | $ | 14,479 | ||||
Basic earnings per common share | $ | 0.78 | $ | 0.83 | $ | 0.88 | $ | 0.97 | ||||
104
Diluted earnings per common share | 0.78 | 0.83 | 0.88 | 0.97 | ||||||||
Average common shares outstanding: | ||||||||||||
Basic | 14,916 | 14,889 | 14,899 | 14,894 | ||||||||
Diluted | 14,927 | 14,902 | 14,909 | 14,914 | ||||||||
NOTE TWENTY-ONE – EARNINGS PER SHARE
The following table sets forth the computation of basic and diluted earnings per share (in thousands, except per share data):
For the Year Ended December 31, | |||||||||
2017 | 2016 | 2015 | |||||||
Net income available to common shareholders | $ | 54,310 | $ | 52,128 | $ | 54,097 | |||
Less: earnings allocated to participating securities | $ | (591 | ) | $ | (623 | ) | $ | (613 | ) |
Net earnings allocated to common shareholders | $ | 53,719 | $ | 51,505 | $ | 53,484 | |||
Distributed earnings allocated to common shares outstanding | $ | 27,497 | $ | 25,710 | $ | 25,212 | |||
Undistributed earnings allocated to common shares outstanding | 26,222 | 25,795 | 28,272 | ||||||
Net earnings allocated to common shareholders | $ | 53,719 | $ | 51,505 | $ | 53,484 | |||
Average shares outstanding, basic | 15,412 | 14,900 | 15,123 | ||||||
Effect of dilutive securities | 24 | 13 | 48 | ||||||
Average shares outstanding, diluted | 15,436 | 14,913 | 15,171 | ||||||
Basic earnings per share | $ | 3.49 | $ | 3.46 | $ | 3.54 | |||
Diluted earnings per share | $ | 3.48 | $ | 3.45 | $ | 3.53 | |||
Options to purchase approximately 3,000 shares, 2,000 shares, and 13,000 shares of common stock were outstanding during the years ended December 31, 2017, December 31, 2016, and December 31, 2015, but were not included in the computation of diluted earnings per share because the options’ exercise price was greater than the average market price of the common shares and therefore, the effect would have been anti-dilutive.
105
NOTE TWENTY-TWO – ACCUMULATED OTHER COMPREHENSIVE LOSS
The activity in accumulated other comprehensive loss is presented in the tables below (in thousands). The activity is shown net of tax, which is calculated using a combined Federal and state income tax rate approximating 37%. The impact of the change in the corporate tax rate as a result of the Tax Cuts and Jobs Act ("TCJA") from 35% to 21% is shown in the reclassification of residual tax effect of corporate tax rate reduction line item in the table below. As a result, the accumulated other comprehensive loss balances at December 31, 2017 reflect a combined Federal and state income tax rate approximating 23%.
Accumulated Other Comprehensive Loss | |||||||||
Unrealized | |||||||||
Gains (Losses) on | |||||||||
Defined Benefit | Securities | ||||||||
Pension Plans | Available-for-Sale | Total | |||||||
Balance at December 31, 2015 | $ | (4,759 | ) | $ | 927 | $ | (3,832 | ) | |
Other comprehensive income before reclassifications | 99 | (1,063 | ) | (964 | ) | ||||
Amounts reclassified from other comprehensive loss | — | (2,216 | ) | (2,216 | ) | ||||
99 | (3,279 | ) | (3,180 | ) | |||||
Balance at December 31, 2016 | $ | (4,660 | ) | $ | (2,352 | ) | $ | (7,012 | ) |
Other comprehensive income (loss) before reclassifications | 528 | 4,658 | 5,186 | ||||||
Amounts reclassified from other comprehensive loss | — | (2,819 | ) | (2,819 | ) | ||||
528 | 1,839 | 2,367 | |||||||
Reclassification of residual tax effect of corporate tax rate reduction | (901 | ) | (98 | ) | (999 | ) | |||
Balance at December 31, 2017 | $ | (5,033 | ) | $ | (611 | ) | $ | (5,644 | ) |
Amount reclassified from Other Comprehensive Loss | Affected line item | |||||||||
December 31, | in the Statements | |||||||||
2017 | 2016 | 2015 | of Income | |||||||
Securities available-for-sale: | ||||||||||
Net securities gains reclassified into earnings | $ | (4,476 | ) | $ | (3,513 | ) | $ | (2,130 | ) | Gains on sale of investment securities |
Related income tax expense | 1,657 | 1,297 | 786 | Income tax expense | ||||||
Net effect on accumulated other comprehensive (loss) | $ | (2,819 | ) | $ | (2,216 | ) | $ | (1,344 | ) | |
106
Item 9.Changes in and Disagreements With Accountants on Accounting and Financial Disclosure
None
Item 9A.Controls and Procedures
Pursuant to Rule 13a-15(b) under the Securities Exchange Act of 1934, the Company carried out an evaluation, with the participation of the Company’s management, including the Company’s Chief Executive Officer and Chief Financial Officer, of the effectiveness of the Company’s disclosure controls and procedures (as defined under Rules 13a-15(e) and 15d-15(e) under the Securities Exchange Act of 1934) as of the end of the period covered by this report. Based upon that evaluation, the Company’s Chief Executive Officer and Chief Financial Officer concluded that the Company’s disclosure controls and procedures are effective in timely alerting them to material information relating to the Company required to be included in the Company’s periodic Securities and Exchange Commission filings.
(a) | Management’s annual report on internal control over financial reporting appearing on page 49 of the Annual Report on Form 10-K of City Holding Company for the year ended December 31, 2017. |
(b) | The Company did not have any changes in internal control over financial reporting during its fourth quarter for the year ending December 31, 2017, that materially affected, or were reasonably likely to materially affect, the Company’s internal control over financial reporting. |
The Report of Management on Internal Control Over Financial Reporting is included in Item 8 of this Annual Report on Form 10-K.
Item 9B.Other Information
None
107
PART III
Item 10.Directors, Executive Officers and Corporate Governance
Certain information regarding executive officers is included under the section captioned “Executive Officers of The Registrant” in Part I, Item 1, elsewhere in this Annual Report on Form 10-K. Other information required by this Item appears under the captions “ELECTION OF DIRECTORS”, “ADDITIONAL INFORMATION CONCERNING THE BOARD OF DIRECTORS”, “REPORT OF THE AUDIT COMMITTEE”, and “SECTION 16(a) BENEFICIAL OWNERSHIP REPORTING COMPLIANCE” in the Company's 2018 Proxy Statement that will be filed within 120 days of fiscal year end and is hereby incorporated by reference.
In December 2009, the Company adopted a new Code of Business Conduct and Ethics which applies to all employees (including its chief executive officer, chief financial officer and principal accounting officer). Members of the Board of Directors are governed by a separate Code of Business Conduct and Ethics approved in January 2004. Both of the Codes of Business Conduct and Ethics have been posted on the Company's website at www.bankatcity.com under the “Corporate Governance” link located at the bottom of the page. A copy of the Company’s Code of Business Conduct and Ethics covering all employees and/or a copy of the Code of Business Conduct and Ethics covering the Board of Directors will be mailed without charge upon request to Investor Relations, City Holding Company, 25 Gatewater Road, P.O. Box 7520, Charleston, WV 25356-0520. Any amendments to or waivers from any provision of the Code of Ethics applicable to the Company’s chief executive officer, chief financial officer, or principal accounting officer will be disclosed by timely posting such information on the Company’s Internet website.
Item 11.Executive Compensation
Certain information regarding securities authorized for issuance under equity compensation plans is included in the section captioned "STOCK-BASED COMPENSATION PLAN" in Part II, Item 5, elsewhere in this Annual Report on Form 10-K. Other information required by Item 11 of FORM 10-K appears under the captions "COMPENSATION OF DIRECTORS", “COMPENSATION DISCUSSION AND ANALYSIS”, “EQUITY HOLDINGS”, “POST-EMPLOYMENT PAYMENTS”, “BOARD COMPENSATION COMMITTEE REPORT ON EXECUTIVE COMPENSATION” and "PAY RATIO DISCLOSURE" in the Company's 2018 Proxy Statement that will be filed within 120 days of fiscal year end and is hereby incorporated by reference.
Item 12.Security Ownership of Certain Beneficial Owners and Management and Related Stockholder Matters
The information required by Item 12 of FORM 10-K appears under the caption "COMMON STOCK OWNERSHIP OF CERTAIN BENEFICIAL OWNERS AND MANAGEMENT" in the Company's 2018 Proxy Statement that will be filed within 120 days of fiscal year end and is hereby incorporated by reference.
Item 13.Certain Relationships and Related Transactions and Director Independence
The information required by Item 13 of FORM 10-K appears under the captions "CERTAIN TRANSACTIONS INVOLVING DIRECTORS AND EXECUTIVE OFFICERS" and “ADDITIONAL INFORMATION CONCERNING THE BOARD OF DIRECTORS” in the Company's 2018 Proxy Statement that will be filed within 120 days of fiscal year end and is hereby incorporated by reference.
Item 14.Principal Accounting Fees and Services
The information required by Item 14 of FORM 10-K appears under the caption "PRINCIPAL ACCOUNTING FEES AND SERVICES" in the Company's 2018 Proxy Statement that will be filed within 120 days of fiscal year end and is hereby incorporated by reference.
108
PART IV
Item 15.Exhibits, Financial Statement Schedules
(a) | (1) | Financial Statements. Reference is made to Part II, Item 8, of this Annual Report on Form 10-K. | ||
(2) | Financial Statement Schedules. These schedules are omitted as the required information is inapplicable or the information is presented in the consolidated financial statements or related notes. | |||
(3) | Exhibits. The exhibits listed in the “Exhibit Index” on pages 111-113 of this Annual Report on Form 10-K included herein are filed herewith or incorporated by reference from previous filings. | |||
(b) | See (a) (3) above. | |||
(c) | See (a) (1) and (2) above. | |||
Item 16. Form 10-K Summary
None.
109
EXHIBIT INDEX
The following exhibits are filed herewith or are incorporated herein by reference.
Exhibit | Description |
2(a) | |
2(b) | |
3(a) | Articles of Incorporation of City Holding Company (attached to, and incorporated by reference from, Amendment No. 1 to City Holding Company’s Registration Statement on Form S-4, Registration No. 2-86250, filed November 4, 1983 with the Securities and Exchange Commission). |
3(b) | Articles of Amendment to the Articles of Incorporation of City Holding Company, dated March 6, 1984 (attached to, and incorporated by reference from, City Holding Company's Form 8-K Report dated March 7, 1984, and filed with the Securities and Exchange Commission on March 22, 1984). |
3(c) | Articles of Amendment to the Articles of Incorporation of City Holding Company, dated March 4, 1986 (attached to, and incorporated by reference from, City Holding Company's Form 10-K Annual Report for the year ended December 31, 1986, filed March 31, 1987 with the Securities and Exchange Commission). |
3(d) | Articles of Amendment to the Articles of Incorporation of City Holding Company, dated September 29, 1987 (attached to and incorporated by reference from, City Holding Company's Registration Statement on Form S-4, Registration No. 33-23295, filed with the Securities and Exchange Commission on August 3, 1988). |
3(e) | Articles of Amendment to the Articles of Incorporation of City Holding Company, dated May 6, 1991 (attached to, and incorporated by reference from, City Holding Company's Form 10-K Annual Report for the year ended December 31, 1991, filed March 17, 1992 with the Securities and Exchange Commission). |
3(f) | Articles of Amendment to the Articles of Incorporation of City Holding Company, dated May 7, 1991 (attached to, and incorporated by reference from, City Holding Company's Form 10-K Annual Report for the year ended December 31, 1991, filed March 17, 1992 with the Securities and Exchange Commission). |
3(g) | Articles of Amendment to the Articles of Incorporation of City Holding Company, dated August 1, 1994 (attached to, and incorporated by reference from, City Holding Company's Form 10-Q Quarterly Report for the quarter ended September 30, 1994, filed November 14, 1994 with the Securities and Exchange Commission). |
3(h) | |
3(i) | |
3(j) | |
3(k) | |
4(a) | |
4(b) | |
10(a) | |
110
10(b) | |
10(c) | |
10(d) | |
10(e) | |
10(f) | |
10(g) | |
10(h) | |
10(i) | |
10(j) | |
10(k) | |
10(l) | |
10(m) | |
10(n) | |
21 | |
23 | |
24 | |
31(a) | |
31(b) | |
32(a) | |
32(b) | |
101.INS | XBRL Instance Document* |
101.SCH | XBRL Taxonomy Extension Schema* |
101.CAL | XBRL Taxonomy Extension Calculation Linkbase* |
101.DEF | XBRL Taxonomy Extension Definition Linkbase* |
101.LAB | XBRL Taxonomy Extension Label Linkbase* |
101.PRE | XBRL Taxonomy Extension Presentation Linkbase* |
111
*Pursuant to Rule 406T of Regulation S-T, these interactive data files are deemed not filed or part of a registration statement or prospectus for purposes of Section 11 or 12 of the Securities Act of 1933 or Section 18 of the Securities Exchange Act of 1934 and otherwise are not subject to liability.
SIGNATURES
Pursuant to the requirements of Section 13 or 15(d) of the Securities Exchange Act of 1934, the Registrant has duly caused this report to be signed on its behalf by the undersigned, thereunto duly authorized.
Date: | February 28, 2018 | City Holding Company | ||
(Registrant) | ||||
By: | /s/ Charles R. Hageboeck, Ph.D. | |||
Charles R. Hageboeck, Ph.D. | ||||
President and Chief Executive Officer | ||||
(Principal Executive Officer) | ||||
By: | /s/ David L. Bumgarner | |||
David L. Bumgarner | ||||
Senior Vice President, Chief Financial Officer and Principal Accounting Officer | ||||
(Principal Financial Officer) | ||||
112
POWER OF ATTORNEY
Pursuant to the requirements of the Securities Exchange Act of 1934, this report has been signed below by the following persons on behalf of the Registrant and in the capacities indicated on February 28, 2018. Each of the directors and/or officers of City Holding Company whose signature appears below hereby appoints C. Dallas Kayser, and/or Charles R. Hageboeck Ph.D., as his attorney-in-fact to sign in his name and behalf, in any and all capacities stated below and to file with the Securities and Exchange Commission, any and all amendments to this report on Form 10-K, making such changes in this report on Form 10-K as appropriate, and generally to do all such things in their behalf in their capacities as officers and directors to enable City Holding Company to comply with the provisions of the Securities Exchange Act of 1934, and all requirements of the Securities and Exchange Commission.
/s/ C. Dallas Kayser | /s/ Charles R. Hageboeck, Ph.D. | |
C. Dallas Kayser | Charles R. Hageboeck, Ph.D. | |
Chairman | Director, President, and Chief Executive Officer | |
/s/ John R. Elliot | /s/ David W. Hambrick | |
John R Elliot | David W. Hambrick | |
Director | Director | |
/s/ Charles W. Fairchilds | /s/ Tracy W. Hylton, II | |
Charles W. Fairchilds | Tracy W. Hylton, II | |
Director | Director | |
/s/ William H. File, III | /s/ J. Thomas Jones | |
William H. File, III | J. Thomas Jones | |
Director | Director | |
/s/ Robert D. Fisher | /s/ James L. Rossi | |
Robert D. Fisher | James L. Rossi | |
Director | Director | |
/s/ Jay C. Goldman | /s/ Sharon H. Rowe | |
Jay C. Goldman | Sharon H. Rowe | |
Director | Director | |
/s/ Patrick C. Graney, III | /s/ Diane Strong-Treister | |
Patrick C. Graney, III | Diane Strong-Treister | |
Director | Director | |
113