Attached files
| file | filename |
|---|---|
| 8-K - 8-K - PACIFIC PREMIER BANCORP INC | a16-5950_18k.htm |
| EX-99.1 - EX-99.1 - PACIFIC PREMIER BANCORP INC | a16-5950_1ex99d1.htm |
Exhibit 99.2
Investor Presentation Fourth Quarter 2015 Steve Gardner President & Chief Executive Officer sgardner@ppbi.com 949-864-8000 Exhibit 99.2
Forward-Looking Statements The statements contained in this presentation that are not historical facts are forward-looking statements based on management’s current expectations and beliefs concerning future developments and their potential effects on Pacific Premier Bancorp, Inc. (the “Company”). Such statements involve inherent risks and uncertainties, many of which are difficult to predict and are generally beyond the control of the Company. There can be no assurance that future developments affecting the Company will be the same as those anticipated by management. The Company cautions readers that a number of important factors could cause actual results to differ materially from those expressed in, or implied or projected by, such forward-looking statements. These risks and uncertainties include, but are not limited to, the following: the strength of the United States economy in general and the strength of the local economies in which the Company conducts operations; the effects of, and changes in, trade, monetary and fiscal policies and laws, including interest rate policies of the Board of Governors of the Federal Reserve System; inflation, interest rate, market and monetary fluctuations; the timely development of competitive new products and services and the acceptance of these products and services by new and existing customers; the impact of changes in financial services policies, laws and regulations including those concerning taxes, banking, securities and insurance, and the application thereof by regulatory bodies; technological and social media changes; the effect of acquisitions that the Company has made or may make, if any, including, without limitation, the failure to achieve the expected revenue growth and/or expense savings from such acquisitions, and/or the failure to effectively integrate an acquisition target into our operations; changes in the level of the Company’s nonperforming assets and charge-offs; oversupply of inventory and deterioration in values of California real estate, both residential and commercial; the effect of changes in accounting policies and practices, as may be adopted from time-to-time by bank regulatory agencies, the Securities and Exchange Commission (“SEC”), the Public Company Accounting Oversight Board, the Financial Accounting Standards Board or other accounting standards setters; possible other-than-temporary impairments of securities held by the Company; changes in consumer spending, borrowing and savings habits; the effects of the Company’s lack of a diversified loan portfolio, including the risks of geographic and industry concentrations; ability to attract deposits and other sources of liquidity; changes in the financial performance and/or condition of the Company’s borrowers; changes in the competitive environment among financial and bank holding companies and other financial service providers; geopolitical conditions, including acts or threats of terrorism, actions taken by the United States or other governments in response to acts or threats of terrorism and/or military conflicts, which could impact business and economic conditions in the United States and abroad; unanticipated regulatory or judicial proceedings; and the Company’s ability to manage the risks involved in the foregoing. Additional factors that could cause actual results to differ materially from those expressed in the forward-looking statements are discussed in the Company’s Annual Report on Form 10-K for the fiscal year ended December 31, 2014, filed with the SEC and other filings made by the Company with the SEC. The Company specifically disclaims any obligation to update any factors or to publicly announce the result of revisions to any of the forward-looking statements included herein to reflect future events or developments.
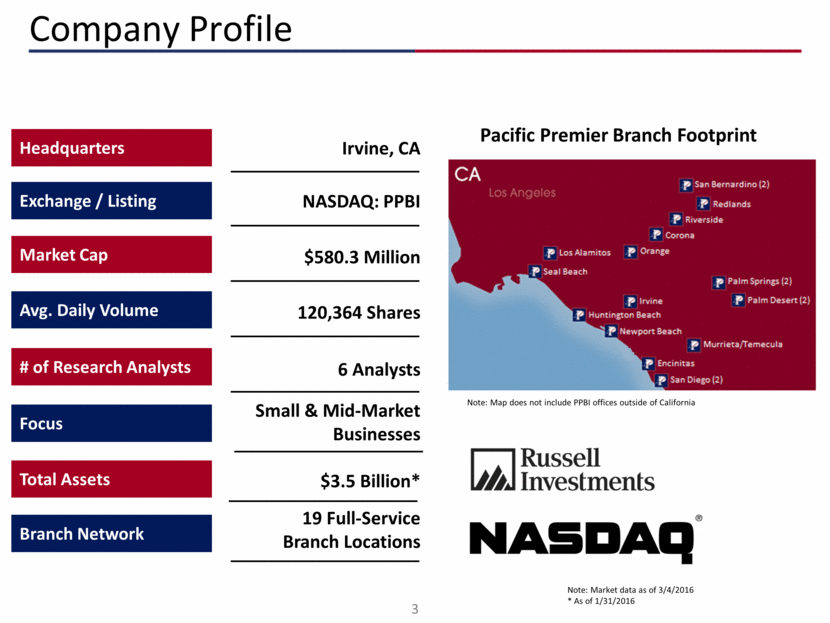
19 Full-Service Branch Locations Company Profile Exchange / Listing NASDAQ: PPBI Focus Small & Mid-Market Businesses Total Assets $3.5 Billion* Branch Network Note: Market data as of 3/4/2016 * As of 1/31/2016 Pacific Premier Branch Footprint Headquarters Irvine, CA # of Research Analysts 6 Analysts Market Cap $580.3 Million Avg. Daily Volume 120,364 Shares Note: Map does not include PPBI offices outside of California
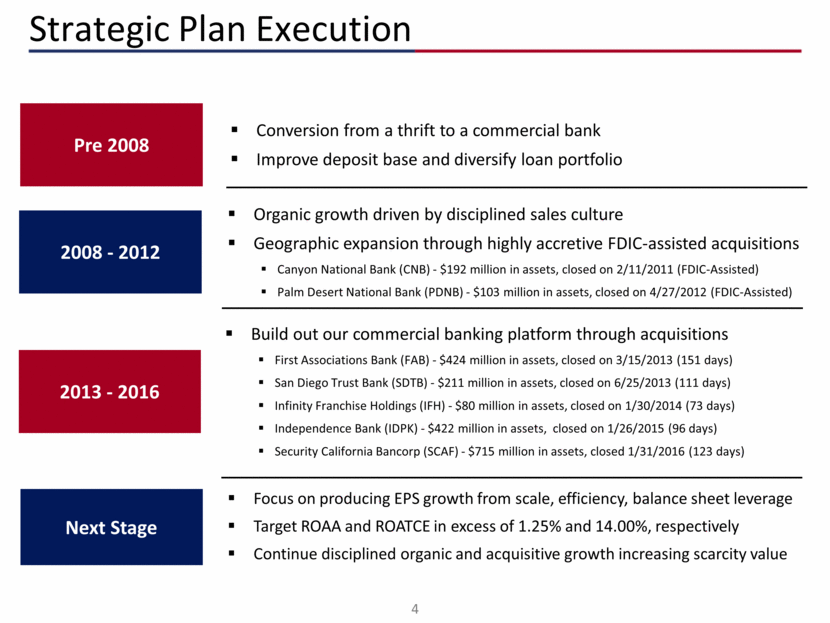
Strategic Plan Execution Pre 2008 Conversion from a thrift to a commercial bank Improve deposit base and diversify loan portfolio 2008 - 2012 Organic growth driven by disciplined sales culture Geographic expansion through highly accretive FDIC-assisted acquisitions Canyon National Bank (CNB) - $192 million in assets, closed on 2/11/2011 (FDIC-Assisted) Palm Desert National Bank (PDNB) - $103 million in assets, closed on 4/27/2012 (FDIC-Assisted) Next Stage Focus on producing EPS growth from scale, efficiency, balance sheet leverage Target ROAA and ROATCE in excess of 1.25% and 14.00%, respectively Continue disciplined organic and acquisitive growth increasing scarcity value 2013 - 2016 Build out our commercial banking platform through acquisitions First Associations Bank (FAB) - $424 million in assets, closed on 3/15/2013 (151 days) San Diego Trust Bank (SDTB) - $211 million in assets, closed on 6/25/2013 (111 days) Infinity Franchise Holdings (IFH) - $80 million in assets, closed on 1/30/2014 (73 days) Independence Bank (IDPK) - $422 million in assets, closed on 1/26/2015 (96 days) Security California Bancorp (SCAF) - $715 million in assets, closed 1/31/2016 (123 days)
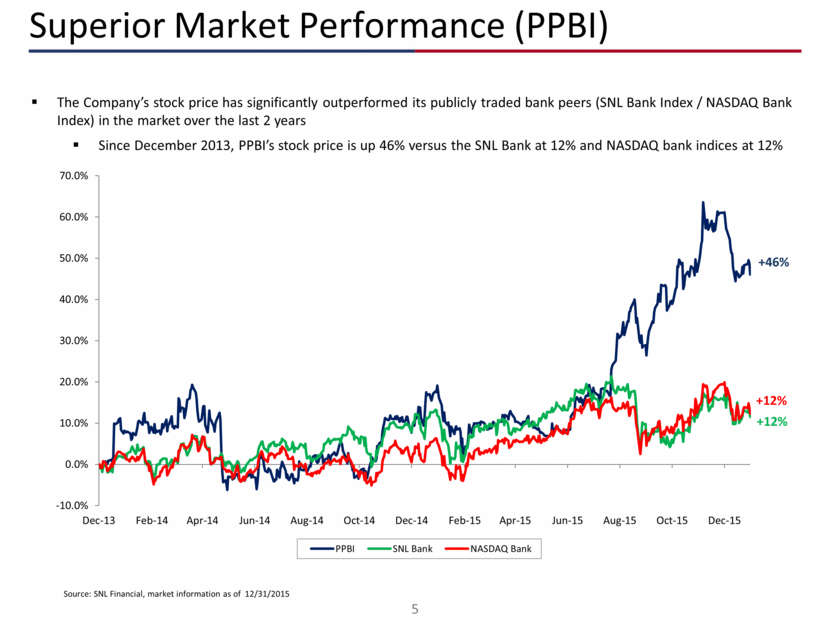
Superior Market Performance (PPBI) Source: SNL Financial, market information as of 12/31/2015 The Company’s stock price has significantly outperformed its publicly traded bank peers (SNL Bank Index / NASDAQ Bank Index) in the market over the last 2 years Since December 2013, PPBI’s stock price is up 46% versus the SNL Bank at 12% and NASDAQ bank indices at 12% +46% +12% +12% -10.0% 0.0% 10.0% 20.0% 30.0% 40.0% 50.0% 60.0% 70.0% Dec-13 Feb-14 Apr-14 Jun-14 Aug-14 Oct-14 Dec-14 Feb-15 Apr-15 Jun-15 Aug-15 Oct-15 Dec-15 PPBI SNL Bank NASDAQ Bank
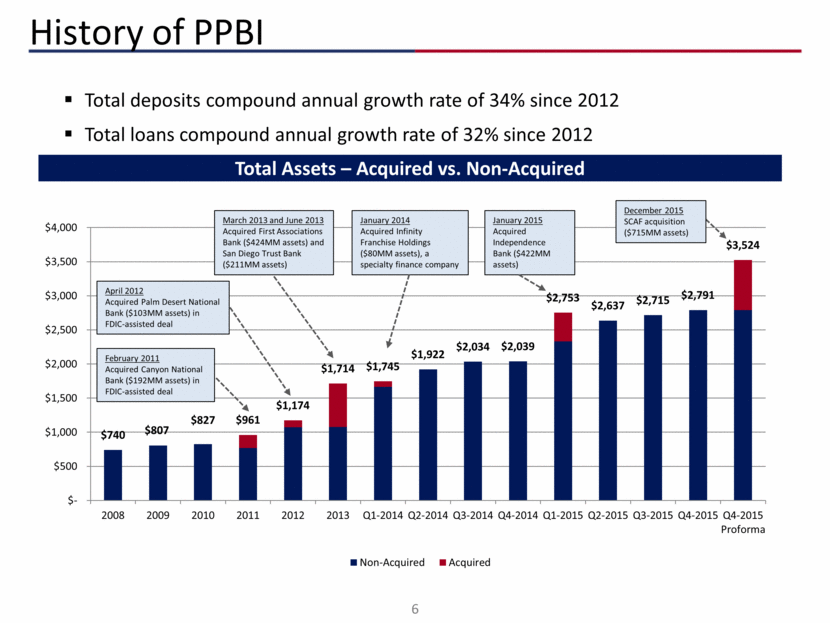
History of PPBI Total deposits compound annual growth rate of 34% since 2012 Total loans compound annual growth rate of 32% since 2012 Total Assets – Acquired vs. Non-Acquired February 2011 Acquired Canyon National Bank ($192MM assets) in FDIC-assisted deal April 2012 Acquired Palm Desert National Bank ($103MM assets) in FDIC-assisted deal March 2013 and June 2013 Acquired First Associations Bank ($424MM assets) and San Diego Trust Bank ($211MM assets) January 2014 Acquired Infinity Franchise Holdings ($80MM assets), a specialty finance company January 2015 Acquired Independence Bank ($422MM assets) December 2015 SCAF acquisition ($715MM assets) $740 $807 $827 $961 $1,174 $1,714 $1,745 $1,922 $2,034 $2,039 $2,753 $2,637 $2,715 $2,791 $3,524 $- $500 $1,000 $1,500 $2,000 $2,500 $3,000 $3,500 $4,000 2008 2009 2010 2011 2012 2013 Q1-2014 Q2-2014 Q3-2014 Q4-2014 Q1-2015 Q2-2015 Q3-2015 Q4-2015 Q4-2015 Proforma Non-Acquired Acquired
PPBI Strategic Focus Examples of PPBI’s operating environment and the culture we have built over the years Portfolio Management – reorganization of C&I and OO CRE underwriters, aligned with senior RM Sales culture maturation combined with traditional RM and leveraging of technology BSA/AML – Rule Based Risk Rating and statistical analytics covering entire client base CRA – enhanced program to exceed community group requirements and large bank exam standards PPBI’s management team operates the bank knowing we will grow to $5.0 to $7.5 billion Our business model is always evolving, transforming and improving Continued growth and strengthening of the management team Retention of key executives from Security with significant banking experience Consistent Focus on Evolving and Striving for Superior Performance Operational Integrity leads to strong Internal Controls and Risk Management
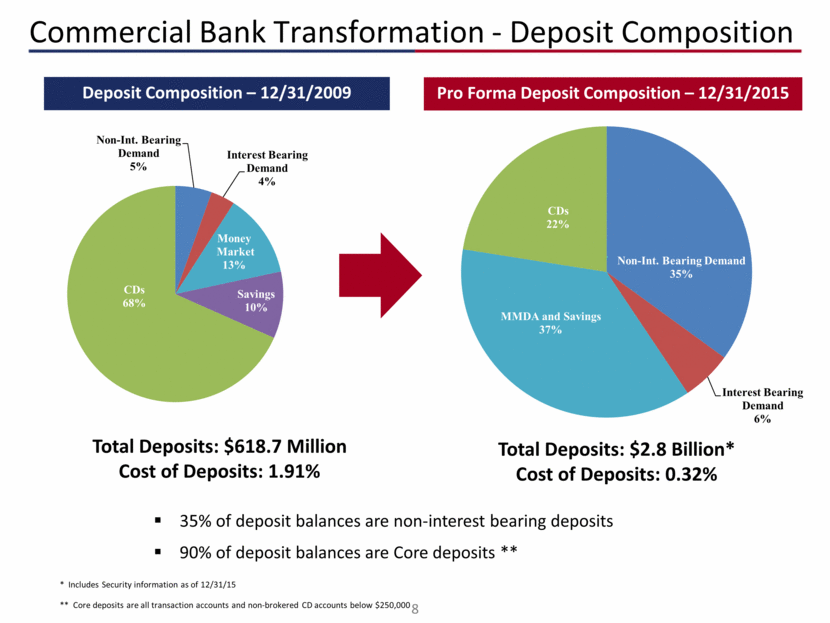
Commercial Bank Transformation - Deposit Composition Deposit Composition – 12/31/2009 Pro Forma Deposit Composition – 12/31/2015 35% of deposit balances are non-interest bearing deposits 90% of deposit balances are Core deposits ** Total Deposits: $618.7 Million Cost of Deposits: 1.91% Total Deposits: $2.8 Billion* Cost of Deposits: 0.32% * Includes Security information as of 12/31/15 ** Core deposits are all transaction accounts and non-brokered CD accounts below $250,000 Non - Int. Bearing Demand 5% Interest Bearing Demand 4% Money Market 13% Savings 10% CDs 68% Non - Int. Bearing Demand 35% Interest Bearing Demand 6% MMDA and Savings 37% CDs 22%
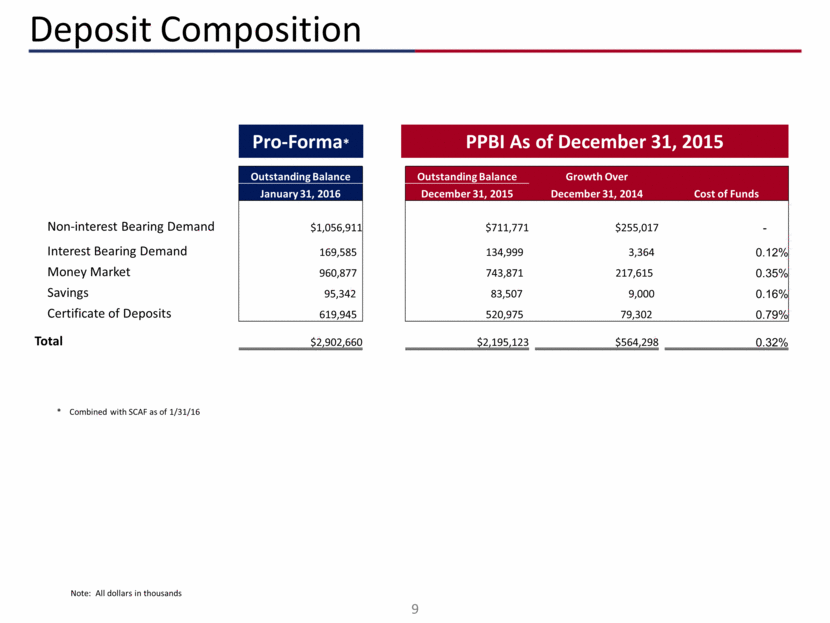
Deposit Composition Note: All dollars in thousands * Combined with SCAF as of 1/31/16 PPBI As of December 31, 2015 Pro-Forma* Outstanding Balance Outstanding Balance Growth Over January 31, 2016 December 31, 2015 December 31, 2014 Cost of Funds Non-interest Bearing Demand $1,056,911 $711,771 $255,017 - Interest Bearing Demand 169,585 134,999 3,364 0.12% Money Market 960,877 743,871 217,615 0.35% Savings 95,342 83,507 9,000 0.16% Certificate of Deposits 619,945 520,975 79,302 0.79% Total $2,902,660 $2,195,123 $564,298 0.32%
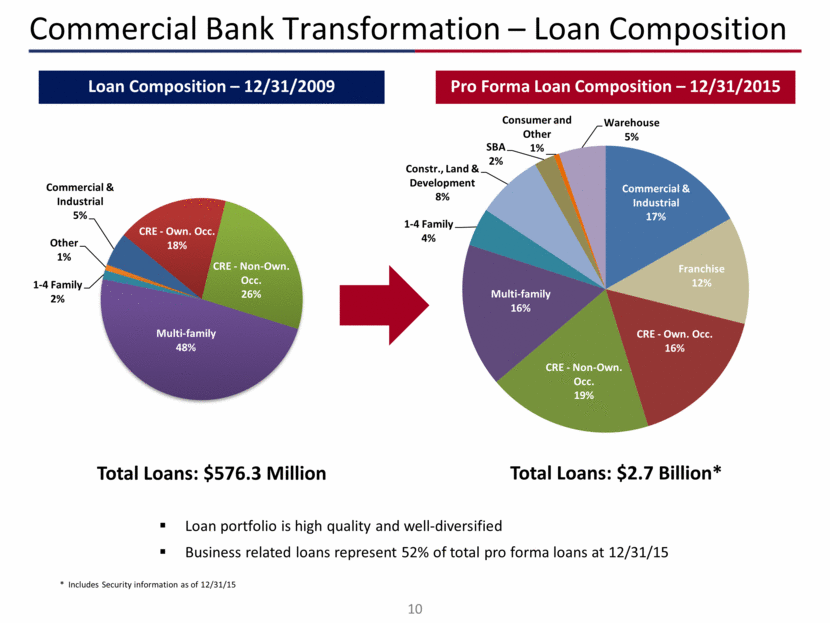
Commercial Bank Transformation – Loan Composition Loan Composition – 12/31/2009 Pro Forma Loan Composition – 12/31/2015 Loan portfolio is high quality and well-diversified Business related loans represent 52% of total pro forma loans at 12/31/15 Total Loans: $576.3 Million Total Loans: $2.7 Billion* * Includes Security information as of 12/31/15 Commercial & Industrial 5% CRE - Own. Occ. 18% CRE - Non - Own. Occ. 26% Multi - family 48% 1 - 4 Family 2% Other 1% Commercial & Industrial 17% Franchise 12% CRE - Own. Occ. 16% CRE - Non - Own. Occ. 19% Multi - family 16% 1 - 4 Family 4% Constr ., Land & Development 8% SBA 2% Consumer and Other 1% Warehouse 5%
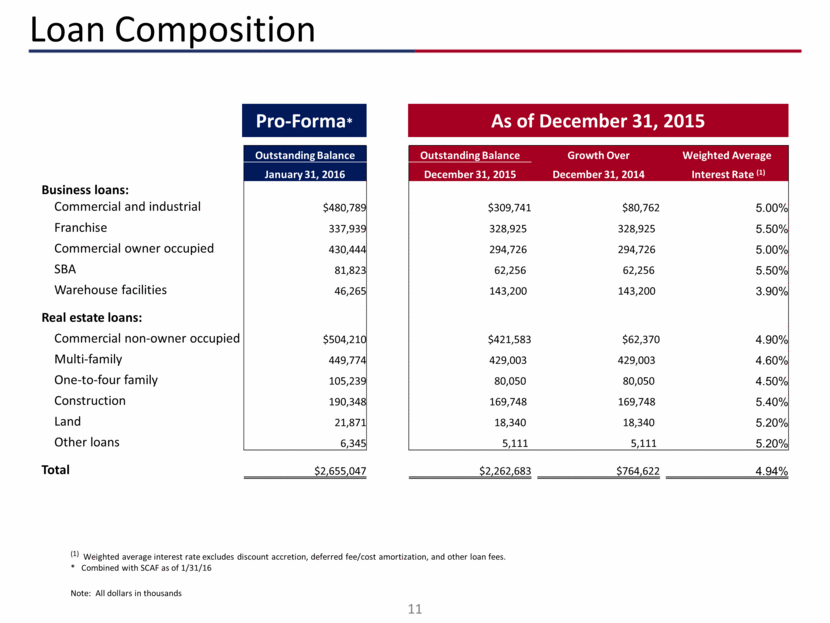
Loan Composition Note: All dollars in thousands (1) (Weighted average interest rate excludes discount accretion, deferred fee/cost amortization, and other loan fees. * Combined with SCAF as of 1/31/16 As of December 31, 2015 Pro-Forma* Outstanding Balance Outstanding Balance Growth Over Weighted Average January 31, 2016 December 31, 2015 December 31, 2014 Interest Rate (1) Business loans: Commercial and industrial $480,789 $309,741 $80,762 5.00% Franchise 337,939 328,925 328,925 5.50% Commercial owner occupied 430,444 294,726 294,726 5.00% SBA 81,823 62,256 62,256 5.50% Warehouse facilities 46,265 143,200 143,200 3.90% Real estate loans: Commercial non-owner occupied $504,210 $421,583 $62,370 4.90% Multi-family 449,774 429,003 429,003 4.60% One-to-four family 105,239 80,050 80,050 4.50% Construction 190,348 169,748 169,748 5.40% Land 21,871 18,340 18,340 5.20% Other loans 6,345 5,111 5,111 5.20% Total $2,655,047 $2,262,683 $764,622 4.94%
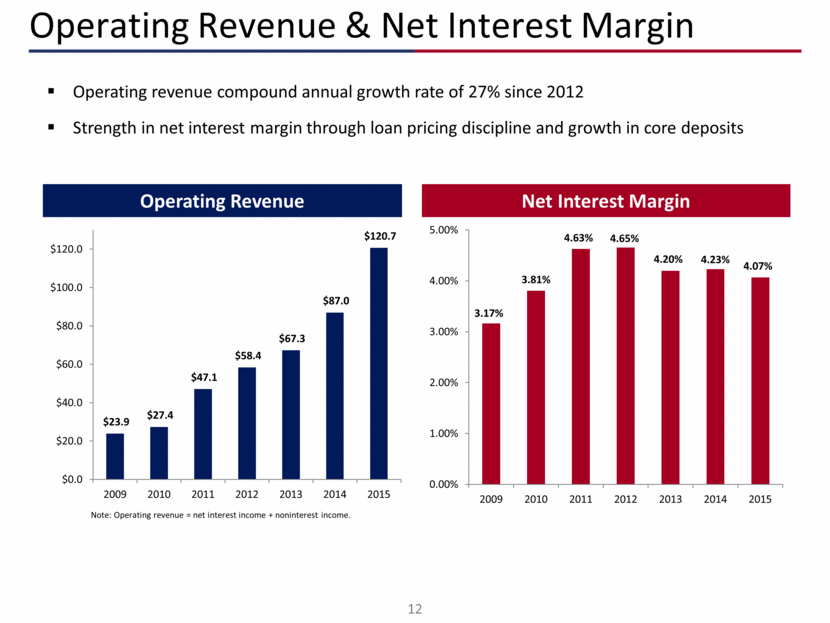
Operating Revenue & Net Interest Margin Net Interest Margin Operating Revenue Operating revenue compound annual growth rate of 27% since 2012 Strength in net interest margin through loan pricing discipline and growth in core deposits Note: Operating revenue = net interest income + noninterest income. $23.9 $27.4 $47.1 $58.4 $67.3 $87.0 $120.7 $0.0 $20.0 $40.0 $60.0 $80.0 $100.0 $120.0 2009 2010 2011 2012 2013 2014 2015 3.17% 3.81% 4.63% 4.65% 4.20% 4.23% 4.07% 0.00% 1.00% 2.00% 3.00% 4.00% 5.00% 2009 2010 2011 2012 2013 2014 2015
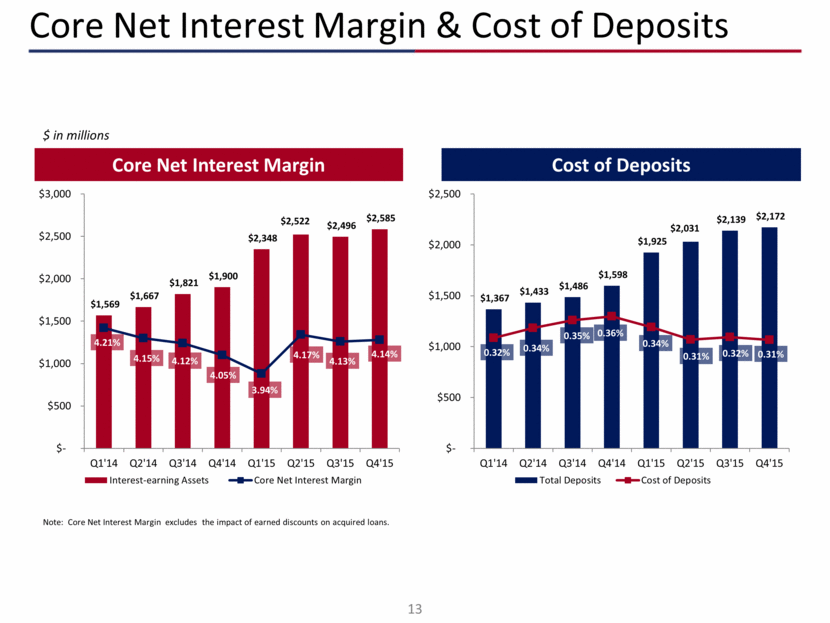
Core Net Interest Margin & Cost of Deposits Core Net Interest Margin Cost of Deposits $ in millions Note: Core Net Interest Margin excludes the impact of earned discounts on acquired loans. $1,569 $1,667 $1,821 $1,900 $2,348 $2,522 $2,496 $2,585 4.21% 4.15% 4.12% 4.05% 3.94% 4.17% 4.13% 4.14% $- $500 $1,000 $1,500 $2,000 $2,500 $3,000 Q1'14 Q2'14 Q3'14 Q4'14 Q1'15 Q2'15 Q3'15 Q4'15 Thousands Interest-earning Assets Core Net Interest Margin $1,367 $1,433 $1,486 $1,598 $1,925 $2,031 $2,139 $2,172 0.32% 0.34% 0.35% 0.36% 0.34% 0.31% 0.32% 0.31% $- $500 $1,000 $1,500 $2,000 $2,500 Q1'14 Q2'14 Q3'14 Q4'14 Q1'15 Q2'15 Q3'15 Q4'15 Thousands Total Deposits Cost of Deposits
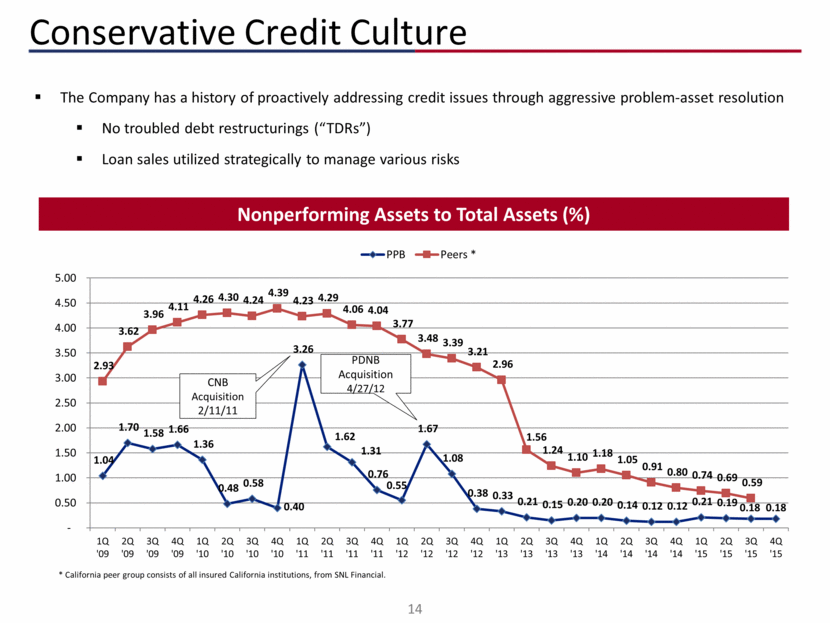
Conservative Credit Culture Nonperforming Assets to Total Assets (%) The Company has a history of proactively addressing credit issues through aggressive problem-asset resolution No troubled debt restructurings (“TDRs”) Loan sales utilized strategically to manage various risks CNB Acquisition 2/11/11 PDNB Acquisition 4/27/12 * California peer group consists of all insured California institutions, from SNL Financial. 1.04 1.70 1.58 1.66 1.36 0.48 0.58 0.40 3.26 1.62 1.31 0.76 0.55 1.67 1.08 0.38 0.33 0.21 0.15 0.20 0.20 0.14 0.12 0.12 0.21 0.19 0.18 0.18 2.93 3.62 3.96 4.11 4.26 4.30 4.24 4.39 4.23 4.29 4.06 4.04 3.77 3.48 3.39 3.21 2.96 1.56 1.24 1.10 1.18 1.05 0.91 0.80 0.74 0.69 0.59 - 0.50 1.00 1.50 2.00 2.50 3.00 3.50 4.00 4.50 5.00 1Q '09 2Q '09 3Q '09 4Q '09 1Q '10 2Q '10 3Q '10 4Q '10 1Q '11 2Q '11 3Q '11 4Q '11 1Q '12 2Q '12 3Q '12 4Q '12 1Q '13 2Q '13 3Q '13 4Q '13 1Q '14 2Q '14 3Q '14 4Q '14 1Q '15 2Q '15 3Q '15 4Q '15 PPB Peers *
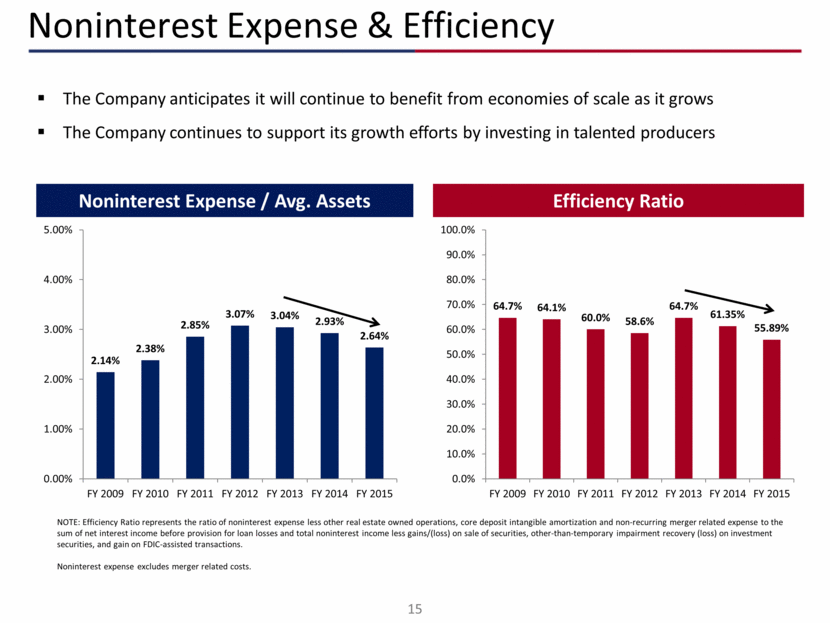
Noninterest Expense & Efficiency Noninterest Expense / Avg. Assets Efficiency Ratio The Company anticipates it will continue to benefit from economies of scale as it grows The Company continues to support its growth efforts by investing in talented producers NOTE: Efficiency Ratio represents the ratio of noninterest expense less other real estate owned operations, core deposit intangible amortization and non-recurring merger related expense to the sum of net interest income before provision for loan losses and total noninterest income less gains/(loss) on sale of securities, other-than-temporary impairment recovery (loss) on investment securities, and gain on FDIC-assisted transactions. Noninterest expense excludes merger related costs. 64.7% 64.1% 60.0% 58.6% 64.7% 61.35% 55.89% 0.0% 10.0% 20.0% 30.0% 40.0% 50.0% 60.0% 70.0% 80.0% 90.0% 100.0% FY 2009 FY 2010 FY 2011 FY 2012 FY 2013 FY 2014 FY 2015 2.14% 2.38% 2.85% 3.07% 3.04% 2.93% 2.64% 0.00% 1.00% 2.00% 3.00% 4.00% 5.00% FY 2009 FY 2010 FY 2011 FY 2012 FY 2013 FY 2014 FY 2015
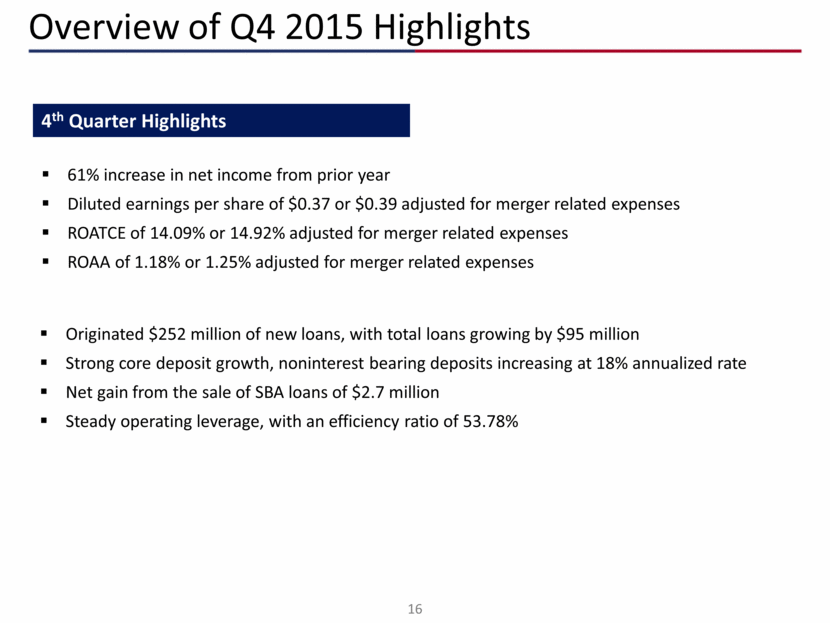
Overview of Q4 2015 Highlights 61% increase in net income from prior year Diluted earnings per share of $0.37 or $0.39 adjusted for merger related expenses ROATCE of 14.09% or 14.92% adjusted for merger related expenses ROAA of 1.18% or 1.25% adjusted for merger related expenses 4th Quarter Highlights Originated $252 million of new loans, with total loans growing by $95 million Strong core deposit growth, noninterest bearing deposits increasing at 18% annualized rate Net gain from the sale of SBA loans of $2.7 million Steady operating leverage, with an efficiency ratio of 53.78%
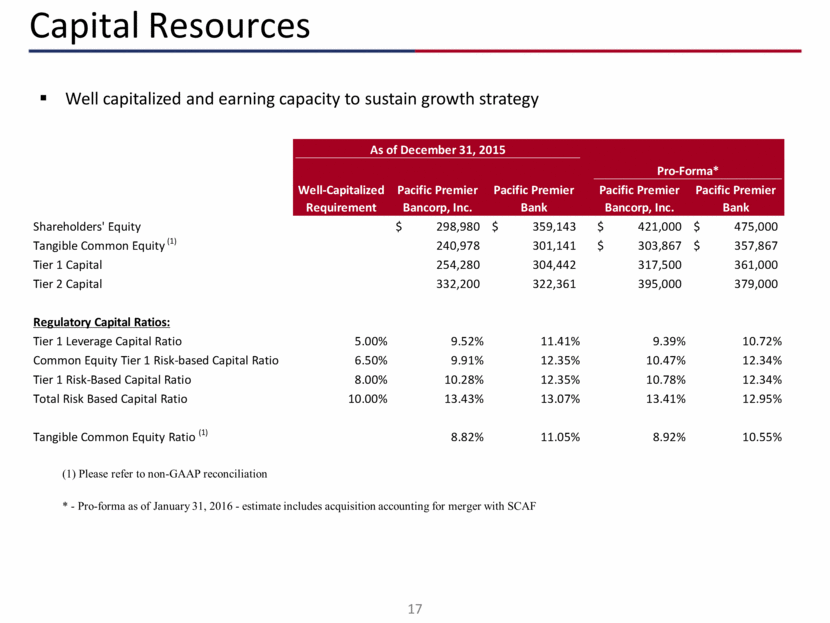
Capital Resources Well capitalized and earning capacity to sustain growth strategy (1) Please refer to non-GAAP reconciliation * - Pro-forma as of January 31, 2016 - estimate includes acquisition accounting for merger with SCAF As of December 31, 2015 Pro-Forma* Well-Capitalized Requirement Pacific Premier Bancorp, Inc. Pacific Premier Bank Pacific Premier Bancorp, Inc. Pacific Premier Bank Shareholders' Equity $ 298,980 $ 359,143 $ 421,000 $ 475,000 Tangible Common Equity (1) 240,978 301,141 $ 303,867 $ 357,867 Tier 1 Capital 254,280 304,442 317,500 361,000 Tier 2 Capital 332,200 322,361 395,000 379,000 Regulatory Capital Ratios: Tier 1 Leverage Capital Ratio 5.00% 9.52% 11.41% 9.39% 10.72% Common Equity Tier 1 Risk-based Capital Ratio 6.50% 9.91% 12.35% 10.47% 12.34% Tier 1 Risk-Based Capital Ratio 8.00% 10.28% 12.35% 10.78% 12.34% Total Risk Based Capital Ratio 10.00% 13.43% 13.07% 13.41% 12.95% Tangible Common Equity Ratio (1) 8.82% 11.05% 8.92% 10.55%
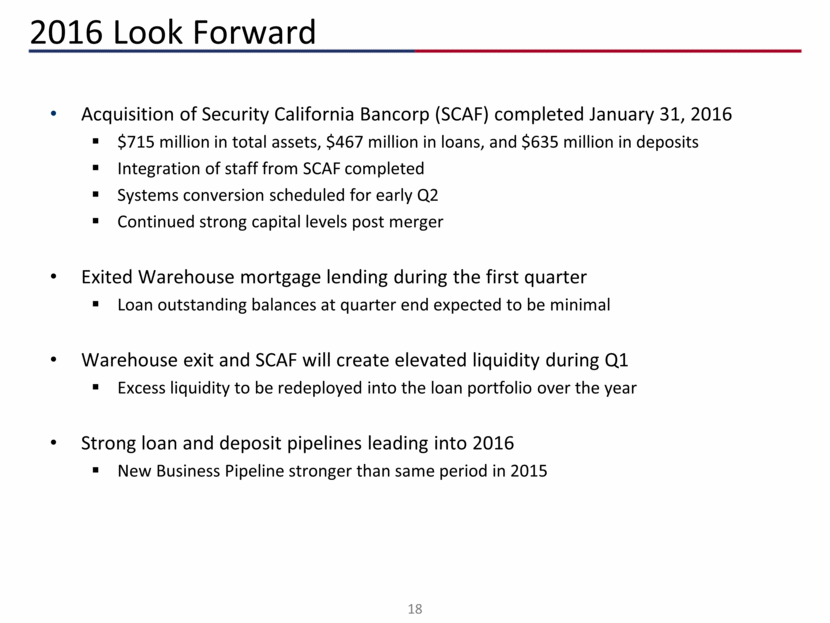
2016 Look Forward Acquisition of Security California Bancorp (SCAF) completed January 31, 2016 $715 million in total assets, $467 million in loans, and $635 million in deposits Integration of staff from SCAF completed Systems conversion scheduled for early Q2 Continued strong capital levels post merger Exited Warehouse mortgage lending during the first quarter Loan outstanding balances at quarter end expected to be minimal Warehouse exit and SCAF will create elevated liquidity during Q1 Excess liquidity to be redeployed into the loan portfolio over the year Strong loan and deposit pipelines leading into 2016 New Business Pipeline stronger than same period in 2015
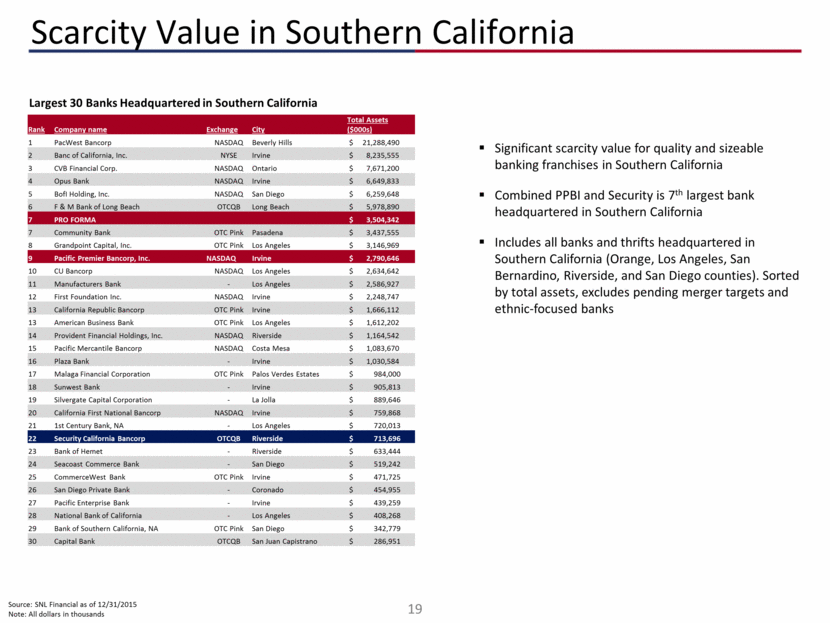
Scarcity Value in Southern California Source: SNL Financial as of 12/31/2015 Note: All dollars in thousands Significant scarcity value for quality and sizeable banking franchises in Southern California Combined PPBI and Security is 7th largest bank headquartered in Southern California Includes all banks and thrifts headquartered in Southern California (Orange, Los Angeles, San Bernardino, Riverside, and San Diego counties). Sorted by total assets, excludes pending merger targets and ethnic-focused banks Largest 30 Banks Headquartered in Southern California Rank Company name Exchange City Total Assets ($000s) 1 PacWest Bancorp NASDAQ Beverly Hills $ 21,288,490 2 Banc of California, Inc. NYSE Irvine $ 8,235,555 3 CVB Financial Corp. NASDAQ Ontario $ 7,671,200 4 Opus Bank NASDAQ Irvine $ 6,649,833 5 BofI Holding, Inc. NASDAQ San Diego $ 6,259,648 6 F & M Bank of Long Beach OTCQB Long Beach $ 5,978,890 7 PRO FORMA $ 3,504,342 7 Community Bank OTC Pink Pasadena $ 3,437,555 8 Grandpoint Capital, Inc. OTC Pink Los Angeles $ 3,146,969 9 Pacific Premier Bancorp, Inc. NASDAQ Irvine $ 2,790,646 10 CU Bancorp NASDAQ Los Angeles $ 2,634,642 11 Manufacturers Bank - Los Angeles $ 2,586,927 12 First Foundation Inc. NASDAQ Irvine $ 2,248,747 13 California Republic Bancorp OTC Pink Irvine $ 1,666,112 13 American Business Bank OTC Pink Los Angeles $ 1,612,202 14 Provident Financial Holdings, Inc. NASDAQ Riverside $ 1,164,542 15 Pacific Mercantile Bancorp NASDAQ Costa Mesa $ 1,083,670 16 Plaza Bank - Irvine $ 1,030,584 17 Malaga Financial Corporation OTC Pink Palos Verdes Estates $ 984,000 18 Sunwest Bank - Irvine $ 905,813 19 Silvergate Capital Corporation - La Jolla $ 889,646 20 California First National Bancorp NASDAQ Irvine $ 759,868 21 1st Century Bank, NA - Los Angeles $ 720,013 22 Security California Bancorp OTCQB Riverside $ 713,696 23 Bank of Hemet - Riverside $ 633,444 24 Seacoast Commerce Bank - San Diego $ 519,242 25 CommerceWest Bank OTC Pink Irvine $ 471,725 26 San Diego Private Bank - Coronado $ 454,955 27 Pacific Enterprise Bank - Irvine $ 439,259 28 National Bank of California - Los Angeles $ 408,268 29 Bank of Southern California, NA OTC Pink San Diego $ 342,779 30 Capital Bank OTCQB San Juan Capistrano $ 286,951
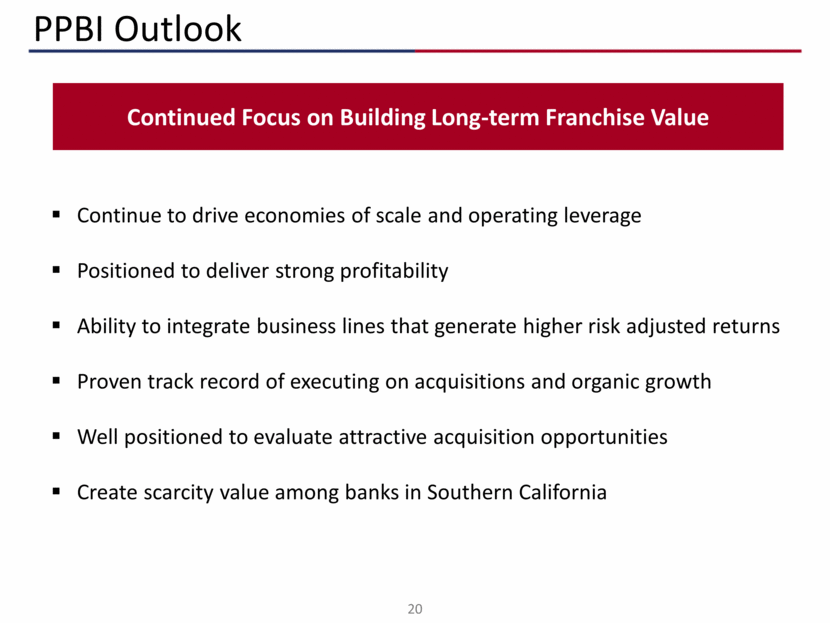
Continue to drive economies of scale and operating leverage Positioned to deliver strong profitability Ability to integrate business lines that generate higher risk adjusted returns Proven track record of executing on acquisitions and organic growth Well positioned to evaluate attractive acquisition opportunities Create scarcity value among banks in Southern California PPBI Outlook Continued Focus on Building Long-term Franchise Value
Appendix material PPBI Supplemental Information
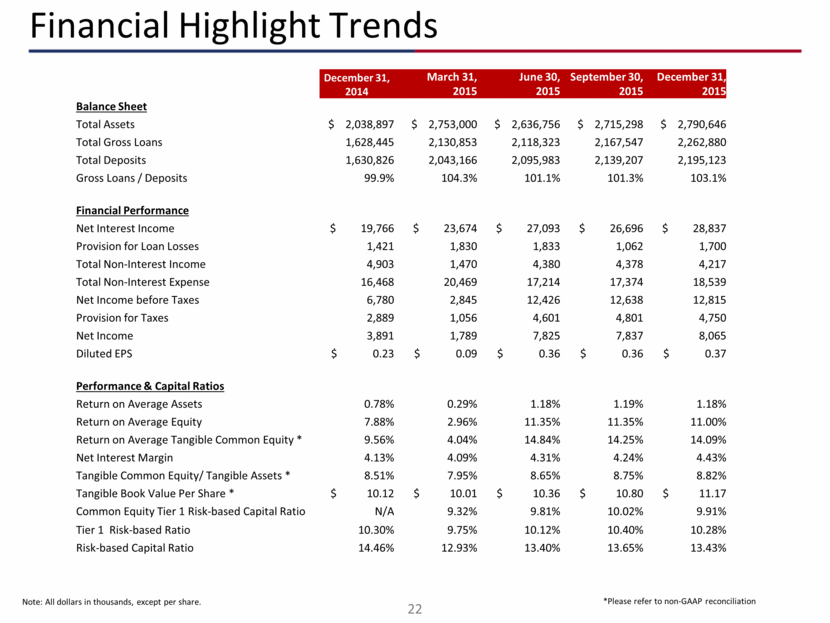
Financial Highlight Trends Note: All dollars in thousands, except per share. *Please refer to non-GAAP reconciliation December 31, 2014 March 31, 2015 June 30, 2015 September 30, 2015 December 31, 2015 Balance Sheet Total Assets $ 2,038,897 $ 2,753,000 $ 2,636,756 $ 2,715,298 $ 2,790,646 Total Gross Loans 1,628,445 2,130,853 2,118,323 2,167,547 2,262,880 Total Deposits 1,630,826 2,043,166 2,095,983 2,139,207 2,195,123 Gross Loans / Deposits 99.9% 104.3% 101.1% 101.3% 103.1% Financial Performance Net Interest Income $ 19,766 $ 23,674 $ 27,093 $ 26,696 $ 28,837 Provision for Loan Losses 1,421 1,830 1,833 1,062 1,700 Total Non-Interest Income 4,903 1,470 4,380 4,378 4,217 Total Non-Interest Expense 16,468 20,469 17,214 17,374 18,539 Net Income before Taxes 6,780 2,845 12,426 12,638 12,815 Provision for Taxes 2,889 1,056 4,601 4,801 4,750 Net Income 3,891 1,789 7,825 7,837 8,065 Diluted EPS $ 0.23 $ 0.09 $ 0.36 $ 0.36 $ 0.37 Performance & Capital Ratios Return on Average Assets 0.78% 0.29% 1.18% 1.19% 1.18% Return on Average Equity 7.88% 2.96% 11.35% 11.35% 11.00% Return on Average Tangible Common Equity * 9.56% 4.04% 14.84% 14.25% 14.09% Net Interest Margin 4.13% 4.09% 4.31% 4.24% 4.43% Tangible Common Equity/ Tangible Assets * 8.51% 7.95% 8.65% 8.75% 8.82% Tangible Book Value Per Share * $ 10.12 $ 10.01 $ 10.36 $ 10.80 $ 11.17 Common Equity Tier 1 Risk-based Capital Ratio N/A 9.32% 9.81% 10.02% 9.91% Tier 1 Risk-based Ratio 10.30% 9.75% 10.12% 10.40% 10.28% Risk-based Capital Ratio 14.46% 12.93% 13.40% 13.65% 13.43%
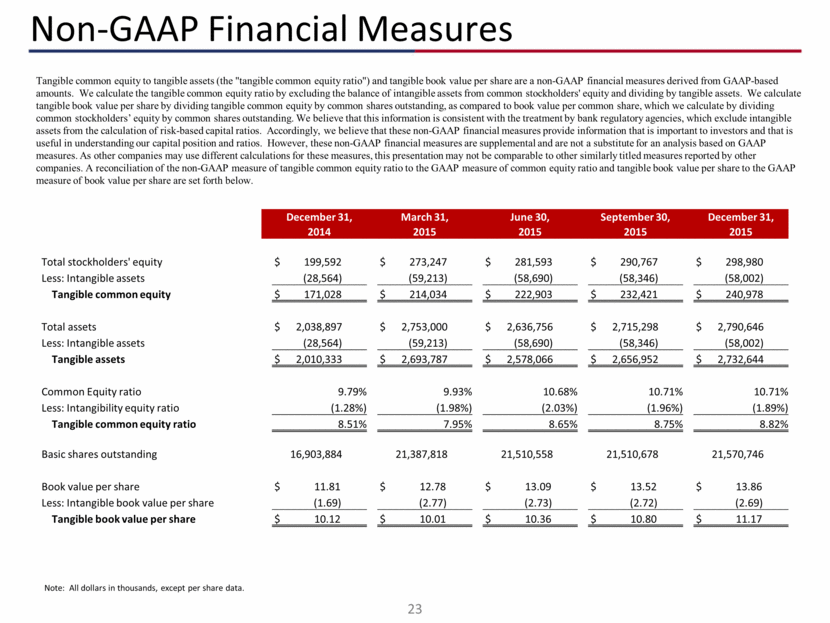
Non-GAAP Financial Measures Tangible common equity to tangible assets (the "tangible common equity ratio") and tangible book value per share are a non-GAAP financial measures derived from GAAP-based amounts. We calculate the tangible common equity ratio by excluding the balance of intangible assets from common stockholders' equity and dividing by tangible assets. We calculate tangible book value per share by dividing tangible common equity by common shares outstanding, as compared to book value per common share, which we calculate by dividing common stockholders’ equity by common shares outstanding. We believe that this information is consistent with the treatment by bank regulatory agencies, which exclude intangible assets from the calculation of risk-based capital ratios. Accordingly, we believe that these non-GAAP financial measures provide information that is important to investors and that is useful in understanding our capital position and ratios. However, these non-GAAP financial measures are supplemental and are not a substitute for an analysis based on GAAP measures. As other companies may use different calculations for these measures, this presentation may not be comparable to other similarly titled measures reported by other companies. A reconciliation of the non-GAAP measure of tangible common equity ratio to the GAAP measure of common equity ratio and tangible book value per share to the GAAP measure of book value per share are set forth below. Note: All dollars in thousands, except per share data. December 31, March 31, June 30, September 30, December 31, 2014 2015 2015 2015 2015 Total stockholders' equity $ 199,592 $ 273,247 $ 281,593 $ 290,767 $ 298,980 Less: Intangible assets (28,564) (59,213) (58,690) (58,346) (58,002) Tangible common equity $ 171,028 $ 214,034 $ 222,903 $ 232,421 $ 240,978 Total assets $ 2,038,897 $ 2,753,000 $ 2,636,756 $ 2,715,298 $ 2,790,646 Less: Intangible assets (28,564) (59,213) (58,690) (58,346) (58,002) Tangible assets $ 2,010,333 $ 2,693,787 $ 2,578,066 $ 2,656,952 $ 2,732,644 Common Equity ratio 9.79% 9.93% 10.68% 10.71% 10.71% Less: Intangibility equity ratio (1.28%) (1.98%) (2.03%) (1.96%) (1.89%) Tangible common equity ratio 8.51% 7.95% 8.65% 8.75% 8.82% Basic shares outstanding 16,903,884 21,387,818 21,510,558 21,510,678 21,570,746 Book value per share $ 11.81 $ 12.78 $ 13.09 $ 13.52 $ 13.86 Less: Intangible book value per share (1.69) (2.77) (2.73) (2.72) (2.69) Tangible book value per share $ 10.12 $ 10.01 $ 10.36 $ 10.80 $ 11.17
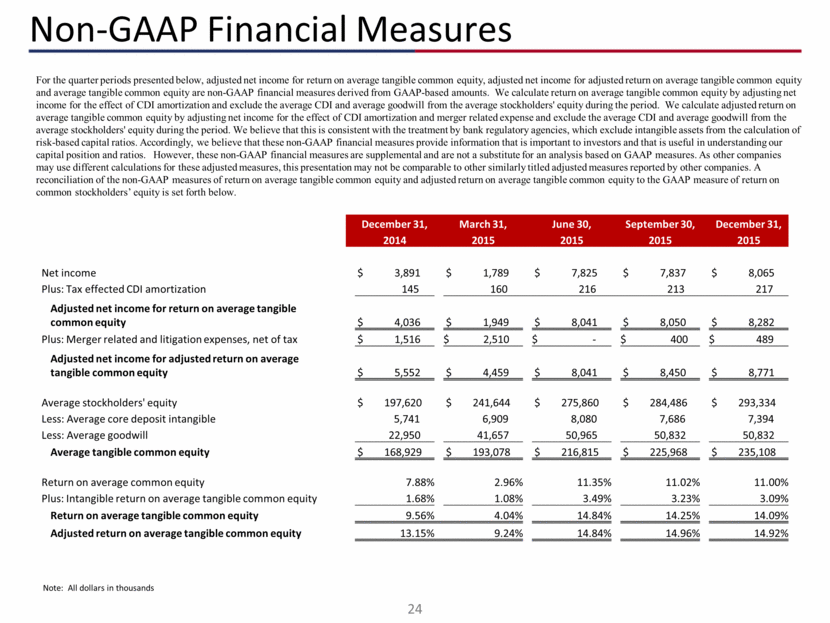
Non-GAAP Financial Measures For the quarter periods presented below, adjusted net income for return on average tangible common equity, adjusted net income for adjusted return on average tangible common equity and average tangible common equity are non-GAAP financial measures derived from GAAP-based amounts. We calculate return on average tangible common equity by adjusting net income for the effect of CDI amortization and exclude the average CDI and average goodwill from the average stockholders' equity during the period. We calculate adjusted return on average tangible common equity by adjusting net income for the effect of CDI amortization and merger related expense and exclude the average CDI and average goodwill from the average stockholders' equity during the period. We believe that this is consistent with the treatment by bank regulatory agencies, which exclude intangible assets from the calculation of risk-based capital ratios. Accordingly, we believe that these non-GAAP financial measures provide information that is important to investors and that is useful in understanding our capital position and ratios. However, these non-GAAP financial measures are supplemental and are not a substitute for an analysis based on GAAP measures. As other companies may use different calculations for these adjusted measures, this presentation may not be comparable to other similarly titled adjusted measures reported by other companies. A reconciliation of the non-GAAP measures of return on average tangible common equity and adjusted return on average tangible common equity to the GAAP measure of return on common stockholders’ equity is set forth below. Note: All dollars in thousands December 31, March 31, June 30, September 30, December 31, 2014 2015 2015 2015 2015 Net income $ 3,891 $ 1,789 $ 7,825 $ 7,837 $ 8,065 Plus: Tax effected CDI amortization 145 160 216 213 217 Adjusted net income for return on average tangible common equity $ 4,036 $ 1,949 $ 8,041 $ 8,050 $ 8,282 Plus: Merger related and litigation expenses, net of tax $ 1,516 $ 2,510 $ - $ 400 $ 489 Adjusted net income for adjusted return on average tangible common equity $ 5,552 $ 4,459 $ 8,041 $ 8,450 $ 8,771 Average stockholders' equity $ 197,620 $ 241,644 $ 275,860 $ 284,486 $ 293,334 Less: Average core deposit intangible 5,741 6,909 8,080 7,686 7,394 Less: Average goodwill 22,950 41,657 50,965 50,832 50,832 Average tangible common equity $ 168,929 $ 193,078 $ 216,815 $ 225,968 $ 235,108 Return on average common equity 7.88% 2.96% 11.35% 11.02% 11.00% Plus: Intangible return on average tangible common equity 1.68% 1.08% 3.49% 3.23% 3.09% Return on average tangible common equity 9.56% 4.04% 14.84% 14.25% 14.09% Adjusted return on average tangible common equity 13.15% 9.24% 14.84% 14.96% 14.92%
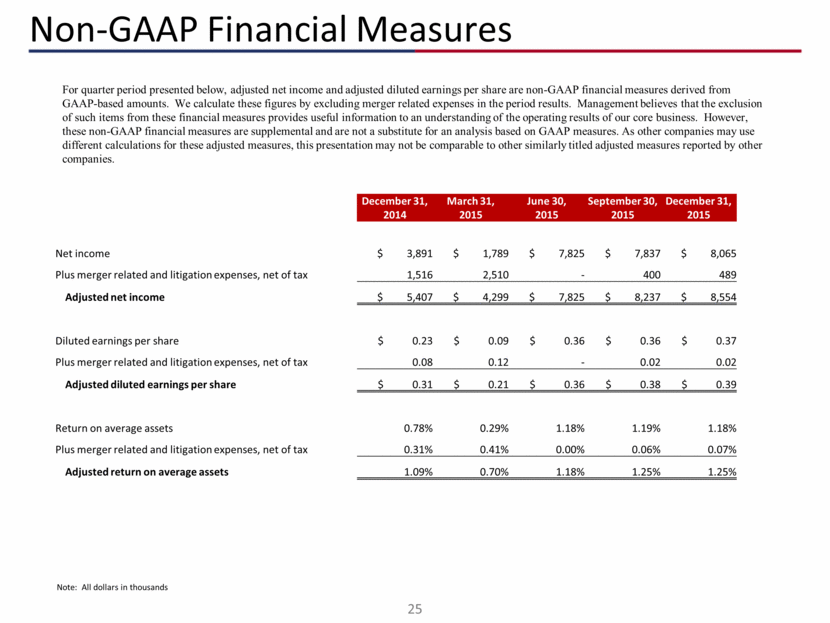
Non-GAAP Financial Measures Note: All dollars in thousands For quarter period presented below, adjusted net income and adjusted diluted earnings per share are non-GAAP financial measures derived from GAAP-based amounts. We calculate these figures by excluding merger related expenses in the period results. Management believes that the exclusion of such items from these financial measures provides useful information to an understanding of the operating results of our core business. However, these non-GAAP financial measures are supplemental and are not a substitute for an analysis based on GAAP measures. As other companies may use different calculations for these adjusted measures, this presentation may not be comparable to other similarly titled adjusted measures reported by other companies. December 31, 2014 March 31, 2015 June 30, 2015 September 30, 2015 December 31, 2015 Net income $ 3,891 $ 1,789 $ 7,825 $ 7,837 $ 8,065 Plus merger related and litigation expenses, net of tax 1,516 2,510 - 400 489 Adjusted net income $ 5,407 $ 4,299 $ 7,825 $ 8,237 $ 8,554 Diluted earnings per share $ 0.23 $ 0.09 $ 0.36 $ 0.36 $ 0.37 Plus merger related and litigation expenses, net of tax 0.08 0.12 - 0.02 0.02 Adjusted diluted earnings per share $ 0.31 $ 0.21 $ 0.36 $ 0.38 $ 0.39 Return on average assets 0.78% 0.29% 1.18% 1.19% 1.18% Plus merger related and litigation expenses, net of tax 0.31% 0.41% 0.00% 0.06% 0.07% Adjusted return on average assets 1.09% 0.70% 1.18% 1.25% 1.25%