Attached files
| file | filename |
|---|---|
| EX-10.11(B) - EXHIBIT 10.11(B) - BANK MUTUAL CORP | v432767_ex10-11b.htm |
| EX-32.2 - EXHIBIT 32.2 - BANK MUTUAL CORP | v432767_ex32-2.htm |
| EX-21.1 - EXHIBIT 21.1 - BANK MUTUAL CORP | v432767_ex21-1.htm |
| EX-23.1 - EXHIBIT 23.1 - BANK MUTUAL CORP | v432767_ex23-1.htm |
| EX-31.2 - EXHIBIT 31.2 - BANK MUTUAL CORP | v432767_ex31-2.htm |
| EX-31.1 - EXHIBIT 31.1 - BANK MUTUAL CORP | v432767_ex31-1.htm |
| EX-32.1 - EXHIBIT 32.1 - BANK MUTUAL CORP | v432767_ex32-1.htm |
SECURITIES AND EXCHANGE COMMISSION
Washington, D.C. 20549
FORM 10-K
ANNUAL REPORT PURSUANT TO SECTION 13 OR 15(d) OF THE SECURITIES EXCHANGE ACT OF 1934
For the fiscal year ended December 31, 2015
Commission file number: 000-31207
BANK MUTUAL CORPORATION
(Exact name of registrant as specified in its charter)
| Wisconsin | 39-2004336 |
| (State or other jurisdiction of incorporation or organization) | (I.R.S. Employer Identification No.) |
| 4949 West Brown Deer Road, Milwaukee, Wisconsin | 53223 |
| (Address of principal executive offices) | (Zip Code) |
Registrant's telephone number, including area code: (414) 354-1500
Securities registered pursuant to Section 12(b) of the Act:
| Common Stock, $0.01 Par Value | The NASDAQ Stock Market LLC |
| (Title of each class) | (Name of each exchange on which registered) |
Securities registered pursuant to Section 12(g) of the Act:
NONE
Indicate by check mark if the registrant is a well-known seasoned issuer, as defined in Rule 405 of the Securities Act
Yes ¨ No x
Indicate by check mark if the registrant is not required to file reports pursuant to Section 13 or Section 15(d) of the Act.
Yes ¨ No x
Indicate by check mark whether the registrant (1) has filed all reports required to be filed by Section 13 or 15(d) of the Securities Exchange Act of 1934 during the preceding 12 months (or for such shorter period that the registrant was required to file such reports), and (2) has been subject to such filing requirements for the past 90 days.
Yes x No ¨
Indicate by check mark if disclosure of delinquent filers pursuant to Item 405 of Regulation S-K is not contained herein, and will not be contained, to the best of registrant's knowledge, in definitive proxy or information statements incorporated by reference in Part III of this Form 10-K or any amendment to this Form 10-K. ¨
Indicate by check mark whether the registrant has submitted electronically and posted on its corporate website, if any, every Interactive Data File required to be submitted and posted pursuant to Rule 405 of Regulation S-T (§232.405 of this chapter) during the preceding 12 months (or for such shorter period that the registrant was required to submit and post such files.)
Yes x No ¨
Indicate by check mark whether the registrant is a large accelerated filer, an accelerated filer, a non-accelerated filer, or a smaller reporting company. See the definitions of “large accelerated filer,” “accelerated filer” and “smaller reporting company” in Rule 12b-2 of the Exchange Act.
| Large accelerated filer | ¨ | Accelerated filer | x | Non-accelerated filer | ¨ | Smaller reporting company | ¨ |
Indicate by check mark whether the registrant is a shell company (as defined in Rule 12b-2 of the act).
Yes ¨ No x
As of February 29, 2016, 45,575,567 shares of Common Stock were validly issued and outstanding. The aggregate market value of the Common Stock (based upon the $7.67 last sale price on The NASDAQ Global Select Market on June 30, 2015, the last trading date of the Company’s second fiscal quarter) held by non-affiliates (excluding outstanding shares reported as beneficially owned by directors and executive officers; does not constitute an admission as to affiliate status) was approximately $327.1 million.
| Part of Form 10-K Into Which | ||
| Documents Incorporated by Reference | Portions of Document are Incorporated | |
| Proxy Statement for Annual Meeting of Shareholders on May 2, 2016 | Part III |
BANK MUTUAL CORPORATION
FORM 10-K ANNUAL REPORT TO
THE SECURITIES AND EXCHANGE COMMISSION
FOR THE YEAR ENDED DECEMBER 31, 2015
Table of Contents
| 2 |
Cautionary Statement
This report contains or incorporates by reference various forward-looking statements concerning the Company's prospects that are based on the current expectations and beliefs of management. Forward-looking statements may contain, and are intended to be identified by, words such as “anticipate,” “believe,” “estimate,” “expect,” “objective,” “projection,” “intend,” and similar expressions; the use of verbs in the future tense and discussions of periods after the date on which this report is issued are also forward-looking statements. The statements contained herein and such future statements involve or may involve certain assumptions, risks, and uncertainties, many of which are beyond the Company's control, that could cause the Company's actual results and performance to differ materially from what is stated or expected. In addition to the assumptions and other factors referenced specifically in connection with such statements, the following factors could impact the business and financial prospects of the Company: general economic conditions, including volatility in credit, lending, and financial markets; weakness and declines in the real estate market, which could affect both collateral values and loan activity; periods of relatively high unemployment or economic weakness and other factors which could affect borrowers’ ability to repay their loans; negative developments affecting particular borrowers, which could further adversely impact loan repayments and collection; legislative and regulatory initiatives and changes, including action taken, or that may be taken, in response to difficulties in financial markets and/or which could negatively affect the rights of creditors; monetary and fiscal policies of the federal government; the effects of further regulation and consolidation within the financial services industry; regulators’ strict expectations for financial institutions’ capital levels and restrictions imposed on institutions, as to payments of dividends, share repurchases, or otherwise, to maintain or achieve those levels; recent, pending, and/or potential rulemaking or other actions by the Consumer Financial Protection Bureau (“CFPB”) and other regulatory or other actions affecting the Company or the Bank; increased competition and/or disintermediation within the financial services industry; changes in tax rates, deductions and/or policies; potential further changes in Federal Deposit Insurance Corporation (“FDIC”) premiums and other governmental assessments; changes in deposit flows; changes in the cost of funds; fluctuations in general market rates of interest and/or yields or rates on competing loans, investments, and sources of funds; demand for loan or deposit products; illiquidity of financial markets and other negative developments affecting particular investment and mortgage-related securities, which could adversely impact the fair value of and/or cash flows from such securities; changes in customers’ demand for other financial services; the Company’s potential inability to carry out business plans or strategies; changes in accounting policies or guidelines; natural disasters, acts of terrorism, or developments in the war on terrorism or other global conflicts; the risk of failures in computer or other technology systems or data maintenance, or breaches of security relating to such systems; and the factors discussed in “Item 1A. Risk Factors,” as well as “Item 7. Management's Discussion and Analysis of Financial Condition and Results of Operations.”
The discussion in this section should be read in conjunction with “Item 1A. Risk Factors,” “Item 7. Management’s Discussion and Analysis of Financial Condition and Results of Operations,” “Item 7A. Quantitative and Qualitative Disclosures about Market Risk,” and “Item 8. Financial Statements and Supplementary Data.”
General
Bank Mutual Corporation (the “Company”) is a Wisconsin corporation headquartered in Milwaukee, Wisconsin. The Company owns 100% of the common stock of Bank Mutual (the “Bank”) and currently engages in no substantial activities other than its ownership of such stock. Consequently, the Company’s net income and cash flows are derived primarily from the Bank’s operations and capital distributions. The Company is regulated as a savings and loan holding company by the Board of Governors of the Federal Reserve (“FRB”). The Company’s common stock trades on The NASDAQ Global Select Market under the symbol BKMU.
The Bank was founded in 1892 and is a federally-chartered savings bank headquartered in Milwaukee, Wisconsin. It is regulated by the Office of the Comptroller of the Currency (“OCC”) and its deposits are insured within limits established by the FDIC. The Bank's primary business is community banking, which includes attracting deposits from and making loans to the general public and private businesses, as well as governmental and non-profit entities. In addition to deposits, the Bank obtains funds through borrowings from the Federal Home Loan Bank (“FHLB”) of Chicago. These funding sources are principally used to originate loans, including commercial and industrial loans, multi-family residential loans, non-residential commercial real estate loans, one- to four-family loans, home equity loans, and other consumer loans. From time-to-time the Bank also purchases and/or participates in loans from third-party financial institutions and is an active seller of residential loans in the secondary market. It also invests in mortgage-related and other investment securities.
| 3 |
The Company’s principal executive office is located at 4949 Brown Deer Road, Milwaukee, Wisconsin, 53223, and its telephone number at that location is (414) 354-1500. The Company’s website is www.bankmutualcorp.com. The Company will make available through that website, free of charge, its Annual Reports on Form 10-K, Quarterly Reports on Form 10-Q, Current Reports on Form 8-K, and amendments to those reports, as soon as reasonably practical after the Company files those reports with, or furnishes them to, the Securities and Exchange Commission (“SEC”). Also available on the Company’s website are various documents relating to the corporate governance of the Company, including its Code of Ethics and its Code of Conduct.
Market Area
At December 31, 2015, the Company had 68 banking offices in Wisconsin and one in Minnesota. The Company is the third largest financial institution headquartered in Wisconsin based on total assets and the fourth largest based on deposit market share. At June 30, 2015, the Company had a 1.26% market share of all deposits held by FDIC-insured institutions in Wisconsin.
The largest concentration of the Company’s offices is in southeastern Wisconsin, consisting of the Milwaukee Metropolitan Statistical Area (“MSA”), and Racine and Kenosha Counties. The Company has 25 offices in these areas. The Company also has five offices in south central Wisconsin, consisting of the Madison MSA and the Janesville/Beloit MSA, as well as six other offices in communities in east central Wisconsin. The Company also operates 18 banking offices in northeastern Wisconsin, including the Green Bay MSA. Finally, the Company has 14 offices in northwestern Wisconsin, including the Eau Claire MSA, and one office in Woodbury, Minnesota, which is part of the Minneapolis-St. Paul MSA. A number of the Company’s banking offices are located near the northern Michigan and Illinois borders. Therefore, the Company may also draw customers from nearby regions in those states.
The services provided through the Company's banking offices are supplemented by services offered through ATMs located in the Company’s market areas, as well as internet and mobile banking, remote deposit capture, a customer service call center, and 24-hour telephone banking.
In March 2016 the Company expects to complete the consolidation of four banking offices into nearby offices, which will reduce the total number of its offices to 65. One of these offices is located in the Milwaukee MSA, one is located in the Eau Claire MSA, one is located in northeastern Wisconsin, and one is located in east central Wisconsin. The Company expects that it will continue to provide products and services to the affected customers through its other nearby locations, as well as its internet, mobile banking, remote deposit capture, and telephone channels. For additional discussion, refer to “Results of Operations—Non-Interest Expense” in “Item 7. Management's Discussion and Analysis of Financial Condition and Results of Operations.”
Competition
The Company faces significant competition in attracting deposits, making loans, and selling other financial products and services. Wisconsin has many banks, savings banks, savings and loan associations, and tax-exempt credit unions, which offer the same types of banking products and services as the Company. The Company also faces competition from other types of financial service companies, such as mortgage brokerage firms, finance companies, insurance companies, investment brokerage firms, and mutual funds. As a result of electronic commerce, the Company also competes with financial service providers outside of Wisconsin.
Lending Activities
General At December 31, 2015, the Company’s total loans receivable was $1.7 billion or 69.5% of total assets. The Company’s loan portfolio consists of loans to both commercial and retail borrowers. Loans to commercial borrowers include loans secured by real estate such as multi-family properties, non-residential commercial properties (referred to as “commercial real estate”), and construction and development projects secured by these same types of properties, as well as land. In addition, commercial loans include loans to businesses that are not secured by real estate (referred to as “commercial and industrial loans”). Loans to retail borrowers include loans to individuals that are secured by real estate such as one- to four-family first mortgages, home equity term loans, and home equity lines of credit. In addition, retail loans include student loans, automobile loans, and other loans not secured by real estate (collectively referred to as “other consumer loans”).
| 4 |
The nature, type, and terms of loans originated or purchased by the Company are subject to federal and state laws and regulations. The Company has no significant concentrations of loans to particular borrowers or to borrowers engaged in similar activities. In addition, the Company limits its lending activities primarily to borrowers and related loan collateral located in its primary market areas, which consist of Wisconsin and contiguous regions of Illinois, Minnesota, and northern Michigan. However, from time-to-time the Company will make loans secured by properties outside of its primary market areas provided the borrowers are located within such areas and are well-known to the Company. For specific information related to the Company’s loans receivable for the periods covered by this report, refer to “Financial Condition—Loans Receivable” in “Item 7. Management’s Discussion and Analysis of Financial Condition and Results of Operations.”
Commercial and Industrial Loans At December 31, 2015, the Company’s portfolio of commercial and industrial loans was $235.3 million or 11.8% of its gross loans receivable. This portfolio consists of loans and lines of credit to businesses for equipment purchases, working capital, debt refinancing or restructuring, business acquisition or expansion, Small Business Administration (“SBA”) loans, and domestic standby letters of credit. The unfunded portion of approved commercial and industrial lines of credit and letters of credit was $175.0 million as of December 31, 2015. Typically, commercial and industrial loans are secured by general business security agreements and personal guarantees. The Company offers variable, adjustable, and fixed-rate commercial and industrial loans. The Company also has commercial and industrial loans that have an initial period where interest rates are fixed, generally for one to five years, and thereafter are adjustable based on various market indices. Fixed-rate loans are priced at either a margin over various market indices with maturities that correspond to the maturities of the notes or to match competitive conditions and yield requirements. Term loans are generally amortized over a three to seven year period. Commercial lines of credit generally have a term of one year and are subject to annual renewal thereafter. The Company performs an annual credit review of all commercial and industrial borrowers having an exposure to the Company of $500,000 or more.
Multi-family and Commercial Real Estate Loans At December 31, 2015, the Company’s aggregate portfolio of multi-family and commercial real estate loans was $709.2 million or 35.5% of its gross loans receivable. The Company’s multi-family and commercial real estate loan portfolios consist of fixed-rate and adjustable-rate loans originated at prevailing market rates usually tied to various market indices. This portfolio generally consists of loans secured by apartment buildings, office buildings, retail centers, warehouses, and industrial buildings. Loans in this portfolio may be secured by either owner or non-owner occupied properties. Loans in this portfolio typically do not exceed 80% of the lesser of the purchase price or an independent appraisal by an appraiser designated by the Company. Loans originated with balloon maturities are generally amortized on a 25 to 30 year basis with a typical balloon term of 3 to 5 years. However, if a multi-family or commercial real estate borrower desires a fixed-rate loan with a balloon maturity beyond five years, the Company generally requires the borrower to commit to an adjustable-rate loan that is converted back into a fixed-rate exposure through an interest rate swap agreement between the Company and the borrower. The Company then enters into an offsetting interest rate swap agreement with a third-party financial institution that converts the Company’s interest rate risk exposure back into a floating-rate exposure. The Company will generally record fee income related to the difference in the fair values of the respective interest rate swaps on the date of the transaction. Refer to “Financial Derivatives,” below, for additional discussion.
Loans secured by multi-family and commercial real estate are granted based on the income producing potential of the property, the financial strength and/or income producing potential of the borrower, and the appraised value of the property. In most cases, the Company also obtains personal guarantees from the principals involved, the assessment of which is also based on financial strength and/or income producing potential. The Company’s approval process includes a review of the other debt obligations and overall sources of cash flow available to the borrower and guarantors. The property’s expected net operating income must be sufficient to cover the payments relating to the outstanding debt. The Company generally requires an assignment of rents or leases to be assured that the cash flow from the property will be used to repay the debt. Appraisals on properties securing multi-family and larger commercial real estate loans are performed by independent state certified or licensed fee appraisers approved by the board of directors. Title and hazard insurance are required as well as flood insurance, if applicable. Environmental assessments are performed on certain multi-family and commercial real estate loans in excess of $1.0 million, as well as all loans secured by certain properties that the Company considers to be “environmentally sensitive.” In addition, the Company performs an annual credit review of its multi-family and commercial real estate loans over $500,000.
| 5 |
Loans secured by multi-family and commercial real estate properties are generally larger and involve a greater degree of credit risk than one- to four-family residential mortgage loans. Such loans typically involve large balances to single borrowers or groups of related borrowers. The Bank has internal lending limits to single borrowers or a group of related borrowers that are adjusted from time-to-time, but are generally well below the Bank’s legal lending limit of approximately $41 million as of December 31, 2015. Because payments on loans secured by multi-family and commercial real estate properties are often dependent on the successful operation or management of the properties, repayment of such loans may be subject to adverse conditions in the real estate market or the economy. Furthermore, borrowers’ problems in areas unrelated to the properties that secure the Company’s loans may have an adverse impact on such borrowers’ ability to comply with the terms of the Company’s loans.
Construction and Development Loans At December 31, 2015, the Company’s portfolio of construction and development loans was $330.7 million or 16.6% of its gross loans receivable. In addition, the unfunded portion of approved construction and development loans was $212.7 million as of that same date. Construction and development loans typically have terms of 18 to 24 months, are interest-only, and carry variable interest rates tied to a market index. Disbursements on these loans are based on draw requests supported by appropriate lien waivers. Construction loans typically convert to permanent loans at the completion of a project, but may or may not remain in the Company’s loan portfolio depending on the competitive environment for permanent financing at the end of the construction term. Development loans are typically repaid as the underlying lots or housing units are sold. Construction and development loans are generally considered to involve a higher degree of risk than mortgage loans on completed properties. The Company's risk of loss on a construction and development loan is dependent largely upon the accuracy of the initial estimate of the property's value at completion of construction, the estimated cost of construction, the appropriate application of loan proceeds to the work performed, the borrower's ability to advance additional construction funds if necessary, and the stabilization period for lease-up after the completion of construction. In addition, in the event a borrower defaults on the loan during its construction phase, the construction project often needs to be completed before the full value of the collateral can be realized by the Company. The Company performs an annual credit review of its construction and development loans over $500,000.
Residential Mortgage Loans At December 31, 2015, the Company’s portfolio of one- to four-family first mortgage loans was $504.2 million or 25.2% of its gross loans receivable. In addition, the unfunded portion of approved construction loans was $25.4 million as of that same date. Most of these loans are for owner-occupied residences; however, the Company also originates first mortgage loans secured by second homes, seasonal homes, and investment properties.
The Company originates primarily conventional fixed-rate residential mortgage loans and adjustable-rate residential mortgage (“ARM”) loans with maturity dates up to 30 years. Such loans generally are underwritten to the Federal National Mortgage Association (“Fannie Mae”) and other regulatory standards, including those specified in the Dodd-Frank Wall Street Reform and Consumer Protection Act (the “Dodd-Frank Act”). In general, ARM loans are retained by the Company in its loan portfolio. Conventional fixed-rate residential mortgage loans are generally sold in the secondary market without recourse, although the Company typically retains the servicing rights to such loans. When the Company sells residential mortgage loans in the secondary market, it makes representations and warranties to the purchasers about various characteristics of each loan, including the underwriting standards applied and the documentation being provided. Failure of the Company to comply with the requirements established by the purchaser of the loan may result in the Company being required to repurchase the loan. There have not been any material instances where the Company has been required to repurchase loans.
The Company also originates “jumbo” single family mortgage loans in excess of the Fannie Mae maximum loan amount, which was $417,000 for single family homes in its primary market areas. Fannie Mae has higher limits for two-, three- and four-family homes. The Company generally retains fixed-rate jumbo single family mortgage loans in its portfolio.
From time-to-time the Company also originates fixed-rate and ARM loans under special programs for low- to moderate-income households and first-time home buyers. These programs are offered to help meet the credit needs of the communities the Company serves and are retained by the Company in its loan portfolio. Among the features of these programs are lower down payments, no mortgage insurance, and generally less restrictive requirements for qualification compared to the Company’s conventional one- to four-family mortgage loans. These loans generally have maturities up to 30 years.
From time-to-time the Company also originates loans under programs administered by various government agencies such as the Wisconsin Housing and Economic Development Authority (“WHEDA”). Loans originated under these programs may or may not be held by the Company in its loan portfolio and the Company may or may not retain the servicing rights for such loans.
| 6 |
ARM loans pose credit risks different from the risks inherent in fixed-rate loans, primarily because as interest rates rise, the underlying payments from the borrowers increase, which increases the potential for payment default. At the same time, the marketability and/or value of the underlying property may be adversely affected by higher interest rates. ARM loans generally have an initial fixed-rate term five or seven years. Thereafter, they are adjusted on an annual basis up to a maximum of 200 basis points per year. The Company originates ARM loans with lifetime caps set at 6% above the origination rate. Monthly payments of principal and interest are adjusted when the interest rate adjusts. The Company does not offer ARM loans with negative amortization or with interest-only payment features. The Company currently utilizes the monthly average yield on United States treasury securities, adjusted to a constant maturity of one year (“constant maturity treasury index”) as the base index to determine the interest rate payable upon the adjustment date of ARM loans. The volume and types of ARM loans the Company originates have been affected by the level of market interest rates, competition, consumer preferences, and the availability of funds. ARM loans are susceptible to early prepayment during periods of lower interest rates as borrowers refinance into fixed-rate loans.
The Company requires an appraisal of the real estate that secures a residential mortgage loan, which must be performed by an independent certified appraiser approved by the board of directors, but contracted and administered by an independent third party. A title insurance policy is required for all real estate first mortgage loans. Evidence of adequate hazard insurance and flood insurance, if applicable, is required prior to closing. Borrowers are required to make monthly payments to fund principal and interest as well as private mortgage insurance and flood insurance, if applicable. With some exceptions for lower loan-to-value ratio loans, borrowers are also generally required to escrow in advance for real estate taxes. Generally, no interest is paid on these escrow deposits. If borrowers with loans having a lower loan-to-value ratio want to handle their own taxes and insurance, an escrow waiver fee is charged. With respect to escrowed real estate taxes, the Company generally makes this disbursement directly to the borrower as obligations become due.
The Company’s staff underwriters review all pertinent information prior to making a credit decision on an application. All recommendations to deny are reviewed by a designated senior officer of the Company, in addition to staff underwriters, prior to the final disposition of the application. The Company’s lending policies generally limit the maximum loan-to-value ratio on single family mortgage loans secured by owner-occupied properties to 95% of the lesser of the appraised value or purchase price of the property. This limit is lower for loans secured by two-, three-, and four-family homes. Loans above 80% loan-to-value ratios are subject to private mortgage insurance to reduce the Company’s exposure to less than 80% of value, except for certain low to moderate income loan program loans.
In addition to servicing the loans in its own portfolio, the Company continues to service most of the loans that it sells to Fannie Mae and other third-party investors (“loans serviced for third-party investors”). Servicing mortgage loans, whether for its own portfolio or for third-party investors, includes such functions as collecting monthly principal and interest payments from borrowers, maintaining escrow accounts for real estate taxes and insurance, and making certain payments on behalf of borrowers. When necessary, servicing of mortgage loans also includes functions related to the collection of delinquent principal and interest payments, loan foreclosure proceedings, and disposition of foreclosed real estate. As of December 31, 2015, loans serviced for third-party investors amounted to $1.04 billion. These loans are not reflected in the Company’s Consolidated Statements of Financial Condition.
When the Company services loans for third-party investors, it is compensated through the retention of a servicing fee from borrowers' monthly payments. The Company pays the third-party investors an agreed-upon yield on the loans, which is generally less than the interest agreed to be paid by the borrowers. The difference, typically 25 basis points or more, is retained by the Company and recognized as servicing fee income over the lives of the loans, net of amortization of capitalized mortgage servicing rights (“MSRs”). The Company also receives fees and interest income from ancillary sources such as delinquency charges and float on escrow and other funds.
| 7 |
Management believes that servicing mortgage loans for third-party investors partially mitigates other risks inherent in the Company's mortgage banking operations. For example, fluctuations in volumes of mortgage loan originations and resulting gains on sales of such loans caused by changes in market interest rates will generally be offset by opposite changes in the amortization of the MSRs. These fluctuations are usually the result of actual loan prepayment activity and/or changes in management expectations for future prepayment activity, which impacts the amount of MSRs amortized in a given period. However, fluctuations in the recorded value of MSRs may also be caused by valuation allowances required to be recognized under generally accepted accounting principles (“GAAP”). That is, the value of servicing rights may fluctuate because of changes in the future prepayment assumptions or discount rates used to periodically assess the impairment of MSRs. Although most of the Company's serviced loans that prepay are replaced by new serviced loans (thus preserving the future servicing cash flow), GAAP requires impairment losses resulting from a change in future prepayment assumptions to be recorded when the change occurs. MSRs are particularly susceptible to impairment losses during periods of declining interest rates during which prepayment activity typically accelerates to levels above that which had been anticipated when the servicing rights were originally recorded. Alternatively, in periods of increasing interest rates, during which prepayment activity typically declines, the Company could potentially recapture through earnings all or a portion of a previously established valuation allowance for impairment.
Home Equity Loans At December 31, 2015, the Company’s portfolio of home equity loans was $198.2 million or 9.9% of its gross loans receivable. Home equity loans include fixed term home equity loans and home equity lines of credit. The unfunded portion of approved home equity lines of credit was $115.9 million as of December 31, 2015. Home equity loans are typically secured by junior liens on owner-occupied one- to four-family residences, but in many instances are secured by first liens on such properties. Underwriting procedures for the home equity and home equity lines of credit loans include a comprehensive review of the loan application, an acceptable credit score, verification of the value of the equity in the home, and verification of the borrower’s income.
The Company originates fixed-rate home equity term loans with loan-to-value ratios of up to 89.99% (when combined with any other mortgage on the property). Pricing on fixed-rate home equity term loans is periodically reviewed by management. Generally, loan terms are in the three to fifteen year range in order to minimize interest rate risk.
The Company also originates home equity lines of credit. Home equity lines of credit are variable-rate loans secured by first liens or junior liens on owner-occupied one- to four-family residences. Current interest rates on home equity lines of credit are tied to an index rate, adjust monthly after an initial interest rate lock period, and generally have floors that vary depending on the loan-to-value ratio. Home equity line of credit loans are made for terms up to 10 years and require minimum monthly payments.
Other Consumer Loans At December 31, 2015, the Company’s portfolio of other consumer loans was $19.8 million or 1.0% of its gross loans receivable. Other consumer loans include student loans, automobile loans, recreational vehicle and boat loans, deposit account loans, overdraft protection lines of credit, and unsecured consumer loans, including loans through credit card programs that are administered by third parties. The Company no longer originates student loans through programs guaranteed by the federal government. Student loans that continue to be held by the Company are administered by a third party.
Other consumer loans generally have shorter terms and higher rates of interest than conventional mortgage loans, but typically involve more credit risk because of the nature of the collateral and, in some instances, the absence of collateral. In general, other consumer loans are more dependent upon the borrower's continuing financial stability, more likely to be affected by adverse personal circumstances, and often secured by rapidly depreciating personal property. In addition, various laws, including bankruptcy and insolvency laws, may limit the amount that may be recovered from a borrower. The Company believes that the higher yields earned on other consumer loans compensate for the increased risk associated with such loans and that consumer loans are important to the Company’s efforts to increase the interest rate sensitivity and shorten the average maturity of its loan portfolio.
Asset Quality
General The Company has policies and procedures in place to manage its exposure to credit risk related to its lending operations. As a matter of policy, the Company limits its lending to geographic areas in which it has substantial familiarity and/or a physical presence. Currently, this is limited to certain specific market areas in Wisconsin and contiguous states. In addition, from time-to-time the Company will prohibit or restrict lending in situations in which the underlying business operations and/or collateral exceed management’s tolerance for risk. The Company obtains appraisals of value prior to the origination of mortgage loans or other secured loans. It also manages its exposure to risk by regularly monitoring loan payment status, conducting periodic site visits and inspections, obtaining regular financial updates from large borrowers and/or guarantors, corresponding regularly with large borrowers and/or guarantors, and/or updating appraisals as appropriate, among other things. These procedures are emphasized when a borrower has failed to make scheduled loan payments, has otherwise defaulted on the terms of the loan agreement, or when management has become aware of a significant adverse change in the financial condition of the borrower, guarantor, or underlying collateral. For specific information relating to the Company’s asset quality for the periods covered by this report, refer to “Financial Condition—Asset Quality” in “Item 7. Management’s Discussion and Analysis of Financial Condition and Results of Operations.”
| 8 |
Internal Risk Ratings and Classified Assets OCC regulations require thrift institutions to review and, if necessary, classify their assets on a regular basis. Accordingly, the Company has internal policies and procedures in place to evaluate and/or maintain risk ratings on all of its loans and certain other assets. In general, these internal risk ratings correspond with regulatory requirements to adversely classify problem loans and certain other assets as “substandard,” “doubtful,” or “loss.” A loan or other asset is adversely classified as substandard if it is determined to involve a distinct possibility that the Company could sustain some loss if deficiencies associated with the loan are not corrected. A loan or other asset is adversely classified as doubtful if full collection is highly questionable or improbable. A loan or other asset is adversely classified as loss if it is considered uncollectible, even if a partial recovery could be expected in the future. The regulations also provide for a “special mention” designation, described as loans or assets which do not currently expose the Company to a sufficient degree of risk to warrant adverse classification, but which demonstrate clear trends in credit deficiencies or potential weaknesses deserving management's close attention (refer to the following paragraph for additional discussion). As of December 31, 2015, $32.4 million or 1.9% the Company’s loans were classified as special mention and $37.1 million or 2.1% were classified as substandard. The latter includes all loans placed on non-accrual in accordance with the Company’s policies, as described below. In addition, as of December 31, 2015, $23.3 million of the Company’s mortgage-related securities, consisting of private-label collateralized mortgage obligations (“CMOs”) rated less than investment grade, were classified as substandard in accordance with regulatory guidelines. The Company had no loans or other assets classified as doubtful or loss at December 31, 2015.
Loans that are not classified as special mention or adversely classified as substandard, doubtful, or loss are classified as “pass” or “watch” in accordance with the Company’s internal risk rating policy. Pass loans are generally current on contractual loan and principal payments, comply with other contractual loan terms, and have no noticeable credit deficiencies or potential weaknesses. Watch loans are also generally current on payments and in compliance with loan terms, but a particular borrower’s financial or operating conditions may exhibit early signs of credit deficiencies or potential weaknesses that deserve management’s close attention. Such deficiencies and/or weaknesses typically include, but are not limited to, the borrower’s financial or operating condition, deterioration in liquidity, increased financial leverage, declines in the condition or value of related collateral, recent changes in management or business strategy, or recent developments in the economic, competitive, or market environment of the borrower. If adverse observations noted in these areas are not corrected, further downgrade of the loan may be warranted.
Delinquent Loans When a borrower fails to make required payments on a loan, the Company takes a number of steps to induce the borrower to cure the delinquency and restore the loan to a current status. In the case of one- to four-family mortgage loans, the Company’s loan servicing department is responsible for collection procedures from the 15th day of delinquency through the completion of foreclosure. Specific procedures include late charge notices, telephone contacts, and letters. If these efforts are unsuccessful, foreclosure notices will eventually be sent. The Company may also send either a qualified third party inspector or a loan officer to the property in an effort to contact the borrower. When contact is made with the borrower, the Company attempts to obtain full payment or work out a repayment schedule to avoid foreclosure of the collateral. Many borrowers pay before the agreed upon payment deadline and it is not necessary to start a foreclosure action. The Company follows collection procedures and guidelines outlined by Fannie Mae, WHEDA, and, when applicable, other government-sponsored loan programs.
The collection procedures for retail loans, excluding student loans and credit card loans, include sending periodic late notices to a borrower and attempts to make direct contact with a borrower once a loan becomes 30 days past due. If collection activity is unsuccessful, the Company may pursue legal remedies itself, refer the matter to legal counsel for further collection efforts, seek foreclosure or repossession of the collateral (if any), and/or charge-off the loan. All student loans are serviced by a third party that guarantees that its servicing complies with all U.S. Department of Education guidelines. The Company’s student loan portfolio is guaranteed under programs sponsored by the U.S. government. Credit card loans are serviced by a third party administrator.
The collection procedures for commercial loans include sending periodic late notices to a borrower once a loan is past due. The Company attempts to make direct contact with a borrower once a loan becomes 15 days past due. The Company’s managers of the multi-family and commercial real estate loan areas regularly review loans that are 10 days or more delinquent. If collection activity is unsuccessful, the Company may refer the matter to legal counsel for further collection effort. After 90 days, loans that are delinquent are typically proposed for repossession or foreclosure.
| 9 |
In working with delinquent borrowers, if the Company cannot develop a repayment plan that substantially complies with the original terms of the loan agreement, the Company’s practice has been to pursue foreclosure or repossession of the underlying collateral. As a matter of practice, the Company has not restructured or modified troubled loans in a manner that has resulted in a loss under accounting rules. However, the Company’s policies do not preclude such practice and the Company may elect in the future to restructure certain troubled loans in a manner that could result in losses under accounting rules. In most cases the Company continues to report restructured or modified troubled loans as non-performing loans unless the borrower has clearly demonstrated the ability to service the loan in accordance with the new terms.
The Company’s policies require that management continuously monitor the status of the loan portfolio and report to the board of directors on a monthly basis. These reports include information on classified loans, delinquent loans, restructured or modified loans, allowance for loan losses, and foreclosed real estate.
Non-Accrual Policy With the exception of student loans that are guaranteed by the U.S. government, the Company generally stops accruing interest income on loans when interest or principal payments are 90 days or more in arrears or earlier when the future collectability of such interest or principal payments may no longer be certain. In such cases, borrowers have often been able to maintain a current payment status, but are experiencing financial difficulties and/or the properties that secure the loans are experiencing increased vacancies, declining lease rates, and/or delays in unit sales. In such instances, the Company generally stops accruing interest income on the loans even though the borrowers are current with respect to all contractual payments. Although the Company generally no longer accrues interest on these loans, the Company may continue to record periodic interest payments received on such loans as interest income provided the borrowers remain current on the loans and provided, in the judgment of management, the Company’s net recorded investment in the loans are deemed to be collectible. The Company designates loans on which it stops accruing interest income as non-accrual loans and establishes a reserve for outstanding interest that was previously credited to income. All loans on non-accrual are considered to be impaired. The Company returns a non-accrual loan to accrual status when factors indicating doubtful or uncertain collection no longer exist. In general, non-accrual loans are also classified as substandard, doubtful, or loss in accordance with the Company’s internal risk rating policy. As of December 31, 2015, $13.6 million or 0.78% of the Company’s loans were considered to be non-performing in accordance with the Company’s policies.
Foreclosed Properties and Repossessed Assets As of December 31, 2015, $3.3 million or 0.1% of the Company’s total assets consisted of foreclosed properties and repossessed assets. In the case of loans secured by real estate, foreclosure action generally starts when the loan is between the 90th and 120th day of delinquency following review by a senior officer and the executive loan committee of the board of directors. If, based on this review, the Company determines that repayment of a loan is solely dependent on the liquidation of the collateral, the Company will typically seek the shortest redemption period possible, thus waiving its right to collect any deficiency from the borrower. Depending on whether the Company has waived this right and a variety of other factors outside the Company’s control (including the legal actions of borrowers to protect their interests), an extended period of time could transpire between the commencement of a foreclosure action by the Company and its ultimate receipt of title to the property.
When the Company ultimately obtains title to the property through foreclosure or deed in lieu of foreclosure, it transfers the property to “foreclosed properties and repossessed assets” on the Company’s Consolidated Statements of Financial Condition. In cases in which a borrower has surrendered control of the property to the Company or has otherwise abandoned the property, the Company may transfer the property to foreclosed properties as an “in substance foreclosure” prior to actual receipt of title. Foreclosed properties and repossessed assets are adversely classified in accordance with the Company’s internal risk rating policy.
Foreclosed real estate properties are initially recorded at the lower of the recorded investment in the loan or fair value. Thereafter, the Company carries foreclosed real estate at fair value less estimated selling costs (typically 5% to 10%). Foreclosed real estate is inspected periodically to evaluate its condition. Additional outside appraisals are obtained as deemed necessary or appropriate. Additional write-downs may occur if the property value deteriorates further after it is acquired. These additional write-downs are charged to the Company’s results of operations as they occur.
| 10 |
In the case of loans secured by assets other than real estate, action to repossess the underlying collateral generally starts when the loan is between the 90th and 120th day of delinquency. The accounting for repossessed assets is similar to that described for real estate, above.
Loan Charge-Offs The Company typically records loan charge-offs when foreclosure or repossession becomes likely or legal proceedings related to such have commenced, the secondary source of repayment (consisting of a guarantor or operating entity) files for bankruptcy, or the loan is otherwise deemed uncollectible. The amount of the charge-off will depend on the fair value of the underlying collateral, if any, and may be zero if the fair market value exceeds the loan amount. All charge-offs are recorded as a reduction to allowance for loan losses. All charge-off activity is reviewed by the board of directors.
Allowance for Loan Losses As of December 31, 2015, the Company’s allowance for loan losses was $17.6 million or 1.01% of loans receivable and 129.51% of non-performing loans. The allowance for loan losses is maintained at a level believed adequate by management to absorb probable losses inherent in the loan portfolio and is based on factors such as the size and current risk characteristics of the portfolio, an assessment of individual problem loans and pools of homogenous loans within the portfolio, and actual loss, delinquency, and/or risk rating experience within the portfolio. The Company also considers current economic conditions and/or events in specific industries and geographical areas, including unemployment levels, trends in real estate values, peer comparisons, and other pertinent factors, including regulatory guidance. Finally, as appropriate, the Company also considers individual borrower circumstances and the condition and fair value of the loan collateral, if any. For additional information relating to the Company’s allowance for loan losses for the periods covered by this report, refer to “Results of Operations—Provision for Loan Losses” and “Financial Condition—Asset Quality” in “Item 7. Management’s Discussion and Analysis of Financial Condition and Results of Operations.”
Determination of the allowance is inherently subjective as it requires significant management judgment and estimates, including the amounts and timing of expected future cash flows on loans, the fair value of underlying collateral (if any), estimated losses on pools of homogeneous loans based on historical loss experience, changes in risk characteristics of the loan portfolio, and consideration of current economic trends, all of which may be susceptible to significant change. Higher rates of loan defaults than anticipated would likely result in a need to increase provisions in future years. Also, increases in the Company’s multi-family, commercial real estate, construction and development, and commercial and industrial loan portfolios could result in a higher allowance for loan losses as these loans typically carry a higher risk of loss. Finally, various regulatory agencies, as an integral part of their examination processes, periodically review the Company’s loan and foreclosed real estate portfolios and the related allowance for loan losses and valuations of foreclosed real estate. One or more of these agencies, particularly the OCC, may require the Company to increase the allowance for loan losses or reduce the recorded value of foreclosed real estate based on their judgments of information available to them at the time of their examination, thereby adversely affecting the Company’s results of operations. As a result of applying management judgment, it is possible that there may be periods when the amount of the allowance and/or its percentage to total loans or non-performing loans may decrease even though non-performing loans may increase.
Periodic adjustments to the allowance for loan loss are recorded through provision for loan losses in the Company’s Consolidated Statements of Income. Actual losses on loans are charged off against the allowance for loan losses. In the case of loans secured by real estate, charge-off typically occurs when foreclosure or repossession is likely or legal proceedings related to such have commenced, when the secondary source of repayment (consisting of a guarantor or operating entity) files for bankruptcy, or when the loan is otherwise deemed uncollectible in the judgment of management. Loans not secured by real estate, as well as unsecured loans, are charged off when the loan is determined to be uncollectible in the judgment of management. Recoveries of loan amounts previously charged off are credited to the allowance as received. Management reviews the adequacy of the allowance for loan losses on a monthly basis. The board of directors reviews management’s judgments related to the allowance for loan loss on at least a quarterly basis.
The Company maintains general allowances for loan loss against certain homogenous pools of loans. These pools generally consist of smaller loans of all types that do not warrant individual review due to their size. In addition, pools may also consist of larger commercial loans that have not been individually identified as impaired by management. Certain of these pools are further segmented by management’s internal risk rating of the loans. Management has developed factors for each pool or segment based on the historical loss experience of each pool or segment, internal risk ratings, industry loss experience by type of loan, and consideration of current economic trends, in order to determine what it believes is an appropriate level for the general allowance. Given the significant amount of management judgment involved in this process there could be significant variation in the Company’s allowance for loan losses and provision for loan losses from period to period.
| 11 |
The Company maintains specific allowances for loan loss against individual loans that have been identified by management as impaired. These loans are generally larger loans, but management may also establish specific allowances against smaller loans from time-to-time. The allowance for loan loss established against these loans is based on one of two methods: (1) the present value of the future cash flows expected to be received from the borrower, discounted at the loan’s effective interest rate, or (2) the fair value of the loan collateral, if the loan is considered to be collateral dependent. In the Company’s experience, loss allowances using the first method have been rare. In working with problem borrowers, if the Company cannot develop a repayment plan that substantially complies with the original terms of the loan agreement, the Company’s practice has been to pursue foreclosure or repossession of the underlying collateral. As a matter of practice, the Company does not restructure troubled loans in a manner that results in a loss under the first method. As a result, most loss allowances are established using the second method because the related loans have been deemed collateral dependent by management.
Management considers loans to be collateral dependent when, in its judgment, there is no source of repayment for the loan other than the ultimate sale or disposition of the underlying collateral and foreclosure is probable. Factors management considers in making this determination typically include, but are not limited to, the length of time a borrower has been delinquent with respect to loan payments, the nature and extent of the financial or operating difficulties experienced by the borrower, the performance of the underlying collateral, the availability of other sources of cash flow or net worth of the borrower and/or guarantor, and the borrower’s immediate prospects to return the loan to performing status. In some instances, because of the facts and circumstances surrounding a particular loan relationship, there could be an extended period of time between management’s identification of a problem loan and a determination that it is probable that such loan is collateral dependent.
Management generally measures impairment of impaired loans whether or not foreclosure is probable based on the estimated fair value of the underlying collateral. Such estimates are based on management’s judgment or, when considered appropriate, on an updated appraisal or similar evaluation. Updated appraisals are also typically obtained on impaired loans on at least an annual basis or when foreclosure or repossession of the underlying collateral is considered to be imminent. Prior to receipt of an updated appraisal, management has typically relied on the latest appraisal and knowledge of the condition of the collateral, as well as the current market for the collateral, to estimate the Company’s exposure to loss on impaired loans.
Investment Activities
At December 31, 2015, the Company’s portfolio of mortgage-related securities available-for-sale was $407.9 million or 16.3% of its total assets. As of the same date its portfolio of mortgage-related securities held-to-maturity was $120.9 million or 4.8% of total assets. Mortgage-related securities consist principally of mortgage-backed securities (“MBSs”) and CMOs. Most of the Company’s mortgage-related securities are directly or indirectly insured or guaranteed by Fannie Mae, the Federal Home Loan Mortgage Corporation (“Freddie Mac”), or the Government National Mortgage Association (“Ginnie Mae”). The remaining securities are private-label CMOs. Private-label CMOs generally carry higher credit risks and higher yields than mortgage-related securities insured or guaranteed by the aforementioned agencies of the U.S. Government. Although the latter securities have less exposure to credit risk, like private-label CMOs they remain exposed to fluctuating interest rates and instability in real estate markets, which may alter the prepayment rate of underlying mortgage loans and thereby affect the fair value of the securities. For additional information related to the Company’s mortgage-related securities, refer to “Financial Condition—Mortgage-Related Securities Available-for-Sale” and “Financial Condition—Mortgage-Related Securities Held-to-Maturity” in “Item 7. Management’s Discussion and Analysis of Financial Condition and Results of Operations.”
In addition to the mortgage-related securities previously described, the Company’s investment policy authorizes investment in various other types of securities, including U.S. Treasury obligations, federal agency obligations, state and municipal obligations, certain certificates of deposit of insured banks and savings institutions, certain bankers’ acceptances, repurchase agreements, federal funds, commercial paper, mutual funds, and, subject to certain limits, corporate debt and equity securities.
The objectives of the Company’s investment policy are to meet the liquidity requirements of the Company and to generate a favorable return on investments without compromising management objectives related to interest rate risk, liquidity risk, credit risk, and investment portfolio concentrations. In addition, from time to time the Company will pledge eligible securities as collateral for certain deposit liabilities, FHLB of Chicago advances, financial derivatives, and other purposes permitted or required by law.
| 12 |
The Company’s investment policy requires that securities be classified as trading, available-for-sale, or held-to-maturity at the date of purchase. The Company’s available-for-sale securities are carried at fair value with the change in fair value recorded as a component of shareholders’ equity rather than affecting results of operations. The Company’s held-to-maturity securities are carried at amortized cost. The Company has not engaged in trading activities.
The Company’s investment policy prohibits the purchase of non-investment grade securities, although the Company may continue to hold investments that are reduced to less than investment grade after their purchase. Securities rated less than investment grade are adversely classified as substandard in accordance with federal guidelines (refer to Asset Quality—Internal Ratings and Classified Assets,” above).
Financial Derivatives
The Company’s policies permit the use of financial derivatives such as financial futures, forward commitments, and interest rate swaps, to manage its exposure to interest rate risk. At December 31, 2015, the Company was using forward commitments to manage interest rate risk related to its sale of residential loans in the secondary market and interest rate swaps to manage interest rate risk related to certain fixed-rate commercial loans and forecasted transaction cash flows. For additional information, refer to “Note 1. Summary of Significant Accounting Policies” and “Note 13. Financial Instruments with Off-Balance-Sheet Risk and Derivative Financial Instruments” in “Item 8. Financial Statements and Supplementary Data.”
Deposit Liabilities
At December 31, 2015, the Company’s deposit liabilities were $1.8 billion or 71.8% of its total liabilities and equity. The Company offers a variety of deposit accounts having a range of interest rates and terms for both retail and business customers. The Company currently offers regular savings accounts, interest-bearing demand accounts, non-interest-bearing demand accounts, money market accounts, and certificates of deposit. The Company also offers IRA time deposit accounts and health savings accounts. When the Company determines its deposit rates, it considers rates offered by local competitors, benchmark rates on U.S. Treasury securities, and rates on other sources of funds such as FHLB of Chicago advances. For additional information, refer to “Financial Condition—Deposit Liabilities” in “Item 7. Management’s Discussion and Analysis of Financial Condition and Results of Operations.”
Deposit flows are significantly influenced by general and local economic conditions, changes in prevailing interest rates, pricing of deposits, and competition. The Company’s deposits are primarily obtained from the market areas surrounding its bank offices. The Company relies primarily on competitive rates, quality service, and long-standing relationships with customers to attract and retain these deposits. The Company does not rely on a particular customer or related group of individuals, organizations, or institutions for its deposit funding. From time to time the Company has used third-party brokers and a nationally-recognized reciprocal deposit gathering network to obtain wholesale deposits.
Borrowings
At December 31, 2015, the Company’s borrowed funds were $372.4 million or 14.9% of its total liabilities and equity. The Company borrows funds to finance its lending, investing, operating, and, when active, stock repurchase activities. Substantially all of the Company’s borrowings have traditionally consisted of advances from the FHLB of Chicago on terms and conditions generally available to member institutions. The Company’s FHLB of Chicago borrowings typically carry fixed rates of interest, have stated maturities, and are generally subject to significant prepayment penalties if repaid prior to their stated maturity. The Company has pledged certain one- to four-family first and second mortgage loans, as well as certain multi-family mortgage loans, as blanket collateral for current and future advances. From time to time the Company may also pledge mortgage-related securities as collateral for advances.
| 13 |
For additional information regarding the Company’s outstanding advances from the FHLB of Chicago as of December 31, 2015, refer to “Financial Condition—Borrowings” in “Item 7. Management’s Discussion and Analysis of Financial Condition and Results of Operations.”
Shareholders’ Equity
At December 31, 2015, the Company’s shareholders’ equity was $276.5 million or 11.17% of its total liabilities and equity. The Company and the Bank are both required to maintain specified amounts of regulatory capital pursuant to regulations promulgated by their respective federal regulators. Management’s objective is to maintain the Company and the Bank’s regulatory capital in an amount sufficient to be classified in the highest regulatory category (i.e., as a “well capitalized” institution). At December 31, 2015, the Company and the Bank exceeded all regulatory minimum requirements, as well as the amount required to be classified as a “well capitalized” institution. For additional discussion relating to regulatory capital standards refer to “Regulation and Supervision of the Company —Regulatory Capital Requirements” and “Regulation and Supervision of the Bank—Regulatory Capital Requirements,” below. For additional information related to the Company’s equity and the Company and Bank’s regulatory capital, refer to “Financial Condition—Shareholders’ Equity” in “Item 7. Management’s Discussion and Analysis of Financial Condition and Results of Operations,” as well as “Note 8. Shareholders’ Equity” in “Item 8. Financial Statements and Supplementary Data.”
The Company has paid quarterly cash dividends since its initial stock offering in 2000. The payment of dividends is discretionary with the Company’s board of directors and depends on the Company’s operating results, financial condition, compliance with regulatory capital requirements, and other considerations. In addition, the Company’s ability to pay dividends is highly dependent on the Bank’s ability to pay dividends to the Company. As such, there can be no assurance that the Company will be able to continue the payment of dividends or that the level of dividends will not be reduced in the future. For additional information, refer to “Regulation and Supervision of the Bank—Dividend and Other Capital Distribution Limitations,” below.
From time to time, the Company has repurchased shares of its common stock which has had the effect of reducing the Company’s capital. However, as with the payment of dividends above, the repurchase of common stock is discretionary with the Company’s board of directors and depends on a variety of factors, including market conditions for the Company’s stock, the financial condition of the Company and the Bank, compliance with regulatory capital requirements, and other considerations. The Company currently has an active stock repurchase program in effect. However, because of the aforementioned considerations there can be no assurances the Company will repurchase shares of its common stock under the current stock repurchase program. For additional discussion relating to the Company’s current stock repurchase program, refer to “Financial Condition—Shareholders’ Equity,” in “Item 7. Management’s Discussion and Analysis.”
Subsidiaries
BancMutual Financial and Insurance Services, Inc. (“BMFIS”), a wholly-owned subsidiary of the Bank that does business as “Mutual Financial Group,” provides investment, wealth management, and insurance products and services to the Bank’s customers and the general public. These products and services include equity and debt securities, mutual fund investments, tax-deferred annuities, life, disability, and long-term care insurance, property and casualty insurance, financial advisory services, and other brokerage-related services. BMFIS also offers fee-based financial planning and third-party-administered trust services to customers. These products and services are provided through an operating agreement with a leading, third-party, registered broker-dealer.
MC Development LTD (“MC Development”), a wholly-owned subsidiary of the Bank, is involved in land development and sales. It owns five parcels of developed land totaling 15 acres in Brown Deer, Wisconsin. In addition, in 2004, MC Development established Arrowood Development LLC with an independent third party to develop approximately 300 acres for residential purposes in Oconomowoc, Wisconsin. In the initial transaction, the third party purchased a one-half interest in that land, all of which previously had been owned by MC Development.
In addition, the Bank has four other wholly-owned subsidiaries that are inactive, but are reserved for possible future use in related or other areas.
| 14 |
Employees
At December 31, 2015, the Company employed 563 full time and 100 part time associates. Management considers its relations with its associates to be good.
Regulation and Supervision
General
The Company is a Wisconsin corporation and a registered savings and loan holding company under federal law. The Company files reports with and is subject to regulation and examination by the FRB. The Bank is a federally-chartered savings bank and is subject to OCC requirements as well as those of the FDIC. Any change in these laws and regulations, whether by the FRB, the OCC, the FDIC, or through legislation, could have a material adverse impact on the Company, the Bank, and the Company’s shareholders.
Certain current laws and regulations applicable to the Company and the Bank, and other material consequences of recent legislation, are summarized below. These summaries do not purport to be complete and are qualified in their entirety by reference to such laws, regulations, or administrative considerations.
Financial Services Industry Legislation and Related Actions
In response to instability in the U.S. financial system, lawmakers and federal banking agencies have taken various actions intended to stabilize the financial system and housing markets, and to strengthen U.S. financial institutions.
Dodd-Frank Act
In 2010 Congress enacted the Dodd-FrankAct, which significantly changed the U.S. financial institution regulatory structure, as well as the lending, investment, trading, and operating activities of financial institutions and their holding companies. Many of the provisions of the Dodd-Frank Act have become effective since 2010 and management believes the Company and the Bank are in compliance with the new provisions, as applicable, and that the impacts of such provisions (if any) are fully reflected in the financial condition and/or results of operations of the Company and the Bank. However, portions of the Dodd-Frank Act remain subject to future rule-making procedures and studies. As such, the full impact of such future provisions cannot yet be determined at this time, although management does not expect them to have a material adverse impact on the Company or the Bank..
Regulation and Supervision of the Bank
General As a federally-chartered, FDIC-insured savings bank, the Bank is subject to extensive regulation by the OCC, as well as the regulations of the FDIC. This federal regulation and supervision establishes a comprehensive framework of activities in which a federal savings bank may engage and is intended primarily for the protection of the FDIC and depositors rather than the shareholders of the Company. This regulatory structure gives authorities extensive discretion in connection with their supervisory and enforcement activities and examination policies, including policies regarding the classification of assets and the establishment of adequate loan loss reserves.
The OCC regularly examines the Bank and issues a report on its examination findings to the Bank’s board of directors. The Bank’s relationships with its depositors and borrowers are also regulated by federal law, especially in such matters as the ownership of savings accounts and the form and content of the Bank’s loan documents. The Bank must file reports with the OCC and the FDIC concerning its activities and financial condition, and must obtain regulatory approvals prior to entering into transactions such as mergers or acquisitions.
Regulatory Capital Requirements In 2015 regulatory capital standards as specified by the Basel Committee of Banking Supervision (known as Basel III) became effective for financial institutions such as the Bank (although certain aspects of the new standards will continue to phase in through 2019). These regulatory capital standards, which superseded the standards in effect prior to 2015, require financial institutions such as the Bank to meet the following minimum regulatory capital standards to be classified as “adequately capitalized” under the regulations: (i) common equity Tier 1 (“CET1”) capital equal to at least 4.5% of total risk-weighted assets, (ii) Tier 1 capital equal to at least 4% of adjusted total assets (known as the “leverage ratio”), (iii) Tier 1 risk-based capital equal to at least 6% of total risk-weighted assets, and (iv) total risk-based capital equal to at least 8% of total risk-weighted assets. At December 31, 2015, the Bank’s regulatory capital ratios exceeded both the minimum requirements to be classified as “adequately capitalized,” as well as the higher requirements necessary to be classified as a “well capitalized” for regulatory capital purposes. For additional information related to the Bank’s regulatory capital ratios, refer to “Note 8. Shareholders’ Equity” in “Item 8. Financial Statements and Supplementary Data.”
| 15 |
In addition to the requirements described in the previous paragraph, the Basel III regulatory capital regulations also introduced an element known as the “capital conservation buffer.” In order to avoid limitations on capital distributions and certain discretionary bonus payments to executive officers, a banking organization such as the Bank must hold a capital conservation buffer composed of CET1 capital above the minimum risk-based capital requirements specified in the previous paragraph. This additional requirement is 2.5% of risk-weighted assets, although it will phase-in at a rate of 0.625% per year from 2016 to 2019. Therefore, management’s objective is to maintain all of the Bank’s regulatory capital ratios in amounts that exceed than the Basel III minimums described in the preceding paragraph including the capital conservation buffer. As such, management does not believe the capital conservation buffer will have any impact on the Bank’s capital contributions or discretionary bonus payments to executive officers.
Dividend and Other Capital Distribution Limitations Federal regulations generally govern capital distributions by savings associations such as the Bank, which include cash dividends or other capital distributions. Currently, the Bank must file an application with the OCC for approval of a capital distribution because the total amount of its capital distributions for the most recent calendar year has exceeded the sum of its earnings for that period plus its earnings that have been retained in the preceding two years. In certain other circumstances, however, the Bank may only be required to give the OCC a minimum of 30 days’ notice before the board of directors declares a dividend or approves a capital distribution. The Bank is also required to notify the FRB of its intent to declare a dividend or approve a capital distribution.
The FRB or the OCC may disapprove or restrict dividends or other capital distributions if (i) the savings association would be undercapitalized, significantly undercapitalized or critically undercapitalized following the distribution; (ii) the proposed capital distribution raises safety and soundness concerns; or (iii) the capital distribution would violate any applicable statute, regulation, agreement or regulatory-imposed condition. The FRB and OCC have substantial discretion in making these decisions. Refer to “Regulation and Supervision of the Company—Dividend and Other Capital Distribution Limitations,” below, for the impact that regulatory restrictions on the Bank’s capital distributions could have on the Company.
Qualified Thrift Lender Test Federal savings associations must meet a qualified thrift lender (“QTL”) test or they become subject to operating restrictions. The Bank met the QTL test as of December 31, 2015, and anticipates that it will maintain an appropriate level of mortgage-related investments (which must be at least 65% of portfolio assets as defined in the regulations) and will otherwise continue to meet the QTL test requirements.
Federal Home Loan Bank System The Bank is a member of the FHLB of Chicago. The FHLB of Chicago makes loans (“advances”) to its members and provides certain other financial services to its members pursuant to policies and procedures established by its board of directors. The FHLB of Chicago imposes limits on advances made to member institutions, including limitations relating to the amount and type of collateral and the amount of advances.
As a member of the FHLB of Chicago, the Bank must meet certain eligibility requirements and must purchase and maintain common stock in the FHLB of Chicago in an amount equal to the greater of (i) $10,000, (ii) 0.40% of its mortgage-related assets at the most recent calendar year end, or (iii) 4.5% of its outstanding advances from the FHLB of Chicago. However, the FHLB of Chicago may occasionally require less than 4.5% for amounts borrowed under certain advance programs offered to member institutions. At December 31, 2015, the Bank owned $17.6 million in FHLB of Chicago common stock, which was in compliance with the minimum common stock ownership guidelines established by the FHLB of Chicago.
Deposit Insurance The deposit accounts held by customers of the Bank are insured by the FDIC up to maximum limits, as provided by law. Insurance on deposits may be terminated by the FDIC if it finds that the Bank has engaged in unsafe or unsound practices, is in an unsafe or unsound condition to continue operations or has violated any applicable law, regulation, rule, order or condition imposed by the FDIC or the OCC. The management of the Bank does not know of any practice, condition, or violation that might lead to termination of the Bank’s deposit insurance.
| 16 |
The FDIC sets deposit insurance premiums based upon the risks a particular bank or savings association poses to its deposit insurance fund. Under the risk-based assessment system, the FDIC assigns an institution to one of three capital categorizations based on the institution’s financial information; institutions are classified as well capitalized, adequately capitalized or undercapitalized using ratios that are substantially similar to the capital ratios discussed above. The FDIC also assigns an institution to one of three supervisory sub-categorizations within each capital group. This assignment is based on a supervisory evaluation provided by the institution’s primary federal regulator and information that the FDIC determines to be relevant to the institution’s financial condition and the risk posed to the deposit insurance fund.
An institution’s assessment rate depends on the capital categorizations and supervisory sub-categorizations to which it is assigned. Under the risk-based assessment system, there are four assessment risk categories to which different assessment rates are applied. The assessment rates range from 2.5 to 45 basis points, depending on the institution’s capital category and supervisory sub-category. The assessment base used by the FDIC in determining deposit insurance premiums consists of an insured institution’s average consolidated total assets minus average tangible equity and certain other adjustments.
In June 2015 the FDIC issued a proposed rule that would change how insured financial institutions are assessed for deposit insurance. Under the proposed rule management estimates that the Bank’s federal deposit insurance premium rate could decline significantly from its current level. However, management anticipates that, even if the rule is adopted as currently proposed, it will not have an impact on the Bank’s premium rate until the second quarter 2016 or later. In addition, in October 2015 the FDIC issued another proposed rule that could result in the creation of insurance premium credits for insured institutions with less than $10 billion in assets, such as the Bank. Each insured institution’s credits would be determined by the FDIC at a future date in accordance with performance measures established for the insurance fund, as specified in the proposed rule. The credits could be used by insured institutions to offset future premium costs until the credits are exhausted. Management is unable to determine the amount or timing of credits that might be awarded, if any. In addition, there can be no assurances that the either of these proposed rules will be adopted as proposed or that they will not be significantly changed prior to their final adoption, which could materially change the deposit insurance premiums the Company might otherwise expect to pay in the future.
Consumer Financial Protection Bureau The CFPB, which was created by the Dodd-Frank Act, has broad rule-making and enforcement authority related to a wide range of consumer protection laws that apply to all banks and savings institutions, such as the Bank. Accordingly, the activities of the CFPB could have a significant impact on the financial condition and/or operations of the Company. Management does not believe the activities of the CFPB have had a significant impact on the Bank to date. Although CFPB regulations apply to the Bank, institutions with $10 billion or less in assets (such as the Bank) are examined for compliance with CFPB directives by their applicable bank regulators rather than the CFPB itself.
Transactions With Affiliates Sections 23A and 23B of the Federal Reserve Act and FRB Regulation W govern transactions between an insured federal savings association, such as the Bank, and any of its affiliates, such as the Company. An affiliate is any company or entity that controls, is controlled by or is under common control with it. Sections 23A and 23B limit the extent to which an institution or a subsidiary may engage in “covered transactions” with any one affiliate to an amount equal to 10% of such savings association’s capital stock and surplus, and limit all such transactions with all affiliates to 20% of such stock and surplus. The term “covered transaction” includes the making of loans, purchase of assets, issuance of guarantees, derivatives transactions, securities borrowing, and lending transactions to the extent that they result in credit exposure to an affiliate. Further, most loans by a savings association to any of its affiliates must be secured by specified collateral amounts. All such transactions must be on terms that are consistent with safe and sound banking practices and must be on terms that are at least as favorable to the savings association as those that would be provided to a non-affiliate. At December 31, 2015, the Company and Bank did not have any covered transactions.
Acquisitions and Mergers Under the federal Bank Merger Act, any merger of the Bank with or into another institution would require the approval of the OCC, or the primary federal regulator of the resulting entity if it is not an OCC-regulated institution. Refer also to “Regulation and Supervision of the Company—Acquisition of Bank Mutual Corporation,” below.
Prohibitions Against Tying Arrangements Savings associations are subject to the prohibitions of 12 U.S.C. Section 1972 on certain tying arrangements. A savings association is prohibited, subject to exceptions, from extending credit to or offering any other service, or fixing or varying the consideration for such credit or service, on the condition that the customer obtain some additional service from the institution or its affiliates or not obtain services of a competitor.
| 17 |
Uniform Real Estate Lending Standards The federal banking agencies adopted uniform regulations prescribing standards for extensions of credit that are secured by liens on interests in real estate or are made to finance the construction of a building or other improvements to real estate. All insured depository institutions must adopt and maintain written policies that establish appropriate limits and standards for such extensions of credit. These policies must establish loan portfolio diversification standards, prudent underwriting standards that are clear and measurable, loan administration procedures, and documentation, approval and reporting requirements.
These lending policies must reflect consideration of the Interagency Guidelines for Real Estate Lending Policies that have been adopted by the federal bank regulators. These guidelines, among other things, require a depository institution to establish internal loan-to-value limits for real estate loans that are not in excess of specified supervisory limits, which generally vary and provide for lower loan-to-value limits for types of collateral that are perceived as having more risk, are subject to fluctuations in valuation, or are difficult to dispose. Although there is no supervisory loan-to-value limit for owner-occupied one- to four-family and home equity loans, the guidelines provide that an institution should require credit enhancement in the form of mortgage insurance or readily marketable collateral for any such loan with a loan-to-value ratio that equals or exceeds 90% at origination. The guidelines also clarify expectations for prudent appraisal and evaluation policies, procedures, and practices, and make other changes, in light of the Dodd-Frank Act and other recent federal statutory changes affecting appraisals.
Other Mortgage Lending Regulations In 2013 the CFPB issued a regulation commonly known as the “qualified mortgage” rule, which generally requires mortgage lenders such as the Bank to make a reasonable, good faith determination of a borrower’s ability to repay loans secured by single family residential properties (excluding home equity lines of credit and certain other types of loans) in order to obtain certain protections from liability under the rule for such qualified mortgages. These new rules were effective in January 2014. This new rule has not had a significant impact on the Bank’s single family mortgage lending or sales operations.
In 2013 the CFPB also issued final regulations to integrate certain single family residential loan disclosures under the Truth in Lending Act ( “TILA”) and Real Estate Settlement Procedures Act of 1974 (“RESPA”), which became effective on October 3, 2015. These new rules, which have become known as the TILA-RESPA Integrated Disclosure (“TRID”) rules. Among other things, the TRID rules consolidated certain existing loan disclosure documents and established strict delivery requirements related to such documents. The type of single family residential lending done by the Bank is subject to these new rules. Although the Bank has implemented the new TRID rules, many financial experts believe that such rules will increase the costs and difficulties that most consumers will experience to obtain a home loan and that such could have an adverse impact on residential lending as a whole. Management is unable to determine at this time whether and to what extent this may be true. Furthermore, it is unable to determine at this time the impact such may have on the Bank’s mortgage banking operations, if any.
In 2014 federal regulators issued a regulation relating to risk retention requirements on sales of single family residential mortgage loans. The risk retention requirements generally require institutions such as the Bank to retain no less than 5% of the credit risk in loans it sells into a securitization and prohibits such institutions from directly or indirectly hedging or otherwise transferring the credit risk that the institution is required to retain, subject to limited exceptions. One significant exception is for securities entirely collateralized by “qualified residential mortgages” (“QRMs”), which are defined the same as the “qualified mortgage” rule issued by the CFPB, as previously discussed. The new risk retention requirements apply to securitizations of residential loans issued after December 24, 2015. Management does not expect this new requirement to have a significant impact on the Bank’s single family mortgage lending or sales operations.
Community Reinvestment Act Under the Community Reinvestment Act (“CRA”), any insured depository institution, including the Bank, must, consistent with its safe and sound operation, help meet the credit needs of its entire community, including low and moderate income neighborhoods. The CRA does not establish specific lending requirements or programs nor does it limit an institution’s discretion to develop the types of products and services that it believes are best suited to its particular community. The CRA requires the OCC to assess the institution’s record of meeting the credit needs of its community and to take such record into account in its evaluation of certain applications by such institution, including applications for additional branches and acquisitions.
| 18 |
Among other things, the CRA regulations contain an evaluation system that rates an institution based on its actual performance in meeting community needs. In particular, the evaluation system focuses on three tests: (i) a lending test, to evaluate the institution’s record of making loans in its service areas, (ii) an investment test, to evaluate the institution’s record of making community development investments, and (iii) a service test, to evaluate the institution’s delivery of services through its branches, ATMs and other offices. The CRA requires the OCC to provide a written evaluation of the Bank’s CRA performance utilizing a four-tiered descriptive rating system and requires public disclosure of the CRA rating. The Bank received a “satisfactory” overall rating in its most recent CRA examination.
Safety and Soundness Standards Each federal banking agency, including the OCC, has guidelines establishing general standards relating to internal controls, information and internal audit systems, loan documentation, credit underwriting, interest rate exposure, asset growth, asset quality, customer privacy, liquidity, earnings, and compensation and benefits. The guidelines require, among other things, appropriate systems and practices to identify and manage the risks and exposures specified in the guidelines. The guidelines also prohibit excessive compensation as an unsafe and unsound practice.
Loans to Insiders A savings association’s loans to its executive officers, directors, any owner of more than 10% of its stock (each, “an insider”) and certain entities affiliated with any such person (an insider’s “related interest”) are subject to the conditions and limitations imposed by Section 22(h) of the Federal Reserve Act and the FRB’s Regulation O thereunder. Under these restrictions, the aggregate amount of the loans to any insider and related interests may not exceed the loans-to-one-borrower limit applicable to national banks. All loans by a savings association to all insiders and related interests in the aggregate may not exceed the savings association’s unimpaired capital and surplus. With certain exceptions, the Bank’s loans to an executive officer (other than certain education loans and residential mortgage loans) may not exceed $100,000. Regulation O also requires that any proposed loan to an insider or a related interest be approved in advance by a majority of the Bank’s board of directors, without the vote of any interested director, if such loan, when aggregated with any existing loans to that insider and related interests, would exceed $500,000. Generally, such loans must be made on substantially the same terms as, and follow credit underwriting procedures that are no less stringent than, those for comparable transactions with other persons and must not present more than a normal risk of collectability. There is an exception for extensions of credit pursuant to a benefit or compensation plan of a savings association that is widely available to employees that does not give preference to officers, directors, and other insiders. As of December 31, 2015, total loans to insiders were $787,000 (including $678,000 which relates to residential mortgages that have been sold in the secondary market).
Regulation and Supervision of the Company
General The Company is a registered savings and loan holding company under federal law and is subject to regulation, supervision, and enforcement actions by the FRB. Among other things, this authority permits the FRB to restrict or prohibit activities that are determined to be a risk to the Bank and to monitor and regulate the Company’s capital and activities such as dividends and share repurchases that can affect capital. Under long-standing FRB policy, holding companies are expected to serve as a source of strength for their depository subsidiaries, and may be called upon to commit financial resources and support to those subsidiaries. The requirement that the Company act as a source of strength for the Bank, and the future capital requirements at the Company level (refer to “Regulatory Capital Requirements,” below), may affect the Company's ability to pay dividends or make other distributions.
The Company may engage in activities permissible for a savings and loan holding company, a bank holding company, or a financial holding company, which generally encompass a wider range of activities that are financial in nature. The Company may not engage in any activities beyond that scope without the approval of the FRB.
Federal law prohibits a savings and loan holding company from acquiring control of another savings institution or holding company without prior regulatory approval. With some exceptions, it also prohibits the acquisition or retention of more than 5% of the equity securities of a company engaged in activities that are not closely related to banking or financial in nature or acquiring an institution that is not federally-insured. In evaluating applications to acquire savings institutions, the regulator must consider the financial and managerial resources, future prospects of the institution involved, the effect of the acquisition on the risk to the insurance fund, the convenience and needs of the community and competitive factors.
Regulatory Capital Requirements On January 1, 2015, regulatory capital standards as specified in Basel III became effective for savings and loan holding companies such as the Company (although certain aspects of the new standards will continue to phase in through 2019). These capital requirements are substantially the same as those required for the Bank (refer to “Regulation and Supervision of the Bank—Regulatory Capital Requirements,” above). However, the requirements are separately applied to the Company on a consolidated basis. As of December 31, 2015, the Company’s regulatory capital ratios exceeded both the minimum requirements to be classified as “adequately capitalized,” as well as higher requirements necessary to be classified as “well capitalized” for regulatory capital purposes. For additional information related to the Company’s regulatory capital ratios, refer to “Note 8. Shareholders’ Equity” in “Item 8. Financial Statements and Supplementary Data.”
| 19 |
Dividend and Other Capital Distribution Limitations FRB regulations generally govern capital distributions by savings and loan holding companies such as the Company, which include cash dividends and stock repurchases. Currently, the Company is not required to give the FRB any notice or application before the board of directors declares a dividend or approves a stock repurchase. In certain other circumstances, however, the Bank would be required to give the FRB a notice or an application that meets certain filing requirements before the board of directors declares a dividend or stock repurchase.
The FRB may disapprove or restrict dividends or stock repurchases if (i) the savings and loan holding company would be undercapitalized, significantly undercapitalized or critically undercapitalized following the distribution; (ii) the proposed capital distribution raises safety and soundness concerns; or (iii) the capital distribution would violate any applicable statute, regulation, agreement or regulatory-imposed condition. The FRB has substantial discretion in making these decisions.
The Company is highly dependent on the ability of the Bank to pay dividends or otherwise distribute its capital to the Company. Neither the Company nor the Bank can provide any assurances that dividends will continue to be paid by the Bank to the Company or the amount of any such dividends. Furthermore, the Company cannot provide any assurances that dividends will continue to be paid to shareholders, the amount of any such dividends, or whether additional shares of common stock will be repurchased under its current stock repurchase plan. For additional discussion related to the Company’s dividends and common stock repurchases refer to “Financial Condition—Shareholders’ Equity” in “Item 7. Management’s Discussion and Analysis of Financial Condition and Results of Operation.”
Acquisition of Bank Mutual Corporation No person may acquire control of the Company without first obtaining the approval of such acquisition by the appropriate federal regulator. Currently, any person, including a company, or group acting in concert, seeking to acquire 10% or more of the outstanding shares of the Company (or otherwise gain the ability to control the Company) must, depending on the circumstances, obtain the approval of, and/or file a notice with the FRB.
Federal and State Taxation
Federal Taxation The Company and its subsidiaries file a calendar year consolidated federal income tax return, reporting income and expenses using the accrual method of accounting. The federal income tax returns for the Company and its subsidiaries have been examined or closed without examination by the Internal Revenue Service (“IRS”) for tax years prior to 2012.
State Taxation The Company and its subsidiaries are subject to combined reporting in the state of Wisconsin. The state income tax returns for the Company and its subsidiaries have been examined and closed by the Wisconsin Department of Revenue for tax years prior to 2011.
| 20 |
In addition to the discussion and analysis set forth in “Item 7. Management’s Discussion and Analysis of Financial Condition and Results of Operations,” and the cautionary statements set forth in “Item 1. Business,” the following risk factors should be considered when evaluating the Company’s results of operations, financial condition, and outlook. These risk factors should also be considered when evaluating any investment decision with respect to the Company’s common stock.
The Company’s Loan Losses Could Be Significant in the Future and/or Could Exceed Established Allowances for Loan Losses, Which Could Have a Material Adverse Effect on the Company’s Results of Operations
The Company has policies and procedures in place to manage its exposure to risk related to its lending operations. However, despite these practices, the Company’s loan customers may not repay their loans according to the terms of the loans and the collateral securing the payment of these loans may be insufficient to pay any remaining loan balance. Economic weakness, including high unemployment rates and lower values for the collateral underlying loans, may affect borrowers’ ability or willingness to repay their loan obligations that could lead to increased loan losses or provisions. As a result, the Company may experience significant loan losses, including losses that may exceed the amounts established in the allowance for loan losses, which could have a material adverse effect on its operating results and capital.
Declines in Real Estate Values Could Adversely Affect Collateral Values and the Company’s Results of Operations
From time-to-time the Company’s market areas have experienced lower real estate values, higher levels of residential and non-residential tenant vacancies, and weakness in the market for sale of new or existing properties, for both commercial and residential real estate. Such developments could negatively affect the value of the collateral securing the Company’s mortgage and related loans and could in turn lead to increased losses on loans and foreclosed real estate. Increased losses would affect the Company’s loan loss allowance and may cause it to increase its provision for loan losses resulting in a charge to earnings and capital.
A Significant Portion of the Company’s Lending Activities Are Focused on Commercial Lending
The Company has identified multi-family, commercial real estate, commercial and industrial, and construction loans as areas for lending emphasis. Construction lending, in particular, has increased significantly in recent periods. Although the Company believes it has employed the appropriate management, sales, and administrative personnel, as well as installed the appropriate systems and procedures, to support this lending emphasis, these types of loans have historically carried greater risk of payment default than loans to retail borrowers. As the volume of commercial lending increases, credit risk increases. Construction loans have the additional risk of potential non-completion of the project. In the event of increased defaults from commercial borrowers or non-completion of construction projects, the Company’s provision for loan losses would further increase and loans may be written off and, therefore, earnings would be reduced. In addition, costs associated with the administration of problem loans increase and, therefore, earnings would be further reduced.
Further, as the portion of the Company's loans secured by the assets of commercial enterprises increases (including those related to construction projects), the Company becomes increasingly exposed to environmental liabilities and related compliance burdens. Even though the Company is also subject to environmental requirements in connection with residential real estate lending, the possibility of liability increases in connection with commercial lending, particularly in industries that use hazardous materials and/or generate waste or pollution or that own property that was the subject of prior contamination. If the Company does not adequately assess potential environmental risks, the value of the collateral it holds may be less than it expects; further, regulations expose the Bank to potential liability for remediation and other environmental compliance.
Regulators Continue to be Strict, which may Affect the Company's Business and Results of Operations
In addition to the effect of new laws and regulations, the regulatory climate in the U.S., particularly for financial institutions, continues to be strict. As a consequence, regulatory activity affecting financial institutions relating to a wide variety of safety and soundness and compliance issues continues to be elevated. Such regulatory activity, if directed at the Company or the Bank, could have an adverse effect on the Company's or the Bank's costs of compliance and results of operations.
| 21 |
The Bank’s Ability to Pay Dividends to the Company Is Subject to Limitations that May Affect the Company’s Ability to Pay Dividends to its Shareholders and/or Repurchase Its Stock
The Company is a separate legal entity from the Bank and engages in no substantial activities other than its ownership of the common stock of the Bank. Consequently, the Company’s net income and cash flows are derived primarily from the Bank’s operations and capital distributions. The availability of dividends from the Bank to the Company is limited by various statutes and regulations, including those of the OCC and FRB. As a result, it is possible, depending on the results of operations and the financial condition of the Bank and other factors, that the OCC and/or the FRB could restrict the payment by the Bank of dividends or other capital distributions or take other actions which could negatively affect the Bank's results and dividend capacity. The federal regulators continue to be stringent in their interpretation, application and enforcement of banks' capital requirements, which could affect the regulators’ willingness to allow Bank dividends to the Company. If the Bank is required to reduce its dividends to the Company, or is unable to pay dividends at all, or the FRB separately does not allow the Company to pay dividends, the Company may not be able to pay dividends to its shareholders at existing levels or at all and/or may not be able to repurchase its common stock.
Global Credit Market Volatility and Weak Economic Conditions May Significantly Affect the Company’s Liquidity, Financial Condition, and Results of Operations
Global financial markets continue to be volatile from time to time, and economic performance has been inconsistent in various countries. Developments relating to the federal budget, federal borrowing authority, and/or other political issues could also negatively impact these markets, as could global developments such as a foreign sovereign debt crisis or in the war on terrorism. Volatility and/or instability in global financial markets could also affect the Company’s ability to sell investment securities and other financial assets, which in turn could adversely affect the Company’s liquidity and financial position. These factors could also affect the prices at which the Company could make any such sales, which could adversely affect its results of operations and financial condition. Conditions could also negatively affect the Company’s ability to secure funds or raise capital for acquisitions and other projects, which in turn, could cause the Company to use deposits or other funding sources for such projects.
In addition, the volatility of the markets and weakness of global economies could affect the strength of the Company’s customers or counterparties, their willingness to do business with, and/or their ability or willingness to fulfill their obligations to the Company, which could further affect the Company’s results of operations. Conditions such as high unemployment, weak corporate performance, and soft real estate markets, could negatively affect the volume of loan originations and prepayments, the value of the real estate securing the Company’s mortgage loans, and borrowers’ ability or willingness to repay loan obligations, all of which could adversely impact the Company’s results of operations and financial condition.
Recent and Future Legislation and Rulemaking May Significantly Affect the Company’s Results of Operations and Financial Condition
Instability, volatility, and failures in the credit and financial institutions markets in recent years have led regulators and legislators to consider and/or adopt proposals that will significantly affect financial institutions and their holding companies, including the Company. Legislation such as the Emergency Economic Stabilization Act of 2008, the American Recovery and Reinvestment Act of 2009, and the Dodd-Frank Act, were adopted. Although designed to address safety, soundness, and compliance issues in the banking system, there can be no assurance as to the ultimate impact of these actions on financial markets, which could have a material, adverse effect on the Company’s business, financial condition, results of operations, access to credit or the value of the Company’s securities. Further legislative and regulatory proposals to reform the U.S. financial system would also affect the Company and the Bank.
The Dodd-Frank Act created the CFPB, which has broad rulemaking and enforcement authority with respect to entities, including financial institutions, that offer to consumers covered financial products and services. The CFPB is required to adopt rules identifying practices or acts that are unfair, deceptive or abusive relating to any customer transaction for a consumer financial product or service, or the offering of a consumer financial product or service. Although management does not expect rules implemented to date to have a significant adverse impact on the Company, the full scope of the impact of the CFPB’s authority has not yet been determined as all related rules have not all yet been adopted. The Company cannot yet determine the costs and limitations related to these additional regulatory requirements; however, the costs of compliance and the effect on its business may have a material adverse effect on the Company's operations and results.
| 22 |
The Interest Rate Environment May Have an Adverse Impact on the Company’s Net Interest Income
Volatile interest rate environments make it difficult for the Company to coordinate the timing and amount of changes in the rates of interest it pays on deposits and borrowings with the rates of interest it earns on loans and securities. In addition, volatile interest rate environments cause corresponding volatility in the demand by individuals and businesses for the loan and deposit products offered by the Company. These factors have a direct impact on the Company’s net interest income, and consequently, its net income. Future interest rates could continue to be volatile and management is unable to predict the impact such volatility would have on the net interest income and profits of the Company.
Strong Competition Within the Company’s Market Area May Affect Net Income
The Company encounters strong competition both in attracting deposits from customers and originating loans to commercial and retail borrowers. The Company competes with commercial banks, savings institutions, mortgage banking firms, credit unions, finance companies, mutual funds, insurance companies, and brokerage and investment banking firms. The Company’s market area includes branches of several commercial banks that are substantially larger than the Company in terms of deposits and loans. In addition, tax-exempt credit unions operate in most of the Company’s market area and aggressively price their products and services to a large part of the population. If competitors succeed in attracting business from the Company’s customers, its deposits and loans could be reduced, which would likely affect earnings.
Developments in the Marketplace, Such as Alternatives to Traditional Financial Institutions, or Adverse Publicity Could Affect the Company's Ongoing Business
Changes in the marketplace are allowing retail and business consumers to use alternative means to complete financial transactions that previously had been conducted through banks. For example, consumers can increasingly maintain funds in accounts other than bank deposits or through the internet, or complete payment transactions without the assistance of banks. In addition, consumers increasingly have access to non-bank sources for loans. Continuation or acceleration of these trends, including newly developing means of communications and technology, could cause consumers to utilize fewer of the Company's services, which could have a material adverse effect on its results.
Financial institutions such as the Company continue to be under a high level of governmental, media, and other scrutiny, as to the conduct of their businesses, and potential issues and adverse developments (real and perceived) often receive widespread media attention. If there were to be significant adverse publicity about the Company, that publicity could affect its reputation in the marketplace. If the Company's reputation is diminished, it could affect its business and results of operations as well as the price of the Company's common stock.
The Company Is Subject to Security Risks and Failures and Operational Risks Relating to the Use of Technology that Could Damage Its Reputation and Business
The protection of customer data from potential breaches of the Company’s computer systems is an increasing concern, as is the potential for disruption of the Company’s internet banking services, through which it increasingly provides services, as well as other systems through which the Company provides services. The security of company and customer data and protection against disruptions of companies’ computer systems are increasing matters of industry, customer, and regulatory scrutiny given the significant potential consequences of failures in these matters and the potential negative publicity surrounding instances of cybersecurity breaches. In addition, these risks can be difficult to predict or defend against, as the persons committing such attacks often employ novel methods of accessing or disrupting the computer systems of their targets.
Security breaches in the Company’s internet, telephonic, or other electronic banking activities could expose it to possible liability and damage its reputation. Any compromise of the Company’s security also could deter customers from using its internet or other banking services that involve the transmission and/or retention of confidential information. The Company relies on internet and other security systems to provide the security and authentication necessary to effect secure transmission of data. These precautions may not protect the Company’s systems from compromises or breaches of its security measures, which could result in damage to the Company’s reputation and business and affect its results of operations.
| 23 |
Additionally, as a financial institution, the Company’s business is data intensive. Beyond the inherent nature of a financial institution that requires it to process and track extremely large numbers of financial transactions and accounts, the Company is required to collect, maintain, and keep secure significant data about its customers. These operations require the Company to obtain and maintain technology and security-related systems that are mission critical to its business. The Company’s failure to do so could significantly affect its ability to conduct business and its customers' confidence in it. Further, the Company outsources a large portion of its data processing to third parties. If these third party providers encounter technological or other difficulties or if they have difficulty in communicating with the Company or if there is a breach of security, it will significantly affect the Company’s ability to adequately process and account for customer transactions, which would significantly affect the Company’s business operations and reputation.
Further, the technology affecting the financial institutions industry and consumer financial transactions is rapidly changing, with the frequent introduction of new products, services, and alternatives. The future success of the Company requires that it continue to adapt to these changes in technology to address its customers' needs. Many of the Company's competitors have greater technological resources to invest in these improvements. These changes could be costly to the Company and if the Company does not continue to offer the services and technology demanded by the marketplace, this failure to keep pace with change could materially affect its business, financial condition, and results of operation.
The Company’s Ability to Grow May Be Limited if It Cannot Make Acquisitions
The Company will continue to seek to expand its banking franchise by growing internally, acquiring other financial institutions or branches, acquiring other financial services providers, and opening new offices. The Company’s ability to grow through selective acquisitions of other financial institutions or branches will depend on successfully identifying, acquiring, and integrating those institution or branches. The Company has not made any acquisitions in recent years, as management has not identified acquisitions for which it was able to reach an agreement on terms management believed were appropriate and/or that met its acquisition criteria. The Company cannot provide any assurance that it will be able to generate internal growth, identify attractive acquisition candidates, make acquisitions on favorable terms, or successfully integrate any acquired institutions or branches.
The Company Depends on Certain Key Personnel and the Company’s Business Could Be Harmed by the Loss of Their Services or the Inability to Attract Other Qualified Personnel
The Company’s success depends in large part on the continued service and availability of its management team, and on its ability to attract, retain and motivate qualified personnel, particularly customer relationship managers. The competition for these individuals can be significant, and the loss of key personnel could harm the Company’s business. The Company cannot provide assurances that it will be able to retain existing key personnel or attract additional qualified personnel.
| 24 |
Item 1B. Unresolved Staff Comments
None.
As of December 31, 2015, the Company and its subsidiaries conducted their business through an executive office and 69 banking offices. As of December 31, 2015, the Company owned the building and land for 62 of its property locations and leased the space for eight.
In March 2016 the Company expects to complete the consolidation of four banking offices into nearby offices. The Company owns the building and land for three of these locations and leases the space for one. However, the leased location had a free-standing ATM on land adjacent to the office that is owned by the Company. The Company intends to retain this land and continue to operate the ATM. For additional discussion, refer to “Results of Operations—Non-Interest Expense” in “Item 7. Management's Discussion and Analysis of Financial Condition and Results of Operations.”
The Company also owns 15 acres of developed land in a suburb of Milwaukee, Wisconsin, through its MC Development subsidiary, as well as approximately 300 acres of undeveloped land in another community located near Milwaukee through MC Development’s 50% ownership in Arrowood Development LLC. The Company’s interest in the net book value of these parcels of land was $2.2 million at December 31, 2015.
The Company is not involved in any pending legal proceedings other than routine legal proceedings occurring in the ordinary course of business. Management believes that these routine legal proceedings, in the aggregate, are immaterial to the Company’s financial condition, results of operations, and cash flows.
Item 4. Mine Safety Disclosures
Not applicable.
Executive Officers
Refer to “Item 10. Directors, Executive Officers, and Corporate Governance,” for information regarding the executive officers of the Company and the Bank.
| 25 |
| Item 5. | Market for Registrant's Common Equity, Related Stockholder Matters’ and Issuer Purchase of Equity Securities |
The common stock of the Company is traded on The NASDAQ Global Select Market under the symbol BKMU.
As of February 29, 2016, there were 45,575,567 shares of common stock outstanding and approximately 8,500 shareholders of record.
The Company paid a total cash dividend of $0.19 per share in 2015. A cash dividend of $0.05 per share was paid on February 26, 2016, to shareholders of record on February 12, 2016. For additional discussion relating to the Company’s dividends, refer to “Financial Condition—Shareholders’ Equity” in “Item 7. Management’s Discussion and Analysis of Financial Condition and Results of Operations.” The payment of dividends in the future is discretionary with the Company’s board of directors and will depend on the Company’s operating results, financial condition, and other considerations. Refer also to “Item 1. Business—Regulation and Supervision” for information relating to regulatory limitations on the Company’s payment of dividends to shareholders, as well as the payment of dividends by the Bank to the Company, which in turn could affect the payment of dividends by the Company.
The quarterly high and low trading prices of the Company’s common stock from January 1, 2014, through December 31, 2015, and the dividends paid in each quarter, were as follows:
| 2015 Stock Prices | 2014 Stock Prices | Cash Dividends Paid | ||||||||||||||||||||||
| High | Low | High | Low | 2015 | 2014 | |||||||||||||||||||
| 1st Quarter | $ | 7.39 | $ | 6.37 | $ | 7.34 | $ | 6.21 | $ | 0.04 | $ | 0.03 | ||||||||||||
| 2nd Quarter | 7.75 | 7.02 | 6.46 | 5.80 | 0.05 | 0.04 | ||||||||||||||||||
| 3rd Quarter | 7.78 | 6.78 | 6.62 | 5.93 | 0.05 | 0.04 | ||||||||||||||||||
| 4th Quarter | 8.05 | 7.03 | 6.99 | 6.17 | 0.05 | 0.04 | ||||||||||||||||||
| Total | $ | 0.19 | $ | 0.15 | ||||||||||||||||||||
From January 1, 2016, to February 29, 2016, the trading price of the Company's common stock ranged between $7.21 to $7.88 per share, and closed this period at $7.47 per share.
The Company’s board of directors announced a stock repurchase plan on February 2, 2015, that authorized the purchase of up to 2.3 million shares of the Company’s common stock. During 2015 the Company repurchased 1.5 million shares of stock under this plan at an average price of $7.18. The following table provides information about shares that were repurchased under this plan during the fourth quarter of 2015.
| Month | Shares Purchased | Average Price Per Share | Total Number of Shares Purchased as Part of Publicly Announced Plans | Number of Shares That May Yet Be Purchased Under the Plan | ||||||||||||
| October 2015 | 102,160 | $ | 7.24 | 102,160 | 926,099 | |||||||||||
| November 2015 | 56,657 | 7.26 | 56,657 | 869,442 | ||||||||||||
| December 2015 | – | – | – | 869,442 | ||||||||||||
| Total/Average | 158,817 | $ | 7.25 | 158,817 | ||||||||||||
From January 1, 2016, to February 2, 2016, 500 additional shares were purchased at an average price per share of $7.25 under the plan, which expired on February 2, 2016. However, on February 1, 2016, the Company’s board of directors announced a new stock repurchase plan that authorized the purchase of up to 1.0 million shares of the Company’s common stock. From February 1, 2016, to February 29, 2016, the Company repurchased 5,281 shares at an average price of $7.28 under the new plan. For additional information relating to the Company’s stock repurchase plans, refer to “Financial Condition—Shareholders’ Equity,” in “Item 7. Management’s Discussion and Analysis of Financial Condition and Results of Operations.” For additional discussion relating to the Company’s ability to repurchase of its common stock, refer to “Item 1. Business—Shareholders’ Equity” and “Item 1. Business—Regulation and Supervision.”
| 26 |
Set forth below is a line graph comparing the cumulative total shareholder return on Company common stock, based on the market price of the common stock and assuming reinvestment of cash dividends, with the cumulative total return of companies on the NASDAQ Stock Market U.S. Index (“NASDAQ Composite Index”) and the NASDAQ Stock Market Bank Index. The graph assumes that $100 was invested on December 31, 2010, in Company common stock and each of those indices.
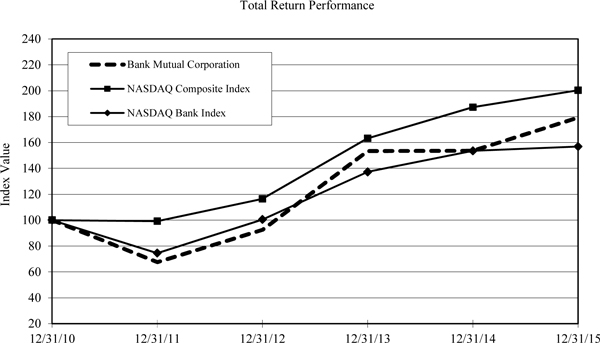
| Period Ending December 31 | ||||||||||||||||||||||||
| Index | 2010 | 2011 | 2012 | 2013 | 2014 | 2015 | ||||||||||||||||||
| Bank Mutual Corporation | 100.00 | 67.58 | 92.53 | 153.34 | 153.60 | 179.23 | ||||||||||||||||||
| NASDAQ Composite Index | 100.00 | 99.17 | 116.48 | 163.21 | 187.23 | 200.31 | ||||||||||||||||||
| NASDAQ Bank Index | 100.00 | 74.57 | 100.48 | 137.27 | 153.50 | 156.89 | ||||||||||||||||||
| 27 |
Item 6. Selected Financial Data
The following table provides selected financial data for the Company for its past five fiscal years. The data is derived from the Company’s audited financial statements, although the table itself is not audited. The following data should be read together with the Company’s consolidated financial statements and related notes and “Item 7. Management's Discussion and Analysis of Financial Condition and Results of Operations.”
| At December 31 | ||||||||||||||||||||
| 2015 | 2014 | 2013 | 2012 | 2011 | ||||||||||||||||
| (Dollars in thousands, except number of shares and per share amounts) | ||||||||||||||||||||
| Selected financial condition data: | ||||||||||||||||||||
| Total assets | $ | 2,502,167 | $ | 2,328,446 | $ | 2,347,349 | $ | 2,418,264 | $ | 2,498,484 | ||||||||||
| Loans receivable, net | 1,740,018 | 1,631,303 | 1,508,996 | 1,402,246 | 1,319,636 | |||||||||||||||
| Loans held-for-sale | 3,350 | 3,837 | 1,798 | 10,739 | 19,192 | |||||||||||||||
| Mortgage-related securities available-for-sale | 407,874 | 321,883 | 446,596 | 550,185 | 781,770 | |||||||||||||||
| Mortgage-related securities held-to-maturity | 120,891 | 132,525 | 155,505 | 157,558 | – | |||||||||||||||
| Foreclosed properties and repossessed assets | 3,306 | 4,668 | 6,736 | 13,961 | 24,724 | |||||||||||||||
| Mortgage servicing rights, net | 7,205 | 7,867 | 8,737 | 6,821 | 7,401 | |||||||||||||||
| Deposit liabilities | 1,795,591 | 1,718,756 | 1,762,682 | 1,867,899 | 2,021,663 | |||||||||||||||
| Borrowings | 372,375 | 256,469 | 244,900 | 210,786 | 153,091 | |||||||||||||||
| Shareholders' equity | 279,394 | 280,717 | 281,037 | 271,853 | 265,771 | |||||||||||||||
| Number of shares outstanding, net of treasury stock | 45,443,548 | 46,568,284 | 46,438,284 | 46,326,484 | 46,228,984 | |||||||||||||||
| Book value per share | $ | 6.15 | $ | 6.03 | $ | 6.05 | $ | 5.87 | $ | 5.75 | ||||||||||
| For the Year Ended December 31 | ||||||||||||||||||||
| 2015 | 2014 | 2013 | 2012 | 2011 | ||||||||||||||||
| (Dollars in thousands, except per share amounts) | ||||||||||||||||||||
| Selected operating data: | ||||||||||||||||||||
| Total interest income | $ | 77,901 | $ | 79,265 | $ | 79,456 | $ | 83,022 | $ | 89,345 | ||||||||||
| Total interest expense | 9,566 | 9,416 | 13,112 | 21,641 | 26,756 | |||||||||||||||
| Net interest income | 68,335 | 69,849 | 66,344 | 61,381 | 62,589 | |||||||||||||||
| Provision for loan losses | (3,665 | ) | 233 | 4,506 | 4,545 | 6,710 | ||||||||||||||
| Total non-interest income | 23,239 | 22,349 | 26,116 | 29,259 | 23,158 | |||||||||||||||
| Total non-interest expense (1) | 72,727 | 68,461 | 71,504 | 76,057 | 124,900 | |||||||||||||||
| Income (loss) before income taxes | 22,512 | 23,504 | 16,450 | 10,038 | (45,863 | ) | ||||||||||||||
| Income tax expense | 8,335 | 8,850 | 5,702 | 3,336 | 1,752 | |||||||||||||||
| Net income (loss) before non-controlling interest | 14,177 | 14,654 | 10,748 | 6,702 | (47,615 | ) | ||||||||||||||
| Net loss attributable to non-controlling interest | – | 11 | 48 | 52 | 50 | |||||||||||||||
| Net income (loss) | $ | 14,177 | $ | 14,665 | $ | 10,796 | $ | 6,754 | $ | (47,565 | ) | |||||||||
| Earnings (loss) per share-basic | $ | 0.31 | $ | 0.32 | $ | 0.23 | $ | 0.15 | $ | (1.03 | ) | |||||||||
| Earnings (loss) per share-diluted | 0.31 | 0.31 | 0.23 | 0.15 | (1.03 | ) | ||||||||||||||
| Cash dividends paid per share | 0.19 | 0.15 | 0.10 | 0.05 | 0.06 | |||||||||||||||
| (1) | Total non-interest expense in 2011 includes a goodwill impairment of $52.6 million. |
| 28 |
| At or For the Year Ended December 31 | ||||||||||||||||||||
| 2015 | 2014 | 2013 | 2012 | 2011 | ||||||||||||||||
| Selected financial ratios: | ||||||||||||||||||||
| Net interest margin (2) | 3.11 | % | 3.32 | % | 3.11 | % | 2.67 | % | 2.76 | % | ||||||||||
| Net interest rate spread | 3.02 | 3.24 | 3.02 | 2.57 | 2.64 | |||||||||||||||
| Return on average assets | 0.59 | 0.63 | 0.46 | 0.27 | (1.87 | ) | ||||||||||||||
| Return on average shareholders' equity | 5.07 | 5.14 | 3.93 | 2.50 | (16.37 | ) | ||||||||||||||
| Efficiency ratio (3) | 79.61 | 74.34 | 77.34 | 84.04 | 85.07 | |||||||||||||||
| Non-interest expense as a percent of adjusted average assets (4) | 3.00 | 2.94 | 3.03 | 3.03 | 2.84 | |||||||||||||||
| Shareholders' equity to total assets | 11.17 | 12.06 | 11.97 | 11.24 | 10.64 | |||||||||||||||
| Selected asset quality ratios: | ||||||||||||||||||||
| Non-performing loans to loans receivable, net | 0.78 | % | 0.74 | % | 0.86 | % | 1.84 | % | 5.69 | % | ||||||||||
| Non-performing assets to total assets | 0.68 | 0.72 | 0.84 | 1.64 | 4.00 | |||||||||||||||
| Allowance for loan losses to non-performing loans | 129.51 | 185.68 | 181.62 | 83.64 | 37.17 | |||||||||||||||
| Allowance for loan losses to total loans receivable, net | 1.01 | 1.37 | 1.56 | 1.54 | 2.12 | |||||||||||||||
| Charge-offs to average loans | 0.06 | 0.10 | 0.18 | 0.78 | 1.96 | |||||||||||||||
| (2) | Net interest margin is calculated by dividing net interest income by average earnings assets. |
| (3) | Efficiency ratio is calculated by dividing non-interest expense (excluding goodwill impairment) by the sum of net interest income and non-interest income (excluding gains and losses on investments and real estate). |
| (4) | The ratio in 2011 excludes the impact of the goodwill impairment. |
| 29 |
Item 7. Management's Discussion and Analysis of Financial Condition and Results of Operations
The discussion and analysis in this section should be read in conjunction with “Item 8. Financial Statements and Supplementary Data,” and “Item 7A. Quantitative and Qualitative Disclosures about Market Risk,” as well as “Item 1. Business” and “Item 1A. Risk Factors.”
Results of Operations
Overview The Company’s net income for the years ended December 31, 2015, 2014, and 2013, was $14.2 million, $14.7 million, and $10.8 million, respectively. Diluted earnings per share during these periods were $$0.31, $0.31, and $0.23, respectively. The Company’s net income during these periods represented a return on average assets (“ROA”) of 0.59%, 0.63%, and 0.46%, respectively, and a return on average equity (“ROE”) of 5.07%, 5.14%, and 3.93%, respectively.
The Company’s net income in 2015 was impacted by the following unfavorable developments compared to 2014:
| • | a $3.5 million or 8.5% increase in compensation-related expenses; |
| • | a $1.5 million or 2.2% decrease in net interest income; |
| • | a $1.5 million or 22.8% increase in occupancy, equipment, and data processing costs; and |
| • | a $920,000 or 33.0% decrease in income form bank-owned life insurance. |
These unfavorable developments were partially offset by the following favorable developments in 2015 compared to 2014:
| • | a $3.9 million decrease in provision for (recovery of) loan losses; |
| • | a $1.0 million or 39.0% increase in brokerage and insurance commissions; |
| • | a $713,000 or 7.1% decrease in other non-interest expense; |
| • | a $676,000 or 41.6% increase in loan-related fees; and |
| • | a $518,000 non-recurring charge in 2014 related to state income taxes, net of federal benefit. |
The Company’s net income in 2014 was impacted by the following favorable developments compared to 2013:
| • | a $3.5 million or 5.3% increase in net interest income; |
| • | a $4.3 million or 94.8% decrease in provision for (recovery of) loan losses; |
| • | a $2.6 million or 5.8% decrease in compensation-related expenses; and |
| • | a $1.3 million or 57.0% decrease in net losses and expenses on foreclosed real estate. |
These favorable developments were partially offset by the following unfavorable developments in 2014 compared to 2013:
| • | a $3.9 million or 56.5% decrease in net mortgage banking revenue; |
| • | a $906,000 or 7.6% increase in occupancy and equipment expense; |
| • | a $518,000 non-recurring charge related to state income taxes, net of federal benefit; and |
| • | a $2.6 million or 46.1% increase in income tax expense, excluding the non-recurring charge. |
The following paragraphs discuss these developments in greater detail, as well as other changes in the components of net income during the years ended December 31, 2015, 2014, and 2013.
| 30 |
Net Interest Income The Company’s net interest income declined by $1.5 million or 2.2% during the twelve months ended December 31, 2015, compared to the same period in 2014. This decline was primarily attributable to a decrease in the Company’s net interest margin that was only partially offset by an increase in earning assets and an increase in funding from non-interest-bearing checking accounts. The Company’s net interest margin was 3.11% in 2015 compared to 3.32% in 2014. In 2015 the average yield on the Company’s earning assets declined by 23 basis points compared to 2014, but the average cost of funds declined by only one basis point. The decline in the average yield on earning assets was largely due to the continued repricing of the Company’s loan portfolio to lower rates in the current interest rate environment, as well as its continued emphasis on the origination of variable-rate loans, which generally have lower initial yields than fixed-rate loans. Also contributing to the decline in yield on earning assets was the purchase of mortgage-related securities in 2015 at yields that were generally less than the prevailing yields in the securities portfolio.
The one basis point decline in the Company’s average cost of funds in 2015 compared to 2014 was due principally to a decrease in its average cost of borrowed funds. This decrease was caused by an increase in overnight borrowings from FHLB of Chicago, which were drawn to fund growth in earning assets in 2015. Overnight borrowings from the FHLB of Chicago generally have a lower initial interest cost than the Company’s certificates of deposit. The benefit of this lower interest cost more than offset an increase in the average cost of the Company’s certificates of deposits in 2015. In that year the Company increased the rates and lengthened the maturity terms on certain of the certificates of deposit it offers customers in an effort to fund growth in earning assets and to manage exposure to future changes in interest rates.
The Company’s average earning assets increased by $97.7 million or 4.6% during the twelve months ended December 31, 2015, compared to the same period in 2014. This increase was primarily attributable to a $99.7 million or 6.5% increase in average loans receivable in 2015. This development was partially offset by a small decrease in average mortgage-related securities in 2015 compared to 2014. Although the full-year average of mortgage-related securities declined between these years, the average balance of such securities actually increased during the last half of 2015 due to an increase in purchases of such securities.
Also contributing favorably to the Company’s net interest income in 2015, as well as its net interest margin in that year, was an increase in funding from non-interest-bearing checking accounts. The average balance in these accounts increased by $22.9 million or 12.4% in 2015 compared to 2014.
The Company’s net interest income increased by $3.5 million or 5.3% during the twelve months ended December 31, 2014, compared to the same period in 2013. This increase was primarily attributable to a 21 basis point increase in the Company’s net interest margin, from 3.11% in 2013 to 3.32% in 2014. This increase was due primarily to an improved earning asset mix and an improved funding mix in 2014. Specifically, the Company’s average loans receivable increased by $109.3 million or 7.6% in 2014 compared to 2013, and its average mortgage-related securities, investment securities, and overnight investments declined by $140.1 million or 20.0% in the aggregate in 2014. Loans receivable generally have a higher yield than securities and overnight investments.
With respect to the Company’s funding mix in 2014, its average non-interest-bearing checking accounts increased by $61.8 million or over 50% in that year compared to 2013. In contrast, its average certificates of deposit declined by $148.5 million or 20.8% in 2014 compared to 2013. Also contributing to the improvement in funding mix in 2014 was a $44.7 million or 21.6% increase in average borrowings from the FHLB of Chicago. This increase, which funded loan growth and net deposit outflows in 2014, had a marginal average interest cost in that year that was lower than the average cost of the Company’s certificates of deposit.
Also contributing to the improvement in net interest margin in 2014 was a 38 basis point decline in the average cost of the Company’s certificates of deposit compared to the prior year. During most of 2014 the Company’s pricing strategy was to price certificates of deposits lower in order to reduce its overall funding cost and improve its funding mix, as noted in the previous paragraph.
The favorable impact of the aforementioned developments on net interest income in 2014 were partially offset by a $30.8 million or 1.4% decrease in average earning assets in 2014 compared to 2013. The Company’s earning assets declined in 2014 as it utilized available cash flow in that year to fund a net decrease in deposit liabilities, particularly certificates of deposit, as previously described.
| 31 |
Finally, included in net interest income in 2015 and 2014 were call premiums of $219,000 and $512,000, respectively, that the Company received on mortgage-related securities called by their issuer in those periods. These call premiums increased the Company’s reported net interest margin by one and two basis points in 2015 and 2014, respectively.
The following table presents certain details regarding the Company's average balance sheet and net interest income for the periods indicated. The tables present the average yield on interest-earning assets and the average cost of interest-bearing liabilities. The yields and costs are derived by dividing income or expense by the average balance of interest-earning assets or interest-bearing liabilities, respectively, for the periods shown. The average balances are derived from daily balances over the periods indicated. Interest income includes prepayment fees, accretion or amortization of deferred fees and costs, and accretion or amortization of purchase discounts and premiums, all of which are considered adjustments to the yield of the related assets. Net interest spread is the difference between the yield on interest-earning assets and the rate paid on interest-bearing liabilities. Net interest margin is derived by dividing net interest income by average interest-earning assets. The Company’s tax exempt investments are insignificant, so no tax equivalent adjustments have been made.
| Year Ended December 31 | ||||||||||||||||||||||||||||||||||||
| 2015 | 2014 | 2013 | ||||||||||||||||||||||||||||||||||
| Interest | Avg. | Interest | Avg. | Interest | Avg. | |||||||||||||||||||||||||||||||
| Average | Earned/ | Yield/ | Average | Earned/ | Yield/ | Average | Earned/ | Yield/ | ||||||||||||||||||||||||||||
| Balance | Paid | Cost | Balance | Paid | Cost | Balance | Paid | Cost | ||||||||||||||||||||||||||||
| (Dollars in thousands) | ||||||||||||||||||||||||||||||||||||
| Assets: | ||||||||||||||||||||||||||||||||||||
| Interest-earning assets: | ||||||||||||||||||||||||||||||||||||
| Loans receivable, net (1) | $ | 1,641,567 | $ | 65,954 | 4.02 | % | $ | 1,541,879 | $ | 66,261 | 4.30 | % | $ | 1,432,606 | $ | 64,638 | 4.51 | % | ||||||||||||||||||
| Mortgage-related securities | 525,222 | 11,684 | 2.22 | 533,902 | 12,850 | 2.41 | 626,084 | 14,666 | 2.34 | |||||||||||||||||||||||||||
| Investment securities (2) | 16,362 | 244 | 1.49 | 13,633 | 139 | 1.02 | 12,168 | 54 | 0.44 | |||||||||||||||||||||||||||
| Interest-earning deposits | 17,333 | 19 | 0.11 | 13,339 | 15 | 0.11 | 62,742 | 98 | 0.16 | |||||||||||||||||||||||||||
| Total interest-earning assets | 2,200,484 | 77,901 | 3.54 | 2,102,753 | 79,265 | 3.77 | 2,133,600 | 79,456 | 3.72 | |||||||||||||||||||||||||||
| Non-interest-earning assets | 221,267 | 225,444 | 228,010 | |||||||||||||||||||||||||||||||||
| Total average assets | $ | 2,421,751 | $ | 2,328,197 | $ | 2,361,610 | ||||||||||||||||||||||||||||||
| Liabilities and equity: | ||||||||||||||||||||||||||||||||||||
| Interest-bearing liabilities: | ||||||||||||||||||||||||||||||||||||
| Savings deposits | $ | 220,038 | 46 | 0.02 | $ | 222,930 | 55 | 0.02 | $ | 226,307 | 62 | 0.03 | ||||||||||||||||||||||||
| Money market accounts | 511,793 | 702 | 0.14 | 503,090 | 735 | 0.15 | 478,938 | 694 | 0.14 | |||||||||||||||||||||||||||
| Interest-bearing demand accounts | 246,711 | 30 | 0.01 | 228,578 | 30 | 0.01 | 220,381 | 32 | 0.01 | |||||||||||||||||||||||||||
| Certificates of deposit | 536,457 | 3,993 | 0.74 | 564,505 | 3,834 | 0.68 | 713,043 | 7,537 | 1.06 | |||||||||||||||||||||||||||
| Total deposit liabilities | 1,514,999 | 4,771 | 0.31 | 1,519,103 | 4,684 | 0.31 | 1,638,669 | 8,325 | 0.51 | |||||||||||||||||||||||||||
| Advance payment by borrowers for taxes and insurance | 20,107 | 1 | 0.00 | 20,949 | 1 | 0.00 | 21,881 | 2 | 0.01 | |||||||||||||||||||||||||||
| Borrowings | 313,655 | 4,794 | 1.53 | 252,128 | 4,731 | 1.88 | 207,404 | 4,785 | 2.31 | |||||||||||||||||||||||||||
| Total interest-bearing liabilities | 1,848,761 | 9,566 | 0.52 | 1,792,180 | 9,416 | 0.53 | 1,867,954 | 13,112 | 0.70 | |||||||||||||||||||||||||||
| Non-interest-bearing liabilities: | ||||||||||||||||||||||||||||||||||||
| Non-interest-bearing deposits | 207,372 | 184,479 | 122,677 | |||||||||||||||||||||||||||||||||
| Other non-interest-bearing liabilities | 85,928 | 66,067 | 96,215 | |||||||||||||||||||||||||||||||||
| Total non-interest-bearing liabilities | 293,300 | 250,546 | 218,892 | |||||||||||||||||||||||||||||||||
| Total liabilities | 2,142,061 | 2,042,726 | 2,086,846 | |||||||||||||||||||||||||||||||||
| Total equity | 279,690 | 285,471 | 274,764 | |||||||||||||||||||||||||||||||||
| Total average liabilities and equity | $ | 2,421,751 | $ | 2,328,197 | $ | 2,361,610 | ||||||||||||||||||||||||||||||
| Net interest income and net interest rate spread | $ | 68,335 | 3.02 | % | $ | 69,849 | 3.24 | % | $ | 66,344 | 3.02 | % | ||||||||||||||||||||||||
| Net interest margin | 3.11 | % | 3.32 | % | 3.11 | % | ||||||||||||||||||||||||||||||
| Average interest-earning assets to interest-bearing liabilities | 1.19 | x | 1.17 | x | 1.14 | x | ||||||||||||||||||||||||||||||
| (1) | For the purposes of these computations, non-accruing loans and loans held-for-sale are included in the average loans outstanding. |
| (2) | Investment securities consist of FHLB of Chicago common stock, which is owned as a condition of membership in that organization. |
| 32 |
The following tables present the extent to which changes in interest rates and changes in the volume of interest-earning assets and interest-bearing liabilities have affected the Company’s interest income and interest expense during the periods indicated. Information is provided in each category with respect to the change attributable to change in volume (change in volume multiplied by prior rate), the change attributable to change in rate (change in rate multiplied by prior volume), and the net change. The change attributable to the combined impact of volume and rate has been allocated proportionately to the change due to volume and the change due to rate.
| Year
Ended December 31, 2015, Compared to Year Ended December 31, 2014 | ||||||||||||
| Increase (Decrease) | ||||||||||||
| Volume | Rate | Net | ||||||||||
| (Dollars in thousands) | ||||||||||||
| Interest-earning assets: | ||||||||||||
| Loans receivable | $ | 4,150 | $ | (4,457 | ) | $ | (307 | ) | ||||
| Mortgage-related securities | (165 | ) | (1,001 | ) | (1,166 | ) | ||||||
| Investment securities | 32 | 73 | 105 | |||||||||
| Interest-earning deposits | 4 | – | 4 | |||||||||
| Total interest-earning assets | 4,021 | (5,385 | ) | (1,364 | ) | |||||||
| Interest-bearing liabilities: | ||||||||||||
| Savings deposits | (7 | ) | (2 | ) | (9 | ) | ||||||
| Money market deposits | 13 | (46 | ) | (33 | ) | |||||||
| Interest-bearing demand deposits | 2 | (2 | ) | – | ||||||||
| Certificates of deposit | (197 | ) | 326 | 129 | ||||||||
| Advance payment by borrowers for taxes and insurance | – | – | – | |||||||||
| Borrowings | 1,035 | (972 | ) | 63 | ||||||||
| Total interest-bearing liabilities | 846 | (696 | ) | 150 | ||||||||
| Net change in net interest income | $ | 3,175 | $ | (4,689 | ) | $ | (1,514 | ) | ||||
| Year
Ended December 31, 2014, Compared to Year Ended December 31, 2013 | ||||||||||||
| Increase (Decrease) | ||||||||||||
| Volume | Rate | Net | ||||||||||
| (Dollars in thousands) | ||||||||||||
| Interest-earning assets: | ||||||||||||
| Loans receivable | $ | 4,718 | $ | (3,095 | ) | $ | 1,623 | |||||
| Mortgage-related securities | (2,243 | ) | 427 | (1,816 | ) | |||||||
| Investment securities | 7 | 78 | 85 | |||||||||
| Interest-earning deposits | (61 | ) | (22 | ) | (83 | ) | ||||||
| Total interest-earning assets | 2,421 | (2,612 | ) | (191 | ) | |||||||
| Interest-bearing liabilities: | ||||||||||||
| Savings deposits | 16 | (23 | ) | (7 | ) | |||||||
| Money market deposits | 35 | 6 | 41 | |||||||||
| Interest-bearing demand deposits | 1 | (3 | ) | (2 | ) | |||||||
| Certificates of deposit | (1,368 | ) | (2,305 | ) | (3,673 | ) | ||||||
| Advance payment by borrowers for taxes and insurance | – | (1 | ) | (1 | ) | |||||||
| Borrowings | 930 | (984 | ) | (54 | ) | |||||||
| Total interest-bearing liabilities | (386 | ) | (3,310 | ) | (3,696 | ) | ||||||
| Net change in net interest income | $ | 2,807 | $ | 698 | $ | 3,505 | ||||||
Provision for Loan Losses The Company’s provision for (recovery of) loan losses was $(3.7) million, $233,000, and $4.5 million during the years ended December 31, 2015, 2014, and 2013, respectively. The Company’s provision for (recovery of) loan losses in 2015 and 2014 benefited from a continued decline in Company’s actual loan charge-off experience in those periods, which had a favorable impact on the methodology the Company uses to compute general valuation allowances for most of its loan types. Also contributing was a general decline in non-performing and classified loans in both years, although non-performing loans increased in the fourth quarter of 2015. As described later in this report, non-performing loans increased in the fourth quarter of 2015 because of a $4.8 million loan to an industrial manufacturing company. This loan was downgraded to non-performing status due to a general deterioration in operating performance, coupled with difficulties the borrower has experienced integrating an acquired business. The Company established a loss allowance in the fourth quarter of 2015 related to this loan, which management believes is appropriate given the estimated fair value of the collateral that secures the loan. The borrower has a plan to improve its operating results, the execution of which will occur over the next several quarters, but results of which cannot be assured. Management will closely monitor the borrower's progress in implementing this plan. Excluding this loan, total non-performing loans would have declined in 2015. Refer to “Financial Condition—Asset Quality,” below, for additional discussion.
| 33 |
Despite the recent increase in the Company’s non-performing loans, which related to a single commercial loan as noted in the previous paragraph, management believes that general economic, employment, and real estate conditions continue to be stable in the Company’s markets. If such conditions persist in the near term and Company continues to experience stable or reduced levels of non-performing loans, classified loans, and/or loan charge-offs, management anticipates that the provision for (recovery of) loan losses may consist of net recoveries in the first and possibly the second quarter of 2016. However, there can be no assurances that these trends will continue or that classified loans, non-performing loans, and/or loan charge-off experience will not increase in future periods. Accordingly, there can be no assurances that the Company’s provision for (recovery of) loan losses will not fluctuate considerably from period to period.
Non-Interest Income Total non-interest income for the years ended December 31, 2015, 2014, and 2013, was $23.2 million, $22.3 million, and $26.1 million, respectively. The following paragraphs discuss the principal components of non-interest income and primary reasons for its change from 2014 to 2015, as well as 2013 to 2014.
Deposit-related fees and charges were $11.6 million, $12.0 million, and $12.2 million in 2015, 2014, and 2013, respectively. Deposit-related fees and charges consist of overdraft fees, ATM and debit card fees, merchant processing fees, account service charges, and other revenue items related to services performed by the Company for its retail and commercial deposit customers. Management attributes the declines in deposit-related fees and charges in recent years to changes in customer spending behavior that has resulted in reduced revenue from overdraft charges and from check printing commissions. These developments have been partially offset by increased revenue from treasury management and merchant card processing services that the Company offers to commercial depositors. In the fourth quarter of 2015 the Company introduced a new checking account product line. Management believes that this new product line, combined with an increased advertising and marketing effort to support its retail deposit business, could result in an increase in deposit-related fees and charges in 2016. However, there can be no assurances.
Brokerage and insurance commissions were $3.6 million, $2.6 million, and $3.1 million, for the years ended December 31, 2015, 2014, and 2013, respectively. This revenue item typically consists of commissions earned on sales of tax-deferred annuities, mutual funds, and certain other securities, as well as personal and business insurance products. The increase in this revenue item in 2015 was due to non-refundable incentive payments that the Company received both to enter into a new relationship with a third-party financial service provider and to assist in recruiting additional qualified financial advisors. These payments will not recur in future periods. The new financial service provider has enabled the Company to expand the investment products and services that it provides to its brokerage and investment advisory customers, as well as attract additional financial advisors because of such expanded products and services. Management also believes that such developments may enable the Company to increase this revenue item in 2016 at a pace similar to the fourth quarter of 2015, which increased by $88,000 or 13.1% compared to the same quarter in 2014. However, it is unlikely this source of revenue in the full-year 2016 will exceed the amount recorded in 2015 because the previously described incentive payments will not recur. The decrease in brokerage and insurance commissions in 2014 compared to 2013 was primarily due to a decline in customer demand for tax-deferred annuities. This development was offset somewhat by an increase in commission revenue from the sale of mutual funds and other securities.
Mortgage banking revenue, net, was $3.5 million, $3.0 million, and $6.9 million in 2015, 2014, and 2013, respectively. The following table presents the components of mortgage banking revenue, net, for the periods indicated:
| Year Ended December 31 | ||||||||||||
| 2015 | 2014 | 2013 | ||||||||||
| (Dollars in thousands) | ||||||||||||
| Gross loan servicing fees | $ | 2,661 | $ | 2,796 | $ | 2,885 | ||||||
| MSR amortization | (1,906 | ) | (1,772 | ) | (2,809 | ) | ||||||
| MSR valuation recovery | – | 1 | 2,395 | |||||||||
| Loan servicing revenue, net | 755 | 1,025 | 2,471 | |||||||||
| Gain on sales of loan activities, net | 2,707 | 1,965 | 4,405 | |||||||||
| Mortgage banking revenue, net | $ | 3,462 | $ | 2,990 | $ | 6,876 | ||||||
| 34 |
Gross loan servicing fees were $2.7 million, $2.8 million, and $2.9 million in 2015, 2014, and 2013, respectively. Gross loan servicing fees are highly correlated with loans serviced for third-party investors. As of December 31, 2015, 2014, and 2013, loans serviced for third-party investors were $1.04 billion, $1.09 billion, and $1.15 billion, respectively. In recent years the Company’s origination of fixed-rate, one- to four-family mortgage loans that it sells and services for third-party investors has not kept pace with repayments of such loans. Management attributes this to increased competition from non-bank sources, such as on-line mortgage banks. The Company has implemented new processing systems and improved management and staffing in its mortgage banking line of business in recent periods. Management is optimistic that these changes, combined with a planned increase in loan originators in 2016, as described below, could result in increases in gross servicing revenue in future periods. However, there can be no assurances.
Amortization of MSRs increased in 2015 compared to 2014. Generally lower market interest rates for one- to four-family residential loans in 2015 caused higher levels of actual and expected loan prepayment activity in 2015, which resulted in higher MSR amortization compared to 2014. Amortization of MSRs decreased in 2014 compared to 2013 for the opposite reason. Generally higher market interest rates for residential loans in 2014 caused lower levels of actual and expected prepayment activity in that year, which resulted in lower MSR amortization in 2014 compared to 2013.
The change in the valuation allowance that the Company maintains against its MSRs is recorded as a recovery or loss, as the case may be, in the period in which the change occurs. MSR valuation allowances typically increase in lower interest rate environments and decrease in higher interest rate environments. In lower rate environments, loan refinance activity and expectations for future loan prepayments generally increase, which typically reduces the fair value of MSRs and results in an increase in the MSR valuation allowance. The opposite situation generally occurs in higher rate environments. Lower market interest rates for one- to four-family residential loans in 2013 resulted in the recovery of substantially all of the Company’s MSR valuation allowance in that year. Subsequent to 2013 interest rates for residential loans have not been low enough to generate a requirement for an MSR valuation allowance in 2014 or 2015. However, if market interest rates for one- to four-family residential loans decrease and/or actual or expected loan prepayment expectations increase in future periods, the Company could record significant charges to earnings related to increases in the valuation allowance on its MSRs, as well as record increased levels of MSR amortization expense.
Net gains on loan sales activities were $2.7 million, $2.0 million, and $4.4 million, during the years ended December 31, 2015, 2014, and 2013, respectively. The Company’s policy is to sell substantially all of its fixed-rate, one- to four-family mortgage loan originations in the secondary market. During 2015, 2014, and 2013, sales of one- to four-family residential loans were $111.5 million, $77.8 million, and $252.3 million, respectively. Lower market interest rates for one- to four-family residential loans in 2013 resulted in significantly higher sales of loans in that year compared to 2014 and 2015. Market interest rates for residential loans were generally lower in 2015 compared to 2014, which resulted in increased sales of such loans in the latest year.
Management is optimistic that environment for home sales may continue to improve in 2016 and believes that fixed-rate, one- to four-family mortgage loans should continue to be affordable to borrowers. This optimism, combined with a planned increase of 20% to 30% in the number of loan originators the Company has on staff in 2016, could result in an increase in gains on sales of loans in 2016 compared to 2015. However, the origination and sale of residential loans are subject to variations in market interest rates, overall economic conditions, and other factors outside of management’s control. In addition, management cannot be certain it will be able to attract or retain loan originators as anticipated. Accordingly, there can be no assurances that originations and sales of loans will increase in the future or will not vary considerably from period to period.
Loan-related fees were $2.3 million, $1.6 million, and $976,000 in 2015, 2014, and 2013, respectively. In previous periods, loan-related fees were reported as a component of other non-interest income. Loan-related fees consist of periodic income from lending activities that are not deferred as yield adjustments under the applicable accounting rules. The largest source of fees in this revenue category are those realized from interest rate swaps related to commercial loan relationships. The Company mitigates the interest rate risk associated with certain of its loan relationships by executing interest rate swaps, the accounting for which results in the recognition of a certain amount of fee income at the time the swap contracts are executed. Management believes this source of revenue will vary considerably from period to period depending on borrower preference for the types of loan relationships that generate the interest rate swaps.
Income from BOLI was $1.9 million, $2.8 million, and $2.4 million during the years ended December 31, 2015, 2014, and 2013, respectively. Results in 2015 included no payouts related to excess death benefits under the terms of the insurance contracts. In contrast, results in 2014 and 2013 included payouts of $948,000 and $639,000 related to excess death benefits, respectively. Income from BOLI is also not subject to income taxes.
| 35 |
In 2015 the Company recorded $218,000 in gains on the disposition of real estate properties that it held for investment purposes. No such gains were recorded in 2014 or 2013. Management continues to actively sell certain properties that the Company holds for investment purposes, but does not expect to record material gains or losses on the future disposition of such properties, if any.
In 2014 the Company recorded a $102,000 gain on the sale of mortgage-related securities that management felt no longer met the yield objectives of that portfolio. The Company did not sell any securities in 2015 or 2013.
Other non-interest income was $240,000, $284,000, and $565,000 for the years ended December 31, 2015, 2014, and 2013, respectively. The decreases in this revenue item in recent years have been caused by a decline in the fair value of assets held in trust for certain non-qualifying employee benefit plans.
Non-Interest Expense Total non-interest expense for the years ended December 31, 2015, 2014, and 2013 was $72.7 million, $68.5 million, and $71.5 million, respectively. The following paragraphs discuss the principal components of non-interest expense and the primary reasons for its change from 2014 to 2015, as well as 2013 to 2014.
Compensation and related expenses were $44.8 million, $41.3 million, and $43.9 million, during the years ended December 31, 2015, 2014, and 2013, respectively. The increase in 2015 was partly the result of increased cost related to the Company’s defined benefit pension plan, which was caused in large part by a decrease in the discount rate used to determine the present value of the pension obligation, as well as changes in certain other actuarial assumptions. In 2015 pension-related expense was $1.3 million higher than it was in 2014 for these reasons. Also contributing to the increase in compensation-related expenses in 2015 was a change in 2014 in the manner in which employees earned benefits for compensated absences. This change reduced the Company’s expense for compensated absences in 2014, which caused such expense to be $1.5 million higher in 2015 than it was in 2014. Compensation-related expenses in the 2015 were also higher because of normal annual merit increases granted to most employees at the beginning of the year, as well as higher stock-based compensation expense. Finally, compensation-related expenses in 2015 included $80,000 for employee severance costs related to the Company’s consolidation of eleven retail branch offices, as discussed later in this report.
In December 2015 the Company announced that, effective December 31, 2015, it froze the benefits of its remaining employees that were still earning benefits in its defined benefit pension plan. The benefits of all other employees had been frozen in 2013. As a result of this most recent change, as well as changes in other actuarial assumptions related to the plan, management anticipates that pension-related expenses in 2016 could be $2.8 million lower than they were in 2015, although there can be no assurances.
The decrease compensation and related expenses in 2014 compared to 2013 was caused in part by lower costs related to the Company’s defined benefit pension plan due to an increase in the discount rate used to determine the present value of the pension obligation in 2014. Also contributing to the decrease in compensation-related expenses in 2014 was a change in the way employees earned benefits for compensated absences, as previously described. These favorable developments were partially offset by an increase in employer contributions to the Company’s defined contribution savings plan in 2014, which were intended to partially offset the impact of the freezing of the plan for most employees in 2013. Also offsetting the favorable developments in 2014 was the impact of normal annual merit increases granted to most employees during the year, as well as an increase in costs related to certain non-qualified employee benefit plans.
As of December 31, 2015, the Company had 563 full-time employees and 100 part-time employees. This compared to 616 full-time and 99 part-time at December 31, 2014, and 637 full-time and 85 part-time at December 31, 2013. The number of employees has declined in recent years as the Company has consolidated retail branch offices and has improved efficiencies in other areas of its operations.
Occupancy, equipment, and data processing costs during the years ended December 31, 2015, 2014, and 2013 was $14.3 million, $12.8 million, and $11.9 million, respectively. The increase in 2015 was due in part to $715,000 in asset disposition costs associated with the Company’s consolidation of retail branch offices, as noted later in this report. Also contributing to the increase in 2015, as well as the increase in 2014, were increases in data processing costs related to the installation of new systems, certain repairs and maintenance on the Company’s facilities, and in 2014, snow removal and utility costs due to harsh winter conditions.
| 36 |
Advertising and marketing expenses were $1.9 million, $1.8 million, and $1.8 million in 2015, 2014, and 2013, respectively. In 2016 management anticipates that the Company may increase advertising and marketing-related expense by 20% to 25% in an effort to increase sales and expand the Company’s overall brand awareness, especially as such relates to the retail deposit business. However, this increase will depend on future management decisions and there can be no assurances.
Federal insurance premiums were $1.5 million, $1.5 million, and $1.9 million in 2015, 2014, and 2013, respectively. The decrease in premiums from 2013 to 2014 was caused by an improvement in the Bank’s financial condition and operating results that, under the FDIC’s risk-based premium assessment system, resulted in lower insurance assessment rates. In June 2015 the FDIC issued a proposed rule that would change how insured financial institutions are assessed for deposit insurance. Under the proposed rule management estimates that the Bank’s federal deposit insurance premiums could decline beginning as early as the second quarter of 2016 and that its premium expense in all of 2016 could be up to 20% lower than it was in 2015. In addition, in October 2015 the FDIC issued another proposed rule that could result in the creation of insurance premium credits for insured institutions with less than $10 billion in assets, such as the Bank. Each insured institution’s credits would be determined by the FDIC at a future date in accordance with performance measures established for the insurance fund, as specified in the proposed rule. The credits could be used by insured institutions to offset future premium costs until the credits are exhausted. Management is unable to determine the amount or timing of credits that might be awarded, if any. In addition, there can be no assurances that the either of these proposed rules will be adopted as proposed or that they will not be significantly changed prior to their final adoption, which could materially change the deposit insurance premiums the Bank might otherwise expect to pay in the future. For additional information, refer to “Regulation and Supervision of the Bank—Deposit Insurance” in “Item 1. Business—Regulation and Supervision,” above.
Net losses and expenses on foreclosed properties were $801,000, $1.0 million, and $2.3 million in 2015, 2014, and 2013, respectively. The Company has experienced lower losses and expenses on foreclosed real estate in recent periods due to reduced levels of foreclosed properties and improved market conditions.
Other non-interest expense was $9.4 million, $10.1 million, and $9.8 million during the years ended December 31, 2015, 2014, and 2013, respectively. In 2015 and 2014 the Company prepaid $10.0 million and $20.0 million in fixed-rate, term FHLB of Chicago advances, respectively. These advances had been drawn in prior years to fund the purchase of mortgage-related securities that were called by the issuer in 2015 and 2014, as previously described. Management elected to prepay these advances concurrent with the calls of the securities. As a result, the Company recorded prepayment penalties of $102,000 and $242,000 in 2015 and 2014, respectively. Also contributing to the decrease in other non-interest expense in 2015 compared to 2014 was lower spending on legal, consulting, and other professional services.
In May 2015 the Company consolidated seven retail branch offices in connection with an efficiency and expense reduction effort. In December 2015 the Company announced the consolidation of four additional offices that it expects will be completed in March 2016. Management estimates these actions may result in annual net cost savings of approximately $1.5 million and $1.0 million, respectively. In connection with the branch consolidations the Company recorded certain one-time costs in non-interest expense in 2015, as previously noted in this report. For additional discussion, refer to “Item 1. Business—Market Area.”
Income Tax Expense Income tax expense was $8.3 million, $8.9 million, and $5.7 million in 2015, 2014, and 2013, respectively. The year ended December 31, 2014, included a non-recurring charge of $518,000 (net of federal income tax benefit) related to a payment by the Company to the Wisconsin Department of Revenue to settle a tax matter. Excluding the impact of this non-recurring charge, the Company’s effective tax rate (“ETR”) in 2015, 2014, and 2013 was 37.0%, 35.4%, and 34.7%, respectively. The Company’s ETR will vary from period to period depending primarily on the impact of non-taxable revenue, such as earnings from BOLI and tax-exempt interest income. The ETR will generally be higher in periods in which non-taxable revenue comprises a smaller portion of pre-tax income, such as it did in 2015.
| 37 |
Financial Condition
Overview The Company’s total assets increased by $173.7 million or 7.5% during the twelve months ended December 31, 2015. During this period the Company’s loans receivable increased by $108.7 million and its aggregate mortgage-related securities increased by $74.4 million. These increases were funded by a $115.9 million increase in borrowings from the FHLB of Chicago and a $76.8 million increase in deposit liabilities. The Company’s total shareholders’ equity was $279.4 million at December 31, 2015, compared to $280.7 million at December 31, 2014. The following paragraphs describe these changes in greater detail, as well as other changes in the Company’s financial condition during the twelve months ended December 31, 2015.
Mortgage-Related Securities Available-for-Sale The Company’s portfolio of mortgage-related securities available-for-sale increased by $86.0 million or 26.7% during the year ended December 31, 2015. This increase was the result of $203.7 million in security purchases that were only partially offset by periodic repayments. The purpose of the security purchases was to maintain the portfolio at a level management considers sufficient to sustain the Company’s balance sheet liquidity.
The following table presents the carrying value of the Company’s mortgage-related securities available-for-sale at the dates indicated:
| December 31 | ||||||||||||
| 2015 | 2014 | 2013 | ||||||||||
| (Dollars in thousands) | ||||||||||||
| Freddie Mac | $ | 216,278 | $ | 169,168 | $ | 228,873 | ||||||
| Fannie Mae | 169,771 | 123,209 | 179,021 | |||||||||
| Ginnie Mae | 24 | 29 | 33 | |||||||||
| Private-label CMOs | 21,801 | 29,477 | 38,669 | |||||||||
| Total | $ | 407,874 | $ | 321,883 | $ | 446,596 | ||||||
The following table presents the activity in the Company’s portfolio of mortgage-related securities available-for-sale for the periods indicated:
| Year Ended December 31 | ||||||||||||
| 2015 | 2014 | 2013 | ||||||||||
| (Dollars in thousands) | ||||||||||||
| Carrying value at beginning of period | $ | 321,883 | $ | 446,596 | $ | 550,185 | ||||||
| Purchases | 203,729 | – | 88,094 | |||||||||
| Sales | – | (17,692 | ) | – | ||||||||
| Principal repayments | (111,640 | ) | (104,430 | ) | (186,674 | ) | ||||||
| Premium amortization, net | (1,725 | ) | (1,213 | ) | (1,460 | ) | ||||||
| Other-than-temporary impairment reductions | 148 | – | – | |||||||||
| Increase (decrease) in net unrealized gain or loss | (4,521 | ) | (1,378 | ) | (3,549 | ) | ||||||
| Net increase (decrease) | 85,991 | (124,713 | ) | (103,589 | ) | |||||||
| Carrying value at end of period | $ | 407,874 | $ | 321,883 | $ | 446,596 | ||||||
The table below presents information regarding the carrying values, weighted-average yields, and contractual maturities of the Company’s mortgage-related securities available-for-sale at December 31, 2015:
| One Year or Less | More
Than One Year to Five Years | More
Than Five Years to Ten Years | More Than Ten Years | Total | ||||||||||||||||||||||||||||||||||||
| Carrying Value | Weighted Average Yield | Carrying Value | Weighted Average Yield | Carrying Value | Weighted Average Yield | Carrying Value | Weighted Average Yield | Carrying Value | Weighted Average Yield | |||||||||||||||||||||||||||||||
| (Dollars in thousands) | ||||||||||||||||||||||||||||||||||||||||
| Securities by issuer and type: | ||||||||||||||||||||||||||||||||||||||||
| Freddie Mac, Fannie Mae, and Ginnie Mae MBSs | – | – | $ | 4,198 | 2.81 | % | $ | 87,664 | 2.07 | % | $ | 45,078 | 2.07 | % | $ | 139,940 | 2.09 | % | ||||||||||||||||||||||
| Freddie Mac and Fannie Mae CMOs | – | – | 9,255 | 2.05 | 110,233 | 2.71 | 129,646 | 1.85 | 249,134 | 2.23 | ||||||||||||||||||||||||||||||
| Private-label CMOs | – | – | 4,451 | 5.08 | – | – | 17,349 | 2.89 | 21,800 | 3.33 | ||||||||||||||||||||||||||||||
| Total | – | – | $ | 17,904 | 2.98 | % | $ | 197,897 | 2.42 | % | $ | 192,073 | 1.99 | % | $ | 407,874 | 2.24 | % | ||||||||||||||||||||||
| Securities by coupon: | ||||||||||||||||||||||||||||||||||||||||
| Adjustable-rate coupon | – | – | – | – | $ | 342 | 1.64 | % | $ | 16,532 | 2.74 | % | $ | 16,874 | 2.72 | % | ||||||||||||||||||||||||
| Fixed-rate coupon | – | – | $ | 17,904 | 2.98 | % | 197,555 | 2.42 | 175,541 | 1.92 | 391,000 | 2.22 | ||||||||||||||||||||||||||||
| Total | – | – | $ | 17,904 | 2.98 | % | $ | 197,897 | 2.42 | % | $ | 192,073 | 1.99 | % | $ | 407,874 | 2.24 | % | ||||||||||||||||||||||
| 38 |
Changes in the fair value of mortgage-related securities available-for-sale are recorded through accumulated other comprehensive loss, net of related income tax effect, which is a component of shareholders’ equity. The fair value adjustment on the Company’s mortgage-related securities available-for-sale was a net unrealized gain of $1.2 million at December 31, 2015, compared to a net unrealized gain of $5.7 million at December 31, 2014. The net unrealized gain declined in 2015 because of an increase in market interest rates at the end of 2015.
The Company maintains an investment in private-label CMOs that were purchased from 2004 to 2006 and are secured by prime residential mortgage loans. The securities were all rated “triple-A” by various credit rating agencies at the time of their purchase. However, all of the securities in the portfolio have been downgraded since their purchase. Securities rated less than investment grade are adversely classified as substandard in accordance with regulatory guidelines (refer to “Item 1. Business—Asset Quality”). As of December 31, 2015 and 2014, the carrying value of the Company’s investment in private-label CMOs was $21.8 million and $29.5 million, respectively. The net unrealized gain on the securities as of such dates was $200,000 and $479,000, respectively. As of December 31, 2015, $15.7 million of the Company’s private-label CMOs were rated less than investment grade by at least one credit rating agency. These securities had a net unrealized gain of $237,000 as of that date. As of December 31, 2014, $23.3 million of the Company’s private-label CMOs were rated less than investment grade and had a net unrealized gain of $480,000.
As of December 31, 2015 and 2014, management determined that none of the Company’s private-label CMOs had incurred OTTI as of those dates. The Company does not intend to sell these securities and it is unlikely it would be required to sell them before recovery of their amortized cost. However, collection is subject to numerous factors outside of the Company’s control and a future determination of OTTI could result in significant losses being recorded through earnings in future periods. For additional discussion refer to “Critical Accounting Policies—Other-Than-Temporary Impairment,” below, and “Item 1. Business—Investment Activities,” above.
Mortgage-Related Securities Held-to-Maturity The Company’s mortgage-related securities held-to-maturity consist of fixed-rate mortgage-backed securities issued and guaranteed by Fannie Mae and backed by multi-family residential loans. The Company classified these securities as held-to-maturity because it has the ability and intent to hold them until they mature.
The following table presents the activity in the Company’s portfolio of mortgage-related securities held-to-maturity for the periods indicated:
| Year Ended December 31 | ||||||||||||
| 2015 | 2014 | 2013 | ||||||||||
| (Dollars in thousands) | ||||||||||||
| Carrying value at beginning of period | $ | 132,525 | $ | 155,505 | $ | 157,558 | ||||||
| Principal repayments | (10,985 | ) | (21,977 | ) | (1,354 | ) | ||||||
| Premium amortization | (649 | ) | (1,003 | ) | (699 | ) | ||||||
| Net decrease | (11,634 | ) | (22,980 | ) | (2,053 | ) | ||||||
| Carrying value at end of period | $ | 120,891 | $ | 132,525 | $ | 155,505 | ||||||
In 2015 and 2014 mortgage-related securities held-to-maturity with carrying values of $8.9 million and $20.4 million, respectively, were called by the issuers. The Company recorded call premiums in interest income of $219,000 and $512,000 in 2015 and 2014, respectively, in connection with these calls.
The table below presents information regarding the carrying values, weighted-average yields, and contractual maturities of the Company’s mortgage-related securities held-to-maturity at December 31, 2015, all of which are fixed rate:
| One Year or Less | More
Than One Year to Five Years | More
Than Five Years to Ten Years | More Than Ten Years | Total | ||||||||||||||||||||||||||||||||||||
| Carrying Value | Weighted Average Yield | Carrying Value | Weighted Average Yield | Carrying Value | Weighted Average Yield | Carrying Value | Weighted Average Yield | Carrying Value | Weighted Average Yield | |||||||||||||||||||||||||||||||
| (Dollars in thousands) | ||||||||||||||||||||||||||||||||||||||||
| Securities by issuer and type: | ||||||||||||||||||||||||||||||||||||||||
| Fannie Mae DUS | – | – | $ | 60,131 | 2.09 | % | $ | 60,760 | 2.49 | % | – | – | $ | 120,891 | 2.29 | % | ||||||||||||||||||||||||
| 39 |
Loans Held-for-Sale The Company’s policy is to sell substantially all of its fixed-rate, one- to four-family mortgage loan originations in the secondary market. The following table presents a summary of the activity in the Company’s loans held-for-sale for the periods indicated:
| Year Ended December 31 | ||||||||||||
| 2015 | 2014 | 2013 | ||||||||||
| (Dollars in thousands) | ||||||||||||
| Balance outstanding at beginning of period | $ | 3,837 | $ | 1,798 | $ | 10,739 | ||||||
| Origination of loans held-for-sale (1) | 111,012 | 79,714 | 243,669 | |||||||||
| Principal balance of loans sold | (111,456 | ) | (77,776 | ) | (252,348 | ) | ||||||
| Change in net unrealized gains or losses (2) | (43 | ) | 101 | (262 | ) | |||||||
| Total loans held-for-sale | $ | 3,350 | $ | 3,837 | $ | 1,798 | ||||||
| (1) | Amounts do not include one- to four-family mortgage loans originated for the Company’s loan portfolio. |
| (2) | Refer to “Note 1. Basis of Presentation” in the Company’s consolidated financial statements included in “Item 8. Financial Statements and Supplementary Data.” |
The origination of one- to four-family mortgage loans intended for sale and the corresponding sales of such loans are lower than they were in 2013 because of generally higher market interest rates since that time, which resulted in fewer borrowers refinancing higher-rate loans into lower rate loans since that time. For additional discussion, refer to “Results of Operations—Non-Interest Income,” above.
Loans Receivable The Company’s loans receivable increased by $108.7 million or 6.7% during the twelve months ended December 31, 2015. During this period increases in multi-family, commercial real estate, and construction loans (net of the undisbursed portion), as well as commercial and industrial (C&I) loans, were partially offset by declines in one- to four-family permanent mortgages, home equity loans, and other consumer loans. Management believes that the overall loan growth experienced in recent periods is sustainable in the near term. However, the loan portfolio is subject to economic, market, and competitive factors outside of the Company’s control and there can be no assurances that expected loan growth will continue or that total loans will not decrease in future periods.
Construction loans, net of the undisbursed portion, increased by $14.8 million during the twelve months ended December 31, 2015, despite a substantially larger increase in the origination of such loans during the period, which was $263.0 million in 2015 compared to $154.9 million 2014. This development was due mostly to a large amount of construction loans that refinanced to permanent financing away from the Company after the completion of the construction phase. In many cases the Company chooses to not compete aggressively for the permanent financing on these loans because of pricing, terms, and/or other conditions that management considers to be unfavorable. It should be noted, however, that the significant increase in the origination of construction loans in 2015 caused the undisbursed portion of such loans to increase significantly, from $162.5 million at December 31, 2014, to $238.1 million at December 31, 2015. Management expects that these loans will be fully disbursed over the next few quarters, which should contribute to continued growth in total loans outstanding, although there can be no assurances.
Declines in the one- to four-family permanent and home equity loan portfolios during the twelve months ended December 31, 2015, were largely the result of a relatively low interest rate environment. These loan portfolios consist largely of adjustable-rate loans. The current rate environment favors the refinancing of such loans by borrowers into new fixed-rate, one- to four-family mortgage loans, which the Company typically sells in the secondary market, as previously described. Also contributing to the decreases, however, was low customer demand in recent years for adjustable-rate mortgage loans, which the Company generally retains in its loan portfolio, as well as low customer demand for home equity loans. Management does not expect these trends to change in the near term.
| 40 |
The following table presents the composition of the Company’s loan portfolio in dollar amounts and in percentages of the total portfolio at the dates indicated.
| December 31 | ||||||||||||||||||||||||||||||||||||||||
| 2015 | 2014 | 2013 | 2012 | 2011 | ||||||||||||||||||||||||||||||||||||
| Amount | Percent | Amount | Percent | Amount | Percent | Amount | Percent | Amount | Percent | |||||||||||||||||||||||||||||||
| (Dollars in thousands) | ||||||||||||||||||||||||||||||||||||||||
| Commercial loans: | ||||||||||||||||||||||||||||||||||||||||
| Commercial and industrial | $ | 235,313 | 11.78 | % | $ | 226,537 | 12.47 | % | $ | 166,788 | 10.10 | % | $ | 132,436 | 8.82 | % | $ | 87,715 | 6.31 | % | ||||||||||||||||||||
| Commercial real estate | 299,550 | 14.99 | 263,512 | 14.50 | 276,547 | 16.75 | 263,775 | 17.57 | 226,195 | 16.27 | ||||||||||||||||||||||||||||||
| Multi-family | 409,674 | 20.51 | 322,413 | 17.74 | 265,841 | 16.10 | 264,013 | 17.58 | 247,040 | 17.77 | ||||||||||||||||||||||||||||||
| Construction and development: | ||||||||||||||||||||||||||||||||||||||||
| Commercial real estate | 28,156 | 1.41 | 42,405 | 2.33 | 27,815 | 1.68 | 11,116 | 0.74 | 19,907 | 1.43 | ||||||||||||||||||||||||||||||
| Multi-family | 291,380 | 14.59 | 211,239 | 11.62 | 164,685 | 9.97 | 86,904 | 5.79 | 29,409 | 2.12 | ||||||||||||||||||||||||||||||
| Land and land development | 11,143 | 0.56 | 5,069 | 0.28 | 6,962 | 0.42 | 6,445 | 0.43 | 8,078 | 0.60 | ||||||||||||||||||||||||||||||
| Total construction and development loans | 330,679 | 16.56 | 258,713 | 14.24 | 199,462 | 12.08 | 104,465 | 6.96 | 57,394 | 4.15 | ||||||||||||||||||||||||||||||
| Total commercial loans | 1,275,216 | 63.84 | 1,071,175 | 58.94 | 908,638 | 55.03 | 764,689 | 50.93 | 618,344 | 44.50 | ||||||||||||||||||||||||||||||
| Retail loans: | ||||||||||||||||||||||||||||||||||||||||
| One- to four-family first mortgages: | ||||||||||||||||||||||||||||||||||||||||
| Permanent | 461,797 | 23.12 | 480,102 | 26.42 | 449,230 | 27.21 | 471,551 | 31.40 | 516,854 | 37.17 | ||||||||||||||||||||||||||||||
| Construction | 42,357 | 2.12 | 23,905 | 1.32 | 40,968 | 2.48 | 18,502 | 1.23 | 16,263 | 1.17 | ||||||||||||||||||||||||||||||
| Total first mortgages | 504,154 | 25.24 | 504,007 | 27.73 | 490,198 | 29.69 | 490,053 | 32.63 | 533,117 | 38.34 | ||||||||||||||||||||||||||||||
| Home equity loans: | ||||||||||||||||||||||||||||||||||||||||
| Fixed term home equity | 122,985 | 6.16 | 139,046 | 7.65 | 148,688 | 9.01 | 141,898 | 9.45 | 126,798 | 9.12 | ||||||||||||||||||||||||||||||
| Home equity lines of credit | 75,261 | 3.77 | 80,692 | 4.44 | 79,470 | 4.81 | 81,898 | 5.45 | 86,540 | 6.23 | ||||||||||||||||||||||||||||||
| Total home equity | 198,246 | 9.93 | 219,738 | 12.09 | 228,158 | 13.82 | 223,796 | 14.90 | 213,338 | 15.35 | ||||||||||||||||||||||||||||||
| Other consumer loans: | ||||||||||||||||||||||||||||||||||||||||
| Student | 8,129 | 0.41 | 9,692 | 0.53 | 11,177 | 0.68 | 12,915 | 0.86 | 15,711 | 1.13 | ||||||||||||||||||||||||||||||
| Other | 11,678 | 0.58 | 12,681 | 0.70 | 12,942 | 0.78 | 10,202 | 0.68 | 9,405 | 0.68 | ||||||||||||||||||||||||||||||
| Total other consumer | 19,807 | 0.99 | 22,373 | 1.23 | 24,119 | 1.46 | 23,117 | 1.54 | 25,116 | 1.81 | ||||||||||||||||||||||||||||||
| Total retail loans | 722,207 | 36.16 | 746,118 | 41.06 | 742,475 | 44.97 | 736,966 | 49.07 | 771,571 | 55.50 | ||||||||||||||||||||||||||||||
| Gross loans receivable | 1,997,423 | 100.00 | % | 1,817,293 | 100.00 | % | 1,651,113 | 100.00 | % | 1,501,655 | 100.00 | % | 1,389,915 | 100.00 | % | |||||||||||||||||||||||||
| Undisbursed loan proceeds | (238,124 | ) | (162,471 | ) | (117,439 | ) | (76,703 | ) | (41,859 | ) | ||||||||||||||||||||||||||||||
| Allowance for loan losses | (17,641 | ) | (22,289 | ) | (23,565 | ) | (21,577 | ) | (27,928 | ) | ||||||||||||||||||||||||||||||
| Deferred fees and costs, net | (1,640 | ) | (1,230 | ) | (1,113 | ) | (1,129 | ) | (492 | ) | ||||||||||||||||||||||||||||||
| Total loans receivable, net | $ | 1,740,018 | $ | 1,631,303 | $ | 1,508,996 | $ | 1,402,246 | $ | 1,319,636 | ||||||||||||||||||||||||||||||
| 41 |
The following table presents a summary of the Company’s activity in loans receivable for the periods indicated.
| Year Ended December 31 | ||||||||||||
| 2015 | 2014 | 2013 | ||||||||||
| (Dollars in thousands) | ||||||||||||
| Balance outstanding at beginning of period | $ | 1,631,303 | $ | 1,508,996 | $ | 1,402,246 | ||||||
| Loan originations: | ||||||||||||
| Commercial loans: | ||||||||||||
| Commercial and industrial | 90,265 | 73,630 | 52,701 | |||||||||
| Commercial real estate | 101,198 | 37,444 | 80,157 | |||||||||
| Multi-family | 87,328 | 101,260 | 50,323 | |||||||||
| Construction and development | 263,030 | 154,940 | 164,028 | |||||||||
| Total commercial loans | 541,821 | 367,274 | 347,209 | |||||||||
| Retail loans: | ||||||||||||
| One- to four-family first mortgages (1) | 100,876 | 75,402 | 84,822 | |||||||||
| Home equity | 33,291 | 33,850 | 52,827 | |||||||||
| Other consumer | 1,594 | 1,427 | 3,775 | |||||||||
| Total retail loans | 135,761 | 110,679 | 141,424 | |||||||||
| Total loan originations | 677,582 | 477,953 | 488,633 | |||||||||
| Principal payments and repayments: | ||||||||||||
| Commercial loans | (337,601 | ) | (204,737 | ) | (199,507 | ) | ||||||
| Retail loans | (157,515 | ) | (104,782 | ) | (134,225 | ) | ||||||
| Total principal payments and repayments | (495,116 | ) | (309,519 | ) | (333,732 | ) | ||||||
| Transfers to foreclosed properties, real estate owned, and repossessed assets | (2,336 | ) | (2,254 | ) | (5,443 | ) | ||||||
| Net change in undisbursed loan proceeds, allowance for loan losses, and deferred fees and costs | (71,415 | ) | (43,873 | ) | (42,708 | ) | ||||||
| Total loans receivable, net | $ | 1,740,018 | $ | 1,631,303 | $ | 1,508,996 | ||||||
| (1) | Amounts do not include one- to four-family mortgage loans originated for sale. |
The following table presents the contractual maturity of the Company’s commercial and industrial loans and construction and development loans at December 31, 2015. The table does not include the effect of prepayments or scheduled principal amortization.
| Commercial
and Industrial | Construction
and Development | Total | ||||||||||
| (Dollars in thousands) | ||||||||||||
| Amounts due: | ||||||||||||
| Within one year or less | $ | 99,454 | $ | 36,406 | $ | 135,860 | ||||||
| After one year through five years | 126,036 | 258,281 | 384,317 | |||||||||
| After five years | 9,823 | 78,349 | 88,172 | |||||||||
| Total due after one year | 135,859 | 336,630 | 472,489 | |||||||||
| Total commercial and construction loans | $ | 235,313 | $ | 373,036 | $ | 608,349 | ||||||
The following table presents, as of December 31, 2015, the dollar amount of the Company’s commercial and industrial loans and construction and development loans due after one year and whether these loans have fixed interest rates or adjustable interest rates.
| Due After One Year | ||||||||||||
| Fixed Rate | Adjustable Rate | Total | ||||||||||
| (Dollars in thousands) | ||||||||||||
| Commercial and industrial | $ | 51,687 | $ | 84,172 | $ | 135,859 | ||||||
| Construction and development | 11,453 | 325,177 | 336,630 | |||||||||
| Total loans due after one year | $ | 63,140 | $ | 409,349 | $ | 472,489 | ||||||
| 42 |
Mortgage Servicing Rights The carrying value of the Company’s MSRs was $7.2 million at December 31, 2015, compared to $7.9 million at December 31, 2014, net of valuation allowances of zero at both dates. As of December 31, 2015 and 2014, the Company serviced $1.04 billion and $1.09 billion in loans for third-party investors, respectively. For additional information refer to “Results of Operations—Non-Interest Income” and “Item 1. Business—Lending Activities,” above.
Other Assets Other assets consist of the following items on the dates indicated:
| December 31 | ||||||||
| 2015 | 2014 | |||||||
| (Dollars in thousands) | ||||||||
| Accrued interest receivable: | ||||||||
| Loans receivable | $ | 4,894 | $ | 4,748 | ||||
| Mortgage-related securities | 1,141 | 1,027 | ||||||
| Total accrued interest receivable | 6,035 | 5,775 | ||||||
| Foreclosed properties and repossessed assets: | ||||||||
| Commercial real estate | 1,685 | 2,566 | ||||||
| Land and land development | 747 | 1,693 | ||||||
| One- to four- family first mortgages | 874 | 409 | ||||||
| Total foreclosed and repossessed assets | 3,306 | 4,668 | ||||||
| Bank-owned life insurance | 61,656 | 59,830 | ||||||
| Premises and equipment | 49,218 | 52,594 | ||||||
| Deferred tax asset, net | 16,485 | 25,595 | ||||||
| Federal Home Loan Bank stock, at cost | 17,591 | 14,209 | ||||||
| Other assets | 24,037 | 22,183 | ||||||
| Total other assets | $ | 178,328 | $ | 184,854 | ||||
The Company’s foreclosed properties and repossessed assets were $3.3 million and $4.7 million at December 31, 2015 and 2014, respectively. The Company does not expect significant changes in the level of its foreclosed properties and repossessed in the near term. However, there can be no assurances.
BOLI is long-term life insurance on the lives of certain current and past employees where the insurance policy benefits and ownership are retained by the Company. The cash surrender value of the related policies is an asset that the Company uses to partially offset the future cost of employee benefits. The cash value accumulation on BOLI is permanently tax deferred if the policy is held to the insured person’s death and certain other conditions are met. The increase in BOLI in 2015 was a result of the increase in the accumulated cash value of the insurance policies during the period.
As of December 31, 2015, the Company and its subsidiaries conducted their business through an executive office and 69 banking offices. The Company owned the building and land for 62 of its office locations and leased the space for seven. However, refer to “Results of Operations—Non-Interest Expense,” above, for discussion related to the Company’s consolidation of certain banking office locations in March 2016.
The Company’s net deferred tax asset decreased by $9.1 million or 35.6% during the year ended December 31, 2015, due primarily to the utilization of net operating loss carryforwards during the period. Management evaluates this asset on an on-going basis to determine if a valuation allowance is required. Management determined that no valuation allowance was required as of December 31, 2015. The evaluation of the net deferred tax asset requires significant management judgment based on positive and negative evidence. Such evidence includes the Company’s recent trend in earnings, expectations for the Company’s future earnings, the duration of federal and state net operating loss carryforward periods, and other factors. There can be no assurance that future events, such as adverse operating results, court decisions, regulatory actions or interpretations, changes in tax rates and laws, or changes in positions of federal and state taxing authorities will not differ from management’s current assessments. The impact of these matters could be significant to the consolidated financial conditions, results of operations, and capital of the Company.
The FHLB of Chicago requires its members to own its common stock as a condition of membership, which is redeemable at par. As of December 31, 2015, the Company’s ownership of FHLB of Chicago common stock exceeded the amount required under the FHLB of Chicago’s minimum guidelines. For additional discussion refer to the section entitled “Federal Home Loan Bank System” in “Item 1. Business—Regulation and Supervision.”
| 43 |
Deposit Liabilities The Company’s deposit liabilities increased by $76.8 million or 4.5% during the twelve months ended December 31, 2015. Transaction deposits, which consist of checking, savings, and money market accounts, increased by $56.3 million or 4.7% during the period and certificates of deposit increased by $20.5 million or 3.9%. As noted earlier in this release, the Company increased rates and lengthened maturity terms on certain of the certificates of deposit it offers customers in 2015. Accordingly, management believes that the average cost of the Company’s certificates of deposit may continue to increase modestly for the foreseeable future, which would have an adverse impact on its net interest margin. Management further believes that the low interest rate environment that has persisted for the past few years has encouraged some customers to switch to transaction deposits in an effort to retain flexibility in the event interest rates increase in the future. If interest rates increase in the future, customer preference may shift from transaction deposits back to certificates of deposit, which typically have a higher interest cost to the Company. This development could also increase the Company’s cost of funds in the future, which would also have an adverse impact on its net interest margin.
The following table presents the distribution of the Company’s deposit accounts at the dates indicated by dollar amount and percent of portfolio, and the weighted-average rate.
| December 31 | ||||||||||||||||||||||||||||||||||||
| 2015 | 2014 | 2013 | ||||||||||||||||||||||||||||||||||
| Percent | Weighted- | Percent | Weighted- | Percent | Weighted- | |||||||||||||||||||||||||||||||
| of Total | Average | of Total | Average | of Total | Average | |||||||||||||||||||||||||||||||
| Deposit | Nominal | Deposit | Nominal | Deposit | Nominal | |||||||||||||||||||||||||||||||
| Amount | Liabilities | Rate | Amount | Liabilities | Rate | Amount | Liabilities | Rate | ||||||||||||||||||||||||||||
| (Dollars in thousands) | ||||||||||||||||||||||||||||||||||||
| Non-interest-bearing demand | $ | 213,761 | 11.90 | % | 0.00 | % | $ | 187,852 | 10.93 | % | 0.00 | % | $ | 161,639 | 9.20 | % | 0.00 | % | ||||||||||||||||||
| Interest-bearing demand | 277,606 | 15.46 | 0.01 | 253,595 | 14.76 | 0.01 | 245,923 | 13.95 | 0.01 | |||||||||||||||||||||||||||
| Money market savings | 542,020 | 30.19 | 0.12 | 532,705 | 30.99 | 0.14 | 501,020 | 28.40 | 0.14 | |||||||||||||||||||||||||||
| Savings accounts | 217,6331 | 12.12 | 0.01 | 220,557 | 12.83 | 0.03 | 220,236 | 12.50 | 0.03 | |||||||||||||||||||||||||||
| Total transaction accounts | 1,251,020 | 69.67 | 0.06 | 1,194,709 | 69.51 | 0.07 | 1,128,818 | 64.05 | 0.07 | |||||||||||||||||||||||||||
| Certificates of deposit: | ||||||||||||||||||||||||||||||||||||
| With original maturities of: | ||||||||||||||||||||||||||||||||||||
| Three months or less | 4,559 | 0.25 | 0.32 | 6,081 | 0.35 | 0.25 | 20,665 | 1.17 | 1.44 | |||||||||||||||||||||||||||
| Over three to 12 months | 136,547 | 7.60 | 0.36 | 177,748 | 10.34 | 0.44 | 121,350 | 6.88 | 0.17 | |||||||||||||||||||||||||||
| Over 12 to 24 months | 260,143 | 14.50 | 0.93 | 204,499 | 11.90 | 0.53 | 346,565 | 19.66 | 0.51 | |||||||||||||||||||||||||||
| Over 24 to 36 months | 101,571 | 5.66 | 1.09 | 84,507 | 4.92 | 0.58 | 80,370 | 4.56 | 1.88 | |||||||||||||||||||||||||||
| Over 36 to 48 months | 2,388 | 0.13 | 1.44 | – | – | – | – | – | – | |||||||||||||||||||||||||||
| Over 48 to 60 months | 39,363 | 2.19 | 1.14 | 51,212 | 2.98 | 1.37 | 64,914 | 3.68 | 2.08 | |||||||||||||||||||||||||||
| Total certificates of deposit | 544,571 | 30.33 | 0.82 | 524,047 | 30.49 | 0.58 | 633,864 | 35.95 | 0.81 | |||||||||||||||||||||||||||
| Total deposit liabilities | $ | 1,795,591 | 100.00 | % | 0.29 | % | $ | 1,718,756 | 100.00 | % | 0.23 | % | $ | 1,762,682 | 100.00 | % | 0.34 | % | ||||||||||||||||||
At December 31, 2015, the Company had certificates of deposit with balances of $100,000 and over maturing as follows:
| Amount | ||||
| (In thousands) | ||||
| Maturing in: | ||||
| Three months or less | $ | 16,352 | ||
| Over three months through six months | 16,845 | |||
| Over six months through 12 months | 51,310 | |||
| Over 12 months through 24 months | 56,225 | |||
| Over 24 months through 36 months | 21,114 | |||
| Over 36 months | 5,936 | |||
| Total certificates of deposit greater than $100,000 | $ | 167,782 | ||
The following table presents the Company’s activity in its deposit liabilities for the periods indicated:
| Year Ended December 31 | ||||||||||||
| 2015 | 2014 | 2013 | ||||||||||
| (Dollars in thousands) | ||||||||||||
| Total deposit liabilities at beginning of period | $ | 1,718,756 | $ | 1,762,682 | $ | 1,867,899 | ||||||
| Net deposits (withdrawals) | 72,746 | (48,358 | ) | (113,058 | ) | |||||||
| Interest credited, net of penalties | 4,090 | 4,432 | 7,841 | |||||||||
| Total deposit liabilities at end of period | $ | 1,795,591 | $ | 1,718,756 | $ | 1,762,682 | ||||||
Borrowings Borrowings, which consist of advances from the FHLB of Chicago, increased by $115.9 million or 45.2% during the twelve months ended December 31, 2015. This increase was used to fund growth in loans and mortgage-related securities available-for-sale during the period, as previously described.
| 44 |
The following table sets forth certain information regarding the Company’s borrowings at the end of and during the periods indicated:
| At or For the Year Ended December 31 | ||||||||||||||||||||
| 2015 | 2014 | 2013 | 2012 | 2011 | ||||||||||||||||
| (Dollars in thousands) | ||||||||||||||||||||
| Balance outstanding at end of year: | ||||||||||||||||||||
| FHLB term advances | $ | 242,375 | $ | 213,669 | $ | 204,900 | $ | 210,786 | $ | 153,091 | ||||||||||
| Overnight borrowings from FHLB | 130,000 | 42,800 | 40,000 | – | – | |||||||||||||||
| Weighted-average interest rate at end of year: | ||||||||||||||||||||
| FHLB term advances | 1.86 | % | 2.01 | % | 2.26 | % | 2.34 | % | 4.69 | % | ||||||||||
| Overnight borrowings from FHLB | 0.16 | % | 0.13 | % | 0.13 | % | – | – | ||||||||||||
| Maximum amount outstanding during the year: | ||||||||||||||||||||
| FHLB term advances | $ | 252,920 | $ | 234,085 | $ | 210,786 | $ | 311,419 | $ | 199,493 | ||||||||||
| Overnight borrowings from FHLB | 130,000 | 80,000 | 40,000 | 5,000 | – | |||||||||||||||
| Average amount outstanding during the year: | ||||||||||||||||||||
| FHLB term advances | $ | 228,346 | $ | 213,566 | $ | 206,828 | $ | 227,573 | $ | 156,521 | ||||||||||
| Overnight borrowings from FHLB | 85,309 | 38,562 | 207 | 14 | – | |||||||||||||||
| Weighted-average interest rate during the year: | ||||||||||||||||||||
| FHLB term advances | 2.01 | % | 2.19 | % | 2.31 | % | 3.07 | % | 4.59 | % | ||||||||||
| Overnight borrowings from FHLB | 0.13 | % | 0.13 | % | 0.13 | % | 0.30 | % | – | |||||||||||
Management believes that additional funds are available to be borrowed from the FHLB of Chicago or other sources in the future to fund loan originations or security purchases or to fund existing advances as they mature if needed or desirable. However, there can be no assurances of the future availability of borrowings or any particular level of future borrowings. For additional information refer to “Item 1. Business—Borrowings.”
Shareholders’ Equity The Company’s shareholders’ equity was $279.4 million at December 31, 2015, compared to $280.7 million at December 31, 2014. This decrease was due in part to the Company’s repurchase of $10.5 million or 1.5 million shares of its common stock during the period at an average price of $7.18 per share. Also contributing to the decrease was the payment of $8.8 million in regular dividends. These developments were partially offset by net income of $14.2 million during the twelve months ended December 31, 2015. The book value of the Company’s common stock was $6.15 at December 31, 2015, compared to $6.03 at December 31, 2014.
The Company’s ratio of shareholders’ equity to total assets was 11.17% at December 31, 2015, compared to 12.06% at December 31, 2014. The Company is required to maintain specified amounts of regulatory capital pursuant to regulations promulgated by the FRB. The Company is “well capitalized” for regulatory capital purposes. As of December 31, 2015, the Company had a total risk-based capital ratio of 15.83% and a Tier 1 leverage capital ratio of 11.37%. The minimum ratios to be considered “well capitalized” under current supervisory regulations are 10% for total risk-based capital and 5% for Tier 1 capital. The minimum ratios to be considered “adequately capitalized” are 8% and 4%, respectively. For additional discussion refer to “Note 8. Shareholders’ Equity” in “Item 8. Financial Statements and Supplementary Data.”
On February 1, 2016, the Company’s board of directors declared a $0.05 per share dividend payable on February 26, 2016, to shareholders of record on February 12, 2016. On February 1, 2016, the Company’s board of directors also approved a plan to repurchase up to 1.0 million shares of its common stock. This plan replaced a previous plan that had been approved in February 2015, but which expired on February 2, 2016. From January 1, 2016, to February 2, 2016, the Company repurchased 500 shares of its common stock at an average price of $7.25 under the plan that expired. From February 1, 2016, to February 29, 2016 the Company repurchased 5,281 shares of its common stock at an average price of $7.28 under the new plan.
The payment of dividends and/or the repurchase of common stock by the Company is highly dependent on the ability of the Bank to pay dividends or otherwise distribute capital to the Company. Such payments are subject to requirements imposed by law or regulations and to the application and interpretation thereof by the OCC and FRB. The Company cannot provide any assurances that dividends will continue to be paid, the amount of any such dividends, or whether additional shares of common stock will be repurchased under its current stock repurchase plan. For further information regarding the factors which could affect the Company’s payment of dividends and/or the repurchase of its common stock, refer to “Item 1. Business—Regulation and Supervision,” as well as “Item 5. Market for Registrant’s Common Equity, Related Stockholder Matters, and Issuer Purchase of Equity Securities,” above.
| 45 |
Asset Quality The following table presents information regarding non-accrual loans, accruing loans delinquent 90 days or more, and foreclosed properties and repossessed assets as of the dates indicated.
| December 31 | ||||||||||||||||||||
| 2015 | 2014 | 2013 | 2012 | 2011 | ||||||||||||||||
| (Dollars in thousands) | ||||||||||||||||||||
| Non-accrual commercial loans: | ||||||||||||||||||||
| Commercial and industrial | $ | 4,915 | $ | 201 | $ | 284 | $ | 693 | $ | 1,642 | ||||||||||
| Commercial real estate | 3,968 | 4,309 | 4,401 | 6,994 | 23,997 | |||||||||||||||
| Multi-family | – | 1,402 | 1,783 | 6,824 | 22,905 | |||||||||||||||
| Construction and development | 766 | 803 | 728 | 865 | 9,108 | |||||||||||||||
| Total commercial loans | 9,649 | 6,715 | 7,196 | 15,376 | 57,652 | |||||||||||||||
| Non-accrual retail loans: | ||||||||||||||||||||
| One- to four-family first mortgages | 2,703 | 4,148 | 4,556 | 8,264 | 15,128 | |||||||||||||||
| Home equity | 703 | 493 | 676 | 1,514 | 1,457 | |||||||||||||||
| Other consumer | 82 | 108 | 104 | 59 | 207 | |||||||||||||||
| Total non-accrual retail loans | 3,488 | 4,749 | 5,336 | 9,837 | 16,792 | |||||||||||||||
| Total non-accrual loans | 13,137 | 11,464 | 12,532 | 25,213 | 74,444 | |||||||||||||||
| Accruing loans delinquent 90 days or more (1) | 484 | 540 | 443 | 584 | 696 | |||||||||||||||
| Total non-performing loans | 13,621 | 12,004 | 12,975 | 25,797 | 75,140 | |||||||||||||||
| Foreclosed real estate and repossessed assets | 3,306 | 4,668 | 6,736 | 13,961 | 24,724 | |||||||||||||||
| Total non-performing assets | $ | 16,927 | $ | 16,672 | $ | 19,711 | $ | 39,758 | $ | 99,864 | ||||||||||
| Non-performing loans to total loans | 0.78 | % | 0.74 | % | 0.86 | % | 1.84 | % | 5.69 | % | ||||||||||
| Non-performing assets to total assets | 0.68 | % | 0.72 | % | 0.84 | % | 1.64 | % | 4.00 | % | ||||||||||
| Interest income that would have been recognized if non-accrual loans had been current | $ | 637 | $ | 634 | $ | 1,265 | $ | 1,998 | $ | 4,535 | ||||||||||
(1) Amounts consist of student loans that are guaranteed under programs sponsored by the U.S. government.
The Company’s non-performing loans were $13.6 million or 0.78% of loans receivable as of December 31, 2015, compared to $12.0 million or 0.74% of loans receivable as of December 31, 2014. Non-performing assets, which include non-performing loans, were $16.9 million or 0.68% of total assets and $16.7 million or 0.72% of total assets as of these same dates, respectively. Non-performing loans and assets increased in 2015 because of a $4.8 million loan to an industrial manufacturing company that was downgraded to non-performing status in the fourth quarter of 2015, as previously described. Excluding this loan, non-performing loans and non-performing assets would have declined in 2015. The general decline in non-performing loans and non-performing assets in recent years has been caused by repayments of the related loans or disposition of the foreclosed properties. Also contributing are upgrades of loans to performing status due to improvements in the financial condition or performance of the borrowers and/or the underlying collateral, as permitted by the Company’s credit policies.
Non-performing assets are classified as “substandard” in accordance with the Company’s internal risk rating policy. In addition to non-performing assets, at December 31, 2015, management was closely monitoring $32.4 million in additional loans that were classified as “special mention” and $23.5 million in additional loans that were classified as “substandard” in accordance with the Company’s internal risk rating policy. These amounts compared to $43.5 million and $33.4 million, respectively, as of December 31, 2014. As of December 31, 2015, most of the additional loans that were classified as “special mention” or “substandard” were secured by commercial real estate, multi-family real estate, land, and certain commercial business assets. Management does not believe any of these loans were impaired as of December 31, 2015, although there can be no assurances that such loans will not become impaired in future periods. Classified loans have declined in recent periods as a number of such loans have been either upgraded or have been paid-off by the borrowers.
Trends in the credit quality of the Company’s loan portfolio are subject to many factors that are outside of the Company’s control, such as economic and market conditions. As such, there can be no assurances that there will not be significant fluctuations in the Company’s non-performing assets and/or classified loans in future periods or that there will not be significant variability in the Company’s provision for loan losses from period to period.
Loans considered to be impaired by the Company at December 31, 2015, were $13.6 million compared to $12.0 million at December 31, 2014, $13.0 million at December 31, 2013, $25.8 million at December 31, 2012, and $75.1 million at December 31, 2011. The average annual balance of loans impaired as of December 31, 2015, was $11.6 million and the interest received and recognized on these loans while they were impaired was $630,000.
| 46 |
The following table presents the activity in the Company’s allowance for loan losses at or for the periods indicated.
| At or For the Year Ended December 31 | ||||||||||||||||||||
| 2015 | 2014 | 2013 | 2012 | 2011 | ||||||||||||||||
| (Dollars in thousands) | ||||||||||||||||||||
| Balance at beginning of period | $ | 22,289 | $ | 23,565 | $ | 21,577 | $ | 27,928 | $ | 47,985 | ||||||||||
| Provision for loan losses | (3,655 | ) | 233 | 4,506 | 4,545 | 6,710 | ||||||||||||||
| Charge-offs: | ||||||||||||||||||||
| Commercial and industrial | (74 | ) | (59 | ) | (199 | ) | (136 | ) | (551 | ) | ||||||||||
| Commercial real estate | (149 | ) | (561 | ) | (514 | ) | (4,894 | ) | (15,286 | ) | ||||||||||
| Multi-family | – | (241 | ) | (536 | ) | (857 | ) | (5,035 | ) | |||||||||||
| Construction and development | – | (34 | ) | (148 | ) | (2,693 | ) | (2,737 | ) | |||||||||||
| One- to four-family first mortgages | (346 | ) | (871 | ) | (1,205 | ) | (3,182 | ) | (3,047 | ) | ||||||||||
| Home equity | (147 | ) | (103 | ) | (1,000 | ) | (327 | ) | (524 | ) | ||||||||||
| Other consumer | (544 | ) | (431 | ) | (389 | ) | (485 | ) | (512 | ) | ||||||||||
| Total charge-offs | (1,260 | ) | (2,300 | ) | (3,991 | ) | (12,574 | ) | (27,692 | ) | ||||||||||
| Recoveries: | ||||||||||||||||||||
| Commercial and industrial | 7 | 64 | 5 | 26 | 18 | |||||||||||||||
| Commercial real estate | 120 | 169 | 666 | 956 | 40 | |||||||||||||||
| Multi-family | – | 15 | 102 | 568 | 248 | |||||||||||||||
| Construction and development | – | 142 | 109 | 1 | 550 | |||||||||||||||
| One- to four-family first mortgages | 73 | 344 | 492 | 86 | 49 | |||||||||||||||
| Home equity | 29 | 27 | 68 | 1 | – | |||||||||||||||
| Other consumer | 48 | 30 | 31 | 40 | 20 | |||||||||||||||
| Total recoveries | 277 | 791 | 1,473 | 1,678 | 925 | |||||||||||||||
| Net charge-offs | (983 | ) | (1,509 | ) | (2,518 | ) | (10,896 | ) | (26,768 | ) | ||||||||||
| Balance at end of period | $ | 17,641 | $ | 22,289 | $ | 23,565 | $ | 21,577 | $ | 27,928 | ||||||||||
| Net charge-offs to average loans | 0.06 | % | 0.10 | % | 0.18 | % | 0.78 | % | 1.96 | % | ||||||||||
| Allowance for loan losses to total loans | 1.01 | % | 1.37 | % | 1.56 | % | 1.54 | % | 2.12 | % | ||||||||||
| Allowance for loan losses to non-performing loans | 129.51 | % | 185.68 | % | 181.62 | % | 83.64 | % | 37.17 | % | ||||||||||
The changes in the Company’s allowance for loan losses in recent years has been generally consistent with overall changes in the Company’s level of non-performing loans, changes in loan charge-off activity, and industry trends. The changes are also consistent with changes in management’s assessment of overall economic conditions, unemployment, and real estate values during the periods. The Company’s ratio of allowance for loan losses as a percent of non-performing loans increased from 37.17% at December 31, 2011, to 129.51% at December 31, 2015. The general increase in this ratio over this period was caused by a substantial decline in non-performing loans relative to the allowance for loan losses. Such increase is to be expected when non-performing loans (which are generally evaluated for impairment on an individual basis) decline and, as a result, a larger portion of the allowance for loan losses relates to loans that are evaluated for impairment on a collective basis (refer to “Note 3. Loans Receivable” in “Item 8. Financial Statements and Supplementary Data”). The decrease in the ratio of allowance for loan losses to non-performing loans at December 31, 2015, compared to December 31, 2014, was caused by the downgrade to non-performing status of the loan to a regional metal finishing company, as previously discussed.
Although management believes the Company’s allowance for loan losses at December 31, 2015, was adequate, there can be no assurances that future adjustments to the allowance will not be necessary, which could adversely affect the Company’s results of operations. For additional discussion, refer to “Item 1. Business—Asset Quality,” above, and “Critical Accounting Policies—Allowance for Loan Losses,” below.
| 47 |
The following table represents the Company’s allocation of its allowance for loan losses by loan category on the dates indicated:
| December 31 | ||||||||||||||||||||||||||||||||||||||||
| 2015 | 2014 | 2013 | 2012 | 2011 | ||||||||||||||||||||||||||||||||||||
| Amount | Percent to Total | Amount | Percent to Total | Amount | Percent to Total | Amount | Percent to Total | Amount | Percent to Total | |||||||||||||||||||||||||||||||
| (Dollars in thousands) | ||||||||||||||||||||||||||||||||||||||||
| Loan category: | ||||||||||||||||||||||||||||||||||||||||
| Commercial and industrial | $ | 3,658 | 20.73 | % | $ | 2,349 | 10.54 | % | $ | 2,603 | 11.05 | % | $ | 1,686 | 7.81 | % | $ | 2,098 | 7.51 | % | ||||||||||||||||||||
| Commercial real estate | 4,796 | 27.19 | 6,880 | 30.86 | 6,377 | 27.06 | 7,354 | 34.08 | 9,467 | 33.90 | ||||||||||||||||||||||||||||||
| Multi-family | 3,337 | 18.92 | 6,078 | 27.27 | 5,931 | 25.17 | 5,195 | 24.08 | 7,442 | 26.65 | ||||||||||||||||||||||||||||||
| Construction and development | 2,835 | 16.07 | 2,801 | 12.57 | 4,160 | 17.65 | 2,617 | 12.13 | 4,506 | 16.13 | ||||||||||||||||||||||||||||||
| One- to four-family first mortgages | 1,835 | 10.40 | 3,004 | 13.48 | 3,220 | 13.66 | 3,267 | 15.14 | 3,201 | 11.46 | ||||||||||||||||||||||||||||||
| Home equity and other consumer | 1,180 | 6.69 | 1,177 | 5.28 | 1,274 | 5.41 | 1,458 | 6.76 | 1,214 | 4.35 | ||||||||||||||||||||||||||||||
| Total allowance for loan losses | $ | 17,641 | 100.00 | % | $ | 22,289 | 100.00 | % | $ | 23,565 | 100.00 | % | $ | 21,577 | 100.00 | % | $ | 27,928 | 100.00 | % | ||||||||||||||||||||
Critical Accounting Policies
There are a number of accounting policies that the Company has established which require a significant amount of management judgment. A number of the more significant policies are discussed in the following paragraphs.
Allowance for Loan Losses Establishing the amount of the allowance for loan losses requires the use of management judgment. The allowance for loan losses is maintained at a level believed adequate by management to absorb probable losses inherent in the loan portfolio and is based on factors such as the size and current risk characteristics of the portfolio, an assessment of individual problem loans and pools of homogenous loans within the portfolio, and actual loss, delinquency, and/or risk rating experience within the portfolio. The Company also considers current economic conditions and/or events in specific industries and geographical areas, including unemployment levels, trends in real estate values, peer comparisons, and other pertinent factors, to include regulatory guidance. Finally, as appropriate, the Company also considers individual borrower circumstances and the condition and fair value of the loan collateral, if any.
Determination of the allowance is inherently subjective as it requires significant estimates, including the amounts and timing of expected future cash flows on loans, the fair value of underlying collateral (if any), estimated losses on pools of homogeneous loans based on historical loss experience, changes in risk characteristics of the loan portfolio, and consideration of current economic trends, all of which may be susceptible to significant change. Higher rates of loan defaults than anticipated would likely result in a need to increase provisions in future years. Loan losses are charged off against the allowance, while recoveries of amounts previously charged off are credited to the allowance. A provision for loan losses is charged to operations based on management’s periodic evaluation of the factors previously mentioned, as well as other pertinent factors. Evaluations are conducted at least quarterly and more often if deemed necessary. If management misjudges a major component of the allowance and the Company experiences an unanticipated loss, it will likely affect earnings. Developments affecting loans can also cause the allowance to vary significantly between quarters. Management consistently challenges itself in the review of the risk components to identify any changes in trends and their causes.
Other-Than-Temporary Impairment Generally accepted accounting principles require enterprises to determine whether a decline in the fair value of an individual debt security below its amortized cost is other than temporary. If the decline is deemed to be other than temporary, the cost basis of the security must be written down through a charge to earnings. Determination of OTTI requires significant management judgment relating to the probability of future cash flows, the financial condition and near-term prospects of the issuer of the security, and/or the collateral for the security, the duration and extent of the decline in fair value, and the ability and intent of the Company to retain the security, among other things. Future changes in management’s assessment of OTTI on its securities could result in significant charges to earnings in future periods.
Income Taxes The assessment of the Company’s tax assets and liabilities involves the use of estimates, forecasts, assumptions, interpretations, and judgment concerning the Company’s estimated future results of operations, as well as certain accounting pronouncements and federal and state tax codes. Management evaluates the Company’s net deferred tax asset on an on-going basis to determine if a valuation allowance is required. This evaluation requires significant management judgment based on positive and negative evidence. Such evidence includes the Company’s recent trends in earnings, the duration of federal and state net operating loss carryforward periods, and other factors. There can be no assurance that future events, such as adverse operating results, court decisions, regulatory actions or interpretations, changes in tax rates and laws, or changes in positions of federal and state taxing authorities will not differ from management’s current assessments. The impact of these matters could be significant to the consolidated financial conditions and results of operations.
| 48 |
The Company describes all of its significant accounting policies in “Note 1. Basis of Presentation” in “Item 8. Financial Statements and Supplementary Data.”
Contractual Obligations, Commitments, Contingent Liabilities, and Off-Balance Sheet Arrangements
The Company has various financial obligations, including contractual obligations and commitments, that may require future cash payments.
The following table presents, as of December 31, 2015, significant fixed and determinable contractual obligations to third parties by payment date. All amounts in the table exclude interest costs to be paid in the periods indicated, if applicable.
| Payments Due In | ||||||||||||||||||||
| One to | Three to | Over | ||||||||||||||||||
| One Year | Three | Five | Five | |||||||||||||||||
| Or Less | Years | Years | Years | Total | ||||||||||||||||
| (Dollars in thousands) | ||||||||||||||||||||
| Deposit liabilities without a stated maturity | $ | 1,251,020 | – | – | – | $ | 1,251,020 | |||||||||||||
| Certificates of deposit | 282,584 | $ | 244,405 | $ | 17,582 | – | 544,571 | |||||||||||||
| Borrowed funds | 185,950 | 110,790 | 45,980 | $ | 29,655 | 372,375 | ||||||||||||||
| Operating leases | 905 | 1,167 | 1,106 | 2,292 | 5,470 | |||||||||||||||
| Purchase obligations | 2,400 | 4,800 | 1,800 | – | 9,000 | |||||||||||||||
| Deferred retirement plans and deferred compensation plans | 781 | 1,571 | 1,639 | 4,548 | 8,539 | |||||||||||||||
The Company’s operating lease obligations represent short- and long-term lease and rental payments for facilities, certain software and data processing and other equipment. Purchase obligations represent obligations under agreements to purchase goods or services that are enforceable and legally binding on the Company and that specify all significant terms, including: fixed or minimum quantities to be purchased; fixed, minimum or variable price provisions; and the approximate timing of the transaction. The purchase obligation amounts presented above primarily relate to certain contractual payments for services provided for information technology.
The Company also has obligations under its deferred retirement plan for directors as described in “Note 10. Employee Benefit Plans” in “Item 8. Financial Statements and Supplementary Data.”
The following table details the amounts and expected maturities of significant off-balance sheet commitments to extend credit as of December 31, 2015.
| Payments Due In | ||||||||||||||||||||
| One to | Three to | Over | ||||||||||||||||||
| One Year | Three | Five | Five | |||||||||||||||||
| Or Less | Years | Years | Years | Total | ||||||||||||||||
| (Dollars in thousands) | ||||||||||||||||||||
| Commercial lines of credit | $ | 146,183 | – | – | – | $ | 146,183 | |||||||||||||
| Commercial loans | 6,447 | $ | 325 | – | 6,772 | |||||||||||||||
| Standby letters of credit | 2,748 | 1,426 | $ | 284 | – | 4,458 | ||||||||||||||
| Multi-family and commercial real estate | 312,826 | – | – | – | 312,826 | |||||||||||||||
| Residential real estate | 32,268 | – | – | – | 32,268 | |||||||||||||||
| Revolving home equity and credit card lines | 164,989 | – | – | – | 164,989 | |||||||||||||||
| Net commitments to sell residential loans | 9,543 | – | – | – | 9,543 | |||||||||||||||
| 49 |
Commitments to extend credit, including loan commitments, standby letters of credit, unused lines of credit and commercial letters of credit do not necessarily represent future cash requirements, since these commitments often expire without being drawn upon.
Quarterly Financial Information
The following table sets forth certain unaudited quarterly data for the periods indicated:
| 2015 Quarter Ended | ||||||||||||||||
| March 31 | June 30 | September 30 | December 31 | |||||||||||||
| (Dollars in thousands, except per share amounts) | ||||||||||||||||
| Interest income | $ | 19,410 | $ | 19,271 | $ | 19,441 | $ | 19,778 | ||||||||
| Interest expense | 2,246 | 2,309 | 2,449 | 2,561 | ||||||||||||
| Net interest income | 17,164 | 16,962 | 16,992 | 17,217 | ||||||||||||
| Provision for loan losses | (964 | ) | (752 | ) | (930 | ) | (1,019 | ) | ||||||||
| Total non-interest income | 5,546 | 5,907 | 5,996 | 5,789 | ||||||||||||
| Total non-interest expense | 18,057 | 17,942 | 18,470 | 18,258 | ||||||||||||
| Income before taxes | 5,617 | 5,679 | 5,448 | 5,767 | ||||||||||||
| Income tax expense | 2,064 | 2,090 | 2,103 | 2,077 | ||||||||||||
| Net income | $ | 3,553 | $ | 3,589 | $ | 3,345 | $ | 3,690 | ||||||||
| Earnings per share-basic | $ | 0.08 | $ | 0.08 | $ | 0.07 | $ | 0.08 | ||||||||
| Earnings per share-diluted | 0.08 | 0.08 | 0.07 | 0.08 | ||||||||||||
| Cash dividend paid per share | 0.04 | 0.05 | 0.05 | 0.05 | ||||||||||||
| 2014 Quarter Ended | ||||||||||||||||
| March 31 | June 30 | September 30 | December 31 | |||||||||||||
| (Dollars in thousands, except per share amounts) | ||||||||||||||||
| Interest income | $ | 19,673 | $ | 19,798 | $ | 19,671 | $ | 20,123 | ||||||||
| Interest expense | 2,526 | 2,396 | 2,291 | 2,203 | ||||||||||||
| Net interest income | 17,147 | 17,402 | 17,380 | 17,920 | ||||||||||||
| Provision for loan losses | 13 | 321 | 98 | (199 | ) | |||||||||||
| Total non-interest income | 4,895 | 5,704 | 6,093 | 5,657 | ||||||||||||
| Total non-interest expense | 16,759 | 17,220 | 16,684 | 17,798 | ||||||||||||
| Income before taxes | 5,270 | 5,565 | 6,691 | 5,978 | ||||||||||||
| Income tax expense | 2,438 | 1,988 | 2,284 | 2,140 | ||||||||||||
| Net loss (gain) attributable to non-controlling interest | 12 | 1 | 2 | (4 | ) | |||||||||||
| Net income | $ | 2,844 | $ | 3,578 | $ | 4,409 | $ | 3,834 | ||||||||
| Earnings per share-basic | $ | 0.06 | $ | 0.08 | $ | 0.09 | $ | 0.08 | ||||||||
| Earnings per share-diluted | 0.06 | 0.08 | 0.09 | 0.08 | ||||||||||||
| Cash dividend paid per share | 0.03 | 0.04 | 0.04 | 0.04 | ||||||||||||
| 50 |
Item 7A. Quantitative and Qualitative Disclosures About Market Risk
The Company’s ability to maintain net interest income depends upon earning a higher yield on assets than the rates it pays on deposits and borrowings. Fluctuations in market interest rates will ultimately impact both the level of income and expense recorded on a large portion of the Company’s assets and liabilities. Fluctuations in interest rates will also affect the market value of all interest-earning assets and interest-bearing liabilities, other than those with a very short term to maturity.
Interest rate sensitivity is a measure of the difference between amounts of interest-earning assets and interest-bearing liabilities which either reprice or mature during a given period of time. The difference, or the interest rate sensitivity “gap, ” provides an indication of the extent to which the Company’s interest rate spread will be affected by changes in interest rates. Refer to “Gap Analysis,” below. Interest rate sensitivity is also measured through analysis of changes in the present value of the Company’s equity. Refer to “Present Value of Equity,” below.
To achieve the objectives of managing interest rate risk, the Company’s executive management meets periodically to discuss and monitor the market interest rate environment and provides reports to the board of directors. Management seeks to coordinate asset and liability decisions so that, under changing interest rate scenarios, the Company’s earnings will remain within an acceptable range. The primary objectives of the Company’s interest rate management strategy are to:
| · | maintain earnings and capital within self-imposed parameters over a range of possible interest rate environments; |
| · | coordinate interest rate risk policies and procedures with other elements of the Company’s business plan, all within the context of the current business environment and regulatory capital and liquidity requirements; and |
| · | manage interest rate risk in a manner consistent with the approved guidelines and policies set by the board of directors. |
The Company has employed certain strategies to manage the interest rate risk inherent in the asset/liability mix, including:
| · | emphasizing the origination of adjustable-rate mortgage loans and mortgage loans that mature or reprice within five years for portfolio, and selling most fixed-rate residential mortgage loans with maturities of 15 years or more in the secondary market; |
| · | entering into interest rate swap arrangements to mitigate the interest rate exposure associated with specific commercial loan relationships at the time such loans are originated; |
| · | emphasizing variable-rate and/or short- to medium-term, fixed-rate home equity and commercial and industrial loans; |
| · | maintaining a significant level of mortgage-related and other investment securities available-for-sale that have weighted-average life of less than five years or interest rates that reprice in less than five years; and |
| · | managing deposits and borrowings to provide stable funding. |
Management believes these strategies reduce the Company’s interest rate risk exposure to acceptable levels.
Gap Analysis Repricing characteristics of assets and liabilities may be analyzed by examining the extent to which such assets and liabilities are “interest rate sensitive” and by monitoring a financial institution's interest rate sensitivity “gap.” An asset or liability is said to be “interest rate sensitive” within a specific time period if it will mature or reprice within that time period. The interest rate sensitivity gap is defined as the difference between the amount of interest-earning assets maturing or repricing within a specific time period and the amount of interest-bearing liabilities maturing or repricing within that same time period.
| 51 |
A gap is considered positive when the amount of interest-earning assets maturing or repricing within a specific time period exceeds the amount of interest-bearing liabilities maturing or repricing within that specific time period. A gap is considered negative when the amount of interest-bearing liabilities maturing or repricing within a specific time period exceeds the amount of interest-earning assets maturing or repricing within the same period. During a period of rising interest rates, a financial institution with a negative gap position would be expected, absent the effects of other factors, to experience a greater increase in the costs of its liabilities relative to the yields of its assets and thus a decrease in the institution's net interest income. An institution with a positive gap position would be expected, absent the effect of other factors, to experience the opposite result. Conversely, during a period of falling interest rates, a negative gap would tend to result in an increase in net interest income while a positive gap would tend to reduce net interest income.
The following table presents the amounts of the Company’s interest-earning assets and interest-bearing liabilities outstanding at December 31, 2015, which management anticipates to reprice or mature in each of the future time periods shown. The information presented in the following table is based on the following assumptions:
| · | Loans—based upon contractual maturities, repricing date, if applicable, scheduled repayments of principal, and projected prepayments of principal based upon the Company’s historical experience or anticipated prepayments. Actual cash flows may differ substantially from these assumptions. |
| · | Mortgage-related securities—based upon known repricing dates (if applicable) and an independent outside source for determining estimated prepayment speeds. Actual cash flows may differ substantially from these assumptions. |
| · | Deposit liabilities—based upon contractual maturities and the Company’s historical decay rates. Actual cash flows may differ from these assumptions. |
| · | Borrowings—based upon final maturity. |
| December 31, 2015 | ||||||||||||||||||||||||
| Within | Three to | More than | More than | |||||||||||||||||||||
| Three | Twelve | 1 Year to | 3 Years - | Over 5 | ||||||||||||||||||||
| Months | Months | 3 Years | 5 Years | Years | Total | |||||||||||||||||||
| (Dollars in thousands) | ||||||||||||||||||||||||
| Loans receivable: | ||||||||||||||||||||||||
| Commercial loans: | ||||||||||||||||||||||||
| Fixed | $ | 20,045 | $ | 63,855 | $ | 154,144 | $ | 76,507 | $ | 23,004 | $ | 337,555 | ||||||||||||
| Adjustable | 602,765 | 56,189 | 57,016 | 14,794 | – | 730,764 | ||||||||||||||||||
| Retail loans: | ||||||||||||||||||||||||
| Fixed | 19,316 | 40,557 | 75,557 | 43,402 | 70,568 | 249,400 | ||||||||||||||||||
| Adjustable | 110,904 | 144,490 | 82,743 | 57,240 | 36,929 | 432,306 | ||||||||||||||||||
| Interest-earning deposits | 16,524 | – | – | – | – | 16,524 | ||||||||||||||||||
| Mortgage-related securities: | ||||||||||||||||||||||||
| Fixed | 31,168 | 88,968 | 155,646 | 130,910 | 103,879 | 510,571 | ||||||||||||||||||
| Adjustable | 16,988 | – | – | – | – | 16,988 | ||||||||||||||||||
| Other interest-earning assets | 17,591 | – | – | – | – | 17,591 | ||||||||||||||||||
| Total interest-earning assets | 835,301 | 394,059 | 525,106 | 322,853 | 234,380 | 2,311,699 | ||||||||||||||||||
| Deposit liabilities: | ||||||||||||||||||||||||
| Non-interest-bearing demand accounts | – | – | – | – | 213,762 | 213,762 | ||||||||||||||||||
| Interest-bearing demand accounts | – | – | – | – | 277,605 | 277,605 | ||||||||||||||||||
| Savings accounts | – | – | – | – | 217,633 | 217,633 | ||||||||||||||||||
| Money market accounts | 542,020 | – | – | – | – | 542,020 | ||||||||||||||||||
| Certificates of deposit | 75,425 | 210,627 | 240,938 | 17,582 | – | 544,572 | ||||||||||||||||||
| Advance payments by borrowers for taxes and insurance | – | 3,382 | – | – | – | 3,382 | ||||||||||||||||||
| Borrowings | 130,334 | 56,974 | 104,308 | 53,994 | 26,765 | 372,375 | ||||||||||||||||||
| Total non-interest- and interest- bearing liabilities | 747,779 | 270,983 | 345,246 | 71,576 | 735,765 | 2,171,349 | ||||||||||||||||||
| Interest rate sensitivity gap | $ | 87,523 | $ | 123,076 | $ | 179,860 | $ | 251,277 | $ | (501,835 | ) | $ | 140,350 | |||||||||||
| Cumulative interest rate sensitivity gap | $ | 87,523 | $ | 210,599 | $ | 390,458 | $ | 641,735 | $ | 140,350 | ||||||||||||||
| Cumulative interest rate sensitivity gap as a percent of total assets | ||||||||||||||||||||||||
| Cumulative interest-earning assets as a | 3.50 | % | 8.42 | % | 15.61 | % | 25.66 | % | 5.61 | % | ||||||||||||||
| percentage of non-interest- and interest-bearing liabilities | 111.70 | % | 120.67 | % | 128.63 | % | 144.70 | % | 106.46 | % | ||||||||||||||
| 52 |
Based on the above gap analysis, at December 31, 2015, the Company’s interest-bearing assets maturing or repricing within one year exceeds its interest-earning liabilities maturing or repricing within the same period. Based on this information, over the course of the next year net interest income could be favorably impacted by an increase in market interest rates. Alternatively, net interest income could be unfavorably impacted by a decrease in market interest rates. However, it should be noted that the Company’s future net interest income is affected by more than just future market interest rates. Net interest income is also affected by absolute and relative levels of earning assets and interest-bearing liabilities, the level of non-performing loans and other investments, and by other factors outlined in “Item 1. Business—Cautionary Statement,” “Item 1A. Risk Factors,” and “Item 7. Management Discussion of Financial Condition and Results of Operations.”
In addition to not anticipating all of the factors that could impact future net interest income, gap analysis has certain shortcomings. For example, although certain assets and liabilities may mature or reprice in similar periods, the interest rates on such react by different degrees to changes in market interest rates, especially in instances where changes in rates are limited by contractual caps or floors or instances where rates are influenced by competitive forces. Interest rates on certain types of assets and liabilities may fluctuate in advance of changes in market interest rates, while interest rates on other types may lag behind changes in market rates. For example, it is the Company’s past experience that rate changes on most of its deposit liabilities generally lag changes in market interest rates. Certain assets, such as adjustable-rate loans, have features which limit changes in interest rates on a short term basis and over the life of the loan. If interest rates change, prepayment, and early withdrawal levels would likely deviate significantly from those assumed in calculating the table. Finally, the ability of borrowers to make payments on their adjustable-rate loans may decrease if interest rates increase. Because of these shortcomings, management of the Company believes that gap analysis is a better indicator of the relative change in the Company’s interest rate risk exposure from period to period than it is an indicator of the direction or amount of future change in net interest income.
Present Value of Equity In addition to the gap analysis table, management also uses simulation models to monitor interest rate risk. The models report the present value of equity (“PVE”) in different interest rate environments, assuming an instantaneous and permanent interest rate shock to all interest rate sensitive assets and liabilities. The PVE is the difference between the present value of expected cash flows of interest rate sensitive assets and liabilities. The changes in market value of assets and liabilities due to changes in interest rates reflect the interest rate sensitivity of those assets and liabilities as their values are derived from the characteristics of the asset or liability (i.e., fixed rate, adjustable rate, caps, and floors) relative to the current interest rate environment. For example, in a rising interest rate environment, the fair market value of a fixed-rate asset will decline whereas the fair market value of an adjustable-rate asset, depending on its repricing characteristics, may not decline. Increases in the market value of assets will increase the PVE whereas decreases in market value of assets will decrease the PVE. Conversely, increases in the market value of liabilities will decrease the PVE whereas decreases in the market value of liabilities will increase the PVE.
The following table presents the estimated PVE over a range of interest rate change scenarios at December 31, 2015. The present value ratio shown in the table is the PVE as a percent of the present value of total assets in each of the different rate environments. For purposes of this table, management has made assumptions such as prepayment rates and decay rates similar to those used for the gap analysis table.
| Change in Interest Rates (Basis Points) | Present
Value Ratio | Change
in Ratio | ||||||
| +400 | 13.39 | % | 12.2 | % | ||||
| +300 | 13.19 | 10.5 | ||||||
| +200 | 12.88 | 7.9 | ||||||
| +100 | 12.35 | 3.5 | ||||||
| 0 | 11.93 | – | ||||||
| -100 | 13.13 | 10.0 | ||||||
Based on the above analysis, the Company’s PVE is not expected to be materially impacted by changes in interest rates. However, it should be noted that the Company’s PVE is impacted by more than changes in market interest rates. Future PVE is also affected by management’s decisions relating to reinvestment of future cash flows, decisions relating to funding sources, and by other factors outlined in “Item 1. Business—Cautionary Statement,” “Item 1A. Risk Factors,” and “Item 7. Management Discussion of Financial Condition and Results of Operations.”
| 53 |
As is the case with gap analysis, PVE analysis also has certain shortcomings. PVE modeling requires management to make assumptions about future changes in market interest rates that are unlikely to occur, such as immediate, sustained, and parallel (or equal) changes in all market rates across all maturity terms. PVE modeling also requires that management make assumptions which may not reflect the manner in which actual yields and costs respond to changes in market interest rates. For example, it is the Company’s past experience that rate changes on most of its deposit liabilities generally lag changes in market interest rates. In addition, management makes assumptions regarding the changes in prepayment speeds of mortgage loans and securities. Prepayments will accelerate in a falling rate environment and the reverse will occur in a rising rate environment. Management also assumes that decay rates on core deposits will accelerate in a rising rate environment and the reverse in a falling rate environment. The model assumes that the Company will take no action in response to the changes in interest rates, when in practice rate changes on most deposit liabilities lag behind market changes and/or may be limited by competition. In addition, prepayment estimates and other assumptions within the model are subjective in nature, involve uncertainties, and therefore cannot be determined with precision. Accordingly, although the PVE model may provide an estimate of the Company’s interest rate risk at a particular point in time, such measurements are not intended to and do not provide a precise forecast of the effect of changes in interest rates on the Company’s PVE. Because of these shortcomings, management of the Company believes that PVE analysis is a better indicator of the relative change in the Company’s interest rate risk exposure from period to period than it is an indicator of the direction or amount of future change in net interest income.
| 54 |
Item 8. Financial Statements and Supplementary Data
Report of Independent Registered Public Accounting Firm
To the Board of Directors and Shareholders
of
Bank Mutual Corporation
Milwaukee, Wisconsin
We have audited the accompanying consolidated statements of financial condition of Bank Mutual Corporation and subsidiaries (the “Company”) as of December 31, 2015 and 2014, and the related consolidated statements of income, total comprehensive income, equity, and cash flows for each of the three years in the period ended December 31, 2015. These consolidated financial statements are the responsibility of the Company’s management. Our responsibility is to express an opinion on these consolidated financial statements based on our audits.
We conducted our audits in accordance with the standards of the Public Company Accounting Oversight Board (United States). Those standards require that we plan and perform the audit to obtain reasonable assurance about whether the financial statements are free of material misstatement. An audit includes examining, on a test basis, evidence supporting the amounts and disclosures in the financial statements. An audit also includes assessing the accounting principles used and significant estimates made by management, as well as evaluating the overall financial statement presentation. We believe that our audits provide a reasonable basis for our opinion.
In our opinion, such consolidated financial statements present fairly, in all material respects, the financial position of Bank Mutual Corporation and subsidiaries as of December 31, 2015 and 2014, and the results of their operations and their cash flows for each of the three years in the period ended December 31, 2015, in conformity with accounting principles generally accepted in the United States of America.
We have also audited, in accordance with the standards of the Public Company Accounting Oversight Board (United States), the Company’s internal control over financial reporting as of December 31, 2015, based on the criteria established in Internal Control—Integrated Framework (2013) issued by the Committee of Sponsoring Organizations of the Treadway Commission and our report dated March 7, 2016, expressed an unqualified opinion on the Company’s internal control over financial reporting.
/s/ Deloitte & Touche LLP
Milwaukee, Wisconsin
March 7, 2016
| 55 |
Bank Mutual Corporation and Subsidiaries
Consolidated Statements of Financial Condition
| December 31 | ||||||||
| 2015 | 2014 | |||||||
| (Dollars in thousands) | ||||||||
| Assets | ||||||||
| Cash and due from banks | $ | 27,971 | $ | 34,727 | ||||
| Interest-earning deposits in banks | 16,530 | 11,450 | ||||||
| Cash and cash equivalents | 44,501 | 46,177 | ||||||
| Mortgage-related securities available-for-sale, at fair value | 407,874 | 321,883 | ||||||
| Mortgage-related securities held-to-maturity, at amortized cost (fair value of $121,641 in 2015 and $134,117 in 2014) | 120,891 | 132,525 | ||||||
| Loans held-for-sale | 3,350 | 3,837 | ||||||
| Loans receivable (net of allowance for loan losses of $17,641 in 2015 and $22,289 in 2014) | 1,740,018 | 1,631,303 | ||||||
| Mortgage servicing rights, net | 7,205 | 7,867 | ||||||
| Other assets | 178,328 | 184,854 | ||||||
| Total assets | $ | 2,502,167 | $ | 2,328,446 | ||||
| Liabilities and equity | ||||||||
| Liabilities: | ||||||||
| Deposit liabilities | $ | 1,795,591 | $ | 1,718,756 | ||||
| Borrowings | 372,375 | 256,469 | ||||||
| Advance payments by borrowers for taxes and insurance | 3,382 | 4,742 | ||||||
| Other liabilities | 51,425 | 63,988 | ||||||
| Total liabilities | 2,222,773 | 2,043,955 | ||||||
| Equity: | ||||||||
| Preferred stock–$0.01 par value: | ||||||||
| Authorized–20,000,000
shares in 2015 and 2014 Issued and outstanding–none in 2015 and 2014 | – | – | ||||||
| Common stock–$0.01 par value: | ||||||||
| Authorized–200,000,000
shares in 2015 and 2014 Issued–78,783,849 shares in 2015 and 2014 | ||||||||
| Outstanding–45,443,548 shares in 2015 and 46,568,284 in 2014 | 788 | 788 | ||||||
| Additional paid-in capital | 486,273 | 488,467 | ||||||
| Retained earnings | 164,482 | 159,065 | ||||||
| Accumulated other comprehensive loss | (9,365 | ) | (11,136 | ) | ||||
| Treasury stock–33,340,301 shares in 2015 and 32,215,565 in 2014 | (362,784 | ) | (356,467 | ) | ||||
| Total shareholders' equity | 279,394 | 280,717 | ||||||
| Non-controlling interest in real estate partnership | – | 3,774 | ||||||
| Total equity including non-controlling interest | 279,394 | 284,491 | ||||||
| Total liabilities and equity | $ | 2,502,167 | $ | 2,328,446 | ||||
Refer to Notes to Consolidated Financial Statements
| 56 |
Bank Mutual Corporation and Subsidiaries
Consolidated Statements of Income
| Year Ended December 31 | ||||||||||||
| 2015 | 2014 | 2013 | ||||||||||
| (Dollars in thousands, except per share data) | ||||||||||||
| Interest income: | ||||||||||||
| Loans | $ | 65,954 | $ | 66,261 | $ | 64,638 | ||||||
| Mortgage-related securities | 11,684 | 12,850 | 14,666 | |||||||||
| Investment securities | 244 | 139 | 54 | |||||||||
| Interest-earning deposits | 19 | 15 | 98 | |||||||||
| Total interest income | 77,901 | 79,265 | 79,456 | |||||||||
| Interest expense: | ||||||||||||
| Deposit liabilities | 4,771 | 4,684 | 8,325 | |||||||||
| Borrowings | 4,794 | 4,731 | 4,785 | |||||||||
| Advance payments by borrowers for taxes and insurance | 1 | 1 | 2 | |||||||||
| Total interest expense | 9,566 | 9,416 | 13,112 | |||||||||
| Net interest income | 68,335 | 69,849 | 66,344 | |||||||||
| Provision for loan losses | (3,665 | ) | 233 | 4,506 | ||||||||
| Net interest income after provision for loan losses | 72,000 | 69,616 | 61,838 | |||||||||
| Non-interest income: | ||||||||||||
| Deposit-related fees and charges | 11,572 | 11,985 | 12,196 | |||||||||
| Brokerage and insurance commissions | 3,577 | 2,574 | 3,116 | |||||||||
| Mortgage banking revenue, net | 3,462 | 2,990 | 6,876 | |||||||||
| Loan-related fees | 2,300 | 1,624 | 976 | |||||||||
| Income from bank-owned life insurance (“BOLI”) | 1,870 | 2,790 | 2,387 | |||||||||
| Gain on real estate held for investment | 218 | – | – | |||||||||
| Gain on sales of investments | – | 102 | – | |||||||||
| Other non-interest income | 240 | 284 | 565 | |||||||||
| Total non-interest income | 23,239 | 22,349 | 26,116 | |||||||||
| Non-interest expense: | ||||||||||||
| Compensation, payroll taxes, and other employee benefits | 44,824 | 41,299 | 43,854 | |||||||||
| Occupancy, equipment, and data processing costs | 14,298 | 12,787 | 11,881 | |||||||||
| Advertising and marketing | 1,910 | 1,801 | 1,826 | |||||||||
| Federal insurance premiums | 1,508 | 1,489 | 1,863 | |||||||||
| Losses and expenses on foreclosed real estate, net | 801 | 986 | 2,292 | |||||||||
| Other non-interest expense | 9,386 | 10,099 | 9,788 | |||||||||
| Total non-interest expense | 72,727 | 68,461 | 71,504 | |||||||||
| Income before income taxes | 22,512 | 23,504 | 16,450 | |||||||||
| Income tax expense | 8,335 | 8,850 | 5,702 | |||||||||
| Net income before non-controlling interest | 14,177 | 14,654 | 10,748 | |||||||||
| Net loss attributable to non-controlling interests | – | 11 | 48 | |||||||||
| Net income | $ | 14,177 | $ | 14,665 | $ | 10,796 | ||||||
| Per share data: | ||||||||||||
| Earnings per share–basic | $ | 0.31 | $ | 0.32 | $ | 0.23 | ||||||
| Earnings per share–diluted | 0.31 | 0.31 | 0.23 | |||||||||
| Cash dividends per share paid | 0.19 | 0.15 | 0.10 | |||||||||
Refer to Notes to Consolidated Financial Statements
| 57 |
Bank Mutual Corporation and Subsidiaries
Consolidated Statements of Total Comprehensive Income
| Year Ended December 31 | ||||||||||||
| 2015 | 2014 | 2013 | ||||||||||
| (Dollars in thousands) | ||||||||||||
| Net income before non-controlling interest | $ | 14,177 | $ | 14,654 | $ | 10,748 | ||||||
| Other comprehensive income (loss), net of income taxes: | ||||||||||||
| Defined benefit pension plans: | ||||||||||||
| Unrecognized gain (loss) and net prior service costs, net of deferred income taxes of $2,576 in 2015, $(5,328) in 2014, and $2,058 in 2013 | 3,863 | (7,992 | ) | 3,086 | ||||||||
| Curtailment gain on plan amendment, net of deferred income taxes of $409 in 2015 and $958 in 2013 | 614 | – | 1,437 | |||||||||
| 4,477 | (7,992 | ) | 4,523 | |||||||||
| Unrealized holding losses: | ||||||||||||
| Change in net unrealized gain on securities available-for-sale, net of deferred income taxes of $(1,815) in 2015, $(512) in 2014, and $(1,424) in 2013 | (2,706 | ) | (764 | ) | (2,125 | ) | ||||||
| Reclassification adjustment for gain on securities included in income, net of income taxes of $(41) in 2014 | – | (61 | ) | – | ||||||||
| (2,706 | ) | (825 | ) | (2,125 | ) | |||||||
| Total other comprehensive income (loss), net of income taxes | 1,771 | (8,817 | ) | 2,398 | ||||||||
| Total comprehensive income before non-controlling interest | 15,948 | 5,837 | 13,146 | |||||||||
| Comprehensive loss attributable to non-controlling interest | – | 11 | 48 | |||||||||
| Total comprehensive income | $ | 15,948 | $ | 5,848 | $ | 13,194 | ||||||
Refer to Notes to Consolidated Financial Statements
| 58 |
Bank Mutual Corporation and Subsidiaries
Consolidated Statements of Equity
| Common Stock | Additional
Paid-In Capital | Retained
Earnings | Accumulated Other Comprehensive Loss | Treasury
Stock | Non- Controlling Interest in Real Estate Partnership | Total | ||||||||||||||||||||||
| (Dollars in thousands; except per share data) | ||||||||||||||||||||||||||||
| Balance at December 31, 2012 | $ | 788 | $ | 489,960 | $ | 145,231 | $ | (4,717 | ) | $ | (359,409 | ) | $ | 2,933 | $ | 274,786 | ||||||||||||
| Net income | – | – | 10,796 | – | – | – | 10,796 | |||||||||||||||||||||
| Net loss attributable to non-controlling interest | – | – | – | – | – | (48 | ) | (48 | ) | |||||||||||||||||||
| Other comprehensive income | – | – | – | 2,398 | – | – | 2,398 | |||||||||||||||||||||
| Issuance of restricted stock | – | (1,134 | ) | – | – | 1,134 | – | – | ||||||||||||||||||||
| Exercise of stock options | – | (134 | ) | – | – | 221 | – | 87 | ||||||||||||||||||||
| Share based payments | – | 546 | – | – | – | – | 546 | |||||||||||||||||||||
| Cash dividends ($0.10 per share) | – | – | (4,643 | ) | – | – | – | (4,643 | ) | |||||||||||||||||||
| Balance at December 31, 2013 | $ | 788 | $ | 489,238 | $ | 151,384 | $ | (2,319 | ) | $ | (358,054 | ) | $ | 2,885 | $ | 283,922 | ||||||||||||
| Net income | – | – | 14,665 | – | – | – | 14,665 | |||||||||||||||||||||
| Net loss attributable to non-controlling interest | – | – | – | – | – | (11 | ) | (11 | ) | |||||||||||||||||||
| Other comprehensive loss | – | – | – | (8,817 | ) | – | – | (8,817 | ) | |||||||||||||||||||
| Equity contribution by non-controlling interest | – | – | – | – | – | 900 | 900 | |||||||||||||||||||||
| Issuance of restricted stock | – | (1,538 | ) | – | – | 1,538 | – | – | ||||||||||||||||||||
| Exercise of stock options | – | (29 | ) | – | – | 49 | – | 20 | ||||||||||||||||||||
| Share based payments | – | 796 | – | – | – | – | 796 | |||||||||||||||||||||
| Cash dividends ($0.15 per share) | – | – | (6,984 | ) | – | – | – | (6,984 | ) | |||||||||||||||||||
| Balance at December 31, 2014 | $ | 788 | $ | 488,467 | $ | 159,065 | $ | (11,136 | ) | $ | (356,467 | ) | $ | 3,774 | $ | 284,491 | ||||||||||||
| Net income | – | – | 14,177 | – | – | – | 14,177 | |||||||||||||||||||||
| Decrease in non-controlling interest | – | – | – | – | – | (3,774 | ) | (3,774 | ) | |||||||||||||||||||
| Other comprehensive loss | – | – | – | 1,771 | – | – | 1,771 | |||||||||||||||||||||
| Purchase of treasury stock | – | – | – | – | (10,545 | ) | – | (10,545 | ) | |||||||||||||||||||
| Issuance of restricted stock | – | (2,526 | ) | – | – | 2,526 | – | – | ||||||||||||||||||||
| Exercise of stock options | – | (1,323 | ) | – | – | 2,053 | – | 730 | ||||||||||||||||||||
| Share based payments | – | 1,655 | – | – | (351 | ) | – | 1,304 | ||||||||||||||||||||
| Cash dividends ($0.19 per share) | – | – | (8,760 | ) | – | – | – | (8,760 | ) | |||||||||||||||||||
| Balance at December 31, 2015 | $ | 788 | $ | 486,273 | $ | 164,482 | $ | (9,365 | ) | $ | (362,784 | ) | – | $ | 279,394 | |||||||||||||
Refer to Notes to Consolidated Financial Statements
| 59 |
Bank Mutual Corporation and Subsidiaries
Consolidated Statements of Cash Flows
| Year Ended December 31 | ||||||||||||
| 2015 | 2014 | 2013 | ||||||||||
| (Dollars in thousands) | ||||||||||||
| Operating activities: | ||||||||||||
| Net income | $ | 14,177 | $ | 14,665 | $ | 10,796 | ||||||
| Adjustments to reconcile net income to net cash provided by operating activities: | ||||||||||||
| Provision for (recovery of) loan losses | (3,665 | ) | 233 | 4,506 | ||||||||
| Loss on foreclosed real estate, net | 321 | 763 | 1,882 | |||||||||
| Provision for depreciation | 3,253 | 2,917 | 2,668 | |||||||||
| Amortization of mortgage servicing rights | 1,907 | 1,772 | 2,809 | |||||||||
| Decrease in valuation on MSRs | – | (1 | ) | (2,395 | ) | |||||||
| Net premium amortization on securities | 2,374 | 2,216 | 2,159 | |||||||||
| Loans originated for sale | (111,012 | ) | (79,714 | ) | (243,669 | ) | ||||||
| Proceeds from loan sales | 112,962 | 78,739 | 254,685 | |||||||||
| Gain on loan sales activities, net | (2,708 | ) | (1,965 | ) | (4,405 | ) | ||||||
| Gain on real estate held for investment | (218 | ) | – | – | ||||||||
| Gain on sales of investments | – | (102 | ) | – | ||||||||
| Deferred income tax expense | 8,128 | 7,550 | 5,207 | |||||||||
| Qualified defined benefit pension plan contribution | (10,000 | ) | – | – | ||||||||
| Other, net | 732 | (3,094 | ) | 4,410 | ||||||||
| Net cash provided by operating activities | 16,251 | 23,979 | 38,653 | |||||||||
| Investing activities: | ||||||||||||
| Purchases of mortgage-related securities available-for-sale | (203,729 | ) | – | (88,094 | ) | |||||||
| Principal payments on mortgage-related securities available-for-sale | 111,492 | 104,430 | 186,674 | |||||||||
| Proceeds from sale of investment securities available-for-sale | – | 17,794 | – | |||||||||
| Principal payments on mortgage-related securities held-to-maturity | 10,985 | 21,977 | 1,354 | |||||||||
| Net increase in loans receivable | (107,386 | ) | (124,794 | ) | (116,700 | ) | ||||||
| Purchases of FHLB stock | (3,382 | ) | (1,964 | ) | (582 | ) | ||||||
| Redemption of FHLB stock | – | – | 4,178 | |||||||||
| Proceeds from sale of foreclosed properties | 3,378 | 3,558 | 10,786 | |||||||||
| Proceeds from sale of real estate held for investment | 1,356 | – | – | |||||||||
| Net purchases of premises and equipment | (3,568 | ) | (4,133 | ) | (3,696 | ) | ||||||
| Net cash provided (used) by investing activities | (190,854 | ) | 16,868 | (6,080 | ) | |||||||
(continued)
| 60 |
Bank Mutual Corporation and Subsidiaries
Consolidated Statements of Cash Flows (continued)
| Year Ended December 31 | ||||||||||||
| 2015 | 2014 | 2013 | ||||||||||
| (Dollars in thousands) | ||||||||||||
| Financing activities: | ||||||||||||
| Net increase (decrease) in deposit liabilities | $ | 76,801 | $ | (43,926 | ) | $ | (105,217 | ) | ||||
| Net increase in short-term borrowings | 107,200 | 2,800 | 40,000 | |||||||||
| Proceeds from long-term borrowings | 20,000 | 30,000 | – | |||||||||
| Repayments of long-term borrowings | (11,294 | ) | (21,231 | ) | (5,886 | ) | ||||||
| Net increase (decrease) in advance payments by borrowers for taxes and insurance | (1,360 | ) | 1,311 | (1,525 | ) | |||||||
| Cash dividends | (8,760 | ) | (6,984 | ) | (4,643 | ) | ||||||
| Purchases of treasury stock | (10,545 | ) | – | – | ||||||||
| Other, net | 885 | 904 | 95 | |||||||||
| Net cash provided (used) by financing activities | 172,927 | (37,126 | ) | (77,176 | ) | |||||||
| Increase (decrease) in cash and cash equivalents | (1,676 | ) | 3,721 | (44,603 | ) | |||||||
| Cash and cash equivalents at beginning of year | 46,177 | 42,456 | 87,059 | |||||||||
| Cash and cash equivalents at end of year | $ | 44,501 | $ | 46,177 | $ | 42,456 | ||||||
| Supplemental information: | ||||||||||||
| Cash paid in period for: | ||||||||||||
| Interest on deposits and borrowings | $ | 9,070 | $ | 9,431 | $ | 13,142 | ||||||
| Income taxes | 2,438 | 1,055 | 274 | |||||||||
| Non-cash transactions: | ||||||||||||
| Loans transferred to foreclosed properties and repossessed assets | 2,336 | 2,254 | 5,443 | |||||||||
Refer to Notes to Consolidated Financial Statements
| 61 |
Bank Mutual Corporation and Subsidiaries
Notes to Consolidated Financial Statements
December 31, 2015
(Dollars in thousands, except share and per share amounts)
1. Summary of Significant Accounting Policies
Business Bank Mutual Corporation (the “Company”), a Wisconsin corporation, is a federal unitary savings and loan holding company which holds all of the outstanding shares of Bank Mutual (the “Bank”). The Bank is a federal savings bank offering a full range of financial services to customers who are primarily located in the state of Wisconsin. The Bank is principally engaged in the business of attracting deposits from the general public, including businesses and government entities, and using such deposits to originate secured and unsecured loans to commercial and retail borrowers.
Principles of Consolidation The consolidated financial statements have been prepared in accordance with accounting principles generally accepted in the United States. The consolidated financial statements include the accounts and transactions of the Company and its wholly-owned subsidiaries. The Bank has two active wholly-owned subsidiaries, BancMutual Financial & Investment Services, Inc., and MC Development Ltd., which are consolidated into the financial statements. All intercompany accounts and transactions have been eliminated in consolidation.
In 2015 the Company determined that it was no longer necessary under GAAP to consolidate a partial interest it has in a real estate partnership. Effective with this change, the Company determined that the equity method of accounting was appropriate for its ownership interest in this partnership. As such, the $895 carrying value of the Company’s interest in the partnership at December 31, 2015, was included as a component of other assets. In addition, its $8 interest in the loss of the partnership during the twelve months ended December 31, 2015 was included as a component of other non-interest income.
In preparing the consolidated financial statements, management is required to make estimates and assumptions that affect the reported amounts of assets and liabilities as of the date of the statement of financial condition and revenues and expenses for the period. Actual results could differ from those estimates.
Cash and Cash Equivalents The Company considers interest-bearing deposits in banks and federal funds sold that have original maturities of three months or less to be cash equivalents. Under Regulation D, the Bank is required to maintain cash and reserve balances with the Federal Reserve Bank of Chicago. The average amount of required reserve balances for the years ended December 31, 2015 and 2014, was $16,373 and $14,525, respectively.
Federal Home Loan Bank Stock Stock of the Federal Home Loan Bank of Chicago (“FHLB of Chicago”) is owned due to membership requirements and is carried at cost, which is its redemption value, and is included in other assets. FHLB stock is periodically reviewed for impairment based on management’s assessment of the ultimate recoverability of the investment rather than temporary declines in its estimated fair value.
Securities Available-for-Sale and Held-to-Maturity Available-for-sale securities are stated at fair value, with the unrealized gains and losses, net of tax, reported as a separate component of accumulated other comprehensive income in shareholders’ equity. Held-to-maturity securities are stated at amortized cost.
The amortized cost of securities classified as available-for-sale or held-to-maturity is adjusted for amortization of premiums and accretion of discounts to maturity, or in the case of mortgage-related securities, over the estimated life of the securities. Such accretion or amortization is included in interest income from investments. Interest and dividends are included in interest income from investments. Realized gains and losses and declines in value judged to be other-than-temporary are included in net gain or loss on sales of securities and are based on the specific identification method.
| 62 |
Bank Mutual Corporation and Subsidiaries
Notes to Consolidated Financial Statements
December 31, 2015
(Dollars in thousands, except share and per share amounts)
1. Summary of Significant Accounting Policies (continued)
Impairment of available-for-sale and held-to-maturity securities is evaluated considering numerous factors, and their relative significance varies case-by-case. Factors considered include the length of time and extent to which the market value has been less than cost; the financial condition and near-term prospects of the issuer of a security; and the Company’s intent and/or likely need to sell the security before its anticipated recovery in fair value. Further, if the Company does not expect to recover the entire amortized cost of the security (i.e., a credit loss is expected), the Company will be unable to assert that it will recover its cost basis even if it does not intend to sell the security. If, based upon an analysis of each of these factors, it is determined that the impairment is other-than-temporary, the carrying value of the security is written down through earnings by the amount of the expected credit loss.
Loans Receivable Loans receivable are recorded at cost, net of undisbursed loan proceeds, allowance for loan losses, unamortized deferred fees and costs, and unamortized purchase premiums or discounts, if any. Loan origination and commitment fees and certain direct loan origination costs are deferred and amortized as an adjustment of loan yield. Purchase premiums and discounts are also amortized as an adjustment of yield.
Loans Held-for-Sale Loans held-for-sale, which generally consists of recently originated fixed-rate residential mortgage loans, are recorded at market value determined on an individual loan basis. Fees received from the borrower are deferred and recorded as an adjustment of the carrying value.
Accrued Interest on Loans Interest on loans receivable is accrued and credited to income as earned. The Company measures the past due status of a loan by the number of days that have elapsed since the borrower has failed to make a contractual loan payment. Accrual of interest is generally discontinued when either (i) reasonable doubt exists as to the full, timely collection of interest or principal or (ii) when a loan becomes past due by more than 90 days. At that time, the loan is considered impaired and any accrued but uncollected interest is reversed. Additional interest income is recorded only to the extent that payments are received, collection of the principal is reasonably assured, and/or the net recorded investment in the loan is deemed to be collectible. Loans are generally restored to accrual status when the obligation is brought to a current status by the borrower.
Allowance for Loan Losses and Impaired Loans The Company classifies its loan portfolio into six segments for purposes of determining its allowance for loan losses: commercial and industrial, commercial real estate, multi-family real estate, construction and development, one- to four-family real estate, and home equity and other consumer. This segmentation is based on the nature of the loan collateral and the purpose of the loan, which in the judgment of management are the primary risk characteristics that determine the allowance for loan loss. Loans in the commercial and industrial segment are typically secured by equipment, inventory, receivables, other business assets, and in some instances, business and personal real estate, or may be unsecured. Loans in the commercial real estate, multi-family real estate, and one- to four-family real estate segments are secured principally by real estate. The commercial real estate segment consists of non-residential loans secured by office, retail/wholesale, industrial/warehouse, and other properties. The construction and development segment consists of loans secured by commercial real estate, multi-family, and developed and undeveloped land. Loans in the home equity and other consumer segment may be secured by real estate, personal property, or may be unsecured.
The allowance for loan losses for each segment is maintained at a level believed adequate by management to absorb probable losses inherent in each segment and is based on factors such as the size and current risk characteristics of the segments, an assessment of individual problem loans and pools of homogenous loans within the segments, and actual loss, delinquency, and/or risk rating experience within the segments. The Company also considers current economic conditions and/or events in specific industries and geographical areas, including unemployment levels, trends in real estate values, peer comparisons, industry loss experience by loan type, and other pertinent factors, to include regulatory guidance. Finally, as appropriate, the Company also considers individual borrower circumstances and the condition and fair value of the loan collateral, if any.
The allowance for loan losses for each segment is determined using a combined approach. Individual loans in the segments that have been identified as impaired are analyzed individually to determine an appropriate allowance for
loan loss. In addition, the allowance for loan losses for each segment is augmented using a homogenous pool approach for loans in each segment that are current and/or have not been individually identified as impaired loans.
| 63 |
Bank Mutual Corporation and Subsidiaries
Notes to Consolidated Financial Statements
December 31, 2015
(Dollars in thousands, except share and per share amounts)
1. Summary of Significant Accounting Policies (continued)
The homogenous approach utilizes loss rates that are developed by management using the qualitative factors and other considerations outlined in the previous paragraph.
Loans are considered impaired when they are identified as such by the Company’s internal risk rating and loss evaluation process or when contractually past due 90 days or more with respect to interest or principal. Factors that indicate impairment include, but are not limited to, deterioration in a borrower’s financial condition, performance, or outlook, decline in the condition, performance, or fair value of the collateral for the loan (if any), payment or other default on the loan, and adverse economic or market developments in the borrower’s region or business segment. Accrual of interest is typically discontinued on impaired loans, although from time-to-time the Company may continue to accrue interest and/or recognize interest income on impaired loans when payments are being received and, in the judgment of management, collection of the principal is reasonably assured and/or the net recorded investment in the loan is deemed to be collectible.
The Company has various policies and procedures in place to monitor its exposure to credit risk including, but not limited to, a formal risk rating process, periodic loan delinquency reporting, periodic loan file reviews, financial updates from and visits to borrowers, and established past-due loan collection procedures. The Company formally evaluates its allowance for loan losses on a quarterly basis or more often as deemed necessary. A provision for loan loss is charged to operations based on this periodic evaluation. Actual loan losses are charged off against the allowance for loan losses, while recoveries of amounts previously charged off are credited to the allowance.
Determination of the allowance is inherently subjective as it requires significant estimates, including the amounts and timing of expected future cash flows on loans, the fair value of underlying collateral (if any), estimated losses on pools of homogeneous loans based on historical loss experience, changes in risk characteristics of the loan portfolio, and consideration of current economic trends, all of which may be susceptible to significant change.
Mortgage Servicing Rights Mortgage servicing rights are recorded as an asset when loans are sold with servicing rights retained. The total cost of loans sold is allocated between the loan balance and their servicing asset based on their relative fair values. The capitalized value of mortgage servicing rights is amortized in proportion to, and over the period of, estimated net future servicing revenue. Mortgage servicing rights are carried at the lower of the initial carrying value, adjusted for amortization, or estimated fair value. The carrying values are periodically evaluated for impairment. For purposes of measuring impairment, the servicing rights are stratified into pools based on term and interest rate. Impairment represents the excess of the remaining capitalized cost of a stratified pool over its fair value, and is recorded through a valuation allowance. The fair value of each servicing rights pool is calculated based on the present value of estimated future cash flows using a discount rate, given current market conditions. Estimates of fair value include assumptions about prepayment speeds, interest rates and other factors which are subject to change over time. Changes in these underlying assumptions could cause the fair value of mortgage servicing rights, and the related valuation allowance, if any, to change significantly in the future.
Derivative Financial Instruments Derivative financial instruments, including derivative instruments embedded in other contracts, are carried at fair value on the consolidated balance sheets with changes in the fair value recorded to earnings or other comprehensive income, as specified in GAAP. On the date derivative contracts are entered into, the Company designates such as either (i) a fair value hedge (i.e., a hedge of the fair value of a recognized asset or liability), (ii) a cash flow hedge (i.e., a hedge of the variability of cash flows to be received or paid related to a recognized asset or liability), or (iii) a free-standing derivative instrument. The Company has no derivatives designated as fair value hedges. For derivatives designated as cash flow hedges, the effective portion of the change in the fair value of the derivative instrument is recorded in other comprehensive income and the ineffective portion is recognized in current period earnings as an adjustment to the related income statement account. Amounts within accumulated other comprehensive income are reclassified into earnings in the period the hedged item affects earnings. If a derivative is designated as a free-standing derivative instrument, changes in fair value are reported in current period earnings.
| 64 |
Bank Mutual Corporation and Subsidiaries
Notes to Consolidated Financial Statements
December 31, 2015
(Dollars in thousands, except share and per share amounts)
1. Summary of Significant Accounting Policies (continued)
In connection with its mortgage banking activities, the Company enters into interest rate lock commitments (“IRLCs”) to fund residential mortgage loans at specified interest rates and within specified periods of time, generally up to 60 days from the time of rate lock. IRLCs that are related to loans that will be sold in the secondary market are designated as free-standing derivative instruments by management. In addition, the forward commitments to sell loans are also designated as free-standing derivatives by management. IRLCs related to loans that will be sold, as well as the forward commitments to sell loans, are carried at fair value on the consolidated balance sheet in other assets or other liabilities, as the case may be, and changes in fair value are recorded in income from mortgage banking operations.
The Company enters into interest rate swap arrangements to manage the interest rate risk exposure associated with specific commercial loan relationships at the time such loans are originated. These interest rate swaps, as well as the embedded derivatives associated with certain of the Company’s commercial loan relationships, are designated as free-standing derivative instruments by management. As such, the fair market value of these interest rate swaps and embedded derivatives are included in the Company’s other assets or other liabilities, as the case may be, and periodic changes in fair value are recorded in other non-interest income.
The Company also enters into interest rate swap arrangements to manage the interest rate risk exposure associated with certain forecasted borrowings from the FHLB of Chicago. These interest rate swaps are designated as forecasted transaction cash flow hedges by management. The effective portion of the change in the fair value of these derivatives is recorded in other comprehensive income and the ineffective portion is recorded in interest expense.
To qualify for and maintain hedge accounting, the Company must meet formal documentation and effectiveness evaluation requirements both at the hedge’s inception and on an ongoing basis. The application of the hedge accounting policy requires adherence to documentation and effectiveness testing requirements, judgment in the assessment of hedge effectiveness, and measurement of changes in the fair value of hedged items. The Company reviews the effectiveness of derivatives that is has designated as hedges on a quarterly basis. If it is determined that a derivative is not highly effective as a hedge or that it has ceased to be a highly effective hedge, the Company discontinues hedge accounting prospectively. When hedge accounting is discontinued on a cash flow hedge because it is determined that the derivative no longer qualifies as an effective hedge, the Company records the changes in the fair value of the derivative in earnings rather than through other comprehensive income and when the cash flows associated with the hedged item are realized, the gain or loss is reclassified out of accumulated other comprehensive income and is included in the same income statement account of the item being hedged. The Company measures the effectiveness of its hedges, where applicable, at inception and each quarter on an ongoing basis.
The Company’s use of interest rate swaps to manage risk exposes it to the additional risk that a counterparty could default on the contract. In instances where the counterparty is a commercial borrower, the Company considers the potential value and impact of the interest rate swap contract in the underwriting decision process. The Company also insures the borrower is qualified to participate in the interest rate swap in accordance with applicable federal regulations. In all other instances, the Company’s counterparties to its interest rate swaps are profitable, well-capitalized commercial banks or government-sponsored entities with significant experience with such derivative instruments. In these cases the Company manages its exposure to counterparty risk by requiring specific minimum credit standards for its counterparties.
Foreclosed Properties and Repossessed Assets Foreclosed properties acquired through, or in lieu of, loan foreclosure are recorded at the lower of cost or fair value less estimated costs to sell. Costs related to the development and improvement of property are capitalized provided such costs do not result in a carrying value in excess of the property’s fair value less estimated costs to sell, in which case such costs are expensed. Costs related to holding the property are expensed. Gains and losses on sales are recognized based on the carrying value upon closing of the sale.
| 65 |
Bank Mutual Corporation and Subsidiaries
Notes to Consolidated Financial Statements
December 31, 2015
(Dollars in thousands, except share and per share amounts)
1. Summary of Significant Accounting Policies (continued)
Premises and Equipment Land, buildings, leasehold improvements and equipment are carried at amortized cost. Buildings and equipment are depreciated over their estimated useful lives (office buildings 30 to 45 years and furniture and equipment 3 to 10 years) using the straight-line method. Leasehold improvements are amortized over the shorter of their useful lives or expected lease terms. The Company reviews buildings, leasehold improvements and equipment for impairment whenever events or changes in circumstances indicate that the carrying amount of an asset may not be recoverable. Impairment exists when the estimated undiscounted cash flows for the property are less than its carrying value. If identified, an impairment loss is recognized through a charge to earnings based on the fair value of the property.
Life Insurance Policies Investments in life insurance policies owned by the Company are carried at the amount that could be realized under the insurance contract if the Company cashed them in on the respective dates.
Income Taxes The Company files consolidated federal and combined state income tax returns. A deferred tax asset or liability is determined based on the enacted tax rates that will be in effect when the differences between the financial statement carrying amounts and tax basis of existing assets and liabilities are expected to be reported in the Company’s income tax returns. The effect on deferred taxes of a change in tax rates is recognized in income in the period that includes the enactment date of the change. A valuation allowance is provided for any deferred tax asset for which it is more likely than not that the asset will not be realized. Changes in valuation allowances are recorded as a component of income taxes.
Earnings Per Share Basic and diluted earnings per share (“EPS”) are computed by dividing net income by the weighted-average number of common shares outstanding for the period. Vested shares of restricted stock which have been awarded under provisions of the Company's 2004 and 2014 Stock Incentive Plans are also considered outstanding for basic EPS. Non-vested restricted stock and stock option shares are considered dilutive potential common shares and are included in the weighted-average number of shares outstanding for diluted EPS.
Pension Costs The Company has a qualifying defined benefit plan and a supplemental defined benefit plan. As appropriate, the net periodic pension cost of these plans consists of the expected cost of benefits earned by employees during the current period and an interest cost on the projected benefit obligation, reduced by the expected earnings on assets held by the plans, amortization of prior service cost, and amortization of recognized actuarial gains and losses over the estimated future service period of existing plan participants. In 2013 the Company froze the benefits of participants in the qualified defined benefit pension plan that had less than 20 years of service. This change also resulted in the future benefits under the Company’s supplemental defined benefit pension plan being effectively frozen. In 2015 the Company froze the benefits of all remaining employees in the qualified defined benefit pension plan.
The Company also has a defined contribution plan. The costs associated with the defined contribution plan consist of a predetermined percentage of individual participant compensation, as well as the cost of discretionary contributions determined by the Company’s board of directors.
Segment Information The Company has determined that it has one reportable segment—community banking. The Company offers a range of financial products and services to external customers, including: accepting deposits from the general public, originating secured and unsecured loans to commercial and retail borrowers, and marketing annuities and other insurance products.
| 66 |
Bank Mutual Corporation and Subsidiaries
Notes to Consolidated Financial Statements
December 31, 2015
(Dollars in thousands, except share and per share amounts)
1. Summary of Significant Accounting Policies (continued)
Recent Accounting Changes In 2013 the Financial Accounting Standards Board (“FASB”) issued new accounting guidance relating to the recognition, measurement, and disclosure of obligations resulting from joint and severalliability arrangements for which the total amount of the obligation is fixed at the reporting date. The guidance was effective for fiscal years beginning after December 15, 2013, which was the first quarter of 2014 for the Company. Adoption of this item did not have a material impact on the Company’s results of operations or financial condition.
In 2013 the FASB issued new accounting guidance on the financial statement presentation of an unrecognized tax benefit when a net operating loss carry forward, a similar tax loss, or a tax credit carry forward exists. The guidance was effective for fiscal years and interim periods beginning after December 15, 2013, which was the first quarter of 2014 for the Company. Adoption of this item did not have a material impact on the Company’s results of operations or financial condition.
In 2014 the FASB issued new accounting guidance related to troubled debt restructurings by creditors to clarify when an in-substance repossession or foreclosure occurs as satisfaction of a consumer mortgage loan. Although the new guidance was effective for fiscal years beginning after December 15, 2014, which was the first quarter of 2015 for the Company, early adoption of the new guidance was permitted. Accordingly, the Company adopted the new guidance in the first quarter of 2014 using a prospective transition method. Adoption of this new guidance did not have a material impact on the Company’s results of operations or financial condition. However, it did affect how certain matters are disclosed in the financial statements.
In 2014 the FASB issued new accounting guidance related to the classification and measurement of certain government-guaranteed mortgages upon foreclosure. The guidance was effective for fiscal years and interim periods beginning after December 15, 2014, which was the first quarter of 2015 for the Company. The Company’s adoption of this new guidance did not have a material impact on its results of operations or financial condition.
In 2014 the FASB issued new accounting guidance related to the recognition of revenue from contracts with customers. In 2015 the FASB deferred the effective date one year from the date in the original guidance. The guidance is effective for fiscal years and interim periods beginning after December 15, 2018, which will be the first quarter of 2019 for the Company. The Company’s adoption of this item is not expected to have a material impact on its results of operations or financial condition.
In 2015 the FASB issued new accounting guidance related to the consolidation of legal entities for financial reporting purposes. For public companies the guidance is effective for periods beginning after December 15, 2015, which will be the first quarter of 2016 for the Company. The Company’s adoption of this new guidance is not expected to have a material impact on its results of operations or financial condition.
In 2016 the FASB issued new accounting guidance related to certain aspects of the recognition and measurement of financial assets and liabilities. For public companies the guidance is effective for periods beginning after December 15, 2017, which will be the first quarter of 2018 for the Company. Early application of some aspects of the new guidance is also permitted, although the Company does not intend to adopt the guidance early. The Company’s eventual adoption of this new guidance is not expected to have a material impact on its results of operations or financial condition.
Reclassifications Certain components of non-interest income in 2014 and 2013 were reclassified to conform to the 2015 presentation format. For the years ended December 31, 2014 and 2013, $1,624 and $976, respectively, that were originally reported as a component of “other non-interest income” were reclassified to “loan related fees” to conform to the presentation format in 2015.
| 67 |
Bank Mutual Corporation and Subsidiaries
Notes to Consolidated Financial Statements
December 31, 2015
(Dollars in thousands, except share and per share amounts)
2. Mortgage-Related Securities Available-for-Sale and Held-to-Maturity
The amortized cost and fair value of mortgage-related securities available-for-sale and held-to-maturity are as follows:
| December 31, 2015 | ||||||||||||||||
| Gross | Gross | Estimated | ||||||||||||||
| Amortized | Unrealized | Unrealized | Fair | |||||||||||||
| Cost | Gains | Losses | Value | |||||||||||||
| Securities available-for-sale: | ||||||||||||||||
| Federal Home Loan Mortgage Corporation | $ | 215,255 | $ | 1,823 | $ | (800 | ) | $ | 216,278 | |||||||
| Federal National Mortgage Association | 169,792 | 853 | (874 | ) | 169,771 | |||||||||||
| Government National Mortgage Association | 21 | 3 | – | 24 | ||||||||||||
| Private-label CMOs | 21,600 | 446 | (245 | ) | 21,801 | |||||||||||
| Total available-for-sale | $ | 406,668 | $ | 3,125 | $ | (1,919 | ) | $ | 407,874 | |||||||
| Securities held-to-maturity: | ||||||||||||||||
| Federal National Mortgage Association | $ | 120,891 | $ | 750 | – | $ | 121,641 | |||||||||
| Total held-to-maturity | $ | 120,891 | $ | 750 | – | $ | 121,641 | |||||||||
| December 31, 2014 | ||||||||||||||||
| Gross | Gross | Estimated | ||||||||||||||
| Amortized | Unrealized | Unrealized | Fair | |||||||||||||
| Cost | Gains | Losses | Value | |||||||||||||
| Securities available-for-sale: | ||||||||||||||||
| Federal Home Loan Mortgage Corporation | $ | 165,632 | $ | 3,590 | $ | (54 | ) | $ | 169,168 | |||||||
| Federal National Mortgage Association | 121,501 | 1,862 | (154 | ) | 123,209 | |||||||||||
| Government National Mortgage Association | 25 | 4 | – | 29 | ||||||||||||
| Private-label CMOs | 28,998 | 707 | (228 | ) | 29,477 | |||||||||||
| Total available-for-sale | $ | 316,156 | $ | 6,163 | $ | (436 | ) | $ | 321,883 | |||||||
| Securities held-to-maturity: | ||||||||||||||||
| Federal National Mortgage Association | $ | 132,525 | $ | 1,592 | – | $ | 134,117 | |||||||||
| Total held-to-maturity | $ | 132,525 | $ | 1,592 | – | $ | 134,117 | |||||||||
| 68 |
Bank Mutual Corporation and Subsidiaries
Notes to Consolidated Financial Statements
December 31, 2015
(Dollars in thousands, except share and per share amounts)
2. Mortgage-Related Securities Available-for-Sale and Held-to-Maturity (continued)
The following tables identify mortgage-related securities by amount of time the securities have had a gross unrealized loss as of the dates indicated:
| December 31, 2015 | ||||||||||||||||||||||||||||||||
| Less Than 12 Months | Greater Than 12 Months | |||||||||||||||||||||||||||||||
| in an Unrealized Loss Position | in an Unrealized Loss Position | Gross | Total | |||||||||||||||||||||||||||||
| Unrealized
Loss Amount | Number
of Securities | Estimated
Fair Value | Unrealized
Loss Amount | Number
of Securities | Estimated
Fair Value | Unrealized
Loss Amount | Estimated
Fair Value | |||||||||||||||||||||||||
| Securities available-for-sale: | ||||||||||||||||||||||||||||||||
| Federal Home Loan Mortgage Corporation | $ | 777 | 17 | $ | 107,807 | $ | 23 | 3 | $ | 7,937 | $ | 800 | $ | 115,744 | ||||||||||||||||||
| Federal National Mortgage Association | 634 | 16 | 79,273 | 240 | 4 | 10,679 | 874 | 89,952 | ||||||||||||||||||||||||
| Private-label CMOs | 1 | 1 | 1,357 | 244 | 10 | 10,574 | 245 | 11,931 | ||||||||||||||||||||||||
| Total available-for-sale | $ | 1,412 | 34 | $ | 188,437 | $ | 507 | 17 | $ | 29,190 | $ | 1,919 | $ | 217,627 | ||||||||||||||||||
| December 31, 2014 | ||||||||||||||||||||||||||||||||
| Less Than 12 Months | Greater Than 12 Months | |||||||||||||||||||||||||||||||
| in an Unrealized Loss Position | in an Unrealized Loss Position | Gross | Total | |||||||||||||||||||||||||||||
| Unrealized
Loss Amount | Number
of Securities | Estimated
Fair Value | Unrealized
Loss Amount | Number
of Securities | Estimated
Fair Value | Unrealized
Loss Amount | Estimated
Fair Value | |||||||||||||||||||||||||
| Securities available-for-sale: | ||||||||||||||||||||||||||||||||
| Federal Home Loan Mortgage Corporation | $ | 9 | 2 | $ | 5,831 | $ | 45 | 1 | $ | 5,180 | $ | 54 | $ | 11,011 | ||||||||||||||||||
| Federal National Mortgage Association | – | – | – | 154 | 3 | 13,556 | 154 | 13,556 | ||||||||||||||||||||||||
| Private-label CMOs | 12 | 1 | 1,363 | 216 | 9 | 11,821 | 228 | 13,184 | ||||||||||||||||||||||||
| Total available-for-sale | $ | 21 | 3 | $ | 7,194 | $ | 415 | 13 | $ | 30,557 | $ | 436 | $ | 37,751 | ||||||||||||||||||
None of the Company’s mortgage-related securities held-to-maturity at December 31, 2015 or 2014, had an unrealized loss.
The Company determined that the unrealized losses on its mortgage-related securities were temporary as of December 31, 2015 and 2014. The Company does not intend to sell these securities and it is unlikely that it will be required to sell these securities before the recovery of their amortized cost. The Company believes it is probable that it will receive all future contractual cash flows related to these securities. This determination was based on management’s judgment regarding the nature of the loan collateral that supports the securities, a review of the current ratings issued on the securities by various credit rating agencies, recent trends in the fair market values of the securities and, in the case of private-label CMOs, a review of the actual delinquency and/or default performance of the loan collateral that supports the securities.
As of December 31, 2015 and 2014, the Company had private-label CMOs with a fair value of $15,725 and $23,254 respectively, and unrealized gains of $237 and $480, respectively that were rated less than investment grade. These private-label CMOs were analyzed using modeling techniques that considered the priority of cash flows in the CMO structure and various default and loss rate scenarios that management considered appropriate given the nature of the loan collateral.
| 69 |
Bank Mutual Corporation and Subsidiaries
Notes to Consolidated Financial Statements
December 31, 2015
(Dollars in thousands, except share and per share amounts)
2. Mortgage-Related Securities Available-for-Sale and Held-to-Maturity (continued)
The following table contains a summary of OTTI related to credit losses that have been recognized in earnings as of the December 31 for the years indicated, as well as the end of period values for securities that have experienced such losses:
| Year Ended December 31 | ||||||||||||
| 2015 | 2014 | 2013 | ||||||||||
| Beginning balance of unrealized OTTI related to credit losses | $ | 789 | $ | 789 | $ | 789 | ||||||
| Reductions for actual losses realized | (80 | ) | – | – | ||||||||
| Reductions for increase in cash flows expected to be received | (117 | ) | – | – | ||||||||
| Ending balance of unrealized OTTI related to credit losses | $ | 592 | $ | 789 | $ | 789 | ||||||
| Adjusted cost at end of period | $ | 4,260 | $ | 5,504 | $ | 7,152 | ||||||
| Estimated fair value at end of period | $ | 4,664 | $ | 6,065 | $ | 7,649 | ||||||
Results of operations included gross realized gains on the sale of securities available-for-sale of $102 in 2014. There were no gross realized losses on the sale of such securities in that year. In addition, there were no gross realized gains or losses on the sale of securities available-for-sale in 2015 or 2013.
Mortgage-related securities with a fair value of approximately $67,923 and $79,753 at December 31, 2015 and 2014, respectively, were pledged to secure deposits, FHLB advances, or for other purposes as permitted or required by law.
| 70 |
Bank Mutual Corporation and Subsidiaries
Notes to Consolidated Financial Statements
December 31, 2015
(Dollars in thousands, except share and per share amounts)
3. Loans Receivable
| December 31 | ||||||||
| 2015 | 2014 | |||||||
| Loans receivable is summarized as follows: | ||||||||
| Commercial loans: | ||||||||
| Commercial and industrial | $ | 235,313 | $ | 226,537 | ||||
| Commercial real estate | 299,550 | 263,512 | ||||||
| Multi-family real estate | 409,674 | 322,413 | ||||||
| Construction and development loans: | ||||||||
| Commercial real estate | 28,156 | 42,405 | ||||||
| Multi-family real estate | 291,380 | 211,239 | ||||||
| Land and land development | 11,143 | 5,069 | ||||||
| Total construction and development | 330,679 | 258,713 | ||||||
| Total commercial loans | 1,275,216 | 1,071,175 | ||||||
| Retail loans: | ||||||||
| One- to four-family first mortgages: | ||||||||
| Permanent | 461,797 | 480,102 | ||||||
| Construction | 42,357 | 23,905 | ||||||
| Total one- to four-family first mortgages | 504,154 | 504,007 | ||||||
| Home equity loans: | ||||||||
| Fixed term home equity | 122,985 | 139,046 | ||||||
| Home equity lines of credit | 75,261 | 80,692 | ||||||
| Total home equity loans | 198,246 | 219,738 | ||||||
| Other consumer loans: | ||||||||
| Student | 8,129 | 9,692 | ||||||
| Other | 11,678 | 12,681 | ||||||
| Total other consumer loans | 19,807 | 22,373 | ||||||
| Total retail loans | 722,207 | 746,118 | ||||||
| Gross loans receivable | 1,997,423 | 1,817,293 | ||||||
| Undisbursed loan proceeds | (238,124 | ) | (162,471 | ) | ||||
| Allowance for loan losses | (17,641 | ) | (22,289 | ) | ||||
| Deferred fees and costs, net | (1,640 | ) | (1,230 | ) | ||||
| Total loans receivable, net | $ | 1,740,018 | $ | 1,631,303 | ||||
The Company’s commercial and retail borrowers are located primarily in Wisconsin, Illinois, Michigan, Minnesota, and Iowa, as is the real estate and non-real estate collateral that secures the Company’s loans.
At December 31, 2015 and 2014, certain one- to four-family mortgage loans and home equity loans, as well as certain multi-family mortgage loans, with aggregate carrying values of approximately $496,000 and $342,000, respectively, were pledged to secure FHLB advances.
The unpaid principal balance of loans serviced for third-party investors was $1,038,588 and $1,087,107 at December 31, 2015 and 2014, respectively. These loans are not reflected in the consolidated financial statements.
| 71 |
Bank Mutual Corporation and Subsidiaries
Notes to Consolidated Financial Statements
December 31, 2015
(Dollars in thousands, except share and per share amounts)
3. Loans Receivable (continued)
The following tables summarize the allowance for loan losses by loan portfolio segment during the periods indicated. The tables also summarize the allowance for loan loss and loans receivable as of the dates indicated by the nature of the impairment evaluation, either individually or collectively (the loans receivable amounts in the table are net of undisbursed loan proceeds).
| December 31, 2015 | ||||||||||||||||||||||||||||
| Commercial
and Industrial | Commercial
Real Estate | Multi- Family Real Estate | Construction
and Development | One-
to Four- Family | Home
Equity and Other Consumer | Total | ||||||||||||||||||||||
| Allowance for loan losses: | ||||||||||||||||||||||||||||
| Beginning balance | $ | 2,349 | $ | 6,880 | $ | 6,078 | $ | 2,801 | $ | 3,004 | $ | 1,177 | $ | 22,289 | ||||||||||||||
| Provision | 1,376 | (2,055 | ) | (2,741 | ) | 34 | (896 | ) | 617 | (3,665 | ) | |||||||||||||||||
| Charge-offs | (74 | ) | (149 | ) | – | – | (346 | ) | (691 | ) | (1,260 | ) | ||||||||||||||||
| Recoveries | 7 | 120 | – | – | 73 | 77 | 277 | |||||||||||||||||||||
| Ending balance | $ | 3,658 | $ | 4,796 | $ | 3,337 | $ | 2,835 | $ | 1,835 | $ | 1,180 | $ | 17,641 | ||||||||||||||
| Loss allowance individually evaluated for impairment | $ | 535 | – | – | – | – | – | $ | 535 | |||||||||||||||||||
| Loss allowance collectively evaluated for impairment | $ | 3,123 | $ | 4,796 | $ | 3,337 | $ | 2,835 | $ | 1,835 | $ | 1,180 | $ | 17,106 | ||||||||||||||
| Loan receivable balances at December 31, 2014: | ||||||||||||||||||||||||||||
| Loans individually evaluated for impairment | $ | 12,237 | $ | 10,334 | $ | 8,239 | $ | 2,114 | $ | 3,410 | $ | 785 | $ | 37,119 | ||||||||||||||
| Loans collectively evaluated for impairment | 223,076 | 289,216 | 401,435 | 117,043 | 474,142 | 217,268 | 1,722,180 | |||||||||||||||||||||
| Total loans receivable | $ | 235,313 | $ | 299,550 | $ | 409,674 | $ | 119,157 | $ | 477,552 | $ | 218,053 | $ | 1,759,299 | ||||||||||||||
| December 31, 2014 | ||||||||||||||||||||||||||||
| Commercial
and Industrial | Commercial
Real Estate | Multi- Family Real Estate | Construction
and Development | One-
to Four- Family | Home
Equity and Other Consumer | Total | ||||||||||||||||||||||
| Allowance for loan losses: | ||||||||||||||||||||||||||||
| Beginning balance | $ | 2,603 | $ | 6,377 | $ | 5,931 | $ | 4,160 | $ | 3,220 | $ | 1,274 | $ | 23,565 | ||||||||||||||
| Provision | (259 | ) | 895 | 373 | (1,467 | ) | 311 | 380 | 233 | |||||||||||||||||||
| Charge-offs | (59 | ) | (561 | ) | (241 | ) | (34 | ) | (871 | ) | (534 | ) | (2,300 | ) | ||||||||||||||
| Recoveries | 64 | 169 | 15 | 142 | 344 | 57 | 791 | |||||||||||||||||||||
| Ending balance | $ | 2,349 | $ | 6,880 | $ | 6,078 | $ | 2,801 | $ | 3,004 | $ | 1,177 | $ | 22,289 | ||||||||||||||
| Loss allowance individually evaluated for impairment | – | $ | 262 | $ | 642 | – | – | – | $ | 904 | ||||||||||||||||||
| Loss allowance collectively evaluated for impairment | $ | 2,349 | $ | 6,618 | $ | 5,436 | $ | 2,801 | $ | 3,004 | $ | 1,177 | $ | 21,385 | ||||||||||||||
| Loan receivable balances at December 31, 2013: | ||||||||||||||||||||||||||||
| Loans individually evaluated for impairment | $ | 12,343 | $ | 14,822 | $ | 10,654 | $ | 2,166 | $ | 4,839 | $ | 601 | $ | 45,425 | ||||||||||||||
| Loans collectively evaluated for impairment | 214,194 | 248,690 | 311,759 | 110,453 | 482,791 | 241,510 | 1,609,397 | |||||||||||||||||||||
| Total loans receivable | $ | 226,537 | $ | 263,512 | $ | 322,413 | $ | 112,619 | $ | 487,630 | $ | 242,111 | $ | 1,654,822 | ||||||||||||||
| 72 |
Bank Mutual Corporation and Subsidiaries
Notes to Consolidated Financial Statements
December 31, 2015
(Dollars in thousands, except share and per share amounts)
3. Loans Receivable (continued)
| December 31, 2013 | ||||||||||||||||||||||||||||
| Commercial
and Industrial | Commercial
Real Estate | Multi- Family Real Estate | Construction
and Development | One-
to Four- Family | Home
Equity and Other Consumer | Total | ||||||||||||||||||||||
| Allowance for loan losses: | ||||||||||||||||||||||||||||
| Beginning balance | $ | 1,686 | $ | 7,354 | $ | 5,195 | $ | 2,617 | $ | 3,267 | $ | 1,458 | $ | 21,577 | ||||||||||||||
| Provision | 1,111 | (1,129 | ) | 1,170 | 1,582 | 666 | 1,106 | 4,506 | ||||||||||||||||||||
| Charge-offs | (199 | ) | (514 | ) | (536 | ) | (148 | ) | (1,205 | ) | (1,389 | ) | (3,991 | ) | ||||||||||||||
| Recoveries | 5 | 666 | 102 | 109 | 492 | 99 | 1,473 | |||||||||||||||||||||
| Ending balance | $ | 2,603 | $ | 6,377 | $ | 5,931 | $ | 4,160 | $ | 3,220 | $ | 1,274 | $ | 23,565 | ||||||||||||||
| Loss allowance individually evaluated for impairment | – | $ | 412 | $ | 588 | – | – | – | $ | 1,000 | ||||||||||||||||||
| Loss allowance collectively evaluated for impairment | $ | 2,603 | $ | 5,965 | $ | 5,343 | $ | 4,160 | $ | 3,220 | $ | 1,274 | $ | 22,565 | ||||||||||||||
| Loan receivable balances at December 31, 2012: | ||||||||||||||||||||||||||||
| Loans individually evaluated for impairment | $ | 436 | $ | 16,340 | $ | 8,021 | $ | 18,109 | $ | 5,377 | $ | 780 | $ | 49,063 | ||||||||||||||
| Loans collectively evaluated for impairment | 166,352 | 260,204 | 257,820 | 93,117 | 455,621 | 251,497 | 1,484,611 | |||||||||||||||||||||
| Total loans receivable | $ | 166,788 | $ | 276,544 | $ | 265,841 | $ | 111,226 | $ | 460,998 | $ | 252,277 | $ | 1,533,674 | ||||||||||||||
The Company adjusts certain factors used to determine the allowance for loan losses on loans that are collectively evaluated for impairment. Management considered these adjustments necessary and prudent in light of general uncertainties related to trends in real estate values, economic conditions, and unemployment. The Company estimates that these changes, as well as overall changes in the balance of loans to which the various factors were applied, resulted in a decrease of $4,279 in 2015, a decrease of $1,180 in 2014, and an increase of $3,029 in 2013, in the total allowance for loan losses.
| 73 |
Bank Mutual Corporation and Subsidiaries
Notes to Consolidated Financial Statements
December 31, 2015
(Dollars in thousands, except share and per share amounts)
3. Loans Receivable (continued)
The following tables present information regarding impaired loans that have a related allowance for loan loss and those that do not as of the dates indicated (the loans receivable amounts in the tables are net of undisbursed loan proceeds):
| December 31, 2015 | ||||||||||||||||||||
| Loans
Receivable Balance, Net | Unpaid Principal Balance | Related Allowance for Loss | Average
Loan Receivable Balance, Net | Interest Income Recognized | ||||||||||||||||
| Impaired loans with an allowance recorded: | ||||||||||||||||||||
| Commercial and industrial: | ||||||||||||||||||||
| Term loans | – | – | – | – | – | |||||||||||||||
| Lines of credit | $ | 2,783 | $ | 2,795 | $ | 535 | $ | 557 | $ | 142 | ||||||||||
| Total commercial and industrial | – | – | – | – | ||||||||||||||||
| Commercial real estate: | ||||||||||||||||||||
| Office | ||||||||||||||||||||
| Retail/wholesale/mixed | – | – | – | 1,538 | – | |||||||||||||||
| Industrial/warehouse | – | – | – | – | – | |||||||||||||||
| Other | – | – | – | – | – | |||||||||||||||
| Total commercial real estate | – | – | – | 1,538 | – | |||||||||||||||
| Multi-family real estate | – | – | – | 1,112 | – | |||||||||||||||
| Construction and development: | ||||||||||||||||||||
| Commercial real estate | – | – | – | – | – | |||||||||||||||
| Multi-family | – | – | – | – | – | |||||||||||||||
| Land and land development | – | – | – | – | – | |||||||||||||||
| Total construction and development | – | – | – | – | ||||||||||||||||
| One- to four-family | – | – | – | – | – | |||||||||||||||
| Home equity and other consumer: | ||||||||||||||||||||
| Home equity | – | – | – | – | – | |||||||||||||||
| Student | – | – | – | – | – | |||||||||||||||
| Other | – | – | – | – | – | |||||||||||||||
| Total home equity and other consumer | – | – | – | – | – | |||||||||||||||
| Total with an allowance recorded | $ | 2,783 | $ | 2,795 | $ | 535 | $ | 3,207 | $ | 142 | ||||||||||
| Impaired loans with no allowance recorded: | ||||||||||||||||||||
| Commercial and industrial: | ||||||||||||||||||||
| Term loans | $ | 116 | $ | 133 | – | $ | 129 | $ | 3 | |||||||||||
| Lines of credit | 2,016 | 2,032 | – | 422 | 117 | |||||||||||||||
| Total commercial and industrial | 2,132 | 2,165 | – | 551 | 120 | |||||||||||||||
| Commercial real estate: | ||||||||||||||||||||
| Office | 2,126 | 2,426 | – | 833 | 148 | |||||||||||||||
| Retail/wholesale/mixed | 1,637 | 2,348 | – | 1,672 | 79 | |||||||||||||||
| Industrial/warehouse | 194 | 265 | – | 204 | 18 | |||||||||||||||
| Other | 11 | 155 | – | 22 | 14 | |||||||||||||||
| Total commercial real estate | 3,968 | 5,194 | – | 2,731 | 259 | |||||||||||||||
| Multi-family real estate | – | – | – | – | ||||||||||||||||
| Construction and development: | ||||||||||||||||||||
| Commercial real estate | 597 | 597 | – | 597 | – | |||||||||||||||
| Multi-family real estate | – | – | – | – | – | |||||||||||||||
| Land and land development | 169 | 220 | – | 187 | 17 | |||||||||||||||
| Total construction and development | 766 | 817 | 784 | 17 | ||||||||||||||||
| One- to four-family | 2,703 | 3,168 | – | 3,744 | 70 | |||||||||||||||
| Home equity and other consumer: | ||||||||||||||||||||
| Home equity | 703 | 805 | – | 509 | 21 | |||||||||||||||
| Student | – | – | – | – | – | |||||||||||||||
| Other | 82 | 184 | – | 87 | 1 | |||||||||||||||
| Total home equity and other consumer | 785 | 989 | – | 596 | 22 | |||||||||||||||
| Total with no allowance recorded | $ | 10,354 | $ | 12,333 | – | $ | 8,406 | $ | 488 | |||||||||||
| 74 |
Bank Mutual Corporation and Subsidiaries
Notes to Consolidated Financial Statements
December 31, 2015
(Dollars in thousands, except share and per share amounts)
3. Loans Receivable (continued)
| December 31, 2014 | ||||||||||||||||||||
| Loans
Receivable Balance, Net | Unpaid Principal Balance | Related Allowance for Loss | Average
Loan Receivable Balance, Net | Interest Income Recognized | ||||||||||||||||
| Impaired loans with an allowance recorded: | ||||||||||||||||||||
| Commercial and industrial: | ||||||||||||||||||||
| Term loans | – | – | – | $ | 6 | – | ||||||||||||||
| Lines of credit | – | – | – | – | – | |||||||||||||||
| Total commercial and industrial | – | – | – | 6 | – | |||||||||||||||
| Commercial real estate: | ||||||||||||||||||||
| Office | $ | 1,922 | $ | 1,938 | $ | 262 | 384 | $ | 125 | |||||||||||
| Retail/wholesale/mixed | – | – | – | 375 | – | |||||||||||||||
| Industrial/warehouse | – | – | – | 473 | – | |||||||||||||||
| Other | – | – | – | – | – | |||||||||||||||
| Total commercial real estate | 1,922 | 1,938 | 262 | 1,232 | 125 | |||||||||||||||
| Multi-family real estate | 1,402 | 1,402 | 642 | 1,423 | 42 | |||||||||||||||
| Construction and development: | ||||||||||||||||||||
| Commercial real estate | – | – | – | – | – | |||||||||||||||
| Multi-family real estate | – | – | – | – | – | |||||||||||||||
| Land and land development | – | – | – | – | – | |||||||||||||||
| Total construction and development | – | – | – | – | ||||||||||||||||
| One- to four-family | – | – | – | – | – | |||||||||||||||
| Home equity and other consumer: | ||||||||||||||||||||
| Home equity | – | – | – | – | – | |||||||||||||||
| Student | – | – | – | – | – | |||||||||||||||
| Other | – | – | – | – | – | |||||||||||||||
| Total home equity and other consumer | – | – | – | – | – | |||||||||||||||
| Total with an allowance recorded | $ | 3,324 | $ | 3,340 | $ | 904 | $ | 2,661 | $ | 167 | ||||||||||
| Impaired loans with no allowance recorded: | ||||||||||||||||||||
| Commercial and industrial: | ||||||||||||||||||||
| Term loans | $ | 201 | $ | 345 | – | $ | 207 | $ | 14 | |||||||||||
| Lines of credit | – | – | – | 14 | – | |||||||||||||||
| Total commercial and industrial | 201 | 345 | – | 221 | 14 | |||||||||||||||
| Commercial real estate: | ||||||||||||||||||||
| Office | 609 | 774 | – | 690 | 45 | |||||||||||||||
| Retail/wholesale/mixed | 1,537 | 1,943 | – | 1,425 | 100 | |||||||||||||||
| Industrial/warehouse | 212 | 265 | – | 172 | 16 | |||||||||||||||
| Other | 29 | 159 | – | 53 | 14 | |||||||||||||||
| Total commercial real estate | 2,387 | 3,141 | – | 2,340 | 175 | |||||||||||||||
| Multi-family real estate | – | – | – | 136 | – | |||||||||||||||
| Construction and development: | ||||||||||||||||||||
| Commercial real estate | 597 | 597 | – | 597 | – | |||||||||||||||
| Multi-family real estate | – | – | – | – | – | |||||||||||||||
| Land and land development | 206 | 240 | – | 86 | 15 | |||||||||||||||
| Total construction and development | 803 | 837 | – | 683 | 15 | |||||||||||||||
| One- to four-family | 4,148 | 4,750 | – | 4,005 | 99 | |||||||||||||||
| Home equity and other consumer: | ||||||||||||||||||||
| Home equity | 493 | 694 | – | 530 | 13 | |||||||||||||||
| Student | – | – | – | – | – | |||||||||||||||
| Other | 108 | 110 | – | 81 | – | |||||||||||||||
| Total home equity and other consumer | 601 | 804 | – | 611 | 13 | |||||||||||||||
| Total with no allowance recorded | $ | 8,140 | $ | 9,877 | – | $ | 7,996 | $ | 316 | |||||||||||
| 75 |
Bank Mutual Corporation and Subsidiaries
Notes to Consolidated Financial Statements
December 31, 2015
(Dollars in thousands, except share and per share amounts)
3. Loans Receivable (continued)
The following tables present information relating to the Company’s internal risk ratings of its loans receivable as of the dates indicated (all amounts in the tables are net of undisbursed loan proceeds):
| December 31, 2015 | ||||||||||||||||||||
| Pass | Watch | Special
Mention | Substandard | Total | ||||||||||||||||
| Commercial and industrial: | ||||||||||||||||||||
| Term loans | $ | 53,785 | $ | 5,536 | $ | 252 | $ | 2,605 | $ | 62,178 | ||||||||||
| Lines of credit | 145,118 | 17,086 | 1,299 | 9,632 | 173,135 | |||||||||||||||
| Total commercial and industrial | 198,903 | 22,622 | 1,551 | 12,237 | 235,313 | |||||||||||||||
| Commercial real estate: | ||||||||||||||||||||
| Office | 69,223 | 5,567 | 15,063 | 2,126 | 91,979 | |||||||||||||||
| Retail/wholesale/mixed use | 103,634 | 28,091 | 14,510 | 6,599 | 152,834 | |||||||||||||||
| Industrial/warehouse | 46,545 | 1,326 | 588 | 1,598 | 50,057 | |||||||||||||||
| Other | 4,669 | – | – | 11 | 4,680 | |||||||||||||||
| Total commercial real estate | 224,071 | 34,984 | 30,161 | 10,334 | 299,550 | |||||||||||||||
| Multi-family real estate | 394,097 | 7,338 | – | 8,239 | 409,674 | |||||||||||||||
| Construction and development: | ||||||||||||||||||||
| Commercial real estate | 13,928 | – | – | 597 | 14,525 | |||||||||||||||
| Multi-family real estate | 93,635 | – | – | – | 93,635 | |||||||||||||||
| Land and land development | 9,411 | 69 | – | 1,517 | 10,997 | |||||||||||||||
| Total construction/development | 116,974 | 69 | – | 2,114 | 119,157 | |||||||||||||||
| One- to four-family | 471,412 | 2,059 | 671 | 3,410 | 477,552 | |||||||||||||||
| Home equity and other consumer: | ||||||||||||||||||||
| Home equity | 197,543 | – | – | 703 | 198,246 | |||||||||||||||
| Student | 8,129 | – | – | – | 8,129 | |||||||||||||||
| Other | 11,596 | – | – | 82 | 11,678 | |||||||||||||||
| Total home equity and other consumer | 217,268 | – | – | 785 | 218,053 | |||||||||||||||
| Total | $ | 1,622,725 | $ | 67,072 | $ | 32,383 | $ | 37,119 | $ | 1,759,299 | ||||||||||
| 76 |
Bank Mutual Corporation and Subsidiaries
Notes to Consolidated Financial Statements
December 31, 2015
(Dollars in thousands, except share and per share amounts)
3. Loans Receivable (continued)
| December 31, 2014 | ||||||||||||||||||||
| Pass | Watch | Special
Mention | Substandard | Total | ||||||||||||||||
| Commercial and industrial: | ||||||||||||||||||||
| Term loans | $ | 60,393 | $ | 1,943 | $ | 716 | $ | 939 | $ | 63,991 | ||||||||||
| Lines of credit | 132,921 | 14,385 | 3,836 | 11,404 | 162,546 | |||||||||||||||
| Total commercial and industrial | 193,314 | 16,328 | 4,552 | 12,343 | 226,537 | |||||||||||||||
| Commercial real estate: | ||||||||||||||||||||
| Office | 55,306 | 9,033 | 15,351 | 4,950 | 84,640 | |||||||||||||||
| Retail/wholesale/mixed use | 99,775 | 8,938 | 21,950 | 6,714 | 137,377 | |||||||||||||||
| Industrial/warehouse | 31,819 | 1,413 | 17 | 3,129 | 36,378 | |||||||||||||||
| Other | 5,088 | – | – | 29 | 5,117 | |||||||||||||||
| Total commercial real estate | 191,988 | 19,384 | 37,318 | 14,822 | 263,512 | |||||||||||||||
| Multi-family real estate | 301,162 | 10,597 | – | 10,654 | 322,413 | |||||||||||||||
| Construction and development: | ||||||||||||||||||||
| Commercial real estate | 17,143 | – | – | 597 | 17,740 | |||||||||||||||
| Multi-family real estate | 89,811 | – | – | – | 89,811 | |||||||||||||||
| Land and land development | 3,412 | 87 | – | 1,569 | 5,068 | |||||||||||||||
| Total construction/development | 110,366 | 87 | – | 2,166 | 112,619 | |||||||||||||||
| One- to four-family | 480,521 | 678 | 1,592 | 4,839 | 487,630 | |||||||||||||||
| Home equity and other consumer: | ||||||||||||||||||||
| Home equity | 219,245 | – | – | 493 | 219,738 | |||||||||||||||
| Student | 9,692 | – | – | – | 9,692 | |||||||||||||||
| Other | 12,573 | – | – | 108 | 12,681 | |||||||||||||||
| Total home equity and other consumer | 241,510 | – | – | 601 | 242,111 | |||||||||||||||
| Total | $ | 1,518,861 | $ | 47,074 | $ | 43,462 | $ | 45,425 | $ | 1,654,822 | ||||||||||
Loans rated “pass” or “watch” are generally current on contractual loan and principal payments and comply with other contractual loan terms. Pass loans generally have no noticeable credit deficiencies or potential weaknesses. Loans rated watch, however, will typically exhibit early signs of credit deficiencies or potential weaknesses that deserve management’s close attention. Loans rated “special mention” do not currently expose the Company to a sufficient degree of risk to warrant a lower rating, but possess clear trends in credit deficiencies or potential weaknesses that deserve management’s close attention. The allowance for loan losses on loans rated pass, watch, or special mention is typically evaluated collectively for impairment using a homogenous pool approach. This approach utilizes quantitative factors developed by management from its assessment of historical loss experience, qualitative factors, and other considerations.
Loans rated “substandard” involve a distinct possibility that the Company could sustain some loss if deficiencies associated with the loan are not corrected. Loans rated “doubtful” indicate that full collection is highly questionable or improbable. The Company did not have any loans that were rated doubtful at December 31, 2015 and 2014. Loans rated substandard or doubtful that are also considered in management’s judgment to be impaired are generally analyzed individually to determine an appropriate allowance for loan loss. A loan rated “loss” is considered uncollectible, even if a partial recovery could be expected in the future. The Company generally charges off loans that are rated as a loss. As such, the Company did not have any loans that were rated loss at December 31, 2015 and 2014.
| 77 |
Bank Mutual Corporation and Subsidiaries
Notes to Consolidated Financial Statements
December 31, 2015
(Dollars in thousands, except share and per share amounts)
3. Loans Receivable (continued)
The following tables contain information relating to the past due and non-accrual status of the Company’s loans receivable as of the dates indicated (all amounts in the table are net of undisbursed loan proceeds):
| December 31, 2015 | ||||||||||||||||||||||||||||
| Past Due Status | Total | |||||||||||||||||||||||||||
| 30-59
Days | 60-89
Days | >
90 Days | Total
Past Due | Total
Current | Total
Loans | Non- Accrual | ||||||||||||||||||||||
| Commercial and industrial: | ||||||||||||||||||||||||||||
| Term loans | – | – | $ | 61 | $ | 61 | $ | 62,117 | $ | 62,178 | $ | 116 | ||||||||||||||||
| Lines of credit | $ | 8,901 | – | – | 8,901 | 164,234 | 173,135 | 4,799 | ||||||||||||||||||||
| Total commercial and industrial | 8,901 | – | 61 | 8,962 | 226,351 | 235,313 | 4,915 | |||||||||||||||||||||
| Commercial real estate: | ||||||||||||||||||||||||||||
| Office | – | – | – | – | 91,979 | 91,979 | 2,126 | |||||||||||||||||||||
| Retail/wholesale/mixed | 768 | $ | 2 | 684 | 1,454 | 151,380 | 152,834 | 1,637 | ||||||||||||||||||||
| Industrial/warehouse | – | – | – | – | 50,057 | 50,057 | 194 | |||||||||||||||||||||
| Other | – | – | – | – | 4,680 | 4,680 | 11 | |||||||||||||||||||||
| Total commercial real estate | 768 | 2 | 684 | 1,454 | 298,096 | 299,550 | 3,968 | |||||||||||||||||||||
| Multi-family real estate | 721 | – | – | 721 | 408,953 | 409,674 | – | |||||||||||||||||||||
| Construction and development: | ||||||||||||||||||||||||||||
| Commercial real estate | – | – | 597 | 597 | 13,928 | 14,525 | 597 | |||||||||||||||||||||
| Multi-family real estate | – | – | – | – | 93,635 | 93,635 | – | |||||||||||||||||||||
| Land and land development | – | – | – | – | 10,997 | 10,997 | 169 | |||||||||||||||||||||
| Total construction | – | – | 597 | 597 | 118,560 | 119,157 | 766 | |||||||||||||||||||||
| One- to four-family | 6,490 | 2,959 | 2,634 | 12,083 | 465,469 | 477,552 | 2,703 | |||||||||||||||||||||
| Home equity and other consumer: | ||||||||||||||||||||||||||||
| Home equity | 1,214 | 217 | 703 | 2,134 | 196,112 | 198,246 | 703 | |||||||||||||||||||||
| Student | 178 | 62 | 484 | 724 | 7,405 | 8,129 | – | |||||||||||||||||||||
| Other | 38 | 49 | 82 | 169 | 11,509 | 11,678 | 82 | |||||||||||||||||||||
| Total home equity and other consumer | 1,430 | 328 | 1,269 | 3,027 | 215,026 | 218,053 | 785 | |||||||||||||||||||||
| Total | $ | 18,310 | $ | 3,289 | $ | 5,245 | $ | 26,844 | $ | 1,732,455 | $ | 1,759,299 | $ | 13,137 | ||||||||||||||
| 78 |
Bank Mutual Corporation and Subsidiaries
Notes to Consolidated Financial Statements
December 31, 2015
(Dollars in thousands, except share and per share amounts)
3. Loans Receivable (continued)
| December 31, 2014 | ||||||||||||||||||||||||||||
| Past Due Status | Total | |||||||||||||||||||||||||||
| 30-59
Days | 60-89
Days | >
90 Days | Total
Past Due | Total
Current | Total
Loans | Non- Accrual | ||||||||||||||||||||||
| Commercial and industrial: | ||||||||||||||||||||||||||||
| Term loans | – | $ | 63 | $ | 83 | $ | 146 | $ | 63,845 | $ | 63,991 | $ | 167 | |||||||||||||||
| Lines of credit | $ | 36 | – | – | 36 | 162,510 | 162,546 | 34 | ||||||||||||||||||||
| Total commercial and industrial | 36 | 63 | 83 | 182 | 226,355 | 226,537 | 201 | |||||||||||||||||||||
| Commercial real estate: | ||||||||||||||||||||||||||||
| Office | – | 1,922 | 239 | 2,161 | 82,479 | 84,640 | 2,531 | |||||||||||||||||||||
| Retail/wholesale/mixed | 654 | 715 | 244 | 1,613 | 135,764 | 137,377 | 1,537 | |||||||||||||||||||||
| Industrial/warehouse | – | – | – | – | 36,378 | 36,378 | 212 | |||||||||||||||||||||
| Other | – | – | – | – | 5,117 | 5,117 | 29 | |||||||||||||||||||||
| Total commercial real estate | 654 | 2,637 | 483 | 3,774 | 259,738 | 263,512 | 4,309 | |||||||||||||||||||||
| Multi-family real estate | 558 | – | – | 558 | 321,855 | 322,413 | 1,402 | |||||||||||||||||||||
| Construction and development: | ||||||||||||||||||||||||||||
| Commercial real estate | – | – | 597 | 597 | 17,143 | 17,740 | 597 | |||||||||||||||||||||
| Multi-family real estate | – | – | – | – | 89,811 | 89,811 | – | |||||||||||||||||||||
| Land and land development | – | 16 | – | 16 | 5,052 | 5,068 | 206 | |||||||||||||||||||||
| Total construction | – | 16 | 597 | 613 | 112,006 | 112,619 | 803 | |||||||||||||||||||||
| One- to four-family | 7,853 | 2,687 | 3,988 | 14,528 | 473,102 | 487,630 | 4,148 | |||||||||||||||||||||
| Home equity and other consumer: | ||||||||||||||||||||||||||||
| Home equity | 919 | 257 | 493 | 1,669 | 218,069 | 219,738 | 493 | |||||||||||||||||||||
| Student | 167 | 145 | 540 | 852 | 8,840 | 9,692 | – | |||||||||||||||||||||
| Other | 100 | 40 | 108 | 248 | 12,433 | 12,681 | 108 | |||||||||||||||||||||
| Total home equity and other consumer | 1,186 | 442 | 1,141 | 2,769 | 239,342 | 242,111 | 601 | |||||||||||||||||||||
| Total | $ | 10,287 | $ | 5,845 | $ | 6,292 | $ | 22,424 | $ | 1,632,398 | $ | 1,654,822 | $ | 11,464 | ||||||||||||||
As of December 31, 2015 and 2014, $484 and $540 in student loans, respectively, were 90-days past due, but remained on accrual status. No other loans 90-days past due were in accrual status as of December 31, 2015 and 2014.
The Company classifies a loan modification as a troubled debt restructuring (“TDR”) when it has granted a borrower experiencing financial difficulties a concession that it would otherwise not consider. Loan modifications that result in insignificant delays in the receipt of payments (generally six months or less) are not considered TDRs under the Company’s TDR policy. TDRs are relatively insignificant and/or infrequent in the Company and generally consist of loans placed in interest-only status for a short period of time or payment forbearance for greater than six months. As of December 31, 2015 and 2014, TDRs were $8,704 and $4,872, respectively, and consisted primarily of commercial and industrial loans and one- to four-family mortgage loans. TDRs in accrual status as of those same dates were $2,558 and $3,315, respectively. Additions to TDRs during the twelve months ended December 31, 2015 was $5,256, consisting of $4,768 of commercial and industrial loans and $488 of one- to four-family residential loans. Additions to TDRs during the twelve months ended December 31, 2014 were immaterial. In addition, TDRs that experienced a payment default within one year of their restructuring were also immaterial during these twelve month periods. TDRs are evaluated for impairment and appropriate credit losses are recorded in accordance with the Company’s accounting policies and GAAP.
| 79 |
Bank Mutual Corporation and Subsidiaries
Notes to Consolidated Financial Statements
December 31, 2015
(Dollars in thousands, except share and per share amounts)
4. Mortgage Servicing Rights
The activity in mortgage servicing rights during the years ended December 31 is presented in the following table.
| 2015 | 2014 | 2013 | ||||||||||
| Mortgage servicing rights, net, at beginning of year | $ | 7,867 | $ | 8,737 | $ | 6,821 | ||||||
| Additions | 1,244 | 901 | 2,330 | |||||||||
| Amortization | (1,906 | ) | (1,772 | ) | (2,809 | ) | ||||||
| Decrease in valuation allowance during the year | – | 1 | 2,395 | |||||||||
| Mortgage servicing rights, net, at end of year | $ | 7,205 | $ | 7,867 | $ | 8,737 | ||||||
The following table shows the estimated future amortization expense for mortgage servicing rights for the years ended December 31:
| 2016 | $ | 1,066 | ||||
| 2017 | 926 | |||||
| 2018 | 801 | |||||
| 2019 | 692 | |||||
| 2020 | 595 | |||||
| Thereafter | 3,125 | |||||
| Total | $ | 7,205 |
The projection of amortization for mortgage servicing rights is based on existing asset balances and the interest rate environment as of December 31, 2015. Future amortization expense may be significantly different depending upon changes in the mortgage servicing portfolio, mortgage interest rates, loan prepayments, and market conditions.
5. Other Assets
Other assets are summarized as follow:
| December 31 | ||||||||
| 2015 | 2014 | |||||||
| Accrued interest: | ||||||||
| Loans receivable | $ | 4,894 | $ | 4,748 | ||||
| Mortgage-related securities | 1,141 | 1,027 | ||||||
| Total accrued interest | 6,035 | 5,775 | ||||||
| Foreclosed properties and repossessed assets: | ||||||||
| Commercial real estate | 1,685 | 2,566 | ||||||
| Land and land development | 747 | 1,693 | ||||||
| One-to four-family first mortgages | 874 | 409 | ||||||
| Total foreclosed properties and repossessed assets | 3,306 | 4,668 | ||||||
| Bank-owned life insurance | 61,656 | 59,830 | ||||||
| Premises and equipment, net | 49,218 | 52,594 | ||||||
| Federal Home Loan Bank stock, at cost | 17,591 | 14,209 | ||||||
| Deferred tax asset, net | 16,485 | 25,595 | ||||||
| Other assets | 24,037 | 22,183 | ||||||
| Total other assets | $ | 178,328 | $ | 184,854 | ||||
Residential one-to four-family mortgage loans that were in the process of foreclosure were $2,576 and $3,243 at December 31, 2015 and 2014, respectively.
| 80 |
Bank Mutual Corporation and Subsidiaries
Notes to Consolidated Financial Statements
December 31, 2015
(Dollars in thousands, except share and per share amounts)
5. Other Assets (continued)
| Premises and equipment are summarized as follows: | December 31 | |||||||
| 2015 | 2014 | |||||||
| Land and land improvements | $ | 16,500 | $ | 17,782 | ||||
| Office buildings | 54,168 | 57,864 | ||||||
| Furniture and equipment | 19,317 | 18,830 | ||||||
| Leasehold improvements | 1,145 | 1,191 | ||||||
| Total cost | 91,130 | 95,667 | ||||||
| Accumulated depreciation and amortization | (41,912 | ) | (43,073 | ) | ||||
| Total premises and equipment, net | $ | 49,218 | $ | 52,594 | ||||
The Company leases various branch offices, office facilities and equipment under non-cancelable operating leases which expire on various dates through 2032. Future minimum payments under non-cancelable operating leases with initial or remaining terms of one year or more for the years indicated are as follows at December 31, 2014:
| Amount | ||||
| 2016 | $ | 905 | ||
| 2017 | 598 | |||
| 2018 | 569 | |||
| 2019 | 578 | |||
| 2020 | 528 | |||
| Thereafter | 2,292 | |||
| Total | $ | 5,470 | ||
Rent expense was $996, $927, and $955, in 2015, 2014, and 2013, respectively.
6. Deposits Liabilities
Deposit liabilities are summarized as follows:
| December 31 | ||||||||
| 2015 | 2014 | |||||||
| Checking accounts: | ||||||||
| Non-interest-bearing | $ | 213,761 | $ | 187,852 | ||||
| Interest-bearing | 277,606 | 253,595 | ||||||
| Total checking accounts | 491,367 | 441,447 | ||||||
| Money market accounts | 542,020 | 532,705 | ||||||
| Savings accounts | 217,633 | 220,557 | ||||||
| Certificate of deposits: | ||||||||
| Due within one year | 282,584 | 383,814 | ||||||
| After one but within two years | 182,599 | 66,586 | ||||||
| After two but within three years | 61,806 | 48,328 | ||||||
| After three but within four years | 15,373 | 10,401 | ||||||
| After four but within five years | 2,209 | 14,918 | ||||||
| Total certificates of deposit | 544,571 | 524,047 | ||||||
| Total deposit liabilities | $ | 1,795,591 | $ | 1,718,756 | ||||
| 81 |
Bank Mutual Corporation and Subsidiaries
Notes to Consolidated Financial Statements
December 31, 2015
(Dollars in thousands, except share and per share amounts)
6. Deposits Liabilities (continued)
The aggregate amount of certificate accounts with balances of one hundred thousand dollars or more was $167,782 and $142,141 at December 31, 2015 and 2014, respectively.
Interest expense on deposits was as follows:
| Year Ended December 31 | ||||||||||||
| 2015 | 2014 | 2013 | ||||||||||
| Interest-bearing checking accounts | $ | 30 | $ | 30 | $ | 32 | ||||||
| Money market accounts | 702 | 735 | 694 | |||||||||
| Savings accounts | 46 | 55 | 62 | |||||||||
| Certificate of deposits | 3,993 | 3,864 | 7,537 | |||||||||
| Total interest expense on deposit liabilities | $ | 4,771 | $ | 4,684 | $ | 8,325 | ||||||
7. Borrowings
Borrowings consist of the following:
| December 31, 2015 | December 31, 2014 | |||||||||||||||
| Weighted- | Weighted- | |||||||||||||||
| Average | Average | |||||||||||||||
| Balance | Rate | Balance | Rate | |||||||||||||
| FHLB overnight advances | $ | 130,000 | 0.16 | % | $ | 42,800 | 0.13 | % | ||||||||
| FHLB term advances maturing in: | ||||||||||||||||
| 2015 | – | 18,450 | 0.79 | |||||||||||||
| 2016 | 75,950 | 0.63 | 48,450 | 0.82 | ||||||||||||
| 2017 | 56,183 | 1.20 | 32,765 | 1.50 | ||||||||||||
| 2018 | 34,607 | 2.18 | 37,293 | 2.16 | ||||||||||||
| 2019 | 19,127 | 2.98 | 19,307 | 3.00 | ||||||||||||
| 2020 | 26,853 | 3.62 | 27,248 | 3.64 | ||||||||||||
| 2021 and thereafter | 29,655 | 3.65 | 30,156 | 3.67 | ||||||||||||
| Total borrowings | $ | 372,375 | 1.27 | % | $ | 256,469 | 1.78 | % | ||||||||
All of the Company’s FHLB advances are subject to prepayment penalties if voluntarily repaid prior to their stated maturity.
As discussed in Note 13, “Financial Instruments with Off-Balance Sheet Risk and Derivative Financial Instruments,” the Company has entered into cash flow hedges using interest rate swaps to manage the interest rate risk exposure associated with certain forecasted borrowings from the FHLB of Chicago. Two advances maturing in January 2016 of $10,000 each have corresponding pay-fixed interest rate swaps that mature in 2018 and 2019, respectively. Although these advances have stated interest rates of 0.25%, they have effective interest rates including the impact of the interest rate swaps of 1.20% and 1.46%, respectively. However, these advances have been included in the table, above, at their contractual rates and maturities. If they had been included in the table at their hedge-adjusted rates and maturities, the advances reported as maturing in 2018 and 2019 would have each been $10,000 higher and the weighted average rates for those maturity years would have been 1.96% and 2.46% as of December 31, 2015, respectively. Furthermore, the weighted average rate reported for total borrowings would have been 1.33% as of the same date. Finally, these borrowings were included in the amount reported as net increase in short-term borrowings in the Company’s Audited Consolidated Statement of Cash Flows for the year ended December 31, 2015.
| 82 |
Bank Mutual Corporation and Subsidiaries
Notes to Consolidated Financial Statements
December 31, 2015
(Dollars in thousands, except share and per share amounts)
7. Borrowings (continued)
The Company is required to pledge certain unencumbered mortgage loans and mortgage-related securities as collateral against its outstanding advances from the FHLB of Chicago. Advances are also collateralized by the shares of capital stock of the FHLB of Chicago that are owned by the Company. The Company’s borrowings at the FHLB of Chicago are limited to the lesser of: (i) 35% of total assets; (ii) 22.2 times the FHLB of Chicago capital stock owned by the Company; or (iii) the total of 80% of the book value of one- to four-family mortgage loans, 72% of the book value of certain multi-family mortgage loans, 51% of the book value of certain home equity loans, and 98% of the fair value of certain mortgage-related securities.
8. Shareholders’ Equity
The Company and Bank are subject to various regulatory capital requirements administered by federal banking agencies and as defined in applicable regulations. Failure to meet minimum capital requirements can initiate certain mandatory actions and possible additional discretionary actions by regulators that, if undertaken, could have a direct material effect on the Company's financial statements. Under capital adequacy guidelines the Company and Bank must meet specific capital guidelines that involve quantitative measures of assets, liabilities, and certain off-balance sheet items as calculated under regulatory accounting practices. The Company and Bank’s capital amounts and classification are also subject to qualitative judgments by the regulators about components, risk weightings, and other factors.
Quantitative measures established by federal regulation to ensure capital adequacy require the Company and Bank to maintain minimum capital amounts and ratios as shown in the following table and as defined in the applicable regulations. Management believes, as of December 31, 2015, that the Company and the Bank met or exceeded all regulatory capital adequacy requirements to which it is subject. The following table presents the Company and the Bank’s actual and required regulatory capital amounts and ratios as of the dates indicated. However, it should be noted that the Company was not subject to regulatory capital regulations prior to January 1, 2015, nor was the Bank subject to a common equity tangible Tier 1 (“CET1”) capital requirement prior to that same date. Furthermore, effective January 1, 2015, new regulatory capital adequacy requirements became effective which changed the inputs and methodology for computing the total capital, Tier 1 capital, and Tier 1 leverage capital ratios after that date.
| 83 |
Bank Mutual Corporation and Subsidiaries
Notes to Consolidated Financial Statements
December 31, 2015
(Dollars in thousands, except share and per share amounts)
8. Shareholders’ Equity (continued)
The Company and Bank’s actual and required regulatory capital amounts and ratios as of December 31, 2015 and 2014, are presented in the following table, as applicable:
| Actual | Required to be Adequately Capitalized | Required to be Well Capitalized | ||||||||||||||||||||||
| Amount | Ratio | Amount | Ratio | Amount | Ratio | |||||||||||||||||||
| As of December 31, 2015: | ||||||||||||||||||||||||
| At the Company: | ||||||||||||||||||||||||
| Total risk-weighted capital | $ | 296,709 | 15.83 | % | $ | 149,922 | 8.00 | % | $ | 187,402 | 10.00 | % | ||||||||||||
| Tier 1 risk-weighted capital | 279,068 | 14.89 | 112,441 | 6.00 | 149,922 | 8.00 | ||||||||||||||||||
| CET1 risk-weighted capital | 279,068 | 14.89 | 84,331 | 4.50 | 121,811 | 6.50 | ||||||||||||||||||
| Tier 1 leverage capital | 279,068 | 11.37 | 98,197 | 4.00 | 122,747 | 5.00 | ||||||||||||||||||
| At the Bank: | ||||||||||||||||||||||||
| Total risk-weighted capital | $ | 272,568 | 14.55 | % | $ | 149,900 | 8.00 | % | $ | 187,375 | 10.00 | % | ||||||||||||
| Tier 1 risk-weighted capital | 254,927 | 13.61 | 112,425 | 6.00 | 149,900 | 8.00 | ||||||||||||||||||
| CET1 risk-weighted capital | 254,927 | 13.61 | 84,319 | 4.50 | 121,794 | 6.50 | ||||||||||||||||||
| Tier 1 leverage capital | 254,927 | 10.48 | 97,328 | 4.00 | 121,660 | 5.00 | ||||||||||||||||||
| As of December 31, 2014 | ||||||||||||||||||||||||
| At the Bank: | ||||||||||||||||||||||||
| Total risk-weighted capital | $ | 285,406 | 18.19 | % | $ | 125,489 | 8.00 | % | $ | 156,861 | 10.00 | % | ||||||||||||
| Tier 1 risk-weighted capital | 265,765 | 16.94 | 62,744 | 4.00 | 94,117 | 6.00 | ||||||||||||||||||
| Tier 1 leverage capital | 265,765 | 11.44 | 92,957 | 4.00 | 116,197 | 5.00 | ||||||||||||||||||
The following table presents reconciliations of the Company and the Bank’s equity under generally accepted accounting principles to capital as determined by regulators:
| December 31, 2015 | December 31, 2014 | |||||||||||||||
| Total Risk- Weighted | Tier 1 and CET1 | Total Risk- Weighted | Tier 1 | |||||||||||||
| Total equity including
non-controlling interest according to the Bank’s records | $ | 254,200 | $ | 254,200 | $ | 265,948 | $ | 265,948 | ||||||||
| Net unrealized gain on securities available for sale, net of taxes | (724 | ) | (724 | ) | (3,430 | ) | (3,430 | ) | ||||||||
| Net unrealized loss and net prior service costs for defined pension plans, net of taxes | 10,089 | 10,089 | 14,566 | 14,566 | ||||||||||||
| Deposit-based intangible, net of taxes | – | – | (70 | ) | (70 | ) | ||||||||||
| Investment in “non-includable” subsidiaries | (3,023 | ) | (3,023 | ) | (3,249 | ) | (3,249 | ) | ||||||||
| Disallowed deferred tax assets | (5,615 | ) | (5,615 | ) | (8,000 | ) | (8,000 | ) | ||||||||
| Allowance for loan losses, as limited | 17,641 | – | 19,641 | – | ||||||||||||
| Regulatory capital at the Bank | 272,568 | 254,927 | $ | 285,406 | $ | 265,765 | ||||||||||
| Additional retained earnings at the Company | 25,194 | 25,194 | ||||||||||||||
| Additional disallowed deferred tax asset at the Company | (1,053 | ) | (1,053 | ) | ||||||||||||
| Regulatory capital at the Company | $ | 296,709 | $ | 279,068 | ||||||||||||
| 84 |
Bank Mutual Corporation and Subsidiaries
Notes to Consolidated Financial Statements
December 31, 2015
(Dollars in thousands, except share and per share amounts)
8. Shareholders’ Equity (continued)
The following table summarizes the components of accumulated other comprehensive loss, net of related income tax effects, as of the dates shown:
| December 31 | ||||||||
| 2015 | 2014 | |||||||
| Net unrealized gain on securities available-for-sale | $ | 724 | $ | 3,430 | ||||
| Qualified and supplemental defined benefit plans | (10,011 | ) | (14,458 | ) | ||||
| Other post-retirement benefit plans | (78 | ) | (108 | ) | ||||
| Accumulated other comprehensive loss | $ | (9,365 | ) | $ | (11,136 | ) | ||
9. Earnings Per Share
The computation of the Company’s basic and diluted earnings per share is presented in the following table.
| Year Ended December 31 | ||||||||||||
| 2015 | 2014 | 2013 | ||||||||||
| Basic earnings per share: | ||||||||||||
| Net income | $ | 14,177 | $ | 14,665 | $ | 10,796 | ||||||
| Weighted-average shares outstanding | 45,614,877 | 46,123,884 | 46,204,917 | |||||||||
| Vested restricted shares during the period | 63,707 | 40,146 | 25,710 | |||||||||
| Basic shares outstanding | 45,678,584 | 46,164,030 | 46,230,627 | |||||||||
| Basic earnings per share | $ | 0.31 | $ | 0.32 | $ | 0.23 | ||||||
| Diluted earnings per share: | ||||||||||||
| Net income | $ | 14,177 | $ | 14,665 | $ | 10,796 | ||||||
| Weighted-average shares outstanding used in basic earnings per share | 45,678,584 | 46,164,030 | 46,230,627 | |||||||||
| Net dilutive effect of: | ||||||||||||
| Stock option shares | 352,645 | 251,949 | 162,239 | |||||||||
| Non-vested restricted shares | 32,580 | 29,319 | 30,725 | |||||||||
| Diluted shares outstanding | 46,063,809 | 46,445,298 | 46,423,591 | |||||||||
| Diluted earnings per share | $ | 0.31 | $ | 0.31 | $ | 0.23 | ||||||
The Company had stock options for 309,700, 438,000, and 1,778,000 shares outstanding at December 31, 2015, 2014, and 2013, respectively, which were not included in the computation of diluted earnings per share because they were anti-dilutive. These shares had weighted-average exercise prices of $8.32, $7.81, and $10.53, as of those same dates, respectively.
10. Employee Benefit Plans
The Company has a discretionary, defined contribution savings plan (the “Savings Plan”). The Savings Plan is qualified under Sections 401 and 401(k) of the Internal Revenue Code and provides employees meeting certain minimum age and service requirements the ability to make contributions to the Savings Plan on a pretax basis. The Company then matches a percentage of the employee’s contributions. Matching contributions expensed by the Company were $807 in 2015, $930 in 2014, and $206 in 2013.
| 85 |
Bank Mutual Corporation and Subsidiaries
Notes to Consolidated Financial Statements
December 31, 2015
(Dollars in thousands, except share and per share amounts)
10. Employee Benefit Plans (continued)
The Company also has a qualified defined benefit pension plan covering employees meeting certain minimum age and service requirements and a supplemental defined benefit pension plan for certain eligible employees. The supplemental pension plan is funded through a "rabbi trust" arrangement. The benefits under these plans are generally based on years of service and the employee’s average annual compensation for five consecutive calendar years in the last ten calendar years which produces the highest average. The Company’s funding policy is to contribute annually the amount necessary to satisfy the requirements of the Employee Retirement Income Security Act of 1974.
In 2013 the Company froze the benefits of participants in the qualified defined benefit pension plan that had less than 20 years of service. This change also resulted in the future benefits under the Company’s supplemental defined benefit pension plan being effectively frozen. In addition, in 2015 the Company froze the benefits of the remaining participants in the qualified defined benefit pension plan. These actions resulted in curtailment gains in the qualified plan in 2013 and 2015, which reduced the projected benefit obligation and the unrecognized loss by $2,395 and $1,023 in those years, respectively. These amounts were also recognized through accumulated other comprehensive income in 2013 and 2015, respectively.
The changes in plan assets and benefit obligations at December 31, 2015 and 2014, are presented in the following table.
| Qualified | Supplemental | |||||||||||||||
| Pension Plan | Pension Plan | |||||||||||||||
| 2015 | 2014 | 2015 | 2014 | |||||||||||||
| Change in plan assets: | ||||||||||||||||
| Fair value of plan assets at beginning of year | $ | 50,161 | $ | 49,256 | – | – | ||||||||||
| Actual return on plan assets | 663 | 2,684 | – | – | ||||||||||||
| Employer contributions | 10,000 | – | $ | 1,018 | $ | 1,097 | ||||||||||
| Benefits paid | (2,175 | ) | (1,779 | ) | (1,018 | ) | (1,097 | ) | ||||||||
| Fair value of plan assets at end of year | $ | 58,649 | 50,161 | – | – | |||||||||||
| Change in benefit obligation: | ||||||||||||||||
| Benefit obligation at beginning of year | 71,759 | 57,854 | 11,114 | 10,183 | ||||||||||||
| Service cost | 966 | 897 | – | – | ||||||||||||
| Interest cost | 2,640 | 2,668 | 398 | 453 | ||||||||||||
| Actuarial loss (gain) | (6,119 | ) | 12,119 | 159 | 1,575 | |||||||||||
| Curtailment gain on plan amendment | (1,023 | ) | – | – | – | |||||||||||
| Benefits paid | (2,175 | ) | (1,779 | ) | (1,018 | ) | (1,097 | ) | ||||||||
| Benefit obligation at end of year | 66,048 | 71,759 | 10,653 | 11,114 | ||||||||||||
| Funded status at the end of the year | $ | (7,399 | ) | $ | (21,598 | ) | $ | (10,653 | ) | $ | (11,114 | ) | ||||
The underfunded status of the qualified and supplemental pension plans at December 31, 2015, are recognized in the Consolidated Statement of Financial Condition as accrued pension liability, which is included as a component of other liabilities.
| 86 |
Bank Mutual Corporation and Subsidiaries
Notes to Consolidated Financial Statements
December 31, 2015
(Dollars in thousands, except share and per share amounts)
10. Employee Benefit Plans (continued)
The following tables summarize the changes in pension plan assets and benefit obligations recognized in accumulated other comprehensive loss, net of related income tax effect, for the periods indicated:
| Qualified | Supplemental | |||||||||||||||
| Pension Plan | Pension Plan | |||||||||||||||
| 2015 | 2014 | 2015 | 2014 | |||||||||||||
| Balance in accumulated other comprehensive loss at the beginning of year | $ | (12,856 | ) | $ | (5,857 | ) | $ | (1,602 | ) | $ | (661 | ) | ||||
| Change in unrecognized loss recorded in other comprehensive income | 4,494 | (6,999 | ) | (47 | ) | (941 | ) | |||||||||
| Balance in accumulated other comprehensive loss at the end of year | $ | (8,362 | ) | $ | (12,856 | ) | $ | (1,649 | ) | $ | (1,602 | ) | ||||
All period-end balances in the table for the qualified pension plan and supplemental pension plan consisted of unrecognized loss.
The estimated net of tax costs that will be amortized from accumulated other comprehensive income into net periodic cost in 2016 is $1,278 for the qualified plan. The accumulated benefit obligations for the qualified defined benefit pension plan were $66,047 at December 31, 2015, and $70,163 at December 31, 2014.
The assumptions used to determine the benefit obligations as of December 31 is as follows:
| 2015 | 2014 | |||||||
| Discount rate qualified plan | 4.13 | % | 3.74 | % | ||||
| Discount rate supplemental plan | 3.66 | 3.74 | ||||||
| Rate of increase in compensation levels (both plans) | 3.00 | 3.00 | ||||||
| Expected long-term rate of return on plan assets (qualified plan) | 6.00 | 6.00 | ||||||
The assumptions used to determine the net cost for the years ended December 31 is as follows:
| 2015 | 2014 | 2013 | ||||||||||
| Discount rate (both plans) | 3.74 | % | 4.70 | % | 3.70 | % | ||||||
| Rate of increase in compensation levels (both plans) | 3.00 | 3.00 | 3.00 | |||||||||
| Expected long-term rate of return on plan assets (qualified plan) | 6.00 | 6.00 | 6.50 | |||||||||
The expected long-term rate of return was estimated using a combination of the historical and expected rate of return for immediate participation guarantee contracts, which is the primary asset of the qualified plan.
| 87 |
Bank Mutual Corporation and Subsidiaries
Notes to Consolidated Financial Statements
December 31, 2015
(Dollars in thousands, except share and per share amounts)
10. Employee Benefit Plans (continued)
Using an actuarial measurement date of December 31, 2015, 2014, and 2013, components of net periodic benefit cost follow:
| 2015 | 2014 | 2013 | ||||||||||
| Qualified pension plan: | ||||||||||||
| Interest cost | $ | 2,640 | $ | 2,668 | $ | 2,300 | ||||||
| Service cost | 966 | 897 | 3,081 | |||||||||
| Expected return on plan assets | (2,939 | ) | (2,891 | ) | (3,297 | ) | ||||||
| Amortization of net loss | 2,623 | 661 | 1,732 | |||||||||
| Net periodic cost | $ | 3,290 | $ | 1,335 | $ | 3,816 | ||||||
| Supplemental pension plan: | ||||||||||||
| Interest cost | $ | 398 | $ | 453 | $ | 388 | ||||||
| Service cost | – | – | 160 | |||||||||
| Amortization of prior service cost | – | – | 44 | |||||||||
| Amortization of net loss from earlier periods | 91 | 6 | 368 | |||||||||
| Net periodic cost | $ | 489 | $ | 459 | $ | 960 | ||||||
At December 31, 2015, the projected benefit payments for each of the plans are as follows:
| Qualified Pension Plan | Supplemental Pension Plan | Total | ||||||||||||
| 2016 | $ | 2,519 | $ | 909 | $ | 3,428 | ||||||||
| 2017 | 2,740 | 848 | 3,588 | |||||||||||
| 2018 | 2,958 | 809 | 3,767 | |||||||||||
| 2019 | 3,148 | 786 | 3,934 | |||||||||||
| 2020 | 3,353 | 771 | 4,124 | |||||||||||
| 2021 – 2025 | 19,058 | 3,627 | 22,685 | |||||||||||
| Total | $ | 33,776 | $ | 7,750 | $ | 41,526 | ||||||||
| 88 |
Bank Mutual Corporation and Subsidiaries
Notes to Consolidated Financial Statements
December 31, 2015
(Dollars in thousands, except share and per share amounts)
10. Employee Benefit Plans (continued)
The following tables summarize the fair value of the Company’s qualified pension plan assets as of the dates indicated:
| December 31, 2015 | ||||||||||||||||
| Fair Value Hierarchy | ||||||||||||||||
| Amount | Level 1 | Level 2 | Level 3 | |||||||||||||
| Asset category: | ||||||||||||||||
| Money market funds | $ | 10,406 | – | $ | 10,406 | – | ||||||||||
| Equity security | 891 | $ | 891 | – | – | |||||||||||
| Immediate participation guarantee contract | 47,352 | – | – | $ | 47,352 | |||||||||||
| Total | $ | 58,649 | $ | 891 | $ | 10,406 | $ | 47,352 | ||||||||
| December 31, 2014 | ||||||||||||||||
| Fair Value Hierarchy | ||||||||||||||||
| Amount | Level 1 | Level 2 | Level 3 | |||||||||||||
| Asset category: | ||||||||||||||||
| Money market funds | $ | 385 | – | $ | 385 | – | ||||||||||
| Equity security | 1,135 | $ | 1,135 | – | – | |||||||||||
| Immediate participation guarantee contract | 48,641 | – | – | $ | 48,641 | |||||||||||
| Total | $ | 50,161 | $ | 1,135 | $ | 385 | $ | 48,641 | ||||||||
The plan’s investment objective is to minimize risk. The assets of the qualified pension plan are concentrated in a group annuity contract issued by a life insurance company. Pension plan contributions are maintained in the general account of the insurance company, which invests primarily in corporate and government notes and bonds with ten to fifteen years to maturity. The group annuity contract is valued at fair value by discounting the related cash flows based on current yields of similar instruments with comparable durations and considering the credit worthiness of the issuer.
The equity securities are shares of stock issued by the life insurance company when it demutualized. This investment is valued at the closing price reported in the active market in which the security is traded. The money market funds, invest in short-term U.S. government securities. The funds are not traded in an active market.
The following table presents a summary of the changes in the fair value of the pension plan’s Level 3 asset during the periods indicated. As noted above, the Company’s Level 3 asset consists entirely of a group annuity contract issued by an insurance company.
| 2015 | 2014 | |||||||
| Fair value at the beginning of the period | $ | 48,641 | $ | 47,729 | ||||
| Actual return on plan assets | 886 | 2,691 | ||||||
| Employer contribution | – | – | ||||||
| Benefits paid | (2,175 | ) | (1,773 | ) | ||||
| Fair value at the end of the period | $ | 47,352 | $ | 48,641 | ||||
The Company has a deferred retirement plan for certain non-officer directors who have provided at least five years of service. In the event a director dies prior to completion of these payments, payments will go to the director’s heirs. The Company has funded these arrangements through “rabbi trust” arrangements and, based on actuarial analyses, believes these obligations are adequately funded. The Company also has supplemental retirement plans for certain executives of a financial institution it acquired in 2000.
| 89 |
Bank Mutual Corporation and Subsidiaries
Notes to Consolidated Financial Statements
December 31, 2015
(Dollars in thousands, except share and per share amounts)
10. Employee Benefit Plans (continued)
The liabilities related to these plans were $4,280 and $4,258 at December 31, 2015 and 2014 respectively. The net expense related to these plans for the years ended December 31, 2015, 2014, and 2013 was $183, $839, and $199, respectively.
11. Stock-Based Benefit Plans
In 2004 the Company’s shareholders approved the 2004 Stock Incentive Plan (the “2004 Plan”). Options granted under the 2004 Plan vested over five years and had expiration terms of ten years. The 2004 Plan also provided for restricted stock awards that also vested over five years. The 2004 Plan terminated on February 1, 2014, in accordance with the terms of the plan. Options awarded under the 2004 Plan will remain outstanding until exercised, forfeited, or expired.
In 2014 the Company’s shareholders approved the 2014 Incentive Compensation Plan (the “2014 Plan”), which provides for the award of stock options, stock appreciation rights, restricted stock, restricted stock units, performance shares, and cash awards. Stock-related awards under the 2014 Plan may vest over a period of three or more years and, if applicable, have a maximum term of ten years. The number of shares of common stock of the Company that may be issued under the 2014 Plan is limited to 3,000,000 shares. As of December 31, 2015, 2,689,700 shares remain available for award under the 2014 Plan.
Restricted stock grants are amortized to compensation expense as the Company’s employees and directors become vested in the shares. The amount amortized to expense was $737, $376, and $237 in 2015, 2014, and 2013, respectively. Outstanding non-vested restricted stock grants had a fair value of $2,006 and an unamortized cost of $1,628 at December 31, 2015. The cost of these shares is expected to be recognized over a weighted-average period of 1.2 years.
The Company recorded stock option compensation expenses of $412, $465, and $301 for 2015, 2014, and 2013, respectively. As of December 31, 2015, there was $663 in total unrecognized stock option compensation expense related to non-vested options. This cost is expected to be recognized over a weighted-average period of 1.2 years.
The following schedule reflects activity in the Company’s vested and non-vested stock options and related weighted-average exercise prices for the periods indicated.
| Year Ended December 31 | ||||||||||||||||||||||||
| 2015 | 2014 | 2013 | ||||||||||||||||||||||
| Stock Options | Weighted- Average Exercise | Stock Options | Weighted- Average Exercise | Stock Options | Weighted- Average Exercise | |||||||||||||||||||
| Outstanding at beginning of year | 1,631,000 | $ | 5.3032 | 2,955,000 | $ | 8.0742 | 2,671,000 | $ | 8.4711 | |||||||||||||||
| Granted | 44,000 | 6.7780 | 276,000 | 6.9653 | 352,000 | 4.9439 | ||||||||||||||||||
| Exercised | (177,700 | ) | 4.5579 | (4,000 | ) | 5.0500 | (18,200 | ) | 4.7764 | |||||||||||||||
| Forfeited | (75,800 | ) | 5.2706 | (60,000 | ) | 11.9737 | (49,800 | ) | 8.4373 | |||||||||||||||
| Expired | – | – | (1,536,000 | ) | 10.6730 | – | – | |||||||||||||||||
| Outstanding at end of year | 1,421,500 | $ | 5.4378 | 1,631,000 | $ | 5.3032 | 2,955,000 | $ | 8.0742 | |||||||||||||||
| 90 |
Bank Mutual Corporation and Subsidiaries
Notes to Consolidated Financial Statements
December 31, 2015
(Dollars in thousands, except share and per share amounts)
11. Stock-Based Benefit Plans (continued)
The following table provides additional information regarding the Company’s outstanding options as of December 31, 2015.
| Remaining | Non-Vested Options | Vested Options | ||||||||||||||||||||
| Contractual Life | Stock Options | Intrinsic Value | Stock Options | Intrinsic Value | ||||||||||||||||||
| Exercise price: | ||||||||||||||||||||||
| $ | 11.160 | 2.3 | – | – | 32,000 | – | ||||||||||||||||
| $ | 12.025 | 2.6 | – | – | 50,000 | – | ||||||||||||||||
| $ | 7.226 | 4.3 | – | – | 50,000 | $ | 29 | |||||||||||||||
| $ | 4.740 | 5.0 | – | – | 70,000 | 214 | ||||||||||||||||
| $ | 5.050 | 5.0 | 58,400 | $ | 161 | 229,600 | 631 | |||||||||||||||
| $ | 4.300 | 5.2 | 5,000 | 18 | 20,000 | 70 | ||||||||||||||||
| $ | 3.720 | 5.6 | 2,500 | 10 | 10,000 | 41 | ||||||||||||||||
| $ | 3.390 | 6.0 | 130,000 | 573 | 183,000 | 807 | ||||||||||||||||
| $ | 3.800 | 6.3 | 4,000 | 16 | 6,000 | 24 | ||||||||||||||||
| $ | 4.820 | 7.1 | 145,800 | 434 | 100,000 | 298 | ||||||||||||||||
| $ | 5.360 | 7.3 | 12,000 | 29 | 8,000 | 20 | ||||||||||||||||
| $ | 5.700 | 7.4 | 12,000 | 25 | 8,000 | 17 | ||||||||||||||||
| $ | 6.340 | 7.6 | 6,000 | 9 | 4,000 | 6 | ||||||||||||||||
| $ | 7.170 | 8.1 | 148,800 | 94 | 39,900 | 25 | ||||||||||||||||
| $ | 6.010 | 8.3 | 6,000 | 11 | 1,500 | 3 | ||||||||||||||||
| $ | 5.8500 | 8.4 | 13,333 | 26 | 6,667 | 13 | ||||||||||||||||
| $ | 6.1000 | 8.6 | 13,333 | 23 | 6,667 | 11 | ||||||||||||||||
| $ | 6.7000 | 9.1 | 32,000 | 35 | – | – | ||||||||||||||||
| $ | 7.1900 | 9.6 | 7,000 | 4 | – | – | ||||||||||||||||
| Total | 596,166 | $ | 1,468 | 825,334 | $ | 2,209 | ||||||||||||||||
| Weighted-average remaining contractual life | 7.1 years | 5.5 years | ||||||||||||||||||||
| Weighted-average exercise price | $ | 5.3377 | $ | 5.5100 | ||||||||||||||||||
The total intrinsic value of options exercised was $459, $5, and $25 in 2015, 2014, and 2013, respectively. The weighted-average grant date fair value of non-vested options at December 31, 2015, was $1.54 per share. In 2015 75,800 non-vested options were forfeited.
The Company uses the Black-Scholes option-pricing model to estimate the fair value of granted options. This model was developed for use in estimating the fair value of traded options that have no vesting restrictions and are fully transferable. However, the Company's stock options have characteristics significantly different from traded options and changes in the subjective input assumptions can materially affect the fair value estimate. Option valuation models such as Black-Scholes require the input of highly subjective assumptions including the expected stock price volatility, which is computed using ten years of actual price activity in the Company’s stock. The Company uses historical data of employee behavior as a basis to estimate the expected life of the options, as well as forfeitures due to employee terminations. The Company also uses its actual dividend yield at the time of the grant, as well as actual U.S. Treasury yields in effect at the time of the grant to estimate the risk-free rate. The following weighted-average assumptions were used to value 44,000 options granted during 2015: risk free interest rate of 1.81%, dividend yield of 2.45%, expected stock volatility of 33.5%, and expected term to exercise of 7.5 years. The following weighted-average assumptions were used to value 276,000 options granted during 2014: risk free interest rate of 2.37%, dividend yield of 1.82%, expected stock volatility of 32%, and expected term to exercise of 7.5 years.
| 91 |
Bank Mutual Corporation and Subsidiaries
Notes to Consolidated Financial Statements
December 31, 2015
(Dollars in thousands, except share and per share amounts)
11. Stock-Based Benefit Plans (continued)
The following weighted-average assumptions were used to value 352,000 options granted during 2013: risk free interest rate of 1.28%, dividend yield of 1.67%, expected stock volatility of 30%, and expected term to exercise of 7.5 years.
12. Income Taxes
The Company and its subsidiaries file income tax returns in the U.S. federal jurisdiction and Wisconsin and Minnesota. The Company is no longer subject to U.S. federal and state income tax examinations for years prior to 2012 and 2011, respectively. If any interest and/or penalties would be imposed by an appropriate taxing authority, the Company would report the interest component as a reduction of income before income taxes and would report penalties through income tax expense. The Company had no material uncertain tax positions and had not recorded a liability for unrecognized tax benefits as of or during the three years ended December 31, 2015.
The Company’s provision for income taxes consists of the following for the periods indicated:
| Year Ended December 31 | ||||||||||||
| 2015 | 2014 | 2013 | ||||||||||
| Current income tax expense: | ||||||||||||
| Federal | $ | 201 | $ | 476 | $ | 487 | ||||||
| State | 6 | 824 | 8 | |||||||||
| Current income tax expense | 207 | 1,300 | 495 | |||||||||
| Deferred income tax expense: | ||||||||||||
| Federal | 6,450 | 5,888 | 4,077 | |||||||||
| State | 1,678 | 1,662 | 1,130 | |||||||||
| Deferred income tax expense | 8,128 | 7,550 | 5,207 | |||||||||
| Income tax expense | $ | 8,335 | $ | 8,850 | $ | 5,702 | ||||||
Income tax expense differs from the provision computed at the federal statutory corporate rate as follows:
| Year Ended December 31 | ||||||||||||
| 2015 | 2014 | 2013 | ||||||||||
| Income before income taxes | $ | 22,512 | $ | 23,504 | $ | 16,450 | ||||||
| Tax expense at federal statutory rate | $ | 7,879 | $ | 8,230 | $ | 5,774 | ||||||
| Increase (decrease) in taxes resulting from: | ||||||||||||
| State income taxes, net of federal tax benefit | 1,095 | 1,095 | 741 | |||||||||
| Bank-owned life insurance | (654 | ) | (977 | ) | (835 | ) | ||||||
| State income tax settlement, net of federal benefit | – | 518 | – | |||||||||
| Other | 15 | (16 | ) | 22 | ||||||||
| Income tax expense | $ | 8,335 | $ | 8,850 | $ | 5,702 | ||||||
| 92 |
Bank Mutual Corporation and Subsidiaries
Notes to Consolidated Financial Statements
December 31, 2015
(Dollars in thousands, except share and per share amounts)
12. Income Taxes (continued)
Deferred income taxes reflect the net tax effects of temporary differences between the carrying amounts of assets and liabilities for financial reporting purposes and the amounts used for income tax purposes. The significant components of the Company’s deferred tax assets and liabilities are summarized as follows:
| December 31 | ||||||||
| 2015 | 2014 | |||||||
| Deferred tax assets: | ||||||||
| Pension | $ | 7,407 | $ | 13,309 | ||||
| Loan loss reserves | 7,082 | 8,947 | ||||||
| State net operating losses | 3,532 | 3,986 | ||||||
| Federal net operating losses and AMT credits | 3,136 | 5,550 | ||||||
| Deferred compensation | 1,766 | 1,807 | ||||||
| Non-deductible losses on foreclosed real estate | 1,431 | 1,775 | ||||||
| Restricted stock amortization | 458 | 287 | ||||||
| Other-than-temporary impairment of investment securities | 237 | 297 | ||||||
| Other | 1,317 | 778 | ||||||
| Total deferred tax assets | 26,366 | 36,736 | ||||||
| Deferred tax liabilities: | ||||||||
| Mortgage servicing rights | 2,892 | 3,157 | ||||||
| Purchase accounting adjustments | 2,575 | 2,699 | ||||||
| Property and equipment depreciation | 2,395 | 1,330 | ||||||
| FHLB stock dividends | 1,200 | 1,200 | ||||||
| Unrealized gain on investment securities | 483 | 2,297 | ||||||
| Other | 336 | 458 | ||||||
| Total deferred tax liabilities | 9,881 | 11,141 | ||||||
| Net deferred tax asset | $ | 16,485 | $ | 25,595 | ||||
As of December 31, 2015, the Company had $2,705 and $68,262 in net operating loss carryovers for federal and state income tax purposes, respectively, and $2,189 in federal AMT credit carryovers available to offset against future income. The net operating loss carryovers expire in various years through 2031 if unused. The AMT credit carryovers have no expiration date.
13. Financial Instruments with Off-Balance Sheet Risk and Derivative Financial Instruments
The Company is party to financial instruments with off-balance-sheet risk in the normal course of business to meet the financing needs of its customers. These financial instruments consist of commitments to extend credit and involve, to varying degrees, elements of credit and interest rate risk in excess of the amounts recognized in the Consolidated Statements of Financial Condition. The contract amounts reflect the extent of involvement the Company has in particular classes of financial instruments and also represents the Company’s maximum exposure to credit loss.
Commitments to extend credit are agreements to lend to a customer as long as there is no violation of any condition established in the contract. Commitments generally have fixed expiration dates or other termination clauses and generally require payment of a fee. As some commitments expire without being drawn upon, the total commitment amounts do not necessarily represent future cash requirements. The Company evaluates the collateral needed and creditworthiness of each customer on a case by case basis. The Company generally extends credit only on a secured basis. Collateral obtained varies, but consists principally of one- to four-family residences.
| 93 |
Bank Mutual Corporation and Subsidiaries
Notes to Consolidated Financial Statements
December 31, 2015
(Dollars in thousands, except share and per share amounts)
13. Financial Instruments with Off-Balance Sheet Risk and Derivative Financial Instruments (continued)
Off-balance sheet financial instruments or obligations that represent exposure to credit risk under commitments to extend credit are summarized in the following table as of the dates indicated:
| December 31 | ||||||||
| 2015 | 2014 | |||||||
| Unused commercial lines of credit | $ | 146,183 | $ | 104,406 | ||||
| Commercial loans | 6,772 | 4,609 | ||||||
| Standby letters of credit | 4,458 | 3,774 | ||||||
| Real estate loan commitments: | ||||||||
| Fixed rate | 36,921 | 33,040 | ||||||
| Adjustable rate | 308,173 | 216,714 | ||||||
| Unused consumer lines of credit | 164,989 | 165,600 | ||||||
The Company sells substantially all of its long-term, fixed-rate, one- to four-family loan originations in the secondary market. The Company uses IRLCs and forward commitments to sell loans to manage interest rate risk associated with its loan sales activities, both of which are considered to be free-standing derivative financial instruments under GAAP. Changes in the fair value of these free-standing derivative instruments are recognized currently through earnings. As of December 31, 2015 and 2014, net unrealized gains of $94 and $84, respectively, were included in net gain on loan sales activities on these free-standing derivative instruments. These amounts were exclusive of net unrealized gains of $74 and $117 on loans held-for-sale as of those dates, respectively, which were also included in net gain on loan sales activities.
The Company enters into interest rate swap arrangements to manage the interest rate risk exposure associated with specific commercial loan relationships at the time such loans are originated. These interest rate swaps, as well as the embedded derivatives associated with certain of its commercial loan relationships, are free-standing derivative instruments under GAAP. As such, changes in the fair value of these free-standing derivative instruments are recognized currently through earnings. During the years ended December 31, 2015 and 2014, net unrealized gains of $3,353 and $1,559, respectively, and net unrecognized losses of $3,353 and $1,559, respectively, related to interest rate swaps and embedded derivatives were recorded in loan-related fees.
Beginning in 2015 the Company also entered into interest rate swap arrangements to manage the interest rate risk exposure associated with certain forecasted borrowings from the FHLB of Chicago. These interest rate swaps were designated as forecasted transaction cash flow hedges by management (refer to Note 7, “Borrowings”). As such, the effective portion of the change in the fair value of these derivatives is recorded in other comprehensive income and the ineffective portion was recorded in interest expense. During the year ended December 31, 2015, there was no net unrealized gain or loss related to interest rate swaps recorded in other comprehensive income. The ineffective portion of this hedge was immaterial in 2015 and was recorded in interest expense.
| 94 |
Bank Mutual Corporation and Subsidiaries
Notes to Consolidated Financial Statements
December 31, 2015
(Dollars in thousands, except share and per share amounts)
13. Financial Instruments with Off-Balance Sheet Risk and Derivative Financial Instruments (continued)
The following table summarizes the Company’s derivative financial instruments as of the dates indicated.
| December 31, 2015 | December 31 2014 | |||||||||||||||
| Notional Amount | Fair Value | Notional Amount | Fair Value | |||||||||||||
| Interest rate lock commitments | $ | 7,961 | $ | 166 | $ | 7,219 | $ | 142 | ||||||||
| Forward commitments to sell loans | 9,543 | (72 | ) | 7,415 | (58 | ) | ||||||||||
| Embedded derivatives on commercial loans | 23,559 | 705 | 23,985 | 649 | ||||||||||||
| Receive-fixed interest rate swaps | 82,780 | 2,648 | 20,144 | 910 | ||||||||||||
| Pay-fixed interest rate swaps | 126,339 | (3,353 | ) | 44,129 | (1,559 | ) | ||||||||||
| Net unrealized gains | $ | 94 | $ | 84 | ||||||||||||
The unrealized gains shown in the preceding table were included as a component of other assets as of the dates indicated. The unrealized losses were included in other liabilities as of the dates indicated.
14. Fair Value Measurements
Fair value is the price that would be received to sell an asset or paid to transfer a liability in an orderly transaction between market participants at the measurement date (exit price). The Company utilizes market data or assumptions that market participants would use in pricing the asset or liability, including assumptions about risk and the risks inherent in the inputs to the valuation technique. These inputs can be readily observable, market corroborated, or generally unobservable. The Company primarily applies the market approach for recurring value measurements and endeavors to utilize the best available information. Accordingly, the Company utilizes valuation techniques that maximize the use of observable inputs and minimize the use of unobservable inputs. The Company is able to classify fair value measurements based on the observability of those inputs. Accounting guidance establishes a fair value hierarchy that prioritizes the inputs used to measure fair value. The hierarchy gives the highest priority to unadjusted quoted prices in active markets for identical assets or liabilities (Level 1), the next highest priority is given to prices based on models, methodologies, and/or management judgments that rely on direct or indirect observable inputs (Level 2), and the lowest priority to prices derived from models, methodologies, and/or management judgments that rely on significant unobservable inputs (Level 3). There were no transfers of assets or liabilities between categories of the fair value hierarchy during the years ended December 31, 2015 and 2014.
The following methods and assumptions are used by the Company in estimating its fair value disclosures of financial instruments:
Cash and Cash Equivalents The carrying amounts reported in the statements of financial condition for cash and cash equivalents approximate those assets’ fair values. The Company considers the fair value of cash and cash equivalents to be Level 1 in the fair value hierarchy.
Mortgage-Related Securities Available-for-Sale and Held-to-Maturity Fair values for these securities are based on price estimates obtained from a third-party independent pricing service. This service utilizes pricing models that vary by asset class and incorporate available trade, bid, ask and other market information of comparable instruments. For structured securities, such as CMOs, the pricing models include cash flow estimates that consider the impact of loan performance data, including, but not limited to, expectations relating to loan prepayments, default rates, and loss severities. Management has reviewed the pricing methodology used by its pricing service to verify that prices are determined in accordance with the fair value guidance specified in GAAP. The Company considers the fair value of mortgage-related securities to be Level 2 in the fair value hierarchy.
| 95 |
Bank Mutual Corporation and Subsidiaries
Notes to Consolidated Financial Statements
December 31, 2015
(Dollars in thousands, except share and per share amounts)
14. Fair Value Measurements (continued)
Loans Held-for-Sale The fair value of loans held-for-sale is based on the current market price for securities collateralized by similar loans. The Company considers the fair value of loans held-for-sale to be Level 2 in the fair value hierarchy.
Loans Receivable Loans receivable are segregated by type such as commercial and industrial loans, commercial real estate mortgage loans, multi-family real estate mortgage loans, one- to four-family mortgage loans, and home equity and other consumer loans. The fair value of each type is calculated by discounting scheduled cash flows through the expected maturity of the loans using estimated market discount rates that reflect the credit and interest rate risk inherent in the loan type. The estimated maturity is based on the Company’s historical experience with prepayments for each loan classification, modified, as required, by an estimate of the effect of current economic and lending conditions. The Company considers the fair value of loans receivable to be Level 3 in the fair value hierarchy.
Mortgage Servicing Rights The Company has calculated the fair market value of mortgage servicing rights for those loans that are sold with servicing rights retained. For valuation purposes, loans are stratified by product type and, within product type, by interest rates. The fair value of mortgage servicing rights is based upon the present value of estimated future cash flows using current market assumptions for prepayments, servicing cost and other factors. The Company considers the fair value of mortgage servicing rights to be Level 3 in the fair value hierarchy.
The following table summarizes the significant inputs utilized by the Company to estimate the fair value of its MSRs as of December 31, 2015:
| Weighted- Average | Range | |||||||
| Loan size | $ | 117 | $1-$417 | |||||
| Contractual interest rate | 3.74 | % | 2.00%-7.10% | |||||
| Constant prepayment rate (“CPR”) | 8.37 | % | 1.45%-19.44% | |||||
| Remaining maturity in months | 222 | 3-480 | ||||||
| Servicing fee | 0.25 | % | – | |||||
| Annual servicing cost per loan (not in thousands) | $ | 60 | – | |||||
| Annual ancillary income per loan (not in thousands) | $ | 30 | – | |||||
| Discount rate | 9.80 | % | 9.75%-11.50% | |||||
MSR pools with an amortized cost basis greater than fair value are carried at fair value in the Company’s financial statements. There were no pools determined to be impaired at December 31, 2015 or 2014, and as there was no valuation allowance as of either of those dates.
Federal Home Loan Bank Stock FHLB of Chicago stock is carried at cost, which is its redeemable (fair) value, since the market for this stock is restricted. The Company considers the fair value of FHLB of Chicago stock to be Level 2 in the fair value hierarchy.
Accrued Interest Receivable and Payable The carrying values of accrued interest receivable and payable approximate their fair value. The Company considers the accrued interest receivable and payable to be Level 2 in the fair value hierarchy.
| 96 |
Bank Mutual Corporation and Subsidiaries
Notes to Consolidated Financial Statements
December 31, 2015
(Dollars in thousands, except share and per share amounts)
14. Fair Value Measurements (continued)
Deposit Liabilities and Advance Payments by Borrowers for Taxes and Insurance Fair value for demand deposits equal book value. The Company considers the fair value of demand deposits to be Level 2 in the fair value hierarchy. Fair values for certificate of deposits are estimated using a discounted cash flow calculation that applies current market borrowing interest rates to a schedule of aggregated expected monthly maturities on deposits. The Company considers the fair value of certificates of deposit to be Level 3 in the fair value hierarchy. The advance payments by borrowers for taxes and insurance are equal to their carrying amounts at the reporting date. The Company considers the fair value of advance payments by borrowers to be Level 2 in the fair value hierarchy.
Borrowings The fair value of long-term borrowings is estimated using discounted cash flow calculations with the discount rates equal to interest rates currently being offered for borrowings with similar terms and maturities. The carrying value on short-term borrowings approximates fair value. The Company considers the fair value of borrowings to be Level 2 in the fair value hierarchy.
Financial Instruments with Off-Balance Sheet Risk and Derivative Financial Instruments Commitments to extend credit that are not IRLCs generally carry variable rates of interest. As such, the fair value of these instruments is not material. The Company considers the fair value of these instruments to be Level 2 in the fair value hierarchy. The carrying value of IRLCs, forward commitments to sell loans, interest rate swaps and embedded derivatives is equal to their fair value. For IRLCs and forward commitments, the fair value is the difference between the current market prices for securities collateralized by similar loans and the notional amounts of the IRLCs and forward commitments. The fair value of the Company’s interest rate swaps and embedded derivatives is determined using discounted cash flow analysis on the expected cash flows of each derivative and also includes a nonperformance or credit risk component. The Company considers the fair value of IRLCs, forward commitments to sell loans, interest rate swaps, and embedded derivatives to be Level 2 in the fair value hierarchy.
The carrying values and fair values of the Company’s financial instruments are presented in the following table as of the dates indicated.
| December 31, 2015 | December 31, 2014 | |||||||||||||||
| Carrying Value | Fair Value | Carrying Value | Fair Value | |||||||||||||
| Cash and cash equivalents | $ | 44,501 | $ | 44,501 | $ | 46,177 | $ | 46,177 | ||||||||
| Mortgage related securities available-for-sale | 407,874 | 407,874 | 321,883 | 321,883 | ||||||||||||
| Mortgage related securities held-to-maturity | 120,891 | 121,641 | 132,525 | 134,117 | ||||||||||||
| Loans held-for-sale | 3,350 | 3,350 | 3,837 | 3,837 | ||||||||||||
| Loans receivable, net | 1,740,018 | 1,751,670 | 1,631,303 | 1,653,170 | ||||||||||||
| Mortgage servicing rights, net | 7,205 | 9,455 | 7,867 | 9,550 | ||||||||||||
| Federal Home Loan Bank stock | 17,591 | 17,591 | 14,209 | 14,209 | ||||||||||||
| Accrued interest receivable | 6,035 | 6,035 | 5,775 | 5,775 | ||||||||||||
| Deposit liabilities | 1,795,591 | 1,786,934 | 1,718,756 | 1,620,375 | ||||||||||||
| Borrowings | 372,375 | 378,266 | 256,469 | 264,659 | ||||||||||||
| Advance payments by borrowers | 3,382 | 3,382 | 4,742 | 4,742 | ||||||||||||
| Accrued interest payable | 1,091 | 1,091 | 492 | 492 | ||||||||||||
| Unrealized gain (loss) on: | ||||||||||||||||
| Interest rate lock commitments on loans | 166 | 166 | 142 | 142 | ||||||||||||
| Forward commitments to sell loans | (72 | ) | (72 | ) | (58 | ) | (58 | ) | ||||||||
| Embedded derivatives on commercial loans | 705 | 705 | 649 | 649 | ||||||||||||
| Receive-fixed interest rate swaps | 2,648 | 2,648 | 910 | 910 | ||||||||||||
| Pay-fixed interest rate swaps | (3,353 | ) | (3,353 | ) | (1,559 | ) | (1,559 | ) | ||||||||
| 97 |
Bank Mutual Corporation and Subsidiaries
Notes to Consolidated Financial Statements
December 31, 2015
(Dollars in thousands, except share and per share amounts)
14. Fair Value Measurements (continued)
The following table segregates by fair value hierarchy (i.e., Level 1, 2, or 3) all of the Company’s assets and liabilities that are measured at fair value on a recurring basis as of the dates indicated.
| December 31, 2015 | ||||||||||||||||
| Level 1 | Level 2 | Level 3 | Total | |||||||||||||
| Loans held-for-sale | – | $ | 3,350 | – | $ | 3,350 | ||||||||||
| Mortgage-related securities available-for-sale | – | 407,874 | – | 407,874 | ||||||||||||
| Total | – | $ | 411,224 | – | $ | 411,224 | ||||||||||
| December 31, 2014 | ||||||||||||||||
| Level 1 | Level 2 | Level 3 | Total | |||||||||||||
| Loans held-for-sale | – | $ | 3,837 | – | $ | 3,837 | ||||||||||
| Mortgage-related securities available-for-sale | – | 321,883 | – | 321,883 | ||||||||||||
| Total | – | $ | 325,720 | – | $ | 325,720 | ||||||||||
Impaired Loans For non-accrual loans greater than an established threshold and individually evaluated for impairment and all renegotiated loans, impairment is measured based on: (i) the fair value of the loan or the fair value of the collateral less estimated selling costs (collectively the “collateral value method”) or (ii) the present value of the estimated cash flows discounted at the loan’s original effective interest rate (the “discounted cash flow method”). The resulting valuation allowance, if any, is a component of the allowance for loan losses. The discounted cash flow method is a fair value measure. For the collateral value method, the Company generally obtains appraisals on a periodic basis to support the fair value of collateral underlying the loans. Appraisals are performed by independent certified and/or licensed appraisers that have been reviewed by the Company and incorporate information such as recent sales prices for comparable properties, costs of construction, and net operating income of the property or business. Selling costs are generally estimated at 10%. Appraised values may be further discounted based on management judgment regarding changes in market conditions and other factors since the time of the appraisal. A significant unobservable input in using net operating income to estimate fair value is the capitalization rate. At December 31, 2015, the range of capitalization rates utilized to determine the fair value of the underlying collateral on certain loans was 6% to 12%. The Company considers these fair values to be Level 3 in the fair value hierarchy. For those loans individually evaluated for impairment using the collateral value method, a valuation allowance of $535 was recorded for loans with a recorded investment of $37,119 at December 31, 2015. These amounts were $904 and $45,425 at December 31, 2014, respectively. Provision for loan losses related to these loans was $535 and $316 in 2015 and 2014, respectively.
Foreclosed Properties Foreclosed properties acquired through, or in lieu of, loan foreclosure are recorded at the lower of cost or fair value less estimated costs to sell. In determining fair value, the Company generally obtains appraisals to support the fair value of foreclosed properties, as described in the previous paragraph. In certain instances, the Company may also use the selling list price, less estimated costs to sell, as the fair value of foreclosed properties. In such instances, the list price is generally less than the appraised value. The Company considers these fair values to be Level 3 in the fair value hierarchy. As of December 31, 2015, $2,794 in foreclosed properties were valued at collateral value compared to $4,311 at December 31, 2014. Losses of $330 and $856 related to these foreclosed properties valued at collateral value were recorded during the twelve months ended December 31, 2015 and 2014, respectively.
| 98 |
Bank Mutual Corporation and Subsidiaries
Notes to Consolidated Financial Statements
December 31, 2015
(Dollars in thousands, except share and per share amounts)
15. Condensed Parent Company Only Financial Statements
STATEMENT OF FINANCIAL CONDITION
| December 31 | ||||||||
| 2015 | 2014 | |||||||
| Assets | ||||||||
| Cash and cash equivalents | $ | 23,873 | $ | 17,553 | ||||
| Investment in subsidiary | 254,200 | 262,175 | ||||||
| Other assets | 1,321 | 989 | ||||||
| Total assets | $ | 279,394 | $ | 280,717 | ||||
| Liabilities and shareholders’ equity | ||||||||
| Total liabilities | – | – | ||||||
| Shareholders’ equity: | ||||||||
| Common stock–$0.01 par value: | ||||||||
| Authorized–200,000,000 shares in 2015 and 2014 Issued–78,783,849 shares in 2015 and 2014 Outstanding–45,443,548 shares in 2015 and 46,568,284 shares in 2014 | $ | 788 | $ | 788 | ||||
| Additional paid-in capital | 486,273 | 488,467 | ||||||
| Retained earnings | 164,482 | 159,065 | ||||||
| Accumulated other comprehensive loss | (9,365 | ) | (11,136 | ) | ||||
| Treasury stock–33,340,301 shares in 2015 and 32,215,565 shares in 2014 | (362,784 | ) | (356,467 | ) | ||||
| Total shareholders’ equity | 279,394 | 280,717 | ||||||
| Total liabilities and shareholders’ equity | $ | 279,394 | $ | 280,717 | ||||
STATEMENT OF INCOME
| Year Ended December 31 | ||||||||||||
| 2015 | 2014 | 2013 | ||||||||||
| Total income | $ | 34 | $ | 20 | $ | 9 | ||||||
| Total expenses | 833 | 974 | 836 | |||||||||
| Loss before income taxes | (799 | ) | (954 | ) | (827 | ) | ||||||
| Income tax benefit | (318 | ) | (377 | ) | (323 | ) | ||||||
| Loss before equity in earnings of subsidiary | (481 | ) | (577 | ) | (504 | ) | ||||||
| Equity in earnings of subsidiary | 14,658 | 15,242 | 11,300 | |||||||||
| Net income | $ | 14,177 | $ | 14,665 | $ | 10,796 | ||||||
| 99 |
Bank Mutual Corporation and Subsidiaries
Notes to Consolidated Financial Statements
December 31, 2015
(Dollars in thousands, except share and per share amounts)
15. Condensed Parent Company Only Financial Statements (continued)
STATEMENT OF TOTAL COMPREHENSIVE INCOME
| Year Ended December 31 | ||||||||||||
| 2015 | 2014 | 2013 | ||||||||||
| Net income | $ | 14,177 | $ | 14,665 | $ | 10,796 | ||||||
| Other comprehensive income (loss), net of income taxes: | ||||||||||||
| Defined benefit pension plans: | ||||||||||||
| Unrecognized gain (loss) and net prior service costs, net of deferred income taxes of $2,576 in 2015, $(5,328) in 2014, and $2,058 in 2013 | 3,863 | (7,992 | ) | 3,086 | ||||||||
| Curtailment gain on plan amendment, net of deferred income taxes of $409 in 2015 and $958 in 2013 | 614 | – | 1,437 | |||||||||
| 4,477 | (7,992 | ) | 4,523 | |||||||||
| Unrealized holding gains: | ||||||||||||
| Change in net unrealized gain on securities available-for-sale, net of deferred income taxes of $(1,815) in 2015, $(512) in 2014, and $(1,424) in 2013 | (2,706 | ) | (764 | ) | (2,125 | ) | ||||||
| Reclassification adjustment for gain on securities included in income, net of income taxes of $(41) | – | (61 | ) | – | ||||||||
| (2,706 | ) | (825 | ) | (2,125 | ) | |||||||
| Total other comprehensive income (loss), net of income taxes | 1,771 | (8,817 | ) | 2,398 | ||||||||
| Total comprehensive income | $ | 15,948 | $ | 5,848 | $ | 13,194 | ||||||
| 100 |
Bank Mutual Corporation and Subsidiaries
Notes to Consolidated Financial Statements
December 31, 2015
(Dollars in thousands, except share and per share amounts)
15. Condensed Parent Company Only Financial Statements (continued)
STATEMENT OF CASH FLOWS
| Year Ended December 31 | ||||||||||||
| 2015 | 2014 | 2013 | ||||||||||
| Operating activities: | ||||||||||||
| Net income | $ | 14,177 | $ | 14,665 | $ | 10,796 | ||||||
| Adjustment to reconcile net income to net cash provided by operating activities: | ||||||||||||
| Equity in earnings of subsidiary | (14,658 | ) | (15,242 | ) | (11,300 | ) | ||||||
| Stock-based compensation | 130 | 163 | 85 | |||||||||
| Other operating activities | (310 | ) | (434 | ) | 1,467 | |||||||
| Net cash provided (used) by operating activities | (661 | ) | (848 | ) | 1,048 | |||||||
| Investing activities: | ||||||||||||
| Dividends from Bank subsidiary | 24,852 | 14,063 | 10,920 | |||||||||
| Other investing activities | – | – | 230 | |||||||||
| Net cash provided by investing activities | 24,852 | 14,063 | 11,150 | |||||||||
| Financing activities: | ||||||||||||
| Cash dividends | (8,760 | ) | (6,984 | ) | (4,643 | ) | ||||||
| Purchases of treasury stock | (10,545 | ) | – | – | ||||||||
| Proceeds from exercise of stock options | 730 | 20 | 87 | |||||||||
| Other financing activities | 704 | 376 | – | |||||||||
| Net cash used in financing activities | (17,871 | ) | (6,588 | ) | (4,556 | ) | ||||||
| Increase in cash and cash equivalents | 6,320 | 6,627 | 7,642 | |||||||||
| Cash and cash equivalents at beginning of year | 17,553 | 10,926 | 3,284 | |||||||||
| Cash and cash equivalents at end of year | $ | 23,873 | $ | 17,553 | $ | 10,926 | ||||||
| 101 |
Item 9. Changes in and Disagreements with Accountants on Accounting and Financial Disclosure
Not applicable.
Item 9A. Controls and Procedures
Disclosure Controls and Procedures
The management of the Company, including its Chief Executive Officer and Chief Financial Officer, has conducted an evaluation of the effectiveness of the Company’s disclosure controls and procedures (as such term is defined in Rules 13a-15(e) and 15d-15(e) under the Securities Exchange Act of 1934, as amended (the “Exchange Act”)) as of the end of the period covered by this report. Based on that evaluation, the Chief Executive Officer and Chief Financial Officer concluded as of December 31, 2015, that the disclosure controls and procedures were effective.
Change in Internal Control Over Financial Reporting
There have not been any changes in the Company’s internal control over financial reporting (as such term is defined in Rules 13a-15(f) and 15d-15(f) under the Exchange Act) during the final fiscal quarter of the year to which this report relates that have materially affected, or are reasonably likely to materially affect, the Company’s internal control over financial reporting.
Management’s Report on Internal Control Over Financial Reporting
The internal control over financial reporting is a process designed to provide reasonable assurance regarding the reliability of financial reporting and the preparation of financial statements for external purposes in accordance with GAAP. The Company’s internal control over financial reporting includes those policies and procedures that: (1) pertain to the maintenance of records that, in reasonable detail, accurately and fairly reflect the transactions and dispositions of the assets of the Company; (2) provide reasonable assurance that transactions are recorded as necessary to permit preparation of financial statements in accordance with GAAP, and that receipts and expenditures of the Company are being made only in accordance with authorization of management and directors of the Company; and (3) provide reasonable assurance regarding prevention or timely detection of unauthorized acquisition, use, or disposition of the Company’s assets that could have a material effect on the financial statements.
Management of the Company is responsible for establishing and maintaining effective internal control over financial reporting and for its assessment of the effectiveness of internal control over financial reporting. The Company’s management, including its Chief Executive Officer and Chief Financial Officer, has assessed the effectiveness of its internal control over financial reporting as of December 31, 2015, based on the criteria established in “Internal Control—Integrated Framework (2013)” issued by the Committee of Sponsoring Organizations of the Treadway Commission (“COSO”). Based upon its assessment and those criteria, management believes that as of December 31, 2015, the Company’s internal control over financial reporting was effective.
Deloitte & Touche LLP, the Company’s independent registered public accounting firm, has audited the consolidated financial statements included in this Annual Report on Form 10-K and, as a part of its audit, has audited the effectiveness of the Company’s internal control over financial reporting. That report can be found on the following page as part of this Item 9A.
| 102 |
Report of Independent Registered Public Accounting Firm
To the Board of Directors and Shareholders of
Bank Mutual Corporation
Milwaukee, Wisconsin
We have audited the internal control over financial reporting of Bank Mutual Corporation and subsidiaries (the “Company”) as of December 31, 2015, based on criteria established in Internal Control—Integrated Framework (2013) issued by the Committee of Sponsoring Organizations of the Treadway Commission. The Company’s management is responsible for maintaining effective internal control over financial reporting and for its assessment of the effectiveness of internal control over financial reporting, included in the accompanying Management’s Report on Internal Control Over Financial Reporting. Our responsibility is to express an opinion on the Company’s internal control over financial reporting based on our audit.
We conducted our audit in accordance with the standards of the Public Company Accounting Oversight Board (United States). Those standards require that we plan and perform the audit to obtain reasonable assurance about whether effective internal control over financial reporting was maintained in all material respects. Our audit included obtaining an understanding of internal control over financial reporting, assessing the risk that a material weakness exists, testing and evaluating the design and operating effectiveness of internal control based on the assessed risk, and performing such other procedures as we considered necessary in the circumstances. We believe that our audit provides a reasonable basis for our opinion.
A company’s internal control over financial reporting is a process designed by, or under the supervision of, the company’s principal executive and principal financial officers, or persons performing similar functions, and effected by the company’s board of directors, management, and other personnel to provide reasonable assurance regarding the reliability of financial reporting and the preparation of financial statements for external purposes in accordance with generally accepted accounting principles. A company’s internal control over financial reporting includes those policies and procedures that (1) pertain to the maintenance of records that, in reasonable detail, accurately and fairly reflect the transactions and dispositions of the assets of the company; (2) provide reasonable assurance that transactions are recorded as necessary to permit preparation of financial statements in accordance with generally accepted accounting principles, and that receipts and expenditures of the company are being made only in accordance with authorizations of management and directors of the company; and (3) provide reasonable assurance regarding prevention or timely detection of unauthorized acquisition, use, or disposition of the company’s assets that could have a material effect on the financial statements.
Because of the inherent limitations of internal control over financial reporting, including the possibility of collusion or improper management override of controls, material misstatements due to error or fraud may not be prevented or detected on a timely basis. Also, projections of any evaluation of the effectiveness of the internal control over financial reporting to future periods are subject to the risk that the controls may become inadequate because of changes in conditions, or that the degree of compliance with the policies or procedures may deteriorate.
In our opinion, the Company maintained, in all material respects, effective internal control over financial reporting as of December 31, 2015, based on the criteria established in Internal Control—Integrated Framework (2013) issued by the Committee of Sponsoring Organizations of the Treadway Commission.
We have also audited, in accordance with the standards of the Public Company Accounting Oversight Board (United States), the consolidated financial statements as of and for the year ended December 31, 2015, of the Company and our report dated March 7, 2016, expressed an unqualified opinion on those consolidated financial statements.
/s/ Deloitte & Touche LLP
Milwaukee, Wisconsin
March 7, 2016
| 103 |
Not applicable.
| 104 |
Item 10. Directors, Executive Officers, and Corporate Governance
Information in response to this item is incorporated herein by reference to “Election of Directors and “Section 16(a) Beneficial Ownership Reporting Compliance” in the Company’s definitive Proxy Statement for its Annual Meeting of Shareholders on May 2, 2016 (the “2016 Annual Meeting Proxy Statement”).
The following table lists the executive officers of the Company and the Bank as of March 4, 2016.
| Name and Age | Officers and Positions with the Company and the Bank (1) | Executive Officer Since | ||
| David A. Baumgarten, 65 | Chief Executive Officer since 2013 and President since 2010; previously, Executive Vice President – Regional Banking of Associated Banc-Corp | 2010 | ||
| Michael W. Dosland, 56 | Senior Vice President and Chief Financial Officer; Principal Financial Officer of the Company (2) | 2008 | ||
| James P. Carter, 58 | Vice President and Secretary of the Company; Vice President Corporate Counsel of the Bank | 2009 | ||
| Richard L. Schroeder, 58 | Vice President – Controller; Principal Accounting Officer of the Company, | 2009 | ||
| Officers and Positions with the Bank (1) | ||||
| Joseph W. Fikejs, 45 | Senior Vice President and Chief Operating Officer since 2015; previously, Vice President of Finance and Operations of Bergstrom Corporation from 2010 to 2015, and previously Director of Commercial Sales and Support of Associated Banc-Corp | 2015 | ||
| Gregory A. Larson, 61 | Senior Vice President – Director of Commercial Banking since 2010; previously, Senior Vice President/Group Manager – Commercial Banking of Associated Bank, N.A. | 2011 | ||
| Patrick W. Lawton, 53 | Senior Vice President – Investment Real Estate since 2013; formerly Senior Vice President – Real Estate of BMO Harris Bank (M&I Bank) | 2014 | ||
| Christopher L. Mayne, 51 | Senior Vice President – Chief Credit Officer since 2011; previously, Senior Vice President – Senior Credit Officer for Middle Market Lending of Associated Bank, N.A. | 2011 | ||
| Daniel J. Mekemson, 71 | Senior Vice President – Residential Lending since 2013; previously, President of Mekemson Consulting Services | 2014 | ||
| Terri M. Pfarr, 55 | Senior Vice President – Human Resources since 2014, and its Vice President – Human Resources since 2013; formerly Director of Human Resources for ACC Holding, Inc. | 2014 | ||
| Kimberlie D. Weekley, 45 | Senior Vice President, Director of Retail Banking and Sales since 2014; previously, Vice President – Market Manager of BMO Harris Bank (M&I Bank) | 2014 |
| (1) | Excluding directorships and executive positions with the Bank’s subsidiaries, which positions do not constitute a substantial part of the officers’ duties. Includes other positions held in the past five years, if the individuals have not held their current positions for that entire period. |
| (2) | Mr. Dosland was President and Chief Executive Officer of Vantus Bank and First Federal Bankshares from 2006 to August 2008. In September 2009, Vantus Bank was closed by the Office of Thrift Supervision, and the FDIC was appointed as Vantus’ receiver. Those events occurred more than one year after Mr. Dosland left his positions with Vantus Bank. |
| 105 |
Item 11. Executive Compensation
Information in response to this item is incorporated by reference to “Election of Directors—Board Meetings and Committees—Compensation Committee Interlocks and Insider Participation,” “Directors' Compensation,” “Compensation Discussion and Analysis,” “Compensation Committee Report on Executive Compensation,” “Executive Compensation,” and “Risk Management and Compensation” in the 2016 Annual Meeting Proxy Statement.
Item 12. Security Ownership of Certain Beneficial Owners and Management and Related Stockholder Matters
Information in response to this item is incorporated by reference to “Security Ownership of Certain Beneficial Owners” in the 2016 Annual Meeting Proxy Statement.
The following chart gives aggregate information regarding grants under all equity compensation plans of the Company through December 31, 2015.
| Plan category | Number of securities to be issued upon exercise of outstanding options, warrants, and rights | Weighted-average exercise price of outstanding options, warrants, and rights | Number of securities remaining available for future issuance under equity compensation plans (excluding securities reflected in 1st column) | |||||||||
| 2004 Stock Incentive Plan approved by shareholders | 1,335,000 | $ | 5.3790 | None | ||||||||
| 2014 Incentive Compensation Plan approved by shareholders | 86,500 | 6.3446 | 2,689,700 | |||||||||
| Equity compensation plans not approved by security holders | None | None | None | |||||||||
| Total | 1,421,500 | $ | 5.4378 | 2,689,700 | ||||||||
Item 13. Certain Relationships and Related Transactions, and Director Independence
Information in response to this item is incorporated by reference to “Election of Directors—Board Meetings and Committees” and “Certain Transactions and Relationships with the Company” in the 2016 Annual Meeting Proxy Statement.
Item 14. Principal Accountant Fees and Services
Information in response to this item is incorporated by reference to “Independent Registered Public Accounting Firm” in the 2016 Annual Meeting Proxy Statement.
| 106 |
Item 15. Exhibits, Financial Statement Schedules
| (a) | Documents filed as part of the Report: |
1. and 2. Financial Statements and Financial Statement Schedules.
The following consolidated financial statements of the Company and subsidiaries are filed as part of this report under “Item 8. Financial Statements and Supplementary Data”:
| · | Report of Deloitte & Touche LLP, Independent Registered Public Accounting Firm, on the consolidated financial statements. |
| · | Consolidated Statements of Financial Condition—As of December 31, 2015 and 2014. |
| · | Consolidated Statements of Income—Years Ended December 31, 2015, 2014, and 2013. |
| · | Consolidated Statements of Total Comprehensive Income—Years Ended December 31, 2015, 2014, and 2013 |
| · | Consolidated Statements of Equity—Years Ended December 31, 2015, 2014, and 2013. |
| · | Consolidated Statements of Cash Flows—Years Ended December 31, 2015, 2014, and 2013. |
| · | Notes to Consolidated Financial Statements. |
All schedules for which provision is made in the applicable accounting regulations of the Securities and Exchange Commission are not required under the related instructions or are inapplicable, and therefore have been omitted.
(b) Exhibits. Refer to the Exhibit Index following the signature page of this report, which is incorporated herein by reference. Each management contract or compensatory plan or arrangement required to be filed as an exhibit to this report is identified in the Exhibit Index by an asterisk following its exhibit number.
| 107 |
Pursuant to the requirements of Section 13 or 15(d) of the Securities Exchange Act of 1934, the registrant has duly caused this report to be signed on its behalf by the undersigned, thereunto duly authorized.
BANK MUTUAL CORPORATION
March 7, 2016
| By: | /s/ David A. Baumgarten | |
| David A. Baumgarten | ||
| President and Chief Executive Officer |
POWER OF ATTORNEY
Each person whose signature appears below hereby authorizes David A. Baumgarten, Michael W. Dosland, Richard L. Schroeder or any of them, as attorneys-in-fact with full power of substitution, to execute in the name and on behalf of such person, individually, and in each capacity stated below or otherwise, and to file, any and all amendments to this report.
Pursuant to the requirements of the Securities Exchange Act of 1934, this report has been signed below by the following persons on behalf of the registrant and in the capacities indicated.*
Signature and Title
| /s/ David A. Baumgarten | /s/ Thomas H. Buestrin | |
| David A. Baumgarten, President, Chief Executive Officer, and Director (Principal Executive Officer) | Thomas H. Buestrin, Director | |
| /s/ Michael W. Dosland | /s/ Mark C. Herr | |
| Michael W. Dosland, Senior Vice President and Chief Financial Officer (Principal Financial Officer) | Mark C. Herr, Director | |
| /s/ Richard L. Schroeder | /s/ Lisa A. Mauer | |
| Richard L. Schroeder, Vice President and | Lisa A. Mauer, Director | |
| Controller (Principal Accounting Officer) | ||
| /s/ Michael T. Crowley, Jr. | /s/ William J. Mielke | |
| Michael T. Crowley, Jr., Chairman and Director | William J. Mielke, Director | |
| /s/ David C. Boerke | /s/ Robert B. Olson | |
| David C. Boerke, Director | Robert B. Olson, Director | |
| /s/ Richard A. Brown | ||
| Richard A. Brown, Director |
* Each of the above signatures is affixed as of March 7, 2016.
| 108 |
BANK MUTUAL CORPORATION
(“Bank Mutual Corporation” or the “Company”)
Commission File No. 000-32107
EXHIBIT INDEX
TO
2015 REPORT ON FORM 10-K
The following exhibits are filed with, or incorporated by reference in, this Report on Form 10-K for the year ended December 31, 2015:
| Exhibit | Description | Incorporated Herein by Reference To |
Filed Herewith | |||
| 3(i) | Restated Articles of Incorporation, as last amended May 29, 2003, of Bank Mutual Corporation (the “Articles”) | Exhibit 3(i) to the Company's Registration Statement on Form S-1, Registration No. 333-105685 | ||||
| 3(ii) | Bylaws, as last amended May 7, 2007, of Bank Mutual Corporation | Exhibit 3.1 to the Company’s Report on Form 8-K dated May 7, 2007 | ||||
| 4.1 | The Articles | Exhibit 3(i) above | ||||
| 10.1* | Bank Mutual Corporation Savings Restoration Plan and Bank Mutual Corporation ESOP Restoration Plan | Exhibit 10.1(b) to the Company’s Annual Report on Form 10-K for the year ended December 31, 2003 | ||||
| 10.2* | Bank Mutual Corporation Outside Directors’ Retirement Plan | Exhibit 10.2 to the Company’s Annual Report on Form 10-K for the year ended December 31, 2009 | ||||
| 10.3* | Mutual Savings Bank Executive Excess Benefit Plan ** | Exhibit 10.3 to Bank Mutual Corporation’s Registration Statement on Form S-1, Registration No. 333-39362 (“2000 S-1”) | ||||
| 10.4* | Agreement regarding deferred compensation dated May 16, 1988 between Mutual Savings Bank and Michael T. Crowley, Sr. | Exhibit 10.4 to 2000 S-1 | ||||
| 10.5(a)* | Employment Agreement between Mutual Savings Bank and Michael T. Crowley Jr. dated December 21, 1993 (in effect only as to post-retirement matters) | Exhibit 10.5(a) to 2000 S-1 | ||||
| 10.5(b)* | Amendment thereto dated February 17, 1998 | Exhibit 10.5(b) to 2000 S-1 | ||||
| 10.6* | Form of Employment Agreement (with Messrs.Dosland, Larson, Lawton, Mayne, and certain other executive officers; continuing through 2016) | Exhibit 10.6(c) to the Company’s Annual Report on Form 10-K for the year ended December 31, 2010 (“2010 10-K”) |
| 109 |
| Exhibit | Description | Incorporated Herein by Reference To |
Filed Herewith | |||
| 10.7* | Employment Agreement of Mr. Baumgarten with Bank Mutual dated as of April 5, 2010 (continuing through 2017) | Exhibit 10.1 to the Company’s Report on Form 8-K dated April 5, 2010 | ||||
| 10.8(a)* | Non-Qualified Deferred Retirement Plan for Directors of First Northern Savings Bank | Exhibit 10.10(a) to the Company’s Annual Report on Form 10-K for the year ended December 31, 2000 | ||||
| 10.8(b)* | Amendment No. 1 thereto | Exhibit 10.3.2 to First Northern Capital Corp.’s Annual Report on Form 10-K for the fiscal year ended December 31, 1998 | ||||
| 10.9(a)* | Bank Mutual Corporation 2004 Stock Incentive Plan (superseded) | Appendix A to Proxy Statement for 2004 Annual Meeting of Shareholders | ||||
| 10.9(b)(i)* | Form of Option Agreement thereunder—Bank Mutual Corporation Director Stock Option Agreement (superseded) | Exhibit 10.1(b) to the Company’s Report on Form 10-Q for the quarter ended June 30, 2004 (“6/30/04 10-Q”) | ||||
| 10.9(b)(ii)* | 2011 updated Form of Bank Mutual Corporation Director Stock Option Agreement (superseded) | Exhibit 10.11(b)(ii) to the 2010 10-K | ||||
| 10.9(c)(i)* | Form of Option Agreement thereunder—Bank Mutual Corporation Incentive Stock Option Agreement (superseded) | Exhibit 10.1(c ) to the 6/30/04 10-Q | ||||
| 10.9(c)(ii)* | 2010 updated Form of Bank Mutual Corporation Incentive Stock Option Agreement (superseded) | Exhibit 10.11(c )(ii) to the 2010 10-K | ||||
| 10.9(c)(iii)* | 2012 alternate Form of Bank Mutual Corporation Incentive Stock Option Agreement (superseded) | Exhibit 10.10(c)(iii) to the Company’s Annual Report on Form 10-K for the year ended December 31, 2011 (“2011 10-K”) | ||||
| 10.9(d)(i)* | Form of Bank Mutual Corporation Officers Management Recognition Award—2011 (superseded) | Exhibit 10.11(e)(ii) to the 2010 10-K | ||||
| 10.9(d)(ii)* | Form of Bank Mutual Corporation Officers Management Recognition Award—2012 (superseded) | Exhibit 10.10(e)(iii) to the 2011 10-K |
| 110 |
| Exhibit | Description | Incorporated Herein by Reference To |
Filed Herewith | |||
| 10.10(a)* | Bank Mutual Corporation 2014 Incentive Compensation Plan (the “2014 Plan”) | Exhibit 10.1 to the Company’s Quarterly Report on Form 10-Q for the quarter ended March 31, 2014 (“3/31/14 10-Q”) | ||||
| Forms of Award Agreements under 2014 Plan: | ||||||
| 10.10(b)* | Form of Incentive Stock Option Agreement (standard) | Exhibit 10.2(a) to 3/31/14 10-Q | ||||
| 10.10(c)* | Form of Incentive Stock Option Agreement (for Mr. Baumgarten) | Exhibit 10.2(b) to 3/31/14 10-Q | ||||
| 10.10(d)* | Form of Director Stock Option Agreement | Exhibit 10.2(c) to 3/31/14 10-Q | ||||
| 10.10(e)* | Form of Restricted Stock award (standard) | Exhibit 10.2(d) to 3/31/14 10-Q | ||||
| 10.10(f)* | Form of Restricted Stock Award (for Mr. Baumgarten) | Exhibit 10.2(e) to 3/31/14 10-Q | ||||
| 10.10(g)* | Form of Restricted Stock Award (for directors) | Exhibit 10.2(f) to 3/31/14 10-Q | ||||
| 10.11(a)* | Bank Mutual Corporation Management Incentive Plan (superceded) | Exhibit 10.11(b) to the 2011 10-K | ||||
| 10.11(b)* | Bank Mutual Corporation Management Incentive Compensation Plan (2016) *** | X | ||||
| 10.12 | Agreement dated February 22, 2016 among the Company and Clover Partners, L.P. MHC Mutual Conversion Fund, L.P., Clover Investment, L.L.C., and Johnny Guerry | Exhibit 10.1 to the Company’s Report on Form 8-K dated February 22, 2016 | ||||
| 21.1 | List of Subsidiaries | X | ||||
| 23.1 | Consent of Deloitte & Touche LLP | X | ||||
| 24.1 | Powers of Attorney | Signature Page of this Report | ||||
| 31.1 | Sarbanes-Oxley Act Section 302 Certification signed by the Chairman and Chief Executive Officer of Bank Mutual Corporation | X | ||||
| 31.2 | Sarbanes-Oxley Act Section 302 Certification signed by the Senior Vice President and Chief Financial Officer of Bank Mutual Corporation | X | ||||
| 32.1 | Certification pursuant to 18 U.S.C. Section 1350, as adopted pursuant to Section 906 of the Sarbanes-Oxley Act of 2002 signed by the Chairman and Chief Executive Officer of Bank Mutual Corporation | X | ||||
| 32.2 | Certification pursuant to 18 U.S.C. Section 1350, as adopted pursuant to Section 906 of the Sarbanes-Oxley Act of 2002 signed by the Senior Vice President and Chief Financial Officer of Bank Mutual Corporation | X |
| 111 |
| Exhibit | Description | Incorporated Herein by Reference To |
Filed Herewith | |||
| 101 | The following materials are provided from Bank Mutual Corporation’s Annual Report on Form 10-K for the year ended December 31, 2015, formatted in Extensible Business Reporting Language (“XBRL”): (i) the Unaudited Condensed Consolidated Statements of Financial Condition, (ii) Unaudited Condensed Consolidated Statements of Income, (iii) Unaudited Condensed Consolidated Statements of Equity, (iv) Unaudited Condensed Consolidated Statements of Cash Flow, and (v) Notes to Unaudited Condensed Consolidated Financial Statements tagged as blocks of text. | |||||
| 101.INS | XBRL Instance Document | X | ||||
| 101.SCH | XBRL Taxonomy Extension Schema Document | X | ||||
| 101.CAL | XBRL Taxonomy Extension Calculation Linkbase Document | X | ||||
| 101.LAB | XBRL Extension Labels Linkbase Document | X | ||||
| 101.PRE | XBRL Taxonomy Extension Presentation Linkbase Document | X | ||||
| 101.DEF | XBRL Taxonomy Extension Definition Linkbase Document | X |
| * | Designates management or compensatory agreements, plans or arrangements required to be filed as exhibits pursuant to Item 15(b) of Form 10-K. |
| ** | Mutual Savings Bank is now known as “Bank Mutual.” |
| *** | Reflects non-material changes from the prior version pursuant to the 2014 Plan. |
| 112 |