Attached files
| file | filename |
|---|---|
| EX-23 - EXHIBIT 23 - SAUL CENTERS, INC. | bfs-12312015exhibit23.htm |
| EX-32 - EXHIBIT 32 - SAUL CENTERS, INC. | bfs-12312015exhibit32.htm |
| EX-21 - EXHIBIT 21 - SAUL CENTERS, INC. | bfs-12312015exhibit21.htm |
| EX-31 - EXHIBIT 31 - SAUL CENTERS, INC. | bfs-12312015exhibit31.htm |
| EX-99 - EXHIBIT 99 - SAUL CENTERS, INC. | bfs-12312015exhibit99.htm |
UNITED STATES
SECURITIES AND EXCHANGE COMMISSION
WASHINGTON, D.C. 20549
FORM 10-K |
(Mark One)
x | ANNUAL REPORT PURSUANT TO SECTION 13 or 15(d) OF THE SECURITIES EXCHANGE ACT OF 1934 |
For the fiscal year ended December 31, 2015
o | TRANSITION REPORT PURSUANT TO SECTION 13 OR 15(d) OF THE SECURITIES EXCHANGE ACT OF 1934 |
For the transition period from to
Commission File number 1-12254
SAUL CENTERS, INC. (Exact name of registrant as specified in its charter) |
Maryland | 52-1833074 |
(State or other jurisdiction of incorporation or organization) | (I.R.S. Employer Identification No.) |
7501 Wisconsin Avenue, Suite 1500, Bethesda, Maryland 20814-6522
(Address of principal executive offices) (Zip Code)
Registrant’s telephone number, including area code: (301) 986-6200
Securities registered pursuant to Section 12(b) of the Act:
Title of each class | Name of each exchange on which registered |
Common Stock, Par Value $0.01 Per Share | New York Stock Exchange |
Depositary Shares each representing 1/100th of a share of 6.875% Series C Cumulative Redeemable Preferred Stock, Par Value $0.01 Per Share | New York Stock Exchange |
Securities registered pursuant to Section 12(g) of the Act: N/A
Indicate by check mark if the registrant is a well-known seasoned issuer, as defined in Rule 405 of the Securities Act. Yes o No x
Indicate by check mark if the registrant is not required to file reports pursuant to Section 13 or Section 15(d) of the Act Yes o No x.
Indicate by check mark whether registrant (1) has filed all reports required to be filed by Section 13 or 15(d) of the Securities Exchange Act of 1934 during the preceding 12 months (or for such shorter period that the registrant was required to file such reports), and (2) has been subject to such filing requirements for the past 90 days. Yes x No o
Indicate by check mark whether the registrant has submitted electronically and posted on its corporate Web site, if any, every Interactive Data File required to be submitted and posted pursuant to Rule 405 of Regulation S-T (§ 232.405 of this chapter) during the preceding 12 months (or for such shorter period that the registrant was required to submit and post such files). YES x NO o
Indicate by check mark if disclosure of delinquent filers pursuant to Item 405 of Regulation S-K is not contained herein, and will not be contained, to the best of registrant’s knowledge, in the definitive proxy or information statements incorporated by reference in Part III of this Form 10-K or any amendment to this Form 10-K. o
Indicate by check mark whether the registrant is a large accelerated filer, an accelerated filer, a non-accelerated filer or a smaller reporting company. See definition of “accelerated filer,” “large accelerated filer” and smaller reporting company in Rule 12b-2 of the Exchange Act. (Check one):
Large accelerated filer | o | Accelerated filer | x |
Non-accelerated filer | o | Smaller reporting company | o |
Indicate by check mark whether the registrant is a shell company (as defined in Rule 12b-2 of the Act). Yes o No x.
The number of shares of Common Stock, $0.01 par value, issued and outstanding as of March 1, 2016 was 21,081,418.
The aggregate market value of the voting and non-voting common equity held by non-affiliates computed by reference to the closing price of the registrant’s Common Stock on the New York Stock Exchange on June 30, 2015 was $575.9 million.
DOCUMENTS INCORPORATED BY REFERENCE:
Registrant incorporates by reference into Part III (Items 10, 11, 12, 13 and 14) of this Annual Report on Form 10-K portions of registrant’s definitive Proxy Statement for the 2016 Annual Meeting of Stockholders to be filed with the Securities Exchange Commission pursuant to Regulation 14A. The definitive Proxy Statement will be filed with the Commission not later than 120 days after the end of the fiscal year covered by this Annual Report on Form 10-K.
TABLE OF CONTENTS
Page Numbers | ||
Item 1. | ||
Item 1A. | ||
Item 1B. | ||
Item 2. | ||
Item 3. | ||
Item 4. | ||
Item 5. | ||
Item 6. | ||
Item 7. | ||
Item 7A. | ||
Item 8. | ||
Item 9. | ||
Item 9A. | ||
Item 9B. | ||
Item 10. | ||
Item 11. | ||
Item 12. | ||
Item 13. | ||
Item 14. | ||
Item 15. | ||
FINANCIAL STATEMENT SCHEDULE | ||
Schedule III. | ||
2
PART I
Cautionary Statement Regarding Forward-Looking Statements
Certain statements contained herein constitute forward-looking statements as such term is defined in Section 27A of the Securities Act of 1933, as amended, and Section 21E of the Securities Exchange Act of 1934, as amended. Forward-looking statements are not guarantees of performance. Our future results, financial condition and business may differ materially from those expressed in these forward-looking statements. You can find many of these statements by looking for words such as “plans,” “intends,” “estimates,” “anticipates,” “expects,” “believes” or similar expressions in this Form 10-K. These forward-looking statements are subject to numerous assumptions, risks and uncertainties. Many of the factors that will determine these items are beyond our ability to control or predict. For further discussion of these factors, see “Item 1A. Risk Factors” in this Form 10-K.
For these statements, we claim the protection of the safe harbor for forward-looking statements contained in the Private Securities Litigation Reform Act of 1995. You are cautioned not to place undue reliance on our forward-looking statements, which speak only as of the date of this Form 10-K or the date of any document incorporated by reference. All subsequent written and oral forward-looking statements attributable to us or any person acting on our behalf are expressly qualified in their entirety by the cautionary statements contained or referred to in this section. We do not undertake any obligation to release publicly any revisions to our forward-looking statements to reflect events or circumstances after the date of this Form 10-K.
Item 1. Business
General
Saul Centers, Inc. (“Saul Centers”) was incorporated under the Maryland General Corporation Law on June 10, 1993. Saul Centers operates as a real estate investment trust (a “REIT”) under the Internal Revenue Code of 1986, as amended (the “Code”). The Company is required to annually distribute at least 90% of its REIT taxable income (excluding net capital gains) to its stockholders and meet certain organizational and other requirements. Saul Centers has made and intends to continue to make regular quarterly distributions to its stockholders. Saul Centers, together with its wholly owned subsidiaries and the limited partnerships of which Saul Centers or one of its subsidiaries is the sole general partner, are referred to collectively as the “Company.” B. Francis Saul II serves as Chairman of the Board of Directors and Chief Executive Officer of Saul Centers.
The Company’s principal business activity is the ownership, management and development of income-producing properties. The Company’s long-term objectives are to increase cash flow from operations and to maximize capital appreciation of its real estate.
Saul Centers was formed to continue and expand the shopping center business previously owned and conducted by the B. F. Saul Real Estate Investment Trust, the B. F. Saul Company and certain other affiliated entities, each of which is controlled by B. Francis Saul II and his family members (collectively, the "Saul Organization”). On August 26, 1993, members of the Saul Organization transferred to Saul Holdings Limited Partnership, a newly formed Maryland limited partnership (the “Operating Partnership”), and two newly formed subsidiary limited partnerships (the “Subsidiary Partnerships,” and collectively with the Operating Partnership, the “Partnerships”), shopping center and mixed-use properties, and the management functions related to the transferred properties. Since its formation, the Company has developed and purchased additional properties.
3
The following table lists the significant properties acquired, developed and/or disposed of by the Company since January 1, 2013.
Name of Property | Location | Type | Square Footage | Year of Acquisition/ Development/ Disposal | |||||
Acquisitions | |||||||||
1580 Rockville Pike | Rockville, Maryland | Shopping Center | 12,100 | January 2014 | |||||
1582 Rockville Pike | Rockville, Maryland | Shopping Center | 40,700 | April 2014 | |||||
750 N. Glebe Road | Arlington, Virginia | Shopping Center | 16,900 | August 2014 | |||||
730 N. Glebe Road | Arlington, Virginia | Shopping Center | 2,000 | December 2014 | |||||
1584 Rockville Pike | Rockville, Maryland | Shopping Center | 4,600 | December 2014 | |||||
726 N. Glebe Road | Arlington, Virginia | Shopping Center | 4,800 | September 2015 | |||||
Developments | |||||||||
Park Van Ness | Washington, DC | Mixed-Use | 2013-2015 | ||||||
Dispositions | |||||||||
Giant Center | Milford Mill, Maryland | Shopping Center | 70,040 | April 2014 | |||||
As of December 31, 2015, the Company’s properties (the “Current Portfolio Properties”) consisted of 50 shopping center properties (the “Shopping Centers”), six mixed-use properties, one of which was designated as held for sale, which are comprised of office, retail and multi-family residential uses (the “Mixed-Use Properties”) and three (non-operating) development properties. Shopping Centers and Mixed-Use Properties represent reportable business segments for financial reporting purposes. Revenue, net income, total assets and other financial information of each reportable segment are described in Note 16 to the Consolidated Financial Statements contained in Item 8 of this Form 10-K.
4
Organizational Structure
The Company conducts its business through the Operating Partnership and/or directly or indirectly owned subsidiaries. The following diagram depicts the Company’s organizational structure and beneficial ownership of the common and preferred stock of Saul Centers calculated pursuant to Rule 13d-3 of the Exchange Act as of December 31, 2015.
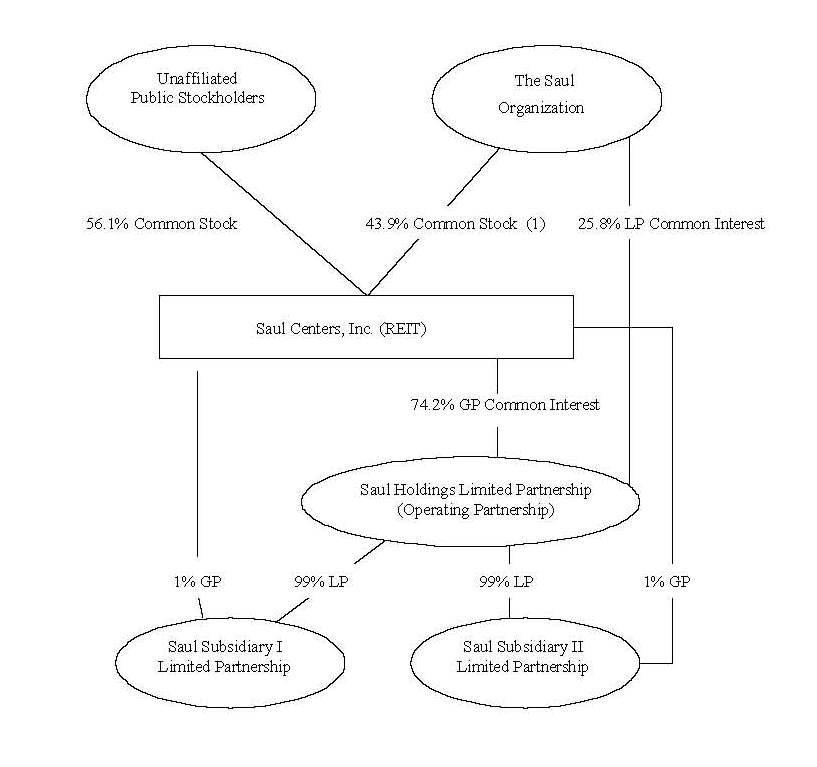
(1) | The Saul Organization’s ownership percentage in Saul Centers reported above does not include units of limited partnership interest of the Operating Partnership held by the Saul Organization. In general, most units are convertible into shares of the Company’s common stock on a one-for-one basis. However, not all of the units may be convertible into the Company’s common stock because (i) the articles of incorporation limit beneficial and constructive ownership (defined by reference to various Code provisions) to 39.9% in value of the Company’s issued and outstanding common and preferred equity securities, which comprise the ownership limit and (ii) the convertibility of some of the outstanding units is subject to approval of the Company’s stockholders. |
Management of the Current Portfolio Properties
The Operating Partnership manages the Current Portfolio Properties and will manage any subsequently acquired or developed properties. The management of the properties includes performing property management, leasing, design, renovation, development and accounting duties for each property. The Operating Partnership provides each property with a fully integrated property management capability, with approximately 61 full-time equivalent employees at its headquarters office and 36 employees at its properties and with an extensive and mature network of relationships with tenants and potential tenants as well as with members of the brokerage and property
5
owners’ communities. The Company currently does not, and does not intend to, retain third party managers or provide management services to third parties.
The Company augments its property management capabilities by sharing with the Saul Organization certain ancillary functions, at cost, such as information technology and payroll services, benefits administration and in-house legal services. The Company also shares insurance administration expenses on a pro rata basis with the Saul Organization. Management believes that these arrangements result in lower costs than could be obtained by contracting with third parties. These arrangements permit the Company to capture greater economies of scale in purchasing from third party vendors than would otherwise be available to the Company alone and to capture internal economies of scale by avoiding payments representing profits with respect to functions provided internally. The terms of all sharing arrangements with the Saul Organization, including payments related thereto, are specified in a written agreement and are reviewed annually by the Audit Committee of the Company’s Board of Directors.
The Company subleases its corporate headquarters space from the Saul Organization at the Company’s share of the cost. A discussion of the lease terms are provided in Note 7, Long Term Lease Obligations, of the Notes to Consolidated Financial Statements.
Principal Offices
The principal offices of the Company are located at 7501 Wisconsin Avenue, Suite 1500, Bethesda, Maryland 20814-6522, and the Company’s telephone number is (301) 986-6200. The Company’s internet web address is www.saulcenters.com. Information contained on the Company’s website is not part of this report. The Company makes available free of charge on its website its annual reports on Form 10-K, quarterly reports on Form 10-Q, current reports on Form 8-K, and any amendments to those reports filed or furnished pursuant to Section 13(a) or 15(d) of the Exchange Act, as soon as reasonably practicable after the reports are electronically filed with, or furnished to, the Securities and Exchange Commission (“SEC”). Alternatively, you may access these reports at the SEC’s website: www.sec.gov.
Policies with Respect to Certain Activities
The following is a discussion of the Company’s operating strategy and certain of its investment, financing and other policies. These strategies and policies have been determined by the Board of Directors and, in general, may be amended or revised from time to time by the Board of Directors without a vote of the Company’s stockholders.
Operating Strategies
The Company’s primary operating strategy is to focus on its community and neighborhood shopping center business and to operate its properties to achieve both cash flow growth and capital appreciation. Community and neighborhood shopping centers typically provide reliable cash flow and steady long-term growth potential. Management actively manages its property portfolio by engaging in strategic leasing activities, tenant selection, lease negotiation and shopping center expansion and reconfiguration. The Company seeks to optimize tenant mix by selecting tenants for its shopping centers that provide a broad spectrum of goods and services, consistent with the role of community and neighborhood shopping centers as the source for day-to-day necessities. Management believes that such a synergistic tenanting approach results in increased cash flow from existing tenants by providing the Shopping Centers with consistent traffic and a desirable mix of shoppers, resulting in increased sales and, therefore, increased cash flows.
Management believes there is potential for long term growth in cash flow as existing leases for space in the Shopping Centers expire and are renewed, or newly available or vacant space is leased. The Company intends to renegotiate leases where possible and seek new tenants for available space in order to optimize the mix of uses to improve foot traffic through the Shopping Centers. As leases expire, management expects to revise rental rates, lease terms and conditions, relocate existing tenants, reconfigure tenant spaces and introduce new tenants with the goals of increasing occupancy, improving overall retail sales, and ultimately increasing cash flow as economic conditions improve. In those circumstances in which leases are not otherwise expiring, management selectively attempts to increase cash flow through a variety of means, or in connection with renovations or relocations, recapturing leases
6
with below market rents and re-leasing at market rates, as well as replacing financially troubled tenants. When possible, management also will seek to include scheduled increases in base rent, as well as percentage rental provisions, in its leases.
The Company will also seek growth opportunities in its Washington, D.C. metropolitan area mixed-use portfolio, primarily through development and redevelopment, as evidenced by the commencement in 2013 of the redevelopment of Park Van Ness (formerly Van Ness Square). Management also intends to negotiate lease renewals or to re-lease available space in the Mixed-Use Properties, while considering the strategic balance of optimizing short-term cash flow and long-term asset value.
It is management’s intention to hold properties for long-term investment and to place strong emphasis on regular maintenance, periodic renovation and capital improvement. Management believes that characteristics such as cleanliness, lighting and security are particularly important in community and neighborhood shopping centers, which are frequently visited by shoppers during hours outside of the normal work-day. Management believes that the Shopping Centers and Mixed-Use Properties generally are attractive and well maintained. The Shopping Centers and Mixed-Use Properties will undergo expansion, renovation, reconfiguration and modernization from time to time when management believes that such action is warranted by opportunities or changes in the competitive environment of a property. The Company will continue its practice of expanding existing properties by undertaking new construction on outparcels suitable for development as free standing retail or office facilities.
Investment in Real Estate or Interests in Real Estate
The Company’s redevelopment and renovation objective is to selectively and opportunistically redevelop and renovate its properties, by replacing below-market-rent leases with strong, traffic-generating anchor stores such as supermarkets and drug stores, as well as other desirable local, regional and national tenants. The Company’s strategy remains focused on continuing the operating performance and internal growth of its existing Shopping Centers, while enhancing this growth with selective acquisitions, redevelopments and renovations.
In 2014, in separate transactions, the Company purchased three properties, with approximately 57,400 square feet of retail space, for an aggregate $25.2 million. The three properties are adjacent to an existing property on the east side of Rockville Pike near the Twinbrook Metro station. Combined, the four properties total 10.3 acres and are zoned for up to 1.2 million square feet of rentable mixed-use space. The Company is actively engaged in a plan for redevelopment but has not committed to any timetable for commencement of construction.
The Company owns properties on the east and west sides of Rockville Pike near the White Flint Metro station which combined total 7.6 acres which are zoned for a development potential of up to 1.6 million square feet of mixed-use space. The Company is actively engaged in a plan for redevelopment but has not committed to any timetable for commencement of construction.
In 2014, in separate transactions, the Company purchased two adjacent properties, with approximately 18,900 square feet of retail space, on North Glebe Road in Arlington, Virginia, for an aggregate $42.8 million. In September 2015, the Company purchased an additional property on North Glebe Road, which is adjacent to the two properties acquired in 2014, for $4.0 million. Combined, the properties total 2.5 acres and are zoned for up to 550,000 square feet of rentable mixed-use space. The Company is actively engaged in a plan for redevelopment but has not committed to any timetable for commencement of construction.
In light of the limited amount of quality properties for sale and the escalated pricing of properties that the Company has been presented with or has inquired about over the past year, management believes acquisition opportunities for investment in existing and new Shopping Center and Mixed-Use Properties in the near future is uncertain. Because of the Company’s conservative capital structure, including its cash and capacity under its revolving credit facility, management believes that the Company is positioned to take advantage of additional investment opportunities as attractive properties are located and market conditions improve. (See “Item 1. Business - Capital Policies”). It is management’s view that several of the sub-markets in which the Company operates have, or are expected to have in the future, attractive supply/demand characteristics. The Company will continue to evaluate acquisition, development and redevelopment as integral parts of its overall business plan.
7
In evaluating a particular redevelopment, renovation, acquisition, or development, management will consider a variety of factors, including (i) the location and accessibility of the property; (ii) the geographic area (with an emphasis on the Washington, D.C./Baltimore metropolitan area and the southeastern region of the United States) and demographic characteristics of the community, as well as the local real estate market, including potential for growth and potential regulatory impediments to development; (iii) the size of the property; (iv) the purchase price; (v) the non-financial terms of the proposed acquisition; (vi) the availability of funds or other consideration for the proposed acquisition and the cost thereof; (vii) the “fit” of the property with the Company’s existing portfolio; (viii) the potential for, and current extent of, any environmental problems; (ix) the current and historical occupancy rates of the property or any comparable or competing properties in the same market; (x) the quality of construction and design and the current physical condition of the property; (xi) the financial and other characteristics of existing tenants and the terms of existing leases; and (xii) the potential for capital appreciation.
During 2013, the Company completed negotiation of lease termination agreements with the tenants of Van Ness Square. Costs incurred related to those termination arrangements were amortized to expense using the straight-line method over the remaining terms of the leases, are included in “Predevelopment Expenses” in the Consolidated Statements of Operations, and totaled $3.3 million in 2013. The Company is in the process of developing a primarily residential project with street-level retail. In connection with the demolition of the existing structure, approximately $580,000 and $503,000 of predevelopment expenses were recognized in 2013 and 2014, respectively.
Although it is management’s present intention to concentrate future acquisition and development activities on community and neighborhood shopping centers and mixed-use properties in the Washington, D.C./Baltimore metropolitan area and the southeastern region of the United States, the Company may, in the future, also acquire other types of real estate in other areas of the country as opportunities present themselves. While the Company may diversify in terms of property locations, size and market, it does not set any limit on the amount or percentage of assets that may be invested in any one property or any one geographic area.
The Company intends to engage in such future investment or development activities in a manner that is consistent with the maintenance of its status as a REIT for federal income tax purposes and that will not make the Company become regulated as an investment company under the Investment Company Act of 1940, as amended. Equity investments in acquired properties may be subject to existing mortgage financings and other indebtedness or to new indebtedness which may be incurred in connection with acquiring or refinancing these investments.
Investments in Real Estate Mortgages
While the Company’s current portfolio and business objectives emphasize equity investments in commercial and neighborhood shopping centers and mixed-use properties, the Company may, at the discretion of the Board of Directors, invest in mortgages, participating or convertible mortgages, deeds of trust and other types of real estate interests consistent with its qualification as a REIT. The Company does not presently invest, nor does it intend to invest, in real estate mortgages.
Investments in Securities of or Interests in Persons Engaged in Real Estate Activities and Other Issues
Subject to the requirements to maintain REIT qualification, the Company may invest in securities of other REITs, other entities engaged in real estate activities or securities of other issuers, including for the purpose of exercising control over such entities. The Company does not presently invest, nor does it intend to invest, in any securities of other REITs.
Dispositions
In April 2014, the Company sold for $7.5 million the 70,040 square foot Giant Center located in Milford Mill, Maryland and recognized a $6.1 million gain.
The Company may elect to dispose of other properties if, based upon management’s periodic review of the Company’s portfolio, the Board of Directors determines that such action would be in the best interest of the Company’s stockholders.
8
Capital Policies
The Company has established a debt capitalization policy relative to asset value, which is computed by reference to the aggregate annualized cash flow from the properties in the Company’s portfolio rather than relative to book value. The Company has used a measure tied to cash flow because it believes that the book value of its portfolio properties, which is the depreciated historical cost of the properties, does not accurately reflect the Company’s ability to incur indebtedness. Asset value, however, is somewhat more variable than book value, and may not at all times reflect the fair market value of the underlying properties. As a general policy, the Company intends to maintain a ratio of its total debt to total asset value of 50% or less and to actively manage the Company’s leverage and debt expense on an ongoing basis in order to maintain prudent coverage of fixed charges. Given the Company’s current debt level, it is management’s belief that the ratio of the Company’s debt to total asset value is below 50% as of December 31, 2015.
The organizational documents of the Company do not limit the absolute amount or percentage of indebtedness that it may incur. The Board of Directors may, from time to time, reevaluate the Company’s debt capitalization policy in light of current economic conditions, relative costs of capital, market values of the Company property portfolio, opportunities for acquisition, development or expansion, and such other factors as the Board of Directors then deems relevant. The Board of Directors may modify the Company’s debt capitalization policy based on such a reevaluation without shareholder approval and consequently, may increase or decrease the Company’s debt to total asset ratio above or below 50% or may waive the policy for certain periods of time, subject to maintaining compliance with financial covenants within existing debt agreements. The Company selectively continues to refinance or renegotiate the terms of its outstanding debt in order to achieve longer maturities, and obtain generally more favorable loan terms, whenever management determines the financing environment is favorable.
The Company intends to finance future acquisitions and developments and to make debt repayments by utilizing the sources of capital then deemed to be most advantageous. Such sources may include undistributed operating cash flow, secured or unsecured bank and institutional borrowings, proceeds from the Company’s Dividend Reinvestment and Stock Purchase Plan, proceeds from the sale of properties and private and public offerings of debt or equity securities. Borrowings may be at the Operating Partnership or Subsidiary Partnerships’ level and securities offerings may include (subject to certain limitations) the issuance of Operating Partnership interests convertible into common stock or other equity securities.
Other Policies
The Company has the authority to offer equity or debt securities in exchange for property and to repurchase or otherwise acquire its common stock or other securities in the open market or otherwise, and may engage in such activities in the future. The Company expects, but is not obligated, to issue common stock to holders of units of the Operating Partnership upon exercise of their redemption rights. The Company has not engaged in trading, underwriting or agency distribution or sale of securities of other issuers other than the Operating Partnership and does not intend to do so. The Company has not made any loans to third parties, although the Company may in the future make loans to third parties. In addition, the Company has policies relating to related party transactions discussed in “Item 1A. Risk Factors.”
Competition
As an owner of, or investor in, community and neighborhood shopping centers and mixed-use properties, the Company is subject to competition from an indeterminate number of companies in connection with the acquisition, development, ownership and leasing of similar properties. These investors include investors with access to significant capital, such as domestic and foreign corporations and financial institutions, publicly traded and privately held REITs, private institutional investment funds, investment banking firms, life insurance companies and pension funds.
Competition may reduce properties available for acquisition or development or increase prices for raw land or developed properties of the type in which the Company invests. The Company faces competition in providing leases to prospective tenants and in re-letting space to current tenants upon expiration of their respective
9
leases. If tenants decide not to renew or extend their leases upon expiration, the Company may not be able to re-let the space. Even if the tenants do renew or the Company can re-let the space, the terms of renewal or re-letting, including the cost of required renovations, may be less favorable than current lease terms or than expectations for the space. This risk may be magnified if the properties owned by our competitors have lower occupancy rates than the Company’s properties. As a result, these competitors may be willing to make space available at lower prices than the space in the Current Portfolio Properties.
Management believes that success in the competition for ownership and leasing property is dependent in part upon the geographic location of the property, the tenant mix, the performance of property managers, the amount of new construction in the area and the maintenance and appearance of the property. Additional competitive factors impacting the Company’s properties include the ease of access to the properties, the adequacy of related facilities such as parking, and the demographic characteristics in the markets in which the properties compete. Overall economic circumstances and trends and new properties in the vicinity of each of the Current Portfolio Properties are also competitive factors.
Finally, retailers at our Shopping Centers face increasing competition from outlet stores, discount shopping clubs and other forms of marketing goods, such as direct mail, internet marketing and telemarketing. This competition may reduce percentage rents payable to us and may contribute to lease defaults or insolvency of tenants.
Environmental Matters
The Current Portfolio Properties are subject to various laws and regulations relating to environmental and pollution controls. The impact upon the Company from the application of such laws and regulations either prospectively or retrospectively is not expected to have a materially adverse effect on the Company’s property operations. As a matter of policy, the Company requires an environmental study be performed with respect to a property that may be subject to possible environmental hazards prior to its acquisition to ascertain that there are no material environmental hazards associated with such property.
Employees
As of March 1, 2016, the Company had approximately 61 full-time equivalent employees at its headquarters office, including seven leasing officers, and 36 employees at its properties. None of the Company’s employees are covered by collective bargaining agreements. Management believes that its relationship with employees is good.
Recent Developments
During the most recent downturn in the national real estate market, which began in 2008, the effects on the office and retail markets in the metropolitan Washington, D.C. area initially were less severe than in many other areas of the country. Even though economic conditions in the local economies, where the majority of the Company’s properties are located, have improved over recent years, issues facing the Federal government relating to spending cuts and budget policies have resulted in continued elevated vacancy rates in many sub-markets, thus pressuring rental rate growth. While overall consumer confidence appears to have improved, retailers continue to be cautious about new store openings. However, the Company’s overall leasing percentage, on a comparative same property basis, which excludes the impact of properties not in operation for the entirety of the comparable periods, continues to improve and increased to 94.7% at December 31, 2015, from 94.4% at December 31, 2014.
The Company's tenants were further impacted by winter weather, as heavy snowfall in the Mid-Atlantic states during the first quarter of 2016 and 2014 hindered the ability of customers to shop. The cost of removing snow from the Company's properties during the three months ended March 31, 2016 and 2014, was approximately $2.2 million and $2.0 million, respectively, approximately 60% of which is recoverable from tenants.
On November 12, 2014, Saul Centers sold, in an underwritten public offering, 1.6 million depositary shares, each representing 1/100th of a share of 6.875% Series C Cumulative Redeemable Preferred Stock, providing net cash proceeds of approximately $39.3 million. The depositary shares, which represent a new issuance of additional depositary shares that were first issued on February 12, 2013, may be redeemed at the Company’s option,
10
in whole or in part, at the $25.00 liquidation preference, plus accumulated dividends to but not including the redemption date, on or after February 12, 2018. The depositary shares pay an annual dividend of $1.71875 per share, equivalent to 6.875% of the $25.00 liquidation preference. The Series C preferred stock has no stated maturity, is not subject to any sinking fund or mandatory redemption and is not convertible into any other securities of the Company except in connection with certain changes in control or delisting events. Investors in the depositary shares generally have no voting rights, but will have limited voting rights if the Company fails to pay dividends for six or more quarters (whether or not declared or consecutive) and in certain other events. The proceeds from the offering were used to redeem all outstanding shares of the Company’s 8% Series A Cumulative Redeemable Preferred Stock and related depositary shares.
The Company had access to debt and preferred equity at attractive terms and pricing during 2013, 2014 and 2015. The Company maintains a ratio of total debt to total asset value of under 50%, which allows it to obtain additional secured borrowings if necessary. And, as of December 31, 2015, amortizing fixed-rate mortgage debt with staggered maturities from 2018 to 2034, represented approximately 95.1% of the Company’s notes payable, thus minimizing refinancing risk. The Company had one fixed-rate debt maturity scheduled for 2015, which was refinanced on March 3, 2015. The floating-rate debt of the Company is comprised of a $14.8 million loan secured by Metro Pike Center and $28.0 million outstanding under the Company's revolving credit facility.
In January 2016, the Company terminated a 16,500 square foot lease at 11503 Rockville Pike and received a $3.0 million lease termination fee which will be recognized as revenue in the first quarter. The space was previously occupied by an office supply store that had vacated in mid 2014 and the lease was scheduled to expire in 2019. The termination fee revenue will be partially offset by the loss of approximately $1.0 million in rental revenue over the remainder of 2016. The Company is in preliminary negotiation with a replacement tenant. While the Company continues to plan for a mixed-use development at this site and its neighboring Metro Pike Center, the initial phases of this development are expected to be on the west side of Rockville Pike at Metro Pike Center. The Company has not committed to any timetable for commencement of construction.
Acquisition and Development Activity
A significant contributor to the Company’s recent growth in its Shopping Center portfolio has been its land acquisitions and subsequent development, redevelopment of existing centers and operating property acquisition activities. Redevelopment activities reposition the Company’s centers to be competitive in the current retailing environment. These redevelopments typically include an update of the facade, site improvements and reconfiguring tenant spaces to accommodate tenant size requirements and merchandising evolution. During the period January 1, 2013 through December 31, 2015, the Company acquired eight real estate assets. Below is a discussion of significant activities.
2015 / 2014 / 2013 Acquisitions, Developments and Redevelopments
1500, 1580, 1582, 1584 Rockville Pike
In 2014, in separate transactions, the Company purchased three properties, with approximately 57,400 square feet of retail space for an aggregate $25.2 million. The three properties are adjacent to an existing property on the east side of Rockville Pike near the Twinbrook Metro station. Combined, the four properties total 10.3 acres and are zoned for up to 1.2 million square feet of rentable mixed-use space. The Company is actively engaged in a plan for redevelopment but has not committed to any timetable for commencement of construction.
726, 730, 750 North Glebe Road
In 2014, in separate transactions, the Company purchased two adjacent properties, with approximately 18,900 square feet of retail space, on North Glebe Road in Arlington, Virginia, for an aggregate $42.8 million. In September 2015, the Company purchased an additional property on North Glebe Road, which is adjacent to the two properties acquired in 2014, for $4.0 million. Combined, the properties total 2.5 acres and are zoned for up to 550,000 square feet of rentable mixed-use space. The Company is actively engaged in a plan for redevelopment but has not committed to any timetable for commencement of construction.
11
Park Van Ness (formerly Van Ness Square)
During 2013, the Company completed negotiation of lease termination agreements with the tenants of Van Ness Square and the building became vacant in April 2013. Costs incurred related to those termination arrangements were amortized to expense using the straight-line method over the remaining terms of the leases and are included in “Predevelopment Expenses” in the Consolidated Statements of Operations. Lease termination costs and demolition costs totaled approximately $3.9 million in 2013 and $0.5 million in 2014. The Company is developing a 271-unit residential project with approximately 9,000 square feet of street-level retail, below street-level structured parking and amenities including a community room, landscaped courtyards, a fitness room and a rooftop pool and deck. Construction is expected to be substantially completed early in the second quarter of 2016. The structure comprises 11 levels, five of which are below street level. Interior finishes are nearing completion and site work is being finalized. The street level retail space is 100% leased to a grocery/gourmet food market and an upscale Italian restaurant. The total cost of the project, excluding predevelopment expense and land (which the Company has owned), is expected to be approximately $93.0 million, a portion of which is being financed with a $71.6 million construction-to-permanent loan. Costs incurred through December 31, 2015, total approximately $77.2 million, of which $45.2 million has been financed by the loan.
Item 1A. Risk Factors
RISK FACTORS
Carefully consider the following risks and all of the other information set forth in this Annual Report on Form 10-K, including the consolidated financial statements and the notes thereto. If any of the events or developments described below were actually to occur, the Company’s business, financial condition or results of operations could be adversely affected.
In this section, unless the context indicates otherwise, the terms “Company,” “we,” “us” and “our” refer to Saul Centers, Inc., and its subsidiaries, including the Operating Partnership.
Financial and economic conditions may have an adverse impact on us, our tenants’ businesses and our results of operations.
Global financial and macro-economic conditions continue to be challenging and volatile, and a prolonged continuation or worsening of such conditions, including any disruption in the capital markets, could adversely affect our business, financial condition, results of operations or real estate values, as well as the financial condition of our tenants and lenders, which may expose us to increased risks of default by these parties.
Potential consequences of a prolonged continuation or worsening of current financial and economic conditions include:
• | the financial condition of our tenants, many of which operate in the retail industry, may be adversely affected, which may result in tenant defaults under their leases due to bankruptcy, lack of liquidity, operational failures or for other reasons; |
• | the ability to borrow on terms and conditions that we find acceptable, or at all, may be limited, which could reduce our ability to pursue acquisition and development opportunities and refinance existing debt, reduce our returns from acquisition and development activities and increase our future interest expense; |
• | reduced values of our properties may limit our ability to dispose of assets at attractive prices and may reduce the ability to refinance loans; and |
• | one or more lenders under our credit facility could fail and we may not be able to replace the financing commitment of any such lenders on favorable terms, or at all. |
12
Revenue from our properties may be reduced or limited if the retail operations of our tenants are not successful.
The global and domestic economies have recently experienced a significant contraction of credit markets and resulting slowdown in business and consumer spending. We believe that consumers in recent years have cut back their discretionary spending in response to credit constraints, unemployment, a reduction in home equity values, highly volatile fuel and other commodity prices, and general economic uncertainty. Revenue from our properties depends primarily on the ability of our tenants to pay the full amount of rent due under their leases on a timely basis. The amount of rent we receive from our tenants generally will depend in part on the success of our tenants’ retail operations, making us vulnerable to general economic downturns and other conditions affecting the retail industry. Some tenants may terminate their occupancy due to an inability to operate profitably for an extended period of time, impacting the Company’s ability to maintain occupancy levels.
Any reduction in our tenants’ ability to pay base rent or percentage rent may adversely affect our financial condition and results of operations. Small business tenants and anchor retailers which lease space in the Company’s properties may experience a deterioration in their sales or other revenue, or experience a constraint on the availability of credit necessary to fund operations, which in turn may adversely impact those tenants’ ability to pay contractual base rents and operating expense recoveries. Some of our leases provide for the payment, in addition to base rent, of additional rent above the base amount according to a specified percentage of the gross sales generated by the tenants. Decreasing sales revenue by retail tenants could adversely impact the Company’s receipt of percentage rents required to be paid by tenants under certain leases.
Our ability to increase our net income depends on the success and continued presence of our shopping center “anchor” tenants and other significant tenants.
Our net income could be adversely affected in the event of a downturn in the business, or the bankruptcy or insolvency, of any anchor store or anchor tenant. Our largest shopping center anchor tenant is Giant Food, which accounted for 4.4% of our total revenue for the year ended December 31, 2015. The closing of one or more anchor stores prior to the expiration of the lease of that store or the termination of a lease by one or more of a property’s anchor tenants could adversely affect that property and result in lease terminations by, or reductions in rent from, other tenants whose leases may permit termination or rent reduction in those circumstances or whose own operations may suffer as a result. This could reduce our net income.
We may experience difficulty or delay in renewing leases or leasing vacant space.
We derive most of our revenue directly or indirectly from rent received from our tenants. We are subject to the risks that, upon expiration, leases for space in our properties may not be renewed, the space and other vacant space may not be re-leased, or the terms of renewal or re-lease, including the cost of required renovations or concessions to tenants, may be less favorable than previous lease terms. Constraints on the availability of credit to office and retail tenants, necessary to purchase and install improvements, fixtures and equipment, and fund start-up business expenses, could impact the Company’s ability to procure new tenants for spaces currently vacant in existing operating properties or properties under development. As a result, our results of operations and our net income could be reduced.
We have substantial relationships with members of the Saul Organization whose interests could conflict with the interests of other stockholders.
Influence of Officers, Directors and Significant Stockholders.
Three of our executive officers, Mr. B. F. Saul II, our President and Chief Operating Officer, J. Page Lansdale, and our Executive Vice President-Chief Legal and Administrative Officer, Christine Nicolaides Kearns, are members of the Saul Organization, and persons associated with the Saul Organization constitute five of the
13 members of our Board of Directors. In addition, as of December 31, 2015, Mr. B. F. Saul II had the potential to exercise control over 9,223,861 shares of our common stock representing 43.9% of our issued and outstanding shares of common stock. Mr. B. F. Saul II also beneficially owned, as of December 31, 2015, 7,305,758 units of the Operating Partnership. In general, these units are convertible into shares of our common stock on a one-for-one
13
basis. The ownership limitation set forth in our articles of incorporation is 39.9% in value of our issued and outstanding equity securities (which includes both common and preferred stock). As of December 31, 2015,
Mr. B. F. Saul II and members of the Saul Organization owned common stock representing approximately 37.4% in value of all our issued and outstanding equity securities. Members of the Saul Organization are permitted under our articles of incorporation to convert Operating Partnership units into shares of common stock or acquire additional shares of common stock until the Saul Organization’s actual ownership of common stock reaches 39.9% in value of our equity securities. As of December 31, 2015, 1,040,000 of the 7,305,758 units of the Operating Partnership would have been permitted to convert into additional shares of common stock, and would have resulted in Mr. B. F. Saul II and members of the Saul Organization owning common stock representing approximately 39.9% in value of all our issued and outstanding equity securities.
As a result of these relationships, members of the Saul Organization will be in a position to exercise significant influence over our affairs, which influence might not be consistent with the interests of some, or a majority, of our stockholders. Except as discussed below, we do not have any written policies or procedures for the review, approval or ratification of transactions with related persons.
Management Time.
Our Chief Executive Officer, President and Chief Operating Officer, Executive Vice President-Chief Legal and Administrative Officer and Senior Vice President-Chief Accounting Officer are also officers of various entities of the Saul Organization. Although we believe that these officers spend sufficient management time to meet their responsibilities as our officers, the amount of management time devoted to us will depend on our specific circumstances at any given point in time. As a result, in a given period, these officers may spend less than a majority of their management time on our matters. Over extended periods of time, we believe that our Chief Executive Officer will spend less than a majority of his management time on Company matters, while our President and Chief Operating Officer, Executive Vice President-Chief Legal and Administrative Officer and Senior Vice President-Chief Accounting Officer may or may not spend less than a majority of their time on our matters.
Exclusivity and Right of First Refusal Agreements.
We will acquire, develop, own and manage shopping center properties and will own and manage other commercial properties, and, subject to certain exclusivity agreements and rights of first refusal to which we are a party, the Saul Organization will continue to develop, acquire, own and manage commercial properties and own land suitable for development as, among other things, shopping centers and other commercial properties. Therefore, conflicts could develop in the allocation of acquisition and development opportunities with respect to commercial properties other than shopping centers and with respect to development sites, as well as potential tenants and other matters, between us and the Saul Organization. The agreement relating to exclusivity and the right of first refusal between us and the Saul Organization generally requires the Saul Organization to conduct its shopping center business exclusively through us and to grant us a right of first refusal to purchase commercial properties and development sites in certain market areas that become available to the Saul Organization. The Saul Organization has granted the right of first refusal to us, acting through our independent directors, in order to minimize potential conflicts with respect to commercial properties and development sites. We and the Saul Organization have entered into this agreement in order to minimize conflicts with respect to shopping centers and certain of our commercial properties.
We own real estate assets in the Twinbrook area of Rockville, Maryland, which are adjacent to real estate assets owned by the B. F. Saul Real Estate Investment Trust (the “Saul Trust”), a member of the Saul Organization. We have entered into an agreement with the Saul Trust, which originally expired on December 31, 2015, and which was extended to December 31, 2016, to share, on a pro rata basis, third-party predevelopment costs related to the planning of the future development of the adjacent sites. Conflicts with respect to payments and allocations of costs may arise under the agreement.
Shared Services.
We share with the Saul Organization certain ancillary functions, such as computer and payroll services, benefits administration and in-house legal services. The terms of all sharing arrangements, including payments
14
related thereto, are reviewed periodically by our Audit Committee, which is comprised solely of independent directors. Included in our general and administrative expenses or capitalized to specific development projects, for the year ended December 31, 2015, are charges totaling $8.2 million, related to such shared services, which included rental payments for the Company’s headquarters lease, which were billed by the Saul Organization. Although we believe that the amounts allocated to us for such shared services represent a fair allocation between us and the Saul Organization, we have not obtained a third party appraisal of the value of these services.
The B. F. Saul Insurance Agency of Maryland, Inc., a subsidiary of the B. F. Saul Company and a member of the Saul Organization, is a general insurance agency that receives commissions and counter-signature fees in connection with our insurance program. Such commissions and fees amounted to approximately $443,500 for the year ended December 31, 2015.
Related Party Rents.
We sublease space for our corporate headquarters from a member of the Saul Organization, the building of which is owned by another member of the Saul Organization. The lease commenced in March 2002, expires in March 2017, and provides for base rent escalated at 3% per year, with payment of a pro-rata share of operating expenses over a base year amount. The Company and the Saul Organization entered into a Shared Services Agreement whereby each party pays a portion of the total rental payments based on a percentage proportionate to the number of employees employed by each party. The Company’s rent expense for the year ended December 31, 2015 was $904,900. Although the Company believes that this lease has terms comparable to what would have been obtained from a third party landlord, it did not seek bid proposals from any independent third parties when entering into its new corporate headquarters lease.
Conflicts Based on Individual Tax Considerations.
The tax basis of members of the Saul Organization in our portfolio properties which were contributed to certain partnerships at the time of our initial public offering in 1993 was substantially less than the fair market value thereof at the time of their contribution. In the event of our disposition of such properties, a disproportionately large share of the gain for federal income tax purposes would be allocated to members of the Saul Organization. In addition, future reductions of the level of our debt, or future releases of the guarantees or indemnities with respect thereto by members of the Saul Organization, would cause members of the Saul Organization to be considered, for federal income tax purposes, to have received constructive distributions. Depending on the overall level of debt and other factors, these distributions could be in excess of the Saul Organization’s bases in their Partnership units, in which case such excess constructive distributions would be taxable.
Consequently, it is in the interests of the Saul Organization that we continue to hold the contributed portfolio properties, that a portion of our debt remains outstanding or is refinanced and that the Saul Organization guarantees and indemnities remain in place, in order to defer the taxable gain to members of the Saul Organization. Therefore, the Saul Organization may seek to cause us to retain the contributed portfolio properties, and to refrain from reducing our debt or releasing the Saul Organization guarantees and indemnities, even when such action may not be in the interests of some, or a majority, of our stockholders. In order to minimize these conflicts, decisions as to sales of the portfolio properties, or any refinancing, repayment or release of guarantees and indemnities with respect to our debt, will be made by the independent directors.
Ability to Block Certain Actions.
Under applicable law and the limited partnership agreement of the Operating Partnership, consent of the limited partners is required to permit certain actions, including the sale of all or substantially all of the Operating Partnership’s assets. Therefore, members of the Saul Organization, through their status as limited partners in the Operating Partnership, could prevent the taking of any such actions, even if they were in the interests of some, or a majority, of our stockholders.
15
The amount of debt we have and the restrictions imposed by that debt could adversely affect our business and financial condition.
As of December 31, 2015, we had approximately $875.2 million of debt outstanding, $832.4 million of which was long-term fixed-rate debt secured by 35 of our properties and $42.8 million of which was variable-rate debt due under one secured bank loan and our revolving credit facility.
We currently have a general policy of limiting our borrowings to 50 percent of asset value, i.e., the value of our portfolio, as determined by our Board of Directors by reference to the aggregate annualized cash flow from our portfolio. Our organizational documents contain no limitation on the amount or percentage of indebtedness which we may incur. Therefore, the Board of Directors could alter or eliminate the current limitation on borrowing at any time. If our debt capitalization policy were changed, we could increase our leverage, resulting in an increase in debt service that could adversely affect our operating cash flow and our ability to make expected distributions to stockholders, and in an increased risk of default on our obligations.
We have established our debt capitalization policy relative to asset value, which is computed by reference to the aggregate annualized cash flow from the properties in our portfolio rather than relative to book value. We have used a measure tied to cash flow because we believe that the book value of our portfolio properties, which is the depreciated historical cost of the properties, does not accurately reflect our ability to borrow. Asset value, however, is somewhat more variable than book value, and may not at all times reflect the fair market value of the underlying properties.
The amount of our debt outstanding from time to time could have important consequences to our stockholders. For example, it could:
• | require us to dedicate a substantial portion of our cash flow from operations to payments on our debt, thereby reducing funds available for operations, property acquisitions and other appropriate business opportunities that may arise in the future; |
• | limit our ability to obtain any additional financing we may need in the future for working capital, debt refinancing, capital expenditures, acquisitions, development or other general corporate purposes; |
• | make it difficult to satisfy our debt service requirements; |
• | limit our ability to make distributions on our outstanding common and preferred stock; |
• | require us to dedicate increased amounts of our cash flow from operations to payments on our variable rate, unhedged debt if interest rates rise; |
• | limit our flexibility in planning for, or reacting to, changes in our business and the factors that affect the profitability of our business, which may place us at a disadvantage compared to competitors with less debt or debt with less restrictive terms; and |
• | limit our ability to obtain any additional financing we may need in the future for working capital, debt refinancing, capital expenditures, acquisitions, development or other general corporate purposes. |
Our ability to make scheduled payments of the principal of, to pay interest on, or to refinance, our indebtedness will depend primarily on our future performance, which to a certain extent is subject to economic, financial, competitive and other factors described in this section. If we are unable to generate sufficient cash flow from our business in the future to service our debt or meet our other cash needs, we may be required to refinance all or a portion of our existing debt, sell assets or obtain additional financing to meet our debt obligations and other cash needs. Our ability to refinance, sell assets or obtain additional financing may not be possible on terms that we would find acceptable.
We are obligated to comply with financial and other covenants in our debt that could restrict our operating activities, and the failure to comply could result in defaults that accelerate the payment under our debt.
Our secured debt generally contains customary covenants, including, among others, provisions:
• | relating to the maintenance of the property securing the debt; |
16
• | restricting our ability to assign or further encumber the properties securing the debt; and |
• | restricting our ability to enter into certain new leases or to amend or modify certain existing leases without obtaining consent of the lenders. |
Our unsecured debt generally contains various restrictive covenants. The covenants in our unsecured debt include, among others, provisions restricting our ability to:
• | incur additional unsecured debt; |
• | guarantee additional debt; |
• | make certain distributions, investments and other restricted payments, including distribution payments on our outstanding stock; |
• | create certain liens; |
• | increase our overall secured and unsecured borrowing beyond certain levels; and |
• | consolidate, merge or sell all or substantially all of our assets. |
Our ability to meet some of the covenants in our debt, including covenants related to the condition of the property or payment of real estate taxes, may be dependent on the performance by our tenants under their leases.
In addition, our line of credit requires us and our subsidiaries to satisfy financial covenants. The material financial covenants require us, on a consolidated basis, to:
• | maintain tangible net worth, as defined in the loan agreement, of at least $542.1 million plus 80% of the Company’s net equity proceeds received after March 2014; |
• | limit the amount of debt as a percentage of gross asset value, as defined in the loan agreement, to less than 60% (leverage ratio); |
• | limit the amount of debt so that interest coverage will exceed 2.0x on a trailing four-quarter basis (interest expense coverage); and |
• | limit the amount of debt so that interest, scheduled principal amortization and preferred dividend coverage exceeds 1.3x on a trailing four-quarter basis (fixed charge coverage). |
As of December 31, 2015, we were in compliance with all such covenants. If we were to breach any of our debt covenants and did not cure the breach within any applicable cure period, our lenders could require us to repay the debt immediately, and, if the debt is secured, could immediately begin proceedings to take possession of the property securing the loan. Some of our debt arrangements are cross-defaulted, which means that the lenders under those debt arrangements can put us in default and require immediate repayment of their debt if we breach and fail to cure a covenant under certain of our other debt obligations. As a result, any default under our debt covenants could have an adverse effect on our financial condition, our results of operations, our ability to meet our obligations and the market value of our shares.
Our development activities are inherently risky.
The ground-up development of improvements on real property, which is different from the renovation and redevelopment of existing improvements, presents substantial risks. In addition to the risks associated with real estate investment in general as described elsewhere, the risks associated with our remaining development activities include:
• | significant time lag between commencement and completion subjects us to greater risks due to fluctuation in the general economy; |
• | failure or inability to obtain construction or permanent financing on favorable terms; |
• | expenditure of money and time on projects that may never be completed; |
• | inability to achieve projected rental rates or anticipated pace of lease-up; |
• | higher-than-estimated construction costs, including labor and material costs; and |
17
• | possible delay in completion of the project because of a number of factors, including weather, labor disruptions, construction delays or delays in receipt of zoning or other regulatory approvals, or acts of God (such as fires, earthquakes or floods). |
Redevelopments and acquisitions may fail to perform as expected.
Our investment strategy includes the redevelopment and acquisition of community and neighborhood shopping centers that are anchored by supermarkets, drugstores or high volume, value-oriented retailers that provide consumer necessities. The redevelopment and acquisition of properties entails risks that include the following, any of which could adversely affect our results of operations and our ability to meet our obligations:
• | our estimate of the costs to improve, reposition or redevelop a property may prove to be too low, and, as a result, the property may fail to achieve the returns we have projected, either temporarily or for a longer time; |
• | we may not be able to identify suitable properties to acquire or may be unable to complete the acquisition of the properties we identify; |
• | we may not be able to integrate new developments or acquisitions into our existing operations successfully; |
• | properties we redevelop or acquire may fail to achieve the occupancy or rental rates we project at the time we make the decision to invest, which may result in the properties’ failure to achieve the returns we projected; |
• | our pre-acquisition evaluation of the physical condition of each new investment may not detect certain defects or identify necessary repairs until after the property is acquired, which could significantly increase our total acquisition costs; and |
• | our investigation of a property or building prior to our acquisition, and any representations we may receive from the seller, may fail to reveal various liabilities, which could reduce the cash flow from the property or increase our acquisition cost. |
Our ability to grow will be limited if we cannot obtain additional capital.
Our growth strategy includes the redevelopment of properties we already own and the acquisition of additional properties. Because we are required to distribute to our stockholders at least 90% of our taxable income each year to continue to qualify as a real estate investment trust, or REIT, for federal income tax purposes, in addition to our undistributed operating cash flow, we rely upon the availability of debt or equity capital to fund our growth, which financing may or may not be available on favorable terms or at all. The debt could include mortgage loans from third parties or the sale of debt securities. Equity capital could include our common stock or preferred stock. Additional financing, refinancing or other capital may not be available in the amounts we desire or on favorable terms. Our access to debt or equity capital depends on a number of factors, including the general state of the capital markets, the market’s perception of our growth potential, our ability to pay dividends, and our current and potential future earnings. Depending on the outcome of these factors, we could experience delay or difficulty in implementing our growth strategy on satisfactory terms, or be unable to implement this strategy.
Our performance and value are subject to general risks associated with the real estate industry.
Our economic performance and the value of our real estate assets, and, consequently, the value of our investments, are subject to the risk that if our properties do not generate revenue sufficient to meet our operating expenses, including debt service and capital expenditures, our cash flow and ability to pay distributions to our stockholders will be adversely affected. As a real estate company, we are susceptible to the following real estate industry risks:
• | economic downturns in the areas where our properties are located; |
• | adverse changes in local real estate market conditions, such as oversupply or reduction in demand; |
• | changes in tenant preferences that reduce the attractiveness of our properties to tenants; |
• | zoning or regulatory restrictions; |
18
• | decreases in market rental rates; |
• | weather conditions that may increase energy costs and other operating expenses; |
• | costs associated with the need to periodically repair, renovate and re-lease space; and |
• | increases in the cost of adequate maintenance, insurance and other operating costs, including real estate taxes, associated with one or more properties, which may occur even when circumstances such as market factors and competition cause a reduction in revenue from one or more properties, although real estate taxes typically do not increase upon a reduction in such revenue. |
Many real estate costs are fixed, even if income from our properties decreases.
Our financial results depend primarily on leasing space in our properties to tenants on terms favorable to us. Costs associated with real estate investment, such as real estate taxes and maintenance costs, generally are not reduced even when a property is not fully occupied, rental rates decrease, or other circumstances cause a reduction in income from the investment. As a result, cash flow from the operations of our properties may be reduced if a tenant does not pay its rent or we are unable to rent our properties on favorable terms. Under those circumstances, we might not be able to enforce our rights as landlord without delays, and may incur substantial legal costs. Additionally, new properties that we may acquire or develop may not produce any significant revenue immediately, and the cash flow from existing operations may be insufficient to pay the operating expenses and debt service associated with that property until the property is fully leased.
Competition may limit our ability to purchase new properties and generate sufficient income from tenants.
Numerous commercial developers and real estate companies compete with us in seeking tenants for properties and properties for acquisition. This competition may:
• | reduce properties available for acquisition; |
• | increase the cost of properties available for acquisition; |
• | reduce rents payable to us; |
• | interfere with our ability to attract and retain tenants; |
• | lead to increased vacancy rates at our properties; and |
• | adversely affect our ability to minimize expenses of operation. |
Retailers at our shopping center properties also face increasing competition from outlet stores, discount shopping clubs, and other forms of marketing of goods, such as direct mail, internet marketing and telemarketing. This competition may reduce percentage rents payable to us and may contribute to lease defaults and insolvency of tenants. If we are unable to continue to attract appropriate retail tenants to our properties, or to purchase new properties in our geographic markets, it could materially affect our ability to generate net income, service our debt and make distributions to our stockholders.
We may be unable to sell properties when appropriate because real estate investments are illiquid.
Real estate investments generally cannot be sold quickly. In addition, there are some limitations under federal income tax laws applicable to real estate and to REITs in particular that may limit our ability to sell our assets. We may not be able to alter our portfolio promptly in response to changes in economic or other conditions. Our inability to respond quickly to adverse changes in the performance of our investments could have an adverse effect on our ability to meet our obligations and make distributions to our stockholders.
Our insurance coverage on our properties may be inadequate.
We carry comprehensive insurance on all of our properties, including insurance for liability, earthquake, fire, flood, terrorism and rental loss. These policies contain coverage limitations. We believe this coverage is of the type and amount customarily obtained for or by an owner of real property assets. We intend to obtain similar insurance coverage on subsequently acquired properties.
19
As a consequence of the September 11, 2001 terrorist attacks and other significant losses incurred by the insurance industry, the availability of insurance coverage has decreased and the prices for insurance have increased. As a result, we may be unable to renew or duplicate our current insurance coverage in adequate amounts or at reasonable prices. In addition, insurance companies may no longer offer coverage against certain types of losses, such as losses due to terrorist acts and toxic mold, or, if offered, the expense of obtaining these types of insurance may not be justified. We therefore may cease to have insurance coverage against certain types of losses and/or there may be decreases in the limits of insurance available. If an uninsured loss or a loss in excess of our insured limits occurs, we could lose all or a portion of the capital we have invested in a property, as well as the anticipated future revenue from the property, but still remain obligated for any mortgage debt or other financial obligations related to the property. Material losses in excess of insurance proceeds may occur in the future. Also, due to inflation, changes in codes and ordinances, environmental considerations and other factors, it may not be feasible to use insurance proceeds to replace a building after it has been damaged or destroyed. Events such as these could adversely affect our results of operations and our ability to meet our obligations, including distributions to our stockholders.
Environmental laws and regulations could reduce the value or profitability of our properties.
All real property and the operations conducted on real property are subject to federal, state and local laws, ordinances and regulations relating to hazardous materials, environmental protection and human health and safety. Under various federal, state and local laws, ordinances and regulations, we and our tenants may be required to investigate and clean up certain hazardous or toxic substances released on or in properties we own or operate, and also may be required to pay other costs relating to hazardous or toxic substances. This liability may be imposed without regard to whether we or our tenants knew about the release of these types of substances or were responsible for their release. The presence of contamination or the failure to properly remediate contamination at any of our properties may adversely affect our ability to sell or lease those properties or to borrow using those properties as collateral. The costs or liabilities could exceed the value of the affected real estate. We are not aware of any environmental condition with respect to any of our properties that management believes would have a material adverse effect on our business, assets or results of operations taken as a whole. The uses of any of our properties prior to our acquisition of the property and the building materials used at the property are among the property-specific factors that will affect how the environmental laws are applied to our properties. If we are subject to any material environmental liabilities, the liabilities could adversely affect our results of operations and our ability to meet our obligations.
We cannot predict what other environmental legislation or regulations will be enacted in the future, how existing or future laws or regulations will be administered or interpreted or what environmental conditions may be found to exist on the properties in the future. Compliance with existing and new laws and regulations may require us or our tenants to spend funds to remedy environmental problems. Our tenants, like many of their competitors, have incurred, and will continue to incur, capital and operating expenditures and other costs associated with complying with these laws and regulations, which will adversely affect their potential profitability. Generally, our tenants must comply with environmental laws and meet remediation requirements. Our leases typically impose obligations on our tenants to indemnify us from any compliance costs we may incur as a result of the environmental conditions on the property caused by the tenant. If a tenant fails to or cannot comply, we could be forced to pay these costs. If not addressed, environmental conditions could impair our ability to sell or re-lease the affected properties in the future or result in lower sales prices or rent payments.
The Americans with Disabilities Act of 1990 (the “ADA”) could require us to take remedial steps with respect to newly acquired properties.
The properties, as commercial facilities, are required to comply with Title III of the ADA. Investigation of a property may reveal non-compliance with the ADA. The requirements of the ADA, or of other federal, state or local laws, also may change in the future and restrict further renovations of our properties with respect to access for disabled persons. Future compliance with the ADA may require expensive changes to the properties.
20
The revenue generated by our tenants could be negatively affected by various federal, state and local laws to which they are subject.
We and our tenants are subject to a wide range of federal, state and local laws and regulations, such as local licensing requirements, consumer protection laws and state and local fire, life-safety and similar requirements that affect the use of the properties. The leases typically require that each tenant comply with all regulations. Failure to comply could result in fines by governmental authorities, awards of damages to private litigants, or restrictions on the ability to conduct business on such properties. Non-compliance of this sort could reduce our revenue from a tenant, could require us to pay penalties or fines relating to any non-compliance, and could adversely affect our ability to sell or lease a property.
Failure to qualify as a REIT for federal income tax purposes would cause us to be taxed as a corporation, which would substantially reduce funds available for payment of distributions.
We believe that we are organized and qualified as a REIT, and currently intend to operate in a manner that will allow us to continue to qualify as a REIT for federal income tax purposes under the Code. However, the IRS could successfully assert that we are not qualified as such. In addition, we may not remain qualified as a REIT in the future. Qualification as a REIT involves the application of highly technical and complex Code provisions. The complexity of these provisions and of the applicable income tax regulations that have been issued under the Code by the United States Department of Treasury is greater in the case of a REIT that holds its assets in partnership form. Certain facts and circumstances not entirely within our control may affect our ability to qualify as a REIT. For example, in order to qualify as a REIT, at least 95% of our gross income in any year must be derived from qualifying rents and other income. Satisfying this requirement could be difficult, for example, if defaults by tenants were to reduce the amount of income from qualifying rents. Also, we must make annual distributions to stockholders of at least 90% of our net taxable income (excluding capital gains). In addition, new legislation, new regulations, new administrative interpretations or new court decisions may significantly change the tax laws with respect to qualification as a REIT or the federal income tax consequences of such qualification. If we fail to qualify as a REIT:
• | we would not be allowed a deduction for dividend distributions to stockholders in computing taxable income; |
• | we would be subject to federal income tax at regular corporate rates; |
• | we could be subject to the federal alternative minimum tax; |
• | unless we are entitled to relief under specific statutory provisions, we could not elect to be taxed as a REIT for four taxable years following the year during which we were disqualified; |
• | we could be required to pay significant income taxes, which would substantially reduce the funds available for investment and for distribution to our stockholders for each year in which we failed to qualify; and |
• | we would no longer be required by law to make any distributions to our stockholders. |
We believe that the Operating Partnership is treated as a partnership, and not as a corporation, for federal income tax purposes. If the IRS were to challenge successfully the status of the Operating Partnership as a partnership for federal income tax purposes:
• | the Operating Partnership would be taxed as a corporation; |
• | we would cease to qualify as a REIT for federal income tax purposes; and |
• | the amount of cash available for distribution to our stockholders would be substantially reduced. |
We may be required to incur additional debt to qualify as a REIT.
As a REIT, we must make annual distributions to stockholders of at least 90% of our REIT taxable income. We are subject to income tax on amounts of undistributed REIT taxable income and net capital gain. In addition, we would be subject to a 4% excise tax if we fail to distribute sufficient income to meet a minimum distribution test based on our ordinary income, capital gain and aggregate undistributed income from prior years. We
21
intend to make distributions to stockholders to comply with the Code’s distribution provisions and to avoid federal income and excise tax. We may need to borrow funds to meet our distribution requirements because:
• | our income may not be matched by our related expenses at the time the income is considered received for purposes of determining taxable income; and |
• | non-deductible capital expenditures or debt service requirements may reduce available cash but not taxable income. |
In these circumstances, we might have to borrow funds on unfavorable terms and even if our management believes the market conditions make borrowing financially unattractive.
The structure of our leases may jeopardize our ability to qualify as a REIT.
If the IRS were to challenge successfully the characterization of one or more of our leases of properties as leases for federal income tax purposes, the Operating Partnership would not be treated as the owner of the related property or properties for federal income tax purposes. As a result, the Operating Partnership would lose tax depreciation and cost recovery deductions with respect to one or more of our properties, which in turn could cause us to fail to qualify as a REIT. Although we will use our best efforts to structure any leasing transaction for properties acquired in the future so the lease will be characterized as a lease and the Operating Partnership will be treated as the owner of the property for federal income tax purposes, we will not seek an advance ruling from the IRS and do not intend to seek an opinion of counsel that the Operating Partnership will be treated as the owner of any leased properties for federal income tax purposes. Thus, the IRS could successfully assert that future leases will not be treated as leases for federal income tax purposes, which could adversely affect our financial condition and results of operations.
To maintain our status as a REIT, we limit the amount of shares any one stockholder can own.
The Code imposes certain limitations on the ownership of the stock of a REIT. For example, not more than 50% in value of our outstanding shares of capital stock may be owned, actually or constructively, by five or fewer individuals (as defined in the Code). To protect our REIT status, our articles of incorporation restrict beneficial and constructive ownership (defined by reference to various Code provisions) to no more than 2.5% in value of our issued and outstanding equity securities by any single stockholder with the exception of members of the Saul Organization, who are restricted to beneficial and constructive ownership of no more than 39.9% in value of our issued and outstanding equity securities.
The constructive ownership rules are complex. Shares of our capital stock owned, actually or constructively, by a group of related individuals and/or entities may be treated as constructively owned by one of those individuals or entities. As a result, the acquisition of less than 2.5% or 39.9% in value of our issued and outstanding equity securities, by an individual or entity could cause that individual or entity (or another) to own constructively more than 2.5% or 39.9% in value of the outstanding stock. If that happened, either the transfer or ownership would be void or the shares would be transferred to a charitable trust and then sold to someone who can own those shares without violating the respective ownership limit.
As of December 31, 2015, Mr. B. F. Saul II and members of the Saul Organization owned common stock representing approximately 37.4% in value of all our issued and outstanding equity securities. In addition, members of the Saul Organization beneficially owned Operating Partnership units that are, in general, convertible into our common stock on a one-for-one basis. Members of the Saul Organization are permitted under our articles of incorporation to convert Operating Partnership units into shares of common stock or acquire additional shares of common stock until the Saul Organization’s actual ownership of common stock reaches 39.9% in value of our equity securities.
The Board of Directors may waive these restrictions on a case-by-case basis. The Board has authorized the Company to grant waivers to look-through entities, such as mutual funds, in which shares of equity stock owned by the entity are treated as owned proportionally by individuals who are the beneficial owners of the entity. Even though these entities may own stock in excess of the 2.5% ownership limit, no individual beneficially or constructively would own more than 2.5%. The Board of Directors has agreed to waive the ownership limit with
22
respect to certain mutual funds and similar investors. In addition, the Board of Directors has agreed to waive the ownership limit with respect to certain bank pledgees of shares of our common stock and units issued by the Operating Partnership and held by members of the Saul Organization.
The ownership restrictions may delay, defer or prevent a transaction or a change of our control that might involve a premium price for our equity stock or otherwise be in the stockholders’ best interest.
We cannot assure you we will continue to pay dividends at historical rates.
Our ability to continue to pay dividends on our common stock at historical rates or to increase our common stock dividend rate will depend on a number of factors, including, among others, the following:
• | our financial condition and results of future operations; |
• | the performance of lease terms by tenants; |
• | the terms of our loan covenants; and |
• | our ability to acquire, finance, develop or redevelop and lease additional properties at attractive rates. |
If we do not maintain or increase the dividend rate on our common stock, it could have an adverse effect on the market price of our common stock and other securities. Payment of dividends on our common stock may be subject to payment in full of the dividends on any preferred stock or depositary shares and payment of interest on any debt securities we may offer.
Certain tax and anti-takeover provisions of our articles of incorporation and bylaws may inhibit a change of our control.
Certain provisions contained in our articles of incorporation and bylaws and the Maryland General Corporation Law may discourage a third party from making a tender offer or acquisition proposal to us. If this were to happen, it could delay, deter or prevent a change in control or the removal of existing management. These provisions also may delay or prevent the stockholders from receiving a premium for their stock over then-prevailing market prices. These provisions include:
• | the REIT ownership limit described above; |
• | authorization of the issuance of our preferred stock with powers, preferences or rights to be determined by the Board of Directors; |
• | a staggered, fixed-size Board of Directors consisting of three classes of directors; |
• | special meetings of our stockholders may be called only by the Chairman of the Board, the president, by a majority of the directors or by stockholders possessing no less than 25% of all the votes entitled to be cast at the meeting; |
• | the Board of Directors, without a stockholder vote, can classify or reclassify unissued shares of preferred stock; |
• | a member of the Board of Directors may be removed only for cause upon the affirmative vote of 75% of the Board of Directors or 75% of the then-outstanding capital stock; |
• | advance notice requirements for proposals to be presented at stockholder meetings; and |
• | the terms of our articles of incorporation regarding business combinations and control share acquisitions. |
We face risks relating to cybersecurity attacks that could cause loss of confidential information and other business disruptions.
We rely extensively on computer systems to process transactions and manage our business, and our business is at risk from and may be impacted by cybersecurity attacks. These could include attempts to gain unauthorized access to our data and computer systems. Attacks can be both individual and/or highly organized attempts organized by very sophisticated hacking organizations. We employ a number of measures to prevent, detect and mitigate these threats; however, there is no guarantee such efforts will be successful in preventing a
23
cybersecurity attack. A cybersecurity attack could compromise the confidential information of our employees, tenants and vendors. A successful attack could disrupt and otherwise adversely affect our business operations.
We may amend or revise our business policies without your approval.
Our Board of Directors may amend or revise our operating policies without stockholder approval. Our investment, financing and borrowing policies and policies with respect to all other activities, such as growth, debt, capitalization and operations, are determined by the Board of Directors or those committees or officers to whom the Board of Directors has delegated that authority. The Board of Directors may amend or revise these policies at any time and from time to time at its discretion. A change in these policies could adversely affect our financial condition and results of operations, and the market price of our securities.
Item 1B. Unresolved Staff Comments
We have received no written comments from the Securities and Exchange Commission staff regarding our periodic or current reports in the 180 days preceding December 31, 2015 that remain unresolved.
Item 2. Properties
Overview
As of December 31, 2015, the Company is the owner, developer and operator of a real estate portfolio composed of 56 operating properties, totaling approximately 9.3 million square feet of gross leasable area (“GLA”), and three development parcels. The properties are located primarily in the Washington, D.C./Baltimore, Maryland metropolitan area. The operating property portfolio is composed of 50 neighborhood and community Shopping Centers, and six predominantly Mixed-Use Properties totaling approximately 7.9 million and 1.4 million square feet of GLA, respectively. No single property accounted for more than 6.5% of the total gross leasable area. A majority of the Shopping Centers are anchored by several major tenants. Thirty-one of the Shopping Centers were anchored by a grocery store and offer primarily day-to-day necessities and services. Two retail tenants, Giant Food (4.4%), a tenant at nine Shopping Centers and Albertson's/Safeway (2.7%), a tenant at nine Shopping Centers, individually accounted for 2.5% or more of the Company’s total revenue for the year ended December 31, 2015.
The following table sets forth average annualized base rent per square foot and average annualized effective rent per square foot for the Company's Commercial properties (all properties except for the Clarendon Center apartments). For purposes of this table, annualized effective rent is annualized base rent minus amortized tenant improvements and amortized leasing commissions.
Year ended December 31, | ||||||||||||||||||||
2015 | 2014 | 2013 | 2012 | 2011 | ||||||||||||||||
Base rent | $ | 18.52 | $ | 18.07 | $ | 17.77 | $ | 17.05 | $ | 15.81 | ||||||||||
Effective rent | $ | 16.81 | $ | 16.45 | $ | 15.98 | $ | 15.47 | $ | 14.42 | ||||||||||
The Company expects to hold its properties as long-term investments, and it has no maximum period for retention of any investment. It plans to selectively acquire additional income-producing properties and to expand, renovate, and improve its properties when circumstances warrant. See “Item 1. Business—Operating Strategies” and “Business—Capital Policies.”
The Shopping Centers
Community and neighborhood shopping centers typically are anchored by one or more grocery stores, discount department stores or drug stores. These anchors offer day-to-day necessities rather than apparel and luxury goods and, therefore, generate consistent local traffic. By contrast, regional malls generally are larger and typically are anchored by one or more full-service department stores.
In general, the Shopping Centers are seasoned community and neighborhood shopping centers located in well established, highly developed, densely populated, middle and upper income areas. The 2015 average
24
estimated population within a one- and three-mile radius of the Shopping Centers is approximately 16,000 and 96,600, respectively. The 2015 average household income within the one- and three-mile radius of the Shopping Centers is approximately $108,000 and $111,500, respectively, compared to a national average of $74,700. Because the Shopping Centers generally are located in highly developed areas, management believes that there is little likelihood that significant numbers of competing centers will be developed in the future.
The Shopping Center properties range in size from approximately 19,000 to 573,500 square feet of GLA, with six in excess of 300,000 square feet, and average approximately 157,900 square feet. A majority of the Shopping Centers are anchored by several major tenants and other tenants offering primarily day-to-day necessities and services. Thirty-one of the Shopping Centers are anchored by a grocery store.
Lease Expirations of Shopping Center Properties
The following table sets forth, by year of expiration, the aggregate amount of base rent and leasable area for leases in place at the Shopping Centers that the Company owned as of December 31, 2015, for each of the next ten years beginning with 2016, assuming that none of the tenants exercise renewal options and excluding an aggregate of 366,014 square feet of unleased space, which represented 4.6% of the GLA of the Shopping Centers as of December 31, 2015.
Lease Expirations of Shopping Center Properties
Year of Lease Expiration | Leasable Area Represented by Expiring Leases | Percentage of Leasable Area Represented by Expiring Leases | Annual Base Rent Under Expiring Leases (1) | Percentage of Annual Base Rent Under Expiring Leases | Annual Base Rent per Square Foot | ||||||||||||||
2016 | 862,159 | sf | 10.9 | % | $ | 13,185,935 | 10.5 | % | $ | 15.29 | |||||||||
2017 | 954,294 | 12.1 | % | 17,847,010 | 14.3 | % | 18.70 | ||||||||||||
2018 | 1,042,451 | 13.2 | % | 17,824,260 | 14.3 | % | 17.10 | ||||||||||||
2019 | 974,646 | 12.3 | % | 18,118,121 | 14.5 | % | 18.59 | ||||||||||||
2020 | 874,365 | 11.1 | % | 15,435,563 | 12.3 | % | 17.65 | ||||||||||||
2021 | 406,215 | 5.2 | % | 6,855,743 | 5.5 | % | 16.88 | ||||||||||||
2022 | 575,845 | 7.3 | % | 7,503,061 | 6.0 | % | 13.03 | ||||||||||||
2023 | 404,938 | 5.1 | % | 6,315,452 | 5.1 | % | 15.60 | ||||||||||||
2024 | 214,392 | 2.7 | % | 4,699,019 | 3.8 | % | 21.92 | ||||||||||||
2025 | 194,297 | 2.5 | % | 4,363,831 | 3.5 | % | 22.46 | ||||||||||||
Thereafter | 1,026,883 | 13.0 | % | 12,758,517 | 10.2 | % | 12.42 | ||||||||||||
Total | 7,530,485 | sf | 95.4 | % | $ | 124,906,512 | 100.0 | % | 16.59 | ||||||||||
(1) | Calculated using annualized contractual base rent payable as of December 31, 2015 for the expiring GLA, excluding expenses payable by or reimbursable from tenants. |
The Mixed-Use Properties
Five of the six Mixed-Use Properties are located in the Washington, D.C. metropolitan area and contain an aggregate GLA of approximately 1.3 million square feet, comprised of 1.0 million and 96.4 thousand square feet of office and retail space, respectively, and 244 apartments. The sixth Mixed-Use Property is located in Tulsa, Oklahoma and contains GLA of 197,000 square feet. The Mixed-Use Properties represent three distinct styles of facilities, are located in differing commercial environments with distinctive demographic characteristics, and are geographically removed from one another. Accordingly, management believes that the Washington, D.C. area
25
mixed-use properties compete for tenants in different commercial and geographic sub-markets of the metropolitan Washington, D.C. market and do not compete with one another.
601 Pennsylvania Avenue is a nine-story, 227,000 square foot Class A office building (with a small amount of street level retail space) built in 1986 and situated in a prime location in downtown Washington, D.C. Washington Square at Old Town is a 236,000 square foot Class A mixed-use office/retail complex completed in 2000 and located on a two-acre site along Alexandria’s main street, North Washington Street, in historic Old Town Alexandria, Virginia. Avenel Business Park is a 391,000 square foot research park located in the suburban Maryland, I-270 biotech corridor. The business park consists of twelve one-story buildings built in six phases, completed between 1981 and 2000. Clarendon Center, constructed in 2010, is a mixed-use Class A commercial and residential project located at the Clarendon Metro station in Arlington County, Virginia, which contains 171,600 square feet of office, 41,700 square feet of retail and 244 apartment units.
Crosstown Business Center is a 197,000 square foot flex office/warehouse property located in Tulsa, Oklahoma, which was designated as held for sale as of December 31, 2015. The property is located in close proximity to Tulsa’s international airport and major roadways and has attracted tenants requiring light industrial and distribution facilities.
During 2013, the Company completed negotiation of lease termination agreements with the tenants of Van Ness Square and the building became vacant in April 2013. Costs incurred related to those termination arrangements were amortized to expense using the straight-line method over the remaining terms of the leases and are included in “Predevelopment Expenses” in the Consolidated Statements of Operations. Lease termination costs and demolition costs totaled approximately $3.9 million in 2013 and $0.5 million in 2014. The Company is developing a 271-unit residential project with approximately 9,000 square feet of street-level retail, below street-level structured parking and amenities including a community room, landscaped courtyards, a fitness room and a rooftop pool and deck. Construction is expected to be substantially completed early in the second quarter of 2016. The structure comprises 11 levels, five of which are below street level. Interior finishes are nearing completion and site work is being finalized. The street level retail space is 100% leased to a grocery/gourmet food market and an upscale Italian restaurant. The total cost of the project, excluding predevelopment expense and land (which the Company has owned), is expected to be approximately $93.0 million, a portion of which is being financed with a $71.6 million construction-to-permanent loan. Costs incurred through December 31, 2015, total approximately $77.2 million, of which $45.2 million has been financed by the loan.
Lease Expirations of Mixed-Use Properties
The following table sets forth, by year of expiration, the aggregate amount of base rent and leasable area for commercial leases in place at the Mixed-Use Properties that the Company owned as of December 31, 2015, for each of the next ten years beginning with 2016, assuming that none of the tenants exercise renewal options and excluding an aggregate of 113,824 square feet of unleased office and retail space, which represented 9.0% of the GLA of the commercial space within the Mixed-Use Properties as of December 31, 2015.
26
Commercial Lease Expirations of Mixed-Use Properties
Year of Lease Expiration | Leasable Area Represented by Expiring Leases | Percentage of Leasable Area Represented by Expiring Leases | Annual Base Rent Under Expiring Leases (1) | Percentage of Annual Base Rent Under Expiring Leases | Annual Base Rent per Square Foot | ||||||||||||||
2016 | 173,036 | sf | 13.7 | % | $ | 2,673,815 | 7.5 | % | $ | 15.45 | |||||||||
2017 | 67,184 | 5.3 | % | 1,138,562 | 3.2 | % | 16.95 | ||||||||||||
2018 | 91,840 | 7.3 | % | 3,099,657 | 8.7 | % | 33.75 | ||||||||||||
2019 | 111,873 | 8.8 | % | 5,137,851 | 14.4 | % | 45.93 | ||||||||||||
2020 | 194,818 | 15.4 | % | 3,347,767 | 9.4 | % | 17.18 | ||||||||||||
2021 | 116,731 | 9.2 | % | 5,336,771 | 14.9 | % | 45.72 | ||||||||||||
2022 | 105,006 | 8.3 | % | 3,142,169 | 8.8 | % | 29.92 | ||||||||||||
2023 | 112,546 | 8.9 | % | 5,748,206 | 16.1 | % | 51.07 | ||||||||||||
2024 | 36,744 | 2.9 | % | 2,201,352 | 6.2 | % | 59.91 | ||||||||||||
2025 | 22,235 | 1.8 | % | 530,175 | 1.5 | % | 23.84 | ||||||||||||
Thereafter | 118,651 | 9.4 | % | 3,313,214 | 9.3 | % | 27.92 | ||||||||||||
Total | 1,150,664 | sf | 91.0 | % | $ | 35,669,539 | 100.0 | % | 31.00 | ||||||||||
(1) | Calculated using annualized contractual base rent payable as of December 31, 2015, for the expiring GLA, excluding expenses payable by or reimbursable from tenants. |
As of December 31, 2015, the Company had 242 apartment leases, 217 of which will expire in 2016 and 25 of which will expire in 2017. Annual base rent due under these leases is $3.5 million and $0.9 million for the years ending December 31, 2016 and 2017, respectively.
27
Current Portfolio Properties
The following table sets forth, at the dates indicated, certain information regarding the Current Portfolio Properties:
Property | Location | Leasable Area (Square Feet) | Year Acquired or Developed (Renovated) | Land Area (Acres) | Percentage Leased as of December 31, (1) | |||||||||||||||||||||
2015 | 2014 | 2013 | 2012 | 2011 | Anchor / Significant Tenants | |||||||||||||||||||||
Shopping Centers | ||||||||||||||||||||||||||
Ashburn Village | Ashburn, VA | 221,585 | 1994-2006 | 26.4 | 95 | % | 93 | % | 91 | % | 92 | % | 88 | % | Giant Food, Hallmark Cards, McDonald's, Burger King, Dunkin' Donuts, Kinder Care | |||||||||||
Ashland Square Phase I | Dumfries, VA | 23,120 | 2007 | 2.0 | 100 | % | 100 | % | 100 | % | 100 | % | 100 | % | Capital One Bank, CVS Pharmacy, The All American Steakhouse | |||||||||||
Beacon Center | Alexandria, VA | 358,071 | 1972 (1993/99/07) | 32.3 | 100 | % | 100 | % | 100 | % | 100 | % | 100 | % | Lowe’s Home Improvement Center, Giant Food, Home Goods, Outback Steakhouse, Marshalls, Hancock Fabrics, Party Depot, Panera Bread, TGI Fridays, Starbucks, Famous Dave’s, Chipotle | |||||||||||
BJ’s Wholesale Club | Alexandria, VA | 115,660 | 2008 | 9.6 | 100 | % | 100 | % | 100 | % | 100 | % | 100 | % | BJ’s Wholesale Club | |||||||||||
Boca Valley Plaza | Boca Raton, FL | 121,269 | 2004 | 12.7 | 100 | % | 89 | % | 91 | % | 87 | % | 80 | % | Publix, Wachovia Bank, Jaco Hybrid Training, Subway | |||||||||||
Boulevard | Fairfax, VA | 49,140 | 1994 (1999/09) | 5.0 | 100 | % | 98 | % | 100 | % | 100 | % | 100 | % | Panera Bread, Party City, Petco | |||||||||||
Briggs Chaney MarketPlace | Silver Spring, MD | 194,347 | 2004 | 18.2 | 99 | % | 99 | % | 99 | % | 99 | % | 99 | % | Safeway, Ross Dress For Less, Family Dollar, Advance Auto, McDonald's, Wendy’s, Chuck E Cheese’s | |||||||||||
Broadlands Village | Ashburn, VA | 174,734 | 2003-2006 | 24.0 | 98 | % | 97 | % | 87 | % | 85 | % | 91 | % | Safeway, The All American Steakhouse, Bonefish Grill, Dollar Tree, Starbucks, Minnieland Day Care | |||||||||||
Countryside Marketplace | Sterling, VA | 138,229 | 2004 | 16.0 | 93 | % | 91 | % | 91 | % | 92 | % | 90 | % | Safeway, CVS Pharmacy, Starbucks, McDonalds | |||||||||||
Cranberry Square | Westminster, MD | 141,450 | 2011 | 18.9 | 97 | % | 97 | % | 95 | % | 92 | % | 91 | % | Giant Food, Staples, Party City, Pier 1 Imports, Jos. A. Bank, Wendy’s, Giant Gas | |||||||||||
Cruse MarketPlace | Cumming, GA | 78,686 | 2004 | 10.6 | 92 | % | 88 | % | 84 | % | 84 | % | 88 | % | Publix, Subway, Orange Theory | |||||||||||
Flagship Center | Rockville, MD | 21,500 | 1972, 1989 | 0.5 | 100 | % | 100 | % | 100 | % | 100 | % | 100 | % | Capital One Bank | |||||||||||
French Market | Oklahoma City, OK | 244,718 | 1974 (1984/98) | 13.8 | 98 | % | 100 | % | 100 | % | 87 | % | 94 | % | Burlington Coat Factory, Bed Bath & Beyond, Staples, Petco, The Tile Shop, Lakeshore Learning Center, Dollar Tree, Verizon, Circle K | |||||||||||
Germantown | Germantown, MD | 18,982 | 1992 | 2.7 | 100 | % | 86 | % | 81 | % | 81 | % | 82 | % | Jiffy Lube, CVS Pharmacy | |||||||||||
750/730/726 N.Glebe Road | Arlington, VA | 23,688 | 2014 | 2.5 | 100 | % | 100 | % | N/A | N/A | N/A | Rosenthal Mazda | ||||||||||||||
The Glen | Woodbridge, VA | 136,440 | 1994 (2005) | 14.7 | 95 | % | 94 | % | 97 | % | 96 | % | 96 | % | Safeway Marketplace, The All American Steakhouse, Panera Bread, Five Guys, Chipotle | |||||||||||
Great Eastern | District Heights, MD | 255,398 | 1972 (1995) | 31.9 | 73 | % | 73 | % | 74 | % | 75 | % | 98 | % | Pep Boys, No Excuse Workout, Room Style Furniture, Kool Smiles | |||||||||||
Great Falls Center | Great Falls, VA | 91,666 | 2008 | 11.0 | 100 | % | 98 | % | 96 | % | 98 | % | 95 | % | Safeway, CVS Pharmacy, Capital One Bank, Starbucks, Subway, Long & Foster | |||||||||||
Hampshire Langley | Takoma Park, MD | 131,700 | 1972 (1979) | 9.9 | 100 | % | 100 | % | 100 | % | 100 | % | 98 | % | Mega Mart, Radio Shack, Starbucks, Chuck E. Cheese’s, Sardi's Chicken | |||||||||||
Hunt Club Corners | Apopka, FL | 101,522 | 2006 | 13.9 | 94 | % | 94 | % | 97 | % | 94 | % | 94 | % | Publix, Pet Supermarket, Sprint/Radio Shack, Hallmark | |||||||||||
Jamestown Place | Altamonte Springs, FL | 96,341 | 2005 | 10.9 | 90 | % | 92 | % | 89 | % | 93 | % | 90 | % | Publix, Carrabas Italian Grill | |||||||||||
28
Property | Location | Leasable Area (Square Feet) | Year Acquired or Developed (Renovated) | Land Area (Acres) | Percentage Leased as of December 31, (1) | |||||||||||||||||||||
2015 | 2014 | 2013 | 2012 | 2011 | Anchor / Significant Tenants | |||||||||||||||||||||
Shopping Centers (Continued) | ||||||||||||||||||||||||||
Kentlands Square I | Gaithersburg, MD | 114,381 | 2002 | 11.5 | 100 | % | 100 | % | 100 | % | 100 | % | 100 | % | Lowe’s Home Improvement Center, Chipotle | |||||||||||
Kentlands Square II | Gaithersburg, MD | 246,965 | 2011, 2013 | 23.4 | 100 | % | 98 | % | 96 | % | 96 | % | 100 | % | Giant Food, Kmart, Party City, Panera Bread, Not Your Average Joe’s, Payless Shoes, Hallmark, Chick-Fil-A, Coal Fire Pizza, Brasserie Beck, Cava Mezze Grill, Zengo Cycle, Fleet Feet | |||||||||||
Kentlands Place | Gaithersburg, MD | 40,697 | 2005 | 3.4 | 96 | % | 100 | % | 100 | % | 100 | % | 97 | % | Elizabeth Arden’s Red Door Salon, Bonefish Grill, Subway | |||||||||||
Lansdowne Town Center | Leesburg, VA | 189,422 | 2006 | 23.4 | 89 | % | 97 | % | 97 | % | 93 | % | 96 | % | Harris Teeter, CVS Pharmacy, Panera Bread, Not Your Average Joe's, Starbucks, Lansdowne Tavern, Capital One Bank, Pike's Fish House | |||||||||||
Leesburg Pike Plaza | Baileys Crossroads, VA | 97,752 | 1966 (1982/95) | 9.4 | 100 | % | 100 | % | 100 | % | 100 | % | 95 | % | CVS Pharmacy, Party Depot, FedEx Kinko’s, Radio Shack, Verizon Wireless | |||||||||||
Lumberton Plaza | Lumberton, NJ | 192,718 | 1975 (1992/96) | 23.3 | 90 | % | 94 | % | 94 | % | 93 | % | 76 | % | Aldi Grocery, Rite Aid, Virtua Health Center, Radio Shack, Family Dollar, Retro Fitness, Big Lots | |||||||||||
Metro Pike Center | Rockville, MD | 67,488 | 2010 | 4.6 | 89 | % | 80 | % | 92 | % | 84 | % | 76 | % | McDonald's, Dunkin' Donuts, 7-Eleven | |||||||||||
Shops at Monocacy | Frederick, MD | 109,144 | 2004 | 13.0 | 100 | % | 97 | % | 93 | % | 92 | % | 91 | % | Giant Food, Giant Gas Station, Panera Bread, Starbucks, Five Guys, California Tortilla, Firehouse Subs, Comcast | |||||||||||
Northrock | Warrenton, VA | 99,789 | 2009 | 15.4 | 92 | % | 95 | % | 87 | % | 81 | % | 81 | % | Harris Teeter, Longhorn Steakhouse, Ledo’s Pizza, Capital One Bank, Jos. A. Bank | |||||||||||
Olde Forte Village | Ft. Washington, MD | 143,577 | 2003 | 16.0 | 97 | % | 98 | % | 97 | % | 96 | % | 94 | % | Safeway, Advance Auto, Dollar Tree, Radio Shack, McDonalds, Wendy’s, Ledo’s Pizza | |||||||||||
Olney | Olney, MD | 53,765 | 1975 (1990) | 3.7 | 97 | % | 92 | % | 93 | % | 94 | % | 96 | % | Rite Aid, Olney Grill, Ledo’s Pizza, Popeye’s, Sardi's Fusion | |||||||||||
Orchard Park | Dunwoody, GA | 87,365 | 2007 | 10.5 | 98 | % | 98 | % | 94 | % | 92 | % | 90 | % | Kroger, Subway, Jett Ferry Dental | |||||||||||
Palm Springs Center | Altamonte Springs, FL | 126,446 | 2005 | 12.0 | 98 | % | 91 | % | 98 | % | 98 | % | 94 | % | Albertson’s, Duffy's Sports Grill, Toojay’s Deli, The Tile Shop, Rockler Tools | |||||||||||
Ravenwood | Baltimore, MD | 93,328 | 1972 (2006) | 8.0 | 99 | % | 96 | % | 94 | % | 91 | % | 93 | % | Giant Food, Starbucks, Sleepy's, Dominos, Bank of America | |||||||||||
11503 Rockville Pike/5541 Nicholson Lane | Rockville, MD | 40,249 | 2010/2012 | 3.0 | 63 | % | 63 | % | 70 | % | 70 | % | 100 | % | Staples, Casual Male | |||||||||||
1500/1580/1582/ 1584 Rockville Pike | Rockville, MD | 110,128 | 2012/2014 | 10.3 | 90 | % | 99 | % | 100 | % | 91 | % | N/A | Party City, CVS Pharmacy, Sheffield Furniture, Hooters | ||||||||||||
Seabreeze Plaza | Palm Harbor, FL | 146,673 | 2005 | 18.4 | 95 | % | 97 | % | 97 | % | 97 | % | 95 | % | Publix, Earth Origins Health Food, Petco, Planet Fitness, Vision Works | |||||||||||
Marketplace at Sea Colony | Bethany Beach, DE | 21,677 | 2008 | 5.1 | 95 | % | 91 | % | 91 | % | 90 | % | 95 | % | Seacoast Realty, Armand’s Pizza, Candy Kitchen, Burnzy's | |||||||||||
29
Property | Location | Leasable Area (Square Feet) | Year Acquired or Developed (Renovated) | Land Area (Acres) | Percentage Leased as of December 31, (1) | |||||||||||||||||||||
2015 | 2014 | 2013 | 2012 | 2011 | Anchor / Significant Tenants | |||||||||||||||||||||
Shopping Centers (Continued) | ||||||||||||||||||||||||||
Seven Corners | Falls Church, VA | 573,481 | 1973 (1994) | 31.6 | 100 | % | 100 | % | 100 | % | 100 | % | 91 | % | The Home Depot, Shoppers Food & Pharmacy, Michaels Arts & Crafts, Barnes & Noble, Ross Dress For Less, Ski Chalet, Off-Broadway Shoes, JoAnn Fabrics, Dress Barn, Starbucks, Dogfishhead Ale House, Red Robin Gourmet Burgers, Chipotle, Wendy’s, Burlington Coat Factory | |||||||||||
Severna Park Marketplace | Severna Park, MD | 254,174 | 2011 | 20.6 | 100 | % | 100 | % | 100 | % | 100 | % | 100 | % | Giant Food, Kohl’s, Office Depot, A.C. Moore, Goodyear, Chipotle, McDonald's, Jos. A Bank, Radio Shack, Five Guys, Unleashed (Petco) | |||||||||||
Shops at Fairfax | Fairfax, VA | 68,762 | 1975 (1993/99) | 6.7 | 100 | % | 98 | % | 100 | % | 100 | % | 95 | % | Super H Mart | |||||||||||
Smallwood Village Center | Waldorf, MD | 174,749 | 2006 | 25.1 | 69 | % | 72 | % | 74 | % | 70 | % | 68 | % | Safeway, CVS Pharmacy, Family Dollar | |||||||||||
Southdale | Glen Burnie, MD | 484,035 | 1972 (1986) | 39.6 | 95 | % | 89 | % | 87 | % | 93 | % | 83 | % | The Home Depot, Michaels Arts & Crafts, Marshalls, PetSmart, Value City Furniture, Athletic Warehouse, Starbucks, Gallo Clothing, Office Depot, The Tile Shop | |||||||||||
Southside Plaza | Richmond, VA | 371,761 | 1972 | 32.8 | 98 | % | 98 | % | 98 | % | 92 | % | 92 | % | Community Supermarket, Maxway, Citi Trends, City of Richmond, McDonald's, Burger King, Kool Smiles, Falla's, Hibachi Grill | |||||||||||
South Dekalb Plaza | Atlanta, GA | 163,418 | 1976 | 14.6 | 91 | % | 94 | % | 94 | % | 88 | % | 88 | % | Maxway, Big Lots, Emory Clinic, Dollar Tree, Shoe Land | |||||||||||
Thruway | Winston-Salem, NC | 362,456 | 1972 (1997) | 30.5 | 96 | % | 97 | % | 96 | % | 93 | % | 87 | % | Harris Teeter, Trader Joe’s, Stein Mart, Talbots, Hanes Brands, Jos. A Bank, Bonefish Grill, Chico’s, Ann Taylor Loft, Rite Aid, FedEx/Kinkos, Plow & Hearth, New Balance, Aveda Salon, Christies Hallmark, Carter’s Kids, McDonalds, Chick-Fil-A, Wells Fargo Bank, Francesca’s Collections, Great Outdoor Provision Company, White House / Black Market, Soma | |||||||||||
Village Center | Centreville, VA | 146,032 | 1990 | 17.2 | 94 | % | 98 | % | 96 | % | 99 | % | 90 | % | Giant Food, Tuesday Morning, Starbucks, McDonald's, Pet Supplies Plus, Bikram Yoga | |||||||||||
Westview Village | Frederick, MD | 97,145 | 2009 | 11.6 | 100 | % | 90 | % | 88 | % | 85 | % | 57 | % | Silver Diner, Sleepy’s, Music & Arts, Firehouse Subs, CiCi’s Pizza, Café Rio, Five Guys, Regus | |||||||||||
White Oak | Silver Spring, MD | 480,676 | 1972 (1993) | 27.9 | 99 | % | 100 | % | 100 | % | 100 | % | 99 | % | Giant Food, Sears, Walgreens, Boston Market, Sarku | |||||||||||
Total Shopping Centers | (3) | 7,896,499 | 760.1 | 95.4 | % | 95.0 | % | 94.5 | % | 93.4 | % | 91.6 | % | |||||||||||||
30
Property | Location | Leasable Area (Square Feet) | Year Acquired or Developed (Renovated) | Land Area (Acres) | Percentage Leased as of December 31, (1) | |||||||||||||||||||||
2015 | 2014 | 2013 | 2012 | 2011 | Anchor / Significant Tenants | |||||||||||||||||||||
Mixed-Use Properties | ||||||||||||||||||||||||||
Avenel Business Park | Gaithersburg, MD | 390,683 | 1981-2000 | 37.1 | 84 | % | 88 | % | 91 | % | 83 | % | 80 | % | General Services Administration, Gene Dx, Inc., American Type Culture Collection, Inc. | |||||||||||
Clarendon Center-North Block | Arlington, VA | 108,387 | 2010 | 0.6 | 96 | % | 96 | % | 96 | % | 96 | % | 86 | % | Pete’s New Haven Pizza, AT&T, Airline Reporting Corporation | |||||||||||
Clarendon Center-South Block | Arlington, VA | 104,894 | 2010 | 1.3 | 100 | % | 100 | % | 100 | % | 100 | % | 99 | % | Trader Joe’s, Circa, Burke and Herbert Bank, Bracket Room, Winston Partners, Keppler Speakers Bureau, ECG Management Co., Leadership Institute, Capital One | |||||||||||
Clarendon Center Residential-South Block (244 units) | 188,671 | 2010 | 97 | % | 96 | % | 99 | % | 100 | % | 100 | % | ||||||||||||||
Crosstown Business Center (4) | Tulsa, OK | 197,127 | 1975 (2000) | 22.4 | 85 | % | 94 | % | 81 | % | 77 | % | 87 | % | Roxtec, Keystone Automotive, Freedom Express, Direct TV, Baldor | |||||||||||
601 Pennsylvania Ave. | Washington, DC | 227,021 | 1973 (1986) | 1.0 | 98 | % | 96 | % | 95 | % | 95 | % | 95 | % | National Gallery of Art, American Assn. of Health Plans, Credit Union National Assn., Southern Company, HQ Global, Freedom Forum, Capital Grille, Michael Best & Friedrich, LLP | |||||||||||
Washington Square | Alexandria, VA | 236,376 | 1975 (2000) | 2.0 | 95 | % | 82 | % | 86 | % | 89 | % | 92 | % | Vanderweil Engineering, Freeman Decorating Services, Tauri Group, Cooper Carry, National PACE Association, Marketing General, Alexandria Economic Development, Trader Joe’s, Fed Ex/Kinko’s, Talbots, Teaism Restaurant, Starbucks, The Business Bank, Virginia ABC | |||||||||||
Total Mixed Use Properties | (3) | 1,453,159 | 64.4 | 91.0 | % | (2) | 90.8 | % | (2) | 90.5 | % | (2) | 87.7 | % | (2) | 88.2 | % | (2) | ||||||||
Total Portfolio | (3) | 9,349,658 | 824.5 | 94.8 | % | (2) | 94.4 | % | (2) | 93.9 | % | (2) | 92.6 | % | (2) | 91.1 | % | (2) | ||||||||
Land and Development Parcels | ||||||||||||||||||||||||||
Ashland Square Phase II | Manassas, VA | 2004 | 17.3 | Marketing to grocers and other retail businesses, with a development timetable yet to be finalized. | ||||||||||||||||||||||
New Market | New Market, MD | 2005 | 35.5 | Parcel will accommodate retail development in excess of 120,000 SF near I-70, east of Frederick, Maryland. A development timetable has not been determined. | ||||||||||||||||||||||
Park Van Ness | Washington, DC | — | 1973/2011 | 1.4 | A 271-unit residential building with approximately 9,000 square feet of street-level retail space is currently under construction. | |||||||||||||||||||||
Total Development Properties | 54.2 | |||||||||||||||||||||||||
(1) | Percentage leased is a percentage of rentable square feet leased for commercial space and a percentage of units leased for apartments. Includes only operating properties owned as of December 31, 2015. As such, prior year totals do not agree to prior year tables. |
(2) | Total percentage leased is for commercial space only. |
(3) | Prior year leased percentages for Total Shopping Centers, Total Mixed-Use Properties and Total Portfolio have been recalculated to exclude the impact of properties sold or removed from service and, therefore, the percentages reported in this table may be different than the percentages previously reported. |
(4) | As of December 31, 2015, Crosstown Business Center was designated as held for sale. |
31
Item 3. Legal Proceedings
In the normal course of business, the Company is involved in litigation, including litigation arising out of the collection of rents, the enforcement or defense of the priority of its security interests, and the continued development and marketing of certain of its real estate properties. In the opinion of management, litigation that is currently pending should not have a material adverse impact on the financial condition or future operations of the Company.
Item 4. Mine Safety Disclosures
Not applicable.
32
PART II
Item 5. Market for Registrant’s Common Equity, Related Stockholder Matters and Issuer Purchases of Equity Securities
Market Information
Shares of Saul Centers common stock are listed on the New York Stock Exchange under the symbol “BFS”. The composite high and low closing sale prices for the Company’s shares of common stock were reported by the New York Stock Exchange for each quarter of 2015 and 2014 as follows:
Period | Share Price | ||||||
High | Low | ||||||
October 1, 2015 – December 31, 2015 | $ | 58.87 | $ | 51.27 | |||
July 1, 2015 – September 30, 2015 | $ | 52.90 | $ | 47.65 | |||
April 1, 2015 – June 30, 2015 | $ | 56.93 | $ | 49.19 | |||
January 1, 2015 – March 31, 2015 | $ | 60.30 | $ | 53.52 | |||
October 1, 2014 – December 31, 2014 | $ | 58.56 | $ | 46.83 | |||
July 1, 2014 – September 30, 2014 | $ | 50.35 | $ | 45.98 | |||
April 1, 2014 – June 30, 2014 | $ | 50.53 | $ | 45.51 | |||
January 1, 2014– March 31, 2014 | $ | 48.20 | $ | 45.06 | |||
On March 1, 2016, the closing price was $49.83 per share.
Holders
The approximate number of holders of record of the common stock was 196 as of March 1, 2016.
Dividends and Distributions
Under the Code, REITs are subject to numerous organizational and operating requirements, including the requirement to distribute at least 90% of REIT taxable income. The Company distributed more than the required amount in 2015 and 2014. Distributions by the Company to common stockholders and holders of limited partnership units in the Operating Partnership were $47.9 million and $43.5 million in 2015 and 2014, respectively. Distributions to preferred stockholders were $12.4 million and $13.5 million in 2015 and 2014, respectively. See Notes to Consolidated Financial Statements, No. 14, “Distributions.” The Company may or may not elect to distribute in excess of 90% of REIT taxable income in future years.
The Company’s estimate of cash flow available for distributions is believed to be based on reasonable assumptions and represents a reasonable basis for setting distributions. However, the actual results of operations of the Company will be affected by a variety of factors, including but not limited to actual rental revenue, operating expenses of the Company, interest expense, general economic conditions, federal, state and local taxes (if any), unanticipated capital expenditures, the adequacy of reserves and preferred dividends. While the Company intends to continue paying regular quarterly distributions, any future payments will be determined solely by the Board of Directors and will depend on a number of factors, including cash flow of the Company, its financial condition and capital requirements, the annual distribution amounts required to maintain its status as a REIT under the Code, and such other factors as the Board of Directors deems relevant. We are obligated to pay regular quarterly distributions to holders of depositary shares, prior to distributions on the common stock.
The Company paid four quarterly distributions totaling $1.69, $1.56 and $1.44 per common share during 2015, 2014 and 2013, respectively. The annual distribution amounts paid by the Company exceeded the distribution amounts required for tax purposes. Distributions to the extent of our current and accumulated earnings and profits for federal income tax purposes generally will be taxable to a stockholder as ordinary dividend income. Distributions in excess of current and accumulated earnings and profits will be treated as a nontaxable reduction of
33
the stockholder’s basis in such stockholder’s shares, to the extent thereof, and thereafter as taxable gain. Distributions that are treated as a reduction of the stockholder’s basis in its shares will have the effect of deferring taxation until the sale of the stockholder’s shares. All of the 2015 and 2014 common dividends were treated as taxable dividends. Of the $1.44 per common share dividend paid in 2013, 67% was treated as a taxable dividend and 33% was treated as a return of capital. No assurance can be given regarding what portion, if any, of distributions in 2016 or subsequent years will constitute a return of capital for federal income tax purposes. All of the preferred stock dividends paid are treated as ordinary dividend income.
Acquisition of Equity Securities by the Saul Organization
Through participation in the Company’s Dividend Reinvestment Plan, during the quarter ended December 31, 2015, (a) B. Francis Saul II, the Company’s Chairman of the Board and Chief Executive Officer, (b) his spouse, (c) B. F. Saul Real Estate Investment Trust and B. F. Saul Company, for each of which Mr. B. F. Saul II serves as either President or Chairman, and (d) B. F. Saul Property Company, Avenel Executive Park Phase II, LLC, SHLP Unit Acquisition Corp. and Dearborn, LLC, which are wholly-owned subsidiaries of either B. F. Saul Company or B. F. Saul Real Estate Investment Trust, acquired an aggregate of 22,851 shares of common stock and 28,936 limited partnership units at an average price of $55.73 per share/unit, in respect of the October 31, 2015 dividend distribution.
No shares were acquired pursuant to a publicly announced plan or program.
34
Performance Graph
Rules promulgated under the Exchange Act require the Company to present a graph comparing the cumulative total stockholder return on its Common Stock with the cumulative total stockholder return of (i) a broad equity market index, and (ii) a published industry index or peer group. The following graph compares the cumulative total stockholder return of the Company’s common stock, based on the market price of the common stock and assuming reinvestment of dividends, with the National Association of Real Estate Investment Trust Equity Index (“NAREIT Equity”), the S&P 500 Index (“S&P 500”) and the Russell 2000 Index (“Russell 2000”). The graph assumes the investment of $100 on December 31, 2010.
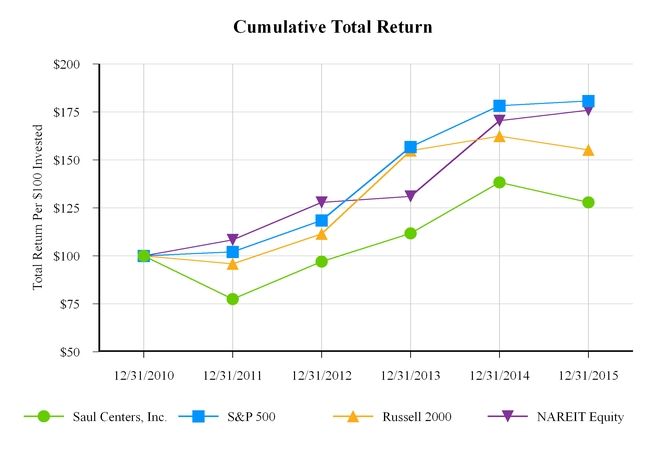
Period Ending | ||||||||||||||||||
Index | 12/31/2010 | 12/31/2011 | 12/31/2012 | 12/31/2013 | 12/31/2014 | 12/31/2015 | ||||||||||||
Saul Centers, Inc. | $100.00 | $77.51 | $97.05 | $111.70 | $138.25 | $127.88 | ||||||||||||
S&P 500 | $100.00 | $102.11 | $118.45 | $156.82 | $178.28 | $180.75 | ||||||||||||
Russell 2000 | $100.00 | $95.82 | $111.49 | $154.78 | $162.35 | $155.18 | ||||||||||||
NAREIT Equity | $100.00 | $108.29 | $127.85 | $131.01 | $170.49 | $175.94 | ||||||||||||
Source: SNL Financial LC | ||||||||||||||||||
35
Item 6. Selected Financial Data
The selected financial data of the Company contained herein has been derived from the consolidated financial statements of the Company. The data should be read in conjunction with “Item 7. Management’s Discussion and Analysis of Financial Condition and Results of Operations” and the Consolidated Financial Statements included elsewhere in this report.
SELECTED FINANCIAL DATA | |||||||||||||||||||
Years Ended December 31, | |||||||||||||||||||
(In thousands, except per share data) | 2015 | 2014 | 2013 | 2012 | 2011 | ||||||||||||||
Operating Data: | |||||||||||||||||||
Total revenue | $ | 209,077 | $ | 207,092 | $ | 197,897 | $ | 190,092 | $ | 173,878 | |||||||||
Total operating expenses | 156,147 | 155,163 | 162,628 | 154,996 | 142,442 | ||||||||||||||
Operating income | 52,930 | 51,929 | 35,269 | 35,096 | 31,436 | ||||||||||||||
Non-operating income: | |||||||||||||||||||
Change in fair value of derivatives | (10 | ) | (10 | ) | (7 | ) | 36 | (1,332 | ) | ||||||||||
Loss on early extinguishment of debt | — | — | (497 | ) | — | — | |||||||||||||
Gains on sales of properties | 11 | 6,069 | — | — | — | ||||||||||||||
Gain on casualty settlements | — | — | 77 | 219 | 245 | ||||||||||||||
Income from continuing operations | 52,931 | 57,988 | 34,842 | 35,351 | 30,349 | ||||||||||||||
Discontinued operations | — | — | — | 4,429 | (55 | ) | |||||||||||||
Net income | 52,931 | 57,988 | 34,842 | 39,780 | 30,294 | ||||||||||||||
Income attributable to noncontrolling interests | (10,463 | ) | (11,045 | ) | (3,970 | ) | (6,406 | ) | (3,561 | ) | |||||||||
Net income attributable to Saul Centers, Inc. | 42,468 | 46,943 | 30,872 | 33,374 | 26,733 | ||||||||||||||
Preferred stock redemption | — | (1,480 | ) | (5,228 | ) | — | — | ||||||||||||
Preferred dividends | (12,375 | ) | (13,361 | ) | (13,983 | ) | (15,140 | ) | (15,140 | ) | |||||||||
Net income available to common stockholders | $ | 30,093 | $ | 32,102 | $ | 11,661 | $ | 18,234 | $ | 11,593 | |||||||||
Per Share Data (diluted): | |||||||||||||||||||
Net income available to common stockholders: | |||||||||||||||||||
Continuing operations | $ | 1.42 | $ | 1.54 | $ | 0.57 | $ | 0.70 | $ | 0.61 | |||||||||
Discontinued operations | — | — | — | 0.23 | — | ||||||||||||||
Total | $ | 1.42 | $ | 1.54 | $ | 0.57 | $ | 0.93 | $ | 0.61 | |||||||||
Basic and Diluted Shares Outstanding: | |||||||||||||||||||
Weighted average common shares - basic | 21,127 | 20,772 | 20,364 | 19,649 | 18,889 | ||||||||||||||
Effect of dilutive options | 69 | 49 | 37 | 51 | 60 | ||||||||||||||
Weighted average common shares - diluted | 21,196 | 20,821 | 20,401 | 19,700 | 18,949 | ||||||||||||||
Weighted average convertible limited partnership units | 7,253 | 7,156 | 6,929 | 6,914 | 5,791 | ||||||||||||||
Weighted average common shares and fully converted limited partnership units - diluted | 28,449 | 27,977 | 27,330 | 26,614 | 24,740 | ||||||||||||||
Dividends Paid: | |||||||||||||||||||
Cash dividends to common stockholders (1) | $ | 35,645 | $ | 32,346 | $ | 29,205 | $ | 28,135 | $ | 27,062 | |||||||||
Cash dividends per share | $ | 1.69 | $ | 1.56 | $ | 1.44 | $ | 1.44 | $ | 1.44 | |||||||||
36
SELECTED FINANCIAL DATA | |||||||||||||||||||
Years Ended December 31, | |||||||||||||||||||
(In thousands, except per share data) | 2015 | 2014 | 2013 | 2012 | 2011 | ||||||||||||||
Balance Sheet Data: | |||||||||||||||||||
Real estate investments (net of accumulated depreciation) | $ | 1,197,340 | $ | 1,163,542 | $ | 1,094,776 | $ | 1,112,763 | $ | 1,091,448 | |||||||||
Total assets | 1,304,145 | 1,266,987 | 1,198,675 | 1,207,309 | 1,192,569 | ||||||||||||||
Total debt, including accrued interest | 878,389 | 860,601 | 823,328 | 831,121 | 835,459 | ||||||||||||||
Preferred stock | 180,000 | 180,000 | 180,000 | 179,328 | 179,328 | ||||||||||||||
Total stockholders’ equity | 353,727 | 339,257 | 315,126 | 307,289 | 293,206 | ||||||||||||||
Other Data | |||||||||||||||||||
Cash flow provided by (used in): | |||||||||||||||||||
Operating activities | $ | 88,896 | $ | 86,568 | $ | 73,527 | $ | 78,423 | $ | 55,669 | |||||||||
Investing activities | $ | (69,587 | ) | $ | (83,589 | ) | $ | (26,034 | ) | $ | (46,873 | ) | $ | (201,500 | ) | ||||
Financing activities | $ | (21,434 | ) | $ | (8,148 | ) | $ | (42,329 | ) | $ | (31,740 | ) | $ | 145,186 | |||||
Funds from operations (2): | |||||||||||||||||||
Net income | $ | 52,931 | $ | 57,988 | $ | 34,842 | $ | 39,780 | $ | 30,294 | |||||||||
Real property depreciation and amortization | 43,270 | 41,203 | 49,130 | 40,112 | 35,298 | ||||||||||||||
Real property depreciation - discontinued operations | — | — | — | 77 | 102 | ||||||||||||||
Gain on property dispositions and casualty settlements | (11 | ) | (6,069 | ) | (77 | ) | (4,729 | ) | (245 | ) | |||||||||
Funds from operations | 96,190 | 93,122 | 83,895 | 75,240 | 65,449 | ||||||||||||||
Preferred stock redemption | — | (1,480 | ) | (5,228 | ) | — | — | ||||||||||||
Preferred dividends | (12,375 | ) | (13,361 | ) | (13,983 | ) | (15,140 | ) | (15,140 | ) | |||||||||
Funds from operations available to common stockholders and noncontrolling interests | $ | 83,815 | $ | 78,281 | $ | 64,684 | $ | 60,100 | $ | 50,309 | |||||||||
1) | During 2015, 2014, 2013, 2012, and 2011, shareholders reinvested $10.6 million, $9.3 million, |
$20.7 million, $23.1 million and $19.8 million, respectively, in newly issued common stock through the Company’s dividend reinvestment plan.
2) | Funds from operations (FFO) is a non-GAAP financial measure and is defined in “Item 7. Management’s Discussion and Analysis of Financial Condition and Results of Operations-Funds From Operations.” |
Item 7. Management’s Discussion and Analysis of Financial Condition and Results of Operations
Management’s Discussion and Analysis of Financial Condition and Results of Operations (MD&A) begins with the Company’s primary business strategy to give the reader an overview of the goals of the Company’s business. This is followed by a discussion of the critical accounting policies that the Company believes are important to understanding the assumptions and judgments incorporated in the Company’s reported financial results. The next section, beginning on page 41, discusses the Company’s results of operations for the past two years. Beginning on page 46, the Company provides an analysis of its liquidity and capital resources, including discussions of its cash flows, debt arrangements, sources of capital and financial commitments. Finally, on page 56, the Company discusses funds from operations, or FFO, which is a non-GAAP financial measure of performance of an equity REIT used by the REIT industry.
The MD&A should be read in conjunction with the other sections of this Annual Report on Form 10-K, including the consolidated financial statements and notes thereto appearing in Item 8 of this report. Historical results set forth in Selected Financial Information, the Consolidated Financial Statements and Supplemental Data included in Item 6 and Item 8 and this section should not be taken as indicative of the Company’s future operations.
37
Overview
The Company’s principal business activity is the ownership, management and development of income-producing properties. The Company’s long-term objectives are to increase cash flow from operations and to maximize capital appreciation of its real estate investments.
The Company’s primary operating strategy is to focus on its community and neighborhood shopping center business and to operate its properties to achieve both cash flow growth and capital appreciation. Management believes there is potential for long term growth in cash flow as existing leases for space in the Shopping Center and Mixed-Use Properties expire and are renewed, or newly available or vacant space is leased. The Company intends to renegotiate leases where possible and seek new tenants for available space in order to optimize the mix of uses to improve foot traffic through the Shopping Centers. As leases expire, management expects to revise rental rates, lease terms and conditions, relocate existing tenants, reconfigure tenant spaces and introduce new tenants with the goals of increasing occupancy, improving overall retail sales, and ultimately increasing cash flow as economic conditions improve. In those circumstances in which leases are not otherwise expiring, management selectively attempts to increase cash flow through a variety of means, or in connection with renovations or relocations, recapturing leases with below market rents and re-leasing at market rates, as well as replacing financially troubled tenants. When possible, management also will seek to include scheduled increases in base rent, as well as percentage rental provisions, in its leases.
The Company’s redevelopment and renovation objective is to selectively and opportunistically redevelop and renovate its properties, by replacing below-market-rent leases with strong, traffic-generating anchor stores such as supermarkets and drug stores, as well as other desirable local, regional and national tenants. The Company’s strategy remains focused on continuing the operating performance and internal growth of its existing Shopping Centers, while enhancing this growth with selective acquisitions, redevelopments and renovations.
In 2014, in separate transactions, the Company purchased three properties, with approximately 57,400 square feet of retail space, for an aggregate $25.2 million. The three properties are adjacent to an existing property on the east side of Rockville Pike near the Twinbrook Metro station. Combined, the four properties total 10.3 acres and are zoned for up to 1.2 million square feet of rentable mixed-use space. The Company is actively engaged in a plan for redevelopment but has not committed to any timetable for commencement of construction.
The Company owns properties on the east and west sides of Rockville Pike near the White Flint Metro station which combined total 7.6 acres which are zoned for a development potential of up to 1.6 million square feet of mixed-use space. The Company is actively engaged in a plan for redevelopment but has not committed to any timetable for commencement of construction.
During 2013, the Company completed negotiation of lease termination agreements with the tenants of Van Ness Square. Costs incurred related to those termination arrangements were amortized to expense using the straight-line method over the remaining terms of the leases, are included in “Predevelopment Expenses” in the Consolidated Statements of Operations, and totaled $3.3 million in 2013. The Company is in the process of developing a primarily residential project with street-level retail. In connection with the demolition of the existing structure, approximately $580,000 and $503,000 of predevelopment expenses were recognized in 2013 and 2014, respectively.
In 2014, in separate transactions, the Company purchased two adjacent properties, with approximately 18,900 square feet of retail space, on North Glebe Road in Arlington, Virginia, for an aggregate $42.8 million. In September 2015, the Company purchased an additional property on North Glebe Road, which is adjacent to the two properties acquired in 2014, for $4.0 million. Combined, the properties total 2.5 acres and are zoned for up to 550,000 square feet of rentable mixed-use space. The Company is actively engaged in a plan for redevelopment but has not committed to any timetable for commencement of construction.
In light of the limited amount of quality properties for sale and the escalated pricing of properties that the Company has been presented with or has inquired about over the past year, management believes acquisition opportunities for investment in existing and new Shopping Center and Mixed-Use Properties in the near future is uncertain. Because of its conservative capital structure, including its cash and capacity under its revolving credit
38
facility, management believes that the Company is positioned to take advantage of additional investment opportunities as attractive properties are located and market conditions improve. (See “Item 1. Business - Capital Policies”). It is management’s view that several of the sub-markets in which the Company operates have, or are expected to have in the future, attractive supply/demand characteristics. The Company will continue to evaluate acquisition, development and redevelopment as integral parts of its overall business plan.
During the most recent downturn in the national real estate market, which began in 2008, the effects on the office and retail markets in the metropolitan Washington, D.C. area, where the majority of the Company’s properties are located, were initially less severe than in many other areas of the country. Even though economic conditions in the local economies, where the majority of the Company’s properties are located, have improved over recent years, issues facing the Federal government relating to spending cuts and budget policies have resulted in continued elevated vacancy rates in many sub-markets, thus pressuring rental rate growth. While overall consumer confidence appears to have improved, retailers continue to be cautious about new store openings. However, the Company’s overall leasing percentage, on a comparative same property basis, which excludes the impact of properties not in operation for the entirety of the comparable periods, continues to improve and increased to 94.7% at December 31, 2015, from 94.4% at December 31, 2014.
Because of the Company’s conservative capital structure, its liquidity has not been significantly affected by the recent turmoil in the credit markets. The Company maintains a ratio of total debt to total asset value of under 50%, which allows the Company to obtain additional secured borrowings if necessary. As of December 31, 2015, amortizing fixed-rate mortgage debt with staggered maturities from 2018 to 2034 represented approximately 95.1% of the Company’s notes payable, thus minimizing refinancing risk. The Company’s variable-rate debt consists of a $14.8 million bank term loan secured by the Metro Pike Center and $28.0 million outstanding under the unsecured revolving line of credit. As of December 31, 2015, the Company has loan availability of approximately $246.6 million under its $275.0 million unsecured revolving line of credit.
Although it is management’s present intention to concentrate future acquisition and development activities on community and neighborhood shopping centers and office properties in the Washington, D.C./Baltimore metropolitan area and the southeastern region of the United States, the Company may, in the future, also acquire other types of real estate in other areas of the country as opportunities present themselves. While the Company may diversify in terms of property locations, size and market, the Company does not set any limit on the amount or percentage of Company assets that may be invested in any one property or any one geographic area.
Critical Accounting Policies
The Company’s consolidated financial statements are prepared in accordance with accounting principles generally accepted in the United States (“GAAP”), which requires management to make certain estimates and assumptions that affect the reporting of financial position and results of operations. See Note 2 to the Consolidated Financial Statements in this report. The Company has identified the following policies that, due to estimates and assumptions inherent in those policies, involve a relatively high degree of judgment and complexity.
Real Estate Investments
Real estate investment properties are stated at historic cost less depreciation. Although the Company intends to own its real estate investment properties over a long term, from time to time it will evaluate its market position, market conditions, and other factors and may elect to sell properties that do not conform to the Company’s investment profile. Management believes that the Company’s real estate assets have generally appreciated in value since their acquisition or development and, accordingly, the aggregate current value exceeds their aggregate net book value and also exceeds the value of the Company’s liabilities as reported in the financial statements. Because the financial statements are prepared in conformity with GAAP, they do not report the current value of the Company’s real estate investment properties.
The Company purchases real estate investment properties from time to time and records assets acquired and liabilities assumed, including land, buildings, and intangibles related to in-place leases and customer
39
relationships based on their fair values. The fair value of buildings generally is determined as if the buildings were vacant upon acquisition and subsequently leased at market rental rates and considers the present value of all cash flows expected to be generated by the property including an initial lease up period. The Company determines the fair value of above and below market intangibles associated with in-place leases by assessing the net effective rent and remaining term of the in-place lease relative to market terms for similar leases at acquisition taking into consideration the remaining contractual lease period, renewal periods, and the likelihood of the tenant exercising its renewal options. The fair value of a below market lease component is recorded as deferred income and accreted as additional lease revenue over the remaining contractual lease period. If the fair value of the below market lease intangible includes fair value associated with a renewal option, such amounts are not accreted until the renewal option is exercised. If the renewal option is not exercised the value is recognized at that time. The fair value of above market lease intangibles is recorded as a deferred asset and is amortized as a reduction of lease revenue over the remaining contractual lease term. The Company determines the fair value of at-market in-place leases considering the cost of acquiring similar leases, the foregone rents associated with the lease-up period and carrying costs associated with the lease-up period. Intangible assets associated with at-market in-place leases are amortized as additional expense over the remaining contractual lease term. To the extent customer relationship intangibles are present in an acquisition, the fair value of the intangibles are amortized over the life of the customer relationship. From time to time the Company may purchase a property for future development purposes. The property may be improved with an existing structure that would be demolished as part of the development. In such cases, the fair value of the building may be determined based only on existing leases and not include estimated cash flows related to future leases.
If there is an event or change in circumstance that indicates a potential impairment in the value of a real estate investment property, the Company prepares an analysis to determine whether the carrying value of the real estate investment property exceeds its estimated fair value. The Company considers both quantitative and qualitative factors in identifying impairment indicators including recurring operating losses, significant decreases in occupancy, and significant adverse changes in legal factors and business climate. If impairment indicators are present, the Company compares the projected cash flows of the property over its remaining useful life, on an undiscounted basis, to the carrying value of that property. The Company assesses its undiscounted projected cash flows based upon estimated capitalization rates, historic operating results and market conditions that may affect the property. If the carrying value is greater than the undiscounted projected cash flows, the Company would recognize an impairment loss equivalent to an amount required to adjust the carrying amount to its then estimated fair value. The fair value of any property is sensitive to the actual results of any of the aforementioned estimated factors, either individually or taken as a whole. Should the actual results differ from management’s projections, the valuation could be negatively or positively affected.
When incurred, the Company capitalizes the cost of improvements that extend the useful life of property and equipment. All repair and maintenance expenditures are expensed when incurred. Leasehold improvements expenditures are capitalized when certain criteria are met, including when we supervise construction and will own the improvement. Tenant improvements we own are depreciated over the life of the respective lease or the estimated useful life of the improvements, whichever is shorter.
Interest, real estate taxes, development-related salary costs and other carrying costs are capitalized on projects under construction. Once construction is substantially complete and the assets are placed in service, rental income, direct operating expenses, and depreciation associated with such properties are included in current operations. Commercial development projects are substantially complete and available for occupancy upon completion of tenant improvements, but no later than one year from the cessation of major construction activity. Residential development projects are considered substantially complete and available for occupancy upon receipt of the certificate of occupancy from the appropriate licensing authority. Substantially completed portions of a project are accounted for as separate projects. Depreciation is calculated using the straight-line method and estimated useful lives of generally between 35 and 50 years for base buildings, or a shorter period if management determines that the building has a shorter useful life, and up to 20 years for certain other improvements.
40
Deferred Leasing Costs
Certain initial direct costs incurred by the Company in negotiating and consummating successful commercial leases are capitalized and amortized over the term of the leases. Deferred leasing costs consist of commissions paid to third-party leasing agents as well as internal direct costs such as employee compensation and payroll-related fringe benefits directly related to time spent performing successful leasing-related activities. Such activities include evaluating prospective tenants’ financial condition, evaluating and recording guarantees, collateral and other security arrangements, negotiating lease terms, preparing lease documents and closing transactions. In addition, deferred leasing costs include amounts attributed to in-place leases associated with acquisition properties.
Revenue Recognition
Rental and interest income are accrued as earned except when doubt exists as to collectability, in which case the accrual is discontinued. Recognition of rental income commences when control of the space has been given to the tenant. When rental payments due under leases vary from a straight-line basis because of free rent periods or scheduled rent increases, income is recognized on a straight-line basis throughout the term of the lease. Expense recoveries represent a portion of property operating expenses billed to tenants, including common area maintenance, real estate taxes and other recoverable costs. Expense recoveries are recognized in the period when the expenses are incurred. Rental income based on a tenant’s revenue, known as percentage rent, is accrued when a tenant reports sales that exceed a specified breakpoint specified in the lease agreement.
Allowance for Doubtful Accounts - Current and Deferred Receivables
Accounts receivable primarily represent amounts accrued and unpaid from tenants in accordance with the terms of the respective leases, subject to the Company’s revenue recognition policy. Receivables are reviewed monthly and reserves are established with a charge to current period operations when, in the opinion of management, collection of the receivable is doubtful. In addition to rents due currently, accounts receivable include amounts representing minimum rental income accrued on a straight-line basis to be paid by tenants over the remaining term of their respective leases. Reserves are established with a charge to income for tenants whose rent payment history or financial condition casts doubt upon the tenant’s ability to perform under its lease obligations.
Legal Contingencies
The Company is subject to various legal proceedings and claims that arise in the ordinary course of business, which are generally covered by insurance. While the resolution of these matters cannot be predicted with certainty, the Company believes the final outcome of current matters will not have a material adverse effect on its financial position or the results of operations. Once it has been determined that a loss is probable to occur, the estimated amount of the loss is recorded in the financial statements. Both the amount of the loss and the point at which its occurrence is considered probable can be difficult to determine.
Results of Operations
Same property revenue and same property operating income are non-GAAP financial measures of performance and improve the comparability of these measures by excluding the results of properties which were not in operation for the entirety of the comparable reporting periods.
We define same property revenue as total revenue minus the sum of interest income and revenue of properties not in operation for the entirety of the comparable reporting periods, and we define same property operating income as net income plus the sum of interest expense and amortization of deferred debt costs, depreciation and amortization, general and administrative expense, loss on the early extinguishment of debt (if any), predevelopment expense and acquisition related costs, minus the sum of interest income, the change in the fair value of derivatives, gains on property dispositions (if any) and the results of properties which were not in operation for the entirety of the comparable periods.
41
Other REITs may use different methodologies for calculating same property revenue and same property operating income. Accordingly, our same property revenue and same property operating income may not be comparable to those of other REITs.
Same property revenue and same property operating income are used by management to evaluate and compare the operating performance of our properties, and to determine trends in earnings, because these measures are not affected by the cost of our funding, the impact of depreciation and amortization expenses, gains or losses from the acquisition and sale of operating real estate assets, general and administrative expenses or other gains and losses that relate to ownership of our properties. We believe the exclusion of these items from revenue and operating income is useful because the resulting measures capture the actual revenue generated and actual expenses incurred by operating our properties.
Same property revenue and same property operating income are measures of the operating performance of our properties but do not measure our performance as a whole. Such measures are therefore not substitutes for total revenue, net income or operating income as computed in accordance with GAAP.
The tables below provide reconciliations of total revenue and operating income under GAAP to same property revenue and operating income for the indicated periods. The same property results include 49 Shopping Centers and six Mixed-Use properties for each period.
Same property revenue
(in thousands) | Year ended December 31, | ||||||
2015 | 2014 | ||||||
Total revenue | $ | 209,077 | $ | 207,092 | |||
Less: Interest income | (51 | ) | (75 | ) | |||
Less: Acquisitions, dispositions and development properties | (2,572 | ) | (1,320 | ) | |||
Total same property revenue | $ | 206,454 | $ | 205,697 | |||
Shopping centers | $ | 153,538 | $ | 153,065 | |||
Mixed-Use properties | 52,916 | 52,632 | |||||
Total same property revenue | $ | 206,454 | $ | 205,697 | |||
The $0.8 million increase in same property revenue for 2015 compared to 2014 was primarily due to
(a) a $0.23 per square foot increase in base rent ($2.0 million), (b) a 48,863 square foot increase in leased space ($0.9 million), and (c) increased expense recovery income ($0.8 million), partially offset by (d) the 2014 bankruptcy settlement and collection related to a former tenant at Seven Corners ($1.6 million) and (e) the 2014 impact of a lease termination fee at Seven Corners ($1.9 million).
42
Same property operating income
Year Ended December 31, | |||||||
(In thousands) | 2015 | 2014 | |||||
Net income | $ | 52,931 | $ | 57,988 | |||
Add: Interest expense and amortization of deferred debt costs | 45,165 | 46,034 | |||||
Add: General and administrative | 16,353 | 16,961 | |||||
Add: Depreciation and amortization of deferred leasing costs | 43,270 | 41,203 | |||||
Add: Predevelopment expenses | 132 | 503 | |||||
Add: Acquisition related costs | 84 | 949 | |||||
Add: Change in fair value of derivatives | 10 | 10 | |||||
Less: Gains on property dispositions | (11 | ) | (6,069 | ) | |||
Less: Interest income | (51 | ) | (75 | ) | |||
Property operating income | 157,883 | 157,504 | |||||
Less: Acquisitions, dispositions & development property | (2,274 | ) | (1,122 | ) | |||
Total same property operating income | $ | 155,609 | $ | 156,382 | |||
Shopping centers | $ | 119,959 | $ | 119,482 | |||
Mixed-Use properties | 35,650 | 36,900 | |||||
Total same property operating income | $ | 155,609 | $ | 156,382 | |||
Same property operating income decreased $0.8 million for 2015 compared to 2014 due primarily to
(a) the 2014 bankruptcy settlement and collection related to a former tenant at Seven Corners ($1.6 million),
(b) higher real estate taxes ($1.2 million), and (c) a 2014 lease termination fee at Seven Corners ($1.9 million) partially offset by (d) a $0.23 per square foot increase in base rent ($2.0 million), (e) a 48,863 square foot increase in leased space ($0.9 million) and (f) increased expense recovery income ($0.8 million).
The following is a discussion of the components of revenue and expense for the entire Company.
Revenue | |||||||||||||||||
(Dollars in thousands) | Year ended December 31, | Percentage Change | |||||||||||||||
2015 | 2014 | 2013 | 2015 from 2014 | 2014 from 2013 | |||||||||||||
Base rent | $ | 168,303 | $ | 164,599 | $ | 159,898 | 2.3 | % | 2.9 | % | |||||||
Expense recoveries | 32,911 | 32,132 | 30,949 | 2.4 | % | 3.8 | % | ||||||||||
Percentage rent | 1,608 | 1,492 | 1,575 | 7.8 | % | (5.3 | )% | ||||||||||
Other | 6,255 | 8,869 | 5,475 | (29.5 | )% | 62.0 | % | ||||||||||
Total revenue | $ | 209,077 | $ | 207,092 | $ | 197,897 | 1.0 | % | 4.6 | % | |||||||
Base rent includes $2.4 million, $2.0 million and $3.0 million, for the years 2015, 2014, and 2013, respectively, to recognize base rent on a straight-line basis. In addition, base rent includes $1.8 million, $1.9 million and $1.7 million, for the years 2015, 2014, and 2013, respectively, to recognize income from the amortization of in-place leases.
Total revenue increased 1.0% in 2015 compared to 2014 primarily due to (a) a $0.45 per square foot increase in base rent ($3.9 million) and (b) higher expense recoveries ($0.8 million) partially offset by (c) a 2014 bankruptcy settlement and collection related to a former tenant at Seven Corners ($1.6 million), (d) a 2014 lease
43
termination fee at Seven Corners ($1.9 million), and (e) a 6,586 square foot decrease in leased space ($0.1 million). Total revenue increased 4.6% in 2014 compared to 2013 primarily due to (a) a $0.43 per square foot increase in base rent ($3.7 million), (b) a 107,062 square foot increase in leased space ($1.9 million), (c) higher expense recoveries ($1.2 million), (d) a 2014 bankruptcy settlement and collection related to a former tenant at Seven Corners ($1.6 million) and (e) the impact of a 2014 lease termination at Seven Corners ($0.7 million). A discussion of the components of revenue follows.
Base rent
The $3.7 million increase in base rent in 2015 compared to 2014 was attributable to (a) a $0.45 per square foot increase in base rent ($3.9 million) partially offset by (b) a 6,586 square foot decrease in leased space ($0.1 million). The $4.7 million increase in base rent in 2014 compared to 2013 was attributable to (a) a $0.30 per square foot increase in base rent ($2.6 million) and (b) a 107,062 square foot increase in leased space ($1.9 million).
Expense recoveries
Expense recovery income increased $0.8 million in 2015 compared to 2014 primarily due to higher real estate tax expense. Expense recovery income increased $1.2 million in 2014 compared to 2013 primarily due to higher snow removal costs incurred in early 2014.
Other revenue
Other revenue decreased $2.6 million in 2015 compared to 2014 and increased $3.4 million in 2014 compared to 2013 due primarily to (a) the 2014 bankruptcy settlement and collection related to a former tenant at Seven Corners ($1.6 million) and (b) a 2014 lease termination fee at Seven Corners ($1.9 million).
Operating expenses | |||||||||||||||||
(Dollars in thousands) | Year ended December 31, | Percentage Change | |||||||||||||||
2015 | 2014 | 2013 | 2015 from 2014 | 2014 from 2013 | |||||||||||||
Property operating expenses | $ | 26,565 | $ | 26,479 | $ | 24,559 | 0.3 | % | 7.8 | % | |||||||
Provision for credit losses | 915 | 680 | 968 | 34.6 | % | (29.8 | )% | ||||||||||
Real estate taxes | 23,663 | 22,354 | 22,415 | 5.9 | % | (0.3 | )% | ||||||||||
Interest expense and amortization of deferred debt costs | 45,165 | 46,034 | 46,589 | (1.9 | )% | (1.2 | )% | ||||||||||
Depreciation and amortization of deferred leasing costs | 43,270 | 41,203 | 49,130 | 5.0 | % | (16.1 | )% | ||||||||||
General and administrative | 16,353 | 16,961 | 14,951 | (3.6 | )% | 13.4 | % | ||||||||||
Acquisition related costs | 84 | 949 | 106 | (91.1 | )% | 795.3 | % | ||||||||||
Predevelopment expenses | 132 | 503 | 3,910 | (73.8 | )% | (87.1 | )% | ||||||||||
Total operating expenses | $ | 156,147 | $ | 155,163 | $ | 162,628 | 0.6 | % | (4.6 | )% | |||||||
Total operating expenses increased 0.6% in 2015 compared to 2014. Total operating expenses decreased 4.6% in 2014 compared to 2013 primarily due to $8.0 million of additional depreciation expense recorded in 2013 and $3.4 million of lower predevelopment expenses related to Park Van Ness partially offset by $1.9 million of higher property operating expenses caused by snow removal costs in early 2014.
Property operating expenses
Property operating expenses increased $0.1 million in 2015 compared to 2014. Property operating expenses increased $1.9 million in 2014 compared to 2013 primarily due to a $1.5 million increase in snow removal costs.
44
Provision for credit losses
The provision for credit losses represents the Company’s estimate of amounts owed by tenants that may not be collectible. The $235,000 increase in 2015 compared to 2014 as well as the $288,000 decrease in 2014 compared to 2013 reflect general stability in the retail economy and lack of significant bankruptcy losses among the Company’s various tenants.
Real estate taxes
Real estate taxes increased $1.3 million in 2015 compared to 2014 primarily due to a $0.5 million increase at 601 Pennsylvania Avenue, a $0.3 million increase at Clarendon Center and small increases throughout the remainder of the portfolio. Real estate taxes decreased $61,000 in 2014 compared to 2013.
Interest and amortization of deferred debt costs
Interest expense decreased $0.9 million in 2015 compared to 2014 primarily due to a $1.5 million increase in the amount of interest capitalized. Interest expense decreased $0.6 million in 2014 compared to 2013 primarily due to a $0.5 million increase in the amount of interest capitalized.
Depreciation and amortization
Depreciation and amortization of deferred leasing costs increased by $2.1 million in 2015 compared to 2014 primarily due to (a) additional depreciation expense on a portion of the buildings at Germantown as a result of the reduction of their useful lives to six months effective May 2015 ($0.7 million) and (b) incremental depreciation expense on buildings purchased in 2014 and 2015 ($0.6 million). Depreciation and amortization of deferred leasing costs decreased $7.9 million in 2014 compared to 2013 primarily due to $8.0 million of additional depreciation expense in 2013 on the building at the former Van Ness Square as a result of the reduction of its useful life to four months effective January 1, 2013.
General and administrative
General and administrative costs decreased $0.6 million in 2015 compared to 2014 and increased $2.0 million in 2014 compared to 2013 primarily due to the accrual in 2014 of $1.1 million of severance costs.
Acquisition related costs
Acquisition related costs in 2015 totaling approximately $0.1 million relate to the purchase of
726 N. Glebe Road. Acquisition related costs in 2014 totaling approximately $0.9 million relate to the purchase of 1580, 1582 and 1584 Rockville Pike and 730 and 750 N. Glebe Road. Acquisition related costs in 2013 totaling approximately $0.1 million relate to the purchase of a retail pad with a 7,100 square foot restaurant located in Gaithersburg, Maryland which is contiguous with and an expansion of the Company's other Kentlands assets.
Predevelopment expenses
Predevelopment expenses in 2015 include lease termination costs and demolition costs which are related to development projects and do not meet the criteria to be capitalized. Predevelopment expenses in 2014 and 2013 represent costs, primarily lease termination and demolition costs, incurred with the repositioning and redevelopment of Van Ness Square.
Gain on Casualty Settlement
Gain on casualty settlement in 2013 reflects insurance proceeds received in excess of the carrying value of assets damaged during a hail storm at French Market in 2012. The insurance proceeds funded substantially all of the restoration of the damaged property.
45
Loss on Early Extinguishment of Debt
On September 4, 2013, the Company closed on a 15-year, non-recourse $18.0 million mortgage loan secured by Seabreeze Plaza. The loan matures in 2028, bears interest at a fixed rate of 3.99%, requires monthly principal and interest payments totaling $94,900 based on a 25-year amortization schedule and requires a final payment of $9.5 million at maturity. Proceeds were used to pay off the $13.5 million remaining balance of existing debt secured by Seabreeze Plaza which was scheduled to mature in May 2014 and the Company incurred $497,000 of related debt extinguishment costs.
Gain on Sales of Properties
Gain on sale of property in 2014 resulted from the April 2014 sale of Giant Center shopping center.
Impact of Inflation
Inflation has remained relatively low during 2015 and 2014. The impact of rising operating expenses due to inflation on the operating performance of the Company’s portfolio would have been mitigated by terms in substantially all of the Company’s leases which contain provisions designed to increase revenues to offset the adverse impact of inflation on the Company’s results of operations. These provisions include upward periodic adjustments in base rent due from tenants, usually based on a stipulated increase and to a lesser extent on a factor of the change in the consumer price index, commonly referred to as the CPI.
In addition, substantially all of the Company’s properties are leased to tenants under long-term leases, which provide for reimbursement of operating expenses by tenants. These leases tend to reduce the Company’s exposure to rising property expenses due to inflation. Inflation and increased costs may have an adverse impact on the Company’s tenants if increases in their operating expenses exceed increases in their revenue.
Liquidity and Capital Resources
Cash and cash equivalents were $10.0 million and $12.1 million at December 31, 2015 and 2014, respectively. The changes in cash and cash equivalents during the years ended December 31, 2015 and 2014 were attributable to operating, investing and financing activities, as described below.
(in thousands) | Year Ended December 31, | ||||||
2015 | 2014 | ||||||
Net cash provided by operating activities | $ | 88,896 | $ | 86,568 | |||
Net cash used in investing activities | (69,587 | ) | (83,589 | ) | |||
Net cash used in financing activities | (21,434 | ) | (8,148 | ) | |||
Decrease in cash and cash equivalents | $ | (2,125 | ) | $ | (5,169 | ) | |
Operating Activities
Net cash provided by operating activities increased $2.3 million to $88.9 million for the year ended December 31, 2015 compared to $86.6 million for the year ended December 31, 2014. Net cash provided by operating activities represents, in each year, cash received primarily from rental income, plus other income, less property operating expenses, normal recurring general and administrative expenses and interest payments on debt outstanding.
Investing Activities
Net cash used in investing activities decreased $14.0 million to $69.6 million for the year ended December 31, 2015 from $83.6 million for the year ended December 31, 2014. Investing activities in 2015 primarily reflect tenant improvements and capital expenditures ($18.9 million), the Company's development
46
activities ($45.9 million) and the acquisition of various retail real estate assets ($4.9 million). Net cash used in investing activities increased $57.6 million to $83.6 million for the year ended December 31, 2014 from $26.0 million for the year ended December 31, 2013. Investing activities in 2014 primarily reflect (a) tenant improvements and capital expenditures ($15.0 million), (b) the Company's development activities ($17.8 million) and (c) the acquisition of various retail real estate assets ($57.5 million).
Financing Activities
Net cash used in financing activities was $21.4 million and $8.1 million for the years ended December 31, 2015 and 2014, respectively. Net cash used in financing activities in 2015 primarily reflects:
• | the repayment of mortgage notes payable totaling $53.0 million; |
• | the repayment of amounts borrowed under the revolving credit facility totaling $35.0 million; |
• | distributions to common stockholders totaling $35.6 million; |
• | distributions to holders of convertible limited partnership units in the Operating Partnership totaling $12.2 million; |
• | distributions made to preferred stockholders totaling $12.4 million; and |
• | payments of $0.3 million for financing costs of mortgage notes payable; |
which was partially offset by:
• | proceeds of $20.0 million received from revolving credit facility draws; |
• | proceeds of $5.7 million from the issuance of limited partnership units in the Operating Partnership under the dividend reinvestment program; |
• | proceeds of $15.6 million from the issuance of common stock under the dividend reinvestment program, directors deferred plan and the exercise of stock options; and |
• | proceeds of $39.8 million received from construction loan draws. |
Net cash used in financing activities for the year ended December 31, 2014 primarily reflects:
• | repayments of $47.0 million on the revolving credit facility; |
• | preferred stock redemption payments totaling $40.0 million; |
• | the repayment of mortgage notes payable totaling $22.1 million; |
• | distributions to common stockholders totaling $32.3 million; |
• | distributions to holders of convertible limited partnership units in the Operating Partnership totaling $11.1 million; |
• | distributions to preferred stockholders totaling $13.5 million; and |
• | payments of $1.3 million for financing costs of new mortgage loans; |
which was partially offset by:
• | proceeds of $39.3 million received from the sale of Series C preferred stock; |
• | proceeds of $90.0 million from revolving credit facility; |
• | proceeds of $8.9 million from the issuance of limited partnership units in the Operating Partnership under the divided reinvestment program; |
• | proceeds of $15.6 million received from the issuance of common stock under the dividend reinvestment program and from the exercise of stock options; and |
• | proceeds of $5.4 million from construction loan draws. |
47
Liquidity Requirements
Short-term liquidity requirements consist primarily of normal recurring operating expenses and capital expenditures, debt service requirements (including debt service relating to additional and replacement debt), distributions to common and preferred stockholders, distributions to unit holders and amounts required for expansion and renovation of the Current Portfolio Properties and selective acquisition and development of additional properties. In order to qualify as a REIT for federal income tax purposes, the Company must distribute to its stockholders at least 90% of its “real estate investment trust taxable income,” as defined in the Code. The Company expects to meet these short-term liquidity requirements (other than amounts required for additional property acquisitions and developments) through cash provided from operations, available cash and its existing line of credit.
Long-term liquidity requirements consist primarily of obligations under our long-term debt and dividends paid to our preferred shareholders. We anticipate that long-term liquidity requirements will also include amounts required for property acquisitions and developments. The Company is developing Park Van Ness, a primarily residential project with street-level retail. The total cost of the project, excluding predevelopment expense and land costs, is expected to be approximately $93.0 million, a portion of which is being funded with a $71.6 million construction-to-permanent loan and the remainder will be funded with the Company's working capital, including its existing line of credit. The Company may also redevelop certain of the Current Portfolio Properties and may develop additional freestanding outparcels or expansions within certain of the Shopping Centers.
Acquisition and development of properties are undertaken only after careful analysis and review, and management’s determination that such properties are expected to provide long-term earnings and cash flow growth. During the coming year, developments, expansions or acquisitions are expected to be funded with available cash, bank borrowings from the Company’s credit line, construction and permanent financing, proceeds from the operation of the Company’s dividend reinvestment plan or other external debt or equity capital resources available to the Company. Any future borrowings may be at the Saul Centers, Operating Partnership or Subsidiary Partnership level, and securities offerings may include (subject to certain limitations) the issuance of additional limited partnership interests in the Operating Partnership which can be converted into shares of Saul Centers common stock. The availability and terms of any such financing will depend upon market and other conditions.
48
Contractual Payment Obligations
As of December 31, 2015, the Company had unfunded contractual payment obligations of approximately $49.0 million, excluding operating obligations, due within the next 12 months. The table below shows the total contractual payment obligations as of December 31, 2015.
Payments Due By Period | |||||||||||||||||||
(Dollars in thousands) | One Year or Less | 2 - 3 Years | 4 - 5 Years | After 5 Years | Total | ||||||||||||||
Notes Payable: | |||||||||||||||||||
Interest | $ | 4,030 | $ | 7,042 | $ | 5,513 | $ | 12,280 | $ | 28,865 | |||||||||
Scheduled Principal | 24,655 | 51,701 | 46,509 | 127,678 | 250,543 | ||||||||||||||
Balloon Payments | — | 70,178 | 121,956 | 432,565 | 624,699 | ||||||||||||||
Subtotal | 28,685 | 128,921 | 173,978 | 572,523 | 904,107 | ||||||||||||||
Ground Leases (1) | 176 | 351 | 359 | 9,005 | 9,891 | ||||||||||||||
Corporate Headquarters Lease (1) | 789 | 132 | — | — | 921 | ||||||||||||||
Development Obligations | 12,310 | 3,554 | — | — | 15,864 | ||||||||||||||
Tenant Improvements | 7,021 | — | 278 | — | 7,299 | ||||||||||||||
Total Contractual Obligations | $ | 48,981 | $ | 132,958 | $ | 174,615 | $ | 581,528 | $ | 938,082 | |||||||||
(1) | See Note 7 to Consolidated Financial Statements. Corporate Headquarters Lease amounts represent an allocation to the Company based upon employees’ time dedicated to the Company’s business as specified in the Shared Services Agreement. Future amounts are subject to change as the number of employees employed by each of the parties to the lease fluctuates. |
Management believes that the Company’s cash flow from operations and its capital resources, which at December 31, 2015, included cash balances of $10.0 million and borrowing availability of approximately $246.6 million on its revolving line of credit, will be sufficient to meet its contractual obligations for the foreseeable future.
Preferred Stock Issues
In March 2013, the Company redeemed 60% of its then-outstanding 8% Series A Cumulative Redeemable Preferred Stock (the “Series A Stock”) and all of its 9% Series B Cumulative Redeemable Preferred Stock. In December 2014, the Company redeemed the remaining outstanding Series A Stock.
In February 2013, the Company sold, in an underwritten public offering, 5.6 million depositary shares, each representing 1/100th of a share of 6.875% Series C Cumulative Redeemable Preferred Stock (the "Series C Stock"), providing net cash proceeds of approximately $135.2 million. The depositary shares may be redeemed at the Company’s option, in whole or in part, at the $25.00 liquidation preference plus accrued but unpaid dividends on or after February 12, 2018. The depositary shares pay an annual dividend of $1.71875 per share, equivalent to 6.875% of the $25.00 liquidation preference. The first dividend was paid on April 15, 2013 and covered the period from February 12, 2013 through March 31, 2013. The Series C Stock has no stated maturity, is not subject to any sinking fund or mandatory redemption and is not convertible into any other securities of the Company except in connection with certain changes of control or delisting events. Investors in the depositary shares generally have no voting rights, but will have limited voting rights if the Company fails to pay dividends for six or more quarters (whether or not declared or consecutive) and in certain other events.
In November 2014, the Company sold, in an underwritten public offering, 1.6 million depositary shares of the Series C Stock (the "Additional Series C Stock"). The Company received proceeds of approximately
$39.3 million from the offering and used the proceeds to redeem its outstanding Series A Stock. The Additional Series C Stock represents a new issuance of additional depositary shares representing shares of Series C Stock.
49
Dividend Reinvestments
In December 1995, the Company established a Dividend Reinvestment Plan (the “Plan”) to allow its common stockholders and holders of limited partnership interests an opportunity to buy additional shares of common stock by reinvesting all or a portion of their dividends or distributions. The Plan provides for investing in newly issued shares of common stock at a 3% discount from market price without payment of any brokerage commissions, service charges or other expenses. All expenses of the Plan are paid by the Company. The Company issued 193,678 and 190,177 shares under the Plan at a weighted average discounted price of $52.93 and $46.85 per share during the years ended December 31, 2015 and 2014, respectively. The Company issued 107,037 and 196,183 limited partnership units under the Plan at a weighted average price of $53.00 and $45.25 per unit during the years ended December 31, 2015 and 2014, respectively. The Company also credited 7,534 and 7,461 shares to directors pursuant to the reinvestment of dividends specified by the Directors’ Deferred Compensation Plan at a weighted average discounted price of $53.01 and $47.08 per share, during the years ended December 31, 2015 and 2014, respectively.
Capital Strategy and Financing Activity
As a general policy, the Company intends to maintain a ratio of its total debt to total asset value of 50% or less and to actively manage the Company’s leverage and debt expense on an ongoing basis in order to maintain prudent coverage of fixed charges. Asset value is the aggregate fair market value of the Current Portfolio Properties and any subsequently acquired properties as reasonably determined by management by reference to the properties’ aggregate cash flow. Given the Company’s current debt level, it is management’s belief that the ratio of the Company’s debt to total asset value was below 50% as of December 31, 2015.
The organizational documents of the Company do not limit the absolute amount or percentage of indebtedness that it may incur. The Board of Directors may, from time to time, reevaluate the Company’s debt capitalization policy in light of current economic conditions, relative costs of capital, market values of the Company property portfolio, opportunities for acquisition, development or expansion, and such other factors as the Board of Directors then deems relevant. The Board of Directors may modify the Company’s debt capitalization policy based on such a reevaluation without shareholder approval and consequently, may increase or decrease the Company’s debt to total asset ratio above or below 50% or may waive the policy for certain periods of time. The Company selectively continues to refinance or renegotiate the terms of its outstanding debt in order to achieve longer maturities, and obtain generally more favorable loan terms, whenever management determines the financing environment is favorable.
The following is a summary of notes payable as of December 31, 2015 and 2014.
50
Notes Payable | Year Ended December 31, | Interest | Scheduled | |||||||||||
(Dollars in thousands) | 2015 | 2014 | Rate* | Maturity* | ||||||||||
Fixed rate mortgages: | $ | — | (a) | $ | 15,399 | 7.45 | % | Jun-2015 | ||||||
30,778 | (b) | 32,049 | 6.01 | % | Feb-2018 | |||||||||
33,766 | (c) | 35,398 | 5.88 | % | Jan-2019 | |||||||||
10,928 | (d) | 11,454 | 5.76 | % | May-2019 | |||||||||
15,098 | (e) | 15,819 | 5.62 | % | Jul-2019 | |||||||||
15,064 | (f) | 15,761 | 5.79 | % | Sep-2019 | |||||||||
13,387 | (g) | 14,014 | 5.22 | % | Jan-2020 | |||||||||
10,587 | (h) | 10,881 | 5.60 | % | May-2020 | |||||||||
9,127 | (i) | 9,535 | 5.30 | % | Jun-2020 | |||||||||
40,360 | (j) | 41,441 | 5.83 | % | Jul-2020 | |||||||||
8,025 | (k) | 8,346 | 5.81 | % | Feb-2021 | |||||||||
5,959 | (l) | 6,100 | 6.01 | % | Aug-2021 | |||||||||
34,420 | (m) | 35,222 | 5.62 | % | Jun-2022 | |||||||||
10,492 | (n) | 10,718 | 6.08 | % | Sep-2022 | |||||||||
11,365 | (o) | 11,587 | 6.43 | % | Apr-2023 | |||||||||
14,177 | (p) | 14,909 | 6.28 | % | Feb-2024 | |||||||||
16,348 | (q) | 16,750 | 7.35 | % | Jun-2024 | |||||||||
14,197 | (r) | 14,535 | 7.60 | % | Jun-2024 | |||||||||
25,088 | (s) | 25,639 | 7.02 | % | Jul-2024 | |||||||||
29,714 | (t) | 30,429 | 7.45 | % | Jul-2024 | |||||||||
29,564 | (u) | 30,253 | 7.30 | % | Jan-2025 | |||||||||
15,360 | (v) | 15,735 | 6.18 | % | Jan-2026 | |||||||||
112,299 | (w) | 115,291 | 5.31 | % | Apr-2026 | |||||||||
34,133 | (x) | 35,125 | 4.30 | % | Oct-2026 | |||||||||
38,842 | (y) | 39,932 | 4.53 | % | Nov-2026 | |||||||||
18,150 | (z) | 18,645 | 4.70 | % | Dec-2026 | |||||||||
67,850 | (aa) | 69,397 | 5.84 | % | May-2027 | |||||||||
16,826 | (bb) | 17,281 | 4.04 | % | Apr-2028 | |||||||||
31,844 | (cc) | 33,140 | 3.51 | % | Jun-2028 | |||||||||
17,011 | (dd) | 17,462 | 3.99 | % | Sep-2028 | |||||||||
29,444 | (ee) | — | 3.69 | % | Mar-2030 | |||||||||
15,748 | (ff) | — | 3.99 | % | Apr-2030 | |||||||||
45,208 | (gg) | 5,391 | 4.88 | % | Sep-2032 | |||||||||
11,282 | (hh) | 11,119 | 8.00 | % | Apr-2034 | |||||||||
Total fixed rate | 832,441 | 784,757 | 5.53 | % | 9.2 Years | |||||||||
Variable rate loans: | ||||||||||||||
28,000 | (ii) | 43,000 | LIBOR + 1.45 | % | Jun-2018 | |||||||||
— | (jj) | 14,525 | LIBOR + 1.65 | % | Feb-2016 | |||||||||
14,801 | (kk) | 15,106 | LIBOR + 1.65 | % | Feb-2017 | |||||||||
Total variable rate | 42,801 | 72,631 | LIBOR + 1.94 | % | 2.0 Years | |||||||||
Total notes payable | $ | 875,242 | $ | 857,388 | 5.35 | % | 8.9 Years | |||||||
* | Interest rate and scheduled maturity data presented as of December 31, 2015. Totals computed using weighted averages. |
(a) | The loan was collateralized by Shops at Fairfax and Boulevard shopping centers and required equal monthly principal and interest payments totaling $156,000 based upon a weighted average 23-year amortization |
51
schedule and a final payment of $15.2 million was due at loan maturity. In 2015 the loan was repaid in full and replaced with a new $30.0 million loan. See (ee) below.
(b) | The loan is collateralized by Washington Square and requires equal monthly principal and interest payments of $264,000 based upon a 27.5-year amortization schedule and a final payment of $28.0 million at loan maturity. Principal of $1.3 million was amortized during 2015. |
(c) | The loan is collateralized by three shopping centers, Broadlands Village, The Glen and Kentlands Square I, and requires equal monthly principal and interest payments of $306,000 based upon a 25-year amortization schedule and a final payment of $28.4 million at loan maturity. Principal of $1.6 million was amortized during 2015. |
(d) | The loan is collateralized by Olde Forte Village and requires equal monthly principal and interest payments of $98,000 based upon a 25-year amortization schedule and a final payment of $9.0 million at loan maturity. Principal of $526,000 was amortized during 2015. |
(e) | The loan is collateralized by Countryside and requires equal monthly principal and interest payments of $133,000 based upon a 25-year amortization schedule and a final payment of $12.3 million at loan maturity. Principal of $721,000 was amortized during 2015. |
(f) | The loan is collateralized by Briggs Chaney MarketPlace and requires equal monthly principal and interest payments of $133,000 based upon a 25-year amortization schedule and a final payment of $12.2 million at loan maturity. Principal of $697,000 was amortized during 2015. |
(g) | The loan is collateralized by Shops at Monocacy and requires equal monthly principal and interest payments of $112,000 based upon a 25-year amortization schedule and a final payment of $10.6 million at loan maturity. Principal of $627,000 was amortized during 2015. |
(h) | The loan is collateralized by Boca Valley Plaza and requires equal monthly principal and interest payments of $75,000 based upon a 30-year amortization schedule and a final payment of $9.1 million at loan maturity. Principal of $294,000 was amortized during 2015. |
(i) | The loan is collateralized by Palm Springs Center and requires equal monthly principal and interest payments of $75,000 based upon a 25-year amortization schedule and a final payment of $7.1 million at loan maturity. Principal of $408,000 was amortized during 2015. |
(j) | The loan and a corresponding interest-rate swap closed on June 29, 2010 and are collateralized by Thruway. On a combined basis, the loan and the interest-rate swap require equal monthly principal and interest payments of $289,000 based upon a 25-year amortization schedule and a final payment of $34.8 million at loan maturity. Principal of $1,081,000 was amortized during 2015. |
(k) | The loan is collateralized by Jamestown Place and requires equal monthly principal and interest payments of $66,000 based upon a 25-year amortization schedule and a final payment of $6.1 million at loan maturity. Principal of $321,000 was amortized during 2015. |
(l) | The loan is collateralized by Hunt Club Corners and requires equal monthly principal and interest payments of $42,000 based upon a 30-year amortization schedule and a final payment of $5.0 million, at loan maturity. Principal of $141,000 was amortized during 2015. |
(m) | The loan is collateralized by Lansdowne Town Center and requires monthly principal and interest payments of $230,000 based on a 30-year amortization schedule and a final payment of $28.2 million at loan maturity. Principal of $802,000 was amortized during 2015. |
(n) | The loan is collateralized by Orchard Park and requires equal monthly principal and interest payments of $73,000 based upon a 30-year amortization schedule and a final payment of $8.6 million at loan maturity. Principal of $226,000 was amortized during 2015. |
(o) | The loan is collateralized by BJ’s Wholesale and requires equal monthly principal and interest payments of $80,000 based upon a 30-year amortization schedule and a final payment of $9.3 million at loan maturity. Principal of $222,000 was amortized during 2015. |
(p) | The loan is collateralized by Great Falls shopping center. The loan consists of three notes which require equal monthly principal and interest payments of $138,000 based upon a weighted average 26-year amortization schedule and a final payment of $6.3 million at maturity. Principal of $732,000 was amortized during 2015. |
(q) | The loan is collateralized by Leesburg Pike and requires equal monthly principal and interest payments of $135,000 based upon a 25-year amortization schedule and a final payment of $11.5 million at loan maturity. Principal of $402,000 was amortized during 2015. |
52
(r) | The loan is collateralized by Village Center and requires equal monthly principal and interest payments of $119,000 based upon a 25-year amortization schedule and a final payment of $10.1 million at loan maturity. Principal of $338,000 was amortized during 2015. |
(s) | The loan is collateralized by White Oak and requires equal monthly principal and interest payments of $193,000 based upon a 24.4 year weighted amortization schedule and a final payment of $18.5 million at loan maturity. The loan was previously collateralized by Van Ness Square. During 2012, the Company substituted White Oak as the collateral and borrowed an additional $10.5 million. Principal of $551,000 was amortized during 2015. |
(t) | The loan is collateralized by Avenel Business Park and requires equal monthly principal and interest payments of $246,000 based upon a 25-year amortization schedule and a final payment of $20.9 million at loan maturity. Principal of $715,000 was amortized during 2015. |
(u) | The loan is collateralized by Ashburn Village and requires equal monthly principal and interest payments of $240,000 based upon a 25-year amortization schedule and a final payment of $20.5 million at loan maturity. Principal of $689,000 was amortized during 2015. |
(v) | The loan is collateralized by Ravenwood and requires equal monthly principal and interest payments of $111,000 based upon a 25-year amortization schedule and a final payment of $10.1 million at loan maturity. Principal of $375,000 was amortized during 2015. |
(w) | The loan is collateralized by Clarendon Center and requires equal monthly principal and interest payments of $753,000 based upon a 25-year amortization schedule and a final payment of $70.5 million at loan maturity. Principal of $3.0 million was amortized during 2015. |
(x) | The loan is collateralized by Severna Park MarketPlace and requires equal monthly principal and interest payments of $207,000 based upon a 25-year amortization schedule and a final payment of $20.3 million at loan maturity. Principal of $992,000 was amortized during 2015. |
(y) | The loan is collateralized by Kentlands Square II and requires equal monthly principal and interest payments of $240,000 based upon a 25-year amortization schedule and a final payment of $23.1 million at loan maturity. Principal of $1,090,000 was amortized during 2015. |
(z) | The loan is collateralized by Cranberry Square and requires equal monthly principal and interest payments of $113,000 based upon a 25-year amortization schedule and a final payment of $10.9 million at loan maturity. Principal of $495,000 was amortized during 2015. |
(aa) | The loan in the original amount of $73.0 million closed in May 2012, is collateralized by Seven Corners and requires equal monthly principal and interest payments of $463,200 based upon a 25-year amortization schedule and a final payment of $42.3 million at loan maturity. Principal of $1.5 million was amortized during 2015. |
(bb) | The loan is collateralized by Hampshire Langley and requires equal monthly principal and interest payments of $95,400 based upon a 25-year amortization schedule and a final payment of $9.5 million at loan maturity. Principal of $455,000 was amortized in 2015. |
(cc) | The loan is collateralized by Beacon Center and requires equal monthly principal and interest payments of $203,200 based upon a 20-year amortization schedule and a final payment of $11.4 million at loan maturity. Principal of $1,296,000 was amortized in 2015. |
(dd) | The loan is collateralized by Seabreeze Plaza and requires equal monthly principal and interest payments of $94,900 based upon a 25-year amortization schedule and a final payment of $9.5 million at loan maturity. Principal of $451,000 was amortized in 2015. |
(ee) | The loan is collateralized by Shops at Fairfax and Boulevard shopping centers and requires equal monthly principal and interest payments totaling $153,300 based upon a 25-year amortization schedule and a final payment of $15.5 million at maturity. Principal of $556,000 was amortized in 2015. |
(ff) The loan is collateralized by Northrock and requires equal monthly principal and interest payments totaling $84,400 based upon a 25-year amortization schedule and a final payment of $8.4 million at maturity. Principal of $252,000 was amortized in 2015.
(gg) The loan is a $71.6 million construction-to-permanent facility that is collateralized by and will finance a portion of the construction costs of Park Van Ness. During the construction period, interest will be funded by the loan. After conversion to a permanent loan, monthly principal and interest payments totaling $413,500 will be required based upon a 25-year amortization schedule. A final payment of $39.6 million will be due at maturity.
53
(hh) | The Company entered into a sale-leaseback transaction with its Olney property and is accounting for that transaction as a secured financing. The arrangement requires monthly payments of $60,400 which increase by 1.5% on May 1, 2015, and every May 1 thereafter. The arrangement provides for a final payment of $14.7 million and has an implicit interest rate of 8.0%. Negative amortization in 2015 totaled $163,000. |
(ii) | The loan is a $275.0 million unsecured revolving credit facility. Interest accrues at a rate equal to the sum of one-month LIBOR plus a spread of 145 basis points. The line may be extended at the Company’s option for one year with payment of a fee of 0.15%. Monthly payments, if required, are interest only and vary depending upon the amount outstanding and the applicable interest rate for any given month. |
(jj) | The loan was collateralized by Northrock and required monthly principal and interest payments of approximately $47,000 and a final payment of $14.2 million at maturity. In 2015, the loan was repaid in full and replaced with a new $16.0 million loan. See (ff) above. |
(kk) | The loan is collateralized by Metro Pike Center and requires monthly principal and interest payments of approximately $48,000 and a final payment of $14.8 million at loan maturity. Principal of $305,000 was amortized during 2015. |
The carrying value of properties collateralizing the mortgage notes payable totaled $856.8 million and $895.5 million as of December 31, 2015 and 2014, respectively. The Company’s credit facility requires the Company and its subsidiaries to maintain certain financial covenants, which are summarized below. As of December 31, 2015, the Company was in compliance with all such covenants:
• | maintain tangible net worth, as defined in the loan agreement, of at least $542.1 million plus 80% of the Company’s net equity proceeds received after March 2014; |
• | limit the amount of debt as a percentage of gross asset value, as defined in the loan agreement, to less than 60% (leverage ratio); |
• | limit the amount of debt so that interest coverage will exceed 2.0x on a trailing four-quarter basis (interest expense coverage); and |
• | limit the amount of debt so that interest, scheduled principal amortization and preferred dividend coverage exceeds 1.3x on a trailing four-quarter basis (fixed charge coverage). |
2015 Financing Activity
On March 3, 2015, the Company closed on a 15-year, $30.0 million non-recourse mortgage loan secured by Boulevard and Shops at Fairfax shopping centers in Fairfax, Virginia. The loan matures in 2030, bears interest at a fixed rate of 3.69%, requires monthly principal and interest payments totaling $153,300 based on a 25year amortization schedule and a final payment of $15.5 million at maturity. Proceeds of the loan were used to repay in full the existing 7.45% mortgage in the amount of $15.2 million, which was scheduled to mature in June 2015 and to pay down outstanding balances under the revolving credit facility.
On April 1, 2015, the Company closed on a 15-year, non-recourse $16.0 million mortgage loan secured by Northrock. The loan matures in 2030, bears interest at a fixed rate of 3.99%, requires monthly principal and interest payments totaling $84,400 based on a 25-year amortization schedule and requires a final payment of $8.4 million at maturity. Proceeds of the loan were used to repay in full the $14.5 million remaining balance of existing debt secured by Northrock.
2014 Financing Activity
On June 24, 2014, the Company amended and restated its revolving credit facility. The unsecured revolving credit facility, which can be used for working capital, property acquisitions, development projects or letters of credit was increased to $275.0 million. The revolving credit facility matures on June 23, 2018, and may be extended by the Company for one additional year subject to the Company’s satisfaction of certain conditions. Saul Centers and certain consolidated subsidiaries of the Operating Partnership have guaranteed the payment obligations of the Operating Partnership under the revolving credit facility. Letters of credit may be issued under the revolving credit facility. The interest rate under the facility is variable and equals the sum of one-month LIBOR and a margin that is based on the Company’s leverage ratio, and which can range from 145 basis points to 200 basis points.
54
2013 Financing Activity
On February 27, 2013, the Company closed on a three-year $15.6 million mortgage loan secured by Metro Pike Center. The loan matures in 2017, bears interest at a variable rate equal to the sum of one-month LIBOR and 165 basis points, requires monthly principal and interest payments based on a 25-year amortization schedule and requires a final payment of $14.8 million at maturity. The loan may be extended for one additional year. Proceeds were used to pay-off the $15.9 million remaining balance of existing debt secured by Metro Pike Center, and to extinguish the related swap agreement.
On February 27, 2013, the Company closed on a three-year $15.0 million mortgage loan secured by Northrock. The loan was originally scheduled to mature in 2016 and was refinanced in 2015. The loan bore interest at a variable rate equal to the sum of one-month LIBOR and 165 basis points, required monthly principal and interest payments based on a 25-year amortization schedule and required a final payment of $14.2 million at maturity. Proceeds were used to pay-off the $15.0 million remaining balance of existing debt secured by Northrock.
On March 19, 2013, the Company closed on a 15-year, non-recourse $18.0 million mortgage loan secured by Hampshire Langley. The loan matures in 2028, bears interest at a fixed rate of 4.04%, requires monthly principal and interest payments totaling $95,400 based on a 25-year amortization schedule and requires a final payment of $9.5 million at maturity.
On April 10, 2013, the Company paid in full the $6.9 million remaining balance on the mortgage loan secured by Cruse Marketplace.
On May 28, 2013, the Company closed on a 15-year, non-recourse $35.0 million mortgage loan secured by Beacon Center. The loan matures in 2028, bears interest at a fixed rate of 3.51%, requires monthly principal and interest payments totaling $203,200 based on a 20-year amortization schedule and requires a final payment of $11.4 million at maturity.
On September 4, 2013, the Company closed on a 15-year, non-recourse $18.0 million mortgage loan secured by Seabreeze Plaza. The loan matures in 2028, bears interest at a fixed rate of 3.99%, requires monthly principal and interest payments totaling $94,900 based on a 25-year amortization schedule and requires a final payment of $9.5 million at maturity. Proceeds were used to pay off the $13.5 million remaining balance of existing debt secured by Seabreeze Plaza which was scheduled to mature in May 2014 and the Company incurred $497,000 of related debt extinguishment costs.
On October 25, 2013 the Company closed on a $71.6 million construction-to-permanent loan which will partially finance the construction of Park Van Ness. The loan bears interest at 4.88% and during the construction period it will be fully recourse to Saul Centers and accrued interest will be funded by the loan. Following the completion of construction and lease-up, and upon achieving certain debt service coverage requirements, the loan will convert to a non-recourse, permanent mortgage at the same interest rate, with principal amortization computed based on a 25-year schedule.
Off-Balance Sheet Arrangements
The Company has no off-balance sheet arrangements that are reasonably likely to have a current or future material effect on the Company’s financial condition, revenue or expenses, results of operations, liquidity, capital expenditures or capital resources.
55
Funds From Operations
In 2015, the Company reported Funds From Operations ("FFO")1 available to common stockholders and noncontrolling interests of $83.8 million, a 7.1% increase from 2014 FFO available to common stockholders and noncontrolling interests of $78.3 million. The following table presents a reconciliation from net income to FFO available to common stockholders and noncontrolling interests for the periods indicated:
Year ended December 31, | |||||||||||||||||||
(Dollars in thousands) | 2015 | 2014 | 2013 | 2012 | 2011 | ||||||||||||||
Net income | $ | 52,931 | $ | 57,988 | $ | 34,842 | $ | 39,780 | $ | 30,294 | |||||||||
Subtract: | |||||||||||||||||||
Gains on sales of properties | (11 | ) | (6,069 | ) | — | (4,510 | ) | — | |||||||||||
Gain on casualty settlement | — | — | (77 | ) | (219 | ) | (245 | ) | |||||||||||
Add: | |||||||||||||||||||
Real estate depreciation - discontinued operations | — | — | — | 77 | 102 | ||||||||||||||
Real estate depreciation and amortization | 43,270 | 41,203 | 49,130 | 40,112 | 35,298 | ||||||||||||||
FFO | 96,190 | 93,122 | 83,895 | 75,240 | 65,449 | ||||||||||||||
Subtract: | |||||||||||||||||||
Preferred dividends | (12,375 | ) | (13,361 | ) | (13,983 | ) | (15,140 | ) | (15,140 | ) | |||||||||
Preferred stock redemption | — | (1,480 | ) | (5,228 | ) | — | — | ||||||||||||
FFO available to common stockholders and noncontrolling interests | $ | 83,815 | $ | 78,281 | $ | 64,684 | $ | 60,100 | $ | 50,309 | |||||||||
Average shares and units used to compute FFO per share | 28,449 | 27,977 | 27,330 | 26,614 | 24,740 | ||||||||||||||
FFO per share | $ | 2.95 | $ | 2.80 | $ | 2.37 | $ | 2.26 | $ | 2.03 | |||||||||
1 The National Association of Real Estate Investment Trusts (NAREIT) developed FFO as a relative non-GAAP financial measure of performance of an equity REIT in order to recognize that income-producing real estate historically has not depreciated on the basis determined under GAAP. FFO is defined by NAREIT as net income, computed in accordance with GAAP, plus real estate depreciation and amortization, and excluding extraordinary items, impairment charges on depreciable real estate assets and gains or losses from property dispositions. FFO does not represent cash generated from operating activities in accordance with GAAP and is not necessarily indicative of cash available to fund cash needs, which is disclosed in the Company’s Consolidated Statements of Cash Flows for the applicable periods. There are no material legal or functional restrictions on the use of FFO. FFO should not be considered as an alternative to net income, its most directly comparable GAAP measure, as an indicator of the Company’s operating performance, or as an alternative to cash flows as a measure of liquidity. Management considers FFO a meaningful supplemental measure of operating performance because it primarily excludes the assumption that the value of the real estate assets diminishes predictably over time (i.e. depreciation), which is contrary to what we believe occurs with our assets, and because industry analysts have accepted it as a performance measure. FFO may not be comparable to similarly titled measures employed by other REITs.
Acquisitions, Redevelopments and Renovations
Management anticipates that during the coming year the Company will continue activities related to the redevelopment of Van Ness Square and may develop additional freestanding outparcels or expansions within certain of the Shopping Centers. Although not currently planned, it is possible that the Company may redevelop additional Current Portfolio Properties and may develop expansions within certain of the Shopping Centers. Acquisition and development of properties are undertaken only after careful analysis and review, and management’s determination that such properties are expected to provide long-term earnings and cash flow growth. During the coming year, any
56
developments, expansions or acquisitions are expected to be funded with borrowings from the Company’s credit line, construction financing, proceeds from the operation of the Company’s dividend reinvestment plan or other external capital resources available to the Company.
The Company has been selectively involved in acquisition, development, redevelopment and renovation activities. It continues to evaluate the acquisition of land parcels for retail and office development and acquisitions of operating properties for opportunities to enhance operating income and cash flow growth. The following describes significant acquisitions, developments, redevelopments and renovations which affected the Company’s financial position and results of operations in 2015, 2014, and 2013.
1500, 1580, 1582 and 1584 Rockville Pike
In December 2012, the Company purchased for $23.0 million, including acquisition costs, approximately 52,700 square feet of retail space located on the east side of Rockville Pike near the Twinbrook Metro station.
In January 2014, the Company purchased for $8.0 million a single-tenant retail property with a 12,100 square foot CVS Pharmacy located at 1580 Rockville Pike in Rockville, Maryland, and incurred acquisition costs of $0.2 million.
In April 2014, the Company purchased for $11.0 million a single-tenant retail property with a 40,700 square foot furniture store located at 1582 Rockville Pike in Rockville, Maryland, and incurred acquisition costs totaling approximately $0.2 million. Concurrently with the purchase, the Company sold to the same party, for $11.0 million, the 53,765 square foot Olney Center located in Olney, Maryland.
In December 2014, the Company purchased for $6.2 million a single-tenant retail property with a 4,600 square foot restaurant located at 1584 Rockville Pike in Rockville, Maryland, and incurred acquisition costs totaling approximately $0.2 million.
The properties at 1580, 1582 and 1584 Rockville Pike are contiguous with and an expansion of the Company’s assets at 1500 Rockville Pike. When combined with 1500 Rockville Pike, the four properties comprise 10.3 acres which are zoned for development potential of up to 1.2 million square feet of mixed-use space. The Company is actively engaged in a plan for redevelopment but has not committed to any timetable for commencement of construction.
Olney
Simultaneously with the sale of Olney Center, the Company entered into a lease of the property with the buyer and the Company continues to operate and manage the property. The lease term is 20 years and the Company has the option to purchase the property for $14.6 million at the end of the lease term. The purchaser has the right to sell the property to the Company at any time from and after April 2016 at a price equal to $11.0 million increased by 1.5% annually beginning January 1, 2015 and continuing each January thereafter. The Company has accounted for this transaction as a secured financing.
5541 Nicholson Lane and 11503 Rockville Pike
In December 2012, the Company purchased for $12.2 million, including acquisition costs, approximately 20,100 square feet of retail space, located on the east side of Rockville Pike near the White Flint Metro station and adjacent to 11503 Rockville Pike, which was purchased in 2010. The property, when combined with 11503 Rockville Pike, will provide zoning for up to 331,000 square feet of mixed-use space. When combining these two properties with our Metro Pike Center on the west side of Rockville Pike, the Company's holdings at White Flint total 7.6 acres which are zoned for a development potential of up to 1.6 million square feet of mixed-use space. The Company is actively engaged in a plan for redevelopment but has not committed to any timetable for commencement of construction.
Westview Pad
In February 2015, the Company purchased for $0.9 million, including acquisition costs, a 1.1 acre retail pad site in Frederick, Maryland, which is contiguous with and an expansion of the Company's other Westview asset.
57
726, 730, 750 N. Glebe Road
In August 2014, the Company purchased for $40.0 million a single-tenant retail property with a 16,900 square foot automobile dealership located at 750 N. Glebe Road in Arlington, Virginia, and incurred acquisition costs of $0.4 million. In December 2014, the Company purchased for $2.8 million an adjacent single-tenant retail property with a 2,000 square foot store, and incurred acquisition costs of $40,400. In September 2015, the Company purchased an additional property on North Glebe Road, which is adjacent to the two properties acquired in 2014, for $4.0 million. The properties comprise 2.5 acres of land which is zoned for development potential of up to 550,000 square feet of mixed-use space. The Company is actively engaged in a plan for redevelopment but has not committed to any timetable for commencement of construction.
Park Van Ness
The Company continues to develop Park Van Ness, a 271-unit residential project with approximately 9,000 square feet of street-level retail, below street-level structured parking, and amenities including a community room, landscaped courtyards, a fitness room and a rooftop pool and deck. Construction is projected to be substantially completed early in the second quarter of 2016. The structure comprises 11 levels, five of which are below street level. Interior finishes are nearing completion and site work is being finalized. The street level retail space is 100% leased to a grocery/gourmet food market and an upscale Italian restaurant. The total cost of the project, excluding predevelopment expense and land (which the Company has owned), is expected to be approximately $93.0 million, a portion of which is being financed with a $71.6 million construction-to-permanent loan. Costs incurred through December 31, 2015, total approximately $77.2 million, of which $45.2 million has been financed by the loan.
Property Sales
Giant Center
In April 2014, the Company sold for $7.5 million the 70,040 square foot Giant Center located in Milford Mill, Maryland and recognized a $6.1 million gain. As of March 31, 2014, the carrying amounts of the associated assets and liabilities were $0.5 million and $0.1 million, respectively. There was no debt on the property.
Portfolio Leasing Status
The following chart sets forth certain information regarding commercial leases at our properties for the periods indicated.
Total Properties | Total Square Footage | Percentage Leased | ||||||||||||||||
As of December 31, | Shopping Centers | Mixed-Use | Shopping Centers | Mixed-Use | Shopping Centers | Mixed-Use | ||||||||||||
2015 | 50 | 6 | 7,896,499 | 1,453,159 | 95.4 | % | 91.0 | % | ||||||||||
2014 | 50 | 6 | 7,886,304 | 1,453,159 | 95.0 | % | 90.8 | % | ||||||||||
2013 | 50 | 6 | 7,880,269 | 1,452,742 | 94.5 | % | 90.5 | % | ||||||||||
The 2015 Shopping Center leasing percentage includes one property acquired in 2015. There is no change in 2015 in the properties that comprise the Mixed-Use leasing percentage. The Clarendon Center residential component was 99.2% leased at December 31, 2015. On a same property basis, which excludes the impact of properties not in operation for the entirety of the comparable periods, the Shopping Center leasing percentage increased to 95.3% from 95.0%. and the Mixed-Use leasing percentage increased to 91.0% from 90.8%. The overall portfolio leasing percentage, on a comparative same property basis, increased to 94.7% at December 31, 2015 from 94.4% at December 31, 2014.
The 2014 Shopping Center leasing percentage includes the five properties acquired in 2014 and excludes the Giant Center, which was sold in 2014. There is no change in 2014 in the properties that comprise the Mixed-Use leasing percentage. The Clarendon Center residential component was 95.9% leased at December 31,
58
2014. On a same property basis, which excludes the impact of properties not in operation for the entirety of the comparable periods, the Shopping Center leasing percentage increased to 95.0% from 94.5%. and the Mixed-Use leasing percentage increased to 90.8% from 90.5%. The overall portfolio leasing percentage, on a comparative same property basis, increased to 94.4% at December 31, 2014 from 93.9% at December 31, 2013.
There were no changes from the prior year in the properties that comprise the 2013 Shopping Centers percentage leased. The 2013 Mixed-Use percentage leased excludes Park Van Ness, which was taken out of service in March 2013 and is currently being redeveloped. The Clarendon Center residential component was 99.2% leased at December 31, 2013. On a same property basis, Shopping Center leasing percentages increased to 94.5% from 93.4% and Mixed-Use leasing percentages increased to 90.5% from 87.7%. The overall portfolio lease percentage, on a comparative same property basis, ended the year at 93.9%, an increase from 92.6% at year end 2012. The 2013 Shopping Centers percentage leased was impacted by a net increase of 88,600 square feet, 70,800 square feet of which resulted from improved leasing of small shop space (spaces totaling 10,000 square feet or less) throughout the portfolio. The 2013 Mixed-Use percentage leased was impacted by a net increase of 34,500 square feet, the majority of which resulted from improved leasing at Avenel Business Park.
The following table shows selected data for leases executed in the indicated periods. The information is based on executed leases without adjustment for the timing of occupancy, tenant defaults, or landlord concessions. The base rent for an expiring lease is the annualized contractual base rent, on a cash basis, as of the expiration date of the lease. The base rent for a new or renewed lease is the annualized contractual base rent, on a cash basis, as of the expected rent commencement date. Because tenants that execute leases may not ultimately take possession of their space or pay all of their contractual rent, the changes presented in the table provide information only about trends in market rental rates. The actual changes in rental income received by the Company may be different.
Base Rent per Square Foot | ||||||||||||||
Year ended December 31, | Square Feet | Number of Leases | New/Renewed Leases | Expiring Leases | ||||||||||
2015 | 1,583,310 | 259 | $ | 15.15 | $ | 14.82 | ||||||||
2014 | 1,224,700 | 276 | 18.60 | 18.26 | ||||||||||
2013 | 1,471,000 | 276 | 19.56 | 19.75 | ||||||||||
Additional information about commercial leasing activity during the three months ended December 31, 2015, is set forth below. The below information includes leases for space which had not been previously leased during the period of the Company's ownership, either a result of acquisition or development.
New Leases | Renewed Leases | |||||||
Number of leases | 15 | 38 | ||||||
Square feet | 28,435 | 113,347 | ||||||
Per square foot average annualized: | ||||||||
Base rent | $ | 25.16 | $ | 26.34 | ||||
Tenant improvements | (3.00 | ) | (0.34 | ) | ||||
Leasing costs | (0.37 | ) | — | |||||
Rent concessions | (0.32 | ) | — | |||||
Effective rents | $ | 21.47 | $ | 26.00 | ||||
During 2015, the Company entered into 222 new or renewed apartment leases. The monthly rent per square foot for these leases was unchanged at $3.45. During 2014, the Company entered into 234 new or renewed apartment leases. The monthly rent per square foot for these leases increased to $3.46 from $3.37. During 2013, the
59
Company entered into 228 new or renewed apartment leases. The monthly rent per square foot for these leases increased to $3.37 from $3.24.
As of December 31, 2015, 1,035,195 square feet of Commercial space was subject to leases scheduled to expire in 2016. Below is information about existing and estimated market base rents per square foot for that space.
Expiring Leases: | Total | |||
Square feet | 1,035,195 | |||
Average base rent per square foot | $ | 15.32 | ||
Estimated market base rent per square foot | $ | 15.38 | ||
Item 7A. Quantitative and Qualitative Disclosures About Market Risk
The Company is exposed to certain financial market risks, the most predominant being fluctuations in interest rates. Interest rate fluctuations are monitored by management as an integral part of the Company’s overall risk management program, which recognizes the unpredictability of financial markets and seeks to reduce the potentially adverse effect on the Company’s results of operations.
The Company may, where appropriate, employ derivative instruments, such as interest rate swaps, to mitigate the risk of interest rate fluctuations. The Company does not enter into derivatives or other financial instruments for trading or speculative purposes. On June 29, 2010, the Company entered into an interest rate swap agreement with a $45.6 million notional amount to manage the interest rate risk associated with $45.6 million of variable-rate mortgage debt. The swap agreement was effective July 1, 2010, terminates on July 1, 2020 and effectively fixes the interest rate on the mortgage debt at 5.83%. The aggregate fair value of the swap at December 31, 2015 was approximately $2.9 million and is reflected in accounts payable, accrued expenses and other liabilities in the consolidated balance sheet.
The Company is exposed to interest rate fluctuations which will affect the amount of interest expense of its variable rate debt and the fair value of its fixed rate debt. As of December 31, 2015, the Company had variable rate indebtedness totaling $42.8 million. If the interest rates on the Company’s variable rate debt instruments outstanding at December 31, 2015 had been one percent higher, our annual interest expense relating to these debt instruments would have increased by $428,010, based on those balances. As of December 31, 2015, the Company had fixed-rate indebtedness totaling $832.4 million with a weighted average interest rate of 5.53%. If interest rates on the Company’s fixed-rate debt instruments at December 31, 2015 had been one percent higher, the fair value of those debt instruments on that date would have decreased by approximately $43.3 million.
60
Item 8. Financial Statements and Supplementary Data
The financial statements of the Company and its consolidated subsidiaries are included in this report on the pages indicated, and are incorporated herein by reference:
Page | |
Item 9. Changes in and Disagreements with Accountants on Accounting and Financial Disclosure
None.
Item 9A. Controls and Procedures
Quarterly Assessment.
The Company carried out an assessment as of December 31, 2015 of the effectiveness of the design and operation of its disclosure controls and procedures and its internal control over financial reporting. This assessment was done under the supervision and with the participation of management, including the Company’s Chairman and Chief Executive Officer, its Senior Vice President-Chief Financial Officer, Secretary and Treasurer, and its Senior Vice President-Chief Accounting Officer as appropriate. Rules adopted by the SEC require that the Company present the conclusions of the Company’s Chairman and Chief Executive Officer and its Senior Vice President-Chief Financial Officer, Secretary and Treasurer about the effectiveness of the Company’s disclosure controls and procedures and the conclusions of the Company’s management about the effectiveness of its internal control over financial reporting as of the end of the period covered by this Annual Report on Form 10-K.
CEO and CFO Certifications.
Included as Exhibits 31 to this Annual Report on Form 10-K are forms of “Certification” of the Company’s Chairman and Chief Executive Officer and its Senior Vice President-Chief Financial Officer, Secretary and Treasurer. The forms of Certification are required in accordance with Section 302 of the Sarbanes-Oxley Act of 2002. This section of the Annual Report on Form 10-K that you are currently reading is the information concerning the assessment referred to in the Section 302 certifications and this information should be read in conjunction with the Section 302 certifications for a more complete understanding of the topics presented.
Disclosure Controls and Procedures and Internal Control over Financial Reporting.
Management is responsible for establishing and maintaining adequate disclosure controls and procedures and internal control over financial reporting. Disclosure controls and procedures are designed to provide reasonable assurance that information required to be disclosed in our reports filed or submitted under the Exchange Act, such as this Annual Report on Form 10-K, is recorded, processed, summarized and reported within the time periods specified in the SEC’s rules and forms. Disclosure controls and procedures are also designed to provide reasonable assurance that such information is accumulated and communicated to the Company’s management, including the Company’s Chairman and Chief Executive Officer, its Senior Vice President-Chief Financial Officer, Secretary and Treasurer, and its Senior Vice President-Chief Accounting Officer, as appropriate to allow timely decisions regarding required disclosure.
61
Internal control over financial reporting is a process designed by, or under the supervision of the Company’s Chairman and Chief Executive Officer, its Senior Vice President-Chief Financial Officer, Secretary and Treasurer, and its Senior Vice President-Chief Accounting Officer, and effected by the Company’s Board of Directors, management and other personnel, to provide reasonable assurance regarding the reliability of financial reporting and the preparation of financial statements for external purposes in accordance with U. S. GAAP and includes those policies and procedures that:
• | pertain to the maintenance of records that in reasonable detail accurately and fairly reflect the transactions and dispositions of the Company’s assets; |
• | provide reasonable assurance that transactions are recorded as necessary to permit preparation of financial statements in accordance with U. S. GAAP, and that the Company’s receipts and expenditures are being made only in accordance with authorizations of management or the Company’s Board of Directors; and |
• | provide reasonable assurance regarding prevention or timely detection of unauthorized acquisition, use or disposition of the Company’s assets that could have a material adverse effect on the Company’s financial statements. |
Limitations on the Effectiveness of Controls.
Management, including the Company’s Chairman and Chief Executive Officer, its Senior Vice President-Chief Financial Officer, Secretary and Treasurer, and its Senior Vice President-Chief Accounting Officer, does not expect that the Company’s disclosure controls and procedures or internal control over financial reporting will prevent all errors and all fraud. A control system, no matter how well conceived and operated, can provide only reasonable, not absolute, assurance that the objectives of the control system are met. Further, the design of a control system must reflect the fact that there are resource constraints, and the benefits of controls must be considered relative to their costs. Because of the inherent limitations in all control systems, no assessment of controls can provide absolute assurance that all control issues and instances of fraud, if any, within the Company have been detected. These inherent limitations include the realities that judgments in decision-making can be faulty, and that breakdowns can occur because of simple error or mistake. Additionally, controls can be circumvented by the individual acts of some persons, by collusion of two or more people, or by management’s override of the control. The design of any system of controls also is based in part upon certain assumptions about the likelihood of future events, and there can be no assurance that any design will succeed in achieving its stated goals under all potential future conditions; over time, controls may become inadequate because of changes in conditions, or the degree of compliance with the policies or procedures may deteriorate. Because of the inherent limitations in a cost-effective control system, misstatements due to error or fraud may occur and not be detected.
Scope of the Assessments.
The assessment by the Company’s Chairman and Chief Executive Officer, its Senior Vice President-Chief Financial Officer, Secretary and Treasurer, and its Senior Vice President-Chief Accounting Officer of the Company’s disclosure controls and procedures and the assessment by the Company’s management of the Company’s internal control over financial reporting included a review of procedures and discussions with the Company’s Disclosure Committee and others in the Company. In the course of the assessments, management sought to identify data errors, control problems or acts of fraud and to confirm that appropriate corrective action, including process improvements, were being undertaken. Management used the criteria issued by the Committee of Sponsoring Organizations of the Treadway Commission in Internal Control - Integrated Framework (2013 Framework) to assess the effectiveness of the Company’s internal control over financial reporting. The evaluation of the Company’s disclosure controls and procedures and internal control over financial reporting is done on a quarterly basis so that the conclusions concerning the effectiveness of disclosure controls can be reported in the Company’s Quarterly Reports on Form 10-Q and Annual Report on Form 10-K.
The Company’s internal control over financial reporting is also evaluated on an ongoing basis by management, other personnel in the Company’s accounting department and the Company’s internal audit function. The effectiveness of the Company’s internal control over financial reporting is audited by the Company’s independent registered public accounting firm. We consider the results of these various assessment activities as we
62
monitor the Company’s disclosure controls and procedures and internal control over financial reporting and when deciding to make modifications as necessary. Management’s intent in this regard is that the disclosure controls and procedures and the internal control over financial reporting will be maintained and updated (including improvements and corrections) as conditions warrant.
Assessment of Effectiveness of Disclosure Controls and Procedures
Based upon the assessments, the Company’s Chairman and Chief Executive Officer, its Senior Vice President-Chief Financial Officer, Secretary and Treasurer, and its Senior Vice President-Chief Accounting Officer have concluded that, as of December 31, 2015, the Company’s disclosure controls and procedures were effective.
Assessment of Effectiveness of Internal Control Over Financial Reporting.
Management is responsible for establishing and maintaining adequate internal control over financial reporting. Management used the criteria issued by the Committee of Sponsoring Organizations of the Treadway Commission in Internal Control - Integrated Framework (2013 Framework) to assess the effectiveness of the Company’s internal control over financial reporting. Based upon the assessments, the Company’s management has concluded that, as of December 31, 2015, the Company’s internal control over financial reporting was effective. The Company’s independent registered public accounting firm has issued a report on the effectiveness of the Company’s internal control over financial reporting, which appears on page F-2 of this Annual Report on Form 10-K.
Changes in Internal Control Over Financial Reporting.
During the three months ended December 31, 2015, there was no change in the Company’s internal control over financial reporting that has materially affected, or is reasonably likely to materially affect, the Company’s internal control over financial reporting.
Item 9B. Other Information
None.
PART III
Item 10. Directors, Executive Officers and Corporate Governance
The information this Item requires is incorporated by reference to the information under the captions “The Board of Directors,” “Corporate Governance – Ethical Conduct Policy and Senior Financial Officer Code of Ethics,” “Section 16(a) Beneficial Ownership Reporting Compliance,” “Corporate Governance – Nominating and Corporate Governance Committee – Selection of Director Nominees,” and “Corporate Governance – Audit Committee” of the Company’s Proxy Statement to be filed with the SEC for its annual stockholders’ meeting to be held on May 6, 2016 (the “Proxy Statement”).
Item 11. Executive Compensation
The information this Item requires is incorporated by reference to the information under the captions “Corporate Governance – Compensation of Directors,” “Report of the Compensation Committee,” and “Executive Compensation” of the Proxy Statement.
Item 12. Security Ownership of Certain Beneficial Owners and Management and Related Shareholder Matters
The information this Item requires is incorporated by reference to the information under the captions “Equity Compensation Plan Information” and “Security Ownership of Certain Beneficial Owners and Management” of the Proxy Statement.
63
Item 13. Certain Relationships and Related Transactions and Director Independence
The information this Item requires is incorporated by reference to the information under the captions “Certain Relationships and Transactions” and “Corporate Governance – Board of Directors” of the Proxy Statement.
Item 14. Principal Accountant Fees and Services
The information this Item requires is incorporated by reference to the information contained in the Proxy Statement under the caption “Audit Committee Report – 2015 and 2014 Independent Registered Public Accounting Firm Fee Summary” of the Proxy Statement.
64
PART IV
Item 15. Exhibits and Financial Statement Schedules
(a) | The following documents are filed as part of this report: | |
1. | Financial Statements | |
The following financial statements of the Company and their consolidated subsidiaries are incorporated by reference in Part II, Item 8. | ||
(a) | Reports of Independent Registered Public Accounting Firm – Ernst & Young LLP | |
(b) | Consolidated Balance Sheets - December 31, 2015 and 2014 | |
(c) | Consolidated Statements of Operations - Years ended December 31, 2015, 2014, and 2013. | |
(d) | Consolidated Statements of Comprehensive Income – Years ended December 31, 2015, 2014, and 2013. | |
(e) | Consolidated Statements of Stockholders’ Equity - Years ended December 31, 2015, 2014, and 2013. | |
(f) | Consolidated Statements of Cash Flows - Years ended December 31, 2015, 2014, and 2013. | |
(g) | Notes to Consolidated Financial Statements | |
2. | Financial Statement Schedule and Supplementary Data | |
(a) | Selected Quarterly Financial Data for the Company are incorporated by reference in Part II, Item 8 | |
(b) | Schedule of the Company: | |
Schedule III - Real Estate and Accumulated Depreciation | ||
All other schedules for which provision is made in the applicable accounting regulations of the Securities and Exchange Commission are not required under the related instructions or are inapplicable and therefore have been omitted. | ||
65
Exhibits | ||
3. | (a) | First Amended and Restated Articles of Incorporation of Saul Centers, Inc. filed with the Maryland Department of Assessments and Taxation on August 23, 1994 and filed as Exhibit 3.(a) of the 1993 Annual Report of the Company on Form 10-K are hereby incorporated by reference. Articles of Amendment to the First Amended and Restated Articles of Incorporation of Saul Centers, Inc., filed with the Maryland Department of Assessments and Taxation on May 28, 2004 and filed as Exhibit 3.(a) of the June 30, 2004 Quarterly Report of the Company is hereby incorporated by reference. Articles of Amendment to the First Amended and Restated Articles of Incorporation of Saul Centers, Inc., filed with the Maryland Department of Assessments and Taxation on May 26, 2006 and filed as Exhibit 3.(a) of the Company’s Current Report on Form 8-K filed May 30, 2006 is hereby incorporated by reference. Articles of Amendment to the First Amended and Restated Articles of Incorporation of Saul Centers, Inc., filed with the Maryland State Department of Assessments and Taxation on May 14, 2013 and filed as Exhibit 3.(a) of the Company's Current Report on Form 8-K filed May 14, 2013, is hereby incorporated by reference. |
(b) | Amended and Restated Bylaws of Saul Centers, Inc. as in effect at and after August 24, 1993 and as of August 26, 1993 and filed as Exhibit 3.(b) of the 1993 Annual Report of the Company on Form 10-K are hereby incorporated by reference. Amendment No. 1 to Amended and Restate Bylaws of Saul Centers, Inc. adopted November 29, 2007 and filed as Exhibit 3(b) of the Company’s Current Report on Form 8-K filed December 3, 2007 is hereby incorporated by reference. | |
(c) | Articles Supplementary to First Amended and Restated Articles of Incorporation of the Company, dated October 30, 2003, filed as Exhibit 2 to the Company’s Current Report on Form 8-A dated October 31, 2003, is hereby incorporated by reference. | |
(d) | Articles Supplementary to First Amended and Restated Articles of Incorporation of the Company, as amended, dated March 26, 2008, filed as Exhibit 3.1 to the Company’s Current Report on Form 8-K, filed March 27, 2008, is hereby incorporated by reference. | |
(e) | Articles Supplementary to First Amended and Restated Articles of Incorporation of the Company, dated February 6, 2013, filed as Exhibit 3.2 to Saul Centers’ Registration Statement on Form 8-A, filed February 7, 2013, is hereby incorporated by reference. | |
(f) | Articles Supplementary to First Amended and Restated Articles of Incorporation of the Company, dated November 10, 2014, filed as Exhibit 3.2 of the Company's Current Report on Form 8-K, dated November 12, 2014, is hereby incorporated by reference. | |
4. | (a) | Deposit Agreement, dated November 5, 2003, among the Company, Continental Stock Transfer & Trust Company, as Depositary, and the holders of depositary receipts, each representing 1/100th of a share of 8% Series A Cumulative Redeemable Preferred Stock of Saul Centers, Inc. and filed as Exhibit 4 to the Registration Statement on Form 8-A on October 31, 2003 is hereby incorporated by reference. |
(b) | Deposit Agreement, dated February 6, 2013, among the Company, Continental Stock Transfer & Trust Company, as Depositary, and the holders of depositary receipts, each representing 1/100th of a share of 6.875% Series C Cumulative Redeemable Preferred Stock of Saul Centers, Inc. filed as Exhibit 4.1 to Saul Centers’ Registration Statement on Form 8-A on February 7, 2013 is hereby incorporated by reference. | |
(c) | Form specimen of receipt representing the depositary shares, each representing 1/100th of a share of 8% Series A Cumulative Redeemable Preferred Stock of Saul Centers, Inc. and included as part of Exhibit 4 to the Registration Statement on Form 8-A on October 31, 2003 is hereby incorporated by reference. | |
(d) | Form specimen of receipt representing the depositary shares, each representing 1/100th of a share of 6.875% Series C Cumulative Redeemable Preferred Stock of Saul Centers, Inc. and included as part of Exhibit 4.1 to Saul Centers’ Registration Statement on Form 8-A on February 7, 2013 is hereby incorporated by reference. | |
(e) | First Amendment to Deposit Agreement, dated November 12, 2014, among the Company, Continental Stock Transfer & Trust Company, as Depositary, and the holders of depositary receipts, each representing 1/100th of a share of 6.875% Series C Cumulative Redeemable Preferred Stock of Saul Centers, Inc. filed as Exhibit 4.2 to of the Company's Current Report on Form 8-K, dated November 12, 2014, is hereby incorporated by reference. | |
66
10. | (a) | First Amended and Restated Agreement of Limited Partnership of Saul Holdings Limited Partnership filed as Exhibit No. 10.1 to Registration Statement No. 33-64562 is hereby incorporated by reference. The First Amendment to the First Amended and Restated Agreement of Limited Partnership of Saul Holdings Limited Partnership, the Second Amendment to the First Amended and Restated Agreement of Limited Partnership of Saul Holdings Limited Partnership, and the Third Amendment to the First Amended and Restated Agreement of Limited Partnership of Saul Holdings Limited Partnership filed as Exhibit 10.(a) of the 1995 Annual Report of the Company on Form 10-K is hereby incorporated by reference. The Fourth Amendment to the First Amended and Restated Agreement of Limited Partnership of Saul Holdings Limited Partnership filed as Exhibit 10.(a) of the March 31, 1997 Quarterly Report of the Company is hereby incorporated by reference. The Fifth Amendment to the First Amended and Restated Agreement of Limited Partnership of Saul Holdings Limited Partnership filed as Exhibit 4.(c) to Registration Statement No. 333-41436, is hereby incorporated by reference. The Sixth Amendment to the First Amended and Restated Agreement of Limited Partnership of Saul Holdings Limited Partnership filed as Exhibit 10.(a) of the September 30, 2003 Quarterly Report of the Company on Form 10-Q is hereby incorporated by reference. The Seventh Amendment to the First Amended and Restated Agreement of Limited Partnership of Saul Holdings Limited Partnership filed as Exhibit 10.(a) of the December 31, 2003 Annual Report of the Company on Form 10-K is hereby incorporated by reference. The Eighth Amendment to the First Amended and Restated Agreement of Limited Partnership of Saul Holdings Limited Partnership filed as Exhibit 10.(a) of the December 31, 2007 Annual Report of the Company on Form 10-K is hereby incorporated by reference. The Ninth Amendment to the First Amended and Restated Agreement of Limited Partnership of Saul Holdings Limited Partnership filed as Exhibit 10.(a) of the March 31, 2008 Quarterly Report of the Company on Form 10-Q is hereby incorporated by reference. The Tenth Amendment to the First Amended and Restated Agreement of Limited Partnership of Saul Holdings Limited Partnership filed as Exhibit 10.(a) of the March 31, 2008 Quarterly Report of the Company on Form 10-Q is hereby incorporated by reference. The Eleventh Amendment to the First Amended and Restated Agreement of Limited Partnership of Saul Holdings Limited Partnership filed as Exhibit 10 (a) of the September 30, 2011 Quarterly Report of the Company on Form 10-Q is hereby incorporated by reference. The Twelfth Amendment to the First Amended and Restated Agreement of Limited Partnership of Saul Holdings Limited Partnership filed as Exhibit 10.1 of the Current Report of the Company on Form 8-K dated February 12, 2013 is hereby incorporated by reference. The Thirteenth Amendment to the First Amended and Restated Agreement of Limited Partnership of Saul Holdings Limited Partnership filed as Exhibit 10.1 of the Current Report of the Company on Form 8-K dated November 12, 2014, is hereby incorporated by reference. |
(b) | First Amended and Restated Agreement of Limited Partnership of Saul Subsidiary I Limited Partnership and Amendment No. 1 thereto filed as Exhibit 10.2 to Registration Statement No. 33-64562 are hereby incorporated by reference. The Second Amendment to the First Amended and Restated Agreement of Limited Partnership of Saul Subsidiary I Limited Partnership, the Third Amendment to the First Amended and Restated Agreement of Limited Partnership of Saul Subsidiary I Limited Partnership and the Fourth Amendment to the First Amended and Restated Agreement of Limited Partnership of Saul Subsidiary I Limited Partnership as filed as Exhibit 10.(b) of the 1997 Annual Report of the Company on Form 10-K are hereby incorporated by reference. | |
(c) | First Amended and Restated Agreement of Limited Partnership of Saul Subsidiary II Limited Partnership and Amendment No. 1 thereto filed as Exhibit 10.3 to Registration Statement No. 33-64562 are hereby incorporated by reference. The Second Amendment to the First Amended and Restated Agreement of Limited Partnership of Saul Subsidiary II Limited Partnership filed as Exhibit 10.(c) of the June 30, 2001 Quarterly Report of the Company is hereby incorporated by reference. The Third Amendment to the First Amended and Restated Agreement of Limited Partnership of Saul Subsidiary II Limited Partnership as filed as exhibit 10.(c) of the 2006 Annual Report of the Company on Form 10-K are hereby incorporated by reference. The Fourth Amendment to the First Amended and Restated Agreement of Limited Partnership of Saul Subsidiary II Limited Partnership as filed as Exhibit 10.(c) of the 2009 Annual Report of the Company on Form 10-K are hereby incorporated by reference. | |
(d) | Property Conveyance Agreement filed as Exhibit 10.4 to Registration Statement No. 33- 64562 is hereby incorporated by reference. | |
(e) | Management Functions Conveyance Agreement filed as Exhibit 10.5 to Registration Statement No. 33-64562 is hereby incorporated by reference. | |
(f) | Registration Rights and Lock-Up Agreement filed as Exhibit 10.6 to Registration Statement No. 33-64562 is hereby incorporated by reference. | |
(g) | Exclusivity and Right of First Refusal Agreement filed as Exhibit 10.7 to Registration Statement No. 33-64562 is hereby incorporated by reference. | |
(h) | Agreement of Assumption dated as of August 26, 1993 executed by Saul Holdings Limited Partnership and filed as Exhibit 10.(i) of the 1993 Annual Report of the Company on Form 10-K is hereby incorporated by reference. | |
67
(i) | Deferred Compensation Plan for Directors, dated as of April 23, 2004 and filed as Exhibit 10.(k) of the June 30, 2004 Quarterly Report of the Company is hereby incorporated by reference. | |
(j) | Amended and Restated Credit Agreement, dated as of June 24, 2014, by and among Saul Holdings Limited Partnership as Borrower; Wells Fargo Bank, National Association, as Administrative Agent and Sole Lead Arranger; JP Morgan Chase Bank, N.A., as Syndication Agent; and Wells Fargo Bank, National Association, JP Morgan Chase Bank, N.A., Capital One, N.A. and Citizens Bank of Pennsylvania as Lenders, as filed as Exhibit 10.1 of the Company’s Current Report on Form 8-K, dated June 25, 2014, is hereby incorporated by reference. | |
(k) | Amended and Restated Guaranty, dated as of June 24, 2014, by and between Saul Centers, Inc., as Guarantor, and Wells Fargo Bank, National Association, as Administrative Agent and Sole Lead Arranger for itself and other financial institutions as Lenders, as filed as Exhibit 10.2 of the Company’s Current Report on Form 8-K, dated June 25, 2014, is hereby incorporated by reference. | |
(l) | The Saul Centers, Inc. 2004 Stock Plan, as amended on April 25, 2008 and May 10, 2013 and filed as Exhibit 10.(a) of the Company's Current Report on Form 8-K filed on May 14, 2013, is hereby incorporated by reference. | |
(m) | Form of Director Stock Option Agreements, as filed as Exhibit 10.(j) of the September 30, 2004 Quarterly Report of the Company, is hereby incorporated by reference. | |
(n) | Form of Officer Stock Option Grant Agreements, as filed as Exhibit 10.(k) of the September 30, 2004 Quarterly Report of the Company, is hereby incorporated by reference. | |
(o) | Promissory Note, dated as of March 23, 2011, by Clarendon Center LLC to The Prudential Life Insurance Company of America as filed as Exhibit 10.(a) of the Company’s Current Report on Form 8-K dated April 28, 2011, is hereby incorporated by reference. | |
(p) | Deed of Trust, Security Agreement and Fixture Filing, dated as of March 23, 2011, by Clarendon Center LLC to Lawyers Title Realty Services, Inc. as trustee for the benefit of The Prudential Insurance Company of America, as beneficiary, as filed as Exhibit 10.(b) of the Company’s Current Report on Form 8-K dated April 28, 2011, is hereby incorporated by reference. | |
(q) | Shared Services Agreement, dated as of July 1, 2004, between B. F. Saul Company and Saul Centers, Inc., as filed as Exhibit 10.(c) of the Company’s Current Report on Form 8- K dated August 11, 2010, is hereby incorporated by reference. | |
(r) | Purchase Agreement, dated as of August 9, 2011, by and among the Company, Saul Holdings Limited Partnership and B. F. Saul Real Estate Investment Trust and filed as Exhibit 10.(r) of the September 30, 2011 Quarterly Report of the Company is hereby incorporated by reference. | |
(s) | Agreement of Purchase and Sale, dated as of August 9, 2011, between Cranberry Retail, Inc. and Saul Holdings Limited Partnership, as amended and filed as Exhibit 2.(a) of the September 30, 2011 Quarterly Report of the Company is hereby incorporated by reference. | |
(t) | Agreement of Purchase and Sale, dated as of August 9, 2011, between Kentlands Retail, Inc. and Saul Holdings Limited Partnership, as amended and filed as Exhibit 2.(b) of the September 30, 2011 Quarterly Report of the Company is hereby incorporated by reference. | |
(u) | Agreement of Purchase and Sale, dated as of August 9, 2011, between Severna Retail, Inc. and Saul Holdings Limited Partnership, as amended and filed as Exhibit 2.(c) of the September 30, 2011 Quarterly Report of the Company is hereby incorporated by reference. | |
(v) | Separation Agreement, dated as of March 25, 2014, by and among Saul Centers, Inc., B. F. Saul Company and Thomas H. McCormick and filed as Exhibit 10(w) of the March 31, 2014 Quarterly Report of the Company is hereby incorporated by reference. | |
21. | Subsidiaries of Saul Centers, Inc. is filed herewith. | |
23. | Consent of Independent Registered Public Accounting Firm is filed herewith. | |
24. | Power of Attorney (included on signature page). | |
31. | Rule 13a-14(a)/15d-14(a) Certifications of Chief Executive Officer and Chief Financial Officer are filed herewith. | |
32. | Section 1350 Certifications of Chief Executive Officer and Chief Financial Officer are filed herewith. | |
68
99. | First Extension, dated November 6, 2015, of Letter Agreement dated October 16, 2014, between B. F. Saul Real Estate Investment Trust and Saul Holdings Limited Partnership regarding Shared Third Party Pre-Development Costs for Twinbrook area properties is filed herewith. | |
101. | The following financial statements from the Company’s Annual Report on Form 10-K for the year ended December 31, 2015, formatted in Extensible Business Reporting Language (“XBRL”): (i) consolidated balance sheets, (ii) consolidated statements of operations, (iii) consolidated statements of changes in stockholders’ equity and comprehensive income, (iv) consolidated statements of cash flows, and (v) the notes to the consolidated financial statements. | |
69
SIGNATURES
Pursuant to the requirements of Section 13 or 15(d) of the Securities Exchange Act of 1934, the registrant has duly caused this report to be signed on its behalf by the undersigned, thereunto duly authorized.
SAUL CENTERS, INC. | |||
(Registrant) | |||
Date: | March 4, 2016 | /s/ B. Francis Saul II | |
B. Francis Saul II | |||
Chairman of the Board of Directors & Chief Executive Officer (Principal Executive Officer) | |||
Pursuant to the requirements of the Securities Exchange Act of 1934, as amended, this Report has been signed below by the following persons in the capacities indicated. Each person whose signature appears below hereby constitutes and appoints each of B. Francis Saul II, J. Page Lansdale and Scott V. Schneider as his attorney-in-fact and agent, with full power of substitution and resubstitution for him in any and all capacities, to sign any or all amendments to this Report and to file same, with exhibits thereto and other documents in connection therewith, granting unto such attorney-in-fact and agent full power and authority to do and perform each and every act and thing requisite and necessary in connection with such matters and hereby ratifying and confirming all that such attorney-in-fact and agent or his substitutes may do or cause to be done by virtue hereof.
Date: | March 4, 2016 | /s/ J. Page Lansdale | |
J. Page Lansdale, President and Director | |||
Date: | March 4, 2016 | /s/ Philip D. Caraci | |
Philip D. Caraci, Vice Chairman | |||
Date: | March 4, 2016 | /s/ Scott V. Schneider | |
Scott V. Schneider, Senior Vice President, Treasurer and Secretary (Principal Financial Officer) | |||
Date: | March 4, 2016 | /s/ Joel A. Friedman | |
Joel A. Friedman, Senior Vice President-Chief Accounting Officer (Principal Accounting Officer) | |||
Date: | March 4, 2016 | ||
John E. Chapoton, Director | |||
Date: | March 4, 2016 | /s/ G. Patrick Clancy, Jr. | |
G. Patrick Clancy, Jr., Director | |||
70
Date: | March 4, 2016 | ||
Gilbert M. Grosvenor, Director | |||
Date: | March 4, 2016 | /s/ Philip C. Jackson Jr. | |
Philip C. Jackson Jr., Director | |||
Date: | March 4, 2016 | /s/ Patrick F. Noonan | |
Patrick F. Noonan, Director | |||
Date: | March 4, 2016 | /s/ H. Gregory Platts | |
H. Gregory Platts, Director | |||
Date: | March 4, 2016 | /s/ Andrew M. Saul II | |
Andrew M. Saul II Director | |||
Date: | March 4, 2016 | /s/ Mark Sullivan III | |
Mark Sullivan III, Director | |||
Date: | March 4, 2016 | /s/ James W. Symington | |
James W. Symington, Director | |||
Date: | March 4, 2016 | /s/ John R. Whitmore | |
John R. Whitmore, Director | |||
71
Report of Independent Registered Public Accounting Firm
The Board of Directors and Stockholders of Saul Centers, Inc.
We have audited the accompanying consolidated balance sheets of Saul Centers, Inc. as of December 31, 2015 and 2014, and the related consolidated statements of operations, comprehensive income, stockholders’ equity, and cash flows for each of the three years in the period ended December 31, 2015. Our audits also included the financial statement schedule listed in the Index at Item 15(a)2(b). These financial statements and schedule are the responsibility of the Company’s management. Our responsibility is to express an opinion on these financial statements and schedule based on our audits.
We conducted our audits in accordance with the standards of the Public Company Accounting Oversight Board (United States). Those standards require that we plan and perform the audit to obtain reasonable assurance about whether the financial statements are free of material misstatement. An audit includes examining, on a test basis, evidence supporting the amounts and disclosures in the financial statements. An audit also includes assessing the accounting principles used and significant estimates made by management, as well as evaluating the overall financial statement presentation. We believe that our audits provide a reasonable basis for our opinion.
In our opinion, the financial statements referred to above present fairly, in all material respects, the consolidated financial position of Saul Centers, Inc. at December 31, 2015 and 2014, and the consolidated results of its operations and its cash flows for each of the three years in the period ended December 31, 2015, in conformity with U.S. generally accepted accounting principles. Also, in our opinion, the related financial statement schedule, when considered in relation to the basic financial statements taken as a whole, presents fairly in all material respects the information set forth therein.
We also have audited, in accordance with the standards of the Public Company Accounting Oversight Board (United States), Saul Centers, Inc.’s internal control over financial reporting as of December 31, 2015, based on criteria established in Internal Control-Integrated Framework issued by the Committee of Sponsoring Organizations of the Treadway Commission (2013 framework) and our report dated March 4, 2016 expressed an unqualified opinion thereon.
/s/ Ernst & Young LLP
McLean, Virginia
March 4, 2016
F-1
Report of Independent Registered Public Accounting Firm
The Board of Directors and Stockholders of Saul Centers, Inc.
We have audited Saul Centers, Inc.’s internal control over financial reporting as of December 31, 2015, based on criteria established in Internal Control-Integrated Framework issued by the Committee of Sponsoring Organizations of the Treadway Commission (2013 framework) (the COSO criteria). Saul Centers, Inc.’s management is responsible for maintaining effective internal control over financial reporting, and for its assessment of the effectiveness of internal control over financial reporting included in the accompanying Assessment of Effectiveness of Internal Control Over Financial Reporting. Our responsibility is to express an opinion on the Company’s internal control over financial reporting based on our audit.
We conducted our audit in accordance with the standards of the Public Company Accounting Oversight Board (United States). Those standards require that we plan and perform the audit to obtain reasonable assurance about whether effective internal control over financial reporting was maintained in all material respects. Our audit included obtaining an understanding of internal control over financial reporting, assessing the risk that a material weakness exists, testing and evaluating the design and operating effectiveness of internal control based on the assessed risk, and performing such other procedures as we considered necessary in the circumstances. We believe that our audit provides a reasonable basis for our opinion.
A company’s internal control over financial reporting is a process designed to provide reasonable assurance regarding the reliability of financial reporting and the preparation of financial statements for external purposes in accordance with generally accepted accounting principles. A company’s internal control over financial reporting includes those policies and procedures that (1) pertain to the maintenance of records that, in reasonable detail, accurately and fairly reflect the transactions and dispositions of the assets of the company; (2) provide reasonable assurance that transactions are recorded as necessary to permit preparation of financial statements in accordance with generally accepted accounting principles, and that receipts and expenditures of the company are being made only in accordance with authorizations of management and directors of the company; and (3) provide reasonable assurance regarding prevention or timely detection of unauthorized acquisition, use, or disposition of the company’s assets that could have a material effect on the financial statements.
Because of its inherent limitations, internal control over financial reporting may not prevent or detect misstatements. Also, projections of any evaluation of effectiveness to future periods are subject to the risk that controls may become inadequate because of changes in conditions, or that the degree of compliance with the policies or procedures may deteriorate.
In our opinion, Saul Centers, Inc. maintained, in all material respects, effective internal control over financial reporting as of December 31, 2015, based on the COSO criteria.
We also have audited, in accordance with the standards of the Public Company Accounting Oversight Board (United States), the consolidated balance sheets of Saul Centers, Inc. as of December 31, 2015 and 2014 and the related consolidated statements of operations, comprehensive income, stockholders’ equity, and cash flows for each of the three years in the period ended December 31, 2015 of Saul Centers, Inc. and our report dated March 4, 2016 expressed an unqualified opinion thereon.
/s/ Ernst & Young LLP
McLean, Virginia
March 4, 2016
F-2
Saul Centers, Inc.
CONSOLIDATED BALANCE SHEETS
December 31, | |||||||
(Dollars in thousands, except per share amounts) | 2015 | 2014 | |||||
Assets | |||||||
Real estate investments | |||||||
Land | $ | 424,837 | $ | 420,622 | |||
Buildings and equipment | 1,114,357 | 1,109,276 | |||||
Construction in progress | 83,516 | 30,261 | |||||
1,622,710 | 1,560,159 | ||||||
Accumulated depreciation | (425,370 | ) | (396,617 | ) | |||
1,197,340 | 1,163,542 | ||||||
Cash and cash equivalents | 10,003 | 12,128 | |||||
Accounts receivable and accrued income, net | 51,076 | 46,784 | |||||
Deferred leasing costs, net | 26,919 | 26,928 | |||||
Prepaid expenses, net | 4,663 | 4,093 | |||||
Deferred debt costs, net | 8,737 | 9,874 | |||||
Other assets | 5,407 | 3,638 | |||||
Total assets | $ | 1,304,145 | $ | 1,266,987 | |||
Liabilities | |||||||
Mortgage notes payable | $ | 802,034 | $ | 808,997 | |||
Revolving credit facility payable | 28,000 | 43,000 | |||||
Construction loan payable | 45,208 | 5,391 | |||||
Dividends and distributions payable | 15,380 | 14,352 | |||||
Accounts payable, accrued expenses and other liabilities | 27,687 | 23,537 | |||||
Deferred income | 32,109 | 32,453 | |||||
Total liabilities | 950,418 | 927,730 | |||||
Stockholders' equity | |||||||
Preferred stock, 1,000,000 shares authorized: | |||||||
Series C Cumulative Redeemable, 72,000 shares issued and outstanding | 180,000 | 180,000 | |||||
Common stock, $0.01 par value, 30,000,000 shares authorized, 21,266,239 and 20,947,141 shares issued and outstanding, respectively | 213 | 209 | |||||
Additional paid-in capital | 305,008 | 287,995 | |||||
Accumulated deficit | (180,091 | ) | (173,774 | ) | |||
Accumulated other comprehensive loss | (1,802 | ) | (1,894 | ) | |||
Total Saul Centers, Inc. stockholders' equity | 303,328 | 292,536 | |||||
Noncontrolling interests | 50,399 | 46,721 | |||||
Total stockholders' equity | 353,727 | 339,257 | |||||
Total liabilities and stockholders' equity | $ | 1,304,145 | $ | 1,266,987 | |||
The Notes to Financial Statements are an integral part of these statements.
F-3
Saul Centers, Inc.
CONSOLIDATED STATEMENTS OF OPERATIONS
For The Year Ended December 31, | |||||||||||
(Dollars in thousands, except per share amounts) | 2015 | 2014 | 2013 | ||||||||
Revenue | |||||||||||
Base rent | $ | 168,303 | $ | 164,599 | $ | 159,898 | |||||
Expense recoveries | 32,911 | 32,132 | 30,949 | ||||||||
Percentage rent | 1,608 | 1,492 | 1,575 | ||||||||
Other | 6,255 | 8,869 | 5,475 | ||||||||
Total revenue | 209,077 | 207,092 | 197,897 | ||||||||
Operating expenses | |||||||||||
Property operating expenses | 26,565 | 26,479 | 24,559 | ||||||||
Provision for credit losses | 915 | 680 | 968 | ||||||||
Real estate taxes | 23,663 | 22,354 | 22,415 | ||||||||
Interest expense and amortization of deferred debt costs | 45,165 | 46,034 | 46,589 | ||||||||
Depreciation and amortization of deferred leasing costs | 43,270 | 41,203 | 49,130 | ||||||||
General and administrative | 16,353 | 16,961 | 14,951 | ||||||||
Acquisition related costs | 84 | 949 | 106 | ||||||||
Predevelopment expenses | 132 | 503 | 3,910 | ||||||||
Total operating expenses | 156,147 | 155,163 | 162,628 | ||||||||
Operating income | 52,930 | 51,929 | 35,269 | ||||||||
Change in fair value of derivatives | (10 | ) | (10 | ) | (7 | ) | |||||
Loss on early extinguishment of debt | — | — | (497 | ) | |||||||
Gains on sales of properties | 11 | 6,069 | — | ||||||||
Gain on casualty settlement | — | — | 77 | ||||||||
Net Income | 52,931 | 57,988 | 34,842 | ||||||||
Income attributable to noncontrolling interests | (10,463 | ) | (11,045 | ) | (3,970 | ) | |||||
Net income attributable to Saul Centers, Inc. | 42,468 | 46,943 | 30,872 | ||||||||
Preferred stock redemption | — | (1,480 | ) | (5,228 | ) | ||||||
Preferred dividends | (12,375 | ) | (13,361 | ) | (13,983 | ) | |||||
Net income available to common stockholders | $ | 30,093 | $ | 32,102 | $ | 11,661 | |||||
Per share net income available to common stockholders | |||||||||||
Basic | $ | 1.42 | $ | 1.55 | $ | 0.57 | |||||
Diluted | $ | 1.42 | $ | 1.54 | $ | 0.57 | |||||
The Notes to Financial Statements are an integral part of these statements.
F-4
Saul Centers, Inc.
CONSOLIDATED STATEMENTS OF COMPREHENSIVE INCOME
For The Year Ended December 31, | |||||||||||
(Dollars in thousands) | 2015 | 2014 | 2013 | ||||||||
Net income | $ | 52,931 | $ | 57,988 | $ | 34,842 | |||||
Other comprehensive income | |||||||||||
Unrealized gain (loss) on cash flow hedge | 124 | (675 | ) | 2,897 | |||||||
Total comprehensive income | 53,055 | 57,313 | 37,739 | ||||||||
Comprehensive income attributable to noncontrolling interests | (10,495 | ) | (10,874 | ) | (4,706 | ) | |||||
Total comprehensive income attributable to Saul Centers, Inc. | 42,560 | 46,439 | 33,033 | ||||||||
Preferred stock redemption | — | (1,480 | ) | (5,228 | ) | ||||||
Preferred dividends | (12,375 | ) | (13,361 | ) | (13,983 | ) | |||||
Total comprehensive income available to common stockholders | $ | 30,185 | $ | 31,598 | $ | 13,822 | |||||
The Notes to Financial Statements are an integral part of these statements.
F-5
CONSOLIDATED STATEMENTS OF STOCKHOLDERS' EQUITY | |||||||||||||||||||||||||||||||
(Dollars in thousands, except per share amounts) | Preferred Stock | Common Stock | Additional Paid-in Capital | Accumulated Deficit | Accumulated Other Comprehensive (Loss) | Total Saul Centers, Inc. | Noncontrolling Interests | Total | |||||||||||||||||||||||
Balance, December 31, 2012 | $ | 179,328 | $ | 201 | $ | 246,557 | $ | (154,830 | ) | $ | (3,553 | ) | $ | 267,703 | $ | 39,586 | $ | 307,289 | |||||||||||||
Issuance of 56,000 shares of Series C preferred stock | 140,000 | — | (4,807 | ) | — | — | 135,193 | — | 135,193 | ||||||||||||||||||||||
Redemption of 24,000 shares of Series A preferred stock | (60,000 | ) | — | 2,212 | (2,216 | ) | — | (60,004 | ) | — | (60,004 | ) | |||||||||||||||||||
Redemption of 31,731 shares of Series B preferred stock | (79,328 | ) | — | 3,007 | (3,012 | ) | — | (79,333 | ) | — | (79,333 | ) | |||||||||||||||||||
Issuance of common stock: | |||||||||||||||||||||||||||||||
475,162 shares pursuant to dividend reinvestment plan | — | 5 | 20,667 | — | — | 20,672 | — | 20,672 | |||||||||||||||||||||||
56,002 shares due to exercise of employee stock options and issuance of directors' deferred stock | — | — | 2,792 | — | — | 2,792 | — | 2,792 | |||||||||||||||||||||||
Issuance of 88,309 partnership units pursuant to dividend reinvestment plan | — | — | — | — | — | — | 4,144 | 4,144 | |||||||||||||||||||||||
Net income | — | — | — | 30,872 | — | 30,872 | 3,970 | 34,842 | |||||||||||||||||||||||
Change in unrealized loss on cash flow hedge | — | — | — | — | 2,161 | 2,161 | 736 | 2,897 | |||||||||||||||||||||||
Preferred stock distributions: | |||||||||||||||||||||||||||||||
Series A | — | — | — | (3,213 | ) | — | (3,213 | ) | — | (3,213 | ) | ||||||||||||||||||||
Series B | — | — | — | (1,468 | ) | — | (1,468 | ) | — | (1,468 | ) | ||||||||||||||||||||
Series C | — | — | — | (6,095 | ) | — | (6,095 | ) | — | (6,095 | ) | ||||||||||||||||||||
Common stock distributions | — | — | — | (21,988 | ) | — | (21,988 | ) | (7,467 | ) | (29,455 | ) | |||||||||||||||||||
Distributions payable preferred stock: | |||||||||||||||||||||||||||||||
Series A, $50.00 per share | — | — | — | (800 | ) | — | (800 | ) | — | (800 | ) | ||||||||||||||||||||
Series C, $42.97 per share | — | — | — | (2,406 | ) | — | (2,406 | ) | — | (2,406 | ) | ||||||||||||||||||||
Distributions payable common stock ($0.36/share) and distributions payable partnership units ($0.36/unit) | — | — | — | (7,408 | ) | — | (7,408 | ) | (2,521 | ) | (9,929 | ) | |||||||||||||||||||
Balance, December 31, 2013 | 180,000 | 206 | 270,428 | (172,564 | ) | (1,392 | ) | 276,678 | 38,448 | 315,126 | |||||||||||||||||||||
Issuance of 16,000 shares of Series C preferred stock | 40,000 | — | (740 | ) | — | — | 39,260 | — | 39,260 | ||||||||||||||||||||||
Redemption of 16,000 shares of Series A preferred stock | (40,000 | ) | — | 1,475 | (1,475 | ) | — | (40,000 | ) | — | (40,000 | ) | |||||||||||||||||||
Issuance of common stock: | |||||||||||||||||||||||||||||||
197,638 shares pursuant to dividend reinvestment plan | — | 2 | 9,262 | — | — | 9,264 | — | 9,264 | |||||||||||||||||||||||
172,887 shares due to exercise of employee stock options and issuance of directors' deferred stock | — | 1 | 7,570 | — | — | 7,571 | — | 7,571 | |||||||||||||||||||||||
Issuance of 196,183 partnership units pursuant to dividend reinvestment plan | — | — | — | — | — | — | 8,877 | 8,877 | |||||||||||||||||||||||
Net income | — | — | — | 46,943 | — | 46,943 | 11,045 | 57,988 | |||||||||||||||||||||||
CONSOLIDATED STATEMENTS OF STOCKHOLDERS' EQUITY (continued) | |||||||||||||||||||||||||||||||
(Dollars in thousands, except per share amounts) | Preferred Stock | Common Stock | Additional Paid-in Capital | Accumulated Deficit | Accumulated Other Comprehensive (Loss) | Total Saul Centers, Inc. | Noncontrolling Interests | Total | |||||||||||||||||||||||
Change in unrealized loss on cash flow hedge | — | — | — | — | (502 | ) | (502 | ) | (173 | ) | (675 | ) | |||||||||||||||||||
Preferred stock distributions: | |||||||||||||||||||||||||||||||
Series A | — | — | — | (3,049 | ) | — | (3,049 | ) | — | (3,049 | ) | ||||||||||||||||||||
Series C | — | — | — | (7,219 | ) | — | (7,219 | ) | — | (7,219 | ) | ||||||||||||||||||||
Common stock distributions | — | — | — | (24,937 | ) | — | (24,937 | ) | (8,597 | ) | (33,534 | ) | |||||||||||||||||||
Distributions payable preferred stock: | |||||||||||||||||||||||||||||||
Series C, $42.97 per share | — | — | — | (3,094 | ) | — | (3,094 | ) | — | (3,094 | ) | ||||||||||||||||||||
Distributions payable common stock ($0.40/share) and distributions payable partnership units ($0.40/unit) | — | — | — | (8,379 | ) | — | (8,379 | ) | (2,879 | ) | (11,258 | ) | |||||||||||||||||||
Balance, December 31, 2014 | 180,000 | 209 | 287,995 | (173,774 | ) | (1,894 | ) | 292,536 | 46,721 | 339,257 | |||||||||||||||||||||
Issuance of common stock: | |||||||||||||||||||||||||||||||
201,212 shares pursuant to dividend reinvestment plan | — | 3 | 10,647 | — | — | 10,650 | — | 10,650 | |||||||||||||||||||||||
117,886 shares due to exercise of employee stock options and issuance of directors' deferred stock | — | 1 | 6,366 | — | — | 6,367 | — | 6,367 | |||||||||||||||||||||||
Issuance of 107,037 partnership units pursuant to dividend reinvestment plan | — | — | — | — | — | — | 5,673 | 5,673 | |||||||||||||||||||||||
Net income | — | — | — | 42,468 | — | 42,468 | 10,463 | 52,931 | |||||||||||||||||||||||
Change in unrealized loss on cash flow hedge | — | — | — | — | 92 | 92 | 32 | 124 | |||||||||||||||||||||||
Series C preferred stock distributions | — | — | — | (9,282 | ) | — | (9,282 | ) | — | (9,282 | ) | ||||||||||||||||||||
Common stock distributions | — | — | — | (27,265 | ) | — | (27,265 | ) | (9,349 | ) | (36,614 | ) | |||||||||||||||||||
Distributions payable on Series C preferred stock, $42.97 per share | — | — | — | (3,093 | ) | — | (3,093 | ) | — | (3,093 | ) | ||||||||||||||||||||
Distributions payable common stock ($0.43/share) and partnership units ($0.43/unit) | — | — | — | (9,145 | ) | — | (9,145 | ) | (3,141 | ) | (12,286 | ) | |||||||||||||||||||
Balance, December 31, 2015 | $ | 180,000 | $ | 213 | $ | 305,008 | $ | (180,091 | ) | $ | (1,802 | ) | $ | 303,328 | $ | 50,399 | $ | 353,727 | |||||||||||||
The Notes to Financial Statements are an integral part of these statements.
F-6
Saul Centers, Inc.
CONSOLIDATED STATEMENTS OF CASH FLOWS | |||||||||||
For The Year Ended December 31, | |||||||||||
(Dollars in thousands) | 2015 | 2014 | 2013 | ||||||||
Cash flows from operating activities: | |||||||||||
Net income | $ | 52,931 | $ | 57,988 | $ | 34,842 | |||||
Adjustments to reconcile net income to net cash provided by operating activities: | |||||||||||
Change in fair value of derivatives | 10 | 10 | 7 | ||||||||
Gains on sales of properties | (11 | ) | (6,069 | ) | — | ||||||
Gain on casualty settlement | — | — | (77 | ) | |||||||
Depreciation and amortization of deferred leasing costs | 43,270 | 41,203 | 49,130 | ||||||||
Amortization of deferred debt costs | 1,433 | 1,327 | 1,257 | ||||||||
Non cash compensation costs of stock grants and options | 1,434 | 1,240 | 1,145 | ||||||||
Provision for credit losses | 915 | 680 | 968 | ||||||||
Increase in accounts receivable and accrued income | (5,207 | ) | (3,320 | ) | (3,669 | ) | |||||
Additions to deferred leasing costs | (5,563 | ) | (4,048 | ) | (5,876 | ) | |||||
Increase in prepaid expenses | (570 | ) | (60 | ) | (152 | ) | |||||
(Increase) decrease in other assets | 1,535 | (694 | ) | 353 | |||||||
Increase (decrease) in accounts payable, accrued expenses and other liabilities | (937 | ) | 1,149 | (3,286 | ) | ||||||
Decrease in deferred income | (344 | ) | (2,838 | ) | (1,115 | ) | |||||
Net cash provided by operating activities | 88,896 | 86,568 | 73,527 | ||||||||
Cash flows from investing activities: | |||||||||||
Acquisitions of real estate investments (1) | (4,894 | ) | (57,494 | ) | (5,124 | ) | |||||
Additions to real estate investments | (18,855 | ) | (14,986 | ) | (13,999 | ) | |||||
Additions to development and redevelopment projects | (45,870 | ) | (17,788 | ) | (7,316 | ) | |||||
Proceeds from sale of properties | 32 | 6,679 | — | ||||||||
Proceeds from casualty settlement | — | — | 405 | ||||||||
Net cash used in investing activities | (69,587 | ) | (83,589 | ) | (26,034 | ) | |||||
Cash flows from financing activities: | |||||||||||
Proceeds from mortgage notes payable (1) | 46,000 | — | 101,600 | ||||||||
Repayments on mortgage notes payable | (52,963 | ) | (22,071 | ) | (71,308 | ) | |||||
Proceeds from construction loans payable | 39,817 | 5,391 | — | ||||||||
Proceeds from revolving credit facility | 20,000 | 90,000 | 142,000 | ||||||||
Repayments on revolving credit facility | (35,000 | ) | (47,000 | ) | (180,000 | ) | |||||
Additions to deferred debt costs | (296 | ) | (1,264 | ) | (3,219 | ) | |||||
Proceeds from the issuance of: | |||||||||||
Common stock | 15,583 | 15,596 | 22,292 | ||||||||
Partnership units | 5,673 | 8,877 | 4,144 | ||||||||
Series C preferred stock | — | 39,260 | 135,221 | ||||||||
Preferred stock redemption payments: | |||||||||||
Series A preferred | — | (40,000 | ) | (60,000 | ) | ||||||
Series B preferred | — | — | (79,328 | ) | |||||||
Preferred stock redemption costs | — | — | (9 | ) | |||||||
Distributions to: | |||||||||||
Series A preferred stockholders | — | (3,849 | ) | (5,213 | ) | ||||||
Series B preferred stockholders | — | — | (3,253 | ) | |||||||
Series C preferred stockholders | (12,375 | ) | (9,625 | ) | (6,095 | ) | |||||
Common stockholders | (35,645 | ) | (32,346 | ) | (29,205 | ) | |||||
Noncontrolling interests | (12,228 | ) | (11,117 | ) | (9,956 | ) | |||||
Net cash used in financing activities | (21,434 | ) | (8,148 | ) | (42,329 | ) | |||||
Net increase (decrease) in cash and cash equivalents | (2,125 | ) | (5,169 | ) | 5,164 | ||||||
Cash and cash equivalents, beginning of year | 12,128 | 17,297 | 12,133 | ||||||||
Cash and cash equivalents, end of year | $ | 10,003 | $ | 12,128 | $ | 17,297 | |||||
Supplemental disclosure of cash flow information: | |||||||||||
Cash paid for interest | $ | 45,965 | $ | 45,443 | $ | 45,743 | |||||
(1) The 2014 acquisition of real estate and proceeds from notes payable each exclude $11,000 in connection with the sale and leaseback of the Company's Olney property. | |||||||||||
F-7
SAUL CENTERS, INC.
Notes to Consolidated Financial Statements
1. | ORGANIZATION, FORMATION, AND BASIS OF PRESENTATION |
Organization
Saul Centers, Inc. (“Saul Centers”) was incorporated under the Maryland General Corporation Law on June 10, 1993. Saul Centers operates as a real estate investment trust (a “REIT”) under the Internal Revenue Code of 1986, as amended (the “Code”). The Company is required to annually distribute at least 90% of its REIT taxable income (excluding net capital gains) to its stockholders and meet certain organizational and other requirements. Saul Centers has made and intends to continue to make regular quarterly distributions to its stockholders. Saul Centers, together with its wholly owned subsidiaries and the limited partnerships of which Saul Centers or one of its subsidiaries is the sole general partner, are referred to collectively as the “Company.” B. Francis Saul II serves as Chairman of the Board of Directors and Chief Executive Officer of Saul Centers.
Formation and Structure of Company
Saul Centers was formed to continue and expand the shopping center business previously owned and conducted by the B. F. Saul Real Estate Investment Trust, the B. F. Saul Company and certain other affiliated entities, each of which is controlled by B. Francis Saul II and his family members (collectively, the “Saul Organization”). On August 26, 1993, members of the Saul Organization transferred to Saul Holdings Limited Partnership, a newly formed Maryland limited partnership (the “Operating Partnership”), and two newly formed subsidiary limited partnerships (the “Subsidiary Partnerships,” and collectively with the Operating Partnership, the “Partnerships”), shopping center and mixed-used properties, and the management functions related to the transferred properties. Since its formation, the Company has developed and purchased additional properties.
The following table lists the significant properties acquired, developed and/or disposed of by the Company since January 1, 2013.
Name of Property | Location | Type | Year of Acquisition/ Development/ Disposal | ||
Acquisitions | |||||
1580 Rockville Pike | Rockville, Maryland | Shopping Center | January 2014 | ||
1582 Rockville Pike | Rockville, Maryland | Shopping Center | April 2014 | ||
750 N. Glebe Road | Arlington, Virginia | Shopping Center | August 2014 | ||
730 N. Glebe Road | Arlington, Virginia | Shopping Center | December 2014 | ||
1584 Rockville Pike | Rockville, Maryland | Shopping Center | December 2014 | ||
726 N. Glebe Road | Arlington, Virginia | Shopping Center | September 2015 | ||
Developments | |||||
Park Van Ness | Washington, DC | Mixed-Use | 2013-2015 | ||
Dispositions | |||||
Giant Center | Milford Mill, Maryland | Shopping Center | April 2014 | ||
As of December 31, 2015, the Company’s properties (the “Current Portfolio Properties”) consisted of 50 shopping center properties (the “Shopping Centers”), six mixed-use properties, one of which was designated as held for sale, which are comprised of office, retail and multi-family residential uses (the “Mixed-Use Properties”) and three (non-operating) development properties.
Basis of Presentation
The accompanying financial statements are presented on the historical cost basis of the Saul Organization because of affiliated ownership and common management and because the assets and liabilities were
F-8
the subject of a business combination with the Operating Partnership, the Subsidiary Partnerships and Saul Centers, all newly formed entities with no prior operations.
2. | SUMMARY OF SIGNIFICANT ACCOUNTING POLICIES |
Nature of Operations
The Company, which conducts all of its activities through its subsidiaries, the Operating Partnership and Subsidiary Partnerships, engages in the ownership, operation, management, leasing, acquisition, renovation, expansion, development and financing of community and neighborhood shopping centers and mixed-used properties, primarily in the Washington, DC/Baltimore metropolitan area. Because the properties are located primarily in the Washington, DC/Baltimore metropolitan area, a disproportionate economic downturn in the local economy would have a greater negative impact on our overall financial performance than on the overall financial performance of a company with a portfolio that is more geographically diverse. A majority of the Shopping Centers are anchored by several major tenants. As of December 31, 2015, 31 of the Shopping Centers were anchored by a grocery store and offer primarily day-to-day necessities and services. Two retail tenants, Giant Food (4.4%), a tenant at nine Shopping Centers, and Albertson's/Safeway (2.7%), a tenant at nine Shopping Centers, individually accounted for 2.5% or more of the Company’s total revenue for the year ended December 31, 2015.
Principles of Consolidation
The accompanying consolidated financial statements include the accounts of Saul Centers, its subsidiaries, and the Operating Partnership and Subsidiary Partnerships which are majority owned by Saul Centers. All significant intercompany balances and transactions have been eliminated in consolidation.
Use of Estimates
The preparation of financial statements in conformity with accounting principles generally accepted in the United States requires management to make certain estimates and assumptions that affect the reported amounts of assets and liabilities and disclosure of contingent assets and liabilities at the date of the financial statements and the reported amounts of revenue and expenses during the reporting period. Actual results could differ from those estimates.
Real Estate Investment Properties
The Company purchases real estate investment properties from time to time and records assets acquired and liabilities assumed, including land, buildings, and intangibles related to in-place leases and customer relationships, based on their fair values. The fair value of buildings generally is determined as if the buildings were vacant upon acquisition and then subsequently leased at market rental rates and considers the present value of all cash flows expected to be generated by the property including an initial lease up period. From time to time the Company may purchase a property for future development purposes. The property may be improved with an existing structure that would be demolished as part of the development. In such cases, the fair value of the building may be determined based only on existing leases and not include estimated cash flows related to future leases. In certain circumstances, such as if the building is vacant and the Company intends to demolish the building in the near term, the entire purchase price will be allocated to land.
The Company determines the fair value of above and below market intangibles associated with in-place leases by assessing the net effective rent and remaining term of the lease relative to market terms for similar leases at acquisition taking into consideration the remaining contractual lease period, renewal periods, and the likelihood of the tenant exercising its renewal options. The fair value of a below market lease component is recorded as deferred income and accreted as additional lease revenue over the remaining contractual lease period. If the fair value of the below market lease intangible includes fair value associated with a renewal option, such amounts are not accreted until the renewal option is exercised. If the renewal option is not exercised the value is recognized at that time. The fair value of above market lease intangibles is recorded as a deferred asset and is amortized as a reduction of lease revenue over the remaining contractual lease term. The Company determines the fair value of at-market in-place leases considering the cost of acquiring similar leases, the foregone rents associated with the lease-up period and carrying costs associated with the lease-up period. Intangible assets associated with at-market in-place leases are
F-9
amortized as additional expense over the remaining contractual lease term. To the extent customer relationship intangibles are present in an acquisition, the fair values of the intangibles are amortized over the lives of the customer relationships. The Company has never recorded a customer relationship intangible asset. Acquisition-related transaction costs are either (a) expensed as incurred when related to business combinations or (b) capitalized to land and/or building when related to asset acquisitions.
If there is an event or change in circumstance that indicates a potential impairment in the value of a real estate investment property, the Company prepares an analysis to determine whether the carrying value of the real estate investment property exceeds its estimated fair value. The Company considers both quantitative and qualitative factors including recurring operating losses, significant decreases in occupancy, and significant adverse changes in legal factors and business climate. If impairment indicators are present, the Company compares the projected cash flows of the property over its remaining useful life, on an undiscounted basis, to the carrying value of that property. The Company assesses its undiscounted projected cash flows based upon estimated capitalization rates, historic operating results and market conditions that may affect the property. If the carrying value is greater than the undiscounted projected cash flows, the Company would recognize an impairment loss equivalent to an amount required to adjust the carrying amount to its then estimated fair value. The fair value of any property is sensitive to the actual results of any of the aforementioned estimated factors, either individually or taken as a whole. Should the actual results differ from management’s projections, the valuation could be negatively or positively affected. The Company did not recognize an impairment loss on any of its real estate in 2015, 2014, or 2013.
Interest, real estate taxes, development related salary costs and other carrying costs are capitalized on projects under development and construction. Once construction is substantially completed and the assets are placed in service, their rental income, real estate tax expense, property operating expenses (consisting of payroll, repairs and maintenance, utilities, insurance and other property related expenses) and depreciation are included in current operations. Property operating expenses are charged to operations as incurred. Interest expense capitalized totaled $2.2 million, $0.7 million, and $0.2 million during 2015, 2014, and 2013, respectively. Commercial development projects are considered substantially complete and available for occupancy upon completion of tenant improvements, but no later than one year from the cessation of major construction activity. Multi-family residential development projects are considered substantially complete and available for occupancy upon receipt of the certificate of occupancy from the appropriate licensing authority. Substantially completed portions of a project are accounted for as separate projects.
Depreciation is calculated using the straight-line method and estimated useful lives of generally between 35 and 50 years for base buildings, or a shorter period if management determines that the building has a shorter useful life, and up to 20 years for certain other improvements that extend the useful lives. Leasehold improvements expenditures are capitalized when certain criteria are met, including when the Company supervises construction and will own the improvements. Tenant improvements are amortized, over the shorter of the lives of the related leases or the useful life of the improvement, using the straight-line method. Depreciation expense, which is included in Depreciation and amortization of deferred leasing costs in the Consolidated Statements of Operations, for the years ended December 31, 2015, 2014, and 2013, was $37.7 million, $35.9 million, and $43.2 million, respectively. Repairs and maintenance expense totaled $11.6 million, $11.9 million, and $10.3 million for 2015, 2014, and 2013, respectively, and is included in property operating expenses in the accompanying consolidated financial statements.
Deferred Leasing Costs
Deferred leasing costs consist of commissions paid to third-party leasing agents, internal direct costs such as employee compensation and payroll-related fringe benefits directly related to time spent performing leasing-related activities for successful commercial leases and amounts attributed to in place leases associated with acquired properties and are amortized, using the straight-line method, over the term of the lease or the remaining term of an acquired lease. Leasing related activities include evaluating the prospective tenant’s financial condition, evaluating and recording guarantees, collateral and other security arrangements, negotiating lease terms, preparing lease documents and closing the transaction. Unamortized deferred costs are charged to expense if the applicable lease is terminated prior to expiration of the initial lease term. Collectively, deferred leasing costs totaled $26.9 million and $26.9 million, net of accumulated amortization of approximately $26.6 million and $21.6 million, as of December 31, 2015 and 2014, respectively. Amortization expense, which is included in Depreciation and
F-10
amortization of deferred leasing costs in the Consolidated Statements of Operations, totaled approximately $5.6 million, $5.3 million, and $5.9 million, for the years ended December 31, 2015, 2014, and 2013, respectively.
Construction in Progress
Construction in progress includes preconstruction and development costs of active projects. Preconstruction costs include legal, zoning and permitting costs and other project carrying costs incurred prior to the commencement of construction. Development costs include direct construction costs and indirect costs incurred subsequent to the start of construction such as architectural, engineering, construction management and carrying costs consisting of interest, real estate taxes and insurance. The following table shows the components of construction in progress.
December 31, | ||||||||
(in thousands) | 2015 | 2014 | ||||||
Park Van Ness | $ | 77,245 | $ | 26,998 | ||||
Other | 6,271 | 3,263 | ||||||
Total | $ | 83,516 | $ | 30,261 | ||||
Accounts Receivable and Accrued Income
Accounts receivable primarily represent amounts currently due from tenants in accordance with the terms of the respective leases. Receivables are reviewed monthly and reserves are established with a charge to current period operations when, in the opinion of management, collection of the receivable is doubtful. Accounts receivable in the accompanying consolidated financial statements are shown net of an allowance for doubtful accounts of $1.3 million and $0.7 million, at December 31, 2015 and 2014, respectively.
(In thousands) | Year ended December 31, | ||||||||||
2015 | 2014 | 2013 | |||||||||
Beginning Balance | $ | 677 | $ | 572 | $ | 1,208 | |||||
Provision for Credit Losses | 915 | 680 | 968 | ||||||||
Charge-offs | (329 | ) | (575 | ) | (1,604 | ) | |||||
Ending Balance | $ | 1,263 | $ | 677 | $ | 572 | |||||
In addition to rents due currently, accounts receivable also includes $41.4 million and $38.7 million, at December 31, 2015 and 2014, respectively, net of allowance for doubtful accounts totaling $0.5 million and $0.3 million, respectively, representing minimum rental income accrued on a straight-line basis to be paid by tenants over the remaining term of their respective leases.
Assets Held for Sale
The Company considers properties to be assets held for sale when all of the following criteria are met:
• | management commits to a plan to sell a property; |
• | it is unlikely that the disposal plan will be significantly modified or discontinued; |
• | the property is available for immediate sale in its present condition; |
• | actions required to complete the sale of the property have been initiated; |
• | sale of the property is probable and the Company expects the completed sale will occur within one year; and |
• | the property is actively being marketed for sale at a price that is reasonable given its current market value. |
F-11
The Company must make a determination as to the point in time that it is probable that a sale will be consummated, which generally occurs when an executed sales contract has no contingencies and the prospective buyer has significant funds at risk to ensure performance. Upon designation as an asset held for sale, the Company records the carrying value of each property at the lower of its carrying value or its estimated fair value, less estimated costs to sell, and ceases depreciation. As of December 31, 2015, the Company has classified as held-for-sale one operating property, comprising 197,127 square feet of gross leasable area. The book value of this property, which is included in Other Assets, was $3.4 million, net of accumulated depreciation of $7.0 million, which does not exceed its estimated fair value, less costs to sell, and liabilities were $0.2 million. Fair value was determined based on a third party appraisal.
Cash and Cash Equivalents
Cash and cash equivalents include short-term investments. Short-term investments include money market accounts and other investments which generally mature within three months, measured from the acquisition date, and/or are readily convertible to cash. Substantially all of the Company’s cash balances at December 31, 2015 are held in non-interest bearing accounts at various banks. From time to time the Company may maintain deposits with financial institutions in amounts in excess of federally insured limits. The Company has not experienced any losses on such deposits and believes it is not exposed to any significant credit risk on those deposits.
Deferred Debt Costs
Deferred debt costs consist of fees and costs incurred to obtain long-term financing, construction financing and the revolving line of credit. These fees and costs are being amortized on a straight-line basis over the terms of the respective loans or agreements, which approximates the effective interest method. Deferred debt costs totaled $8.7 million and $9.9 million, net of accumulated amortization of $6.2 million and $5.9 million at December 31, 2015 and 2014, respectively.
Deferred Income
Deferred income consists of payments received from tenants prior to the time they are earned and recognized by the Company as revenue, including tenant prepayment of rent for future periods, real estate taxes when the taxing jurisdiction has a fiscal year differing from the calendar year reimbursements specified in the lease agreement and tenant construction work provided by the Company. In addition, deferred income includes the fair value of certain below market leases.
Derivative Financial Instruments
The Company may, when appropriate, employ derivative instruments, such as interest-rate swaps, to mitigate the risk of interest rate fluctuations. The Company does not enter into derivative or other financial instruments for trading or speculative purposes. Derivative financial instruments are carried at fair value as either assets or liabilities on the consolidated balance sheets. For those derivative instruments that qualify, the Company may designate the hedging instrument, based upon the exposure being hedged, as a fair value hedge or a cash flow hedge. Derivative instruments that are designated as a hedge are evaluated to ensure they continue to qualify for hedge accounting. The effective portion of any gain or loss on the hedge instruments is reported as a component of accumulated other comprehensive income (loss) and recognized in earnings within the same line item associated with the forecasted transaction in the same period or periods during which the hedged transaction affects earnings. Any ineffective portion of the change in fair value of a derivative instrument is immediately recognized in earnings. For derivative instruments that do not meet the criteria for hedge accounting, or that qualify and are not designated, changes in fair value are immediately recognized in earnings.
Revenue Recognition
Rental and interest income are accrued as earned except when doubt exists as to collectability, in which case the accrual is discontinued. Recognition of rental income commences when control of the space has been given to the tenant. When rental payments due under leases vary from a straight-line basis because of free rent periods or stepped increases, income is recognized on a straight-line basis. Expense recoveries represent a portion of property
F-12
operating expenses billed to the tenants, including common area maintenance, real estate taxes and other recoverable costs. Expense recoveries are recognized in the period in which the expenses are incurred. Rental income based on a tenant’s revenue (“percentage rent”) is accrued when a tenant reports sales that exceed a specified breakpoint, pursuant to the terms of their respective leases.
Income Taxes
The Company made an election to be treated, and intends to continue operating so as to qualify, as a REIT under the Code, commencing with its taxable year ended December 31, 1993. A REIT generally will not be subject to federal income taxation, provided that distributions to its stockholders equal or exceed its REIT taxable income and complies with certain other requirements. Therefore, no provision has been made for federal income taxes in the accompanying consolidated financial statements.
As of December 31, 2015, the Company had no material unrecognized tax benefits and there exist no potentially significant unrecognized tax benefits which are reasonably expected to occur within the next twelve months. The Company recognizes penalties and interest accrued related to unrecognized tax benefits, if any, as general and administrative expense. No penalties and interest have been accrued in years 2015, 2014, and 2013. The tax basis of the Company’s real estate investments was approximately $1.1 billion and $1.2 billion as of December 31, 2015 and 2014, respectively. With few exceptions, the Company is no longer subject to U.S. federal, state, and local tax examinations by tax authorities for years before 2012.
Stock Based Employee Compensation, Deferred Compensation and Stock Plan for Directors
The Company uses the fair value method to value and account for employee stock options. The fair value of options granted is determined at the time of each award using the Black-Scholes model, a widely used method for valuing stock based employee compensation, and the following assumptions: (1) Expected Volatility determined using the most recent trading history of the Company’s common stock (month-end closing prices) corresponding to the average expected term of the options; (2) Average Expected Term of the options is based on prior exercise history, scheduled vesting and the expiration date; (3) Expected Dividend Yield determined by management after considering the Company’s current and historic dividend yield rates, the Company’s yield in relation to other retail REITs and the Company’s market yield at the grant date; and (4) a Risk-free Interest Rate based upon the market yields of US Treasury obligations with maturities corresponding to the average expected term of the options at the grant date. The Company amortizes the value of options granted ratably over the vesting period and includes the amounts as compensation in general and administrative expenses.
The Company has a stock plan, which was originally approved in 2004, amended in 2008 and 2013 and which expires in 2023, for the purpose of attracting and retaining executive officers, directors and other key personnel (the "Stock Plan"). Pursuant to the Stock Plan, the Compensation Committee established a Deferred Compensation Plan for Directors for the benefit of its directors and their beneficiaries, which replaced a previous Deferred Compensation and Stock Plan for Directors. A director may make an annual election to defer all or part of his or her director’s fees and has the option to have the fees paid in cash, in shares of common stock or in a combination of cash and shares of common stock upon separation from the Board. If the director elects to have fees paid in stock, fees earned during a calendar quarter are aggregated and divided by the common stock’s closing market price on the first trading day of the following quarter to determine the number of shares to be allocated to the director. As of December 31, 2015, the directors’ deferred fee accounts comprise 241,949 shares.
The Compensation Committee has also approved an annual award of shares of the Company’s common stock as additional compensation to each director serving on the Board of Directors as of the record date for the Annual Meeting of Stockholders. The shares are awarded as of each Annual Meeting of Shareholders, and their issuance may not be deferred. Each director was issued 200 shares for each of the years ended December 31, 2015, 2014, and 2013. The shares were valued at the closing stock price on the dates the shares were awarded and included in general and administrative expenses in the total amounts of $143,000, $112,900, and $124,400, for the years ended December 31, 2015, 2014, and 2013, respectively.
F-13
Noncontrolling Interest
Saul Centers is the sole general partner of the Operating Partnership, owning a 74.2% common interest as of December 31, 2015. Noncontrolling interest in the Operating Partnership is comprised of limited partnership units owned by the Saul Organization. Noncontrolling interest reflected on the accompanying consolidated balance sheets is increased for earnings allocated to limited partnership interests and distributions reinvested in additional units, and is decreased for limited partner distributions. Noncontrolling interest reflected on the consolidated statements of operations represents earnings allocated to limited partnership interests held by the Saul Organization.
Per Share Data
Per share data for net income (basic and diluted) is computed using weighted average shares of common stock. Convertible limited partnership units and employee stock options are the Company’s potentially dilutive securities. For all periods presented, the convertible limited partnership units are anti-dilutive. The treasury stock method was used to measure the effect of the dilution.
December 31, | |||||||||||
(Shares in thousands) | 2015 | 2014 | 2013 | ||||||||
Weighted average common shares outstanding - Basic | 21,127 | 20,772 | 20,364 | ||||||||
Effect of dilutive options | 69 | 49 | 37 | ||||||||
Weighted average common shares outstanding - Diluted | 21,196 | 20,821 | 20,401 | ||||||||
Average share price | $ | 53.38 | $ | 49.09 | $ | 45.44 | |||||
Non-dilutive options | 111 | 107 | 113 | ||||||||
Years non-dilutive options were issued | 2007 and 2015 | 2007 and 2008 | 2007 and 2008 | ||||||||
Legal Contingencies
The Company is subject to various legal proceedings and claims that arise in the ordinary course of business, which are generally covered by insurance. Upon determination that a loss is probable to occur and can be reasonably estimated, the estimated amount of the loss is recorded in the financial statements.
F-14
Recently Issued Accounting Standards
In April 2014, the Financial Accounting Standards Board (“FASB”) issued Accounting Standards Update (“ASU”) No. 2014-08, “Presentation of Financial Statements (Topic 205) and Property Plant and Equipment (Topic 360)” (“ASU 2014-08”). ASU 2014-08 changes the requirements for reporting discontinued operations such that disposals of components of an entity will be reported in discontinued operations if the disposal represents a strategic shift that has (or will have) a major effect on an entity’s operations. ASU 2014-08 also requires additional disclosures about discontinued operations. ASU 2014-08 is effective for annual periods beginning after December 15, 2014, and interim periods within those years and early adoption is permitted. The Company retrospectively adopted ASU 2014-08 on April 15, 2014. The adoption of ASU 2014-08 did not have a material impact on the Company’s financial condition or results of operations.
In May 2014, the FASB issued ASU No. 2014-09, “Revenue from Contracts with Customers” (“ASU 2014-09”). ASU 2014-09 will replace most existing revenue recognition guidance and will require an entity to recognize the amount of revenue to which it expects to be entitled for the transfer of promised goods or services to customers. ASU 2014-09 is effective for annual periods beginning after December 15, 2016, and interim periods within those years and early adoption is not permitted. ASU 2014-09 must be applied retrospectively by either restating prior periods or by recognizing the cumulative effect as of the first date of application. We have not yet selected a transition method and are evaluating the impact that ASU 2014-09 will have on our consolidated financial statements and related disclosures.
In April 2015, the FASB issued ASU No. 2015-03, “Interest - Imputation of Interest” (“ASU 2015-03”). ASU 2015-03 simplifies the presentation of debt issuance costs and will require an entity to deduct transaction costs from the carrying value of the related financial liability and not record those transaction costs as a separate asset. Recognition and measurement guidance for debt issuance costs are not affected by ASU 2015-03. ASU 2015-03 is effective for annual periods beginning after December 15, 2015, and interim periods within those years, and must be applied retrospectively by adjusting the balance sheet of each individual period presented. Adoption of ASU 2015-03 is not expected to have a material effect on our consolidated financial statements and related disclosures.
In February 2016, the FASB issued ASU 2016-02, ‘‘Leases’’ (“ASU 2016-02”). ASU 2016-02 amends the existing accounting standards for lease accounting, including requiring lessees to recognize most leases on their balance sheets and making targeted changes to lessor accounting. ASU 2016-02 is effective for annual periods beginning after December 15, 2018, interim periods within those years, and requires a modified retrospective transition approach for all leases existing at the date of initial application, with an option to use certain practical expedients for those existing leases. We are evaluating the impact that ASU 2016-02 will have on our consolidated financial statements and related disclosures.
Reclassifications
Certain reclassifications have been made to prior years to conform to the presentation used for year ended December 31, 2015.
3. | REAL ESTATE ACQUIRED |
1580, 1582 and 1584 Rockville Pike
In January 2014, the Company purchased for $8.0 million 1580 Rockville Pike and incurred acquisition costs of $0.2 million. In April 2014, the Company purchased for $11.0 million 1582 Rockville Pike and incurred acquisition costs of $0.2 million. In December 2014, the company purchased for $6.2 million 1584 Rockville Pike and incurred acquisition costs of $0.2 million. These retail properties are contiguous with each other and the Company's property at 1500 Rockville Pike and are located in Rockville, Maryland.
726, 730 and 750 N. Glebe Road
In August 2014, the Company purchased for $40.0 million, 750 N. Glebe Road and incurred acquisition costs of $0.4 million. In December 2014, the Company purchased for $2.8 million 730 N. Glebe Road and incurred acquisition costs of $40,400. In September 2015, the Company purchased for $4.0 million 726 N. Glebe Road and
F-15
incurred acquisition costs of $0.1 million. These retail properties are contiguous and are located in Arlington, Virginia.
Kentlands pad
In August 2013, the Company purchased for $4.3 million, a retail pad with a 7,100 square foot restaurant located in Gaithersburg, Maryland, which is contiguous with and an expansion of the Company's other Kentlands assets, and incurred acquisition costs of $0.1 million.
Hunt Club pad
In December 2013, the Company purchased for $0.8 million, including acquisition costs, a retail pad with a 5,500 square foot vacant building located in Apopka, Florida, which is contiguous with and an expansion of the Company's other Hunt Club asset.
Westview pad
In February 2015, the Company purchased for $0.9 million including acquisition costs, a 1.1 acre retail pad site in Frederick, Maryland, which is contiguous with and an expansion of the Company's other Westview asset.
Allocation of Purchase Price of Real Estate Acquired
The Company allocates the purchase price of real estate investment properties to various components, such as land, buildings and intangibles related to in-place leases and customer relationships, based on their fair values. See Note 2. Summary of Significant Accounting Policies-Real Estate Investment Properties.
During 2015, the Company purchased one property at a cost of $4.0 million and incurred acquisition costs of $0.1 million. Of the total purchase price, $3.9 million was allocated to land and $0.1 million was allocated to building. No amounts were allocated to in-place, above-market or below-market leases.
During 2014, the Company purchased five properties at an aggregate cost of $68.0 million, and incurred acquisition costs of $0.9 million. The purchase prices were allocated to the assets acquired and liabilities assumed based on their fair value as shown in the following table.
(in thousands) | 1580 Rockville Pike | 1582 Rockville Pike | 750 N. Glebe Road | 730 N. Glebe Road | 1584 Rockville Pike | Total | |||||||||||||||||
Land | $ | 9,600 | $ | 9,742 | $ | 38,224 | $ | 2,683 | $ | 5,798 | $ | 66,047 | |||||||||||
Buildings | 2,200 | 828 | 1,327 | 78 | 440 | 4,873 | |||||||||||||||||
In-place Leases | 513 | 849 | 449 | 39 | 249 | 2,099 | |||||||||||||||||
Above Market Rent | — | — | — | — | — | — | |||||||||||||||||
Below Market Rent | (4,313 | ) | (419 | ) | — | — | (337 | ) | (5,069 | ) | |||||||||||||
Total Purchase Price | $ | 8,000 | $ | 11,000 | $ | 40,000 | $ | 2,800 | $ | 6,150 | $ | 67,950 | |||||||||||
During 2013, the Company purchased two properties at a cost of $5.1 million and incurred acquisition costs of $106,000. Of the total purchase price, $2.0 million was allocated to buildings and $3.1 million was allocated to land. No amounts were allocated to in-place, above-market, or below-market leases.
The gross carrying amount of lease intangible assets included in deferred leasing costs as of December 31, 2015 and 2014 was $24.0 million and $24.0 million, respectively, and accumulated amortization was $19.2 million and $18.0 million, respectively. Amortization expense totaled $1.3 million, $1.3 million and $2.0 million, for the years ended December 31, 2015, 2014, and 2013, respectively. The gross carrying amount of below market lease intangible liabilities included in deferred income as of December 31, 2015 and 2014 was $29.9 million and $29.9 million, respectively, and accumulated amortization was $13.7 million and $11.9 million, respectively. Accretion income totaled $1.8 million, $1.9 million, and $1.7 million, for the years ended December 31, 2015, 2014, and 2013, respectively. The gross carrying amount of above market lease intangible assets included in accounts receivable as of December 31, 2015 and 2014 was $1.0 million and $1.0 million,
F-16
respectively, and accumulated amortization was $998,200 and $996,700, respectively. Amortization expense totaled $2,000, $23,000 and $45,000, for the years ended December 31, 2015, 2014 and 2013, respectively.
As of December 31, 2015, scheduled amortization of intangible assets and deferred income related to in place leases is as follows:
(In thousands) | Lease acquisition costs | Above market leases | Below market leases | ||||||||
2016 | $ | 988 | $ | 2 | $ | 1,719 | |||||
2017 | 796 | 1 | 1,697 | ||||||||
2018 | 737 | 1 | 1,615 | ||||||||
2019 | 550 | — | 1,478 | ||||||||
2020 | 417 | — | 1,397 | ||||||||
Thereafter | 1,322 | — | 8,236 | ||||||||
Total | $ | 4,810 | $ | 4 | $ | 16,142 | |||||
4. | NONCONTROLLING INTERESTS - HOLDERS OF CONVERTIBLE LIMITED PARTNERSHIP UNITS IN THE OPERATING PARTNERSHIP |
The Saul Organization holds a 25.8% limited partnership interest in the Operating Partnership represented by 7,305,758 limited partnership units, as of December 31, 2015. The units are convertible into shares of Saul Centers’ common stock, at the option of the unit holder, on a one-for-one basis provided that, in accordance with the Saul Centers, Inc. Articles of Incorporation, the rights may not be exercised at any time that the Saul Organization beneficially owns, directly or indirectly, in the aggregate more than 39.9% of the value of the outstanding common stock and preferred stock of Saul Centers (the “Equity Securities”). As of December 31, 2015, 1,040,000 units were eligible for conversion.
The impact of the Saul Organization’s 25.8% limited partnership interest in the Operating Partnership is reflected as Noncontrolling Interests in the accompanying consolidated financial statements. Fully converted partnership units and diluted weighted average shares outstanding for the years ended December 31, 2015, 2014, and 2013, were 28,449,400, 27,977,500, and 27,330,100, respectively.
5. | MORTGAGE NOTES PAYABLE, REVOLVING CREDIT FACILITY, INTEREST EXPENSE AND AMORTIZATION OF DEFERRED DEBT COSTS |
At December 31, 2015, outstanding debt totaled $875.2 million, of which $832.4 million was fixed rate debt and $42.8 million was variable rate debt. The Company’s outstanding debt totaled $857.4 million at December 31, 2014, of which $784.8 million was fixed rate debt and $72.6 million was variable rate debt. At December 31, 2015, the Company had a $275.0 million unsecured revolving credit facility, which can be used for working capital, property acquisitions or development projects. The revolving credit facility matures on June 23, 2018, and may be extended by the Company for one additional year subject to the Company’s satisfaction of certain conditions. Saul Centers and certain consolidated subsidiaries of the Operating Partnership have guaranteed the payment obligations of the Operating Partnership under the revolving credit facility. Letters of credit may be issued under the revolving credit facility. On December 31, 2015, based on the value of the Company's unencumbered properties, approximately $246.6 million was available under the line, $28.0 million was outstanding and approximately $448,000 was committed for letters of credit. The interest rate under the facility is variable and equals the sum of one-month LIBOR and a margin that is based on the Company’s leverage ratio and which can range from 145 basis points to 200 basis points. As of December 31, 2015, the margin was 145 basis points.
Saul Centers is a guarantor of the revolving credit facility, of which the Operating Partnership is the borrower, the Metro Pike Center bank loan (approximately $7.8 million of the $14.8 million outstanding at December 31, 2015) and all of the Park Van Ness construction-to-permanent loan. All other notes payable are non-recourse.
F-17
On February 27, 2013, the Company closed on a three-year $15.6 million mortgage loan secured by Metro Pike Center. The loan matures in 2017, bears interest at a variable rate equal to the sum of one-month LIBOR and 165 basis points, requires monthly principal and interest payments based on a 25-year amortization schedule and requires a final payment of $14.8 million at maturity. The loan may be extended for one additional year. Proceeds were used to pay-off the $15.9 million remaining balance of existing debt secured by Metro Pike Center, and to extinguish the related swap agreement.
On February 27, 2013, the Company closed on a three-year $15.0 million mortgage loan secured by Northrock. The loan was originally scheduled to mature in 2016 and was refinanced in 2015. The loan bore interest at a variable rate equal to the sum of one-month LIBOR and 165 basis points, required monthly principal and interest payments based on a 25-year amortization schedule and required a final payment of $14.2 million at maturity. Proceeds were used to pay-off the $15.0 million remaining balance of existing debt secured by Northrock.
On March 19, 2013, the Company closed on a 15-year, non-recourse $18.0 million mortgage loan secured by Hampshire Langley. The loan matures in 2028, bears interest at a fixed rate of 4.04%, requires monthly principal and interest payments totaling $95,400 based on a 25-year amortization schedule and requires a final payment of $9.5 million at maturity.
On April 10, 2013, the Company paid in full the $6.9 million remaining balance on the mortgage loan secured by Cruse Marketplace.
On May 28, 2013, the Company closed on a 15-year, non-recourse $35.0 million mortgage loan secured by Beacon Center. The loan matures in 2028, bears interest at a fixed rate of 3.51%, requires monthly principal and interest payments totaling $203,200 based on a 20-year amortization schedule and requires a final payment of $11.4 million at maturity.
On September 4, 2013, the Company closed on a 15-year, non-recourse $18.0 million mortgage loan secured by Seabreeze Plaza. The loan matures in 2028, bears interest at a fixed rate of 3.99%, requires monthly principal and interest payments totaling $94,900 based on a 25-year amortization schedule and requires a final payment of $9.5 million at maturity. Proceeds were used to pay off the $13.5 million remaining balance of existing debt secured by Seabreeze Plaza which was scheduled to mature in May 2014 and the Company incurred $497,000 of related debt extinguishment costs.
On October 25, 2013 the Company closed on a $71.6 million construction-to-permanent loan which will partially finance the construction of Park Van Ness. The loan bears interest at 4.88% and during the construction period it will be fully recourse to Saul Centers and accrued interest will be funded by the loan. Following the completion of construction and lease-up, and upon achieving certain debt service coverage requirements, the loan will convert to a non-recourse, permanent mortgage at the same interest rate, with principal amortization computed based on a 25-year schedule.
On June 24, 2014, the Company amended and restated its revolving credit facility. The Company unsecured revolving credit facility, which can be used for working capital, property acquisitions, development projects or letters of credit was increased to $275.0 million. The revolving credit facility matures on June 23, 2018, and may be extended by the Company for one additional year subject to the Company’s satisfaction of certain conditions. Saul Centers and certain consolidated subsidiaries of the Operating Partnership have guaranteed the payment obligations of the Operating Partnership under the revolving credit facility. Letters of credit may be issued under the revolving credit facility. The interest rate under the facility is variable and equals the sum of one-month LIBOR and a margin that is based on the Company’s leverage ratio, and which can range from 145 basis points to 200 basis points.
On March 3, 2015, the Company closed on a 15-year, non-recourse $30.0 million mortgage loan secured by Shops at Fairfax and Boulevard. The loan matures in 2030, bears interest at a fixed rate of 3.69%, requires monthly principal and interest payments totaling $153,300 based on a 25-year amortization schedule and requires a final payment of $15.5 million at maturity. Proceeds were used to repay in full the $15.2 million remaining balance of existing debt secured by Shops at Fairfax and Boulevard and to reduce outstanding borrowings under the revolving credit facility.
F-18
On April 1, 2015, the Company closed on a 15-year, non-recourse $16.0 million mortgage loan secured by Northrock. The loan matures in 2030, bears interest at a fixed rate of 3.99%, requires monthly principal and interest payments totaling $84,400 based on a 25-year amortization schedule and requires a final payment of $8.4 million at maturity. Proceeds were used to repay in full the $14.5 million remaining balance of existing debt secured by Northrock.
F-19
The following is a summary of notes payable as of December 31, 2015 and 2014.
Notes Payable | December 31, | Interest | Scheduled | |||||||||||
(Dollars in thousands) | 2015 | 2014 | Rate * | Maturity * | ||||||||||
Fixed rate mortgages: | $ | — | (a) | $ | 15,399 | 7.45 | % | Jun-2015 | ||||||
30,778 | (b) | 32,049 | 6.01 | % | Feb-2018 | |||||||||
33,766 | (c) | 35,398 | 5.88 | % | Jan-2019 | |||||||||
10,928 | (d) | 11,454 | 5.76 | % | May-2019 | |||||||||
15,098 | (e) | 15,819 | 5.62 | % | Jul-2019 | |||||||||
15,064 | (f) | 15,761 | 5.79 | % | Sep-2019 | |||||||||
13,387 | (g) | 14,014 | 5.22 | % | Jan-2020 | |||||||||
10,587 | (h) | 10,881 | 5.60 | % | May-2020 | |||||||||
9,127 | (i) | 9,535 | 5.30 | % | Jun-2020 | |||||||||
40,360 | (j) | 41,441 | 5.83 | % | Jul-2020 | |||||||||
8,025 | (k) | 8,346 | 5.81 | % | Feb-2021 | |||||||||
5,959 | (l) | 6,100 | 6.01 | % | Aug-2021 | |||||||||
34,420 | (m) | 35,222 | 5.62 | % | Jun-2022 | |||||||||
10,492 | (n) | 10,718 | 6.08 | % | Sep-2022 | |||||||||
11,365 | (o) | 11,587 | 6.43 | % | Apr-2023 | |||||||||
14,177 | (p) | 14,909 | 6.28 | % | Feb-2024 | |||||||||
16,348 | (q) | 16,750 | 7.35 | % | Jun-2024 | |||||||||
14,197 | (r) | 14,535 | 7.60 | % | Jun-2024 | |||||||||
25,088 | (s) | 25,639 | 7.02 | % | Jul-2024 | |||||||||
29,714 | (t) | 30,429 | 7.45 | % | Jul-2024 | |||||||||
29,564 | (u) | 30,253 | 7.30 | % | Jan-2025 | |||||||||
15,360 | (v) | 15,735 | 6.18 | % | Jan-2026 | |||||||||
112,299 | (w) | 115,291 | 5.31 | % | Apr-2026 | |||||||||
34,133 | (x) | 35,125 | 4.30 | % | Oct-2026 | |||||||||
38,842 | (y) | 39,932 | 4.53 | % | Nov-2026 | |||||||||
18,150 | (z) | 18,645 | 4.70 | % | Dec-2026 | |||||||||
67,850 | (aa) | 69,397 | 5.84 | % | May-2027 | |||||||||
16,826 | (bb) | 17,281 | 4.04 | % | Apr-2028 | |||||||||
31,844 | (cc) | 33,140 | 3.51 | % | Jun-2028 | |||||||||
17,011 | (dd) | 17,462 | 3.99 | % | Sep-2028 | |||||||||
29,444 | (ee) | — | 3.69 | % | Mar-2030 | |||||||||
15,748 | (ff) | — | 3.99 | % | Apr-2030 | |||||||||
45,208 | (gg) | 5,391 | 4.88 | % | Sep-2032 | |||||||||
11,282 | (hh) | 11,119 | 8.00 | % | Apr-2034 | |||||||||
Total fixed rate | 832,441 | 784,757 | 5.53 | % | 9.2 Years | |||||||||
Variable rate loans: | ||||||||||||||
28,000 | (ii) | 43,000 | LIBOR + 1.45 | % | Jun-2018 | |||||||||
— | (jj) | 14,525 | LIBOR + 1.65 | % | Feb-2016 | |||||||||
14,801 | (kk) | 15,106 | LIBOR + 1.65 | % | Feb-2017 | |||||||||
Total variable rate | $ | 42,801 | $ | 72,631 | LIBOR + 1.94 | % | 2.0 Years | |||||||
Total notes payable | $ | 875,242 | $ | 857,388 | 5.35 | % | 8.9 Years | |||||||
* | Interest rate and scheduled maturity data presented as of December 31, 2015. Totals computed using weighted averages. |
F-20
(a) | The loan was collateralized by Shops at Fairfax and Boulevard shopping centers and required equal monthly principal and interest payments totaling $156,000 based upon a weighted average 23-year amortization schedule and a final payment of $15.2 million was due at loan maturity. In 2015 the loan was repaid in full and replaced with a new $30.0 million loan. See (ee) below. |
(b) | The loan is collateralized by Washington Square and requires equal monthly principal and interest payments of $264,000 based upon a 27.5-year amortization schedule and a final payment of $28.0 million at loan maturity. Principal of $1.3 million was amortized during 2015. |
(c) | The loan is collateralized by three shopping centers, Broadlands Village, The Glen and Kentlands Square I, and requires equal monthly principal and interest payments of $306,000 based upon a 25-year amortization schedule and a final payment of $28.4 million at loan maturity. Principal of $1.6 million was amortized during 2015. |
(d) | The loan is collateralized by Olde Forte Village and requires equal monthly principal and interest payments of $98,000 based upon a 25-year amortization schedule and a final payment of $9.0 million at loan maturity. Principal of $526,000 was amortized during 2015. |
(e) | The loan is collateralized by Countryside and requires equal monthly principal and interest payments of $133,000 based upon a 25-year amortization schedule and a final payment of $12.3 million at loan maturity. Principal of $721,000 was amortized during 2015. |
(f) | The loan is collateralized by Briggs Chaney MarketPlace and requires equal monthly principal and interest payments of $133,000 based upon a 25-year amortization schedule and a final payment of $12.2 million at loan maturity. Principal of $697,000 was amortized during 2015. |
(g) | The loan is collateralized by Shops at Monocacy and requires equal monthly principal and interest payments of $112,000 based upon a 25-year amortization schedule and a final payment of $10.6 million at loan maturity. Principal of $627,000 was amortized during 2015. |
(h) | The loan is collateralized by Boca Valley Plaza and requires equal monthly principal and interest payments of $75,000 based upon a 30-year amortization schedule and a final payment of $9.1 million at loan maturity. Principal of $294,000 was amortized during 2015. |
(i) | The loan is collateralized by Palm Springs Center and requires equal monthly principal and interest payments of $75,000 based upon a 25-year amortization schedule and a final payment of $7.1 million at loan maturity. Principal of $408,000 was amortized during 2015. |
(j) | The loan and a corresponding interest-rate swap closed on June 29, 2010 and are collateralized by Thruway. On a combined basis, the loan and the interest-rate swap require equal monthly principal and interest payments of $289,000 based upon a 25-year amortization schedule and a final payment of $34.8 million at loan maturity. Principal of $1,081,000 was amortized during 2015. |
(k) | The loan is collateralized by Jamestown Place and requires equal monthly principal and interest payments of $66,000 based upon a 25-year amortization schedule and a final payment of $6.1 million at loan maturity. Principal of $321,000 was amortized during 2015. |
(l) | The loan is collateralized by Hunt Club Corners and requires equal monthly principal and interest payments of $42,000 based upon a 30-year amortization schedule and a final payment of $5.0 million, at loan maturity. Principal of $141,000 was amortized during 2015. |
(m) | The loan is collateralized by Lansdowne Town Center and requires monthly principal and interest payments of $230,000 based on a 30-year amortization schedule and a final payment of $28.2 million at loan maturity. Principal of $802,000 was amortized during 2015. |
(n) | The loan is collateralized by Orchard Park and requires equal monthly principal and interest payments of $73,000 based upon a 30-year amortization schedule and a final payment of $8.6 million at loan maturity. Principal of $226,000 was amortized during 2015. |
(o) | The loan is collateralized by BJ’s Wholesale and requires equal monthly principal and interest payments of $80,000 based upon a 30-year amortization schedule and a final payment of $9.3 million at loan maturity. Principal of $222,000 was amortized during 2015. |
(p) | The loan is collateralized by Great Falls shopping center. The loan consists of three notes which require equal monthly principal and interest payments of $138,000 based upon a weighted average 26-year amortization schedule and a final payment of $6.3 million at maturity. Principal of $732,000 was amortized during 2015. |
F-21
(q) | The loan is collateralized by Leesburg Pike and requires equal monthly principal and interest payments of $135,000 based upon a 25-year amortization schedule and a final payment of $11.5 million at loan maturity. Principal of $402,000 was amortized during 2015. |
(r) | The loan is collateralized by Village Center and requires equal monthly principal and interest payments of $119,000 based upon a 25-year amortization schedule and a final payment of $10.1 million at loan maturity. Principal of $338,000 was amortized during 2015. |
(s) | The loan is collateralized by White Oak and requires equal monthly principal and interest payments of $193,000 based upon a 24.4 year weighted amortization schedule and a final payment of $18.5 million at loan maturity. The loan was previously collateralized by Van Ness Square. During 2012, the Company substituted White Oak as the collateral and borrowed an additional $10.5 million. Principal of $551,000 was amortized during 2015. |
(t) | The loan is collateralized by Avenel Business Park and requires equal monthly principal and interest payments of $246,000 based upon a 25-year amortization schedule and a final payment of $20.9 million at loan maturity. Principal of $715,000 was amortized during 2015. |
(u) | The loan is collateralized by Ashburn Village and requires equal monthly principal and interest payments of $240,000 based upon a 25-year amortization schedule and a final payment of $20.5 million at loan maturity. Principal of $689,000 was amortized during 2015. |
(v) | The loan is collateralized by Ravenwood and requires equal monthly principal and interest payments of $111,000 based upon a 25-year amortization schedule and a final payment of $10.1 million at loan maturity. Principal of $375,000 was amortized during 2015. |
(w) | The loan is collateralized by Clarendon Center and requires equal monthly principal and interest payments of $753,000 based upon a 25-year amortization schedule and a final payment of $70.5 million at loan maturity. Principal of $3.0 million was amortized during 2015. |
(x) | The loan is collateralized by Severna Park MarketPlace and requires equal monthly principal and interest payments of $207,000 based upon a 25-year amortization schedule and a final payment of $20.3 million at loan maturity. Principal of $992,000 was amortized during 2015. |
(y) | The loan is collateralized by Kentlands Square II and requires equal monthly principal and interest payments of $240,000 based upon a 25-year amortization schedule and a final payment of $23.1 million at loan maturity. Principal of $1,090,000 was amortized during 2015. |
(z) | The loan is collateralized by Cranberry Square and requires equal monthly principal and interest payments of $113,000 based upon a 25-year amortization schedule and a final payment of $10.9 million at loan maturity. Principal of $495,000 was amortized during 2015. |
(aa) | The loan in the original amount of $73.0 million closed in May 2012, is collateralized by Seven Corners and requires equal monthly principal and interest payments of $463,200 based upon a 25-year amortization schedule and a final payment of $42.3 million at loan maturity. Principal of $1.5 million was amortized during 2015. |
(bb) | The loan is collateralized by Hampshire Langley and requires equal monthly principal and interest payments of $95,400 based upon a 25 -year amortization schedule and a final payment of $9.5 million at loan maturity. Principal of $455,000 was amortized in 2015. |
(cc) | The loan is collateralized by Beacon Center and requires equal monthly principal and interest payments of $203,200 based upon a 20-year amortization schedule and a final payment of $11.4 million at loan maturity. Principal of $1,296,000 was amortized in 2015. |
(dd) | The loan is collateralized by Seabreeze Plaza and requires equal monthly principal and interest payments of $94,900 based upon a 25-year amortization schedule and a final payment of $9.5 million at loan maturity. Principal of $451,000 was amortized in 2015. |
(ee) | The loan is collateralized by Shops at Fairfax and Boulevard shopping centers and requires equal monthly principal and interest payments totaling $153,300 based upon a 25-year amortization schedule and a final payment of $15.5 million at maturity. Principal of $556,000 was amortized in 2015. |
(ff) The loan is collateralized by Northrock and requires equal monthly principal and interest payments totaling $84,400 based upon a 25-year amortization schedule and a final payment of $8.4 million at maturity. Principal of $252,000 was amortized in 2015.
(gg) | The loan is a $71.6 million construction-to-permanent facility that is collateralized by and will finance a portion of the construction costs of Park Van Ness. During the construction period, interest will be funded by the loan. After conversion to a permanent loan, monthly principal and interest payments totaling $413,500 |
F-22
will be required based upon a 25-year amortization schedule. A final payment of $39.6 million will be due at maturity.
(hh) | The Company entered into a sale-leaseback transaction with its Olney property and is accounting for that transaction as a secured financing. The arrangement requires monthly payments of $60,400 which increase by 1.5% on May 1, 2015, and every May 1 thereafter. The arrangement provides for a final payment of $14.7 million and has an implicit interest rate of 8.0%. Negative amortization in 2015 totaled $163,000. |
(ii) | The loan is a $275.0 million unsecured revolving credit facility. Interest accrues at a rate equal to the sum of one-month LIBOR plus a spread of 145 basis points. The line may be extended at the Company’s option for one year with payment of a fee of 0.15%. Monthly payments, if required, are interest only and vary depending upon the amount outstanding and the applicable interest rate for any given month. |
(jj) | The loan was collateralized by Northrock and required monthly principal and interest payments of approximately $47,000 and a final payment of $14.2 million at maturity. In 2015 the loan was repaid in full and replaced with a new $16.0 million loan. See (ff) above. |
(kk) | The loan is collateralized by Metro Pike Center and requires monthly principal and interest payments of approximately $48,000 and a final payment of $14.8 million at loan maturity. Principal of $305,000 was amortized during 2015. |
The carrying value of the properties collateralizing the mortgage notes payable totaled $856.8 million and $895.5 million, as of December 31, 2015 and 2014, respectively. The Company’s credit facility requires the Company and its subsidiaries to maintain certain financial covenants, which are summarized below. The Company was in compliance as of December 31, 2015.
• | maintain tangible net worth, as defined in the loan agreement, of at least $542.1 million plus 80% of the Company’s net equity proceeds received after March 2014; |
• | limit the amount of debt as a percentage of gross asset value, as defined in the loan agreement, to less than 60% (leverage ratio); |
• | limit the amount of debt so that interest coverage will exceed 2.0 x on a trailing four-quarter basis (interest expense coverage); and |
• | limit the amount of debt so that interest, scheduled principal amortization and preferred dividend coverage exceeds 1.3x on a trailing four-quarter basis (fixed charge coverage). |
Mortgage notes payable at each of December 31, 2015 and 2014, totaling $51.0 million, are guaranteed by members of the Saul Organization. As of December 31, 2015, the scheduled maturities of all debt including scheduled principal amortization for years ended December 31 are as follows:
(in thousands) | Balloon Payments | Scheduled Principal Amortization | Total | ||||||||
2016 | $ | — | $ | 24,655 | $ | 24,655 | |||||
2017 | 14,430 | 25,798 | 40,228 | ||||||||
2018 | 55,748 | (a) | 25,903 | 81,651 | |||||||
2019 | 60,793 | 24,616 | 85,409 | ||||||||
2020 | 61,163 | 21,893 | 83,056 | ||||||||
Thereafter | 432,565 | 127,678 | 560,243 | ||||||||
$ | 624,699 | $ | 250,543 | $ | 875,242 | ||||||
(a) Includes $28.0 million outstanding under the line of credit.
The components of interest expense are set forth below.
F-23
(in thousands) | Year ended December 31, | ||||||||||
2015 | 2014 | 2013 | |||||||||
Interest incurred | $ | 45,898 | $ | 45,396 | $ | 45,502 | |||||
Amortization of deferred debt costs | 1,433 | 1,327 | 1,257 | ||||||||
Capitalized interest | (2,166 | ) | (689 | ) | (170 | ) | |||||
Total | $ | 45,165 | $ | 46,034 | $ | 46,589 | |||||
Deferred debt costs capitalized during the years ending December 31, 2015, 2014 and 2013 totaled $0.3 million, $1.3 million and $3.2 million, respectively.
6. | LEASE AGREEMENTS |
Lease income includes primarily base rent arising from noncancelable leases. Base rent (including straight-line rent) for the years ended December 31, 2015, 2014, and 2013, amounted to $168.3 million, $164.6 million, and $159.9 million, respectively. Future contractual payments under noncancelable leases for years ended December 31 (which exclude the effect of straight-line rents), are as follows:
(in thousands) | |||
2016 | $ | 154,983 | |
2017 | 140,786 | ||
2018 | 122,922 | ||
2019 | 100,845 | ||
2020 | 80,559 | ||
Thereafter | 273,328 | ||
$ | 873,423 | ||
The majority of the leases provide for rental increases and expense recoveries based on fixed annual increases or increases in the Consumer Price Index and increases in operating expenses. The expense recoveries generally are payable in equal installments throughout the year based on estimates, with adjustments made in the succeeding year. Expense recoveries for the years ended December 31, 2015, 2014, and 2013, amounted to $32.9 million, $32.1 million, and $30.9 million, respectively. In addition, certain retail leases provide for percentage rent based on sales in excess of the minimum specified in the tenant’s lease. Percentage rent amounted to $1.6 million, $1.5 million, and $1.6 million, for the years ended December 31, 2015, 2014, and 2013, respectively.
7. | LONG-TERM LEASE OBLIGATIONS |
Certain properties are subject to noncancelable long-term leases which apply to land underlying the Shopping Centers. Certain of the leases provide for periodic adjustments of the base annual rent and require the payment of real estate taxes on the underlying land. The leases will expire between 2058 and 2068. Reflected in the accompanying consolidated financial statements is minimum ground rent expense of $176,000, $176,000, and $176,000, for the years ended December 31, 2015, 2014, and 2013, respectively. The future minimum rental commitments under these ground leases are as follows:
Year ending December 31, | |||||||||||||||||||||||||||
(In thousands) | 2016 | 2017 | 2018 | 2019 | 2020 | Thereafter | Total | ||||||||||||||||||||
Beacon Center | $ | 60 | $ | 60 | $ | 60 | $ | 60 | $ | 60 | $ | 2,482 | $ | 2,782 | |||||||||||||
Olney | 56 | 56 | 56 | 57 | 62 | 3,697 | 3,984 | ||||||||||||||||||||
Southdale | 60 | 60 | 60 | 60 | 60 | 2,825 | 3,125 | ||||||||||||||||||||
Total | $ | 176 | $ | 176 | $ | 176 | $ | 177 | $ | 182 | $ | 9,004 | $ | 9,891 | |||||||||||||
In addition to the above, Flagship Center consists of two developed out parcels that are part of a larger adjacent community shopping center formerly owned by the Saul Organization and sold to an affiliate of a tenant in
F-24
1991. The Company has a 90-year ground leasehold interest which commenced in September 1991 with a minimum rent of one dollar per year. Countryside shopping center was acquired in February 2004. Because of certain land use considerations, approximately 3.4% of the underlying land is held under a 99-year ground lease. The lease requires the Company to pay minimum rent of one dollar per year as well as its pro-rata share of the real estate taxes.
The Company’s corporate headquarters space is leased by a member of the Saul Organization. The lease commenced in March 2002, was extended in 2012 for five years, and provides for base rent increases of 3% per year, with payment of a pro-rata share of operating expenses over a base year amount. The Company and the Saul Organization entered into a Shared Services Agreement whereby each party pays an allocation of total rental payments based on a percentage proportionate to the number of employees employed by each party. The Company’s rent expense for the years ended December 31, 2015, 2014, and 2013 was $904,900, $840,800, and $850,600, respectively. Expenses arising from the lease are included in general and administrative expense (see Note 9 – Related Party Transactions).
8. | STOCKHOLDERS’ EQUITY AND NONCONTROLLING INTEREST |
The Consolidated Statements of Operations for the years ended December 31, 2015, 2014, and 2013 reflect noncontrolling interest of $10.5 million, $11.0 million, and $4.0 million, respectively, representing the Saul Organization’s share of the net income for the year.
In November 2003, the Company sold 4,000,000 depositary shares, each representing 1/100th of a share of 8% Series A Cumulative Redeemable Preferred Stock (the "Series A Stock"). The depositary shares are redeemable, in whole or in part at the Company’s option, from time to time, at $25.00 per share. The depositary shares pay an annual dividend of $2.00 per share, equivalent to 8% of the $25.00 per share liquidation preference. The Series A preferred stock has no stated maturity, is not subject to any sinking fund or mandatory redemption and is not convertible into any other securities of the Company. Investors in the depositary shares generally have no voting rights, but will have limited voting rights if the Company fails to pay dividends for six or more quarters (whether or not declared or consecutive) and in certain other events. In March 2013, the Company redeemed 60% of its then-outstanding Series A Stock. In December 2014, the Company redeemed the remaining outstanding Series A Stock. Costs associated with the redemptions were charged against accumulated deficit in the respective periods.
In March 2008, the Company sold 3,173,115 depositary shares, each representing 1/100th of a share of 9% Series B Cumulative Redeemable Preferred Stock (the "Series B Stock"). The depositary shares may be redeemed at the Company’s option, on or after March 15, 2013, in whole or in part, at $25.00 per share. The depositary shares pay an annual dividend of $2.25 per share, equivalent to 9% of the $25.00 per share liquidation preference. The Series B preferred stock has no stated maturity, is not subject to any sinking fund or mandatory redemption and is not convertible into any other securities of the Company. Investors in the depositary shares generally have no voting rights, but will have limited voting rights if the Company fails to pay dividends for six or more quarters (whether or not declared or consecutive) and in certain other events. In March 2013, the Company redeemed all of its Series B Stock. Costs associated with the redemption were charged against accumulated deficit.
On February 12, 2013, the Company sold, in an underwritten public offering, 5.6 million depositary shares, each representing 1/100th of a share of 6.875% Series C Cumulative Redeemable Preferred Stock ("Series C Stock"), and received net cash proceeds of approximately $135.2 million. The depositary shares may be redeemed on or after February 12, 2018 at the Company’s option, in whole or in part, at the $25.00 liquidation preference plus accrued but unpaid dividends. The depositary shares pay an annual dividend of $1.71875 per share, equivalent to 6.875% of the $25.00 liquidation preference. The first dividend was paid on April 15, 2013 and covered the period from February 12, 2013 through March 31, 2013. The Series C Stock has no stated maturity, is not subject to any sinking fund or mandatory redemption and is not convertible into any other securities of the Company except in connection with certain changes of control or delisting events. Investors in the depositary shares generally have no voting rights, but will have limited voting rights if the Company fails to pay dividends for six or more quarters (whether or not declared or consecutive) and in certain other events. On November 12, 2014, the Company sold, in an underwritten public offering, 1.6 million depositary shares of Series C Stock and received net cash proceeds of approximately $39.3 million (the "Additional Series C Stock"). The terms of Additional Series C Stock are identical to the Series C Stock.
F-25
9. | RELATED PARTY TRANSACTIONS |
The Chairman and Chief Executive Officer, the President and Chief Operating Officer, the Executive Vice President-Chief Legal and Administrative Officer and the Senior Vice President-Chief Accounting Officer of the Company are also officers of various members of the Saul Organization and their management time is shared with the Saul Organization. Their annual compensation is fixed by the Compensation Committee of the Board of Directors, with the exception of the Senior Vice President-Chief Accounting Officer whose share of annual compensation allocated to the Company is determined by the shared services agreement (described below).
The Company participates in a multiemployer 401K plan with entities in the Saul Organization which covers those full-time employees who meet the requirements as specified in the plan. Company contributions, which are included in general and administrative expense or property operating expenses in the consolidated statements of operations, at the discretionary amount of up to six percent of the employee’s cash compensation, subject to certain limits, were $400,000, $379,000, and $369,000, for 2015, 2014, and 2013, respectively. All amounts deferred by employees and contributed by the Company are fully vested.
The Company also participates in a multiemployer nonqualified deferred compensation plan with entities in the Saul Organization which covers those full-time employees who meet the requirements as specified in the plan. According to the plan, which can be modified or discontinued at any time, participating employees defer 2% of their compensation in excess of a specified amount. For the years ended December 31, 2015, 2014, and 2013, the Company contributed three times the amount deferred by employees. The Company’s expense, included in general and administrative expense, totaled $224,900, $192,800, and $191,300, for the years ended December 31, 2015, 2014, and 2013, respectively. All amounts deferred by employees and the Company are fully vested. The cumulative unfunded liability under this plan was $1.8 million and $1.8 million, at December 31, 2015 and 2014, respectively, and is included in accounts payable, accrued expenses and other liabilities in the consolidated balance sheets.
The Company has entered into a shared services agreement (the “Agreement”) with the Saul Organization that provides for the sharing of certain personnel and ancillary functions such as computer hardware, software, and support services and certain direct and indirect administrative personnel. The method for determining the cost of the shared services is provided for in the Agreement and is based upon head count, estimates of usage or estimates of time incurred, as applicable. Senior management has determined that the final allocations of shared costs are reasonable. The terms of the Agreement and the payments made thereunder are reviewed annually by the Audit Committee of the Board of Directors, which consists entirely of independent directors. Billings by the Saul Organization for the Company’s share of these ancillary costs and expenses for the years ended December 31, 2015, 2014, and 2013, which included rental expense for the Company’s headquarters lease (see Note 7. Long Term Lease Obligations), totaled $8.2 million, $7.4 million, and $6.3 million, respectively. The amounts are expensed when incurred and are primarily reported as general and administrative expenses or capitalized to specific development projects in these consolidated financial statements. As of December 31, 2015 and 2014, accounts payable, accrued expenses and other liabilities included $655,000 and $543,000, respectively, representing billings due to the Saul Organization for the Company’s share of these ancillary costs and expenses.
The Company has entered into a shared third-party predevelopment cost agreement with the B. F. Saul Real Estate Investment Trust, a member of the Saul Organization (the “Predevelopment Agreement”). The Predevelopment Agreement, which expired on December 31, 2015 and was extended to December 31, 2016, relates to the sharing of third-party predevelopment costs incurred in connection with the planning of the future redevelopment of certain adjacent real estate assets in the Twinbrook area of Rockville, Maryland. The costs will be billed by the third-parties on a pro rata basis based on the acreage owned by each entity and neither party is obligated to advance funds to the other.
The B. F. Saul Insurance Agency of Maryland, Inc., a subsidiary of the B. F. Saul Company and a member of the Saul Organization, is a general insurance agency that receives commissions and counter-signature fees in connection with the Company’s insurance program. Such commissions and fees amounted to approximately $443,500, $427,300, and $447,300, for the years ended December 31, 2015, 2014, and 2013, respectively.
F-26
Effective as of September 4, 2012, the Company entered into a consulting agreement with B. F. Saul III, one of the Company’s former presidents, whereby Mr. Saul III provided certain consulting services to the Company as an independent contractor and was paid at a rate of $60,000 per month. The consulting agreement included certain noncompete, nonsolicitation and nondisclosure covenants, and expired in September 2014. During 2014 and 2013 such consulting fees totaled $495,000 and $720,000, respectively.
10. | STOCK OPTION PLAN |
The Company established a stock option plan in 1993 (the “1993 Plan”) for the purpose of attracting and retaining executive officers and other key personnel. The 1993 Plan provides for grants of options to purchase up to 400,000 shares of common stock. The 1993 Plan authorizes the Compensation Committee of the Board of Directors to grant options at an exercise price which may not be less than the market value of the common stock on the date the option is granted.
At the annual meeting of the Company’s stockholders in 2004, the stockholders approved the adoption of the 2004 stock plan for the purpose of attracting and retaining executive officers, directors and other key personnel. The 2004 stock plan was subsequently amended by the Company’s stockholders at the 2008 Annual Meeting and further amended at the 2013 Annual Meeting (the “Amended 2004 Plan”). The Amended 2004 Plan, which terminates in 2023, provides for grants of options to purchase up to 2,000,000 shares of common stock as well as grants of up to 200,000 shares of common stock to directors. The Amended 2004 Plan authorizes the Compensation Committee of the Board of Directors to grant options at an exercise price which may not be less than the market value of the common stock on the date the option is granted.
Effective May 1, 2006, the Compensation Committee granted options to purchase 30,000 shares (all nonqualified stock options) to twelve Company directors (the “2006 Options”), which were immediately exercisable and expire on April 30, 2016. The exercise price of $40.35 per share was the closing market price of the Company’s common stock on the date of the award. Using the Black-Scholes model, the Company determined the total fair value of the 2006 Options to be $143,400. Because the directors’ options vested immediately, the entire $143,400 was expensed as of the date of grant. No options were granted to the Company’s officers in 2006.
Effective April 27, 2007, the Compensation Committee granted options to purchase 165,000 shares (27,560 incentive stock options and 137,440 nonqualified stock options) to thirteen Company officers and twelve Company Directors (the “2007 options”), which expire on April 26, 2017. The officers’ 2007 Options vest 25% per year over four years and are subject to early expiration upon termination of employment. The directors’ options were immediately exercisable. The exercise price of $54.17 per share was the closing market price of the Company’s common stock on the date of award. Using the Black-Scholes model, the Company determined the total fair value of the 2007 Options to be $1.5 million, of which $1.3 million and $285,300 were the values assigned to the officer options and director options, respectively. Because the directors’ options vested immediately, the entire $285,300 was expensed as of the date of grant. The expense for the officers’ options was recognized as compensation expense monthly during the four years the options vested.
Effective April 25, 2008, the Compensation Committee granted options to purchase 30,000 shares (all nonqualified stock options) to twelve Company directors (the “2008 Options”), which were immediately exercisable and expire on April 24, 2018. The exercise price of $50.15 per share was the closing market price of the Company’s common stock on the date of the award. Using the Black-Scholes model, the Company determined the total fair value of the 2008 Options to be $254,700. Because the directors’ options vested immediately, the entire $254,700 was expensed as of the date of grant. No options were granted to the Company’s officers in 2008.
Effective April 24, 2009, the Compensation Committee granted options to purchase 32,500 shares (all nonqualified stock options) to thirteen Company directors (the “2009 Options”), which were immediately exercisable and expire on April 23, 2019. The exercise price of $32.68 per share was the closing market price of the Company’s common stock on the date of the award. Using the Black-Scholes model, the Company determined the total fair value of the 2009 Options to be $222,950. Because the directors’ options vested immediately, the entire $222,950 was expensed as of the date of grant. No options were granted to the Company’s officers in 2009.
Effective May 7, 2010, the Compensation Committee granted options to purchase 32,500 shares (all nonqualified stock options) to thirteen Company directors (the “2010 Options”), which were immediately exercisable and expire on May 6, 2020. The exercise price of $38.76 per share was the closing market price of the
F-27
Company’s common stock on the date of the award. Using the Black-Scholes model, the Company determined the total fair value of the 2010 Options to be $287,950. Because the directors’ options vested immediately, the entire $287,950 was expensed as of the date of grant. No options were granted to the Company’s officers in 2010.
Effective May 13, 2011, the Compensation Committee granted options to purchase 195,000 shares (65,300 incentive stock options and 129,700 nonqualified stock options) to fifteen Company officers and thirteen Company Directors (the “2011 options”), which expire on May 12, 2021. The officers’ 2011 Options vest 25% per year over four years and are subject to early expiration upon termination of employment. The directors’ 2011 options were immediately exercisable. The exercise price of $41.82 per share was the closing market price of the Company’s common stock on the date of award. Using the Black-Scholes model, the Company determined the total fair value of the 2011 Options to be $1.6 million, of which $1.3 million and $297,375 were assigned to the officer options and director options, respectively. Because the directors’ options vested immediately, the entire $297,375 was expensed as of the date of grant. The expense for the officers’ options is being recognized as compensation expense monthly during the four years the options vest.
Effective May 4, 2012, the Compensation Committee granted options to purchase 277,500 shares (26,157 incentive stock options and 251,343 nonqualified stock options) to fifteen Company officers and fourteen Company Directors (the “2012 options”), which expire on May 3, 2022. The officers’ 2012 Options vest 25% per year over four years and are subject to early expiration upon termination of employment. The directors’ 2012 Options were immediately exercisable. The exercise price of $39.29 per share was the closing market price of the Company’s common stock on the date of award. Using the Black-Scholes model, the Company determined the total fair value of the 2012 Options to be $1.7 million, of which $1.4 million and $257,250 were assigned to the officer options and director options, respectively. Because the directors’ options vested immediately, the entire $257,250 was expensed as of the date of grant. The expense for the officers’ options is being recognized as compensation expense monthly during the four years the options vest.
Effective May 10, 2013, the Compensation Committee granted options to purchase 237,500 shares (35,592 incentive stock options and 201,908 nonqualified stock options) to fifteen Company officers and fourteen Company Directors (the "2013 options"), which expire on May 9, 2023. The officers' 2013 Options vest 25% per year over four years and are subject to early expiration upon termination of employment. The directors' 2013 options were immediately exercisable. The exercise price of $44.42 per share was the closing market price of the Company's common stock on the date of award. Using the Black-Scholes model, the Company determined the total fair value of the 2013 Options to be $1.5 million, of which $1.3 million and $0.3 million were assigned to the officer options and director options, respectively. Because the directors' options vested immediately, the entire $0.3 million was expensed as of the date of grant. The expense for the officers' options is being recognized as compensation expense monthly during the four years the option was vested.
Effective May 9, 2014, the Compensation Committee granted options to purchase 200,000 shares (29,300 incentive stock options and 170,700 nonqualified stock options) to eighteen Company officers and twelve Company Directors (the “2014 options”), which expire on May 8, 2024. The officers’ 2014 Options vest 25% per year over four years and are subject to early expiration upon termination of employment. The directors’ 2014 Options were immediately exercisable. The exercise price of $47.03 per share was the closing market price of the Company’s common stock on the date of award. Using the Black-Scholes model, the Company determined the total fair value of the 2014 Options to be $1.3 million, of which $1.2 million and $109,500 were assigned to the officer options and director options, respectively. Because the directors’ options vested immediately, the entire $109,500 was expensed as of the date of grant. The expense for the officers’ options is being recognized as compensation expense monthly during the four years the options vest.
Effective May 8, 2015, the Compensation Committee granted options to purchase 225,000 shares (33,690 incentive stock options and 191,310 nonqualified stock options) to 19 Company officers and 14 Company Directors (the “2015 options”), which expire on May 7, 2025. The officers’ 2015 Options vest 25% per year over four years and are subject to early expiration upon termination of employment. The directors’ 2015 Options were immediately exercisable. The exercise price of $51.07 per share was the closing market price of the Company’s common stock on the date of award. Using the Black-Scholes model, the Company determined the total fair value of the 2015 Options to be $1.6 million, of which $1.4 million and $125,300 were assigned to the officer options and director options, respectively. Because the directors’ options vested immediately, the entire $125,300 was expensed
F-28
as of the date of grant. The expense for the officers’ options is being recognized as compensation expense monthly during the four years the options vest.
The following table summarizes the amount and activity of each grant, the total value and variables used in the computation and the amount expensed and included in general and administrative expense in the Consolidated Statements of Operations for the years ended December 31, 2015, 2014 and 2013.
F-29
SAUL CENTERS, INC. Notes to Consolidated Financial Statements (Dollars in thousands, except per share data) | ||||||||||||||||||||||||||||||||||||||||||||
Stock options issued | ||||||||||||||||||||||||||||||||||||||||||||
Directors | ||||||||||||||||||||||||||||||||||||||||||||
Grant date | 5/1/2006 | 4/27/2007 | 4/25/2008 | 4/24/2009 | 5/7/2010 | 5/13/2011 | 5/4/2012 | 5/10/2013 | 5/9/2014 | 5/8/2015 | Subtotals | |||||||||||||||||||||||||||||||||
Total grant | 30,000 | 30,000 | 30,000 | 32,500 | 32,500 | 32,500 | 35,000 | 35,000 | 30,000 | 35,000 | 322,500 | |||||||||||||||||||||||||||||||||
Vested | 30,000 | 30,000 | 30,000 | 32,500 | 32,500 | 32,500 | 35,000 | 35,000 | 30,000 | 35,000 | 322,500 | |||||||||||||||||||||||||||||||||
Exercised | 20,000 | 5,000 | 7,500 | 22,500 | 15,000 | 15,000 | 15,000 | 12,500 | 7,500 | 5,000 | 125,000 | |||||||||||||||||||||||||||||||||
Forfeited | 2,500 | 7,500 | 7,500 | — | 2,500 | 2,500 | — | — | — | — | 22,500 | |||||||||||||||||||||||||||||||||
Exercisable at December 31, 2015 | 7,500 | 17,500 | 15,000 | 10,000 | 15,000 | 15,000 | 20,000 | 22,500 | 22,500 | 30,000 | 175,000 | |||||||||||||||||||||||||||||||||
Remaining unexercised | 7,500 | 17,500 | 15,000 | 10,000 | 15,000 | 15,000 | 20,000 | 22,500 | 22,500 | 30,000 | 175,000 | |||||||||||||||||||||||||||||||||
Exercise price | $ | 40.35 | $ | 54.17 | $ | 50.15 | $ | 32.68 | $ | 38.76 | $ | 41.82 | $ | 39.29 | $ | 44.42 | $ | 47.03 | $ | 51.07 | ||||||||||||||||||||||||
Volatility | 0.206 | 0.225 | 0.237 | 0.344 | 0.369 | 0.358 | 0.348 | 0.333 | 0.173 | 0.166 | ||||||||||||||||||||||||||||||||||
Expected life (years) | 9.0 | 8.0 | 7.0 | 6.0 | 5.0 | 5.0 | 5.0 | 5.0 | 5.0 | 5.0 | ||||||||||||||||||||||||||||||||||
Assumed yield | 5.93 | % | 4.39 | % | 4.09 | % | 4.54 | % | 4.23 | % | 4.16 | % | 4.61 | % | 4.53 | % | 4.48 | % | 4.54 | % | ||||||||||||||||||||||||
Risk-free rate | 5.11 | % | 4.65 | % | 3.49 | % | 2.19 | % | 2.17 | % | 1.86 | % | 0.78 | % | 0.82 | % | 1.63 | % | 1.50 | % | ||||||||||||||||||||||||
Total value at grant date | $ | 144 | $ | 285 | $ | 255 | $ | 223 | $ | 288 | $ | 297 | $ | 257 | $ | 278 | $ | 110 | $ | 125 | $ | 2,262 | ||||||||||||||||||||||
Expensed in previous years | 144 | 285 | 255 | 223 | 288 | 297 | 257 | — | — | — | 1,749 | |||||||||||||||||||||||||||||||||
Expensed in 2013 | — | — | — | — | — | — | — | 278 | — | — | 278 | |||||||||||||||||||||||||||||||||
Expensed in 2014 | — | — | — | — | — | — | — | — | 110 | — | 110 | |||||||||||||||||||||||||||||||||
Expensed in 2015 | — | — | — | — | — | — | — | — | — | 125 | 125 | |||||||||||||||||||||||||||||||||
Future expense | — | — | — | — | — | — | — | — | — | — | — | |||||||||||||||||||||||||||||||||
Officers | ||||||||||||||||||||||||||||||||||||||||||||
Grant date | 4/27/2007 | 5/13/2011 | 5/4/2012 | 5/10/2013 | 5/9/2014 | 5/8/2015 | Subtotals | Grand Totals | ||||||||||||||||||||||||||||||||||||
Total grant | 135,000 | 162,500 | 242,500 | 202,500 | 170,000 | 190,000 | 1,102,500 | 1,425,000 | ||||||||||||||||||||||||||||||||||||
Vested | 67,500 | 118,750 | 81,875 | 91,250 | 42,500 | — | 401,875 | 724,375 | ||||||||||||||||||||||||||||||||||||
Exercised | 14,097 | 58,754 | 40,625 | 24,375 | 3,125 | — | 140,976 | 265,976 | ||||||||||||||||||||||||||||||||||||
Forfeited | 67,500 | 43,750 | 135,000 | 30,000 | — | — | 276,250 | 298,750 | ||||||||||||||||||||||||||||||||||||
Exercisable at December 31, 2015 | 53,403 | 59,996 | 41,250 | 66,875 | 39,375 | — | 260,899 | 435,899 | ||||||||||||||||||||||||||||||||||||
Remaining unexercised | 53,403 | 59,996 | 66,875 | 148,125 | 166,875 | 190,000 | 685,274 | 860,274 | ||||||||||||||||||||||||||||||||||||
Exercise price | $ | 54.17 | $ | 41.82 | $ | 39.29 | $ | 44.42 | $ | 47.03 | $ | 51.07 | ||||||||||||||||||||||||||||||||
Volatility | 0.233 | 0.330 | 0.315 | 0.304 | 0.306 | 0.298 | ||||||||||||||||||||||||||||||||||||||
Expected life (years) | 6.5 | 8.0 | 8.0 | 8.0 | 7.0 | 7.0 | ||||||||||||||||||||||||||||||||||||||
Assumed yield | 4.13 | % | 4.81 | % | 5.28 | % | 5.12 | % | 4.89 | % | 4.94 | % | ||||||||||||||||||||||||||||||||
Risk-free rate | 4.61 | % | 2.75 | % | 1.49 | % | 1.49 | % | 2.17 | % | 1.89 | % | ||||||||||||||||||||||||||||||||
Gross value at grant date | $ | 1,339 | $ | 1,367 | $ | 1,518 | $ | 1,401 | $ | 1,350 | $ | 1,585 | $ | 8,560 | $ | 10,822 | ||||||||||||||||||||||||||||
Estimated forfeitures | 62 | 368 | 890 | 280 | 169 | 142 | 1,911 | 1,911 | ||||||||||||||||||||||||||||||||||||
Expensed in previous years | 1,277 | 457 | 105 | — | — | — | 1,839 | 3,588 | ||||||||||||||||||||||||||||||||||||
Expensed in 2013 | — | 236 | 157 | 209 | — | — | 602 | 880 | ||||||||||||||||||||||||||||||||||||
Expensed in 2014 | — | 217 | 157 | 284 | 197 | — | 855 | 965 | ||||||||||||||||||||||||||||||||||||
Expensed in 2015 | — | 89 | 157 | 269 | 295 | 241 | 1,051 | 1,176 | ||||||||||||||||||||||||||||||||||||
Future expense | — | — | 52 | 359 | 689 | 1,202 | 2,302 | 2,302 | ||||||||||||||||||||||||||||||||||||
Weighted average term of remaining future expense | 2.7 | years | ||||||||||||||||||||||||||||||||||||||||||
F-30
The table below summarizes the option activity for the years 2015, 2014, and 2013:
2015 | 2014 | 2013 | ||||||||||||||||||
Shares | Weighted Average Exercise Price | Shares | Weighted Average Exercise Price | Shares | Weighted Average Exercise Price | |||||||||||||||
Outstanding at January 1 | 748,208 | $ | 44.79 | 753,625 | $ | 42.55 | 570,840 | $ | 41.04 | |||||||||||
Granted | 225,000 | 51.07 | 200,000 | 47.03 | 237,500 | 44.42 | ||||||||||||||
Exercised | (112,934 | ) | 43.67 | (167,917 | ) | 37.71 | (49,715 | ) | 33.15 | |||||||||||
Expired/Forfeited | — | — | (37,500 | ) | 43.56 | (5,000 | ) | 52.16 | ||||||||||||
Outstanding December 31 | 860,274 | 46.58 | 748,208 | 44.79 | 753,625 | 42.55 | ||||||||||||||
Exercisable at December 31 | 435,899 | 380,708 | 44.85 | 413,000 | 42.42 | |||||||||||||||
The intrinsic value of options exercised in 2015, 2014, and 2013, was $1.5 million, $2.0 million and $0.6 million, respectively. The intrinsic value of options outstanding and exercisable at year end 2015 was $4.2 million and $2.8 million, respectively. The intrinsic value measures the difference between the options’ exercise price and the closing share price quoted by the New York Stock Exchange as of the date of measurement. The date of exercise was the measurement date for shares exercised during the period. At December 31, 2015, the final trading day of calendar 2015, the closing price of $51.27 per share was used for the calculation of aggregate intrinsic value of options outstanding and exercisable at that date. At December 31, 2015, 70,903 options issued in 2007 had an exercise price in excess of the market closing price and therefore had no intrinsic value. The weighted average remaining contractual life of the Company’s exercisable and outstanding options at December 31, 2015 are 5.7 and 7.1 years, respectively.
11. NON-OPERATING ITEMS
Gain on casualty settlement in 2013 reflects insurance proceeds received in excess of the carrying value of assets damaged during a hail storm at French Market in 2012. The insurance proceeds funded substantially all of the restoration of the damaged property.
12. FAIR VALUE OF FINANCIAL INSTRUMENTS
The carrying values of cash and cash equivalents, accounts receivable, accounts payable and accrued expenses are reasonable estimates of their fair value. The aggregate fair value of the notes payable with fixed-rate payment terms was determined using Level 3 data in a discounted cash flow approach, which is based upon management’s estimate of borrowing rates and loan terms currently available to the Company for fixed rate financing, and assuming long term interest rates of approximately 3.75% and 3.65%, would be approximately $832.4 million and $886.4 million as of December 31, 2015 and 2014, respectively, compared to the carrying value of $892.9 million and $784.8 million at December 31, 2015 and 2014, respectively. A change in any of the significant inputs may lead to a change in the Company’s fair value measurement of its debt.
Effective June 30, 2011, the Company determined that one of its interest-rate swap arrangements was a highly effective hedge of the cash flows under one of its variable-rate mortgage loans and designated the swap as a cash flow hedge of that mortgage. The swap is carried at fair value with changes in fair value recognized either in income or comprehensive income depending on the effectiveness of the swap. The following chart summarizes the changes in fair value of the Company’s swaps for the indicated periods.
F-31
(Dollars in thousands) | Year ended December 31, | ||||||||||
2015 | 2014 | 2013 | |||||||||
Increase (decrease) in fair value: | |||||||||||
Recognized in earnings | $ | (10 | ) | $ | (10 | ) | $ | (7 | ) | ||
Recognized in other comprehensive income | 124 | (675 | ) | 2,897 | |||||||
Total | $ | 114 | $ | (685 | ) | $ | 2,890 | ||||
The Company carries its interest rate swaps at fair value. The Company has determined the majority of the inputs used to value its derivative fall within Level 2 of the fair value hierarchy with the exception of the impact of counter-party risk, which was determined using Level 3 inputs and are not significant. Derivative instruments are classified within Level 2 of the fair value hierarchy because their values are determined using third-party pricing models which contain inputs that are derived from observable market data. Where possible, the values produced by the pricing models are verified by the market prices. Valuation models require a variety of inputs, including contractual terms, market prices, yield curves, credit spreads, measure of volatility, and correlations of such inputs. The swap agreement terminates on July 1, 2020. As of December 31, 2015, the fair value of the interest-rate swap was approximately $2.9 million and is included in “Accounts payable, accrued expenses and other liabilities” in the consolidated balance sheets. The decrease in value from inception of the swap designated as a cash flow hedge is reflected in “Other Comprehensive Income” in the Consolidated Statements of Comprehensive Income.
13. COMMITMENTS AND CONTINGENCIES
Neither the Company nor the Current Portfolio Properties are subject to any material litigation, nor, to management’s knowledge, is any material litigation currently threatened against the Company, other than routine litigation and administrative proceedings arising in the ordinary course of business. Management believes that these items, individually or in the aggregate, will not have a material adverse impact on the Company or the Current Portfolio Properties.
14. DISTRIBUTIONS
In December 1995, the Company established a Dividend Reinvestment and Stock Purchase Plan (the “Plan”), to allow its stockholders and holders of limited partnership interests an opportunity to buy additional shares of common stock by reinvesting all or a portion of their dividends or distributions. The Plan provides for investing in newly issued shares of common stock at a 3% discount from market price without payment of any brokerage commissions, service charges or other expenses. All expenses of the Plan are paid by the Company. The Operating Partnership also maintains a similar dividend reinvestment plan that mirrors the Plan, which allows holders of limited partnership interests the opportunity to buy either additional limited partnership units or common stock shares of the Company.
The Company paid common stock distributions of $1.69 per share in 2015 and $1.56 per share during 2014 and $1.44 per share during 2013, Series A preferred stock dividends of $2.41 per depositary share during 2014 and $2.00 per depositary share in 2013, Series B preferred stock dividends of $0.99 per depository share during 2013, and Series C preferred stock dividends of $1.72 per depositary share during each of 2015 and 2014 and $1.09 per depositary share during 2013. Of the common stock dividends paid, $1.69 per share, $1.56 per share, and $0.96 per share, represented ordinary dividend income in 2015, 2014, and 2013, respectively, and $0.48 per share represented return of capital to the shareholders in 2013. All of the preferred stock dividends paid were considered ordinary dividend income.
The following summarizes distributions paid during the years ended December 31, 2015, 2014, and 2013, and includes activity in the Plan as well as limited partnership units issued from the reinvestment of unit distributions:
F-32
Total Distributions to | Dividend Reinvestments | ||||||||||||||||||||||||
(Dollars in thousands, except per share amounts) | Preferred Stockholders | Common Stockholders | Limited Partnership Unitholders | Common Stock Shares Issued | Discounted Share Price | Limited Partnership Units Issued | Average Unit Price | ||||||||||||||||||
Distributions during 2015 | |||||||||||||||||||||||||
October 31 | $ | 3,094 | $ | 9,106 | $ | 3,129 | 47,313 | $ | 55.73 | 28,936 | $ | 55.73 | |||||||||||||
July 31 | 3,094 | 9,081 | 3,115 | 56,003 | 50.30 | 32,041 | 50.30 | ||||||||||||||||||
April 30 | 3,094 | 9,055 | 3,104 | 54,921 | 50.21 | 25,264 | 50.21 | ||||||||||||||||||
January 31 | 3,093 | 8,403 | 2,880 | 42,975 | 56.74 | 20,796 | 56.74 | ||||||||||||||||||
Total 2015 | $ | 12,375 | $ | 35,645 | $ | 12,228 | 201,212 | 107,037 | |||||||||||||||||
Distributions during 2014 | |||||||||||||||||||||||||
October 31 | $ | 3,856 | $ | 8,348 | $ | 2,879 | 40,142 | $ | 52.71 | ||||||||||||||||
July 31 | 3,206 | 8,314 | 2,879 | 57,696 | 46.79 | ||||||||||||||||||||
April 30 | 3,206 | 8,269 | 2,838 | 60,212 | 44.14 | 104,831 | $ | 44.77 | |||||||||||||||||
January 31 | 3,206 | 7,415 | 2,521 | 39,588 | 45.15 | 91,352 | 45.80 | ||||||||||||||||||
Total 2014 | $ | 13,474 | $ | 32,346 | $ | 11,117 | 197,638 | 196,183 | |||||||||||||||||
Distributions during 2013 | |||||||||||||||||||||||||
October 31 | $ | 3,206 | $ | 7,388 | $ | 2,489 | 48,836 | $ | 46.27 | 88,309 | $ | 46.93 | |||||||||||||
July 31 | 3,206 | 7,327 | 2,489 | 138,019 | 45.21 | ||||||||||||||||||||
April 30 | 4,364 | 7,272 | 2,489 | 142,839 | 42.85 | ||||||||||||||||||||
January 31 | 3,785 | 7,218 | 2,489 | 145,468 | 41.67 | ||||||||||||||||||||
Total 2013 | $ | 14,561 | $ | 29,205 | $ | 9,956 | 475,162 | 88,309 | |||||||||||||||||
In December 2015, the Board of Directors of the Company authorized a distribution of $0.43 per common share payable in January 2016, to holders of record on January 15, 2016. As a result, $9.1 million was paid to common shareholders on January 29, 2016. Also, $3.1 million was paid to limited partnership unitholders on January 29, 2016 ($0.43 per Operating Partnership unit). The Board of Directors authorized preferred stock dividends of $0.4297 per Series C depositary share to holders of record on January 7, 2016. As a result, $3.1 million was paid to preferred shareholders on January 15, 2016. These amounts are reflected as a reduction of stockholders’ equity in the case of common stock and preferred stock dividends and noncontrolling interests deductions in the case of limited partner distributions and are included in dividends and distributions payable in the accompanying consolidated financial statements.
F-33
15. | INTERIM RESULTS (Unaudited) |
The following summary presents the results of operations of the Company for the quarterly periods of calendar years 2015 and 2014.
(In thousands, except per share amounts) | 2015 | ||||||||||||||
1st Quarter | 2nd Quarter | 3rd Quarter | 4th Quarter | ||||||||||||
Revenue | $ | 52,088 | $ | 51,711 | $ | 52,376 | $ | 52,902 | |||||||
Operating income before loss on early extinguishment of debt, gain on casualty settlement, and noncontrolling interests | 12,687 | 12,922 | 13,238 | 14,083 | |||||||||||
Gain on sales of properties | — | 11 | — | — | |||||||||||
Net income attributable to Saul Centers, Inc. | 10,207 | 10,396 | 10,615 | 11,250 | |||||||||||
Net income available to common stockholders | 7,113 | 7,302 | 7,522 | 8,156 | |||||||||||
Net income available to common stockholders per diluted share | 0.33 | 0.35 | 0.36 | 0.38 | |||||||||||
(In thousands, except per share amounts) | 2014 | ||||||||||||||
1st Quarter | 2nd Quarter | 3rd Quarter | 4th Quarter | ||||||||||||
Revenue | $ | 52,947 | $ | 52,286 | $ | 50,595 | $ | 51,264 | |||||||
Operating income before loss on early extinguishment of debt, gain on casualty settlement, and noncontrolling interests | 12,713 | 14,423 | 12,479 | 12,314 | |||||||||||
Gain on sales of properties | — | 6,069 | — | — | |||||||||||
Net income attributable to Saul Centers, Inc. | 10,287 | 16,054 | 10,106 | 10,496 | |||||||||||
Net income available to common stockholders | 7,081 | 12,847 | 6,900 | 5,274 | |||||||||||
Net income available to common stockholders per diluted share | 0.34 | 0.62 | 0.33 | 0.25 | |||||||||||
16. | BUSINESS SEGMENTS |
The Company has two reportable business segments: Shopping Centers and Mixed-Use Properties. The accounting policies of the segments are the same as those described in the summary of significant accounting policies (see Note 2). The Company evaluates performance based upon income and cash flows from real estate for the combined properties in each segment. All of our properties within each segment generate similar types of revenues and expenses related to tenant rent, reimbursements and operating expenses. Although services are provided to a range of tenants, the types of services provided to them are similar within each segment. The properties in each portfolio have similar economic characteristics and the nature of the products and services provided to our tenants and the method to distribute such services are consistent throughout the portfolio. Certain reclassifications have been made to prior year information to conform to the 2015 presentation.
F-34
SAUL CENTERS, INC. Notes to Consolidated Financial Statements | |||||||||||||||
(In thousands) | Shopping | Mixed-Use | Corporate | Consolidated | |||||||||||
As of or for the year ended December 31, 2015 | Centers | Properties | and Other | Totals | |||||||||||
Real estate rental operations: | |||||||||||||||
Revenue | $ | 156,110 | $ | 52,916 | $ | 51 | $ | 209,077 | |||||||
Expenses | (33,877 | ) | (17,266 | ) | — | (51,143 | ) | ||||||||
Income from real estate | 122,233 | 35,650 | 51 | 157,934 | |||||||||||
Interest expense and amortization of deferred debt costs | — | — | (45,165 | ) | (45,165 | ) | |||||||||
General and administrative | — | — | (16,353 | ) | (16,353 | ) | |||||||||
Subtotal | 122,233 | 35,650 | (61,467 | ) | 96,416 | ||||||||||
Depreciation and amortization of deferred leasing costs | (30,171 | ) | (13,099 | ) | — | (43,270 | ) | ||||||||
Acquisition related costs | (84 | ) | — | — | (84 | ) | |||||||||
Predevelopment expenses | (57 | ) | (75 | ) | — | (132 | ) | ||||||||
Change in fair value of derivatives | — | — | (10 | ) | (10 | ) | |||||||||
Gain on sale of property | 11 | — | — | 11 | |||||||||||
Net income (loss) | $ | 91,932 | $ | 22,476 | $ | (61,477 | ) | $ | 52,931 | ||||||
Capital investment | $ | 17,159 | $ | 52,460 | $ | — | $ | 69,619 | |||||||
Total assets | $ | 936,542 | $ | 356,400 | $ | 11,203 | $ | 1,304,145 | |||||||
As of or for the year ended December 31, 2014 | |||||||||||||||
Real estate rental operations: | |||||||||||||||
Revenue | $ | 154,385 | $ | 52,632 | $ | 75 | $ | 207,092 | |||||||
Expenses | (33,781 | ) | (15,732 | ) | — | (49,513 | ) | ||||||||
Income from real estate | 120,604 | 36,900 | 75 | 157,579 | |||||||||||
Interest expense and amortization of deferred debt costs | — | — | (46,034 | ) | (46,034 | ) | |||||||||
General and administrative | — | — | (16,961 | ) | (16,961 | ) | |||||||||
Subtotal | 120,604 | 36,900 | (62,920 | ) | 94,584 | ||||||||||
Depreciation and amortization of deferred leasing costs | (28,082 | ) | (13,121 | ) | — | (41,203 | ) | ||||||||
Acquisition related costs | (949 | ) | — | — | (949 | ) | |||||||||
Predevelopment expenses | — | (503 | ) | — | (503 | ) | |||||||||
Change in fair value of derivatives | — | — | (10 | ) | (10 | ) | |||||||||
Gain on sale of property | 6,069 | — | — | 6,069 | |||||||||||
Net income (loss) | $ | 97,642 | $ | 23,276 | $ | (62,930 | ) | $ | 57,988 | ||||||
Capital investment | $ | 66,508 | $ | 23,760 | $ | — | $ | 90,268 | |||||||
Total assets | $ | 946,819 | $ | 307,901 | $ | 12,267 | $ | 1,266,987 | |||||||
F-35
SAUL CENTERS, INC. Notes to Consolidated Financial Statements (continued) | |||||||||||||||
(In thousands) | Shopping | Mixed-Use | Corporate | Consolidated | |||||||||||
As of or for the year ended December 31, 2013 | Centers | Properties | and Other | Totals | |||||||||||
Real estate rental operations: | |||||||||||||||
Revenue | $ | 145,219 | $ | 52,609 | $ | 69 | $ | 197,897 | |||||||
Expenses | (30,729 | ) | (17,213 | ) | — | (47,942 | ) | ||||||||
Income from real estate | 114,490 | 35,396 | 69 | 149,955 | |||||||||||
Interest expense and amortization of deferred debt costs | — | — | (46,589 | ) | (46,589 | ) | |||||||||
General and administrative | — | — | (14,951 | ) | (14,951 | ) | |||||||||
Subtotal | 114,490 | 35,396 | (61,471 | ) | 88,415 | ||||||||||
Depreciation and amortization of deferred leasing costs | (27,340 | ) | (21,790 | ) | — | (49,130 | ) | ||||||||
Acquisition related costs | (106 | ) | — | — | (106 | ) | |||||||||
Predevelopment expenses | — | (3,910 | ) | — | (3,910 | ) | |||||||||
Loss on early extinguishment of debt | — | — | (497 | ) | (497 | ) | |||||||||
Gain on casualty settlement | 77 | — | — | 77 | |||||||||||
Change in fair value of derivatives | — | — | (7 | ) | (7 | ) | |||||||||
Net income (loss) | $ | 87,121 | $ | 9,696 | $ | (61,975 | ) | $ | 34,842 | ||||||
Capital investment | $ | 18,232 | $ | 8,207 | $ | — | $ | 26,439 | |||||||
Total assets | $ | 888,109 | $ | 293,512 | $ | 17,054 | $ | 1,198,675 | |||||||
17. | Subsequent Events |
The Company has reviewed operating activities for the period subsequent to December 31, 2015 and prior to the date that financial settlements are issued, March 4, 2016, and determined there are no subsequent events that are required to be disclosed.
F-36
Schedule III
SAUL CENTERS, INC. Real Estate and Accumulated Depreciation December 31, 2015 (Dollars in Thousands) | |||||||||||||||||||||||||||||||||||||||||
Costs | Buildings | ||||||||||||||||||||||||||||||||||||||||
Capitalized | Basis at Close of Period | and | |||||||||||||||||||||||||||||||||||||||
Initial Basis | Subsequent to Acquisition | Land | Buildings and Improvements | Leasehold Interests | Total | Accumulated Depreciation | Book Value | Related Debt | Date of Construction | Date Acquired | Improvements Depreciable Lives in Years | ||||||||||||||||||||||||||||||
Shopping Centers | |||||||||||||||||||||||||||||||||||||||||
Ashburn Village, Ashburn, VA | $ | 11,431 | $ | 19,713 | $ | 6,764 | $ | 24,380 | $ | — | $ | 31,144 | $ | 11,578 | $ | 19,566 | $ | 29,564 | 1994 & 2000-6 | 3/94 | 40 | ||||||||||||||||||||
Ashland Square Phase I, Dumfries, VA | 1,178 | 7,503 | 1,178 | 7,503 | — | 8,681 | 1,108 | 7,573 | — | 2007, 2013 | 12/04 | 20 & 50 | |||||||||||||||||||||||||||||
Beacon Center, Alexandria, VA | 1,493 | 18,172 | — | 18,571 | 1,094 | 19,665 | 13,156 | 6,509 | 31,844 | 1960 & 1974 | 1/72 | 40 & 50 | |||||||||||||||||||||||||||||
BJ’s Wholesale Club, Alexandria, VA | 22,623 | — | 22,623 | — | — | 22,623 | — | 22,623 | 11,365 | 3/08 | — | ||||||||||||||||||||||||||||||
Boca Valley Plaza, Boca Raton, FL | 16,720 | 1,434 | 5,735 | 12,419 | — | 18,154 | 3,877 | 14,277 | 10,587 | 2/04 | 40 | ||||||||||||||||||||||||||||||
Boulevard, Fairfax, VA | 4,883 | 4,461 | 3,687 | 5,657 | — | 9,344 | 2,379 | 6,965 | 17,666 | 1969, 1999 & 2009 | 4/94 | 40 | |||||||||||||||||||||||||||||
Briggs Chaney MarketPlace, Silver Spring, MD | 27,037 | 3,497 | 9,789 | 20,745 | — | 30,534 | 6,684 | 23,850 | 15,064 | 4/04 | 40 | ||||||||||||||||||||||||||||||
Broadlands Village, Ashburn, VA | 5,316 | 26,745 | 5,300 | 26,761 | — | 32,061 | 9,101 | 22,960 | 17,964 | 2002-3, 2004 & 2006 | 3/02 | 40 & 50 | |||||||||||||||||||||||||||||
Countryside Marketplace, Sterling, VA | 28,912 | 3,286 | 7,666 | 24,532 | — | 32,198 | 7,278 | 24,920 | 15,098 | 2/04 | 40 | ||||||||||||||||||||||||||||||
Cranberry Square, Westminster, MD | 31,578 | 512 | 6,700 | 25,390 | — | 32,090 | 2,736 | 29,354 | 18,150 | 9/11 | 40 | ||||||||||||||||||||||||||||||
Cruse MarketPlace, Cumming, GA | 12,226 | 239 | 3,901 | 8,564 | — | 12,465 | 2,531 | 9,934 | — | 3/04 | 40 | ||||||||||||||||||||||||||||||
Flagship Center, Rockville, MD | 160 | 9 | 169 | — | — | 169 | — | 169 | — | 1972 | 1/72 | — | |||||||||||||||||||||||||||||
French Market, Oklahoma City, OK | 5,781 | 13,858 | 1,118 | 18,521 | — | 19,639 | 10,080 | 9,559 | — | 1972 & 1998 | 3/74 | 50 | |||||||||||||||||||||||||||||
Germantown, Germantown, MD | 3,576 | 990 | 2,034 | 2,532 | — | 4,566 | 2,154 | 2,412 | — | 1990 | 8/93 | 40 | |||||||||||||||||||||||||||||
750/730/726 N. Glebe Road, Arlington, VA | 46,312 | 1,994 | 44,831 | 3,475 | — | 48,306 | 697 | 47,609 | — | 08/14, 12/14, 09/15 | 3 & 2 | ||||||||||||||||||||||||||||||
The Glen, Woodbridge, VA | 12,918 | 7,734 | 5,300 | 15,352 | — | 20,652 | 7,899 | 12,753 | 8,622 | 1993 & 2005 | 6/94 | 40 | |||||||||||||||||||||||||||||
Great Eastern, District Heights, MD | 4,993 | 10,678 | 3,785 | 11,886 | — | 15,671 | 8,023 | 7,648 | — | 1958 & 1960 | 1/72 | 40 | |||||||||||||||||||||||||||||
Great Falls Center, Great Falls, VA | 41,750 | 2,986 | 14,766 | 29,970 | — | 44,736 | 5,876 | 38,860 | 14,177 | 3/08 | 40 | ||||||||||||||||||||||||||||||
Hampshire Langley, Takoma, MD | 3,159 | 3,350 | 1,856 | 4,653 | — | 6,509 | 3,484 | 3,025 | 16,826 | 1960 | 1/72 | 40 | |||||||||||||||||||||||||||||
Hunt Club Corners, Apopka, FL | 12,584 | 3,165 | 4,822 | 10,927 | — | 15,749 | 2,931 | 12,818 | 5,959 | 6/06, 12/12 | 40 | ||||||||||||||||||||||||||||||
Jamestown Place, Altamonte Springs, FL | 14,055 | 1,161 | 4,455 | 10,761 | — | 15,216 | 2,829 | 12,387 | 8,025 | 11/05 | 40 | ||||||||||||||||||||||||||||||
Kentlands Square I, Gaithersburg, MD | 14,379 | 328 | 5,006 | 9,701 | — | 14,707 | 3,206 | 11,501 | 7,180 | 2002 | 9/02 | 40 | |||||||||||||||||||||||||||||
Kentlands Square II, Gaithersburg, MD | 76,723 | 1,188 | 22,800 | 55,111 | — | 77,911 | 5,925 | 71,986 | 38,842 | 9/11, 9/13 | 40 | ||||||||||||||||||||||||||||||
Kentlands Place, Gaithersburg, MD | 1,425 | 7,202 | 1,425 | 7,202 | — | 8,627 | 3,176 | 5,451 | — | 2005 | 1/04 | 50 | |||||||||||||||||||||||||||||
Lansdowne Town Center, Leesburg, VA | 6,545 | 36,364 | 6,546 | 36,363 | — | 42,909 | 11,352 | 31,557 | 34,420 | 2006 | 11/02 | 50 | |||||||||||||||||||||||||||||
Leesburg Pike Plaza, Baileys Crossroads, VA | 2,418 | 6,173 | 1,132 | 7,459 | — | 8,591 | 5,700 | 2,891 | 16,348 | 1965 | 2/66 | 40 | |||||||||||||||||||||||||||||
Lumberton Plaza, Lumberton, NJ | 4,400 | 11,170 | 950 | 14,620 | — | 15,570 | 12,109 | 3,461 | — | 1975 | 12/75 | 40 | |||||||||||||||||||||||||||||
Metro Pike Center, Rockville, MD | 33,123 | 3,090 | 26,064 | 10,149 | — | 36,213 | 973 | 35,240 | 14,801 | 12/10 | 40 | ||||||||||||||||||||||||||||||
Shops at Monocacy, Frederick, MD | 9,541 | 13,926 | 9,260 | 14,207 | — | 23,467 | 4,635 | 18,832 | 13,387 | 2003-4 | 11/03 | 50 | |||||||||||||||||||||||||||||
Northrock, Warrenton, VA | 12,686 | 15,167 | 12,686 | 15,167 | — | 27,853 | 2,813 | 25,040 | 15,748 | 2009 | 01/08 | 50 | |||||||||||||||||||||||||||||
Olde Forte Village, Ft. Washington, MD | 15,933 | 6,514 | 5,409 | 17,038 | — | 22,447 | 6,112 | 16,335 | 10,928 | 2003-4 | 07/03 | 40 | |||||||||||||||||||||||||||||
Olney, Olney, MD | 1,884 | 1,706 | — | 3,590 | — | 3,590 | 3,275 | 315 | 11,282 | 1972 | 11/75 | 40 | |||||||||||||||||||||||||||||
Orchard Park, Dunwoody, GA | 19,377 | 814 | 7,751 | 12,440 | — | 20,191 | 2,703 | 17,488 | 10,492 | 7/07 | 40 | ||||||||||||||||||||||||||||||
Palm Springs Center, Altamonte Springs, FL | 18,365 | 1,375 | 5,739 | 14,001 | — | 19,740 | 3,648 | 16,092 | 9,127 | 3/05 | 40 | ||||||||||||||||||||||||||||||
Ravenwood, Baltimore, MD | 1,245 | 4,097 | 703 | 4,639 | — | 5,342 | 2,771 | 2,571 | 15,360 | 1959 & 2006 | 1/72 | 40 | |||||||||||||||||||||||||||||
11503 Rockville Pike/5541 Nicholson Lane, Rockville, MD | 26,561 | — | 22,113 | 4,448 | — | 26,561 | 584 | 25,977 | — | 10/10 12/12 | 40 | ||||||||||||||||||||||||||||||
1500/1580/1582/1584 Rockville Pike, Rockville, MD | 51,149 | 906 | 43,863 | 8,192 | — | 52,055 | 3,281 | 48,774 | — | 12/12, 1/14, 4/14, 12/14 | 5, 10, 5, 4 | ||||||||||||||||||||||||||||||
Seabreeze Plaza, Palm Harbor, FL | 24,526 | 1,525 | 8,665 | 17,386 | — | 26,051 | 4,566 | 21,485 | 17,011 | 11/05 | 40 | ||||||||||||||||||||||||||||||
Market Place at Sea Colony, Bethany Beach, DE | 2,920 | 106 | 1,147 | 1,879 | — | 3,026 | 373 | 2,653 | — | 3/08 | 40 | ||||||||||||||||||||||||||||||
Seven Corners, Falls Church, VA | 4,848 | 43,692 | 4,913 | 43,627 | — | 48,540 | 26,614 | 21,926 | 67,850 | 1956 & 1997 | 7/73 | 40 | |||||||||||||||||||||||||||||
Severna Park Marketplace, Severna Park, MD | 63,254 | 86 | 12,700 | 50,640 | — | 63,340 | 5,381 | 57,959 | 34,133 | 9/11 | 40 | ||||||||||||||||||||||||||||||
Shops at Fairfax, Fairfax, VA | 2,708 | 9,924 | 992 | 11,640 | — | 12,632 | 7,259 | 5,373 | 11,778 | 1975 & 1999 | 6/75 | 50 | |||||||||||||||||||||||||||||
Smallwood Village Center, Waldorf, MD | 17,819 | 7,619 | 6,402 | 19,036 | — | 25,438 | 5,763 | 19,675 | — | 1/06 | 40 | ||||||||||||||||||||||||||||||
Southdale, Glen Burnie, MD | 3,650 | 21,366 | — | 24,394 | 622 | 25,016 | 20,890 | 4,126 | — | 1962 & 1986 | 1/72 | 40 | |||||||||||||||||||||||||||||
Southside Plaza, Richmond, VA | 6,728 | 10,357 | 1,878 | 15,207 | — | 17,085 | 11,595 | 5,490 | — | 1958 | 1/72 | 40 | |||||||||||||||||||||||||||||
South Dekalb Plaza, Atlanta, GA | 2,474 | 4,130 | 703 | 5,901 | — | 6,604 | 4,491 | 2,113 | — | 1970 | 2/76 | 40 | |||||||||||||||||||||||||||||
Thruway, Winston-Salem, NC | 4,778 | 23,579 | 5,496 | 22,756 | 105 | 28,357 | 14,760 | 13,597 | 40,360 | 1955 & 1965 | 5/72 | 40 | |||||||||||||||||||||||||||||
Village Center, Centreville, VA | 16,502 | 1,971 | 7,851 | 10,622 | — | 18,473 | 6,003 | 12,470 | 14,197 | 1990 | 8/93 | 40 | |||||||||||||||||||||||||||||
Westview Village, Frederick, MD | 6,047 | 22,499 | 6,047 | 22,499 | — | 28,546 | 5,310 | 23,236 | — | 2009 | 11/07, 02/15 | 50 | |||||||||||||||||||||||||||||
White Oak, Silver Spring, MD | 6,277 | 5,357 | 4,649 | 6,985 | — | 11,634 | 5,758 | 5,876 | 25,088 | 1958 & 1967 | 1/72 | 40 | |||||||||||||||||||||||||||||
Other Buildings / Improvements | 221 | 221 | 221 | 95 | 126 | — | |||||||||||||||||||||||||||||||||||
Total Shopping Centers | 766,970 | 393,939 | 389,369 | 769,719 | 1,821 | 1,160,909 | 295,522 | 865,387 | 629,243 | ||||||||||||||||||||||||||||||||
Mixed-Use Properties | |||||||||||||||||||||||||||||||||||||||||
Avenel Business Park, Gaithersburg, MD | 21,459 | 28,896 | 3,756 | 46,599 | — | 50,355 | 33,503 | 16,852 | 29,714 | 1981-2000 | 12/2/1984 | 35 & 40 | |||||||||||||||||||||||||||||
Clarendon Center, Arlington, VA (1) | 12,753 | 185,129 | 16,287 | 181,595 | — | 197,882 | 27,412 | 170,470 | 112,299 | 2010 | 7/73, 1/96 & 4/02 | 50 | |||||||||||||||||||||||||||||
601 Pennsylvania Ave., Washington, DC | 5,479 | 65,773 | 5,667 | 65,585 | — | 71,252 | 47,842 | 23,410 | — | 1986 | 7/73 | 35 | |||||||||||||||||||||||||||||
Washington Square, Alexandria, VA | 2,034 | 53,631 | 544 | 55,121 | — | 55,665 | 21,091 | 34,574 | 30,778 | 1952 & 2000 | 7/73 | 50 | |||||||||||||||||||||||||||||
Total Mixed-Use Properties | 41,725 | 333,429 | 26,254 | 348,900 | — | 375,154 | 129,848 | 245,306 | 172,791 | ||||||||||||||||||||||||||||||||
Development Land | |||||||||||||||||||||||||||||||||||||||||
Ashland Square Phase II, Manassas, VA | 5,292 | 1,736 | 7,028 | — | — | 7,028 | — | 7,028 | — | 12/04 | |||||||||||||||||||||||||||||||
New Market, New Market, MD | 2,088 | 286 | 2,374 | — | — | 2,374 | — | 2,374 | — | 9/05 | |||||||||||||||||||||||||||||||
Park Van Ness, Washington, DC | 2,242 | 75,003 | 2,242 | 75,003 | — | 77,245 | — | 77,245 | 45,208 | 07/73 and 02/11 | |||||||||||||||||||||||||||||||
Total Development Land | 9,622 | 77,025 | 11,644 | 75,003 | — | 86,647 | — | 86,647 | 45,208 | ||||||||||||||||||||||||||||||||
Total | $ | 818,317 | $ | 804,393 | $ | 427,267 | $ | 1,193,622 | $ | 1,821 | $ | 1,622,710 | $ | 425,370 | $ | 1,197,340 | $ | 847,242 | |||||||||||||||||||||||
(1) | Includes the North and South Blocks and Residential |
*Excludes Crosstown Business Center which was designated as held for sale as of December 31, 2015, and included in Other Assets.
F-37
Schedule III
SAUL CENTERS, INC.
Real Estate and Accumulated Depreciation
December 31, 2015
Depreciation and amortization related to the real estate investments reflected in the statements of operations is calculated over the estimated useful lives of the assets as follows:
Base building | Generally 35 - 50 years or a shorter period if management determines that | |
the building has a shorter useful life. | ||
Building components | Up to 20 years | |
Tenant improvements | The shorter of the term of the lease or the useful life | |
of the improvements | ||
The aggregate remaining net basis of the real estate investments for federal income tax purposes was approximately $1.1 billion at December 31, 2015. Depreciation and amortization are provided on the declining balance and straight-line methods over the estimated useful lives of the assets.
The changes in total real estate investments and related accumulated depreciation for each of the years in the three year period ended December 31, 2015 are summarized as follows:
(In thousands) | 2015 | 2014 | 2013 | ||||||||
Total real estate investments: | |||||||||||
Balance, beginning of year | $ | 1,560,159 | $ | 1,459,439 | $ | 1,466,068 | |||||
Acquisitions | 4,894 | 70,921 | 5,124 | ||||||||
Improvements | 70,067 | 34,417 | 21,991 | ||||||||
Retirements | (1,981 | ) | (4,618 | ) | (33,744 | ) | |||||
Transfers to assets held for sale | (10,429 | ) | — | — | |||||||
Balance, end of year | $ | 1,622,710 | $ | 1,560,159 | $ | 1,459,439 | |||||
Total accumulated depreciation: | |||||||||||
Balance, beginning of year | $ | 396,617 | $ | 364,663 | $ | 353,305 | |||||
Depreciation expense | 37,698 | 35,933 | 43,204 | ||||||||
Retirements | (1,911 | ) | (3,979 | ) | (31,846 | ) | |||||
Transfers to assets held for sale | (7,034 | ) | $ | — | — | ||||||
Balance, end of year | $ | 425,370 | $ | 396,617 | $ | 364,663 | |||||
F-38