Attached files
| file | filename |
|---|---|
| EX-23 - EXHIBIT 23 - SAUL CENTERS, INC. | dex23.htm |
| EX-31 - EXHIBIT 31 - SAUL CENTERS, INC. | dex31.htm |
| EX-21 - EXHIBIT 21 - SAUL CENTERS, INC. | dex21.htm |
| EX-32 - EXHIBIT 32 - SAUL CENTERS, INC. | dex32.htm |
| EX-10.C - EXHIBIT 10.C - SAUL CENTERS, INC. | dex10c.htm |
Table of Contents
UNITED STATES
SECURITIES AND EXCHANGE COMMISSION
WASHINGTON, DC 20549
FORM 10-K
(Mark One)
| x | ANNUAL REPORT PURSUANT TO SECTION 13 or 15(d) OF THE SECURITIES EXCHANGE ACT OF 1934 |
For the fiscal year ended December 31, 2009
| ¨ | TRANSITION REPORT PURSUANT TO SECTION 13 OR 15(d) OF THE SECURITIES EXCHANGE ACT OF 1934 |
For the transition period from to
Commission File number 1-12254
SAUL CENTERS, INC.
(Exact name of registrant as specified in its charter)
| Maryland | 52-1833074 | |
| (State or other jurisdiction of incorporation or organization) |
(I.R.S. Employer Identification No.) |
7501 Wisconsin Avenue, Suite 1500, Bethesda, Maryland 20814-6522
(Address of principal executive offices) (Zip Code)
Registrant’s telephone number, including area code: (301) 986-6200
Securities registered pursuant to Section 12(b) of the Act:
| Title of each class |
Name of each exchange on which registered | |
| Common Stock, Par Value $0.01 Per Share | New York Stock Exchange | |
| Depositary Shares each representing 1/100th of a share of 8% Series A Cumulative Redeemable Preferred Stock, Par Value, $0.01 Per Share | New York Stock Exchange | |
| Depositary Shares each representing 1/100th of a share of 9% Series B Cumulative Redeemable Preferred Stock, Par Value, $0.01 Per Share | New York Stock Exchange |
Securities registered pursuant to Section 12(g) of the Act: N/A
Indicate by check mark if the registrant is a well-known seasoned issuer, as defined in Rule 405 of the Securities Act. Yes ¨ No x
Indicate by check mark if the registrant is not required to file reports pursuant to Section 13 or Section 15(d) of the Act Yes ¨ No x.
Indicate by check mark whether registrant (1) has filed all reports required to be filed by Section 13 or 15(d) of the Securities Exchange Act of 1934 during the preceding 12 months (or for such shorter period that the registrant was required to file such reports), and (2) has been subject to such filing requirements for the past 90 days. Yes x No ¨
Indicate by check mark whether the registrant has submitted electronically and posted on its corporate Web site, if any, every Interactive Data File required to be submitted and posted pursuant to Rule 405 of Regulation S-T (§ 232.405 of this chapter) during the preceding 12 months (or for such shorter period that the registrant was required to submit and post such files). YES ¨ NO ¨
Indicate by check mark if disclosure of delinquent filers pursuant to Item 405 of Regulation S-K is not contained herein, and will not be contained, to the best of registrant’s knowledge, in the definitive proxy or information statements incorporated by reference in Part III of this Form 10-K or any amendment to this Form 10-K. ¨
Indicate by check mark whether the registrant is a large accelerated filer, an accelerated filer, a non-accelerated filer or a smaller reporting company. See definition of “accelerated filer,” “large accelerated filer” and smaller reporting company in Rule 12b-2 of the Exchange Act. (Check one):
| Large accelerated filer | ¨ | Accelerated filer | x | |||
| Non-accelerated filer | ¨ | Smaller reporting company | ¨ | |||
Indicate by check mark whether the registrant is a shell company (as defined in Rule 12b-2 of the Act). Yes ¨ No x.
The number of shares of Common Stock, $0.01 par value, outstanding as of March 12, 2010 was 18,115,000.
The aggregate market value of the voting and non-voting common equity held by non-affiliates computed by reference to the closing price of the registrant’s Common Stock on the New York Stock Exchange on June 30, 2009 was $375,011,000.
DOCUMENTS INCORPORATED BY REFERENCE:
Registrant incorporates by reference into Part III (Items 10, 11, 12, 13 and 14) of this Annual Report on Form 10-K portions of registrant’s definitive Proxy Statement for the 2010 Annual Meeting of Stockholders to be filed with the Securities Exchange Commission pursuant to Regulation 14A. The definitive Proxy Statement will be filed with the Commission not later than 120 days after the end of the fiscal year covered by this Annual Report on Form 10-K.
Table of Contents
2
Table of Contents
Cautionary Statement Regarding Forward-Looking Statements
Certain statements contained herein constitute forward-looking statements as such term is defined in Section 27A of the Securities Act of 1933, as amended, and Section 21E of the Securities Exchange Act of 1934, as amended. Forward-looking statements are not guarantees of performance. Our future results, financial condition and business may differ materially from those expressed in these forward-looking statements. You can find many of these statements by looking for words such as “plans,” “intends,” “estimates,” “anticipates,” “expects,” “believes” or similar expressions in this Form 10-K. These forward-looking statements are subject to numerous assumptions, risks and uncertainties. Many of the factors that will determine these items are beyond our ability to control or predict. For further discussion of these factors, see “Item 1A. Risk Factors” in this Form 10-K.
For these statements, we claim the protection of the safe harbor for forward-looking statements contained in the Private Securities Litigation Reform Act of 1995. You are cautioned not to place undue reliance on our forward-looking statements, which speak only as of the date of this Form 10-K or the date of any document incorporated by reference. All subsequent written and oral forward-looking statements attributable to us or any person acting on our behalf are expressly qualified in their entirety by the cautionary statements contained or referred to in this section. We do not undertake any obligation to release publicly any revisions to our forward-looking statements to reflect events or circumstances after the date of this Form 10-K.
| Item 1. | Business |
General
Saul Centers, Inc. (“Saul Centers”) was incorporated under the Maryland General Corporation Law on June 10, 1993. Saul Centers operates as a real estate investment trust (a “REIT”) under the Internal Revenue Code of 1986, as amended (the “Code”). The Company is required to annually distribute at least 90% of its REIT taxable income (excluding net capital gains) to its stockholders and meet certain organizational and other requirements. Saul Centers has made and intends to continue to make regular quarterly distributions to its stockholders. Saul Centers, together with its wholly owned subsidiaries and the limited partnerships of which Saul Centers or one of its subsidiaries is the sole general partner, are referred to collectively as the “Company”. B. Francis Saul II serves as Chairman of the Board of Directors and Chief Executive Officer of Saul Centers.
The Company’s principal business activity is the ownership, management and development of income-producing properties. The Company’s long-term objectives are to increase cash flow from operations and to maximize capital appreciation of its real estate.
Saul Centers was formed to continue and expand the shopping center business previously owned and conducted by the B.F. Saul Real Estate Investment Trust, the B.F. Saul Company and certain other affiliated entities, each of which is controlled by B. Francis Saul II and his family members (collectively, “The Saul Organization”). On August 26, 1993, members of The Saul Organization transferred to Saul Holdings Limited Partnership, a newly formed Maryland limited partnership (the “Operating Partnership”), and two newly formed subsidiary limited partnerships (the “Subsidiary Partnerships”, and collectively with the Operating Partnership, the “Partnerships”), shopping center and office properties, and the management functions related to the transferred properties. Since its formation, the Company has developed and purchased additional properties.
3
Table of Contents
The following table lists the properties acquired and/or developed by the Company since December 31, 2006. The following are operating shopping centers. Two shopping centers, Northrock and Westview have been recently constructed and only a portion of the total square footage, scheduled below, has been leased and placed in service.
| Name of Property |
Location |
Square Footage |
Date of Acquisition/ Development | |||
| Acquisitions |
||||||
| Orchard Park |
Dunwoody, GA | 88,000 | 2007 | |||
| Great Falls Shopping Center |
Great Falls, VA | 92,000 | 2008 | |||
| BJ’s Wholesale Club |
Alexandria, VA | 116,000 | 2008 | |||
| Marketplace at Sea Colony |
Bethany Beach, DE | 22,000 | 2008 | |||
| Developments |
||||||
| Ashland Square Phase I |
Manassas, VA | 17,000 | 2007 | |||
| Northrock |
Warrenton, VA | 103,000 | 2009 | |||
| Westview Village |
Frederick, MD | 101,000 | 2009 | |||
As of December 31, 2009, the Company’s properties (the “Current Portfolio Properties”) consisted of 47 operating shopping center properties (the “Shopping Centers”), five predominantly office operating properties (the “Office Properties”) and four (non-operating) development properties. Shopping Centers and Office Properties represent reportable business segments for financial reporting purposes. Revenue, net income, total assets and other financial information of each reportable segment are described in Note 16 to the Consolidated Financial Statements contained in Item 8 of this Form 10-K.
The Company established Saul QRS, Inc., a wholly owned subsidiary of Saul Centers, to facilitate the placement of collateralized mortgage debt. Saul QRS, Inc. was created to succeed to the interest of Saul Centers as the sole general partner of Saul Subsidiary I Limited Partnership. The remaining limited partnership interests in Saul Subsidiary I Limited Partnership and Saul Subsidiary II Limited Partnership are held by the Operating Partnership as the sole limited partner. Through this structure, the Company owns 100% of the Current Portfolio Properties.
4
Table of Contents
Organizational Structure
The Company conducts its business through the Operating Partnership and/or directly or indirectly owned subsidiaries. The following diagram depicts the Company’s organizational structure and beneficial ownership of the common and preferred stock of Saul Centers calculated pursuant to Rule 13d-3 of the Exchange Act as of December 31, 2009.
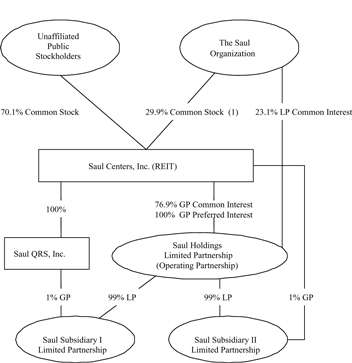
| (1) | The Saul Organization’s ownership percentage in Saul Centers reported above does not include units of limited partnership interest of the Operating Partnership held by The Saul Organization. In general, units are convertible into shares of the Company’s common stock on a one-for-one basis. However, not all of the units may be convertible into the Company’s common stock because the articles of incorporation limit beneficial and constructive ownership (defined by reference to various Code provisions) to 39.9% in value of the Company’s issued and outstanding equity securities, which comprise the ownership limit. |
Management of the Current Portfolio Properties
The Operating Partnership manages the Current Portfolio Properties and will manage any subsequently acquired or developed properties. The management of the properties includes performing property management, leasing, design, renovation, development and accounting duties for each property. The Operating Partnership provides each property with a fully integrated property management capability, with approximately 65 employees and with an extensive and mature network of relationships with tenants and potential tenants as well as with members of the brokerage and property owners’ communities. The Company currently does not, and does not intend to, retain third party managers or provide management services to third parties.
The Company augments its property management capabilities by sharing with The Saul Organization certain ancillary functions, at cost, such as information technology and payroll services, benefits administration and in-house legal services. The Company also shares insurance administration expenses on a pro rata basis with The Saul Organization. Management believes that these arrangements result in lower costs than could be obtained by contracting with third parties. These arrangements permit the Company to capture greater economies of scale in
5
Table of Contents
purchasing from third party vendors than would otherwise be available to the Company alone and to capture internal economies of scale by avoiding payments representing profits with respect to functions provided internally. The terms of all sharing arrangements with The Saul Organization, including payments related thereto, are specified in a written agreement and are reviewed annually by the Audit Committee of the Company’s Board of Directors.
The Company subleases its corporate headquarters space from The Saul Organization at the Company’s share of the cost. A discussion of the lease terms are provided in Note 7, Long Term Lease Obligations, of the Notes to Consolidated Financial Statements.
Principal Offices
The principal offices of the Company are located at 7501 Wisconsin Avenue, Suite 1500, Bethesda, Maryland 20814-6522, and the Company’s telephone number is (301) 986-6200. The Company’s internet web address is www.saulcenters.com. Information contained on the Company’s website is not part of this report. The Company makes available free of charge on its website its annual reports on Form 10-K, quarterly reports on Form 10-Q, current reports on Form 8-K, and any amendments to those reports filed or furnished pursuant to Section 13(a) or 15(d) of the Exchange Act, as soon as reasonably practicable after the reports are electronically filed with, or furnished to, the Securities and Exchange Commission (“SEC”). Alternatively, you may access these reports at the SEC’s website: www.sec.gov.
Policies with Respect to Certain Activities
The following is a discussion of the Company’s operating strategy and certain of its investment, financing and other policies. These strategies and policies have been determined by the Board of Directors and, in general, may be amended or revised from time to time by the Board of Directors without a vote of the Company’s stockholders.
Operating Strategies
The Company’s primary operating strategy is to focus on its community and neighborhood shopping center business and to operate its properties to achieve both cash flow growth and capital appreciation. Community and neighborhood shopping centers typically provide reliable cash flow and steady long-term growth potential. Management actively manages its property portfolio by engaging in strategic leasing activities, tenant selection, lease negotiation and shopping center expansion and reconfiguration. The Company seeks to optimize tenant mix by selecting tenants for its shopping centers that provide a broad spectrum of goods and services, consistent with the role of community and neighborhood shopping centers as the source for day-to-day necessities. Management believes that such a synergistic tenanting approach results in increased cash flow from existing tenants by providing the Shopping Centers with consistent traffic and a desirable mix of shoppers, resulting in increased sales and, therefore, increased cash flows.
Management believes there is potential for long term growth in cash flow as existing leases for space in the Shopping Centers expire and are renewed, or newly available or vacant space is leased. The Company intends to renegotiate leases where possible and seek new tenants for available space in order to maximize this potential for increased cash flow. As leases expire, management expects to revise rental rates, lease terms and conditions, relocate existing tenants, reconfigure tenant spaces and introduce new tenants with the goal of increasing cash flow. In those circumstances in which leases are not otherwise expiring, management selectively attempts to increase cash flow through a variety of means, or in connection with renovations or relocations, recapturing leases with below market rents and re-leasing at market rates, as well as replacing financially troubled tenants. When possible, management also will seek to include scheduled increases in base rent, as well as percentage rental provisions, in its leases.
6
Table of Contents
The Company will also seek growth opportunities in its Washington, DC metropolitan area office portfolio, primarily through development and redevelopment. Management also intends to negotiate lease renewals or to re-lease available space in the Office Properties, while considering the strategic balance of optimizing short-term cash flow and long-term asset value.
It is management’s intention to hold properties for long-term investment and to place strong emphasis on regular maintenance, periodic renovation and capital improvement. Management believes that characteristics such as cleanliness, lighting and security are particularly important in community and neighborhood shopping centers, which are frequently visited by shoppers during hours outside of the normal work-day. Management believes that the Shopping Centers and Office Properties generally are attractive and well maintained. The Shopping Centers and Office Properties will undergo expansion, renovation, reconfiguration and modernization from time to time when management believes that such action is warranted by opportunities or changes in the competitive environment of a property. During 2009 and 2008, the Company redeveloped or expanded four of its operating properties, Hunt Club, Smallwood Village Center, Boulevard and Seven Corners, and developed two new shopping centers, Westview Village and Northrock. Additionally, the Company is constructing Clarendon Center, a mixed-use development containing ground floor retail, office and apartments. The Company will continue its practice of expanding existing properties by undertaking new construction on outparcels suitable for development as free standing retail or office facilities.
Investment in Real Estate or Interests in Real Estate
The Company’s redevelopment and renovation objective is to selectively and opportunistically redevelop and renovate its properties, by replacing below-market-rent leases with strong, traffic-generating anchor stores such as supermarkets and drug stores, as well as other desirable local, regional and national tenants. The Company’s strategy remains focused on continuing the operating performance and internal growth of its existing Shopping Centers, while enhancing this growth with selective retail redevelopments and renovations.
In light of the limited amount of quality properties for sale that the Company has been presented with or has inquired about over the past year, management believes acquisition and development opportunities for investment in existing and new shopping center and office properties in the near future is uncertain. However, because of its conservative capital structure, including its cash and unfunded credit line, management believes that the Company is positioned to take advantage of investment opportunities when market conditions improve. (See “Capital Policies” following). It is management’s view that several of the sub-markets in which the Company operates have very attractive supply/demand characteristics. The Company will continue to evaluate acquisition, development and redevelopment as an integral part of its overall business plan.
In evaluating a particular redevelopment, renovation, acquisition, or development, management will consider a variety of factors, including (i) the location and accessibility of the property; (ii) the geographic area (with an emphasis on the Washington, DC/Baltimore metropolitan area and the southeastern region of the United States) and demographic characteristics of the community, as well as the local real estate market, including potential for growth and potential regulatory impediments to development; (iii) the size of the property; (iv) the purchase price; (v) the non-financial terms of the proposed acquisition; (vi) the availability of funds or other consideration for the proposed acquisition and the cost thereof; (vii) the “fit” of the property with the Company’s existing portfolio; (viii) the potential for, and current extent of, any environmental problems; (ix) the current and historical occupancy rates of the property or any comparable or competing properties in the same market; (x) the quality of construction and design and the current physical condition of the property; (xi) the financial and other characteristics of existing tenants and the terms of existing leases; and (xii) the potential for capital appreciation.
Although it is management’s present intention to concentrate future acquisition and development activities on community and neighborhood shopping centers and office properties in the Washington, DC/Baltimore metropolitan area and the southeastern region of the United States, the Company may, in the future, also acquire other types of real estate in other areas of the country as opportunities present themselves. While the Company may diversify in terms of property locations, size and market, the Company does not set any limit on the amount or percentage of Company assets that may be invested in any one property or any one geographic area.
7
Table of Contents
The Company intends to engage in such future investment or development activities in a manner that is consistent with the maintenance of its status as a REIT for federal income tax purposes and that will not make the Company become regulated as an investment company under the Investment Company Act of 1940, as amended. Equity investments in acquired properties may be subject to existing mortgage financings and other indebtedness or to new indebtedness which may be incurred in connection with acquiring or refinancing these investments.
Investments in Real Estate Mortgages
While the Company’s current portfolio of, and its business objectives emphasize, equity investments in commercial and neighborhood shopping centers and office properties, the Company may, at the discretion of the Board of Directors, invest in mortgages, participating or convertible mortgages, deeds of trust and other types of real estate interests consistent with its qualification as a REIT. However, the Company does not presently have nor intend to invest in real estate mortgages.
Investments in Securities of or Interests in Persons Engaged in Real Estate Activities and Other Issues
Subject to the tests necessary for REIT qualification, the Company may invest in securities of other REITs, other entities engaged in real estate activities or securities of other issuers, including for the purpose of exercising control over such entities. However, the Company does not presently have nor intend to invest in any securities of other REITs.
Dispositions
The Company does not currently intend to dispose of any of its properties, although the Company reserves the right to do so if, based upon management’s periodic review of the Company’s portfolio, the Board of Directors determines that such action would be in the best interest of the Company’s stockholders.
Capital Policies
The Company has established a debt capitalization policy relative to asset value, which is computed by reference to the aggregate annualized cash flow from the properties in the Company’s portfolio rather than relative to book value. The Company has used a measure tied to cash flow because it believes that the book value of its portfolio properties, which is the depreciated historical cost of the properties, does not accurately reflect the Company’s ability to incur indebtedness. Asset value, however, is somewhat more variable than book value, and may not at all times reflect the fair market value of the underlying properties. As a general policy, the Company intends to maintain a ratio of its total debt to total asset value of 50% or less and to actively manage the Company’s leverage and debt expense on an ongoing basis in order to maintain prudent coverage of fixed charges. Given the Company’s current debt level, it is management’s belief that the ratio of the Company’s debt to total asset value is below 50% as of December 31, 2009.
The organizational documents of the Company do not limit the absolute amount or percentage of indebtedness that it may incur. The Board of Directors may, from time to time, reevaluate the Company’s debt capitalization policy in light of current economic conditions, relative costs of capital, market values of the Company property portfolio, opportunities for acquisition, development or expansion, and such other factors as the Board of Directors then deems relevant. The Board of Directors may modify the Company’s debt capitalization policy based on such a reevaluation without shareholder approval and consequently, may increase or decrease the Company’s debt to total asset ratio above or below 50% or may waive the policy for certain periods of time, subject to maintaining compliance with financial covenants within existing debt agreements. The Company selectively continues to refinance or renegotiate the terms of its outstanding debt in order to achieve longer maturities, and obtain generally more favorable loan terms, whenever management determines the financing environment is favorable.
8
Table of Contents
The Company intends to finance future acquisitions and developments and to make debt repayments by utilizing the sources of capital then deemed to be most advantageous. Such sources may include undistributed operating cash flow, secured or unsecured bank and institutional borrowings, proceeds from the Company’s Dividend Reinvestment and Stock Purchase Plan, proceeds from the sale of properties and private and public offerings of debt or equity securities. Borrowings may be at the Operating Partnership or Subsidiary Partnerships’ level and securities offerings may include (subject to certain limitations) the issuance of Operating Partnership interests convertible into common stock or other equity securities.
Other Policies
The Company has the authority to offer equity or debt securities in exchange for property and to repurchase or otherwise acquire its common stock or other securities in the open market or otherwise, and may engage in such activities in the future. The Company expects, but is not obligated, to issue common stock to holders of units of the Operating Partnership upon exercise of their redemption rights. The Company has not engaged in trading, underwriting or agency distribution or sale of securities of other issues other than the Operating Partnership and does not intend to do so. The Company has not made any loans to third parties, although the Company may in the future make loans to third parties. In addition, the Company has policies relating to related party transactions discussed in “Item 1A. Risk Factors.”
Competition
As an owner of, or investor in, community and neighborhood shopping centers and office properties, the Company is subject to competition from an indeterminate number of companies in connection with the acquisition, development, ownership and leasing of similar properties. These investors include investors with access to significant capital, such as domestic and foreign corporations and financial institutions, publicly traded and privately held REITs, private institutional investment funds, investment banking firms, life insurance companies and pension funds.
With respect to acquisitions and developments, this competition may reduce properties available for acquisition or development or increase prices for raw land or developed properties of the type in which the Company invests. The Company faces competition in providing leases to prospective tenants and in re-letting space to current tenants upon expiration of their respective leases. If the Company’s tenants decide not to renew or extend their leases upon expiration, the Company may not be able to re-let the space. Even if the tenants do renew or the Company can re-let the space, the terms of renewal or re-letting, including the cost of required renovations, may be less favorable than current lease terms or than expectations for the space. This risk may be magnified if the properties owned by our competitors have lower occupancy rates than the Company’s properties. As a result, these competitors may be willing to make space available at lower prices than the space in the Current Portfolio Properties.
Management believes that success in the competition for ownership and leasing property is dependent in part upon the geographic location of the property, the tenant mix, the performance of property managers, the amount of new construction in the area and the maintenance and appearance of the property. Additional competitive factors impacting the Company’s properties include the ease of access to the properties, the adequacy of related facilities such as parking, and the demographic characteristics in the markets in which the properties compete. Overall economic circumstances and trends and new properties in the vicinity of each of the Current Portfolio Properties are also competitive factors.
9
Table of Contents
Finally, retailers at our Shopping Centers face increasing competition from outlet stores, discount shopping clubs and other forms of marketing goods, such as direct mail, internet marketing and telemarketing. This competition may reduce percentage rents payable to us and may contribute to lease defaults or insolvency of tenants.
Environmental Matters
The Current Portfolio Properties are subject to various laws and regulations relating to environmental and pollution controls. The impact upon the Company from the application of such laws and regulations either prospectively or retrospectively is not expected to have a materially adverse effect on the Company’s property operations. As a matter of policy, the Company requires an environmental study be performed with respect to a property that may be subject to possible environmental hazards prior to its acquisition to ascertain that there are no material environmental hazards associated with such property.
Employees
As of March 12, 2010, the Company employed approximately 65 persons, including seven leasing officers. None of the Company’s employees are covered by collective bargaining agreements. Management believes that its relationship with employees is good.
Recent Developments
The current economic situation, including constraints on credit availability, high unemployment and lower housing values have had an effect on the Company’s results of operations during 2009. Increased vacancies and credit losses, particularly among independent small shop retailers and restaurants at the Company’s Loudoun County, Northern Virginia and Florida shopping centers, have negatively impacted current year earnings. The Company has also experienced an increase in credit loss reserves as small shop tenants have slowed their rent payments in response to declining year over year sales. Management believes that its portfolio, both its geographic locations and tenant mix, is well positioned for the current economy, but believes operating results may continue to be negatively affected. In addition, at December 31, 2009 approximately 90% of the Company’s debt consisted of fixed-rate, amortizing non-recourse mortgage loans, none of which mature until October 2012. The Company believes it has adequate capital capacity, consisting of construction loans in place and borrowing availability on its revolving credit facility, to complete work on its current development projects.
Acquisition and Development Activity
A significant contributor to the Company’s recent growth in its shopping center portfolio has been its land acquisitions and subsequent development, redevelopment of existing centers and operating property acquisition activities. Redevelopment activities reposition the Company’s centers to be competitive in the current retailing environment. These redevelopments typically include an update of the facade, site improvements and reconfiguring tenant spaces to accommodate tenant size requirements and merchandising evolution. During the period January 1, 2007 though February 2010, the Company acquired three land parcels located in the Washington, DC metropolitan area, has developed neighborhood shopping centers on two of the parcels and acquired four operating neighborhood shopping center properties. In summary, since January 1, 2007, the Company’s leasable area has grown by approximately 7% (0.5 million square feet), from 7.9 million square feet to approximately 8.4 million square feet.
2009 / 2008 / 2007 Acquisitions, Developments and Redevelopments
Ashland Square Phase I
On December 15, 2004, the Company purchased for $6.3 million, a 19.3 acre parcel of land in Manassas, Prince William County, Virginia. The Company received site plan approval during the third quarter of 2006 to develop a grocery-anchored neighborhood shopping center totaling approximately 125,000 square feet of retail space. A site plan for an additional 35,000 square feet of commercial space is under review by Prince William
10
Table of Contents
County. During the fourth quarter of 2007, the Company completed preliminary site work consisting of clearing, grading and site utility construction. A ground lease has been executed with Chevy Chase Bank, which built a branch, on a pad site, that opened for business October 2007. During 2009, the Company executed a lease with CVS, which is subject to the tenant obtaining site plan and special use permits from Prince William County. It is uncertain whether these lease contingencies will be fulfilled as permit submissions are in progress. If successful, CVS is expected to commence operations in late 2011. The balance of the center is being marketed to grocers and other retail businesses, with a development timetable yet to be finalized.
Smallwood Village Center
On January 27, 2006, the Company acquired the 198,000 square foot Smallwood Village Center, located on 25 acres within the St. Charles planned community of Waldorf, Maryland. The center was acquired for a purchase price of $17.5 million subject to the assumption of an $11.3 million mortgage loan, and was 76% leased at December 31, 2009. The Company commenced construction during the first quarter of 2008 on a capital improvement project to improve access to the center, reconfigure portions of the center and upgrade the center’s façade and common areas. The redeveloped center totals approximately 173,000 square feet. Substantial completion of construction was achieved during the second quarter of 2009. Project costs totaled approximately $6.9 million.
Hunt Club Corners
On June 1, 2006, the Company purchased for $11.1 million the 101,500 square foot Publix-anchored Hunt Club Corners shopping center located in Apopka, Florida (metropolitan Orlando). The center was 96% leased at December 31, 2009. The Company completed a façade renovation of Hunt Club during 2008 for a total cost of approximately $0.9 million.
Clarendon Center
The Company owns an assemblage of land parcels (including its former operating properties, Clarendon and Clarendon Station) totaling approximately 1.5 acres adjacent to the Clarendon Metro Station in Arlington, Virginia. In June 2006, the Company obtained zoning approvals for a mixed-use development project to include up to approximately 45,000 square feet of retail space, 170,000 square feet of office space and 244 residential units. The total development costs are expected to be approximately $195.0 million, a portion of which will be funded with the $157.5 million construction loan that the Company closed in May 2008. The south block’s four-level sub-surface parking garage was structurally completed during the second quarter of 2009 and structural concrete work was completed to the top of the residential building (12th floor) and the top of the office building (9th floor) during the third quarter of 2009. Exterior wall brick laying and the installation of exterior pre-cast panels and windows is proceeding. Construction of the north block sub-surface parking garage was structurally completed during the fourth quarter of 2009 and structural concrete work has been completed for the six story office building. The Company estimates construction on both blocks will be substantially complete in late 2010, at which time the residential component is expected to be operational and ready for occupancy. The retail and office spaces will be operational as tenant improvements are built-out.
Westview Village
In November 2007, the Company purchased for $5.0 million, a 10.4 acre site in the Westview development on Buckeystown Pike (MD Route 85) in Frederick, Maryland. Construction was substantially completed in the second quarter of 2009 on a development that totals approximately 101,000 square feet of commercial space, including 60,000 square feet of retail shop space, 11,000 square feet of retail pads and 30,000 square feet of professional office space and is expected to cost approximately $26.5 million. The Company is currently marketing the space and as of December 31, 2009, has executed leases for 24,200 square feet, or approximately 32% of the total retail space.
11
Table of Contents
Great Eastern Plaza Land Parcel
On June 6, 2007, the Company purchased, for $1.3 million, 8.0 acres of undeveloped land adjacent to its Great Eastern Plaza shopping center in District Heights, Maryland. The Company is analyzing options to expand the existing shopping center onto this parcel at some future date.
Orchard Park
On July 19, 2007, the Company purchased, for $17.0 million, the 88,000 square foot Kroger-anchored Orchard Park shopping center located in Dunwoody, Georgia. The center is 91% leased as of December 31, 2009.
Northrock
In January 2008, the Company purchased for $12.5 million, approximately 15.4 acres of undeveloped land in Warrenton, Virginia, located at the southwest corner of the U. S. Route 29/211 and Fletcher Drive intersection. The Company constructed Northrock shopping center, a neighborhood shopping center totaling approximately 103,000 square feet of leasable area. Approximately 67% of the project is leased at December 31, 2009, including a 52,700 square foot Harris Teeter supermarket store, 7,896 square feet of small shop space, and pad leases with Chevy Chase Bank and Longhorn Steakhouse. The Chevy Chase Bank opened February 2009. The Longhorn Steakhouse restaurant is under construction by the tenant, who expects to commence operations during the summer of 2010. Total construction and development costs, including land, lease-up and tenant improvement costs, are projected to be approximately $27.9 million, the majority of which were funded with the $21.8 million construction loan the Company closed in May 2008. Substantial completion of construction was achieved during the first quarter of 2009.
Great Falls Center
On March 28, 2008, the Company completed the acquisition of the Safeway-anchored Great Falls Center located in Great Falls, Virginia. The center was 93% leased at December 31, 2009 and was acquired for a purchase price of $36.6 million, subject to the assumption of a $10.3 million mortgage loan.
BJ’s Wholesale Club
On March 28, 2008, the Company purchased for $21.0 million, the single tenant property anchored by BJ’s Wholesale Club, located in Alexandria, Virginia. The center was 100% leased at December 31, 2009.
Marketplace at Sea Colony
On March 28, 2008, the Company purchased for $3.0 million, Marketplace at Sea Colony, located in Bethany Beach, Delaware. The center was 91% leased at December 31, 2009.
Boulevard
During the second quarter of 2008, permits were issued for the redevelopment of a portion of the Boulevard shopping center. A vacant pad building previously occupied by a furniture store was demolished, the center’s in-line shop space was expanded by approximately 8,000 square feet for small shop retail and a Chevy Chase Bank pad building was constructed and commenced operations. As of December 31, 2009, all six shop spaces and the bank pad were leased, totaling 11,610 square feet. Substantial completion of construction was achieved during the first quarter of 2009, and total construction and development costs were approximately $2.8 million.
12
Table of Contents
| Item 1A. | Risk Factors |
RISK FACTORS
Carefully consider the following risks and all of the other information set forth in this Annual Report on Form 10-K, including the consolidated financial statements and the notes thereto. If any of the events or developments described below were actually to occur, the Company’s business, financial condition or results of operations could be adversely affected.
In this section, unless the context indicates otherwise, the terms “Company,” “we,” “us” and “our” refer to Saul Centers, Inc., and its subsidiaries, including the Operating Partnership.
The global financial crisis and economic slowdown may have an adverse impact on our business, our tenants’ business and our results of operations.
The continuation or worsening of the current credit crisis and global economic crisis could have an adverse effect on the fundamentals of our business and results of operations, including overall market occupancy and rental rates. These current economic conditions could have a negative effect on the financial condition of our tenants or lenders, which may expose us to increased risks of default by these parties.
With this disruption in the economy and capital markets, there can be no assurance we will not experience material adverse effects on our business, financial condition, results of operations or real estate values.
There can be no assurance that actions of the United States Government, Federal Reserve or other government and regulatory bodies for the reported purpose of stabilizing the economy or financial markets will achieve their intended effect. Additionally, some of these actions may adversely affect financial institutions, capital providers, retailers, consumers or our financial condition, results of operations or the trading price of our shares.
Potential consequences of the current credit crisis and global economic slowdown include:
| • | the financial condition of our tenants, many of which operate in the retail industry, may be adversely affected, which may result in tenant defaults under their leases due to bankruptcy, lack of liquidity, operational failures or for other reasons; |
| • | the ability to borrow on terms and conditions that we find acceptable, or at all, may be limited, which could reduce our ability to pursue acquisition and development opportunities and refinance existing debt, reduce our returns from acquisition and development activities and increase our future interest expense; |
| • | reduced values of our properties may limit our ability to dispose of assets at attractive prices and may reduce the ability to refinance loans; and |
| • | one or more lenders under our credit facility could fail and we may not be able to replace the financing commitment of any such lenders on favorable terms, or at all. |
Revenue from our properties may be reduced or limited if the retail operations of our tenants are not successful.
The global and domestic economies have recently experienced a significant contraction of credit markets and resulting slowdown in business and consumer spending. We believe that consumers have cut back their discretionary spending in response to credit constraints, unemployment, a reduction in home equity values, highly volatile fuel and other commodity prices, and general economic uncertainty. Revenue from our properties depends primarily on the ability of our tenants to pay the full amount of rent due under their leases on a timely basis. The amount of rent we receive from our tenants generally will depend in part on the success of our tenants’ retail operations, making us vulnerable to general economic downturns and other conditions affecting the retail industry. Some tenants may terminate their occupancy due to an inability to operate profitably for an extended period of time, impacting the Company’s ability to maintain occupancy levels.
13
Table of Contents
Any reduction in our tenants’ ability to pay base rent or percentage rent may adversely affect our financial condition and results of operations. Small business tenants and anchor retailers which lease space in the Company’s properties may experience a deterioration in their sales or other revenue, or experience a constraint on the availability of credit necessary to fund operations, which in turn may adversely impact those tenants’ ability to pay contractual base rents and operating expense recoveries. Some of our leases provide for the payment, in addition to base rent, of additional rent above the base amount according to a specified percentage of the gross sales generated by the tenants. Decreasing sales revenue by retail tenants could adversely impact the Company’s receipt of percentage rents required to be paid by tenants under certain leases.
Our ability to increase our net income depends on the success and continued presence of our shopping center “anchor” tenants and other significant tenants.
Our net income could be adversely affected in the event of a downturn in the business, or the bankruptcy or insolvency, of any anchor store or anchor tenant. Our largest shopping center anchor tenant is Giant Food, which accounted for 4.4% of our total revenue for the year ended December 31, 2009. The closing of one or more anchor stores prior to the expiration of the lease of that store or the termination of a lease by one or more of a property’s anchor tenants could adversely affect that property and result in lease terminations by, or reductions in rent from, other tenants whose leases may permit termination or rent reduction in those circumstances or whose own operations may suffer as a result. This could reduce our net income.
We may experience difficulty or delay in renewing leases or leasing vacant space.
We derive most of our revenue directly or indirectly from rent received from our tenants. We are subject to the risks that, upon expiration, leases for space in our properties may not be renewed, the space and other vacant space may not be re-leased, or the terms of renewal or re-lease, including the cost of required renovations or concessions to tenants, may be less favorable than previous lease terms. Constraints on the availability of credit to office and retail tenants, necessary to purchase and install improvements, fixtures and equipment, and fund start-up business expenses, could impact the Company’s ability to procure new tenants for spaces currently vacant in existing operating properties or properties under development. As a result, our results of operations and our net income could be reduced.
We have substantial relationships with members of The Saul Organization whose interests could conflict with the interests of other stockholders.
Influence of Officers, Directors and Significant Stockholders.
Three of our executive officers, Mr. Saul II, his son and our President, B. Francis Saul III, and Thomas H. McCormick, our Senior Vice President and General Counsel, are members of The Saul Organization, and persons associated with The Saul Organization constitute four of the 13 members of our Board of Directors. In addition, as of December 31, 2009, Mr. Saul II beneficially owned, for purposes of SEC reporting, 5,102,000 shares of our common stock representing 28.7% of our issued and outstanding shares of common stock. Mr. Saul II also beneficially owned, as of December 31, 2009, 5,416,000 units of the Operating Partnership. In general, these units are convertible into shares of our common stock on a one-for-one basis. The ownership limitation set forth in our articles of incorporation is 39.9% in value of our issued and outstanding equity securities (which includes both common and preferred stock). As of December 31, 2009, Mr. Saul II and members of The Saul Organization owned common stock representing approximately 23.1% in value of all our issued and outstanding equity securities. Members of the Saul Organization are permitted under our articles of incorporation to convert Operating Partnership units into shares of common stock or acquire additional shares of common stock until The Saul Organization’s actual ownership of common stock reaches 39.9% in value of our equity securities. As of December 31, 2009, all of the 5,416,000 units of the Operating Partnership would have been permitted to convert into additional shares of common stock, and would have resulted in Mr. Saul II and members of The Saul Organization owning common stock representing approximately 37.5% in value of all our issued and outstanding equity securities.
As a result of these relationships, members of The Saul Organization will be in a position to exercise significant influence over our affairs, which influence might not be consistent with the interests of some, or a majority, of our stockholders. Except as discussed below, we do not have any written policies or procedures for the review, approval or ratification of transactions with related persons.
14
Table of Contents
Management Time.
Our Chief Executive Officer, President, Senior Vice President-Chief Accounting Officer and Senior Vice President and General Counsel are also officers of various entities of The Saul Organization. Although we believe that these officers spend sufficient management time to meet their responsibilities as our officers, the amount of management time devoted to us will depend on our specific circumstances at any given point in time. As a result, in a given period, these officers may spend less than a majority of their management time on our matters. Over extended periods of time, we believe that our Chief Executive Officer and Senior Vice President and General Counsel will spend less than a majority of their management time on Company matters, while our President and Senior Vice President-Chief Accounting Officer may or may not spend less than a majority of their time on our matters.
Exclusivity and Right of First Refusal Agreements.
We will acquire, develop, own and manage shopping center properties and will own and manage other commercial properties, and, subject to certain exclusivity agreements and rights of first refusal to which we are a party, The Saul Organization will continue to develop, acquire, own and manage commercial properties and own land suitable for development as, among other things, shopping centers and other commercial properties. Therefore, conflicts could develop in the allocation of acquisition and development opportunities with respect to commercial properties other than shopping centers and with respect to development sites, as well as potential tenants and other matters, between us and The Saul Organization. The agreement relating to exclusivity and the right of first refusal between us and The Saul Organization generally requires The Saul Organization to conduct its shopping center business exclusively through us and to grant us a right of first refusal to purchase commercial properties and development sites in certain market areas that become available to The Saul Organization. The Saul Organization has granted the right of first refusal to us, acting through our independent directors, in order to minimize potential conflicts with respect to commercial properties and development sites. We and The Saul Organization have entered into this agreement in order to minimize conflicts with respect to shopping centers and certain of our commercial properties.
Shared Services.
We share with The Saul Organization certain ancillary functions, such as computer and payroll services, benefits administration and in-house legal services. The terms of all sharing arrangements, including payments related thereto, are reviewed periodically by our Audit Committee, which is comprised solely of independent directors. Included in our general and administrative expenses or capitalized to specific development projects, for the year ended December 31, 2009, are charges totaling $5,804,000, related to such shared services, which included rental payments for the Company’s headquarters lease, which were billed by The Saul Organization. Although we believe that the amounts allocated to us for such shared services represent a fair allocation between us and The Saul Organization, we have not obtained a third party appraisal of the value of these services.
The B. F. Saul Insurance Agency of Maryland, Inc., a subsidiary of the B. F. Saul Company and a member of the Saul Organization, is a general insurance agency that receives commissions and counter-signature fees in connection with our insurance program. Such commissions and fees amounted to approximately $314,000 for the year ended December 31, 2009.
Related Party Rents.
We sublease space for our corporate headquarters from a member of The Saul Organization, the building of which is owned by another member of the Saul Organization. The 10-year lease commenced in March 2002 and provides for base rent escalated at 3% per year, with payment of a pro-rata share of operating expenses over a base year amount. The Company and The Saul Organization entered into a Shared Services Agreement whereby each party pays a portion of the total rental payments based on a percentage proportionate to the number of employees employed by each party. The Company’s rent expense for the year ended December 31, 2009 was $835,000. Although the Company believes that this lease has terms comparable to what would have been obtained from a third party landlord, it did not seek bid proposals from any independent third parties when entering into its new corporate headquarters lease.
Conflicts Based on Individual Tax Considerations.
The tax basis of members of The Saul Organization in our portfolio properties which were contributed to certain partnerships at the time of our initial public offering in 1993 was substantially less than the fair market value thereof at the time of their contribution. In the event of our disposition of such properties, a disproportionately large share of the gain for federal income tax purposes would be allocated to members of The Saul Organization. In
15
Table of Contents
addition, future reductions of the level of our debt, or future releases of the guarantees or indemnities with respect thereto by members of The Saul Organization, would cause members of The Saul Organization to be considered, for federal income tax purposes, to have received constructive distributions. Depending on the overall level of debt and other factors, these distributions could be in excess of The Saul Organization’s bases in their Partnership units, in which case such excess constructive distributions would be taxable.
Consequently, it is in the interests of The Saul Organization that we continue to hold the contributed portfolio properties, that a portion of our debt remains outstanding or is refinanced and that The Saul Organization guarantees and indemnities remain in place, in order to defer the taxable gain to members of The Saul Organization. Therefore, The Saul Organization may seek to cause us to retain the contributed portfolio properties, and to refrain from reducing our debt or releasing The Saul Organization guarantees and indemnities, even when such action may not be in the interests of some, or a majority, of our stockholders. In order to minimize these conflicts, decisions as to sales of the portfolio properties, or any refinancing, repayment or release of guarantees and indemnities with respect to our debt, will be made by the independent directors.
Ability to Block Certain Actions.
Under applicable law and the limited partnership agreement of the Operating Partnership, consent of the limited partners is required to permit certain actions, including the sale of all or substantially all of the Operating Partnership’s assets. Therefore, members of The Saul Organization, through their status as limited partners in the Operating Partnership, could prevent the taking of any such actions, even if they were in the interests of some, or a majority, of our stockholders.
The amount of debt we have and the restrictions imposed by that debt could adversely affect our business and financial condition.
As of December 31, 2009, we had approximately $636.8 million of debt outstanding, $576.1 million of which was long-term fixed-rate debt and was secured by 36 of our properties. The remaining $60.7 million of outstanding debt was borrowed under two secured construction loans.
We currently have a general policy of limiting our borrowings to 50 percent of asset value, i.e., the value of our portfolio, as determined by our Board of Directors by reference to the aggregate annualized cash flow from our portfolio. Our organizational documents contain no limitation on the amount or percentage of indebtedness which we may incur. Therefore, the Board of Directors could alter or eliminate the current limitation on borrowing at any time. If our debt capitalization policy were changed, we could increase our leverage, resulting in an increase in debt service that could adversely affect our operating cash flow and our ability to make expected distributions to stockholders, and in an increased risk of default on our obligations.
We have established our debt capitalization policy relative to asset value, which is computed by reference to the aggregate annualized cash flow from the properties in our portfolio rather than relative to book value. We have used a measure tied to cash flow because we believe that the book value of our portfolio properties, which is the depreciated historical cost of the properties, does not accurately reflect our ability to borrow. Asset value, however, is somewhat more variable than book value, and may not at all times reflect the fair market value of the underlying properties.
The amount of our debt outstanding from time to time could have important consequences to our stockholders. For example, it could:
| • | require us to dedicate a substantial portion of our cash flow from operations to payments on our debt, thereby reducing funds available for operations, property acquisitions and other appropriate business opportunities that may arise in the future; |
| • | limit our ability to obtain any additional financing we may need in the future for working capital, debt refinancing, capital expenditures, acquisitions, development or other general corporate purposes; |
| • | make it difficult to satisfy our debt service requirements; |
| • | limit our ability to make distributions on our outstanding common and preferred stock; |
16
Table of Contents
| • | require us to dedicate increased amounts of our cash flow from operations to payments on our variable rate, unhedged debt if interest rates rise; |
| • | limit our flexibility in planning for, or reacting to, changes in our business and the factors that affect the profitability of our business, which may place us at a disadvantage compared to competitors with less debt or debt with less restrictive terms; and |
| • | limit our ability to obtain any additional financing we may need in the future for working capital, debt refinancing, capital expenditures, acquisitions, development or other general corporate purposes. |
Our ability to make scheduled payments of the principal of, to pay interest on, or to refinance, our indebtedness will depend primarily on our future performance, which to a certain extent is subject to economic, financial, competitive and other factors described in this section. If we are unable to generate sufficient cash flow from our business in the future to service our debt or meet our other cash needs, we may be required to refinance all or a portion of our existing debt, sell assets or obtain additional financing to meet our debt obligations and other cash needs. Our ability to refinance, sell assets or obtain additional financing may not be possible on terms that we would find acceptable.
We are obligated to comply with financial and other covenants in our debt that could restrict our operating activities, and the failure to comply could result in defaults that accelerate the payment under our debt.
Our secured debt generally contains customary covenants, including, among others, provisions:
| • | relating to the maintenance of the property securing the debt; |
| • | restricting our ability to assign or further encumber the properties securing the debt; and |
| • | restricting our ability to enter into certain new leases or to amend or modify certain existing leases without obtaining consent of the lenders. |
Our unsecured debt generally contains various restrictive covenants. The covenants in our unsecured debt include, among others, provisions restricting our ability to:
| • | incur additional unsecured debt; |
| • | guarantee additional debt; |
| • | make certain distributions, investments and other restricted payments, including distribution payments on our outstanding stock; |
| • | create certain liens; |
| • | increase our overall secured and unsecured borrowing beyond certain levels; and |
| • | consolidate, merge or sell all or substantially all of our assets. |
Our ability to meet some of the covenants in our debt, including covenants related to the condition of the property or payment of real estate taxes, may be dependent on the performance by our tenants under their leases. In addition, our line of credit requires us and our subsidiaries to satisfy financial covenants. The material financial covenants require us, on a consolidated basis, to:
| • | limit the amount of debt so as to maintain a gross asset value, as defined in the loan agreement, in excess of liabilities of at least $600 million plus 90% of the Company’s future net equity proceeds; |
| • | limit the amount of debt as a percentage of gross asset value, as defined in the loan agreement, to less than 60% (leverage ratio); |
| • | limit the amount of debt so that interest coverage will exceed 2.2x on a trailing 12-full calendar month basis (interest expense coverage); |
| • | limit the amount of debt so that interest and scheduled principal amortization coverage exceeds 1.6x (debt service coverage); |
17
Table of Contents
| • | limit the amount of debt so that interest, scheduled principal amortization and preferred dividend coverage exceeds 1.4x (fixed charge coverage); and |
| • | limit the amount of variable rate debt and debt with initial loan terms of less than five years to no more than 40% of total debt. |
As of December 31, 2009, we were in compliance with all such covenants. If we were to breach any of our debt covenants and did not cure the breach within any applicable cure period, our lenders could require us to repay the debt immediately, and, if the debt is secured, could immediately begin proceedings to take possession of the property securing the loan. Some of our debt arrangements are cross-defaulted, which means that the lenders under those debt arrangements can put us in default and require immediate repayment of their debt if we breach and fail to cure a covenant under certain of our other debt obligations. As a result, any default under our debt covenants could have an adverse effect on our financial condition, our results of operations, our ability to meet our obligations and the market value of our shares.
Our development activities are inherently risky.
The ground-up development of improvements on real property, which is different from the renovation and redevelopment of existing improvements, presents substantial risks. In addition to the risks associated with real estate investment in general as described elsewhere, the risks associated with our remaining development activities include:
| • | significant time lag between commencement and completion subjects us to greater risks due to fluctuation in the general economy; |
| • | failure or inability to obtain construction or permanent financing on favorable terms; |
| • | expenditure of money and time on projects that may never be completed; |
| • | inability to achieve projected rental rates or anticipated pace of lease-up; |
| • | higher-than-estimated construction costs, including labor and material costs; and |
| • | possible delay in completion of the project because of a number of factors, including weather, labor disruptions, construction delays or delays in receipt of zoning or other regulatory approvals, or acts of God (such as fires, earthquakes or floods). |
Redevelopments and acquisitions may fail to perform as expected.
Our investment strategy includes the redevelopment and acquisition of community and neighborhood shopping centers that are anchored by supermarkets, drugstores or high volume, value-oriented retailers that provide consumer necessities. The redevelopment and acquisition of properties entails risks that include the following, any of which could adversely affect our results of operations and our ability to meet our obligations:
| • | our estimate of the costs to improve, reposition or redevelop a property may prove to be too low, and, as a result, the property may fail to achieve the returns we have projected, either temporarily or for a longer time; |
| • | we may not be able to identify suitable properties to acquire or may be unable to complete the acquisition of the properties we identify; |
| • | we may not be able to integrate new developments or acquisitions into our existing operations successfully; |
| • | properties we redevelop or acquire may fail to achieve the occupancy or rental rates we project at the time we make the decision to invest, which may result in the properties’ failure to achieve the returns we projected; |
| • | our pre-acquisition evaluation of the physical condition of each new investment may not detect certain defects or identify necessary repairs until after the property is acquired, which could significantly increase our total acquisition costs; and |
| • | our investigation of a property or building prior to our acquisition, and any representations we may receive from the seller, may fail to reveal various liabilities, which could reduce the cash flow from the property or increase our acquisition cost. |
18
Table of Contents
Our ability to grow will be limited if we cannot obtain additional capital.
Our growth strategy includes the redevelopment of properties we already own and the acquisition of additional properties. Because we are required to distribute to our stockholders at least 90% of our taxable income each year to continue to qualify as a real estate investment trust, or REIT, for federal income tax purposes, in addition to our undistributed operating cash flow, we rely upon the availability of debt or equity capital to fund our growth, which financing may or may not be available on favorable terms or at all. The debt could include mortgage loans from third parties or the sale of debt securities. Equity capital could include our common stock or preferred stock. Additional financing, refinancing or other capital may not be available in the amounts we desire or on favorable terms. Our access to debt or equity capital depends on a number of factors, including the general state of the capital markets, the market’s perception of our growth potential, our ability to pay dividends, and our current and potential future earnings. Depending on the outcome of these factors, we could experience delay or difficulty in implementing our growth strategy on satisfactory terms, or be unable to implement this strategy.
Our performance and value are subject to general risks associated with the real estate industry.
Our economic performance and the value of our real estate assets, and, consequently, the value of our investments, are subject to the risk that if our properties do not generate revenue sufficient to meet our operating expenses, including debt service and capital expenditures, our cash flow and ability to pay distributions to our stockholders will be adversely affected. As a real estate company, we are susceptible to the following real estate industry risks:
| • | economic downturns in the areas where our properties are located; |
| • | adverse changes in local real estate market conditions, such as oversupply or reduction in demand; |
| • | changes in tenant preferences that reduce the attractiveness of our properties to tenants; |
| • | zoning or regulatory restrictions; |
| • | decreases in market rental rates; |
| • | weather conditions that may increase energy costs and other operating expenses; |
| • | costs associated with the need to periodically repair, renovate and re-lease space; and |
| • | increases in the cost of adequate maintenance, insurance and other operating costs, including real estate taxes, associated with one or more properties, which may occur even when circumstances such as market factors and competition cause a reduction in revenue from one or more properties, although real estate taxes typically do not increase upon a reduction in such revenue. |
Many real estate costs are fixed, even if income from our properties decreases.
Our financial results depend primarily on leasing space in our properties to tenants on terms favorable to us. Costs associated with real estate investment, such as real estate taxes and maintenance costs, generally are not reduced even when a property is not fully occupied, rental rates decrease, or other circumstances cause a reduction in income from the investment. As a result, cash flow from the operations of our properties may be reduced if a tenant does not pay its rent or we are unable to rent our properties on favorable terms. Under those circumstances, we might not be able to enforce our rights as landlord without delays, and may incur substantial legal costs. Additionally, new properties that we may acquire or develop may not produce any significant revenue immediately, and the cash flow from existing operations may be insufficient to pay the operating expenses and debt service associated with that property until the property is fully leased.
Competition may limit our ability to purchase new properties and generate sufficient income from tenants.
Numerous commercial developers and real estate companies compete with us in seeking tenants for properties and properties for acquisition. This competition may:
| • | reduce properties available for acquisition; |
| • | increase the cost of properties available for acquisition; |
| • | reduce rents payable to us; |
| • | interfere with our ability to attract and retain tenants; |
19
Table of Contents
| • | lead to increased vacancy rates at our properties; and |
| • | adversely affect our ability to minimize expenses of operation. |
Retailers at our shopping center properties also face increasing competition from outlet stores, discount shopping clubs, and other forms of marketing of goods, such as direct mail, internet marketing and telemarketing. This competition may reduce percentage rents payable to us and may contribute to lease defaults and insolvency of tenants. If we are unable to continue to attract appropriate retail tenants to our properties, or to purchase new properties in our geographic markets, it could materially affect our ability to generate net income, service our debt and make distributions to our stockholders.
We may be unable to sell properties when appropriate because real estate investments are illiquid.
Real estate investments generally cannot be sold quickly. In addition, there are some limitations under federal income tax laws applicable to real estate and to REITs in particular that may limit our ability to sell our assets. We may not be able to alter our portfolio promptly in response to changes in economic or other conditions. Our inability to respond quickly to adverse changes in the performance of our investments could have an adverse effect on our ability to meet our obligations and make distributions to our stockholders.
Our insurance coverage on our properties may be inadequate.
We carry comprehensive insurance on all of our properties, including insurance for liability, fire, flood, terrorism and rental loss. These policies contain coverage limitations. We believe this coverage is of the type and amount customarily obtained for or by an owner of real property assets. We intend to obtain similar insurance coverage on subsequently acquired properties.
As a consequence of the September 11, 2001 terrorist attacks and other significant losses incurred by the insurance industry, the availability of insurance coverage has decreased and the prices for insurance have increased. As a result, we may be unable to renew or duplicate our current insurance coverage in adequate amounts or at reasonable prices. In addition, insurance companies may no longer offer coverage against certain types of losses, such as losses due to terrorist acts and toxic mold, or, if offered, the expense of obtaining these types of insurance may not be justified. We therefore may cease to have insurance coverage against certain types of losses and/or there may be decreases in the limits of insurance available. If an uninsured loss or a loss in excess of our insured limits occurs, we could lose all or a portion of the capital we have invested in a property, as well as the anticipated future revenue from the property, but still remain obligated for any mortgage debt or other financial obligations related to the property. Material losses in excess of insurance proceeds may occur in the future. Also, due to inflation, changes in codes and ordinances, environmental considerations and other factors, it may not be feasible to use insurance proceeds to replace a building after it has been damaged or destroyed. Events such as these could adversely affect our results of operations and our ability to meet our obligations, including distributions to our stockholders.
Environmental laws and regulations could reduce the value or profitability of our properties.
All real property and the operations conducted on real property are subject to federal, state and local laws, ordinances and regulations relating to hazardous materials, environmental protection and human health and safety. Under various federal, state and local laws, ordinances and regulations, we and our tenants may be required to investigate and clean up certain hazardous or toxic substances released on or in properties we own or operate, and also may be required to pay other costs relating to hazardous or toxic substances. This liability may be imposed without regard to whether we or our tenants knew about the release of these types of substances or were responsible for their release. The presence of contamination or the failure to properly remediate contamination at any of our properties may adversely affect our ability to sell or lease those properties or to borrow using those properties as collateral. The costs or liabilities could exceed the value of the affected real estate. We are not aware of any environmental condition with respect to any of our properties that management believes would have a material adverse effect on our business, assets or results of operations taken as a whole. The uses of any of our properties prior to our acquisition of the property and the building materials used at the property are among the property-specific factors that will affect how the environmental laws are applied to our properties. If we are subject to any material environmental liabilities, the liabilities could adversely affect our results of operations and our ability to meet our obligations.
20
Table of Contents
We cannot predict what other environmental legislation or regulations will be enacted in the future, how existing or future laws or regulations will be administered or interpreted or what environmental conditions may be found to exist on the properties in the future. Compliance with existing and new laws and regulations may require us or our tenants to spend funds to remedy environmental problems. Our tenants, like many of their competitors, have incurred, and will continue to incur, capital and operating expenditures and other costs associated with complying with these laws and regulations, which will adversely affect their potential profitability. Generally, our tenants must comply with environmental laws and meet remediation requirements. Our leases typically impose obligations on our tenants to indemnify us from any compliance costs we may incur as a result of the environmental conditions on the property caused by the tenant. If a tenant fails to or cannot comply, we could be forced to pay these costs. If not addressed, environmental conditions could impair our ability to sell or re-lease the affected properties in the future or result in lower sales prices or rent payments.
The Americans with Disabilities Act of 1990 could require us to take remedial steps with respect to newly acquired properties.
The properties, as commercial facilities, are required to comply with Title III of the Americans with Disabilities Act of 1990. Investigation of a property may reveal non-compliance with this Act. The requirements of the Act, or of other federal, state or local laws, also may change in the future and restrict further renovations of our properties with respect to access for disabled persons. Future compliance with the Act may require expensive changes to the properties.
The revenue generated by our tenants could be negatively affected by various federal, state and local laws to which they are subject.
We and our tenants are subject to a wide range of federal, state and local laws and regulations, such as local licensing requirements, consumer protection laws and state and local fire, life-safety and similar requirements that affect the use of the properties. The leases typically require that each tenant comply with all regulations. Failure to comply could result in fines by governmental authorities, awards of damages to private litigants, or restrictions on the ability to conduct business on such properties. Non-compliance of this sort could reduce our revenue from a tenant, could require us to pay penalties or fines relating to any non-compliance, and could adversely affect our ability to sell or lease a property.
Failure to qualify as a REIT for federal income tax purposes would cause us to be taxed as a corporation, which would substantially reduce funds available for payment of distributions.
We believe that we are organized and qualified as a REIT, and currently intend to operate in a manner that will allow us to continue to qualify as a REIT for federal income tax purposes under the Code. However, the IRS could successfully assert that we are not qualified as such. In addition, we may not remain qualified as a REIT in the future. Qualification as a REIT involves the application of highly technical and complex Code provisions. The complexity of these provisions and of the applicable income tax regulations that have been issued under the Code by the United States Department of Treasury is greater in the case of a REIT that holds its assets in partnership form. Certain facts and circumstances not entirely within our control may affect our ability to qualify as a REIT. For example, in order to qualify as a REIT, at least 95% of our gross income in any year must be derived from qualifying rents and other income. Satisfying this requirement could be difficult, for example, if defaults by tenants were to reduce the amount of income from qualifying rents. Also, we must make annual distributions to stockholders of at least 90% of our net taxable income (excluding capital gains). In addition, new legislation, new regulations, new administrative interpretations or new court decisions may significantly change the tax laws with respect to qualification as a REIT or the federal income tax consequences of such qualification.
If we fail to qualify as a REIT:
| • | we would not be allowed a deduction for dividend distributions to stockholders in computing taxable income; |
| • | we would be subject to federal income tax at regular corporate rates; |
| • | we could be subject to the federal alternative minimum tax; |
| • | unless we are entitled to relief under specific statutory provisions, we could not elect to be taxed as a REIT for four taxable years following the year during which we were disqualified; |
21
Table of Contents
| • | we could be required to pay significant income taxes, which would substantially reduce the funds available for investment and for distribution to our stockholders for each year in which we failed to qualify; and |
| • | we would no longer be required by law to make any distributions to our stockholders. |
We believe that the Operating Partnership is treated as a partnership, and not as a corporation, for federal income tax purposes. If the IRS were to challenge successfully the status of the Operating Partnership as a partnership for federal income tax purposes:
| • | the Operating Partnership would be taxed as a corporation; |
| • | we would cease to qualify as a REIT for federal income tax purposes; and |
| • | the amount of cash available for distribution to our stockholders would be substantially reduced. |
We may be required to incur additional debt to qualify as a REIT.
As a REIT, we must make annual distributions to stockholders of at least 90% of our REIT taxable income. We are subject to income tax on amounts of undistributed REIT taxable income and net capital gain. In addition, we would be subject to a 4% excise tax if we fail to distribute sufficient income to meet a minimum distribution test based on our ordinary income, capital gain and aggregate undistributed income from prior years.
We intend to make distributions to stockholders to comply with the Code’s distribution provisions and to avoid federal income and excise tax. We may need to borrow funds to meet our distribution requirements because:
| • | our income may not be matched by our related expenses at the time the income is considered received for purposes of determining taxable income; and |
| • | non-deductible capital expenditures or debt service requirements may reduce available cash but not taxable income. |
In these circumstances, we might have to borrow funds on unfavorable terms and even if our management believes the market conditions make borrowing financially unattractive.
The structure of our leases may jeopardize our ability to qualify as a REIT.
If the IRS were to challenge successfully the characterization of one or more of our leases of properties as leases for federal income tax purposes, the Operating Partnership would not be treated as the owner of the related property or properties for federal income tax purposes. As a result, the Operating Partnership would lose tax depreciation and cost recovery deductions with respect to one or more of our properties, which in turn could cause us to fail to qualify as a REIT. Although we will use our best efforts to structure any leasing transaction for properties acquired in the future so the lease will be characterized as a lease and the Operating Partnership will be treated as the owner of the property for federal income tax purposes, we will not seek an advance ruling from the IRS and do not intend to seek an opinion of counsel that the Operating Partnership will be treated as the owner of any leased properties for federal income tax purposes. Thus, the IRS could successfully assert that future leases will not be treated as leases for federal income tax purposes, which could adversely affect our financial condition and results of operations.
To maintain our status as a REIT, we limit the amount of shares any one stockholder can own.
The Code imposes certain limitations on the ownership of the stock of a REIT. For example, not more than 50% in value of our outstanding shares of capital stock may be owned, actually or constructively, by five or fewer individuals (as defined in the Code). To protect our REIT status, our articles of incorporation restrict beneficial and constructive ownership (defined by reference to various Code provisions) to no more than 2.5% in value of our issued and outstanding equity securities by any single stockholder with the exception of members of The Saul Organization, who are restricted to beneficial and constructive ownership of no more than 39.9% in value of our issued and outstanding equity securities.
The constructive ownership rules are complex. Shares of our capital stock owned, actually or constructively, by a group of related individuals and/or entities may be treated as constructively owned by one of
22
Table of Contents
those individuals or entities. As a result, the acquisition of less than 2.5% or 39.9% in value of our issued and outstanding equity securities, by an individual or entity could cause that individual or entity (or another) to own constructively more than 2.5% or 39.9% in value of the outstanding stock. If that happened, either the transfer or ownership would be void or the shares would be transferred to a charitable trust and then sold to someone who can own those shares without violating the respective ownership limit.
As of December 31, 2009, Mr. Saul II and members of The Saul Organization owned common stock representing approximately 29.9% in value of all our issued and outstanding equity securities. In addition, members of The Saul Organization beneficially owned Operating Partnership units that are, in general, convertible into our common stock on a one-for-one basis. Members of the Saul Organization are permitted under our articles of incorporation to convert Operating Partnership units into shares of common stock or acquire additional shares of common stock until The Saul Organization’s actual ownership of common stock reaches 39.9% in value of our equity securities.
The Board of Directors may waive these restrictions on a case-by-case basis. The Board has authorized the Company to grant waivers to look-through entities, such as mutual funds, in which shares of equity stock owned by the entity are treated as owned proportionally by individuals who are the beneficial owners of the entity. Even though these entities may own stock in excess of the 2.5% ownership limit, no individual beneficially or constructively would own more than 2.5%. The Board of Directors has agreed to waive the ownership limit with respect to certain mutual funds and similar investors. In addition, the Board of Directors has agreed to waive the ownership limit with respect to certain bank pledgees of shares of our common stock and units issued by the Operating Partnership and held by members of The Saul Organization.
The ownership restrictions may delay, defer or prevent a transaction or a change of our control that might involve a premium price for our equity stock or otherwise be in the stockholders’ best interest.
The lower tax rate on dividends of regular corporations may cause investors to prefer to hold stock of regular corporations instead of REITs.
On May 28, 2003, the President signed into law the Jobs and Growth Tax Relief Reconciliation Act of 2003 (which we will refer to as the Act). Under the Act, the maximum tax rate on the long-term capital gains of non-corporate taxpayers is 15% (applicable to sales occurring from May 7, 2003 through December 31, 2008). The Act also reduced the tax rate on “qualified dividend income” to the maximum capital gains rate. Because, as a REIT, we are not generally subject to tax on the portion of our REIT taxable income or capital gains distributed to our stockholders, our distributions are not generally eligible for this new tax rate on dividends. As a result, our ordinary REIT dividends generally continue to be taxed at the higher tax rates applicable to ordinary income. Without further legislation, the maximum tax rate on long-term capital gains will revert to 20% in 2009, and dividends will again be subject to tax at ordinary rates.
We cannot assure you we will continue to pay dividends at historical rates.
Our ability to continue to pay dividends on our common stock at historical rates or to increase our common stock dividend rate will depend on a number of factors, including, among others, the following:
| • | our financial condition and results of future operations; |
| • | the performance of lease terms by tenants; |
| • | the terms of our loan covenants; and |
| • | our ability to acquire, finance, develop or redevelop and lease additional properties at attractive rates. |
If we do not maintain or increase the dividend rate on our common stock, it could have an adverse effect on the market price of our common stock and other securities. Payment of dividends on our common stock may be subject to payment in full of the dividends on any preferred stock or depositary shares and payment of interest on any debt securities we may offer.
23
Table of Contents
Certain tax and anti-takeover provisions of our articles of incorporation and bylaws may inhibit a change of our control.
Certain provisions contained in our articles of incorporation and bylaws and the Maryland General Corporation Law may discourage a third party from making a tender offer or acquisition proposal to us. If this were to happen, it could delay, deter or prevent a change in control or the removal of existing management. These provisions also may delay or prevent the stockholders from receiving a premium for their stock over then-prevailing market prices. These provisions include:
| • | the REIT ownership limit described above; |
| • | authorization of the issuance of our preferred stock with powers, preferences or rights to be determined by the Board of Directors; |
| • | a staggered, fixed-size Board of Directors consisting of three classes of directors; |
| • | special meetings of our stockholders may be called only by the Chairman of the Board, the president, by a majority of the directors or by stockholders possessing no less than 25% of all the votes entitled to be cast at the meeting; |
| • | the Board of Directors, without a stockholder vote, can classify or reclassify unissued shares of preferred stock; |
| • | a member of the Board of Directors may be removed only for cause upon the affirmative vote of 75% of the Board of Directors or 75% of the then-outstanding capital stock; |
| • | advance notice requirements for proposals to be presented at stockholder meetings; and |
| • | the terms of our articles of incorporation regarding business combinations and control share acquisitions. |
We may amend or revise our business policies without your approval.
Our Board of Directors may amend or revise our operating policies without stockholder approval. Our investment, financing and borrowing policies and policies with respect to all other activities, such as growth, debt, capitalization and operations, are determined by the Board of Directors or those committees or officers to whom the Board of Directors has delegated that authority. The Board of Directors may amend or revise these policies at any time and from time to time at its discretion. A change in these policies could adversely affect our financial condition and results of operations, and the market price of our securities.
| Item 1B. | Unresolved Staff Comments |
We have received no written comments from the Securities and Exchange Commission staff regarding our periodic or current reports in the 180 days preceding December 31, 2009 that remain unresolved.
| Item 2. | Properties |
Overview
The Company is the owner, developer and operator of a real estate portfolio composed of 52 operating properties totaling approximately 8,424,000 square feet of gross leasable area (“GLA”) and four development parcels as of December 31, 2009. The properties are located primarily in the Washington, DC/Baltimore, Maryland metropolitan area. The portfolio is composed of 47 neighborhood and community Shopping Centers, and five predominantly Office Properties totaling approximately 7,218,000 and 1,206,000 square feet of GLA, respectively. No single property accounted for more than 6.8% of the total gross leasable area. A majority of the Shopping Centers are anchored by several major tenants. Thirty-one of the Shopping Centers were anchored by a grocery store and offer primarily day-to-day necessities and services. Three retail tenants, Giant Food (4.4%), a tenant at eight Shopping Centers, Safeway (3.2%), a tenant at eight Shopping Centers, and Chevy Chase Bank (2.7%), a tenant at twenty properties and one office tenant, the United States Government (2.8%), a tenant at seven properties, individually accounted for more than 2.5% of the Company’s total revenue for the year ended December 31, 2009. The average rent, calculated using annualized base rent for leased space as of December 31, 2009 and 2008, was $16.76 per square foot and $16.49 per square foot, respectively, for the Company’s Current Portfolio Properties.
24
Table of Contents
The Company’s Current Portfolio Properties primarily consists of seasoned properties that have been owned and managed by The Saul Organization for 20 years or more. The Company expects to hold its properties as long-term investments, and it has no maximum period for retention of any investment. It plans to selectively acquire additional income-producing properties and to expand, renovate, and improve its properties when circumstances warrant. See “Item 1. Business—Operating Strategies” and “Business—Capital Policies.”
The Shopping Centers
Community and neighborhood shopping centers typically are anchored by one or more supermarkets, discount department stores or drug stores. These anchors offer day-to-day necessities rather than apparel and luxury goods and, therefore, generate consistent local traffic. By contrast, regional malls generally are larger and typically are anchored by one or more full-service department stores.
In general, the Shopping Centers are seasoned community and neighborhood shopping centers located in well established, highly developed, densely populated, middle and upper income areas. The 2009 average estimated population within a one and three-mile radius of the Shopping Centers is approximately 15,400 and 93,900, respectively. The 2009 average household income within the one and three-mile radius of the Shopping Centers is approximately $98,500 and $99,700, respectively, compared to a national average of $71,400. Because the Shopping Centers generally are located in highly developed areas, management believes that there is little likelihood that significant numbers of competing centers will be developed in the future.
The Shopping Center properties range in size from 4,000 to 575,000 square feet of GLA, with six in excess of 300,000 square feet, and average approximately 154,000 square feet. A majority of the Shopping Centers are anchored by several major tenants and other tenants offering primarily day-to-day necessities and services. Thirty-one of the 45 Shopping Centers are anchored by a grocery store.
Lease Expirations of Shopping Center Properties
The following table sets forth, by year of expiration, the aggregate amount of base rent and leasable area for leases in place at the shopping center properties that the Company owned as of December 31, 2009, for each of the 10 years beginning with 2010, assuming that none of the tenants exercise renewal options and excluding an aggregate of 600,986 square feet of unleased space, which represented 8.3% of the GLA of the shopping center properties as of December 31, 2009.
25
Table of Contents
Lease Expirations of Shopping Center Properties
| Year of Lease Expiration |
Leasable Area Represented by Expiring Leases |
Percentage of Leasable Area Represented by Expiring Leases |
Annual Base Rent Under Expiring Leases (1) |
Percentage of Annual Base Rent Under Expiring Leases |
||||||||
| 2010 |
682,400 | sf | 9.5 | % | $ | 10,037,000 | 10.4 | % | ||||
| 2011 |
967,902 | 13.4 | 13,426,000 | 13.9 | ||||||||
| 2012 |
826,543 | 11.5 | 14,004,000 | 14.5 | ||||||||
| 2013 |
618,631 | 8.6 | 10,952,000 | 11.3 | ||||||||
| 2014 |
718,465 | 10.0 | 11,499,000 | 11.9 | ||||||||
| 2015 |
413,254 | 5.7 | 5,783,000 | 6.0 | ||||||||
| 2016 |
492,170 | 6.8 | 3,269,000 | 3.4 | ||||||||
| 2017 |
219,069 | 3.0 | 4,600,000 | 4.8 | ||||||||
| 2018 |
284,658 | 3.9 | 3,409,000 | 3.5 | ||||||||
| 2019 |
409,773 | 5.7 | 3,884,000 | 4.0 | ||||||||
| Thereafter |
984,431 | 13.6 | 15,958,000 | 16.3 | ||||||||
| Total |
6,617,296 | sf | 91.7 | % | $ | 96,821,000 | 100.0 | % | ||||
| (1) | Calculated using annualized contractual base rent payable as of December 31, 2009 for the gross leasable area expiring, and excluding expenses payable by or reimbursable from tenants. |
The Office Properties
Four of the five Office Properties are located in the Washington, DC metropolitan area and contain an aggregate GLA of approximately 1,009,000 square feet, comprised of 922,000 and 87,000 square feet of office and retail space, respectively. The fifth Office Property is located in Tulsa, Oklahoma and contains GLA of 197,000 square feet. The Office Properties represent three distinct styles of facilities, are located in differing commercial environments with distinctive demographic characteristics, and are geographically removed from one another. As a consequence, management believes that the Washington, DC area office properties compete for tenants in different commercial and geographic sub-markets of the metropolitan Washington, DC market and do not compete with one another.
Management believes that the Washington, DC office market is one of the strongest and most stable leasing markets in the nation, with relatively low vacancy rates in comparison to other major metropolitan areas. Management believes that the long-term stability of this market is attributable to the status of Washington, DC as the nation’s capital and to the presence of the Federal government, international agencies, and an expanding private sector job market. 601 Pennsylvania Avenue is a nine-story, 227,000 square foot Class A office building (with a small amount of street level retail space) built in 1986 and located in a prime location in downtown Washington, DC. Van Ness Square is a six-story, 156,000 square foot office/retail building which was redeveloped in 1990 and is located in a highly developed commercial area of Northwest Washington, DC which offers extensive retail and restaurant amenities. Washington Square at Old Town is a 235,000 square foot Class A mixed-use office/retail complex completed in 2000 and located on a two-acre site along Alexandria’s main street, North Washington Street, in historic Old Town Alexandria, Virginia. Avenel Business Park is a 391,000 square foot research park located in the suburban Maryland, I-270 biotech corridor. The business park consists of twelve one-story buildings built in six phases, completed between 1981 and 2000.
Crosstown Business Center is a 197,000 square foot flex office/warehouse property located in Tulsa, Oklahoma. The property is located in close proximity to Tulsa’s international airport and major roadways and has attracted tenants requiring light industrial and distribution facilities.
26
Table of Contents
Lease Expirations of Office Properties
The following table sets forth, by year of expiration, the aggregate amount of base rent and leasable area for leases in place at the office properties that the Company owned as of December 31, 2009, for each of the 10 years beginning with 2010, assuming that none of the tenants exercise renewal options and excluding an aggregate of 114,009 square feet of unleased space, which represented 9.4% of the GLA of the office properties as of December 31, 2009.
| Lease Expirations of Office Properties | ||||||||||||
| Year of Lease Expiration |
Leasable Area Represented by Expiring Leases |
Percentage of Leasable Area Represented by Expiring Leases |
Annual Base Rent Under Expiring Leases (1) |
Percentage of Annual Base Rent Under Expiring Leases |
||||||||
| 2010 |
169,871 | sf | 14.1 | % | $ | 4,217,000 | 13.6 | % | ||||
| 2011 |
227,557 | 18.9 | 4,816,000 | 15.6 | ||||||||
| 2012 |
91,315 | 7.6 | 3,154,000 | 10.2 | ||||||||
| 2013 |
147,758 | 12.3 | 5,194,000 | 16.8 | ||||||||
| 2014 |
261,945 | 21.5 | 8,347,000 | 27.0 | ||||||||
| 2015 |
49,058 | 4.1 | 1,294,000 | 4.2 | ||||||||
| 2016 |
74,785 | 6.2 | 2,135,000 | 6.9 | ||||||||
| 2017 |
36,304 | 3.0 | 703,000 | 2.3 | ||||||||
| 2018 |
15,311 | 1.3 | 260,000 | 0.8 | ||||||||
| 2019 |
5,795 | 0.5 | 440,000 | 1.4 | ||||||||
| Thereafter |
12,145 | 1.0 | 398,000 | 1.2 | ||||||||
| Total |
1,091,844 | sf | 90.5 | % | $ | 30,958,000 | 100.0 | % | ||||
| (1) | Calculated using annualized contractual base rent payable as of December 31, 2009 for the gross leasable area expiring, and excluding expenses payable by or reimbursable from tenants. |
27
Table of Contents
Current Portfolio Properties
The following table sets forth, at the dates indicated, certain information regarding the Current Portfolio Properties:
Saul Centers, Inc.
Schedule of Current Portfolio Properties
December 31, 2009
| Property |
Location |
Leasable Area (Square Feet) |
Year Acquired or Developed (Renovated) |
Land Area (Acres) |
Percentage Leased |
Anchor/Significant Tenants | ||||||||||
| Dec-09 | Dec-08 | |||||||||||||||
| Shopping Centers |
||||||||||||||||
| Ashland Square Phase I |
Manassas, VA | 16,550 | 2007 | 2.0 | 100 | % | 100 | % | Chevy Chase Bank | |||||||
| Ashburn Village |
Ashburn, VA | 221,687 | 1994/00/01/02/06 | 26.4 | 95 | % | 91 | % | Giant Food, Ruby Tuesday, Hallmark Cards | |||||||
| Beacon Center |
Alexandria, VA | 356,115 | 1972(1993/99/07) | 32.3 | 100 | % | 100 | % | Lowe’s Home Improvement Center, Giant Food, Office Depot, Outback Steakhouse, Marshalls, Hancock Fabrics, Party Depot, Panera Bread, TGI Fridays, Starbucks, Famous Dave’s | |||||||
| Belvedere |
Baltimore, MD | 54,941 | 1972 | 4.8 | 36 | % | 36 | % | Family Dollar | |||||||
| BJ’s Wholesale Club |
Alexandria, VA | 115,660 | 2008 | 9.6 | 100 | % | 100 | % | BJ’s Wholesale Club | |||||||
| Boca Valley Plaza |
Boca Raton, FL | 121,269 | 2004 | 12.7 | 83 | % | 91 | % | Publix, Wachovia Bank | |||||||
| Boulevard |
Fairfax, VA | 49,140 | 1994(1999) | 5.0 | 100 | % | 93 | % | Panera Bread, Party City, Petco | |||||||
| Briggs Chaney MarketPlace |
Silvers Spring, MD | 194,347 | 2004 | 18.2 | 94 | % | 98 | % | Safeway, Ross Dress For Less, Chuck E Cheese, Family Dollar | |||||||
| Broadlands Village |
Ashburn, VA | 159,734 | 2003/4/6 | 24.0 | 90 | % | 89 | % | Safeway, The Original Steakhouse and Sports Theatre, Bonefish Grill, Starbucks | |||||||
| Countryside |
Sterling, VA | 141,696 | 2004 | 16.0 | 91 | % | 97 | % | Safeway, CVS Pharmacy, Starbucks | |||||||
| Cruse MarketPlace |
Cumming, GA | 78,686 | 2004 | 10.6 | 90 | % | 92 | % | Publix | |||||||
| Flagship Center |
Rockville, MD | 21,500 | 1972, 1989 | 0.5 | 100 | % | 100 | % | ||||||||
| French Market |
Oklahoma City, OK | 244,724 | 1974(1984/98) | 13.8 | 97 | % | 97 | % | Burlington Coat Factory, Bed Bath & Beyond, Staples, Famous Footwear, Lakeshore Learning Center, Alfred Angelo, Dollar Tree | |||||||
| Germantown |
Germantown, MD | 27,241 | 1992 | 2.7 | 86 | % | 90 | % | ||||||||
| Giant |
Baltimore, MD | 70,040 | 1972(1990) | 5.0 | 100 | % | 100 | % | Giant Food | |||||||
| The Glen |
Lake Ridge, VA | 134,317 | 1994(2005) | 14.7 | 88 | % | 91 | % | Safeway Marketplace, The Original Steakhouse and Sports Theatre, Panera Bread | |||||||
| Great Eastern |
District Heights, MD | 255,398 | 1972(1995) | 31.9 | 99 | % | 98 | % | Fresh World, Pep Boys, Big Lots, Capital Sports Complex | |||||||
| Great Falls Center |
Great Falls, VA | 91,666 | 2008 | 11.0 | 93 | % | 95 | % | Safeway, CVS Pharmacy | |||||||
| Hampshire Langley |
Takoma Park, MD | 131,700 | 1972(1979) | 9.9 | 100 | % | 100 | % | Expo E Mart, Radio Shack, Starbucks | |||||||
| Hunt Club Corners |
Apopka, FL | 101,522 | 2006 | 13.1 | 96 | % | 95 | % | Publix, Walgreens, Radio Shack, Hallmark | |||||||
| Jamestown Place |
Altamonte Springs, FL | 96,372 | 2005 | 10.9 | 89 | % | 92 | % | Publix, Carrabas Italian Grill | |||||||
| Kentlands Square |
Gaithersburg, MD | 114,381 | 2002 | 11.5 | 100 | % | 100 | % | Lowe’s Home Improvement Center, Chipotle | |||||||
| Kentlands Place |
Gaithersburg, MD | 40,648 | 2005 | 3.4 | 100 | % | 100 | % | Elizabeth Arden’s Red Door Salon, Bonefish Grill | |||||||
28
Table of Contents
Saul Centers, Inc.
Schedule of Current Portfolio Properties
December 31, 2009
| Property |
Location |
Leasable Area (Square Feet) |
Year Acquired or Developed (Renovated) |
Land Area (Acres) |
Percentage Leased |
Anchor/Significant Tenants | ||||||||||
| Dec-09 | Dec-08 | |||||||||||||||
| Shopping Centers (continued) |
||||||||||||||||
| Lansdowne Town Center |
Leesburg, VA | 189,355 | 2006 | 23.4 | 93 | % | 99 | % | Harris Teeter, CVS Pharmacy, Panera Bread, Not Your Average Joes, Starbucks | |||||||
| Leesburg Pike |
Baileys Crossroads, VA | 97,752 | 1966(1982/95) | 9.4 | 99 | % | 100 | % | CVS Pharmacy, Party Depot, FedEx Kinko’s, Radio Shack, Verizon Wireless | |||||||
| Lexington Pads |
Lexington, KY | 13,646 | 1974 | 4.1 | 100 | % | 100 | % | Applebees, Perkins Restaurant | |||||||
| Lumberton Plaza |
Lumberton, NJ | 193,044 | 1975(1992/96) | 23.3 | 94 | % | 98 | % | SuperFresh, Rite Aid, Virtua Health Center, Radio Shack, Family Dollar | |||||||
| Shops at Monocacy |
Frederick, MD | 109,144 | 2004 | 13.0 | 100 | % | 98 | % | Giant Food, Panera Bread, Starbucks | |||||||
| Northrock |
Warrenton, VA | 103,440 | 2009 | 15.4 | 67 | % | N/A | Harris Teeter, Longhorn Steakhouse, Ledo’s Pizza | ||||||||
| Olde Forte Village |
Ft. Washington, MD | 143,062 | 2003 | 16.0 | 89 | % | 95 | % | Safeway, Radio Shack | |||||||
| Olney |
Olney, MD | 53,765 | 1975(1990) | 3.7 | 100 | % | 100 | % | Rite Aid, Olney Grill | |||||||
| Orchard Park |
Dunwoody, GA | 87,782 | 2007 | 10.5 | 91 | % | 93 | % | Kroger, Starbucks | |||||||
| Palm Springs Center |
Altamonte Springs, FL | 126,446 | 2005 | 12.0 | 94 | % | 94 | % | Albertson’s, Office Depot, Mimi’s Cafe, Toojay’s Deli | |||||||
| Ravenwood |
Baltimore, MD | 93,328 | 1972(2006) | 8.0 | 87 | % | 96 | % | Giant Food, Starbucks | |||||||
| Seabreeze Plaza |
Palm Harbor, FL | 146,673 | 2005 | 18.4 | 95 | % | 100 | % | Publix, Palm Harbor Health Food, Petco, Planet Fitness | |||||||
| Marketplace at Sea Colony |
Bethany Beach, DE | 21,677 | 2008 | 5.1 | 91 | % | 100 | % | Seacoast Realty, Armand’s Pizza, Candy Kitchen | |||||||
| Seven Corners |
Falls Church, VA | 574,831 | 1973 (1994-7/07) | 31.6 | 100 | % | 100 | % | The Home Depot, Shoppers Food & Pharmacy, Syms, Michaels Arts & Crafts, Barnes & Noble, Ross Dress For Less, G Street Fabrics, Off-Broadway Shoes, The Room Store, Dress Barn, Starbucks, Dogfishhead Ale House | |||||||
| Shops at Fairfax |
Fairfax, VA | 68,743 | 1975(1993/99) | 6.7 | 98 | % | 100 | % | Super H Mart | |||||||
| Smallwood Village Center |
Waldorf, MD | 172,817 | 2006 | 25.1 | 76 | % | 77 | % | Safeway, CVS Pharmacy | |||||||
| Southdale |
Glen Burnie, MD | 484,115 | 1972(1986) | 39.6 | 91 | % | 99 | % | The Home Depot, Michaels Arts & Crafts, Marshalls, PetSmart, Value City Furniture, Athletic Warehouse, Starbucks, All Green Market | |||||||
| Southside Plaza |
Richmond, VA | 373,651 | 1972 | 32.8 | 86 | % | 91 | % | Farmers Foods, Maxway, Citi Trends, City of Richmond | |||||||
| South Dekalb Plaza |
Atlanta, GA | 163,418 | 1976 | 14.6 | 89 | % | 65 | % | Maxway, Big Lots, Emory Clinic | |||||||
| Thruway |
Winston-Salem, NC | 361,388 | 1972(1997) | 30.5 | 97 | % | 96 | % | Harris Teeter, Borders Books, Bed Bath & Beyond, Stein Mart, Talbots, Hanes Brands, JoS. A Banks, Bonefish Grill, Chico’s, Ann Taylor Loft, Coldwater Creek, Rite Aid, Kinkos/FedEx, New Balance, Aveda Salon, Christies Hallmark | |||||||
| Village Center |
Centreville, VA | 143,109 | 1990 | 17.2 | 93 | % | 90 | % | Giant Food, Tuesday Morning, Starbucks | |||||||
| West Park |
Oklahoma City, OK | 76,610 | 1975 | 11.2 | 19 | % | 19 | % | Family Dollar | |||||||
| Westview Village |
Frederick, MD | 100,997 | 2009 | 10.4 | 24 | % | NA | Mimi’s Cafe, Sleepy’s, WOW Wingery, Firehouse Subs | ||||||||
| White Oak |
Silver Spring, MD | 480,156 | 1972(1993) | 28.5 | 99 | % | 99 | % | Giant Food, Sears, Walgreens, Radio Shack, Boston Market | |||||||
| Total Shopping Centers |
7,218,283 | 700.5 | 91.7 | % | 93.9 | % | ||||||||||
29
Table of Contents
Saul Centers, Inc.
Schedule of Current Portfolio Properties
December 31, 2009
| Property |
Location |
Leasable Area (Square Feet) |
Year Acquired or Developed (Renovated) |
Land Area (Acres) |
Percentage Leased | Anchor/Significant Tenants | ||||||||||
| Dec-09 | Dec-08 | |||||||||||||||
| Office Properties |
||||||||||||||||
| Avenel Business Park |
Gaithersburg, MD | 390,579 | 1981-2000 | 37.1 | 87 | % | 94 | % | General Services Administration, VIRxSYS, Broadsoft, Quanta Systems, SeraCare Life Sciences | |||||||
| Crosstown Business Center |
Tulsa, OK | 197,135 | 1975(2000) | 22.4 | 78 | % | 93 | % | Compass Group, Roxtec, Keystone Automotive, Freedom Express | |||||||
| 601 Pennsylvania Ave. |
Washington, DC | 226,604 | 1973(1986) | 1.0 | 100 | % | 100 | % | National Gallery of Art, American Assn. of Health Plans, Credit Union National Assn., Southern Company, HQ Global, Freedom Forum, Pharmaceutical Care Management Assn., Capital Grille | |||||||
| Van Ness Square |
Washington, DC | 156,493 | 1973(1990) | 1.2 | 91 | % | 92 | % | Team Video Intl, Office Depot, Pier 1 | |||||||
| Washington Square |
Alexandria, VA | 235,042 | 1975(2000) | 2.0 | 97 | % | 99 | % | Vanderweil Engineering, Agentrics, EarthTech, Thales, Cooper Carry, Bank of America, Trader Joe’s, Fed Ex/Kinko’s, Talbots | |||||||
| Total Office Properties | 1,205,853 | 63.7 | 90.5 | % | 95.8 | % | ||||||||||
| Total Portfolio | 8,424,136 | 764.2 | 91.5 | % | 94.2 | % | ||||||||||
| Land and Development Parcels |
||||||||||||||||
| Clarendon Center |
Arlington, VA | 2002 | 1.9 | Under construction with substantial completion projected for late 2010. | ||||||||||||
| Ashland Square Phase II |
Manassas, VA | 2004 | 17.3 | Marketing to grocers and other retail businesses, with a development timetable yet to be finalized. | ||||||||||||
| Lexington Center |
Lexington, KY | 1974 | 26.0 | Former mall is vacant and the Company has prepared conceptual designs for a shopping center development and is marketing the site to prospective retailers. | ||||||||||||
| New Market |
New Market, MD | 2005 | 35.5 | Parcel will accommodate retail development in excess of 120,000 SF near I-70, east of Frederick, Maryland. A development timetable has not been determined. | ||||||||||||
| Total Development Properties | 80.7 | |||||||||||||||
30
Table of Contents
| Item 3. | Legal Proceedings |
In the normal course of business, the Company is involved in litigation, including litigation arising out of the collection of rents, the enforcement or defense of the priority of its security interests, and the continued development and marketing of certain of its real estate properties. In the opinion of management, litigation that is currently pending should not have a material adverse impact on the financial condition or future operations of the Company.
| Item 4. | Reserved |
| Item 5. | Market for Registrant’s Common Equity, Related Stockholder Matters and Issuer Purchases of Equity Securities |
Market Information
Shares of Saul Centers common stock are listed on the New York Stock Exchange under the symbol “BFS”. The composite high and low closing sale prices for the shares of common stock were reported by the New York Stock Exchange for each quarter of 2009 and 2008 as follows:
| Share Price | ||||||
| Period |
High | Low | ||||
| October 1, 2009 – December 31, 2009 |
$ | 33.32 | $ | 28.98 | ||
| July 1, 2009 – September 30, 2009 |
$ | 34.25 | $ | 28.29 | ||
| April 1, 2009 – June 30, 2009 |
$ | 33.00 | $ | 23.16 | ||
| January 1, 2009 – March 31, 2009 |
$ | 39.05 | $ | 20.23 | ||
| October 1, 2008 – December 31, 2008 |
$ | 48.94 | $ | 24.67 | ||
| July 1, 2008 – September 30, 2008 |
$ | 51.39 | $ | 44.14 | ||
| April 1, 2008 – June 30, 2008 |
$ | 54.56 | $ | 46.81 | ||
| January 1, 2008 – March 31, 2008 |
$ | 55.41 | $ | 45.06 | ||
On March 12, 2010, the closing price was $38.87 per share.
Holders
The approximate number of holders of record of the common stock was 300 as of March 12, 2010.
31
Table of Contents
Dividends and Distributions
Under the Code, REITs are subject to numerous organizational and operating requirements, including the requirement to distribute at least 90% of REIT taxable income. The Company distributed amounts greater than the required amount in 2009 and 2008. Distributions by the Company to common stockholders and holders of limited partnership units in the Operating Partnership were $35,645,000 in 2009 and $43,633,000 in 2008. Distributions to preferred stockholders were $15,140,000 in 2009 and $11,668,000 in 2008. See Notes to Consolidated Financial Statements, No. 14, “Distributions.” The Company may or may not elect to distribute in excess of 90% of REIT taxable income in future years.
The Company’s estimate of cash flow available for distributions is believed to be based on reasonable assumptions and represents a reasonable basis for setting distributions. However, the actual results of operations of the Company will be affected by a variety of factors, including but not limited to actual rental revenue, operating expenses of the Company, interest expense, general economic conditions, federal, state and local taxes (if any), unanticipated capital expenditures, the adequacy of reserves and preferred dividends. While the Company intends to continue paying regular quarterly distributions, any future payments will be determined solely by the Board of Directors and will depend on a number of factors, including cash flow of the Company, its financial condition and capital requirements, the annual distribution amounts required to maintain its status as a REIT under the Code, and such other factors as the Board of Directors deems relevant. We are obligated to pay regular quarterly distributions to holders of depositary shares of Series A preferred stock at the rate of $2.00 per annum per depositary share and to holders of depositary shares of Series B preferred stock at the rate of $2.25 per annum per depositary share, prior to distributions on the common stock.
The Company paid four quarterly distributions totaling $1.53, $1.88 and $1.77, per common share during the years ended December 31, 2009, 2008 and 2007, respectively. The annual distribution amounts paid by the Company exceed the distribution amounts required for tax purposes. Distributions to the extent of our current and accumulated earnings and profits for federal income tax purposes generally will be taxable to a stockholder as ordinary dividend income. Distributions in excess of current and accumulated earnings and profits will be treated as a nontaxable reduction of the stockholder’s basis in such stockholder’s shares, to the extent thereof, and thereafter as taxable gain. Distributions that are treated as a reduction of the stockholder’s basis in its shares will have the effect of deferring taxation until the sale of the stockholder’s shares. The Company has determined that 100% of the total $1.53 per common share dividend paid in 2009 represents currently taxable dividend income to the stockholders. For the $1.88 per common share dividend paid in 2008, 98.0% was taxable dividend income and 2.0% was considered return of capital. The Company has determined that 100% of the total $1.77 per common share dividend paid in 2007 represents currently taxable dividend income to the stockholders. No assurance can be given regarding what portion, if any, of distributions in 2010 or subsequent years will constitute a return of capital for federal income tax purposes. All of the preferred stock dividends paid are considered ordinary dividend income.
Acquisition of Equity Securities by The Saul Organization
Through participation in the Company’s Dividend Reinvestment Plan, B. Francis Saul II, the Company’s Chairman of the Board and Chief Executive Officer, his spouse and B. F. Saul Real Estate Investment Trust and B.F. Saul Company, for each of which Mr. Saul II is either President or Chairman; B.F. Saul Property Company, Avenel Executive Park Phase II, LLC and Dearborn, L.L.C., which are wholly-owned subsidiaries of B. F. Saul Company and B. F. Saul Real Estate Investment Trust, respectively, acquired an aggregate of 108,391 shares of common stock at an average price of $29.96 per share, for the October 30, 2009 dividend distribution.
32
Table of Contents
Performance Graph
Rules promulgated under the Exchange Act require the Company to present a graph comparing the cumulative total stockholder return on its Common Stock with the cumulative total stockholder return of (i) a broad equity market index, and (ii) a published industry index or peer group. The graph compares the cumulative total stockholder return of the Company’s Common Stock, based on the market price of the Common Stock and assuming reinvestment of dividends, with the National Association of Real Estate Investment Trust Equity Index (“NAREIT Equity”), the S&P 500 Index (“S&P 500”) and the Russell 2000 Index (“Russell 2000”). The graph assumes the investment of $100 on January 1, 2005.
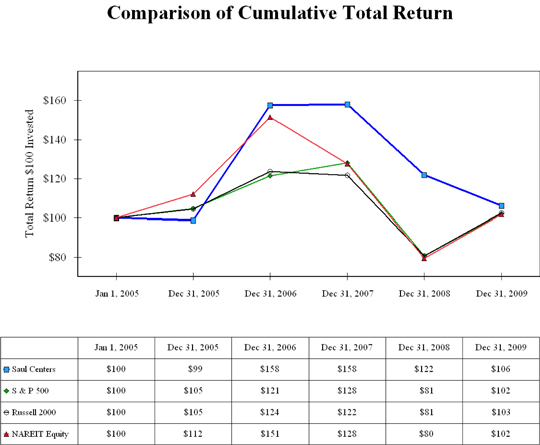
| Item 6. | Selected Financial Data |
The selected financial data of the Company contained herein has been derived from the consolidated financial statements of the Company. The data should be read in conjunction with “Item 7. Management’s Discussion and Analysis of Financial Condition and Results of Operations” and the Consolidated Financial Statements included elsewhere in this report.
33
Table of Contents
Saul Centers, Inc.
(In thousands, except per share data)
| Years Ended December 31, | ||||||||||||||||||||
| 2009 | 2008 | 2007 | 2006 | 2005 | ||||||||||||||||
| Operating Data: |
||||||||||||||||||||
| Total revenue |
$ | 161,113 | $ | 160,345 | $ | 150,585 | $ | 137,978 | $ | 127,015 | ||||||||||
| Operating expenses |
116,002 | 113,980 | 105,203 | 97,505 | 89,990 | |||||||||||||||
| Operating income |
45,111 | 46,365 | 45,382 | 40,473 | 37,025 | |||||||||||||||
| Non-operating items |
||||||||||||||||||||
| Loss on early extinguishment of debt |
(2,210 | ) | — | — | — | — | ||||||||||||||
| Gain on property dispositions |
329 | 1,301 | 139 | — | — | |||||||||||||||
| Net income |
43,230 | 47,666 | 45,521 | 40,473 | 37,025 | |||||||||||||||
| Income attributable to the noncontrolling interest |
(6,517 | ) | (7,972 | ) | (8,818 | ) | (7,793 | ) | (7,798 | ) | ||||||||||
| Net income attributable to Saul Centers, Inc. |
36,713 | 39,694 | 36,703 | 32,680 | 29,227 | |||||||||||||||
| Preferred dividends |
(15,140 | ) | (13,453 | ) | (8,000 | ) | (8,000 | ) | (8,000 | ) | ||||||||||
| Net income available to common stockholders |
$ | 21,573 | $ | 26,241 | $ | 28,703 | $ | 24,680 | $ | 21,227 | ||||||||||
| Per Share Data (diluted): |
||||||||||||||||||||
| Net income available to common stockholders |
$ | 1.20 | $ | 1.46 | $ | 1.62 | $ | 1.43 | $ | 1.27 | ||||||||||
| Basic and Diluted Shares Outstanding |
||||||||||||||||||||
| Weighted average common shares - basic |
17,904 | 17,816 | 17,589 | 17,075 | 16,663 | |||||||||||||||
| Effect of dilutive options |
39 | 145 | 180 | 158 | 107 | |||||||||||||||
| Weighted average common shares - diluted |
17,943 | 17,961 | 17,769 | 17,233 | 16,770 | |||||||||||||||
| Weighted average convertible limited partnership units |
5,416 | 5,416 | 5,416 | 5,395 | 5,233 | |||||||||||||||
| Weighted average common shares and fully converted limited partnership units - diluted |
23,359 | 23,377 | 23,185 | 22,628 | 22,003 | |||||||||||||||
| Dividends Paid: |
||||||||||||||||||||
| Cash dividends to common stockholders (1) |
$ | 27,358 | $ | 33,450 | $ | 31,026 | $ | 28,579 | $ | 26,542 | ||||||||||
| Cash dividends per share |
$ | 1.53 | $ | 1.88 | $ | 1.77 | $ | 1.68 | $ | 1.60 | ||||||||||
| Balance Sheet Data: |
||||||||||||||||||||
| Real estate investments |
$ | 834,914 | $ | 774,718 | $ | 657,258 | $ | 627,651 | $ | 567,417 | ||||||||||
| Total assets |
925,574 | 853,873 | 727,443 | 700,537 | 631,469 | |||||||||||||||
| Total debt, including accrued interest |
639,405 | 570,184 | 535,319 | 525,125 | 484,902 | |||||||||||||||
| Preferred stock |
179,328 | 179,328 | 100,000 | 100,000 | 100,000 | |||||||||||||||
| Total stockholders’ equity |
226,063 | 227,887 | 153,524 | 137,876 | 114,482 | |||||||||||||||
| Other Data |
||||||||||||||||||||
| Cash flow provided by ( used in ) : |
||||||||||||||||||||
| Operating activities |
$ | 69,025 | $ | 73,101 | $ | 71,197 | $ | 62,174 | $ | 58,674 | ||||||||||
| Investing activities |
$ | (80,469 | ) | $ | (115,070 | ) | $ | (52,036 | ) | $ | (65,699 | ) | $ | (73,805 | ) | |||||
| Financing activities |
$ | 19,045 | $ | 49,210 | $ | (21,457 | ) | $ | 3,579 | $ | (10,423 | ) | ||||||||
| Funds from operations (2) |
||||||||||||||||||||
| Net income |
$ | 43,230 | $ | 47,666 | $ | 45,521 | $ | 40,473 | $ | 37,025 | ||||||||||
| Real estate depreciation and amortization |
28,264 | 29,783 | 26,464 | 25,648 | 24,197 | |||||||||||||||
| Gain on property dispositions |
(329 | ) | (1,301 | ) | (139 | ) | — | — | ||||||||||||
| Funds from operations |
71,165 | 76,148 | 71,846 | 66,121 | 61,222 | |||||||||||||||
| Preferred dividends |
(15,140 | ) | (13,453 | ) | (8,000 | ) | (8,000 | ) | (8,000 | ) | ||||||||||
| Funds from operations available to common shareholders |
$ | 56,025 | $ | 62,695 | $ | 63,846 | $ | 58,121 | $ | 53,222 | ||||||||||
| (1) | For the years 2009, 2008, 2007, 2006 and 2005, shareholders reinvested $4,137, $3,941, $18,725, $14,842 and $15,330, respectively, in newly issued common stock by operation of the Company’s dividend reinvestment plan. |
| (2) | Funds from operations (FFO) is a non-GAAP financial measure. For a definition of FFO, see “Item 7. Management’s Discussion and Analysis of Financial Condition and Results of Operations-Funds From Operations.” |
34
Table of Contents
| Item 7. | Management’s Discussion and Analysis of Financial Condition and Results of Operations |
Management’s Discussion and Analysis of Financial Condition and Results of Operations (MD&A) begins with the Company’s primary business strategy to give the reader an overview of the goals of the Company’s business. This is followed by a discussion of the critical accounting policies that the Company believes are important to understanding the assumptions and judgments incorporated in the Company’s reported financial results. The next section, beginning on page 41, discusses the Company’s results of operations for the past two years. Beginning on page 45, the Company provides an analysis of its liquidity and capital resources, including discussions of its cash flows, debt arrangements, sources of capital and financial commitments. Finally, on page 56, the Company discusses funds from operations, or FFO, which is a relative non-GAAP financial measure of performance of an equity REIT used by the REIT industry.
The MD&A should be read in conjunction with the other sections of this Annual Report on Form 10-K, including the consolidated financial statements and notes thereto appearing in Item 8 of this report. Historical results set forth in Selected Financial Information, the Consolidated Financial Statements and Supplemental Data included in Item 6 and Item 8 and this section should not be taken as indicative of the Company’s future operations.
Overview
The Company’s principal business activity is the ownership, management and development of income-producing properties. The Company’s long-term objectives are to increase cash flow from operations and to maximize capital appreciation of its real estate investments.
The Company’s primary operating strategy is to focus on its community and neighborhood shopping center business and to operate its properties to achieve both cash flow growth and capital appreciation. Management believes there is potential for growth in cash flow as existing leases for space in the Shopping Centers expire and are renewed, or newly available or vacant space is leased. The Company intends to renegotiate leases where possible and seek new tenants for available space in order to maximize this potential for increased cash flow. As leases expire, management expects to revise rental rates, lease terms and conditions, relocate existing tenants, reconfigure tenant spaces and introduce new tenants with the goal of increasing cash flow. In those circumstances in which leases are not otherwise expiring, management selectively attempts to increase cash flow through a variety of means, or in connection with renovations or relocations, recapturing leases with below market rents and re-leasing at market rates, as well as replacing financially troubled tenants. When possible, management also will seek to include scheduled increases in base rent, as well as percentage rental provisions, in its leases.
The Company’s redevelopment and renovation objective is to selectively and opportunistically redevelop and renovate its properties, by replacing leases with below market rents with strong, traffic-generating anchor stores such as supermarkets and drug stores, as well as other desirable local, regional and national tenants. The Company’s strategy remains focused on continuing the operating performance and internal growth of its existing Shopping Centers, while enhancing this growth with selective retail redevelopments and renovations.
In light of the limited amount of quality properties for sale that the Company has been presented with or inquired about over the past year, management believes acquisition and development opportunities for investment in existing and new shopping center and office properties in the near future is uncertain. However, because of its conservative capital structure, including its undrawn credit line and cash balances, management believes that the Company is positioned to take advantage of investment opportunities when market conditions change. It is management’s view that several of the sub-markets in which the Company operates have attractive supply/demand characteristics. The Company will continue to evaluate acquisition, development and redevelopment as an integral part of its overall business plan.
Although there has been a downturn in the national real estate market, to date, the effects on the office and retail markets in the metropolitan Washington, D.C. area, where the majority of the Company’s properties are located, have been less severe. However, continued deterioration in the local economies where the Company’s properties are located may lead to increased tenant bankruptcies, increased vacancies and decreased rental rates.
35
Table of Contents
With a severe decline in overall consumer spending, retailers continue to struggle with declining sales and limited access to capital. Vacancies have increased from a year ago. Our overall portfolio leasing percentage, on a comparative same center basis, ended the year at 92.7%, a decrease from 94.1% at year end 2008, a space leased reduction of approximately 130,000 square feet. Five properties, three shopping centers and two office properties, caused the decline in leased space. The Shopping Center Properties: (1) Southdale decreased by 42,000 SF resulting primarily from the big box retailer Circuit City terminating its business; (2) Southside Plaza decreased by 19,000 SF resulting from several businesses which chose not to renew their leases; and (3) Lansdowne Town Center which decreased by 11,000 SF when a fitness center and two small shop tenants ceased rent payments and vacated their spaces prior to lease expiration. Office Properties: (1) Crosstown Business Park decreased by 31,000 SF resulting from two tenants choosing not to renew their leases; and (2) Avenel Business Park, which decreased by 26,000 SF when a 15,000 SF life science tenant lost its financial support and several other small tenants ceased rent payments and vacated their spaces prior to lease expiration.
The Company’s tenants have been further impacted by winter weather, as heavy snowfall in the Mid-Atlantic states during the retail holiday season in late December 2009 hindered the ability of customers to shop. Additionally, the costs of removing the snow from the shopping centers and office buildings approached $1 million. Approximately 70% of the costs are historically billable to tenants, which could further strain their ability to operate profitably. Compounding the costs of the December storm were two major storms impacting the Mid-Atlantic region during February 2010. It is estimated the costs of removing snow from the February storms may be triple the amount of the December 2009 storm.
In addition, because of the Company’s conservative capital structure, the Company has not been significantly affected by the recent turmoil in the credit markets. First, the Company maintains a ratio of total debt to total assets value of under 50%, which allows the Company to obtain additional secured borrowings if necessary. Second, as of December 31, 2009, amortizing fixed-rate mortgage debt represented approximately 90% of the Company’s notes payable, thus minimizing refinancing risk. Third, the Company’s earliest fixed-rate debt maturity is not until October 2012. The Company’s two construction loans for Northrock and Clarendon Center may be extended, under certain conditions, until May 2013. Finally, as of December 31, 2009, the Company has loan availability of more than $149,000,000 under its $150,000,000 unsecured revolving line of credit.
Although it is management’s present intention to concentrate future acquisition and development activities on community and neighborhood shopping centers and office properties in the Washington, DC/Baltimore metropolitan area and the southeastern region of the United States, the Company may, in the future, also acquire other types of real estate in other areas of the country as opportunities present themselves. While the Company may diversify in terms of property locations, size and market, the Company does not set any limit on the amount or percentage of Company assets that may be invested in any one property or any one geographic area. In addition to investing in properties in the Washington, DC/Baltimore metropolitan area, from 2007 through 2009, the Company also acquired a grocery-anchored neighborhood shopping center in Georgia totaling 88,000 square feet.
Critical Accounting Policies
The Company’s accounting policies are in conformity with U.S. generally accepted accounting principles (“GAAP”). The preparation of financial statements in conformity with GAAP requires management to use judgment in the application of accounting policies, including making estimates and assumptions. These judgments affect the reported amounts of assets and liabilities and disclosure of contingent assets and liabilities at the dates of the Company’s financial statements and the reported amounts of revenue and expenses during the reporting periods. If judgment or interpretation of the facts and circumstances relating to various transactions had been different, it is possible that different accounting policies would have been applied resulting in a different presentation of the financial statements. Below is a discussion of accounting policies which the Company considers critical in that they
36
Table of Contents
may require judgment in their application or require estimates about matters which are inherently uncertain. Additional discussion of accounting policies which the Company considers significant, including further discussion of the critical accounting policies described below, can be found in the notes to the Consolidated Financial Statements.
Real Estate Investments
Real estate investment properties are stated at historic cost less depreciation. The Company intends to own its real estate investment properties over a long term. No real estate investment properties have been sold since the Company’s formation in 1993. Management believes that these assets have generally appreciated in value since their acquisition or development and, accordingly, the aggregate current value exceeds their aggregate net book value and also exceeds the value of the Company’s liabilities as reported in these financial statements. Because these financial statements are prepared in conformity with U.S. GAAP, they do not report the current value of the Company’s real estate investment properties.
The Company purchases real estate investment properties from time to time and allocates the purchase price to various components, such as land, buildings, and intangibles related to in-place leases and customer relationships. The purchase price is allocated based on the relative fair value of each component. The fair value of buildings is determined as if the buildings were vacant upon acquisition and subsequently leased at market rental rates. As such, the determination of fair value considers the present value of all cash flows expected to be generated from the property including an initial lease up period. The Company determines the fair value of above and below market intangibles associated with in-place leases by assessing the net effective rent and remaining term of the lease relative to market terms for similar leases at acquisition. In the case of above and below market leases, the Company considers the remaining contractual lease period and renewal periods, taking into consideration the likelihood of the tenant exercising its renewal options. The fair value of a below market lease component is recorded as deferred income and amortized as additional lease revenue over the remaining contractual lease period and any renewal option periods included in the valuation analysis. The fair value of above market lease intangibles is recorded as a deferred asset and is amortized as a reduction of lease revenue over the remaining contractual lease term. The Company determines the fair value of at-market in-place leases considering the cost of acquiring similar leases, the foregone rents associated with the lease-up period and carrying costs associated with the lease-up period. Intangible assets associated with at-market in-place leases are amortized as additional expense over the remaining contractual lease term. To the extent customer relationship intangibles are present in an acquisition, the fair value of the intangibles are amortized over the life of the customer relationship.
If there is an event or change in circumstance that indicates an impairment in the value of a real estate investment property, the Company prepares an impairment analysis to assess the carrying value of the real estate investment property relative to its estimated fair value. The Company considers both quantitative and qualitative factors in identifying impairment indicators including recurring operating losses, significant decreases in occupancy, and significant adverse changes in legal factors and business climate. If impairment indicators are present, the Company performs a comparison of the projected cash flows of the property over its remaining useful life, on an undiscounted basis, to the carrying value of that property. The Company assesses its undiscounted projected cash flows based upon estimated capitalization rates, historic operating results and market conditions that may affect the property. If such carrying value is greater than the undiscounted projected cash flows, the Company would recognize an impairment loss equivalent to an amount required to adjust the carrying amount to its then estimated fair market value. The value of any property is sensitive to the actual results of any of the aforementioned estimated factors, either individually or taken as a whole. Should the actual results differ from management’s projections, the valuation could be negatively or positively affected.
When incurred, the Company capitalizes the cost of improvements that extend the useful life of property and equipment. All repair and maintenance expenditures are expensed when incurred. In addition, we capitalize leasehold improvements when certain criteria are met, including when we supervise construction and will own the improvement. Tenant improvements we own are depreciated over the life of the respective lease or the estimated useful life of the improvements, whichever is shorter.
37
Table of Contents
Interest, real estate taxes, development-related salary costs and other carrying costs are capitalized on projects under construction. Once construction is substantially complete and the assets are placed in service, rental income, direct operating expenses, and depreciation associated with such properties are included in current operations. In the initial rental operations of development projects, a project is considered substantially complete and available for occupancy upon completion of tenant improvements, but no later than one year from the cessation of major construction activity. Substantially completed portions of a project are accounted for as separate projects. Depreciation is calculated using the straight-line method and estimated useful lives of 35 to 50 years for base buildings and up to 20 years for certain other improvements.
Deferred Leasing Costs
Certain initial direct costs incurred by the Company in negotiating and consummating successful leases are capitalized and amortized over the initial base term of the leases. Deferred leasing costs consist of commissions paid to third-party leasing agents as well as internal direct costs such as employee compensation and payroll-related fringe benefits directly related to time spent performing successful leasing-related activities. Such activities include evaluating prospective tenants’ financial condition, evaluating and recording guarantees, collateral and other security arrangements, negotiating lease terms, preparing lease documents and closing transactions. In addition, deferred leasing costs include amounts attributed to in-place leases associated with acquisition properties.
Revenue Recognition
Rental and interest income is accrued as earned except when doubt exists as to collectability, in which case the accrual is discontinued. Recognition of rental income commences when control of the space has been given to the tenant. When rental payments due under leases vary from a straight-line basis because of free rent periods or scheduled rent increases, income is recognized on a straight-line basis throughout the initial term of the lease. Expense recoveries represent a portion of property operating expenses billed to tenants, including common area maintenance, real estate taxes and other recoverable costs. Expense recoveries are recognized in the period when the expenses are incurred. Rental income based on a tenant’s revenue, known as percentage rent, is accrued when a tenant reports sales that exceed a specified breakpoint specified in the lease agreement.
Allowance for Doubtful Accounts—Current and Deferred Receivables
Accounts receivable primarily represent amounts accrued and unpaid from tenants in accordance with the terms of the respective leases, subject to the Company’s revenue recognition policy. Receivables are reviewed monthly and reserves are established with a charge to current period operations when, in the opinion of management, collection of the receivable is doubtful. In addition to rents due currently, accounts receivable include amounts representing minimum rental income accrued on a straight-line basis to be paid by tenants over the remaining term of their respective leases. Reserves are established with a charge to income for tenants whose rent payment history or financial condition casts doubt upon the tenant’s ability to perform under its lease obligations.
Legal Contingencies
The Company is subject to various legal proceedings and claims that arise in the ordinary course of business. These matters are generally covered by insurance. While the resolution of these matters cannot be predicted with certainty, the Company believes the final outcome of such matters will not have a material adverse effect on its financial position or the results of operations. Once it has been determined that a loss is probable to occur, the estimated amount of the loss is recorded in the financial statements. Both the amount of the loss and the point at which its occurrence is considered probable can be difficult to determine.
38
Table of Contents
Results of Operations
Revenue
| For the year ended December 31, | Percentage Change | ||||||||||||||
| (Dollars in thousands) | 2009 | 2008 | 2007 | 2009 to 2008 |
2008 to 2007 |
||||||||||
| Base rent |
$ | 125,845 | $ | 124,999 | $ | 118,806 | 0.7 | % | 5.2 | % | |||||
| Expense recoveries |
29,462 | 29,066 | 26,090 | 1.4 | % | 11.4 | % | ||||||||
| Percentage rent |
1,326 | 1,509 | 1,497 | -12.1 | % | 0.8 | % | ||||||||
| Other |
4,480 | 4,771 | 4,192 | -6.1 | % | 13.8 | % | ||||||||
| Total revenue |
$ | 161,113 | $ | 160,345 | $ | 150,585 | 0.5 | % | 6.5 | % | |||||
Note: (Dollars in thousands)
Base rent includes $1,303, $753 and $1,672, for the years 2009, 2008 and 2007, respectively, to recognize base rent on a straight-line basis. In addition, base rent includes $1,249, $1,445 and $472, for the years 2009, 2008 and 2007, respectively, to recognize income from the amortization of in-place leases.
Total revenue increased 0.5% in 2009 compared to 2008. The revenue increase for the 2009 Period resulted from the operations of the Development Properties (Northrock and Westview Village) and three 2008 acquisition properties (Great Falls Center, BJ’s Wholesale Club and Marketplace at Sea Colony), together defined as the “2009/2008 Development and Acquisition Properties,” (approximately $2,355,000), offset in part by declining revenues from the “Core Properties” (properties which were in operation for the entirety of both periods) due to decreased occupancy levels and the resulting loss of base rent (approximately $957,000) and reduced interest income on invested cash balances (approximately $582,000).
Total revenue increased 6.5% in 2008 compared to 2007 primarily due to (1) the contribution of operating revenue from three operating properties acquired during 2008 (Great Falls Center, BJ’s Wholesale Club and Marketplace at Sea Colony), (2) an operating property acquired July 2007 (Orchard Park) and (3) a development property (Ashland Square Phase I) placed in service during the fourth quarter of 2007, together defined as the “2008/2007 Development and Acquisition Properties,” whose operating results are included in 2008’s operating income but not fully in the previous year’s results. The 2008/2007 Development and Acquisition Properties contributed $4,943,000, or 50.6%, of the increase in revenue. Also contributing to the 2008 revenue increase was a revenue increase of $1,575,000, or 16.1%, from the stabilization of Lansdowne Town Center. The balance of 2008’s revenue growth resulted from rental rate growth, increased parking revenue and increased lease termination fees in the remainder of the Company’s Core Properties. A discussion of the components of revenue follows.
Base rent
The $846,000 increase in base rent in 2009 over 2008 was primarily attributable to leases in effect at the 2009/2008 Development and Acquisition Properties (approximately $1,931,000) which was offset by base rent decline (approximately $1,085,000) throughout the Core Properties in 2009 from 2008 due to increased vacancy attributable to the challenging market conditions, particularly an anchor space vacant at Seven Corners in Falls Church, Virginia, during the first half of 2009 and small shop vacancies at two Loudoun County shopping centers, Broadlands Village and Lansdowne Town Center.
39
Table of Contents
The $6,193,000 increase in base rent in 2008 from 2007 was primarily attributable (68.8% or approximately $4,258,000) to leases in effect at the 2008/2007 Development and Acquisition Properties and the stabilization of Lansdowne Town Center (18.1% or approximately $1,123,000). The balance of the increase was provided by rental rate growth in the Core Properties, particularly Southdale, Seven Corners and Leesburg Pike shopping centers, offset in part by base rent decreases at Broadlands Village, South Dekalb Plaza and Ashburn Village resulting from tenant vacancies.
Expense recoveries
Expense recoveries represent a portion of property operating expenses billable to tenants, including common area maintenance, real estate taxes and other recoverable costs. The operation of the 2009/2008 Development and Acquisition Properties contributed the majority of the $396,000 increase in expense recovery income in 2009 compared to 2008 (90.7% or approximately $359,000).
The $2,976,000 increase in expense recovery income in 2008 compared to 2007 resulted primarily from billings to tenants for their share of increased real estate tax expense in the Core Properties (58.0% or approximately $1,727,000). The operation of the 2008/2007 Development and Acquisition Properties (21.5% or approximately $639,000) and property operating expenses (20.5% or approximately $610,000) throughout the Core Properties accounted the balance of the increase.
Percentage rent
Percentage rent is rental revenue calculated on the portion of a tenant’s sales revenue that exceeds a specified breakpoint. Percentage rent decreased $183,000 in 2009 from 2008 primarily as a result of timing differences in the receipt of sales reports used to calculate percentage rent from two retail tenants (82.0% or approximately $150,000).
Other revenue
Other revenue consists primarily of parking revenue at three of the Office Properties, temporary lease rental revenue, payments associated with early termination of leases and interest income from the investment of cash balances. Other revenue decreased $291,000 in 2009 from 2008 as a result of decreased interest income from short-term investments (approximately $582,000) offset in part by increased parking revenue in the office portfolio (approximately $278,000).
The increase in other revenue for 2008 compared to 2007 resulted primarily from increased parking revenue primarily at 601 Pennsylvania Avenue (38.2% or approximately $221,000), increased lease termination fees (29.7% or approximately $172,000), and interest income resulting from the investment of increased cash balances (23.7% or approximately $137,000).
40
Table of Contents
Operating expenses
| Percentage Change | |||||||||||||||
| For the year ended December 31, | 2009 to | 2008 to | |||||||||||||
| (Dollars in thousands) | 2009 | 2008 | 2007 | 2008 | 2007 | ||||||||||
| Property operating expenses |
$ | 21,408 | $ | 19,877 | $ | 18,758 | 7.7 | % | 6.0 | % | |||||
| Provision for credit losses |
919 | 1,113 | 376 | -17.4 | % | 196.0 | % | ||||||||
| Real estate taxes |
17,766 | 16,608 | 14,084 | 7.0 | % | 17.9 | % | ||||||||
| Interest expense and amortization of deferred debt |
34,689 | 34,278 | 33,855 | 1.2 | % | 1.2 | % | ||||||||
| Depreciation and amortization |
28,264 | 29,783 | 26,464 | -5.1 | % | 12.5 | % | ||||||||
| General and administrative |
12,956 | 12,321 | 11,666 | 5.2 | % | 5.6 | % | ||||||||
| Total operating expenses |
$ | 116,002 | $ | 113,980 | $ | 105,203 | 1.8 | % | 8.3 | % | |||||
Property operating expenses
Property operating expenses consist primarily of repairs and maintenance, utilities, payroll, insurance and other property related expenses. The largest single item contributing to the $1,531,000 increase in 2009 property operating expenses compared to the 2008 year was snow removal expense (88.0% or approximately $1,347,000) resulting primarily from a heavy snowfall in the Mid-Atlantic states during the December 2009 retail holiday season.
The largest single item contributing to the $1,119,000 increase in 2008 property operating expenses compared to the 2007 year was utility expense in the Core Properties (41.4% or approximately $463,000), a 10.8% increase over the prior year’s amount. The operation of the 2008/2007 Development and Acquisition Properties contributed 32.3% or approximately $361,000. The balance of the 2008 increase represents a 2.0% increase in repairs and maintenance, payroll, insurance and other property related expenses for the Core Properties.
Provision for credit losses
The provision for credit losses represents the Company’s estimate of amounts owed by tenants that may not be collectible. The provision for credit losses decreased $194,000 primarily due to a one-time provision for a rent dispute with a former anchor tenant of $409,000 in 2008, partially offset by $215,000 of increased credit losses related to small shop delinquencies in 2009.
The $737,000 credit loss increase in 2008 compared to 2007 was primarily due to a rent dispute with a former anchor tenant (55.5% or approximately $409,000). The Company also established credit loss reserves for tenant rents receivable the majority of which were independent, small shop retailers, primarily at the Company’s Loudoun County, Northern Virginia shopping centers. The provision for credit losses of approximately seven tenths of one percent (0.7%) and three tenths of one percent (0.3%), of total revenue for 2008 and 2007, respectively, reflects the deteriorating impact of the declining housing conditions and frozen credit market.
Real estate taxes
The $1,158,000 increase in real estate taxes resulted primarily from a 5.8% increase in real estate tax expense throughout the Core Properties (82.0% or approximately $949,000). The operation of the 2009/2008 Development and Acquisition Properties contributed the remainder of the real estate tax increase (18.0% or approximately $209,000).
The $2,524,000 increase in real estate taxes in 2008 compared to 2007 was primarily due to a same property shopping center increase of $1,619,000 (64.1% of total real estate tax increase), a 16.5% increase over
41
Table of Contents
2007’s amount, impacted largely by increased expense at several of the Company’s Northern Virginia shopping centers. The Office Properties, particularly Van Ness Square and 601 Pennsylvania Avenue, accounted for $564,000 of the increase, a 13.6% increase over 2007’s amount, and the 2008/2007 Development and Acquisition Properties accounted for approximately $341,000.
Interest and amortization of deferred debt
Interest expense increased $411,000 in 2009 from 2008. The Company incurred increased interest expense of approximately $1,700,000, primarily resulting from increased fixed-rate borrowings of $41,500,000, when the Company obtained five new mortgage loans totaling $118,000,000 to pay-off $76,500,000 of debt scheduled to mature in November 2011. Also increasing interest expense were loan modification fees of $363,000 related to the amendment and extension of the revolving credit facility. Partially offsetting these increases was a $1,830,000 increase in capitalized interest related to construction and development projects resulting primarily from construction activity at Clarendon Center, Northrock and Westview Village. Increased deferred debt cost amortization increased interest expense by approximately $161,000.
Interest expense increased $423,000 in 2008 from 2007 due to increased borrowing for the 2008/2007 Development and Acquisition Properties offset in part by increased capitalized interest on development projects. Average outstanding borrowings increased approximately $35,785,000 (average fixed-rate borrowings increased approximately $38,678,000 while average variable rate borrowings (revolving credit line and construction loans) decreased approximately $2,893,000). The new borrowings reduced the average interest rate by approximately 0.13%. The combined impact of the new borrowings, at a lower average rate, resulted in an approximately $1,700,000 increase in interest expense. Interest capitalized as a cost of construction and development projects increased during 2008 compared to 2007 which resulted in a decrease of interest expense by approximately $1,270,000 ($4,159,000 from $2,889,000) resulting primarily from construction activity at Clarendon Center, Northrock and Westview Village. Increased deferred debt cost amortization increased interest expense by approximately $13,000 ($1,162,000 versus $1,149,000).
Depreciation and amortization
Depreciation and amortization of deferred leasing costs decreased $1,519,000 in 2009 compared to 2008 due primarily to the absence of $1,406,000 of asset retirements that occurred in 2008 in conjunction with the redevelopment of Smallwood Village Center and Clarendon Center development in the prior year period.
The $3,319,000 increase in depreciation and amortization of deferred leasing costs in 2008 compared to 2007 resulted primarily from asset retirements in 2008 in conjunction with the redevelopment of Smallwood Village Center and Clarendon Center development (42.4% or approximately $1,406,000) and the commencement of depreciation on the 2008/2007 Development and Acquisition Properties placed in service during the preceding twelve months (22.0% or approximately $729,000). The write-off of deferred leasing costs and undepreciated leasehold improvements from tenants terminating their leases prior to their contractual lease expiration dates contributed to the remaining increase.
General and administrative
General and administrative expenses consists of payroll, administrative and other overhead expenses. The $635,000 increase in general and administrative expenses for 2009 compared to 2008 resulted from increased staff expenses totaling approximately $1,092,000, resulting in part from one-time severance expenses of approximately $270,000, the expensing of development personnel costs and increased health care expense, partially offset by reduced abandoned acquisition costs, professional fees and option expense, together totaling approximately $411,000.
The $655,000 increase in general and administrative expenses for 2008 compared to 2007 resulted from increased staff expenses (88.9% or approximately $582,000) and real estate tax on land held for investment (31.0% or approximately $203,000), offset in part by reduced professional fees.
42
Table of Contents
Gain on property dispositions
Gain on property dispositions in 2009 totaling $329,000 is comprised of (a) the excess of insurance proceeds received over carrying value of assets damaged at three shopping center properties during 2009 and 2008 and (b) condemnation proceeds received in connection with the taking of land at one shopping center. The insurance proceeds funded substantially all of the restoration of the damaged property.
Gain on property dispositions totaling $1,301,000 in 2008 represents the excess of insurance proceeds received over the carrying value of assets damaged at three shopping centers.
Gain on property dispositions totaling $139,000 in 2007 represents condemnation proceeds received in connection with the taking of land at one shopping center.
Impact of Inflation
Inflation has remained relatively low during 2009 and 2008, with the exception of energy costs which fluctuated widely during these periods. Rising energy prices caused increases in utility expense, primarily gas and electric costs. The impact of rising operating expenses on the operating performance of the Company’s portfolio, however, has been mitigated by terms of substantially all of the Company’s leases which contain provisions designed to increase revenues to offset the adverse impact of inflation on the Company’s results of operations. These provisions include upward periodic adjustments in base rent due from tenants, usually based on a stipulated increase and to a lesser extent on a factor of the change in the consumer price index, commonly referred to as the CPI.
In addition, substantially all of the Company’s properties are leased to tenants under long-term leases, which provide for reimbursement of operating expenses by tenants. These leases tend to reduce the Company’s exposure to rising property expenses due to inflation. Inflation and increased costs may have an adverse impact on the Company’s tenants if increases in their operating expenses exceed increases in their revenue.
Liquidity and Capital Resources
Cash and cash equivalents were $20,607,000 and $13,006,000 at December 31, 2009 and 2008, respectively. The changes in cash and cash equivalents during the years ended December 31, 2009 and 2008 were attributable to operating, investing and financing activities, as described below.
| For the year ended December 31, | ||||||||
| (Dollars in thousands) | 2009 | 2008 | ||||||
| Cash provided by operating activities |
$ | 69,025 | $ | 73,101 | ||||
| Cash used in investing activities |
(80,469 | ) | (115,070 | ) | ||||
| Cash provided by financing activities |
19,045 | 49,210 | ||||||
| Increase in cash and cash equivalents |
$ | 7,601 | $ | 7,241 | ||||
43
Table of Contents
Operating Activities
Cash provided by operating activities decreased $4,076,000 to $69,025,000 for the year ended December 31, 2009 compared to $73,101,000 for the year ended December 31, 2008, primarily reflecting decreased operating income of the core portfolio. Cash provided by operating activities represents, in each year, cash received primarily from rental income, plus other income, less property operating expenses, normal recurring general and administrative expenses and interest payments on debt outstanding.
Investing Activities
Cash used in investing activities decreased $34,601,000 to $80,469,000 for the year ended December 31, 2009 compared to $115,070,000 for the year ended December 31, 2008. Investing activities for 2009 primarily reflect the construction of new and renovated shopping center properties (Clarendon Center, Northrock and Westview Village developments and the Smallwood Village Center and Boulevard renovations), tenant improvements and property capital expenditures throughout the portfolio.
Investing activities for 2008 primarily reflects the acquisition of properties (Great Falls Center, BJ’s Wholesale and Marketplace at Sea Colony), the construction of new and renovated shopping center properties (Clarendon Center, Northrock and Westview Village developments and the Smallwood Village Center and Boulevard renovations), tenant improvements and property capital expenditures throughout the portfolio.
Tenant improvement and property capital expenditures totaled $7,256,000 and $9,986,000, for 2009 and 2008, respectively.
Financing Activities
Cash provided by financing activities for the years ended December 31, 2009 and 2008, was $19,045,000 and $49,210,000, respectively. Cash provided by financing activities for the year ended December 31, 2009 primarily reflects:
| • | proceeds received from five new mortgage notes payable and the final funding of a 2008 mortgage forward commitment totaling $119,882,000; |
| • | amounts borrowed from construction loans payable totaling $41,507,000; |
| • | amounts borrowed from the revolving credit facility totaling $30,000,000; and |
| • | $4,185,000 of proceeds received from the issuance of common stock under the dividend reinvestment program and from the exercise of stock options; |
which was partially offset by:
| • | the repayment of mortgage notes payable totaling $92,078,000; |
| • | the repayments of the revolving credit facility totaling $30,000,000; |
| • | distributions made to common stockholders and holders of convertible limited partnership units in the Operating Partnership during the year totaling $35,645,000; |
| • | distributions made to preferred stockholders during the year totaling $15,140,000; and |
44
Table of Contents
| • | payments of $3,666,000 for financing costs of new mortgage loans and the amendment and extension of the Revolving Credit Agreement. |
Cash provided by financing activities for the year ended December 31, 2008 primarily reflects:
| • | proceeds from the issuance of Series B preferred stock (net of issuance costs) totaling $76,321,000; |
| • | amounts borrowed from the revolving credit facility totaling $19,000,000; |
| • | proceeds received from mortgage notes payable totaling $29,775,000; |
| • | amounts borrowed from construction loans payable totaling $19,230,000; and |
| • | $4,543,000 of proceeds received from the issuance of common stock under the dividend reinvestment program and from the exercise of stock options; |
which was partially offset by:
| • | the scheduled repayment (amortization) of mortgage notes payable totaling $16,585,000; |
| • | the repayments of the revolving credit facility totaling $27,000,000; |
| • | distributions made to common stockholders and holders of convertible limited partnership units in the Operating Partnership during the year totaling $43,633,000; |
| • | distributions made to preferred stockholders during the year totaling $11,668,000; and |
| • | payments of $773,000 for financing costs of new mortgage loans during 2008. |
Liquidity Requirements
Short-term liquidity requirements consist primarily of normal recurring operating expenses and capital expenditures, debt service requirements (including debt service relating to additional and replacement debt), distributions to common and preferred stockholders, distributions to unit holders and amounts required for expansion and renovation of the Current Portfolio Properties and selective acquisition and development of additional properties. In order to qualify as a REIT for federal income tax purposes, the Company must distribute to its stockholders at least 90% of its “real estate investment trust taxable income,” as defined in the Code. The Company expects to meet these short-term liquidity requirements (other than amounts required for additional property acquisitions and developments) through cash provided from operations, available cash and its existing line of credit.
Long-term liquidity requirements consist primarily of obligations under our long-term debt and dividends paid to our preferred shareholders. We anticipate that long-term liquidity requirements will also include amounts required for property acquisitions and developments. Management anticipates that during the coming year the Company:
| • | may redevelop certain of the Current Portfolio Properties, |
45
Table of Contents
| • | may develop additional freestanding outparcels or expansions within certain of the Shopping Centers, |
| • | will continue to develop its construction in progress properties. |
Acquisition and development of properties are undertaken only after careful analysis and review, and management’s determination that such properties are expected to provide long-term earnings and cash flow growth. During the coming year, developments, expansions or acquisitions are expected to be funded with available cash, bank borrowings from the Company’s credit line, construction and permanent financing, proceeds from the operation of the Company’s dividend reinvestment plan or other external debt or equity capital resources available to the Company and proceeds from the sale of properties. Borrowings may be at the Saul Centers, Operating Partnership or Subsidiary Partnership level, and securities offerings may include (subject to certain limitations) the issuance of additional limited partnership interests in the Operating Partnership which can be converted into shares of Saul Centers common stock. The availability and terms of any such financing will depend upon market and other conditions.
Contractual Payment Obligations
As of December 31, 2009, the Company had unfunded contractual payment obligations of approximately $67.0 million, excluding operating obligations, due within the next 12 months. The table below specifies the total contractual payment obligations as of December 31, 2009.
| Payments Due By Period | |||||||||||||||
| (Dollars in thousands) | Total | Less than 1 Year |
2-3 Years | 4-5 Years | After 5 Years | ||||||||||
| Contractual Obligations |
|||||||||||||||
| Notes Payable |
$ | 636,806 | $ | 15,675 | $ | 190,888 | $ | 75,374 | $ | 354,869 | |||||
| Operating Leases (1) |
10,936 | 169 | 349 | 352 | 10,066 | ||||||||||
| Corporate Headquarters Lease (1) |
1,873 | 850 | 1,023 | — | — | ||||||||||
| Development Obligations |
56,272 | 50,272 | 6,000 | — | — | ||||||||||
| Total Contractual Cash Obligations |
$ | 705,887 | $ | 66,966 | $ | 198,260 | $ | 75,726 | $ | 364,935 | |||||
| (1) | See Note 7 to Consolidated Financial Statements. Corporate Headquarters Lease amounts represent an allocation to the Company based upon employees’ time dedicated to the Company’s business as specified in the Shared Services Agreement. Future amounts are subject to change as the number of employees employed by each of the parties to the lease fluctuates. |
Management believes that the Company’s cash flow from operations and its capital resources, which at December 31, 2009 included cash balances of $20.6 million, borrowing availability of approximately $149.8 million on its revolving line of credit and borrowing availability of approximately $118.6 million of unfunded capacity on its two construction loans will be sufficient to meet its contractual obligations for the foreseeable future.
Preferred Stock Issues
In March 2008, the Company sold, in an underwritten public offering, 3,173,115 depositary shares, each representing 1/100th of a share of 9% Series B Cumulative Redeemable Preferred Stock, providing net cash proceeds of $76.3 million. The depositary shares may be redeemed at the Company’s option, in whole or in part, at the $25.00 liquidation preference on or after March 15, 2013. The depositary shares pay an annual dividend of $2.25 per share, equivalent to 9% of the $25.00 liquidation preference. The first dividend was paid on July 15, 2008 and covered the period from March 27, 2008 through June 30, 2008. The Series B preferred stock has no stated maturity, is not subject to any sinking fund or mandatory redemption and is not convertible into any other securities
46
Table of Contents
of the Company. Investors in the depositary shares generally have no voting rights, but will have limited voting rights if the Company fails to pay dividends for six or more quarters (whether or not declared or consecutive) and in certain other events.
Approximately $22.0 million of the net proceeds were used to fully repay the outstanding amount under the Company’s revolving credit facility and approximately $31.5 million was used to acquire three operating shopping center properties ($61.1 million acquisition cost less financing proceeds of $29.6 million from loans secured by the properties). The remaining $22.8 million was initially invested in short-term certificates of deposit and subsequently used to fund certain of the Company’s development and redevelopment projects.
In November 2003, the Company sold 4,000,000 depositary shares, each representing 1/100th of a share of 8% Series A Cumulative Redeemable Preferred Stock. The depositary shares may be redeemed at the Company’s option, in whole or in part from time to time, at the $25.00 liquidation preference. The depositary shares pay an annual dividend of $2.00 per share, equivalent to 8% of the $25.00 liquidation preference. The Series A preferred stock has no stated maturity, is not subject to any sinking fund or mandatory redemption and is not convertible into any other securities of the Company. Investors in the depositary shares generally have no voting rights, but will have limited voting rights if the Company fails to pay dividends for six or more quarters (whether or not declared or consecutive) and in certain other events.
Dividend Reinvestments
In December 1995, the Company established a Dividend Reinvestment Plan (the “Plan”) to allow its common stockholders and holders of limited partnership interests an opportunity to buy additional shares of common stock by reinvesting all or a portion of their dividends or distributions. The Plan provides for investing in newly issued shares of common stock at a 3% discount from market price without payment of any brokerage commissions, service charges or other expenses. All expenses of the Plan are paid by the Company. The Company issued 125,956 and 74,215 shares under the Plan at a weighted average discounted price of $30.21 and $47.44 per share during the years ended December 31, 2009 and 2008, respectively. The Company also credited 10,491 and 9,605 shares to directors pursuant to the reinvestment of dividends specified by the Directors’ Deferred Compensation Plan at a weighted average discounted price of $31.69 and $43.71 per share, during the years ended December 31, 2009 and 2008, respectively.
Capital Strategy and Financing Activity
As a general policy, the Company intends to maintain a ratio of its total debt to total asset value of 50% or less and to actively manage the Company’s leverage and debt expense on an ongoing basis in order to maintain prudent coverage of fixed charges. Asset value is the aggregate fair market value of the Current Portfolio Properties and any subsequently acquired properties as reasonably determined by management by reference to the properties’ aggregate cash flow. Given the Company’s current debt level, it is management’s belief that the ratio of the Company’s debt to total asset value was below 50% as of December 31, 2009.
The organizational documents of the Company do not limit the absolute amount or percentage of indebtedness that it may incur. The Board of Directors may, from time to time, reevaluate the Company’s debt capitalization policy in light of current economic conditions, relative costs of capital, market values of the Company property portfolio, opportunities for acquisition, development or expansion, and such other factors as the Board of Directors then deems relevant. The Board of Directors may modify the Company’s debt capitalization policy based on such a reevaluation without shareholder approval and consequently, may increase or decrease the Company’s debt to total asset ratio above or below 50% or may waive the policy for certain periods of time. The Company selectively continues to refinance or renegotiate the terms of its outstanding debt in order to achieve longer maturities, and obtain generally more favorable loan terms, whenever management determines the financing environment is favorable.
47
Table of Contents
The following is a summary of notes payable as of December 31, 2009 and 2008:
| Notes Payable | December 31, | Interest |
Scheduled | |||||||||||
| (Dollars in thousands) | 2009 | 2008 | Rate * | Maturity * | ||||||||||
| Fixed rate mortgages: |
$ | — | (a | ) | $ | 78,489 | — | — | ||||||
| 110,847 | (b | ) | 115,271 | 7.67 | % | Oct-2012 | ||||||||
| 10,658 | (c | ) | 10,846 | 6.12 | % | Jan-2013 | ||||||||
| 27,533 | (d | ) | 28,837 | 7.88 | % | Jan-2013 | ||||||||
| 7,694 | (e | ) | 7,919 | 5.77 | % | Jul-2013 | ||||||||
| 15,184 | (f | ) | 15,576 | 5.40 | % | May-2014 | ||||||||
| 18,506 | (g | ) | 18,987 | 7.45 | % | Jun-2015 | ||||||||
| 37,376 | (h | ) | 38,263 | 6.01 | % | Feb-2018 | ||||||||
| 42,265 | (i | ) | 43,413 | 5.88 | % | Jan-2019 | ||||||||
| 13,671 | (j | ) | 14,043 | 5.76 | % | May-2019 | ||||||||
| 18,876 | (k | ) | 19,391 | 5.62 | % | Jul-2019 | ||||||||
| 18,702 | (l | ) | 19,195 | 5.79 | % | Sep-2019 | ||||||||
| 16,706 | (m | ) | 17,165 | 5.22 | % | Jan-2020 | ||||||||
| 12,127 | (n | ) | 12,337 | 5.60 | % | May-2020 | ||||||||
| 11,279 | (o | ) | 11,576 | 5.30 | % | Jun-2020 | ||||||||
| 9,698 | (p | ) | 9,925 | 5.81 | % | Feb-2021 | ||||||||
| 6,693 | (q | ) | 6,791 | 6.01 | % | Aug-2021 | ||||||||
| 38,625 | (r | ) | 39,198 | 5.62 | % | Jun-2022 | ||||||||
| 11,661 | (s | ) | 11,817 | 6.08 | % | Sep-2022 | ||||||||
| 12,504 | (t | ) | 12,655 | 6.43 | % | Apr-2023 | ||||||||
| 17,977 | (u | ) | 16,571 | 6.28 | % | Feb-2024 | ||||||||
| 18,368 | (v | ) | — | 7.35 | % | Jun-2024 | ||||||||
| 15,891 | (w | ) | — | 7.60 | % | Jun-2024 | ||||||||
| 16,923 | (x | ) | — | 8.11 | % | Jul-2024 | ||||||||
| 33,305 | (y | ) | — | 7.45 | % | Jul-2024 | ||||||||
| 33,000 | (z | ) | — | 7.30 | % | Jan-2025 | ||||||||
| Total fixed rate |
576,069 | 548,265 | 6.66 | % | 8.9 Years | |||||||||
| Variable rate loans: |
||||||||||||||
| Revolving credit facility |
— | (aa | ) | — | LIBOR + 3.725 | % | Jun-2012 | |||||||
| Northrock construction loan |
19,118 | (bb | ) | 12,817 | LIBOR + 3.00 | % | May-2011 | |||||||
| Clarendon construction loan |
41,619 | (cc | ) | 6,413 | LIBOR + 2.50 | % | Nov-2011 | |||||||
| Total variable rate |
60,737 | 19,230 | 3.29 | % | 1.7 Years | |||||||||
| Total notes payable |
$ | 636,806 | $ | 567,495 | 6.34 | % | 8.2 Years | |||||||
| * | Interest rate and scheduled maturity data presented as of December 31, 2009. Totals computed using weighted averages. |
| (a) | The loan was collateralized by Avenel Business Park, Van Ness Square, Ashburn Village, Leesburg Pike, Lumberton Plaza and Village Center and was repaid during 2009. |
| (b) | The loan is collateralized by nine shopping centers (Seven Corners, Thruway, White Oak, Hampshire Langley, Great Eastern, Southside Plaza, Belvedere, Giant and Ravenwood) and requires equal monthly principal and interest payments of $1,103,000 based upon a 25-year amortization schedule and a final payment of $97,403,000 at loan maturity. Principal of $4,424,000 was amortized during 2009. |
48
Table of Contents
| (c) | The loan is collateralized by Smallwood Village Center and requires equal monthly principal and interest payments of $71,000 based upon a 30-year amortization schedule and a final payment of $10,071,000 at loan maturity. Principal of $188,000 was amortized during 2009. |
| (d) | The loan is collateralized by 601 Pennsylvania Avenue and requires equal monthly principal and interest payments of $294,000 based upon a 25-year amortization schedule and a final payment of $22,961,000 at loan maturity. Principal of $1,304,000 was amortized during 2009. |
| (e) | The loan is collateralized by Cruse MarketPlace and requires equal monthly principal and interest payments of $56,000 based upon an amortization schedule of approximately 24 years and a final payment of $6,830,000 at loan maturity. Principal of $225,000 was amortized during 2009. |
| (f) | The loan is collateralized by Seabreeze Plaza and requires equal monthly principal and interest payments totaling $102,000 based upon a weighted average 26-year amortization schedule and a final payment of $13,278,000 is due at loan maturity. Principal of $392,000 was amortized during 2009. |
| (g) | The loan is collateralized by Shops at Fairfax and Boulevard shopping centers and requires equal monthly principal and interest payments totaling $156,000 based upon a weighted average 23-year amortization schedule and a final payment of $15,168,000 is due at loan maturity. Principal of $481,000 was amortized during 2009. |
| (h) | The loan is collateralized by Washington Square and requires equal monthly principal and interest payments of $264,000 based upon a 27.5-year amortization schedule and a final payment of $28,012,000 at loan maturity. Principal of $887,000 was amortized during 2009. |
| (i) | The loan is collateralized by three shopping centers, Broadlands Village, The Glen and Kentlands Square, and requires equal monthly principal and interest payments of $306,000 based upon a 25-year amortization schedule and a final payment of $28,393,000 at loan maturity. Principal of $1,148,000 was amortized during 2009. |
| (j) | The loan is collateralized by Olde Forte Village and requires equal monthly principal and interest payments of $98,000 based upon a 25-year amortization schedule and a final payment of $8,985,000 at loan maturity. Principal of $372,000 was amortized during 2009. |
| (k) | The loan is collateralized by Countryside and requires equal monthly principal and interest payments of $133,000 based upon a 25-year amortization schedule and a final payment of $12,288,000 at loan maturity. Principal of $515,000 was amortized during 2009. |
| (l) | The loan is collateralized by Briggs Chaney MarketPlace and requires equal monthly principal and interest payments of $133,000 based upon a 25-year amortization schedule and a final payment of $12,192,000 at loan maturity. Principal of $493,000 was amortized during 2009. |
| (m) | The loan is collateralized by Shops at Monocacy and requires equal monthly principal and interest payments of $112,000 based upon a 25-year amortization schedule and a final payment of $10,568,000 at loan maturity. Principal of $459,000 was amortized during 2009. |
| (n) | The loan is collateralized by Boca Valley Plaza and requires equal monthly principal and interest payments of $75,000 based upon a 30-year amortization schedule and a final payment of $9,149,000 at loan maturity. Principal of $210,000 was amortized during 2009. |
| (o) | The loan is collateralized by Palm Springs Center and requires equal monthly principal and interest payments of $75,000 based upon a 25-year amortization schedule and a final payment of $7,075,000 at loan maturity. Principal of $297,000 was amortized during 2009. |
| (p) | The loan is collateralized by Jamestown Place and requires equal monthly principal and interest payments of $66,000 based upon a 25-year amortization schedule and a final payment of $6,102,000 at loan maturity. Principal of $227,000 was amortized during 2009. |
| (q) | The loan is collateralized by Hunt Club Corners and requires equal monthly principal and interest payments of $42,000 based upon a 30-year amortization schedule and a final payment of $5,018,000 at loan maturity. Principal of $98,000 was amortized during 2009. |
49
Table of Contents
| (r) | The loan is collateralized by Lansdowne Town Center and requires monthly principal and interest payments of $230,000 based on a 30-year amortization schedule and a final payment of $28,177,000 at loan maturity. Principal of $573,000 was amortized during 2009. |
| (s) | The loan is collateralized by Orchard Park and requires equal monthly principal and interest payments of $73,000 based upon a 30-year amortization schedule and a final payment of $8,628,000 at loan maturity. Principal of $156,000 was amortized during 2009. |
| (t) | The loan is collateralized by BJs Wholesale and requires equal monthly principal and interest payments of $80,000 based upon a 30-year amortization schedule and a final payment of $9,305,000 at loan maturity. Principal of $151,000 was amortized during 2009. |
| (u) | The loan is collateralized by Great Falls shopping center. In May 2009, the Company closed on the final portion of a forward commitment in the amount of $1,881,617. The loan consists of three notes which require equal monthly principal and interest payments of $138,000 based upon a weighted average 26-year amortization schedule. The loan matures February 1, 2024 at which time a final payment of $6,349,000 will be due. Principal of $476,000 was amortized during 2009. |
| (v) | The loan, closed on June 2, 2009, is collateralized by Leesburg Pike and requires equal monthly principal and interest payments of $135,000 based upon a 25-year amortization schedule and a final payment of $11,506,000 at loan maturity. Principal of $132,000 was amortized during 2009. |
| (w) | The loan, closed on May 28, 2009, is collateralized by Village Center and requires equal monthly principal and interest payments of $119,000 based upon a 25-year amortization schedule and a final payment of $10,060,000 at loan maturity. Principal of $109,000 was amortized during 2009. |
| (x) | The loan, closed on June 12, 2009, is collateralized by Van Ness Square and requires equal monthly principal and interest payments of $132,000 based upon a 25-year amortization schedule and a final payment of $11,453,000 at loan maturity. Principal of $77,000 was amortized during 2009. |
| (y) | The loan, closed on June 19, 2009, is collateralized by Avenel Business Park and requires equal monthly principal and interest payments of $246,000 based upon a 25-year amortization schedule and a final payment of $20,926,000 at loan maturity. Principal of $195,000 was amortized during 2009. |
| (z) | The loan, closed on December 17, 2009, is collateralized by Ashburn Village and requires equal monthly principal and interest payments of $240,000 based upon a 25-year amortization schedule and a final payment of $20,478,000 at loan maturity. |
| (aa) | The loan is an unsecured revolving credit facility totaling $150,000,000. Interest expense is calculated based upon the 1 month LIBOR rate plus a spread of 3.725%. The line may be extended one year with payment of a fee of 1/4% at the Company’s option. Monthly payments, if applicable, are interest only and vary depending upon the amount outstanding and the applicable interest rate for any given month. |
| (bb) | The loan is a secured construction loan facility totaling $21,822,000 to fund the development of Northrock shopping center. Interest charges are funded by the construction loan and are calculated based upon the 1 month LIBOR rate plus a spread of 3.00%. The loan may be extended two years, at the Company’s option, subject to the completion of construction and certain debt coverage requirements. |
| (cc) | The loan is a secured construction loan facility totaling $157,500,000 to fund the development of Clarendon Center. Interest charges are funded by the construction loan and are calculated based upon the 1 month LIBOR rate plus a spread of 2.50%. The loan may be extended for two additional 9-month periods, subject to the satisfaction of certain conditions. |
The December 31, 2009 and 2008 depreciation adjusted cost of properties collateralizing the mortgage notes payable totaled $746,377,000 and $693,205,000, respectively. The Company’s credit facility requires the Company and its subsidiaries to maintain certain financial covenants. As of December 31, 2009, the material covenants required the Company, on a consolidated basis, to:
| • | limit the amount of debt so as to maintain a gross asset value, as defined in the loan agreement, in excess of liabilities of at least $600 million plus 90% of the Company’s future net equity proceeds; |
| • | limit the amount of debt as a percentage of gross asset value, as defined in the loan agreement, to less than 60% (leverage ratio); |
50
Table of Contents
| • | limit the amount of debt so that interest coverage will exceed 2.2x on a trailing 12-full calendar month basis (interest expense coverage); |
| • | limit the amount of debt so that interest and scheduled principal amortization coverage exceeds 1.6x (debt service coverage); |
| • | limit the amount of debt so that interest, scheduled principal amortization and preferred dividend coverage exceeds 1.4x (fixed charge coverage); and |
| • | limit the amount of variable rate debt and debt with initial loan terms of less than five years to no more than 40% of total debt. |
As of December 31, 2009, the Company was in compliance with all such covenants.
2009 Financing Activity
On April 30, 2009, the Company entered into a Modification Agreement, in effect until August 1, 2009, which reduced the Debt Service Coverage ratio under its Line of Credit from 1.6x to 1.5x. The interest rate on the line of credit, which is based on the Company’s leverage, was increased to LIBOR plus 3.725%, with a LIBOR floor of 1.50%, from the former terms of LIBOR plus 1.475%. The maximum commitment under the Line of Credit was reduced from $150,000,000 to $120,000,000. On July 9, 2009, the Company entered into a Second Modification Agreement which extended the maturity date of the facility from December 19, 2010 to June 30, 2012, with an option for the Company to extend for one additional year subject to the Company’s satisfaction of certain conditions. The modification reduced the interest expense coverage for the facility from 2.5x to 2.2x, reduced the existing debt service coverage from 1.5x to 1.4x (and recharacterized the test as fixed charge coverage) and created a new debt service coverage (exclusive of preferred stock dividends) of 1.6x. On July 28, 2009, Company entered into a Third Modification Agreement increasing the maximum commitment under the facility from $120,000,000 to $150,000,000 with the addition of a fourth lender. Also in July 2009, the Company repaid in full the outstanding balance of $15,000,000 on the unsecured revolving credit facility.
The Company also financed and refinanced mortgage notes payable. On May 14, 2009, the Company closed on the final portion of its April 2008 forward commitment secured by the Great Falls Center. The additional funding totaled $1,882,000 which was based upon the achievement of certain leasing requirements. The loan matures February 1, 2024, requires equal monthly principal and interest payments of $12,518, based upon a 7.00% interest rate and 30-year principal amortization, and requires a final principal payment of approximately $1,414,000 at maturity.
Also during May and June 2009, the Company refinanced the mortgage debt secured by four properties. The Company replaced mortgage debt, due to mature December 2011, with new 15-year fixed-rate mortgage debt. The amount borrowed on the new loans totaled $85,000,000 and replaced balances outstanding of $48,059,000. In conjunction with the early repayment of the in-place debt, the Company incurred prepayment penalties of $1,442,000 and wrote-off unamortized deferred debt costs totaling $218,000. Because the refinanced properties were included in a cross-collateralized pool of six properties, the Company was required to pay down outstanding debt balances of two remaining properties in the amount of $4,806,000. Terms of the new mortgage debt are as follows:
On May 28, 2009, the Company closed on a new 15-year, fixed-rate mortgage loan in the amount of $16,000,000, secured by Village Center. The loan matures June 1, 2024, requires equal monthly principal and interest payments of $119,282, based upon a 7.6% interest rate and 25-year principal amortization, and requires a final principal payment of approximately $10,060,000 at maturity.
On June 2, 2009, the Company closed on a new 15-year, fixed-rate mortgage loan in the amount of $18,500,000, secured by Leesburg Pike. The loan matures June 1, 2024, requires equal monthly principal and interest payments of $134,913, based upon a 7.35% interest rate and 25-year principal amortization, and requires a final principal payment of approximately $11,506,000 at maturity.
51
Table of Contents
On June 12, 2009, the Company closed on a new 15-year, fixed-rate mortgage loan in the amount of $17,000,000, secured by Van Ness Square. The loan matures July 1, 2024, requires equal monthly principal and interest payments of $132,450, based upon a 8.11% interest rate and 25-year principal amortization, and requires a final principal payment of approximately $11,453,000 at maturity. A portion of the loan proceeds are held in escrow by the lender to fund up to $1,500,000 of future tenant improvements and leasing commissions. Additional loan proceeds of $1,564,000 are also held in a second escrow to be released pending the achievement of certain annualized base rent levels. The escrows are classified as other assets on the Consolidated Balance Sheets.
On June 19, 2009, the Company closed on a new 15-year, fixed-rate mortgage loan in the amount of $33,500,000, secured by Avenel Business Park. The loan matures July 1, 2024, requires equal monthly principal and interest payments of $246,474, based upon a 7.45% interest rate and 25-year principal amortization, and requires a final principal payment of approximately $20,926,000 at maturity.
On December 17, 2009, the Company closed on a new 15-year, fixed-rate mortgage loan in the amount of $33,000,000, secured by Ashburn Village. The loan matures January 1, 2025, requires equal monthly principal and interest payments of $239,590, based upon a 7.30% interest rate and 25-year principal amortization, and requires a final principal payment of approximately $20,478,000 at maturity.
Off-Balance Sheet Arrangements
The Company has no off-balance sheet arrangements that are reasonably likely to have a current or future material effect on the Company’s financial condition, revenue or expenses, results of operations, liquidity, capital expenditures or capital resources.
52
Table of Contents
Funds From Operations
In 2009, the Company reported Funds From Operations (FFO)1 available to common shareholders (common stockholders and limited partner unitholders) of $56,025,000, a 10.6% decrease from 2008 FFO available to common shareholders of $62,695,000. The following table presents a reconciliation from net income to FFO available to common shareholders for the periods indicated:
| Year Ended December 31, | ||||||||||||||||||||
| (Dollars in thousands) | 2009 | 2008 | 2007 | 2006 | 2005 | |||||||||||||||
| Net income |
$ | 43,230 | $ | 47,666 | $ | 45,521 | $ | 40,473 | $ | 37,025 | ||||||||||
| Subtract: |
||||||||||||||||||||
| Gain on property dispositions |
(329 | ) | (1,301 | ) | (139 | ) | — | — | ||||||||||||
| Add: |
||||||||||||||||||||
| Real estate depreciation and amortization |
28,264 | 29,783 | 26,464 | 25,648 | 24,197 | |||||||||||||||
| FFO |
71,165 | 76,148 | 71,846 | 66,121 | 61,222 | |||||||||||||||
| Subtract: |
||||||||||||||||||||
| Preferred dividends |
(15,140 | ) | (13,453 | ) | (8,000 | ) | (8,000 | ) | (8,000 | ) | ||||||||||
| FFO available to common shareholders |
$ | 56,025 | $ | 62,695 | $ | 63,846 | $ | 58,121 | $ | 53,222 | ||||||||||
| Average shares and units used to compute FFO per share |
23,359 | 23,377 | 23,185 | 22,628 | 22,003 | |||||||||||||||
| 1 | The National Association of Real Estate Investment Trusts (NAREIT) developed FFO as a relative non-GAAP financial measure of performance of an equity REIT in order to recognize that income-producing real estate historically has not depreciated on the basis determined under GAAP. FFO is defined by NAREIT as net income, computed in accordance with GAAP, plus real estate depreciation and amortization, and excluding extraordinary items and gains or losses from property dispositions. FFO does not represent cash generated from operating activities in accordance with GAAP and is not necessarily indicative of cash available to fund cash needs, which is disclosed in the Company’s Consolidated Statements of Cash Flows for the applicable periods. There are no material legal or functional restrictions on the use of FFO. FFO should not be considered as an alternative to net income, its most directly comparable GAAP measure, as a indicator of the Company’s operating performance, or as an alternative to cash flows as a measure of liquidity. Management considers FFO a meaningful supplemental measure of operating performance because it primarily excludes the assumption that the value of the real estate assets diminishes predictably over time (i.e. depreciation), which is contrary to what we believe occurs with our assets, and because industry analysts have accepted it as a performance measure. FFO may not be comparable to similarly titled measures employed by other REITs. |
53
Table of Contents
Acquisitions, Redevelopments and Renovations
Management anticipates that during the coming year the Company: (i) may redevelop certain of the Current Portfolio Properties, (ii) may develop additional freestanding outparcels or expansions within certain of the Shopping Centers, and (iii) will continue to develop its construction in progress properties. Acquisition and development of properties are undertaken only after careful analysis and review, and management’s determination that such properties are expected to provide long-term earnings and cash flow growth. During the coming year, any developments, expansions or acquisitions are expected to be funded with borrowings from the Company’s credit line, construction financing, proceeds from the operation of the Company’s dividend reinvestment plan or other external capital resources available to the Company.
The Company has been selectively involved in acquisition, development, redevelopment and renovation activities. It continues to evaluate the acquisition of land parcels for retail and office development and acquisitions of operating properties for opportunities to enhance operating income and cash flow growth. The Company also continues to take advantage of redevelopment, renovation and expansion opportunities within the portfolio, as demonstrated by its recent activities at Hunt Club, Smallwood Village Center and Boulevard. The following describes the acquisitions, developments, redevelopments and renovations which affected the Company’s financial position and results of operations in 2009, 2008 and 2007.
Ashland Square Phase I
On December 15, 2004, the Company purchased for $6.3 million, a 19.3 acre parcel of land in Manassas, Prince William County, Virginia. The Company received site plan approval during the third quarter of 2006 to develop a grocery-anchored neighborhood shopping center totaling approximately 125,000 square feet of retail space. A site plan for an additional 35,000 square feet of commercial space is under review by Prince William County. During the fourth quarter of 2007, the Company completed preliminary site work consisting of clearing, grading and site utility construction. A ground lease has been executed with Chevy Chase Bank, which built a branch, on a pad site, that opened for business October 2007. During 2009, the Company executed a lease with CVS, which is subject to the tenant obtaining site plan and special use permits from Prince William County. It is uncertain whether these lease contingencies will be fulfilled as permit submissions are in progress. If successful, CVS is expected to commence operations in late 2011. The balance of the center is being marketed to grocers and other retail businesses, with a development timetable yet to be finalized.
Smallwood Village Center
On January 27, 2006, the Company acquired the 198,000 square foot Smallwood Village Center, located on 25 acres within the St. Charles planned community of Waldorf, Maryland. The center was acquired for a purchase price of $17.5 million subject to the assumption of an $11.3 million mortgage loan, and was 76% leased at December 31, 2009. The Company commenced construction during the first quarter of 2008 on a capital improvement project to improve access to the center, reconfigure portions of the center and upgrade the center’s façade and common areas. The redeveloped center totals approximately 173,000 square feet. Substantial completion of construction was achieved during the second quarter of 2009. Project costs totaled approximately $6.9 million.
Hunt Club Corners
On June 1, 2006, the Company purchased for $11.1 million the 101,500 square foot Publix-anchored Hunt Club Corners shopping center located in Apopka, Florida (metropolitan Orlando). The center was 96% leased at December 31, 2009. The Company completed a façade renovation of Hunt Club during 2008 for a total cost of approximately $0.9 million.
Clarendon Center
The Company owns an assemblage of land parcels (including its former operating properties, Clarendon and Clarendon Station) totaling approximately 1.5 acres adjacent to the Clarendon Metro Station in Arlington, Virginia. In June 2006, the Company obtained zoning approvals for a mixed-use development project to include up
54
Table of Contents
to approximately 45,000 square feet of retail space, 170,000 square feet of office space and 244 residential units. The total development costs are expected to be approximately $195.0 million, a portion of which will be funded with the $157.5 million construction loan that the Company closed in May 2008. The south block’s four-level sub-surface parking garage was structurally completed during the second quarter of 2009 and structural concrete work was completed to the top of the residential building (12th floor) and the top of the office building (9th floor) during the third quarter of 2009. Exterior wall brick laying and the installation of exterior pre-cast panels and windows is proceeding. Construction of the north block sub-surface parking garage was structurally completed during the fourth quarter of 2009 and structural concrete work has been completed for the six story office building. The Company estimates construction on both blocks will be substantially complete in late 2010, at which time the residential component is expected to be operational and ready for occupancy. The retail and office spaces will be operational as tenant improvements are built-out.
Westview Village
In November 2007, the Company purchased for $5.0 million, a 10.4 acre site in the Westview development on Buckeystown Pike (MD Route 85) in Frederick, Maryland. Construction was substantially completed in the second quarter of 2009 on a development that totals approximately 101,000 square feet of commercial space, including 60,000 square feet of retail shop space, 11,000 square feet of retail pads and 30,000 square feet of professional office space and is expected to cost approximately $26.5 million. The Company is currently marketing the space and as of December 31, 2009, has executed leases for 24,200 square feet, or approximately 32% of the total retail space.
Great Eastern Plaza Land Parcel
On June 6, 2007, the Company purchased, for $1.3 million, 8.0 acres of undeveloped land adjacent to its Great Eastern Plaza shopping center in District Heights, Maryland. The Company is analyzing options to expand the existing shopping center onto this parcel at some future date.
Orchard Park
On July 19, 2007, the Company purchased, for $17.0 million, the 88,000 square foot Kroger-anchored Orchard Park shopping center located in Dunwoody, Georgia. The center is 91% leased as of December 31, 2009.
Northrock
In January 2008, the Company purchased for $12.5 million, approximately 15.4 acres of undeveloped land in Warrenton, Virginia, located at the southwest corner of the U. S. Route 29/211 and Fletcher Drive intersection. The Company constructed Northrock shopping center, a neighborhood shopping center totaling approximately 103,000 square feet of leasable area. Approximately 67% of the project is leased at December 31, 2009, including a 52,700 square foot Harris Teeter supermarket store, 7,896 square feet of small shop space, and pad leases with Chevy Chase Bank and Longhorn Steakhouse. The Chevy Chase Bank opened February 2009. The Longhorn Steakhouse restaurant is under construction by the tenant, who expects to commence operations during the summer of 2010. Total construction and development costs, including land, lease-up and tenant improvement costs, are projected to be approximately $27.9 million, the majority of which were funded with the $21.8 million construction loan the Company closed in May 2008. Substantial completion of construction was achieved during the first quarter of 2009.
Great Falls Center
On March 28, 2008, the Company completed the acquisition of the Safeway-anchored Great Falls Center located in Great Falls, Virginia. The center was 93% leased at December 31, 2009 and was acquired for a purchase price of $36.6 million, subject to the assumption of a $10.3 million mortgage loan.
BJ’s Wholesale Club
On March 28, 2008, the Company purchased for $21.0 million, the single tenant property anchored by BJ’s Wholesale Club, located in Alexandria, Virginia. The center was 100% leased at December 31, 2009.
55
Table of Contents
Marketplace at Sea Colony
On March 28, 2008, the Company purchased for $3.0 million, Marketplace at Sea Colony, located in Bethany Beach, Delaware. The center was 91% leased at December 31, 2009.
Boulevard
During the second quarter of 2008, permits were issued for the redevelopment of a portion of the Boulevard shopping center. A vacant pad building previously occupied by a furniture store was demolished, the center’s in-line shop space was expanded by approximately 8,000 square feet for small shop retail and a Chevy Chase Bank pad building was constructed and commenced operations. As of December 31, 2009, all six shop spaces and the bank pad were leased, totaling 11,610 square feet. Substantial completion of construction was achieved during the first quarter of 2009, and total construction and development costs were approximately $2.8 million.
Portfolio Leasing Status
The following chart sets forth certain information regarding our properties for the periods indicated.
| Total Properties | Total Square Footage | Percentage Leased | ||||||||||||
| As of December 31, |
Shopping Centers |
Office | Shopping Centers |
Office | Shopping Centers |
Office | ||||||||
| 2009 |
47 | 5 | 7,218,000 | 1,206,000 | 91.7 | % | 90.6 | % | ||||||
| 2008 |
45 | 5 | 6,988,000 | 1,206,000 | 93.9 | % | 95.8 | % | ||||||
| 2007 |
43 | 5 | 6,803,000 | 1,206,000 | 95.3 | % | 95.2 | % | ||||||
The 2009 shopping center percentage leased includes recently constructed but not yet fully leased Northrock and Westview Village, which were 67% and 24% leased as of December 31, 2009, respectively. On a same property basis, shopping center leasing percentages decreased to 93.0% from 93.9% and office property leasing percentages decreased to 90.6% from 95.8%. Overall portfolio leasing percentage, on a comparative same center basis, ended the year at 92.7%, a decrease from 94.1% at year end 2008, a space leased reduction of approximately 130,000 square feet. Five properties, three shopping centers and two office properties, caused the decline in leased space. Shopping Center Properties: (1) Southdale decreased by 42,000 SF resulting primarily from the big box retailer Circuit City terminating its business; (2) Southside Plaza decreased by 19,000 SF resulting from several businesses which chose not to renew their leases; and (3) Lansdowne Town Center which decreased by 11,000 SF when a fitness center and two small shop tenants ceased rent payments and vacated their spaces prior to lease expiration. Office Properties: (1) Crosstown Business Park decreased by 31,000 SF resulting from two tenants choosing not to renew their leases; and (2) Avenel Business Park, which decreased by 26,000 SF when a 15,000 SF life science tenant lost its financial support and several other small tenants ceased rent payments and vacated their spaces prior to lease expiration.
The 2008 same property leasing percentages decreased due to a net decrease of approximately 99,000 square feet of leased space. The largest contributor to the leasing decrease, approximately 29,000 square feet, occurred at South Dekalb Plaza in Atlanta, Georgia. Leasing also decreased approximately 14,000 square feet at Village Center, approximately 13,000 square feet at Broadlands Village and approximately 10,000 square feet at Ashburn Village, located in the Northern Virginia suburbs of Washington, DC.
| Item 7A. | Quantitative and Qualitative Disclosures About Market Risk |
The Company is exposed to certain financial market risks, the most predominant being fluctuations in interest rates. Interest rate fluctuations are monitored by management as an integral part of the Company’s overall risk management program, which recognizes the unpredictability of financial markets and seeks to reduce the potentially adverse effect on the Company’s results of operations. The Company does not enter into financial instruments for trading purposes.
56
Table of Contents
The Company is exposed to interest rate fluctuations which will affect the amount of interest expense of its variable rate debt and the fair value of its fixed rate debt. As of December 31, 2009, the Company had variable rate indebtedness totaling $60,737,000. If the interest rates on the Company’s variable rate debt instruments outstanding at December 31, 2009 had been one percent higher, our annual interest expense relating to these debt instruments would have increased by $607,400, based on those balances. As of December 31, 2009, the Company had fixed-rate indebtedness totaling $576,069,000 with a weighted average interest rate of 6.66%. If interest rates on the Company’s fixed-rate debt instruments at December 31, 2009 had been one percent higher, the fair value of those debt instruments on that date would have decreased by approximately $31,099,000.
| Item 8. | Financial Statements and Supplementary Data |
The financial statements of the Company and its consolidated subsidiaries are included in this report on the pages indicated, and are incorporated herein by reference:
| Item 9. | Changes in and Disagreements with Accountants on Accounting and Financial Disclosure |
None.
| Item 9A. | Controls and Procedures |
Quarterly Assessment.
The Company carried out an assessment as of December 31, 2009 of the effectiveness of the design and operation of its disclosure controls and procedures and its internal control over financial reporting. This assessment was done under the supervision and with the participation of management, including the Company’s Chairman and Chief Executive Officer, its Senior Vice President-Chief Financial Officer, Secretary and Treasurer, and its Senior Vice President-Chief Accounting Officer as appropriate. Rules adopted by the SEC require that the Company present the conclusions of the Company’s Chairman and Chief Executive Officer and its Senior Vice President-Chief Financial Officer, Secretary and Treasurer about the effectiveness of the Company’s disclosure controls and procedures and the conclusions of the Company’s management about the effectiveness of its internal control over financial reporting as of the end of the period covered by this Annual Report on Form 10-K.
57
Table of Contents
CEO and CFO Certifications.
Included as Exhibits 31 to this Annual Report on Form 10-K are forms of “Certification” of the Company’s Chairman and Chief Executive Officer and its Senior Vice President-Chief Financial Officer, Secretary and Treasurer. The forms of Certification are required in accordance with Section 302 of the Sarbanes-Oxley Act of 2002. This section of the Annual Report on Form 10-K that you are currently reading is the information concerning the assessment referred to in the Section 302 certifications and this information should be read in conjunction with the Section 302 certifications for a more complete understanding of the topics presented.
Disclosure Controls and Procedures and Internal Control over Financial Reporting.
Management is responsible for establishing and maintaining adequate disclosure controls and procedures and internal control over financial reporting. Disclosure controls and procedures are designed to provide reasonable assurance that information required to be disclosed in our reports filed or submitted under the Exchange Act, such as this Annual Report on Form 10-K, is recorded, processed, summarized and reported within the time periods specified in the SEC’s rules and forms. Disclosure controls and procedures are also designed to provide reasonable assurance that such information is accumulated and communicated to the Company’s management, including the Company’s Chairman and Chief Executive Officer, its Senior Vice President-Chief Financial Officer, Secretary and Treasurer, and its Senior Vice President-Chief Accounting Officer, as appropriate to allow timely decisions regarding required disclosure.
Internal control over financial reporting is a process designed by, or under the supervision of the Company’s Chairman and Chief Executive Officer, its Senior Vice President-Chief Financial Officer, Secretary and Treasurer, and its Senior Vice President-Chief Accounting Officer, and effected by the Company’s Board of Directors, management and other personnel, to provide reasonable assurance regarding the reliability of financial reporting and the preparation of financial statements for external purposes in accordance with GAAP and includes those policies and procedures that:
| • | pertain to the maintenance of records that in reasonable detail accurately and fairly reflect the transactions and dispositions of the Company’s assets; |
| • | provide reasonable assurance that transactions are recorded as necessary to permit preparation of financial statements in accordance with GAAP, and that the Company’s receipts and expenditures are being made only in accordance with authorizations of management or the Company’s Board of Directors; and |
| • | provide reasonable assurance regarding prevention or timely detection of unauthorized acquisition, use or disposition of the Company’s assets that could have a material adverse effect on the Company’s financial statements. |
Limitations on the Effectiveness of Controls.
Management, including the Company’s Chairman and Chief Executive Officer, its Senior Vice President-Chief Financial Officer, Secretary and Treasurer, and its Senior Vice President-Chief Accounting Officer, does not expect that the Company’s disclosure controls and procedures or internal control over financial reporting will prevent all errors and all fraud. A control system, no matter how well conceived and operated, can provide only reasonable, not absolute, assurance that the objectives of the control system are met. Further, the design of a control system must reflect the fact that there are resource constraints, and the benefits of controls must be considered relative to their costs. Because of the inherent limitations in all control systems, no assessment of controls can provide absolute assurance that all control issues and instances of fraud, if any, within the Company have been detected. These inherent limitations include the realities that judgments in decision-making can be faulty, and that breakdowns can occur because of simple error or mistake. Additionally, controls can be circumvented by the individual acts of some persons, by collusion of two or more people, or by management’s override of the control. The design of any system of controls also is based in part upon certain assumptions about the likelihood of future events, and there can be no assurance that any design will succeed in achieving its stated goals under all potential
58
Table of Contents
future conditions; over time, controls may become inadequate because of changes in conditions, or the degree of compliance with the policies or procedures may deteriorate. Because of the inherent limitations in a cost-effective control system, misstatements due to error or fraud may occur and not be detected.
Scope of the Assessments.
The assessment by the Company’s Chairman and Chief Executive Officer, its Senior Vice President-Chief Financial Officer, Secretary and Treasurer, and its Senior Vice President-Chief Accounting Officer of the Company’s disclosure controls and procedures and the assessment by the Company’s management of the Company’s internal control over financial reporting included a review of procedures and discussions with the Company’s Disclosure Committee and others in the Company. In the course of the assessments, management sought to identify data errors, control problems or acts of fraud and to confirm that appropriate corrective action, including process improvements, were being undertaken. Management used the criteria issued by the Committee of Sponsoring Organizations of the Treadway Commission in Internal Control—Integrated Framework to assess the effectiveness of the Company’s internal control over financial reporting. The evaluation of the Company’s disclosure controls and procedures and internal control over financial reporting is done on a quarterly basis so that the conclusions concerning controls effectiveness can be reported in the Company’s Quarterly Reports on Form 10-Q and Annual Report on Form 10-K.
The Company’s internal control over financial reporting is also evaluated on an ongoing basis by management, other personnel in the Company’s accounting department and the Company’s internal audit function. The effectiveness of the Company’s internal control over financial reporting is audited by the Company’s independent registered public accounting firm. We consider the results of these various assessment activities as we monitor the Company’s disclosure controls and procedures and internal control over financial reporting and when deciding to make modifications as necessary. Management’s intent in this regard is that the disclosure controls and procedures and the internal control over financial reporting will be maintained and updated (including improvements and corrections) as conditions warrant.
Assessment of Effectiveness of Disclosure Controls and Procedures
Based upon the assessments, the Company’s Chairman and Chief Executive Officer, its Senior Vice President-Chief Financial Officer, Secretary and Treasurer, and its Senior Vice President-Chief Accounting Officer have concluded that, as of December 31, 2009, the Company’s disclosure controls and procedures were effective.
Assessment of Effectiveness of Internal Control Over Financial Reporting.
Management is responsible for establishing and maintaining adequate internal control over financial reporting. Management used the criteria issued by the Committee of Sponsoring Organizations of the Treadway Commission in Internal Control—Integrated Framework to assess the effectiveness of the Company’s internal control over financial reporting. Based upon the assessments, the Company’s management has concluded that, as of December 31, 2009, the Company’s internal control over financial reporting was effective. The Company’s independent registered public accounting firm has issued a report on the effectiveness of the Company’s internal control over financial reporting, which appears on page F-2 of this Annual Report on Form 10-K.
Changes in Internal Control Over Financial Reporting.
During the three months ended December 31, 2009, there was no change in the Company’s internal control over financial reporting that has materially affected, or is reasonably likely to materially affect, the Company’s internal control for financial reporting.
| Item 9B. | Other Information |
None.
59
Table of Contents
| Item 10. | Directors, Executive Officers and Corporate Governance |
The information this Item requires is incorporated by reference to the information under the captions “The Board of Directors,” “Corporate Governance – Ethical Conduct Policy and Senior Financial Officer Code of Ethics,” “Section 16(a) Beneficial Ownership Reporting Compliance,” “Corporate Governance – Nominating and Corporate Governance Committee – Selection of Director Nominees,” and “Corporate Governance – Audit Committee” of the Company’s Proxy Statement to be filed with the SEC for its annual stockholders’ meeting to be held on May 7, 2010.
| Item 11. | Executive Compensation |
The information this Item requires is incorporated by reference to the information under the captions “Corporate Governance – Compensation of Directors,” “Report of the Compensation Committee,” and “Executive Compensation” of the Proxy Statement.
| Item 12. | Security Ownership of Certain Beneficial Owners and Management and Related Shareholder Matters |
The information this Item requires is incorporated by reference to the information under the captions “Equity Compensation Plan Information” and “Security Ownership of Certain Beneficial Owners and Management” of the Proxy Statement.
| Item 13. | Certain Relationships and Related Transactions and Director Independence |
The information this Item requires is incorporated by reference to the information under the captions “Certain Relationships and Transactions” and “Corporate Governance – Board of Directors” of the Proxy Statement.
| Item 14. | Principal Accountant Fees and Services |
The information this Item requires is incorporated by reference to the information contained in the Proxy Statement under the caption “Audit Committee Report – 2009 and 2008 Independent Registered Public Accounting Firm Fee Summary” of the Proxy Statement.
| Item 15. | Exhibits and Financial Statement Schedules |
| (a) | The following documents are filed as part of this report: | |||||
| 1. | Financial Statements | |||||
| The following financial statements of the Company and their consolidated subsidiaries are incorporated by reference in Part II, Item 8. | ||||||
| (a) | Report of Independent Registered Public Accounting Firm – Ernst & Young LLP | |||||
60
Table of Contents
| (a) | Report of Independent Registered Public Accounting Firm on Internal Control over Financial Reporting – Ernst & Young LLP | |||||
| (b) | Consolidated Balance Sheets—December 31, 2009 and 2008 | |||||
| (c) | Consolidated Statements of Operations—Years ended December 31, 2009, 2008 and 2007 | |||||
| (d) | Consolidated Statements of Stockholders’ Equity—Years ended December 31, 2009, 2008 and 2007 | |||||
| (e) | Consolidated Statements of Cash Flows—Years ended December 31, 2009, 2008 and 2007 | |||||
| (f) | Notes to Consolidated Financial Statements | |||||
| 2. | Financial Statement Schedule and Supplementary Data | |||||
| (a) | Selected Quarterly Financial Data for the Company are incorporated by reference in Part II, Item 8 | |||||
| (b) | Schedule of the Company: | |||||
| Schedule III—Real Estate and Accumulated Depreciation | ||||||
All other schedules for which provision is made in the applicable accounting regulations of the Securities and Exchange Commission are not required under the related instructions or are inapplicable and therefore have been omitted.
| Exhibits | ||||||
| 3. | (a) | First Amended and Restated Articles of Incorporation of Saul Centers, Inc. filed with the Maryland Department of Assessments and Taxation on August 23, 1994 and filed as Exhibit 3.(a) of the 1993 Annual Report of the Company on Form 10-K are hereby incorporated by reference. Articles of Amendment to the First Amended and Restated Articles of Incorporation of Saul Centers, Inc., filed with the Maryland Department of Assessments and Taxation on May 28, 2004 and filed as Exhibit 3.(a) of the June 30, 2004 Quarterly Report of the Company is hereby incorporated by reference. Articles of Amendment to the First Amended and Restated Articles of Incorporation of Saul Centers, Inc., filed with the Maryland Department of Assessments and Taxation on May 26, 2006 and filed as Exhibit 3.(a) of the Company’s Current Report on Form 8-K filed May 30, 2006 is hereby incorporated by reference. | ||||
| (b) | Amended and Restated Bylaws of Saul Centers, Inc. as in effect at and after August 24, 1993 and as of August 26, 1993 and filed as Exhibit 3.(b) of the 1993 Annual Report of the Company on Form 10-K are hereby incorporated by reference. Amendment No. 1 to Amended and Restate Bylaws of Saul Centers, Inc. adopted November 29, 2007 and filed as Exhibit 3(b) of the Company’s Current Report on Form 8-K filed December 3, 2007 is hereby incorporated by reference. | |||||
| (c) | Articles Supplementary to First Amended and Restated Articles of Incorporation of the Company, dated October 30, 2003, filed as Exhibit 2 to the Company’s Current Report on Form 8-A dated October 31, 2003, is hereby incorporated by reference. | |||||
61
Table of Contents
| (d) | Articles Supplementary to First Amended and Restated Articles of Incorporation of the Company, as amended, dated March 26, 2008, filed as Exhibit 3.1 to the Company’s Current Report on Form 8-K, filed March 27, 2008, is hereby incorporated by reference. | |||||
| 4. | (a) | Deposit Agreement, dated November 5, 2003, among the Company, Continental Stock Transfer & Trust Company, as Depositary, and the holders of depositary receipts, each representing 1/100th of a share of 8% Series A Cumulative Redeemable Preferred Stock of Saul Centers, Inc. and filed as Exhibit 4 to the Registration Statement on Form 8-A on October 31, 2003 is hereby incorporated by reference. | ||||
| (b) | Deposit Agreement, dated March 27, 2008, among the Company, Continental Stock Transfer & Trust Company, as Depositary, and the holders of depositary receipts, each representing 1/100th of a share of 9% Series B Cumulative Redeemable Preferred Stock of Saul Centers, Inc. and filed as Exhibit 4.1 to the Registration Statement on Form 8-A on March 27, 2008 is hereby incorporated by reference. | |||||
| (c) | Form specimen of receipt representing the depositary shares, each representing 1/100th of a share of 8% Series A Cumulative Redeemable Preferred Stock of Saul Centers, Inc. and included as part of Exhibit 4 to the Registration Statement on Form 8-A on October 31, 2003 is hereby incorporated by reference. | |||||
| (d) | Form specimen of receipt representing the depositary shares, each representing 1/100th of a share of 9% Series B Cumulative Redeemable Preferred Stock of Saul Centers, Inc. and included as part of Exhibit 4.2 to the Registration Statement on Form 8-A on March 27, 2008 is hereby incorporated by reference. | |||||
| 10. | (a) | First Amended and Restated Agreement of Limited Partnership of Saul Holdings Limited Partnership filed as Exhibit No. 10.1 to Registration Statement No. 33-64562 is hereby incorporated by reference. The First Amendment to the First Amended and Restated Agreement of Limited Partnership of Saul Holdings Limited Partnership, the Second Amendment to the First Amended and Restated Agreement of Limited Partnership of Saul Holdings Limited Partnership, and the Third Amendment to the First Amended and Restated Agreement of Limited Partnership of Saul Holdings Limited Partnership filed as Exhibit 10.(a) of the 1995 Annual Report of the Company on Form 10-K is hereby incorporated by reference. The Fourth Amendment to the First Amended and Restated Agreement of Limited Partnership of Saul Holdings Limited Partnership filed as Exhibit 10.(a) of the March 31, 1997 Quarterly Report of the Company is hereby incorporated by reference. The Fifth Amendment to the First Amended and Restated Agreement of Limited Partnership of Saul Holdings Limited Partnership filed as Exhibit 4.(c) to Registration Statement No. 333-41436, is hereby incorporated by reference. The Sixth Amendment to the First Amended and Restated Agreement of Limited Partnership of Saul Holdings Limited Partnership filed as Exhibit 10.(a) of the September 30, 2003 Quarterly Report of the Company on Form 10-Q is hereby incorporated by reference. The Seventh Amendment to the First Amended and Restated Agreement of Limited Partnership of Saul Holdings Limited Partnership filed as Exhibit 10.(a) of the December 31, 2003 Annual Report of the Company on Form 10-K is hereby incorporated by reference. The Eighth Amendment to the First Amended and Restated Agreement of Limited Partnership of Saul Holdings Limited Partnership filed as Exhibit 10.(a) of the December 31, 2007 Annual Report of the Company on Form 10-K is hereby incorporated by reference. The Ninth Amendment to the First Amended and Restated Agreement of Limited Partnership of Saul Holdings Limited Partnership filed as Exhibit 10.(a) of the March 31, 2008 Quarterly Report of the Company on Form 10-Q is hereby incorporated by reference. The Tenth Amendment to the First Amended and Restated Agreement of Limited Partnership of Saul Holdings Limited Partnership filed as Exhibit 10.(a) of the March 31, 2008 Quarterly Report of the Company on Form 10-Q is hereby incorporated by reference. | ||||
62
Table of Contents
| (b) | First Amended and Restated Agreement of Limited Partnership of Saul Subsidiary I Limited Partnership and Amendment No. 1 thereto filed as Exhibit 10.2 to Registration Statement No. 33-64562 are hereby incorporated by reference. The Second Amendment to the First Amended and Restated Agreement of Limited Partnership of Saul Subsidiary I Limited Partnership, the Third Amendment to the First Amended and Restated Agreement of Limited Partnership of Saul Subsidiary I Limited Partnership and the Fourth Amendment to the First Amended and Restated Agreement of Limited Partnership of Saul Subsidiary I Limited Partnership as filed as Exhibit 10.(b) of the 1997 Annual Report of the Company on Form 10-K are hereby incorporated by reference. | |||||
| (c) | First Amended and Restated Agreement of Limited Partnership of Saul Subsidiary II Limited Partnership and Amendment No. 1 thereto filed as Exhibit 10.3 to Registration Statement No. 33-64562 are hereby incorporated by reference. The Second Amendment to the First Amended and Restated Agreement of Limited Partnership of Saul Subsidiary II Limited Partnership filed as Exhibit 10.(c) of the June 30, 2001 Quarterly Report of the Company is hereby incorporated by reference. The Third Amendment to the First Amended and Restated Agreement of Limited Partnership of Saul Subsidiary II Limited Partnership as filed as exhibit 10.(c) of the 2006 Annual Report of the Company on Form 10-K are hereby incorporated by reference. The Fourth Amendment to the First Amended and Restated Agreement of Limited Partnership of Saul Subsidiary II Limited Partnership is filed herewith. | |||||
| (d) | Property Conveyance Agreement filed as Exhibit 10.4 to Registration Statement No. 33-64562 is hereby incorporated by reference. | |||||
| (e) | Management Functions Conveyance Agreement filed as Exhibit 10.5 to Registration Statement No. 33-64562 is hereby incorporated by reference. | |||||
| (f) | Registration Rights and Lock-Up Agreement filed as Exhibit 10.6 to Registration Statement No. 33-64562 is hereby incorporated by reference. | |||||
| (g) | Exclusivity and Right of First Refusal Agreement filed as Exhibit 10.7 to Registration Statement No. 33-64562 is hereby incorporated by reference. | |||||
| (h) | Agreement of Assumption dated as of August 26, 1993 executed by Saul Holdings Limited Partnership and filed as Exhibit 10.(i) of the 1993 Annual Report of the Company on Form 10-K is hereby incorporated by reference. | |||||
| (i) | Deferred Compensation Plan for Directors, dated as of April 23, 2004 and filed as Exhibit 10.(k) of the June 30, 2004 Quarterly Report of the Company is hereby incorporated by reference. | |||||
| (j) | Loan Agreement dated as of November 7, 1996 by and among Saul Holdings Limited Partnership, Saul Subsidiary II Limited Partnership and PFL Life Insurance Company, c/o AEGON USA Realty Advisors, Inc., filed as Exhibit 10.(t) of the March 31, 1997 Quarterly Report of the Company, is hereby incorporated by reference. | |||||
| (k) | Loan Agreement dated as of October 1, 1997 between Saul Subsidiary I Limited Partnership as Borrower and Nomura Asset Capital Corporation as Lender filed as Exhibit 10.(p) of the 1997 Annual Report of the Company on Form 10-K is hereby incorporated by reference. | |||||
| (l) | Revolving Credit Agreement, dated as of December 19, 2007, by and among Saul Holdings Limited Partnership as Borrower; U.S. Bank National Association, as Administrative Agent and Sole Lead Arranger; Wells Fargo Bank National Association, as Syndication Agent; and U.S. Bank National Association, Wells Fargo Bank National Association, Compass Bank, and Sovereign Bank, as Lenders, as filed as Exhibit 10.(n) of the December 31, 2007 Annual Report of the Company on Form 10-K, is hereby | |||||
63
Table of Contents
| incorporated by reference. Modification to Revolving Credit Agreement, dated April 30, 2009, as filed as Exhibit 10.(l) of the June 30, 2009 Quarterly Report of the Company, is hereby incorporated by reference. Second Modification to Revolving Credit Agreement, dated July 9, 2009, as filed as Exhibit 10.(l) of the June 30, 2009 Quarterly Report of the Company, is hereby incorporated by reference. Third Modification to Revolving Credit Agreement, dated July 28, 2009, as filed as Exhibit 10.(l) of the June 30, 2009 Quarterly Report of the Company, is hereby incorporated by reference. | ||||||
| (m) | Guaranty, dated as of December 19, 2007, by and between Saul Centers, Inc., as Guarantor, and U.S. Bank National Association, as Administrative Agent and Sole Lead Arranger for itself and other financial institutions as Lenders, as filed as Exhibit 10.(o) of the December 31, 2007 Annual Report of the Company on Form 10-K, is hereby incorporated by reference. | |||||
| (n) | The Saul Centers, Inc. 2004 Stock Plan, as filed as Annex A to the Proxy Statement of the Company for its 2004 Annual Meeting of Stockholders, is hereby incorporated by reference. The Amendment to Saul Centers, Inc. 2004 Stock Plan, as filed as Annex A to the Proxy Statement of the Company for its 2008 Annual Meeting of Stockholders, is hereby incorporated by reference. | |||||
| (o) | Form of Director Stock Option Agreements, as filed as Exhibit 10.(j) of the September 30, 2004 Quarterly Report of the Company, is hereby incorporated by reference. | |||||
| (p) | Form of Officer Stock Option Grant Agreements, as filed as Exhibit 10.(k) of the September 30, 2004 Quarterly Report of the Company, is hereby incorporated by reference. | |||||
| (q) | Construction Loan Agreement, dated as of May 14, 2008, by and among Saul Holdings Limited Partnership, U.S. Bank National Association, as agent, and the lenders party to or who become party to such agreement, as filed as Exhibit 10. (a) of the Company’s Current Report on Form 8-K dated May 20, 2008, is hereby incorporated by reference. | |||||
| (r) | Shared Services Agreement, dated as of July 1, 2004, between B. F. Saul Company and Saul Centers, Inc., as filed as Exhibit 10. (a) of the Company’s Current Report on Form 8-K dated October 3, 2008, is hereby incorporated by reference. | |||||
| 21. | Subsidiaries of Saul Centers, Inc. is filed herewith. | |||||
| 23. | Consent of Ernst & Young LLP, Independent Public Accountants is filed herewith. | |||||
| 24. | Power of Attorney (included on signature page). | |||||
| 31. | Rule 13a-14(a)/15d-14(a) Certifications of Chief Executive Officer and Chief Financial Officer are filed herewith. | |||||
| 32. | Section 1350 Certifications of Chief Executive Officer and Chief Financial Officer are filed herewith. | |||||
64
Table of Contents
SIGNATURES
Pursuant to the requirements of Section 13 or 15(d) of the Securities Exchange Act of 1934, the registrant has duly caused this report to be signed on its behalf by the undersigned, thereunto duly authorized.
SAUL CENTERS, INC.
(Registrant)
| Date: March 12 , 2010 | /s/ B. Francis Saul II | |
| B. Francis Saul II | ||
| Chairman of the Board of Directors & Chief Executive Officer (Principal Executive Officer) |
Pursuant to the requirements of the Securities Exchange Act of 1934, as amended, this Report has been signed below by the following persons in the capacities indicated. Each person whose signature appears below hereby constitutes and appoints each of B. Francis Saul II, B. Francis Saul III and Scott V. Schneider as his attorney-in-fact and agent, with full power of substitution and resubstitution for him in any and all capacities, to sign any or all amendments to this Report and to file same, with exhibits thereto and other documents in connection therewith, granting unto such attorney-in-fact and agent full power and authority to do and perform each and every act and thing requisite and necessary in connection with such matters and hereby ratifying and confirming all that such attorney-in-fact and agent or his substitutes may do or cause to be done by virtue hereof.
| Date: March 12 , 2010 | /s/ B. Francis Saul III | |
| B. Francis Saul III, President and Director | ||
| Date: March 12 , 2010 | /s/ Philip D. Caraci | |
| Philip D. Caraci, Vice Chairman | ||
| Date: March 12 , 2010 | /s/ Scott V. Schneider | |
| Scott V. Schneider, Senior Vice President, Treasurer | ||
| and Secretary (Principal Financial Officer) | ||
| Date: March 12 , 2010 | /s/ Joel A. Friedman | |
| Joel A. Friedman, Senior Vice President-Chief | ||
| Accounting Officer (Principal Accounting Officer) | ||
| Date: March 12 , 2010 | /s/ John E. Chapoton | |
| John E. Chapoton, Director | ||
| Date: March 12 , 2010 | /s/ Gilbert M. Grosvenor | |
| Gilbert M. Grosvenor, Director | ||
| Date: March 12 , 2010 | /s/ Philip C. Jackson Jr. | |
| Philip C. Jackson Jr., Director | ||
65
Table of Contents
| Date: March 12 , 2010 | /s/ David B. Kay | |
| David B. Kay, Director | ||
| Date: March 12 , 2010 | /s/ General Paul X. Kelley | |
| General Paul X. Kelley, Director | ||
| Date: March 12 , 2010 | /s/ Charles R. Longsworth | |
| Charles R. Longsworth, Director | ||
| Date: March 12 , 2010 | /s/ Patrick F. Noonan | |
| Patrick F. Noonan, Director | ||
| Date: March 12 , 2010 | /s/ Mark Sullivan III | |
| Mark Sullivan III, Director | ||
| Date: March 12 , 2010 | /s/ James W. Symington | |
| James W. Symington, Director | ||
| Date: March 12 , 2010 | /s/ John R. Whitmore | |
| John R. Whitmore, Director | ||
66
Table of Contents
REPORT OF INDEPENDENT REGISTERED
PUBLIC ACCOUNTING FIRM
Board of Directors and Stockholders
Saul Centers, Inc.
We have audited the accompanying consolidated balance sheets of Saul Centers, Inc. as of December 31, 2009 and 2008, and the related consolidated statements of operations, stockholders’ equity, and cash flows for each of the three years in the period ended December 31, 2009. Our audits also included the financial statement schedule listed in the Index at Item 15(a)2(b). These financial statements and schedule are the responsibility of the Company’s management. Our responsibility is to express an opinion on these financial statements and schedule based on our audits.
We conducted our audits in accordance with the standards of the Public Company Accounting Oversight Board (United States). Those standards require that we plan and perform the audit to obtain reasonable assurance about whether the financial statements are free of material misstatement. An audit includes examining, on a test basis, evidence supporting the amounts and disclosures in the financial statements. An audit also includes assessing the accounting principles used and significant estimates made by management, as well as evaluating the overall financial statement presentation. We believe that our audits provide a reasonable basis for our opinion.
In our opinion, the financial statements referred to above present fairly, in all material respects, the consolidated financial position of Saul Centers, Inc. at December 31, 2009 and 2008, and the consolidated results of its operations and its cash flows for each of the three years in the period ended December 31, 2009, in conformity with U.S. generally accepted accounting principles. Also, in our opinion, the related financial statement schedule, when considered in relation to the basic financial statements taken as a whole, presents fairly in all material respects the information set forth therein.
We also have audited, in accordance with the standards of the Public Company Accounting Oversight Board (United States), Saul Centers, Inc.’s internal control over financial reporting as of December 31, 2009, based on criteria established in Internal Control-Integrated Framework issued by the Committee of Sponsoring Organizations of the Treadway Commission and our report dated March 15, 2010 expressed an unqualified opinion thereon.
| /S/ Ernst & Young LLP |
| McLean, Virginia |
| March 15, 2010 |
F-1
Table of Contents
REPORT OF INDEPENDENT REGISTERED
PUBLIC ACCOUNTING FIRM ON
INTERNAL CONTROL OVER FINANCIAL REPORTING
Board of Directors and Stockholders
Saul Centers, Inc.
We have audited Saul Centers, Inc.’s internal control over financial reporting as of December 31, 2009, based on criteria established in Internal Control—Integrated Framework issued by the Committee of Sponsoring Organizations of the Treadway Commission (the COSO criteria). Saul Centers, Inc.’s management is responsible for maintaining effective internal control over financial reporting, and for its assessment of the effectiveness of internal control over financial reporting included in the accompanying Assessment of Effectiveness of Internal Control over Financial Reporting. Our responsibility is to express an opinion on the Company’s internal control over financial reporting based on our audit.
We conducted our audit in accordance with the standards of the Public Company Accounting Oversight Board (United States). Those standards require that we plan and perform the audit to obtain reasonable assurance about whether effective internal control over financial reporting was maintained in all material respects. Our audit included obtaining an understanding of internal control over financial reporting, assessing the risk that a material weakness exists, testing and evaluating the design and operating effectiveness of internal control based on the assessed risk, and performing such other procedures as we considered necessary in the circumstances. We believe that our audit provides a reasonable basis for our opinion.
A company’s internal control over financial reporting is a process designed to provide reasonable assurance regarding the reliability of financial reporting and the preparation of financial statements for external purposes in accordance with generally accepted accounting principles. A company’s internal control over financial reporting includes those policies and procedures that (1) pertain to the maintenance of records that, in reasonable detail, accurately and fairly reflect the transactions and dispositions of the assets of the company; (2) provide reasonable assurance that transactions are recorded as necessary to permit preparation of financial statements in accordance with generally accepted accounting principles, and that receipts and expenditures of the company are being made only in accordance with authorizations of management and directors of the company; and (3) provide reasonable assurance regarding prevention or timely detection of unauthorized acquisition, use, or disposition of the company’s assets that could have a material effect on the financial statements.
Because of its inherent limitations, internal control over financial reporting may not prevent or detect misstatements. Also, projections of any evaluation of effectiveness to future periods are subject to the risk that controls may become inadequate because of changes in conditions, or that the degree of compliance with the policies or procedures may deteriorate.
In our opinion, Saul Centers, Inc. maintained, in all material respects, effective internal control over financial reporting as of December 31, 2009, based on the COSO criteria.
We also have audited, in accordance with the standards of the Public Company Accounting Oversight Board (United States), the consolidated balance sheets of Saul Centers, Inc. as of December 31, 2009 and 2008 and the related consolidated statements of operations, stockholders’ equity, and cash flows for each of the three years in the period ended December 31, 2009 of Saul Centers, Inc. and our report dated March 15, 2010 expressed an unqualified opinion thereon.
| /s/ Ernst & Young LLP |
| McLean, Virginia |
| March 15, 2010 |
F-2
Table of Contents
CONSOLIDATED BALANCE SHEETS
| (Dollars in thousands, except per share amounts) |
December 31, 2009 |
December 31, 2008 |
||||||
| Assets |
||||||||
| Real estate investments |
||||||||
| Land |
$ | 223,193 | $ | 215,407 | ||||
| Buildings and equipment |
740,442 | 713,154 | ||||||
| Construction in progress |
147,589 | 98,920 | ||||||
| 1,111,224 | 1,027,481 | |||||||
| Accumulated depreciation |
(276,310 | ) | (252,763 | ) | ||||
| 834,914 | 774,718 | |||||||
| Cash and cash equivalents |
20,607 | 13,006 | ||||||
| Accounts receivable and accrued income, net |
37,503 | 37,495 | ||||||
| Deferred leasing costs, net |
15,609 | 16,901 | ||||||
| Prepaid expenses, net |
3,096 | 2,981 | ||||||
| Deferred debt costs, net |
7,537 | 5,875 | ||||||
| Other assets |
6,308 | 2,897 | ||||||
| Total assets |
$ | 925,574 | $ | 853,873 | ||||
| Liabilities |
||||||||
| Mortgage notes payable |
$ | 576,069 | $ | 548,265 | ||||
| Construction loans payable |
60,737 | 19,230 | ||||||
| Dividends and distributions payable |
12,220 | 12,864 | ||||||
| Accounts payable, accrued expenses and other liabilities |
23,395 | 22,394 | ||||||
| Deferred income |
27,090 | 23,233 | ||||||
| Total liabilities |
699,511 | 625,986 | ||||||
| Stockholders’ equity |
||||||||
| Preferred stock, 1,000,000 shares authorized: |
||||||||
| Series A Cumulative Redeemable, 40,000 shares issued and outstanding |
100,000 | 100,000 | ||||||
| Series B Cumulative Redeemable, 31,731 shares issued and outstanding |
79,328 | 79,328 | ||||||
| Common stock, $0.01 par value, 30,000,000 shares authorized, 18,012,416 and 17,863,214 shares issued and outstanding, respectively |
180 | 179 | ||||||
| Additional paid-in capital |
169,363 | 164,278 | ||||||
| Accumulated deficit |
(124,167 | ) | (118,865 | ) | ||||
| Total Saul Centers, Inc. stockholders’ equity |
224,704 | 224,920 | ||||||
| Noncontrolling interest |
1,359 | 2,967 | ||||||
| Total stockholders’ equity |
226,063 | 227,887 | ||||||
| Total liabilities and stockholders’ equity |
$ | 925,574 | $ | 853,873 | ||||
The accompanying notes are an integral part of these statements
F-3
Table of Contents
CONSOLIDATED STATEMENTS OF OPERATIONS
| (Dollars in thousands, except per share amounts) |
For The Year Ended December 31, | |||||||||||
| 2009 | 2008 | 2007 | ||||||||||
| Revenue |
||||||||||||
| Base rent |
$ | 125,845 | $ | 124,999 | $ | 118,806 | ||||||
| Expense recoveries |
29,462 | 29,066 | 26,090 | |||||||||
| Percentage rent |
1,326 | 1,509 | 1,497 | |||||||||
| Other |
4,480 | 4,771 | 4,192 | |||||||||
| Total revenue |
161,113 | 160,345 | 150,585 | |||||||||
| Operating expenses |
||||||||||||
| Property operating expenses |
21,408 | 19,877 | 18,758 | |||||||||
| Provision for credit losses |
919 | 1,113 | 376 | |||||||||
| Real estate taxes |
17,766 | 16,608 | 14,084 | |||||||||
| Interest expense and amortization of deferred debt costs |
34,689 | 34,278 | 33,855 | |||||||||
| Depreciation and amortization of deferred leasing costs |
28,264 | 29,783 | 26,464 | |||||||||
| General and administrative |
12,956 | 12,321 | 11,666 | |||||||||
| Total operating expenses |
116,002 | 113,980 | 105,203 | |||||||||
| Operating income before loss on early extinguishment of debt and gain on property dispositions |
45,111 | 46,365 | 45,382 | |||||||||
| Non-operating items: |
||||||||||||
| Loss on early extinguishment of debt |
(2,210 | ) | — | — | ||||||||
| Gain on property dispositions |
329 | 1,301 | 139 | |||||||||
| Net income |
43,230 | 47,666 | 45,521 | |||||||||
| Noncontrolling interest |
||||||||||||
| Income attributable to the noncontrolling interest |
(6,517 | ) | (7,972 | ) | (8,818 | ) | ||||||
| Net income attributable to Saul Centers, Inc. |
36,713 | 39,694 | 36,703 | |||||||||
| Preferred dividends |
(15,140 | ) | (13,453 | ) | (8,000 | ) | ||||||
| Net income available to common stockholders |
$ | 21,573 | $ | 26,241 | $ | 28,703 | ||||||
| Per share net income available to common stockholders |
||||||||||||
| Basic |
$ | 1.20 | $ | 1.47 | $ | 1.63 | ||||||
| Diluted |
$ | 1.20 | $ | 1.46 | $ | 1.62 | ||||||
| Dividends declared per common share outstanding |
$ | 1.50 | $ | 1.80 | $ | 1.82 | ||||||
The accompanying notes are an integral part of these statements
F-4
Table of Contents
CONSOLIDATED STATEMENTS OF STOCKHOLDERS’ EQUITY
| (Dollars in thousands, except per share amounts) |
Preferred Stock |
Common Stock |
Additional Paid-in Capital |
Accumulated Deficit |
Total Saul Centers, Inc. |
Noncontrolling Interest |
Total | |||||||||||||||||||
| Balance, December 31, 2006 |
$ | 100,000 | $ | 173 | $ | 141,554 | $ | (109,636 | ) | $ | 132,091 | $ | 5,785 | $ | 137,876 | |||||||||||
| Issuance of 406,088 shares of common stock: |
||||||||||||||||||||||||||
| 389,197 shares due to dividend reinvestment plan |
— | 5 | 18,720 | — | 18,725 | — | 18,725 | |||||||||||||||||||
| 16,891 shares due to employee stock options and directors’ deferred stock plan and stock option awards |
— | — | 1,344 | — | 1,344 | — | 1,344 | |||||||||||||||||||
| Net income |
— | — | — | 36,703 | 36,703 | 8,818 | 45,521 | |||||||||||||||||||
| Distributions of preferred stock, Series A |
(6,000 | ) | (6,000 | ) | (6,000 | ) | ||||||||||||||||||||
| Common stock distributions |
— | — | — | (23,743 | ) | (23,743 | ) | (7,312 | ) | (31,055 | ) | |||||||||||||||
| Distributions payable preferred stock, Series A ($50.00 per share) |
— | — | — | (2,000 | ) | (2,000 | ) | — | (2,000 | ) | ||||||||||||||||
| Distributions payable common stock ($0.47/share) and |
— | |||||||||||||||||||||||||
| distributions payable partnership units ($0.47/share) |
— | — | — | (8,341 | ) | (8,341 | ) | (2,546 | ) | (10,887 | ) | |||||||||||||||
| Balance, December 31, 2007 |
100,000 | 178 | 161,618 | (113,017 | ) | 148,779 | 4,745 | 153,524 | ||||||||||||||||||
| Issuance of 31,731 shares of Series B preferred stock |
79,328 | — | (3,007 | ) | — | 76,321 | — | 76,321 | ||||||||||||||||||
| Issuance of 115,685 shares of common stock: |
||||||||||||||||||||||||||
| 83,820 shares due to dividend reinvestment plan |
— | 1 | 3,940 | — | 3,941 | — | 3,941 | |||||||||||||||||||
| 31,865 shares due to employee stock options and directors’ deferred stock plan and stock option awards |
— | — | 1,727 | — | 1,727 | — | 1,727 | |||||||||||||||||||
| Net income |
— | — | — | 39,694 | 39,694 | 7,972 | 47,666 | |||||||||||||||||||
| Distributions of preferred stock: |
||||||||||||||||||||||||||
| Series A |
— | — | — | (6,000 | ) | (6,000 | ) | — | (6,000 | ) | ||||||||||||||||
| Series B |
— | — | — | (3,668 | ) | (3,668 | ) | — | (3,668 | ) | ||||||||||||||||
| Common stock distributions |
— | — | — | (25,122 | ) | (25,122 | ) | (7,637 | ) | (32,759 | ) | |||||||||||||||
| Distributions payable preferred stock: |
||||||||||||||||||||||||||
| Series A, $50.00 per share |
— | — | — | (2,000 | ) | (2,000 | ) | — | (2,000 | ) | ||||||||||||||||
| Series B, $56.25 per share |
— | — | — | (1,785 | ) | (1,785 | ) | — | (1,785 | ) | ||||||||||||||||
| Distributions payable common stock ($0.39/share) and distributions payable partnership units ($0.39/share) |
— | — | — | (6,967 | ) | (6,967 | ) | (2,113 | ) | (9,080 | ) | |||||||||||||||
| Balance, December 31, 2008 |
179,328 | 179 | 164,278 | (118,865 | ) | 224,920 | 2,967 | 227,887 | ||||||||||||||||||
| Issuance of 149,202 shares of common stock: |
||||||||||||||||||||||||||
| 136,447 shares due to dividend reinvestment plan |
— | 1 | 4,136 | — | 4,137 | — | 4,137 | |||||||||||||||||||
| 12,755 shares due to employee stock options and directors’ deferred stock plan and stock option awards |
— | — | 949 | — | 949 | — | 949 | |||||||||||||||||||
| Net income |
— | — | — | 36,713 | 36,713 | 6,517 | 43,230 | |||||||||||||||||||
| Distributions of preferred stock: |
||||||||||||||||||||||||||
| Series A |
— | — | — | (6,000 | ) | (6,000 | ) | — | (6,000 | ) | ||||||||||||||||
| Series B |
— | — | — | (5,355 | ) | (5,355 | ) | — | (5,355 | ) | ||||||||||||||||
| Common stock distributions |
— | — | — | (20,390 | ) | (20,390 | ) | (6,175 | ) | (26,565 | ) | |||||||||||||||
| Distributions payable preferred stock: |
||||||||||||||||||||||||||
| Series A, $50.00 per share |
— | — | — | (2,000 | ) | (2,000 | ) | — | (2,000 | ) | ||||||||||||||||
| Series B, $56.25 per share |
— | — | — | (1,785 | ) | (1,785 | ) | — | (1,785 | ) | ||||||||||||||||
| Distributions payable common stock ($0.36/share) and distributions payable partnership units ($0.36/share) |
— | — | — | (6,485 | ) | (6,485 | ) | (1,950 | ) | (8,435 | ) | |||||||||||||||
| Balance, December 31, 2009 |
$ | 179,328 | $ | 180 | $ | 169,363 | $ | (124,167 | ) | $ | 224,704 | $ | 1,359 | $ | 226,063 | |||||||||||
The accompanying notes are an integral part of these statements
F-5
Table of Contents
CONSOLIDATED STATEMENTS OF CASH FLOWS
| For The Year Ended December 31, | ||||||||||||
| (Dollars in thousands) |
2009 | 2008 | 2007 | |||||||||
| Cash flows from operating activities: |
||||||||||||
| Net income |
$ | 43,230 | $ | 47,666 | $ | 45,521 | ||||||
| Adjustments to reconcile net income to net cash provided by operating activities: |
||||||||||||
| Gain on property dispositions |
(329 | ) | (1,301 | ) | (139 | ) | ||||||
| Depreciation and amortization of deferred leasing costs |
28,264 | 29,783 | 26,464 | |||||||||
| Amortization of deferred debt costs |
2,004 | 1,162 | 1,149 | |||||||||
| Non cash compensation costs from stock grants and options |
901 | 1,125 | 1,111 | |||||||||
| Provision for credit losses |
919 | 1,113 | 376 | |||||||||
| Increase in accounts receivable and accrued income |
(820 | ) | (3,850 | ) | (1,095 | ) | ||||||
| Increase in deferred leasing costs |
(3,061 | ) | (3,382 | ) | (2,692 | ) | ||||||
| Increase in prepaid expenses |
(115 | ) | (410 | ) | (64 | ) | ||||||
| (Increase) decrease in other assets |
(3,411 | ) | 2,531 | 177 | ||||||||
| Increase (decrease) in accounts payable, accrued expenses and other liabilities |
1,277 | (698 | ) | 598 | ||||||||
| Increase (decrease) in deferred income |
165 | (638 | ) | (209 | ) | |||||||
| Net cash provided by operating activities |
69,024 | 73,101 | 71,197 | |||||||||
| Cash flows from investing activities: |
||||||||||||
| Acquisitions of real estate investments, net (1) |
— | (63,406 | ) | (23,744 | ) | |||||||
| Additions to real estate investments |
(7,256 | ) | (9,986 | ) | (7,302 | ) | ||||||
| Additions to development and redevelopment activities |
(73,464 | ) | (42,513 | ) | (20,990 | ) | ||||||
| Proceeds from property dispositions |
251 | 835 | — | |||||||||
| Net cash used in investing activities |
(80,469 | ) | (115,070 | ) | (52,036 | ) | ||||||
| Cash flows from financing activities: |
||||||||||||
| Proceeds from mortgage notes payable |
119,882 | 29,775 | 52,000 | |||||||||
| Repayments on mortgage notes payable |
(92,078 | ) | (16,585 | ) | (14,717 | ) | ||||||
| Proceeds from construction loans payable |
41,507 | 19,230 | — | |||||||||
| Proceeds from revolving credit facility |
30,000 | 19,000 | 20,000 | |||||||||
| Repayments on revolving credit facility |
(30,000 | ) | (27,000 | ) | (47,000 | ) | ||||||
| Additions to deferred debt costs |
(3,666 | ) | (773 | ) | (2,085 | ) | ||||||
| Proceeds from the issuance of: |
||||||||||||
| Series B preferred stock, net of issuance costs |
— | 76,321 | — | |||||||||
| Common stock |
4,185 | 4,543 | 18,958 | |||||||||
| Distributions to: |
||||||||||||
| Series A preferred stockholders |
(8,000 | ) | (8,000 | ) | (8,000 | ) | ||||||
| Series B preferred stockholders |
(7,140 | ) | (3,668 | ) | — | |||||||
| Common stockholders |
(27,358 | ) | (33,450 | ) | (31,026 | ) | ||||||
| Noncontrolling interest |
(8,287 | ) | (10,183 | ) | (9,587 | ) | ||||||
| Net cash provided by (used in) financing activities |
19,045 | 49,210 | (21,457 | ) | ||||||||
| Net increase (decrease) in cash and cash equivalents |
7,600 | 7,241 | (2,296 | ) | ||||||||
| Cash and cash equivalents, beginning of period |
13,006 | 5,765 | 8,061 | |||||||||
| Cash and cash equivalents, end of period |
$ | 20,606 | $ | 13,006 | $ | 5,765 | ||||||
| Supplemental disclosure of cash flow information: |
||||||||||||
| Cash paid for interest |
$ | 40,973 | $ | 37,179 | $ | 35,684 | ||||||
Supplemental discussion of non-cash investing and financing activities:
| (1) | The 2008 real estate acquisition costs of $63,406 are presented exclusive of a mortgage loan assumed of $10,349. |
The accompanying notes are an integral part of these statements
F-6
Table of Contents
Notes to Consolidated Financial Statements
1. ORGANIZATION, FORMATION, AND BASIS OF PRESENTATION
Organization
Saul Centers, Inc. (“Saul Centers”) was incorporated under the Maryland General Corporation Law on June 10, 1993. Saul Centers operates as a real estate investment trust (a “REIT”) under the Internal Revenue Code of 1986, as amended (the “Code”). The Company is required to annually distribute at least 90% of its REIT taxable income (excluding net capital gains) to its stockholders and meet certain organizational and other requirements. Saul Centers has made and intends to continue to make regular quarterly distributions to its stockholders. Saul Centers, together with its wholly owned subsidiaries and the limited partnerships of which Saul Centers or one of its subsidiaries is the sole general partner, are referred to collectively as the “Company”. B. Francis Saul II serves as Chairman of the Board of Directors and Chief Executive Officer of Saul Centers.
Formation and Structure of Company
Saul Centers was formed to continue and expand the shopping center business previously owned and conducted by the B.F. Saul Real Estate Investment Trust, the B.F. Saul Company and certain other affiliated entities, each of which is controlled by B. Francis Saul II and his family members (collectively, “The Saul Organization”). On August 26, 1993, members of The Saul Organization transferred to Saul Holdings Limited Partnership, a newly formed Maryland limited partnership (the “Operating Partnership”), and two newly formed subsidiary limited partnerships (the “Subsidiary Partnerships”, and collectively with the Operating Partnership, the “Partnerships”), shopping center and office properties, and the management functions related to the transferred properties. Since its formation, the Company has developed and purchased additional properties.
The following table lists the properties acquired and/or developed by the Company since December 31, 2006. The following are operating shopping centers (“Shopping Centers”). Two shopping centers, Northrock and Westview, have been recently constructed and only a portion of their total square footage has been leased and placed in service.
| Name of Property |
Location |
Date of Acquisition/ Development | ||
| Acquisitions |
||||
| Orchard Park |
Dunwoody, GA | 2007 | ||
| Great Falls Shopping Center |
Great Falls, VA | 2008 | ||
| BJ’s Wholesale Club |
Alexandria, VA | 2008 | ||
| Marketplace at Sea Colony |
Bethany Beach, DE | 2008 | ||
| Developments |
||||
| Ashland Square Phase I |
Manassas, VA | 2007 | ||
| Northrock |
Warrenton, VA | 2009 | ||
| Westview Village |
Frederick, MD | 2009 | ||
As of December 31, 2009, the Company’s properties (the “Current Portfolio Properties”) consisted of 47 operating shopping center properties (the “Shopping Centers”), five predominantly office operating properties (the “Office Properties”) and four (non-operating) development properties.
The Company established Saul QRS, Inc., a wholly owned subsidiary of Saul Centers, to facilitate the placement of collateralized mortgage debt. Saul QRS, Inc. was created to succeed to the interest of Saul Centers as the sole general partner of Saul Subsidiary I Limited Partnership. The remaining limited partnership interests in Saul Subsidiary I Limited Partnership and Saul Subsidiary II Limited Partnership are held by the Operating Partnership as the sole limited partner. Through this structure, the Company owns 100% of the Current Portfolio Properties.
F-7
Table of Contents
SAUL CENTERS, INC.
Notes to Consolidated Financial Statements
Basis of Presentation
The accompanying financial statements of the Company have been presented on the historical cost basis of The Saul Organization because of affiliated ownership and common management and because the assets and liabilities were the subject of a business combination with the Operating Partnership, the Subsidiary Partnerships and Saul Centers, all newly formed entities with no prior operations.
2. SUMMARY OF SIGNIFICANT ACCOUNTING POLICIES
Nature of Operations
The Company, which conducts all of its activities through its subsidiaries, the Operating Partnership and Subsidiary Partnerships, engages in the ownership, operation, management, leasing, acquisition, renovation, expansion, development and financing of community and neighborhood shopping centers and office properties, primarily in the Washington, DC/Baltimore metropolitan area. Because the properties are located primarily in the Washington, DC/Baltimore metropolitan area, the Company is subject to a concentration of credit risk related to these properties. A majority of the Shopping Centers are anchored by several major tenants. As of December 31, 2009, thirty-one of the Shopping Centers were anchored by a grocery store and offer primarily day-to-day necessities and services. Three retail tenants, Giant Food (4.4%), a tenant at eight Shopping Centers, Safeway (3.2%), a tenant at eight Shopping Centers and Chevy Chase Bank (2.7%), a tenant at twenty properties, and one office tenant, the United States Government (2.8%), a tenant at seven properties, individually accounted for more than 2.5% of the Company’s total revenue for the year ended December 31, 2009.
Principles of Consolidation
The accompanying consolidated financial statements of the Company include the accounts of Saul Centers, its subsidiaries, and the Operating Partnership and Subsidiary Partnerships which are majority owned by Saul Centers. All significant intercompany balances and transactions have been eliminated in consolidation.
Use of Estimates
The preparation of financial statements in conformity with U.S. generally accepted accounting principles requires management to make estimates and assumptions that affect the reported amounts of assets and liabilities and disclosure of contingent assets and liabilities at the date of the financial statements and the reported amounts of revenue and expenses during the reporting period. Actual results could differ from those estimates.
Real Estate Investment Properties
The Company purchases real estate investment properties from time to time and records assets acquired and liabilities assumed, including land, buildings, and intangibles related to in-place leases and customer relationships, based on their fair values. The Company determines the estimated fair values of the assets and liabilities in accordance with current GAAP fair value provisions. The Company estimates the fair value of buildings on an as-if–vacant basis upon acquisition and then subsequently leased at market rental rates. As such, the determination of fair value considers the present value of all cash flows expected to be generated from the property including an initial lease up period. The Company estimates the fair value of above and below market intangibles associated with in-place leases by assessing the net effective rent and remaining term of the lease relative to market terms for similar leases at acquisition. In the case of above and below market leases, the Company considers the remaining contractual lease period and renewal periods, taking into consideration the likelihood of the tenant exercising its renewal options. The fair value of a below market lease component is recorded as deferred income and amortized as additional lease revenue over the remaining contractual lease period and any renewal option periods included in the valuation analysis. The fair value of above market lease intangibles is recorded as a deferred asset and is amortized as a reduction of lease revenue over the remaining contractual lease term. The Company estimates the fair value of at-market in-place leases considering the cost of acquiring similar leases, the foregone rents associated with the lease-up period and carrying costs associated with the lease-up period. Intangible assets associated with at-market in-place leases are amortized as additional expense over the remaining contractual lease term. To the extent customer relationship intangibles are present in an acquisition, the fair values of the intangibles are amortized over the lives of the customer relationships. The Company has never recorded a customer relationship intangible asset. Effective January 1, 2009, acquisition-related transaction costs will be expensed as incurred.
F-8
Table of Contents
SAUL CENTERS, INC.
Notes to Consolidated Financial Statements
If there is an event or change in circumstance that indicates an impairment in the value of a real estate investment property, the Company prepares an impairment analysis to assess that the carrying value of the real estate investment property does not exceed its estimated fair value. The Company considers both quantitative and qualitative factors including recurring operating losses, significant decreases in occupancy, and significant adverse changes in legal factors and business climate. If impairment indicators are present the Company performs a comparison of the projected cash flows of the property over its remaining useful life, on an undiscounted basis, to the carrying value of that property. The Company assesses its undiscounted projected cash flows based upon estimated capitalization rates, historic operating results and market conditions that may affect the property. If such carrying value is greater than the undiscounted projected cash flows, the Company would recognize an impairment loss equivalent to an amount required to adjust the carrying amount to its then estimated fair market value. The value of any property is sensitive to the actual results of any of the aforementioned estimated factors, either individually or taken as a whole. Should the actual results differ from management’s projections, the valuation could be negatively or positively affected. The Company did not recognize an impairment loss on any of its real estate in 2009, 2008 or 2007.
Interest, real estate taxes, development related salary costs and other carrying costs are capitalized on projects under development and construction. Once construction is substantially completed and the assets are placed in service, their rental income, real estate tax expense, property operating expenses (consisting of payroll, repairs and maintenance, utilities, insurance and other property related expenses) and depreciation are included in current operations. Property operating expenses are charged to operations as incurred. Interest expense capitalized totaled $5,989,000, $4,159,000 and $2,889,000, for 2009, 2008 and 2007, respectively. In the initial rental operations of development projects, a project is considered substantially complete and available for occupancy upon completion of tenant improvements, but no later than one year from the cessation of major construction activity. Substantially completed portions of a project are accounted for as separate projects.
Depreciation is calculated using the straight-line method and estimated useful lives of 35 to 50 years for base buildings and up to 20 years for certain other improvements that extend the useful lives. In addition, we capitalize leasehold improvements when certain criteria are met, including when we supervise construction and will own the improvement. Tenant improvements are amortized, over the shorter of the lives of the related leases or the useful life of the improvement, using the straight-line method. Depreciation expense and amortization of leasehold improvements for the years ended December 31, 2009, 2008 and 2007 was $23,911,000, $24,761,000 and $21,638,000, respectively. Repairs and maintenance expense totaled $10,111,000, $9,106,000 and $8,926,000, for 2009, 2008 and 2007, respectively, and is included in property operating expenses in the accompanying consolidated financial statements.
Deferred Leasing Costs
Deferred leasing costs consist of commissions paid to third-party leasing agents, internal direct costs such as employee compensation and payroll-related fringe benefits directly related to time spent performing leasing-related activities for successful leases and amounts attributed to in place leases associated with acquired properties. Leasing related activities include evaluating the prospective tenant’s financial condition, evaluating and recording guarantees, collateral and other security arrangements, negotiating lease terms, preparing lease documents and closing the transaction. The carrying amount of these costs is written-off to expense if the applicable lease is terminated prior to expiration of the initial lease term. Deferred leasing costs are amortized over the initial term of the lease or remaining initial term of acquired leases. Collectively, deferred leasing costs totaled $15,609,000 and $16,901,000, net of accumulated amortization of approximately $14,889,000 and $15,196,000, as of December 31, 2009 and 2008, respectively. Amortization expense, included in depreciation and amortization in the consolidated statements of operations, totaled approximately $4,353,000, $5,022,000 and $4,826,000, for the years ended December 31, 2009, 2008 and 2007, respectively.
F-9
Table of Contents
SAUL CENTERS, INC.
Notes to Consolidated Financial Statements
Construction in Progress
Construction in progress includes preconstruction and development costs of active projects. Preconstruction costs include legal, zoning and permitting costs and other project carrying costs incurred prior to the commencement of construction. Development costs include direct construction costs and indirect costs incurred subsequent to the start of construction such as architectural, engineering, construction management and carrying costs consisting of interest, real estate taxes and insurance. Construction in progress balances as of December 31, 2009 and 2008 are as follows:
Construction in Progress
| December 31, | ||||||
| (In thousands) | 2009 | 2008 | ||||
| Clarendon Center |
$ | 115,810 | $ | 49,836 | ||
| Northrock |
11,910 | 21,656 | ||||
| Westview Village |
18,730 | 17,240 | ||||
| Smallwood Village Center |
— | 6,290 | ||||
| Boulevard |
— | 2,925 | ||||
| Other |
1,139 | 973 | ||||
| Total |
$ | 147,589 | $ | 98,920 | ||
As of December 31, 2009, 64% of the leasable area at Northrock had been placed in operation. The development costs related to the area in operation have been reclassified to land and buildings. The costs reported in Construction in Progress above reflect the costs incurred as of December 31, 2009 and 2008, for the remaining 36% and 100% of the leasable area, respectively. As of December 31, 2009, 15% of the leasable area at Westview Village had been placed in operation. The development costs related to the area in operation have been reclassified to land and buildings. The costs reported in Construction in Progress above reflect the costs incurred as of December 31, 2009 and 2008, for the remaining 85% and 100% of the leasable area, respectively.
Accounts Receivable and Accrued Income
Accounts receivable primarily represent amounts currently due from tenants in accordance with the terms of the respective leases. Receivables are reviewed monthly and reserves are established with a charge to current period operations when, in the opinion of management, collection of the receivable is doubtful. Accounts receivable in the accompanying consolidated financial statements are shown net of an allowance for doubtful accounts of $1,265,000 and $914,000, at December 31, 2009 and 2008, respectively.
Allowance for Doubtful Accounts
| Year ended December 31, | ||||||||||||
| (In thousands) | 2009 | 2008 | 2007 | |||||||||
| Beginning Balance |
$ | 914 | $ | 387 | $ | 479 | ||||||
| Provision for Credit Losses |
919 | 1,113 | 376 | |||||||||
| Charge-offs |
(568 | ) | (586 | ) | (468 | ) | ||||||
| Ending Balance |
$ | 1,265 | $ | 914 | $ | 387 | ||||||
In addition to rents due currently, accounts receivable also includes $27,154,000 and $25,766,000, at December 31, 2009 and 2008, respectively, net of allowance for doubtful accounts totaling $15,000 and $155,000, respectively, representing minimum rental income accrued on a straight-line basis to be paid by tenants over the remaining term of their respective leases.
F-10
Table of Contents
SAUL CENTERS, INC.
Notes to Consolidated Financial Statements
Cash and Cash Equivalents
Cash and cash equivalents include short-term investments. Short-term investments include money market accounts and other investments which generally mature within three months, measured from the acquisition date, and/or are readily convertible to cash. Substantially all of the Company’s cash balances at December 31, 2009 are held in non-interest bearing accounts at various banks.
Deferred Debt Costs
Deferred debt costs consist of fees and costs incurred to obtain long-term financing, construction financing and the revolving line of credit. These fees and costs are being amortized on a straight-line basis over the terms of the respective loans or agreements, which approximates the effective interest method. Deferred debt costs totaled $7,537,000 and $5,875,000, net of accumulated amortization of $5,161,000 and $5,079,000, at December 31, 2009 and 2008, respectively.
Deferred Income
Deferred income consists of payments received from tenants prior to the time they are earned and recognized by the Company as revenue, including tenant prepayment of rent for future periods, real estate taxes when the taxing jurisdiction has a fiscal year differing from the calendar year reimbursements specified in the lease agreement and tenant construction work provided by the Company. In addition, deferred income includes the fair value of certain below market leases.
Revenue Recognition
Rental and interest income is accrued as earned except when doubt exists as to collectibility, in which case the accrual is discontinued. Recognition of rental income commences when control of the space has been given to the tenant. When rental payments due under leases vary from a straight-line basis because of free rent periods or stepped increases, income is recognized on a straight-line basis. Expense recoveries represent a portion of property operating expenses billed to the tenants, including common area maintenance, real estate taxes and other recoverable costs. Expense recoveries are recognized in the period in which the expenses are incurred. Rental income based on a tenant’s revenue (“percentage rent”) is accrued when a tenant reports sales that exceed a specified breakpoint, pursuant to the terms of their respective leases.
Income Taxes
The Company made an election to be treated, and intends to continue operating so as to qualify, as a REIT under the Code, commencing with its taxable year ended December 31, 1993. A REIT generally will not be subject to federal income taxation, provided that distributions to its stockholders equal or exceed its REIT taxable income and complies with certain other requirements. Therefore, no provision has been made for federal income taxes in the accompanying consolidated financial statements.
As of December 31, 2009, the Company had no material unrecognized tax benefits and there exist no potentially significant unrecognized tax benefits which are reasonably expected to occur within the next twelve months. The Company recognizes penalties and interest accrued related to unrecognized tax benefits, if any, as general and administrative expense. No penalties and interest have been accrued in years 2009, 2008 and 2007. The tax basis of the Company’s real estate investments was approximately $750,188,000 and $745,700,000, as of December 31, 2009 and 2008, respectively. With few exceptions, the Company is no longer subject to U.S. federal, state, and local tax examinations by tax authorities for years before 2005.
Stock Based Employee Compensation, Deferred Compensation and Stock Plan for Directors
Effective January 2003, the Company adopted the fair value method to value and account for employee stock options using the prospective transition method. The Company had no options eligible for valuation prior to
F-11
Table of Contents
SAUL CENTERS, INC.
Notes to Consolidated Financial Statements
the grant of options in 2003. The fair value of options granted is determined at the time of each award using the Black-Scholes model, a widely used method for valuing stock based employee compensation, and the following assumptions: (1) Expected Volatility determined using the most recent trading history of the Company’s common stock (month-end closing prices) corresponding to the average expected term of the options; (2) Average Expected Term of the options is based on prior exercise history, scheduled vesting and the expiration date; (3) Expected Dividend Yield determined by management after considering the Company’s current and historic dividend yield rates, the Company’s yield in relation to other retail REITs and the Company’s market yield at the grant date; and (4) a Risk-free Interest Rate based upon the market yields of US Treasury obligations with maturities corresponding to the average expected term of the options at the grant date. The Company amortizes the value of options granted ratably over the vesting period and includes the amounts as compensation in general and administrative expenses.
At the annual meeting of the Company’s stockholders in 2004, the stockholders approved the adoption of the 2004 stock plan for the purpose of attracting and retaining executive officers, directors and other key personnel. The 2004 stock plan was subsequently amended by the Company’s stockholders at the 2008 Annual Meeting (the “Amended 2004 Plan”) and terminates in April 2018. Pursuant to the Amended 2004 Plan, the Compensation Committee established a Deferred Compensation Plan for Directors for the benefit of its directors and their beneficiaries, which replaced a previous Deferred Compensation and Stock Plan for Directors. A director may make an annual election to defer all or part of his or her director’s fees and has the option to have the fees paid in cash, in shares of common stock or in a combination of cash and shares of common stock upon termination from the Board. If the director elects to have fees paid in stock, fees earned during a calendar quarter are aggregated and divided by the common stock’s closing market price on the first trading day of the following quarter to determine the number of shares to be allocated to the director. As of December 31, 2009, 219,000 shares had been credited to the directors’ deferred fee accounts.
The Compensation Committee has also approved an annual award of shares of the Company’s common stock as additional compensation to each director serving on the Board of Directors as of the record date for the Annual Meeting of Stockholders. The shares are awarded as of each Annual Meeting of Shareholders, and their issuance may not be deferred. Each director was issued 200 shares for each of the years ended December 31, 2009, 2008 and 2007. The shares were valued at the closing stock price on the dates the shares were awarded and included in general and administrative expenses in the total amounts of $85,000, $120,000 and $130,000, for the years ended December 31, 2009, 2008 and 2007, respectively.
Noncontrolling Interest
Saul Centers is the sole general partner of the Operating Partnership, owning a 76.9% common interest as of December 31, 2009. Noncontrolling interest in the Operating Partnership is comprised of limited partnership units owned by The Saul Organization. Noncontrolling interest as reflected on the accompanying consolidated balance sheets is increased for earnings allocated to limited partnership interests and distributions reinvested in additional units, and is decreased for limited partner distributions. Noncontrolling interest as reflected on the consolidated statements of operations represent earnings allocated to limited partnership interests held by The Saul Organization.
Per Share Data
Per share data for net income (basic and diluted) is computed using weighted average shares of common stock. Convertible limited partnership units and employee stock options are the Company’s potentially dilutive securities. For all periods presented, the convertible limited partnership units are anti-dilutive. For the years ended December 31, 2009, 2008 and 2007 certain options are dilutive because the average share price of the Company’s common stock exceeded the exercise prices. The treasury stock method was used to measure the effect of the dilution.
F-12
Table of Contents
SAUL CENTERS, INC.
Notes to Consolidated Financial Statements
Basic and Diluted Shares Outstanding
| December 31 | |||||||||
| (In thousands) | 2009 | 2008 | 2007 | ||||||
| Weighted average common shares outstanding – Basic |
17,904 | 17,816 | 17,589 | ||||||
| Effect of dilutive options |
39 | 145 | 180 | ||||||
| Weighted average common shares outstanding – Diluted |
17,943 | 17,961 | 17,769 | ||||||
| Average Share Price |
$ | 30.63 | $ | 45.98 | $ | 52.22 | |||
Legal Contingencies
The Company is subject to various legal proceedings and claims that arise in the ordinary course of business. These matters are generally covered by insurance. Upon determination that a loss is probable to occur and can be reasonably estimated, the estimated amount of the loss is recorded in the financial statements.
New Accounting Standards
The Company adopted provisions of the Financial Accounting Standards Board (“FASB”) Accounting Standards Codification (“ASC”) Consolidation Topic on January 1, 2009. These provisions of the Consolidation Topic establish new accounting and reporting requirements for a noncontrolling (or minority) interest in a subsidiary and for the deconsolidation of a subsidiary. Specifically, these provisions require (i) the reclassification of minority interest in the consolidated balance sheets of the Company to noncontrolling interest, a component of permanent equity, (ii) the reclassification of minority interest expense to net income attributable to noncontrolling interest on the consolidated statements of operations, (iii) the inclusion of noncontrolling interest in the statement of stockholders’ equity, and (iv) additional disclosures, including noncontrolling interest activity. Adoption of these provisions in the Consolidation Topic did not have a material impact on the Company’s reported consolidated financial position, results of operations or cash flows.
The Company adopted provisions of the ASC Business Combinations Topic on January 1, 2009. These provisions require most identifiable assets and liabilities acquired in a business combination be recorded at “full fair value.” Transaction costs are no longer included in the measurement of the business acquired. Instead, these items are expensed as incurred. These provisions apply prospectively to business combinations.
In the second quarter of 2009, the Company adopted provisions of the ASC Subsequent Events Topic. These provisions establish general standards of accounting for and disclosure of events that occur after the balance sheet date but before financial statements are issued or are available to be issued.
3. REAL ESTATE ACQUIRED
Orchard Park
On July 19, 2007, the Company purchased for $17.0 million the Kroger-anchored Orchard Park shopping center located in Dunwoody, GA.
Westview Village
In November 2007, the Company purchased for $5.0 million a land parcel in the Westview development in Frederick, Maryland. In 2009, the Company completed construction of a neighborhood retail and office center.
Northrock
In January 2008, the Company purchased for $12.5 million an undeveloped land parcel in Warrenton, Virginia. In 2009, the Company completed construction of a neighborhood shopping center which is anchored by a Harris Teeter supermarket.
F-13
Table of Contents
SAUL CENTERS, INC.
Notes to Consolidated Financial Statements
Great Falls Center
On March 28, 2008, the Company purchased for $36.6 million (including the assumption of a $10.3 million mortgage loan) the Safeway-anchored Great Falls Center located in Great Falls, Virginia. As of the date of acquisition, management determined the mortgage loan was fairly valued because the terms of the loan were not materially different from market terms.
BJ’s Wholesale Club
On March 28, 2008, the Company purchased for $21.0 million the single tenant property anchored by BJ’s Wholesale Club, located in Alexandria, Virginia.
Marketplace at Sea Colony
On March 28, 2008, the Company purchased for $3.0 million Marketplace at Sea Colony, located in Bethany Beach, Delaware.
Allocation of Purchase Price for Real Estate Acquired
The Company allocates the purchase price to various components, such as land, buildings and intangibles related to in-place leases and customer relationships, if applicable. See Note 2. Significant Accounting Policies-Real Estate Investment Properties. Of the combined $61,100,000 total cost of the operating property acquisitions in 2008, which excludes amounts related to acquisitions of undeveloped land, which includes the properties’ purchase price and closing costs, a total of $2,351,000 was allocated to lease intangible assets and included in lease acquisition costs at December 31, 2008. The lease intangible assets are being amortized over the remaining periods of the leases acquired, a weighted average term of 16 years. The values of below market leases, totaling $8,724,000, are being amortized over a weighted average term of 20 years, and are included in deferred income. The values of above market leases, totaling $148,000, are being amortized over a weighted average term of 5 years, and are included as a deferred asset in accounts receivable. The Company did not acquire any properties in 2009.
The gross carrying amount of lease intangible assets included in deferred leasing costs was $13,736,000 at both December 31, 2009 and 2008, and accumulated amortization was $10,711,000 and $9,506,000, for December 31, 2009 and 2008, respectively. Amortization expense totaled $1,205,000, $1,908,000 and $1,918,000, for the years ended December 31, 2009, 2008 and 2007, respectively. The gross carrying amount of below market lease intangible liabilities included in deferred income was $18,402,000 at both December 31, 2009 and 2008, and accumulated amortization was $4,474,000 and $3,151,000, respectively. Accretion income totaled $1,323,000, $1,552,000 and $580,000, for the years ended December 31, 2009, 2008 and 2007, respectively. The gross carrying amount of above market lease intangible assets included in accounts receivable was $874,000 at both December 31, 2009 and 2008, and accumulated amortization was $746,000 and $670,000 respectively. Amortization expense totaled $76,000, $106,000 and $107,000, for the years ended December 31, 2009, 2008 and 2007, respectively.
As of December 31, 2009, scheduled amortization of intangible assets and deferred income related to in place leases is as follows:
Amortization of Intangible Assets and Deferred Income Related to Acquired In-place Leases
| (In thousands) | Lease acquisition costs |
Above market leases |
Below market leases |
Total | ||||||||||
| 2010 |
$ | (738 | ) | $ | (62 | ) | $ | 1,086 | $ | 286 | ||||
| 2011 |
(433 | ) | (29 | ) | 865 | 403 | ||||||||
| 2012 |
(268 | ) | (25 | ) | 771 | 478 | ||||||||
| 2013 |
(203 | ) | (12 | ) | 714 | 499 | ||||||||
| 2014 |
(124 | ) | — | 706 | 582 | |||||||||
| Thereafter |
(1,259 | ) | — | 9,786 | 8,527 | |||||||||
| Total |
$ | (3,025 | ) | $ | (128 | ) | $ | 13,928 | $ | 10,775 | ||||
F-14
Table of Contents
SAUL CENTERS, INC.
Notes to Consolidated Financial Statements
The results of operations of the acquired properties are included in the consolidated statements of operations as of the acquisition date. The following unaudited pro-forma consolidated condensed statements of operations set forth the consolidated results of operations for the years ended December 31, 2008 and 2007 as if the above described operating property acquisitions had occurred on January 1, 2008 and 2007. The unaudited pro-forma information does not purport to be indicative of the results that actually would have occurred if the combinations had been in effect for the years ended December 31, 2008 and 2007.
Pro-Forma Consolidated Condensed Statements of Operations
| Year ended December 31, | |||||||||
| (In thousands, except per share data) | 2009 | 2008 | 2007 | ||||||
| Real estate revenue |
$ | 161,113 | $ | 161,610 | $ | 155,353 | |||
| Net income available to common shareholders |
$ | 21,573 | $ | 26,337 | $ | 28,264 | |||
| Net income per common share – basic |
$ | 1.20 | $ | 1.48 | $ | 1.61 | |||
| Net income per common share – diluted |
$ | 1.20 | $ | 1.47 | $ | 1.59 | |||
4. NONCONTROLLING INTEREST - HOLDERS OF CONVERTIBLE LIMITED PARTNERSHIP UNITS IN THE OPERATING PARTNERSHIP
The Saul Organization holds a 23.1% limited partnership interest, represented by 5,416,000 convertible limited partnership units in the Operating Partnership, as of December 31, 2009. These convertible limited partnership units are convertible into shares of Saul Centers’ common stock, at the option of the unit holder, on a one-for-one basis provided that, in accordance with the Saul Centers, Inc. Articles of Incorporation, the rights may not be exercised at any time that The Saul Organization beneficially owns, directly or indirectly, in the aggregate more than 39.9% of the value of the outstanding common stock and preferred stock of Saul Centers (the “Equity Securities”).
The impact of The Saul Organization’s 23.1% limited partnership interest in the Operating Partnership is reflected as Noncontrolling Interest in the accompanying consolidated financial statements. Fully converted partnership units and diluted weighted average shares outstanding for the years ended December 31, 2009, 2008 and 2007, were 23,359,000, 23,377,000 and 23,185,000, respectively.
F-15
Table of Contents
SAUL CENTERS, INC.
Notes to Consolidated Financial Statements
5. MORTGAGE NOTES PAYABLE, REVOLVING CREDIT FACILITY, INTEREST EXPENSE AND AMORTIZATION OF DEFERRED DEBT COSTS
The Company’s outstanding debt totaled $636,806,000 at December 31, 2009, of which $576,069,000 was fixed rate debt and $60,737,000 was variable rate debt. At December 31, 2008, outstanding debt totaled $567,495,000, of which $548,265,000 was fixed rate debt and $19,230,000 was variable rate debt. At December 31, 2009, the Company had a $150 million unsecured revolving credit facility, which can be used for working capital, property acquisitions or development projects, with no outstanding borrowings. The revolving credit facility matures on June 30, 2012, and may be extended by the Company for one additional year subject to the Company’s satisfaction of certain conditions. Saul Centers and certain consolidated subsidiaries of the Operating Partnership have guaranteed the payment obligations of the Operating Partnership under the revolving credit facility. Letters of credit may be issued under the revolving credit facility. On December 31, 2009, of the $150,000,000 available for borrowing, approximately $224,000 was committed for letters of credit, and approximately $149,776,000 was available under the line. Interest rate pricing under the facility is primarily determined by operating income from the Company’s existing unencumbered properties and, to a lesser extent, certain leverage tests. As of December 31, 2009, operating income from the unencumbered properties determined the interest rate for up to $105,000,000 of the line’s available borrowings, with interest expense to be calculated based upon the 1, 2, 3 or 6 month LIBOR plus a spread of 3.65% to 3.90%. The interest rate on the remaining $45,000,000 of the line’s availability is determined based upon the Company’s consolidated operating income after debt service. On this portion of the facility, interest accrues at a rate of LIBOR plus a spread of 4.45% to 5.25%, determined by certain leverage tests. The Company may elect to use the 1, 2, 3 or 6 month LIBOR, but in no event shall LIBOR be less than 1.5%.
Saul Centers is a guarantor of the revolving credit facility, of which the Operating Partnership is the borrower. Saul Centers is also the guarantor of 50% of the Northrock construction loan (approximately $9,559,000 of the $19,118,000 outstanding at December 31, 2009) and the Clarendon Center construction loan (approximately $41,619,000 outstanding at December 31, 2009). The fixed-rate notes payable are all non-recourse debt except for $3,882,000 of the Great Falls Center mortgage, which is guaranteed by Saul Centers.
On April 30, 2009, the Company entered into a Modification Agreement, in effect until August 1, 2009, which reduced the Debt Service Coverage ratio under its Line of Credit from 1.6x to 1.5x. The interest rate for borrowings under the line of credit that are based on the Company’s leverage was increased to LIBOR plus 3.725%, with a LIBOR floor of 1.50%, from LIBOR plus 1.475%. The maximum availability under the Line of Credit was reduced to $120,000,000 from $150,000,000. On July 9, 2009, the Company entered into a Second Modification Agreement which extended the maturity date of the facility to June 30, 2012 from December 19, 2010 , with an option for the Company to extend for one additional year subject to the Company’s satisfaction of certain conditions. The modification reduced the interest expense coverage ratio to 2.2x from 2.5x, reduced the debt service coverage to 1.4x from 1.5x (and recharacterized the test as fixed charge coverage) and created a new debt service coverage (exclusive of preferred stock dividends) of 1.6x. On July 28, 2009, Company entered into a Third Modification Agreement increasing the maximum availability under the facility to $150,000,000 from $120,000,000 with the addition of a fourth lender. Also in July 2009, the Company repaid the full outstanding balance of $15,000,000 on the unsecured revolving credit facility.
On May 14, 2009, the Company closed on the final portion of its April 2008 forward commitment secured by the Great Falls Center. The additional funding totaled $1,882,000 which was based upon the achievement of certain leasing requirements. The loan matures February 1, 2024, requires equal monthly principal and interest payments of $12,518, based upon a 7.00% interest rate and 30-year principal amortization, and requires a final principal payment of approximately $1,414,000 at maturity.
Also during May and June 2009, the Company refinanced $48.1 million of mortgage debt secured by four properties, due to mature December 2011, with $85 million of new 15-year fixed-rate mortgage debt. In conjunction with the early repayment of the in-place debt, the Company incurred prepayment penalties of $1,442,000 and wrote-off unamortized deferred debt costs totaling $218,000. Because the refinanced properties were included in a cross-collateralized pool of six properties, the Company was required to pay down outstanding debt balances of two remaining properties in the amount of $4,806,000. Terms of the new mortgage debt are as follows:
On May 28, 2009, the Company closed on a new 15-year, fixed-rate mortgage loan in the amount of $16,000,000, secured by Village Center. The loan matures June 1, 2024, requires equal monthly principal and interest payments of $119,282, based upon a 7.6% interest rate and 25-year principal amortization, and requires a final principal payment of approximately $10,060,000 at maturity.
F-16
Table of Contents
SAUL CENTERS, INC.
Notes to Consolidated Financial Statements
On June 2, 2009, the Company closed on a new 15-year, fixed-rate mortgage loan in the amount of $18,500,000, secured by Leesburg Pike. The loan matures June 1, 2024, requires equal monthly principal and interest payments of $134,913, based upon a 7.35% interest rate and 25-year principal amortization, and requires a final principal payment of approximately $11,506,000 at maturity.
On June 12, 2009, the Company closed on a new 15-year, fixed-rate mortgage loan in the amount of $17,000,000, secured by Van Ness Square. The loan matures July 1, 2024, requires equal monthly principal and interest payments of $132,450, based upon an 8.11% interest rate and 25-year principal amortization, and requires a final principal payment of approximately $11,453,000 at maturity. A portion of the loan proceeds are held in escrow by the lender to fund up to $1,500,000 of future tenant improvements and leasing commissions. Additional loan proceeds of $1,564,000 are held in a second escrow to be released pending the achievement of certain annualized base rent levels. The escrows are classified as other assets on the Consolidated Balance Sheets.
On June 19, 2009, the Company closed on a new 15-year, fixed-rate mortgage loan in the amount of $33,500,000, secured by Avenel Business Park. The loan matures July 1, 2024, requires equal monthly principal and interest payments of $246,474, based upon a 7.45% interest rate and 25-year principal amortization, and requires a final principal payment of approximately $20,926,000 at maturity.
On December 17, 2009, the Company closed on a new 15-year, fixed-rate mortgage loan in the amount of $33,000,000, secured by Ashburn Village. The loan matures January 1, 2025, requires equal monthly principal and interest payments of $239,590, based upon a 7.30% interest rate and 25-year principal amortization, and requires a final principal payment of approximately $20,478,000 at maturity.
During 2008, the Company obtained increases to two fixed-rate mortgages totaling $10,500,000, assumed a mortgage note of $10,349,000 in conjunction with the acquisition of Great Falls Center, obtained additional fixed-rate mortgage financing totaling $23,575,000 and obtained construction financing for its Clarendon Center and Northrock shopping center projects.
On February 29, 2008, the Company closed on a $7,500,000 increase to a fixed-rate mortgage secured by Shops at Fairfax and Boulevard shopping centers. The loan matures June 1, 2015 (same as the original financing), requires monthly interest only payments of $38,000, based upon a 6.08% interest rate, and requires a final principal payment of $7,500,000 at maturity.
On March 23, 2008, the Company closed on a $3,000,000 increase to a fixed-rate mortgage secured by Seabreeze Plaza. The loan matures May 1, 2014 (same as the original financing), requires equal monthly principal and interest payments of $17,794, based upon a 5.90% interest rate and 30-year principal amortization, and requires a final principal payment of approximately $2,738,000 at maturity.
On March 28, 2008, in connection with the acquisition of Great Falls Center, the Company assumed a $10.3 million fully amortizing fixed-rate mortgage loan which is secured by the property. The loan matures February 1, 2024 and requires equal monthly principal and interest payments of $83,113, based upon a 5.80% interest rate and 20-year principal amortization. Management determined the mortgage loan was fairly valued at acquisition because the terms of the loan were not materially different from current market terms.
On March 31, 2008, the Company closed on a new 15-year, fixed-rate mortgage loan in the amount of $12,750,000, secured by the BJ’s Wholesale Club center. The loan matures April 1, 2023, requires equal monthly principal and interest payments of $80,003, based upon a 6.43% interest rate and 30-year principal amortization, and requires a final principal payment of approximately $9,255,000 at maturity.
In April 2008, the Company closed on a $10,825,000 additional financing secured by the Great Falls Center. Funding in the amount of $6,525,000 occurred on April 6, 2008, payable at an interest rate of 6.80%, interest only for the first year, after which amortization will commence on a 30-year amortization schedule, requiring monthly payments of principal and interest totaling $42,538. A final principal payment of approximately $1,274,000 will be due at maturity on February 1, 2024. The Company has initially guaranteed $2,000,000 of this
F-17
Table of Contents
SAUL CENTERS, INC.
Notes to Consolidated Financial Statements
loan, with the amount of any additional advance to also be guaranteed until certain debt service coverage tests are achieved. The balance totaling $4,300,000 is a forward commitment to be funded in 2009, subject to achieving certain re-leasing requirements.
In May 2008, the Company closed on a $21,822,000 secured construction loan to fund the development of Northrock shopping center in Warrenton, Virginia. Funding in the amount of approximately $6,495,000 occurred at closing. The loan accrues interest at the sum of LIBOR and 3.0%. The loan matures on May 1, 2011, and can be extended for two years at the Company’s option subject to completion of improvements and certain debt service coverage requirements. The loan is 100% guaranteed by the Company until such time as the construction is complete, at which time the guarantee will be limited to 50% of the total principal outstanding. Approximately $19,118,000 was outstanding as of December 31, 2009.
Also in May 2008, the Company closed a $157,500,000 secured construction loan to finance the development of Clarendon Center, a mixed-use development adjacent to the Clarendon Metro station in Arlington, Virginia. The Company has guaranteed the loan, with the guarantee to be reduced subject to certain conditions related to pre-leasing, completion of construction and net operating income from the project. The loan accrues interest at the sum of LIBOR and 2.5% and matures on November 14, 2011, and may be extended by the Company for two additional 9-month periods, subject to the satisfaction of certain conditions. Approximately $41,619,000 was outstanding as of December 31, 2009.
F-18
Table of Contents
SAUL CENTERS, INC.
Notes to Consolidated Financial Statements
The following is a summary of notes payable as of December 31, 2009 and 2008:
| Notes Payable | December 31, | Interest Rate * |
Scheduled Maturity * | |||||||||
| (Dollars in thousands) | 2009 | 2008 | ||||||||||
| Fixed rate mortgages: |
$ | — | (a) | $ | 78,489 | — | — | |||||
| 110,847 | (b) | 115,271 | 7.67 | % | Oct-2012 | |||||||
| 10,658 | (c) | 10,846 | 6.12 | % | Jan-2013 | |||||||
| 27,533 | (d) | 28,837 | 7.88 | % | Jan-2013 | |||||||
| 7,694 | (e) | 7,919 | 5.77 | % | Jul-2013 | |||||||
| 15,184 | (f) | 15,576 | 5.40 | % | May-2014 | |||||||
| 18,506 | (g) | 18,987 | 7.45 | % | Jun-2015 | |||||||
| 37,376 | (h) | 38,263 | 6.01 | % | Feb-2018 | |||||||
| 42,265 | (i) | 43,413 | 5.88 | % | Jan-2019 | |||||||
| 13,671 | (j) | 14,043 | 5.76 | % | May-2019 | |||||||
| 18,876 | (k) | 19,391 | 5.62 | % | Jul-2019 | |||||||
| 18,702 | (l) | 19,195 | 5.79 | % | Sep-2019 | |||||||
| 16,706 | (m) | 17,165 | 5.22 | % | Jan-2020 | |||||||
| 12,127 | (n) | 12,337 | 5.60 | % | May-2020 | |||||||
| 11,279 | (o) | 11,576 | 5.30 | % | Jun-2020 | |||||||
| 9,698 | (p) | 9,925 | 5.81 | % | Feb-2021 | |||||||
| 6,693 | (q) | 6,791 | 6.01 | % | Aug-2021 | |||||||
| 38,625 | (r) | 39,198 | 5.62 | % | Jun-2022 | |||||||
| 11,661 | (s) | 11,817 | 6.08 | % | Sep-2022 | |||||||
| 12,504 | (t) | 12,655 | 6.43 | % | Apr-2023 | |||||||
| 17,977 | (u) | 16,571 | 6.28 | % | Feb-2024 | |||||||
| 18,368 | (v) | — | 7.35 | % | Jun-2024 | |||||||
| 15,891 | (w) | — | 7.60 | % | Jun-2024 | |||||||
| 16,923 | (x) | — | 8.11 | % | Jul-2024 | |||||||
| 33,305 | (y) | — | 7.45 | % | Jul-2024 | |||||||
| 33,000 | (z) | — | 7.30 | % | Jan-2025 | |||||||
| Total fixed rate |
576,069 | 548,265 | 6.66 | % | 8.9 Years | |||||||
| Variable rate loans: |
||||||||||||
| Revolving credit facility |
— | (aa) | — | LIBOR + 3.725 | % | Jun-2012 | ||||||
| Northrock construction loan |
19,118 | (bb) | 12,817 | LIBOR + 3.00 | % | May-2011 | ||||||
| Clarendon construction loan |
41,619 | (cc) | 6,413 | LIBOR + 2.50 | % | Nov-2011 | ||||||
| Total variable rate |
60,737 | 19,230 | 3.29 | % | 1.7 Years | |||||||
| Total notes payable |
$ | 636,806 | $ | 567,495 | 6.34 | % | 8.2 Years | |||||
| * | Interest rate and scheduled maturity data presented as of December 31, 2009. Totals computed using weighted averages. |
| (a) | The loan was collateralized by Avenel Business Park, Van Ness Square, Ashburn Village, Leesburg Pike, Lumberton Plaza and Village Center and was repaid during 2009. |
F-19
Table of Contents
SAUL CENTERS, INC.
Notes to Consolidated Financial Statements
| (b) | The loan is collateralized by nine shopping centers (Seven Corners, Thruway, White Oak, Hampshire Langley, Great Eastern, Southside Plaza, Belvedere, Giant and Ravenwood) and requires equal monthly principal and interest payments of $1,103,000 based upon a 25-year amortization schedule and a final payment of $97,403,000 at loan maturity. Principal of $4,424,000 was amortized during 2009. |
| (c) | The loan is collateralized by Smallwood Village Center and requires equal monthly principal and interest payments of $71,000 based upon a 30-year amortization schedule and a final payment of $10,071,000 at loan maturity. Principal of $188,000 was amortized during 2009. |
| (d) | The loan is collateralized by 601 Pennsylvania Avenue and requires equal monthly principal and interest payments of $294,000 based upon a 25-year amortization schedule and a final payment of $22,961,000 at loan maturity. Principal of $1,304,000 was amortized during 2009. |
| (e) | The loan is collateralized by Cruse MarketPlace and requires equal monthly principal and interest payments of $56,000 based upon an amortization schedule of approximately 24 years and a final payment of $6,830,000 at loan maturity. Principal of $225,000 was amortized during 2009. |
| (f) | The loan is collateralized by Seabreeze Plaza and requires equal monthly principal and interest payments totaling $102,000 based upon a weighted average 26-year amortization schedule and a final payment of $13,278,000 is due at loan maturity. Principal of $392,000 was amortized during 2009. |
| (g) | The loan is collateralized by Shops at Fairfax and Boulevard shopping centers and requires equal monthly principal and interest payments totaling $156,000 based upon a weighted average 23-year amortization schedule and a final payment of $15,168,000 is due at loan maturity. Principal of $481,000 was amortized during 2009. |
| (h) | The loan is collateralized by Washington Square and requires equal monthly principal and interest payments of $264,000 based upon a 27.5-year amortization schedule and a final payment of $28,012,000 at loan maturity. Principal of $887,000 was amortized during 2009. |
| (i) | The loan is collateralized by three shopping centers, Broadlands Village, The Glen and Kentlands Square, and requires equal monthly principal and interest payments of $306,000 based upon a 25-year amortization schedule and a final payment of $28,393,000 at loan maturity. Principal of $1,148,000 was amortized during 2009. |
| (j) | The loan is collateralized by Olde Forte Village and requires equal monthly principal and interest payments of $98,000 based upon a 25-year amortization schedule and a final payment of $8,985,000 at loan maturity. Principal of $372,000 was amortized during 2009. |
| (k) | The loan is collateralized by Countryside and requires equal monthly principal and interest payments of $133,000 based upon a 25-year amortization schedule and a final payment of $12,288,000 at loan maturity. Principal of $515,000 was amortized during 2009. |
| (l) | The loan is collateralized by Briggs Chaney MarketPlace and requires equal monthly principal and interest payments of $133,000 based upon a 25-year amortization schedule and a final payment of $12,192,000 at loan maturity. Principal of $493,000 was amortized during 2009. |
| (m) | The loan is collateralized by Shops at Monocacy and requires equal monthly principal and interest payments of $112,000 based upon a 25-year amortization schedule and a final payment of $10,568,000 at loan maturity. Principal of $459,000 was amortized during 2009. |
| (n) | The loan is collateralized by Boca Valley Plaza and requires equal monthly principal and interest payments of $75,000 based upon a 30-year amortization schedule and a final payment of $9,149,000 at loan maturity. Principal of $210,000 was amortized during 2009. |
| (o) | The loan is collateralized by Palm Springs Center and requires equal monthly principal and interest payments of $75,000 based upon a 25-year amortization schedule and a final payment of $7,075,000 at loan maturity. Principal of $297,000 was amortized during 2009. |
| (p) | The loan is collateralized by Jamestown Place and requires equal monthly principal and interest payments of $66,000 based upon a 25-year amortization schedule and a final payment of $6,102,000 at loan maturity. Principal of $227,000 was amortized during 2009. |
F-20
Table of Contents
SAUL CENTERS, INC.
Notes to Consolidated Financial Statements
| (q) | The loan is collateralized by Hunt Club Corners and requires equal monthly principal and interest payments of $42,000 based upon a 30-year amortization schedule and a final payment of $5,018,000 at loan maturity. Principal of $98,000 was amortized during 2009. |
| (r) | The loan is collateralized by Lansdowne Town Center and requires monthly principal and interest payments of $230,000 based on a 30-year amortization schedule and a final payment of $28,177,000 at loan maturity. Principal of $573,000 was amortized during 2009. |
| (s) | The loan is collateralized by Orchard Park and requires equal monthly principal and interest payments of $73,000 based upon a 30-year amortization schedule and a final payment of $8,628,000 at loan maturity. Principal of $156,000 was amortized during 2009. |
| (t) | The loan is collateralized by BJs Wholesale and requires equal monthly principal and interest payments of $80,000 based upon a 30-year amortization schedule and a final payment of $9,305,000 at loan maturity. Principal of $151,000 was amortized during 2009. |
| (u) | The loan is collateralized by Great Falls shopping center. In May 2009, the Company closed on the final portion of a forward commitment in the amount of $1,881,617. The loan consists of three notes which require equal monthly principal and interest payments of $138,000 based upon a weighted average 26-year amortization schedule. The loan matures February 1, 2024 at which time a final payment of $6,349,000 will be due. Principal of $476,000 was amortized during 2009. |
| (v) | The loan, closed on June 2, 2009, is collateralized by Leesburg Pike and requires equal monthly principal and interest payments of $135,000 based upon a 25-year amortization schedule and a final payment of $11,506,000 at loan maturity. Principal of $132,000 was amortized during 2009. |
| (w) | The loan, closed on May 28, 2009, is collateralized by Village Center and requires equal monthly principal and interest payments of $119,000 based upon a 25-year amortization schedule and a final payment of $10,060,000 at loan maturity. Principal of $109,000 was amortized during 2009. |
| (x) | The loan, closed on June 12, 2009, is collateralized by Van Ness Square and requires equal monthly principal and interest payments of $132,000 based upon a 25-year amortization schedule and a final payment of $11,453,000 at loan maturity. Principal of $77,000 was amortized during 2009. |
| (y) | The loan, closed on June 19, 2009, is collateralized by Avenel Business Park and requires equal monthly principal and interest payments of $246,000 based upon a 25-year amortization schedule and a final payment of $20,926,000 at loan maturity. Principal of $195,000 was amortized during 2009. |
| (z) | The loan, closed on December 17, 2009, is collateralized by Ashburn Village and requires equal monthly principal and interest payments of $240,000 based upon a 25-year amortization schedule and a final payment of $20,478,000 at loan maturity. |
| (aa) | The loan is an unsecured revolving credit facility totaling $150,000,000. Interest expense is calculated based upon the 1 month LIBOR rate plus a spread of 3.725%. The line may be extended one year with payment of a fee of 1/4% at the Company’s option. Monthly payments, if applicable, are interest only and vary depending upon the amount outstanding and the applicable interest rate for any given month. |
| (bb) | The loan is a secured construction loan facility totaling $21,822,000 to fund the development of Northrock shopping center. Interest charges are funded by the construction loan and are calculated based upon the 1 month LIBOR rate plus a spread of 3.00%. The loan may be extended two years, at the Company’s option, subject to the completion of construction and certain debt coverage requirements. |
| (cc) | The loan is a secured construction loan facility totaling $157,500,000 to fund the development of Clarendon Center. Interest charges are funded by the construction loan and are calculated based upon the 1 month LIBOR rate plus a spread of 2.50%. The loan may be extended for two additional 9-month periods, subject to the satisfaction of certain conditions. |
The carrying value of the properties which collateralize the mortgage notes payable at December 31, 2009 and 2008 totaled $746,377,000 and $693,205,000, respectively. The Company’s credit facility requires the Company and its subsidiaries to maintain certain financial covenants. As of December 31, 2009, the material covenants required the Company, on a consolidated basis, to:
| • | limit the amount of debt so as to maintain a gross asset value, as defined in the loan agreement, in excess of liabilities of at least $600 million plus 90% of the Company’s future net equity proceeds; |
F-21
Table of Contents
SAUL CENTERS, INC.
Notes to Consolidated Financial Statements
| • | limit the amount of debt as a percentage of gross asset value, as defined in the loan agreement, to less than 60% (leverage ratio); |
| • | limit the amount of debt so that interest coverage will exceed 2.2x on a trailing 12-full calendar month basis (interest expense coverage); |
| • | limit the amount of debt so that interest and scheduled principal amortization coverage exceeds 1.6x (debt service coverage); |
| • | limit the amount of debt so that interest, scheduled principal amortization and preferred dividend coverage exceeds 1.4x (fixed charge coverage); and |
| • | limit the amount of variable rate debt and debt with initial loan terms of less than five years to no more than 40% of total debt. |
As of December 31, 2009, the Company was in compliance with all such covenants.
Notes payable at December 31, 2009 and 2008, totaling $138,381,000 and $144,108,000, respectively, are guaranteed by members of The Saul Organization. As of December 31, 2009, the scheduled maturities of all debt including scheduled principal amortization for years ended December 31, are as follows:
Debt Maturity Schedule
| (Dollars in thousands) | Balloon Payments |
Scheduled Principal Amortization |
Total | |||||||
| 2010 |
$ | — | $ | 15,675 | $ | 15,675 | ||||
| 2011 |
60,737 | (a) | 16,823 | 77,560 | ||||||
| 2012 |
96,300 | 17,028 | 113,328 | |||||||
| 2013 |
39,440 | 11,404 | 50,844 | |||||||
| 2014 |
13,176 | 11,354 | 24,530 | |||||||
| 2015 |
15,012 | 11,459 | 26,471 | |||||||
| Thereafter |
252,470 | 75,928 | 328,398 | |||||||
| $ | 477,135 | $ | 159,671 | $ | 636,806 | |||||
| (a) | Represents the Clarendon Center and Northrock construction loan balances as of December 31, 2009. |
F-22
Table of Contents
SAUL CENTERS, INC.
Notes to Consolidated Financial Statements
Interest Expense and Amortization of Deferred Debt Costs
| Year ended December 31, | ||||||||||||
| (Dollars in thousands) | 2009 | 2008 | 2007 | |||||||||
| Interest incurred |
$ | 38,992 | $ | 37,275 | $ | 35,595 | ||||||
| Amortization of deferred debt costs |
1,323 | 1,162 | 1,149 | |||||||||
| Revolving credit line amendment |
363 | — | — | |||||||||
| Capitalized interest |
(5,989 | ) | (4,159 | ) | (2,889 | ) | ||||||
| $ | 34,689 | $ | 34,278 | $ | 33,855 | |||||||
The Company incurred and capitalized as construction in progress deferred debt costs related to the Clarendon Center and Northrock construction loans of approximately $46 and $2,369, during 2009 and 2008, respectively.
6. LEASE AGREEMENTS
Lease income includes primarily base rent arising from noncancelable commercial leases. Base rent (including straight-line rent) for the years ended December 31, 2009, 2008 and 2007, amounted to $125,845,000, $124,999,000 and $118,806,000, respectively. Future contractual payments under noncancelable leases for years ended December 31, (which exclude the effect of straight-line rents), are as follows:
Future Contractual Payments
| (In thousands) | |||
| 2010 |
$ | 123,518 | |
| 2011 |
108,202 | ||
| 2012 |
93,159 | ||
| 2013 |
75,503 | ||
| 2014 |
56,954 | ||
| Thereafter |
299,356 | ||
| Total |
$ | 756,692 | |
The majority of the leases also provide for rental increases and expense recoveries based on fixed annual increases or increases in the Consumer Price Index and increases in operating expenses. The expense recoveries generally are payable in equal installments throughout the year based on estimates, with adjustments made in the succeeding year. Expense recoveries for the years ended December 31, 2009, 2008 and 2007 amounted to $29,462,000, $29,066,000 and $26,090,000, respectively. In addition, certain retail leases provide for percentage rent based on sales in excess of the minimum specified in the tenant’s lease. Percentage rent amounted to $1,326,000, $1,509,000 and $1,497,000, for the years ended December 31, 2009, 2008 and 2007, respectively.
7. LONG-TERM LEASE OBLIGATIONS
Certain properties are subject to noncancelable long-term leases which apply to land underlying the Shopping Centers. Certain of the leases provide for periodic adjustments of the base annual rent and require the payment of real estate taxes on the underlying land. The leases will expire between 2058 and 2068. Reflected in the accompanying consolidated financial statements is minimum ground rent expense of $165,000, $164,000 and $164,000, for each of the years ended December 31, 2009, 2008 and 2007, respectively.
F-23
Table of Contents
SAUL CENTERS, INC.
Notes to Consolidated Financial Statements
The future minimum rental commitments under these ground leases are as follows:
Ground Lease Rental Commitments
| Annually | |||||||||||||||||||||
| (In thousands) | 2010 | 2011 | 2012 | 2013 | 2014 | Thereafter | Total | ||||||||||||||
| Beacon Center |
$ | 53 | $ | 57 | $ | 60 | $ | 60 | $ | 60 | $ | 2,840 | $ | 3,130 | |||||||
| Olney |
56 | 56 | 56 | 56 | 56 | 4,041 | 4,321 | ||||||||||||||
| Southdale |
60 | 60 | 60 | 60 | 60 | 3,185 | 3,485 | ||||||||||||||
| Total |
$ | 169 | $ | 173 | $ | 176 | $ | 176 | $ | 176 | $ | 10,066 | $ | 10,936 | |||||||
In addition to the above, Flagship Center consists of two developed out parcels that are part of a larger adjacent community shopping center formerly owned by The Saul Organization and sold to an affiliate of a tenant in 1991. The Company has a 90-year ground leasehold interest which commenced in September 1991 with a minimum rent of one dollar per year. Countryside shopping center was acquired in February, 2004. Because of certain land use considerations, approximately 3.4% of the underlying land is held under a 99-year ground lease. The lease requires the Company to pay minimum rent of one dollar per year as well as its pro-rata share of the real estate taxes.
The Company’s corporate headquarters space is leased by a member of The Saul Organization. The 10-year lease, which commenced in March 2002, provides for base rent increases of 3% per year, with payment of a pro-rata share of operating expenses over a base year amount. The Company and The Saul Organization entered into a Shared Services Agreement whereby each party pays an allocation of total rental payments based on a percentage proportionate to the number of employees employed by each party. The Company’s rent expense for the years ended December 31, 2009, 2008 and 2007 was $835,000, $813,000 and $796,000, respectively. Expenses arising from the lease are included in general and administrative expense (see Note 9 – Related Party Transactions).
8. STOCKHOLDERS’ EQUITY AND NONCONTROLLING INTEREST
The Consolidated Statements of Operations for the years ended December 31, 2009, 2008 and 2007 reflect noncontrolling interest of $6,517,000, $7,972,000 and $8,818,000, respectively, representing The Saul Organization’s share of the net income for the year.
In November 2003, the Company sold 4,000,000 depositary shares, each representing 1/100th of a share of 8% Series A Cumulative Redeemable Preferred Stock. The depositary shares are redeemable, in whole or in part at the Company’s option, from time to time, at $25.00 per share. The depositary shares pay an annual dividend of $2.00 per share, equivalent to 8% of the $25.00 per share liquidation preference. The Series A preferred stock has no stated maturity, is not subject to any sinking fund or mandatory redemption and is not convertible into any other securities of the Company. Investors in the depositary shares generally have no voting rights, but will have limited voting rights if the Company fails to pay dividends for six or more quarters (whether or not declared or consecutive) and in certain other events.
In March 2008, the Company sold 3,173,115 depositary shares, each representing 1/100th of a share of 9% Series B Cumulative Redeemable Preferred Stock. The depositary shares may be redeemed at the Company’s option, on or after March 15, 2013, in whole or in part, at $25.00 per share . The depositary shares pay an annual dividend of $2.25 per share, equivalent to 9% of the $25.00 per share liquidation preference. The first dividend was paid on July 15, 2008 and covered the period from March 27, 2008 through June 30, 2008. The Series B preferred stock has no stated maturity, is not subject to any sinking fund or mandatory redemption and is not convertible into any other securities of the Company. Investors in the depositary shares generally have no voting rights, but will have limited voting rights if the Company fails to pay dividends for six or more quarters (whether or not declared or consecutive) and in certain other events.
F-24
Table of Contents
SAUL CENTERS, INC.
Notes to Consolidated Financial Statements
9. RELATED PARTY TRANSACTIONS
The Chairman and Chief Executive Officer, the President, the Senior Vice President- General Counsel and the Senior Vice President-Chief Accounting Officer of the Company are also officers of various members of The Saul Organization and their management time is shared with The Saul Organization. Their annual compensation is fixed by the Compensation Committee of the Board of Directors, with the exception of the Senior Vice President-Chief Accounting Officer whose share of annual compensation allocated to the Company is determined by the shared services agreement (described below).
The Company participates in a multiemployer 401K plan with entities in The Saul Organization which covers those full-time employees who meet the requirements as specified in the plan. Company contributions, which are included in general and administrative expense or property operating expenses in the consolidated statements of operations, at the discretionary amount of up to six percent of the employee’s cash compensation, subject to certain limits, were $426,000, $381,000 and $331,000, for 2009, 2008 and 2007, respectively. All amounts deferred by employees and the Company are fully vested.
The Company also participates in a multiemployer nonqualified deferred compensation plan with entities in The Saul Organization which covers those full-time employees who meet the requirements as specified in the plan. According to the plan, which can be modified or discontinued at any time, participating employees defer 2% of their compensation in excess of a specified amount. For the years ended December 31, 2009, 2008 and 2007, the Company contributed three times the amount deferred by employees. The Company’s expense, included in general and administrative expense, totaled $244,000, $203,000 and $106,000, for the years ended December 31, 2009, 2008 and 2007, respectively. All amounts deferred by employees and the Company are fully vested. The cumulative unfunded liability under this plan was $1,371,000 and $1,082,000, at December 31, 2009 and 2008, respectively, and is included in accounts payable, accrued expenses and other liabilities in the consolidated balance sheets.
The Company has entered into a shared services agreement (the “Agreement”) with The Saul Organization that provides for the sharing of certain personnel and ancillary functions such as computer hardware, software, and support services and certain direct and indirect administrative personnel. The method for determining the cost of the shared services is provided for in the Agreement and is based upon head count, estimates of usage or estimates of time incurred, as applicable. Senior management has determined that the final allocations of shared costs are reasonable. The terms of the Agreement and the payments made thereunder are reviewed annually by the Audit Committee of the Board of Directors, which consists entirely of independent directors. Billings by The Saul Organization for the Company’s share of these ancillary costs and expenses for the years ended December 31, 2009, 2008 and 2007, which included rental expense for the Company’s headquarters lease (see Note 7. Long Term Lease Obligations), totaled $5,804,000, $5,188,000 and $4,890,000, respectively. The amounts are expensed when incurred and are primarily reported as general and administrative expenses or capitalized to specific development projects in these consolidated financial statements. As of December 31, 2009 and 2008, accounts payable, accrued expenses and other liabilities included $525,000 and $324,000, respectively, represent billings due to The Saul Organization for the Company’s share of these ancillary costs and expenses.
The B. F. Saul Insurance Agency of Maryland, Inc., a subsidiary of the B. F. Saul Company and a member of the Saul Organization, is a general insurance agency that receives commissions and counter-signature fees in connection with our insurance program. Such commissions and fees amounted to approximately $314,000, $418,000 and $367,000, for the years ended December 31, 2009, 2008 and 2007, respectively.
10. STOCK OPTION PLAN
The Company established a stock option plan in 1993 (the “1993 Plan”) for the purpose of attracting and retaining executive officers and other key personnel. The 1993 Plan provides for grants of options to purchase up to 400,000 shares of common stock. The 1993 Plan authorizes the Compensation Committee of the Board of Directors to grant options at an exercise price which may not be less than the market value of the common stock on the date the option is granted. On May 23, 2003, the Compensation Committee granted options to purchase a total of 220,000 shares (80,000 shares from incentive stock options and 140,000 shares from nonqualified stock options) to six Company officers (the “2003 Options”). Following the grant of the 2003 Options, no additional shares remained for issuance under the 1993 Plan. The 2003 Options vest 25% per year over four years and have a term of ten years, subject to earlier expiration upon termination of employment. The exercise price of $24.91 per share was the closing market price of the Company’s common stock on the date of the award.
F-25
Table of Contents
SAUL CENTERS, INC.
Notes to Consolidated Financial Statements
At the annual meeting of the Company’s stockholders in 2004, the stockholders approved the adoption of the 2004 stock plan for the purpose of attracting and retaining executive officers, directors and other key personnel. The 2004 stock plan was subsequently amended by the Company’s stockholders at the 2008 Annual Meeting (the “Amended 2004 Plan”). The Amended 2004 Plan, which terminates in April 2018, provides for grants of options to purchase up to 1,000,000 shares of common stock as well as grants of up to 200,000 shares of common stock to directors. The Amended 2004 Plan authorizes the Compensation Committee of the Board of Directors to grant options at an exercise price which may not be less than the market value of the common stock on the date the option is granted.
Effective April 26, 2004, the Compensation Committee granted options to purchase a total of 152,500 shares (27,500 shares from incentive stock options and 125,000 shares from nonqualified stock options) to eleven Company officers and to the twelve Company directors (the “2004 Options”), which expire on April 25, 2014. The officers’ 2004 Options vest 25% per year over four years and are subject to early expiration upon termination of employment. The directors’ options were immediately exercisable. The exercise price of $25.78 per share was the closing market price of the Company’s common stock on the date of the award. Using the Black-Scholes model, the Company determined the total fair value of the 2004 Options to be $360,000, of which $293,000 and $67,000 were the values assigned to the officer options and director options, respectively. Because the directors’ options vest immediately, the entire $67,000 was expensed as of the date of grant. The expense of the officers’ options is being recognized as compensation expense monthly during the four years the options vest.
Effective May 6, 2005, the Compensation Committee granted options to purchase a total of 162,500 shares (35,500 shares from incentive stock options and 127,000 shares from nonqualified stock options) to twelve Company officers and to twelve Company directors (the “2005 Options”), which expire on May 5, 2015. The officers’ 2005 Options vest 25% per year over four years and are subject to early expiration upon termination of employment. The directors’ options were immediately exercisable. The exercise price of $33.22 per share was the closing market price of the Company’s common stock on the date of the award. Using the Black-Scholes model, the Company determined the total fair value of the 2005 Options to be $484,500, of which $413,400 and $71,100 were the values assigned to the officer options and director options, respectively. Because the directors’ options vest immediately, the entire $71,100 was expensed as of the date of grant. The expense of the officers’ options is being recognized as compensation expense monthly during the four years the options vest.
Effective May 1, 2006, the Compensation Committee granted options to purchase a total of 30,000 shares (all nonqualified stock options) to twelve Company directors (the “2006 Options”), which were immediately exercisable and expire on April 30, 2016. The exercise price of $40.35 per share was the closing market price of the Company’s common stock on the date of the award. Using the Black-Scholes model, the Company determined the total fair value of the 2006 Options to be $143,400. Because the directors’ options vest immediately, the entire $143,400 was expensed as of the date of grant. No options were granted to the Company’s officers in 2006.
Effective April 27, 2007, the Compensation Committee granted options to purchase a total of 165,000 shares (27,560 shares from incentive stock options and 137,440 shares from nonqualified stock options) to thirteen Company officers and twelve Company Directors (the “2007 options”), which expire on April 26, 2017. The officers’ 2007 Options vest 25% per year over four years and are subject to early expiration upon termination of employment. The directors’ options were immediately exercisable. The exercise price of $54.17 per share was the closing market price of the Company’s common stock on the date of award. Using the Black-Scholes model, the Company determined the total fair value of the 2007 Options to be $1,544,148, of which $1,258,848 and $285,300 were the values assigned to the officer options and director options, respectively. Because the directors’ options vest immediately, the entire $285,300 was expensed as of the date of grant. The expense for the officers’ options is being recognized as compensation expense monthly during the four years the options vest.
Effective April 25, 2008, the Compensation Committee granted options to purchase a total of 30,000 shares (all nonqualified stock options) to twelve Company directors (the “2008 Options”), which were immediately exercisable and expire on April 24, 2018. The exercise price of $50.15 per share was the closing market price of the Company’s common stock on the date of the award. Using the Black-Scholes model, the Company determined the total fair value of the 2008 Options to be $254,700. Because the directors’ options vest immediately, the entire $254,700 was expensed as of the date of grant. No options were granted to the Company’s officers in 2008.
F-26
Table of Contents
SAUL CENTERS, INC.
Notes to Consolidated Financial Statements
Effective April 24, 2009, the Compensation Committee granted options to purchase a total of 32,500 shares (all nonqualified stock options) to thirteen Company directors (the “2009 Options”), which were immediately exercisable and expire on April 23, 2019. The exercise price of $32.68 per share was the closing market price of the Company’s common stock on the date of the award. Using the Black-Scholes model, the Company determined the total fair value of the 2009 Options to be $222,950. Because the directors’ options vest immediately, the entire $222,950 was expensed as of the date of grant. No options were granted to the Company’s officers in 2009.
F-27
Table of Contents
Notes to Consolidated Financial Statements (Unaudited)
The following table summarizes the amount and activity of each grant, the total value and variables used in the computation and the amount expensed and included in general and administrative expense in the Consolidated Statements of Operations for the years ended December 31, 2007, 2008 and 2009:
Stock options issued
| Officers | Directors | ||||||||||||||||||||||||||||||||||||||||||||||||
| Grant date |
05/23/2003 | 04/26/2004 | 05/06/2005 | 04/27/2007 | Subtotals | 04/26/2004 | 05/06/2005 | 05/01/2006 | 04/27/2007 | 04/25/2008 | 04/24/2009 | Subtotals | Grand Totals | ||||||||||||||||||||||||||||||||||||
| Total grant |
220,000 | 122,500 | 132,500 | 135,000 | 610,000 | 30,000 | 30,000 | 30,000 | 30,000 | 30,000 | 32,500 | 182,500 | 792,500 | ||||||||||||||||||||||||||||||||||||
| Vested |
212,500 | 115,000 | 118,750 | 61,250 | 507,500 | 30,000 | 30,000 | 30,000 | 30,000 | 30,000 | 32,500 | 182,500 | 690,000 | ||||||||||||||||||||||||||||||||||||
| Exercised |
96,422 | 30,625 | 6,250 | — | 133,297 | 6,200 | 2,500 | — | — | — | — | 8,700 | 141,997 | ||||||||||||||||||||||||||||||||||||
| Forfeited |
7,500 | 7,500 | 13,750 | 12,500 | 41,250 | — | — | — | — | — | — | — | 41,250 | ||||||||||||||||||||||||||||||||||||
| Exercisable at December 31, 2009 |
116,078 | 84,375 | 112,500 | 61,250 | 374,203 | 23,800 | 27,500 | 30,000 | 30,000 | 30,000 | 32,500 | 173,800 | 548,003 | ||||||||||||||||||||||||||||||||||||
| Remaining unexercised |
116,078 | 84,375 | 112,500 | 122,500 | 435,453 | 23,800 | 27,500 | 30,000 | 30,000 | 30,000 | 32,500 | 173,800 | 609,253 | ||||||||||||||||||||||||||||||||||||
| Exercise price |
$ | 24.91 | $ | 25.78 | $ | 33.22 | $ | 54.17 | $ | 25.78 | $ | 33.22 | $ | 40.35 | $ | 54.17 | $ | 50.15 | $ | 32.68 | |||||||||||||||||||||||||||||
| Volatility |
0.175 | 0.183 | 0.207 | 0.233 | 0.183 | 0.198 | 0.206 | 0.225 | 0.237 | 0.344 | |||||||||||||||||||||||||||||||||||||||
| Expected life (years) |
7.0 | 7.0 | 8.0 | 6.5 | 5.0 | 10.0 | 9.0 | 8.0 | 7.0 | 6.0 | |||||||||||||||||||||||||||||||||||||||
| Assumed yield |
7.00 | % | 5.75 | % | 6.37 | % | 4.13 | % | 5.75 | % | 6.91 | % | 5.93 | % | 4.39 | % | 4.09 | % | 4.54 | % | |||||||||||||||||||||||||||||
| Risk-free rate |
4.00 | % | 4.05 | % | 4.15 | % | 4.61 | % | 3.57 | % | 4.28 | % | 5.11 | % | 4.65 | % | 3.49 | % | 2.19 | % | |||||||||||||||||||||||||||||
| Total value at grant date |
$ | 332,200 | $ | 292,775 | $ | 413,400 | $ | 1,258,848 | $ | 2,297,223 | $ | 66,600 | $ | 71,100 | $ | 143,400 | $ | 285,300 | $ | 254,700 | $ | 222,950 | $ | 1,044,050 | $ | 3,341,273 | |||||||||||||||||||||||
| Forfeited options |
11,325 | 17,925 | 35,100 | — | 64,350 | — | — | — | — | — | — | — | 64,350 | ||||||||||||||||||||||||||||||||||||
| Expensed in previous years |
292,843 | 190,208 | 164,460 | — | 647,511 | 66,600 | 71,100 | 143,400 | — | — | — | 281,100 | 928,611 | ||||||||||||||||||||||||||||||||||||
| Expensed in 2007 |
28,032 | 64,242 | 91,648 | 209,808 | 393,730 | — | — | — | 285,300 | — | — | 285,300 | 679,030 | ||||||||||||||||||||||||||||||||||||
| Expensed in 2008 |
— | 20,400 | 91,644 | 314,721 | 426,765 | — | — | — | — | 254,700 | — | 254,700 | 681,465 | ||||||||||||||||||||||||||||||||||||
| Expensed in 2009 |
— | — | 30,548 | 314,716 | 345,264 | — | — | — | — | — | 222,950 | 222,950 | 568,214 | ||||||||||||||||||||||||||||||||||||
| Future expense |
$ | — | $ | — | $ | — | $ | 419,603 | $ | 419,603 | $ | — | $ | — | $ | — | $ | — | $ | — | $ | — | $ | — | 419,603 | ||||||||||||||||||||||||
| Weighted average term of future expense |
|
|
1.3 years |
|
|||||||||||||||||||||||||||||||||||||||||||||
F-28
Table of Contents
SAUL CENTERS, INC.
Notes to Consolidated Financial Statements
The table below summarizes the option activity for the years 2009, 2008 and 2007:
| 2009 | 2008 | 2007 | ||||||||||||||||
| Shares | Wtd Avg Exercise Price |
Shares | Wtd Avg Exercise Price |
Shares | Wtd Avg Exercise Price | |||||||||||||
| Outstanding at January 1 |
593,628 | $ | 37.25 | 586,753 | $ | 36.15 | 430,453 | $ | 29.06 | |||||||||
| Granted |
32,500 | 32.68 | 30,000 | 50.15 | 165,000 | 54.17 | ||||||||||||
| Exercised |
(1,875 | ) | 25.78 | (23,125 | ) | 26.02 | (8,700 | ) | 26.85 | |||||||||
| Expired/Forfeited |
(15,000 | ) | 50.68 | — | — | — | — | |||||||||||
| Outstanding December 31 |
609,253 | 36.72 | 593,628 | 37.25 | 586,753 | 36.15 | ||||||||||||
| Exercisable at December 31 |
548,003 | 34.76 | 463,003 | 33.81 | 354,878 | 30.74 | ||||||||||||
The intrinsic value of options exercised in 2009, 2008 and 2007 was $14,000, $557,000 and $208,775, respectively. The intrinsic value of options outstanding and exercisable at year end 2009 was $1,666,000. The intrinsic value measures the difference between the options’ exercise price and the closing share price quoted by the New York Stock Exchange as of the date of measurement. The date of exercise was the measurement date for shares exercised during the period. At December 31, 2009, the final trading day of calendar 2009, the closing price of $32.76 per share was used for the calculation of aggregate intrinsic value of options outstanding and exercisable at that date. Options having an exercise price in excess of the December 31, 2009 closing price have no intrinsic value. The weighted average remaining contractual life of the Company’s exercisable and outstanding options are 5.7 and 5.5 years, respectively.
11. NON-OPERATING ITEMS
Gain on Property Dispositions
Gain on property dispositions in 2009 totaling $329,000 is comprised of (a) the excess of insurance proceeds received over carrying value of assets damaged at three shopping center properties during 2009 and 2008 and (b) condemnation proceeds received in connection with the taking of land at one shopping center. The insurance proceeds funded substantially all of the restoration of the damaged property.
Gain on property dispositions totaling $1,301,000 in 2008 represents the excess of insurance proceeds received over the carrying value of assets damaged at three shopping centers.
Gain on property dispositions totaling $139,000 in 2007 represents condemnation proceeds received in connection with the taking of land at one shopping center.
12. FAIR VALUE OF FINANCIAL INSTRUMENTS
The carrying values of cash and cash equivalents, accounts receivable, accounts payable and accrued expenses are reasonable estimates of their fair value. Based upon management’s estimate of borrowing rates and loan terms currently available to the Company for fixed rate financing, the fair value of the fixed rate notes payable assuming long term interest rates of approximately 7.30% and 7.15%, would be approximately $553,257,000 and $525,285,000, as of December 31, 2009 and 2008, respectively, compared to the carrying value of $576,069,000 and $548,265,000 at December 31, 2009 and 2008, respectively.
F-29
Table of Contents
SAUL CENTERS, INC.
Notes to Consolidated Financial Statements
13. COMMITMENTS AND CONTINGENCIES
Neither the Company nor the Current Portfolio Properties are subject to any material litigation, nor, to management’s knowledge, is any material litigation currently threatened against the Company, other than routine litigation and administrative proceedings arising in the ordinary course of business. Management believes that these items, individually or in the aggregate, will not have a material adverse impact on the Company or the Current Portfolio Properties.
14. DISTRIBUTIONS
In December 1995, the Company established a Dividend Reinvestment and Stock Purchase Plan (the “Plan”), to allow its stockholders and holders of limited partnership interests an opportunity to buy additional shares of common stock by reinvesting all or a portion of their dividends or distributions. The Plan provides for investing in newly issued shares of common stock at a 3% discount from market price without payment of any brokerage commissions, service charges or other expenses. All expenses of the Plan are paid by the Company. The Operating Partnership also maintains a similar dividend reinvestment plan that mirrors the Plan, which allows holders of limited partnership interests the opportunity to buy either additional limited partnership units or common stock shares of the Company.
The Company paid common stock distributions of $1.53 per share, $1.88 per share and $1.77 per share, during 2009, 2008 and 2007, respectively, and paid Series A preferred stock dividends of $2.00 per depositary share during each of the three years and Series B preferred stock dividends totaling $2.25 per share and $1.16 per share, during 2009 and 2008, respectively. For the common stock dividends paid, $1.53 per share, $1.842 per share and $1.77 per share, represented ordinary dividend income for the years 2009, 2008 and 2007. For the common stock dividend paid for the 2008 year, $0.038 per share, represented return of capital to the shareholders. The 2009 and 2007 common dividends were 100% taxable. All of the preferred stock dividends paid were considered ordinary dividend income.
F-30
Table of Contents
SAUL CENTERS, INC.
Notes to Consolidated Financial Statements
The following summarizes distributions paid during the years ended December 31, 2009, 2008 and 2007, and includes activity in the Plan as well as limited partnership units issued from the reinvestment of unit distributions:
| Total Distributions to | Dividend Reinvestments | |||||||||||||
| (Dollars in thousands) | ||||||||||||||
| Preferred Stockholders |
Common Stockholders |
Limited Partnership Unitholders |
Common Stock Shs Issued |
Discounted Share Price | ||||||||||
| Distributions during 2009 |
||||||||||||||
| October 30 |
$ | 3,785 | $ | 6,445 | $ | 1,950 | 114,643 | $ | 29.96 | |||||
| July 31 |
3,785 | 6,971 | 2,112 | 6,995 | 33.08 | |||||||||
| April 30 |
3,785 | 6,973 | 2,112 | 7,324 | 31.30 | |||||||||
| January 30 |
3,785 | 6,969 | 2,113 | 7,485 | 32.42 | |||||||||
| Total 2009 |
$ | 15,140 | $ | 27,358 | $ | 8,287 | 136,447 | |||||||
| Distributions during 2008 |
||||||||||||||
| October 31 |
$ | 3,785 | $ | 8,376 | $ | 2,546 | 8,520 | $ | 34.25 | |||||
| July 31 |
3,883 | 8,375 | 2,546 | 21,712 | 46.78 | |||||||||
| April 30 |
2,000 | 8,356 | 2,546 | 26,915 | 48.73 | |||||||||
| January 31 |
2,000 | 8,343 | 2,545 | 26,673 | 49.56 | |||||||||
| Total 2008 |
$ | 11,668 | $ | 33,450 | $ | 10,183 | 83,820 | |||||||
| Distributions during 2007 |
||||||||||||||
| October 31 |
$ | 2,000 | $ | 8,323 | $ | 2,546 | 19,828 | $ | 52.52 | |||||
| July 31 |
2,000 | 7,740 | 2,383 | 148,651 | 41.92 | |||||||||
| April 30 |
2,000 | 7,679 | 2,383 | 113,165 | 51.60 | |||||||||
| January 31 |
2,000 | 7,284 | 2,275 | 107,553 | 52.24 | |||||||||
| Total 2007 |
$ | 8,000 | $ | 31,026 | $ | 9,587 | 389,197 | |||||||
In December 2009, 2008 and 2007, the Board of Directors of the Company authorized a distribution of $0.36, $0.39 and $0.47 per common share payable in January 2010, 2009 and 2008, to holders of record on January 15, 2010, January 16, 2009 and January 17, 2008, respectively. As a result, $6,406,000, $6,967,000 and $8,343,000, were paid to common shareholders on January 29, 2010, January 30, 2009 and January 31, 2008, respectively. Also, $1,950,000, $2,112,000 and $2,545,000, were paid to limited partnership unitholders on January 29, 2010, January 30, 2009 and January 31, 2008 ($0.36, $0.39 and $0.47 per Operating Partnership unit), respectively. The Board of Directors authorized preferred stock dividends of $0.50 per Series A depositary share, to holders of record on January 5, 2010, January 5, 2009 and January 2, 2008, respectively and $0.5625 per Series B depositary share to holders of record on January 5, 2010 and 2009. As a result, $3,785,000 was paid to preferred shareholders on January 15, 2010 and 2009 and $2,000,000 was paid January 15, 2008. These amounts are reflected as a reduction of stockholders’ equity in the case of common stock and preferred stock dividends and noncontrolling interest deductions in the case of limited partner distributions and are included in dividends and distributions payable in the accompanying consolidated financial statements.
F-31
Table of Contents
SAUL CENTERS, INC.
Notes to Consolidated Financial Statements
15. INTERIM RESULTS (Unaudited)
The following summary presents the results of operations of the Company for the quarterly periods of calendar years 2009 and 2008.
| 2009 | ||||||||||||
| (In thousands, except per share amounts) | 1st Quarter | 2nd Quarter | 3rd Quarter | 4th Quarter | ||||||||
| Revenue |
$ | 39,689 | $ | 39,416 | $ | 40,273 | $ | 41,735 | ||||
| Operating income before loss on early extinguishment of debt, gain on property dispositions and noncontrolling interest |
11,550 | 10,574 | 11,349 | 11,638 | ||||||||
| Net income attributable to Saul Centers, Inc |
9,741 | 7,719 | 9,607 | 9,646 | ||||||||
| Net income available to common shareholders |
5,956 | 3,934 | 5,822 | 5,861 | ||||||||
| Net income available to common shareholders per share (diluted) |
0.33 | 0.22 | 0.32 | 0.33 | ||||||||
| 2008 | ||||||||||||
| 1st Quarter | 2nd Quarter | 3rd Quarter | 4th Quarter | |||||||||
| Revenue |
$ | 38,722 | $ | 40,105 | $ | 40,947 | $ | 40,571 | ||||
| Operating income before loss on early extinguishment of debt, gain on property dispositions and noncontrolling interest |
11,073 | 12,175 | 11,264 | 11,853 | ||||||||
| Net income attributable to Saul Centers, Inc |
9,130 | 10,229 | 9,521 | 10,814 | ||||||||
| Net income available to common shareholders |
7,033 | 6,443 | 5,736 | 7,029 | ||||||||
| Net income available to common shareholders per share (diluted) |
0.39 | 0.36 | 0.32 | 0.39 | ||||||||
F-32
Table of Contents
SAUL CENTERS, INC.
Notes to Consolidated Financial Statements
16. BUSINESS SEGMENTS
The Company has two reportable business segments: Shopping Centers and Office Properties. The accounting policies of the segments are the same as those described in the summary of significant accounting policies (see Note 2). The Company evaluates performance based upon income from real estate for the combined properties in each segment.
| (In thousands) | Shopping Centers |
Office Properties |
Corporate and Other |
Consolidated Totals |
||||||||||||
| 2009 |
||||||||||||||||
| Real estate rental operations: |
(1) | |||||||||||||||
| Revenue |
$ | 121,572 | $ | 39,532 | $ | 9 | $ | 161,113 | ||||||||
| Expenses |
(28,670 | ) | (11,423 | ) | — | (40,093 | ) | |||||||||
| Income from real estate |
92,902 | 28,109 | 9 | 121,020 | ||||||||||||
| Interest expense & amortization of deferred debt costs |
— | — | (34,689 | ) | (34,689 | ) | ||||||||||
| General and administrative |
— | — | (12,956 | ) | (12,956 | ) | ||||||||||
| Subtotal |
92,902 | 28,109 | (47,636 | ) | 73,375 | |||||||||||
| Depreciation and amortization of deferred leasing costs |
(20,324 | ) | (7,940 | ) | — | (28,264 | ) | |||||||||
| Loss on early extinguishment of debt |
— | — | (2,210 | ) | (2,210 | ) | ||||||||||
| Gain on property dispositions |
329 | — | — | 329 | ||||||||||||
| Net income |
$ | 72,907 | $ | 20,169 | $ | (49,846 | ) | $ | 43,230 | |||||||
| Capital investment |
$ | 24,346 | $ | 1,093 | $ | 55,030 | $ | 80,469 | ||||||||
| Total assets |
$ | 670,455 | $ | 116,161 | $ | 138,958 | $ | 925,574 | ||||||||
| 2008 |
||||||||||||||||
| Real estate rental operations: |
(1 | ) | ||||||||||||||
| Revenue |
$ | 121,050 | $ | 38,704 | $ | 591 | $ | 160,345 | ||||||||
| Expenses |
(26,636 | ) | (10,962 | ) | — | (37,598 | ) | |||||||||
| Income from real estate |
94,414 | 27,742 | 591 | 122,747 | ||||||||||||
| Interest expense & amortization of deferred debt costs |
— | — | (34,278 | ) | (34,278 | ) | ||||||||||
| General and administrative |
— | — | (12,321 | ) | (12,321 | ) | ||||||||||
| Subtotal |
94,414 | 27,742 | (46,008 | ) | 76,148 | |||||||||||
| Depreciation and amortization of deferred leasing costs |
(21,657 | ) | (8,126 | ) | — | (29,783 | ) | |||||||||
| Gain on property dispositions |
1,301 | — | — | 1,301 | ||||||||||||
| Net income |
$ | 74,058 | $ | 19,616 | $ | (46,008 | ) | $ | 47,666 | |||||||
| Capital investment |
$ | 94,917 | $ | 1,833 | $ | 19,155 | $ | 115,905 | ||||||||
| Total assets |
$ | 668,493 | $ | 120,410 | $ | 64,970 | $ | 853,873 | ||||||||
| 2007 |
||||||||||||||||
| Real estate rental operations: |
||||||||||||||||
| Revenue |
$ | 112,444 | $ | 37,687 | $ | 454 | $ | 150,585 | ||||||||
| Expenses |
(23,325 | ) | (9,893 | ) | — | (33,218 | ) | |||||||||
| Income from real estate |
89,119 | 27,794 | 454 | 117,367 | ||||||||||||
| Interest expense & amortization of deferred debt costs |
— | — | (33,855 | ) | (33,855 | ) | ||||||||||
| General and administrative |
— | — | (11,666 | ) | (11,666 | ) | ||||||||||
| Subtotal |
89,119 | 27,794 | (45,067 | ) | 71,846 | |||||||||||
| Depreciation and amortization of deferred leasing costs |
(18,320 | ) | (8,144 | ) | — | (26,464 | ) | |||||||||
| Gain on property dispositions |
139 | 139 | ||||||||||||||
| Net income |
$ | 70,938 | $ | 19,650 | $ | (45,067 | ) | $ | 45,521 | |||||||
| Capital investment |
$ | 43,325 | $ | 1,387 | $ | 7,324 | $ | 52,036 | ||||||||
| Total assets |
$ | 569,249 | $ | 122,908 | $ | 35,286 | $ | 727,443 | ||||||||
| (1) | Clarendon Center development included because a significant component will be residential. |
F-33
Table of Contents
SAUL CENTERS, INC.
Notes to Consolidated Financial Statements
17. SUBSEQUENT EVENTS
The Company has reviewed operating activities for the period subsequent to December 31, 2009 and prior to the date the financial statements are issued or are available to be issued, March 15, 2010, and determined certain subsequent events are required to be disclosed.
The Company and a former anchor tenant at one of its shopping center properties have been involved in a long-standing dispute arising from the non-payment of the tenant’s rent over a period of time. A final order against the former tenant was entered on March 11, 2010, awarding to the Company rent and other damages totaling approximately $2,614,000, of which approximately $669,000 is included in accounts receivable. The former tenant, which is no longer a tenant in any of the Company’s properties, has the right to, and has indicated that it will consider, an appeal of the decision. The outcome of the action and the timing of collection is uncertain at this time.
The Company’s properties have been impacted by severe winter weather, as heavy snowfall in the Mid-Atlantic states during February 2010 hindered customer’s ability to shop. Preliminary costs of removing the snow from the shopping centers and office buildings is expected to approach $3 million. Approximately 70% of the costs are historically billable to tenants.
F-34
Table of Contents
SAUL CENTERS, INC.
Real Estate and Accumulated Depreciation
December 31, 2009
(Dollars in Thousands)
| Initial Basis |
Costs Capitalized |
Basis at Close of Period | Accumulated Depreciation |
Book Value |
Related Debt |
Date of Construction |
Date Acquired |
Buildings and | |||||||||||||||||||||||||
| Subsequent to Acquisition |
Land | Buildings and Improvements |
Leasehold Interests |
Total | Improvements Depreciable Lives in Years | ||||||||||||||||||||||||||||
| Shopping Centers |
|||||||||||||||||||||||||||||||||
| Ashburn Village, Ashburn, VA |
$ | 11,431 | $ | 18,760 | $ | 6,764 | $ | 23,427 | $ | — | $ | 30,191 | $ | 7,454 | $ | 22,737 | $ | 33,000 | 1994 & 2000-2 | 3/94 | 40 | ||||||||||||
| Ashland Square Phase I, Manassas, VA |
73 | 375 | 73 | 375 | — | 448 | 42 | 406 | 12/04 | 20 | |||||||||||||||||||||||
| Ashland Square Phase II, Manassas, VA |
6,338 | 4,761 | 6,397 | 4,702 | — | 11,099 | — | 11,099 | — | 12/04 | |||||||||||||||||||||||
| Beacon Center, Alexandria, VA |
1,493 | 17,976 | — | 18,375 | 1,094 | 19,469 | 9,964 | 9,505 | 1960 & 1974 | 1/72 | 40 & 50 | ||||||||||||||||||||||
| Belvedere, Baltimore, MD |
932 | 848 | 263 | 1,517 | — | 1,780 | 1,289 | 491 | 2,084 | 1958 | 1/72 | 40 | |||||||||||||||||||||
| BJ’s Wholesale Club, Alexandria, VA |
22,623 | — | 22,623 | — | — | 22,623 | 22,623 | 12,504 | 3/08 | — | |||||||||||||||||||||||
| Boca Valley Plaza, Boca Raton, FL |
16,720 | 589 | 5,735 | 11,574 | — | 17,309 | 1,740 | 15,569 | 12,127 | 2/04 | 40 | ||||||||||||||||||||||
| Boulevard, Fairfax, VA |
4,883 | 4,729 | 3,687 | 5,925 | — | 9,612 | 1,212 | 8,400 | 7,402 | 1969 | 4/94 | 40 | |||||||||||||||||||||
| Briggs Chaney MarketPlace, Silver Spring, MD |
27,037 | 2,378 | 9,789 | 19,626 | — | 29,415 | 3,086 | 26,329 | 18,702 | 4/04 | 40 | ||||||||||||||||||||||
| Broadlands Village, Loudoun County, VA |
5,316 | 24,644 | 5,300 | 24,660 | — | 29,960 | 4,327 | 25,633 | 22,459 | 2002-3 & 2004 | 3/02 | 40 & 50 | |||||||||||||||||||||
| Countryside, Sterling, VA |
28,912 | 1,562 | 7,532 | 22,942 | — | 30,474 | 3,328 | 27,146 | 18,876 | 2/04 | 40 | ||||||||||||||||||||||
| Cruse MarketPlace, Cumming, GA |
12,226 | 65 | 3,920 | 8,371 | — | 12,291 | 1,244 | 11,047 | 7,694 | 3/04 | 40 | ||||||||||||||||||||||
| Flagship Center, Rockville, MD |
160 | 9 | 169 | — | — | 169 | 169 | 1972 | 1/72 | — | |||||||||||||||||||||||
| French Market, Oklahoma City, OK |
5,781 | 10,211 | 1,118 | 14,874 | — | 15,992 | 8,557 | 7,435 | 1972 & 2001 | 3/74 | 50 | ||||||||||||||||||||||
| Germantown, Germantown, MD |
3,576 | 724 | 2,034 | 2,266 | — | 4,300 | 1,032 | 3,268 | 1990 | 8/93 | 40 | ||||||||||||||||||||||
| Giant, Baltimore, MD |
998 | 528 | 422 | 1,104 | — | 1,526 | 920 | 606 | 2,107 | 1959 | 1/72 | 40 | |||||||||||||||||||||
| The Glen, Lake Ridge, VA |
12,918 | 6,630 | 5,300 | 14,248 | — | 19,548 | 4,627 | 14,921 | 10,824 | 1993 | 6/94 | 40 | |||||||||||||||||||||
| Great Eastern, District Heights, MD |
4,993 | 9,822 | 3,785 | 11,030 | — | 14,815 | 6,091 | 8,724 | 9,046 | 1958 & 1960 | 1/72 | 40 | |||||||||||||||||||||
| Great Falls Center, Great Falls, VA |
41,750 | 77 | 14,766 | 27,061 | — | 41,827 | 1,181 | 40,646 | 17,977 | 3/08 | 40 | ||||||||||||||||||||||
| Hampshire Langley, Langley Park, MD |
3,159 | 2,998 | 1,856 | 4,301 | — | 6,157 | 2,879 | 3,278 | 8,292 | 1960 | 1/72 | 40 | |||||||||||||||||||||
| Hunt Club Corners, Apopka, FL |
12,584 | 1,578 | 3,948 | 10,214 | — | 14,162 | 887 | 13,275 | 6,693 | 6/06 | 40 | ||||||||||||||||||||||
| Jamestown Place, Altamonte Springs, FL |
14,055 | 356 | 4,455 | 9,956 | — | 14,411 | 1,044 | 13,367 | 9,698 | 11/05 | 40 | ||||||||||||||||||||||
| Kentlands Square, Gaithersburg, MD |
14,379 | 104 | 5,006 | 9,477 | — | 14,483 | 1,752 | 12,731 | 8,982 | 2002 | 9/02 | 40 | |||||||||||||||||||||
| Kentlands Place, Gaithersburg, MD |
1,425 | 6,979 | 1,425 | 6,979 | — | 8,404 | 1,346 | 7,058 | 1/04 | 50 | |||||||||||||||||||||||
| Lansdowne Town Center, Loudoun County, VA |
6,545 | 35,470 | 6,546 | 35,469 | — | 42,015 | 3,842 | 38,173 | 38,625 | 2002 | 11/02 | 50 | |||||||||||||||||||||
| Leesburg Pike, Baileys Crossroads, VA |
2,418 | 5,887 | 1,132 | 7,173 | — | 8,305 | 5,027 | 3,278 | 18,368 | 1965 | 2/66 | 40 | |||||||||||||||||||||
| Lexington Pads, Lexington, KY * |
4,868 | 2,486 | 2,111 | 5,243 | — | 7,354 | 2,827 | 4,527 | 1971 & 1974 | 3/74 | 40 | ||||||||||||||||||||||
| Lumberton Plaza, Lumberton, NJ |
4,400 | 9,355 | 950 | 12,805 | — | 13,755 | 10,107 | 3,648 | 1975 | 12/75 | 40 | ||||||||||||||||||||||
| Shops at Monocacy, Frederick, MD |
9,541 | 13,329 | 9,260 | 13,610 | — | 22,870 | 2,249 | 20,621 | 16,706 | 2003-4 | 11/03 | 50 | |||||||||||||||||||||
| New Market, New Market, MD |
2,088 | 267 | 2,140 | 215 | — | 2,355 | — | 2,355 | — | 9/05 | |||||||||||||||||||||||
| Northrock, Warrington, VA |
8,099 | 6,498 | 8,099 | 6,498 | — | 14,597 | 100 | 14,497 | 0 | 2008 | 01/08 | ||||||||||||||||||||||
| Olde Forte Village, Ft. Washington, MD |
15,933 | 6,388 | 5,409 | 16,912 | — | 22,321 | 2,993 | 19,328 | 13,671 | 2003-4 | 07/03 | 40 | |||||||||||||||||||||
| Olney, Olney, MD |
1,884 | 1,434 | — | 3,318 | — | 3,318 | 2,665 | 653 | 1972 | 11/75 | 40 | ||||||||||||||||||||||
| Orchard Park, Sandy Spring, GA |
19,377 | 261 | 7,751 | 11,887 | — | 19,638 | 723 | 18,915 | 11,661 | 7/07 | 40 | ||||||||||||||||||||||
| Palm Springs Center, Altamonte Springs, FL |
18,365 | 63 | 5,739 | 12,689 | — | 18,428 | 1,536 | 16,892 | 11,279 | 3/05 | 40 | ||||||||||||||||||||||
F-35
Table of Contents
Schedule III
SAUL CENTERS, INC.
Real Estate and Accumulated Depreciation
December 31, 2009
(Dollars in Thousands)
| Initial Basis |
Costs Capitalized |
Basis at Close of Period | Accumulated Depreciation |
Book Value |
Related Debt |
Date of Construction |
Date Acquired |
Buildings and | |||||||||||||||||||||||||
| Subsequent to Acquisition |
Land | Buildings and Improvements |
Leasehold Interests |
Total | Improvements Depreciable Lives in Years | ||||||||||||||||||||||||||||
| Ravenwood, Baltimore, MD |
1,245 | 4,120 | 703 | 4,662 | — | 5,365 | 1,955 | 3,410 | 5,344 | 1959 | 1/72 | 40 | |||||||||||||||||||||
| Seabreeze Plaza, Palm Harbor, FL |
24,526 | 674 | 8,665 | 16,535 | — | 25,200 | 1,652 | 23,548 | 15,184 | 11/05 | 40 | ||||||||||||||||||||||
| Sea Colony (Market Place at), Bethany Beach, DE |
2,920 | 12 | 1,146 | 1,786 | — | 2,932 | 78 | 2,854 | 3/08 | 40 | |||||||||||||||||||||||
| Seven Corners, Falls Church, VA |
4,848 | 41,105 | 4,913 | 41,040 | — | 45,953 | 20,120 | 25,833 | 36,173 | 1956 | 7/73 | 40 | |||||||||||||||||||||
| Shops at Fairfax, Fairfax, VA |
2,708 | 9,292 | 992 | 11,008 | — | 12,000 | 5,214 | 6,786 | 11,104 | 1975 & 2001 | 6/75 | 50 | |||||||||||||||||||||
| Smallwood Village Center, Waldorf, MD |
17,819 | 7,239 | 6,402 | 18,656 | — | 25,058 | 1,337 | 23,721 | 10,658 | 1/06 | 40 | ||||||||||||||||||||||
| Southdale, Glen Burnie, MD |
3,650 | 18,552 | — | 21,580 | 622 | 22,202 | 17,759 | 4,443 | 1962 & 1987 | 1/72 | 40 | ||||||||||||||||||||||
| Southside Plaza, Richmond, VA |
6,728 | 8,267 | 1,878 | 13,117 | — | 14,995 | 8,595 | 6,400 | 8,004 | 1958 | 1/72 | 40 | |||||||||||||||||||||
| South Dekalb Plaza, Atlanta, GA |
2,474 | 3,593 | 703 | 5,364 | — | 6,067 | 3,760 | 2,307 | 1970 | 2/76 | 40 | ||||||||||||||||||||||
| Thruway, Winston-Salem, NC |
4,778 | 21,453 | 5,496 | 20,630 | 105 | 26,231 | 10,577 | 15,654 | 20,687 | 1955 & 1965 | 5/72 | 40 | |||||||||||||||||||||
| Village Center, Centreville, VA |
16,502 | 1,282 | 7,851 | 9,933 | — | 17,784 | 4,474 | 13,310 | 15,890 | 1990 | 8/93 | 40 | |||||||||||||||||||||
| West Park, Oklahoma City, OK |
1,883 | 707 | 485 | 2,105 | — | 2,590 | 1,461 | 1,129 | 1974 | 9/75 | 50 | ||||||||||||||||||||||
| Westview Village, Frederick, MD |
764 | 3,371 | 765 | 3,370 | — | 4,135 | 67 | 4,068 | — | 2007 | 11/07 | ||||||||||||||||||||||
| White Oak, Silver Spring, MD |
6,277 | 4,362 | 4,649 | 5,990 | — | 10,639 | 4,911 | 5,728 | 19,112 | 1958 & 1967 | 1/72 | 40 | |||||||||||||||||||||
| Other buiildings/improvements |
1,178 | 1,178 | 1,178 | 90 | 1,178 | ||||||||||||||||||||||||||||
| Total Shopping Centers |
444,402 | 323,348 | 211,793 | 554,136 | 1,821 | 767,750 | 178,121 | 589,629 | 460,932 | ||||||||||||||||||||||||
| Office Properties |
|||||||||||||||||||||||||||||||||
| Avenel Business Park, Gaithersburg, MD |
21,459 | 23,875 | 3,755 | 41,579 | — | 45,334 | 25,948 | 19,386 | 33,305 | 1984, 1986, 1990, 1998 & 2000 |
12/84, 8/85, 2/86, 4/98 & 10/2000 |
35 & 40 | |||||||||||||||||||||
| Crosstown Business Center, Tulsa, OK |
3,454 | 5,867 | 604 | 8,717 | — | 9,321 | 5,525 | 3,796 | 1974 | 10/75 | 40 | ||||||||||||||||||||||
| 601 Pennsylvania Ave., Washington, DC |
5,479 | 56,862 | 5,667 | 56,674 | — | 62,341 | 36,254 | 26,087 | 27,533 | 1986 | 7/73 | 35 | |||||||||||||||||||||
| Van Ness Square, Washington, DC |
812 | 29,064 | 831 | 29,045 | — | 29,876 | 18,213 | 11,663 | 16,923 | 1990 | 7/73 | 35 | |||||||||||||||||||||
| Washington Square, Alexandria, VA |
2,034 | 48,118 | 544 | 49,608 | — | 50,152 | 12,249 | 37,903 | 37,376 | 1952 & 2001 | 7/73 | 50 | |||||||||||||||||||||
| Total Office Properties |
33,238 | 163,786 | 11,401 | 185,623 | — | 197,024 | 98,189 | 98,835 | 115,137 | ||||||||||||||||||||||||
| Development Land |
|||||||||||||||||||||||||||||||||
| Clarendon Center, Arlington, VA |
12,753 | 103,057 | 16,287 | 99,523 | — | 115,810 | — | 115,810 | 41,619 | 7/73, 1/96 & 4/02 | |||||||||||||||||||||||
| Lexington Center, Lexington, KY * |
— | — | — | — | — | — | — | — | 3/74 | ||||||||||||||||||||||||
| Northrock, Warrington, VA |
4,587 | 7,323 | 4,587 | 7,323 | — | 11,910 | 11,910 | 19,118 | 01/08 | ||||||||||||||||||||||||
| Westview Village, Frederick, MD |
4,382 | 14,348 | 4,388 | 14,342 | — | 18,730 | 18,730 | — | 11/07 | ||||||||||||||||||||||||
| Total Development Land |
21,722 | 124,728 | 25,262 | 121,188 | — | 146,450 | — | 146,450 | 60,737 | ||||||||||||||||||||||||
| Total |
$ | 499,362 | $ | 611,862 | $ | 248,456 | $ | 860,947 | $ | 1,821 | $ | 1,111,224 | $ | 276,310 | $ | 834,914 | $ | 636,806 | |||||||||||||||
| * | Lexington Pads include the land and building basis of the property formerly identified as Lexington Mall. The Company carries costs related to the redevelopment of the property within the line item Lexington Center. |
F-36
Table of Contents
Schedule III
SAUL CENTERS, INC.
Real Estate and Accumulated Depreciation
December 31, 2009
Depreciation and amortization related to the real estate investments reflected in the statements of operations is calculated over the estimated useful lives of the assets as follows:
| Base building | 35 - 50 years | |
| Building components | Up to 20 years | |
| Tenant improvements | The shorter of the term of the lease or the useful life of the improvements |
The aggregate remaining net basis of the real estate investments for federal income tax purposes was approximately $750,188,000 at December 31, 2009. Depreciation and amortization are provided on the declining balance and straight-line methods over the estimated useful lives of the assets.
The changes in total real estate investments and related accumulated depreciation for each of the years in the three year period ended December 31, 2009 are summarized as follows.
| (In thousands) |
2009 | 2008 | 2007 | |||||||||
| Total real estate investments: |
||||||||||||
| Balance, beginning of year |
$ | 1,027,481 | $ | 889,927 | $ | 841,861 | ||||||
| Acquisitions |
3,692 | 79,987 | 27,169 | |||||||||
| Improvements |
80,524 | 62,978 | 24,742 | |||||||||
| Retirements |
(473 | ) | (5,411 | ) | (3,845 | ) | ||||||
| Balance, end of year |
$ | 1,111,224 | $ | 1,027,481 | $ | 889,927 | ||||||
| Total accumulated depreciation: |
||||||||||||
| Balance, beginning of year |
$ | 252,763 | $ | 232,669 | $ | 214,210 | ||||||
| Depreciation expense |
23,847 | 24,761 | 21,638 | |||||||||
| Adjustment |
482 | |||||||||||
| Retirements |
(300 | ) | (4,667 | ) | (3,661 | ) | ||||||
| Balance, end of year |
$ | 276,310 | $ | 252,763 | $ | 232,669 | ||||||
F-37