Attached files
| file | filename |
|---|---|
| 8-K - FORM 8-K - MERCHANTS BANCSHARES INC | v433394_8k.htm |
Exhibit 99.1

Merchants Bancshares, Inc. Investor Presentation February 2016 NASDAQ: MBVT

Preface This presentation contains some statements that may constitute forward - looking statements . Forward - looking statements relate to expectations, beliefs, projections, future plans and strategies, anticipated events or trends and similar expressions concerning matters that are not historical facts . The forward - looking statements reflect Merchants’ current views about future events and are subject to risks, uncertainties, assumptions and changes in circumstances that may cause Merchants’ actual results to differ significantly from those expressed in any forward - looking statement . Forward - looking statements should not be relied on since they involve known and unknown risks, uncertainties and other factors that are, in some cases, beyond Merchants’ control and which could materially affect actual results . The factors that could cause actual results to differ materially from current expectations include changes in general economic conditions, changes in interest rates, changes in competitive product and pricing pressures among financial institutions within Merchants’ markets, and changes in the financial condition of Merchants’ borrowers . The forward - looking statements contained herein represent Merchants’ judgment as of the date of this release, and Merchants cautions readers not to place undue reliance on such statements . For further information, please refer to Merchants’ reports filed with the Securities and Exchange Commission . 2
Company Representatives Geoffrey R. Hesslink President, CEO and Director Merchants Bancshares, Inc. and Merchants Bank ghesslink@mbvt.com 802 - 865 - 1601 3 • 26 years of banking experience; • 21 years with Merchants; • Background in credit and lending Marie A. Thresher EVP, Chief Operating Officer Merchants Bank mthresher@mbvt.com 802 - 865 - 1699 • 24 years of regional and national banking experience; • 2 years with Merchants Bank; • Background in risk management, operations, M&A, and integration

Experienced Management Team ▪ Eric A . Segal . Interim Principal Financial Officer, Principal Accounting Officer and Treasurer . Mr . Segal has more than 25 years of experience in senior financial management positions with companies ranging from the Fortune 500 to community banks . ▪ Bruce Bernier . Senior Vice President and Senior Lender . Mr . Bernier has over 20 years in commercial banking experience with local banking institutions . ▪ Jacqueline Dragon . Senior Vice President and Director of Human Resources . Ms . Dragon has over 25 years of human resources management and organizational development experience . ▪ Laura Abbott . Senior Vice President and Senior Credit Officer . Ms . Abbott has been with Merchants Bank for over 25 years . ▪ Jonathan Watson . Senior Vice President and Chief Risk Officer . Mr . Watson has over 10 years of internal audit and risk advisory services experience at regional financial institutions . ▪ Michael Cataldo . Senior Vice President and Director of Operations . Mr . Cataldo has over 30 years of experience in the financial services industry . 4

Merchants At A Glance 5 Assets (YTD average) $ 1 . 78 billion Loans (YTD average) $ 1 . 24 billion Deposits (YTD average) $ 1 . 38 billion Trust assets $ 600 million Tangible book value $ 20 . 38 per share Continuous dividend 77 consecutive quarters Consistent dividend 41 st consecutive quarters at $ 0 . 28 per share Market Capitalization $ 193 . 7 million Average Daily Trading Volume 6 , 559 shares Current Stock Price $ 28 . 24 Dividend Rate/Yield $ 1 . 12 / 4 . 0 % Institutional Ownership 35 % Insider Ownership 17 % Balance sheet data at December 31, 2015; Market data as of February 3, 2016

Investment Highlights ▪ Largest statewide independent bank in Vermont: ▪ Community focused yet capable of competing with regional and national banks ▪ Entry into Western Massachusetts with recent acquisition of NUVO : ▪ Enhanced loan growth profile and expansion of historical geographic footprint ▪ High performing, yet low risk financial profile: ▪ Sustained strong earnings through varying economic cycles ▪ Pristine loan c redit q uality ▪ Current NPAs to assets 21 bps – peaked at 105 bps in 2009 ▪ Net charge - offs never rose above 19 bps over past six years; 1 bp in 2015 ▪ Valuable core funding base – 37% non - interest bearing demand; 13% time ▪ Investment portfolio 100% AAA rated ▪ Strong liquidity and regulatory capital ▪ Compound annual growth rate (CAGR) in tangible book value (TBV) since 2005 of 6.17% ▪ 8 year total return on MBVT common stock over 100 % 6

Acquisition of NUVO ▪ Attractive financial metrics ▪ Accretive to earnings beginning first full year; ▪ TBV dilution of 3% with earn back inside 3.5 years; ▪ Internal rate of return in excess of 18%. ▪ Contiguous market with significant growth potential ▪ Expand MBVT footprint outside of Vermont to more densely populated Springfield, MA market; ▪ Potential for larger credits, lower cost of funds, and municipal, mortgage banking and asset management opportunities; ▪ Seeking additional bankers to accelerate business opportunity; ▪ Anticipate loan growth well in excess of NUVO historical experience; ▪ Attractive deployment of MBVT low cost of deposits. ▪ Commercial - oriented leadership team that remains with MBVT ▪ Donald Chase (NUVO Chairman) joined MBVT bank and holding company boards; ▪ Dale Janes (CEO) and Jeff Sattler (President) continue with bank. ▪ Reasonable sized, one branch institution facilitates integration and maintains focus on growth 7 Loan Composition Deposit Composition Owner Occupied CRE, 28% Non - Owner Occupied CRE, 10% Multi - Family, 5% C&I, 26% Consumer/ Other, 8% Residential Mortgages, 19% Home Equity, 4% Non - interest bearing, 12% NOW & MMDA, 37% Retail Time, 38% Jumbo Time, 13%

▪ Win with service - be as close to the customer as we can ; ▪ Faster turnaround, more personal interaction ; ▪ Focus on size business that is off the “radar” of larger competitors ; ▪ Mid sized commercial customers who are credit scored at larger banks get a skilled banker, knowledgeable on the industry and deal structuring with Merchants Bank . ▪ Six lines of business fit our service model : ▪ Commercial banking ; ▪ Government banking ; ▪ Cash management and treasury ; ▪ Mortgage banking ; ▪ Trust ; ▪ Deposit generation / funding . ▪ Can’t be all things to all people – outperforming banks are laser focused on the segments of the business where they can be most impactful. Our Operating Philosophy 8

▪ Grew Vermont loan business 6.7% ▪ Recognized the benefits of our new core system ▪ Enhanced customer service ▪ Streamlined our platform ▪ Automated transactions/controls ▪ Prepared for future growth ▪ Invested in team ▪ New mortgage team, investments made in commercial, credit and IT ▪ Sales and management training ▪ Acquired NUVO , expanding our market in New England Accomplishments for 2015 9

▪ Integrate, convert and build our NUVO business. ▪ Grow commercial loans in Vermont and Western Massachusetts markets. ▪ Optimize operational and system support for business initiatives. ▪ Continued focus on growth and revenue. Opportunities in 2016 / A Year of Growth 10

8 Year Total Return Data source: SNL.com 1/7/2007 through 12/31/2015 11 103.6% - 19.8% 63.2% -40% -20% 0% 20% 40% 60% 80% 100% 120% 140% Merchants SNL US Bank Russell 2000

The Markets We Serve 12

Vermont and Massachusetts Economies Mirror U.S. Economy VT source - http://www.vtlmi.info MA & U.S. Source - http://www.bls.gov 13 Vermont Springfield, MA U.S. Vermont Springfield Goods Producing 15.0% 12.5% 13.9% 1.1% -1.4% Trade Transportation and Utilities 17.7% 17.9% 18.9% -1.2% -1.0% Information 1.6% 1.1% 2.0% -0.4% -0.9% Financial Activities 3.9% 4.9% 5.7% -1.8% -0.8% Professional and Business Services 8.7% 8.5% 14.0% -5.3% -5.5% Educational and Health Services 20.3% 23.1% 15.5% 4.8% 7.6% Leisure and Hospitality 11.3% 9.1% 10.8% 0.5% -1.7% Other Services 3.3% 3.8% 3.9% -0.6% -0.1% Government 18.2% 19.1% 15.3% 2.9% 3.8% September 2015 Employment Shares Comparison to US

Healthy Labor Markets VT Source - http://www.vtlmi.info / MA & U.S . Source - http://www.bls.gov/ Unemployment Rate 0.00 2.00 4.00 6.00 8.00 10.00 Q1 2010 Q2 2010 Q3 2010 Q4 2010 Q1 2011 Q2 2011 Q3 2011 Q4 2011 Q1 2012 Q2 2012 Q3 2012 Q4 2012 Q1 2013 Q2 2013 Q3 2013 Q4 2013 Q1 2014 Q2 2014 Q3 2014 Q4 2014 Q1 2015 Q2 2015 Q3 2015 Q4 2015 United States Vermont Massachusetts $38,000 $43,000 $48,000 $53,000 $58,000 2005 2006 2007 2008 2009 2010 2011 2012 2013 2014 Vermont Springfield, MA U.S. 14 Median Income 4.7% 5.0% 3.6%

Vermont Deposit Market Share Has Room to Grow 56% of Deposit Market Share is Held by Out of State Banks Statewide Deposits (000's) 2015 2014 2013 2012 2011 2010 2009 2008 2007 People's United 2,758,248 2,667,323 2,632,403 2,615,898 2,469,355 2,586,791 2,490,817 2,543,777 2,733,058 TD Bank 2,486,590 2,518,158 2,568,284 2,569,294 2,326,146 1,960,974 1,819,737 1,690,094 1,557,240 Merchants Bank 1,346,910 1,311,672 1,315,260 1,241,448 1,104,101 1,037,878 1,016,332 946,264 873,471 Citizens 772,009 783,984 813,942 850,655 787,191 845,755 851,099 884,746 980,067 Key Bank 719,569 672,453 709,681 780,546 706,677 819,359 885,505 846,992 798,400 State Deposit Base 2015 2014 2013 2012 2011 2010 2009 2008 2007 Dollars (000's) 12,089,894 11,776,548 11,745,641 11,705,166 10,293,718 10,631,225 10,314,185 9,948,551 9,928,805 Market Share Percentages 2015 2014 2013 People's United 22.81% 22.65% 22.41% TD Banknorth 20.57% 21.38% 21.87% Merchants Bank 11.14% 11.14% 11.20% Citizens 6.39% 6.66% 6.93% Key Bank 5.95% 5.71% 6.04% All Other in State Banks 33.14% 32.46% 31.55% All Out of State Banks 55.72% 56.40% 57.25% Merchants Bank 11.14% 11.14% 11.20% 33.14% 55.72% 11.14% All Other in State Banks All Out of State Banks Merchants Bank 15

0 5,000 10,000 15,000 20,000 25,000 30,000 35,000 40,000 Springfield City, MA Hampden County, MA Vermont 0 10,000 20,000 30,000 40,000 50,000 60,000 70,000 Springfield City, MA Hampden County, MA Vermont Springfield, Massachusetts Expansion Opportunity ________ Source: SNL Financial, U.S. Census Bureau 2015 Population 2015 Median Household Income ($) 0 100,000 200,000 300,000 400,000 500,000 600,000 700,000 Springfield City, MA Hampden County, MA Vermont 0 10,000 20,000 30,000 40,000 50,000 60,000 70,000 Springfield City, MA Hampden County, MA Vermont Businesses Business Sales ($ millions) 16

Balance Sheet Growth and Composition 17

Loan Portfolio (in thousands) $500,000 $600,000 $700,000 $800,000 $900,000 $1,000,000 $1,100,000 $1,200,000 $1,300,000 2008 2009 2010 2011 2012 2013 2014 2015 18 Compound annual growth rate of 5.94%

C & I 12.3% CRE 34.9% Residential 45.3% Municipal 7.5% Loan Composition 2015 2010 C & I 19.2% CRE 40.5% Residential 32.8% Municipal 7.5% 19 Intentional shift toward CRE and C&I

Apartments 16.2% Hotel/Motel 5.3% Industrial Building 13.5% Office Building, 13.7% Retail/Mixed Use 21.3% Other 16.3% Residential, 1 - 4 Units 10.6% Education, 3.1% Owner Occupied 36.7% Non - Owner Occupied 39.4% Multi - Family 15.7% Construction & Development 8.2% Commercial Real Estate Loan Type At December 31, 2015 Collateral Type 20 Low risk loan portfolio with well diversified collateral structure
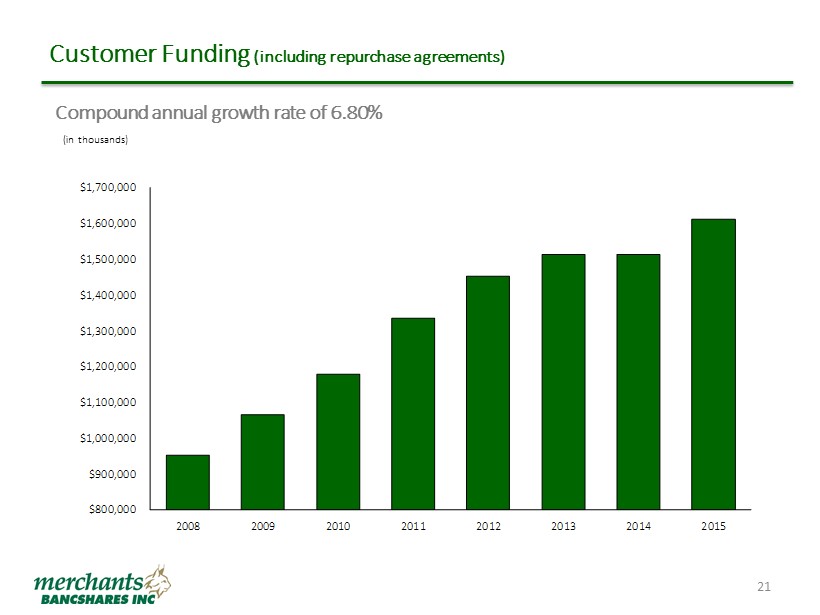
Customer Funding (including repurchase agreements) $800,000 $900,000 $1,000,000 $1,100,000 $1,200,000 $1,300,000 $1,400,000 $1,500,000 $1,600,000 $1,700,000 2008 2009 2010 2011 2012 2013 2014 2015 21 Compound annual growth rate of 6.80% (in thousands)

Demand 11% Savings & NOW 22% Money Market 22% Time 28% Customer Repo 17% Customer Funding Composition 2010 Demand 37% Savings & NOW 7% Money Market 29% Time 13% Customer Repo 14% 22 2015 Intentional shift in funding composition to provide low cost and stable funding
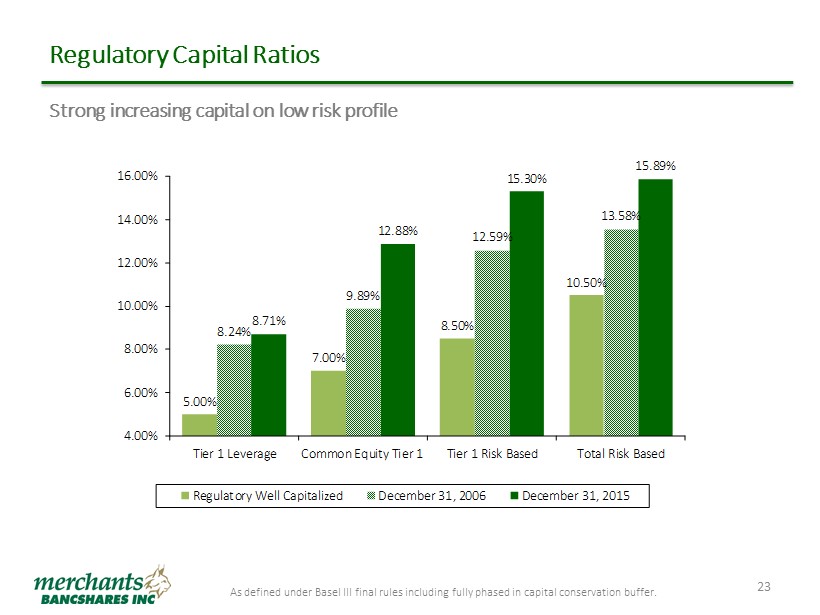
5.00% 7.00% 8.50% 10.50% 8.24% 9.89% 12.59% 13.58% 8.71% 12.88% 15.30% 15.89% 4.00% 6.00% 8.00% 10.00% 12.00% 14.00% 16.00% Tier 1 Leverage Common Equity Tier 1 Tier 1 Risk Based Total Risk Based Regulatory Well Capitalized December 31, 2006 December 31, 2015 Regulatory Capital Ratios As defined under Basel III final rules including fully phased in capital conservation buffer. 23 Strong increasing capital on low risk profile
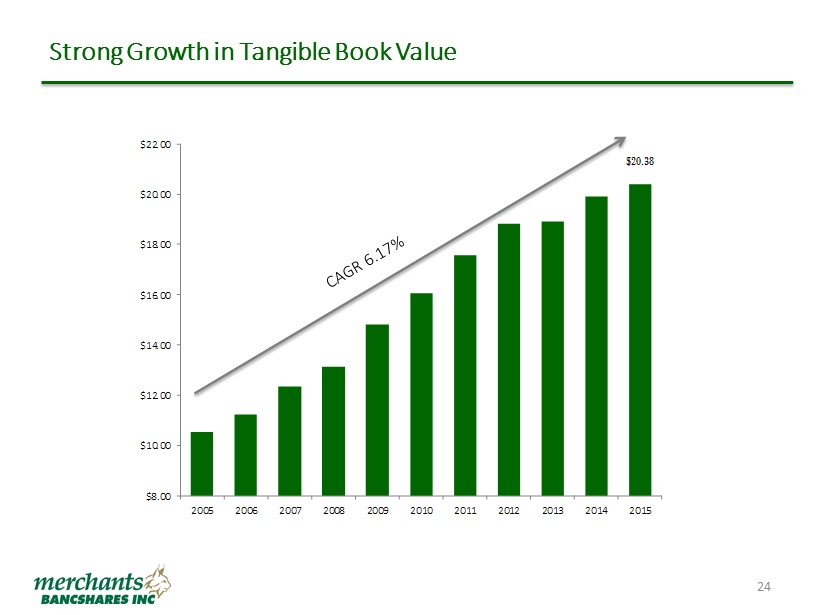
Strong Growth in Tangible Book Value $8.00 $10.00 $12.00 $14.00 $16.00 $18.00 $20.00 $22.00 2005 2006 2007 2008 2009 2010 2011 2012 2013 2014 2015 $20.38 24

Financial Performance 25

Return on Assets *MBVT ROAA based upon adjusted operating income (excludes significant, nonrecurring conversion and severance costs). See non - GAAP reconciliation in Appendix. **Peer data as of 9/30/2015. 0.40% 0.50% 0.60% 0.70% 0.80% 0.90% 1.00% 1.10% 2008 2009 2010 2011 2012 2013 2014* 2015* MBVT ROAA Peer Group ROAA** 26

Superior Return on Equity *MBVT ROAE based upon adjusted operating income (excludes significant, nonrecurring conversion and severance costs). See non - GA AP reconciliation in appendix. **Peer data as of 9/30/2015. 5.00% 7.00% 9.00% 11.00% 13.00% 15.00% 17.00% 2008 2009 2010 2011 2012 2013 2014* 2015* MBVT ROAE Peer Group ROAE** 27

Superior Asset Quality NPAs as a % of Total Assets 28 0.92% 1.05% 0.29% 0.18% 0.17% 0.06% 0.05% 0.21% 0.67% 1.37% 1.38% 1.47% 1.29% 1.22% 0.88% 0.77% 0.00% 0.20% 0.40% 0.60% 0.80% 1.00% 1.20% 1.40% 1.60% 2008 2009 2010 2011 2012 2013 2014 2015 Merchants Peer Group 2015 peer data as of 9/30/15
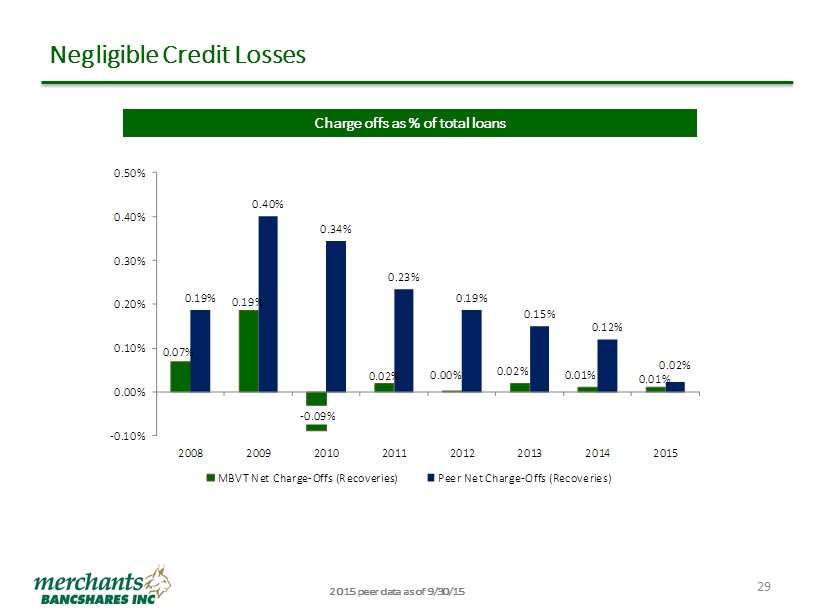
Negligible Credit Losses 2015 peer data as of 9/30/15 Charge offs as % of total loans 0.07% 0.19% - 0.09% 0.02% 0.00% 0.02% 0.01% 0.01% 0.19% 0.40% 0.34% 0.23% 0.19% 0.15% 0.12% 0.02% -0.10% 0.00% 0.10% 0.20% 0.30% 0.40% 0.50% 2008 2009 2010 2011 2012 2013 2014 2015 MBVT Net Charge-Offs (Recoveries) Peer Net Charge-Offs (Recoveries) 29

0.53% 0.40% 0.29% 0.26% 0.26% 0.20% 1.06% 0.85% 0.64% 0.51% 0.45% 0.43% 0.00% 0.20% 0.40% 0.60% 0.80% 1.00% 1.20% 2010 2011 2012 2013 2014 2015 MBVT Peers Low Deposit Cost Cost of Deposits 30 2015 peer data as of 9/30/15

3.10% 3.06% 3.03% 2.93% 2.95% 2.95% 2.96% 2.89% 2.85% 2.90% 2.95% 3.00% 3.05% 3.10% 3.15% Q1 2014 Q2 2014 Q3 2014 Q4 2014 Q1 2015 Q2 2015 Q3 2015 Q4 2015 Net Interest Margin – Last Eight Quarters 31 Accretive to Margin ▪ Reinvest excess liquidity into loans and investments ▪ Asset prepayments are slowing ▪ Funding costs are stable ▪ Expect continued growth in transaction account balances Dilutive to Margin ▪ Marginal asset yields are still below average ▪ Balance sheet positioned for rise in interest rates

Margin History – Risk Adjusted Risk adjusted NIM computed by subtracting MBVT NCO/Avg. Loan Percent from Peer group NCO/Avg. Loan Percent plus MBVT Actual NIM. 3.80% 3.65% 3.51% 3.28% 3.15% 3.03% 2.98% 3.92% 4.05% 3.76% 3.49% 3.27% 3.15% 3.07% 3.45% 3.45% 3.40% 3.41% 3.22% 3.25% 3.17% 2.75% 2.95% 3.15% 3.35% 3.55% 3.75% 3.95% 4.15% 4.35% 2009 2010 2011 2012 2013 2014 Q3 2015 NIM MBVT Risk Adjusted NIM MBVT Avg NIM - Peer Group 32 2015 peer data as of 9/30/15
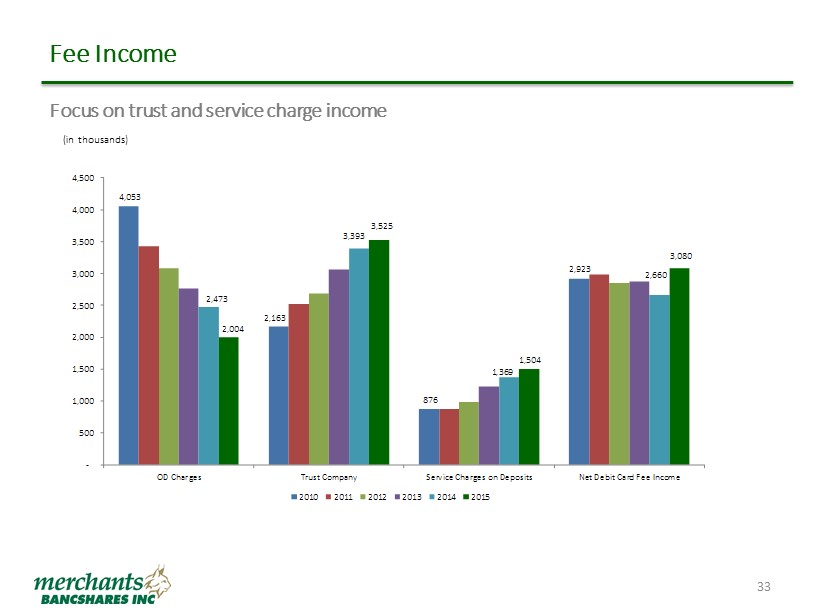
Fee Income 4,053 2,163 876 2,923 2,473 3,393 1,369 2,660 2,004 3,525 1,504 3,080 - 500 1,000 1,500 2,000 2,500 3,000 3,500 4,000 4,500 OD Charges Trust Company Service Charges on Deposits Net Debit Card Fee Income 2010 2011 2012 2013 2014 2015 33 Focus on trust and service charge income (in thousands)

Efficiency Ratio * The efficiency ratio excludes amortization of intangibles, equity in losses of real estate limited partnerships, OREO expenses, gain/loss on sales of securities, state franchise taxes, and any significant nonrecurring items . 64.02% 67.75% 63.22% 50% 55% 60% 65% 70% MBVT Adjusted * Merchants Bancshares, Inc. Peer Group 34 Peer group data as of 9/30/15, Merchants data as of 12/31/15

Financial Highlights 35 (dollars in thousands) 2015 Operating* 2015 Reported 2014 Operating* 2014 Reported 2013 2013 2012 2011 2010 Total Assets 2,021,198$ 2,021,198$ 1,723,465$ 1,723,465$ 1,725,469$ 1,725,469$ 1,708,550$ 1,611,869$ 1,487,644$ Gross Loans 1,414,280 1,414,280 1,182,334 1,182,334 1,166,233 1,166,233 1,082,923 1,027,626 910,794 Investment Securities 403,128 403,128 341,894 341,894 393,339 393,339 509,088 512,309 466,756 Total Deposits & Customer Repos 1,838,078 1,838,078 1,567,236 1,567,236 1,573,890 1,573,890 1,558,600 1,440,407 1,324,389 Other Long Term Debt 2,237 2,237 2,320 2,320 2,403 2,403 2,483 22,562 31,139 Total Equity 147,992 147,992 125,821 125,821 119,611 119,611 118,221 109,537 99,331 Net Interest Income (FTE) 50,153 50,153 48,525 48,525 50,955 50,955 51,989 51,304 50,348 Provision for Credit Losses 250 250 150 150 800 800 950 750 (1,750) Non-interest Income** 11,520 11,960 11,467 11,467 11,014 11,014 11,023 10,855 11,390 Merger-related expenses 0 1,875 - - - - - - - Core Conversion - - - 1,319 - - - - - Non-interest Expense*** 42,964 43,971 40,170 42,214 39,534 40,618 39,587 40,102 39,356 Net Income 14,572 12,618 13,617 12,125 15,131 15,131 15,194 14,620 15,461 Diluted EPS $2.28 $1.98 $2.15 $1.91 $2.40 $2.40 $2.42 $2.35 $2.51 ROAA 0.82% 0.71% 0.79% 0.73% 0.90% 0.90% 0.92% 0.97% 1.07% ROAE 11.19% 9.69% 10.71% 9.84% 12.97% 12.97% 13.37% 14.11% 16.18% Net Interest Margin 2.94% 2.94% 3.03% 3.03% 3.15% 3.15% 3.28% 3.51% 3.65% *line items exclude certain one-time events. See Appendix - Non-GAAP reconciliation for details. **excludes gains and losses on securities and other assets ***excludes long-term debt prepayment penalties

Appendix 36

Peer Group As of 9/30/15 Company Name Location Total Assets Loans/ Deposits (%) Tang Common Equity/ Tang Assets (%) Tier 1 Ratio (%) Market Cap of Traded Common Equity ($M) Price/ Last- twelve- months EPS (x) Price/ Book (%) Price/ Tangible Book (%) NPAs/ Assets (%) NCOs/ Avg Loans (%) Arrow Financial Corp. Glens Falls, NY 2,419,551 73.82 7.79 13.94 345.53 13.92 161.48 182.21 0.37 0.06 Bar Harbor Bankshares Bar Harbor, ME 1,567,921 96.54 9.52 15.15 196.23 13.06 127.30 131.92 0.63 0.14 Camden National Corp. Camden, ME 2,871,798 91.18 7.51 13.67 416.02 12.03 117.15 143.29 0.54 0.11 Century Bancorp Inc. Medford, MA 3,856,407 56.39 5.41 11.74 143.42 9.64 103.37 104.69 0.12 (0.04) Chemung Financial Corp. Elmira, NY 1,631,639 80.98 7.02 11.10 129.84 13.70 94.61 116.46 1.34 0.09 Enterprise Bancorp Inc. Lowell, MA 2,195,314 91.26 7.81 8.81 233.19 14.50 129.31 133.50 1.04 0.08 Evans Bancorp Inc. Hamburg, NY 920,891 92.90 8.94 11.80 105.53 12.72 117.22 128.86 1.32 0.01 Financial Institutions Inc. Warsaw, NY 3,357,608 74.00 6.39 10.49 386.89 14.06 137.08 180.88 0.26 0.40 First Bancorp Inc. Damariscotta, ME 1,539,672 90.92 9.08 14.77 204.65 12.60 122.18 148.95 0.74 0.21 Hingham Instit. for Savings Hingham, MA 1,690,959 114.10 7.92 13.03 255.49 13.31 185.12 185.12 0.40 (0.01) Lake Sunapee Bank Grp Newport, NH 1,490,812 105.31 5.80 12.38 115.43 12.76 84.44 136.91 0.88 0.12 Meridian Bancorp Inc. Peabody, MA 3,375,848 111.26 16.94 17.44 758.38 30.04 128.95 132.02 1.46 0.06 SI Financial Group Inc. Willimantic, CT 1,453,646 110.27 9.46 15.39 169.83 40.88 110.35 125.18 0.85 0.04 United Financial Bancorp Glastonbury, CT 5,843,022 99.04 8.71 10.99 561.62 11.25 89.78 111.71 0.91 0.10 Washington Trust Bancorp Inc. Westerly, RI 3,674,836 105.12 8.18 11.83 634.15 14.67 168.93 211.48 0.85 0.07 Westfield Financial Inc. Westfield, MA 1,357,215 88.63 10.29 16.42 146.23 24.24 104.85 104.85 0.57 0.05 Minimum 920,891 56.39 5.41 8.81 105.53 9.64 84.44 104.69 0.12 (0.04) Median 1,943,137 92.08 8.05 12.71 218.92 13.50 119.70 132.76 0.80 0.07 Average 2,452,946 92.61 8.55 13.06 300.15 16.46 123.88 142.38 0.77 0.09 Maximum 5,843,022 114.10 16.94 17.44 758.38 40.88 185.12 211.48 1.46 0.40 Merchants Bancshares Inc. South Burlington, VT 1,818,341 90.66 7.29 15.83 194.41 14.31 131.37 139.20 0.08 0.01 37
Non - GAAP 38 Non - GAAP Financial Measure . In addition to results presented in accordance with generally accepted accounting principles (“GAAP”), this presentation contains certain non - GAAP financial measures, such as operating net income, operating return on average assets and equity and tangible book value . Merchants Bancshares believes that the supplemental non - GAAP information is utilized by regulators and market analysts to evaluate a company’s financial condition and therefore such information is useful to investors . These disclosures should not be viewed as a substitute for financial results determined in accordance with GAAP, nor are they necessarily comparable to non - GAAP performance measures which may be presented by other companies . Because non - GAAP financial measures are not standardized, it may not be possible to compare these financial measures with other companies’ non - GAAP financial measures having the same or similar names .
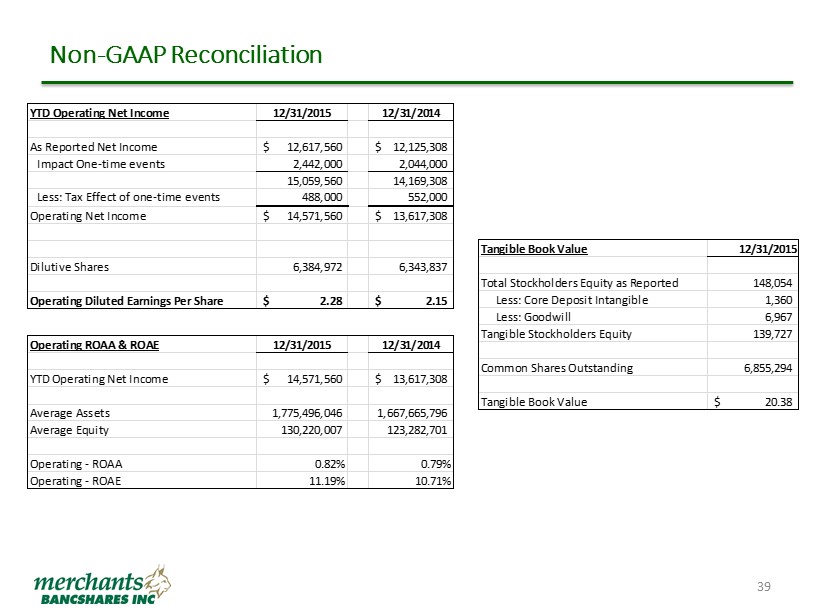
Non - GAAP Reconciliation 39 YTD Operating Net Income 12/31/2015 12/31/2014 As Reported Net Income 12,617,560$ 12,125,308$ Impact One-time events 2,442,000 2,044,000 15,059,560 14,169,308 Less: Tax Effect of one-time events 488,000 552,000 Operating Net Income 14,571,560$ 13,617,308$ Dilutive Shares 6,384,972 6,343,837 Operating Diluted Earnings Per Share 2.28$ 2.15$ Operating ROAA & ROAE 12/31/2015 12/31/2014 YTD Operating Net Income 14,571,560$ 13,617,308$ Average Assets 1,775,496,046 1,667,665,796 Average Equity 130,220,007 123,282,701 Operating - ROAA 0.82% 0.79% Operating - ROAE 11.19% 10.71% Tangible Book Value 12/31/2015 Total Stockholders Equity as Reported 148,054 Less: Core Deposit Intangible 1,360 Less: Goodwill 6,967 Tangible Stockholders Equity 139,727 Common Shares Outstanding 6,855,294 Tangible Book Value 20.38$