Attached files
| file | filename |
|---|---|
| EX-32.2 - EXHIBIT 32.2 - VWR Corp | a2015q4form10-kcex322.htm |
| EX-31.2 - EXHIBIT 31.2 - VWR Corp | a2015q4form10-kcex312.htm |
| EX-31.1 - EXHIBIT 31.1 - VWR Corp | a2015q4form10-kcex311.htm |
| EX-24 - EXHIBIT 24 - VWR Corp | a2015q4form10-kcex24.htm |
| EX-10.7 - EXHIBIT 10.7 - VWR Corp | a2015q4form10-kcex107.htm |
| EX-23.1 - EXHIBIT 23.1 - VWR Corp | a2015q4form10-kcex231.htm |
| EX-32.1 - EXHIBIT 32.1 - VWR Corp | a2015q4form10-kcex321.htm |
| EX-21.1 - EXHIBIT 21.1 - VWR Corp | a2015q4form10-kcex211.htm |
UNITED STATES SECURITIES AND EXCHANGE COMMISSION
Washington, D.C. 20549
FORM 10-K
ý ANNUAL REPORT PURSUANT TO SECTION 13 OR 15(d) OF THE SECURITIES EXCHANGE ACT OF 1934
For the fiscal year ended December 31, 2015
¨ TRANSITION REPORT PURSUANT TO SECTION 13 OR 15(d) OF THE SECURITIES EXCHANGE ACT OF 1934
For the transition period from __________ to __________
Commission file number: 001-36673
VWR Corporation
(Exact name of registrant as specified in its charter)
Delaware | 26-0237871 |
(State of incorporation) | (I.R.S. Employer Identification No.) |
Radnor Corporate Center, Building One, Suite 200
100 Matsonford Road
Radnor, Pennsylvania 19087
(Address of principal executive offices)
(610) 386-1700
(Registrant’s telephone number, including area code)
Securities registered pursuant to Section 12(b) of the Act:
Common Stock, par value $0.01 per share | The NASDAQ Stock Market LLC |
(Title of class) | (Name of exchange on which registered) |
Securities registered pursuant to Section 12(g) of the Act: None
Indicate by check mark if the registrant is a well-known seasoned issuer, as defined in Rule 405 of the Securities Act. ý Yes ¨ No
Indicate by check mark if the registrant is not required to file reports pursuant to Section 13 or Section 15(d) of the Act. ¨ Yes ý No
Indicate by check mark whether the registrant (1) has filed all reports required to be filed by Section 13 or 15(d) of the Securities Exchange Act of 1934 during the preceding 12 months (or for such shorter period that the registrant was required to file such reports), and (2) has been subject to such filing requirements for the past 90 days. ý Yes ¨ No
Indicate by check mark whether the registrant has submitted electronically and posted on its corporate Web site, if any, every Interactive Data File required to be submitted and posted pursuant to Rule 405 of Regulation S-T (§232.405 of this chapter) during the preceding 12 months (or for such shorter period that the registrant was required to submit and post such files). ý Yes ¨ No
Indicate by check mark if disclosure of delinquent filers pursuant to Item 405 of Regulation S-K (§ 229.405 of this chapter) is not contained herein, and will not be contained, to the best of registrant’s knowledge, in definitive proxy or information statements incorporated by reference in Part III of this Form 10-K or any amendment to this Form 10-K. ý
Indicate by check mark whether the registrant is a large accelerated filer, an accelerated filer, a non-accelerated filer, or a smaller reporting company. ý Large accelerated filer ¨ Accelerated filer ¨ Non‑accelerated filer ¨ Smaller reporting company
Indicate by check mark whether the registrant is a shell company (as defined in Rule 12b-2 of the Act). ¨ Yes ý No
As of June 30, 2015, the aggregate market value of common stock held by non-affiliates of the registrant was $1,276,590,051.
On February 18, 2016, 131,419,375 shares of the registrant’s common stock, $0.01 par value per share, were outstanding.
DOCUMENTS INCORPORATED BY REFERENCE
Portions of our definitive proxy statement for our 2016 annual meeting of stockholders will be filed with the SEC on or before 120 days after our 2015 fiscal year-end and are incorporated by reference into Part III of this report.
VWR Corporation and Subsidiaries
Form 10-K
For the fiscal year ended December 31, 2015
Table of Contents
Page | |
i
Glossary of Commonly Used Terms
Description | |
the Company, we, us, our | VWR Corporation and its consolidated subsidiaries |
Adjusted EBITDA* | our earnings or loss before interest, taxes, depreciation, amortization and certain other adjustments |
Adjusted EPS* | our net income, adjusted for certain items, divided by diluted weighted average shares outstanding, normalized for the shares issued in our IPO |
Americas | a reportable segment covering North, Central and South America |
A/R Facility | an accounts receivable securitization facility due 2016 |
Biopharma | the combination of the pharmaceutical and biotechnology sectors |
Board | the board of directors of VWR Corporation |
EMEA-APAC | a reportable segment covering Europe, Middle East, Africa and Asia-Pacific |
FASB | the Financial Accounting Standards Board |
Free Cash Flow* | our operating cash flows reduced by our capital expenditures |
GAAP | United States generally accepted accounting principles |
IPO | our initial public offering which occurred in 2014 |
ITRA | the income tax receivable agreement with VWR Holdings |
NASDAQ | the stock exchange on which our common stock is traded |
Organic net sales growth* | the reported growth in net sales compared to a prior period, reduced by the impact of changes in foreign currency rates and the contribution of acquisitions to the extent not present in the prior reported results |
SEC | the United States Securities and Exchange Commission |
SG&A expenses | selling, general and administrative expenses as defined by GAAP and SEC regulations |
VWR Funding | VWR Funding, Inc., our wholly-owned subsidiary |
VWR Holdings | Varietal Distribution Holdings, LLC, our parent company |
* | Denotes a non-GAAP financial measurement. See Item 7, “Management’s Discussion and Analysis of Financial Condition and Results of Operations—Key Indicators of Performance and Financial Condition” for more information, including where to find reconciliations from the most directly comparable GAAP-based financial measurements. |
ii
Cautionary Factors Regarding Forward-Looking Statements
This report contains forward-looking statements. All statements other than statements of historical fact included in this report are forward-looking statements. Forward-looking statements discuss our current expectations and projections relating to our financial condition, results of operations, plans, objectives, future performance and business. These statements may be preceded by, followed by or include the words “aim,” “anticipate,” believe,” “estimate,” “expect,” “forecast,” “intend,” “likely,” “outlook,” “plan,” “potential,” “project,” “projection,” “seek,” “can,” “could,” “may,” “should,” “would,” “will,” the negatives thereof and other words and terms of similar meaning.
Forward-looking statements are inherently subject to risks, uncertainties and assumptions; they are not guarantees of performance. You should not place undue reliance on these statements. We have based these forward-looking statements on our current expectations and projections about future events. Although we believe that our assumptions made in connection with the forward-looking statements are reasonable, we cannot assure you that the assumptions and expectations will prove to be correct.
You should understand that the following important factors, in addition to those discussed in this report, could affect our future results and could cause those results or other outcomes to differ materially from those expressed or implied in our forward-looking statements:
• | unfavorable political, economic, capital and credit market conditions in the regions where we operate; |
• | changes in our customers’ research, development and production and other scientific endeavors; |
• | changes to the life science industry adversely affecting our business; |
• | increased competition from other companies in our industry and our ability to increase our market shares in the geographic regions where we operate; |
• | our ability to maintain relationships with our customers and suppliers; |
• | our ability to consummate and integrate recent and future acquisitions; |
• | the international scope of our operations; |
• | the need to record impairment charges against our goodwill, other intangible and/or other long-lived assets; |
• | existing and increased government regulations to which we and our suppliers are subject; |
• | our ability to comply with applicable antitrust or competition laws; |
• | increased costs to comply with environmental, health and safety laws and regulations; |
• | product liability and other claims in the ordinary course of business; |
• | our ability to hire, train and retain executive officers and other key personnel; |
• | significant interruptions in the operations of our distribution centers or the operations of our suppliers; |
• | failure of our information services and its connectivity to our customers, suppliers and/or certain service providers; |
• | our failure to register and in some cases own the existing applications and registrations for our material trademarks or service marks in certain countries where we do business; |
• | foreign currency exchange rate fluctuations; and |
• | unanticipated increases to our income tax liabilities. |
All forward-looking statements attributable to us or persons acting on our behalf are expressly qualified in their entirety by the foregoing cautionary statements. In addition, all forward-looking statements speak only as of the date of this report. We undertake no obligations to update or revise publicly any forward-looking statements, whether as a result of new information, future events or otherwise other than as required under the federal securities laws.
iii
PART I
Item 1. | Business |
We are a leading, independent provider of laboratory products, services and solutions to the global life science, general research and applied markets. We have significant market positions in Europe and North America. We also have operations in Asia-Pacific and other key emerging markets to support our multinational customers across the globe. We serve a critical role in connecting customer sites with core laboratory product suppliers across multiple industries and geographies. We offer a broad portfolio of branded and private label laboratory products. We also offer a full range of value-added services, including custom manufacturing, to meet our customers’ needs. These services represent a growing but currently small portion of our overall net sales. We offer a wide selection of unique products and have developed an extensive global infrastructure including thousands of sales and service-focused professionals. We deliver value to our customers by improving the costs, efficiency and effectiveness of their research laboratories and production operations. We deliver value to our suppliers by providing them with cost-effective channel access to a global and diverse customer base.
Our portfolio includes chemicals, reagents, consumables, durable products and scientific equipment and instruments with a range of complexity and sophistication. We offer most of the leading branded products to the customer segments we serve. Our private label products enhance our branded product offerings by providing additional choice at varying price points to our customers. We complement our branded and private label product portfolio with value-added service offerings marketed under the “VWRCATALYST” brand, including sourcing and procurement, logistics, chemical and equipment tracking and sample management. We have recently expanded our service offerings to include more complex scientific research support services, such as genotyping, bioreactor servicing, compound management and customized kit assembly. In addition, we offer custom manufacturing solutions, including buffers, reagents and other chemicals used in biopharmaceutical and industrial applications and production processes. We believe these growing value-added service offerings integrate us within our customers’ critical operational processes and further differentiate our value proposition from that of our competitors. We believe our range of offerings and capabilities enhances our ability to expand our addressable market and gain market share leading to incremental net sales and profits.
Business Segments
We report financial results on the basis of two reportable segments organized by geographic region: Americas and EMEA-APAC. Our Americas segment is comprised of operations located principally in the United States and Canada as well as in Puerto Rico, Mexico and select countries in Central and South America, including Costa Rica, Brazil, Argentina and Chile, and includes 65 facilities located in 8 countries. The EMEA-APAC segment is comprised of our operations located principally in Europe as well as in certain Asia-Pacific countries, and includes 102 facilities located in 26 countries.
The following table presents the percentage of net sales from each of our reportable segments:
Year ended December 31, | ||||||||
2015 | 2014 | 2013 | ||||||
Americas | 60 | % | 56 | % | 56 | % | ||
EMEA-APAC | 40 | 44 | 44 | |||||
Total | 100 | % | 100 | % | 100 | % | ||
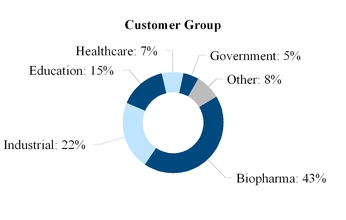
Both of our segments provide laboratory products, services and solutions to customers in the life science, general research and applied markets, including the Biopharma, agricultural, chemical, environmental, food and beverage, healthcare, microelectronic and petrochemical industries, as well as governmental agencies, universities, primary education and research institutes and environmental organizations. We also offer a similar portfolio of laboratory products and other supplies in both of our segments.
1
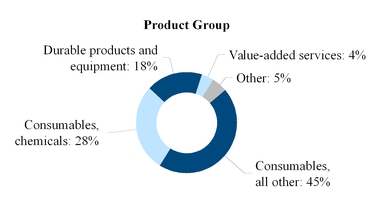
We use operational data and management assumptions to estimate our product and customer mix as a percentage of consolidated net sales. The following charts present estimated net sales by product and customer group as a percentage of total net sales for the year ended December 31, 2015:
For more information about our reportable segments, see Note 22 to our consolidated financial statements beginning on page F-1 of this report.
Products and Services
Branded and Private Label Laboratory Products
We provide value to our customers by offering a broad portfolio of branded and private label laboratory products in our industry, including custom manufacturing. Our portfolio of branded products gives our customers access to some of the most recognized brands in the world. We enhance our customers’ choice by offering a lower cost, private label alternative to branded products. Private label laboratory products represented approximately 20% of our 2015 net sales. During 2015, we processed approximately 17,000 customer orders per day with an average order size of approximately $700. We distinguish between product types within our branded and private label laboratory products as consumable or durable.
Consumable Products
Many of our products, including chemicals, laboratory and production supplies and science education products, are consumable in nature. These products are basic and essential supplies required by research and quality control laboratories and are generally used on a recurring basis. In addition to our extensive selection of branded products, we offer a robust suite of private label offerings. Further, we offer custom manufactured chemicals, including buffers, reagents and other chemicals used in Biopharma and industrial applications and production process. Consumable products represented approximately 73% of our 2015 net sales.
Durable Products and Equipment
We also offer durable products and scientific instruments with varying levels of complexity and sophistication. These products represented approximately 18% of our 2015 net sales.
Value-Added Services
We complement our branded and private label product portfolio with a number of customized value-added services, which we collectively have branded “VWRCATALYST.” In addition to our traditional service offerings such as procurement, logistics, chemical and equipment tracking and glassware autoclaving, we have expanded our service offerings to include more complex scientific research support services, such as DNA extraction, bioreactor servicing, compound management and, with our recent acquisition of Therapak, customized kit assembly. This enables us to support a higher level of science on behalf of our customers, enabling them to focus on core areas of research.
2
History
The origins of our business date to 1852 in Sacramento, California when we initially sold glassware and laboratory supplies for the mining industry. We first became a publicly-owned company in 1986 after a spin-off from Univar Corporation, and later we were acquired by Merck KGaA in 1999. In 2001, we expanded internationally into Europe to become a leader in the global laboratory products market when Merck KGaA combined our operations with those of its European scientific supplies distribution business under the name “VWR International Corporation.” In 2004, we were divested by Merck KGaA and acquired by a newly formed entity controlled by Clayton, Dubilier & Rice, Inc., a private equity firm, in a leveraged transaction.
On June 29, 2007, we were acquired by VWR Holdings, an entity owned by investment funds affiliated with Madison Dearborn Partners, certain co-investors and members of management. Prior to October 7, 2014, the closing of our IPO, we were wholly-owned by VWR Holdings. Following our IPO and the subsequent secondary offerings of 2015, VWR Holdings now owns 54% of our common stock.
Customers
We maintain a diverse and stable customer base. We provided solutions to over 100,000 customers in 2015, including a significant number of the companies on the Fortune 500 list, approximately 5,000 leading academic institutions and thousands of smaller businesses in multiple industries. We centrally manage and actively collaborate with our largest global customers and provide them with value-added services, optimize the efficiency of their research, production and procurement activities and support them with dedicated on-site professionals and technicians. In addition, we manage relationships with our regional customers on a local basis, with a focus on their particular customer segment-specific needs. We estimate that we shipped products to nearly 300,000 unique customer sites in 2015.
We seek to be an important provider of laboratory products and services to our customer base. The substantial majority of our 50 largest customer relationships are governed by three to five year contracts that typically include pricing and volume incentives intended to position us as the primary provider of laboratory products and services.
We are a significant provider of laboratory products, chemicals, safety equipment and life science supplies to a majority of the world’s 20 largest pharmaceutical companies. In 2015, our top 20 customers accounted for approximately 21% of our net sales, with no single customer representing more than 4% of our net sales. At December 31, 2015, our top ten customers have had relationships with us averaging more than 12 years.
Suppliers
We distribute branded and private label products sourced from over 4,000 core laboratory product suppliers located across the globe. This includes a majority of the leading developers and manufacturers of laboratory chemicals and reagents, glassware, plastics, instruments and other laboratory equipment, protective clothing and laboratory furniture, who sell through distributors. We strive to maintain strong relationships with our largest suppliers, most of which have utilized our infrastructure for more than 20 years. Our ten largest suppliers in 2015 accounted for 33% of our purchases, with no individual supplier accounting for more than 10% of purchases.
Our supplier relationships are based on contracts that vary in terms of geographic scope, duration, product and service type, with a limited number also including exclusivity provisions. Our arrangements with suppliers may include distribution, sales and marketing support as well as servicing of instruments and equipment.
We manufacture a portion of our private label products, primarily lab and production chemicals, including buffers, reagents and other chemicals used in biopharmaceutical and industrial applications, and source the remainder from third-parties, including our established branded suppliers. We utilize a disciplined process to ensure the high quality of our private label products. Private label products provide our customers with a value-focused alternative to branded products and generally provide us higher margins.
Sales and Marketing
We reach customers through a well-trained global sales force, comprehensive websites and targeted catalogs. Our sales force is comprised of approximately 3,800 sales and sales support professionals, including approximately 330 sales specialists in areas such as life science, chromatography, production, chemicals and furniture, selected for their in-depth industry and product knowledge. Our sales professionals include native speakers for each of the countries in which we operate, allowing them to have high impact interactions with our customers across the globe.
3
Our e-commerce platform plays a vital role in how we conduct business with our customers. Over half of the orders that we process originate from our e-commerce platform, including our websites which feature our full product offering on a multi-language platform. Our websites utilize Google® search analytics and feature personalized search tools, customer specific web solutions as well as enhanced data on over 2.4 million products, all of which allow us to optimize the online purchasing experience for our customers. Our customers make use of the rich functionality that our websites have to offer, many of which better integrate our customers’ processes with our own. The flexibility and scalability of our websites allow us to integrate acquisitions, drive geographical expansion and serve segmented market needs with relative ease.
We also provide printed literature including flyers, brochures, magazines and catalogs in over 20 languages distributed worldwide. Our general catalogs are supplemented by specialty catalogs, as well as brochures, geared toward specific industries, scientific applications and product lines. For example, we have developed “all you need” catalogs for industries such as brewing, dairy, life science and genomics. In addition, we produce several serial publications that engage our customers with informative articles and a focused product offering, timed to release during prime purchasing seasons.
Distribution Network, Facilities and Infrastructure
Our global infrastructure consists of over 160 facilities, which enables us to deliver a broad array of products to our customers generally within 24 to 48 hours. We have the broadest pan-European platform, which enables us to reach customers throughout Europe with industry-leading efficiency and service levels. We operate a distribution network of over 4.6 million square feet of distribution space, consisting of strategically located distribution centers, various smaller regional service centers, and “just-in-time” facilities and customer contact centers for customer-specific requirements. Below is a summary of these facilities:
• | our distribution centers receive products from manufacturers, manage inventory and fill and ship customer orders; |
• | our regional service centers are located near selected customer locations and are designed to supply a limited number of products to those customers that require a high level of service; |
• | we also operate “just-in-time” facilities at or near customer sites to meet their needs promptly; |
• | customer contact centers are responsible for order entry and their service; and |
• | our two service centers employ more than 1,000 associates who provide commercial and administrative support services to us and our customers and suppliers. |
We also contract with third parties to ship products directly to our customers.
We maintain our corporate headquarters in Radnor, Pennsylvania for executive, financial, legal, information systems, human resources, marketing and other administrative activities. Our European executive, financial, legal, information systems, human resources, marketing and other administrative activities are in Darmstadt, Germany and Leuven, Belgium.
Technology
We have a highly automated ERP system that promotes standardization and simplicity. Our global web infrastructure provides seamless integration with our customers. Furthermore, our technology platforms support rapid development and deployment of enhancements so that we may quickly adapt to meet the technology needs of our customers and seamlessly integrate new acquisitions. We have made significant investments in our IT platform to implement a common ERP and e-commerce platform to enhance the customer experience. In 2015, over half of our orders were derived from our e-commerce platform. We have more than 175,000 customer accounts on our website.
Our IT operating strategy is to act globally when possible and locally where necessary to strategically facilitate our business objectives and to develop a stable, growth oriented infrastructure and global informational system platform. Our IT infrastructure has evolved into a cohesive group of core global computing platforms. This development has reduced costs while improving our overall quality and delivering more value.
4
Competition
We operate in a highly competitive environment with a diverse and fragmented base of competitors, many of whom focus on specific regions and market segments. Competitive factors in the customer segments we serve include service and delivery, breadth of product line, price, customer support, e-commerce capabilities and the ability to meet the special and local needs of our customers.
In our Americas laboratory products business, we compete primarily with Fisher Scientific. The majority of our other competitors include laboratory equipment manufacturers, which sell directly to their customers, and smaller distributors that focus on specific geographies and product categories. With respect to our value-added services business, we compete with local service providers, life science companies that offer laboratory management services to their clients such as Fisher Scientific, PerkinElmer and Agilent Technologies, and other service outsourcing companies.
In our EMEA-APAC laboratory products business, we have the broadest Pan-European platform, which provides us with an important competitive advantage. We principally compete with Fisher Scientific for certain global customers and with certain regional competitors. With respect to our valued-added services business, we predominantly compete with small businesses operating on a regional basis.
We believe our competitive strengths position us well in our customer segments and in the geographies we serve. We leverage our scale, customer access, depth of product and service offerings, marketing strategies and sales force, financial profile and management team to deliver superior solutions to our customers and to provide extensive market channel access to our suppliers.
Employees
As of December 31, 2015, we had approximately 9,300 employees, including approximately 4,000 in North America, 3,900 in Europe, 1,200 in Asia-Pacific (including over 1,000 employees in our shared service centers) and 200 in Central and South America. Of these employees, nearly 3,000 or 32% are in customer facing roles. As of December 31, 2015, approximately 6% of our employees in North America were represented by unions, and virtually all of our employees in Europe are represented by workers’ councils and/or unions. We believe our relations with our employees are good.
Trademarks and Tradenames
We believe the VWR tradename is well recognized in the global laboratory products market and by scientists and is therefore a valuable asset to us. We use a number of different registered and unregistered trademarks and service marks for our products and services, substantially all of which are owned by us. However, we have not registered all of our trademarks or service marks in each country in which we do business. Generally, registered trademarks have perpetual lives, provided that they are renewed on a timely basis and continue to be used properly as trademarks, subject only to the rights of third parties to seek cancellation of the marks.
Our business is not dependent to a material degree on patents, copyrights or trade secrets although we consider our catalogs, websites and proprietary software integral to our operations. Although we believe we have adequate policies and procedures in place to protect our intellectual property, we have not sought patent protection for our processes nor have we registered the copyrights in any of our catalogs, websites or proprietary software. Other than licenses to commercially available third party software, we have no licenses to intellectual property that are significant to our business.
Government Regulation
Some of the products we offer and our operations are subject to complex and stringent laws and regulations governing the production, storage, handling, transportation, import, export and distribution of chemicals, drugs and other similar products. Included among these laws are regulations are the operating and security standards of the United States Drug Enforcement Administration, the Alcohol and Tobacco Tax and Trade Bureau, the Food and Drug Administration, the Bureau of Industry and Security and various state boards of pharmacy as well as comparable state and foreign agencies. In addition, our operational activities must comply with the rules and regulations of the Department of Transportation, the Federal Aviation Administration and similar foreign agencies. We are also required to abide by the anti-corruption and anti-bribery laws of all countries in which we operate, including the United States Foreign Corrupt Practices Act of 1977, as amended (the “FCPA”). While we believe we are in compliance in all material respects with such laws and regulations, any non-compliance could result in substantial fines, penalties or assessments or otherwise restrict our ability to provide competitive distribution services and thereby have an adverse impact on our financial condition.
5
Environmental, Health and Safety Matters
We are subject to a broad range of foreign, federal, state and local environmental, health and safety laws and regulations, including those pertaining to air emissions, water discharges, the manufacturing, handling, disposal and transport of hazardous materials and solid waste, the investigation and remediation of contamination and otherwise relating to health and safety and the protection of the environment and natural resources. As our global operations have involved and continue to involve the manufacturing, handling, transport and distribution of materials that are, or could be, classified as toxic or hazardous, there is a risk of contamination and environmental damage inherent in our operations and the products we manufacture, handle, transport and distribute. Our environmental, health and safety liabilities and obligations may result in significant capital expenditures and other costs, which could negatively impact our business, financial condition and results of operations. We may be fined or penalized by regulators for failing to comply with environmental, health and safety laws and regulations. In addition, contamination resulting from our current or past operations may trigger investigation or remediation obligations, which may have a material adverse effect on our business, financial condition and results of operations.
Based on current information, we believe that any costs we may incur relating to environmental, health and safety matters will not be material. We cannot be certain, however, that identification of presently unidentified environmental, health and safety conditions, new regulations, more vigorous enforcement by regulatory authorities or other unanticipated events will not arise in the future and give rise to additional environmental liabilities, business interruptions, compliance costs or penalties which could have a material adverse effect on our business, financial condition and results of operations. In addition, environmental laws and regulations are constantly evolving, and it is not possible to predict accurately the effect they, or any new regulations or legislation, may have in future periods.
Insurance
We maintain commercial insurance programs with third parties in the areas of executive risk, commercial property, business interruption and casualty (including product liability). We also self-insure certain risks inherent in our business which, taken together with the deductible levels and exclusions contained within our third party programs, results in our recording of accruals for incurred claims. Our ultimate exposure may be mitigated by amounts we expect to recover from third parties associated with such claims.
Available Information
We file or furnish annual and quarterly reports and other information with or to the SEC. You may read and copy any documents we file at the SEC’s Public Reference Room at 100 F Street, N.E., Washington, D.C. 20549. Please call the SEC at 1-800-SEC-0330 for further information on the Public Reference Room. Our SEC filings are also available to the public free of charge at the SEC’s website at www.sec.gov.
You may also access our press releases, financial information and reports filed with or furnished to the SEC (for example, our Annual Report on Form 10-K, our Quarterly Reports on Form 10-Q and our Current Reports on Form 8-K and any amendments to those forms) online at www.vwr.com. Copies of any documents on our website are available without charge, and reports filed with or furnished to the SEC will be available as soon as reasonably practicable after they are filed with or furnished to the SEC. The information found on our website is not part of this or any other report filed with or furnished to the SEC.
Corporate Information
Our principal executive offices are located at Radnor Corporate Center, Building One, Suite 200, 100 Matsonford Road, Radnor, PA 19087. Our telephone number is (610) 386-1700. Our Internet website is located at www.vwr.com.
6
Item 1A. | Risk Factors |
There are many factors that affect our business and our results of operations, some of which are beyond our control. The following is a description of some important factors that may cause our results of operations or financial condition in future periods to differ materially from those currently expected or desired.
Risks Related to Our Business
Our business is affected by general economic conditions in the United States, Europe and the other regions in which we operate, and unfavorable global economic conditions or instability in the capital and credit markets could adversely impact our business.
With operations in many parts of the world, the global economy has a significant impact on our business. Unfavorable economic conditions in the United States, Europe and other regions in which we operate, and volatility in the global capital and credit markets, could materially and adversely affect our business, financial condition and results of operations. In particular, a deterioration of global economic conditions, or a prolonged period of market instability, could present the following additional risks and uncertainties for our business:
• | a reduction in revenues from and/or less favorable pricing or terms with new and existing customers; |
• | the inability to expand our customer base in existing or new markets; |
• | difficulties in collecting trade accounts receivable; |
• | an increase in product prices from our suppliers that we are not able to pass through to our customers; |
• | an acceleration of payment terms with our suppliers and/or the imposition of more restrictive credit terms and other contractual requirements; |
• | an increased risk of excess and obsolete inventory; |
• | a reduction in research, development or production spending by our customers, especially those in the Biopharma industry; |
• | the inability to access additional capital or refinance existing indebtedness; |
• | a limited availability to enter into new derivative financial instruments; and |
• | the need to record impairment charges against our goodwill, other intangible and/or other long-lived assets. |
Our business, financial condition and results of operations may be harmed if our customers discontinue, outsource or spend less on research, development and production and other scientific endeavors or discontinue or lessen their relationship with us.
Our customers are engaged in research, development and production in the Biopharma, agricultural, chemical, environmental, food and beverage, healthcare, microelectronic and petrochemical industries as well as in the education and government sectors. The amount of customer spending on research, development and production has a large impact on our sales and profitability. Our customers determine the amounts that they will spend on the basis of, among other things, general economic conditions, their financial condition and liquidity, spending priorities and their need to develop new products, which, in turn, is dependent upon a number of factors, including their competitors’ research, development and production initiatives.
In addition, consolidation in the industries in which our customers operate may have an impact on such spending as customers integrate acquired operations, including research and development departments and their budgets. Our customers finance their research and development spending from private and public sources. Government funding of scientific research and education has varied for several reasons, including general economic conditions, growth in population, political priorities, changes in the number of students and other demographic changes.
A deterioration in general economic conditions or a return to a period of economic contraction could result in reductions, or further reductions as the case may be, in spending by our customers across all customer segments that we serve, including the Biopharma industry as our largest customer segment. In addition, certain of our customers who depend on U.S. federal funding to finance their scientific research may be adversely impacted by U.S. federal spending cuts required by the “sequestration” mechanism in the Budget Control Act of 2011 and the Bipartisan Budget Act of 2013. The sequestration mechanism, which went into effect in March 2013, creates limits on discretionary federal spending. While the Congressional Budget Office has determined that the budgetary cuts required by sequestration have not been triggered in 2014 through 2016, there can be no assurances that sequestration is not triggered in any subsequent years. A reduction in spending by our customers could have a material adverse effect on our business, financial condition and results of operations.
7
The substantial majority of our 50 largest customer relationships are governed by three to five year contracts that typically include pricing and volume incentives intended to position us as the primary provider of laboratory products and services. These contracts typically do not contain minimum purchase requirements or provide us with an exclusive supplier relationship during the term of such contract. In many cases, our customers will undertake a competitive process at the expiration of these contracts and have on occasion not selected us to continue as their provider of laboratory products and services. The loss of one or more of our large customers, a material reduction in their purchase of products or services from us, extended disruptions or interruptions in their operations or material changes in the terms based on which we sell to them, could have a material adverse effect on our business, financial condition and results of operations.
The life science industry has and will continue to experience significant changes that could adversely affect our business.
Many of our customers in the life science industry have experienced significant changes in the last several years and are expected to continue to experience significant changes, including reductions in governmental payments for pharmaceutical products, expirations of significant patents, lower funding for research and development and adverse changes in legislation or regulations regarding the delivery or pricing of general healthcare services or mandated benefits. In response to these and other changes, some of our life science customers have implemented or may in the future implement actions in an effort to control and reduce costs, including:
• | development of large and sophisticated group purchasing organizations that reduces spending on laboratory products; |
• | consolidation of pharmaceutical companies resulting in a rationalization of research expenditures; |
• | purchasing the products that we supply directly from manufacturers; |
• | closing of domestic facilities and the establishment of facilities at low-cost offshore locations; and |
• | significant reductions in and/or outsourcing of research, development and production activities, including outsourcing to low-cost offshore locations. |
The ability of our life science customers to develop new products to replace revenue decreases attributable to expirations of significant patents, along with the impact of other past or potential future changes in the general healthcare industry may result in our customers significantly reducing their purchases of products and services from us or the prices they are willing to pay for those products or services. In addition, we will need to adapt our business to maintain existing customer relationships and develop new customer relationships as our customers consolidate or outsource certain activities domestically or to low-cost offshore locations.
We compete in a highly competitive market. Failure to compete successfully could have a material adverse effect on our business, financial condition and results of operations.
We compete in the global laboratory products market, primarily with Fisher Scientific, which has a portion of its business dedicated to the distribution of laboratory products and services. We also compete with many smaller regional, local and specialty distributors, as well as with manufacturers of all sizes selling directly to their customers. Competitive factors include price, service and delivery, breadth of product line, customer support, e-business capabilities, service offerings and the ability to meet the special requirements of customers.
A few of our competitors have greater financial and other resources than we do. Most of our products are available from several sources, and some of our customers have relationships with several distributors. Our agreements with customers generally provide that the customer can terminate the agreement or reduce the scope of products or services provided pursuant to the agreement with little or no notice. Lack of product availability, stemming from either our inability to acquire products or interruptions in the supply of products from manufacturers, could have a material adverse effect on our ability to compete. Our competitors could also obtain exclusive rights to distribute some products, thereby foreclosing our ability to distribute these products. Vertically integrated distributors may also have an advantage with respect to the total delivered product cost of certain of their captive products. Additionally, manufacturers could increase their efforts to sell directly to consumers and effectively bypass distributors like us. Consolidation in the global laboratory products market could result in existing competitors increasing their market share, which could have a material adverse effect on our business, financial condition and results of operations. The entry of new participants in the industry could also have a material adverse effect on our ability to compete.
We are subject to currency risks with respect to our international operations.
We report our consolidated financial results in U.S. dollars. A significant portion of our results are from our operations outside the United States and denominated in foreign currencies (principally the euro, the British pound sterling, the Canadian dollar and the Swiss franc). Fluctuations in the relative values of currencies occur from time to time and could adversely affect our operating results. Specifically, during times of a strengthening U.S. dollar, our reported international sales and earnings will be reduced because the local currency will translate into fewer U.S. dollars.
8
Our business, financial condition and results of operations depend upon maintaining our relationships with suppliers.
We offer products from a wide range of suppliers. While there is generally more than one source of supply for most of the categories of products that we sell, we currently do not manufacture the majority of our products and are dependent on these suppliers for access to those products. Our ability to sustain our gross margins has been, and will continue to be, dependent in part upon our ability to obtain favorable terms from our suppliers. These terms may change from time to time, and such changes could adversely affect our gross margins over time. In addition, our results of operations and cash flows could be adversely impacted by the acceleration of payment terms to our suppliers and/or the imposition of more restrictive credit terms and other contractual requirements.
Some of our competitors are increasing their manufacturing operations both internally and through acquisitions of manufacturers, including manufacturers that supply products to us. In addition, we manufacture certain products that may compete directly with products we source from our suppliers. To date, we have not experienced an adverse impact on our ability to continue to source products from manufacturers that have been vertically integrated or otherwise compete with us, although there is no assurance that we will not experience such an impact in the future.
The loss of one or more of our large suppliers, a material reduction in their supply of products or provision of services to us, extended disruptions or interruptions in their operations or material changes in the terms we obtain from them, could have a material adverse effect on our business, financial condition and results of operations.
Our future operating results may fluctuate significantly and our current operating results may not be a good indication of our future performance. Fluctuations in our quarterly financial results could affect our stock price in the future.
Our net sales and operating results have historically varied from period-to-period, and we expect that they will continue to do so as a result of a number of factors, many of which are outside of our control. If our quarterly financial results or our predictions of future financial results fail to meet the expectations of securities analysts and investors, our stock price could be negatively affected. Any volatility in our quarterly financial results may make it more difficult for us to raise capital in the future or pursue acquisitions that involve issuances of our stock. Our operating results for prior periods may not be effective predictors of future performance.
Part of our growth strategy is to engage in acquisitions, which will subject us to a variety of risks that could harm our business.
As part of our business strategy, we intend to continue to review and complete selective acquisition opportunities focusing initially in North America and Europe and, over the longer term, in other select geographies. There can be no assurances that we will be able to complete suitable acquisitions for a variety of reasons, including the identification of and competition for acquisition targets, the need for regulatory approvals, the inability of the parties to agree to the structure or purchase price of the transaction and our inability to finance the transaction on commercially acceptable terms. In addition, any completed acquisition will subject us to a variety of other risks, including:
• | we will need to allocate substantial operational, financial and management resources in integrating new businesses, technologies and products, and management may encounter difficulties in integrating the operations, personnel or systems of the acquired businesses; |
• | acquisitions may have a material adverse effect on our business relationships with existing or future suppliers, in particular, to the extent we consummate acquisitions that vertically integrate portions of our business; |
• | we may assume substantial actual or contingent liabilities, known and unknown; |
• | acquisitions may not meet our expectations of future financial performance; |
• | we may experience delays or reductions in realizing expected synergies; |
• | we may incur substantial unanticipated costs or encounter other problems associated with acquired businesses or devote time and capital investigating a potential acquisition and not complete the transaction; |
• | we may be unable to achieve our intended objectives for the transaction; and |
• | we may not be able to retain the key personnel, customers and suppliers of the acquired business. |
In addition, we may be unable to maintain uniform standards, controls, procedures and policies as we attempt to integrate the acquired businesses, and this may lead to operational inefficiencies. These factors related to our acquisition strategy, among others, could have a material adverse effect on our business, financial condition and results of operations.
9
The international scope of our operations may adversely affect our business.
We are continuing to expand our sourcing, commercial operations and administrative activities internationally, and we derive a significant portion of our net sales from operations outside the United States. Our ability to manage our business and conduct our operations internationally require considerable management attention and resources and is subject to the challenges of supporting a rapidly growing business in an environment of multiple languages, cultures, customs, legal and regulatory systems, alternative dispute systems and commercial markets. Expansion has required and will continue to require us to invest significant funds and other resources. Accordingly, we face certain risks, including:
• | restrictions on foreign ownership of subsidiaries; |
• | tariffs and other trade barriers and restrictions; |
• | operating in jurisdictions that do not protect intellectual property rights to the same extent as the United States; |
• | differing laws or administrative practices; |
• | recruiting and retaining talented and capable employees in foreign countries and maintaining our corporate culture across all geographies; |
• | business practices that are inconsistent with local or U.S. law, such as the FCPA, or other applicable anti-bribery regulations; |
• | violating sanctions established by the Office of Foreign Assets Control of the U.S. Department of the Treasury, with respect to threats to the national security, foreign policy or the economy of the United States; |
• | political risks; |
• | disruptions in the efficiency and effectiveness of, and difficulty in overseeing and managing, operations, supply chain and certain important administrative functions, including those that have been or in the future may be transferred to our shared services operations; |
• | restrictions imposed by foreign governments on international cash transfers; |
• | fluctuations in foreign currency exchange rates; and |
• | potentially adverse tax consequences of operating in multiple international jurisdictions. |
In addition, an adverse change in laws or administrative practices in countries within which we operate could have a material adverse effect on us. Our operations outside the United States also may present additional risk with respect to compliance with government regulations and licensing requirements. If we are unable to manage the complexity of our global operations successfully, our business, financial condition and operating results could be adversely affected.
In recent years, we incurred, and we may in the future incur, impairment charges related to our goodwill and other intangible assets, which could negatively impact our results of operations.
We carry significant amounts of goodwill and other intangible assets, including indefinite-lived intangible assets, on our balance sheet as a result of our 2007 merger and subsequent acquisitions. Our intangible assets with finite useful lives primarily relate to customer and supplier relationships and are amortized over their respective estimated useful lives on a straight-line basis. Our indefinite-lived intangible assets relate to certain of our trademarks and tradenames.
Goodwill and other intangible assets with indefinite useful lives are not amortized and are tested annually for impairment, and they must also be tested for impairment between the annual tests if an event or change in circumstance occurs that would more likely than not reduce the fair value of the asset below its carrying amount. Other amortizable intangible assets are reviewed for impairment whenever an indication of potential impairment exists.
See Item 7, “Management’s Discussion and Analysis of Financial Condition and Results of Operations—Critical Accounting Policies and Estimates—Testing Goodwill and Other Intangible Assets for Impairment” for more information.
As of December 31, 2015, goodwill and other intangible assets represented approximately $3.2 billion or 68% of our total assets. We may recognize additional impairment charges in the future should our operating results, market conditions or fair value assumptions decline due to, among other things, ongoing or worsening economic instability and volatility or other macroeconomic or industry-specific pressures, including but not limited to rising interest rates.
10
We are subject to laws and regulations governing government contracts, and failure to address these laws and regulations or comply with government contracts could harm our business by leading to a reduction in sales to these customers or penalties.
We sell products to government entities and, as a result, we are subject to various statutes and regulations that apply to companies doing business with the government. The laws governing government contracts differ from the laws governing private contracts and government contracts may contain pricing terms and conditions that are not applicable to private contracts. We are also subject to investigation for compliance with the regulations governing government contracts. A failure to comply with these regulations could result in suspension of these contracts, criminal, civil and administrative penalties or debarment.
If we do not comply with existing government regulations or if we or our suppliers become subject to more onerous government regulations, we could be adversely affected.
Some of the products we offer and our operations are subject to a number of complex and stringent laws and regulations governing the production, handling, transportation, storage, import, export and distribution of chemicals, drugs and other similar products, including the operating and security standards of the United States Drug Enforcement Administration, the Alcohol and Tobacco Tax and Trade Bureau, the Food and Drug Administration, the Bureau of Industry and Security and various state boards of pharmacy as well as comparable state and foreign agencies. In addition, our operational activities must comply with the rules and regulations of the Department of Transportation, the Federal Aviation Administration and similar foreign agencies. We are also required to abide by the anti-corruption and anti-bribery laws of all countries in which we operate, including the FCPA. While we believe we are in compliance in all material respects with such laws and regulations, any non-compliance could result in substantial fines, penalties or assessments or otherwise restrict our ability to provide competitive products and solutions and thereby have an adverse impact on our financial condition. We cannot assure you that existing laws and regulations will not be revised or that new, more restrictive laws will not be adopted or become applicable to us or the products that we manufacture and distribute.
If our suppliers become subject to more stringent laws, they may seek to recover any or all increased costs of compliance from us by increasing prices, and we may not be able to recover all such increased prices from our customers. Accordingly, we cannot assure you that our business and financial condition will not be materially and adversely affected by future changes in applicable laws and regulations applicable to our suppliers.
If any of our operations are found not to comply with applicable antitrust or competition laws, our business may suffer.
Our operations are subject to applicable antitrust and competition laws in the countries in which we conduct our business, in particular in the United States and in the European Union. These laws prohibit, among other things, anticompetitive agreements and practices. If any of our commercial agreements are found to violate or infringe upon such laws, we may be subject to civil and other penalties and third party claims for damages. Further, agreements that infringe upon these laws may be void and unenforceable, in whole or in part, or require modification in order to be lawful and enforceable. If we are unable to enforce any of our commercial agreements, whether at all or in material part, our business could be adversely affected.
We are subject to environmental, health and safety laws and regulations, and costs to comply with such laws and regulations, or any liability or obligation imposed under such laws or regulations, could negatively impact our business, financial condition and results of operations.
We are subject to a broad range of foreign, federal, state and local environmental, health and safety laws and regulations, including those pertaining to air emissions, water discharges, the manufacturing, handling, disposal and transport of hazardous materials and solid waste, the investigation and remediation of contamination and otherwise relating to health and safety and the protection of the environment and natural resources. As our global operations have involved and continue to involve the manufacturing, handling, transport and distribution of materials that are, or could be classified as toxic or hazardous, there is a risk of contamination and environmental damage inherent in our operations and the products we manufacture, handle, transport and distribute. Our environmental, health and safety liabilities and obligations may result in significant capital expenditures and other costs, which could negatively impact our business, financial condition and results of operations. We may be fined or penalized by regulators for failing to comply with environmental, health and safety laws and regulations. In addition, contamination resulting from our current or past operations may trigger investigation or remediation obligations, which may have a material adverse effect on our business, financial condition and results of operations.
Based on current information, we believe that any costs we may incur relating to environmental, health and safety matters will not be material. We cannot be certain, however, that identification of presently unidentified environmental, health and safety conditions, new regulations, more vigorous enforcement by regulatory authorities or other unanticipated events will not arise in the future and give rise to additional environmental liabilities, business interruptions, compliance costs or penalties which could have a material adverse effect on our business, financial condition and results of operations. In addition, environmental, health and safety laws and regulations are constantly evolving and it is not possible to predict accurately the effect they, or any new regulations or legislation may have in future periods.
11
We are subject to product liability and other claims in the ordinary course of business.
Our business involves risk of product liability, patent infringement and other claims in the ordinary course of business arising from the products that we source from various manufacturers or produce ourselves, as well as from the services we provide. Our exposure to such claims may increase as we seek to increase the geographic scope of our sourcing activities and sales of private label products and to the extent that we expand our manufacturing operations. We maintain insurance policies, including product liability insurance, and in many cases the manufacturers of the products we distribute have indemnified us against such claims. We cannot assure you that our insurance coverage or indemnification agreements with manufacturers will be available in all pending or any future cases brought against us. Furthermore, our ability to recover under any insurance or indemnification arrangements is subject to the financial viability of our insurers, our manufacturers and our manufacturers’ insurers, as well as legal enforcement under the local laws governing the arrangements. In particular, as we seek to expand our sourcing from manufacturers in Asia-Pacific and other developing locations, we expect that we will increase our exposure to potential defaults under the related indemnification arrangements. Insurance coverage in general or coverage for certain types of liabilities, such as product liability or patent infringement in these developing markets may not be readily available for purchase or cost-effective for us to purchase. Furthermore, insurance for liability relating to asbestos, lead and silica exposure is not available, and we do not maintain insurance for product recalls. Accordingly, we could be subject to uninsured and unindemnified future liabilities, and an unfavorable result in a case for which adequate insurance or indemnification is not available could result in a material adverse effect on our business, financial condition and results of operations.
We are also involved in various disputes, litigation and regulatory matters incidental to our business, including employment matters, commercial disputes, government contract compliance matters, disputes regarding environmental clean-up costs, and other matters arising out of the normal conduct of our business. We intend to vigorously defend ourselves in such matters. From time to time, we are named as a defendant in cases as a result of our distribution of laboratory supplies, including litigation resulting from the alleged prior distribution of products containing asbestos by certain of our predecessors or acquired companies. While the impact of this litigation has historically been immaterial, there can be no assurance that the impact of the pending and any future claims will not be material to our business, financial condition or results of operations in the future.
If we are unable to hire, train and retain key personnel, our business, financial condition and results of operations could be adversely affected.
Our success depends in large part upon our continuing ability to identify, hire, retain and motivate skilled professionals. We face intense competition for these professionals from our competitors, customers, suppliers and other companies within the industries in which we compete and the geographical regions in which we operate. Any failure on our part to hire, train and retain a sufficient number of qualified professionals could have a significant adverse impact on our business.
We depend heavily on the services of our senior management. We believe that our future success will depend upon the continued services of our senior management. Our business may be harmed by the loss of one or more members of our senior management. We currently do not maintain key-man life insurance with respect to our executive officers.
We rely upon our distribution centers and third parties to ship products to our customers, and significant interruptions in the operations of our distribution centers or the operations of such third parties could harm our business, financial condition and results of operations.
Our infrastructure primarily consists of strategically located distribution centers and various smaller regional service centers where we receive products from manufacturers, manage inventory and fill and ship customer orders. We also ship a significant amount of our orders through various independent package delivery providers. Prompt shipment of our products is important to our business. Any significant disruptions to the operations of our distribution centers or such third parties for any reason, including labor relations issues, power interruptions, severe weather, fire or other circumstances beyond the control of us or such third parties, could cause our operating expenses to increase or seriously harm our ability to fulfill our customers’ orders or deliver products on a timely basis, or both. In addition, an increase in prices by our third party carriers, due to increases in fuel prices or otherwise, could adversely impact our financial condition and results of operations if we are unable to find alternative providers or make adjustments to our selling prices.
Problems with or failure of our information services and their connectivity to our customers, suppliers and/or certain service providers could significantly disrupt our operations, which could reduce our customer or supplier base and could harm our business, financial condition and results of operations.
Our businesses rely on sophisticated information systems to obtain, rapidly process, analyze and manage data to facilitate the purchase and distribution of millions of inventory items from numerous distribution centers; to receive, process and ship orders on a timely basis; to account for other product and service transactions with customers; to manage the accurate billing and collections for thousands of customers; and to process payments to suppliers. Our business and results of operations may be adversely affected if these systems are interrupted or damaged by unforeseen events or if they fail for any extended period of time, including due to the actions of third parties. To reduce our risks against unforeseen events, we continually deploy, test and refine disaster recovery and business continuity preparedness plans.
12
Information security risks have generally increased in recent years because of the proliferation of new technologies and the increased sophistication and activities of perpetrators of cyber attacks. A failure in or breach of our operational or information security systems, or those of our third party service providers, as a result of cyber attacks or information security breaches could disrupt our business and/or our supply chain, result in the improper disclosure or misuse of confidential or proprietary information, damage our reputation and/or increase our costs. As a result, cyber security and the continued development and enhancement of the controls and processes designed to protect our systems, computers, software, data and networks from attack, damage or unauthorized access remain a high priority for us. Although we believe that we have robust information security procedures and other safeguards in place, as cyber threats continue to evolve, we may be required to expend additional resources to continue to enhance our information security measures and/or to investigate and remediate any information security vulnerabilities.
In addition, we accept payment by credit card and similar payment instruments for a material portion of our sales, and our ability to accept, process and settle credit card transactions is subject to rules and regulations issued and/or amended from time to time by payment card companies, such as American Express, VISA, MasterCard and Discover. These rules and regulations, which vary based on annual transaction volume and transaction experience, require us to safeguard customer information, including applying the minimum security standards for the manner in which we capture, store, process and transmit such information. Our failure to comply with such changing rules and standards can subject us to fines, restrictions or expulsion from these card acceptance programs, which could have a material adverse effect on our business, financial condition and results of operations.
We maintain enterprise resource planning systems throughout our business and we plan to continue to make technology and infrastructure investments, including with respect to our enterprise resource planning and e-commerce capabilities. Our technology initiatives are designed to enhance the security, confidentiality, integrity and availability of data and systems, to ensure our operations continue to provide a high quality service to our customers and to provide important information to our management. We are continually assessing the risks and costs associated with potential problems and interruptions that could reduce the efficiency and effectiveness of our operations in the near term, looking for opportunities to transfer or share these risks with specialized information systems security providers and insuring against these risks where appropriate. Despite these efforts, the cost and potential problems and interruptions associated with the implementation of our technology initiatives could disrupt or reduce our productivity, including our ability to process orders, ship products, provide services and customer support, send invoices and track payments, fulfill contractual obligations or otherwise operate our business, as well as disrupt or impair our ability to provide important information to our management and investors.
We have not registered and in some cases do not own the existing applications and registrations for our material trademarks or service marks in every country in which we do business.
We serve our customers globally through our operations in 34 countries and use a number of registered and unregistered trademarks and service marks for our products and services, substantially all of which are owned by us. Although we have registered our material trademarks in the United States and the primary European countries in which we conduct business, we have not registered and in some cases do not own the existing applications and registrations for our material trademarks or service marks in all countries in which we conduct business. Our efforts to protect our intellectual property rights in certain countries, especially those in Asia-Pacific, may only provide us with limited protection. In addition, in some countries, we may be blocked from registering or otherwise protecting certain of our marks by others who have already registered identical or similar marks for similar goods or services, and in those cases, we run the risk of being sued for infringement or being unable to effectively establish brand identity.
The failure to own and have enforceable rights in the trademarks and service marks used in our business could have a material adverse effect on our business, financial condition and results of operations.
Unanticipated increases to our income tax liabilities could adversely impact our results of operations.
As a global corporation, our business is subject to a wide variety of U.S. federal, state and non-U.S. laws, regulations and policies. There can be no assurance that laws, regulations and policies will not be changed in ways that will impact our income tax provision or our income tax assets and liabilities. We are also subject to income tax audits in the United States and numerous foreign jurisdictions. Judgment is required in determining our global provision for income taxes and other tax liabilities. Although we believe that our tax estimates are reasonable, we cannot assure you that the final determination of tax audits or tax disputes will not be different from what is reflected in our historical income tax provisions and accruals. Tax authorities in the various jurisdictions in which we have a presence and conduct business may disagree with our tax positions and assess additional taxes.
13
In addition, our effective tax rate in the future could be adversely affected by changes to our operating structure, changes in the mix of earnings in countries with differing statutory tax rates, changes in the valuation of deferred tax assets and liabilities, changes in tax laws, and the discovery of new information in the course of our tax return preparation process. The carrying value of deferred tax assets, which are predominantly in the United States, is dependent on our ability to generate future taxable income in the United States. Increases in our income tax liabilities or risks related to the realization of our deferred tax assets as a result of any of the foregoing could adversely affect our financial position or results of operations.
As a U.S. company doing business in international markets through subsidiaries, we are subject to intercompany pricing rules in the jurisdictions where we operate. Tax rates vary from country to country and if regulators determine that our profits in one jurisdiction should be increased, we might not be able to fully offset the adjustment in the other jurisdictions; which would increase our effective tax rate. Additionally, the Organization for Economic Cooperation and Development, or OECD, has adopted guidelines regarding base erosion and profit shifting. As a result of the adoption by the OECD, individual taxing jurisdictions have also adopted some form of these guidelines as well. As such, we may need to change our approach to intercompany transfer pricing in order to maintain compliance under the new rules. Our effective tax rate may increase or decrease depending on the current location of global operations at the time of the change.
Risks Related to Our Indebtedness
Our substantial indebtedness could have a material adverse effect on our financial condition and prevent us from fulfilling our debt or contractual obligations.
We have a substantial amount of debt, which requires us to make significant interest and principal payments. At December 31, 2015, we had outstanding indebtedness of $1,989.0 million, including our senior credit facility, 4.625% senior notes and our A/R Facility. Our high level of debt could have important consequences to us including the following:
• | making it more difficult for us to satisfy our debt or contractual obligations; |
• | exposing us to the risk of increased interest rates as certain of our borrowings, including borrowings under our senior credit facility and our A/R Facility, are at variable rates of interest; |
• | requiring us to dedicate a substantial portion of our cash flow from operations to debt service payments, which would reduce the funds available for working capital, capital expenditures, investments, acquisitions and other general corporate purposes; |
• | limiting our flexibility in planning for, or reacting to, changes in our business, future business opportunities and the industry in which we operate; |
• | placing us at a competitive disadvantage compared to any of our less leveraged competitors; |
• | increasing our vulnerability to a downturn in our business and both general and industry-specific adverse economic conditions; and |
• | limiting our ability to obtain additional financing at a favorable cost of borrowing, or if at all, to fund future working capital, capital expenditures, investments, acquisitions or other general corporate requirements. |
Despite current indebtedness levels and restrictive covenants, we may incur additional indebtedness in the future, which would intensify our leverage risks.
Although the terms of the credit agreement governing the senior credit facility and the indenture governing the 4.625% senior notes restrict us and our restricted subsidiaries from incurring additional indebtedness, these restrictions are subject to significant exceptions and qualifications, including with respect to our ability to incur additional senior secured debt. The risks that we and our subsidiaries face as a result of our leverage could intensify to the extent that we incur a significant amount of additional indebtedness.
14
Our debt agreements contain restrictions on our ability to operate our business and to pursue our business strategies, and our failure to comply with, cure breaches of, or obtain waivers for covenants could result in an acceleration of the due date of our indebtedness.
The credit agreement governing our senior credit facility and the indenture governing the 4.625% senior notes contain, and agreements governing future debt issuances may contain, covenants that restrict our ability to finance future operations or capital needs, to respond to changing business and economic conditions or to engage in other transactions or business activities that may be important to our growth strategy or otherwise important to us. The credit agreement and the indenture restrict, among other things, our ability and the ability of our subsidiaries to:
• | incur or create additional indebtedness; |
• | pay dividends or make distributions in respect of our capital stock or to make certain other restricted payments; |
• | purchase or redeem stock; |
• | make investments; |
• | create liens; |
• | sell assets and subsidiary stock; |
• | enter into transactions with affiliates; |
• | enter into agreements that restrict dividends and liens; |
• | change our lines of business or our fiscal year; and |
• | enter into mergers, consolidations and sales of substantially all assets. |
Additionally, our senior credit facility contains a financial maintenance covenant requiring us to maintain a ratio of first lien indebtedness, net of unrestricted cash to EBITDA, as defined (the “First Lien Net Leverage Ratio”) of not more than 4.00:1.00. The financial maintenance covenant is tested at the end of each fiscal quarter. We cannot assure you that we will be able to maintain compliance with the covenants related to our debt in the future and, if we fail to do so, that we will be able to obtain waivers from the lenders or noteholders and/or amend the covenants. In particular, if our financial condition or operating results deteriorate, our relations with our lenders and noteholders may be materially and adversely affected, which could impact our ability to obtain waivers if necessary.
Any breach of the covenants in the credit agreement or the indenture could result in a default of the obligations under such debt and cause a default under other debt. If there were an event of default under the credit agreement related to our senior credit facility that was not cured or waived, the lenders under our senior credit facility could cause all amounts outstanding with respect to the borrowings under the senior credit facility to be due and payable immediately. Our assets and cash flow may not be sufficient to fully repay borrowings under our senior credit facility and our obligations under the 4.625% senior notes if accelerated upon an event of default. If, as or when required, we are unable to repay, refinance or restructure our indebtedness under, or amend the covenants contained in, our senior credit facility, the lenders under our senior credit facility could institute foreclosure proceedings against the assets securing borrowings under the senior credit facility. Any such acceleration may also constitute a termination event under our A/R Facility, which could result in the amount outstanding under that facility becoming due and payable.
We may not be able to generate sufficient cash flows or access sufficient additional capital to meet our debt obligations or to fund our other liquidity needs.
Our business may not generate sufficient cash flow from operations, or future borrowings under our senior credit facility, our A/R Facility or from other sources may not be available to us in an amount sufficient to enable us to make required interest payments on our indebtedness or to fund our other liquidity needs, including capital expenditure requirements, investments, acquisitions and other transactions that are important to the execution of our business strategy. As our debt matures, we may not be able to refinance our maturing debt on favorable terms, or at all, based on general economic or market conditions, our historical or projected growth or other factors, including those beyond our control. If our cash flow from operations or other liquidity sources are not sufficient to make required interest payments or we are not able to refinance maturing debt on favorable terms, we may have to take actions such as selling assets, seeking additional equity or debt capital on commercially unreasonable terms or reducing or delaying important business transactions. Our senior credit facility and the indenture governing our 4.625% senior notes restrict our ability to sell assets and use the proceeds from such sales for purposes other than debt payment obligations.
15
Risks Related to Ownership of our Common Stock
Our common stock price may be volatile or may decline regardless of our operating performance, and holders of our common stock could lose a significant portion of their investment.
The market price for our common stock is likely to be volatile. Our stockholders may not be able to resell their shares of common stock at or above the price at which they purchased their shares, due to fluctuations in the market price of our common stock, which may be caused by a number of factors, many of which we cannot control, including those described under “Risks Related to Our Business” and “Risks Related to Our Indebtedness” and the following:
• | changes in financial estimates by any securities analysts who follow our common stock, our failure to meet these estimates or failure of securities analysts to initiate or maintain coverage of our common stock; |
• | downgrades by any securities analysts who follow our common stock; |
• | future sales of our common stock by our officers, directors and significant stockholders, including VWR Holdings, which is controlled by Madison Dearborn Partners; |
• | market conditions or trends in our industry or the economy as a whole; |
• | investors’ perceptions of our prospects; |
• | announcements by us or our competitors of significant contracts, acquisitions, joint ventures or capital commitments; |
• | changes in key personnel; and |
• | our limited public float in light of Madison Dearborn Partners’ beneficial ownership of a majority of our common stock, which may result in the trading of relatively small quantities of shares by our stockholders having a disproportionate positive or negative influence on the market price of our common stock. |
In addition, the stock markets have experienced extreme price and volume fluctuations that have affected and continue to affect the market prices of equity securities of many companies, including companies in our industry. In the past, stockholders have instituted securities class action litigation following periods of market volatility. If we were involved in securities litigation, we could incur substantial costs, and our resources and the attention of management could be diverted from our business.
Madison Dearborn Partners has the ability to control significant corporate activities, and their interests may not coincide with yours.
At December 31, 2015, Madison Dearborn Partners beneficially owned, through its control of VWR Holdings, 54% of our common stock. As a result of its beneficial ownership, Madison Dearborn Partners, so long as it continues to beneficially own a majority of our outstanding common stock, will have the ability to control the outcome of most matters submitted to a vote of stockholders and, through the Board, the ability to control decision-making with respect to our business direction and policies. Matters over which Madison Dearborn Partners, directly or indirectly, exercise control include:
• | the election of the Board and the appointment and removal of our officers; |
• | mergers and other business combination transactions, including proposed transactions that would result in our stockholders receiving a premium price for their shares; |
• | other acquisitions or dispositions of businesses or assets; |
• | incurrence of indebtedness and the issuance of equity securities; |
• | repurchase of stock and payment of dividends; and |
• | the issuance of shares to management under our equity incentive plans. |
Even if Madison Dearborn Partners’ beneficial ownership of our shares falls below a majority, it may continue to be able to strongly influence or effectively control our decisions. Under our amended and restated certificate of incorporation, Madison Dearborn Partners and its affiliates will not have any obligation to present to us, and Madison Dearborn Partners and its affiliates may separately pursue corporate opportunities of which they become aware, even if those opportunities are ones that we would have pursued if granted the opportunity.
16
In addition, we have entered into a Director Nomination Agreement with VWR Holdings that provides VWR Holdings the right to designate nominees for election to our board of directors for so long as VWR Holdings beneficially owns 10% or more of the total number of shares of our common stock then outstanding. The Director Nomination Agreement provides that Madison Dearborn Partners may cause VWR Holdings to assign such right to Madison Dearborn Partners or to a Madison Dearborn Partners’ affiliate so long as Madison Dearborn Partners and its affiliates are the beneficial owners of 50% or more of VWR Holdings’ voting equity interests.
We are a “controlled company” and, as a result, we qualify for, and intend to rely on, exemptions from certain corporate governance requirements. You do not have the same protections afforded to stockholders of companies that are subject to such requirements.
Madison Dearborn Partners through its control of VWR Holdings beneficially owns a majority of our common stock. As a result, we are a “controlled company” within the meaning of the corporate governance standards under NASDAQ. Under the rules of NASDAQ, a company of which more than 50% of the outstanding voting power is held by an individual, group or another company is a “controlled company” and may elect not to comply with certain stock exchange corporate governance requirements, including the requirement that (i) a majority of the Board consist of “independent directors,” as defined under the rules of NASDAQ, (ii) the Nominating and Governance Committee is composed entirely of independent directors or (iii) the Compensation Committee is composed entirely of independent directors.
The NASDAQ independence standards are intended to ensure that directors who meet the independence standards are free of any conflicting interest that could influence their actions as directors. Accordingly, you do not have the same protections afforded to stockholders of companies that are subject to all of the stock exchange corporate governance requirements.
Conflicts of interest may arise because some of our directors are principals of our largest stockholders.
Each of Messrs. Alexos and Sullivan, who are officers of Madison Dearborn Partners, and Mr. Kraemer, who is associated with Madison Dearborn Partners, serve on the Board. VWR Holdings, which is controlled by Madison Dearborn Partners, continues to hold a majority of our outstanding common stock. Madison Dearborn Partners and the entities respectively controlled by them may hold equity interests in entities that directly or indirectly compete with us, and companies in which they currently invest may begin competing with us. As a result of these relationships, when conflicts between the interests of Madison Dearborn Partners, on the one hand, and of other stockholders, on the other hand, arise, these directors may not be disinterested. Although our directors and officers have a duty of loyalty to us under Delaware law and our amended and restated certificate of incorporation, transactions that we enter into in which a director or officer has a conflict of interest are generally permissible so long as (i) the material facts relating to the director’s or officer’s relationship or interest as to the transaction are disclosed to the Board and a majority of our disinterested directors approves the transaction, (ii) the material facts relating to the director’s or officer’s relationship or interest as to the transaction are disclosed to our stockholders and a majority of our disinterested stockholders approve the transaction or (iii) the transaction is otherwise fair to us. Our amended and restated certificate of incorporation provides that any principal, officer, member, manager and/or employee of Madison Dearborn Partners or any entity that controls, is controlled by or under common control with Madison Dearborn Partners (other than us or any company that is controlled by us) or a Madison Dearborn Partners-managed investment fund is not required to offer any transaction opportunity of which they become aware to us and could take any such opportunity for themselves or offer it to other companies in which they have an investment, unless such opportunity is offered to them solely in their capacities as our directors.
Future sales of our common stock, or the perception in the public markets that these sales may occur, may depress our stock price.
Sales of substantial amounts of our common stock in the public market, or the perception that these sales could occur, could adversely affect the price of our common stock and could impair our ability to raise capital through the sale of additional shares. On February 18, 2016, 131,419,375 shares of common stock were outstanding. The shares of common stock sold in our IPO and subsequent registered secondary offerings are freely tradable without restriction under the Securities Act, except that any shares of our common stock that may be acquired by our directors, executive officers and other affiliates, as that term is defined in the Securities Act, may be sold only in compliance with certain volume limitations and other restrictions of Rule 144 of the Securities Act.
The remaining 70,950,000 shares, representing 54% of our total outstanding shares of common stock, will continue to be “restricted securities” within the meaning of Rule 144 and subject to certain restrictions on resale. Restricted securities may be sold in the public market only if they are registered under the Securities Act or are sold pursuant to an exemption from registration such as Rule 144 or Rule 701 under the Securities Act.
In the future, we may also issue our securities in connection with investments or acquisitions. The number of shares of our common stock issued in connection with an investment or acquisition could constitute a material portion of our then-outstanding shares of our common stock.
17
Anti-takeover provisions in our charter documents and as provided under Delaware law might discourage or delay acquisition attempts for us that you might consider favorable.
Our charter documents contain provisions that may make it more difficult for us to be acquired without the approval of the Board. These provisions:
• | authorize the issuance of undesignated preferred stock, the terms of which may be established and the shares of which may be issued without stockholder approval, and which may include super voting, special approval, dividend, or other rights or preferences superior to the rights of the holders of common stock; |
• | establish a classified board of directors so that not all members of the Board are elected at one time; |
• | generally prohibit stockholder action by written consent, requiring all stockholder actions be taken at a meeting of our stockholders, except that any action required or permitted to be taken by our stockholders may be effected by written consent until such time as Madison Dearborn Partners ceases to beneficially own 50% or more of our common stock; |
• | provide that special meetings of the stockholders can only be called by (i) the chairman or vice chairman of the Board, (ii) our chief executive officer, (iii) a majority of the Board through a special resolution or (iv) the holders of at least 10% of our common stock until such time as Madison Dearborn Partners ceases to beneficially own 50% or more of our common stock, effected by consent in writing by such stockholders; |
• | establish advance notice requirements for nominations for elections to the Board or for proposing matters that can be acted upon by stockholders at stockholder meetings; and |
• | provide that the Board is expressly authorized to make, alter or repeal our amended and restated by-laws. |
These anti-takeover provisions and other provisions under Delaware law could discourage, delay or prevent a transaction involving a change in our control, even if doing so would benefit our stockholders. These provisions could also discourage proxy contests and make it more difficult for you and other stockholders to elect directors of your choosing and to cause us to take other corporate actions you desire.
Our amended and restated certificate of incorporation designates the Court of Chancery of the State of Delaware as the sole and exclusive forum for certain types of actions and proceedings that may be initiated by our stockholders, which could limit our stockholders’ ability to obtain a favorable judicial forum for disputes with us or our directors, officers or employees.
Our amended and restated certificate of incorporation requires, to the fullest extent permitted by law, that (i) any derivative action or proceeding brought on our behalf, (ii) any action asserting a claim of breach of a fiduciary duty owed by any of our directors, officers or other employees to us or our stockholders, (iii) any action asserting a claim against us arising pursuant to any provision of the General Corporation Law of the State of Delaware (the “DGCL”), our certificate of incorporation or our by-laws or (iv) any other action asserting a claim against us that is governed by the internal affairs doctrine may, in each case, be brought only in the Court of Chancery in the State of Delaware and if brought outside of Delaware, the stockholder bringing the suit will be deemed to have consented to service of process on such stockholder’s counsel. Any person or entity purchasing or otherwise acquiring any interest in shares of our capital stock shall be deemed to have notice of and to have consented to the provisions of our amended and restated certificate of incorporation described above. This choice of forum provision may limit a stockholder’s ability to bring a claim in a judicial forum that it finds favorable for disputes with us or our directors, officers or other employees, which may discourage such lawsuits against us and our directors, officers and employees. Alternatively, if a court were to find these provisions of our amended and restated certificate of incorporation inapplicable to, or unenforceable in respect of, one or more of the specified types of actions or proceedings, we may incur additional costs associated with resolving such matters in other jurisdictions, which could adversely affect our business and financial condition.
Because we do not intend to pay cash dividends in the foreseeable future, you may not receive any return on investment unless you are able to sell your common stock for a price greater than your purchase price.
We do not anticipate that we will pay any cash dividends on shares of our common stock for the foreseeable future. Any determination to pay dividends in the future will be at the discretion of the Board and will depend upon results of operations, financial condition, contractual restrictions, including those under the senior credit facility and the indenture governing the 4.625% senior notes, any potential indebtedness we may incur, restrictions imposed by applicable law, tax considerations and other factors the Board deems relevant. Accordingly, if we do not pay dividends in the future, realization of a gain on your investment will depend on the appreciation of the price of our common stock, which may never occur.
18
We are required to pay our existing owners for certain tax benefits to the extent realized by us (or deemed realized by us in the case of a change of control, certain divestitures or certain other events), which amounts are expected to be material and, in some instances, may exceed the tax benefits actually realized by us.
We have entered into an ITRA with our existing stockholder, VWR Holdings. The ITRA provides for the payment by us to VWR Holdings of 85% of the amount of cash savings, if any, in U.S. federal, state and local income tax that we along with our domestic subsidiaries actually realize as a result of the utilization of our pre-IPO net operating loss carryforwards.
These payment obligations are our obligations and not obligations of any of our subsidiaries. The actual timing of any payments under the ITRA will vary depending upon a number of factors, including the amount, character and timing of our and our domestic subsidiaries’ taxable income in the future. We expect that the payments we will be required to make under the ITRA will be material.
At December 31, 2015, we reported a liability of $163.1 million for the ITRA, which represents 85% of the full amount of applicable recognized loss. Future changes in the realization of our net operating loss carryforwards that were generated prior to our IPO may impact the amount that will ultimately be paid to VWR Holdings, if any. We expect to repay the obligation within the carryforward period of the tax attributes without expiration.
In addition, the ITRA provides that upon certain mergers, stock and asset sales, other forms of business combinations or other changes of control, the ITRA will terminate and we will be required to make a payment equal to the present value (at a discount rate of LIBOR plus 1.00%) of anticipated future payments under the ITRA. Such payment would be based on certain assumptions, including those relating to our and our domestic subsidiaries’ future taxable income, and may therefore significantly exceed the actual tax benefits we ultimately realize from our net operating losses. We will have a similar obligation to make a present value accelerated payment based on certain assumptions if we dispose of certain subsidiaries or if we breach any of our material obligations under the ITRA, each of which also may result in a payment significantly in excess of the actual tax benefits we ultimately realize from our net operating losses. In these situations, our obligations under the ITRA could have a negative impact on our liquidity and could have the effect of delaying, deferring or preventing certain mergers, asset sales, other forms of business combinations or other changes of control. Additionally, under the terms of the ITRA, VWR Holdings may be permitted to assign its rights under the agreement without our consent, in which case we may be required to deal with an unrelated counterparty under the agreement.
VWR Holdings will not reimburse us for any payments previously made under the ITRA if such benefits are subsequently disallowed (although future payments would be adjusted to the extent possible to reflect the result of such disallowance). As a result, in certain circumstances, payments could be made under the ITRA in excess of our ultimate cash tax savings. To the extent that we are unable to make timely payments under the ITRA for any reason, such payments will be deferred and will accrue interest at a rate of LIBOR plus 3.00% per annum until paid. We have agreed under the ITRA not to incur, and not to permit any of our domestic subsidiaries to incur, any new restrictions that would limit our ability to make payments under such agreement or the ability of our domestic subsidiaries to make payments to us for that purpose. This restriction could make it more difficult or costly for us to refinance our outstanding indebtedness. See Item 7, “Management’s Discussion and Analysis of Financial Condition and Results of Operations.”
We are a holding company and rely on dividends, distributions and other payments, advances and transfers of funds from our subsidiaries to meet our obligations.
We are a holding company that does not conduct any business operations of our own. As a result, we are largely dependent upon cash dividends and distributions and other transfers from our subsidiaries to meet our obligations. The agreements governing the indebtedness of our subsidiaries impose restrictions on our subsidiaries’ ability to pay dividends or other distributions to us. Additionally, deterioration of the earnings from, or other available assets of, our subsidiaries for any reason could also limit or impair their ability to pay dividends or other distributions to us.
Item 1B. | Unresolved Staff Comments |
Not applicable.
19
Item 2. | Properties |
We operate more than 160 facilities, which aggregate in excess of five million square feet, including offices, warehouse space and manufacturing facilities. We maintain our corporate headquarters in Radnor, Pennsylvania for executive, financial, legal, information systems, marketing and other administrative activities. Our European executive, financial, legal, information systems, marketing and other administrative activities are in Darmstadt, Germany and Leuven, Belgium.
The following table presents information about our principal distribution and other office facilities by segment:
Owned/Leased | Size (sq. ft.) | Type of Facility | |||||
Americas: | |||||||
Batavia, Illinois | Owned | 360,000 | Distribution | ||||
Bridgeport, New Jersey | Owned | 369,000 | Distribution | ||||
Denver, Colorado | Leased | 130,000 | Distribution | ||||
Franklin, Massachusetts | Leased | 55,000 | Distribution | ||||
Lachine, Quebec, Canada | Owned | 52,000 | Distribution, manufacturing and offices | ||||
Manati, Puerto Rico | Owned | 130,000 | Distribution | ||||
Mexico City, Mexico | Leased | 56,000 | Distribution | ||||
Mississauga, Ontario, Canada | Leased | 114,000 | Distribution | ||||
Radnor, Pennsylvania | Leased | 150,000 | Offices | ||||
Rochester, New York | Owned | 339,000 | Distribution, assembly and offices | ||||
Solon, Ohio | Leased | 205,000 | Distribution, manufacturing and offices | ||||
Sugar Land, Texas | Leased | 62,000 | Distribution | ||||
Suwanee, Georgia | Leased | 169,000 | Distribution | ||||
Tualatin, Oregon | Leased | 56,000 | Distribution | ||||
Visalia, California | Owned | 503,000 | Distribution | ||||
Wangara, Australia | Leased | 62,000 | Distribution, manufacturing and offices | ||||
EMEA-APAC: | |||||||
Barcelona, Spain | Leased | 73,000 | Distribution | ||||
Briare, France | Owned/Leased | 303,000 | Distribution, repackaging and mixing | ||||
Bruchsal, Germany | Owned | 219,000 | Distribution | ||||
Darmstadt, Germany | Leased | 56,000 | Offices | ||||
Debrecen, Hungary | Leased | 68,000 | Distribution, repackaging and mixing | ||||
Dublin, Ireland | Leased | 77,000 | Distribution | ||||
Fontenay-sous-Bois, France | Leased | 56,000 | Offices | ||||
Herlev, Denmark | Leased | 66,000 | Distribution | ||||
Karlskoga, Sweden | Leased | 131,000 | Distribution | ||||
Kelsterbach, Germany | Leased | 60,000 | Distribution | ||||
Leuven, Belgium | Owned | 200,000 | Distribution and manufacturing | ||||
Lutterworth, United Kingdom | Leased | 185,000 | Distribution | ||||
Shanghai, China | Leased | 39,000 | Distribution and offices | ||||
Singapore | Leased | 74,000 | Distribution | ||||
We also lease various regional distribution centers and service facilities globally that support our sales and warehouse functions. Our facilities located in Batavia, Illinois and Visalia, California are subject to mortgage liens under the senior credit facility.
20
Item 3. | Legal Proceedings |
For information regarding legal proceedings and matters, see Note 10 to our consolidated financial statements beginning on page F-1 of this report, which information is incorporated into this item by reference.
Item 4. | Mine Safety Disclosures |
Not applicable.
Executive Officers
The following table presents information about our directors and executive officers at February 18, 2016:
Age | Position | ||
Manuel Brocke-Benz | 57 | Director, President and Chief Executive Officer | |
Gregory L. Cowan | 62 | Senior Vice President and Chief Financial Officer | |
Mark T. McLoughlin | 60 | Senior Vice President and President, Americas Lab and Distribution Services | |
Dr. Nils Clausnitzer | 46 | Senior Vice President and President, EMEA-APAC Lab and Distribution Services | |
George Van Kula | 52 | Senior Vice President, Human Resources, General Counsel and Secretary | |
Theodore C. Pulkownik | 58 | Senior Vice President, Strategy and Corporate Development | |
Gerard J. Christian | 47 | Senior Vice President and Chief Information Officer | |
Stephan W. Labonté | 56 | Senior Vice President, Marketing | |
Ulf Kepper | 50 | Senior Vice President, VWR Services | |
Douglas J. Pitts | 57 | Vice President and Corporate Controller | |
Manuel Brocke-Benz was named our President and Chief Executive Officer on January 3, 2013. From July 25, 2012 to January 3, 2013, Mr. Brocke-Benz served as our interim Chief Executive Officer, while also serving as the Senior Vice President and Managing Director of Europe, Lab and Distribution Services, a position he held since January 2006. Mr. Brocke-Benz was elected to the Board in September 2012 and currently is the Chair of the Finance Committee. Mr. Brocke-Benz initially joined us in 1987. Mr. Brocke-Benz is currently a member of the Board of Directors of Patterson Medical. Mr. Brocke-Benz earned a law degree from Albert-Ludwigs University in Freiburg, Germany. Mr. Brocke-Benz’s leadership role and more than 25 years of service with us in a variety of senior-level positions, together with his extensive knowledge of our business, strategy and industry on an international basis and his training as a lawyer make him a valuable member of the Board.
Gregory L. Cowan is our Senior Vice President and Chief Financial Officer, a position he has held since June 2009. In his current role, Mr. Cowan is responsible for our financial operations on a global basis and for overseeing our investor relations activities. Prior to assuming his current position, Mr. Cowan served as our Vice President and Corporate Controller since December 2004. Since joining us, Mr. Cowan has overseen compliance efforts, the development of global policies and procedures and internal and external reporting. He has also been directly involved in various strategic projects involving commercial activities and changes to systems and infrastructure. Mr. Cowan earned a B.A. in accounting from Rutgers University.
Mark T. McLoughlin is our Senior Vice President and President, Americas Lab and Distribution Services, a position he has held since November 2014. In his current role, Mr. McLoughlin leads all sales, marketing, services and operations for our business in the United States, Canada, Mexico and Puerto Rico. Prior to assuming his current position, Mr. McLoughlin served as our Senior Vice President and President, U.S. Lab and Distribution Services from July 2012 to November 2012 and as Senior Vice President of Category Management and Senior Vice President of Emerging Businesses after joining us in September 2008. Mr. McLoughlin serves on the Board of Advisors for the Center for Services Leadership, W.P. Carey School of Business at Arizona State University. Mr. McLoughlin earned a B.A. in psychology from the University of Arizona.
Dr. Nils Clausnitzer is our Senior Vice President and President, EMEA-APAC Lab and Distribution Services, a position he has held since January 2016. In his current role, Dr. Clausnitzer is responsible for our sales, marketing, services, and operations for the European and Asia-Pacific businesses. Prior to joining us in January 2016, Dr. Clausnitzer served as the president and head of commercial operations, EMEA of Qiagen N.V. from 2010 to December 2015. Dr. Clausnitzer earned an M.D. from the Hamburg Medical School in Hamburg, Germany and an MBA from Open University in Milton Keynes, England.
21
George Van Kula is our Senior Vice President, Human Resources, General Counsel and Secretary. Mr. Van Kula has served as Senior Vice President, General Counsel and Secretary since May 2006, and in March 2013 Mr. Van Kula was given additional responsibility for our Human Resources organization. Mr. Van Kula earned a J.D. from the University of Michigan Law School and a B.A. from the University of Notre Dame.
Theodore C. Pulkownik is our Senior Vice President, Strategy and Corporate Development, a position he has held since July 2004. Mr. Pulkownik’s responsibilities include global mergers and acquisitions, corporate-center led initiatives and strategy and several of our businesses in the Americas, including Central and South America, global mining, North America export and our serum business. Mr. Pulkownik earned a B.A. in business administration from the University of Wisconsin and an MBA from the University of Michigan.
Gerard J. Christian is our Senior Vice President and Chief Information Officer, a position he has held since August 2012. In this role, Mr. Christian is responsible for our global information services, including the management of business unit and corporate shared application services, business continuity, infrastructure and operations, and information security and risk management. From January 2011 until August 2012, Mr. Christian served as Vice President of Shared Services as well as Vice President, Pricing and Contract Administration and from March 2007 until December 2010, as Vice President and Country Manager for VWR Ireland. Mr. Christian earned a B.S. in accounting from Canisius College and an MBA from the University of Buffalo, with a concentration in finance.
Stephan W. Labonté is our Senior Vice President, Marketing, a position he has held since October 2012. In his current role, Mr. Labonté is responsible for our supplier relationships, marketing and category management functions on a global basis and the customer segment teams in Europe. Prior to his current role, Mr. Labonté served as Senior Vice President of EU Marketing from February 2009 to September 2012. Mr. Labonté initially joined us in 1995. Mr. Labonté earned an M.S. in biology from Johann Goethe University in Frankfurt, Germany.
Ulf Kepper is our Senior Vice President, VWR Services, a position he has held since June 2014. In his current role, Mr. Kepper is responsible for our global service offerings under the VWRCATALYST brand including onsite services to support our customer’s operations. Prior to this role, Mr. Kepper served as Vice President for Global Marketing Services from 2009 to May 2014 and was responsible for product data management, marketing communications and e-business. Mr. Kepper earned degrees in computer science and economics from the University of Darmstadt in Darmstadt, Germany.
Douglas J. Pitts is our Vice President and Corporate Controller, a position he has held since July 2013. In his current role, Mr. Pitts is responsible for our internal and external reporting and our system of internal controls. Prior to this role, Mr. Pitts served as Vice President, Internal Audit from 2011 to June 2013 and Vice President and Assistant Corporate Controller from 2007 to 2010. Mr. Pitts earned a B.S. from the University of Illinois and is a Certified Public Accountant.
PART II
Item 5. | Market for the Registrant’s Common Equity, Related Stockholder Matters and Issuer Purchases of Equity Securities |
Principal Markets for Common Stock
In connection with our IPO, our common stock began trading on NASDAQ on October 2, 2014 under the symbol “VWR.” The following table presents the high and low sales prices of our common stock since then:
Year ended December 31, | |||||||||||||||
2015 | 2014 | ||||||||||||||
High | Low | High | Low | ||||||||||||
First quarter | $ | 26.86 | $ | 23.18 | $ | — | $ | — | |||||||
Second quarter | 28.83 | 25.16 | — | — | |||||||||||
Third quarter | 27.80 | 24.43 | — | — | |||||||||||
Fourth quarter | 28.58 | 23.65 | 27.14 | 20.60 | |||||||||||
At February 18, 2016, NASDAQ reported that the closing price of our common stock was $23.08.
Holders of Common Stock
As of February 18, 2016, we had only one holder of record of our common stock, VWR Holdings. This does not include holdings in street or nominee names.
22
Dividends
In 2014 we paid a $25.0 million dividend to our then sole shareholder, VWR Holdings, which equated to $0.25 per share. Prior to our recapitalization on July 31, 2014, our redeemable convertible preferred stock accrued dividends at a rate of 8% per annum. Those dividends were never paid and became available to common stockholders following the recapitalization.
Our subsidiaries are party to certain debt agreements that restrict their ability to pay dividends or make other distributions to us. For more information, see Item 7, “Management’s Discussion and Analysis of Financial Condition and Results of Operations — Liquidity and Capital Resources” and Note 24 to our consolidated financial statements beginning on page F-1 of this report.
We currently do not expect to pay any additional dividends on our common stock.
Stock Performance Graph
The following graph compares the return on a $100 investment in our common stock made on October 2, 2014, the day we first began trading on NASDAQ, with a $100 investment also made on October 2, 2014 in the S&P MidCap 400® Index and the S&P MidCap 400® Health Care Index. The S&P MidCap 400® Index is a broad equity market index of companies having market capitalization similar to ours. The S&P MidCap 400® Health Care Index is an industry-specific equity market index that we believe closely aligns to us based on the following: (i) the index follows companies of a similar size to us in terms of net sales and market capitalization; (ii) the index includes health care distributors, the segment of the Global Industry Classification Standard, or GICS®, that we believe most closely aligns to us; and (iii) the index includes companies in the Biopharma and healthcare industries, two of our primary customer groups that together comprise approximately half of our net sales.
The information in this section is not “soliciting material,” is not deemed “filed” with the SEC and is not to be incorporated by reference in any of our filings under the Securities Act of 1933, as amended, or the Securities Exchange Act of 1934, as amended, whether made before or after the date of this Annual Report on Form 10-K, except to the extent that we specifically incorporate such information by reference. The stock performance shown below is not necessarily indicative of future performance.
23
Item 6. | Selected Financial Data |
The information in this item is only a summary and should be read in conjunction with Item 7, “Management’s Discussion and Analysis of Financial Condition and Results of Operations” and our consolidated financial statements and related notes beginning on page F-1 of this report.
The following tables present selected financial data (dollars in millions, except per share amounts and prices of one euro):
Year ended December 31, | |||||||||||||||||||
2015 | 2014 | 2013 | 2012 | 2011 | |||||||||||||||
Average price of one euro(1) | $ | 1.11 | $ | 1.33 | $ | 1.33 | $ | 1.29 | $ | 1.39 | |||||||||
Statement of Operations Data: | |||||||||||||||||||
Net sales(2) | $ | 4,318.8 | $ | 4,375.3 | $ | 4,187.8 | $ | 4,129.4 | $ | 4,161.1 | |||||||||
Cost of goods sold(2) | 3,121.7 | 3,131.9 | 2,991.5 | 2,962.0 | 2,981.6 | ||||||||||||||
Gross profit | 1,197.1 | 1,243.4 | 1,196.3 | 1,167.4 | 1,179.5 | ||||||||||||||
Selling, general and administrative expenses(2) | 876.9 | 925.5 | 942.3 | 915.4 | 913.6 | ||||||||||||||
Operating income | 320.2 | 317.9 | 254.0 | 252.0 | 265.9 | ||||||||||||||
Interest expense, net(3)(4) | (102.8 | ) | (166.3 | ) | (190.7 | ) | (199.5 | ) | (199.6 | ) | |||||||||
Other income (expense), net(5) | 45.4 | 90.9 | (38.8 | ) | (15.1 | ) | 21.8 | ||||||||||||
Loss on extinguishment of debt(3)(4) | (32.7 | ) | (5.1 | ) | (2.0 | ) | (25.5 | ) | — | ||||||||||
Income before income taxes | 230.1 | 237.4 | 22.5 | 11.9 | 88.1 | ||||||||||||||
Income tax provision | (75.8 | ) | (84.8 | ) | (8.4 | ) | (8.1 | ) | (30.4 | ) | |||||||||
Net income | 154.3 | 152.6 | 14.1 | 3.8 | 57.7 | ||||||||||||||
Accretion of dividends on redeemable convertible preferred stock(6) | — | (29.4 | ) | (47.9 | ) | (45.5 | ) | (42.4 | ) | ||||||||||
Net income (loss) applicable to common stockholders | $ | 154.3 | $ | 123.2 | $ | (33.8 | ) | $ | (41.7 | ) | $ | 15.3 | |||||||
Earnings (loss) per share:(6) | |||||||||||||||||||
Basic | $ | 1.17 | $ | 2.50 | $ | (338.00 | ) | $ | (417.00 | ) | $ | 153.00 | |||||||
Diluted | 1.17 | 2.49 | (338.00 | ) | (417.00 | ) | 153.00 | ||||||||||||
Other Financial Data: | |||||||||||||||||||
Net cash provided by (used in):(7) | |||||||||||||||||||
Operating activities | $ | 225.0 | $ | 191.1 | $ | 200.9 | $ | 34.7 | $ | 139.3 | |||||||||
Investing activities | (97.9 | ) | (123.0 | ) | (89.5 | ) | (160.9 | ) | (209.2 | ) | |||||||||
Financing activities | (96.1 | ) | (71.8 | ) | (117.9 | ) | 98.3 | 90.3 | |||||||||||
Depreciation and amortization | 124.5 | 129.3 | 130.0 | 125.9 | 120.9 | ||||||||||||||
Cash paid for income taxes, net | 48.0 | 39.3 | 37.3 | 45.7 | 26.8 | ||||||||||||||
Acquisitions of businesses, net of cash acquired(7) | 59.1 | 102.9 | 44.4 | 113.3 | 168.5 | ||||||||||||||
Capital expenditures | 40.9 | 33.6 | 45.3 | 51.8 | 42.5 | ||||||||||||||
Gross margin | 27.7 | % | 28.4 | % | 28.6 | % | 28.3 | % | 28.3 | % | |||||||||
Dividends paid per share(6) | $ | — | $ | 0.25 | $ | — | $ | — | $ | — | |||||||||
24
December 31, | |||||||||||||||||||
2015 | 2014 | 2013 | 2012 | 2011 | |||||||||||||||
Spot price of one euro(1) | $ | 1.09 | $ | 1.21 | $ | 1.38 | $ | 1.32 | $ | 1.29 | |||||||||
Balance Sheet Data: | (Unaudited) | ||||||||||||||||||
Cash and cash equivalents | $ | 136.3 | $ | 118.0 | $ | 135.6 | $ | 139.8 | $ | 164.6 | |||||||||
Total assets(8) | 4,793.8 | 4,977.1 | 5,187.7 | 5,374.9 | 5,164.7 | ||||||||||||||
Total debt(3)(4)(8) | 1,989.0 | 2,100.2 | 2,833.1 | 3,121.5 | 2,883.7 | ||||||||||||||
Total redeemable equity(6) | 38.8 | 51.4 | 670.6 | 627.9 | 610.6 | ||||||||||||||
Total stockholders’ equity(3)(6) | 1,336.4 | 1,339.7 | 425.8 | 406.1 | 404.1 | ||||||||||||||
(1) | Changes in foreign currency exchange rates are a significant cause of change to our statement of operations, balance sheet and other financial data. The price of one euro is provided to illustrate overall the five-year trend in our most significant foreign currency. |
(2) | For information about recent changes to net sales, cost of goods sold and selling, general and administrative expense, see Item 7, “Management’s Discussion and Analysis of Financial Condition and Results of Operations.” |
(3) | In 2014, we completed our IPO resulting in a significant capital contribution and the repayment of debt. See Item 7, “Management’s Discussion and Analysis of Financial Condition and Results of Operations — Trends and Key Factors Affecting our Performance and Financial Condition — Initial Public Offering.” |
(4) | In 2015, we refinanced substantially all of our debt. See Item 7, “Management’s Discussion and Analysis of Financial Condition and Results of Operations — Trends and Key Factors Affecting our Performance and Financial Condition — Debt Refinancing.” In 2012, we redeemed previously issued senior subordinated notes. |
(5) | We have a significant amount of foreign-denominated debt on our U.S. dollar-denominated balance sheet, the translation of which is reported in other income (expense), net. Such gains or losses are unrealized until repayment of the debt and primarily relate to the weakening or strengthening of the euro against the U.S. dollar, respectively. In 2015, we designated most of our euro-denominated debt as a hedge of net investment in foreign operations, which reduced our exposure to foreign currency remeasurement. |
(6) | In 2014 in anticipation of our IPO, we recapitalized our equity and paid a $25.0 million dividend to VWR Holdings. The recapitalization caused (i) the accretion of dividends on our redeemable convertible preferred stock to cease; (ii) all accrued but unpaid dividends and unreturned capital on the redeemable convertible preferred stock to become available to common stockholders; and (iii) earnings or loss per share for historical periods to be adjusted for a stock split. In addition, the conversion of all shares of common stock and redeemable convertible preferred stock into newly-issued shares of common stock was considered period activity, which affects the comparability of 2015 and 2014 earnings per share results to prior periods. |
(7) | Short-term changes in working capital have caused volatility in historical operating cash flows, while changes in investing cash flows were primarily caused by the relative magnitude of business acquisitions completed each year. We manage changes in operating and investing cash flows by utilizing availability under our credit facilities, which contributes to changes in financing cash flows. Absent these changes, operating cash flows have generally increased as a result of year-over-year improvements to our Adjusted EBITDA and lower cash interest paid. See Item 7, “Management’s Discussion and Analysis of Financial Condition and Results of Operations—Liquidity and Capital Resources.” |
(8) | At December 31, 2015, we early adopted new accounting guidance about the presentation of debt issuance costs on a retrospective basis. As a result, we reclassified deferred debt issuance costs of $11.7 million, $21.3 million, $27.1 million and $25.0 million from other assets to debt, net of current portion, at December 31, 2014, 2013, 2012 and 2011, respectively. |
25
Item 7. | Management’s Discussion and Analysis of Financial Condition and Results of Operations |
The following discussion and analysis should be read with our consolidated financial statements and related notes beginning on page F-1 of this report. This discussion and analysis contains forward-looking statements, which are subject to risks and uncertainties. Actual results may differ materially from those forward-looking statements. Refer to “Cautionary Factors Regarding Forward-Looking Statements” and Item 1A, “Risk Factors” for additional information.
Overview
We are a leading, independent provider of laboratory products, services and solutions to the global life science, general research and applied markets. We have significant market positions in Europe and North America. We also have operations in Asia-Pacific and other key emerging markets to support our multinational customers across the globe. We serve a critical role in connecting customer sites with core laboratory product suppliers across multiple industries and geographies. We offer a broad portfolio of branded and private label laboratory products. We also offer a full range of value-added services, including custom manufacturing, to meet our customers’ product needs. These services represent a growing but currently small portion of our overall net sales. We offer a wide selection of unique products and have developed an extensive global infrastructure including thousands of sales and service-focused professionals. We deliver value to our customers by improving the costs, efficiency and effectiveness of their research laboratories and production operations. We deliver value to our suppliers by providing them with cost-effective channel access to a global and diverse customer base.
Our growth strategies include expanding our global strategic relationships, developing complementary new products and services, expanding our customer and supplier base, implementing best practices across our operations, broadening our offerings to underserved customer segments, executing targeted acquisitions and deploying capital to create shareholder value. As a result of executing our strategies in 2015, we achieved organic net sales growth of 4.4%, which significantly offset the foreign currency effects that contributed to a 1.3% decline in reported net sales, net income increased by 1.1% and Adjusted EPS increased by 26.7%. See “Key Indicators of Performance and Financial Condition” for additional information about organic net sales growth and Adjusted EPS, the reason for their inclusion and where to find reconciliations from the most directly comparable GAAP measures.
We report financial results on the basis of two reportable segments organized by geographic region: the Americas and EMEA-APAC.
Trends and Key Factors Affecting our Performance and Financial Condition
We believe the following trends and key factors have affected our recent operating results and are likely to continue to affect our performance and financial condition.
Debt Refinancing
During the year ended December 31, 2015, we refinanced substantially all of our debt. The refinancing extended the maturity of our debt, lowered our variable interest rate margins and accelerated our required principal repayments prior to maturity. As a result, we expect that our interest expense will decrease, more cash will be provided by operating activities and cash used in financing activities will increase prior to debt maturity. We also incurred a loss on extinguishment of debt of $32.7 million and paid debt issuance costs and redemption premiums of $41.9 million.
For additional information, see Note 8 to the consolidated financial statements beginning on page F-1 of this report.
Initial Public Offering
In the fourth quarter of 2014, we completed an IPO by issuing 29.4 million shares of common stock at a price of $21.00 per share. After deducting underwriting discounts, the IPO resulted in net proceeds of $582.6 million, which we used to repay our 10.75% subordinated notes, a portion of which were denominated in euros. As a result, we incurred a loss on extinguishment of debt, began to incur less interest expense and reduced our earnings exposure to foreign currency remeasurement.
Foreign Currency
Our operations span the globe. A significant portion of our net sales and total assets are denominated in currencies other than the U.S. dollar — principally the euro, as well as the British pound sterling, the Canadian dollar and the Swiss franc. In addition, we carry a significant amount of euro-denominated debt on our U.S. dollar-denominated balance sheet. As a result, changes in foreign currency exchange rates impact our reported results.
During the second half of 2014, the U.S. dollar strengthened considerably against most foreign currencies, including the euro. This negatively impacted our foreign-denominated results and net asset values in 2015 and 2014 and caused us to record foreign currency remeasurement gains on our euro-denominated debt within other income (expense), net for those same periods.
26
During 2015, we designated hedges that reduced our exposures to foreign currency remeasurement recorded in earnings and to changes in the value of our net investment in euro-denominated foreign operations. For more information, see Note 9 to our consolidated financial statements beginning on page F-1 of this report.
We are not able to predict the impact that future changes in foreign currency exchange rates may have on our operating results, but their impact could be significant. For additional information about the effect of foreign currency exchange rates on our results of operations, see Item 7A, “Qualitative and Quantitative Disclosures about Market Risk.”
Acquisitions
Part of our business strategy is to acquire businesses that broaden our product offerings, strengthen our existing market positions and expand our geographic presence. We have acquired 41 businesses since June 2007, and we expect to pursue additional acquisition opportunities in future periods. For additional information, see Note 5 to our consolidated financial statements beginning on page F-1 of this report.
Product and Customer Mix
We offer a broad portfolio of branded and private label laboratory products in our industry and a full range of value-added services, including custom manufacturing and clinical trials support. We typically realize differing gross margins on these products and services, with greater gross margin coming from the sale of private label products as well as chemicals and reagents that we manufacture. Private label products, which enhance customer choice with lower cost alternatives, represented 20% of our 2015 product sales. The mix of products sold by us in any given period will impact our gross margin.
We intend to selectively expand our private label product offerings to augment our branded product offerings. We also offer custom manufactured chemicals, including buffers, reagents and other chemicals used in biopharmaceutical and industrial applications and production processes. We are focused on enhancing our capabilities as a manufacturer of high quality biochemicals, chemicals and reagents to the extent we do not conflict with the offerings of our existing supplier base.
Biopharma was our largest and fastest growing customer group in 2015, representing 43% of our consolidated net sales. Many of these customers have experienced significant changes over the last several years, including reductions in governmental payments for pharmaceutical products, expirations of significant patents, lower funding for research and development and adverse changes in legislation and regulation. Should our Biopharma customers experience similar changes in future periods, it could impact our future results.
Seasonality and Inflation
Neither seasonality nor inflation have had a significant impact on our historical results of operations or financial condition. Although the prices we pay for our products may increase, we believe we will continue to be able to pass through the majority of these increases to our customers. However, our earnings and cash flows could be adversely affected if we are unable to pass through future cost increases arising from inflation to our customers.
Key Indicators of Performance and Financial Condition
To evaluate our performance, we monitor a number of key indicators of our performance and financial condition.
• | Net sales, organic net sales growth, operating income and operating income margin, which we discuss on both a consolidated and reportable segment basis in the section entitled “Results of Operations.” Organic net sales growth is a non-GAAP financial measurement and a key performance indicator used by our investors and management to measure and evaluate our underlying commercial operating performance. |
• | Gross margin, net income or loss, Adjusted EPS, Adjusted EBITDA and Adjusted EBITDA margin, which we discuss on a consolidated basis in the section entitled “Results of Operations.” Adjusted EPS, Adjusted EBITDA and Adjusted EBITDA margin are non-GAAP financial measurements and key performance indicators used by our investors and management to measure and evaluate our operating performance; and |
• | Cash flows, particularly cash flows from operating activities and Free Cash Flow, which we discuss in the section entitled “Liquidity and Capital Resources — Historical Cash Flows.” Free Cash Flow is a non-GAAP financial measurement and a key performance indicator used by our investors, creditors and management to measure and evaluate our ability to generate cash. |
27
Non-GAAP Financial Measurements
As appropriate, we supplement our results of operations determined in accordance with GAAP with certain non-GAAP financial measurements that we believe are useful to investors, creditors and management in assessing our performance. These measurements should not be considered in isolation or as a substitute for reported GAAP results because they may include or exclude certain items as compared to similar GAAP-based measurements, and such measurements may not be comparable to similarly-titled measurements reported by other companies. Rather, these measurements should be considered as an additional way of viewing aspects of our operations that provide a more complete understanding of our business. We strongly encourage readers to review our consolidated financial statements included elsewhere herein and in publicly filed reports in their entirety and not rely solely on any one, single financial measurement.
Reconciliations of organic net sales growth and all other non-GAAP measurements to their most directly comparable GAAP-based financial measurements are included in the sections entitled “Results of Operations” and “Reconciliations of Non-GAAP Financial Measurements,” respectively.
Results of Operations
This discussion and analysis includes a summary of our historical results of operations below, followed by detailed comparisons of our results. We have derived this data from our consolidated financial statements beginning on page F-1 of this report.
The following table presents a summary of our results of operations (dollars in millions, except per share data):
Year ended December 31, | Reported change | ||||||||||||||||||||||||
2015 vs. 2014 | 2014 vs. 2013 | ||||||||||||||||||||||||
2015 | 2014 | 2013 | Amount | % | Amount | % | |||||||||||||||||||
Net sales | $ | 4,318.8 | $ | 4,375.3 | $ | 4,187.8 | $ | (56.5 | ) | (1.3 | )% | $ | 187.5 | 4.5 | % | ||||||||||
Organic net sales growth | 4.4 | % | 3.1 | % | (1.5 | )% | |||||||||||||||||||
Gross margin | 27.7 | % | 28.4 | % | 28.6 | % | (70 | ) | basis points | (20 | ) | basis points | |||||||||||||
Operating income | $ | 320.2 | $ | 317.9 | $ | 254.0 | $ | 2.3 | 0.7 | % | $ | 63.9 | 25.2 | % | |||||||||||
Operating income margin | 7.4 | % | 7.3 | % | 6.1 | % | 10 | basis points | 120 | basis points | |||||||||||||||
Net income | $ | 154.3 | $ | 152.6 | $ | 14.1 | $ | 1.7 | 1.1 | % | $ | 138.5 | n/m | ||||||||||||
Adjusted EPS | 1.52 | 1.20 | 0.94 | 0.32 | 26.7 | % | 0.26 | 27.7 | % | ||||||||||||||||
Adjusted EBITDA | 456.0 | 449.4 | 418.5 | $ | 6.6 | 1.5 | % | $ | 30.9 | 7.4 | % | ||||||||||||||
Adjusted EBITDA margin | 10.6 | % | 10.3 | % | 10.0 | % | 30 | basis points | 30 | basis points | |||||||||||||||
The following summarizes our 2015 results of operations as compared to 2014:
• | A stronger U.S. dollar negatively impacted our reported results, and net sales benefited from acquisitions. Excluding these effects, net sales and operating income each increased. |
• | Organic net sales growth was 4.4%, reflecting continuing strength in Biopharma in both segments. The Americas experienced its seventh consecutive quarter of year-over-year organic net sales growth in the fourth quarter. EMEA-APAC growth included more sales of integrated procurement services and other specialized offerings to our largest customers. |
• | Gross margin decreased from the effects of a stronger U.S. dollar and a supply chain disruption with a major supplier. In addition, a less favorable product sales mix in 2015 and changes to certain supply agreements negatively impacted the comparison. |
• | Operating income and Adjusted EBITDA each increased, despite significant currency impacts, due to the leverage of organic net sales growth and controlling costs. Excluding currency translation, gross profit increased 4.5% while SG&A expenses only increased 2.9%, resulting in operating income growth of 9.1%. Those same factors caused our operating income margin to increase by 10 basis points and our Adjusted EBITDA margin to increase by 30 basis points. |
• | Net income benefited from significant reductions to interest expense caused primarily by the 2014 repayment of our 10.75% subordinated notes as well as our 2015 debt refinancing. The 2015 refinancing lowered our variable interest rate margins, which will be favorable to our results in future periods. Net income also reflected volatility from the remeasurement of euro-denominated debt. Most of our euro-denominated debt is now designated as a hedge, which we believe will lessen the volatility in earnings from foreign currency remeasurement. |
• | Adjusted EPS increased 26.7% reflecting the significant reductions to interest expense and the operational factors noted above. |
28
Comparison of Years Ended December 31, 2015 and 2014
Net Sales and Organic Net Sales Growth
The following table presents net sales, net sales changes and organic net sales growth by segment (dollars in millions):
Year ended December 31, | Reported change | Components of reported change | |||||||||||||||||||||||||||
Currency translation | Acquisitions | Organic net sales growth | |||||||||||||||||||||||||||
2015 | 2014 | Amount | % | Amount | % | ||||||||||||||||||||||||
Americas | $ | 2,577.3 | $ | 2,430.1 | $ | 147.2 | 6.1 | % | $ | (39.0 | ) | $ | 61.3 | $ | 124.9 | 5.1 | % | ||||||||||||
EMEA-APAC | 1,741.5 | 1,945.2 | (203.7 | ) | (10.5 | )% | (295.5 | ) | 24.0 | 67.8 | 3.5 | % | |||||||||||||||||
Total | $ | 4,318.8 | $ | 4,375.3 | $ | (56.5 | ) | (1.3 | )% | $ | (334.5 | ) | $ | 85.3 | $ | 192.7 | 4.4 | % | |||||||||||
Net sales decreased 1.3%, the result of significant unfavorable currency translation that was mitigated by strong organic net sales growth and the contribution of acquisitions. Organic net sales growth was 4.4%, caused by continued strength in Biopharma for both segments and spread across most product groups, but particularly strong for chemicals in the Americas and private label products, integrated procurement services and other value-added services in both segments. Organic net sales growth in the Americas was 5.1% and was balanced between volume and pricing. The growth reflected strength in equipment and instrumentation sales in addition to Biopharma, chemicals, private label products and value-added services as noted previously. As a result, the Americas experienced its seventh consecutive quarter of year-over-year organic net sales growth in the fourth quarter of 2015. Organic net sales in EMEA-APAC was 3.5%, reflecting higher volumes from Biopharma, private label products and value-added services as previously discussed, as well as strong private sector growth that was tempered by lower government spending.
Gross Profit and Gross Margin
The following table presents gross profit, gross margin and changes therein (dollars in millions):
Year ended December 31, | Reported change | Components of reported change | |||||||||||||||||||||||
Currency translation | Operations | ||||||||||||||||||||||||
2015 | 2014 | Amount | % | Amount | % | ||||||||||||||||||||
Gross profit | $ | 1,197.1 | $ | 1,243.4 | $ | (46.3 | ) | (3.7 | )% | $ | (102.2 | ) | $ | 55.9 | 4.5 | % | |||||||||
Gross margin | 27.7 | % | 28.4 | % | (70 | ) | basis points | ||||||||||||||||||
Gross profit decreased 3.7% as a result of the decrease in net sales previously discussed and the decrease to gross margin discussed below. Excluding the effects of currency translation, gross profit increased 4.5%.
Gross margin decreased 70 basis points and included: (i) the strengthening of the U.S. dollar against most foreign currencies, which tempered our ability to adjust pricing to offset cross-border denominated purchases; and to a lesser extent (ii) a supply chain disruption with a major supplier. In addition, a less favorable product sales mix in the 2015 period and changes to our supply agreements with a major supplier in April 2014 negatively impacted the comparison.
29
SG&A Expenses
The following table presents SG&A expenses, SG&A expenses as a percentage of net sales and changes therein (dollars in millions):
Year ended December 31, | Reported change | Components of reported change | |||||||||||||||||||||||
Currency translation | Operations | ||||||||||||||||||||||||
2015 | 2014 | Amount | % | Amount | % | ||||||||||||||||||||
SG&A expenses | $ | 876.9 | $ | 925.5 | $ | (48.6 | ) | (5.3 | )% | $ | (75.6 | ) | $ | 27.0 | 2.9 | % | |||||||||
SG&A expenses as a percentage of net sales | 20.3 | % | 21.2 | % | (90 | ) | basis points | ||||||||||||||||||
SG&A expenses decreased 5.3%, the result of significant favorable currency translation and an increase from operations of 2.9%. The majority of that increase was attributable to acquired businesses with the remainder due to (i) a gain on the partial settlement of our U.S. retirement plan in 2014 that did not recur in 2015, (ii) an increase in share-based compensation expense of $2.9 million; (iii) an impairment charge of $3.2 million for an amortizable intangible asset in 2015 and (iv) $2.8 million of legacy facility exit charges and $1.5 million of secondary equity offering costs each incurred in 2015. Those increases were partially offset by lower overall personnel costs in 2015.
Operating Income
The following table presents operating income, operating income margin and changes therein (dollars in millions):
Year ended December 31, | Reported change | Components of reported change | |||||||||||||||||||||||
Currency translation | Operations | ||||||||||||||||||||||||
2015 | 2014 | Amount | % | Amount | % | ||||||||||||||||||||
Operating income: | |||||||||||||||||||||||||
Americas | $ | 162.5 | $ | 141.0 | $ | 21.5 | 15.2 | % | $ | (0.2 | ) | $ | 21.7 | 15.4 | % | ||||||||||
EMEA-APAC | 157.7 | 176.9 | (19.2 | ) | (10.9 | )% | (26.4 | ) | 7.2 | 4.1 | % | ||||||||||||||
Total | $ | 320.2 | $ | 317.9 | $ | 2.3 | 0.7 | % | $ | (26.6 | ) | $ | 28.9 | 9.1 | % | ||||||||||
Operating income margin: | |||||||||||||||||||||||||
Americas | 6.3 | % | 5.8 | % | 50 | basis points | |||||||||||||||||||
EMEA-APAC | 9.1 | % | 9.1 | % | — | basis points | |||||||||||||||||||
Total | 7.4 | % | 7.3 | % | 10 | basis points | |||||||||||||||||||
Operating income increased 0.7%, the result of 9.1% growth from operations that was substantially offset by currency translation. The increase from operations was caused by the following:
• | In the Americas, operations increased by 15.4% reflecting the leverage of organic net sales growth and lower overall personnel costs in 2015, partially offset by the legacy facility exit charges, secondary equity offering costs, the 2014 settlement gain that did not recur and the increase to share-based compensation expense previously discussed; and |
• | In EMEA-APAC, operations increased by 4.1% reflecting the leverage of organic net sales growth and cost control initiatives in the 2015 periods, which were partially offset by the impairment charge and the factors affecting gross margin previously discussed. |
Operating income margins improved, particularly in the Americas, due to the leverage of organic net sales growth in both segments that was partially offset by the factors impacting our gross margins.
30
Net Income
The following table presents changes to the components of net income (dollars in millions):
Year ended December 31, | Reported change | |||||||||||||
2015 | 2014 | Amount | % | |||||||||||
Operating income, as previously discussed | $ | 320.2 | $ | 317.9 | $ | 2.3 | 0.7 | % | ||||||
Interest expense, net | (102.8 | ) | (166.3 | ) | 63.5 | 38.2 | % | |||||||
Other income (expense), net | 45.4 | 90.9 | (45.5 | ) | n/m | |||||||||
Loss on extinguishment of debt | (32.7 | ) | (5.1 | ) | (27.6 | ) | n/m | |||||||
Income tax provision | (75.8 | ) | (84.8 | ) | 9.0 | 10.6 | % | |||||||
Net income | $ | 154.3 | $ | 152.6 | $ | 1.7 | 1.1 | % | ||||||
Interest expense, net decreased from the 2014 repayment of our 10.75% subordinated notes, our 2015 debt refinancing and the strengthening of the U.S. dollar, which lowered interest expense for our euro-denominated borrowings.
Other income (expense), net, consisted primarily of the net foreign currency remeasurement gain or loss on our foreign-denominated debt, which fluctuates with changes in currency exchange rates and resulted in significant gains in both 2015 and 2014 due to the strengthening of the U.S. dollar.
The loss on extinguishment of debt for 2015 was caused by the refinancing of substantially all of our debt and included the redemption premium on the 7.25% senior notes, the write-off of unamortized deferred financing costs and fees paid to term loan lenders who continued from our prior credit facility to the new facility. The loss on extinguishment of debt for 2014 was caused by the write-off of unamortized deferred financing costs following the repayment of our 10.75% subordinated notes.
The income tax provision decreased primarily due to the change in pretax income and changes in foreign tax rates. For more information about the components of our income tax provisions and reconciliations to the U.S. federal statutory rate, see Note 18 to our consolidated financial statements beginning on page F-1 of this report.
Adjusted EPS and Adjusted EBITDA
Adjusted EPS increased $0.32 or 26.7% due primarily to the after-tax reduction to interest expense and the operational factors noted above.
Adjusted EBITDA increased $6.6 million or 1.5% due to the same factors described previously for operating income except for the items not included in Adjusted EBITDA.
31
Comparison of Years Ended December 31, 2014 and 2013
Net Sales and Organic Net Sales Growth
The following table presents net sales, net sales changes and organic net sales growth by reportable segment (dollars in millions):
Year ended December 31, | Reported change | Components of reported change | |||||||||||||||||||||||||||
Currency translation | Acquisitions | Organic net sales growth | |||||||||||||||||||||||||||
2014 | 2013 | Amount | % | Amount | % | ||||||||||||||||||||||||
Americas | $ | 2,430.1 | $ | 2,352.7 | $ | 77.4 | 3.3 | % | $ | (18.7 | ) | $ | 47.0 | $ | 49.1 | 2.1 | % | ||||||||||||
EMEA-APAC | 1,945.2 | 1,835.1 | 110.1 | 6.0 | % | 0.1 | 27.5 | 82.5 | 4.5 | % | |||||||||||||||||||
Total | $ | 4,375.3 | $ | 4,187.8 | $ | 187.5 | 4.5 | % | $ | (18.6 | ) | $ | 74.5 | $ | 131.6 | 3.1 | % | ||||||||||||
Net sales increased 4.5% as a result of acquisitions and organic net sales growth of 3.1%, which was partially offset by currency translation. In the Americas, organic net sales growth of 2.1% reflected higher volume as a result of initiatives that were put in place to improve Americas segment performance. Those initiatives included investments in infrastructure and management and a strategic shift to a more targeted, customer-centric sales approach. Pricing also improved the year-over-year result. Organic net sales growth was particularly strong for Biopharma customers, with the strongest growth in the fourth quarter, as well as for consumable products. In EMEA-APAC, organic net sales growth of 4.5% reflected consistently higher sales volume throughout the year. Net sales were particularly strong for private label consumables, durable goods and equipment and private label chemicals.
Gross Profit and Gross Margin
The following table presents gross profit, gross margin and changes therein (dollars in millions):
Year ended December 31, | Reported change | Components of reported change | |||||||||||||||||||||||
Currency translation | Operations | ||||||||||||||||||||||||
2014 | 2013 | Amount | % | Amount | % | ||||||||||||||||||||
Gross profit | $ | 1,243.4 | $ | 1,196.3 | $ | 47.1 | 3.9 | % | $ | (4.5 | ) | $ | 51.6 | 4.3 | % | ||||||||||
Gross margin | 28.4 | % | 28.6 | % | (20 | ) | basis points | ||||||||||||||||||
Gross profit increased 3.9% as a result of the increase in net sales previously discussed and the decrease in gross margin discussed below. Excluding the effects of currency translation, gross profit increased 4.3%.
Gross margin decreased 20 basis points. Changes to our agreements with a major supplier negatively impacted our gross margins, particularly in the EMEA-APAC segment. The year-over-year impact of these changes substantially ceased beginning in the second quarter of 2015. These changes were substantially offset by higher pricing and, to a lesser extent, a more favorable product and customer sales mix in the Americas.
32
SG&A Expenses
The following table presents SG&A expenses, SG&A expenses as a percentage of net sales and changes therein (dollars in millions):
Year ended December 31, | Reported change | Components of reported change | |||||||||||||||||||||||
Currency translation | Operations | ||||||||||||||||||||||||
2014 | 2013 | Amount | % | Amount | % | ||||||||||||||||||||
SG&A expenses | $ | 925.5 | $ | 942.3 | $ | (16.8 | ) | (1.8 | )% | $ | (5.8 | ) | $ | (11.0 | ) | (1.2 | )% | ||||||||
SG&A expenses as a percentage of net sales | 21.2 | % | 22.5 | % | (130 | ) | basis points | ||||||||||||||||||
SG&A expenses decreased 1.8% as a result of both currency translation and operations. During 2013, we incurred $31.7 million of charges related to our global restructuring program and $2.2 million of charges related to executive departures that were not present in 2014. Increased employee compensation provisions in 2014, including the expense related to new stock option awards, were substantially offset by lower overall personnel costs in 2014, including savings from our 2013 global restructuring program. We also recognized a gain on the partial settlement of our U.S. Retirement Plan obligations in 2014, and we terminated the management services agreement with Madison Dearborn Partners and Avista Capital Partners in the fourth quarter of 2014. That aggregate decrease was partially offset by new SG&A expenses from acquired businesses.
Operating Income
The following table presents operating income, operating income margin and changes therein by segment (dollars in millions):
Year ended December 31, | Reported change | Components of reported change | |||||||||||||||||||||||
Currency translation | Operations | ||||||||||||||||||||||||
2014 | 2013 | Amount | % | Amount | % | ||||||||||||||||||||
Operating income: | |||||||||||||||||||||||||
Americas | $ | 141.0 | $ | 115.8 | $ | 25.2 | 21.8 | % | $ | 1.1 | $ | 24.1 | 20.8 | % | |||||||||||
EMEA-APAC | 176.9 | 138.2 | 38.7 | 28.0 | % | 0.2 | 38.5 | 27.9 | % | ||||||||||||||||
Total | $ | 317.9 | $ | 254.0 | $ | 63.9 | 25.2 | % | $ | 1.3 | $ | 62.6 | 24.6 | % | |||||||||||
Operating income margin: | |||||||||||||||||||||||||
Americas | 5.8 | % | 4.9 | % | 90 | basis points | |||||||||||||||||||
EMEA-APAC | 9.1 | % | 7.5 | % | 160 | basis points | |||||||||||||||||||
Total | 7.3 | % | 6.1 | % | 120 | basis points | |||||||||||||||||||
Operating income increased primarily from operations, as follows:
• | In the Americas, operating income increased due to the settlement gain, savings from our 2013 global restructuring program, the absence of 2013 charges related to that program and other executive departures, the termination the management services agreement, improvements to gross margin and the leverage of organic net sales growth, which were partially offset by higher employee compensation provisions in 2014 including the expense related to new stock options awards, each as previously discussed; and |
• | In EMEA-APAC, operating income increased due to savings from our 2013 global restructuring program, the absence of 2013 charges related to that program and the leverage of organic net sales growth, which were partially offset by increased employee compensation provisions in 2014 including the expense related to new stock option awards, each as previously discussed. |
33
Net Income
The following table presents changes to the components of net income (in millions):
Year ended December 31, | Reported change | |||||||||||||
2014 | 2013 | Amount | % | |||||||||||
Operating income, as previously discussed | $ | 317.9 | $ | 254.0 | $ | 63.9 | 25.2 | % | ||||||
Interest expense, net | (166.3 | ) | (190.7 | ) | 24.4 | (12.8 | )% | |||||||
Other income (expense), net | 90.9 | (38.8 | ) | 129.7 | n/m | |||||||||
Loss on extinguishment of debt | (5.1 | ) | (2.0 | ) | (3.1 | ) | n/m | |||||||
Income tax provision | (84.8 | ) | (8.4 | ) | (76.4 | ) | n/m | |||||||
Net income | $ | 152.6 | $ | 14.1 | $ | 138.5 | n/m | |||||||
Interest expense, net decreased as a result of lower rates of interest on our term loans, which we refinanced in January 2014, the redemption of our 10.75% subordinated notes in the fourth quarter of 2014 using the net proceeds from the IPO and lower average borrowings under our multi-currency revolving loan facility.
Other income (expense), net, consisted primarily of the net foreign currency remeasurement gain or loss on our foreign-denominated debt, which fluctuates with changes in currency exchange rates and resulted in a significant gain in 2014 due to the strengthening of the U.S. dollar and a significant loss in 2013 due to the weakening of the U.S. dollar.
The loss on extinguishment of debt for 2014 was caused by the write-off of unamortized deferred financing costs following the repayment of our 10.75% subordinated notes. The loss on extinguishment of debt for 2013 was caused by the write-off of unamortized deferred financing costs following an amendment of our prior credit facility.
The income tax provision increased primarily due to the change in pretax income. For more information about the components of our income tax provisions and reconciliations to the U.S. federal statutory rate, see Note 18 to our consolidated financial statements beginning on page F-1 of this report.
Adjusted EPS and Adjusted EBITDA
Adjusted EPS increased $0.26 or 27.7% primarily due to the after-tax increase to operating income, after the exclusion of the 2013 restructuring charges, and the reduction to interest expense.
Adjusted EBITDA increased $30.9 million or 7.4% primarily due to the increase to operating income, after the exclusion of the 2013 restructuring charges.
34
Reconciliations of Non-GAAP Financial Measurements
The following tables present reconciliations of non-GAAP financial measurements to their most directly comparable GAAP measurements (in millions):
Year ended December 31, | |||||||||||
2015 | 2014 | 2013 | |||||||||
Net income | $ | 154.3 | $ | 152.6 | $ | 14.1 | |||||
Amortization of acquired intangible assets | 83.4 | 88.9 | 91.7 | ||||||||
Net foreign currency remeasurement (gain) loss from financing activities | (45.4 | ) | (90.9 | ) | 38.0 | ||||||
Restructuring charges | — | — | 32.5 | ||||||||
Impairment charges | 3.2 | 11.3 | — | ||||||||
Gain on disposition of business | — | (11.1 | ) | — | |||||||
Loss on extinguishment of debt | 32.7 | 5.1 | 2.0 | ||||||||
Charges associated with executive departures | — | — | 2.2 | ||||||||
Secondary equity offering costs | 1.5 | — | — | ||||||||
Income from changes to estimated fair value of contingent consideration | (1.1 | ) | — | — | |||||||
Legacy facility exit charges | 2.8 | — | — | ||||||||
Income tax (benefit) provision applicable to adjustments, net | (26.7 | ) | 2.4 | (57.3 | ) | ||||||
Deferred tax rate change related to amortizable intangible assets | (4.5 | ) | — | — | |||||||
Adjusted net income | 200.2 | 158.3 | 123.2 | ||||||||
Interest expense, net of interest income | 102.8 | 166.3 | 190.7 | ||||||||
Depreciation expense | 41.1 | 40.4 | 38.3 | ||||||||
Share-based compensation expense | 4.9 | 2.0 | 0.6 | ||||||||
Income tax provision applicable to adjusted net income | 107.0 | 82.4 | 65.7 | ||||||||
Adjusted EBITDA | $ | 456.0 | $ | 449.4 | $ | 418.5 | |||||
Adjusted EPS | $ | 1.52 | $ | 1.20 | $ | 0.94 | |||||
Weighted average shares outstanding, diluted | 131.8 | 49.5 | 0.1 | ||||||||
Normalization for recent share activity* | — | 82.0 | 131.3 | ||||||||
Adjusted weighted average shares outstanding, diluted | 131.8 | 131.5 | 131.4 | ||||||||
* | This adjustment states adjusted weighted average shares outstanding, diluted, at the amounts that would have been reported under GAAP had the IPO and the recapitalization occurred on January 1 of each year presented. |
Year ended December 31, | |||||||||||
2015 | 2014 | 2013 | |||||||||
Net cash provided by operating activities | $ | 225.0 | $ | 191.1 | $ | 200.9 | |||||
Less: capital expenditures | 40.9 | 33.6 | 45.3 | ||||||||
Free Cash Flow | $ | 184.1 | $ | 157.5 | $ | 155.6 | |||||
35
Liquidity and Capital Resources
We fund short-term cash requirements primarily from operating cash flows and available borrowings under our credit facilities. Most of our cash resides outside of the United States, which we do not intend to repatriate. Most of our long-term financing is from debt and capital raised from stockholders.
We use cash to satisfy our contractual obligations and to fund other business needs. Our most significant contractual obligations are scheduled principal and interest payments for debt. We also have obligations to make payments under operating leases, to purchase minimum quantities of certain products, to fund pension obligations and to pay VWR Holdings under the ITRA. In addition to contractual obligations, we use cash to fund business acquisitions, capital expenditures and taxes. Changes in working capital may be a source or a use of cash depending on our operations during the period.
In 2015, we refinanced substantially all of our debt. In 2014, we completed an IPO, which significantly changed our capitalization, and we entered into an ITRA, which created a significant obligation to VWR Holdings. The U.S. dollar was also stronger at December 31, 2015 than it was at December 31, 2014. This reduced the value of our foreign-denominated net assets and could reduce it further if the U.S. dollar strengthens more.
Our future financial and operating performance, ability to service or refinance our debt and ability to comply with covenants and restrictions contained in our debt agreements will be subject to future economic conditions and to financial, business and other factors, many of which are beyond our control and will be substantially dependent on the global economy, demand for our products and our ability to successfully implement our business strategies.
We believe that cash generated from operations, together with available borrowings under our credit facilities, will be adequate to meet our current and expected needs for cash prior to the maturity of our debt, although no assurance can be given in this regard.
Liquidity
As of December 31, 2015, we had aggregate unused availability of $368.9 million under our credit facilities, calculated as follows (in millions):
A/R Facility | Multi-currency revolving loan facility | Total | |||||||||
Current availability | $ | 175.0 | $ | 250.0 | $ | 425.0 | |||||
Undrawn letters of credit outstanding | (11.3 | ) | (6.8 | ) | (18.1 | ) | |||||
Outstanding borrowings | (38.0 | ) | — | (38.0 | ) | ||||||
Unused availability | $ | 125.7 | $ | 243.2 | $ | 368.9 | |||||
Borrowings under credit facilities are the most significant source of our liquidity. The daily average of aggregate borrowings outstanding under these facilities for the year ended December 31, 2015 was $127.6 million. Our liquidity needs change daily, which causes our unused availability to fluctuate. Current availability under the A/R Facility also depends upon maintaining a sufficient borrowing base of eligible trade accounts receivable.
Subject to continuing compliance with our covenants, we may request incremental term loan borrowings and/or revolving loan commitments under the senior credit facility in an amount up to (i) $450.0 million or (ii) the maximum amount at such time that could be incurred without causing VWR Funding to exceed a specified net leverage ratio, in each case subject to certain other restrictions. The actual extension of any such incremental term loans or increases in revolving loan commitments would be subject to us and our lenders reaching agreement on applicable terms and conditions, which may depend on market conditions at the time of any request.
Most of our cash resides outside the United States. Foreign exchange ceilings imposed by local governments, regulatory requirements applicable to certain of our subsidiaries and the sometimes lengthy approval processes which foreign governments require for international cash transfers may restrict our internal cash movements. We expect to reinvest all of our cash and earnings outside of the United States because we anticipate that a significant portion of our opportunities for future growth will be abroad. As of December 31, 2015, $124.8 million of our cash and cash equivalents was held by our foreign subsidiaries. We do not intend to repatriate our foreign cash and cash equivalents. If these foreign cash and cash equivalents were repatriated to the United States, we may be required to pay income taxes on the amounts repatriated.
36
Debt
Much of our long-term financing is from debt. This discussion supplements the disclosures provided in Notes 8 and 24 to our consolidated financial statements beginning on page F-1 of this report and “Trends and Key Factors Affecting our Performance and Financial Condition.”
Our debt agreements contain a number of affirmative and negative covenants which we consider to be customary and usual. The senior credit facility includes a financial maintenance covenant requiring us to maintain a First Lien Net Leverage Ratio (as defined in the senior credit facility) of not more than 4.00:1.00. The financial maintenance covenant is tested at the end of each fiscal quarter. The A/R Facility includes a consolidated interest expense test if our available liquidity is less than $115.0 million.
VWR Funding, as the borrower under the senior credit facility and the issuer of the 4.625% senior notes, is currently limited under the terms of such agreements in its ability to declare any cash dividends on, or making any payment on account of, its capital stock, or making any other distribution in respect thereof (collectively, a “restricted payment”), including for the purpose of enabling us to pay dividends on our capital stock. Under the senior credit facility, until such time as Total Net Leverage (as defined in the senior credit facility) is no greater than 3.75:1.00, after giving effect to such restricted payment, VWR Funding can make lifetime restricted payments to us up to (i) the greater of $175.0 million and 4.375% of Total Assets (as defined in the senior credit facility) and (ii) an additional amount equal to $100.0 million plus 50% of its consolidated net income since July 1, 2015 (the “cumulative net income basket”) and any amounts it has received from sales of certain equity or capital contributions that are not used for certain other restricted payments, provided that solely with respect to restricted payments made in reliance on the cumulative net income basket there is no event of default under the senior credit facility and VWR Funding meets a certain total net leverage ratio after giving effect to any such restricted payment. Similarly, VWR Funding can make lifetime restricted payments to us under the indenture governing the 4.625% senior notes up to (i) $35.0 million and (ii) an additional amount equal to $100.0 million plus 50% of its consolidated net income since January 1, 2015 and any amounts it has received from sales of equity or capital contributions since the issue date of such senior notes that are not used for other restricted payments, provided that there is no default under the indenture and that VWR Funding meets a certain fixed charge coverage ratio after giving effect to any such restricted payment. We do not believe that these restrictions impact our ability to meet our cash obligations. Over time, we expect those restrictions will be reduced to the extent that we are able to generate net income and/or certain types of cash inflows in future periods.
At December 31, 2015, we were in compliance with all of our covenants.
Contractual Obligations
The following table presents our contractual obligations at December 31, 2015 (in millions):
Payments due by period | |||||||||||||||||||
Total | Less than 1 year | 1-3 years | 3-5 years | More than 5 years | |||||||||||||||
Debt:(1) | |||||||||||||||||||
Principal(2) | $ | 2,008.2 | $ | 54.8 | $ | 169.7 | $ | 762.2 | $ | 1,021.5 | |||||||||
Interest | 381.7 | 78.1 | 133.1 | 120.0 | 50.5 | ||||||||||||||
Operating leases | 143.3 | 29.9 | 45.7 | 29.6 | 38.1 | ||||||||||||||
Purchase obligations(3) | 265.8 | 86.0 | 179.8 | — | — | ||||||||||||||
Other liabilities: | |||||||||||||||||||
Underfunded pension obligations(4) | 80.1 | 2.1 | 4.3 | 4.8 | 68.9 | ||||||||||||||
Due to VWR Holdings — ITRA(5) | 163.1 | 78.1 | 85.0 | — | — | ||||||||||||||
Total | $ | 3,042.2 | $ | 329.0 | $ | 617.6 | $ | 916.6 | $ | 1,179.0 | |||||||||
(1) | Includes capital lease obligations, which were not material. To calculate payments due for principal and interest, we assumed that variable interest rates, foreign currency exchange rates and outstanding borrowings under credit facilities were unchanged from December 31, 2015 through maturity. |
(2) | Our senior credit facility would require us to accelerate our principal repayments should we generate excess cash flows, as defined, in future periods. |
37
(3) | Purchase obligations for inventory are made in the normal course of business to meet operating needs. |
(4) | The amounts in the table reflect estimated cash payments to be made by us over the next five years and thereafter with respect to certain underfunded pension obligations of our non-U.S. defined benefit plans. See Note 15 to our consolidated financial statements beginning on page F-1 of this report. |
(5) | In March 2016, $78.1 million will be paid to VWR Holdings under the ITRA. The timing and estimated amount of all other payments under the ITRA are not certain. For purposes of inclusion in the table above, we have estimated the timing of payments based on our expectations of when we might realize the benefits of our net operating loss carryforwards, if ever. However, our estimates may not be accurate, and such payments could occur later than depicted in the table. For more information about the ITRA, see Note 20 to our consolidated financial statements beginning on page F-1 of this report. |
Deferred income tax liabilities of $459.5 million at December 31, 2015 are not included in the table above because they do not have a direct connection with the amount of cash taxes to be paid in any future periods and do not relate to liquidity needs. In addition, we have excluded uncertain tax liabilities of $62.2 million at December 31, 2015 due to the uncertainty of the period of payment. In addition, we do not provide for deferred income tax liabilities or foreign withholding taxes on $789.8 million of cumulative undistributed earnings of our foreign subsidiaries as of December 31, 2015, as we consider these earnings to be permanently reinvested. We believe that cash flows generated by our domestic operations and availability under our credit facilities will be sufficient to allow us to satisfy our domestic liquidity requirements, including mandatory principal and interest payments.
The employment agreements with our executive officers include provisions for the payment of severance and continuing health benefits following termination without cause or resignation for good reason, as those terms are defined in the employment agreements. The aggregate of potential payments for all executive offers under these provisions was $10.4 million as of December 31, 2015.
Other Uses of Cash
Since June 2007, we have completed 41 business acquisitions. We funded these acquisitions through a combination of cash and cash equivalents on hand and incremental borrowings under our credit facilities. The funding of an acquisition immediately causes our net leverage to increase. Acquisitions of businesses, net of cash acquired and a business disposition in 2014, used cash of $59.1 million, $89.9 million and $44.4 million for the years ended December 31, 2015, 2014 and 2013, respectively.
Most of our capital expenditures are discretionary and for the purpose of maintaining and improving our facilities, infrastructure and information technology. Capital expenditures were $40.9 million, $33.6 million and $45.3 million for the years ended December 31, 2015, 2014 and 2013, respectively. We plan to continue making investments in our business to support our strategy of continued growth.
Working capital impacts our liquidity and capital resources because changes in working capital directly impact our operating cash flows, and our trade accounts receivable balance affects the amount of credit available to us under our A/R Facility. Working capital amounts can vary from period to period based on the short-term needs of our business. Additional information about changes in working capital balances are provided in the section entitled “Historical Cash Flows.”
Historical Cash Flows
The following table presents a summary of historical cash flows (in millions):
Year ended December 31, | |||||||||||
2015 | 2014 | 2013 | |||||||||
Working capital changes, net | $ | (86.6 | ) | $ | (47.1 | ) | $ | 30.7 | |||
Other operating activities | 311.6 | 238.2 | 170.2 | ||||||||
Cash flows from operating activities | 225.0 | 191.1 | 200.9 | ||||||||
Cash flows from investing activities | (97.9 | ) | (123.0 | ) | (89.5 | ) | |||||
Cash flows from financing activities | (96.1 | ) | (71.8 | ) | (117.9 | ) | |||||
Free Cash Flow | 184.1 | 157.5 | 155.6 | ||||||||
38
Historical Cash Flows — Year Ended December 31, 2015
Operating Activities
Net cash provided by operating activities was $225.0 million, which consisted of working capital changes that used net cash of $86.6 million and other operating activities that provided net cash of $311.6 million.
Net cash used for working capital changes included changes in trade accounts receivable, which used cash of $30.2 million due primarily to organic net sales growth. Inventories and accounts payable each increased, following the organic net sales growth, and together used net cash of $18.7 million reflecting a greater stock of private label products and chemicals, the continuation of a global initiative to expand our product offerings and improve customer service levels. Changes to other assets and liabilities used cash of $37.7 million due primarily to year-over-year decreases to employee compensation accruals and changes to the timing of interest payments for our refinanced debt.
Net cash provided by other operating activities was primarily attributable to our Adjusted EBITDA of $456.0 million, partially offset by cash paid for interest of $104.9 million and net cash paid for income taxes of $48.0 million.
Investing Activities
Net cash used in investing activities was $97.9 million. We paid net cash of $59.1 million to acquire four businesses. Capital expenditures were $40.9 million, an increase of $7.3 million compared to 2014 reflecting new investments in custom manufacturing capabilities and capacity.
Financing Activities
Net cash used in financing activities was $96.1 million. We paid debt issuance costs and a redemption premium of $41.9 million in connection with our debt refinancing, repaid net $43.2 million of debt and paid of $9.8 million to VWR Holdings under the ITRA.
Historical Cash Flows — Year Ended December 31, 2014
Operating Activities
Net cash provided by operating activities was $191.1 million, which consisted of working capital changes that used net cash of $47.1 million and other operating activities that provided net cash of $238.2 million.
Net cash used for working capital changes consisted primarily of changes in trade accounts receivable, which used cash of $30.1 million due primarily to organic net sales growth. Inventories and accounts payable each increased, following the growth in net sales, and together used net cash of $14.0 million reflecting a greater stock of private label products and chemicals, part of a global initiative to improve customer service levels.
Net cash provided by other operating activities was primarily attributable to our Adjusted EBITDA of $449.4 million, partially offset by cash paid for interest of $158.9 million and net cash paid for income taxes of $39.3 million.
Investing Activities
Net cash used in investing activities was $123.0 million. We paid cash of $89.9 million to acquire four businesses, net of acquired cash and a business disposal, compared to seven businesses in 2013. Capital expenditures were $33.6 million, a decrease of $11.7 million compared to 2013 when we invested in our Bruchal, Germany distribution facility.
Financing Activities
Net cash used in financing activities was $71.8 million. We used net proceeds from our IPO of $582.6 million to pay stock issuance costs of $4.8 million and to substantially fund net debt repayments of $611.6 million. We also paid a $25.0 million dividend to VWR Holdings and repurchased $8.9 million of redeemable equity.
39
Historical Cash Flows — Year Ended December 31, 2013
Operating Activities
Net cash provided by operating activities was $200.9 million, which consisted of working capital changes that provided net cash of $30.7 million and other operating activities that provided net cash of $170.2 million.
Net cash provided by working capital changes consisted primarily of changes in trade accounts receivable, which provided cash of $25.9 million due to a decrease in organic net sales and favorable collection efforts, partially offset by an increasing demand for extended payment terms by our customers.
Net cash provided by other operating activities was primarily attributable to our Adjusted EBITDA of $418.5 million, partially offset by cash paid for interest of $186.5 million and net cash paid for income taxes of $37.3 million.
Investing Activities
Net cash used in investing activities was $89.5 million. We paid net cash of $44.4 million to acquire seven businesses. Capital expenditures of $45.3 million included an investment in our Bruchal, Germany distribution facility.
Financing Activities
Net cash used in financing activities was $117.9 million and was primarily attributable to net payments under our multi-currency revolving loan facility and repurchases of redeemable equity.
Free Cash Flow
Free Cash Flow was $184.1 million, $157.5 million and $155.6 million for the years ended December 31, 2015, 2014 and 2013, respectively, reflecting the net cash provided by operating activities and the capital expenditures described above.
Critical Accounting Policies and Estimates
The preparation of consolidated financial statements in conformity with GAAP requires us to make estimates and assumptions that affect reported amounts throughout the consolidated financial statements and notes thereto. Those estimates and assumptions are based on our best estimates and judgment. We evaluate our estimates and assumptions on an ongoing basis using historical experience and known facts and circumstances, including the current economic environment. Unfavorable global economic conditions, when present, increase the uncertainty inherent in such estimates and assumptions. We adjust our estimates and assumptions when we believe the facts and circumstances warrant an adjustment. As future events and their effects cannot be determined with precision, actual results could differ significantly from those estimates.
The policies and estimates discussed below are considered by management to be critical to an understanding of our consolidated financial statements because their application places the most significant demands on management’s judgment. Specific risks for these critical accounting policies are described in the following paragraphs. For all of these policies, we caution that future events rarely develop exactly as forecast, and such estimates routinely require adjustment. We have reviewed these critical accounting policies and estimates and related disclosures with our Audit Committee.
Our discussion of critical accounting policies and estimates is intended to supplement, not duplicate, our summary of significant accounting policies so that readers will have greater insight into the uncertainties involved in applying our critical accounting policies and estimates. For a summary of our significant accounting policies, see Note 2 to our consolidated financial statements beginning on page F-1 of this report.
40
Testing Goodwill and Other Intangible Assets for Impairment
As a result of the 2007 merger, and to a lesser extent our subsequent acquisition of businesses, we carry significant amounts of goodwill and other intangible assets on our consolidated balance sheets. At December 31, 2015, the combined carrying value of goodwill and other intangible assets, net of accumulated amortization and accumulated impairment charges, was $3,247.0 million, representing 68% of our total assets. We believe that testing goodwill and other intangible assets for impairment represents a critical accounting policy because of the significant judgments and estimates that we must make to estimate the fair value of our reporting units and other intangible assets, especially in determining the assumptions used in those estimates such as projected future earnings, applicable discount rates, the selection of peer earnings multiples and the relative weighting of different value indicators.
The following table presents information about impairment testing we performed during the year ended December 31, 2015 (in millions):
Testing date | Reason | Carrying value | Excess (shortfall) of fair value over carrying value | |||||||
Reporting units: | ||||||||||
Americas | October 1, 2015 | Required annual assessment | $ | 2,150.0 | over $800 | |||||
EMEA-APAC | ” ” | ” ” | 1,292.0 | over $1,000 | ||||||
Indefinite-lived intangible assets: | ||||||||||
VWR tradename | October 1, 2015 | Required annual assessment | 611.7 | over $200 | ||||||
Other | ” ” | ” ” | 15.4 | 3.8 | ||||||
Amortizable intangible asset of business in EMEA-APAC | September 30, 2015 | Impairment indicator | 3.2 | (3.2 | ) | |||||
Required Annual Assessment
On October 1 of each year, we perform annual impairment testing of our goodwill and indefinite-lived intangible assets. The impairment testing requires us to estimate the fair value of our reporting units and our indefinite-lived intangible assets, which require significant judgment from management. The most significant fair value measurements are as follows:
• | The fair value of goodwill depends upon estimating the fair value of a reporting unit. We estimate the fair value of each reporting unit using both an income approach (a discounted cash flow technique) and market approaches (a market multiple technique and a market reference technique). These valuation methods require management to make various assumptions, including, but not limited to, assumptions related to future profitability, cash flows, discount rates, weighing of techniques as well as valuation multiples derived from comparable publicly traded companies that are applied to operating performance of the reporting unit. |
• | The fair value of indefinite-lived intangible assets is determined using an income approach (a discounted cash flow technique), which incorporates an estimated royalty rate and discount rate, among other estimates, applicable to trademarks and tradenames. |
Our estimates are based upon historical trends, management’s knowledge and experience and overall economic factors, including projections of future earnings potential. Developing future discounted cash flows in applying the income approach requires us to evaluate our intermediate to longer-term strategies, including, but not limited to, estimates about net sales growth, operating margins, capital requirements, inflation and working capital management. The development of appropriate rates to discount the estimated future cash flows requires the selection of risk premiums, which can materially impact the present value of future cash flows. Selection of an appropriate peer group under the market approach involves judgment, and an alternative selection of guideline companies could yield materially different market multiples. Weighing the different value indications involves judgment about the usefulness and comparability to the reporting unit.
As discussed further in “Results of Operations” above, we experienced growth across our business in 2015 and experienced a number of favorable trends in our business, which generally caused us to increase the projected cash flows of our reporting units resulting in increases to the fair value of our goodwill and indefinite-lived intangible assets compared to prior periods. However, future changes in our estimates or judgments could reduce our fair value measurements, which could in turn result in an impairment charge. For example, our expected net sales, cash flow growth or market conditions could be adversely affected due to, among other things, negative macroeconomic or industry-specific factors. For example, in 2011 and 2010, we recognized impairment charges of $3.3 million and $48.1 million resulting primarily from factors specific to the science education industry, while in 2008, we recognized impairment charges of $392.1 million related primarily to macroeconomic factors. We could also experience adverse changes in market factors such as discount rates, valuation multiples derived from comparable publicly-traded companies, a decline in the trading price of our common stock or control premiums derived from market transactions.
41
Indicators of Impairment
We have acquired 41 businesses since June 2007. Following their recognition in business combinations, we are required to monitor goodwill and other long-lived assets for possible indicators of impairment. If identified, we are required to perform impairment testing, which may require us to estimate the fair value of those assets. Estimating fair value requires management to exercise considerable judgment.
Based on a review of financial performance in September 2015, we decreased our forecast of the profitability of a business in our EMEA-APAC segment. We considered this to be an indicator of impairment and performed impairment testing on the asset group, recording impairment charges of $3.2 million primarily related to an amortizable intangible asset for year ended December 31, 2015. A similar scenario led to an impairment charge in 2013, which was included in the restructuring charge for that year. See Note 9 for more information about fair value measurements. Should we identify other indicators of impairment related to long-lived assets in future periods, we may be required to recognize additional impairment charges.
Estimating Valuation Allowances on Deferred Tax Assets
We are required to estimate the degree to which tax assets and loss carryforwards will result in a future income tax benefit, based on our expectations of future profitability by tax jurisdiction. We provide a valuation allowance for deferred tax assets, consisting primarily of net operating loss carryforwards, that we believe will more likely than not go unused. If it becomes more likely than not that a deferred tax asset will be realized, we reverse the related valuation allowance and recognize an income tax benefit for the amount of the reversal. At December 31, 2015, our valuation allowance on deferred tax assets was $102.5 million, almost all of which was applicable to our foreign operations.
We must make assumptions, judgments and estimates to estimate the amount of valuation allowance to be recorded against our deferred tax assets, which take into account current tax laws and estimates of the amount of future taxable income, if any. Changes to any of the assumptions, judgments and estimates could cause our actual income tax obligations to differ from our estimates.
Accounting for Uncertain Tax Positions and Other Tax Uncertainties
In the ordinary course of business, there is inherent uncertainty in quantifying our income tax positions. We assess income tax positions for all years subject to examination based upon our evaluation of the facts, circumstances and information available at the reporting date. For those tax positions where it is more likely than not that a tax benefit will be sustained, we have recorded the largest amount of tax benefit with a greater than 50% likelihood of being realized upon ultimate settlement with a taxing authority assumed to have full knowledge of all relevant information. For those income tax positions where it is not more likely than not that a tax benefit will be sustained, no tax benefit has been recognized in the financial statements. Our reserve for uncertain tax positions was $62.2 million at December 31, 2015, exclusive of penalties and interest. Where applicable, associated interest expense has also been recognized as a component of the provision for income taxes.
We operate in numerous countries under many legal forms and, as a result, we are subject to the jurisdiction of numerous domestic and non-U.S. tax authorities, as well as to tax agreements and treaties among these governments. Determination of taxable income in any jurisdiction requires the interpretation of the related tax laws and regulations and the use of estimates and assumptions regarding significant future events, such as the amount, timing and character of deductions and the sources and character of income and tax credits. Changes in tax laws, regulations, agreements and treaties, currency exchange restrictions or our level of operations or profitability in each taxing jurisdiction could have an impact upon the amount of current and deferred tax balances and hence our net income.
We file tax returns in each tax jurisdiction that requires us to do so. Should tax return positions not be sustained upon audit, we could be required to record an income tax provision. Should previously unrecognized tax benefits ultimately be sustained, we could be required to record an income tax benefit.
Accounting for Defined Benefit Plans
We have defined benefit pension plans covering a significant number of domestic and international employees. Accounting for these plans requires the use of a number of assumptions, including estimates on the expected long-term rate of return on assets, discount rates and the average rate of increase in employee compensation. In order to make informed assumptions, management consults with actuaries and reviews public market data and general economic information. We periodically assess these assumptions based on market conditions, and if those conditions change, our pension cost and pension obligation may be adjusted accordingly. See Note 15 to our consolidated financial statements beginning on page F-1 of this report for more information about our defined benefit plans.
42
In accordance with GAAP, changes to the assumptions used in measuring defined benefit plans are generally accumulated and amortized over future periods, and therefore affect expense ratably over a number of future periods. A 100 basis point increase or decrease in the discount rate assumption or the expected return on plan assets would not have a material impact on our consolidated financial statements for any single period.
Other Accounting Policies and Estimates
In addition to the critical accounting policies and estimates noted above, we are required to make estimates and assumptions in certain other accounting areas including: (i) our reserve against trade accounts receivable, which represents our estimate of the amounts that will not be collected from customers and for estimated sales returns and allowances; (ii) estimating the net realizable value of our inventories, which if less than the cost of inventories would require us to establish an inventory obsolescence reserve; and (iii) estimating the value of price incentives due from our suppliers and due to our customers, which may depend upon achieving future targets in areas such as sales growth or purchasing volume. Although these policies and estimates could potentially have a material impact on our consolidated results of operations, we are not currently aware of any reasonably likely changes to our estimates and assumptions that would have a material effect on our consolidated financial statements.
New Accounting Standards
For information about new accounting standards, see Note 3 to our consolidated financial statements beginning on page F-1 of this report.
Off-Balance Sheet Arrangements
We are not involved in any off-balance sheet arrangements that have or are reasonably likely to have a material current or future effect on our financial condition, revenues or expenses, results of operations, liquidity, capital expenditures or capital resources.
Item 7A. | Quantitative and Qualitative Disclosures about Market Risk |
Foreign Currency Exchange Rate Risk
While we report our consolidated financial statements in U.S. dollars, a significant portion of the underlying operations are denominated in foreign currencies, principally the euro, the British pound sterling, the Canadian dollar and the Swiss franc. Changes to foreign currency exchange rates expose us to the risk of (i) changes to the value of our net investment in foreign operations; (ii) changes to our earnings from the remeasurement of foreign-denominated operating and financing activities; (iii) changes to earnings from the translation of our foreign operations into U.S. dollars; and (iv) changes to the reported value of our cash and cash equivalents.
Our net investment in foreign operations is sensitive to fluctuations in currency exchange rates. For example, during times of a strengthening U.S. dollar, the net assets of our foreign operations will translate into fewer U.S. dollars, causing us to report less net assets on our consolidated balance sheet. During 2015, we designated €370.0 million of our term loan B facility and all €503.8 million of our 4.625% senior notes as hedges to protect a portion of our net investment from the impact of changes in the euro to U.S. dollar exchange rate. At December 31, 2015, a 10% increase to the value of the U.S. dollar compared to all other foreign currencies would have caused our stockholders’ equity to decrease by $15.2 million.
We enter into short-term foreign-denominated operating activities, such as inventory purchases, in the ordinary course of business. Some of our subsidiaries hedge these transactions using foreign currency forward contracts. These activities do not expose us to material foreign currency exchange risks.
We have a significant amount of foreign-denominated debt and to a lesser degree intercompany financing arrangements that must be remeasured into the functional currencies of the applicable subsidiaries. As noted above, in 2015 a substantial portion of our euro-denominated debt was designated as a hedge of our net investment in foreign operations. As a result, we have reduced our exposure to changes in our earnings from the remeasurement of these instruments. At December 31, 2015, a 10% decrease to the value of the U.S. dollar compared to all other foreign currencies would have decreased our income before income taxes by $1.0 million.
Changes to foreign currency exchange rates could favorably or unfavorably affect our operating results. For example, during times of a strengthening U.S. dollar, our reported international sales and earnings will be reduced because local currencies will translate into fewer U.S. dollars. A 10% increase to the value of the U.S. dollar compared to all other foreign currencies would have decreased our reported operating income for the year ended December 31, 2015 by $11.5 million.
Most of our cash and cash equivalents are denominated in foreign currencies. At December 31, 2015, a 10% increase in the value of U.S. dollar compared to all other foreign currencies would have caused our cash and cash equivalents to decrease by $12.5 million.
43
Interest Rate Risk
We carry a significant amount of debt that exposes us to interest rate risk. The majority of our debt consists of variable-rate instruments. We have also issued fixed-rate senior notes. None of our other financial instruments are subject to material interest rate risk.
Our credit facilities, including our term loan facilities, bear interest at variables rates based on prevailing LIBOR and EURIBOR rates. For these instruments, changes to market interest rates affect both the amount of cash we pay for interest and our reported interest expense, except that our term loan B facility is subject to a minimum EURIBOR rate of 0.75%. At December 31, 2015, a 100 basis point increase to the applicable variable rate of interest would have increased the amount of cash paid for interest and interest expense by $9.7 million per annum.
Our 4.625% senior notes bear interest at a fixed rate. The fair value of fixed-rate debt increases if interest rates fall and decreases if interest rates rise. At December 31, 2015, a 100 basis point decrease in the market rate of interest for the 4.625% senior notes would have increased their fair value by $29.7 million.
Item 8. | Financial Statements and Supplementary Data |
The information required by this item is presented at the end of this report beginning on page F-1 of this report.
Item 9. | Changes in and Disagreements with Accountants on Accounting and Financial Disclosure |
None.
Item 9A. | Controls and Procedures |
Management’s Evaluation of Disclosure Controls and Procedures
Our management, with the participation of our Chief Executive Officer and Chief Financial Officer, evaluated the effectiveness of our disclosure controls and procedures (as defined in Exchange Act Rules 13a-15(e) and 15d-15(e)) as of December 31, 2015. Based on this evaluation, our Chief Executive Officer and Chief Financial Officer concluded that, as of December 31, 2015, our disclosure controls and procedures were effective in providing reasonable assurance that information required to be disclosed by us in the reports that we file or submit under the Exchange Act is recorded, processed, summarized, reported and accumulated and communicated to our management, including our Chief Executive Officer and Chief Financial Officer, as appropriate to allow timely decisions regarding required disclosure.
Management’s Annual Report on Internal Control Over Financial Reporting
Our management, including our Chief Executive Officer and Chief Financial Officer, is responsible for establishing and maintaining adequate internal control over our financial reporting (as defined in Exchange Act Rules 13a-15(f) and 15d-15(f)). Internal control over financial reporting is a process designed to provide reasonable assurance regarding the reliability of financial reporting and the preparation of financial statements for external purposes in accordance with generally accepted accounting principles. Our management conducted an assessment of the effectiveness of our internal control over financial reporting as of December 31, 2015, based on criteria established in Internal Control — Integrated Framework (2013) issued by the Committee of Sponsoring Organizations of the Treadway Commission. Based on this assessment, management concluded that, as of December 31, 2015, our internal control over financial reporting was effective.
Our independent registered public accounting firm, KPMG LLP, has audited the effectiveness of our internal control over financial reporting, as stated in their report on the next page.
Changes in Internal Control over Financial Reporting
There have been no changes in our internal control over financial reporting (as defined in Exchange Act Rules 13a-15(f) and 15d-15(f)) during the fiscal quarter ended December 31, 2015, that have materially affected or are reasonably likely to materially affect our internal control over financial reporting.
44
Report of Independent Registered Public Accounting Firm
The Board of Directors and Stockholders
VWR Corporation:
We have audited VWR Corporation’s internal control over financial reporting as of December 31, 2015, based on criteria established in Internal Control — Integrated Framework (2013) issued by the Committee of Sponsoring Organizations of the Treadway Commission (COSO). VWR Corporation’s management is responsible for maintaining effective internal control over financial reporting and for its assessment of the effectiveness of internal control over financial reporting, included in the accompanying Management’s Annual Report on Internal Control Over Financial Reporting. Our responsibility is to express an opinion on the Company’s internal control over financial reporting based on our audit.
We conducted our audit in accordance with the standards of the Public Company Accounting Oversight Board (United States). Those standards require that we plan and perform the audit to obtain reasonable assurance about whether effective internal control over financial reporting was maintained in all material respects. Our audit included obtaining an understanding of internal control over financial reporting, assessing the risk that a material weakness exists, and testing and evaluating the design and operating effectiveness of internal control based on the assessed risk. Our audit also included performing such other procedures as we considered necessary in the circumstances. We believe that our audit provides a reasonable basis for our opinion.
A company’s internal control over financial reporting is a process designed to provide reasonable assurance regarding the reliability of financial reporting and the preparation of financial statements for external purposes in accordance with generally accepted accounting principles. A company’s internal control over financial reporting includes those policies and procedures that (1) pertain to the maintenance of records that, in reasonable detail, accurately and fairly reflect the transactions and dispositions of the assets of the company; (2) provide reasonable assurance that transactions are recorded as necessary to permit preparation of financial statements in accordance with generally accepted accounting principles, and that receipts and expenditures of the company are being made only in accordance with authorizations of management and directors of the company; and (3) provide reasonable assurance regarding prevention or timely detection of unauthorized acquisition, use, or disposition of the company’s assets that could have a material effect on the financial statements.
Because of its inherent limitations, internal control over financial reporting may not prevent or detect misstatements. Also, projections of any evaluation of effectiveness to future periods are subject to the risk that controls may become inadequate because of changes in conditions, or that the degree of compliance with the policies or procedures may deteriorate.
In our opinion, VWR Corporation maintained, in all material respects, effective internal control over financial reporting as of December 31, 2015, based on criteria established in Internal Control — Integrated Framework (2013) issued by the Committee of Sponsoring Organizations of the Treadway Commission (COSO).
We also have audited, in accordance with the standards of the Public Company Accounting Oversight Board (United States), the consolidated balance sheets of VWR Corporation and subsidiaries as of December 31, 2015 and 2014, and the related consolidated statements of operations, comprehensive income or loss, redeemable equity and stockholders’ equity and cash flows for each of the years in the three-year period ended December 31, 2015, and our report dated February 25, 2016 expressed an unqualified opinion on those consolidated financial statements.
/s/ KPMG LLP
Philadelphia, Pennsylvania
February 25, 2016
45
Item 9B. | Other Information |
None.
PART III
Item 10. | Directors, Executive Officers and Corporate Governance |
See Part I, “Executive Officers” for information about our executive officers, which is incorporated by reference herein.
Other information required under this item is incorporated herein by reference to our definitive proxy statement for our 2016 annual meeting of stockholders.
Item 11. | Executive Compensation |
The information required under this item is incorporated herein by reference to our definitive proxy statement for our 2016 annual meeting of stockholders.
Item 12. | Security Ownership of Certain Beneficial Owners and Management and Related Stockholder Matters |
The information required under this item is incorporated herein by reference to our definitive proxy statement for our 2016 annual meeting of stockholders.
Item 13. | Certain Relationships and Related Transactions, and Director Independence |
The information required under this item is incorporated herein by reference to our definitive proxy statement for our 2016 annual meeting of stockholders.
Item 14. | Principal Accounting Fees and Services |
The information required under this item is incorporated herein by reference to our definitive proxy statement for our 2016 annual meeting of stockholders.
PART IV
Item 15. | Exhibits and Financial Statement Schedules |
(a) | The following documents are filed as part of this report: |
1. | Financial statements: |
Page | ||
2. | Financial statement schedules: |
• | Schedule I, “Condensed financial information of registrant,” is included in Note 24 to the consolidated financial statements beginning on page F-1 of this report. |
• | Schedule II, “Valuation and qualifying accounts,” is included in Note 25 to the consolidated financial statements beginning on page F-1 of this report. |
3. | Exhibits: see the Exhibit Index beginning on page E-1 of this report. |
46
SIGNATURES
Pursuant to the requirements of Section 13 or 15(d) of the Securities Exchange Act of 1934, the registrant has duly caused this report to be signed on its behalf by the undersigned, thereunto duly authorized.
VWR Corporation | |||
Date: February 25, 2016 | By: | /s/ Douglas J. Pitts | |
Name: | Douglas J. Pitts | ||
Title: | Vice President and Corporate Controller (Chief Accounting Officer and Duly Authorized Officer) | ||
Pursuant to the requirements of the Securities Exchange Act of 1934, this report has been signed below by the following persons on behalf of the registrant and in the capacities and on the dates indicated.
/s/ Manuel Brocke-Benz | Director, President and Chief Executive Officer | February 25, 2016 | ||
Manuel Brocke-Benz | ||||
/s/ Gregory L. Cowan | Senior Vice President and Chief Financial Officer | February 25, 2016 | ||
Gregory L. Cowan | ||||
/s/ Douglas J. Pitts | Vice President and Corporate Controller | February 25, 2016 | ||
Douglas J. Pitts | ||||
Directors:
Nicholas W. Alexos | Thompson Dean |
Robert L. Barchi | Pamela Forbes Lieberman |
Edward A. Blechschmidt | Harry M. Jansen Kraemer, Jr. |
Robert P. DeCresce | Timothy P. Sullivan |
Carlos del Salto | Robert J. Zollars |
By George Van Kula pursuant to a Power of Attorney executed by the directors listed above, which Power of Attorney has been filed as an exhibit hereto.
/s/ George Van Kula |
George Van Kula, Attorney in fact |
February 25, 2016 |
47
EXHIBIT INDEX
Exhibit No. | Exhibit Description(1) | Location of Exhibits(2) | ||||||||
Form | Exhibit No. | Filing Date | Filer | |||||||
2.1 | Agreement and Plan of Merger, dated May 2, 2007, among Varietal Distribution Holdings, LLC, Varietal Distribution Merger Sub, Inc., and VWR Funding, Inc. (formerly CDRV Investors, Inc.) | 10-Q | 10.1(a) | 8/14/2007 | VWRF | |||||
2.2 | First Amendment to said Merger Agreement, dated May 7, 2007 | 10-Q | 10.1(b) | 8/14/2007 | VWRF | |||||
2.3 | Second Amendment to said Merger Agreement, dated May 7, 2007 | 10-Q | 10.1(c) | 8/14/2007 | VWRF | |||||
3.1 | Amended and Restated Certificate of Incorporation of VWR Corporation | 8-K | 3.1 | 10/7/2014 | VWRC | |||||
3.2 | Amended and Restated Bylaws | 8-K | 3.2 | 10/7/2014 | VWRC | |||||
4.1 | Indenture dated as of March 25, 2015, among VWR Funding, Inc., the guarantors party thereto, Law Debenture Trust Company of New York, as trustee, Deutsche Bank AG, London Branch, as paying agent and Deutsche Bank Luxembourg S.A., as registrar and transfer agent. | 8-K | 4.1 | 3/25/2015 | VWRC | |||||
4.2 | Exchange and Registration Rights Agreement, dated as of September 4, 2012, among VWR Funding, Inc., the Guarantors from time to time parties thereto, and the Purchasers named therein | 8-K | 4.3 | 9/5/2012 | VWRF | |||||
4.3 | Form of stock certificate | S-1/A | 4.6 | 9/17/2014 | VWRC | |||||
10.1+ | Varietal Distribution Holdings, LLC 2007 Securities Purchase Plan | 10-Q | 10.3(a) | 4/5/2012 | VWRF | |||||
10.2+ | Varietal Distribution Holdings, LLC 2007 Securities Purchase Plan, as amended | 8-K | 10.1 | 4/4/2012 | VWRF | |||||
10.3+ | Varietal Distribution Holdings, LLC 2007 Securities Purchase Plan, as amended | 8-K | 10.1 | 1/2/2013 | VWRF | |||||
10.4+ | Varietal Distribution Holdings, LLC 2007 Securities Purchase Plan, as amended | 8-K | 10.1 | 12/17/2013 | VWRF | |||||
10.5+ | Varietal Distribution Holdings, LLC 2007 Securities Purchase Plan, as amended | 10-K | 10.2(e) | 3/3/2014 | VWRF | |||||
10.6+ | Limited Liability Company Agreement, dated June 29, 2007, among Varietal Distribution Holdings, LLC and the unitholders named therein from time to time | 10-Q | 10.3(b) | 8/14/2007 | VWRF | |||||
10.7+ | Amendment to Limited Liability Company Agreement dated January 1, 2016 | filed herewith | ||||||||
10.8+ | Securityholders Agreement, dated June 29, 2007, among Varietal Distribution Holdings, LLC and the other parties named therein from time to time | 10-Q | 10.3(c) | 8/14/2007 | VWRF | |||||
10.9+ | Form of Management Unit Purchase Agreement | 10-Q | 10.3(d) | 8/14/2007 | VWRF | |||||
10.10+ | Form of Incentive Unit Grant Agreement | 8-K | 10.2 | 4/5/2012 | VWRF | |||||
10.11+ | Form of Time-Based Incentive Unit Grant Agreement | 8-K | 10.2 | 1/2/2013 | VWRF | |||||
10.12+ | Form of Incentive Program Unit Grant Agreement | 8-K | 10.1 | 4/4/2013 | VWRF | |||||
10.13+ | Form of Class A Common Management Unit Purchase Agreement | 8-K | 10.3 | 12/17/2013 | VWRF | |||||
10.14+ | Employment Letter, dated April 3, 2013, between Varietal Management Services GmbH and Manuel Brocke-Benz | 8-K | 10.2 | 4/4/2013 | VWRF | |||||
10.15+ | Management Unit Purchase Agreement, dated March 29, 2013, between Varietal Distribution Holdings, LLC and Manuel Brocke-Benz | 8-K | 10.3 | 4/4/2013 | VWRF | |||||
10.16+ | Amended and Restated Employment Letter, dated December 20, 2010, between VWR Management Services, LLC and Gregory L. Cowan | 10-K | 10.5 | 2/25/2011 | VWRF | |||||
E-1
Exhibit No. | Exhibit Description(1) | Location of Exhibits(2) | ||||||||
Form | Exhibit No. | Filing Date | Filer | |||||||
10.17+ | Amended and Restated Employment Letter, dated December 20, 2010, between VWR Management Services, LLC and George Van Kula | 10-K | 10.8 | 2/25/2011 | VWRF | |||||
10.18+ | Employment Letter, dated July 24, 2012 between VWR Management Services, LLC and Mark T. McLoughlin | 10-K | 10.8 | 3/3/2014 | VWRF | |||||
10.19+ | Amended and restated employment Letter, dated December 20, 2010, between VWR Management Services, LLC and Theodore C. Pulkownik | 10-K | 10.8 | 3/3/2014 | VWRF | |||||
10.20 | Credit Agreement, dated as of September 28, 2015, among VWR Funding Inc., each of the Foreign Subsidiary Borrowers from time to time party thereto, Citibank, N.A., as administrative agent and collateral agent for the Lenders, Citibank, N.A., Barclays Bank PLC, Goldman Sachs Bank USA, Merrill Lynch, Pierce, Fenner & Smith Incorporated, J.P. Morgan Securities LLC and PNC Capital Markets LLC, as joint lead arrangers, Barclays Bank PLC and Goldman Sachs Bank USA, as co-syndication agents, Mizuho Bank, Wells Fargo Bank, National Association and BBVA Compass, as co-documentation agents, Sumitomo Mitsui Banking Corporation, as senior managing agent, and TD Bank, N.A., as managing agent | 8-K | 10.1 | 9/30/2015 | VWRC | |||||
10.21 | Guarantee and Collateral Agreement, dated as of September 28, 2015, among VWR Corporation, VWR Funding Inc., the Subsidiaries from time to time party thereto, and Citibank, N.A., as collateral agent | 8-K | 10.1 | 9/30/2015 | VWRC | |||||
10.22+ | VWR International Nonqualified Deferred Compensation Plan, effective May 1, 2007 (“DC Plan”) | 10-Q | 10.1 | 5/14/2007 | VWRF | |||||
10.23+ | Amendment to DC Plan | 10-K | 10.9(b) | 3/12/2008 | VWRF | |||||
10.24+ | VWR International Nonqualified Deferred Compensation Plan Trust Agreement, dated as of, May 1, 2007 (“Trust Agreement”), between VWR International, Inc. and Wells Fargo, N.A. | 10-Q | 10.2 | 5/14/2007 | VWRF | |||||
10.25+ | Amendment to Trust Agreement | 10-K | 10.1(b) | 3/12/2008 | VWRF | |||||
10.26+ | VWR International Amended and Restated Retirement Plan (“Retirement Plan”) | 10-K | 10.11 | 3/2/2012 | VWRF | |||||
10.27+ | Amendment No. 1 to Retirement Plan | 10-K | 10.12(b) | 3/3/2014 | VWRF | |||||
10.28+ | Amendment No. 2 to Retirement Plan | 10-Q | 10.2 | 5/14/2014 | VWRF | |||||
10.29+ | Amendment No. 3 to Retirement Plan | 10-Q | 10.3 | 5/14/2014 | VWRF | |||||
10.30+ | Amendment No. 4 to Retirement Plan | 10-Q | 10.4 | 5/14/2014 | VWRF | |||||
10.31+ | Amendment No. 5 to Retirement Plan | 10-Q | 10.5 | 5/14/2014 | VWRF | |||||
10.32+ | VWR International, LLC Amended and Restated Supplemental Benefits Plan | 10-K | 10.12 | 3/30/2009 | VWRF | |||||
10.33+ | Board Compensation Policy | 10-K | 10.36 | 3/4/2015 | VWRC | |||||
10.34 | Receivables Purchase Agreement, dated November 4, 2011, among VWR Receivables Funding, LLC, VWR International, LLC, the various conduit purchasers from time to time party thereto, the various related committed purchasers from time to time party thereto, the various purchaser agents from time to time party thereto, the various LC participants from time to time party thereto and PNC Bank, National Association, as Administrator and LC Bank | 10-Q | 10.2 | 11/9/2011 | VWRF | |||||
E-2
Exhibit No. | Exhibit Description(1) | Location of Exhibits(2) | ||||||||
Form | Exhibit No. | Filing Date | Filer | |||||||
10.35 | Amendment No. 1 to Receivables Purchase Agreement, dated December 10, 2012, among VWR Receivables Funding, LLC, VWR International, LLC, PNC Bank, National Association, as Administrator, Purchaser Agent for the Market Street Purchaser Group and Related Committed Purchaser and Market Street Funding LLC, as Conduit Purchaser | 10-K | 10.16(b) | 3/5/2013 | VWRF | |||||
10.36 | Amendment No. 2 to Receivables Purchase Agreement, dated April 17, 2013, among VWR Receivables Funding, LLC, VWR International, LLC, PNC Bank, National Association, as Administrator, Purchase Agent for Market Street Purchaser Group, and Related Committed Purchaser and Market Street Funding, LLC, as Conduit Purchaser | 10-Q | 10.4 | 5/15/2013 | VWRF | |||||
10.37 | Amendment No. 3 to Receivables Purchase Agreement, dated June 4, 2013, among VWR Receivables Funding, LLC, VWR International, LLC, PNC Bank, National Association, as Administrator, Purchase Agent for Market Street Purchaser Group, and Related Committed Purchaser and Market Street Funding, LLC, as Conduit Purchaser | 10-Q | 10.1 | 8/9/2013 | VWRF | |||||
10.38 | Amendment No. 4 to Receivables Purchase Agreement, dated as of November 7, 2013, among VWR Receivables Funding, LLC, VWR International, LLC and PNC Bank, National Association, as Administrator, Related Committed Purchaser and Purchaser Agent for the Market Street Purchaser Group | 10-Q | 10.1 | 11/8/2013 | VWRF | |||||
10.39 | Amendment No. 5 to Receivables Purchase Agreement and Reaffirmation of Performance Guaranty, dated May 18, 2015, among VWR Receivables Funding, LLC, VWR International, LLC, PNC Bank, National Association, as Administrator, LC Bank, Related Commitment Purchaser and Purchaser Agent for the PNC Purchaser Group | 8-K | 10.1 | 5/19/2015 | VWRC | |||||
10.40 | Purchase and Sale Agreement, dated November 4, 2011, between the various entities listed on Schedule I thereto as Originators and VWR Receivables Funding, LLC | 10-Q | 10.3 | 11/9/2011 | VWRF | |||||
10.41 | Amendment No. 1 to Purchase and Sale Agreement between the various entities listed on Schedule I thereto as Originators and VWR Receivables Funding, LLC | 8-K | 10.2 | 5/19/2015 | VWRC | |||||
10.42+ | VWR Corporation 2014 Equity Incentive Plan | S-1/A | 10.46 | 9/17/2014 | VWRC | |||||
10.43+ | Form of Restricted Stock Agreement pursuant to the VWR Corporation 2014 Equity Incentive Plan | S-1/A | 10.47 | 9/17/2014 | VWRC | |||||
10.44+ | Form of Restricted Stock Unit Agreement pursuant to the VWR Corporation 2014 Equity Incentive Plan | S-1/A | 10.48 | 9/17/2014 | VWRC | |||||
10.45+ | Form of Stock Appreciation Rights Agreement pursuant to the VWR Corporation 2014 Equity Incentive Plan | S-1/A | 10.49 | 9/17/2014 | VWRC | |||||
10.46+ | Form of Incentive Stock Option Agreement pursuant to the VWR Corporation 2014 Equity Incentive Plan | S-1/A | 10.50 | 9/17/2014 | VWRC | |||||
10.47+ | Form of Nonqualified Stock Option Agreement pursuant to the VWR Corporation 2014 Equity Incentive Plan | S-1/A | 10.51 | 9/17/2014 | VWRC | |||||
10.48+ | Form of Nonqualified Stock Option Agreement pursuant to the VWR Corporation 2014 Incentive Compensation Plan for grants made at pricing of the IPO | S-1/A | 10.57 | 9/17/2014 | VWRC | |||||
10.49 | Form of Indemnification Agreement (between VWR Corporation and its directors and officers) | S-1/A | 10.52 | 9/17/2014 | VWRC | |||||
E-3
Exhibit No. | Exhibit Description(1) | Location of Exhibits(2) | ||||||||
Form | Exhibit No. | Filing Date | Filer | |||||||
10.50 | Director Nomination Agreement by and between VWR Corporation and Varietal Distribution Holdings, LLC | 8-K | 10.2 | 10/7/2014 | VWRC | |||||
10.51 | Registration Rights Agreement by and between VWR Corporation and Varietal Distribution Holdings, LLC | 8-K | 10.1 | 10/7/2014 | VWRC | |||||
10.52 | Income Tax Receivable Agreement by and between VWR Corporation and Varietal Distribution Holdings, LLC | 8-K | 10.3 | 10/7/2014 | VWRC | |||||
10.53+ | VWR Corporation Employee Stock Purchase Plan (“VWR ESPP”) | 10-K | 10.53 | 3/4/2015 | VWRC | |||||
10.54+ | Amendment No. 1 to VWR ESPP | 10-K | 10.54 | 3/4/2015 | VWRC | |||||
10.55+ | Amendment No.2 to VWR ESPP | S-8 | 4.2 | 4/20/2015 | VWRC | |||||
10.56+ | Appendix 1 to the VWR ESPP | 10-Q | 10.2 | 5/14/2015 | VWRC | |||||
10.57+ | Appendix 2 to the VWR ESPP | 10-Q | 10.3 | 5/14/2015 | VWRC | |||||
14 | Code of Ethics and Conduct | # | ||||||||
21.1 | List of subsidiaries of VWR Corporation | Filed herewith | ||||||||
23.1 | Consent of KPMG | Filed herewith | ||||||||
24 | Power of Attorney | Filed herewith | ||||||||
31.1 | Certification of Principal Executive Officer pursuant to Section 302 of the Sarbanes-Oxley Act of 2002 | Filed herewith | ||||||||
31.2 | Certification of Principal Financial Officer pursuant to Section 302 of the Sarbanes-Oxley Act of 2002 | Filed herewith | ||||||||
32.1 | Certification of Principal Executive Officer pursuant to 18 U.S.C. 1350 (Section 906 of the Sarbanes-Oxley Act of 2002) | Furnished herewith | ||||||||
32.2 | Certification of Principal Financial Officer pursuant to 18 U.S.C. 1350 (Section 906 of the Sarbanes-Oxley Act of 2002) | Furnished herewith | ||||||||
101.INS | XBRL Instance Document | Filed herewith | ||||||||
101.SCH | XBRL Taxonomy Extension Schema Document | Filed herewith | ||||||||
101.CAL | XBRL Taxonomy Calculation Linkbase Document | Filed herewith | ||||||||
101.LAB | XBRL Taxonomy Label Linkbase Document | Filed herewith | ||||||||
101.PRE | XBRL Taxonomy Presentation Linkbase Document | Filed herewith | ||||||||
101.DEF | XBRL Taxonomy Definition Linkbase Document | Filed herewith | ||||||||
(1) | VWR Investors, Inc. changed its name to VWR Corporation on June 19, 2014. As a result, all references to VWR Investors, Inc. in the agreements or documents listed above are to VWR Corporation. |
(2) | Exhibits denoted by the filer “VWRC” are incorporated by reference herein from the prior filing of such document with the SEC by VWR Corporation (Commission File No. 001-36673). Exhibits denoted by the filer “VWRF” are incorporated by reference herein from the prior filing of such document with the SEC by our wholly owned subsidiary, VWR Funding, Inc. (Commission File No. 333-124100). |
+ | Indicates exhibits that constitute management contracts or compensatory plans or arrangements. |
# | Our Code of Ethics and Conduct can be found on our website (www.vwr.com) by clicking on “Investor Relations Area,” “Corporate Governance” and then “VWR Corporation — Code of Ethics and Conduct.” |
E-4
VWR Corporation and Subsidiaries
Index to Consolidated Financial Statements
Page | |
F-1
Report of Independent Registered Public Accounting Firm
The Board of Directors and Stockholders
VWR Corporation:
We have audited the accompanying consolidated balance sheets of VWR Corporation and subsidiaries as of December 31, 2015 and 2014, and the related consolidated statements of operations, comprehensive income or loss, redeemable equity and stockholders’ equity and cash flows for each of the years in the three-year period ended December 31, 2015. These consolidated financial statements are the responsibility of the Company’s management. Our responsibility is to express an opinion on these consolidated financial statements based on our audits.
We conducted our audits in accordance with the standards of the Public Company Accounting Oversight Board (United States). Those standards require that we plan and perform the audit to obtain reasonable assurance about whether the financial statements are free of material misstatement. An audit includes examining, on a test basis, evidence supporting the amounts and disclosures in the financial statements. An audit also includes assessing the accounting principles used and significant estimates made by management, as well as evaluating the overall financial statement presentation. We believe that our audits provide a reasonable basis for our opinion.
In our opinion, the consolidated financial statements referred to above present fairly, in all material respects, the financial position of VWR Corporation and subsidiaries as of December 31, 2015 and 2014, and the results of their operations and their cash flows for each of the years in the three-year period ended December 31, 2015, in conformity with U.S. generally accepted accounting principles.
We also have audited, in accordance with the standards of the Public Company Accounting Oversight Board (United States), VWR Corporation’s internal control over financial reporting as of December 31, 2015, based on criteria established in the Internal Control — Integrated Framework (2013) issued by the Committee of Sponsoring Organizations of the Treadway Commission (COSO), and our report dated February 25, 2016 expressed an unqualified opinion on the effectiveness of the Company’s internal control over financial reporting.
/s/ KPMG LLP
Philadelphia, Pennsylvania
February 25, 2016
F-2
VWR Corporation and Subsidiaries
Consolidated Balance Sheets
(in millions, except per share data)
December 31, | |||||||
2015 | 2014 | ||||||
Assets | |||||||
Current assets: | |||||||
Cash and cash equivalents | $ | 136.3 | $ | 118.0 | |||
Trade accounts receivable, net of reserves of $12.0 and $12.2 | 583.2 | 583.5 | |||||
Other receivables | 56.6 | 62.1 | |||||
Inventories | 424.0 | 394.5 | |||||
Other current assets | 32.9 | 44.5 | |||||
Total current assets | 1,233.0 | 1,202.6 | |||||
Property and equipment, net | 228.2 | 231.5 | |||||
Goodwill | 1,791.4 | 1,853.6 | |||||
Other intangible assets, net | 1,455.6 | 1,594.9 | |||||
Other assets | 85.6 | 94.5 | |||||
Total assets | $ | 4,793.8 | $ | 4,977.1 | |||
Liabilities, Redeemable Equity and Stockholders’ Equity | |||||||
Current liabilities: | |||||||
Current portion of debt | $ | 92.8 | $ | 95.3 | |||
Accounts payable | 474.5 | 466.2 | |||||
Employee-related liabilities | 61.4 | 82.3 | |||||
Current amount due to VWR Holdings — ITRA | 78.1 | 9.8 | |||||
Other current liabilities | 112.3 | 132.5 | |||||
Total current liabilities | 819.1 | 786.1 | |||||
Debt, net of current portion | 1,896.2 | 2,004.9 | |||||
Amount due to VWR Holdings — ITRA, net of current portion | 85.0 | 163.1 | |||||
Deferred income tax liabilities | 459.5 | 462.2 | |||||
Other liabilities | 158.8 | 169.7 | |||||
Total liabilities | 3,418.6 | 3,586.0 | |||||
Commitments and contingencies (Note 10) | |||||||
Redeemable equity, at redemption value | 38.8 | 51.4 | |||||
Stockholders’ equity: | |||||||
Preferred stock, $0.01 par value; 50.0 shares authorized, no shares issued and outstanding | — | — | |||||
Common stock, $0.01 par value; 750.0 shares authorized, 131.4 shares issued and outstanding | 1.3 | 1.3 | |||||
Additional paid-in capital | 1,735.1 | 1,716.3 | |||||
Retained earnings (accumulated deficit) | 6.3 | (148.0 | ) | ||||
Accumulated other comprehensive loss | (406.3 | ) | (229.9 | ) | |||
Total stockholders’ equity | 1,336.4 | 1,339.7 | |||||
Total liabilities, redeemable equity and stockholders’ equity | $ | 4,793.8 | $ | 4,977.1 | |||
See accompanying notes to consolidated financial statements.
F-3
VWR Corporation and Subsidiaries
Consolidated Statements of Operations
(in millions, except per share data)
Year ended December 31, | |||||||||||
2015 | 2014 | 2013 | |||||||||
Net sales | $ | 4,318.8 | $ | 4,375.3 | $ | 4,187.8 | |||||
Cost of goods sold | 3,121.7 | 3,131.9 | 2,991.5 | ||||||||
Gross profit | 1,197.1 | 1,243.4 | 1,196.3 | ||||||||
Selling, general and administrative expenses | 876.9 | 925.5 | 942.3 | ||||||||
Operating income | 320.2 | 317.9 | 254.0 | ||||||||
Interest expense | (103.0 | ) | (167.2 | ) | (191.8 | ) | |||||
Interest income | 0.2 | 0.9 | 1.1 | ||||||||
Other income (expense), net | 45.4 | 90.9 | (38.8 | ) | |||||||
Loss on extinguishment of debt | (32.7 | ) | (5.1 | ) | (2.0 | ) | |||||
Income before income taxes | 230.1 | 237.4 | 22.5 | ||||||||
Income tax provision | (75.8 | ) | (84.8 | ) | (8.4 | ) | |||||
Net income | 154.3 | 152.6 | 14.1 | ||||||||
Accretion of dividends on redeemable convertible preferred stock | — | (29.4 | ) | (47.9 | ) | ||||||
Net income (loss) applicable to common stockholders | $ | 154.3 | $ | 123.2 | $ | (33.8 | ) | ||||
Earnings (loss) per share: | |||||||||||
Basic | $ | 1.17 | $ | 2.50 | $ | (338.00 | ) | ||||
Diluted | 1.17 | 2.49 | (338.00 | ) | |||||||
Weighted average shares outstanding: | |||||||||||
Basic | 131.4 | 49.3 | 0.1 | ||||||||
Diluted | 131.8 | 49.5 | 0.1 | ||||||||
VWR Corporation and Subsidiaries
Consolidated Statements of Comprehensive Income or Loss
(in millions)
Year ended December 31, | |||||||||||
2015 | 2014 | 2013 | |||||||||
Net income | $ | 154.3 | $ | 152.6 | $ | 14.1 | |||||
Other comprehensive (loss) income, net of income taxes: | |||||||||||
Foreign currency translation: | |||||||||||
Net unrealized (loss) gain arising during the period | (174.4 | ) | (204.2 | ) | 40.6 | ||||||
Derivative instruments: | |||||||||||
Net unrealized gain arising during the period | 3.0 | 0.7 | 2.6 | ||||||||
Reclassification of net (gain) loss into earnings | (0.7 | ) | 1.1 | (3.4 | ) | ||||||
Defined benefit plans: | |||||||||||
Net unrealized (loss) gain arising during the period | (7.0 | ) | (27.0 | ) | 10.6 | ||||||
Reclassification of net loss (gain) into earnings | 2.7 | (3.0 | ) | 1.5 | |||||||
Other comprehensive (loss) income | (176.4 | ) | (232.4 | ) | 51.9 | ||||||
Comprehensive (loss) income | $ | (22.1 | ) | $ | (79.8 | ) | $ | 66.0 | |||
See accompanying notes to consolidated financial statements.
F-4
VWR Corporation and Subsidiaries
Consolidated Statements of Redeemable Equity and Stockholders’ Equity
(in millions)
Redeemable equity, at redemption value | Stockholders’ equity | ||||||||||||||||||||||||||||||||||||
Convertible preferred stock | Equity units of parent | Total | Common stock | Additional paid-in capital | Retained earnings (accumulated deficit) | Accumulated other comprehensive income (loss) | Total | ||||||||||||||||||||||||||||||
Shares | Amount | Shares | Par value | ||||||||||||||||||||||||||||||||||
Balance at December 31, 2012 | 0.4 | $ | 586.5 | $ | 41.4 | $ | 627.9 | 0.1 | $ | — | $ | 770.2 | $ | (314.7 | ) | $ | (49.4 | ) | $ | 406.1 | |||||||||||||||||
Issuance of redeemable equity | — | 1.4 | — | 1.4 | — | — | — | — | — | — | |||||||||||||||||||||||||||
Redemption of redeemable equity | — | (6.3 | ) | (5.6 | ) | (11.9 | ) | — | — | 6.3 | — | — | 6.3 | ||||||||||||||||||||||||
Accretion of dividends | — | 47.9 | — | 47.9 | — | — | (47.9 | ) | — | — | (47.9 | ) | |||||||||||||||||||||||||
Share-based compensation expense | — | — | — | — | — | — | 0.6 | — | — | 0.6 | |||||||||||||||||||||||||||
Reclassifications to state redeemable equity at redemption value | — | — | 5.3 | 5.3 | — | — | (5.3 | ) | — | — | (5.3 | ) | |||||||||||||||||||||||||
Net income | — | — | — | — | — | — | — | 14.1 | — | 14.1 | |||||||||||||||||||||||||||
Other comprehensive income | — | — | — | — | — | — | — | — | 51.9 | 51.9 | |||||||||||||||||||||||||||
Balance at December 31, 2013 | 0.4 | 629.5 | 41.1 | 670.6 | 0.1 | — | 723.9 | (300.6 | ) | 2.5 | 425.8 | ||||||||||||||||||||||||||
Redemption of redeemable equity | — | (8.9 | ) | (2.6 | ) | (11.5 | ) | — | — | 4.1 | — | — | 4.1 | ||||||||||||||||||||||||
Accretion of dividends | — | 29.4 | — | 29.4 | — | — | (29.4 | ) | — | — | (29.4 | ) | |||||||||||||||||||||||||
Recapitalization: | |||||||||||||||||||||||||||||||||||||
Retirement of prior stock | (0.4 | ) | (650.0 | ) | — | (650.0 | ) | (0.1 | ) | — | (679.4 | ) | — | — | (679.4 | ) | |||||||||||||||||||||
Issuance of new stock | — | — | — | — | 102.0 | 1.0 | 1,328.4 | 1,329.4 | |||||||||||||||||||||||||||||
Payment of dividend to VWR Holdings | — | — | — | — | — | — | (25.0 | ) | — | — | (25.0 | ) | |||||||||||||||||||||||||
Recognition of amount due to VWR Holdings — ITRA | — | — | — | — | — | — | (172.9 | ) | — | — | (172.9 | ) | |||||||||||||||||||||||||
Issuance of common stock | — | — | — | — | 29.4 | 0.3 | 582.3 | — | — | 582.6 | |||||||||||||||||||||||||||
Payment of stock issuance costs | — | — | — | — | — | — | (4.8 | ) | — | — | (4.8 | ) | |||||||||||||||||||||||||
Share-based compensation expense | — | — | — | — | — | — | 2.0 | — | — | 2.0 | |||||||||||||||||||||||||||
Reclassifications to state redeemable equity at redemption value | — | — | 12.9 | 12.9 | — | — | (12.9 | ) | — | — | (12.9 | ) | |||||||||||||||||||||||||
Net income | — | — | — | — | — | — | — | 152.6 | — | 152.6 | |||||||||||||||||||||||||||
Other comprehensive loss | — | — | — | — | — | — | — | — | (232.4 | ) | (232.4 | ) | |||||||||||||||||||||||||
Balance at December 31, 2014 | — | — | 51.4 | 51.4 | 131.4 | 1.3 | 1,716.3 | (148.0 | ) | (229.9 | ) | 1,339.7 | |||||||||||||||||||||||||
Share-based compensation expense | — | — | — | — | — | — | 4.9 | — | — | 4.9 | |||||||||||||||||||||||||||
Issuance of common stock | — | — | — | — | — | — | 1.3 | — | — | 1.3 | |||||||||||||||||||||||||||
Reclassifications to state redeemable equity at redemption value | — | — | (12.6 | ) | (12.6 | ) | — | — | 12.6 | — | — | 12.6 | |||||||||||||||||||||||||
Net income | — | — | — | — | — | — | — | 154.3 | — | 154.3 | |||||||||||||||||||||||||||
Other comprehensive loss | — | — | — | — | — | — | — | — | (176.4 | ) | (176.4 | ) | |||||||||||||||||||||||||
Balance at December 31, 2015 | — | $ | — | $ | 38.8 | $ | 38.8 | 131.4 | $ | 1.3 | $ | 1,735.1 | $ | 6.3 | $ | (406.3 | ) | $ | 1,336.4 | ||||||||||||||||||
See accompanying notes to consolidated financial statements.
F-5
VWR Corporation and Subsidiaries
Consolidated Statements of Cash Flows
(in millions)
Year ended December 31, | |||||||||||
2015 | 2014 | 2013 | |||||||||
Cash flows from operating activities: | |||||||||||
Net income | $ | 154.3 | $ | 152.6 | $ | 14.1 | |||||
Adjustments to reconcile net income to net cash provided by operating activities: | |||||||||||
Depreciation and amortization | 124.5 | 129.3 | 130.0 | ||||||||
Net foreign currency remeasurement (gain) loss | (45.1 | ) | (95.7 | ) | 41.6 | ||||||
Deferred income tax provision (benefit) | 27.3 | 33.9 | (28.9 | ) | |||||||
Loss on extinguishment of debt | 32.7 | 5.1 | 2.0 | ||||||||
Share-based compensation expense | 4.9 | 2.0 | 0.6 | ||||||||
Amortization of debt issuance costs | 5.2 | 5.9 | 7.6 | ||||||||
Other, net | 7.8 | 5.1 | 3.2 | ||||||||
Changes in working capital, net of business acquisitions: | |||||||||||
Trade accounts receivable | (30.2 | ) | (30.1 | ) | 25.9 | ||||||
Inventories | (43.8 | ) | (41.5 | ) | (28.4 | ) | |||||
Accounts payable | 25.1 | 27.5 | 36.2 | ||||||||
Other assets and liabilities | (37.7 | ) | (3.0 | ) | (3.0 | ) | |||||
Net cash provided by operating activities | 225.0 | 191.1 | 200.9 | ||||||||
Cash flows from investing activities: | |||||||||||
Acquisitions of businesses, net of cash acquired | (59.1 | ) | (102.9 | ) | (44.4 | ) | |||||
Proceeds from disposition of business, net of cash disposed | — | 13.0 | — | ||||||||
Capital expenditures | (40.9 | ) | (33.6 | ) | (45.3 | ) | |||||
Other investing activities | 2.1 | 0.5 | 0.2 | ||||||||
Net cash used in investing activities | (97.9 | ) | (123.0 | ) | (89.5 | ) | |||||
Cash flows from financing activities: | |||||||||||
Proceeds from issuance of common stock, net of underwriting discounts | 1.3 | 582.6 | — | ||||||||
Proceeds from debt | 2,767.0 | 742.2 | 436.5 | ||||||||
Repayment of debt | (2,810.2 | ) | (1,353.8 | ) | (546.7 | ) | |||||
Net change in bank overdrafts | (2.6 | ) | (26.2 | ) | (221.2 | ) | |||||
Net change in compensating cash balance | 2.5 | 23.4 | 221.0 | ||||||||
Redemption of redeemable equity | — | (8.9 | ) | (6.3 | ) | ||||||
Payment of dividend to VWR Holdings | — | (25.0 | ) | — | |||||||
Payment to VWR Holdings under ITRA | (9.8 | ) | — | — | |||||||
Payment of stock issuance costs | — | (4.8 | ) | — | |||||||
Payment of debt issuance costs and redemption premium | (41.9 | ) | (1.1 | ) | (2.6 | ) | |||||
Other financing activities | (2.4 | ) | (0.2 | ) | 1.4 | ||||||
Net cash used in financing activities | (96.1 | ) | (71.8 | ) | (117.9 | ) | |||||
Effect of exchange rate changes on cash | (12.7 | ) | (13.9 | ) | 2.3 | ||||||
Net increase (decrease) in cash and cash equivalents | 18.3 | (17.6 | ) | (4.2 | ) | ||||||
Cash and cash equivalents at beginning of period | 118.0 | 135.6 | 139.8 | ||||||||
Cash and cash equivalents at end of period | $ | 136.3 | $ | 118.0 | $ | 135.6 | |||||
Supplemental disclosures of cash flow information: | |||||||||||
Cash paid for interest | $ | 104.9 | $ | 158.9 | $ | 186.5 | |||||
Cash paid for income taxes, net | 48.0 | 39.3 | 37.3 | ||||||||
See accompanying notes to consolidated financial statements.
F-6
VWR Corporation and Subsidiaries
Notes to Consolidated Financial Statements
(1) | Nature of Operations and Basis of Presentation |
VWR Corporation, together with its consolidated subsidiaries (the “Company,” “we,” “us,” and “our”), is a leading, independent provider of laboratory products, services and solutions to the global life science, general research and applied markets. We have significant market positions in Europe and North America. We also have operations in Asia-Pacific and other key emerging markets to support our multinational customers across the globe. We serve a critical role in connecting customer sites with core laboratory product suppliers across multiple industries and geographies. We offer a broad portfolio of branded and private label laboratory products. We also offer a full range of value-added services, including custom manufacturing, to meet our customers’ needs. These services represent a growing but currently small portion of our overall net sales. We offer a wide selection of unique products and have developed an extensive global infrastructure including thousands of sales and service-focused professionals. We deliver value to our customers by improving the costs, efficiency and effectiveness of their research laboratories and production operations. We deliver value to our suppliers by providing them with cost-effective channel access to a global and diverse customer base.
Basis of Presentation
We report financial results on the basis of two reportable segments organized by geographic region: (i) North, Central and South America (collectively, the “Americas”); and (ii) Europe, Middle East, Africa and Asia Pacific (collectively, “EMEA-APAC”).
Principles of Consolidation
The accompanying consolidated financial statements include the accounts of VWR Corporation and its subsidiaries, as well as redeemable equity and share-based compensation expense related to our parent company (see Notes 11 and 13), each after the elimination of intercompany balances and transactions. The following describes our corporate organization at December 31, 2015 and the principles followed in consolidating our financial statements:
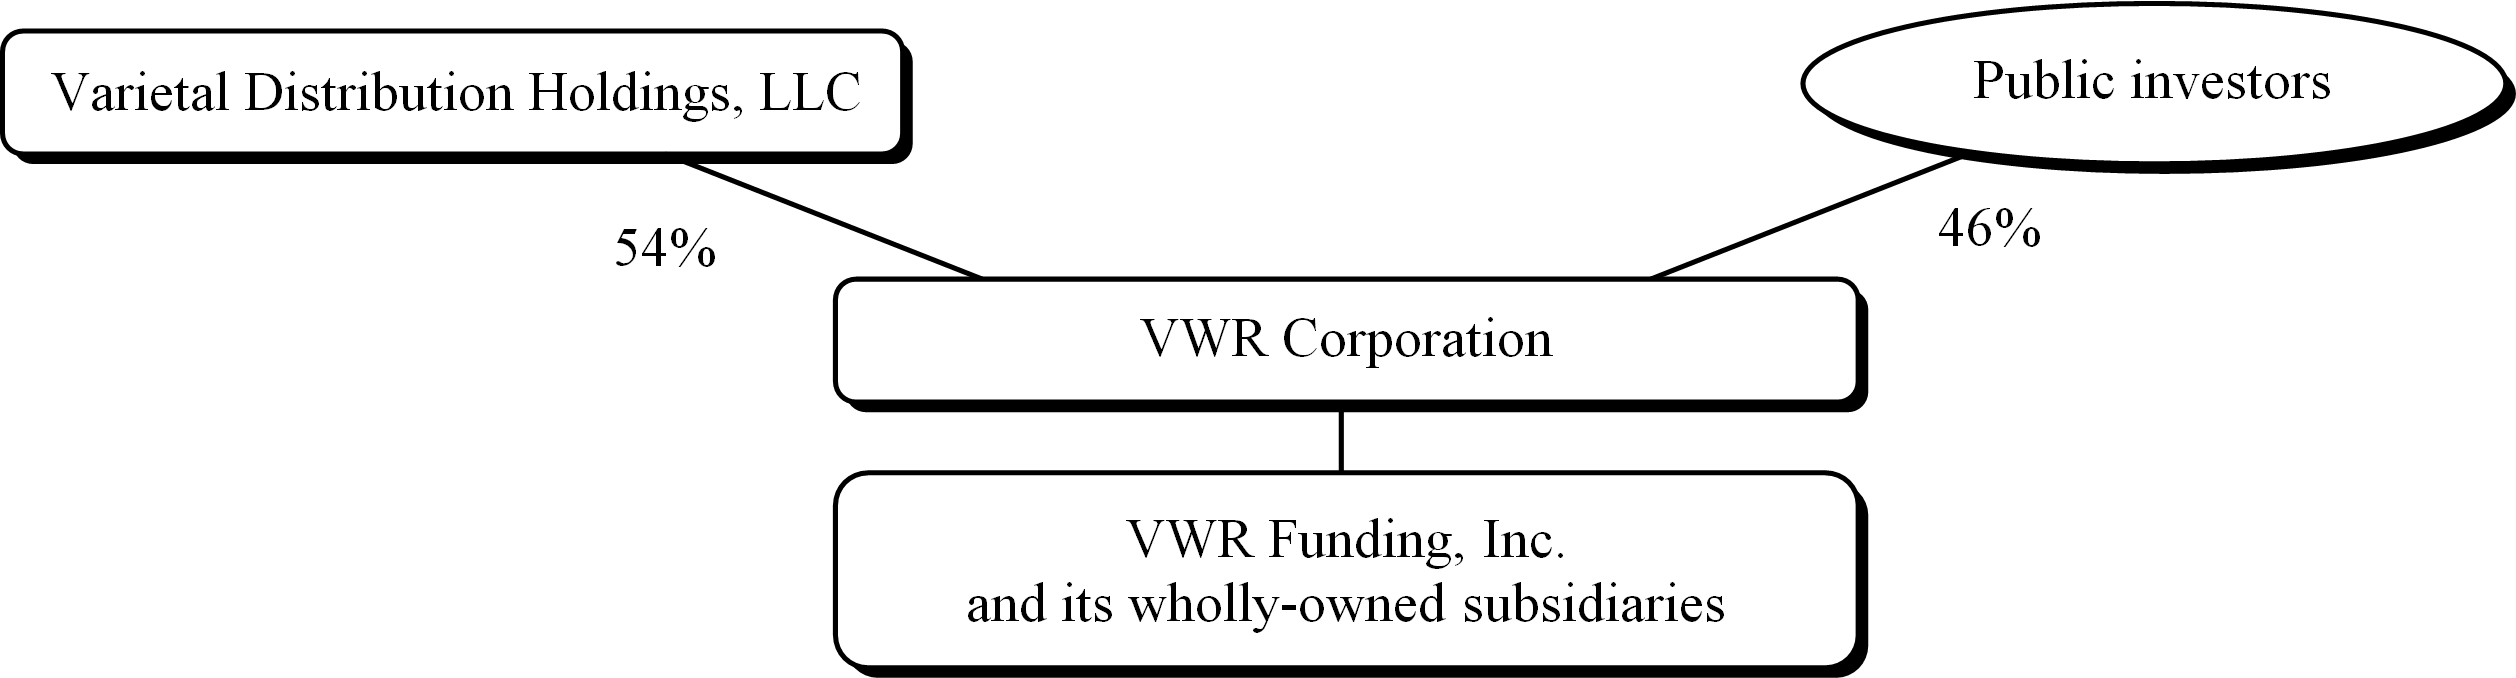
• | Varietal Distribution Holdings, LLC (“VWR Holdings”) — Prior to our initial public offering in the fourth quarter of 2014, (“IPO,” see Note 12), VWR Corporation was a wholly-owned subsidiary of VWR Holdings following a 2007 merger. Private equity funds managed by Madison Dearborn Partners hold a controlling interest in VWR Holdings. Our consolidated balance sheets reflect significant amounts of goodwill and other intangible assets as a result of the 2007 merger. |
• | VWR Funding, Inc. and its wholly-owned subsidiaries (“VWR Funding”) — VWR Funding is our wholly-owned subsidiary and the sole issuer of our debt, certain of which restricts its ability to make distributions to us (see Note 24). |
F-7
Use of Estimates
The preparation of financial statements in conformity with U.S. generally accepted accounting principles requires management to make estimates and assumptions that affect the reported amounts of assets and liabilities and the disclosure of contingent assets and liabilities at the date of the financial statements and the reported amounts of revenue, expenses, income and loss during the reporting period. Actual results could differ significantly from those estimates.
Additional disclosures about significant estimates are provided in the following areas: (i) impairment testing, particularly determining whether indicators of impairment were present and whether assets were impaired (see Note 21); (ii) estimating the valuation allowance on deferred tax assets, such as net operating loss carryforwards, which also affects the estimated value of the amount due to VWR Holdings under the income tax receivable agreement (“ITRA,” see Notes 18 and 20); (iii) accounting for defined benefit plans, in particular determining key assumptions such as discount rates and the expected return on plan assets (see Note 15); (iv) estimating outcomes of loss contingencies (see Note 10); and (v) estimating fair value, particularly related to measurements based on unobservable inputs (see Note 9).
Recapitalization
In 2014, we recapitalized our equity (see Note 12). For all periods presented, the number of shares of common stock outstanding has been adjusted for a stock split. Separately, a conversion of prior equity into newly-issued shares of common stock is presented as a retirement and issuance of shares; share counts for periods prior to that conversion were not adjusted. The consolidated financial statements present the accretion of dividends on redeemable convertible preferred stock for periods prior to the recapitalization. Those dividends were never paid and became available to common stockholders following the recapitalization.
(2) | Summary of Significant Accounting Policies |
Cash and Cash Equivalents
Cash and cash equivalents are comprised of highly liquid investments with original maturities of three months or less, primarily consisting of euro-denominated overnight deposits. Bank overdrafts are classified as current liabilities and presented as a financing activity on our consolidated statements of cash flows.
Trade Accounts Receivable, net of Reserves
Trade accounts receivable are recorded at the invoiced amount and generally do not bear interest. The carrying amount of trade accounts receivable is presented net of a reserve representing our estimate of the amounts that will not be collected and for estimated sales returns and allowances. In addition to reviewing delinquent accounts receivable, we consider many factors in estimating our reserve, including historical data, experience, customer types, creditworthiness and economic trends. From time to time, we may adjust our assumptions for anticipated changes in any of these or other factors expected to affect collectability. Account balances are written off against the allowance when we determine it is probable that the receivable will not be recovered.
Inventories
Our inventories consist primarily of products held for sale. Inventories are valued at the lower of cost or market, cost being primarily determined by the last-in, first-out (“LIFO”) method for certain of our U.S. subsidiaries and the first-in, first-out method for all other subsidiaries. We regularly review quantities of inventories on hand and compare these amounts to the expected use of each product or product line. We record a charge to cost of goods sold for the amount required to reduce the carrying value of inventory to net realizable value.
At December 31, 2015 and 2014, the percentage of inventories valued using the LIFO method was 36% and 37%, respectively, and the excess of current cost over LIFO value for those inventories was $24.6 million and $22.1 million, respectively.
Property and Equipment
Property and equipment are recorded at cost. Depreciation is recognized using the straight-line method over estimated useful lives of 10 to 40 years for buildings and improvements and 3 to 15 years for equipment and computer software. Leasehold improvements are amortized on a straight-line basis over the shorter of the estimated useful lives of the assets or the estimated remaining life of the lease. Costs for repairs and maintenance that do not significantly increase the value or estimated lives of property and equipment are treated as expense as such costs are incurred. Property and equipment held under capital leases were not material for any periods presented.
F-8
Impairment of Long-Lived Assets
We evaluate the recoverability of long-lived assets when events or changes in circumstances indicate a possible inability to recover carrying amounts. We assess recoverability by comparing the carrying value of the asset to estimated undiscounted future cash flows expected to be generated by the asset. If an asset is considered impaired, the impairment loss to be recognized is measured as the amount by which the asset’s carrying value exceeds its fair value.
Goodwill and Other Intangible Assets
Goodwill represents the excess of purchase price over the fair value of net assets acquired in a business combination. Other intangible assets consist of both amortizable and indefinite-lived intangible assets. Amortizable intangible assets are amortized over their estimated useful lives on a straight-line basis. Indefinite-lived intangible assets are not amortized.
We reevaluate the estimated useful lives of our amortizable intangible assets annually. For indefinite-lived intangible assets, we reevaluate annually whether they continue to have indefinite lives, considering whether they have any legal, regulatory, contractual, competitive or economic limitations and whether they are expected to contribute to the generation of cash flows indefinitely.
Goodwill and other indefinite-lived intangible assets are tested annually for impairment on October 1 of each year. Goodwill impairment testing is performed at the reporting unit level. Our reporting units are the same as our operating segments and reportable segments. All of our intangible assets, including goodwill, are tested for impairment whenever an indication of potential impairment arises. Events or circumstances that might require an interim evaluation include unexpected adverse business conditions, economic factors, unanticipated technological changes or competitive activities, loss of key personnel and acts or anticipated acts by governments and courts. Indefinite-lived intangible assets are tested for impairment prior to testing of goodwill or amortizable intangible assets.
The impairment analysis for goodwill and indefinite-lived intangible assets consists of an optional qualitative assessment potentially followed by a two-step quantitative analysis. If we determine that the carrying value of goodwill or indefinite-lived intangible assets exceeds its fair value, an impairment charge is recorded for the excess. Impairment charges cannot be reversed in subsequent periods.
The impairment analysis for amortizable intangible assets is performed in the same way as for our other long-lived assets, as previously discussed.
Fair Value Measurements
Fair value is defined as the price that would be received to sell an asset or paid to transfer a liability in an orderly transaction between market participants at a measurement date. Classification within the fair value hierarchy is determined based on the lowest of the following levels that is significant to the fair value measurement:
• | Level 1 — Quoted prices (unadjusted) in active markets for identical assets or liabilities |
• | Level 2 — Inputs that are observable for the asset or liability, either directly or indirectly through market corroboration, for substantially the full term of the asset or liability |
• | Level 3 — Inputs that are unobservable for the asset or liability based on our evaluation of the assumptions market participants would use in pricing the asset or liability |
We exercise considerable judgment when estimating fair value, particularly when evaluating what assumptions market participants would likely make. The use of different assumptions or estimation methodologies could have a material effect on the estimated fair values.
Commitments and Contingencies
Loss contingencies are reflected in the consolidated financial statements based on our assessments of the expected outcome of legal proceedings or the expected resolution of other contingencies. Liabilities for estimated losses are accrued if the potential loss from any claim or legal proceeding is considered probable and the amount can be reasonably estimated. Significant judgment is required in both the determination of probability and the determination as to whether the amount of an exposure is reasonably estimable. Due to uncertainties related to these matters, accruals are based only on the information available at the time. As additional information becomes available, we reassess potential liabilities related to pending claims and litigation and may revise our previous estimates.
F-9
Revenue Recognition
We record product revenue on a gross basis when persuasive evidence of an arrangement exists, the price is fixed or determinable, title and risk of loss have been transferred to the customer and collectability of the resulting receivable is reasonably assured. Title and risk of loss is transferred at the time of shipment or upon delivery to customers, depending upon the terms of the arrangement with the customer. Products are delivered without post-sale obligations to the customer. Provisions for discounts, rebates to customers, sales returns and other adjustments are provided for as a reduction of sales in the period the related sales are recorded.
We record shipping and handling charges billed to customers in net sales and record shipping and handling costs in cost of goods sold for all periods presented. Sales taxes, value-added taxes and certain excise taxes collected from customers and remitted to governmental authorities are accounted for on a net basis and therefore are excluded from net sales.
Services represent a growing but currently small portion of our net sales and were not material to our consolidated financial statements.
Share-Based Compensation
Share-based compensation consists primarily of stock options awarded to employees and directors. Share-based compensation expense is measured using the grant-date fair value of awards ultimately expected to vest and, for awards with service conditions only, is recognized on a straight-line basis from the date of grant through the end of the requisite service period. We expect to issue new shares of common stock upon the exercise of stock options.
The grant-date fair value of stock options is measured using a closed-form option pricing model, using assumptions based on the terms of each stock option agreement, the expected behavior of grant recipients and peer company data. We have limited historical data about our own awards upon which to base our assumptions. Expected volatility is calculated based on the observed equity volatility for a peer group over a period of time equal to the expected life of the stock options. The risk-free interest rate is based on U.S. Treasury observed market rates continuously compounded over the duration of the expected life. The expected life of stock options is determined using the simplified method, which is calculated as the midpoint of the weighted average vesting period and the contractual term.
The number of awards ultimately expected to vest is determined by use of an estimated forfeiture rate. The estimated forfeiture rate is based on historical data for the employee group awarded options and expected employee turnover rates, which management reevaluates each period.
Defined Benefit Plans
We have defined benefit plans covering certain of our employees. The benefits include pension, salary continuance, life insurance and healthcare. Benefits are accrued over the employees’ service periods. We use actuarial methods and assumptions in the valuation of defined benefit obligations and the determination of net periodic pension income or expense. Differences between actual and expected results or changes in the value of defined benefit obligations and plan assets, if any, are not recognized in earnings as they occur but rather systematically over subsequent periods.
Foreign Currency Translation
Assets and liabilities of our foreign subsidiaries, where the functional currency is the local currency, are translated into U.S. dollars using period-end exchange rates. Revenues, expenses, income and losses are translated using average exchange rates. Resulting translation adjustments are reported in accumulated other comprehensive income or loss. Foreign currency remeasurement gains and losses related to financing activities are reported in other income (expense), net within our consolidated statements of operations, while gains and losses associated with operating activities are reported within the applicable component of operating income.
Income Taxes
Income taxes are accounted for under the asset and liability method. Deferred tax assets and liabilities are recognized for the expected net tax effects of temporary differences between the carrying amounts of assets and liabilities for financial reporting and income tax purposes and for net operating loss and credit carryforwards. Deferred tax assets and liabilities are measured using the enacted tax rates expected to apply to taxable income in the years in which those temporary differences are expected to be recovered or settled. The effect on deferred tax assets and liabilities of a change in tax rates is recognized in income in the period that includes the enactment date. We record a valuation allowance to reduce deferred tax assets to the amount that is more likely than not to be realized.
F-10
We recognize the effect of income tax positions only if those positions are more likely than not to be sustained. Recognized income tax positions are measured at the largest amount that is more likely than not of being realized. Changes in recognition or measurement are reflected in the period in which a change in judgment occurs, as a result of information that arises or when a tax position is effectively settled. We recognize accrued interest and penalties related to unrecognized tax benefits as a component of income tax expense in our consolidated financial statements.
Due to VWR Holdings — ITRA
We record the estimated amount payable to VWR Holdings under an ITRA, entered into in connection with our IPO, as a noncurrent liability, except for the portion estimated to be payable within one year. The ITRA liability was initially recognized through an adjustment to additional paid-in capital and measured at its expected future value, similar to the underlying deferred tax assets to which it relates. Subsequent changes to the value of the ITRA liability, if any, will be classified as other income (expense), net in the consolidated statements of operations. Cash payments under the ITRA are classified as a financing activity on the consolidated statements of cash flows.
(3) | New Accounting Standards |
In February 2016, the Financial Accounting Standards Board (“FASB”) issued comprehensive new guidance about leases. Under the new guidance, most leases will be recognized on our consolidated balance sheets as liabilities with corresponding right-of-use assets. The new guidance is effective for us beginning in the first quarter of 2019, with early adoption permitted. The standard must be adopted using a modified retrospective approach. We have not yet evaluated the impact of this new pronouncement.
In November 2015, the FASB issued new guidance about the classification of deferred income taxes. Under the new guidance, all deferred income taxes are classified as noncurrent. We early adopted the standard at December 31, 2015 on a prospective basis. Prior periods were not retrospectively adjusted.
In April 2015, the FASB issued new guidance about the presentation of debt issuance costs, which it updated in August 2015. Under the new guidance, deferred issuance costs for debt instruments other than revolving credit facilities are presented on our balance sheet as a reduction to debt instead of as a component of other assets. We early adopted the standard at December 31, 2015 on a retrospective basis, resulting in the reclassification of $11.7 million of deferred debt issuance costs from other assets to debt, net of current portion, at December 31, 2014.
In May 2014, the FASB issued comprehensive revenue recognition guidance. The new guidance provides a single model for entities to use in accounting for revenue arising from contracts with customers and will supersede most current revenue recognition guidance. The new standard also requires expanded disclosures regarding the qualitative and quantitative information about the nature, amount, timing and uncertainty of revenue and cash flows arising from contracts with customers. The new guidance is effective for us beginning in the first quarter of 2018. The standard may be adopted using either a full retrospective or a modified retrospective approach. We are continuing to evaluate the impact of this pronouncement and the method by which we will adopt it.
(4) | Earnings or Loss per Share |
The following table presents the reconciliation of the denominators of basic and diluted earnings or loss per share (in millions):
Year ended December 31, | |||||
2015 | 2014 | ||||
Weighted average shares outstanding, basic | 131.4 | 49.3 | |||
Dilutive effect of stock options | 0.4 | 0.2 | |||
Weighted average shares outstanding, diluted | 131.8 | 49.5 | |||
For the year ended December 31, 2015, 2.0 million stock options were excluded from the calculation of diluted earnings per share on the basis that they were anti-dilutive.
F-11
(5) | Acquisitions |
During the three years ended December 31, 2015, we acquired a number of businesses to broaden our product offerings and strengthen our market positions. None of those acquisitions, nor their related costs, were material individually or in the aggregate to our consolidated balance sheets or consolidated statements of operations, either on an actual or pro forma basis.
The following table presents selected information about these acquisitions in the aggregate (dollars in millions):
Year ended December 31, | |||||||||||
2015 | 2014 | 2013 | |||||||||
Number of businesses acquired | 4 | 4 | 7 | ||||||||
Components of purchase price: | |||||||||||
Cash paid, net of cash acquired | $ | 59.1 | $ | 102.9 | $ | 44.4 | |||||
Estimated fair value of contingent consideration | 13.6 | 8.4 | 1.4 | ||||||||
Deferred purchase price, net of (settlements) | (3.4 | ) | 3.4 | — | |||||||
Purchase price | $ | 69.3 | $ | 114.7 | $ | 45.8 | |||||
Allocation of purchase price: | |||||||||||
Net tangible assets | $ | 9.5 | $ | 15.5 | $ | 4.6 | |||||
Identifiable intangible assets | 23.2 | 44.1 | 18.2 | ||||||||
Goodwill | 36.6 | 55.1 | 23.0 | ||||||||
Purchase price | $ | 69.3 | $ | 114.7 | $ | 45.8 | |||||
Weighted average life of acquired amortizable intangible assets in years | 9.7 | 12.2 | 7.6 | ||||||||
The purchase price for the acquisitions was higher than the fair value of the acquired identifiable assets, resulting in goodwill, due to the existence of intangible assets not recognizable under GAAP and other market factors. During the years ended December 31, 2015, 2014 and 2013, we recorded goodwill of $19.6 million, $29.0 million and $4.5 million, respectively, that we expect to be deductible for tax purposes. The purchase price allocations for certain acquisitions completed in 2015 are preliminary pending finalization of opening balance sheets and may be adjusted subsequently.
(6) | Property and Equipment, net |
The following table presents the components of property and equipment, net (in millions):
December 31, | |||||||
2015 | 2014 | ||||||
Buildings and improvements | $ | 161.4 | $ | 154.1 | |||
Equipment and computer software | 244.2 | 220.9 | |||||
Other | 38.8 | 27.3 | |||||
Property and equipment, gross | 444.4 | 402.3 | |||||
Accumulated depreciation | (216.2 | ) | (170.8 | ) | |||
Property and equipment, net | $ | 228.2 | $ | 231.5 | |||
Depreciation expense was $41.1 million, $40.4 million and $38.3 million for the years ended December 31, 2015, 2014 and 2013, respectively.
F-12
(7) | Goodwill and Other Intangible Assets, net |
The following table presents changes in goodwill by segment (in millions):
Americas | EMEA-APAC | Total | |||||||||
Balance at December 31, 2013 | $ | 1,021.0 | $ | 905.5 | $ | 1,926.5 | |||||
Acquisitions (Note 5) | 41.3 | 13.8 | 55.1 | ||||||||
Impairment (Note 9) | (11.3 | ) | — | (11.3 | ) | ||||||
Currency translation | (8.7 | ) | (108.0 | ) | (116.7 | ) | |||||
Balance at December 31, 2014 | 1,042.3 | 811.3 | 1,853.6 | ||||||||
Acquisitions (Note 5) | 19.7 | 16.9 | 36.6 | ||||||||
Currency translation | (15.7 | ) | (82.9 | ) | (98.6 | ) | |||||
Other | — | (0.2 | ) | (0.2 | ) | ||||||
Balance at December 31, 2015 | $ | 1,046.3 | $ | 745.1 | $ | 1,791.4 | |||||
The following table presents the gross amount of goodwill and accumulated impairment losses by segment (in millions):
December 31, 2015 | December 31, 2014 | ||||||||||||||||||||||
Gross carrying amount | Accumulated impairment losses | Net carrying amount | Gross carrying amount | Accumulated impairment losses | Net carrying amount | ||||||||||||||||||
Americas | $ | 1,252.9 | $ | 206.6 | $ | 1,046.3 | $ | 1,248.9 | $ | 206.6 | $ | 1,042.3 | |||||||||||
EMEA-APAC | 745.1 | — | 745.1 | 811.3 | — | 811.3 | |||||||||||||||||
Total | $ | 1,998.0 | $ | 206.6 | $ | 1,791.4 | $ | 2,060.2 | $ | 206.6 | $ | 1,853.6 | |||||||||||
The following table presents the components of other intangible assets (in millions):
December 31, 2015 | December 31, 2014 | ||||||||||||||||||||||
Gross carrying amount | Accumulated amortization | Net carrying amount | Gross carrying amount | Accumulated amortization | Net carrying amount | ||||||||||||||||||
Amortizable intangible assets: | |||||||||||||||||||||||
Customer relationships | $ | 1,402.2 | $ | 581.4 | $ | 820.8 | $ | 1,456.9 | $ | 531.3 | $ | 925.6 | |||||||||||
Other | 30.3 | 15.2 | 15.1 | 28.2 | 12.1 | 16.1 | |||||||||||||||||
Total | 1,432.5 | 596.6 | 835.9 | 1,485.1 | 543.4 | 941.7 | |||||||||||||||||
Indefinite-lived intangible assets: | |||||||||||||||||||||||
Trademarks and tradenames | 619.7 | — | 619.7 | 653.2 | — | 653.2 | |||||||||||||||||
Other intangible assets | $ | 2,052.2 | $ | 596.6 | $ | 1,455.6 | $ | 2,138.3 | $ | 543.4 | $ | 1,594.9 | |||||||||||
Amortization expense was $83.4 million, $88.9 million and $91.7 million for the years ended December 31, 2015, 2014, 2013, respectively. For the years ended December 31, 2015 and 2013, we incurred impairment charges of $3.2 million and $2.8 million, respectively, related to amortizable intangible assets. See Note 9.
The following table presents estimated future amortization expense for amortizable intangible assets at December 31, 2015 (in millions):
2016 | $ | 82.2 | |
2017 | 81.2 | ||
2018 | 78.8 | ||
2019 | 77.3 | ||
2020 | 75.8 | ||
Thereafter | 440.6 | ||
Total | $ | 835.9 | |
F-13
(8) | Debt |
The following table presents information about debt (dollars in millions):
December 31, 2015 | December 31, 2014 | |||||||||||
Interest terms | Rate | Amount | ||||||||||
Accounts receivable securitization facility | LIBOR plus 1.15% | 1.56 | % | $ | 38.0 | $ | 73.0 | |||||
Senior credit facility: | ||||||||||||
Term loan A facility, net of discount of $6.1 | LIBOR plus 2.00% | 2.40 | % | 903.9 | — | |||||||
Term loan B facility, net of discount of $4.7 | EURIBOR plus 3.25% | 4.00 | % | 494.8 | — | |||||||
Prior credit facility, net of discount of $5.4 | — | 1,262.7 | ||||||||||
4.625% senior notes, net of discount of $8.4 | Fixed rate | 4.63 | % | 538.6 | — | |||||||
7.25% senior notes, net of discount of $6.3 | — | 743.7 | ||||||||||
Other debt | 13.7 | 20.8 | ||||||||||
Total debt | $ | 1,989.0 | $ | 2,100.2 | ||||||||
Classification on consolidated balance sheets: | ||||||||||||
Current portion of debt | $ | 92.8 | $ | 95.3 | ||||||||
Debt, net of current portion | 1,896.2 | 2,004.9 | ||||||||||
Total debt | $ | 1,989.0 | $ | 2,100.2 | ||||||||
In the table above, discounts include unamortized original issue discounts and debt issuance costs, EURIBOR is subject to a floor of 0.75%, and other debt includes capital lease obligations and subsidiary loans from local banks. Borrowings under the accounts receivable securitization facility and the multi-currency revolving credit facility, if any, are included in the current portion of debt because we frequently borrow from and repay them to satisfy short term cash requirements.
The following table presents availability under credit facilities at December 31, 2015 (in millions):
A/R Facility | Multi-currency revolving loan facility | Total | |||||||||
Current availability | $ | 175.0 | $ | 250.0 | $ | 425.0 | |||||
Undrawn letters of credit outstanding | (11.3 | ) | (6.8 | ) | (18.1 | ) | |||||
Outstanding borrowings | (38.0 | ) | — | (38.0 | ) | ||||||
Unused availability | $ | 125.7 | $ | 243.2 | $ | 368.9 | |||||
The following table presents the maturities of debt principal at December 31, 2015 (in millions):
2016 | 2017 | 2018 | 2019 | 2020 | Thereafter | Total | |||||||||||||||||||||
Accounts receivable securitization facility | $ | — | $ | — | $ | 38.0 | $ | — | $ | — | $ | — | $ | 38.0 | |||||||||||||
Senior credit facility: | |||||||||||||||||||||||||||
Term loan A facility | 45.5 | 45.5 | 68.3 | 91.0 | 659.7 | — | 910.0 | ||||||||||||||||||||
Term loan B facility | 5.0 | 5.0 | 5.0 | 5.0 | 5.0 | 474.5 | 499.5 | ||||||||||||||||||||
4.625% senior notes | — | — | — | — | — | 547.0 | 547.0 | ||||||||||||||||||||
Other debt | 4.3 | 4.0 | 3.9 | 1.5 | — | — | 13.7 | ||||||||||||||||||||
Total debt, excluding discounts | $ | 54.8 | $ | 54.5 | $ | 115.2 | $ | 97.5 | $ | 664.7 | $ | 1,021.5 | $ | 2,008.2 | |||||||||||||
F-14
A/R Facility
The accounts receivable securitization facility is a $175.0 million secured credit facility with a commercial bank that matures on May 18, 2018. Borrowings under this facility are secured by the trade accounts receivable of certain domestic subsidiaries, which are not available to satisfy the claims of other creditors. The accounts receivable securitization facility includes representations and covenants that we consider usual and customary, including that, if our available liquidity falls below a specified amount, the ratio of our adjusted earnings to interest expense cannot exceed a specified amount, each as defined. At December 31, 2015, we were in compliance with those covenants.
Senior Credit Facility
The senior credit facility is with a syndicate of lenders and includes a $250.0 million multi-currency revolving loan facility due September 28, 2020, a $910.0 million term loan A facility due September 28, 2020 and a €460.0 million term loan B facility due January 15, 2022. The term loan facilities require us to make scheduled quarterly principal repayments as shown in the table above. Borrowings under the senior credit facility are secured by substantially all of our assets except for trade accounts receivable that secure the A/R Facility. The senior credit facility bears interest at variable rates including a margin that declines if certain net leverage ratios are achieved. Fees payable under the senior credit facility are not material to interest expense. The senior credit facility includes representations and covenants that we consider usual and customary, including that our first lien net leverage ratio, as defined, cannot exceed a specified amount. At December 31, 2015, we were in compliance with those covenants.
We entered into the senior credit facility in September 2015, issued borrowings under the term loan B facility at an original issue discount of €1.2 million and paid debt issuance costs of $15.4 million for the year ended December 31, 2015, most of which were deferred and are being recognized as interest expense through the maturity date. We used a portion of the proceeds from the senior credit facility and proceeds from the issuance of 4.625% senior notes earlier in the year to repay our prior credit facility. As a result, we incurred an aggregate loss on extinguishment of debt of $7.9 million for the year ended December 31, 2015.
During the years ended December 31, 2014 and 2013, we amended our prior credit facility to extend maturity dates and obtain more favorable rates of interest. As a result, we paid debt issuance costs of $1.1 million and $2.3 million for the years ended December 31, 2014 and 2013, respectively, and incurred a loss on extinguishment of debt of $2.0 million for the year ended December 31, 2013.
Senior Notes
During 2015, we issued €503.8 million of 4.625% senior notes that mature on April 15, 2022. Interest is payable in arrears on April 15 and October 15 of each year. The notes are redeemable at premiums that begin at 102.3125% plus the present value of interest through April 15, 2018, then decline through April 15, 2020 at which time the notes become redeemable at face value. The notes are also redeemable in part using proceeds from certain equity offerings and in full upon certain changes in control. The indentures covering the notes include representations and covenants that we consider usual and customary. At December 31, 2015, we were in compliance with those covenants.
We issued the notes in the first quarter of 2015 at an original issue discount of €3.8 million and paid debt issuance costs of $5.4 million, which were deferred and are being recognized as interest expense through the maturity date.
In the third quarter of 2015, we used a portion of the proceeds from the senior credit facility to redeem all of our 7.25% senior notes at a redemption price of 102.719% plus accrued and unpaid interest. As a result, we paid a redemption premium of $20.4 million and incurred a loss on extinguishment of debt of $24.8 million for the year ended December 31, 2015.
In 2014, we used net proceeds from the IPO to redeem 10.75% subordinated notes at a redemption price of 100% plus accrued and unpaid interest. As a result, we incurred a loss on extinguishment of debt of $5.1 million for the year ended December 31, 2014.
F-15
(9) | Financial Instruments and Fair Value Measurements |
Our financial instruments include cash and cash equivalents, trade accounts receivable, accounts payable, debt and an amount due to VWR Holdings. Our financial instruments are held or issued by a number of institutions, which reduces the risk of material non-performance, except for the amount due to VWR Holdings.
Assets and Liabilities for which Fair Value is Only Disclosed
The carrying amount of cash and cash equivalents is stated at its fair value, a Level 1 measurement. The carrying amounts for trade accounts receivable and accounts payable approximate fair value due to their short-term nature and are Level 2 measurements.
The following table presents the carrying amounts and estimated fair values of debt instruments (in millions):
December 31, 2015 | December 31, 2014 | ||||||||||||||
Carrying amount | Fair value | Carrying amount | Fair value | ||||||||||||
Accounts receivable securitization facility | $ | 38.0 | $ | 38.0 | $ | 73.0 | $ | 73.0 | |||||||
Senior credit facility: | |||||||||||||||
Term loan A facility | 903.9 | 901.5 | — | — | |||||||||||
Term loan B facility | 494.8 | 500.5 | — | — | |||||||||||
Prior credit facility | — | — | 1,262.7 | 1,256.5 | |||||||||||
4.625% senior notes | 538.6 | 536.5 | — | — | |||||||||||
7.25% senior notes | — | — | 743.7 | 780.2 | |||||||||||
Other debt | 13.7 | 13.7 | 20.8 | 20.8 | |||||||||||
Our estimates of fair value are based on quoted market prices and standard pricing models that take into account the present value of future cash flows. We believe that these qualify as Level 2 measurements, except for our 7.25% senior notes, which were publicly traded prior to their redemption and we believe qualified as a Level 1 measurement.
At December 31, 2015 and December 31, 2014, the amount due to VWR Holdings under the ITRA (see Note 20) had a carrying amount of $163.1 million and $172.9 million, respectively, and a fair value of $147.6 million and $132.0 million, respectively. The fair value was estimated using a combination of observable and unobservable inputs using an income-based approach, a Level 3 measurement.
Recurring Fair Value Measurements with Significant Unobservable Inputs
The following table presents changes in contingent consideration liabilities, which are measured at fair value on a recurring basis using Level 3 measurements (in millions):
Year ended December 31, | |||||||
2015 | 2014 | ||||||
Beginning balance | $ | 11.6 | $ | 3.6 | |||
Acquisitions (Note 5) | 13.6 | 8.4 | |||||
Income from changes to estimated fair value | (1.1 | ) | — | ||||
Settlements in cash | (2.4 | ) | (0.2 | ) | |||
Currency translation | (0.7 | ) | (0.2 | ) | |||
Ending balance | $ | 21.0 | $ | 11.6 | |||
Certain of the business acquisitions we completed entitle the sellers to contingent consideration if earnings targets are met during a period of time following the acquisition. We estimate fair value using the average of probability-weighted potential earn-out payments specified in the purchase agreements, ranging from approximately zero to $28 million for all open earn-outs at December 31, 2015. The significant assumptions used in these calculations include forecasted results and the estimated likelihood for each performance scenario.
For the year ended December 31, 2015, acquisitions include the finalization of provisional amounts for businesses acquired in the fourth quarter of 2014.
F-16
Nonrecurring Fair Value Measurements
At September 30, 2015 and September 30, 2013, we estimated the fair value of two different asset groups and their long-lived assets, each primarily consisting of amortizable intangible assets, in connection with tests of impairment (see Note 21). We determined the fair values using an income approach, a Level 3 measurement. The valuations required us to make various assumptions, including but not limited to assumptions related to changes in profitability, future cash flows associated with the asset groups and the intangible assets and selecting appropriate discount rates. Our estimates were principally based upon our knowledge and experience and overall economic factors, including the regulatory environment.
In 2014, we impaired the goodwill of an acquired business following our receipt of information about inappropriate business practices. We first estimated the fair value of the business using an income approach (Level 3 measurement) and concluded that its fair value was equal to the fair value of its net tangible assets, which we estimated using their carrying value (Level 2 measurement). The valuation required us to make various assumptions, including, but not limited to, assumptions related to changes in profitability and future cash flows associated with the inappropriate business practices and expected customer attrition. Our estimates were principally based upon our knowledge and experience, and overall economic factors, including the regulatory environment. We subsequently rescinded the purchase agreement, receiving a full refund of the purchase price. The impairment could not be reversed, so we recognized a gain on disposition that substantially offsets the impairment.
Derivative Instruments and Hedging Activities
We engage in hedging activities to reduce our exposure to changes in foreign currency exchange rates. Our hedging activities are designed to mitigate specific foreign currency risks according to our strategies, as summarized below, which may change from time to time. Our hedging activities consist of the following:
• | Net investment hedging — We hedge a portion of our net investment in euro-denominated foreign operations using our 4.625% senior notes and a portion of our term loan B facility; |
• | Economic hedge — We experience opposite foreign currency exchange rate effects related to (i) an intercompany loan denominated in euros and (ii) the unhedged portion of our term loan B facility. Both effects are recorded through earnings in the period of change and substantially offset one another without the need for hedge designation under GAAP; and |
• | Other hedging activities — Some of our subsidiaries hedge short-term foreign-denominated business transactions and intercompany financing transactions using foreign currency forward contracts. These activities were not material to our consolidated financial statements. |
Net Investment Hedging
During 2015, we designated €370.0 million of our term loan B facility and all €503.8 million of our 4.625% senior notes as hedges to protect a portion of our net investment in euro-denominated foreign operations from the impact of changes in the euro to U.S. dollar exchange rate (see Note 21). As a result of the hedge designations, the net foreign currency remeasurement gain or loss on the hedging instruments, which otherwise would be recognized in earnings (see Note 17), is deferred as accumulated other comprehensive income or loss. That deferred net gain or loss equally offsets the net unrealized gain or loss that is recognized in other comprehensive income or loss from the translation of the hedged portion of our net investment in euro-denominated foreign operations. The hedge has no other impact to our financial position, financial performance or cash flows.
The following table presents the balance sheet classification and fair value of the hedging instruments, which are Level 2 measurements (in millions):
Balance sheet classification | December 31, 2015 | ||||
Portion of term loan B facility | Current portion of debt | $ | 4.0 | ||
Debt, net of current portion | 398.6 | ||||
4.625% senior notes | Debt, net of current portion | 536.5 | |||
F-17
The following table presents information about the net unrealized gain (loss) recognized in other comprehensive income or loss as a result of net investment hedging (in millions):
Description | Year ended December 31, 2015 | ||||
Portion of net investment in foreign operations | Hedged item | $ | (3.7 | ) | |
Portion of term loan B facility | Hedging instrument | 12.4 | |||
4.625% senior notes | Hedging instrument | (8.7 | ) | ||
We determined that our hedge of the net investment was fully effective for the year ended December 31, 2015, and no amounts were recognized in or reclassified to earnings.
(10) | Commitments and Contingencies |
Our business involves risk of product liability, patent infringement and other claims in the ordinary course of business arising from the products that we source from various manufacturers or produce ourselves, as well as from the services we provide. Our exposure to such claims may increase as we seek to increase the geographic scope of our sourcing activities and sales of private label products and to the extent that we expand our manufacturing operations. We maintain insurance policies, including product liability insurance, and in many cases the manufacturers of the products we distribute have indemnified us against such claims. We cannot assure you that our insurance coverage or indemnification agreements with manufacturers will be available in all pending or any future cases brought against us. Furthermore, our ability to recover under any insurance or indemnification arrangements is subject to the financial viability of our insurers, our manufacturers and our manufacturers’ insurers, as well as legal enforcement under the local laws governing the arrangements. In particular, as we seek to expand our sourcing from manufacturers in the Asia-Pacific region and other developing locations, we expect that we will increase our exposure to potential defaults under the related indemnification arrangements. Insurance coverage in general or coverage for certain types of liabilities, such as product liability or patent infringement in these developing markets may not be readily available for purchase or cost-effective for us to purchase. Furthermore, insurance for liability relating to asbestos, lead and silica exposure is not available, and we do not maintain insurance for product recalls. Accordingly, we could be subject to uninsured and unindemnified future liabilities, and an unfavorable result in a case for which adequate insurance or indemnification is not available could result in a material adverse effect on our business, financial condition and results of operations.
We are also involved in various disputes, litigation and regulatory matters incidental to our business, including employment matters, commercial disputes, government contract compliance matters, disputes regarding environmental clean-up costs, and other matters arising out of the normal conduct of our business. We intend to vigorously defend ourselves in such matters. From time to time, we are named as a defendant in cases as a result of our distribution of laboratory supplies, including litigation resulting from the alleged prior distribution of products containing asbestos by certain of our predecessors or acquired companies. While the impact of these disputes or litigation has historically been immaterial, and we believe the range of reasonably possible loss from current matters continues to be immaterial, there can be no assurance that the impact of the pending and any future claims will not be material to our business, financial condition or results of operations in the future.
Employment Agreements
The employment agreements with our executive officers include provisions for the payment of severance and continuing health benefits following termination without cause or resignation for good reason, as those terms are defined in the employment agreements. The aggregate of potential payments for all executive offers under these provisions was $10.4 million at December 31, 2015.
Registration Rights Agreement
We are party to a registration rights agreement with VWR Holdings that could require us to pay securities registration costs in future periods. Under the registration rights agreement, VWR Holdings is entitled to request that we register (i) any shares of our common stock that it held at October 7, 2014 and (ii) any shares held by Madison Dearborn Partners. Should we register such common stock, we would be required to pay costs related to the registration as well as VWR Holdings’ expenses in connection with its exercise of these rights.
In June and November 2015, we incurred expenses pursuant to the registration rights agreement. See Note 20.
F-18
(11) | Redeemable Equity |
Redeemable equity consists of redeemable equity units of our parent and, prior to July 31, 2014, redeemable convertible preferred stock.
Redeemable Equity Units of Parent
In 2007, VWR Holdings established a plan (the “VWR Holdings Plan”) whereby certain employees were able to purchase a “strip” of preferred and common units. The following describes the accounting for these units:
• | Issuances — Prior to the recapitalization, VWR Holdings issued these units in exchange for cash. Subsequently, VWR Holdings contributed an equal amount of capital to us in exchange for shares of redeemable convertible preferred stock. None of these units have been issued following the recapitalization. |
• | Repurchases — Upon termination of the employee unitholders, two redemption options may be triggered, one of which is outside of our control. Prior to the recapitalization, VWR Holdings redeemed the units by providing an equally-valued number of shares of our redeemable convertible preferred stock to the unitholder, which we subsequently redeemed for cash. Following the recapitalization, VWR Holdings redeems units directly with cash funded by dividends from us. |
• | Valuation — These units are presented on our consolidated balance sheets at their redemption value. The redemption value is contractually defined, with preferred units valued as the sum of unreturned capital plus a cumulative dividend and common units valued at the enterprise value of VWR Holdings less the redemption value of preferred units. Changes to the redemption value are reclassified to or from the additional paid-in capital of our common stockholders. |
Certain employees also received a special type of common unit that vested over a period of four years based upon continuing service, subject to accelerated vesting upon the occurrence of certain events. Because these units were provided as an incentive to provide services to us, we accounted for them as stock-based compensation. See Note 13.
Redeemable Convertible Preferred Stock
In 2014, in anticipation of our IPO, we completed an internal recapitalization (see Note 12) pursuant to which all shares of our redeemable convertible preferred stock were exchanged for newly-issued shares of common stock. Prior to the recapitalization, the preferred stock was redeemable by VWR Holdings for the sum of unreturned capital plus a cumulative dividend.
(12) | Stockholders’ Equity |
Stockholders’ equity consists of common stock. We are also authorized to issue preferred stock.
Our debt agreements impose restrictions on VWR Funding’s ability to make payments to VWR Corporation, including for the purpose of paying dividends on capital stock. See Note 24.
Recapitalization
In anticipation of our IPO, we completed an internal recapitalization in 2014 pursuant to which all then outstanding equity was exchanged for 102.0 million shares of newly-issued common stock. We also amended and restated our certificate of incorporation and bylaws which resulted in the capitalization shown on our consolidated balance sheet and included a 102-for-1 stock split.
Initial Public Offering
In 2014, we completed an IPO, which included an additional sale to our underwriters, by issuing 29.4 million common shares at a price of $21.00 per share. After deducting underwriting discounts, the IPO resulted in net proceeds of $582.6 million.
In connection with the IPO, we entered into a number of other transactions:
• | We paid a $25.0 million dividend to VWR Holdings; |
• | We terminated a management services agreement with Madison Dearborn Partners and Avista Capital Partners and entered into an income tax receivable agreement with VWR Holdings (see Note 20); |
• | We awarded stock options to certain employees and directors under a new stock-based compensation plan and adopted the VWR Corporation Employee Stock Purchase Plan (see Note 13); |
• | We used the net proceeds from the IPO to repay debt. |
F-19
(13) | Share-Based Compensation |
The following table presents the components of share-based compensation expense, a component of selling, general and administrative expenses (in millions):
Year ended December 31, | |||||||||||||
Award type | 2015 | 2014 | 2013 | ||||||||||
2014 Plan | Stock options | $ | 4.4 | $ | 1.1 | $ | — | ||||||
VWR ESPP | Discounted shares of common stock | 0.2 | — | — | |||||||||
VWR Holdings Plan | Equity units of parent | 0.3 | 0.9 | 0.6 | |||||||||
Share-based compensation expense | $ | 4.9 | $ | 2.0 | $ | 0.6 | |||||||
At December 31, 2015, remaining share-based compensation expense of $15.5 million related to unvested awards will be recognized over a weighted average period of 2.0 years.
VWR Corporation 2014 Equity Incentive Plan
In connection with the IPO, the Board of Directors adopted the VWR Corporation 2014 Equity Incentive Plan (the “2014 Plan”). The 2014 Plan authorized up to 11.5 million shares of common stock to be issued in the form of stock options, stock appreciation rights, restricted stock or other stock-based awards. At December 31, 2015, 8.3 million shares were available for future issuance. No award shall be granted pursuant to the 2014 Plan on or after September 9, 2024.
Stock Options
The following table presents information about stock options under the 2014 Plan (in millions, except per share amounts and years):
Number of stock options | Weighted average exercise price per share | Aggregate intrinsic value | Weighted average remaining term in years | |||||||||
Outstanding at December 31, 2014 | 3.5 | $ | 21.02 | |||||||||
Forfeited | (0.3 | ) | 21.00 | |||||||||
Outstanding at December 31, 2015 | 3.2 | $ | 21.03 | $ | 23.6 | 5.8 | ||||||
Expected to vest at end of year | 3.1 | $ | 21.03 | $ | 22.3 | 5.8 | ||||||
Exercisable at end of year | 0.1 | 21.00 | 0.5 | 5.8 | ||||||||
The substantial majority of the stock options shown above were granted to employees in 2014. They vest 40% on the second anniversary of the date of grant and five percent quarterly thereafter through the fifth anniversary of the date of grant. All of the stock options have a seven-year term. Unvested stock options are forfeited in the event of termination of the recipient and fully vest upon a change in control.
The following table presents information about the fair value of stock options granted in 2014:
Weighted average grant date fair value | $ | 6.67 | |
Expected stock price volatility | 33 | % | |
Risk free interest rate | 1.76 | % | |
Expected life of options in years | 4.9 | ||
F-20
VWR Corporation Employee Stock Purchase Plan
The VWR ESPP is designed to encourage employees to become stockholders and to increase their ownership of our common stock. The VWR ESPP became effective October 7, 2014 with 2.0 million shares of common stock reserved for issuance. In 2015, 0.1 million shares of common stock were issued to employees for $1.3 million pursuant to the VWR ESPP. At December 31, 2015, 1.9 million shares were available for future issuance.
Share-based Compensation Related to our Parent
As previously discussed, the VWR Holdings Plan was created pursuant to which a special type of common unit was made available to certain employees (see Note 11). These units are accounted for by us as stock-based compensation. During all periods presented, share-based compensation related to our parent was not material to our consolidated financial statements.
(14) | Restructuring |
In September 2013, we initiated a global restructuring program designed to enhance our interaction with customers and suppliers, improve the efficiency of our operations and reduce operating expenses (the “Program”). The Program involved transitioning the management of our European organization from a national to regional basis, refining customer segmentation and focus within Europe and the United States and consolidating our leadership structure and operations in the Asia Pacific region. As part of the Program, we also exited a variety of relatively small distribution and other facilities in North America, Europe and Asia. The Program was designed to better serve customers and to improve operational efficiency, competitiveness and business profitability. Substantially all actions under the Program were completed by December 31, 2014 with only immaterial payments continuing thereafter.
Restructuring charges incurred under the Program were $32.5 million, of which $7.6 million related to the Americas segment and $24.9 million related to the EMEA-APAC segment. These charges were primarily included in selling, general and administrative expenses in our statements of operations. We expect that no additional charges will be incurred under the Program.
The following table presents changes to accrued restructuring charges under the Program (in millions):
Severance and termination benefits | Facilities-related and other | Total | |||||||||
Balance at December 31, 2012 | $ | — | $ | — | — | ||||||
Restructuring charges | 27.7 | 4.8 | 32.5 | ||||||||
Non-cash settlements | — | (4.0 | ) | (4.0 | ) | ||||||
Cash payments | (9.3 | ) | (0.2 | ) | (9.5 | ) | |||||
Balance at December 31, 2013 | 18.4 | 0.6 | 19.0 | ||||||||
Cash payments | (16.6 | ) | (0.2 | ) | (16.8 | ) | |||||
Balance at December 31, 2014 | $ | 1.8 | $ | 0.4 | $ | 2.2 | |||||
The non-cash settlements above related to an impairment of an amortizable intangible asset and provisions for inventories and trade accounts receivable related to our Asia Pacific operations. By December 31, 2015, substantially all remaining cash payments had been made.
F-21
(15) | Benefit Plans |
We sponsor a number of defined benefit plans for our employees worldwide. We present these plans as follows due to their differing geographies, characteristics and actuarial assumptions:
• | The defined benefit plan in the United States (the “U.S. Retirement Plan”) is a funded and tax-qualified defined benefit retirement plan that covers substantially all of our full-time U.S. employees who completed a year of service as of May 31, 2005. Benefits under this plan were frozen on May 31, 2005. We generally fund the minimum amount required by applicable laws and regulations. We use a December 31 measurement date for the U.S. Retirement Plan. In June 2014, we completed a partial settlement of the U.S. Retirement Plan by providing certain eligible participants their entire vested accrued benefit in a lump sum or annuity. |
• | The defined benefit plans in Germany, France and the United Kingdom are presented in the aggregate (the “German, French and UK Plans”). Our German subsidiaries have unfunded defined benefit pension plans for certain employees and retirees that are closed to new participants. Our French subsidiary has a funded defined benefit pension plan for a certain group of employees that is closed to new participants. Our UK subsidiary has funded defined benefit plans that are closed to new participants and frozen with respect to future accrual of benefits. We use a December 31 measurement date for the German, French and UK Plans. |
• | We sponsor certain other defined benefit plans that were not material individually or in the aggregate. |
We also sponsor a defined contribution plan for our employees in the United States, Canada and Puerto Rico that includes an employer match. The expense related to the employer match was $10.6 million, $10.7 million and $7.4 million for the years ended December 31, 2015, 2014 and 2013, respectively.
The following table presents information about our defined benefit plans (in millions):
U.S. Retirement Plan | German, French and UK Plans | ||||||||||||||
Year ended December 31, | Year ended December 31, | ||||||||||||||
2015 | 2014 | 2015 | 2014 | ||||||||||||
Change in projected benefit obligation: | |||||||||||||||
Beginning balance | $ | 189.1 | $ | 201.1 | $ | 180.3 | $ | 163.1 | |||||||
Service cost | 0.7 | 0.7 | 1.7 | 1.5 | |||||||||||
Interest cost | 7.7 | 8.4 | 5.1 | 6.6 | |||||||||||
Partial plan settlements | — | (35.8 | ) | — | — | ||||||||||
Actuarial (gain) loss | (9.7 | ) | 23.0 | (6.4 | ) | 28.9 | |||||||||
Benefits paid | (7.7 | ) | (8.3 | ) | (3.2 | ) | (3.5 | ) | |||||||
Currency translation | — | — | (13.5 | ) | (16.3 | ) | |||||||||
Ending balance | 180.1 | 189.1 | 164.0 | 180.3 | |||||||||||
Change in fair value of plan assets: | |||||||||||||||
Beginning balance | 241.2 | 253.0 | 83.0 | 83.7 | |||||||||||
Actual (loss) gain on plan assets | (10.7 | ) | 32.3 | 2.3 | 6.0 | ||||||||||
Company contributions | — | — | 6.1 | 1.1 | |||||||||||
Partial plan settlements | — | (35.8 | ) | — | — | ||||||||||
Benefits paid | (7.7 | ) | (8.3 | ) | (2.0 | ) | (2.6 | ) | |||||||
Currency translation | — | — | (4.7 | ) | (5.2 | ) | |||||||||
Ending balance | 222.8 | 241.2 | 84.7 | 83.0 | |||||||||||
Funded status at end of year | $ | 42.7 | $ | 52.1 | $ | (79.3 | ) | $ | (97.3 | ) | |||||
Accumulated benefit obligation at end of year | $ | 180.1 | $ | 189.1 | $ | 156.5 | $ | 171.1 | |||||||
Amounts recognized in consolidated balance sheets at end of year: | |||||||||||||||
Other assets | 42.7 | 52.1 | 0.8 | 0.7 | |||||||||||
Other liabilities | — | — | 80.1 | 98.0 | |||||||||||
Accumulated other comprehensive income (loss) | 7.9 | 23.1 | 53.1 | (60.7 | ) | ||||||||||
F-22
The amounts in accumulated other comprehensive income or loss that have not been recognized as net periodic pension income or cost at December 31, 2015 relate to actuarial gains or losses, none of which will be recognized for the US Retirement Plan and $3.3 million of which will be recognized for the German, French and UK Plans in 2016.
The following table presents the components of net periodic pension income or cost (in millions):
U.S. Retirement Plan | German, French and UK Plans | ||||||||||||||||||||||
Year ended December 31, | Year ended December 31, | ||||||||||||||||||||||
2015 | 2014 | 2013 | 2015 | 2014 | 2013 | ||||||||||||||||||
Service cost | $ | 0.7 | $ | 0.7 | $ | 0.7 | $ | 1.7 | $ | 1.5 | $ | 1.4 | |||||||||||
Interest cost | 7.7 | 8.4 | 8.7 | 5.1 | 6.6 | 5.9 | |||||||||||||||||
Expected return on plan assets | (14.2 | ) | (14.4 | ) | (15.7 | ) | (4.8 | ) | (5.7 | ) | (3.8 | ) | |||||||||||
Recognized net actuarial (gain) loss | — | (0.4 | ) | (0.1 | ) | 3.7 | 2.1 | 2.0 | |||||||||||||||
Gain from partial plan settlement | — | (6.9 | ) | — | — | — | — | ||||||||||||||||
Net periodic pension (income) cost | $ | (5.8 | ) | $ | (12.6 | ) | $ | (6.4 | ) | $ | 5.7 | $ | 4.5 | $ | 5.5 | ||||||||
For the years ended December 31, 2015, 2014 and 2013, the net unrealized gain (loss) recorded in other comprehensive income or loss was: (i) for the U.S. Retirement Plan, $(15.3) million, $(5.0) million and $7.4 million, respectively; and (ii) for the German, French and UK Plans, $3.9 million, $(26.3) million and $1.9 million, respectively. The amounts reclassified from accumulated other comprehensive income or loss into earnings are shown in the table above as recognized net actuarial gain or loss.
The following table presents the assumptions used to determine the projected benefit obligation and net periodic pension income:
U.S. Retirement Plan | German, French and UK Plans | ||||||||||||||||
Year ended December 31, | Year ended December 31, | ||||||||||||||||
2015 | 2014 | 2013 | 2015 | 2014 | 2013 | ||||||||||||
Projected benefit obligation at end of year: | |||||||||||||||||
Discount rate | 4.58 | % | 4.13 | % | 4.90 | % | 3.22 | % | 2.99 | % | 4.19 | % | |||||
Annual rate of compensation increase | — | — | — | 3.00 | % | 3.00 | % | 3.00 | % | ||||||||
Net periodic pension cost or income: | |||||||||||||||||
Discount rate | 4.13 | % | see below | 3.95 | % | 2.99 | % | 4.19 | % | 4.11 | % | ||||||
Expected rate of return on plan assets | 6.00 | % | 6.00 | % | 6.00 | % | 5.93 | % | 6.92 | % | 6.45 | % | |||||
Annual rate of compensation increase | — | — | — | 3.00 | % | 3.00 | % | 3.00 | % | ||||||||
We select our discount rates by reference to published bond yield curves. For the year ended December 31, 2014, we used discount rates of 4.34% and 4.90% to measure the net periodic pension income of the U.S. Retirement Plan subsequent and prior to the partial plan settlement that occurred on June 1, 2014, respectively.
The following table presents future benefits expected to be paid at December 31, 2015 (in millions):
U.S. Retirement Plan | German, French and UK Plans | ||||||
2016 | $ | 8.7 | $ | 3.4 | |||
2017 | 9.1 | 3.2 | |||||
2018 | 9.3 | 3.4 | |||||
2019 | 9.7 | 4.3 | |||||
2020 | 10.1 | 4.1 | |||||
2021 – 2025 | 53.0 | 29.0 | |||||
In 2016, we do not expect to make contributions to the U.S. Retirement Plan and we expect to make contributions of $0.9 million to the German, French and UK Plans.
F-23
The following table presents information about plan assets (in millions):
December 31, 2015 | December 31, 2014 | ||||||||||||||||||||||
Total | Type of fair value measurement | Total | Type of fair value measurement | ||||||||||||||||||||
Level 1 | Level 2 | Level 1 | Level 2 | ||||||||||||||||||||
U.S. Retirement Plan: | |||||||||||||||||||||||
Money market funds | $ | 1.4 | $ | — | $ | 1.4 | $ | 1.1 | $ | — | $ | 1.1 | |||||||||||
Fixed income funds | 171.4 | — | 171.4 | 187.7 | — | 187.7 | |||||||||||||||||
Equity funds | 50.0 | 18.2 | 31.8 | 52.4 | 19.1 | 33.3 | |||||||||||||||||
Total | $ | 222.8 | $ | 18.2 | $ | 204.6 | $ | 241.2 | $ | 19.1 | $ | 222.1 | |||||||||||
German, French and UK Plans: | |||||||||||||||||||||||
Insurance contracts | $ | 83.7 | $ | — | $ | 83.7 | $ | 82.6 | $ | — | $ | 82.6 | |||||||||||
Cash | 1.0 | 1.0 | — | 0.4 | 0.4 | — | |||||||||||||||||
Total | $ | 84.7 | $ | 1.0 | $ | 83.7 | $ | 83.0 | $ | 0.4 | $ | 82.6 | |||||||||||
As of December 31, 2015, the investment strategy of the U.S. Retirement Plan is to match the investment asset duration with the pension liability duration. This strategy, utilizing diversified fixed income funds, attempts to hedge the discount rate used to present value future pension obligations. The fixed income funds invest in long duration investment grade corporate bonds primarily across industrial, financial and utilities sectors and is managed by a single institution. Surplus assets, the fair market value of assets in excess of benefit obligations, are invested in equity funds. We estimate the future return on plan assets after considering prior performance, but primarily based upon the mix of assets and expectations for the long-term returns on those asset classes. Based on the target asset allocation for each asset class, the overall expected rate of return is adjusted for the historical experience and future expectations of returns as a result of active portfolio management as compared to the benchmark returns.
The German, French and UK Plans primarily invest in insurance contracts. The combined weighted target allocations for the underlying investments of such insurance contracts are approximately 70% equity index funds and 30% debt and other securities. The expected long-term rate of return on plan assets used in determining pension expense for non-U.S. plans is determined in a similar manner to the U.S. Retirement Plan.
(16) | Leases |
We lease office and warehouse space, vehicles and computer and office equipment under operating leases. Operating lease expense was $32.8 million, $35.5 million and $35.6 million for the years ended December 31, 2015, 2014 and 2013, respectively.
The following table presents future minimum lease payments under operating leases at December 31, 2015 (in millions):
2016 | $ | 29.9 | |
2017 | 24.7 | ||
2018 | 21.0 | ||
2019 | 15.7 | ||
2020 | 13.9 | ||
Thereafter | 38.1 | ||
Total minimum payments | $ | 143.3 | |
F-24
(17) | Other Income (Expense), net |
Other income (expense), net, consists primarily of foreign currency remeasurement gains and losses. Prior to September 2015, the translation of a significant amount of foreign-denominated debt on our U.S. dollar-denominated balance sheet was reported in other income (expense). Such gains or losses were unrealized until repayment of the debt and related primarily to the weakening or strengthening, respectively, of the euro against the U.S. dollar.
In March 2015 and September 2015, we designated new euro-denominated debt as hedges of our net investment in foreign operations with an objective of minimizing our earnings exposure to remeasurement gains and losses (see Note 9).
(18) | Income Taxes |
The following table presents information related to income taxes in the consolidated statements of operations (in millions):
Year ended December 31, | |||||||||||
2015 | 2014 | 2013 | |||||||||
Income (loss) before income taxes: | |||||||||||
United States | $ | 123.3 | $ | 121.4 | $ | (56.6 | ) | ||||
Foreign | 106.8 | 116.0 | 79.1 | ||||||||
Total | $ | 230.1 | $ | 237.4 | $ | 22.5 | |||||
Income tax provision: | |||||||||||
Current income tax provision: | |||||||||||
Federal | $ | 5.1 | $ | 3.8 | $ | 0.4 | |||||
State | 0.8 | 0.6 | 0.3 | ||||||||
Foreign | 42.6 | 46.5 | 36.6 | ||||||||
Total | 48.5 | 50.9 | 37.3 | ||||||||
Deferred income tax provision (benefit): | |||||||||||
Federal | 38.3 | 40.1 | (6.5 | ) | |||||||
State | 0.9 | 4.3 | (1.0 | ) | |||||||
Foreign | (11.9 | ) | (10.5 | ) | (21.4 | ) | |||||
Total | 27.3 | 33.9 | (28.9 | ) | |||||||
Total income tax provision | $ | 75.8 | $ | 84.8 | $ | 8.4 | |||||
The following table presents the reconciliation of the income tax provision calculated at the United States statutory federal income tax rate of 35% to the amounts presented in the statements of operations (in millions):
Year ended December 31, | |||||||||||
2015 | 2014 | 2013 | |||||||||
Income tax provision at United States federal statutory rate | $ | 80.5 | $ | 83.1 | $ | 7.9 | |||||
State income taxes, net of federal benefit | 1.4 | 3.3 | (0.4 | ) | |||||||
Change in foreign tax rates | (4.5 | ) | — | (8.5 | ) | ||||||
Foreign rate differential | (11.0 | ) | (10.4 | ) | (4.9 | ) | |||||
Nondeductible expenses | (0.2 | ) | 1.3 | 0.6 | |||||||
Changes to valuation allowance not included above | 5.1 | 5.6 | 12.5 | ||||||||
Other, net | 4.5 | 1.9 | 1.2 | ||||||||
Income tax provision | $ | 75.8 | $ | 84.8 | $ | 8.4 | |||||
F-25
The following table presents information about deferred tax assets and liabilities (in millions):
December 31, | |||||||
2015 | 2014 | ||||||
Deferred tax assets: | |||||||
Net operating loss carryforwards | $ | 136.2 | $ | 239.5 | |||
Currency translation | 0.8 | — | |||||
Other | 39.5 | 36.9 | |||||
Deferred tax assets, gross | 176.5 | 276.4 | |||||
Valuation allowances | (102.5 | ) | (110.0 | ) | |||
Deferred tax assets, net | 74.0 | 166.4 | |||||
Deferred tax liabilities: | |||||||
Intangible assets | (467.2 | ) | (514.4 | ) | |||
Goodwill amortization | (38.2 | ) | (35.9 | ) | |||
Currency translation | — | (30.7 | ) | ||||
Other | (16.2 | ) | (21.1 | ) | |||
Total deferred tax liabilities | (521.6 | ) | (602.1 | ) | |||
Net deferred tax liability | $ | (447.6 | ) | $ | (435.7 | ) | |
Classification on consolidated balance sheets: | |||||||
Other current assets | $ | — | $ | 14.4 | |||
Other assets | 11.9 | 17.0 | |||||
Other current liabilities | — | (4.9 | ) | ||||
Deferred income tax liabilities | (459.5 | ) | (462.2 | ) | |||
Net deferred tax liability | $ | (447.6 | ) | $ | (435.7 | ) | |
The (decrease) increase to the valuation allowance for the years ended December 31, 2015, 2014 and 2013 was $(7.5) million, $(9.3) million and $23.9 million, respectively.
At December 31, 2015, the valuation allowances presented above relate to intercompany transactions, foreign net operating loss carryforwards, foreign tax credit carryforwards, short-lived state net operating losses and other deferred tax assets that are not expected to be realized. We evaluate the realization of deferred tax assets by considering such factors as the reversal of existing taxable temporary differences, expected profitability by tax jurisdiction and available carryforward periods. The extent and timing of any such reversals will influence the extent of tax benefits recognized in a particular year. Should applicable losses, credits and deductions ultimately be realized, the resulting reduction in the valuation allowance would generally be recognized as a component of our income tax provision or benefit.
F-26
Uncertain Tax Positions
We conduct business globally, causing us to file income tax returns in the United States federal jurisdiction and various state and foreign jurisdictions. In the normal course of business, we are subject to examination by taxing authorities, including jurisdictions in which we have significant operations such as Germany, France, the UK, Belgium, Sweden, Canada, Switzerland and the United States. We have concluded substantially all income tax matters (i) in the United States through 2005 and (ii) in the foreign jurisdictions noted above through 2010.
The development of reserves for uncertain tax positions requires judgments about tax issues, potential outcomes and timing of settlement discussions with tax authorities. If we were to prevail on all uncertain tax positions, we would recognize a benefit to our income tax provision.
The following table reflects changes to the reserve for uncertain tax positions (in millions):
Year ended December 31, | |||||||||||
2015 | 2014 | 2013 | |||||||||
Beginning balance | $ | 61.7 | $ | 57.9 | $ | 46.5 | |||||
Additions: | |||||||||||
Tax positions related to the current year | 1.7 | 5.1 | 14.0 | ||||||||
Tax positions related to prior years | 0.3 | 0.3 | 0.1 | ||||||||
Reductions: | |||||||||||
Tax positions related to prior years | (0.2 | ) | (0.1 | ) | (1.1 | ) | |||||
Settlements with taxing authorities | (0.1 | ) | (0.3 | ) | (1.2 | ) | |||||
Lapse of statutes of limitations | (0.6 | ) | (0.4 | ) | (0.4 | ) | |||||
Currency translation | (0.6 | ) | (0.8 | ) | — | ||||||
Ending balance | $ | 62.2 | $ | 61.7 | $ | 57.9 | |||||
The amounts above exclude accrued interest and penalties of $1.0 million and $0.7 million at December 31, 2015 and 2014, respectively. We expect a reduction in the liability for uncertain tax positions of up to $1.2 million over the next twelve months as a result of settlements with taxing authorities and the lapse of statutes of limitations.
Other Matters
Neither income taxes nor foreign withholding taxes have been provided on $789.8 million of cumulative undistributed earnings of foreign subsidiaries as of December 31, 2015. These earnings are considered permanently invested in the business. We make an evaluation at the end of each reporting period as to whether or not some or all of the undistributed earnings are permanently reinvested. Future changes in facts and circumstances could require us to recognize income tax liabilities on the assumption that our foreign undistributed earnings will be distributed to the United States in a manner that attracts a net tax cost. At this time, a determination of the amount of unrecognized deferred tax liabilities is not practicable because of the complexities associated with its hypothetical calculation.
At December 31, 2015, we had federal net operating loss carryforwards of $237.5 million that begin to expire in 2025 and state net operating loss carryforwards of $170.7 million, with a corresponding state tax benefit of $6.2 million, that expire at various times through 2034. In addition, we had foreign net operating loss carryforwards of $302.6 million, which predominantly have indefinite expirations. Further, there are U.S. foreign tax credit carryforwards of $1.0 million that will expire at various times through 2016.
We have entered into an agreement that provides for the payment to VWR Holdings of the majority of cash savings, if any, in U.S. federal, state and local income tax as a result of the utilization of net operating losses generated in periods prior to the IPO. See Note 20.
We file a consolidated federal and certain state combined income tax returns with our domestic subsidiaries.
F-27
(19) | Comprehensive Income or Loss |
The following table presents changes in the components of accumulated other comprehensive income (loss), net of tax (in millions):
Foreign currency translation | Derivative instruments | Defined benefit plans | Total | ||||||||||||
Balance at December 31, 2012 | $ | (27.3 | ) | $ | (1.3 | ) | $ | (20.8 | ) | $ | (49.4 | ) | |||
Net unrealized gain arising during the period | 40.6 | 2.6 | 10.6 | 53.8 | |||||||||||
Reclassification of net (gain) loss into earnings | — | (3.4 | ) | 1.5 | (1.9 | ) | |||||||||
Balance at December 31, 2013 | 13.3 | (2.1 | ) | (8.7 | ) | 2.5 | |||||||||
Net unrealized (loss) gain arising during the period | (204.2 | ) | 0.7 | (27.0 | ) | (230.5 | ) | ||||||||
Reclassification of net loss (gain) into earnings | — | 1.1 | (3.0 | ) | (1.9 | ) | |||||||||
Balance at December 31, 2014 | (190.9 | ) | (0.3 | ) | (38.7 | ) | (229.9 | ) | |||||||
Net unrealized (loss) gain arising during the period | (174.4 | ) | 3.0 | (7.0 | ) | (178.4 | ) | ||||||||
Reclassification of net (gain) loss into earnings | — | (0.7 | ) | 2.7 | 2.0 | ||||||||||
Balance at December 31, 2015 | $ | (365.3 | ) | $ | 2.0 | $ | (43.0 | ) | $ | (406.3 | ) | ||||
The following table presents details about the reclassification of net (gain) loss from accumulated other comprehensive income or loss into earnings (in millions):
Year ended December 31, | |||||||||||
2015 | 2014 | 2013 | |||||||||
Derivative instruments: | |||||||||||
Cost of goods sold | $ | (2.3 | ) | $ | 0.6 | $ | (5.5 | ) | |||
Interest expense | 0.3 | 0.6 | 0.6 | ||||||||
Loss on extinguishment of debt | 0.7 | 0.5 | 0.4 | ||||||||
Income tax provision | 0.6 | (0.6 | ) | 1.1 | |||||||
Net income | $ | (0.7 | ) | $ | 1.1 | $ | (3.4 | ) | |||
Defined benefit plans: | |||||||||||
Selling, general and administrative expenses | $ | 3.9 | $ | (5.3 | ) | $ | 2.1 | ||||
Income tax provision | (1.2 | ) | 2.3 | (0.6 | ) | ||||||
Net income | $ | 2.7 | $ | (3.0 | ) | $ | 1.5 | ||||
The following table presents the income tax effects of the components of comprehensive income or loss (in millions):
Year ended December 31, | |||||||||||
2015 | 2014 | 2013 | |||||||||
Foreign currency translation: | |||||||||||
Net unrealized income tax provision arising during the period | $ | (1.5 | ) | $ | — | $ | — | ||||
Derivative instruments: | |||||||||||
Net unrealized income tax provision arising during the period | (1.8 | ) | (0.2 | ) | (0.9 | ) | |||||
Reclassification of net income tax provision (benefit) into earnings | 0.6 | (0.6 | ) | 1.1 | |||||||
Defined benefit plans: | |||||||||||
Net unrealized income tax benefit (provision) arising during the period | 4.8 | 10.1 | (4.4 | ) | |||||||
Reclassification of net income tax (benefit) provision into earnings | (1.2 | ) | 2.3 | (0.6 | ) | ||||||
F-28
(20) | Related Party Transactions |
Management Services Agreement
Prior to the completion of the IPO, we were party to a management services agreement with Madison Dearborn Partners and Avista Capital Partners. Pursuant to the agreement, we were provided with management, consulting, financial, board-level and other advisory services for an annual fee of $2.0 million. Madison Dearborn Partners and Avista Capital Partners agreed to terminate this agreement in connection with the IPO. As a result, we are incurring additional fees to our Board of Directors of $0.3 million annually.
Due to VWR Holdings — ITRA
We are party to an ITRA with VWR Holdings. The ITRA provides for the payment of 85% of the amount of cash savings, if any, in U.S. federal, state and local income tax realized as a result of utilizing net operating losses that were generated in periods prior to the IPO. As noted previously, Madison Dearborn Partners own a controlling interest in VWR Holdings.
The timing of payments under the ITRA corresponds to the year in which the net operating loss carryforwards are claimed on our tax return. We made a payment under the ITRA of $9.8 million during the year ended December 31, 2015. At December 31, 2015, the liability due to VWR Holdings under the ITRA was $163.1 million, $78.1 million of which is classified as current and represents the payment that will become due in the beginning of 2016.
Registration Rights Agreement
For the year ended December 31, 2015, VWR Holdings completed registered sales of 31.1 million shares of our common stock. We received no proceeds from these sales and issued no additional shares of our common stock. Pursuant to our registration rights agreement with VWR Holdings (see Note 10), we incurred expenses of $1.5 million in connection with the registrations and the sales of common stock.
(21) | Risks and Uncertainties |
Testing Goodwill, the VWR Tradename and Other Indefinite-Lived Intangible Assets for Impairment
On October 1 of each year, we perform annual impairment testing of our goodwill, the VWR tradename and our other indefinite-lived intangible assets. The impairment testing requires us to estimate the fair value of these assets, which requires significant judgment from management.
We experienced growth across our business in 2015 and 2014 and experienced a number of favorable trends in our business, which generally caused us to increase the projected cash flows of our reporting units and generally resulted in increases to the estimated fair value of our goodwill and our indefinite-lived intangible assets compared to prior periods. However, future changes in our estimates or judgments could reduce our fair value measurements, which could in turn result in an impairment charge. For example, our expected net sales, cash flow performance or market conditions could be adversely affected due to, among other things, negative macroeconomic or industry-specific factors. In 2011 and 2010, we recognized impairment charges of $3.3 million and $48.1 million, respectively, related primarily to factors specific to the science education industry, while in 2008, we recognized impairment charges of $392.1 million related primarily to macroeconomic factors. We could also experience adverse changes in market factors such as discount rates, valuation multiples derived from comparable publicly-traded companies, a decline in the trading price of our common stock or control premiums derived from market transactions.
At October 1, 2015, the estimated fair value of the VWR tradename, which comprises substantially all of our indefinite-lived intangible assets, exceeded its carrying value by over $200 million, and the estimated fair values of our Americas and EMEA-APAC reporting units exceeded their carrying values by over $800 million and over $1,000 million, respectively.
F-29
Testing Long-Lived Assets for Impairment
We have acquired 41 businesses since June 2007. Following their recognition in business combinations, we are required to monitor goodwill and other long-lived assets for possible indicators of impairment. If identified, we are required to perform impairment testing, which may require us to estimate the fair value of those assets. Estimating fair value requires management to exercise considerable judgment.
Based on a review of financial performance in September 2015, we decreased our forecast of the profitability of a business in our EMEA-APAC segment. We considered this to be an indicator of impairment and performed impairment testing on the asset group, recording impairment charges of $3.2 million primarily related to an amortizable intangible asset for the year ended December 31, 2015. See Note 9 for more information about fair value measurements. Should we identify other indicators of impairment related to long-lived assets in future periods, we may be required to recognize additional impairment charges.
Strengthening of the U.S. Dollar
Our operations span the globe. A significant portion of our net sales and our total assets are denominated in currencies other than the U.S. dollar — principally the euro, as well as the British pound sterling, the Canadian dollar and the Swiss franc. In addition, we carry a significant amount of euro-denominated debt on our U.S. dollar-denominated balance sheet. As a result, changes in foreign currency exchange rates impact our reported results.
During the second half of 2014, the U.S. dollar strengthened considerably against most foreign currencies, including the euro. This negatively impacted our foreign-denominated results and net asset values in 2015 and 2014 and caused us to record remeasurement gains on our euro-denominated debt within other income (expense), net for those same periods. If the U.S. dollar strengthens further, it would have similar effects in 2016.
During 2015, we designated hedges that reduced our exposures to both foreign currency remeasurement recorded in earnings and to changes in the value of our net investment in euro-denominated foreign operations. For more information, see Note 9.
Significant Concentrations
The largest supplier in the Americas and the largest supplier in EMEA-APAC each accounted for 9% and 11%, respectively, of that segment’s 2015 cost of goods sold.
In April 2014, we began operating under new, non-exclusive chemical distribution agreements with our top supplier in EMEA-APAC that extend through December 2018. These new agreements cover a portion of our overall sales of products from that supplier in Europe. The economics of these new agreements are less favorable to us than our previous agreements. That supplier has the right to terminate these agreements if certain events occur.
F-30
(22) | Segment Financial Information |
We report financial results on the basis of two reportable segments organized by geographic region: the Americas and EMEA-APAC. Both the Americas and EMEA-APAC segments provide laboratory products, services and solutions to customers in the life science, general research and applied markets, including the pharmaceutical, biotechnology, agricultural, chemical, environmental, food and beverage, health care, microelectronic and petrochemical industries, as well as governmental agencies, universities and research institutes and environmental organizations. Corporate costs are managed centrally and attributed to the Americas segment.
The following tables present segment financial information (in millions):
Year ended December 31, | |||||||||||
2015 | 2014 | 2013 | |||||||||
Net sales: | |||||||||||
Americas | $ | 2,577.3 | $ | 2,430.1 | $ | 2,352.7 | |||||
EMEA-APAC | 1,741.5 | 1,945.2 | 1,835.1 | ||||||||
Total | $ | 4,318.8 | $ | 4,375.3 | $ | 4,187.8 | |||||
Operating income: | |||||||||||
Americas | $ | 162.5 | $ | 141.0 | $ | 115.8 | |||||
EMEA-APAC | 157.7 | 176.9 | 138.2 | ||||||||
Total | $ | 320.2 | $ | 317.9 | $ | 254.0 | |||||
Capital expenditures: | |||||||||||
Americas | $ | 30.5 | $ | 22.2 | $ | 22.9 | |||||
EMEA-APAC | 10.4 | 11.4 | 22.4 | ||||||||
Total | $ | 40.9 | $ | 33.6 | $ | 45.3 | |||||
Depreciation and amortization: | |||||||||||
Americas | $ | 82.1 | $ | 77.8 | $ | 75.1 | |||||
EMEA-APAC | 42.4 | 51.5 | 54.9 | ||||||||
Total | $ | 124.5 | $ | 129.3 | $ | 130.0 | |||||
December 31, | |||||||
2015 | 2014 | ||||||
Total assets: | |||||||
Americas | $ | 2,867.6 | $ | 2,894.3 | |||
EMEA-APAC | 1,926.2 | 2,082.8 | |||||
Total | $ | 4,793.8 | $ | 4,977.1 | |||
Inter-segment activity has been eliminated; therefore, net sales for each reportable segment are all from external customers.
We determined that disclosing net sales for each group of similar customers, products and services would be impracticable.
F-31
The following tables present net sales and long-lived assets by geographic area (in millions):
Year ended December 31, | |||||||||||
2015 | 2014 | 2013 | |||||||||
Net sales: | |||||||||||
United States | $ | 2,355.9 | $ | 2,188.2 | $ | 2,077.7 | |||||
International | 1,962.9 | 2,187.1 | 2,110.1 | ||||||||
Total | $ | 4,318.8 | $ | 4,375.3 | $ | 4,187.8 | |||||
December 31, | |||||||
2015 | 2014 | ||||||
Long-lived assets: | |||||||
United States | $ | 139.9 | $ | 133.1 | |||
International | 88.3 | 98.4 | |||||
Total | $ | 228.2 | $ | 231.5 | |||
(23) | Unaudited Quarterly Financial Information |
The following tables present unaudited quarterly financial information (in millions, except per share data):
Year ended December 31, 2015 | |||||||||||||||
First | Second | Third | Fourth | ||||||||||||
Net sales | $ | 1,029.6 | $ | 1,081.2 | $ | 1,095.5 | $ | 1,112.5 | |||||||
Gross profit | 291.2 | 298.5 | 299.5 | 307.9 | |||||||||||
Net income | 71.5 | 18.3 | 11.0 | 53.5 | |||||||||||
Earnings per share: | |||||||||||||||
Basic | 0.54 | 0.14 | 0.08 | 0.41 | |||||||||||
Diluted | 0.54 | 0.14 | 0.08 | 0.41 | |||||||||||
Year ended December 31, 2014 | |||||||||||||||
First | Second | Third | Fourth | ||||||||||||
Net sales | $ | 1,056.6 | $ | 1,102.7 | $ | 1,114.4 | $ | 1,101.6 | |||||||
Gross profit | 312.6 | 311.3 | 310.5 | 309.0 | |||||||||||
Net income | 17.4 | 16.6 | 69.8 | 48.8 | |||||||||||
Earnings per share: | |||||||||||||||
Basic | 50.00 | 40.00 | 0.97 | 0.38 | |||||||||||
Diluted | 50.00 | 40.00 | 0.97 | 0.38 | |||||||||||
F-32
(24) | Condensed Parent Company Only Financial Statements |
Our subsidiaries are party to certain debt agreements that restrict their ability to pay dividends or make other distributions to us, subject to limited exceptions. As of December 31, 2015, $1,326.2 million of the net assets of our subsidiaries were subject to those restrictions. Such net assets are restricted from being transferred to us in the form of loans, advances or cash dividends except as permitted pursuant to those debt agreements.
Pursuant to the regulations of the Securities and Exchange Commission, the following presents condensed financial information as to the financial position, results of operations and cash flows of VWR Corporation on an unconsolidated basis. The related disclosures required by those regulations are provided elsewhere in the consolidated financial statements.
Condensed Parent Company Only Balance Sheets
(in millions, except per share data)
December 31, | |||||||
2015 | 2014 | ||||||
Assets | |||||||
Investment in unconsolidated subsidiaries | $ | 1,538.3 | $ | 1,564.0 | |||
Total assets | $ | 1,538.3 | $ | 1,564.0 | |||
Liabilities, Redeemable Equity and Stockholders’ Equity | |||||||
Current liabilities: | |||||||
Current amount due to VWR Holdings — ITRA | $ | 78.1 | 9.8 | ||||
Total current liabilities | 78.1 | 9.8 | |||||
Amount due to VWR Holdings — ITRA, net of current portion | 85.0 | 163.1 | |||||
Total liabilities | 163.1 | 172.9 | |||||
Redeemable equity, at redemption value | 38.8 | 51.4 | |||||
Stockholders’ equity: | |||||||
Preferred stock, $0.01 par value; 50.0 shares authorized, no shares issued and outstanding | — | — | |||||
Common stock, $0.01 par value; 750.0 shares authorized, 131.4 shares issued and outstanding | 1.3 | 1.3 | |||||
Additional paid-in capital | 1,735.1 | 1,716.3 | |||||
Retained earnings (accumulated deficit) | 6.3 | (148.0 | ) | ||||
Accumulated other comprehensive loss | (406.3 | ) | (229.9 | ) | |||
Total stockholders’ equity | 1,336.4 | 1,339.7 | |||||
Total liabilities, redeemable equity and stockholders’ equity | $ | 1,538.3 | $ | 1,564.0 | |||
Condensed Parent Company Only Statements of Operations
(in millions)
Year ended December 31, | |||||||||||
2015 | 2014 | 2013 | |||||||||
Equity in earnings of unconsolidated subsidiaries, net of tax | $ | 154.3 | $ | 152.6 | $ | 14.1 | |||||
Net income | 154.3 | 152.6 | 14.1 | ||||||||
Accretion of dividends on redeemable convertible preferred stock | — | (29.4 | ) | (47.9 | ) | ||||||
Net income (loss) applicable to common stockholders | $ | 154.3 | $ | 123.2 | $ | (33.8 | ) | ||||
F-33
Condensed Parent Company Only Statements of Cash Flows
(in millions)
Year ended December 31, | |||||||||||
2015 | 2014 | 2013 | |||||||||
Net cash from operating activities | $ | — | $ | — | $ | — | |||||
Net cash from investing activities | — | — | — | ||||||||
Cash flows from financing activities: | |||||||||||
Proceeds from issuance of common stock, net of underwriting discounts | 1.3 | 582.6 | — | ||||||||
Proceeds from issuance of redeemable equity | — | — | 1.4 | ||||||||
Payment of stock issuance costs | — | (4.8 | ) | — | |||||||
Capital contributed to unconsolidated subsidiaries | (1.3 | ) | (577.8 | ) | (1.4 | ) | |||||
Receipt of dividends from unconsolidated subsidiaries | — | 33.9 | 6.3 | ||||||||
Payment of dividends to VWR Holdings | — | (25.0 | ) | — | |||||||
Repurchases of redeemable equity | — | (8.9 | ) | (6.3 | ) | ||||||
Net cash from financing activities | — | — | — | ||||||||
Net change in cash and cash equivalents | — | — | — | ||||||||
Cash and cash equivalents beginning of period | — | — | — | ||||||||
Cash and cash equivalents end of period | $ | — | $ | — | $ | — | |||||
(25) | Valuation and Qualifying Accounts |
The following table presents changes to our valuation and qualifying accounts (in millions):
Beginning balance | Charged to costs and expenses | Deductions(1) | Currency translation | Ending balance | |||||||||||||||
Year ended December 31, 2015: | |||||||||||||||||||
Reserves on trade accounts receivable | $ | 12.2 | $ | 3.3 | $ | (2.6 | ) | $ | (0.9 | ) | $ | 12.0 | |||||||
Valuation allowances on deferred taxes | 110.0 | 3.3 | — | (10.8 | ) | 102.5 | |||||||||||||
Year ended December 31, 2014: | |||||||||||||||||||
Reserves on trade accounts receivable | 14.8 | 2.4 | (4.2 | ) | (0.8 | ) | 12.2 | ||||||||||||
Valuation allowances on deferred taxes | 119.3 | 2.5 | — | (11.8 | ) | 110.0 | |||||||||||||
Year ended December 31, 2013: | |||||||||||||||||||
Reserves on trade accounts receivable | 14.4 | 0.1 | — | 0.3 | 14.8 | ||||||||||||||
Valuation allowances on deferred taxes | 95.4 | 19.9 | — | 4.0 | 119.3 | ||||||||||||||
(1) | Deductions represent bad debts charged off, net of recoveries. |
F-34