Attached files
| file | filename |
|---|---|
| 8-K - 8-K - SPIRIT REALTY CAPITAL, INC. | q42015earningsreleasecover.htm |
| EX-99.1 - EXHIBIT 99.1 - SPIRIT REALTY CAPITAL, INC. | earningsreleaseq42015.htm |
NYSE:SRC Supplemental Financial & Operating Information FOURTH QUARTER ENDED DECEMBER 31, 2015
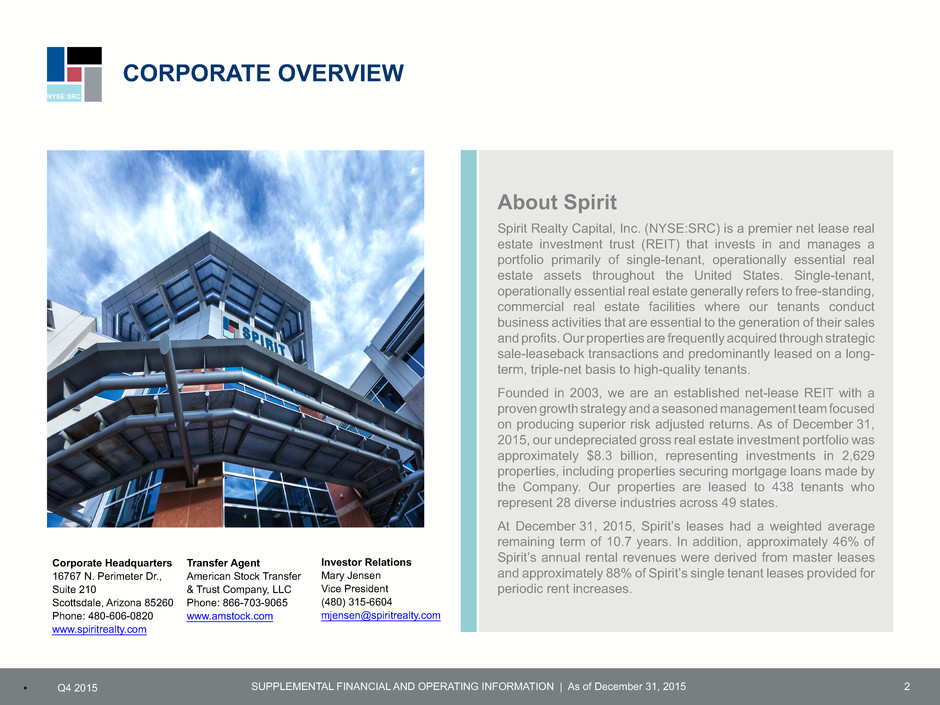
NYSE:SRC SUPPLEMENTAL FINANCIAL AND OPERATING INFORMATION | As of December 31, 2015▪ Q4 2015 About Spirit Spirit Realty Capital, Inc. (NYSE:SRC) is a premier net lease real estate investment trust (REIT) that invests in and manages a portfolio primarily of single-tenant, operationally essential real estate assets throughout the United States. Single-tenant, operationally essential real estate generally refers to free-standing, commercial real estate facilities where our tenants conduct business activities that are essential to the generation of their sales and profits. Our properties are frequently acquired through strategic sale-leaseback transactions and predominantly leased on a long- term, triple-net basis to high-quality tenants. Founded in 2003, we are an established net-lease REIT with a proven growth strategy and a seasoned management team focused on producing superior risk adjusted returns. As of December 31, 2015, our undepreciated gross real estate investment portfolio was approximately $8.3 billion, representing investments in 2,629 properties, including properties securing mortgage loans made by the Company. Our properties are leased to 438 tenants who represent 28 diverse industries across 49 states. At December 31, 2015, Spirit’s leases had a weighted average remaining term of 10.7 years. In addition, approximately 46% of Spirit’s annual rental revenues were derived from master leases and approximately 88% of Spirit’s single tenant leases provided for periodic rent increases. 2 CORPORATE OVERVIEW Corporate Headquarters 16767 N. Perimeter Dr., Suite 210 Scottsdale, Arizona 85260 Phone: 480-606-0820 www.spiritrealty.com Transfer Agent American Stock Transfer & Trust Company, LLC Phone: 866-703-9065 www.amstock.com Investor Relations Mary Jensen Vice President (480) 315-6604 mjensen@spiritrealty.com
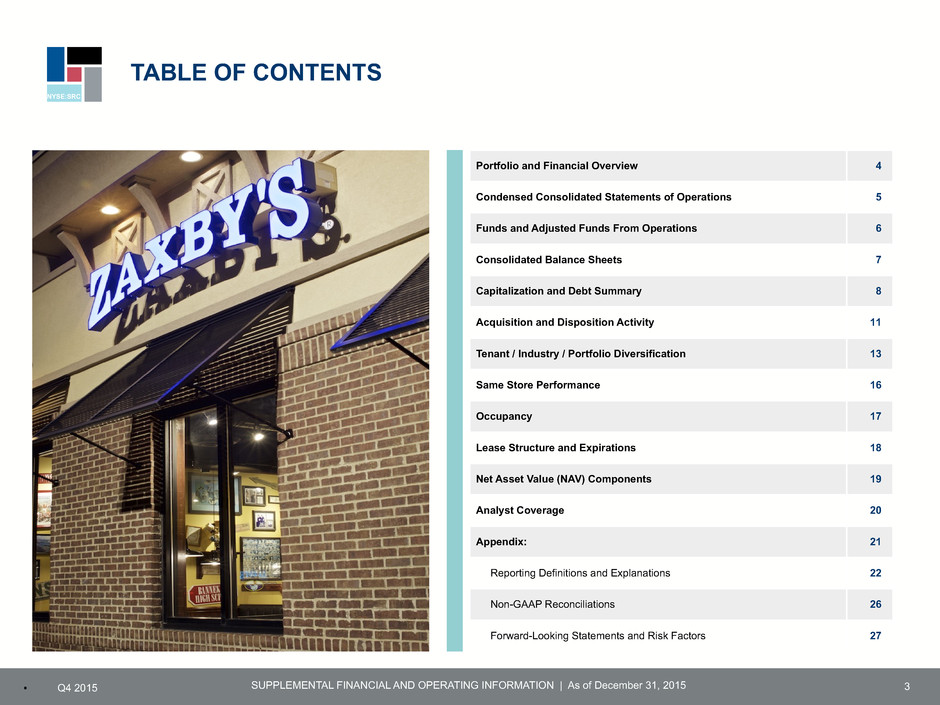
NYSE:SRC SUPPLEMENTAL FINANCIAL AND OPERATING INFORMATION | As of December 31, 2015▪ Q4 2015 TABLE OF CONTENTS 3 Portfolio and Financial Overview 4 Condensed Consolidated Statements of Operations 5 Funds and Adjusted Funds From Operations 6 Consolidated Balance Sheets 7 Capitalization and Debt Summary 8 Acquisition and Disposition Activity 11 Tenant / Industry / Portfolio Diversification 13 Same Store Performance 16 Occupancy 17 Lease Structure and Expirations 18 Net Asset Value (NAV) Components 19 Analyst Coverage 20 Appendix: 21 Reporting Definitions and Explanations 22 Non-GAAP Reconciliations 26 Forward-Looking Statements and Risk Factors 27
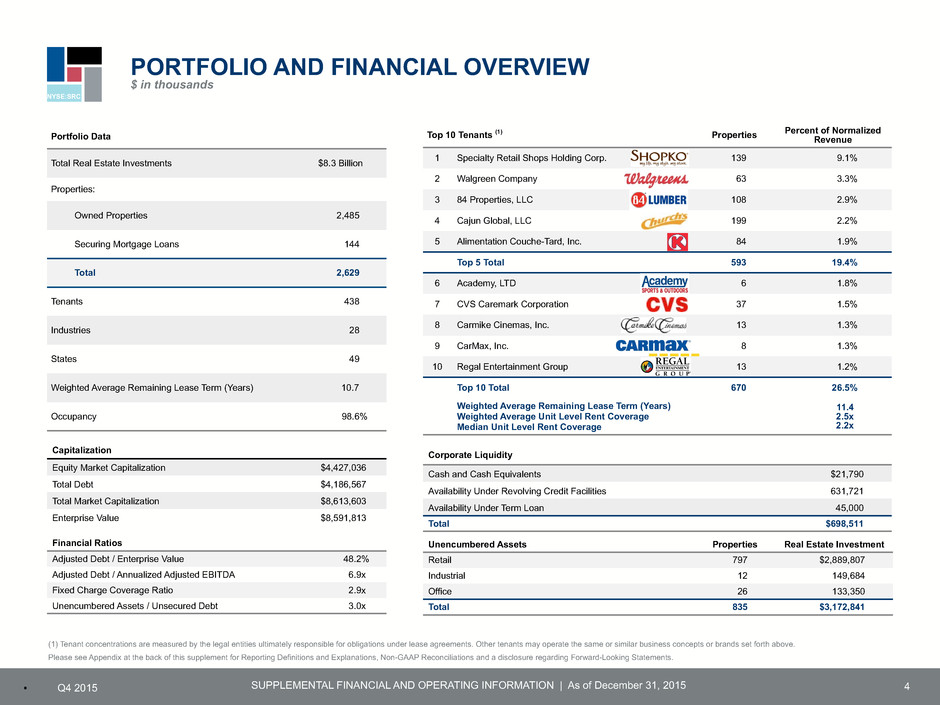
NYSE:SRC SUPPLEMENTAL FINANCIAL AND OPERATING INFORMATION | As of December 31, 2015▪ Q4 2015 PORTFOLIO AND FINANCIAL OVERVIEW $ in thousands 4 Portfolio Data Total Real Estate Investments $8.3 Billion Properties: Owned Properties 2,485 Securing Mortgage Loans 144 Total 2,629 Tenants 438 Industries 28 States 49 Weighted Average Remaining Lease Term (Years) 10.7 Occupancy 98.6% Capitalization Equity Market Capitalization $4,427,036 Total Debt $4,186,567 Total Market Capitalization $8,613,603 Enterprise Value $8,591,813 Financial Ratios Adjusted Debt / Enterprise Value 48.2% Adjusted Debt / Annualized Adjusted EBITDA 6.9x Fixed Charge Coverage Ratio 2.9x Unencumbered Assets / Unsecured Debt 3.0x Top 10 Tenants (1) Properties Percent of NormalizedRevenue 1 Specialty Retail Shops Holding Corp. 139 9.1% 2 Walgreen Company 63 3.3% 3 84 Properties, LLC 108 2.9% 4 Cajun Global, LLC 199 2.2% 5 Alimentation Couche-Tard, Inc. 84 1.9% Top 5 Total 593 19.4% 6 Academy, LTD 6 1.8% 7 CVS Caremark Corporation 37 1.5% 8 Carmike Cinemas, Inc. 13 1.3% 9 CarMax, Inc. 8 1.3% 10 Regal Entertainment Group 13 1.2% Top 10 Total 670 26.5% Weighted Average Remaining Lease Term (Years) Weighted Average Unit Level Rent Coverage Median Unit Level Rent Coverage 11.4 2.5x 2.2x Corporate Liquidity Cash and Cash Equivalents $21,790 Availability Under Revolving Credit Facilities 631,721 Availability Under Term Loan 45,000 Total $698,511 Unencumbered Assets Properties Real Estate Investment Retail 797 $2,889,807 Industrial 12 149,684 Office 26 133,350 Total 835 $3,172,841 (1) Tenant concentrations are measured by the legal entities ultimately responsible for obligations under lease agreements. Other tenants may operate the same or similar business concepts or brands set forth above. Please see Appendix at the back of this supplement for Reporting Definitions and Explanations, Non-GAAP Reconciliations and a disclosure regarding Forward-Looking Statements.
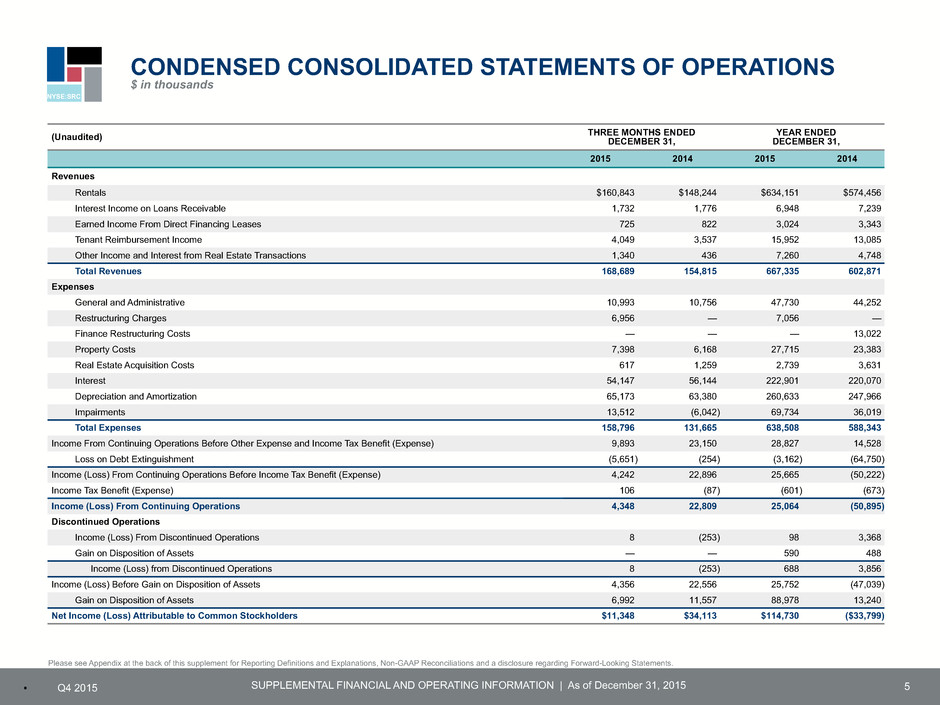
NYSE:SRC SUPPLEMENTAL FINANCIAL AND OPERATING INFORMATION | As of December 31, 2015▪ Q4 2015 CONDENSED CONSOLIDATED STATEMENTS OF OPERATIONS $ in thousands 5 (Unaudited) THREE MONTHS ENDED DECEMBER 31, YEAR ENDED DECEMBER 31, 2015 2014 2015 2014 Revenues Rentals $160,843 $148,244 $634,151 $574,456 Interest Income on Loans Receivable 1,732 1,776 6,948 7,239 Earned Income From Direct Financing Leases 725 822 3,024 3,343 Tenant Reimbursement Income 4,049 3,537 15,952 13,085 Other Income and Interest from Real Estate Transactions 1,340 436 7,260 4,748 Total Revenues 168,689 154,815 667,335 602,871 Expenses General and Administrative 10,993 10,756 47,730 44,252 Restructuring Charges 6,956 — 7,056 — Finance Restructuring Costs — — — 13,022 Property Costs 7,398 6,168 27,715 23,383 Real Estate Acquisition Costs 617 1,259 2,739 3,631 Interest 54,147 56,144 222,901 220,070 Depreciation and Amortization 65,173 63,380 260,633 247,966 Impairments 13,512 (6,042) 69,734 36,019 Total Expenses 158,796 131,665 638,508 588,343 Income From Continuing Operations Before Other Expense and Income Tax Benefit (Expense) 9,893 23,150 28,827 14,528 Loss on Debt Extinguishment (5,651) (254) (3,162) (64,750) Income (Loss) From Continuing Operations Before Income Tax Benefit (Expense) 4,242 22,896 25,665 (50,222) Income Tax Benefit (Expense) 106 (87) (601) (673) Income (Loss) From Continuing Operations 4,348 22,809 25,064 (50,895) Discontinued Operations Income (Loss) From Discontinued Operations 8 (253) 98 3,368 Gain on Disposition of Assets — — 590 488 Income (Loss) from Discontinued Operations 8 (253) 688 3,856 Income (Loss) Before Gain on Disposition of Assets 4,356 22,556 25,752 (47,039) Gain on Disposition of Assets 6,992 11,557 88,978 13,240 Net Income (Loss) Attributable to Common Stockholders $11,348 $34,113 $114,730 ($33,799) Please see Appendix at the back of this supplement for Reporting Definitions and Explanations, Non-GAAP Reconciliations and a disclosure regarding Forward-Looking Statements.
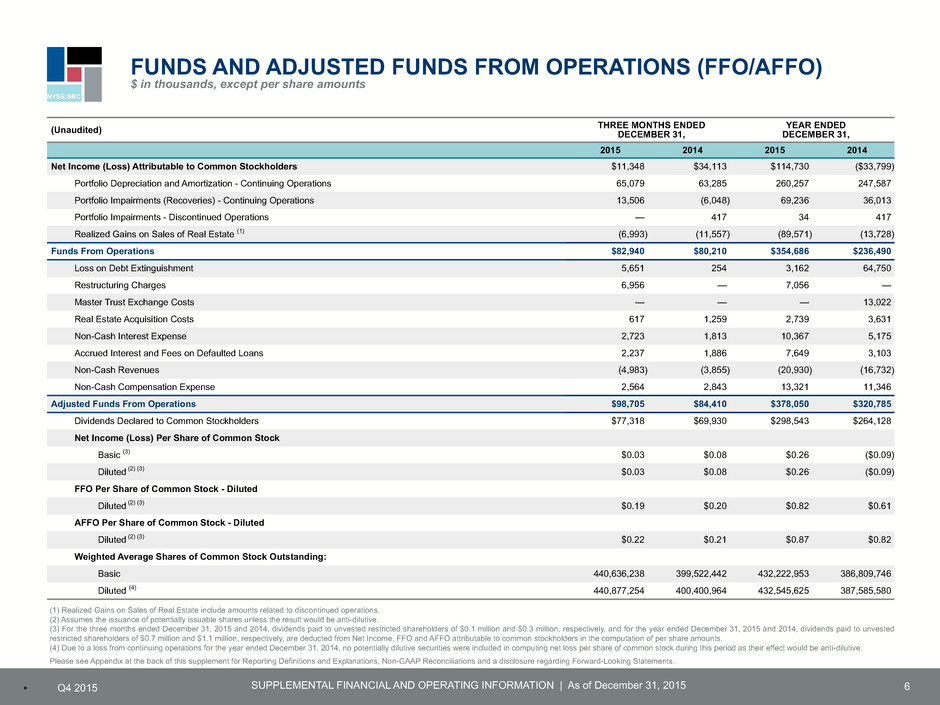
NYSE:SRC SUPPLEMENTAL FINANCIAL AND OPERATING INFORMATION | As of December 31, 2015▪ Q4 2015 FUNDS AND ADJUSTED FUNDS FROM OPERATIONS (FFO/AFFO) $ in thousands, except per share amounts 6 (Unaudited) THREE MONTHS ENDED DECEMBER 31, YEAR ENDED DECEMBER 31, 2015 2014 2015 2014 Net Income (Loss) Attributable to Common Stockholders $11,348 $34,113 $114,730 ($33,799) Portfolio Depreciation and Amortization - Continuing Operations 65,079 63,285 260,257 247,587 Portfolio Impairments (Recoveries) - Continuing Operations 13,506 (6,048) 69,236 36,013 Portfolio Impairments - Discontinued Operations — 417 34 417 Realized Gains on Sales of Real Estate (1) (6,993) (11,557) (89,571) (13,728) Funds From Operations $82,940 $80,210 $354,686 $236,490 Loss on Debt Extinguishment 5,651 254 3,162 64,750 Restructuring Charges 6,956 — 7,056 — Master Trust Exchange Costs — — — 13,022 Real Estate Acquisition Costs 617 1,259 2,739 3,631 Non-Cash Interest Expense 2,723 1,813 10,367 5,175 Accrued Interest and Fees on Defaulted Loans 2,237 1,886 7,649 3,103 Non-Cash Revenues (4,983) (3,855) (20,930) (16,732) Non-Cash Compensation Expense 2,564 2,843 13,321 11,346 Adjusted Funds From Operations $98,705 $84,410 $378,050 $320,785 Dividends Declared to Common Stockholders $77,318 $69,930 $298,543 $264,128 Net Income (Loss) Per Share of Common Stock Basic (3) $0.03 $0.08 $0.26 ($0.09) Diluted (2) (3) $0.03 $0.08 $0.26 ($0.09) FFO Per Share of Common Stock - Diluted Diluted (2) (3) $0.19 $0.20 $0.82 $0.61 AFFO Per Share of Common Stock - Diluted Diluted (2) (3) $0.22 $0.21 $0.87 $0.82 Weighted Average Shares of Common Stock Outstanding: Basic 440,636,238 399,522,442 432,222,953 386,809,746 Diluted (4) 440,877,254 400,400,964 432,545,625 387,585,580 (1) Realized Gains on Sales of Real Estate include amounts related to discontinued operations. (2) Assumes the issuance of potentially issuable shares unless the result would be anti-dilutive. (3) For the three months ended December 31, 2015 and 2014, dividends paid to unvested restricted shareholders of $0.1 million and $0.3 million, respectively, and for the year ended December 31, 2015 and 2014, dividends paid to unvested restricted shareholders of $0.7 million and $1.1 million, respectively, are deducted from Net Income, FFO and AFFO attributable to common stockholders in the computation of per share amounts. (4) Due to a loss from continuing operations for the year ended December 31, 2014, no potentially dilutive securities were included in computing net loss per share of common stock during this period as their effect would be anti-dilutive. Please see Appendix at the back of this supplement for Reporting Definitions and Explanations, Non-GAAP Reconciliations and a disclosure regarding Forward-Looking Statements.
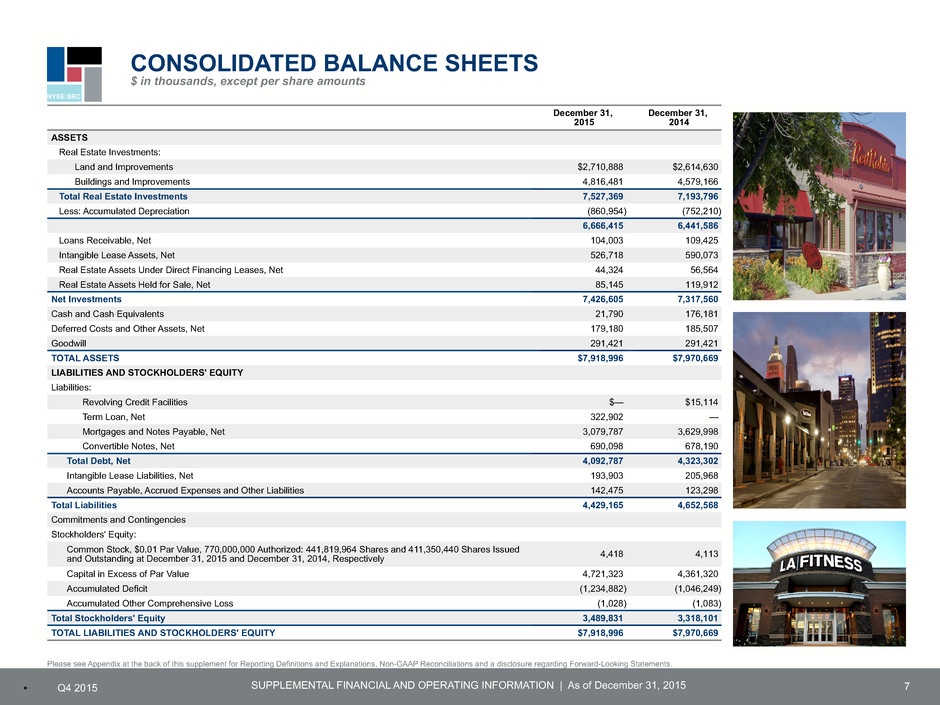
NYSE:SRC SUPPLEMENTAL FINANCIAL AND OPERATING INFORMATION | As of December 31, 2015▪ Q4 2015 7 December 31, 2015 December 31, 2014 ASSETS Real Estate Investments: Land and Improvements $2,710,888 $2,614,630 Buildings and Improvements 4,816,481 4,579,166 Total Real Estate Investments 7,527,369 7,193,796 Less: Accumulated Depreciation (860,954) (752,210) 6,666,415 6,441,586 Loans Receivable, Net 104,003 109,425 Intangible Lease Assets, Net 526,718 590,073 Real Estate Assets Under Direct Financing Leases, Net 44,324 56,564 Real Estate Assets Held for Sale, Net 85,145 119,912 Net Investments 7,426,605 7,317,560 Cash and Cash Equivalents 21,790 176,181 Deferred Costs and Other Assets, Net 179,180 185,507 Goodwill 291,421 291,421 TOTAL ASSETS $7,918,996 $7,970,669 LIABILITIES AND STOCKHOLDERS' EQUITY Liabilities: Revolving Credit Facilities $— $15,114 Term Loan, Net 322,902 — Mortgages and Notes Payable, Net 3,079,787 3,629,998 Convertible Notes, Net 690,098 678,190 Total Debt, Net 4,092,787 4,323,302 Intangible Lease Liabilities, Net 193,903 205,968 Accounts Payable, Accrued Expenses and Other Liabilities 142,475 123,298 Total Liabilities 4,429,165 4,652,568 Commitments and Contingencies Stockholders' Equity: Common Stock, $0.01 Par Value, 770,000,000 Authorized: 441,819,964 Shares and 411,350,440 Shares Issued and Outstanding at December 31, 2015 and December 31, 2014, Respectively 4,418 4,113 Capital in Excess of Par Value 4,721,323 4,361,320 Accumulated Deficit (1,234,882) (1,046,249) Accumulated Other Comprehensive Loss (1,028) (1,083) Total Stockholders' Equity 3,489,831 3,318,101 TOTAL LIABILITIES AND STOCKHOLDERS' EQUITY $7,918,996 $7,970,669 Please see Appendix at the back of this supplement for Reporting Definitions and Explanations, Non-GAAP Reconciliations and a disclosure regarding Forward-Looking Statements. CONSOLIDATED BALANCE SHEETS $ in thousands, except per share amounts
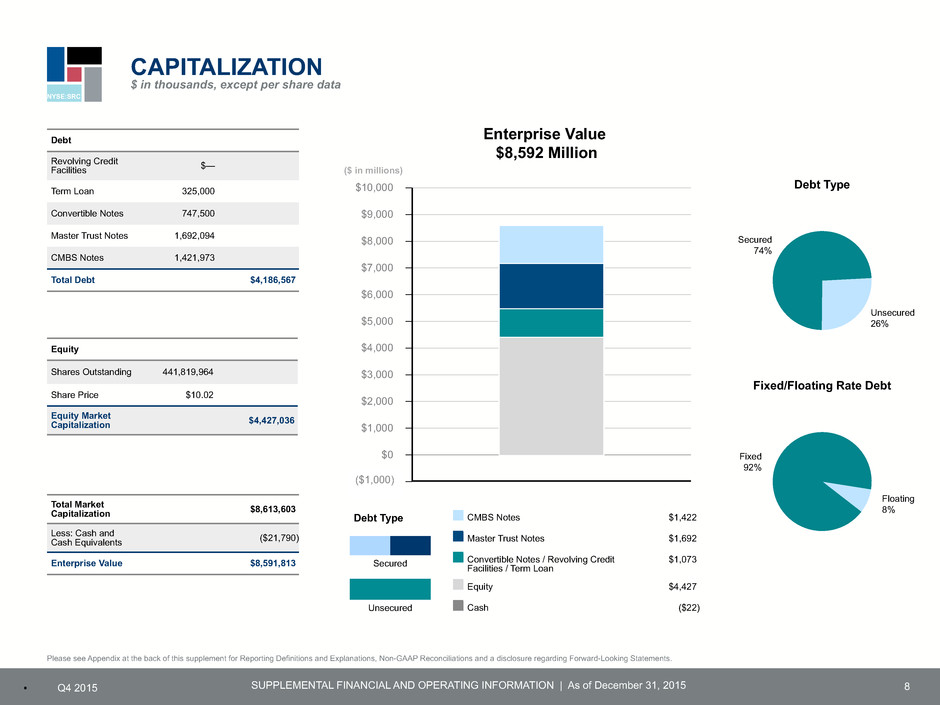
NYSE:SRC SUPPLEMENTAL FINANCIAL AND OPERATING INFORMATION | As of December 31, 2015▪ Q4 2015 Enterprise Value $8,592 Million $10,000 $9,000 $8,000 $7,000 $6,000 $5,000 $4,000 $3,000 $2,000 $1,000 $0 -$1,000 8 Equity Shares Outstanding 441,819,964 Share Price $10.02 Equity Market Capitalization $4,427,036 Please see Appendix at the back of this supplement for Reporting Definitions and Explanations, Non-GAAP Reconciliations and a disclosure regarding Forward-Looking Statements. Debt Type Secured Unsecured Debt Revolving Credit Facilities $— Term Loan 325,000 Convertible Notes 747,500 Master Trust Notes 1,692,094 CMBS Notes 1,421,973 Total Debt $4,186,567 CAPITALIZATION $ in thousands, except per share data Total Market Capitalization $8,613,603 Less: Cash and Cash Equivalents ($21,790) Enterprise Value $8,591,813 ($ in millions) CMBS Notes $1,422 Master Trust Notes $1,692 Convertible Notes / Revolving Credit Facilities / Term Loan $1,073 Equity $4,427 Cash ($22) ($1,000) Debt Type Unsecured 26% Secured 74% Fixed/Floating Rate Debt Floating 8% Fixed 92%
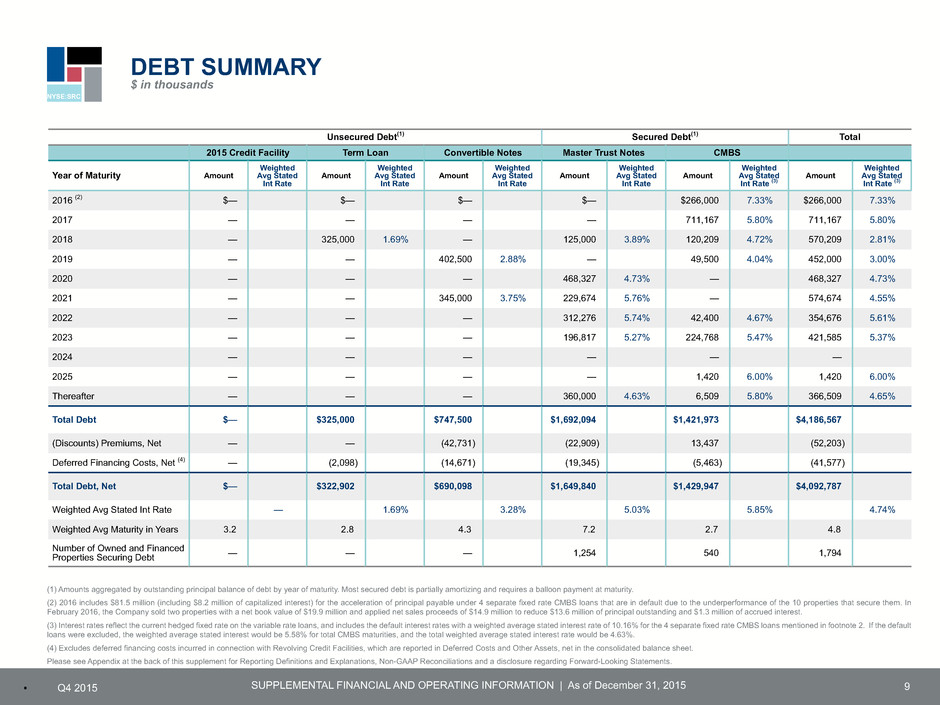
NYSE:SRC SUPPLEMENTAL FINANCIAL AND OPERATING INFORMATION | As of December 31, 2015▪ Q4 2015 9 Unsecured Debt(1) Secured Debt(1) Total 2015 Credit Facility Term Loan Convertible Notes Master Trust Notes CMBS Year of Maturity Amount Weighted Avg Stated Int Rate Amount Weighted Avg Stated Int Rate Amount Weighted Avg Stated Int Rate Amount Weighted Avg Stated Int Rate Amount Weighted Avg Stated Int Rate (3) Amount Weighted Avg Stated Int Rate (3) 2016 (2) $— $— $— $— $266,000 7.33% $266,000 7.33% 2017 — — — — 711,167 5.80% 711,167 5.80% 2018 — 325,000 1.69% — 125,000 3.89% 120,209 4.72% 570,209 2.81% 2019 — — 402,500 2.88% — 49,500 4.04% 452,000 3.00% 2020 — — — 468,327 4.73% — 468,327 4.73% 2021 — — 345,000 3.75% 229,674 5.76% — 574,674 4.55% 2022 — — — 312,276 5.74% 42,400 4.67% 354,676 5.61% 2023 — — — 196,817 5.27% 224,768 5.47% 421,585 5.37% 2024 — — — — — — 2025 — — — — 1,420 6.00% 1,420 6.00% Thereafter — — — 360,000 4.63% 6,509 5.80% 366,509 4.65% Total Debt $— $325,000 $747,500 $1,692,094 $1,421,973 $4,186,567 (Discounts) Premiums, Net — — (42,731) (22,909) 13,437 (52,203) Deferred Financing Costs, Net (4) — (2,098) (14,671) (19,345) (5,463) (41,577) Total Debt, Net $— $322,902 $690,098 $1,649,840 $1,429,947 $4,092,787 Weighted Avg Stated Int Rate — 1.69% 3.28% 5.03% 5.85% 4.74% Weighted Avg Maturity in Years 3.2 2.8 4.3 7.2 2.7 4.8 Number of Owned and Financed Properties Securing Debt — — — 1,254 540 1,794 (1) Amounts aggregated by outstanding principal balance of debt by year of maturity. Most secured debt is partially amortizing and requires a balloon payment at maturity. (2) 2016 includes $81.5 million (including $8.2 million of capitalized interest) for the acceleration of principal payable under 4 separate fixed rate CMBS loans that are in default due to the underperformance of the 10 properties that secure them. In February 2016, the Company sold two properties with a net book value of $19.9 million and applied net sales proceeds of $14.9 million to reduce $13.6 million of principal outstanding and $1.3 million of accrued interest. (3) Interest rates reflect the current hedged fixed rate on the variable rate loans, and includes the default interest rates with a weighted average stated interest rate of 10.16% for the 4 separate fixed rate CMBS loans mentioned in footnote 2. If the default loans were excluded, the weighted average stated interest would be 5.58% for total CMBS maturities, and the total weighted average stated interest rate would be 4.63%. (4) Excludes deferred financing costs incurred in connection with Revolving Credit Facilities, which are reported in Deferred Costs and Other Assets, net in the consolidated balance sheet. Please see Appendix at the back of this supplement for Reporting Definitions and Explanations, Non-GAAP Reconciliations and a disclosure regarding Forward-Looking Statements. DEBT SUMMARY $ in thousands
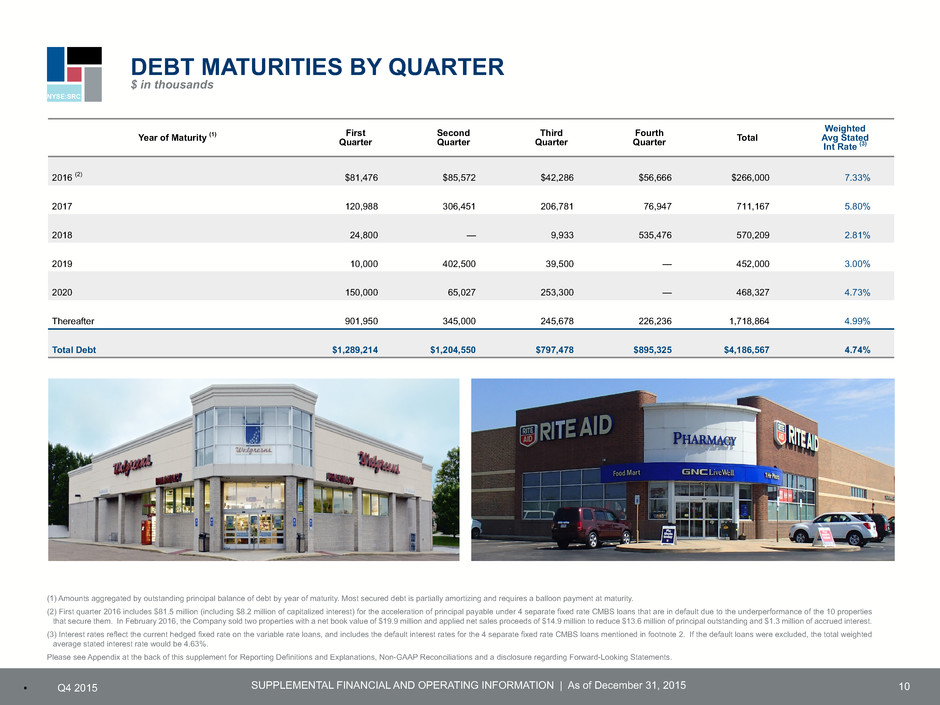
NYSE:SRC SUPPLEMENTAL FINANCIAL AND OPERATING INFORMATION | As of December 31, 2015▪ Q4 2015 DEBT MATURITIES BY QUARTER $ in thousands Year of Maturity (1) First Quarter Second Quarter Third Quarter Fourth Quarter Total Weighted Avg Stated Int Rate (3) 2016 (2) $81,476 $85,572 $42,286 $56,666 $266,000 7.33% 2017 120,988 306,451 206,781 76,947 711,167 5.80% 2018 24,800 — 9,933 535,476 570,209 2.81% 2019 10,000 402,500 39,500 — 452,000 3.00% 2020 150,000 65,027 253,300 — 468,327 4.73% Thereafter 901,950 345,000 245,678 226,236 1,718,864 4.99% Total Debt $1,289,214 $1,204,550 $797,478 $895,325 $4,186,567 4.74% (1) Amounts aggregated by outstanding principal balance of debt by year of maturity. Most secured debt is partially amortizing and requires a balloon payment at maturity. (2) First quarter 2016 includes $81.5 million (including $8.2 million of capitalized interest) for the acceleration of principal payable under 4 separate fixed rate CMBS loans that are in default due to the underperformance of the 10 properties that secure them. In February 2016, the Company sold two properties with a net book value of $19.9 million and applied net sales proceeds of $14.9 million to reduce $13.6 million of principal outstanding and $1.3 million of accrued interest. (3) Interest rates reflect the current hedged fixed rate on the variable rate loans, and includes the default interest rates for the 4 separate fixed rate CMBS loans mentioned in footnote 2. If the default loans were excluded, the total weighted average stated interest rate would be 4.63%. Please see Appendix at the back of this supplement for Reporting Definitions and Explanations, Non-GAAP Reconciliations and a disclosure regarding Forward-Looking Statements. 10
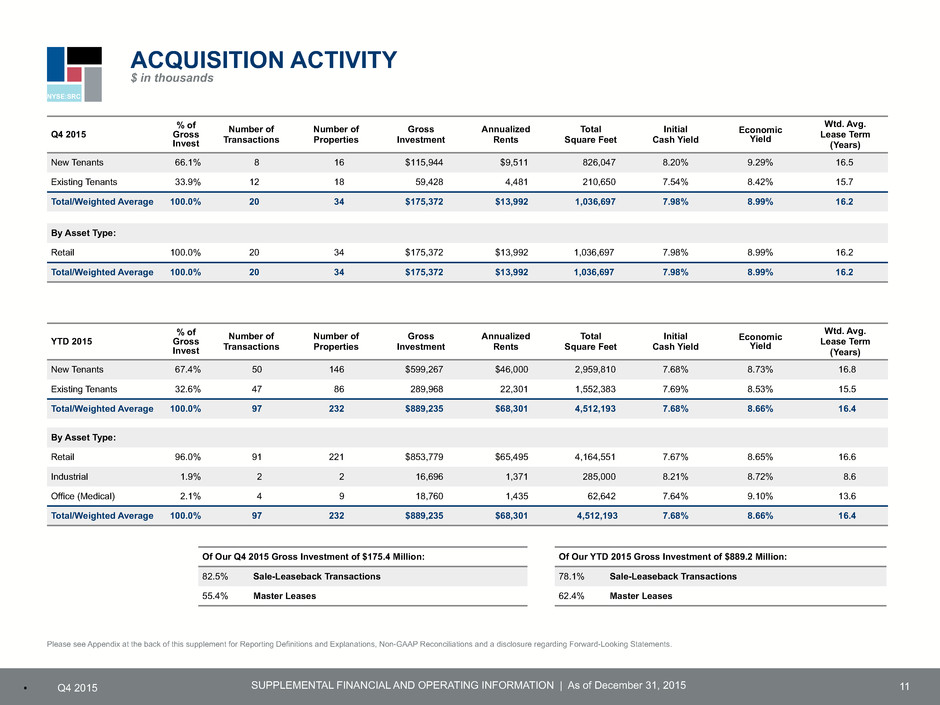
NYSE:SRC SUPPLEMENTAL FINANCIAL AND OPERATING INFORMATION | As of December 31, 2015▪ Q4 2015 11 Q4 2015 % of Gross Invest Number of Transactions Number of Properties Gross Investment Annualized Rents Total Square Feet Initial Cash Yield Economic Yield Wtd. Avg. Lease Term (Years) New Tenants 66.1% 8 16 $115,944 $9,511 826,047 8.20% 9.29% 16.5 Existing Tenants 33.9% 12 18 59,428 4,481 210,650 7.54% 8.42% 15.7 Total/Weighted Average 100.0% 20 34 $175,372 $13,992 1,036,697 7.98% 8.99% 16.2 By Asset Type: Retail 100.0% 20 34 $175,372 $13,992 1,036,697 7.98% 8.99% 16.2 Total/Weighted Average 100.0% 20 34 $175,372 $13,992 1,036,697 7.98% 8.99% 16.2 Of Our Q4 2015 Gross Investment of $175.4 Million: 82.5% Sale-Leaseback Transactions 55.4% Master Leases YTD 2015 % of Gross Invest Number of Transactions Number of Properties Gross Investment Annualized Rents Total Square Feet Initial Cash Yield Economic Yield Wtd. Avg. Lease Term (Years) New Tenants 67.4% 50 146 $599,267 $46,000 2,959,810 7.68% 8.73% 16.8 Existing Tenants 32.6% 47 86 289,968 22,301 1,552,383 7.69% 8.53% 15.5 Total/Weighted Average 100.0% 97 232 $889,235 $68,301 4,512,193 7.68% 8.66% 16.4 By Asset Type: Retail 96.0% 91 221 $853,779 $65,495 4,164,551 7.67% 8.65% 16.6 Industrial 1.9% 2 2 16,696 1,371 285,000 8.21% 8.72% 8.6 Office (Medical) 2.1% 4 9 18,760 1,435 62,642 7.64% 9.10% 13.6 Total/Weighted Average 100.0% 97 232 $889,235 $68,301 4,512,193 7.68% 8.66% 16.4 Please see Appendix at the back of this supplement for Reporting Definitions and Explanations, Non-GAAP Reconciliations and a disclosure regarding Forward-Looking Statements. ACQUISITION ACTIVITY $ in thousands Of Our YTD 2015 Gross Investment of $889.2 Million: 78.1% Sale-Leaseback Transactions 62.4% Master Leases
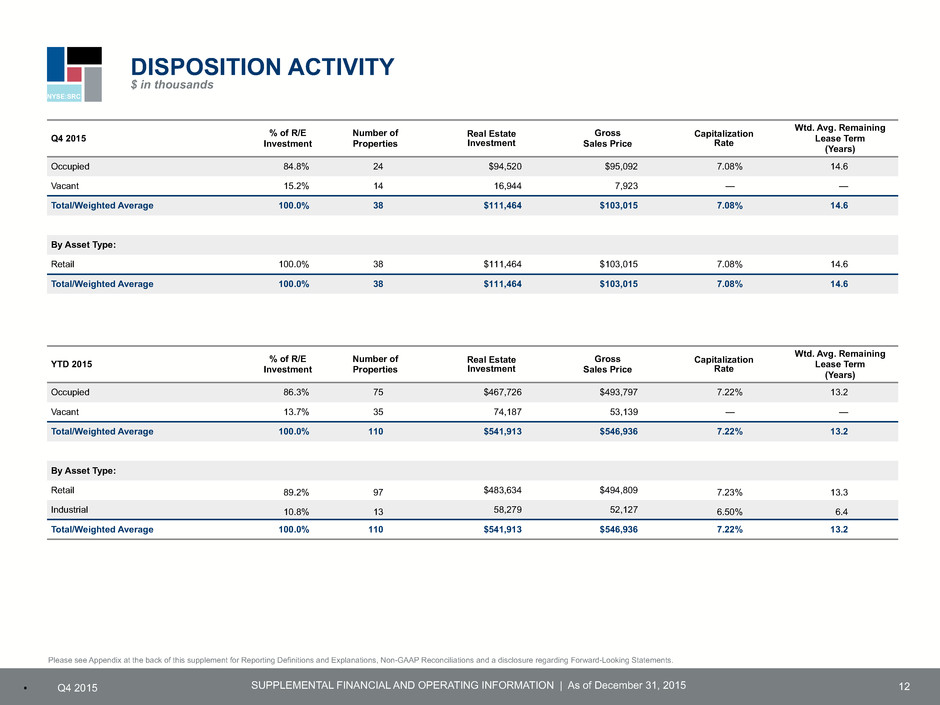
NYSE:SRC SUPPLEMENTAL FINANCIAL AND OPERATING INFORMATION | As of December 31, 2015▪ Q4 2015 12 Q4 2015 % of R/EInvestment Number of Properties Real Estate Investment Gross Sales Price Capitalization Rate Wtd. Avg. Remaining Lease Term (Years) Occupied 84.8% 24 $94,520 $95,092 7.08% 14.6 Vacant 15.2% 14 16,944 7,923 — — Total/Weighted Average 100.0% 38 $111,464 $103,015 7.08% 14.6 By Asset Type: Retail 100.0% 38 $111,464 $103,015 7.08% 14.6 Total/Weighted Average 100.0% 38 $111,464 $103,015 7.08% 14.6 YTD 2015 % of R/EInvestment Number of Properties Real Estate Investment Gross Sales Price Capitalization Rate Wtd. Avg. Remaining Lease Term (Years) Occupied 86.3% 75 $467,726 $493,797 7.22% 13.2 Vacant 13.7% 35 74,187 53,139 — — Total/Weighted Average 100.0% 110 $541,913 $546,936 7.22% 13.2 By Asset Type: Retail 89.2% 97 $483,634 $494,809 7.23% 13.3 Industrial 10.8% 13 58,279 52,127 6.50% 6.4 Total/Weighted Average 100.0% 110 $541,913 $546,936 7.22% 13.2 DISPOSITION ACTIVITY $ in thousands Please see Appendix at the back of this supplement for Reporting Definitions and Explanations, Non-GAAP Reconciliations and a disclosure regarding Forward-Looking Statements.
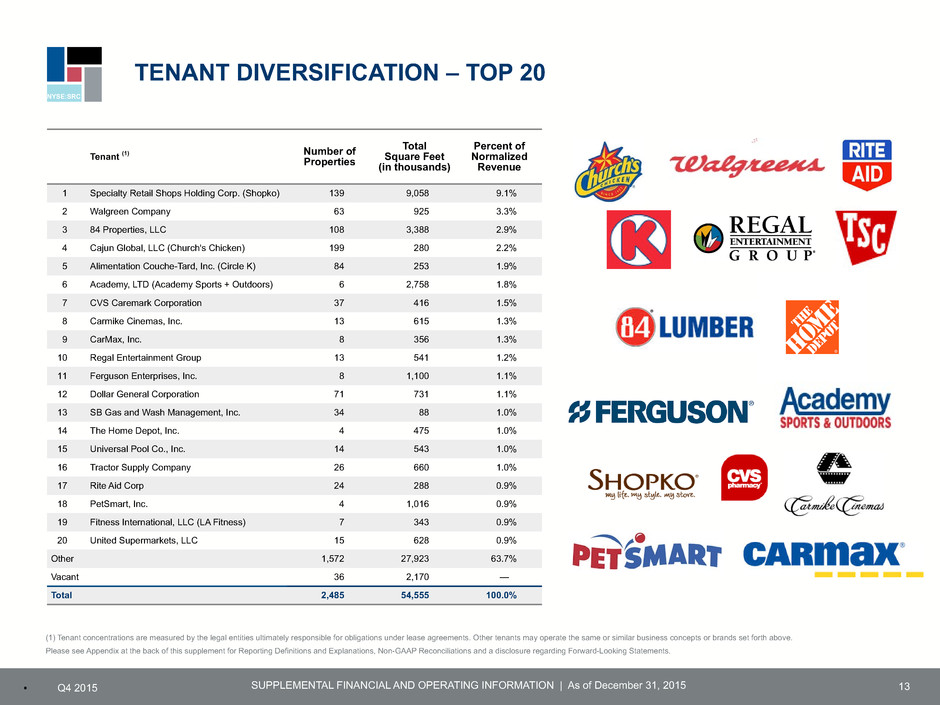
NYSE:SRC SUPPLEMENTAL FINANCIAL AND OPERATING INFORMATION | As of December 31, 2015▪ Q4 2015 TENANT DIVERSIFICATION – TOP 20 13 Tenant (1) Number of Properties Total Square Feet (in thousands) Percent of Normalized Revenue 1 Specialty Retail Shops Holding Corp. (Shopko) 139 9,058 9.1% 2 Walgreen Company 63 925 3.3% 3 84 Properties, LLC 108 3,388 2.9% 4 Cajun Global, LLC (Church's Chicken) 199 280 2.2% 5 Alimentation Couche-Tard, Inc. (Circle K) 84 253 1.9% 6 Academy, LTD (Academy Sports + Outdoors) 6 2,758 1.8% 7 CVS Caremark Corporation 37 416 1.5% 8 Carmike Cinemas, Inc. 13 615 1.3% 9 CarMax, Inc. 8 356 1.3% 10 Regal Entertainment Group 13 541 1.2% 11 Ferguson Enterprises, Inc. 8 1,100 1.1% 12 Dollar General Corporation 71 731 1.1% 13 SB Gas and Wash Management, Inc. 34 88 1.0% 14 The Home Depot, Inc. 4 475 1.0% 15 Universal Pool Co., Inc. 14 543 1.0% 16 Tractor Supply Company 26 660 1.0% 17 Rite Aid Corp 24 288 0.9% 18 PetSmart, Inc. 4 1,016 0.9% 19 Fitness International, LLC (LA Fitness) 7 343 0.9% 20 United Supermarkets, LLC 15 628 0.9% Other 1,572 27,923 63.7% Vacant 36 2,170 — Total 2,485 54,555 100.0% (1) Tenant concentrations are measured by the legal entities ultimately responsible for obligations under lease agreements. Other tenants may operate the same or similar business concepts or brands set forth above. Please see Appendix at the back of this supplement for Reporting Definitions and Explanations, Non-GAAP Reconciliations and a disclosure regarding Forward-Looking Statements.
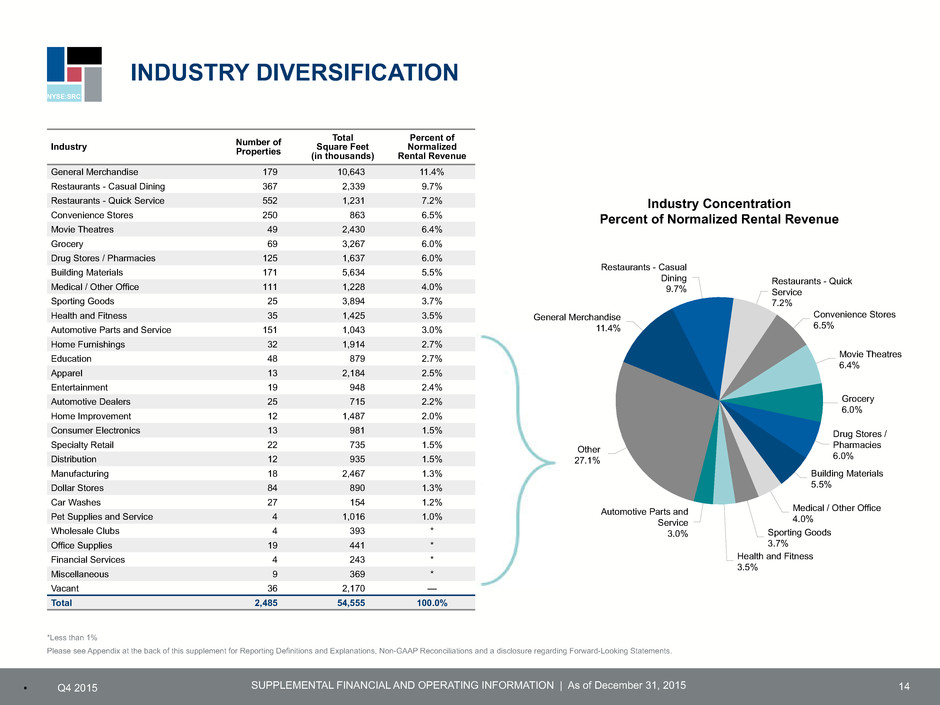
NYSE:SRC SUPPLEMENTAL FINANCIAL AND OPERATING INFORMATION | As of December 31, 2015▪ Q4 2015 INDUSTRY DIVERSIFICATION 14 Industry Number ofProperties Total Square Feet (in thousands) Percent of Normalized Rental Revenue General Merchandise 179 10,643 11.4% Restaurants - Casual Dining 367 2,339 9.7% Restaurants - Quick Service 552 1,231 7.2% Convenience Stores 250 863 6.5% Movie Theatres 49 2,430 6.4% Grocery 69 3,267 6.0% Drug Stores / Pharmacies 125 1,637 6.0% Building Materials 171 5,634 5.5% Medical / Other Office 111 1,228 4.0% Sporting Goods 25 3,894 3.7% Health and Fitness 35 1,425 3.5% Automotive Parts and Service 151 1,043 3.0% Home Furnishings 32 1,914 2.7% Education 48 879 2.7% Apparel 13 2,184 2.5% Entertainment 19 948 2.4% Automotive Dealers 25 715 2.2% Home Improvement 12 1,487 2.0% Consumer Electronics 13 981 1.5% Specialty Retail 22 735 1.5% Distribution 12 935 1.5% Manufacturing 18 2,467 1.3% Dollar Stores 84 890 1.3% Car Washes 27 154 1.2% Pet Supplies and Service 4 1,016 1.0% Wholesale Clubs 4 393 * Office Supplies 19 441 * Financial Services 4 243 * Miscellaneous 9 369 * Vacant 36 2,170 — Total 2,485 54,555 100.0% *Less than 1% Please see Appendix at the back of this supplement for Reporting Definitions and Explanations, Non-GAAP Reconciliations and a disclosure regarding Forward-Looking Statements. Industry Concentration Percent of Normalized Rental Revenue General Merchandise 11.4% Restaurants - Casual Dining 9.7% Restaurants - Quick Service 7.2% Convenience Stores 6.5% Movie Theatres 6.4% Grocery 6.0% Drug Stores / Pharmacies 6.0% Building Materials 5.5% Medical / Other Office 4.0% Sporting Goods 3.7% Health and Fitness 3.5% Automotive Parts and Service 3.0% Other 27.1%
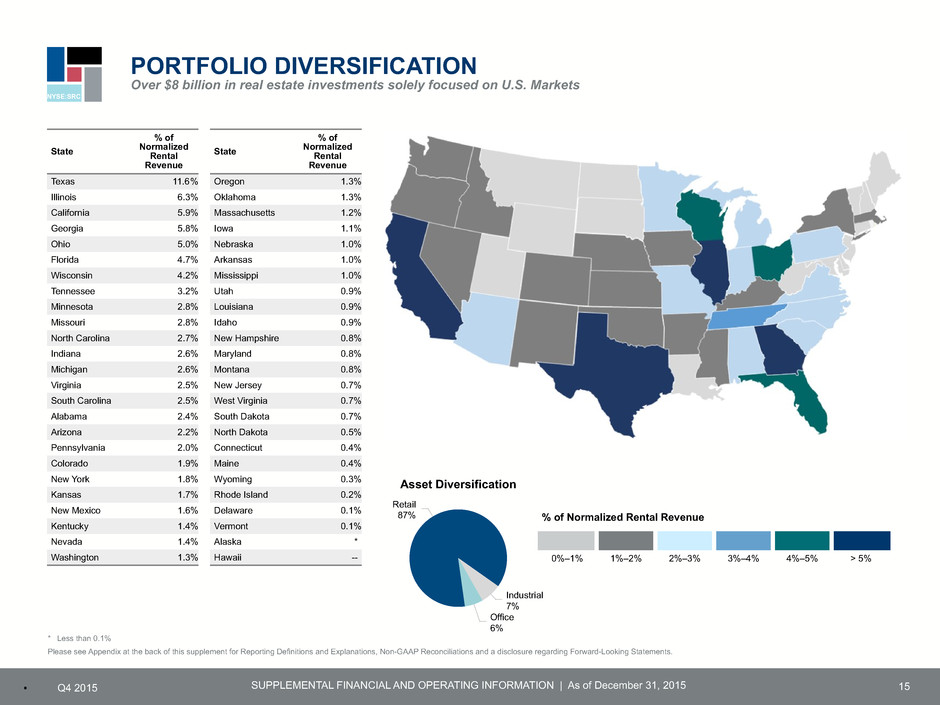
NYSE:SRC SUPPLEMENTAL FINANCIAL AND OPERATING INFORMATION | As of December 31, 2015▪ Q4 2015 PORTFOLIO DIVERSIFICATION Over $8 billion in real estate investments solely focused on U.S. Markets 15 * Less than 0.1% Please see Appendix at the back of this supplement for Reporting Definitions and Explanations, Non-GAAP Reconciliations and a disclosure regarding Forward-Looking Statements. State % of Normalized Rental Revenue Texas 11.6% Illinois 6.3% California 5.9% Georgia 5.8% Ohio 5.0% Florida 4.7% Wisconsin 4.2% Tennessee 3.2% Minnesota 2.8% Missouri 2.8% North Carolina 2.7% Indiana 2.6% Michigan 2.6% Virginia 2.5% South Carolina 2.5% Alabama 2.4% Arizona 2.2% Pennsylvania 2.0% Colorado 1.9% New York 1.8% Kansas 1.7% New Mexico 1.6% Kentucky 1.4% Nevada 1.4% Washington 1.3% State % of Normalized Rental Revenue Oregon 1.3% Oklahoma 1.3% Massachusetts 1.2% Iowa 1.1% Nebraska 1.0% Arkansas 1.0% Mississippi 1.0% Utah 0.9% Louisiana 0.9% Idaho 0.9% New Hampshire 0.8% Maryland 0.8% Montana 0.8% New Jersey 0.7% West Virginia 0.7% South Dakota 0.7% North Dakota 0.5% Connecticut 0.4% Maine 0.4% Wyoming 0.3% Rhode Island 0.2% Delaware 0.1% Vermont 0.1% Alaska * Hawaii -- % of Normalized Rental Revenue 0%–1% 1%–2% 2%–3% 3%–4% 4%–5% > 5% Asset Diversification Retail 87% Industrial 7% Office 6%
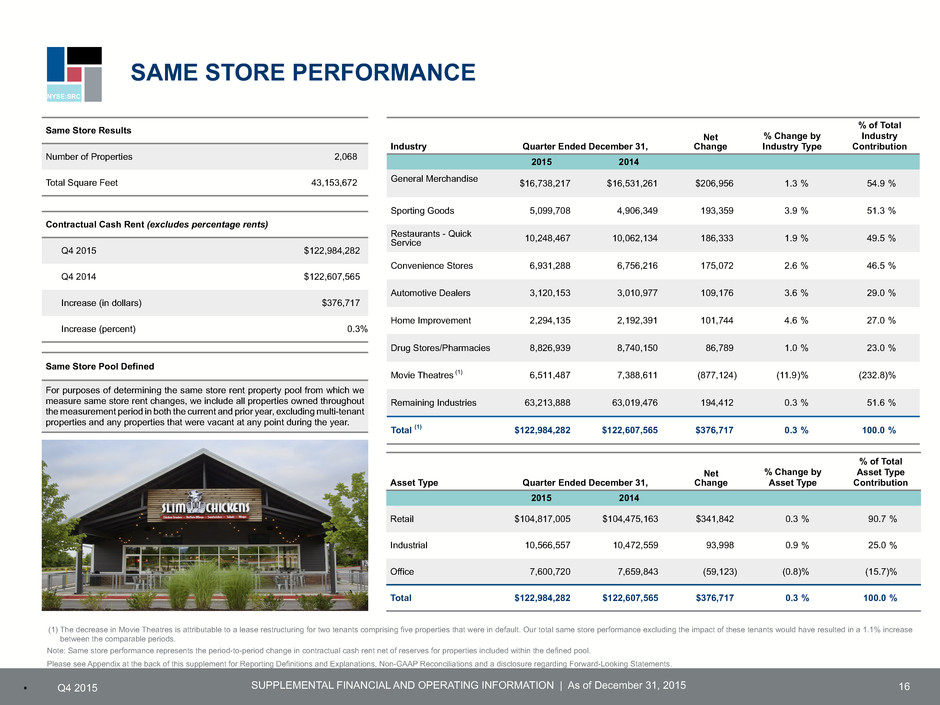
NYSE:SRC SUPPLEMENTAL FINANCIAL AND OPERATING INFORMATION | As of December 31, 2015▪ Q4 2015 SAME STORE PERFORMANCE 16 Note: Same store performance represents the period-to-period change in contractual cash rent net of reserves for properties included within the defined pool. Please see Appendix at the back of this supplement for Reporting Definitions and Explanations, Non-GAAP Reconciliations and a disclosure regarding Forward-Looking Statements. Same Store Results Number of Properties 2,068 Total Square Feet 43,153,672 Industry Quarter Ended December 31, Net Change % Change by Industry Type % of Total Industry Contribution 2015 2014 General Merchandise $16,738,217 $16,531,261 $206,956 1.3 % 54.9 % Sporting Goods 5,099,708 4,906,349 193,359 3.9 % 51.3 % Restaurants - Quick Service 10,248,467 10,062,134 186,333 1.9 % 49.5 % Convenience Stores 6,931,288 6,756,216 175,072 2.6 % 46.5 % Automotive Dealers 3,120,153 3,010,977 109,176 3.6 % 29.0 % Home Improvement 2,294,135 2,192,391 101,744 4.6 % 27.0 % Drug Stores/Pharmacies 8,826,939 8,740,150 86,789 1.0 % 23.0 % Movie Theatres (1) 6,511,487 7,388,611 (877,124) (11.9)% (232.8)% Remaining Industries 63,213,888 63,019,476 194,412 0.3 % 51.6 % Total (1) $122,984,282 $122,607,565 $376,717 0.3 % 100.0 % Asset Type Quarter Ended December 31, Net Change % Change by Asset Type % of Total Asset Type Contribution 2015 2014 Retail $104,817,005 $104,475,163 $341,842 0.3 % 90.7 % Industrial 10,566,557 10,472,559 93,998 0.9 % 25.0 % Office 7,600,720 7,659,843 (59,123) (0.8)% (15.7)% Total $122,984,282 $122,607,565 $376,717 0.3 % 100.0 % Same Store Pool Defined For purposes of determining the same store rent property pool from which we measure same store rent changes, we include all properties owned throughout the measurement period in both the current and prior year, excluding multi-tenant properties and any properties that were vacant at any point during the year. Contractual Cash Rent (excludes percentage rents) Q4 2015 $122,984,282 Q4 2014 $122,607,565 Increase (in dollars) $376,717 Increase (percent) 0.3% (1) The decrease in Movie Theatres is attributable to a lease restructuring for two tenants comprising five properties that were in default. Our total same store performance excluding the impact of these tenants would have resulted in a 1.1% increase between the comparable periods.
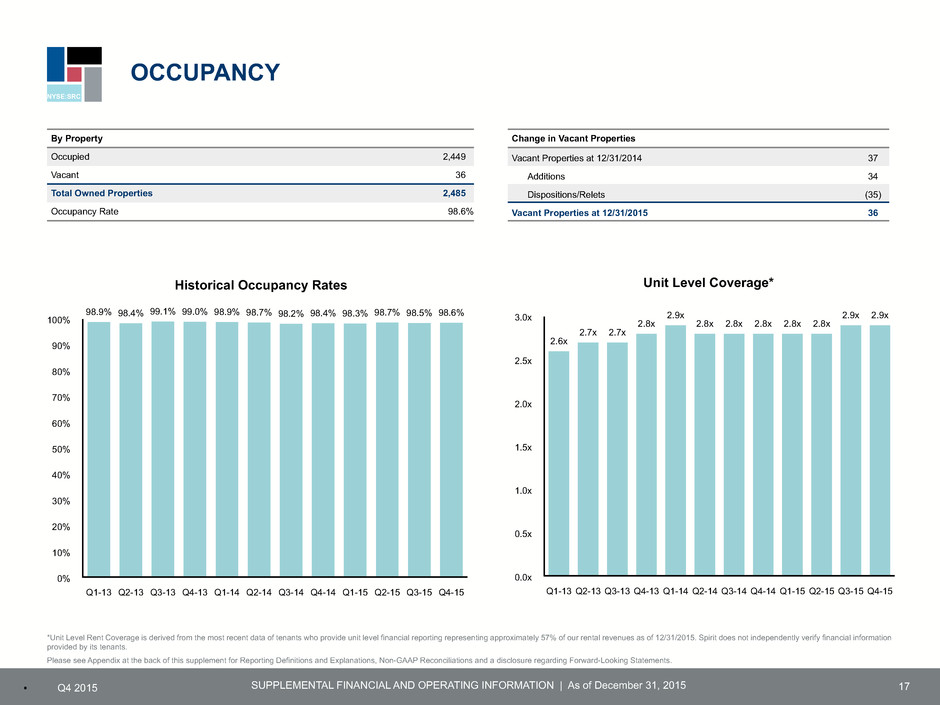
NYSE:SRC SUPPLEMENTAL FINANCIAL AND OPERATING INFORMATION | As of December 31, 2015▪ Q4 2015 OCCUPANCY 17 *Unit Level Rent Coverage is derived from the most recent data of tenants who provide unit level financial reporting representing approximately 57% of our rental revenues as of 12/31/2015. Spirit does not independently verify financial information provided by its tenants. Please see Appendix at the back of this supplement for Reporting Definitions and Explanations, Non-GAAP Reconciliations and a disclosure regarding Forward-Looking Statements. By Property Occupied 2,449 Vacant 36 Total Owned Properties 2,485 Occupancy Rate 98.6% Change in Vacant Properties Vacant Properties at 12/31/2014 37 Additions 34 Dispositions/Relets (35) Vacant Properties at 12/31/2015 36 Unit Level Coverage* 3.0x 2.5x 2.0x 1.5x 1.0x 0.5x 0.0x Q1-13 Q2-13 Q3-13 Q4-13 Q1-14 Q2-14 Q3-14 Q4-14 Q1-15 Q2-15 Q3-15 Q4-15 2.6x 2.7x 2.7x 2.8x 2.9x 2.8x 2.8x 2.8x 2.8x 2.8x 2.9x 2.9x Historical Occupancy Rates 100% 90% 80% 70% 60% 50% 40% 30% 20% 10% 0% Q1-13 Q2-13 Q3-13 Q4-13 Q1-14 Q2-14 Q3-14 Q4-14 Q1-15 Q2-15 Q3-15 Q4-15 98.9% 98.4% 99.1% 99.0% 98.9% 98.7% 98.2% 98.4% 98.3% 98.7% 98.5% 98.6%
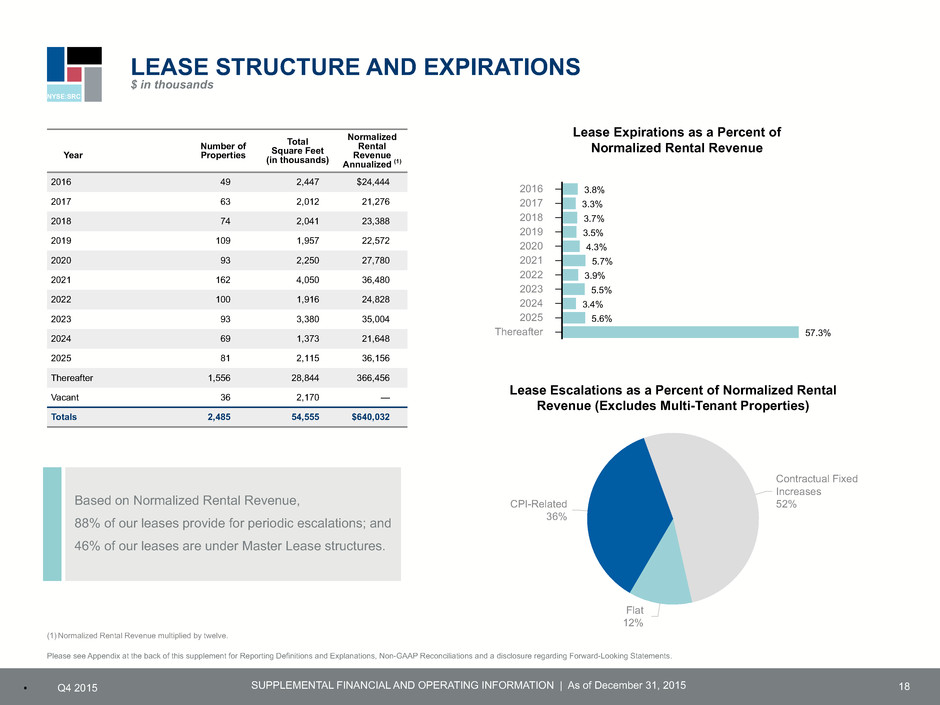
NYSE:SRC SUPPLEMENTAL FINANCIAL AND OPERATING INFORMATION | As of December 31, 2015▪ Q4 2015 18 Please see Appendix at the back of this supplement for Reporting Definitions and Explanations, Non-GAAP Reconciliations and a disclosure regarding Forward-Looking Statements. Year Number of Properties Total Square Feet (in thousands) Normalized Rental Revenue Annualized (1) 2016 49 2,447 $24,444 2017 63 2,012 21,276 2018 74 2,041 23,388 2019 109 1,957 22,572 2020 93 2,250 27,780 2021 162 4,050 36,480 2022 100 1,916 24,828 2023 93 3,380 35,004 2024 69 1,373 21,648 2025 81 2,115 36,156 Thereafter 1,556 28,844 366,456 Vacant 36 2,170 — Totals 2,485 54,555 $640,032 Based on Normalized Rental Revenue, 88% of our leases provide for periodic escalations; and 46% of our leases are under Master Lease structures. LEASE STRUCTURE AND EXPIRATIONS $ in thousands Lease Escalations as a Percent of Normalized Rental Revenue (Excludes Multi-Tenant Properties) Contractual Fixed Increases 52% Flat 12% CPI-Related 36% Lease Expirations as a Percent of Normalized Rental Revenue 2016 2017 2018 2019 2020 2021 2022 2023 2024 2025 Thereafter 3.8% 3.3% 3.7% 3.5% 4.3% 5.7% 3.9% 5.5% 3.4% 5.6% 57.3% (1) Normalized Rental Revenue multiplied by twelve.
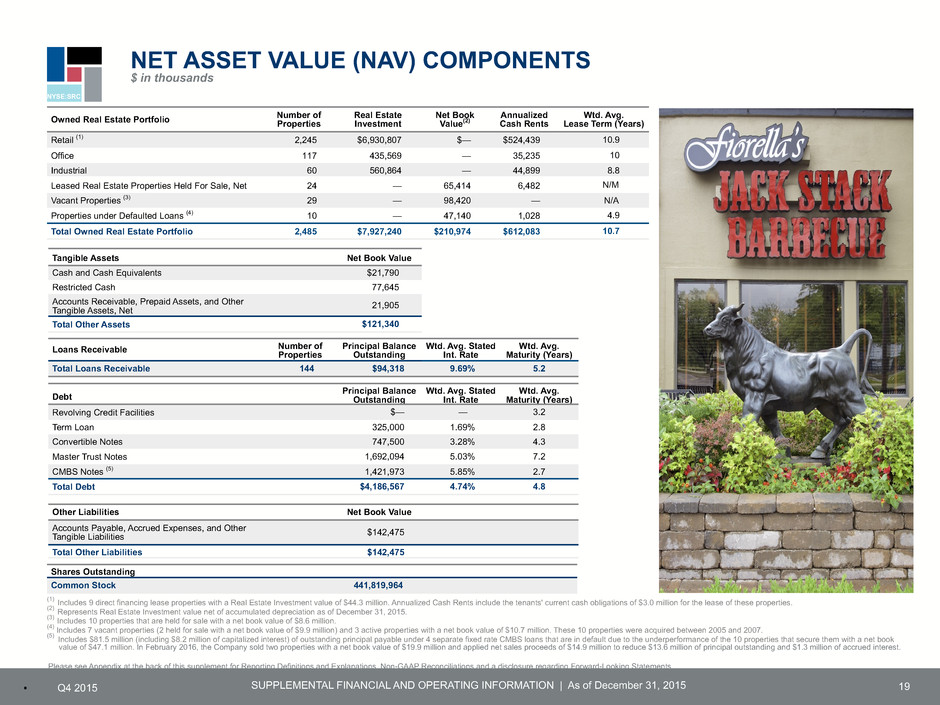
NYSE:SRC SUPPLEMENTAL FINANCIAL AND OPERATING INFORMATION | As of December 31, 2015▪ Q4 2015 19 Owned Real Estate Portfolio Number ofProperties Real Estate Investment Net Book Value(2) Annualized Cash Rents Wtd. Avg. Lease Term (Years) Retail (1) 2,245 $6,930,807 $— $524,439 10.9 Office 117 435,569 — 35,235 10 Industrial 60 560,864 — 44,899 8.8 Leased Real Estate Properties Held For Sale, Net 24 — 65,414 6,482 N/M Vacant Properties (3) 29 — 98,420 — N/A Properties under Defaulted Loans (4) 10 — 47,140 1,028 4.9 Total Owned Real Estate Portfolio 2,485 $7,927,240 $210,974 $612,083 10.7 Loans Receivable Number ofProperties Principal Balance Outstanding Wtd. Avg. Stated Int. Rate Wtd. Avg. Maturity (Years) Total Loans Receivable 144 $94,318 9.69% 5.2 NET ASSET VALUE (NAV) COMPONENTS $ in thousands Tangible Assets Net Book Value Cash and Cash Equivalents $21,790 Restricted Cash 77,645 Accounts Receivable, Prepaid Assets, and Other Tangible Assets, Net 21,905 Total Other Assets $121,340 Debt Principal BalanceOutstanding Wtd. Avg. Stated Int. Rate Wtd. Avg. Maturity (Years) Revolving Credit Facilities $— — 3.2 Term Loan 325,000 1.69% 2.8 Convertible Notes 747,500 3.28% 4.3 Master Trust Notes 1,692,094 5.03% 7.2 CMBS Notes (5) 1,421,973 5.85% 2.7 Total Debt $4,186,567 4.74% 4.8 Other Liabilities Net Book Value Accounts Payable, Accrued Expenses, and Other Tangible Liabilities $142,475 Total Other Liabilities $142,475 Shares Outstanding Common Stock 441,819,964 Please see Appendix at the back of this supplement for Reporting Definitions and Explanations, Non-GAAP Reconciliations and a disclosure regarding Forward-Looking Statements. (1) Includes 9 direct financing lease properties with a Real Estate Investment value of $44.3 million. Annualized Cash Rents include the tenants' current cash obligations of $3.0 million for the lease of these properties. (2) Represents Real Estate Investment value net of accumulated depreciation as of December 31, 2015. (3) Includes 10 properties that are held for sale with a net book value of $8.6 million. (4) Includes 7 vacant properties (2 held for sale with a net book value of $9.9 million) and 3 active properties with a net book value of $10.7 million. These 10 properties were acquired between 2005 and 2007. (5) Includes $81.5 million (including $8.2 million of capitalized interest) of outstanding principal payable under 4 separate fixed rate CMBS loans that are in default due to the underperformance of the 10 properties that secure them with a net book value of $47.1 million. In February 2016, the Company sold two properties with a net book value of $19.9 million and applied net sales proceeds of $14.9 million to reduce $13.6 million of principal outstanding and $1.3 million of accrued interest.
NYSE:SRC SUPPLEMENTAL FINANCIAL AND OPERATING INFORMATION | As of December 31, 2015▪ Q4 2015 ANALYST COVERAGE 20 BofA Merrill Lynch Juan Sanabria juan.sanabria@baml.com 646.855.1589 Camille Tan camille.tan@baml.com 646.556.2095 Capital One Chris Lucas christopher.lucas@capitalone.com 571.633.8151 Vineet Khanna vineet.khanna@capitalone.com 571.835.7013 Cowen and Company Michael Gorman michael.gorman@cowen.com 646.562.1320 James Sullivan james.sullivan@cowen.com 646.562.1380 Matthew Pollinger matthew.pollinger@cowen.com 646.562.1381 Deutsche Bank Vincent Chao vincent.chao@db.com 212.250.6799 Greg Schweitzer greg.schweitzer@bd.com 212.250.9194 Green Street Advisors Cedrik Lachance clachance@greenstreetadvisors.com 949.640.8780 Tyler Grant tgrant@greenstreetadvisors.com 949.640.8780 Ladenburg Thalman & Co. Dan Donlan ddonlan@Ladenburg.com 212.409.2056 John Massocca jmassocca@Ladenburg.com 212.409.2543 Oppenheimer Stephen Manaker stephen.manaker@opco.com 212.667.5950 Morgan Stanley Vikram Malhotra vikram.malhotra@morganstanley.com 212.761.7064 Landon Park landon.park@morganstanley.com 212.761.6368 Raymond James Collin Mings collin.mings@raymondjames.com 727.567.2585 Paul Puryear paul.puryear@raymondjames.com 727.567.2253 Daniel Mannix daniel.mannix@raymondjames.com 727.567.2619 RBC Capital Markets Rich Moore rich.moore@rbccm.com 440,715.2646 Wes Gollady wes.gollady@rbccm.com 440.715.2650 James Bambrick james.bambrick@rbccm.com 440.715.2654 RW Baird RJ Milligan rjmilligan@rwbaird.com 813.273.8252 Sandler O’Neill & Partners, LP Alex Goldfarb agoldfarb@sandleroneill.com 212.466.7937 Ryan Peterson rpeterson@sandleroneill.com 212.466.7927 Sun Trust Robinson Humphrey Ki Bin Kim kibin.kim@suntrust.com 212.303.4124 UBS Ross Nussbaum ross.nussbaum@ubs.com 212.713.2484 Frank Lee frank-a.lee@ubs.com 212.352.5679 Wunderlich Securities, Inc. Craig Kucera ckucera@wunderlich.com 540.277.3366 The aforementioned security analysts currently provide opinions, estimates and forecasts, which are their own and are not promoted or endorsed by Spirit or its management team. Therefore, their opinions, estimates or forecasts are their own and should not be interpreted as Spirit’s opinions, estimates or forecasts. Any reference or distribution by Spirit expressly disclaims any endorsement of or concurrent with any information, estimates, forecasts, opinions, conclusions or recommendations provided by analysts.

NYSE:SRC SUPPLEMENTAL FINANCIAL AND OPERATING INFORMATION | As of December 31, 2015▪ Q4 2015 Appendix 21
NYSE:SRC SUPPLEMENTAL FINANCIAL AND OPERATING INFORMATION | As of December 31, 2015▪ Q4 2015 REPORTING DEFINITIONS AND EXPLANATIONS 22 Funds from Operations (FFO) and Adjusted Funds from Operations (AFFO) We calculate FFO in accordance with the standards established by the National Association of Real Estate Investment Trusts, or NAREIT. FFO represents net income (loss) attributable to common stockholders (computed in accordance with GAAP), excluding real estate-related depreciation and amortization, impairment charges and net (gains) losses from property dispositions. FFO is a supplemental non-GAAP financial measure. We use FFO as a supplemental performance measure because we believe that FFO is beneficial to investors as a starting point in measuring our operational performance. Specifically, in excluding real estate-related depreciation and amortization, gains and losses from property dispositions and impairment charges, which do not relate to or are not indicative of operating performance, FFO provides a performance measure that, when compared year over year, captures trends in occupancy rates, rental rates and operating costs. We also believe that, as a widely recognized measure of the performance of equity REITs, FFO will be used by investors as a basis to compare our operating performance with that of other equity REITs. However, because FFO excludes depreciation and amortization and does not capture the changes in the value of our properties that result from use or market conditions, all of which have real economic effects and could materially impact our results from operations, the utility of FFO as a measure of our performance is limited. In addition, other equity REITs may not calculate FFO as we do, and, accordingly, our FFO may not be comparable to such other equity REITs’ FFO. Accordingly, FFO should be considered only as a supplement to net income (loss) attributable to common stockholders as a measure of our performance. AFFO is a non-GAAP financial measure of operating performance used by many companies in the REIT industry. We adjust FFO to eliminate the impact of certain items that we believe are not indicative of our core operating performance, including merger and finance restructuring costs, restructuring charges, default interest and fees on non-recourse mortgage indebtedness, debt extinguishment gains (losses), transaction costs incurred in connection with the acquisition of real estate investments subject to existing leases and certain non-cash items. These certain non-cash items include non- cash revenues (comprised of straight-line rents, amortization of above and below market rent on our leases, amortization of lease incentives, amortization of net premium (discount) on loans receivable and amortization of capitalized lease transaction costs), non-cash interest expense (comprised of amortization of deferred financing costs and amortization of net debt discount/ premium) and non-cash compensation expense (stock-based compensation expense). In addition, other equity REITs may not calculate AFFO as we do, and, accordingly, our AFFO may not be comparable to such other equity REITs’ AFFO. AFFO does not represent cash generated from operating activities determined in accordance with GAAP, is not necessarily indicative of cash available to fund cash needs and should not be considered as an alternative to net income (determined in accordance with GAAP) as a performance measure.
NYSE:SRC SUPPLEMENTAL FINANCIAL AND OPERATING INFORMATION | As of December 31, 2015▪ Q4 2015 Adjusted EBITDA represents EBITDA, or earnings before interest, taxes, depreciation and amortization, modified to include other adjustments to GAAP net income (loss) attributable to common stockholders for real estate acquisition costs, impairment losses, gains/losses from the sale of real estate and debt transactions and other items that we do not consider to be indicative of our on- going operating performance. We focus our business plans to enable us to sustain increasing shareholder value. Accordingly, we believe that excluding these items, which are not key drivers of our investment decisions and may cause short-term fluctuations in net income, provides a useful supplemental measure to investors and analysts in assessing the net earnings contribution of our real estate portfolio. Because these measures do not represent net income (loss) that is computed in accordance with GAAP, they should not be considered alternatives to net income (loss) or as an indicator of financial performance. A reconciliation of net income (loss) attributable to common stockholders (computed in accordance with GAAP) to EBITDA and Adjusted EBITDA is included in the Appendix found at the end of this presentation. Annualized Adjusted EBITDA is calculated by multiplying Adjusted EBITDA of a quarter by four. Our computation of Adjusted EBITDA and Annualized Adjusted EBITDA may differ from the methodology used by other equity REITs to calculate these measures, and, therefore, may not be comparable to such other equity REITs. A reconciliation of Annualized Adjusted EBITDA is included in the Appendix found at the end of this presentation. Adjusted Debt represents interest bearing debt (reported in accordance with GAAP) adjusted to exclude unamortized debt discount/premium and deferred financing costs, as further reduced by cash and cash equivalents as well as cash reserves on deposit with lenders as additional security. By excluding unamortized debt discount/premium and deferred financing costs, cash and cash equivalents, and cash reserves on deposit with lenders as additional security, the result provides an estimate of the contractual amount of borrowed capital to be repaid, net of cash available to repay it. We believe this calculation constitutes a beneficial supplemental non-GAAP financial disclosure to investors in understanding our financial condition. A reconciliation of interest bearing debt (reported in accordance with GAAP) to Adjusted Debt is included in the Appendix found at the end of this presentation. Adjusted Debt to Annualized Adjusted EBITDA is a supplemental non-GAAP financial measure we use to evaluate the level of borrowed capital being used to increase the potential return of our real estate investments, and a proxy for a measure we believe is used by many lenders and ratings agencies to evaluate our ability to repay and service our debt obligations over time. We believe this ratio is a beneficial disclosure to investors as a supplemental means of evaluating our ability to meet obligations senior to those of our equity holders. Our computation of this ratio may differ from the methodology used by other equity REITs, and, therefore, may not be comparable to such other equity REITs. Annualized Cash Rents represents the annualized monthly contractual cash rent of a lease at a specified period. Capitalization Rate represents the Annualized Cash Rents on the date of a property disposition divided by the gross sales price. For Multi-Tenant properties, non-reimbursable property costs are deducted from the Annualized Cash Rents prior to computing the disposition Capitalization Rate. CMBS are those notes secured by commercial real estate and rents therefrom under which certain indirect wholly-owned special purpose entity subsidiaries of the Company are the borrowers. These liabilities are discussed in greater detail in our financial statements and the notes thereto included in our periodic reports filed with the SEC. Convertible Notes are those $402.5 million convertible notes of the Company due in 2019 and the $345.0 million convertible notes of the Company due in 2021, together. These liabilities are discussed in greater detail in our financial statements and the notes thereto included in our periodic reports filed with the SEC. REPORTING DEFINITIONS AND EXPLANATIONS 23
NYSE:SRC SUPPLEMENTAL FINANCIAL AND OPERATING INFORMATION | As of December 31, 2015▪ Q4 2015 REPORTING DEFINITIONS AND EXPLANATIONS 24 Economic Yield is calculated by dividing the contractual cash rent, including fixed rent escalations and/or cash increases determined by CPI (assumes a prevailing 1.5% annual increase) by the initial lease term, expressed as a percentage of the Gross Investment. Enterprise Value represents Total Market Capitalization less cash and cash equivalents as of the date indicated. Equity Market Capitalization is calculated by multiplying the number of shares outstanding by the closing share price of the Company’s common stock as of the date indicated. Fixed Charge Coverage Ratio (FCCR) is the ratio of Annualized Adjusted EBITDA to Annualized Fixed Charges, a ratio derived from non-GAAP measures that we use to evaluate our liquidity and ability to obtain financing. Fixed charges consist of interest expense, reported in accordance with GAAP, less non-cash interest expense. Annualized fixed charges is calculated by multiplying fixed charges for the quarter by four. GAAP - Generally Accepted Accounting Principles in the United States. Gross Investment represents the gross acquisition cost including the contracted purchase price and related capitalized transaction costs. Initial Cash Yield from properties is calculated by dividing the first twelve months of contractual cash rent (excluding any future rent escalations provided subsequently in the lease and contingent rent) by the Gross Investment in the related properties. Initial cash yield is a measure (expressed as a percentage) of the contractual cash rent expected to be earned on an acquired property in the first year. Because it excludes any future rent increases or additional rent that may be contractually provided for in the lease, as well as any other income or fees that may be earned from lease modifications or asset dispositions, Initial Cash Yield does not represent the annualized investment rate of return of our acquired properties. Additionally, actual contractual cash rent earned from the properties acquired may differ from the Initial Cash Yield based on other factors, including difficulties collecting anticipated rental revenues and unanticipated expenses at these properties that we cannot pass on to tenants, as well as the risk factors set forth in our Annual Report on Form 10-K for the year ended December 31, 2015. Lease Expiration is the end of the initial term under a lease and does not account for extension periods under the lease. Master Trust Notes are those net-lease mortgage notes issued under the Spirit Master Funding Program and the securitization trusts established thereunder. Indirect special purpose entity subsidiaries of the Company are the borrowers. These liabilities are discussed in greater detail in our financial statements and the notes thereto included in our periodic reports filed with the SEC. Net Asset Value (NAV) We believe disclosing information frequently used in the calculation of NAV is useful to investors and because it enables and facilitates calculation of a metric frequently used by our management as one method to estimate the fair value of our business. The assessment of the fair value of our business is subjective in that it involves estimates and assumptions and can be calculated using various methods. Therefore, we have presented certain information regarding our financial and operating results, as well as our assets and liabilities that we believe are important in calculating our NAV, but have not presented any specific methodology nor provided any guidance on the assumptions or estimates that should be used in the calculation of NAV. The components of NAV do not consider the potential changes in the value of assets, the collectability of rents or other receivable obligations, or the value associated with our operating platform. Net Book Value represents the Real Estate Investment value net of accumulated depreciation.
NYSE:SRC SUPPLEMENTAL FINANCIAL AND OPERATING INFORMATION | As of December 31, 2015▪ Q4 2015 REPORTING DEFINITIONS AND EXPLANATIONS 25 Normalized Revenue represents current period quarterly GAAP total revenues as reported in the Consolidated Statement of Operations, adjusted to exclude total revenues contributed from properties sold during that period. We use Normalized Revenue to calculate tenant concentration percentages. A tenant concentration percentage is computed by dividing the current period quarterly GAAP total revenues contributed by a respective tenant’s owned properties at the end of the period by Normalized Revenue. Normalized Rental Revenue represents monthly GAAP rentals and earned income from direct financing leases from our owned properties recognized during the final month of the reporting period, adjusted to exclude GAAP rentals and earned income from direct financing leases contributed from properties sold during that period. We use Normalized Rental Revenue when calculating certain metrics that are useful to evaluate portfolio credit, asset type, industry and geographic diversity and to manage risk. Occupancy is calculated by dividing the number of occupied, owned properties in the portfolio as of the measurement date by the number of total owned properties on said date. Owned Properties refers to properties owned in fee or ground leased by Company subsidiaries as lessee. Real Estate Investment represents the Gross Investment plus improvements less impairment charges. Revolving Credit Facilities include (a) the $600 million unsecured credit facility which matures on March 31, 2019 (“2015 Credit Facility”), and (b) a $40 million secured revolving line of credit which expires on March 31, 2016 (“Line of Credit”). The 2015 Credit Facility includes sublimits for swingline loans and letter of credit issuances. Swingline loans and letters of credit reduce availability under the 2015 Credit Facility. The ability to borrow under these Revolving Credit Facilities is subject to the ongoing compliance with customary financial covenants. Term Loan is the $370 million unsecured term loan facility with an initial maturity date of November 2, 2018. The ability to borrow under the Term Loan is subject to the ongoing compliance with customary financial covenants. Total Market Capitalization represents Equity Market Capitalization plus Total Debt as of the date indicated. Total Debt represents the sum of the principal balances outstanding on interest-bearing debt on the Company’s balance sheet as of the date indicated. Unencumbered Assets represents the assets in our portfolio that are not subject to mortgage indebtedness, which we use to evaluate our potential access to capital and in our management of financial risk. The asset value attributed to these assets is the Real Estate Investment. Unsecured Debt represents components of Total Debt that are not secured by liens, mortgages or deeds of trust on Company assets. Unit Level Rent Coverage is used as an indicator of individual asset profitability, as well as signaling the property’s importance to our tenants’ financial viability. We calculate this ratio by dividing our reporting tenants’ trailing 12-month EBITDAR (earnings before interest, tax, depreciation, amortization and rent) by annual contractual rent. Weighted Average Remaining Lease Term is calculated by dividing the sum product of (a) a stated revenue or sales price component and (b) the lease term for each lease by (c) the sum of the total revenue or sale price components for all leases within the sample. Weighted Average Stated Interest Rate is calculated by dividing the sum product of (a) coupon interest rate of each note and (b) the principal balance outstanding of each note by (c) the sum of the total principal balances outstanding for all notes in the sample.
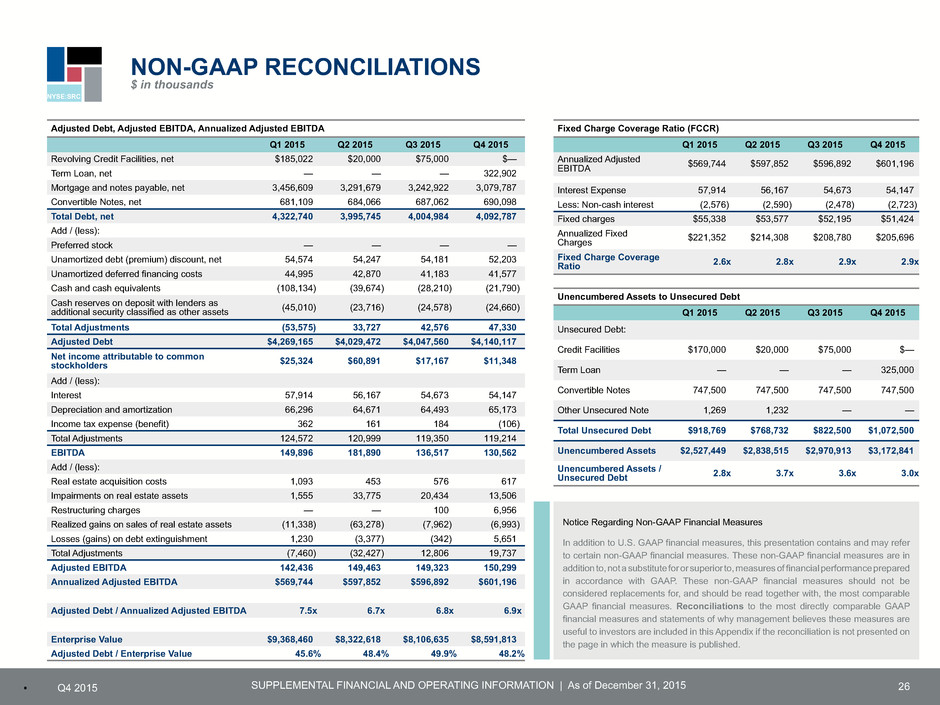
NYSE:SRC SUPPLEMENTAL FINANCIAL AND OPERATING INFORMATION | As of December 31, 2015▪ Q4 2015 26 Adjusted Debt, Adjusted EBITDA, Annualized Adjusted EBITDA Q1 2015 Q2 2015 Q3 2015 Q4 2015 Revolving Credit Facilities, net $185,022 $20,000 $75,000 $— Term Loan, net — — — 322,902 Mortgage and notes payable, net 3,456,609 3,291,679 3,242,922 3,079,787 Convertible Notes, net 681,109 684,066 687,062 690,098 Total Debt, net 4,322,740 3,995,745 4,004,984 4,092,787 Add / (less): Preferred stock — — — — Unamortized debt (premium) discount, net 54,574 54,247 54,181 52,203 Unamortized deferred financing costs 44,995 42,870 41,183 41,577 Cash and cash equivalents (108,134) (39,674) (28,210) (21,790) Cash reserves on deposit with lenders as additional security classified as other assets (45,010) (23,716) (24,578) (24,660) Total Adjustments (53,575) 33,727 42,576 47,330 Adjusted Debt $4,269,165 $4,029,472 $4,047,560 $4,140,117 Net income attributable to common stockholders $25,324 $60,891 $17,167 $11,348 Add / (less): Interest 57,914 56,167 54,673 54,147 Depreciation and amortization 66,296 64,671 64,493 65,173 Income tax expense (benefit) 362 161 184 (106) Total Adjustments 124,572 120,999 119,350 119,214 EBITDA 149,896 181,890 136,517 130,562 Add / (less): Real estate acquisition costs 1,093 453 576 617 Impairments on real estate assets 1,555 33,775 20,434 13,506 Restructuring charges — — 100 6,956 Realized gains on sales of real estate assets (11,338) (63,278) (7,962) (6,993) Losses (gains) on debt extinguishment 1,230 (3,377) (342) 5,651 Total Adjustments (7,460) (32,427) 12,806 19,737 Adjusted EBITDA 142,436 149,463 149,323 150,299 Annualized Adjusted EBITDA $569,744 $597,852 $596,892 $601,196 Adjusted Debt / Annualized Adjusted EBITDA 7.5x 6.7x 6.8x 6.9x Enterprise Value $9,368,460 $8,322,618 $8,106,635 $8,591,813 Adjusted Debt / Enterprise Value 45.6% 48.4% 49.9% 48.2% Fixed Charge Coverage Ratio (FCCR) Q1 2015 Q2 2015 Q3 2015 Q4 2015 Annualized Adjusted EBITDA $569,744 $597,852 $596,892 $601,196 Interest Expense 57,914 56,167 54,673 54,147 Less: Non-cash interest (2,576) (2,590) (2,478) (2,723) Fixed charges $55,338 $53,577 $52,195 $51,424 Annualized Fixed Charges $221,352 $214,308 $208,780 $205,696 Fixed Charge Coverage Ratio 2.6x 2.8x 2.9x 2.9x Unencumbered Assets to Unsecured Debt Q1 2015 Q2 2015 Q3 2015 Q4 2015 Unsecured Debt: Credit Facilities $170,000 $20,000 $75,000 $— Term Loan — — — 325,000 Convertible Notes 747,500 747,500 747,500 747,500 Other Unsecured Note 1,269 1,232 — — Total Unsecured Debt $918,769 $768,732 $822,500 $1,072,500 Unencumbered Assets $2,527,449 $2,838,515 $2,970,913 $3,172,841 Unencumbered Assets / Unsecured Debt 2.8x 3.7x 3.6x 3.0x NON-GAAP RECONCILIATIONS $ in thousands Notice Regarding Non-GAAP Financial Measures In addition to U.S. GAAP financial measures, this presentation contains and may refer to certain non-GAAP financial measures. These non-GAAP financial measures are in addition to, not a substitute for or superior to, measures of financial performance prepared in accordance with GAAP. These non-GAAP financial measures should not be considered replacements for, and should be read together with, the most comparable GAAP financial measures. Reconciliations to the most directly comparable GAAP financial measures and statements of why management believes these measures are useful to investors are included in this Appendix if the reconciliation is not presented on the page in which the measure is published.
NYSE:SRC SUPPLEMENTAL FINANCIAL AND OPERATING INFORMATION | As of December 31, 2015▪ Q4 2015 FORWARD-LOOKING STATEMENTS AND RISK FACTORS 27 The information in this supplemental report should be read in conjunction with the accompanying earnings press release, as well as the Company's Annual Report on Form 10- K and other information filed with the Securities and Exchange Commission. This supplemental report is not incorporated into such filings. This document is not an offer to sell or a solicitation to buy securities of Spirit Realty Capital, Inc. Any offer or solicitation shall be made only by means of a prospectus approved for that purpose. Forward-Looking and Cautionary Statements This document contains forward‐looking statements within the meaning of the Private Securities Litigation Reform Act of 1995 and other federal securities laws. These forward‐ looking statements can be identified by the use of words such as “expects,” “plans,” “estimates,” “projects,” “intends,” “believes,” “guidance,” and other similar expressions that do not relate to historical matters. These forward‐looking statements are subject to known and unknown risks and uncertainties that can cause actual results to differ materially from those currently anticipated due to a number of factors, which include, but are not limited to, Spirit’s continued ability to source new investments, risks associated with using debt and equity financing to fund Spirit’s business activities (including refinancing and interest rate risks, changes in interest rates and/or credit spreads, changes in the price of our common stock, and conditions of the equity and debt capital markets, generally), unknown liabilities acquired in connection with acquired properties or interests in real‐estate related entities, general risks affecting the real estate industry (including, without limitation, the market value of our properties, the inability to enter into or renew leases at favorable rates, portfolio occupancy varying from our expectations, dependence on tenants’ financial condition and operating performance, and competition from other developers, owners and operators of real estate), risks associated with our failure to maintain our status as a REIT under the Internal Revenue Code of 1986, as amended, risks associated with our relocation and transition to our new corporate headquarters in Dallas Texas and other additional risks discussed in Spirit’s most recent filings with the Securities and Exchange Commission, including its Annual Report on Form 10-K. Spirit expressly disclaims any responsibility to update or revise forward‐ looking statements, whether as a result of new information, future events or otherwise, except as required by law.
