Attached files
| file | filename |
|---|---|
| 8-K - FORM 8-K - Kraton Corp | kra0224168-kearningspresen.htm |

Kraton Performance Polymers, Inc. Fourth Quarter 2015 Earnings Conference Call February 24, 2016

Kraton Fourth Quarter 2015 Earnings Call Forward Looking Statement Disclaimer 2 This presentation includes forward-looking statements that reflect our plans, beliefs, expectations, and current views with respect to, among other things, future events and financial performance. Forward-looking statements are often characterized by the use of words such as “outlook,” “believes,” “estimates,” “expects,” “projects,” “may,” “intends,” “plans” or “anticipates,” or by discussions of strategy, plans or intentions, including all matters described on the slide titled “Modeling Assumptions” including, but not limited to, expectations for revenue, adjusted EBITDA, depreciation and amortization, non-cash compensation expense, interest expense, tax provision, capital expenditures, spread between FIFO and ECRC, net debt, anticipated synergies and cost reset savings. All forward-looking statements in this presentation are made based on management's current expectations and estimates, which involve known and unknown risks, uncertainties, and other important factors that could cause actual results to differ materially from those expressed in forward-looking statements. These risks and uncertainties are more fully described in our latest Annual Report on Form 10-K, including but not limited to “Part I, Item 1A. Risk Factors” and “Part II, Item 7. Management’s Discussion and Analysis of Financial Condition and Results of Operations” therein, and in our other filings with the Securities and Exchange Commission, and include, but are not limited to, risks related to: the integration of Arizona Chemical Holdings Corporation; Kraton's ability to repay its indebtedness; Kraton's reliance on third parties for the provision of significant operating and other services; conditions in the global economy and capital markets; fluctuations in raw material costs; limitations in the availability of raw materials; competition in Kraton's end-use markets; and other factors of which we are currently unaware or deem immaterial. Readers are cautioned not to place undue reliance on our forward-looking statements. Forward-looking statements speak only as of the date they are made, and we assume no obligation to update such information in light of new information or future events.
Kraton Fourth Quarter 2015 Earnings Call GAAP Disclaimer 3 This presentation includes the use of both GAAP and non-GAAP financial measures. The non-GAAP financial measures are EBITDA, Adjusted EBITDA, Adjusted Gross Profit and Adjusted Net Income attributable to Kraton (or earnings per share). Tables included in this presentation and our earnings release reconcile each of these non-GAAP financial measures with the most directly comparable GAAP financial measure. For additional information on the impact of the spread between the FIFO basis of accounting and estimated current replacement cost (“ECRC”), see Management’s Discussion and Analysis of Financial Condition and Results of Operations in our Annual Report on Form 10-K for the fiscal year ended December 31, 2015. We consider these non-GAAP financial measures to be important supplemental measures of our performance and believe they are frequently used by investors, securities analysts and other interested parties in the evaluation of our performance including period-to-period comparisons and/or that of other companies in our industry. Further, management uses these measures to evaluate operating performance, and our incentive compensation plan bases incentive compensation payments on our Adjusted EBITDA performance, along with other factors. These non-GAAP financial measures have limitations as analytical tools and in some cases can vary substantially from other measures of our performance. You should not consider them in isolation, or as a substitute for analysis of our results under GAAP in the United States. For EBITDA, these limitations include: EBITDA does not reflect the significant interest expense on our debt; EBITDA does not reflect the significant depreciation and amortization expense associated with our long-lived assets; EBITDA included herein should not be used for purposes of assessing compliance or non-compliance with financial covenants under our debt agreements. The calculation of EBITDA in our debt agreements includes adjustments, such as extraordinary, non-recurring or one-time charges, proforma cost savings, certain non-cash items, turnaround costs, and other items included in the definition of EBITDA in our debt agreements; and other companies in our industry may calculate EBITDA differently than we do, limiting its usefulness as a comparative measure. As an analytical tool, Adjusted EBITDA is subject to all the limitations applicable to EBITDA. We prepare Adjusted EBITDA by eliminating from EBITDA the impact of a number of items we do not consider indicative of our on-going performance, including the spread between FIFO and ECRC, but you should be aware that in the future we may incur expenses similar to the adjustments in this presentation. Our presentation of Adjusted EBITDA should not be construed as an inference that our future results will be unaffected by unusual or non-recurring items. In addition, due to volatility in raw material prices, Adjusted EBITDA may, and often does, vary substantially from EBITDA and other performance measures, including net income calculated in accordance with U.S. GAAP; and Adjusted EBITDA may, and often will, vary significantly from EBITDA calculations under the terms of our debt agreements and should not be used for assessing compliance or non-compliance with financial covenants under our debt agreements. Because of these and other limitations, EBITDA and Adjusted EBITDA should not be considered as a measure of discretionary cash available to us to invest in the growth of our business. As a measure of our performance, Adjusted Gross Profit is limited because it often will vary substantially from gross profit calculated in accordance with U.S. GAAP due to volatility in raw material prices. Finally, we prepare Adjusted Net Income attributable to Kraton by eliminating from net income the impact of a number of items we do not consider indicative of our on-going performance, including the spread between FIFO and ECRC. Our presentation of non-GAAP financial measures and the adjustments made therein should not be construed as an inference that our future results will be unaffected by unusual or non-recurring items, and in the future we may incur expenses or charges similar to the adjustments made in the presentation of our non-GAAP financial measures.

Kraton Fourth Quarter 2015 Earnings Call Fourth Quarter 2015 Overview 4 ($ in thousands, except volume and per share amounts) Q4 2015 Q4 2014 Change Sales volume (in kilotons) 74.9 72.2 2.7 Revenue $ 248.3 $ 276.0 $ (27.8) EBITDA(1) $ 19.5 $ 6.5 $ 13.0 Adjusted EBITDA(1) $ 50.0 $ 31.7 $ 18.3 Net loss attributable to Kraton (GAAP) $ (4.0) $ (17.4) $ 13.5 Adjusted net income attributable to Kraton(1) $ 22.8 $ 5.1 $ 17.7 Loss per diluted share (GAAP) $ (0.13) $ (0.54) $ 0.41 Adjusted earnings per diluted share(1) $ 0.74 $ 0.16 $ 0.58 _______________________________________ (1) See Non-GAAP reconciliations included in the accompanying financial tables for the reconciliation of each non-GAAP measure to its most directly comparable GAAP measure.

Kraton Fourth Quarter 2015 Earnings Call Full Year 2015 Overview 5 ($ in thousands, except volume and per share amounts) 2015 2014 Change Sales volume (in kilotons) 306.5 305.6 0.9 Revenue $ 1,034.6 $ 1,230.4 $ (195.8) EBITDA(1) $ 80.7 $ 97.2 $ (16.4) Adjusted EBITDA(1) $ 166.8 $ 147.2 $ 19.6 Net income (loss) attributable to Kraton (GAAP) $ (10.5) $ 2.4 $ (13.0) Adjusted net income attributable to Kraton(1) $ 63.5 $ 38.4 $ 25.1 Earnings (loss) per diluted share (GAAP) $ (0.34) $ 0.07 $ (0.41) Adjusted earnings per diluted share(1) $ 2.02 $ 1.16 $ 0.86 Net cash provided by operating activities $ 103.8 $ 29.9 $ 74.0 _______________________________________ (1) See Non-GAAP reconciliations included in the accompanying financial tables for the reconciliation of each non-GAAP measure to its most directly comparable GAAP measure.

Kraton Fourth Quarter 2015 Earnings Call CariflexTM Medical 94% Industrial 6% 6 ▪ Sales volume increased 10.2% compared to 2014, primarily due to higher sales into surgical glove applications ▪ Currency movements adversely impacted revenue by $7.7 million 2015 Revenue by Application Europe 8% Asia 91% North America 1% 2015 Revenue by Geography 2014 2015 100% 100% Portfolio Composition Innovation & Differentiated ($ millions) Q4 2015 Q4 2014 Change Revenue $40.8 $34.0 $6.8 ($ millions) 2015 2014 Change Revenue $142.9 $138.6 $4.3 ▪ Sales volume increased 24.7% compared to 2014, primarily due to higher sales into surgical glove applications ▪ Currency movements adversely impacted revenue by $1.1 million

Kraton Fourth Quarter 2015 Earnings Call Specialty Polymers 7 ▪ Sales volume decreased 3.4%, due to lower sales into lubricant additive and personal care applications ▪ $27.4 million of revenue decline is attributable to lower average selling prices associated with lower raw material costs ▪ Currency movements adversely impacted revenue by $19.6 million Other 27% Lubricant additives 14% Polymod 13% Personal care 10% Medical 10% Cable gels 7% Adhesives and coatings 7% Industrial 7% Consumer 5% 2015 Revenue by Application Asia 33% Europe 25% North America 41% South America 1% 2015 Revenue by Geography 2014 2015 24% 28% 76% 72% Portfolio Composition Standard Innovation & Differentiated ($ millions) Q4 2015 Q4 2014 Change Revenue $ 87.6 $ 94.9 $ (7.3) ($ millions) 2015 2014 Change Revenue $ 350.7 $ 412.4 $ (61.7) ▪ Sales volume increased 3.2%, due to higher sales into medical, industrial, consumer, and cable gel applications ▪ $6.4 million of revenue decline is attributable to lower average selling prices associated with lower raw material costs ▪ Currency movements adversely impacted revenue by $3.7 million
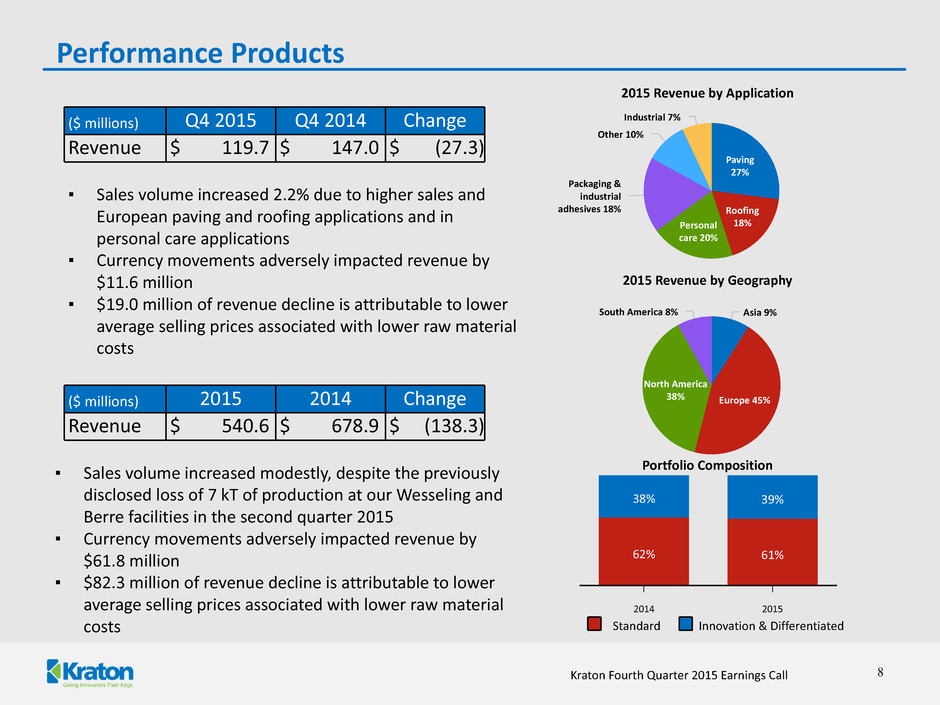
Kraton Fourth Quarter 2015 Earnings Call Performance Products Paving 27% Roofing 18%Personal care 20% Packaging & industrial adhesives 18% Other 10% Industrial 7% Asia 9% Europe 45% North America 38% South America 8% 8 ▪ Sales volume increased modestly, despite the previously disclosed loss of 7 kT of production at our Wesseling and Berre facilities in the second quarter 2015 ▪ Currency movements adversely impacted revenue by $61.8 million ▪ $82.3 million of revenue decline is attributable to lower average selling prices associated with lower raw material costs 2015 Revenue by Application 2014 2015 62% 61% 38% 39% 2015 Revenue by Geography Portfolio Composition Standard Innovation & Differentiated ▪ Sales volume increased 2.2% due to higher sales and European paving and roofing applications and in personal care applications ▪ Currency movements adversely impacted revenue by $11.6 million ▪ $19.0 million of revenue decline is attributable to lower average selling prices associated with lower raw material costs ($ millions) Q4 2015 Q4 2014 Change Revenue $ 119.7 $ 147.0 $ (27.3) ($ millions) 2015 2014 Change Revenue $ 540.6 $ 678.9 $ (138.3)
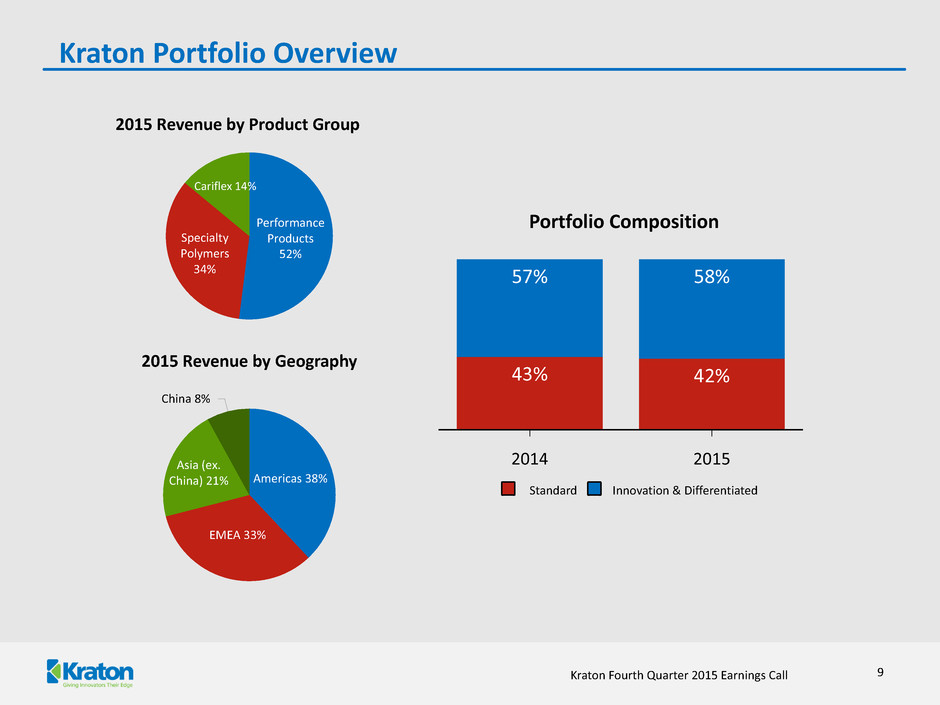
Kraton Fourth Quarter 2015 Earnings Call Performance Products 52% Specialty Polymers 34% Cariflex 14% Americas 38% EMEA 33% Asia (ex. China) 21% China 8% Kraton Portfolio Overview 9 2015 Revenue by Geography 2015 Revenue by Product Group Portfolio Composition 2014 2015 43% 42% 57% 58% Standard Innovation & Differentiated

Kraton Fourth Quarter 2015 Earnings Call Fourth Quarter Revenue and Adjusted Gross Profit 10 ▪ 74.9 kilotons of sales volume in Q4 2015, compared to 72.2 kilotons in Q4 2014 ▪ Of the $27.8 million revenue decline, $25.9 million reflects lower average selling prices associated with lower raw material costs ▪ Currency movements adversely impacted revenue by $16.4 million ▪ Fourth quarter 2015 adjusted gross profit was $1,035 per ton compared to $817 per ton in Q4 2014, driven by strong quarterly volume and favorable mix ▪ $5.4 million reduction in turnaround costs ▪ $5.0 million improvement in Adjusted Gross Profit from cost reset initiatives ▪ Currency movements adversely impacted adjusted gross profit by $6.5 million or $87 per ton See the appendix for a reconciliation of GAAP to non-GAAP financial measures. ($ in millions) Revenue Q4 2014 Q4 2015 $276 $248 Adjusted Gross Profit Q4 2014 Q4 2015 $59 $78

Kraton Fourth Quarter 2015 Earnings Call Fourth Quarter Adjusted EBITDA and Adjusted EPS 11 ▪ Adjusted EPS increased $0.58 per diluted share ▪ Currency negatively impacted adjusted EPS by $0.14 per share ($ in millions) See the appendix for a reconciliation of GAAP to non-GAAP financial measures. Adjusted EPS Q4 2014 Q4 2015 $0.16 $0.74 ▪ Adjusted EBITDA increased $18.3 million compared to Q4 2014 ▪ Currency headwind of $5.3 million ▪ $7.5 million of Adjusted EBITDA growth from cost reset initiatives Adjusted EBITDA Q4 2014 Q4 2015 $32 $50
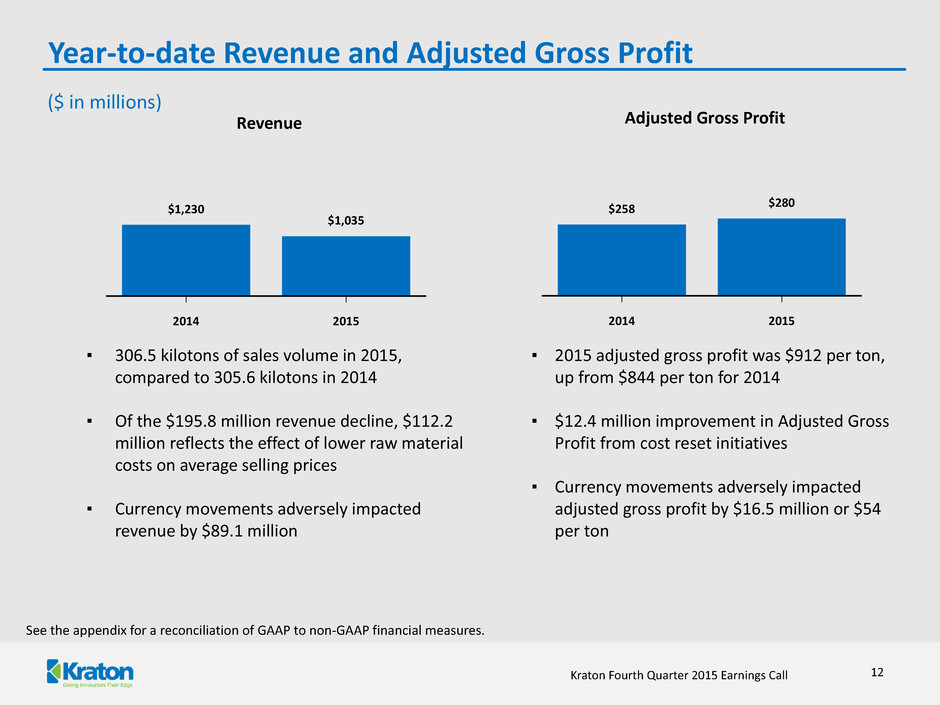
Kraton Fourth Quarter 2015 Earnings Call Year-to-date Revenue and Adjusted Gross Profit 12 ▪ 306.5 kilotons of sales volume in 2015, compared to 305.6 kilotons in 2014 ▪ Of the $195.8 million revenue decline, $112.2 million reflects the effect of lower raw material costs on average selling prices ▪ Currency movements adversely impacted revenue by $89.1 million ▪ 2015 adjusted gross profit was $912 per ton, up from $844 per ton for 2014 ▪ $12.4 million improvement in Adjusted Gross Profit from cost reset initiatives ▪ Currency movements adversely impacted adjusted gross profit by $16.5 million or $54 per ton See the appendix for a reconciliation of GAAP to non-GAAP financial measures. ($ in millions) Revenue 2014 2015 $1,230 $1,035 Adjusted Gross Profit 2014 2015 $258 $280

Kraton Fourth Quarter 2015 Earnings Call Year-to-date Adjusted EBITDA and Adjusted EPS 13 ▪ Adjusted EPS increased $0.86 per diluted share ▪ Currency negatively impacted adjusted EPS by $0.23 per share ▪ Adjusted EBITDA increased $19.6 million ▪ Cost reduction initiatives of $12.4 million included in COGS and $6.9 million in SAR ▪ Currency headwind of $11.0 million See the appendix for a reconciliation of GAAP to non-GAAP financial measures. ($ in millions) Adjusted EPS 2014 2015 $1.16 $2.02 Adjusted EBITDA 2014 2015 $147 $167

Kraton Fourth Quarter 2015 Earnings Call Cash Flow and Other Financial Highlights 14 Twelve Months Ended December 31, 2015 ($ in millions) Kraton KFPC Consolidated Operating activities $ 112.9 $ (9.1) $ 103.8 Investing activities (59.6) (69.1) (128.7) Financing activities (33.0) 80.1 47.1 Foreign currency impact (5.4) (0.6) (6.0) Change in cash 14.9 1.3 16.2 Beginning cash 45.8 8.0 53.8 Ending cash 60.7 9.3 70.0 Debt 352.3 76.9 429.2 Net Debt $ 291.6 $ 67.6 $ 359.2 Note: may not foot due to rounding
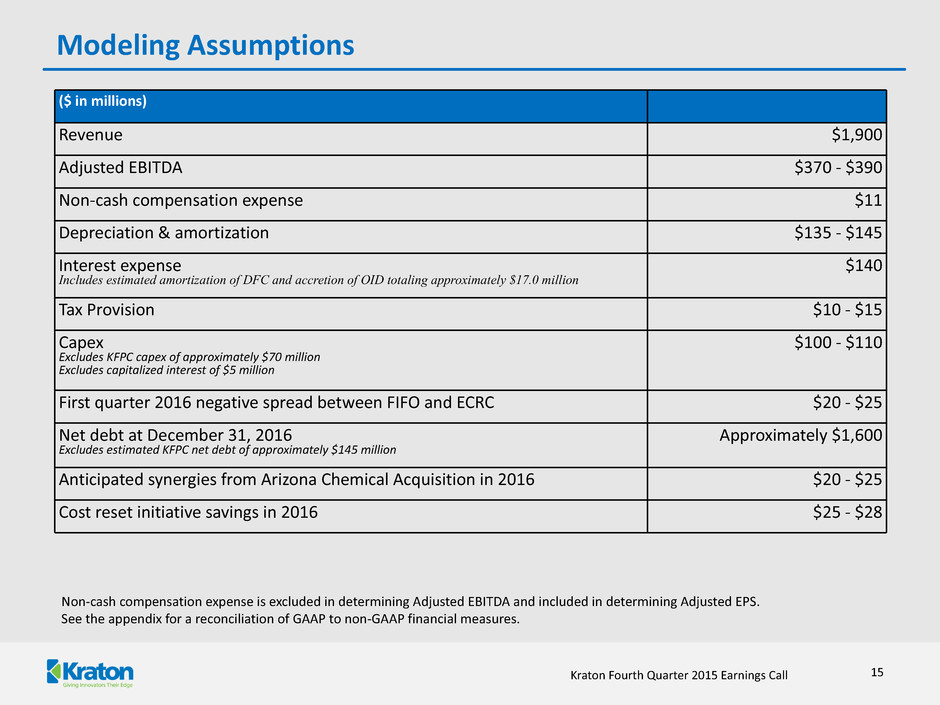
Kraton Fourth Quarter 2015 Earnings Call Modeling Assumptions 15 ($ in millions) Revenue $1,900 Adjusted EBITDA $370 - $390 Non-cash compensation expense $11 Depreciation & amortization $135 - $145 Interest expense Includes estimated amortization of DFC and accretion of OID totaling approximately $17.0 million $140 Tax Provision $10 - $15 Capex Excludes KFPC capex of approximately $70 million Excludes capitalized interest of $5 million $100 - $110 First quarter 2016 negative spread between FIFO and ECRC $20 - $25 Net debt at December 31, 2016 Excludes estimated KFPC net debt of approximately $145 million Approximately $1,600 Anticipated synergies from Arizona Chemical Acquisition in 2016 $20 - $25 Cost reset initiative savings in 2016 $25 - $28 Non-cash compensation expense is excluded in determining Adjusted EBITDA and included in determining Adjusted EPS. See the appendix for a reconciliation of GAAP to non-GAAP financial measures.

Kraton Fourth Quarter 2015 Earnings Call Appendix February 24, 2016 16

Kraton Fourth Quarter 2015 Earnings Call Monomer Volatility ($ in millions, except per ton information) 17 Quarterly Difference Between Inventory Valuation at FIFO and at ECRC Adjusted Gross Profit per Ton Annual Difference Between Inventory Valuation at FIFO and at ECRC Q1’13 Q2’13 Q3’13 Q4’13 Q1'14 Q2'14 Q3'14 Q4’14 Q1’15 Q2’15 Q3’15 Q4’15 $772 $804 $860 $890 $890 $867 $803 $817 $1,075 $698 $850 $1,035 Q1’13 Q2’13 Q3’13 Q4’13 Q1'14 Q2'14 Q3'14 Q4’14 Q1’15 Q2’15 Q3’15 Q4’15 $(0.5) $(2.3) $(20.7) $(7.3) $4.0 $4.3 $(1.8) $(15.8) $(33.4) $(5.8) $(0.9) $(10.5) 2011 2012 2013 2014 2015 $66.3 $(30.5) $(30.7) $(9.3) $(50.7)

Kraton Fourth Quarter 2015 Earnings Call Reconciliation of Gross Profit to Adjusted Gross Profit ($ in millions) 18 Q1’13 Q2’13 Q3’13 Q4’13 Q1'14 Q2'14 Q3'14 Q4’14 Q1’15 Q2’15 Q3’15 Q4’15 Gross Profit @ FIFO $ 59.9 $ 59.9 $ 47.5 $ 58.6 $ 57.1 $ 72.1 $ 63.8 $ 44.1 $ 46.6 $ 47.4 $ 67.8 $ 66.8 FIFO to ECRC 0.5 2.3 20.7 7.3 (4.0) (4.3) 1.8 15.8 33.4 5.8 0.9 10.5 Restructuring and other charges — — 0.1 0.1 0.5 0.1 — 0.1 — 0.1 0.1 — Production downtime — — 3.5 — 12.4 — (1.0) (1.5) (0.2) (0.2) (0.1) — Impairment of spare parts inventory — — — — — — — 0.4 — — — — Non-cash compensation expense — 0.1 0.1 0.1 0.2 0.2 0.1 0.1 0.2 0.1 0.1 0.1 Adjusted Gross Profit $ 60.4 $ 62.3 $ 71.8 $ 66.1 $ 66.2 $ 68.0 $ 64.8 $ 59.0 $ 80.0 $ 53.2 $ 68.8 $ 77.5 Sales Volume (Kilotons) 78.2 77.5 83.5 74.3 74.4 78.4 80.7 72.2 74.4 76.2 81.0 74.9 Adjusted Gross Profit per ton $ 772 $ 804 $ 860 $ 890 $ 890 $ 867 $ 803 $ 817 $ 1,075 $ 698 $ 850 $ 1,035 Columns may not foot due to rounding.

Kraton Fourth Quarter 2015 Earnings Call GAAP and Non-GAAP Statement of Operations – Q4 2015 ($ in thousands, except per share amounts) 19 Three Months Ended December 31, 2015 As Reported Other Adjustments FIFO TO ECRC Adjustment Adjusted Revenue $ 248,277 $ — $ — $ 248,277 Cost of goods sold 181,428 (17) (a) (10,514) 170,897 Gross profit 66,849 17 10,514 77,380 Operating expenses: Research and development 7,679 — — 7,679 Selling, general and administrative 39,820 (17,616) (b) — 22,204 Depreciation and amortization 15,241 — — 15,241 Total operating expenses 62,740 (17,616) — 45,124 Earnings of unconsolidated joint venture 133 — — 133 Interest expense, net 6,248 — — 6,248 Income (loss) before income taxes (2,006) 17,633 10,514 26,141 Income tax expense 2,808 314 (c) 303 3,425 Consolidated net income (loss) (4,814) 17,319 10,211 22,716 Net loss attributable to noncontrolling interest (853) 753 (d) — (100) Net income (loss) attributable to Kraton $ (3,961) $ 16,566 $ 10,211 $ 22,816 Earnings (loss) per common share: Basic $ (0.13) $ 0.55 $ 0.33 $ 0.75 Diluted $ (0.13) $ 0.54 $ 0.33 $ 0.74 Weighted average common shares outstanding: Basic 29,969 29,969 29,969 29,969 Diluted 29,969 30,296 30,296 30,296 (a) Restructuring and other charges. (b) $15.0 million of transaction costs, $1.8 million of KFPC startup costs, $0.8 million of charges associated with the termination of the defined benefit restoration plan, $0.2 million of restructuring and other charges, partially offset by a $0.2 million reduction of production downtime costs. (c) Tax effect of other adjustments. (d) KFPC startup costs.

Kraton Fourth Quarter 2015 Earnings Call GAAP and Non-GAAP Statement of Operations – Q4 2014 ($ in thousands, except per share amounts) 20 Three Months Ended December 31, 2014 As Reported Other Adjustments FIFO TO ECRC Adjustment Adjusted Revenue $ 276,039 $ — $ — $ 276,039 Cost of goods sold 231,949 996 (a) (15,763) 217,182 Gross profit 44,090 (996) 15,763 58,857 Operating expenses: Research and development 7,634 (16) (b) — 7,618 Selling, general and administrative 25,337 (3,711) (c) — 21,626 Depreciation and amortization 16,612 — — 16,612 Impairment of long-lived assets 4,731 (4,731) (d) — — Total operating expenses 54,314 (8,458) — 45,856 Earnings of unconsolidated joint venture 83 — — 83 Interest expense, net 5,927 — — 5,927 Income (loss) before income taxes (16,068) 7,462 15,763 7,157 Income tax expense 1,713 182 (e) 239 2,134 Consolidated net income (loss) (17,781) 7,280 15,524 5,023 Net loss attributable to noncontrolling interest (351) 238 (f) — (113) Net income (loss) attributable to Kraton $ (17,430) $ 7,042 $ 15,524 $ 5,136 Earnings (loss) per common share: Basic $ (0.54) $ 0.22 $ 0.48 $ 0.16 Diluted $ (0.54) $ 0.22 $ 0.48 $ 0.16 Weighted average common shares outstanding: Basic 31,907 31,907 31,907 31,907 Diluted 31,907 32,160 32,160 32,160 (a) $1.5 million reduction of production downtime costs related to a partial insurance recovery and change in total estimated costs, partially offset by $0.1 million of restructuring and other charges and $0.4 million of impairment of spare parts inventory. (b) Charges associated with the termination of the defined benefit restoration pension plan. (c) $2.2 million of restructuring and other charges, $0.8 million of transaction costs, $0.4 million of charges associated with the termination of the defined benefit restoration plan, and $0.6 million of KFPC startup costs, partially offset by a $0.2 million reduction of production downtime costs related to a partial insurance recovery and change in total estimated costs. (d) Impairment of engineering, information technology, office, and other long-lived assets. (e) Income tax benefit related to a portion of the change in our valuation allowance for deferred tax assets. (f) KFPC startup costs.
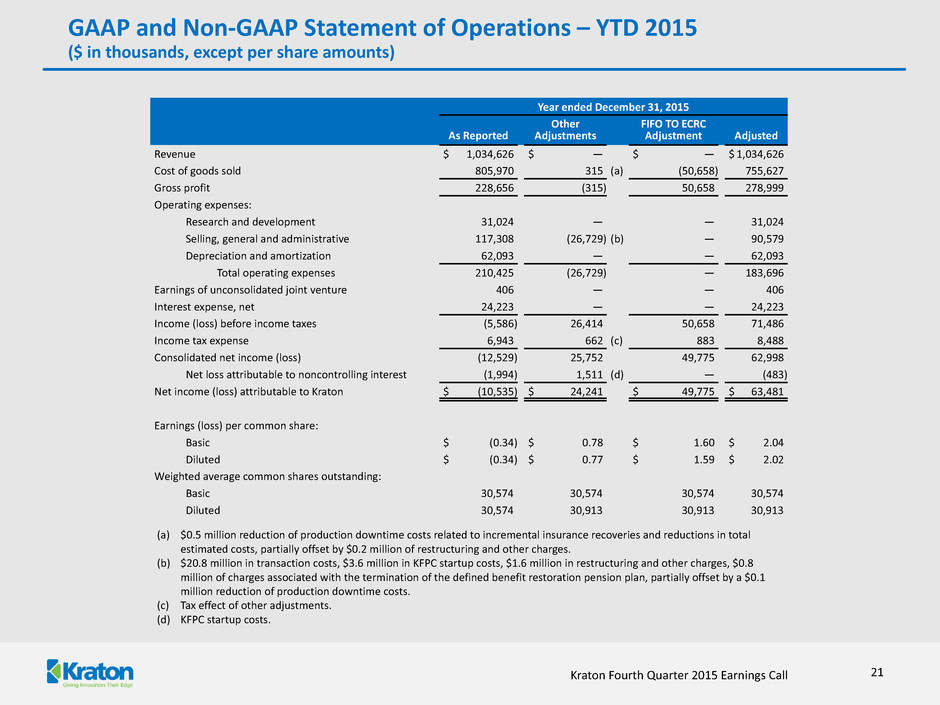
Kraton Fourth Quarter 2015 Earnings Call 21 Year ended December 31, 2015 As Reported Other Adjustments FIFO TO ECRC Adjustment Adjusted Revenue $ 1,034,626 $ — $ — $ 1,034,626 Cost of goods sold 805,970 315 (a) (50,658) 755,627 Gross profit 228,656 (315) 50,658 278,999 Operating expenses: Research and development 31,024 — — 31,024 Selling, general and administrative 117,308 (26,729) (b) — 90,579 Depreciation and amortization 62,093 — — 62,093 Total operating expenses 210,425 (26,729) — 183,696 Earnings of unconsolidated joint venture 406 — — 406 Interest expense, net 24,223 — — 24,223 Income (loss) before income taxes (5,586) 26,414 50,658 71,486 Income tax expense 6,943 662 (c) 883 8,488 Consolidated net income (loss) (12,529) 25,752 49,775 62,998 Net loss attributable to noncontrolling interest (1,994) 1,511 (d) — (483) Net income (loss) attributable to Kraton $ (10,535) $ 24,241 $ 49,775 $ 63,481 Earnings (loss) per common share: Basic $ (0.34) $ 0.78 $ 1.60 $ 2.04 Diluted $ (0.34) $ 0.77 $ 1.59 $ 2.02 Weighted average common shares outstanding: Basic 30,574 30,574 30,574 30,574 Diluted 30,574 30,913 30,913 30,913 (a) $0.5 million reduction of production downtime costs related to incremental insurance recoveries and reductions in total estimated costs, partially offset by $0.2 million of restructuring and other charges. (b) $20.8 million in transaction costs, $3.6 million in KFPC startup costs, $1.6 million in restructuring and other charges, $0.8 million of charges associated with the termination of the defined benefit restoration pension plan, partially offset by a $0.1 million reduction of production downtime costs. (c) Tax effect of other adjustments. (d) KFPC startup costs. GAAP and Non-GAAP Statement of Operations – YTD 2015 ($ in thousands, except per share amounts)
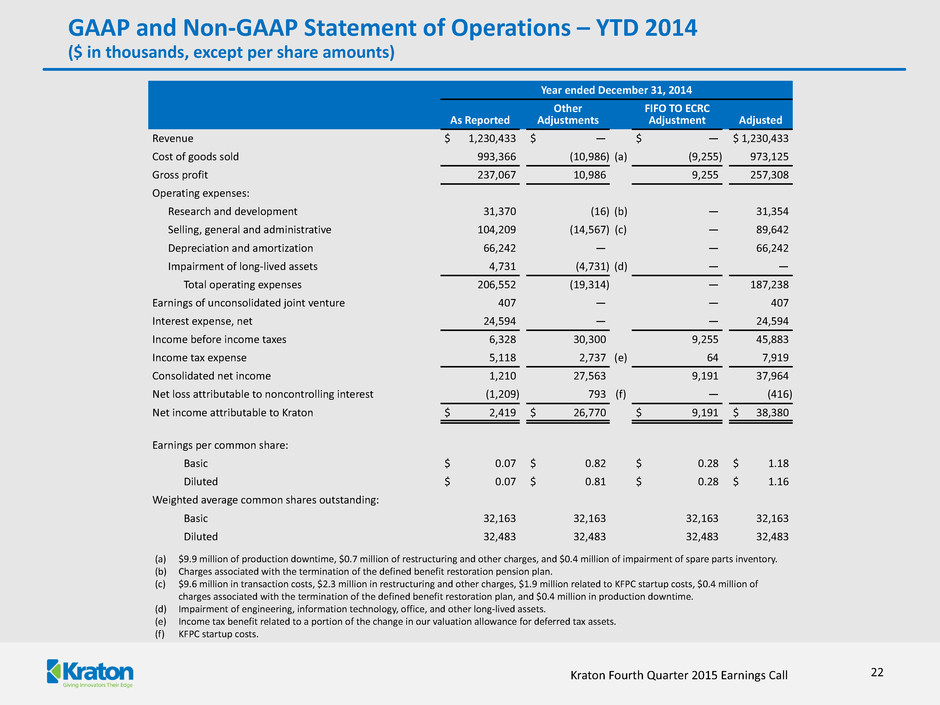
Kraton Fourth Quarter 2015 Earnings Call 22 Year ended December 31, 2014 As Reported Other Adjustments FIFO TO ECRC Adjustment Adjusted Revenue $ 1,230,433 $ — $ — $ 1,230,433 Cost of goods sold 993,366 (10,986) (a) (9,255) 973,125 Gross profit 237,067 10,986 9,255 257,308 Operating expenses: Research and development 31,370 (16) (b) — 31,354 Selling, general and administrative 104,209 (14,567) (c) — 89,642 Depreciation and amortization 66,242 — — 66,242 Impairment of long-lived assets 4,731 (4,731) (d) — — Total operating expenses 206,552 (19,314) — 187,238 Earnings of unconsolidated joint venture 407 — — 407 Interest expense, net 24,594 — — 24,594 Income before income taxes 6,328 30,300 9,255 45,883 Income tax expense 5,118 2,737 (e) 64 7,919 Consolidated net income 1,210 27,563 9,191 37,964 Net loss attributable to noncontrolling interest (1,209) 793 (f) — (416) Net income attributable to Kraton $ 2,419 $ 26,770 $ 9,191 $ 38,380 Earnings per common share: Basic $ 0.07 $ 0.82 $ 0.28 $ 1.18 Diluted $ 0.07 $ 0.81 $ 0.28 $ 1.16 Weighted average common shares outstanding: Basic 32,163 32,163 32,163 32,163 Diluted 32,483 32,483 32,483 32,483 (a) $9.9 million of production downtime, $0.7 million of restructuring and other charges, and $0.4 million of impairment of spare parts inventory. (b) Charges associated with the termination of the defined benefit restoration pension plan. (c) $9.6 million in transaction costs, $2.3 million in restructuring and other charges, $1.9 million related to KFPC startup costs, $0.4 million of charges associated with the termination of the defined benefit restoration plan, and $0.4 million in production downtime. (d) Impairment of engineering, information technology, office, and other long-lived assets. (e) Income tax benefit related to a portion of the change in our valuation allowance for deferred tax assets. (f) KFPC startup costs. GAAP and Non-GAAP Statement of Operations – YTD 2014 ($ in thousands, except per share amounts)

Kraton Fourth Quarter 2015 Earnings Call Reconciliation of Net Loss and EPS to Adjusted Net Income and EPS ($ in thousands, except per share amounts) 23 Three months ended December 31, 2015 Three months ended December 31, 2014 Income (Loss) Before Income Tax Income Taxes Noncontrolling Interest Diluted EPS Income (Loss) Before Income Tax Income Taxes Noncontrolling Interest Diluted EPS GAAP loss $ (2,006) $ 2,808 $ (853) $ (0.13) $ (16,068) $ 1,713 $ (351) $ (0.54) Retirement plan charges (a) 792 — — 0.03 399 8 — 0.01 Restructuring and other charges (b) 230 6 — 0.01 2,300 78 — 0.07 Transaction and acquisition related costs (c) 15,048 — — 0.49 763 15 — 0.03 Impairment of long-lived assets (d) — — — — 4,731 95 — 0.14 Impairment of spare parts inventory (e) — — — — 430 9 — 0.01 Production downtime (f) (250) — — (0.01) (1,732) (35) — (0.05) KFPC startup costs (g) 1,813 308 753 0.02 571 96 238 0.01 Change in valuation allowance (h) — — — — — (84) — — Spread between FIFO and ECRC 10,514 303 — 0.33 15,763 239 — 0.48 Adjusted Earnings $ 26,141 $ 3,425 $ (100) $ 0.74 $ 7,157 $ 2,134 $ (113) $ 0.16 (a) Charges associated with the termination of the defined benefit restoration pension plan, which are primarily recorded in selling, general, and administrative expenses. (b) Employee severance, professional fees, and other restructuring related charges which are primarily recorded in selling, general, and administrative expenses. (c) Charges related to the evaluation of acquisition transactions which are recorded in selling, general, and administrative expenses. In 2015, charges are primarily related to the acquisition of Arizona Chemical. In 2014, charges are primarily related to the terminated combination agreement with LCY. (d) The charge recognized in 2014 includes $2.4 million related to engineering and design assets for projects we determined were no longer economically viable, $1.4 million related to information technology and office assets associated with restructuring activities, and $0.9 million related to other long-lived assets. (e) Impairment of spare parts inventory associated with the coal-burning boilers which were decommissioned in 2015 which is recorded in cost of goods sold. (f) In 2015, the reduction in costs is due to insurance recoveries related to the Belpre production downtime, which are primarily recorded in cost of goods sold. In 2014, weather-related production downtime at our Belpre, Ohio, facility and an operating disruption from a small fire at our Berre, France, facility, of which $9.9 million is recorded in cost of goods sold and $0.4 million is recorded in selling, general, and administrative expenses. (g) Startup costs related to the joint venture company, KFPC, which are recorded in selling, general, and administrative expenses. (h) Income tax benefit related to a portion of the change in our valuation allowance for deferred tax assets.
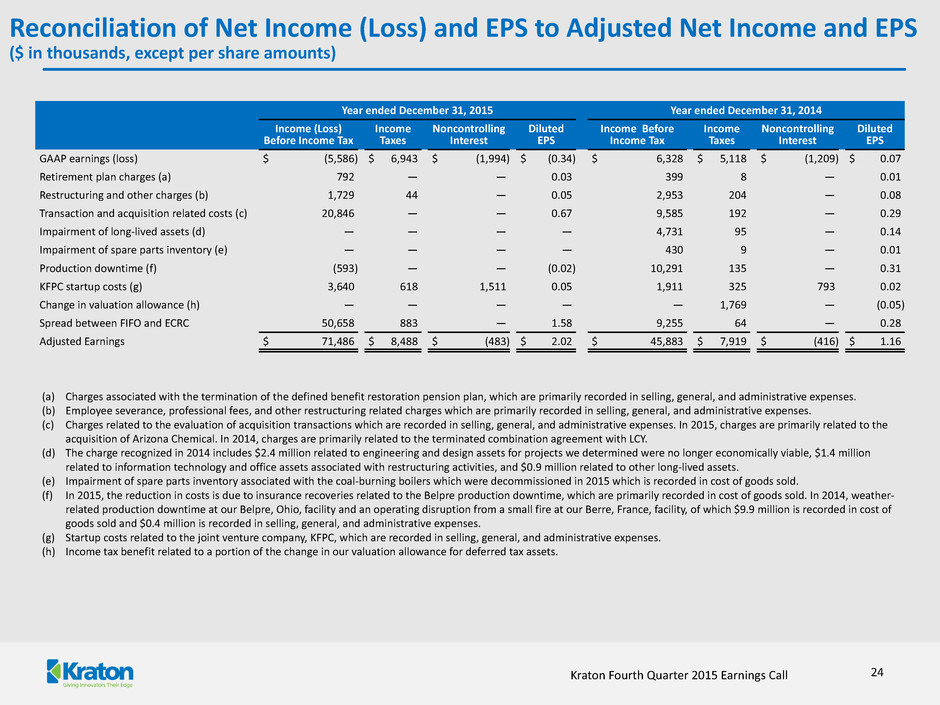
Kraton Fourth Quarter 2015 Earnings Call Reconciliation of Net Income (Loss) and EPS to Adjusted Net Income and EPS ($ in thousands, except per share amounts) 24 (a) Charges associated with the termination of the defined benefit restoration pension plan, which are primarily recorded in selling, general, and administrative expenses. (b) Employee severance, professional fees, and other restructuring related charges which are primarily recorded in selling, general, and administrative expenses. (c) Charges related to the evaluation of acquisition transactions which are recorded in selling, general, and administrative expenses. In 2015, charges are primarily related to the acquisition of Arizona Chemical. In 2014, charges are primarily related to the terminated combination agreement with LCY. (d) The charge recognized in 2014 includes $2.4 million related to engineering and design assets for projects we determined were no longer economically viable, $1.4 million related to information technology and office assets associated with restructuring activities, and $0.9 million related to other long-lived assets. (e) Impairment of spare parts inventory associated with the coal-burning boilers which were decommissioned in 2015 which is recorded in cost of goods sold. (f) In 2015, the reduction in costs is due to insurance recoveries related to the Belpre production downtime, which are primarily recorded in cost of goods sold. In 2014, weather- related production downtime at our Belpre, Ohio, facility and an operating disruption from a small fire at our Berre, France, facility, of which $9.9 million is recorded in cost of goods sold and $0.4 million is recorded in selling, general, and administrative expenses. (g) Startup costs related to the joint venture company, KFPC, which are recorded in selling, general, and administrative expenses. (h) Income tax benefit related to a portion of the change in our valuation allowance for deferred tax assets. Year ended December 31, 2015 Year ended December 31, 2014 Income (Loss) Before Income Tax Income Taxes Noncontrolling Interest Diluted EPS Income Before Income Tax Income Taxes Noncontrolling Interest Diluted EPS GAAP earnings (loss) $ (5,586) $ 6,943 $ (1,994) $ (0.34) $ 6,328 $ 5,118 $ (1,209) $ 0.07 Retirement plan charges (a) 792 — — 0.03 399 8 — 0.01 Restructuring and other charges (b) 1,729 44 — 0.05 2,953 204 — 0.08 Transaction and acquisition related costs (c) 20,846 — — 0.67 9,585 192 — 0.29 Impairment of long-lived assets (d) — — — — 4,731 95 — 0.14 Impairment of spare parts inventory (e) — — — — 430 9 — 0.01 Production downtime (f) (593) — — (0.02) 10,291 135 — 0.31 KFPC startup costs (g) 3,640 618 1,511 0.05 1,911 325 793 0.02 Change in valuation allowance (h) — — — — — 1,769 — (0.05) Spread between FIFO and ECRC 50,658 883 — 1.58 9,255 64 — 0.28 Adjusted Earnings $ 71,486 $ 8,488 $ (483) $ 2.02 $ 45,883 $ 7,919 $ (416) $ 1.16

Kraton Fourth Quarter 2015 Earnings Call Reconciliation of Net Income (Loss) to EBITDA and Adjusted EBITDA ($ in thousands) 25 (a) Charges associated with the termination of the defined benefit restoration pension plan, which are primarily recorded in selling, general, and administrative expenses. (b) Employee severance, professional fees, and other restructuring related charges which are primarily recorded in selling, general, and administrative expenses. (c) Charges related to the evaluation of acquisition transactions which are recorded in selling, general, and administrative expenses. In 2015, charges are primarily related to the acquisition of Arizona Chemical. In 2014, charges are primarily related to the terminated combination agreement with LCY. (d) The charge recognized in 2014 includes $2.4 million related to engineering and design assets for projects we determined were no longer economically viable, $1.4 million related to information technology and office assets associated with restructuring activities, and $0.9 million related to other long-lived assets. (e) Impairment of spare parts inventory associated with the coal-burning boilers which were decommissioned in 2015 which is recorded in cost of goods sold. (f) In 2015, the reduction in costs is due to insurance recoveries related to the Belpre production downtime, which are primarily recorded in cost of goods sold. In 2014, weather- related production downtime at our Belpre, Ohio, facility and an operating disruption from a small fire at our Berre, France, facility, of which $9.9 million is recorded in cost of goods sold and $0.4 million is recorded in selling, general, and administrative expenses. (g) Startup costs related to the joint venture company, KFPC, which are recorded in selling, general, and administrative expenses. (h) Represents non-cash expense related to equity compensation plans. For the three months and year ended December 31, 2015, $2.1 million and $7.8 million was recorded in selling, general and administrative expenses, $0.2 million and $0.7 million was recorded in research and development expenses and $0.1 million and $0.5 million was recorded in cost of goods sold, respectively. For the three months and year ended December 31, 2014, $1.7 million and $9.0 million was recorded in selling, general and administrative expenses, $0.2 million and $0.9 million was recorded in research and development expenses and $0.1 million and $0.6 million was recorded in cost of goods sold, respectively. Three months ended December 31, Twelve months ended December 31, (In thousands) 2015 2014 2015 2014 Net income (loss) attributable to Kraton $ (3,961) $ (17,430) $ (10,535) $ 2,419 Net loss attributable to noncontrolling interest (853) (351) (1,994) (1,209) Consolidated net income (loss) (4,814) (17,781) (12,529) 1,210 Add: Interest expense, net 6,248 5,927 24,223 24,594 Income tax expense 2,808 1,713 6,943 5,118 Depreciation and amortization expenses 15,241 16,612 62,093 66,242 EBITDA 19,483 6,471 80,730 97,164 Add (deduct): Retirement plan charges (a) 792 399 792 399 Restructuring and other charges (b) 230 2,300 1,729 2,953 Transaction and acquisition related costs (c) 15,048 763 20,846 9,585 Impairment of long-lived assets (d) — 4,731 — 4,731 Impairment of spare parts inventory (e) — 430 — 430 Production downtime (f) (250) (1,732) (593) 10,291 KFPC startup costs (g) 1,813 571 3,640 1,911 Non-cash compensation expense (h) 2,414 2,007 9,015 10,475 Spread between FIFO and ECRC 10,514 15,763 50,658 9,255 Adjusted EBITDA $ 50,044 $ 31,703 $ 166,817 $ 147,194

Kraton Fourth Quarter 2015 Earnings Call 26 Year ended December 31, Nine months ended September 30, 2013 2014 2014 2015 Revenue $ 992,259 $ 938,050 $ 728,303 $ 620,957 Cost of goods sold 718,062 677,587 524,381 436,039 Gross profit 274,197 260,463 203,922 184,918 Operating expenses: Selling, general, and administrative 124,816 130,532 106,782 78,205 Facility closure costs — — — 5,953 Litigation expense 70,100 10,110 3,100 12,894 Insurance recoveries — (80,210) — (12,894) Total operating expenses 194,916 60,432 109,882 84,158 Interest expense, net 36,840 42,825 30,398 35,928 Loss on extinguishment of debt 552 7,860 7,860 — (Gain) loss on interest rate caps/swaps, net (751) 3,579 295 7,003 Foreign currency exchange gains (losses), net 1,322 (1,208) (333) (107) Other income (11,111) (1,342) (1,218) (101) Income before income taxes 52,429 148,317 57,038 58,037 Income tax expense 17,131 49,966 17,084 18,103 Net income $ 35,298 $ 98,351 $ 39,954 $ 39,934 Net cash provided by operating activities $ 132,769 $ 91,297 $ 49,457 $ 74,584 Cash paid during the period for: Interest, net of amounts capitalized $ 33,888 $ 38,531 $ 27,128 $ 31,954 Income taxes $ 42,370 $ 29,115 $ 26,655 $ 15,372 Arizona Chemical – Historical Statement of Operations ($ in thousands)
Kraton Performance Polymers, Inc. Fourth Quarter 2015 Earnings Conference Call February 24, 2016
