Attached files
| file | filename |
|---|---|
| 8-K - 8-K - SELECT MEDICAL HOLDINGS CORP | a16-4799_18k.htm |
| EX-99.2 - EX-99.2 - SELECT MEDICAL HOLDINGS CORP | a16-4799_1ex99d2.htm |
| EX-99.1 - EX-99.1 - SELECT MEDICAL HOLDINGS CORP | a16-4799_1ex99d1.htm |
Exhibit 99.3
LENDER PRESENTATION FEBRUARY 2016
Forward-Looking Statements This presentation may contain forward-looking statements based managementexpectations.Numerousfactors,includingthose market conditions and those detailed from time-to-time in the on current relatedto Company’s filings with the Securities and Exchange Commission, may cause results to differ materially from those anticipated in the forward-looking statements. Many of the factors that will determine the Company’s future results are beyond the ability of the Company to control or predict. These statements are subject to risks and uncertainties and, therefore, actual results may differ materially.Readersshouldnotplaceunduerelianceonforward-looking statements, which reflect management’s views only as of the date hereof. The Company undertakes no obligation to revise or update any forward-looking statements, or to make any other forward-looking statements, whether as a result of new information, future events or otherwise.All references to “Select” used throughout this presentation refer to Select Medical Holdings Corporation and its subsidiaries. 2
Transaction Overview • On January 25, 2016, Select Medical Corporation (“Select” or the “Company”) announced the acquisition of Physiotherapy Associates (“Physio”) for $400mm in cash (subject to adjustment) • Physiotherapy Associates is a national provider of Outpatient Rehabilitation (“OR”) care and Orthotics and Prosthetics (“O&P”) services — Physio operates 558 OR clinics and 25 O&P clinics — FY 2015E Adjusted EBITDA of $32.7mm • Select Medical seeks to raise a 5-year up to $625mm Series F Term Loan due March 2021 to finance the acquisition of Physio and refinance the existing Series D Term Loan due December 2016 — $400mm to finance the acquisition and up to $225mm to refinance the Series D Term Loan • At close, Net Secured Leverage will be 3.47x and Net Total Leverage will be 5.15x, based on a combined Adjusted EBITDA of $421.4mm, including synergies • Lender commitments are due by March 2nd at 5pm ET • The acquisition is expected to close by March 4th 3
Pro Forma Capitalization Details New Series F Term Loan due March 2021 Cash from balance sheet $625.0 5.4 Physiotherapy purchase price Refinance Series D Term Loan due December 2016 Estimated financing fees and expenses $400.0 218.4 12.0 1 Select FY2015E Credit Agreement EBITDA of $368.3mm 2 Select FY2015E Credit Agreement EBITDA of $368.3mm plus $32.7mm of Physiotherapy EBITDA plus $20.4mm of synergies achieved by 2018 ($421.4mm) 3 Includes unamortized discount of $0.2mm. The Company plans to make an ECF payment of $3.0mm prior to closing, which would make the pro forma balance $215.4mm inclusive of the unamortized discount 4 Includes unamortized discount of $2.7mm. The Company plans to make an ECF payment of $7.2mm prior to closing, which would make the pro forma balance $524.8mm inclusive of the unamortized discount 5 Includes unamortized premium of $1.2 million 6 Pricing steps up by 25bps to L+425 if the corporate credit rating is downgraded by either Moody’s or S&P below B1/B+ Note: Excludes Concentra’s $655mm non-recourse debt 4 Transaction ($ in millions)FY 2015Ex EBITDA1impactFY 2015Ex EBITDA2Pricing Cash$8.4 $450mm RCF due March 2018295.0 Series D Term Loan due December 20163218.4 Series E Term Loan due June 20184532.0 New Series F Term Loan due March 2021--Other Debt12.0 ($5.4) (218.4) 625.0 $3.0 295.0L+375 --L+275 532.0L+400, 1% floor6 625.0L+475-500, 1% floor @ 98-98.5 12.0--Total Sr Secured Debt$1,057.42.87x Net Sr Secured Debt$1,049.02.85x $1,464.03.47x $1,461.03.47x 6.375% Sr. Notes due June 20215711.2 711.26.375% Total Debt$1,768.64.80x Net Debt$1,760.24.78x $2,175.25.16x $2,172.25.15x Total sources $630.4 Total uses $630.4 Sources: Uses:
Summary Terms—Series F Term Loan (1) Total leverage net of up to $75mm of cash 5 Borrower Select Medical Corporation (“Select Medical” or the “Borrower”) Size Up to $625mm Tenor 5 years (March 2021) Use of proceeds Finance the acquisition of Physiotherapy Associates (the “Target” or “Physio”) and refinance the existing Series D Term Loan Pricing Rate LIBOR Floor OID L+475-500 1.00% 98.0-98.5 Amort. 1% per annum Assumed corporate ratings B1 / B+ Assumed facility ratings Ba2 / B+ Security First lien on all tangible and intangible assets and stock of the Borrower and its domestic subsidiaries; 65% of the stock of any foreign subsidiaries Guarantors The Borrower and each direct and indirect wholly-owned domestic subsidiaries Optional redemption 101 soft call for 6 months Incremental • $50mm free and clear basket • Incremental of $400mm subject to 3.50x Secured Leverage Ratio(1) ($0 available pro forma for the transaction) • 50bps MFN for the life of the deal Financial maintenance covenants • Same as existing: — Total Net Leverage Ratio(1) < 5.75x — Max capital expenditures of $125mm annually Negative covenants Same as existing Bookrunners JPMorgan Chase Bank, N.A., performing its responsibilities through its affiliate, J.P. Morgan Securities LLC, Wells Fargo Securities, LLC, Bank of America, N.A., Deutsche Bank Securities Inc., Goldman Sachs Lending Partners LLC, Morgan Stanley Senior Funding, Inc., Royal Bank of Canada Administrative agent JPMorgan Chase Bank, N.A.
Transaction Timeline S M T W T F S S M T W T F S 1 8 2 9 16 23 3 10 17 24 4 11 5 12 19 6 13 20 27 1 8 15 22 29 3 10 17 24 31 5 12 19 26 7 14 21 28 6 13 20 27 7 14 21 28 9 16 23 30 11 18 25 22 29 25 26 Transaction Dates Bank Holidays SEM Earnings Call February 18th March 2nd March 4th Lender call at 11am ET Commitments due at 5pm ET Closing 6 DateActivity 18 15 4 2 March 2016 February 2016
Physiotherapy Associates

Investment Rationale This is a business we know very well • Enhances Select’s position as a market leader in U.S. outpatient physical therapy (“PT”) with over 2,000 sites of PT service Select continues to move its business mix toward a 50/50 split between specialty hospitals and outpatient rehabilitation — Concentra acquisition in 2015 is also in the OR space Physio’s payor mix will continue to reduce Select’s Medicare reimbursement exposure — Medicare / Medicaid accounts for only 26% of Physio’s payor mix, providing for 70% pro forma non-Medicare payor mix Significant cost synergies: $20.4mm in run-rate cost synergies achieved by 2018, with $19.8mm achieved by the end of 2017 • • • 2015E 2016E 2014A IRF 11% 2015E 2016E 2014A Concentra 15% Concentra 23% Medicare 30% Medicare 37% IRF 12% LTACH 40% Medicare 44% Non Medicare 56% LTACH 51% LTACH 51% Non Medicare 63% IRF 12% Outpatient 25% Outpatient 38% Non Medicare 70% Outpatient 22% 8 Evolution of business mix Evolution of payor mix
Company Overview – Rehab Footprint(1) • Physio is the largest pure-play provider of Outpatient Rehabilitation services in the US — — 558 Outpatient Rehabilitation clinics spanning 28 states 25 Orthotics and Prosthetics clinics spanning 10 states (<10% of revenue & EBITDA) Physio's 558 OR clinics are within a one-hour drive of 75% of the U.S. population 5 29 4 9 19 3 6 87 29 10 6 12 15 32 42 3 27 3 D.C. 59 1 11 12 34 45 13 5 16 21 (1) Company data as of 9/30/15; excludes 25 O&P sites, which are primarily located in the Midwest and Mid-Atlantic 9
Business Overview Advanced Outpatient Rehabilitation clinics with comprehensive services • Orthopedic and musculo-skeletal injury rehab Sports injury rehabilitation Sport-specific training Hand / occupational therapy Physio@Work • • • • • Injury prevention Pediatric programs Geriatric programs Health and wellness Orthotics and prosthetics • • • • • • • 1,500 to 6,000 square feet Convenient access Evidence-based practice model Functional outcomes measured and reported Best-in-class clinicians Top-of-the-line equipment Flexible hours meet patient needs • • • • Platform of 25 Orthotics and Prosthetics clinics across 10 states Designing, manufacture, and fit braces, supports, and artificial limbs • — Patients suffer from musculoskeletal disorders or amputations resulting from accident, disease, or congenial defects • Represent less than 10% of total Company revenue and EBITDA Net revenue 16.3 EBITDA 16.9 16.4 2 9 1 3 1 2 1 1 4 1 2013 2014 2015E 10 2.6 2.3 2.4 O&P Financial Overview ($ mm) O&P Clinics by State Comprehensive Service Offering Advanced Clinics & Services
Outpatient Rehab Clinics 11 VISITS (000’s) 2,955 2,936 2,921 YEAR201320142015E REVENUE PER VISIT $98 $97 $98
Historical Financial Performance Overview Over the past year, Physio has invested heavily in initiatives and infrastructure to drive and support long-term growth of the business With its investments in human and physical infrastructure, the Company is poised for growth The financial data below is adjusted for certain estimates of revenue recognition adjustments Physio has resolved its revenue recognition accounting issues that contributed to the 2013 bankruptcy The business has demonstrated stable performance trends • • • • OR Revene OP Revenue $350 $35 $300 $30 $250 $25 $200 $20 $150 $15 $100 $10 $50 $5 $0 $0 FY 2013 FY 2014 FY 2015E FY 2013 FY 2014 FY 2015E 1 Pro forma for Revenue Recognition adjustments 2 2015E EBITDA is pro forma for certain implemented cost reductions, completed contract renegotiations, completed acquisitions and other customary adjustments 12 $32.3 $32.7 $27.4 $16.4 $16.9 $16.3 $300.8 $279.1 $280.8 Adj. Operational EBITDA(1)(2) ($ mm) Revenue(1) ($ mm)
Diversified Payor and Geographic Mix Diversified payor and geographic mix mitigate exposure to any payor or region 3.2% 2.9% 2.9% CA 12% 100% 90% 80% 70% 60% 50% 40% 30% 20% 10% 0% Other 26% PA 11% OH 4% AZ 4% GA 10% MI 5% MD 9% VA 6% 2013 Mgd. care/commercial W/C Capitation 2014 YTD Sep 15 Medicare Medicaid Other AL 7% CO 6% • Top 5 commercial contracts are only ~14% of revenue No commercial payor >7% of revenue • No individual state represents more than 12% of revenue • (1) Does not include effect of revenue recognition adjustments. Geographic mix reflects YTD September 13 9.2% 9.6% 9.2% 14.4% 14.0% 14.3% 24.5% 24.2% 26.0% 48.8% 49.3% 47.6% Diversified Geographic footprint Diversified Payor Mix(1)
Clearly Identified Anticipated Synergies Expect to be fully integrated by 2018 • • Significant synergies largely from redundant headcount reductions Expected cost to achieve synergies of $5.0mm in severance, with most severance costs incurred in the first three to six months Potential revenue synergies as well from Physio adapting Select’s higher margin OR business strategy • Salaries, Wages, and Benefits Savings Other Operating Savings $20.4 $19.8(2) FY 2016E (1) Total is net of $4.9mm severance related costs to achieve synergies (2) Total is net of $0.1mm severance related costs to achieve synergies FY 2017E FY 2018E 14 $4.2 $5.5(1) $4.1 $16.2 $15.7 $2.4 $3.1 Anticipated net cost saving synergies ($mm)
2015E Pro Forma Credit Agreement EBITDA Bridge $4.2 $16.2 SEM Expected EBITDA Non-cash items Net cash distributions with non-wholly owned Add-back for SEM CreditPhysio EBITDA SW&B Synergies Other Operating Cost Synergies Pro forma Credit Agreement EBITDA specialty hospital Agreement EBITDA start-up losses Note: Physio run-rate synergies to be achieved by 2018 15 $32.7 $3.6$15.0 $421.4 $368.3 $350.9 ($1.2 )
Select Due Diligence of Physiotherapy Accounting Issues • Physiotherapy provided a detailed file of all Charges, Payments, and Adjustments for the period of January 2014 through September 2015 — The detail in the file included both the posted month and the service month for each transaction We analyzed over 39 million records and reconciled the Charges, Payments, and Adjustments per closing month to the Charges, Payments, and Adjustments per the financial statements Aligned Payments against service months to match payments recorded as received against the net revenues posted for the month The file showed that Physio’s method of recording net revenue consistently resulted in recording less net revenue than what was generated in cash receipts • • • 16
SelectMedical Business Update
Pro Forma Company Footprint Diversified national presence 109 Long-Term Acute Care Hospitals (LTACH) (27 States) 5 2 5 1 5 12 2 1 2 18 Inpatient Rehabilitation Hospitals (8 States) 3 4 29 10 18 8 9 4 4 1 2 2 7 25 125 13 17 3 11 6 23 13 42 19 3 10 48 4 1 2 2 7 9 2 5 12 15 8 17 103 1 47 12 7 46 87 129 27 1 3 1,038 Outpatient Rehabilitation Centers (31 States and D.C.) 6 3 29 1 2 20 2 1 3 1 17 12 3 60 2 1 17 15 3 30 6 3 26 19 3 1 16 10 2 46 2 2 3 21 1 32 6 32 2 59 15 4 1 16 1 3 8 4 2 2 11 13 1 2 11 63 3 15 3 12 2 2 4 419 Contract Therapy Locations (30 States and D.C.) 2 7 20 5 7 13 2 2 1 12 1 6 2 2 4 1 14 34 9 6 45 5 2 17 23 7 16 5 5 98 21 62 10 8 1 46 1 3 300 Concentra Centers (38 States ) 1 93 583 Physio Clinics (28 States and D.C.) Note: As of 12/31/2015 18
The Pro Forma Select Medical Network Diversified across multiple business lines Specialty hospital segment Outpatient rehabilitation segment 19 Contract therapy Locations: 419 30 States and D.C. Occupational medicine Locations: 471 43 States Physical therapy outpatient centers Locations: 1,621 37 States and D.C. Inpatient rehabilitation hospitals Locations: 18 8 States Long term acute care hospitals Locations: 109 27 States
Strategy • Be the “preferred” provider of post acute care services in our markets — — — Structured relationships to align with patients Partner with academic / major medical institutions Hospital in hospital model in LTACH • Experts in our fields – LTACH, Inpatient Rehab, Outpatient Rehab and Occupational Medicine — Best in class — High quality clinical services Outpatient critical mass Continued growth — Rehab JVs — Acquisitions within core business lines • • 20
JVs Under Construction Los Angeles, CA 138 bed IRF (opening Q2 2016) New Orleans, LA 60 bed IRF (opening early 2017) Currently managing 1 unit with 29 total beds Cincinnati, OH 60 bed IRF (opening Q2 2016) Currently managing 2 units with 46 total beds 21
Growing Rehabilitation Network Partner in joint ventures with premier acute care hospitals and systems to build post acute networks •select -J MEDICAL []Cleveland Clini Rehabilitation Hospital .,_ ....Sdect_ Rehabilitation Od hu-ioHealth INSTITUTE FOR REHABIUTATION Select Medical HelenM.Simpson habilitation Partnering with Selt Medical . I InMt".l..uon¥ll'dh SMct l _I EMORY Rehabilitation Hospital REH ...-.,...., .--. HOSPITAL REHABILIWION HOSPITAL•SanAritonio REHABIUThTION HOSPrD\l!Dt enton Select Medical:Improving Quality of Life - Js•elect •JSelect ABI LITATION HONORHEALTH California A Cedars/UCLA Health Partnership INSTITUTE .-Ill Rfl-IA.BIUWION HOSPITAL SSM _IIJI' Rehabilitation Hospital ln partnershlpwithSelectMedlcal Network
Specialty Hospitals Poised for Growth LTACH 2 new LTACHs 1 new LTACH Begin phase-in of LTACH patient criteria 3 new LTACHs 1 new LTACH 1 new LTACH 2014 2015 2016 REHAB 23
Outpatient Rehab Clinics 24 5,219 4,971 VISITS 4,781 (000’s) 4,567 4,569 4,470 YEAR201020112012201320142015E REVENUE $101 $103 $103 $104 $103 $103 PER VISIT
2016 Outpatient Initiatives • Continued growth in workers’ comp business by illustrating historical ROI benefits of working with Select — Payors / Employers • Expand hand therapy services to more clinics • Expand concussion management program • Continued development of start-up clinics 25
Concentra Acquired 6/1/2015 Concentra is the leading provider of occupational health with 471 locations across 43 states • Service lines: — Centers: 300 occupational health locations, with some consumer health Onsite Clinics: 138 locations at employer locations CBOCs: 33 Community Based Outpatient Clinics serving Veterans Health Administration patients — — 26
Concentra Post-Acquisition Update • • Management transition Early results / earnings (6/1/15 – 12/31/15) — — — Revenue = $585.2mm Adjusted EBITDA = $48.3mm Adjusted EBITDA margin = 8.3% • Identification of $36 million of cost savings synergies 27
LTACH Regulatory Impact Well-positioned to succeed in an evolving landscape • Patient criteria in place since October 1, 2015 — 34 hospitals under criteria as of January — All hospitals to transition to criteria by the end of Q3 2016 • SEM hospitals are largely compliant — 1/31/2016 compliance for all SEM LTACHs at 86.0% • Significant market exists for LTACH compliant patients — ~350,000 – 400,000 / year compliant discharges from STACH vs. over ~134,000 annual LTACH industry admissions • Systematized way to identify compliant patients with acute care partners — Medpar data provides roadmap to compliant patients • Continued training of people and streamlining of processes to ensure successful transition to criteria 28
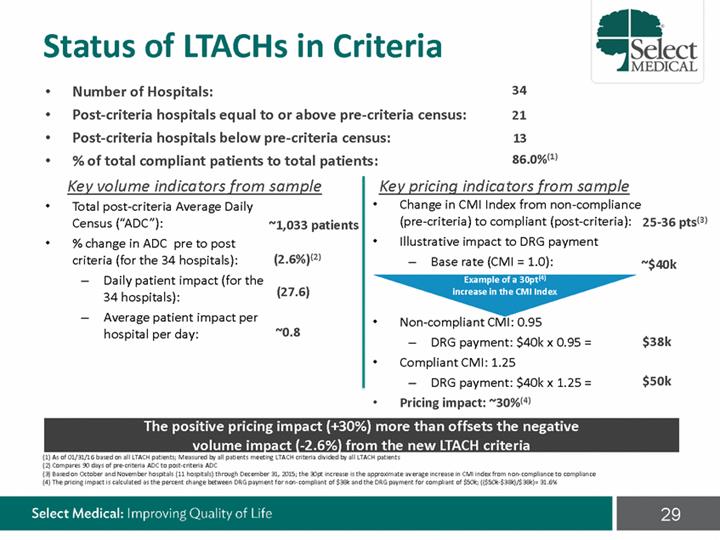
Status of LTACHs in Criteria • • • • 34 21 13 86.0%(1) Number of Hospitals: Post-criteria hospitals equal to or above pre-criteria census: Post-criteria hospitals below pre-criteria census: % of total compliant patients to total patients: Key volume indicators from sample Key pricing indicators from sample • Change in CMI Index from non-compliance (pre-criteria) to compliant (post-criteria): Illustrative impact to DRG payment • Total post-criteria Average Daily Census (“ADC”): % change in ADC pre to post criteria (for the 34 hospitals): 25-36 pts(3) ~1,033 patients • • (2.6%)(2) – Base rate (CMI = 1.0): Example of a 30pt(4) increase in the CMI Index ~$40k – Daily patient impact (for the 34 hospitals): Average patient impact per hospital per day: (27.6) – • Non-compliant CMI: 0.95 ~0.8 – $38k DRG payment: $40k x 0.95 = • Compliant CMI: 1.25 $50k – DRG payment: $40k x 1.25 = • Pricing impact: ~30%(4) (1) As of 01/31/16 based on all LTACH patients; Measured by all patients meeting LTACH criteria divided by all LTACH patients (2) Compares 90 days of pre-criteria ADC to post-criteria ADC (3) Based on October and November hospitals (11 hospitals) through December 31, 2015; the 30pt increase is the approximate av erage increase in CMI index from non-compliance to compliance (4) The pricing impact is calculated as the percent change between DRG payment for non-compliant of $38k and the DRG payment for compliant of $50k; (($50k-$38k)/$38k)= 31.6% 29 The positive pricing impact (+30%) more than offsets the negative volume impact (-2.6%) from the new LTACH criteria
FinancialUpdate

Financial Policy 31 USE OF CAPITAL (OPPORTUNISTIC) Stock buybacks will continue to be opportunistic STOCK BUYBACK Board decision but none for the foreseeable future DIVIDENDS To be funded with cash or stock MINORITY EQUITY IN CONCENTRA Execution of put / call to begin end of FY18 (max 33.3% per year) Only in existing and related businesses ACQUISITION STRATEGY Highly accretive upon execution of synergies
Q4 2015 (Expected) • 2015 revenue of $3.7bn (increase of 22% year-over-year) – – – 4.5% increase in Specialty Hospitals 1.1% decrease in Outpatient Rehab (due to contract terminations in Contract Therapy) Concentra revenue contribution of $585mm since 6/1/15 • 2015 Adjusted EBITDA of $399mm (increase of 10% year-over-year)(1) – Blended margin of 10.7% including Concentra • Development pipeline continues to be strong – UCLA/Cedars JV (138 beds) in Q2 2016, TriHealth (60 beds) in Q2 2016, and Ochsner (60 beds) in early 2017 • FY 2016 guidance (ex. Physio) – – – Revenue of $4.000-$4.200bn Adjusted EBITDA of $470-$510mm EPS of $0.72-$0.91 (1) See slide 37 Non-GAAP reconciliation 32
Financial Metric Trends Net Revenue Adjusted EBITDA $406 $399 $3,743 $364 2013 1 2014 1 2010 2011 2012 2013 2014 2015E 2010 2011 2012 2015E ($ in millions) ($ in millions) Hospitals Outpatient Concentra Hospitals Outpatient Concentra 1 Decline in FY13 and FY14 Adjusted EBITDA was mainly attributable to impacts of sequestration and start-up costs associated with new and recently expanded specialty hospitals Note: See slide 37 Non-GAAP reconciliation 33 $2,949$2,976$3,065 $2,390 $2,805 $386 $307 $373
Annual Capex and Capital Expenditures Cash Flow Maintenance Development $183(1) $150 $75 $0 2010 Cash 2011 2012 2013 2014 2015E Free Flow Conversion % (FCF/EBITDA) $300 $225 $150 $75 $0 2010 2011 2012 2013 2014 2015E Note: Capital expenditures increased due to the Cedars / UCLA joint-venture and Cleveland Clinic (1) Includes $27mm of maintenance capex at Concentra 34 ($ in millions) ($ in millions) 57% 44%$231 30%$171 32% $11921% $93 $756% $25 $95 $68$74 $52$46
Appendix: Additional Materials

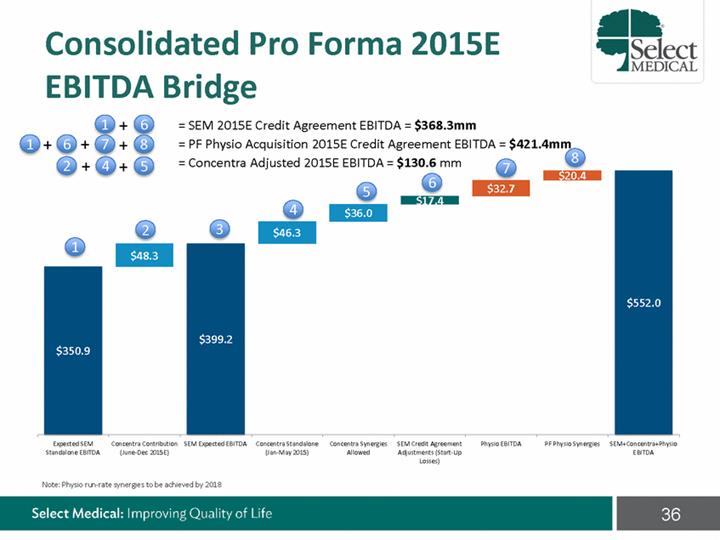
Consolidated Pro Forma 2015E EBITDA Bridge = SEM 2015E Credit Agreement EBITDA = $368.3mm = PF Physio Acquisition 2015E Credit Agreement EBITDA = $421.4mm 1 7 4 + + + 6 8 5 + + 1 + 6 2 8 = Concentra Adjusted 2015E EBITDA = $130.6 mm 7 Expected SEM Standalone EBITDA Concentra Contribution SEM Expected EBITDA Concentra StandaloneConcentra SynergiesSEM Credit Agreement Physio EBITDA PF Physio Synergies SEM+Concentra+Physio EBITDA (June-Dec 2015E) (Jan-May 2015) Allowed Adjustments (Start-Up Losses) Note: Physio run-rate synergies to be achieved by 2018 36 56 4 23 $552.0 1 $399.2 $350.9 $48.3 $46.3 $36.0 $32.7 $20.4
Select Non-GAAP Reconciliation 37 ($ in millions) 2010 2011 2012 2013 2014 2015E Net Income $82 $113 $154 $123 $128 $136 (+) Income tax 42 71 90 75 76 72 (+/-) Equity in losses/(earnings) of unconsolidated subsidiaries 1 (3) (8) (2) (7) (17) (+/-) Other expense/(income) (1) - - - - - (+) Interest expense, net 112 99 95 87 86 113 (-/+) (Gain)/Loss on debt retirement - 31 6 19 2 - (-) Gain on sale of equity investment - - - - - (30) (+) Concentra acquisition costs - - - - - 5 (+) Depreciation and Amortization 69 71 63 64 68 105 (+) Stock Based Compensation 2 4 6 7 11 15 Adjusted EBITDA $307 $386 $406 $373 $364 $399 Net Cash Provided by Operating Activities $145 $217 $299 $193 $170 $208 (-) Purchase of Property and Equipment 52 46 68 74 95 183 Free Cash Flow $93 $171 $231 $119 $75 $25
Physio EBITDA pro forma adjustments Savings from recently implemented field FTE reductions; reflects amount incremental to LTM based on actual run-rate achieved as of Sep 2015 Field FTE reductions 0.7 Ongoing Field incentive plan 0.5 Complete Savings from mid-year modification to Field Incentive Plan Reflects 25% of the annual merit increase (including benefits gross-up) that became effective January 2015 Merit increase (0.7) Effective January 2015 Negotiated rate reduction with IKS, the Company's outsourced billing provider (reflects $100,000 per month savings for 6 months; April to September already reflected in LTM) IKS agreement 0.6 Effective April 2015 Actual savings from signed lease renegotiations / clinic relocations; reflects amount incremental to what is already in LTM actuals Lease renegotiations 0.8 As of September 2015 Transaction Closed: Anderson – June '15 Therapy Plus – Aug '15 Marshalltown – Sep '15 Reflects historical unsynergized EBITDA less what is already in LTM actuals from Anderson Orthopedic acquisition ($0.1) and Therapy Plus acquisition ($0.1), as well as the Marshalltown JV ($0.3) Acquisitions / JVs 0.4 IT outage 0.3 Occurred 1Q 2015 Addback for impact of March IT outage that affected 9 days of visit volume De Novo losses 0.8 Customary addback for de nova losses Reflects EBITDA adjustments for 8 de novos opened since October 2014 to normalize EBITDA to $8,333/month maturity run-rate for each De Novo maturity 0.5 38 Total adjustments3.7 Subtotal1.9 Run-rate and Non-recurring items Subtotal1.4 Contractual cost savings Subtotal0.4 Labor savings CategoryAmountStatusDescription 2015 EBITDA pro forma adjustments ($mm)
selectmedical.com/investor-relations/for-investors