Attached files
| file | filename |
|---|---|
| EX-32 - CERTIFICATION OF CEO AND PFO AND PAO - NATIONAL HEALTH INVESTORS INC | nhi-12312015x10kex32.htm |
| EX-21 - SUBSIDIARIES - NATIONAL HEALTH INVESTORS INC | nhi-12312015x10kex21.htm |
| EX-31.2 - CERTIFICATION OF PRINCIPAL FINANCIAL OFFICER AND PRINCIPAL ACCOUNTING OFFICER - NATIONAL HEALTH INVESTORS INC | nhi-12312015x10kex312.htm |
| EX-12.1 - COMPUTATION OF RATIO OF FIXED CHARGES - NATIONAL HEALTH INVESTORS INC | nhi-12312015x10kex121.htm |
| EX-31.1 - CERTIFICATION OF CHIEF EXECUTIVE OFFICER - NATIONAL HEALTH INVESTORS INC | nhi-12312015x10kex311.htm |
| EX-23.1 - CONSENT OF INDEPENDENT REGISTERED PUBLIC ACCOUNTING FIRM - NATIONAL HEALTH INVESTORS INC | nhi-12312015x10kex231.htm |
| EX-10.40 - NOTE PURCHASE AGREEMENT - NATIONAL HEALTH INVESTORS INC | nhi-12312015x10kex1040.htm |
| EX-99.1 - FINANCIAL STATEMENT SCHEDULES - NATIONAL HEALTH INVESTORS INC | nhi-12_31x2015x10kex991.htm |
UNITED STATES
SECURITIES AND EXCHANGE COMMISSION
WASHINGTON, D.C. 20549
FORM 10-K
(Mark One) | |
[ x ] | ANNUAL REPORT PURSUANT TO SECTION 13 OR 15(d) OF THE SECURITIES EXCHANGE ACT OF 1934 |
For the fiscal year ended December 31, 2015 | |
[ ] | TRANSITION REPORT PURSUANT TO SECTION 13 OR 15(d) OF THE SECURITIES EXCHANGE ACT OF 1934 |
For the transition period from _____________ to _____________ | |
Commission File Number 001-10822
National Health Investors, Inc.
(Exact name of registrant as specified in its charter)
Maryland | 62-1470956 | |
(State or other jurisdiction of incorporation or organization) | (I.R.S. Employer Identification No.) | |
222 Robert Rose Drive, Murfreesboro, Tennessee | 37129 | |
(Address of principal executive offices) | (Zip Code) | |
(615) 890-9100 |
(Registrant's telephone number, including area code) |
Securities registered pursuant to Section 12(b) of the Act:
Title of each Class | Name of each exchange on which registered | |
Common stock, $.01 par value | New York Stock Exchange | |
Securities registered pursuant to Section 12(g) of the Act: None
Indicate by check mark if the registrant is a well-known seasoned issuer, as defined in Rule 405 of the Securities Act. Yes [ x ] No [ ]
Indicate by check mark if the registrant is not required to file reports pursuant to Section 13 or Section 15(d) of the Act. Yes [ ] No [ x ]
Indicate by check mark whether the registrant (1) has filed all reports required to be filed by Section 13 or 15(d) of the Securities Exchange Act of 1934 during the preceding 12 months (or for such shorter period that the registrant was required to file such reports), and (2) has been subject to such filing requirements for the past 90 days. Yes [ x ] No [ ]
Indicate by check mark whether the registrant has submitted electronically and posted on its corporate Web site, if any, every Interactive Data File required to be submitted and posted pursuant to Rule 405 of Regulation S-T (§232.405 of this chapter) during the preceding 12 months (or for such shorter period that the registrant was required to submit and post such files) Yes [ x ] No [ ]
Indicate by check mark if disclosure of delinquent filers pursuant to Item 405 of Regulation S-K (§292.405 of this chapter) is not contained herein, and will not be contained, to the best of the registrant's knowledge, in the definitive proxy or information statements incorporated by reference in Part III of this Form 10-K or any amendment to this Form 10-K [ ]
Indicate by check mark whether the registrant is a large accelerated filer, an accelerated filer, a non-accelerated filer, or a smaller reporting company. See definition of “large accelerated filer”, “accelerated filer” and “smaller reporting company” in Rule 12b-2 of the Exchange Act.
Large accelerated filer [ x ] | Accelerated filer [ ] | |
Non-accelerated filer [ ] | Smaller reporting company [ ] | |
(Do not check if a smaller reporting company) | ||
Indicate by check mark whether the registrant is a shell company (as defined in Rule 12b-2 of the Exchange Act). Yes [ ] No [ x ]
The aggregate market value of shares of common stock held by non-affiliates on June 30, 2015 (based on the closing price of these shares on the New York Stock Exchange) was approximately $2,238,337,000. There were 38,400,276 shares of the registrant’s common stock outstanding as of February 16, 2016.
DOCUMENTS INCORPORATED BY REFERENCE
Portions of the Registrant’s definitive proxy statement for its 2016 annual meeting of stockholders are incorporated by reference into Part III, Items 10, 11, 12, 13, and 14 of this Form 10-K.
Table of Contents
Page | |
2
PART I.
Forward Looking Statements
References throughout this document to NHI or the Company include National Health Investors, Inc., and its consolidated subsidiaries. In accordance with the Securities and Exchange Commission’s “Plain English” guidelines, this Annual Report on Form 10-K has been written in the first person. In this document, the words “we”, “our”, “ours” and “us” refer only to National Health Investors, Inc. and its consolidated subsidiaries and not any other person. Unless the context indicates otherwise, references herein to “the Company” include all of our consolidated subsidiaries.
This Annual Report on Form 10-K and other materials we have filed or may file with the Securities and Exchange Commission, as well as information included in oral statements made, or to be made, by our senior management contain certain “forward-looking” statements as that term is defined by the Private Securities Litigation Reform Act of 1995. All statements regarding our expected future financial position, results of operations, cash flows, funds from operations, continued performance improvements, ability to service and refinance our debt obligations, ability to finance growth opportunities, and similar statements including, without limitation, those containing words such as “may”, “will”, “believes”, “anticipates”, “expects”, “intends”, “estimates”, “plans”, and other similar expressions are forward-looking statements.
Forward-looking statements involve known and unknown risks and uncertainties that may cause our actual results in future periods to differ materially from those projected or contemplated in the forward-looking statements. Such risks and uncertainties include, among other things, the following risks described in more detail under the heading “Risk Factors” under Item 1A:
* | We depend on the operating success of our tenants and borrowers for collection of our lease and interest income; |
* | We depend on the success of property development and construction activities, which may fail to achieve the operating results we expect; |
* | We are exposed to the risk that our tenants and borrowers may become subject to bankruptcy or insolvency proceedings; |
* | We are exposed to risks related to governmental regulations and payors, principally Medicare and Medicaid, and the effect that lower reimbursement rates would have on our tenants’ and borrowers’ business; |
* | We are exposed to the risk that the cash flows of our tenants and borrowers would be adversely affected by increased liability claims and liability insurance costs; |
* | We are exposed to risks related to environmental laws and the costs associated with liabilities related to hazardous substances; |
* | We are exposed to the risk that we may not be fully indemnified by our lessees and borrowers against future litigation; |
* | We depend on the success of our future acquisitions and investments; |
* | We depend on our ability to reinvest cash in real estate investments in a timely manner and on acceptable terms; |
* | We may need to refinance existing debt or incur additional debt in the future, which may not be available on terms acceptable to us; |
* | We have covenants related to our indebtedness which impose certain operational limitations and a breach of those covenants could materially adversely affect our financial condition and results of operations; |
* | We are exposed to the risk that the illiquidity of real estate investments could impede our ability to respond to adverse changes in the performance of our properties; |
* | Certain tenants in our portfolio account for a significant percentage of the rent we expect to generate from our portfolio, and the failure of any of these tenants to meet their obligations to us could materially and adversely affect our business, financial condition and results of operations and our ability to make distributions to our stockholders. |
* | We are exposed to risks associated with our investments in unconsolidated entities, including our lack of sole decision-making authority and our reliance on the financial condition of other interests; |
3
* | We are subject to additional risks related to healthcare operations associated with our investments in unconsolidated entities, which could have a material adverse effect on our results of operations. |
* | We depend on revenues derived mainly from fixed rate investments in real estate assets, while a portion of our debt capital used to finance those investments bear interest at variable rates. This circumstance creates interest rate risk to the Company; |
* | We are exposed to the risk that our assets may be subject to impairment charges; |
* | We depend on the ability to continue to qualify for taxation as a real estate investment trust; |
* | We have ownership limits in our charter with respect to our common stock and other classes of capital stock which may delay, defer or prevent a transaction or a change of control that might involve a premium price for our common stock or might otherwise be in the best interests of our stockholders; |
* | We are subject to certain provisions of Maryland law and our charter and bylaws that could hinder, delay or prevent a change in control transaction, even if the transaction involves a premium price for our common stock or our stockholders believe such transaction to be otherwise in their best interests. |
See the notes to the annual audited consolidated financial statements, and “Business” and “Risk Factors” under Item 1 and Item 1A therein for a further discussion of these and of various governmental regulations and other operating factors relating to the healthcare industry and the risk factors inherent in them. You should carefully consider these risks before making any investment decisions in the Company. These risks and uncertainties are not the only ones we face. There may be additional risks that we do not presently know of or that we currently deem immaterial. If any of the risks actually occur, our business, financial condition, results of operations, or cash flows could be materially adversely affected. In that case, the trading price of our shares of stock could decline and you may lose part or all of your investment. Given these risks and uncertainties, we can give no assurance that these forward-looking statements will, in fact, occur and, therefore, caution investors not to place undue reliance on them.
ITEM 1. BUSINESS
General
National Health Investors, Inc., established in 1991 as a Maryland corporation, is a self-managed real estate investment trust ("REIT") specializing in sale-leaseback, joint-venture, mortgage and mezzanine financing of need-driven and discretionary senior housing and medical investments. Our portfolio consists of real estate investments in independent living facilities, assisted living facilities, entrance-fee communities, senior living campuses, skilled nursing facilities, specialty hospitals and medical office buildings. Other investments include mortgages and other notes, marketable securities, and a joint venture structured to comply with the provisions of the REIT Investment Diversification Empowerment Act of 2007 (“RIDEA”). Through a RIDEA joint venture, we invest in facility operations managed by independent third-parties. We fund our real estate investments primarily through: (1) operating cash flow, (2) debt offerings, including bank lines of credit and term debt, both unsecured and secured, and (3) the sale of equity securities.
At December 31, 2015, we had investments in real estate and mortgage and other notes receivable involving 189 facilities located in 31 states. These investments involve 116 senior housing properties, 68 skilled nursing facilities, 3 hospitals, 2 medical office buildings and other notes receivable. These investments (excluding pre-development costs of $168,000 and our corporate office of $920,000) consisted of properties with an original cost of $2,094,778,000, rented under triple-net leases to 26 lessees, and $135,031,000 aggregate carrying value of mortgage and other notes receivable due from 14 borrowers.
Our investments in real estate and mortgage loans are secured by real estate located within the United States. We are managed as one reporting unit, rather than multiple reporting units, for internal reporting purposes and for internal decision making. Therefore, we have concluded that we operate as a single segment. Information about revenues from our tenants and borrowers, a measure of our income, and total assets can be found in Item 8 of this Form 10-K.
Classification of Properties in our Portfolio
Senior Housing
As of December 31, 2015, our portfolio included 113 senior housing properties (“SHO”) leased to operators and mortgage loans secured by 3 SHOs. SHOs within our portfolio are either need-driven or discretionary for end users and consist of assisted
4
living facilities, independent living facilities, entrance-fee communities and senior living campuses which are more fully described below.
Need-Driven Senior Housing
Assisted Living Facilities. As of December 31, 2015, our portfolio included 69 assisted living facilities (“ALF”) leased to operators and mortgage loans secured by 2 ALFs. ALFs are free-standing facilities that provide basic room and board functions for elderly residents. As residents typically receive assistance with activities of daily living such as bathing, grooming, memory care services and administering medication, we consider these facilities to be need-driven senior housing. On-site staff personnel are available to assist in minor medical needs on an as-needed basis. Operators of ALFs are typically paid from private sources without assistance from government. ALFs may be licensed and regulated in some states, but do not require the issuance of a Certificate of Need (“CON”) as required for skilled nursing facilities.
Senior Living Campuses. As of December 31, 2015, our portfolio included 9 senior living campuses ("SLC") leased to operators. SLCs are either freestanding or multi-site campuses that include skilled nursing beds combined with an independent or assisted living facility that provides basic room and board functions for elderly residents. They may also provide assistance to residents with activities of daily living such as bathing, grooming and administering medication and as such are considered need-driven senior housing. On-site staff personnel are available to assist in minor medical needs on an as-needed basis. As the decision to transition to a senior living campus is typically more than a lifestyle choice and is usually driven by the need to receive some moderate level of care, we consider this facility type to be need-driven. Operators of SLCs are typically paid from private sources and from government programs such as Medicare and Medicaid for skilled nursing residents.
Discretionary Senior Housing
Entrance-Fee Communities. As of December 31, 2015, our portfolio included 7 entrance-fee communities ("EFC") leased to operators and a mortgage loan secured by 1 EFC. Entrance-fee communities, frequently referred to as continuing care retirement communities, or CCRCs, typically include a combination of detached homes, an independent living facility, an assisted living facility and a skilled nursing facility on one campus. These communities appeal to residents because there is no need to relocate when health and medical needs change. EFCs are classified as either Type A, B, or C depending upon the amount of healthcare benefits included in the entrance fee. “Type A” EFCs, or “Lifecare” communities, include substantially all future healthcare costs. Communities providing a modified healthcare contract offering access to skilled nursing care but only paying for a maximum number of days are referred to as “Type B.” Finally, "Type C" EFCs, the type in our portfolio, are fee-for-service communities which do not provide any healthcare benefits and correspondingly have the lowest entrance fees. However, monthly fees may be higher to reflect the current healthcare components delivered to each resident. EFC licensure is state-specific, but generally the skilled nursing beds included in our EFC portfolio are subject to state licensure and regulation. As the decision to transition to an EFC is typically made as a lifestyle choice and not as the result of a pressing medical concern, we consider the decision to transition to an EFC to be discretionary. Similarly, the predominant source of revenue for operators of EFCs is from private payor sources.
Independent Living Facilities. As of December 31, 2015, our portfolio included 28 independent living facilities (“ILF”) leased to operators. ILFs offer specially designed residential units for the active senior adults and provide various ancillary services for their residents including restaurants, activity rooms and social areas. Services provided by ILF operators are generally paid from private sources without assistance from government programs. ILFs may be licensed and regulated in some states, but do not require the issuance of a CON as required for skilled nursing facilities. As ILFs typically do not provide assistance with activities of daily living, we consider the decision to transition to an ILF facility to be discretionary.
Medical
As of December 31, 2015, our portfolio included 67 medical facilities leased to operators and mortgage loans secured by 6 medical facilities. The medical facilities within our portfolio consist of skilled nursing facilities, hospitals and medical office buildings, which are more fully described below.
Skilled Nursing Facilities. As of December 31, 2015, our portfolio included 62 skilled nursing facilities (“SNF”) leased to operators and mortgage loans secured by 6 SNFs. SNFs provide some combination of skilled and intermediate nursing and rehabilitative care, including speech, physical and occupational therapy. As the decision to utilize the services of a SNF is typically made as the result of a pressing medical concern, we consider this to be a need driven medical facility. The operators of the SNFs receive payment from a combination of private pay sources and government programs such as Medicaid and Medicare. SNFs are required to obtain state licenses and are highly regulated at the federal, state and local
5
level. Most SNFs must obtain a CON from the state before opening or expanding such facilities. Some SNFs also include assisted living beds.
Hospitals. As of December 31, 2015, our portfolio included 3 hospitals (“HOSP”) leased to operators. Hospitals provide a wide range of inpatient and outpatient services, including acute psychiatric and rehabilitation services, and are subject to extensive federal, state and local legislation and regulation. Hospitals undergo periodic inspections regarding standards of medical care, equipment and hygiene as a condition of licensure. Services provided by hospitals are generally paid for by a combination of private pay sources and government programs. As the decision to utilize the services of a hospital is typically made as the result of a pressing medical concern, we consider this to be a need driven medical facility.
Medical Office Buildings. As of December 31, 2015, our portfolio included 2 medical office buildings (“MOB”) leased to operators. MOBs are specifically configured office buildings whose tenants are primarily physicians and other medical practitioners. As the decision to utilize the services of an MOB is typically made as a the result of a pressing medical concern, we consider this to be a need driven medical facility. MOBs differ from conventional office buildings due to the special requirements of the tenants. Each of our MOBs is leased to one lessee, and is either physically attached to or located on an acute care hospital campus. The lessee sub-leases individual office space to the physicians or other medical practitioners. The lessee is responsible to us for the lease obligations of the entire building, regardless of their ability to sub-lease the individual office space.
Nature of Investments
Our investments are typically structured as acquisitions of properties through purchase-leaseback transactions, acquisitions of properties from other real estate investors, mortgage loans or, in operations through structures allowed by RIDEA. We have also provided construction loans for facilities for which we were already committed to provide long-term financing or for which the operator agreed to enter into a purchase option and lease with us upon completion of construction or after the facility is stabilized. The annual lease rates on our leases and the annual interest rates on our mortgage, construction and mezzanine loans ranged between 6.75% and 13.50% during 2015. We believe our lease and loan terms are competitive within our peer group. Typical characteristics of these transactions are as follows:
Leases. Our leases generally have an initial leasehold term of 10 to 15 years with one or more 5-year renewal options. The leases are "triple net leases" under which the tenant is responsible for the payment of all taxes, utilities, insurance premium costs, repairs and other charges relating to the ownership and operation of the properties, including required levels of capital expenditure each year. The tenant is obligated at its expense to keep all improvements, fixtures and other components of the properties covered by "all risk" insurance in an amount equal to at least the full replacement cost thereof, and to maintain specified minimal personal injury and property damage insurance, protecting us as well as the tenant. The leases also require the tenant to indemnify and hold us harmless from all claims resulting from the use and occupancy of each facility by the tenant and related activities, and to indemnify us against all costs related to any release, discovery, clean-up and removal of hazardous substances or materials on, or other environmental responsibility with respect to each facility.
Most of our existing leases contain annual escalators in rent payments. For financial statement purposes, rental income is recognized on a straight-line basis over the term of the lease. Certain of our operators hold purchase options allowing them to acquire properties they currently lease from NHI. When present, tenant purchase options generally give the lessee an option to purchase the underlying property for consideration determined by i) a sliding base dependent upon the extent of appreciation in the property plus a specified proportion of any appreciation; ii) our acquisition costs plus a specified proportion of any appreciation; iii) an agreed capitalization rate applied to the current rental; or iv) our acquisition costs plus a profit floor plus a specified proportion of any appreciation. Where stipulated above, appreciation is to be established by independent appraisal.
Some of the obligations under the leases are guaranteed by the parent corporation of the lessee, if any, or affiliates or individual principals of the lessee. In some leases, the third party operator will also guarantee some portion of the lease obligations. Some obligations are backed further by other collateral such as security deposits, machinery, equipment, furnishings and other personal property.
We monitor our triple-net lessee tenant credit quality and identify any material changes by performing the following activities:
• | Obtaining financial statements on a monthly, quarterly and/or annual basis to assess the operational trends of our tenants and the financial position and capability of those tenants |
• | Calculating the operating cash flow for each of our tenants |
• | Calculating the lease service coverage ratio and other ratios pertinent to our tenants |
• | Obtaining property-level occupancy rates for our tenants |
6
• | Verifying the payment of taxes by our tenants |
• | Obtaining certificates of insurance for each tenant |
• | Obtaining financial statements of our lessee guarantors on an annual basis |
• | Conducting a periodic inspection of our properties to ascertain proper maintenance, repair and upkeep |
• | Monitoring those tenants with indications of continuing and material deteriorating credit quality through discussions with our executive management and Board of Directors |
RIDEA Transactions. Our arrangement with Bickford Senior Living ("Bickford") is structured to be compliant with the provisions of RIDEA which permits NHI to receive rent payments through a triple-net lease between a property company and an operating company and gives NHI the opportunity to capture additional value on the improving performance of the operating company through distributions to a Taxable REIT Subsidiary ("TRS"). Accordingly, the TRS holds our 85% equity interest in an unconsolidated operating company, which we do not control, and provides an organizational structure that will allow the TRS to engage in a broad range of activities and share in revenues that would otherwise be non-qualifying income under the REIT gross income tests. The TRS is subject to state and federal income taxes.
Mortgage loans. We have first mortgage loans with maturities of at least 5 years from inception with varying amortization schedules from interest only to fully amortizing. Most of the loans are at a fixed interest rate; however, some interest rates increase based on a fixed schedule of rate increases. In most cases, the owner of the facility is committed to make minimum annual capital expenditures for the purpose of maintaining or upgrading their respective facility. Additionally, most of our loans are collateralized by first mortgage liens and corporate or personal guarantees.
We have made mortgage loans to borrowers secured by a second deed-of-trust where there is a process in place for the borrower to obtain long-term financing, primarily with a U.S. government agency, and where the historical financial performance of the underlying facility meets our loan underwriting criteria. We currently have one second mortgage loan with an interest rate of 12%.
Construction loans. From time to time, we also provide construction loans that by their terms convert to mortgage loans upon the completion of the construction of the facility. We may also obtain a purchase option to acquire the facility at a future date and lease the facility back to the operator. The terms of such construction loans are for a period which commences upon the closing of such loans and terminates upon the earlier of (a) the completion of the construction of the applicable facility or (b) a specific date. During the term of the construction loan, funds are usually advanced pursuant to draw requests made by the borrower in accordance with the terms and conditions of the loan. Interest is typically assessed on these loans at rates equivalent to the eventual mortgage rate upon conversion. In addition to the security of the lien against the property, we will generally require additional security and collateral in the form of either payment and performance completion bonds or completion guarantees by the borrower's parent, affiliates of the borrower or one or more of the individuals who control the borrower.
Other notes receivable. We have provided a revolving credit facility to a borrower whose business is to provide bridge loans to owner-operators who are qualifying for long-term HUD financing secured by real estate. Our interest rate on the credit facility is 13.5%. We have provided loans to borrowers involved in the skilled nursing and senior housing industries who have pledged personal and business guarantees as security for the loans. The interest rates on these loans currently range from 8% to13.5%.
Investment in marketable securities. At December 31, 2015, we invested a portion of our funds in various marketable securities with quoted market prices, including the common shares of other publicly-held REITs. We classify these highly-liquid securities as available-for-sale and carry the investments at their then quoted fair market value at the balance sheet date. We may choose to liquidate these investments to invest the proceeds into real estate assets. With respect to the safekeeping of certain security deposits or where liquidity is otherwise of significant concern, a portion of our funds may be invested in government agency debt securities, long-term certificates of deposit, or other risk-appropriate securities as determined by management.
7
Competition and Market Conditions
We compete with other REITs, private equity funds and other investors (including, but not limited to, banks, insurance companies, and investment banks who market securities in mortgage funds) in the acquisition, leasing and financing of health care real estate.
Operators of our facilities compete on a local and regional basis with operators of facilities that provide comparable services. Operators compete for residents and/or patients and staff based on quality of care, reputation, physical appearance of facilities, services offered, family preference, physicians, staff and price. Competition is with independent operators as well as companies managing multiple facilities, some of which are substantially larger and have greater resources than the operators of our facilities. Some of these facilities are operated for profit while others are owned by governmental agencies or tax exempt not-for-profit organizations.
The SNFs which either secure our mortgage loans or we lease to operators receive the majority of their revenues from Medicare, Medicaid and other government programs. From time to time, these facilities have experienced Medicare and Medicaid revenue reductions brought about by the enactment of legislation to reduce government costs. In particular, the establishment of a Medicare Prospective Payment System (“PPS”) for SNF services to replace the cost-based reimbursement system significantly reduced Medicare reimbursement to SNF providers. While Congress subsequently took steps to mitigate the impact of PPS on SNFs, other federal legislative policies have been adopted and continue to be proposed that would reduce the growth rate of Medicare and/or Medicaid payments to SNFs. State Medicaid funding is not expected to keep pace with inflation according to industry studies. Any changes in government reimbursement methodology that reduce reimbursement to levels that are insufficient to cover the operating costs of our borrowers and lessees could adversely impact us.
Senior housing communities generally rely on private-pay residents who may be negatively impacted in an economic downturn. The success of these facilities is often impacted by the existence of comparable, competing facilities in a local market.
Operator Diversification
For the year ended December 31, 2015, approximately 21% of our portfolio revenue was from publicly-owned operators, 53% was from regional operators, 22% from national chains which are privately owned and 5% was from smaller operators. We consider the creditworthiness of the operator to be an important factor in our underwriting of the investment, and we generally have the right to approve any changes in operators.
For the year ended December 31, 2015, operators of facilities which provided more than 3% of our total revenues were (in alphabetical order): Bickford Senior Living; Fundamental; Health Services Management; Holiday Retirement; Legend Healthcare; National HealthCare Corporation; and Senior Living Communities.
Major Customers
We have four operators, an affiliate of Holiday Retirement ("Holiday"), Senior Living Communities, LLC ("Senior Living"), National HealthCare Corporation (“NHC”) and Bickford Senior Living ("Bickford"), from whom we individually derive at least 10% of our income.
Holiday
In December 2013 we acquired 25 independent living facilities from an affiliate of Holiday for $491,000,000 plus transaction costs of $1,959,000. We have leased this portfolio to Holiday AL Holdings, LP, a subsidiary of Holiday. Our tenant operates the facilities pursuant to a management agreement with a Holiday-affiliated manager. The master lease term of 17 years began in December 2013 and provided for initial base rent of $31,915,000 plus annual escalators of 4.5% in the first 3 years and a minimum of 3.5% each year thereafter.
Of our total revenue from continuing operations, $43,817,000 (19%) and $43,817,000 (25%) were recorded as rental income from Holiday, including straight-line revenues of $10,466,000 and $11,902,000 for the years ended December 31, 2015 and 2014, respectively.
8
Senior Living Communities
In December 2014, we acquired a portfolio of eight retirement communities (the “Senior Living Portfolio”) with a total of 1,671 units from Health Care REIT, Inc. and certain of its affiliates for a cash purchase price of $476,000,000. The Senior Living Portfolio includes seven entrance-fee communities and one senior living campus.
We have leased the Senior Living Portfolio under a triple-net master lease with an affiliate of Senior Living which continues to manage the facilities. The 15-year master lease contains two 5-year renewal options and provides for year one cash rent of $31,000,000, subject to annual escalators of 4% in years two through four and 3% thereafter.
In connection with the Senior Living acquisition, we provided a $15,000,000 revolving line of credit to Senior Living, the maturity of which mirrors the term of the master lease. Borrowings will be used primarily to finance construction projects within the Senior Living Portfolio, including building additional units. Amounts outstanding under the facility, $6,282,000 at December 31, 2015, bear interest at an annual rate equal to the 10-year U.S. Treasury rate, 2.27% at December 31, 2015, plus 6%.
Of our total revenue from continuing operations, $39,422,000 (17%), and $1,533,000 (1%), including $8,422,000 and $328,000 of straight-line revenues, were recorded as rental income from Senior Living, in 2015 and 2014, respectively.
NHC
NHC is a publicly-held company and the lessee of our legacy properties. We lease 42 facilities to NHC comprised of 3 independent living facilities and 39 skilled nursing facilities (4 of which are subleased to other parties for whom the lease payments are guaranteed to us by NHC). These facilities are leased to NHC under the terms of an amended Master Lease Agreement dated October 17, 1991 ("the 1991 lease") which includes our 35 remaining legacy properties and a Master Lease Agreement dated August 30, 2013 ("the 2013 lease") which includes 7 skilled nursing facilities acquired from a third party. Under the terms of the 1991 lease, base annual rental of $30,750,000 escalates by 4% of the increase, if any, in each facility’s revenue over a 2007 base year. Similarly, the 2013 lease provides for base annual rental of $3,450,000 plus percentage rent equal to 4% of the increase, if any, in each facility's annual revenue over a 2014 base year.
Of our total revenue from continuing operations, $36,625,000 (16%), $36,446,000 (21%) and $34,756,000 (29%) in 2015, 2014 and 2013, respectively, were derived from the two lease agreements with NHC.
NHC owned 1,630,462 shares of our common stock at December 31, 2015. The chairman of our board of directors is also a director on NHC’s board.
Bickford
As of December 31, 2015, we owned an 85% equity interest, and Sycamore Street, LLC ("Sycamore"), an affiliate of Bickford, owned a 15% equity interest in our consolidated subsidiary ("PropCo"), which owns 32 assisted living/memory care facilities, plus 5 facilities under development. The facilities are leased to an operating company, ("OpCo"), in which we retain an 85/15 non-controlling ownership interest with Sycamore. The facilities are managed by Bickford. This joint venture is structured to comply with the provisions of RIDEA.
The current annual contractual rent from OpCo to PropCo is $25,529,000, plus fixed annual escalators. NHI has an exclusive right to Bickford's future acquisitions, development projects and refinancing transactions.
Of our total revenue from continuing operations, $24,121,000 (11%), $21,421,000 (12%) and $14,586,000 (12%) were recorded as rental income from Bickford for the years ended December 31, 2015, 2014, and 2013, respectively.
Commitments and Contingencies
The following table summarizes information as of December 31, 2015 related to our outstanding commitments and contingencies which are more fully described in the notes to the consolidated financial statements, included herein.
9
Asset Class | Type | Total | Funded | Remaining | |||||||||||
Commitments: | |||||||||||||||
Life Care Services | SHO | Construction Loan | $ | 154,500,000 | $ | (83,411,000 | ) | $ | 71,089,000 | ||||||
Bickford Senior Living | SHO | Construction | $ | 55,000,000 | $ | (17,436,000 | ) | $ | 37,564,000 | ||||||
Senior Living Communities | SHO | Revolving Credit | $ | 15,000,000 | $ | (6,282,000 | ) | $ | 8,718,000 | ||||||
Capital Funding Group | Mezz. Note | Revolving Credit | $ | 15,000,000 | $ | (15,000,000 | ) | $ | — | ||||||
Chancellor Health Care | SHO | Construction | $ | 650,000 | $ | (33,000 | ) | $ | 617,000 | ||||||
Santé Partners | SHO | Renovation | $ | 3,500,000 | $ | (2,621,000 | ) | $ | 879,000 | ||||||
Senior Living Management | SHO | Renovation | $ | 1,430,000 | $ | (1,165,000 | ) | $ | 265,000 | ||||||
Bickford Senior Living | SHO | Renovation | $ | 620,000 | $ | (575,000 | ) | $ | 45,000 | ||||||
Sycamore Street (Bickford affiliate) | SHO | Revolving Credit | $ | 500,000 | $ | (461,000 | ) | $ | 39,000 | ||||||
East Lake Capital Management | SHO | Renovation | $ | 400,000 | $ | — | $ | 400,000 | |||||||
Contingencies: | |||||||||||||||
East Lake Capital Management | SHO | Lease Inducement | $ | 8,000,000 | $ | — | $ | 8,000,000 | |||||||
East Lake Capital Management | SHO | Seller Earnout | $ | 750,000 | $ | — | $ | 750,000 | |||||||
Sycamore Street (Bickford affiliate) | SHO | Letter-of-credit | $ | 3,550,000 | $ | — | $ | 3,550,000 | |||||||
Discovery Senior Living | SHO | Lease Inducement | $ | 2,500,000 | $ | — | $ | 2,500,000 | |||||||
Santé Partners | SHO | Lease Inducement | $ | 2,000,000 | $ | — | $ | 2,000,000 | |||||||
Sources of Revenues
General. Our revenues are derived primarily from rental income, mortgage and other note interest income and income from our other investments, substantially all of which are in marketable securities, including the common stock of other healthcare REITs. During 2015, rental income was $214,447,000 (94%), interest income from mortgages and other notes was $9,978,000 (4%) and income from our other investments was $4,563,000 (2%) of total revenue from continuing operations of $228,988,000. Our revenues depend on the operating success of our facility operators whose source and amount of revenues are determined by (i) the licensed beds or other capacity of the facility, (ii) the occupancy rate of the facility, (iii) the extent to which the services provided at each facility are utilized by the patients, (iv) the mix of private pay, Medicare and Medicaid patients at the facility, and (v) the rates paid by private paying patients and by the Medicare and Medicaid programs.
Governmental and other concerns regarding health care costs have and may continue to result in significant downward pressure on payments to health care facilities, and there can be no assurance that future payment rates for either governmental or private health care plans will be sufficient to cover cost increases in providing services to patients. Any changes in reimbursement policies which reduce reimbursement to levels that are insufficient to cover the cost of providing patient care could have an adverse effect on revenues of our lessees and borrowers and thereby adversely affect those lessees' and borrowers' abilities to make their lease or debt payments to us. Failure of the lessees or borrowers to make their lease or debt payments would have a direct and material adverse impact on us.
Medicare and Medicaid. A significant portion of the revenue of our SNF lessees and borrowers is derived from government funded reimbursement programs, such as Medicare and Medicaid. Reimbursement under these programs is subject to periodic payment review and other audits by federal and state authorities. Medicare is uniform nationwide and reimburses skilled nursing centers under a Prospective Payment System (“PPS”) which is based on a predetermined, fixed amount. PPS is an acuity based classification system that uses nursing and therapy indexes adjusted by geographical wage indexes to calculate per diem rates for each Medicare patient. Payment rates are updated annually and are generally adjusted each October when the federal fiscal year begins. The current acuity classification system is named Resource Utilization Groups IV (“RUGs IV”) and was effective October 1, 2010. Federal legislative policies have been adopted and continue to be proposed that would provide smaller increases in annual Medicare payments to nursing facilities. For example, the Centers for Medicare and Medicaid Services ("CMS") announced the Skilled Nursing Facilities – PPS final rule for fiscal year 2016 which increases Medicare payments to SNF operators by only 1.2% beginning October 1, 2015. The fiscal year 2015 increase was 2.0%, the fiscal year 2014 increase was 1.4% and the fiscal year 2013 increase was 1.8%.
In the future, any failure of Congress to agree on spending reductions to meet long-term mandated deficit reduction goals would trigger automatic spending cuts of 2% to Medicare.
10
RUGs IV incorporated changes to PPS that significantly altered how SNFs are paid for rendering care. Some examples are as follows:
• | A shift to 66 payment categories from 53 payment categories; |
• | Changes related to assessment reference dates and qualifiers that will significantly reduce utilization of rehabilitation and extensive service categories; |
• | Modification to therapy services related to estimating treatments and utilization of concurrent therapy that will likely result in RUG classifications at much lower levels of therapy than previous results; and |
• | Adjustments related to assistance with activities of daily living (ADLs) and an increased emphasis on ADL scores in the nursing case mix indices and related RUG payment rates. |
Medicaid is a joint federal and state program designed to provide medical assistance to “eligible needy persons.” Medicaid programs are operated by state agencies that adopt their own medical reimbursement methodology and standards. Payment rates and covered services vary from state to state. In many instances, revenues from Medicaid programs are insufficient to cover the actual costs incurred in providing care to those patients. With regard to Medicaid payment increases to skilled nursing operators, changes in federal funding coupled with state budget problems have produced uncertainty. States will more than likely be unable to keep pace with nursing center inflation. States are under pressure to pursue other alternatives to long term care such as community and home-based services. Furthermore, several of the states in which we have investments have actively sought to reduce or slow the increase of Medicaid spending for nursing home care.
Medicare and Medicaid programs are highly regulated and subject to frequent and substantial changes resulting from legislation, adoption of rules and regulations and administrative and judicial interpretations of existing law. Moreover, as health care facilities have experienced increasing pressure from private payors attempting to control health care costs, reimbursement from private payors has in many cases effectively been reduced to levels approaching those of government payors. Healthcare reimbursement will likely continue to be of significant importance to federal and state authorities. We cannot make any assessment as to the ultimate timing or the effect that any future legislative reforms may have on our lessees’ and borrowers’ costs of doing business and on the amount of reimbursement by government and other third-party payors. There can be no assurance that future payment rates for either government or private payors will be sufficient to cover cost increases in providing services to patients. Any changes in reimbursement policies which reduce reimbursement to levels that are insufficient to cover the cost of providing patient care could adversely affect the operating revenues of our SNF and hospital lessees and borrowers, and thereby adversely affect their ability to make their lease or debt payments to us. Failure of our lessees and borrowers to make their scheduled lease and loan payments to us would have a direct and material adverse impact on us.
Government Regulation
Licensure and Certification. The health care industry is highly regulated by federal, state and local law and is directly affected by state and local licensing requirements, facility inspections, state and federal reimbursement policies, regulations concerning capital and other expenditures, certification requirements and other such laws, regulations and rules. Sanctions for failure to comply with these regulations and laws include (but are not limited to) loss of licensure, fines and loss of certification to participate in the Medicare and Medicaid programs, as well as potential criminal penalties. The failure of any lessee or borrower to comply with such laws, requirements and regulations could affect their ability to operate the facility or facilities and could adversely affect such lessee's or borrower's ability to make lease or debt payments to us.
In the past several years, due to rising health care costs, there has been an increased emphasis on detecting and eliminating fraud and abuse in the Medicare and Medicaid programs. Payment of any consideration in exchange for referral of Medicare and Medicaid patients is generally prohibited by federal statute, which subjects violators to severe penalties, including exclusion from the Medicare and Medicaid programs, fines and even prison sentences. In recent years, both federal and state governments have significantly increased investigation and enforcement activity to detect and punish wrongdoers. In addition, legislation has been adopted at both state and federal levels which severely restrict the ability of physicians to refer patients to entities in which they have a financial interest.
It is anticipated that the trend toward increased investigation and enforcement activity in the area of fraud and abuse, as well as self-referral, will continue in future years. Certain of our investments are with lessees or borrowers which are partially or wholly owned by physicians. In the event that any lessee or borrower were to be found in violation of laws regarding fraud and abuse or self-referral, that lessee's or borrower's ability to operate the facility could be jeopardized, which could adversely affect the lessee's or borrower's ability to make lease or debt payments to us and thereby adversely affect us.
11
Certificates of Need. The SNFs and hospitals in which we invest are also generally subject to state statutes which may require regulatory approval in the form of a CON prior to the construction or expansion of facilities to accommodate new beds (or addition of new beds to existing facilities), the addition of services or certain capital expenditures. CON requirements are not uniform throughout the United States and are subject to change. We cannot predict the impact of regulatory changes with respect to CONs on the operations of our lessees and borrowers; however, in our primary market areas, a significant reduction in new construction of long-term care beds has occurred.
Investment Policies
Our investment objectives are (i) to provide consistent and growing current income for distribution to our stockholders through investments primarily in health care related facilities or in the operations thereof through independent third-party management, (ii) to provide the opportunity to realize capital growth resulting from appreciation, if any, in the residual value of our portfolio properties, and (iii) to preserve and protect stockholders' capital through a balance of diversity, flexibility and liquidity. There can be no assurance that these objectives will be realized. Our investment policies include making investments in real estate, mortgage and other notes receivable, marketable securities, including the common stock of other REITs, and joint ventures structured to comply with the provisions of RIDEA.
As described in Item 7 and in Notes 2 and 4 to the consolidated financial statements, included herein, we have funded or made commitments to fund new investments in real estate and loans since January 1, 2015 totaling $310,075,000, and we anticipate making additional investments in 2016 that meet our underwriting criteria. In making new investments, we consider such factors as (i) the geographic area and type of property, (ii) the location, construction quality, condition and design of the property, (iii) the current and anticipated cash flow and its adequacy to meet operational needs, and lease or mortgage obligations to provide a competitive income return to our investors, (iv) the growth, tax and regulatory environments of the communities in which the properties are located, (v) occupancy and demand for similar facilities in the same or nearby communities, (vi) the quality, experience and creditworthiness of the management operating the facilities located on the property and (vii) the mix of private and government-sponsored residents. There can be no assurances that investments meeting our standards regarding these attributes will be found or closed.
We will not, without the approval of a majority of the Board of Directors, and review of a committee comprised of independent directors, enter into any joint venture relationships with or acquire from or sell to any director, officer or employee of NHI, or any affiliate thereof, as the case may be, any of our assets or other property.
The Board of Directors, without the approval of the stockholders, may alter our investment policies if it determines that such a change is in our best interests and our stockholders’ best interests. The methods of implementing our investment policies may vary as new investment and financing techniques are developed or for other reasons. Management may recommend changes in investment criteria from time to time.
Future investments in health care related facilities may utilize borrowed funds or issuance of equity when it is advisable in the opinion of the Board of Directors. We may negotiate lines of credit or arrange for other short or long-term borrowings from lenders. We may arrange for long-term borrowings from institutional investors or through public offerings. We have previously invested and may in the future invest in properties subject to existing loans or secured by mortgages, deeds of trust or similar liens with favorable terms or in mortgage investment pools.
Executive Officers of the Company
The table below sets forth the name, position and age of each of our executive officers. Each executive officer is appointed by the Board of Directors, serves at its pleasure and holds office for a term of one year. There is no “family relationship” among any of the named executive officers or with any director. All information is given as of February 15, 2016:
Name | Position | Age |
Eric Mendelsohn | President and Chief Executive Officer | 54 |
Roger R. Hopkins | Chief Accounting Officer | 54 |
Kristin S. Gaines | Chief Credit Officer | 44 |
Kevin Pascoe | Executive Vice President Investments | 35 |
Eric Mendelsohn, formerly Executive Vice President of Corporate Finance and interim Chief Executive Officer since early August 2015, joined NHI in January 2015. He has over 15 years of healthcare real estate and financing experience. Previously, Mr. Mendelsohn was with Emeritus Senior Living for 9 years, most recently as a Senior Vice President of Corporate Development
12
where he was responsible for the financing and acquisition of assisted living properties, home health care companies, administration of joint venture relationships and executing corporate finance strategies. Prior to Emeritus, he was with the University of Washington as a Transaction Officer where he worked on the development, acquisition and financing of research, clinic and medical properties and has been a practicing transaction attorney, representing lenders and landlords. Mr. Mendelsohn holds a BS from American University in International Relations, a Law Degree from Pepperdine University, and a Masters (LLM) in Banking and Finance from Boston University. Mr. Mendelsohn is a member of the Florida and Washington State Bar Associations.
Roger R. Hopkins joined the former management advisor of NHI in July 2006 and was named Chief Accounting Officer for NHI in December 2006. With over 33 years of combined financial experience in public accounting and the real estate industry, he positioned companies to access public and private capital markets for equity and debt. Mr. Hopkins is responsible at NHI for the development of financial and tax strategies, reporting metrics, supplemental data reports and NHI’s internal control system. He has accounted for significant acquisitions and financings by NHI, including the successful executions of convertible debt and follow-on equity offerings, private debt placements and bank financing arrangements. Mr. Hopkins was an Audit Partner in the Nashville office of Rodefer Moss & Co, a regional accounting firm with five offices in Tennessee and Kentucky, where he brought extensive experience in Securities and Exchange Commission filing requirements and compliance issues. He was previously a Senior Manager in the Nashville office of Deloitte. Mr. Hopkins received his Bachelor of Science in Accounting from Tennessee Technological University in 1982 and is a CPA licensed in Tennessee.
Kristin S. Gaines was appointed NHI’s Chief Credit Officer in February 2010. She joined NHI in 1998 as a Credit Analyst. During her tenure with NHI, Ms. Gaines has had a progressive career in the areas of finance and operations. Her experience has resulted in a breadth of expertise in underwriting, portfolio oversight and real estate finance. Ms. Gaines holds an MBA and a Bachelor of Business Administration in Accounting from Middle Tennessee State University.
Kevin Pascoe joined NHI in June 2010. Mr. Pascoe oversees NHI’s portfolio of assets, relationship management with existing tenants and conducts operational due diligence on NHI’s existing investments and new investment opportunities. He has over 10 years of health care real estate background including his experience with General Electric - Healthcare Financial Services (2006 – 2010) where he most recently served as a Vice-President. With GE HFS he moved up through the organization while working on various assignments including relationship management, deal restructuring, and special assets. He also was awarded an assignment in the GE Capital Global Risk Rotation Program. Mr. Pascoe holds an MBA and a Bachelor of Business Administration in Economics from Middle Tennessee State University.
We have a staff of 12, all serving in our corporate office in Murfreesboro, TN. Essential services such as internal auditing, tax compliance, information technology and legal services are outsourced to third-party professional firms.
Investor Information
We publish our annual report on Form 10-K, quarterly reports on Form 10-Q, quarterly Supplemental Information, current reports on Form 8-K, and press releases to our website at www.nhireit.com. We have a policy of publishing these on the website within two (2) business days after public release or filing with the SEC.
We also maintain the following documents on our web site:
▪ | The NHI Code of Business Conduct and Ethics. This has been adopted for all employees, officers and directors of the Company. |
▪ | Information on our “NHI Valuesline” which allows all interested parties to communicate with NHI executive officers and directors. The toll free number is 877-880-2974 and the communications may be made anonymously, if desired. |
▪ | The NHI Restated Audit Committee Charter. |
▪ | The NHI Revised Compensation Committee Charter. |
▪ | The NHI Revised Nominating and Corporate Governance Committee Charter. |
▪ | The NHI Corporate Governance Guidelines. |
We will furnish, free of charge, a copy of any of the above documents to any interested investor upon receipt of a written request.
Our transfer agent is Computershare. Computershare will assist registered owners with the NHI Dividend Reinvestment plan, change of address, transfer of ownership, payment of dividends, replacement of lost checks or stock certificates. Computershare’s
13
contact information is: Computershare Trust Company, N.A., P.O. Box 43078, Providence, RI 02940-3078. The toll free number is 800-942-5909 and the website is www.computershare.com.
The Annual Stockholders’ meeting will be held at 1:00 p.m. local time on Thursday, May 5, 2016 at Stones River Country Club, 1830 NW Broad Street, Murfreesboro, TN.
ITEM 1A. RISK FACTORS
We depend on the operating success of our tenants and borrowers for collection of our lease and interest income.
Revenues to operators of our facilities are primarily driven by occupancy, Medicare and Medicaid reimbursement and private pay rates. Revenues from government reimbursement have, and may continue to, come under pressure due to reimbursement cuts and from widely-publicized federal and state budget shortfalls and constraints. Periods of weak economic growth in the U.S. which affect housing sales, investment returns and personal incomes may adversely affect senior housing occupancy rates. Expenses for the facilities are driven by the costs of labor, food, utilities, taxes, insurance and rent or debt service. Liability insurance and staffing costs continue to increase for our operators. To the extent any decrease in revenues and/or any increase in operating expenses results in a facility not generating enough cash to make scheduled payments to us, our revenues, net income and funds from operations would be adversely affected. Such events and circumstances would cause us to evaluate whether there was an impairment of the real estate or mortgage loan that should be charged to earnings. Such impairment would be measured as the amount by which the carrying amount of the asset exceeded its fair value. Consequently, we might be unable to maintain or increase our current dividend and the market price of our stock may decline.
We depend on the success of property development and construction activities, which may fail to achieve the operating results we expect.
When we decide to invest in the renovation of an existing property or in the development of a new property, we make assumptions about the future potential cash flows of that property. We estimate our return based on expected occupancy, rental rates and future capital costs. If our projections prove to be inaccurate due to increased capital costs, lower occupancy or other factors, our investment in that property may not generate the cash flow we expected. Recently developed properties, including our Bickford construction, may take longer than expected to achieve stabilized operating levels, if at all. To the extent such facilities fail to reach stabilized operating levels or achieve stabilization later than expected, it could materially adversely affect our RIDEA operations or our tenants’ abilities to make payments to us under their leases and thus adversely affect our business and results of operations.
We are exposed to the risk that our tenants and borrowers may not be able to meet the rent, principal and interest or other payments due us, which may result in an operator bankruptcy or insolvency, or that an operator might become subject to bankruptcy or insolvency proceedings for other reasons.
Although our operating lease agreements provide us the right to evict an operator, demand immediate payment of rent and exercise other remedies, and our mortgage loans provide us the right to terminate any funding obligations, demand immediate repayment of principal and unpaid interest, foreclose on the collateral and exercise other remedies, the bankruptcy laws afford certain rights to a party that has filed for bankruptcy or reorganization. An operator in bankruptcy may be able to limit or delay our ability to collect unpaid rent in the case of a lease or to receive unpaid principal and/or interest in the case of a mortgage loan and to exercise other rights and remedies. We may be required to fund certain expenses (e.g. real estate taxes, maintenance and capital improvements) to preserve the value of a facility, avoid the imposition of liens on a facility and/or transition a facility to a new operator. In some instances, we have terminated our lease with an operator and leased the facility to another operator. In some of those situations, we provided working capital loans to, and limited indemnification of, the new operator. If we cannot transition a leased facility to a new operator, we may take possession of that facility, which may expose us to certain successor liabilities. Should such events occur, our revenue and operating cash flow may be adversely affected.
We are exposed to risks related to governmental regulations and payors, principally Medicare and Medicaid, and the effect that lower reimbursement rates would have on our tenants’ and borrowers’ business.
Our operators’ businesses are affected by government reimbursement and private payor rates. To the extent that any of our facilities receive a significant portion of their revenues from governmental payors, primarily Medicare and Medicaid, such revenues may be subject to statutory and regulatory changes, retroactive rate adjustments, recovery of program overpayments or set-offs, administrative rulings, policy interpretations, payment or other delays by fiscal intermediaries, government funding restrictions (at a program level or with respect to specific facilities) and interruption or delays in payments due to any ongoing governmental investigations and audits at such facilities. In recent years, governmental payors have frozen or reduced payments to health care providers due to budgetary pressures. Such reductions in Medicare reimbursement will have an adverse effect on the financial
14
operations of our borrowers and lessees who operate SNFs. Changes in health care reimbursement will likely continue to be of paramount importance to federal and state authorities. We cannot make any assessment as to the ultimate timing or effect any future legislative reforms may have on the financial condition of the health care industry. There can be no assurance that adequate reimbursement levels will continue to be available for services provided by any facility operator, whether the facility receives reimbursement from Medicare, Medicaid or private payors. Significant limits on the scope of services reimbursed and on reimbursement rates and fees could have a material adverse effect on an operator’s liquidity, financial condition and results of operations, which could adversely affect the ability of an operator to meet its obligations to us. In addition, the replacement of an operator that has defaulted on its lease or loan could be delayed by the approval process of any federal, state or local agency necessary for the transfer of the facility or the replacement of the operator licensed to manage the facility.
We are exposed to the risk that the cash flows of our tenants and borrowers would be adversely affected by increased liability claims and liability insurance costs.
ALF and SNF operators have experienced substantial increases in both the number and size of patient care liability claims in recent years, particularly in the states of Texas and Florida. As a result, general and professional liability costs have increased and may continue to increase. Nationwide, long-term care liability insurance rates are increasing because of large jury awards in states like Texas and Florida. Both Texas and Florida have now adopted SNF liability laws that modify or limit tort damages. Despite some of these reforms, the long-term care industry overall continues to experience very high general and professional liability costs. Insurance companies have responded to this claims crisis by severely restricting their capacity to write long-term care general and professional liability policies. No assurance can be given that the climate for long-term care general and professional liability insurance will improve in any of the foregoing states or any other states where the facility operators conduct business. Insurance companies may continue to reduce or stop writing general and professional liability policies for ALFs and SNFs. Thus, general and professional liability insurance coverage may be restricted, very costly or not available, which may adversely affect the facility operators’ future operations, cash flows and financial condition and may have a material adverse effect on the facility operators’ ability to meet their obligations to us.
We are exposed to risks related to environmental laws and the costs associated with liabilities related to hazardous substances.
Under various federal and state laws, owners or operators of real property may be required to respond to the release of hazardous substances on the property and may be held liable for property damage, personal injuries or penalties that result from environmental contamination. These laws also expose us to the possibility that we may become liable to reimburse the government for damages and costs it incurs in connection with the contamination. Generally, such liability attaches to a person based on the person’s relationship to the property. Our tenants or borrowers are primarily responsible for the condition of the property and since we are a passive landlord, we do not “participate in the management” of any property in which we have an interest. Moreover, we review environmental site assessment of the properties that we own or encumber prior to taking an interest in them. Those assessments are designed to meet the “all appropriate inquiry” standard, which qualifies us for the innocent purchaser defense if environmental liabilities arise. Based upon such assessments, we do not believe that any of our properties are subject to material environmental contamination. However, environmental liabilities, including mold, may be present in our properties and we may incur costs to remediate contamination, which could have a material adverse effect on our business or financial condition.
We are exposed to the risk that we may not be fully indemnified by our lessees and borrowers against future litigation.
Our leases require that the lessee name us as an additional insured party on the tenant’s insurance policy in regard to claims made for professional liability or personal injury. The leases also require the tenant to indemnify and hold us harmless for all claims resulting from the occupancy and use of each facility. We cannot give any assurance that these protective measures will completely eliminate any risk to us related to future litigation, the costs of which could have a material adverse impact on us.
We depend on the success of our future acquisitions and investments.
We are exposed to the risk that our future acquisitions may not prove to be successful. We could encounter unanticipated difficulties and expenditures relating to any acquired properties, including contingent liabilities, and newly acquired properties might require significant management attention that would otherwise be devoted to our existing business. If we agree to provide construction funding to an operator and the project is not completed, we may need to take steps to ensure completion of the project or we could lose the property. Moreover, if we issue equity securities or incur additional debt, or both, to finance future acquisitions, it may reduce our per share financial results. These costs may negatively affect our results of operations.
15
We depend on our ability to reinvest cash in real estate investments in a timely manner and on acceptable terms.
From time to time, we will have cash available from (1) the proceeds of sales of our securities, (2) principal payments on our notes receivable and (3) the sale of properties, including non-elective dispositions, under the terms of master leases or similar financial support arrangements. We must reinvest these proceeds, on a timely basis, in health care investments or in qualified short-term investments. We compete for real estate investments with a broad variety of potential investors. This competition for attractive investments may negatively affect our ability to make timely investments on terms acceptable to us. Delays in acquiring properties may negatively impact revenues and the amount of distributions to stockholders.
We may need to refinance existing debt or incur additional debt in the future, which may not be available on terms acceptable to us.
We operate with a policy of incurring debt when, in the opinion of our Board of Directors, it is advisable. Currently, we believe that our current liquidity, availability under our unsecured credit facility, and our capacity to service additional debt will enable us to meet our obligations, including dividends, and continue to make investments in healthcare real estate. While we currently have a very low debt ratio, in the future, we may increase our borrowings. We may incur additional debt by borrowing under our unsecured credit facility, mortgaging properties we own and/or issuing debt securities in a public offering or in a private transaction. We believe we will be able to raise additional debt and equity capital at reasonable costs to refinance our existing indebtedness at or prior to its maturity. Our ability to raise reasonably priced capital is not guaranteed; we may be unable to raise reasonably priced capital because of reasons related to our business or for reasons beyond our control, such as market conditions. If our access to capital becomes limited, it could have an impact on our ability to refinance our debt obligations, fund dividend payments, acquire properties and fund acquisition activities.
We have covenants related to our indebtedness which impose certain operational limitations and a breach of those covenants could materially adversely affect our financial condition and results of operations.
The terms of our current indebtedness as well as debt instruments that the Company may enter into in the future are subject to customary financial and operational covenants. Among other things, these provisions require us to maintain certain financial ratios and minimum net worth and impose certain limits on our ability to incur indebtedness, create liens and make investments or acquisitions. Our continued ability to incur debt and operate our business is subject to compliance with these covenants, which limit operational flexibility. Breaches of these covenants could result in a default under applicable debt instruments, even if payment obligations are satisfied. Financial and other covenants that limit our operational flexibility, as well as defaults resulting from a breach of any of these covenants in our debt instruments, could have a material adverse effect on our financial condition and results of operations.
We are exposed to the risk that the illiquidity of real estate investments could impede our ability to respond to adverse changes in the performance of our properties.
Real estate investments are relatively illiquid and, therefore, our ability to quickly sell or exchange any of our properties in response to changes in economic and other conditions may be limited. All of our properties are "special purpose" properties that cannot be readily converted to general residential, retail or office use. Facilities that participate in Medicare or Medicaid must meet extensive program requirements, including physical plant and operational requirements, which are revised from time to time. Transfers of operations of facilities are subject to regulatory approvals not required for transfers of other types of commercial operations and other types of real estate. Thus, if the operation of any of our properties becomes unprofitable due to competition, age of improvements or other factors such that our lessee or borrower becomes unable to meet its obligations on the lease or mortgage loan, the liquidation value of the property may be less than the net book value or the amount owed on any related mortgage loan, because the property may not be readily adaptable to other uses. The sale of the property or the replacement of an operator that has defaulted on its lease or loan could also be delayed by the approval process of any federal, state or local agency necessary for the transfer of the property or the replacement of the operator with a new operator licensed to manage the facility. No assurances can be given that we will recognize full value for any property that we are required to sell for liquidity reasons. Should such events occur, our results of operations and cash flows could be adversely affected.
Certain tenants/operators in our portfolio account for a significant percentage of the rent we expect to generate from our portfolio, and the failure of any of these tenants/operators to meet their obligations to us could materially and adversely affect our business, financial condition and results of operations and our ability to make distributions to our stockholders.
The successful performance of our real estate investments is materially dependent on the financial stability of our tenants/operators. Approximately 63% of our total revenue from continuing operations is generated by Holiday (19%), Senior Living (17%), NHC (16%), and Bickford (11%). Lease or interest payment defaults by Holiday, Senior Living, NHC, Bickford or other
16
significant tenants/operators or declines in their operating performance could materially and adversely affect our business, financial condition and results of operations and our ability to make distributions to our stockholders. In the event of a tenant default, we may experience delays in enforcing our rights as landlord and may incur substantial costs in protecting our investment and re-leasing our property. Further, we cannot assure you that we will be able to re-lease the property for the rent previously received, or at all, or that lease terminations will not cause us to sell the property at a loss. The result of any of the foregoing risks could materially and adversely affect our business, financial conditions and results of operations and our ability to make distributions to our stockholders.
We are exposed to risks associated with our investments in unconsolidated entities, including our lack of sole decision-making authority and our reliance on the financial condition of other interests.
Our investments in unconsolidated entities could be adversely affected by our lack of sole decision-making authority regarding major decisions, our reliance on the financial condition of other interests, any disputes that may arise between us and other partners, and our exposure to potential losses from the actions of partners. Risks of dealing with parties outside NHI include limitations on unilateral major decisions opposed by other interests, the prospect of divergent goals of ownership including the likelihood of disputes regarding management, ownership or disposition of a property, or limitations on the transfer of our interests without the consent of our partners. Risks of the unconsolidated entity extend to areas in which the financial health of our partners may impact our plans. Our partners might become bankrupt or fail to fund their share of required capital contributions, which may hinder significant action in the entity. We may disagree with our partners about decisions affecting a property or the entity itself, which could result in litigation or arbitration that increases our expenses, distracts our officers and directors and disrupts the day-to-day operations of the property, including by delaying important decisions until the dispute is resolved; and finally, we may suffer losses as a result of actions taken by our partners with respect to our investments.
We are subject to additional risks related to healthcare operations associated with our investments in unconsolidated entities, which could have a material adverse effect on our results of operations.
We invest in other entities in compliance with RIDEA. As such, we are exposed to various operational risks with respect to those operating properties that may increase our costs or adversely affect our ability to increase revenues. These risks include fluctuations in resident occupancy, operating expenses, economic conditions; competition; certification and inspection laws, regulations, and standards; the availability of and increases in cost of general and professional liability insurance coverage; litigation; federal, state and local regulations; costs associated with government investigations and enforcement actions; the availability and increases in cost of labor; and other risks applicable to any operating business. Any one or a combination of these factors may adversely affect our revenue and operations.
We depend on revenues derived mainly from fixed rate investments in real estate assets, while a portion of our debt used to finance those investments bear interest at variable rates. This circumstance creates interest rate risk to the Company.
Our business model assumes that we can earn a spread between the returns earned from our investments in real estate as compared to our cost of capital, including debt and/or equity. Current interest rates on our debt are at historically low levels, and, as a result, the spread and our profitability on our investments have been at high levels. We are exposed to interest rate risk in the potential for a narrowing of our spread and profitability if interest rates increase in the future. Certain of our debt obligations are floating rate obligations with interest rates that vary with the movement of LIBOR or other indexes. Our revenues are derived mainly from fixed rate investments in real estate assets. Although our leases generally contain escalating rent clauses that provide a partial hedge against interest rate fluctuations, if interest rates rise, our interest costs for our existing floating rate debt and any new debt we incur would also increase. This increasing cost of debt could reduce our profitability by increasing the cost of financing our existing portfolio and our investment activity. Rising interest rates could limit our ability to refinance existing debt upon maturity or cause us to pay higher rates upon refinancing. We manage a portion of our exposure to interest rate risk by accessing debt with staggered maturities and through the use of derivative instruments, primarily interest rate swap agreements with major financial institutions. Increased interest rates may also negatively affect the market price of our common stock and increase the cost of new equity capital.
We are exposed to the risk that our assets may be subject to impairment charges.
We periodically, but not less than quarterly, evaluate our real estate investments and other assets for impairment indicators. The judgment regarding the existence of impairment indicators is based on factors such as market conditions, operator performance and legal structure. If we determine that a significant impairment has occurred, we would be required to make an adjustment to the net carrying value of the asset, which could have a material adverse effect on our reported results of operations in the period in which the impairment charge occurs.
17
We depend on the ability to continue to qualify for taxation as a REIT.
We intend to operate as a REIT under the Internal Revenue Code of 1986, as amended (the “Internal Revenue Code”) and believe we have and will continue to operate in such a manner. Since REIT qualification requires us to meet a number of complex requirements, it is possible that we may fail to fulfill them, and if we do, our earnings will be reduced by the amount of federal taxes owed. A reduction in our earnings would affect the amount we could distribute to our stockholders.
We have ownership limits in our charter with respect to our common stock and other classes of capital stock which may delay, defer or prevent a transaction or a change of control that might involve a premium price for our common stock or might otherwise be in the best interests of our stockholders.
Our charter, subject to certain exceptions, contains restrictions on the ownership and transfer of our common stock and preferred stock that are intended to assist us in preserving our qualification as a REIT. Our charter, provides that any transfer that would cause NHI to be beneficially owned by fewer than 100 persons or would cause NHI to be “closely held” under the Internal Revenue Code would be void, which, subject to certain exceptions, results in no person or entity being allowed to own, actually or constructively, more than 9.9% of the outstanding shares of our stock. Our Board of Directors, in its sole discretion, may exempt a proposed transferee from the ownership limit and such an exemption has been granted through Excepted Holder Agreements to members of the Carl E. Adams family. Based on the Excepted Holder Agreements currently outstanding, the individual ownership limit for all other stockholders is approximately 7.5%. Our charter gives our Board of Directors broad powers to prohibit and rescind any attempted transfer in violation of the ownership limits. These ownership limits may delay, defer or prevent a transaction or a change of control that might involve a premium price for our common stock or might otherwise be in the best interests of our stockholders.
We are subject to certain provisions of Maryland law and our charter and bylaws that could hinder, delay or prevent a change in control transaction, even if the transaction involves a premium price for our common stock or our stockholders believe such transaction to be otherwise in their best interests.
The Maryland Business Combination Act provides that, unless exempted, a Maryland corporation may not engage in business combinations, including mergers, dispositions of 10% or more of its assets, issuances of shares of stock and other specified transactions with an "interested stockholder" or an affiliate of an interested stockholder for five years after the most recent date on which the interested stockholder became an interested stockholder, and thereafter, unless specified criteria are met. An interested stockholder is generally a person owning or controlling, directly or indirectly, 10% or more of the voting power of the outstanding stock of a Maryland corporation. Unless our Board of Directors takes action to exempt us, generally or with respect to certain transactions, from this statute in the future, the Maryland Business Combination Act will be applicable to business combinations between us and other persons. The Company’s Charter and Bylaws also contain certain provisions that could have the effect of making it more difficult for a third party to acquire, or discouraging a third party from attempting to acquire, control of the Company. Such provisions could limit the price that certain investors might be willing to pay in the future for the common stock. These provisions include a staggered board of directors, blank check preferred stock, and the application of Maryland corporate law provisions on business combinations and control shares. The foregoing matters may, together or separately, have the effect of discouraging or making more difficult an acquisition or change of control of the Company.
Other risks.
See the notes to the consolidated financial statements, “Business” under Item 1 and “Legal Proceedings” under Item 3 herein for a discussion of various governmental regulations and operating factors relating to the health care industry and other factors and the risks inherent in them. You should carefully consider each of the foregoing risks before making any investment decisions in the Company. These risks and uncertainties are not the only ones facing us. There may be additional risks that we do not presently know of or that we currently deem immaterial. If any of the risks actually occur, our business, financial condition or results of operations could be materially adversely affected. In that case, the trading price of our shares of stock could decline, and you may lose all or part of your investment. Given these risks and uncertainties, we can give no assurance that any forward-looking statements will, in fact, occur and, therefore, caution investors not to place undue reliance on them.
ITEM 1B. UNRESOLVED STAFF COMMENTS.
None.
18
ITEM 2. PROPERTIES OWNED OR ASSOCIATED WITH MORTGAGE LOAN INVESTMENTS AS OF DECEMBER 31, 2015
Lease (L)/ | Licensed | ||||
Center | City | State | Mortgage (M) | Beds | |
SKILLED NURSING | |||||
NHC HealthCare, Anniston | Anniston | AL | L | 151 | |
NHC HealthCare, Moulton | Moulton | AL | L | 136 | |
Sunbridge Estrella Care & Rehabilitation | Avondale | AZ | L | 161 | |
Ayers Health & Rehabilitation Center | Trenton | FL | L | 120 | |
Bayonet Point Health & Rehabilitation Center | Hudson | FL | L | 180 | |
Bear Creek Nursing Center | Hudson | FL | L | 120 | |
Brooksville Healthcare Center | Brooksville | FL | L | 180 | |
Cypress Cove Care Center | Crystal River | FL | L | 120 | |
Heather Hill Healthcare Center | New Port Richey | FL | L | 120 | |
Parkway Health & Rehabilitation Center | Stuart | FL | L | 177 | |
Royal Oak Nursing Center | Dade City | FL | L | 120 | |
The Health Center of Merritt Island | Merritt Island | FL | L | 180 | |
The Health Center of Plant City | Plant City | FL | L | 180 | |
Grangeville Health and Rehabilitation Center | Grangeville | ID | L | 60 | |
NHC HealthCare, Glasgow | Glasgow | KY | L | 206 | |
Buckley HealthCare Center | Greenfield | MA | L | 120 | |
Holyoke Health Care Center | Holyoke | MA | L | 102 | |
John Adams HealthCare Center | Quincy | MA | L | 71 | |
Longmeadow of Taunton | Taunton | MA | L | 100 | |
NHC Healthcare, Desloge | Desloge | MO | L | 120 | |
NHC Healthcare, Joplin | Joplin | MO | L | 126 | |
NHC Healthcare, Kennett | Kennett | MO | L | 170 | |
NHC Healthcare, Maryland Heights | Maryland Heights | MO | L | 220 | |
NHC HealthCare, St. Charles | St. Charles | MO | L | 120 | |
Maple Leaf HealthCare Center | Manchester | NH | L | 114 | |
Villa Crest HealthCare Center | Manchester | NH | L | 165 | |
Epsom Manor HealthCare Center | Epsom | NH | L | 108 | |
Timberview Care Center | Albany | OR | L | 62 | |
Creswell Health and Rehabilitation Center | Creswell | OR | L | 53 | |
Forest Grove Rehabilitation and Care Center | Forest Grove | OR | L | 81 | |
NHC Healthcare, Anderson | Anderson | SC | L | 290 | |
NHC Healthcare, Greenwood | Greenwood | SC | L | 152 | |
NHC HealthCare, Laurens | Laurens | SC | L | 176 | |
UniHealth Post-Acute Care-Orangeburg | Orangeburg | SC | L | 88 | |
NHC Healthcare, Athens | Athens | TN | L | 98 | |
NHC Healthcare, Chattanooga | Chattanooga | TN | L | 207 | |
NHC HealthCare, Dickson | Dickson | TN | L | 211 | |
NHC HealthCare, Franklin | Franklin | TN | L | 80 | |
NHC Healthcare, Hendersonville | Hendersonville | TN | L | 122 | |
NHC Healthcare, Johnson City | Johnson City | TN | L | 160 | |
NHC Healthcare, Lewisburg | Lewisburg | TN | L | 102 | |
NHC HealthCare, McMinnville | McMinnville | TN | L | 150 | |
NHC HealthCare, Milan | Milan | TN | L | 122 | |
NHC Healthcare, Oakwood | Lewisburg | TN | L | 60 | |
NHC HealthCare, Pulaski | Pulaski | TN | L | 102 | |
NHC Healthcare, Scott | Lawrenceburg | TN | L | 62 | |
NHC HealthCare, Sequatchie | Dunlap | TN | L | 120 | |
19
Lease (L)/ | Licensed | ||||
Center | City | State | Mortgage (M) | Beds | |
SKILLED NURSING | |||||
NHC HealthCare, Smithville | Smithville | TN | L | 120 | |
NHC Healthcare, Somerville | Somerville | TN | L | 84 | |
NHC Healthcare, Sparta | Sparta | TN | L | 120 | |
Canton Oaks | Canton | TX | L | 120 | |
Corinth Rehabilitation Suites | Corinth | TX | L | 134 | |
Legend Healthcare & Rehabilitation | Paris | TX | L | 120 | |
Legend Oaks Healthcare & Rehabilitation Center (East) | Houston | TX | L | 125 | |
Legend Oaks Healthcare & Rehabilitation Center (Northwest) | Houston | TX | L | 125 | |
Legend Oaks Healthcare & Rehabilitation Center | San Antonio | TX | L | 125 | |
Legend Oaks Healthcare & Rehabilitation Center - Ennis | Ennis | TX | L | 124 | |
Legend Healthcare & Rehabilitation | Greenville | TX | L | 125 | |
Legend Oaks Healthcare & Rehabilitation Center | Houston | TX | L | 124 | |
Legend Oaks Healthcare & Rehabilitation Center | Houston | TX | L | 125 | |
Legend Oaks Healthcare & Rehabilitation Center | Kyle | TX | L | 126 | |
Heritage Hall - Brookneal | Brookneal | VA | M | 60 | |
Heritage Hall - Grundy | Grundy | VA | M | 120 | |
Heritage Hall - Laurel Meadows | Laurel Fork | VA | M | 60 | |
Heritage Hall - Virginia Beach | Virginia Beach | VA | M | 90 | |
Heritage Hall - Front Royal | Front Royal | VA | M | 60 | |
Heritage Hall - Lexington | East Lexington | VA | M | 60 | |
NHC HealthCare, Bristol | Bristol | VA | L | 120 | |
ASSISTED LIVING | |||||
Regency Pointe Retirement Community | Rainbow City | AL | L | 120 | |
The Place at Gilbert | Gilbert | AZ | L | 40 | |
The Place at Glendale | Glendale | AZ | L | 38 | |
The Place at Tanque Verde | Tucson | AZ | L | 42 | |
The Place at Tucson | Tucson | AZ | L | 60 | |
Revere Court Memory Care | Sacramento | CA | L | 56 | |
Savannah Court of Bartow | Bartow | FL | L | 30 | |
Savannah Court of Lakeland | Lakeland | FL | L | 30 | |
Indigo Palms at Maitland | Maitland | FL | L | 116 | |
Discovery Village at Naples | Naples | FL | M | 120 | |
Savannah Court of St. Cloud | St. Cloud | FL | L | 30 | |
Savannah Court at Lake Oconee | Greensboro | GA | L | 64 | |
Bickford of Ames | Ames | IA | L | 37 | |
Bickford of Burlington | Burlington | IA | L | 44 | |
Bickford of Cedar Falls | Cedar Falls | IA | L | 42 | |
Bickford of Clinton | Clinton | IA | L | 37 | |
Bickford of Ft. Dodge | Ft. Dodge | IA | L | 38 | |
Bickford of Iowa City | Iowa City | IA | L | 37 | |
Bickford of Marshalltown | Marshalltown | IA | L | 38 | |
Bickford of Muscatine | Muscatine | IA | L | 45 | |
Bickford of Urbandale | Urbandale | IA | L | 61 | |
Prestige Assisted Living at Autumn Wind | Caldwell | ID | L | 105 | |
Indianhead Estates | Weiser | ID | L | 25 | |
Bickford of Aurora* | Aurora | IL | L | — | |
Bickford of Bourbonnais | Bourbonnais | IL | L | 65 | |
Bickford of Moline | Moline | IL | L | 28 | |
Bickford of Peoria | Peoria | IL | L | 32 | |
Bickford of Quincy | Quincy | IL | L | 46 | |
20
Lease (L)/ | Licensed | ||||
Center | City | State | Mortgage (M) | Beds | |
ASSISTED LIVING | |||||
Bickford of Rockford | Rockford | IL | L | 65 | |
Bickford of Springfield | Springfield | IL | L | 67 | |
Bickford of Tinley Park* | Tinley Park | IL | L | — | |
Bickford of Carmel | Carmel | IN | L | 60 | |
Bickford of Crawfordsville | Crawfordsville | IN | L | 28 | |
Bickford of Crown Point | Crown Point | IN | L | 60 | |
Bickford of Greenwood | Greenwood | IN | L | 60 | |
Bickford of Lafayette | LaFayette | IN | L | 28 | |
Bickford of Wabash | Wabash | IN | L | 28 | |
Bickford of Mission Springs | Mission | KS | L | 91 | |
Bickford of Overland Park | Overland Park | KS | L | 79 | |
West Monroe Arbors | West Monroe | LA | L | 59 | |
Bossier Arbors | Bossier City | LA | L | 60 | |
Bastrop Arbors | Bastrop | LA | L | 38 | |
Minden Arbors | Minden | LA | L | 26 | |
The Woodlands Assisted Living | Baltimore | MD | L | 70 | |
Bickford of Battle Creek | Battle Creek | MI | L | 46 | |
Bickford of Lansing | Lansing | MI | L | 46 | |
Bickford of Midland | Midland | MI | L | 46 | |
Bickford of Saginaw | Saginaw | MI | L | 46 | |
Traditions | Owatonna | MN | M | 70 | |
Gracewood Champlin | Champlin | MN | L | 30 | |
Gracewood Hugo | Hugo | MN | L | 24 | |
Gracewood Maplewood | Maplewood | MN | L | 42 | |
Gracewood North Branch | North Branch | MN | L | 30 | |
Regency Retirement Village | Charlotte | NC | L | 112 | |
Bickford of Grand Island | Grand Island | NE | L | 37 | |
Bickford of Lincoln | Lincoln | NE | L | 44 | |
Bickford of Omaha Hickory | Omaha | NE | L | 37 | |
Bickford of Lancaster | Lancaster | OH | L | 92 | |
Halcyon Village | Marysville | OH | L | 76 | |
Bickford of Middletown | Middletown | OH | L | 101 | |
Clackamas View | Milwaukie | OR | L | 25 | |
Dorian Place | Ontario | OR | L | 44 | |
Wellsprings | Ontario | OR | L | 32 | |
Golden Age Center | Portland | OR | L | 29 | |
The Place at Conway | Conway | SC | L | 52 | |
The Place at Gallatin | Gallatin | TN | L | 49 | |
The Place at Kingsport | Kingsport | TN | L | 49 | |
The Place at Tullahoma | Tullahoma | TN | L | 49 | |
Bickford of Spotsylvania* | Fredericksburg | VA | L | — | |
Bickford of Chesterfield* | Midlothian | VA | L | — | |
Charleston House | Beaver Dam | WI | L | 120 | |
INDEPENDENT LIVING | |||||
Apple Blossom Independent Senior Living Community | Rogers | AR | L | 119 | |
Butterfield Place Independent Senior Living Community | Fort Smith | AR | L | 117 | |
Bay Park Independent Senior Living Community | Pinole | CA | L | 98 | |
Bridgecreek Independent Senior Living Community | West Covina | CA | L | 108 | |
Camelot Independent Senior Living Community | Hemet | CA | L | 136 | |
Fig Garden Independent Senior Living Community | Fresno | CA | L | 103 | |
21
Lease (L)/ | Licensed | ||||
Center | City | State | Mortgage (M) | Beds | |
INDEPENDENT LIVING | |||||
Hampshire Independent Senior Living Community | Merced | CA | L | 115 | |
Mistywood Independent Senior Living Community | Roseville | CA | L | 117 | |
Standiford Place Independent Senior Living Community | Modesto | CA | L | 121 | |
Iris Place Independent Senior Living Community | Athens | GA | L | 142 | |
Riverplace Independent Senior Living Community | Columbus | GA | L | 114 | |
River's Edge Independent Senior Living Community | Savannah | GA | L | 121 | |
Chateau De Boise Independent Senior Living Community | Boise | ID | L | 97 | |
Arbor Glen Independent Senior Living Community | Fort Wayne | IN | L | 120 | |
Nouveau Marc Independent Senior Living Community | Kenner | LA | L | 113 | |
Lake St. Charles Retirement Center | St. Charles | MO | L | 180 | |
Yardley Commons Independent Senior Living Community | Voorhees | NJ | L | 107 | |
Worthington Independent Senior Living Community | Gahanna | OH | L | 117 | |
Silver Arrow Estates Independent Senior Living Community | Broken Arrow | OK | L | 126 | |
Astor House Independent Senior Living Community | Newberg | OR | L | 121 | |
Eagle Crest Independent Senior Living Community | Myrtle Beach | SC | L | 120 | |
Westminster Independent Senior Living Community | Greenville | SC | L | 117 | |
Colonial Hill Retirement Center | Johnson City | TN | L | 63 | |
Parkwood Retirement Apartments | Chattanooga | TN | L | 30 | |
Bedford Independent Senior Living Community | Vancouver | WA | L | 103 | |
Garden Club Independent Senior Living Community | Bellevue | WA | L | 105 | |
Kamlu Retirement Inn Independent Senior Living Community | Vancouver | WA | L | 83 | |
Orchard Park Independent Senior Living Community | Yakima | WA | L | 101 | |
SENIOR LIVING CAMPUS | |||||
Linda Valley Care Center | Loma Linda | CA | L | 181 | |
Savannah Court of Maitland | Maitland | FL | L | 151 | |
Savannah Court of Palm Beaches | W. Palm Beach | FL | L | 144 | |
Sunbridge Retirement & Rehab for Nampa | Nampa | ID | L | 183 | |
Morningside of College Park Senior Living Community | Indianapolis | IN | L | 153 | |
Brook of Roscommon | Roscommon | MI | L | 42 | |
Ridgecrest | Mt. Airy | NC | L | 84 | |
Maybelle Carter Retirement Life Community | Madison | TN | L | 148 | |
Sante Silverdale | Silverdale | WA | L | 138 | |
ENTRANCE FEE COMMUNITY | |||||
Osprey Village at Amelia Island Plantation | Fernandina | FL | L | 170 | |
Marsh's Edge on St. Simmons Island | St. Simons Island | GA | L | 192 | |
Homestead Hills | Winston-Salem | NC | L | 248 | |
Cascades Verdae | Greenville | SC | L | 315 | |
Brightwater | Myrtle Beach | SC | L | 229 | |
The Lakes at Litchfield | Pawleys Island | SC | L | 208 | |
Summit Hills | Spartanburg | SC | L | 225 | |
Timber Ridge at Talus | Issaquah | WA | M | 400 | |
HOSPITAL | |||||
Alvarado Parkway Institute | La Mesa | CA | L | 66 | |
Kentucky River Hospital | Jackson | KY | L | 55 | |
TrustPoint Hospital (Polaris) | Murfreesboro | TN | L | 60 | |
MEDICAL OFFICE | Sq. Ft. | ||||
North Okaloosa | Crestview | FL | L | 27,017 | |
22
Lease (L)/ | |||||
Center | City | State | Mortgage (M) | Sq. Ft. | |
MEDICAL OFFICE | |||||
Pasadena Bayshore | Pasadena | TX | L | 61,500 | |
CORPORATE OFFICE | Murfreesboro | TN | N/A | 7,000 | |
* Under construction | |||||
10-YEAR LEASE EXPIRATIONS
The following table provides additional information on our leases which are scheduled to expire based on the maturity date contained in the most recent lease agreement or extension. We expect that, prior to maturity, we will negotiate new terms of a lease to either the current tenant or another qualified operator.
Annualized | Percentage of | |||||||||||
Leases | Rentable | Number | Gross Rent** | Annualized | ||||||||
Year | Expiring | Square Feet* | of Units/Beds | (in thousands) | Gross Rent | |||||||
2016 | 2 | — | 211 | 1,642 | .9 | % | ||||||
2017 | 8 | — | 1,040 | 9,063 | 4.7 | % | ||||||
2018 | 2 | 61,500 | 88 | 1,080 | .6 | % | ||||||
2019 | — | — | — | — | — | % | ||||||
2020 | 6 | 27,017 | 224 | 2,804 | 1.5 | % | ||||||
2021 | 2 | — | 344 | 1,904 | 1.0 | % | ||||||
2022 | 4 | — | 156 | 4,222 | 2.2 | % | ||||||
2023 | 2 | — | 254 | 3,351 | 1.7 | % | ||||||
2024 | 8 | — | 379 | 4,284 | 2.2 | % | ||||||
2025 | 9 | — | 647 | 10,239 | 5.3 | % | ||||||
Thereafter | 101 | — | 12,596 | 152,939 | 79.9 | % | ||||||
*Rentable Square Feet represents total square footage in two MOB investments.
**Annualized Gross Rent refers to the amount of lease revenue that our portfolio would generate if all leases were in effect for the twelve-month calendar year, regardless of the commencement date, maturity date, or renewals.
ITEM 3. LEGAL PROCEEDINGS
Our facilities are subject to claims and suits in the ordinary course of business. Our lessees and borrowers have indemnified, and are obligated to continue to indemnify us, against all liabilities arising from the operation of the facilities, and are further obligated to indemnify us against environmental or title problems affecting the real estate underlying such facilities. While there may be lawsuits pending against certain of the owners and/or lessees of the facilities, management believes that the ultimate resolution of all such pending proceedings will have no material adverse effect on our financial condition, results of operations or cash flows.
ITEM 4. MINE SAFETY DISCLOSURES
Not Applicable
23
PART II.
ITEM 5. MARKET FOR REGISTRANT’S COMMON EQUITY, RELATED STOCKHOLDER MATTERS AND ISSUER PURCHASES OF EQUITY SECURITIES.
The Company’s charter contains certain provisions which are designed to ensure that the Company’s status as a REIT is protected for federal income tax purposes. One of these provisions provides that any transfer that would cause NHI to be beneficially owned by fewer than 100 persons or would cause NHI to be “closely held” under the IRS Code would be void, which, subject to certain exceptions, results in no stockholder being allowed to own, either directly or indirectly pursuant to certain tax attribution rules, more than 9.9% of the Company’s stock. In 1991, the Board created an exception to this ownership limitation for Dr. Carl E. Adams, his spouse, Jennie Mae Adams, and their lineal descendants. Effective May 12, 2008, we entered into Excepted Holder Agreements with W. Andrew Adams and certain members of his family. These written agreements are intended to restate and replace the parties’ prior verbal agreement. Based on the Excepted Holder Agreements currently outstanding, the individual ownership limit for all other stockholders is approximately 7.5%. Our charter gives our Board of Directors broad powers to prohibit and rescind any attempted transfer in violation of the ownership limits. These agreements were entered into in connection with the Company’s announcement in 2008 of a stock purchase program pursuant to which the Company subsequently purchased 194,100 shares of its common stock in the public market from its stockholders.
A separate agreement was entered into with each of the spouse and children of Dr. Carl E. Adams and others within Mr. W. Andrew Adams’ family. We needed to enter into such an agreement with each family member because of the complicated ownership attribution rules under the Internal Revenue Code. The agreement permits the Excepted Holders to own stock in excess of 9.9% up to the limit specifically provided in the individual agreement and not lose rights with respect to such shares. However, if the stockholder’s stock ownership exceeds the limit, then such shares in excess of the limit become “Excess Stock” and lose voting rights and entitlement to receive dividends. The Excess Stock classification remains in place until the stockholder no longer exceeds the threshold limit specified in the Agreement. The purpose of these agreements is to ensure that the Company does not violate the prohibition against a REIT being closely held.
W. Andrew Adams’ Excess Holder Agreement also provides that he will not own shares of stock in any tenant of the Company if such ownership would cause the Company to constructively own more than a 9.9% interest in such tenant. Again, this prohibition is designed to protect the Company’s status as a REIT for tax purposes.
In order to qualify for the beneficial tax treatment accorded to a REIT, we must make distributions to holders of our common stock equal on an annual basis to at least 90% of our REIT taxable income (excluding net capital gains), as defined in the Internal Revenue Code. Cash available for distribution to our stockholders is primarily derived from interest payments received on our notes and from rental payments received under our leases. All distributions will be made by us at the discretion of the Board of Directors and will depend on our cash flow and earnings, our financial condition, bank covenants contained in our financing documents and such other factors as the Board of Directors deems relevant. Our REIT taxable income is calculated without reference to our cash flow. Therefore, under certain circumstances, we may not have received cash sufficient to pay our required distributions.
Our common stock is traded on the New York Stock Exchange under the symbol “NHI”. As of February 16, 2016, there were approximately 774 holders of record of shares and approximately 26,707 beneficial owners of shares.
High and low stock prices of our common stock on the New York Stock Exchange and dividends declared for the last two years were:
2015 | 2014 | |||||||||||||||||||
Sales Price | Cash Dividends Declared | Sales Price | Cash Dividends Declared | |||||||||||||||||
Quarter Ended | High | Low | High | Low | ||||||||||||||||
March 31 | $ | 76.98 | $ | 66.90 | $.85 | $ | 63.53 | $ | 54.75 | $.77 | ||||||||||
June 30 | 72.77 | 61.64 | .85 | 64.84 | 58.85 | .77 | ||||||||||||||
September 30 | 66.28 | 53.64 | .85 | 65.29 | 57.00 | .77 | ||||||||||||||
December 31 | 62.40 | 55.56 | .85 | 71.75 | 56.53 | .77 | ||||||||||||||
The closing price of our stock on February 16, 2016 was $57.81.
24
We currently maintain two equity compensation plans: the 2005 Stock Option, Restricted Stock and Stock Appreciation Rights Plan (“the 2005 Plan”) and the 2012 Stock Incentive Plan ("the 2012 Plan"). These plans, as amended, have been approved by our stockholders. The following table provides information as of December 31, 2015 about our common stock that may be issued upon grants of restricted stock and the exercise of options under our existing equity compensation plans.
Number of securities to be issued upon exercise of outstanding options, warrants and rights | Weighted-average exercise price of outstanding options, warrants and rights | Number of securities remaining available for future issuance under equity compensation plans (excluding securities reflected in the first column) | ||||
Equity compensation plans approved | ||||||
by security holders | 741,676 | $65.84 | 1,916,6681 | |||
The following graph demonstrates the performance of the cumulative total return to the stockholders of our common stock during the previous five years in comparison to the cumulative total return on the MSCI US REIT Index and the Standard & Poor’s 500 Stock Index. The MSCI US REIT Index is a free float-adjusted market capitalization weighted index that is comprised of Equity REIT securities. The MSCI US REIT Index includes securities with exposure to core real estate (e.g.residential and retail properties) as well as securities with exposure to other types of real estate (e.g.casinos, theaters).
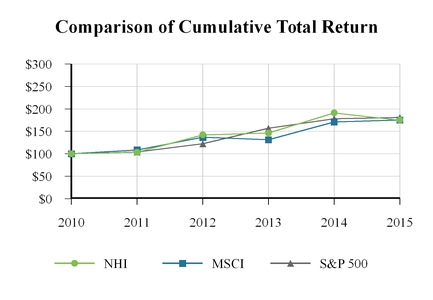
2010 | 2011 | 2012 | 2013 | 2014 | 2015 | |
NHI | $100.00 | $103.27 | $141.97 | $146.03 | $191.00 | $174.91 |
MSCI | $100.00 | $108.69 | $136.69 | $131.17 | $171.01 | $175.32 |
S&P 500 | $100.00 | $103.69 | $122.14 | $156.82 | $178.28 | $180.75 |
25
ITEM 6. SELECTED FINANCIAL DATA.
The following table represents our financial information for the five years ended December 31, 2015. This financial information has been derived from our historical financial statements including those for the most recent three years included elsewhere in this Annual Report on Form 10-K and should be read in conjunction with those consolidated financial statements, accompanying footnotes and Management’s Discussion and Analysis of Financial Condition and Results of Operations in Item 7. Prior period financial information has been reclassified for presentation of operations discontinued in 2013 as described in the notes to the consolidated financial statements. These reclassifications had no impact on previously reported net income.
(in thousands, except share and per share amounts) | |||||||||||||||||||
Years Ended December 31, | |||||||||||||||||||
STATEMENT OF INCOME DATA: | 2015 | 2014 | 2013 | 2012 | 2011 | ||||||||||||||
Revenues | $ | 228,988 | $ | 177,509 | $ | 117,828 | $ | 93,317 | $ | 83,739 | |||||||||
Income from continuing operations | 150,314 | 103,052 | 79,498 | 72,834 | 69,817 | ||||||||||||||
Discontinued operations: | |||||||||||||||||||
Income from operations - discontinued | — | — | 5,426 | 6,098 | 7,967 | ||||||||||||||
Gain on sales of real estate | — | — | 22,258 | 11,966 | 3,348 | ||||||||||||||
Net income | 150,314 | 103,052 | 107,182 | 90,898 | 81,132 | ||||||||||||||
Net income attributable to noncontrolling interest | (1,452 | ) | (1,443 | ) | (999 | ) | (167 | ) | — | ||||||||||
Net income attributable to common stockholders | $ | 148,862 | $ | 101,609 | $ | 106,183 | $ | 90,731 | $ | 81,132 | |||||||||
PER SHARE DATA: | |||||||||||||||||||
Basic earnings per common share: | |||||||||||||||||||
Income from continuing operations | $ | 3.96 | $ | 3.04 | $ | 2.77 | $ | 2.61 | $ | 2.52 | |||||||||
Discontinued operations | — | — | .97 | .65 | .41 | ||||||||||||||
Net income attributable to common stockholders | $ | 3.96 | $ | 3.04 | $ | 3.74 | $ | 3.26 | $ | 2.93 | |||||||||
Diluted earnings per common share: | |||||||||||||||||||
Income from continuing operations | $ | 3.95 | $ | 3.04 | $ | 2.77 | $ | 2.61 | $ | 2.51 | |||||||||
Discontinued operations | — | — | .97 | .65 | .41 | ||||||||||||||
Net income attributable to common stockholders | $ | 3.95 | $ | 3.04 | $ | 3.74 | $ | 3.26 | $ | 2.92 | |||||||||
OTHER DATA: | |||||||||||||||||||
Common shares outstanding, end of year | 38,396,727 | 37,485,902 | 33,051,176 | 27,857,217 | 27,751,208 | ||||||||||||||
Weighted average common shares: | |||||||||||||||||||
Basic | 37,604,594 | 33,375,966 | 28,362,398 | 27,811,813 | 27,719,096 | ||||||||||||||
Diluted | 37,644,171 | 33,416,014 | 28,397,702 | 27,838,720 | 27,792,592 | ||||||||||||||
Regular dividends declared per common share | $ | 3.40 | $ | 3.08 | $ | 2.90 | $ | 2.64 | $ | 2.495 | |||||||||
Special dividends declared per common share | $ | — | $ | — | $ | — | $ | .22 | $ | .22 | |||||||||
BALANCE SHEET DATA: (at year end) | |||||||||||||||||||
Mortgages and other notes receivable, net | $ | 135,031 | $ | 63,630 | $ | 60,639 | $ | 84,250 | $ | 78,672 | |||||||||
Real estate properties, net | $ | 1,836,807 | $ | 1,776,549 | $ | 1,247,740 | $ | 535,390 | $ | 394,795 | |||||||||
Investments in preferred stock and marketable securities | $ | 72,744 | $ | 53,635 | $ | 50,782 | $ | 51,016 | $ | 49,496 | |||||||||
Assets held for sale, net | $ | 1,346 | $ | — | $ | — | $ | 1,611 | $ | 29,381 | |||||||||
Total assets | $ | 2,146,349 | $ | 1,982,960 | $ | 1,455,820 | $ | 705,981 | $ | 579,563 | |||||||||
Debt | $ | 926,257 | $ | 862,726 | $ | 617,080 | $ | 203,250 | $ | 97,300 | |||||||||
Total equity | $ | 1,142,460 | $ | 1,049,933 | $ | 777,160 | $ | 468,047 | $ | 443,485 | |||||||||
26
ITEM 7. MANAGEMENT’S DISCUSSION AND ANALYSIS OF FINANCIAL CONDITION AND RESULTS OF OPERATIONS.
The following discussion and analysis is based primarily on the consolidated financial statements of National Health Investors, Inc. for the periods presented and should be read together with the notes thereto contained in this Annual Report on Form 10-K. Other important factors are identified in “Item 1. Business” and “Item 1A. Risk Factors” above.
Executive Overview
National Health Investors, Inc., is a self-managed real estate investment trust ("REIT") specializing in sale-leaseback, joint-venture, mortgage and mezzanine financing of need-driven and discretionary senior housing and medical investments. Our portfolio consists of real estate investments in independent living facilities, assisted living facilities, entrance-fee communities, senior living campuses, skilled nursing facilities, specialty hospitals and medical office buildings. Other investments include mortgages and other notes, marketable securities, and a joint venture structured to comply with the provisions of the REIT Investment Diversification Empowerment Act of 2007 (“RIDEA”). Through a RIDEA joint venture, we invest in facility operations managed by independent third-parties. We fund our real estate investments primarily through: (1) operating cash flow, (2) debt offerings, including bank lines of credit and term debt, both unsecured and secured, and (3) the sale of equity securities.
Portfolio
At December 31, 2015, we had investments in real estate and mortgage and other notes receivable involving 189 facilities located in 31 states. These investments involve 116 senior housing properties, 68 skilled nursing facilities, 3 hospitals, 2 medical office buildings and other notes receivable. These investments (excluding pre-development costs of $168,000 and our corporate office of $920,000) consisted of properties with an original cost of approximately $2,094,778,000, rented under triple-net leases to 26 lessees, and $135,031,000 aggregate carrying value of mortgage and other notes receivable due from 14 borrowers.
We classify the properties in our portfolio as either senior housing or medical properties. We further classify our senior housing properties as either need-driven (assisted living facilities and senior living campuses) or discretionary (independent living facilities and entrance-fee communities.) Medical properties within our portfolio include skilled nursing facilities, medical office buildings and specialty hospitals.
27
The following tables summarize our investments in real estate and mortgage and other notes receivable as of December 31, 2015 (dollars in thousands):
Real Estate Properties | Properties | Beds/Sq. Ft.* | Revenue | % | Investment | |||||||||||||
Senior Housing - Need-Driven | ||||||||||||||||||
Assisted Living | 69 | 3,377 | $ | 44,597 | 19.9 | % | $ | 504,428 | ||||||||||
Senior Living Campus | 9 | 1,224 | 10,415 | 4.6 | % | 134,379 | ||||||||||||
Total Senior Housing - Need-Driven | 78 | 4,601 | 55,012 | 24.5 | % | 638,807 | ||||||||||||
Senior Housing - Discretionary | ||||||||||||||||||
Independent Living | 28 | 3,114 | 45,139 | 20.1 | % | 502,611 | ||||||||||||
Entrance-Fee Communities | 7 | 1,587 | 38,689 | 17.2 | % | 467,160 | ||||||||||||
Total Senior Housing - Discretionary | 35 | 4,701 | 83,828 | 37.4 | % | 969,771 | ||||||||||||
Total Senior Housing | 113 | 9,302 | 138,840 | 61.9 | % | 1,608,578 | ||||||||||||
Medical Facilities | ||||||||||||||||||
Skilled Nursing Facilities | 62 | 8,061 | 66,874 | 29.8 | % | 424,582 | ||||||||||||
Hospitals | 3 | 181 | 7,732 | 3.4 | % | 51,131 | ||||||||||||
Medical Office Buildings | 2 | 88,517 | * | 1,001 | 0.4 | % | 10,487 | |||||||||||
Total Medical Facilities | 67 | 75,607 | 33.7 | % | 486,200 | |||||||||||||
Total Real Estate Properties | 180 | $ | 214,447 | 95.6 | % | $ | 2,094,778 | |||||||||||
Mortgage and Other Notes Receivable | ||||||||||||||||||
Senior Housing - Need-Driven | 2 | 190 | $ | 757 | 0.3 | % | $ | 6,093 | ||||||||||
Senior Housing - Discretionary | 1 | 400 | 3,569 | 1.6 | % | 83,411 | ||||||||||||
Medical Facilities | 6 | 450 | 1,868 | 0.8 | % | 12,937 | ||||||||||||
Other Notes Receivable | — | — | 3,784 | 1.7 | % | 32,590 | ||||||||||||
Total Mortgage and Other Notes Receivable | 9 | 1,040 | 9,978 | 4.4 | % | 135,031 | ||||||||||||
Total Portfolio | 189 | $ | 224,425 | 100.0 | % | $ | 2,229,809 | |||||||||||
Portfolio Summary | Properties | Beds/Sq. Ft.* | Revenue | % | Investment | |||||||||||||
Real Estate Properties | 180 | $ | 214,447 | 95.6 | % | $ | 2,094,778 | |||||||||||
Mortgage and Other Notes Receivable | 9 | 9,978 | 4.4 | % | 135,031 | |||||||||||||
Total Portfolio | 189 | $ | 224,425 | 100.0 | % | $ | 2,229,809 | |||||||||||
Summary of Facilities by Type | ||||||||||||||||||
Senior Housing - Need-Driven | ||||||||||||||||||
Assisted Living | 71 | 3,567 | $ | 45,354 | 20.2 | % | $ | 510,521 | ||||||||||
Senior Living Campus | 9 | 1,224 | 10,415 | 4.6 | % | 134,379 | ||||||||||||
Total Senior Housing - Need-Driven | 80 | 4,791 | 55,769 | 24.8 | % | 644,900 | ||||||||||||
Senior Housing - Discretionary | ||||||||||||||||||
Entrance-Fee Communities | 8 | 1,987 | 42,258 | 18.8 | % | 550,571 | ||||||||||||
Independent Living | 28 | 3,114 | 45,139 | 20.1 | % | 502,611 | ||||||||||||
Total Senior Housing - Discretionary | 36 | 5,101 | 87,397 | 38.9 | % | 1,053,182 | ||||||||||||
Total Senior Housing | 116 | 9,892 | 143,166 | 63.7 | % | 1,698,082 | ||||||||||||
Medical Facilities | ||||||||||||||||||
Skilled Nursing Facilities | 68 | 8,511 | 68,168 | 30.4 | % | 437,520 | ||||||||||||
Hospitals | 3 | 181 | 8,306 | 3.7 | % | 51,131 | ||||||||||||
Medical Office Buildings | 2 | 88,517 | * | 1,001 | 0.5 | % | 10,486 | |||||||||||
Total Medical | 73 | 77,475 | 34.6 | % | 499,137 | |||||||||||||
Other | — | 3,784 | 1.7 | % | 32,590 | |||||||||||||
Total Portfolio | 189 | $ | 224,425 | 100.0 | % | $ | 2,229,809 | |||||||||||
Portfolio by Operator Type | ||||||||||||||||||
Public | 53 | $ | 46,100 | 20.6 | % | $ | 235,748 | |||||||||||
National Chain (Privately-Owned) | 27 | 49,378 | 22.0 | % | 521,139 | |||||||||||||
Regional | 97 | 118,095 | 52.6 | % | 1,340,612 | |||||||||||||
Small | 12 | 10,852 | 4.8 | % | 132,310 | |||||||||||||
Total Portfolio | 189 | $ | 224,425 | 100.0 | % | $ | 2,229,809 | |||||||||||
28
For the year ended December 31, 2015, operators of facilities which provided more than 3% of our total revenues were (in alphabetical order): Bickford Senior Living; Fundamental; Health Services Management; Holiday Retirement; Legend Healthcare; National HealthCare Corporation; and Senior Living Communities.
As of December 31, 2015, our average effective annualized rental income was $8,022 per bed for SNFs, $13,817 per unit for ALFs, $14,495 per unit for ILFs, $24,379 per unit for EFCs, $42,718 per bed for hospitals, and $11 per square foot for MOBs.
We currently invest a portion of our funds in highly liquid marketable securities, including the common shares of other publicly held healthcare REITs. At December 31, 2015, such investments had a carrying value of $72,744,000.
Areas of Focus
On December 16, 2015, the Federal Open Market Committee of the Federal Reserve announced an increase in the federal funds rate by 25 basis points. The anticipation of this first increase in the federal funds rate since 2006 has been a primary source of much volatility in REIT equity markets. While the impact of the rate hike on the operations of the REIT industry has been a modest rise in debt costs, its impending announcement was foreshadowed by a sharp decline in REIT market capitalization in 2015, including NHI's share price.
We are evaluating and will potentially make additional investments during 2016 while we continue to monitor and improve our existing properties. We seek tenants who will become mission-oriented partners in relationships where our business goals are aligned. This approach fuels steady, and thus, enduring growth for those partners and for NHI. Within the context of our growth model, we rely on a cost-effective access to debt and equity capital to finance acquisitions that will drive our earnings. However, while our debt costs have risen modestly, and our stock prices have declined sharply over recent months due to the prospect of rising interest rates, large-scale portfolios continue to command premium pricing, due to the continued abundance of private and foreign buyers seeking to invest in healthcare real estate. This combination of circumstances places a premium on our ability to execute those larger transactions that will generate meaningful earnings growth.
We expect rising capital costs will continue to be a challenge for us in 2016, particularly as healthcare real estate prices remain near historically high levels. Earnings growth may slow while we fight these headwinds by targeting smaller portfolios and one-off acquisitions.
With lower capitalization rates for existing healthcare facilities, there has been increased interest in constructing new facilities in hopes of generating better returns on invested capital. Using our relationship-driven model, we continue to look for opportunities to support new and existing tenants and borrowers with the capital needed to expand existing facilities and to initiate ground-up development of new facilities. We concentrate our efforts in those markets where there is both a demonstrated demand for a particular product type and where we perceive our competitive advantage. The projects we agree to finance have attractive upside potential and are expected to provide above-average returns to our shareholders to mitigate the risks inherent with property development and construction.
As longer term borrowing rates increase, there will be pressure on the spread between our cost of capital and the returns we earn. We expect that pressure to be partially mitigated by market forces that would tend to result in higher capitalization rates for healthcare assets and higher lease rates indicative of historical levels. Our cost of capital has increased as we transition some of our short term revolving borrowings into debt instruments with longer maturities and fixed interest rates. Managing long-term risk involves trade-offs with the competing goal of maximizing short-term profitability. Our intention is to strike an appropriate balance between these competing interests within the context of our investor profile. We presently prefer private placement debt over an offering of bond debt due to its favorable pricing.
For the year ended December 31, 2015, approximately 30% of our revenue from continuing operations has come from operators of our skilled nursing facilities that receive a significant portion of their revenue from governmental payors, primarily Medicare and Medicaid. Such revenues are subject annually to statutory and regulatory changes, and in recent years, have been reduced due to federal and state budgetary pressures. In 2009, we began to diversify our portfolio by directing a significant portion of our investments into properties which do not rely primarily on Medicare and Medicaid reimbursement, but rather on private pay sources (assisted living and memory care facilities, senior living campuses, independent living facilities and entrance-fee communities). While we will occasionally acquire skilled nursing facilities in good physical condition with a proven operator and strong local market fundamentals, our recent investment focus has been on acquiring need-driven and discretionary senior housing assets.
Considering individual tenant lease revenue as a percentage of total revenue, Bickford Senior Living is our largest assisted living tenant, an affiliate of Holiday Retirement is our largest independent living tenant, National HealthCare Corporation is our
29
largest skilled nursing tenant and Senior Living Communities is our largest entrance-fee community tenant. Our shift toward private payor facilities, as well as our expansion into the discretionary senior housing market, has further resulted in a portfolio that is relatively balanced between medical facilities, need-driven and discretionary senior housing.
In 2015, we utilized our at-the market ("ATM") equity program whereby we sold common shares as a useful tool in the ongoing rebalancing of our capital structure. ATMs are a type of shelf-based offering which provide issuers the ability to sell publicly traded shares at the prevailing market price at the time and amount of their choosing. An ATM program offers an effective way to match-fund our smaller acquisitions by exercising control over the timing and size of transactions at a more favorable cost of capital as compared to larger follow-on offerings. During the November and December, we raised $49,389,000 in new common equity capital, after underwriting discounts and offering expenses, by issuing 830,506 common shares at an average price of $60.33 per share. With the use of these funds to pay down our line of credit, the additional capital has immediately served to rebalance our leverage and keep our options flexible for further expansion. We continue to explore other various funding sources including bank term loans, convertible debt, traditional equity placement, unsecured bonds and senior notes, debt private placement and secured government agency financing.
We manage our business with a goal of increasing the regular annual dividends paid to shareholders. Our Board of Directors approves a regular quarterly dividend which is reflective of expected taxable income on a recurring basis. Our transactions that are infrequent and non-recurring that generate additional taxable income have been distributed to shareholders in the form of special dividends. Taxable income is determined in accordance with the Internal Revenue Code and differs from net income for financial statements purposes determined in accordance with U.S. generally accepted accounting principles. Our goal of increasing annual dividends requires a careful balance between identification of high-quality lease and mortgage assets in which to invest and the cost of our capital with which to fund such investments. We consider the competing interests of short and long-term debt (interest rates, maturities and other terms) versus the higher cost of new equity. We accept some level of risk associated with leveraging our investments. We intend to continue to make new investments that meet our underwriting criteria and where the spreads over our cost of capital will generate sufficient returns to our shareholders.
Our dividends per common share for the last three years ended December 31, are as follows:
2015 | 2014 | 2013 | ||||||||
$ | 3.40 | $ | 3.08 | $ | 2.90 | |||||
Our investments in healthcare real estate have been partially accomplished by our ability to effectively leverage our balance sheet. However, we continue to maintain a relatively low leverage balance sheet compared with the value of our assets and with many in our peer group. We believe that our (a) fixed charge coverage ratio, which is the ratio of Adjusted EBITDA (earnings before interest, taxes, depreciation and amortization, including amounts in discontinued operations, excluding real estate asset impairments and gains on dispositions) to fixed charges (interest expense at contractual rates net of capitalized interest and principal payments on debt), and (b) the ratio of consolidated net debt to Adjusted EBITDA are meaningful measures of our ability to service our debt. We use these two measures as a useful basis to compare the strength of our balance sheet with those in our peer group. We also believe this gives us a competitive advantage when accessing debt markets.
We calculate our fixed charge coverage ratio as approximately 6.1x for the twelve months ended December 31, 2015 (see page 50 for a discussion of Adjusted EBITDA and a reconciliation to our net income). On an annualized basis, our consolidated net debt-to-Adjusted EBITDA ratio is 4.2x.
According to current projections by the U.S. Department of Health and Human Services, the number of Americans 65 and older is expected to grow 36% between 2010 and 2020, compared to a 9% growth rate for the general population. An increase in this age demographic is expected to increase demand for senior housing properties of all types in the coming decades. There is increasing demand for private-pay senior housing properties in countries outside the U.S., as well. We therefore consider real estate and note investments with U.S. entities who seek to expand their senior housing operations into countries where local-market demand is sufficiently demonstrated.
Strong demographic trends provide the context for continued growth in 2016 and the years ahead. We plan to fund any new real estate and mortgage investments during 2016 using our liquid assets and debt financing. Should the weight of additional debt as a result of new acquisitions suggest the need to rebalance our capital structure, we would then expect to access the capital markets through an ATM or other equity offerings. Our disciplined investment strategy implemented through measured increments of debt and equity sets the stage for annual dividend growth, continued low leverage, a portfolio of diversified, high-quality assets, and business relationships with experienced tenants and borrowers who we make our priority. These continue to be the key drivers of our business plan.
30
Critical Accounting Policies
We prepare our consolidated financial statements in conformity with accounting principles generally accepted in the United States of America. These accounting principles require us to make estimates and assumptions that affect the reported amounts of assets and liabilities and disclosure of contingent assets and liabilities at the date of the financial statements and the reported amounts of revenues and expenses during the reporting period. Actual results could differ from those estimates and cause our reported net income to vary significantly from period to period. If actual experience differs from the assumptions and other considerations used in estimating amounts reflected in our consolidated financial statements, the resulting changes could have a material adverse effect on our consolidated results of operations, liquidity and/or financial condition.
We consider an accounting estimate or assumption critical if:
1. | the nature of the estimates or assumptions is material due to the levels of subjectivity and judgment necessary to account for highly uncertain matters or the susceptibility of such matters to change; and |
2. | the impact of the estimates and assumptions on financial condition or operating performance is material. |
Our significant accounting policies and the associated estimates, judgments and the issues which impact these estimates are as follows:
Valuations and Impairments
Our tenants and borrowers who operate SNFs derive their revenues primarily from Medicare, Medicaid and other government programs. Amounts paid under these government programs are subject to legislative and government budget constraints. From time to time, there may be material changes in government reimbursement. In the past, SNFs have experienced material reductions in government reimbursement.
The long-term health care industry has experienced significant professional liability claims which has resulted in an increase in the cost of insurance to cover potential claims. In previous years, these factors have combined to cause a number of bankruptcy filings, bankruptcy court rulings and court judgments affecting our lessees and borrowers. In prior years, we have determined that impairment of certain of our investments had occurred as a result of these events.
We evaluate the recoverability of the carrying values of our properties on a property-by-property basis. On a quarterly basis, we review our properties for recoverability when events or circumstances, including significant physical changes in the property, significant adverse changes in general economic conditions and significant deteriorations of the underlying cash flows of the property, indicate that the carrying amount of the property may not be recoverable. The need to recognize an impairment charge is based on estimated undiscounted future cash flows from a property compared to the carrying value of that property. If recognition of an impairment charge is necessary, it is measured as the amount by which the carrying amount of the property exceeds the fair value of the property.
For our mortgage and other notes receivable, we evaluate the estimated collectibility of contractual loan payments and general economic conditions on an instrument-by-instrument basis. On a quarterly basis, we review our notes receivable for ability to realize on such notes when events or circumstances, including the non-receipt of contractual principal and interest payments, significant deteriorations of the financial condition of the borrower and significant adverse changes in general economic conditions, indicate that the carrying amount of the note receivable may not be recoverable. If necessary, impairment is measured as the amount by which the carrying amount exceeds the fair value as measured by the discounted cash flows expected to be received under the note receivable or, if foreclosure is probable, the fair value of the collateral securing the note receivable.
We evaluate our marketable securities for other-than-temporary impairments. An impairment of a marketable security would be considered “other-than-temporary” unless we have the ability and intent to hold the investment for a period of time sufficient for a forecasted market price recovery up to (or beyond) the cost of the investment and evidence indicates the cost of the investment is recoverable within a reasonable period of time.
The initial carrying value of investments in unconsolidated entities is based on the amount paid to purchase the interest or the estimated fair value of the assets prior to our acquisition of interests in the entity. An aggregate basis difference between the cost of our equity method investee and the amount of underlying equity in its net assets is primarily attributable to goodwill, which is not amortized. We evaluate for impairment our equity method investments and related goodwill based upon a comparison of the estimated fair value of the investments to their carrying value. When we determine a decline in the estimated fair value of such an investment below its carrying value is other than temporary, an impairment is recorded. No impairments to the carrying value of our equity method investee have been recorded for any period presented.
31
The determination of the fair value and whether a shortfall in operating revenues or the existence of operating losses is indicative of a loss in value that is other than temporary involves significant judgment. Our estimates consider all available evidence including, as appropriate, the present value of the expected future cash flows discounted at market rates, general economic conditions and trends, the duration of the fair value deficiency, and any other relevant factors. While we believe our assumptions are reasonable, changes in these assumptions may have a material impact on our financial results.
While we believe that the carrying amounts of our properties are recoverable and our notes receivable, marketable securities and other investments are realizable, it is possible that future events could require us to make significant adjustments or revisions to these estimates.
Revenue Recognition
We collect rent and interest from our tenants and borrowers. Generally, our policy is to recognize revenues on an accrual basis as earned. However, when we determine, based on insufficient historical collections and the lack of expected future collections, that rent or interest is not probable of collection until received, our policy is to recognize rental or interest income when assured, which we consider to be the period the amounts are collected. We identify investments as nonperforming if a required payment is not received within 30 days of the date it is due. This policy could cause our revenues to vary significantly from period to period. Revenue from minimum lease payments under our leases is recognized on a straight-line basis to the extent that future lease payments are considered collectible. Lease payments that depend on a factor directly related to future use of the property, such as an increase in annual revenues over base year revenues, are considered to be contingent rentals, are included in rental income when they are determinable and earned.
REIT Qualification
As part of the process of preparing our consolidated financial statements, significant management judgment is required to evaluate our compliance with REIT requirements. Our determinations are based on interpretation of tax laws, and our conclusions may have an impact on the income tax expense recognized. We believe that we have operated our business so as to qualify as a REIT under Sections 856 through 860 of the Internal Revenue Code of 1986, as amended (the “Code”), and we intend to continue to operate in such a manner, but no assurance can be given that we will be able to so qualify at all times. We record income tax expense or benefit with respect to our subsidiary which is taxed as a Taxable REIT Subsidiary ("TRS") under provisions similar to those applicable to regular corporations. Aside from such income taxes that may be applicable to the taxable income in our TRS, we will not be subject to U.S. federal income tax, provided that we continue to qualify as a REIT and make distributions to stockholders equal to or in excess of our taxable income. This treatment substantially eliminates the “double taxation” (at the corporate and stockholder levels) that typically applies to corporate dividends. Our failure to continue to qualify under the applicable REIT qualification rules and regulations would cause us to owe state and federal income taxes and would have a material adverse impact on our financial position, results of operations and cash flows.
Principles of Consolidation
The consolidated financial statements include our accounts, the accounts of our wholly-owned subsidiaries and the accounts of joint ventures in which we own a majority voting interest with the ability to control operations and where no substantive participating rights or substantive kick-out rights have been granted to the noncontrolling interests. In addition, we consolidate a legal entity deemed to be a variable interest entity ("VIE") when we determine that we are the VIE's primary beneficiary. All material inter-company transactions and balances have been eliminated in consolidation.
We apply Financial Accounting Standards Board ("FASB") guidance for our arrangements with VIEs which requires us to identify entities for which control is achieved through means other than voting rights and to determine which business enterprise is the primary beneficiary of the VIE. A VIE is broadly defined as an entity with one or more of the following characteristics: (a) the total equity investment at risk is insufficient to finance the entity's activities without additional subordinated financial support; (b) as a group, the holders of the equity investment at risk lack (i) the ability to make decisions about the entity's activities through voting or similar rights, (ii) the obligation to absorb the expected losses of the entity, or (iii) the right to receive the expected residual returns of the entity; or (c) the equity investors have voting rights that are not proportional to their economic interests, and substantially all of the entity's activities either involve, or are conducted on behalf of, an investor that has disproportionately few voting rights. We may change our assessment of a VIE due to events such as modifications of contractual arrangements that affect the characteristics or adequacy of the entity's equity investments at risk and the disposal of all or a portion of an interest held by the primary beneficiary.
32
Real Estate Properties
Real property we develop is recorded at cost, including the capitalization of interest during construction. The cost of real property investments we acquire is allocated to net tangible and identifiable intangible assets based on their respective fair values. We make estimates as part of our allocation of the purchase price of acquisitions to the various components of the acquisition based upon the fair value of each component. The most significant components of our allocations are typically the allocation of fair value to land, equipment, buildings and other improvements, and intangible assets, if any. Our estimates of the values of these components will affect the amount of depreciation and amortization we record over the estimated useful life of the property acquired or the remaining lease term.
Significant Operators
As discussed in Note 2 to the consolidated financial statements, we have four operators from whom we individually derive at least 10% of our rental income as follows (dollars in thousands):
Original | Rental Income | ||||||||||||||||
Investment | Year Ended December 31, | Lease | |||||||||||||||
Asset Class | Amount | 2015 | 2014 | Renewal | |||||||||||||
Holiday Retirement | ILF | $ | 493,378 | $ | 43,817 | 21% | $ | 43,817 | 26% | 2031 | |||||||
Senior Living Communities | EFC | 476,000 | 39,422 | 18% | 1,533 | 1% | 2029 | ||||||||||
National HealthCare Corporation | SNF | 171,297 | 36,625 | 17% | 36,446 | 22% | 2026 | ||||||||||
Bickford Senior Living | ALF | 281,883 | 24,121 | 11% | 21,421 | 13% | 2019 | ||||||||||
All others | Various | 672,220 | 70,462 | 33% | 63,062 | 38% | Various | ||||||||||
$ | 2,094,778 | $ | 214,447 | $ | 166,279 | ||||||||||||
Due to a combination of longer initial lease terms and generous escalators, straight line rent constituted a significant component of rental income recognized from the Holiday and Senior Living leases, whose communities we acquired in December 2013 and 2014, respectively. Straight-line rent of $10,466,000 and $11,902,000 was recognized from the Holiday lease for the years ended December 31, 2015 and 2014, respectively. Straight-line rent of $8,422,000 and $328,000 was recognized from the Senior Living lease for the years ended December 31, 2015 and 2014, respectively. For NHC, rent escalations are based on a percentage increase in revenue over a base year and do not give rise to non-cash, straight-line income.
Joint Venture
As of December 31, 2015, we owned an 85% equity interest and Sycamore Street, LLC ("Sycamore"), an affiliate of Bickford, owned a 15% equity interest in our consolidated subsidiary ("PropCo") which owns 32 assisted living/memory care facilities, plus 5 facilities under development. The facilities are leased to an unconsolidated operating company, ("OpCo"), which we do not control, and in which we also retain an 85/15 non-controlling ownership interest with Sycamore. This joint venture is structured to comply with the provisions of RIDEA. As of December 31, 2015, the annual contractual rent from OpCo to PropCo is $25,529,000, plus fixed annual escalators. NHI has an exclusive right to Bickford's future acquisitions, development projects and refinancing transactions. Of our total revenues, $24,121,000 (11%) and $21,421,000 (12%) were recognized as rental income from Bickford for the years ended December 31, 2015 and 2014, respectively.
At December 31, 2015, the carrying value of our investment in the operating company, OpCo, was $7,657,000, plus a deferred asset of $707,000 related to the carry-forward of net operating losses for tax purposes. The excess of the original purchase price over the fair value of identified tangible assets at acquisition is treated as implied goodwill and is subject to periodic review for impairment in conjunction with our equity method investment as a whole.
The income statements for OpCo include the operating results of 29 same-store properties and 3 focus properties that were added to the portfolio within the last 15 months. Focus properties receive increased management oversight because they have not reached cash flow stabilization or are new additions to the portfolio. For accounting purposes we are required to expense the pre-opening expenses and operating losses of newly-developed properties.
33
Unaudited summarized income statements for OpCo are presented below (in thousands):
Year Ended December 31, | |||||||||||
2015 | 2014 | 2013 | |||||||||
Revenues | $ | 77,349 | $ | 65,704 | $ | 42,636 | |||||
Operating expenses, including management fees | 54,132 | 43,389 | 27,419 | ||||||||
Lease expense, including straight-line rent | 24,596 | 21,859 | 14,579 | ||||||||
Depreciation and amortization | 699 | 539 | 256 | ||||||||
Net Income (Loss) | $ | (2,078 | ) | $ | (83 | ) | $ | 382 | |||
The net loss in OpCo for 2015 is attributable to (a) $699,000 in depreciation expense and $533,000 in non-cash straight-line lease expense for accounting purposes, and (b) $846,000 in excess expenses over revenues due to the operational transition of two recently acquired properties in Ohio and a newly constructed property in Carmel, Indiana which has not reached stabilization.
OpCo is intended to be self-financing, and aside from initial investments therein, no direct support has been provided by NHI to OpCo since inception on September 30, 2012. While PropCo's rental revenues associated with the related properties are sourced from OpCo, a decision to furnish additional direct support would be at our discretion and not obligatory. As a result, we believe our maximum exposure to loss at December 31, 2015, due to our investment in OpCo, would be limited to our equity interest as adjusted for any unrealized loss carry-forwards, currently approximately $700,000. We have concluded that OpCo meets the accounting criteria to be considered a VIE. However, because we do not control the entity, nor do we have any role in the day-to-day management, we are not the primary beneficiary of the entity, and we account for our investment using the equity method. There have been no distributions declared from OpCo since its inception.
In July 2013, we extended a $9,200,000 loan to Sycamore to fund a portion of their acquisition of six senior housing communities consisting of 342 units. The loan is guaranteed by principals of Bickford and bears a 12% annual interest rate. As a result of this transaction and existing agreements governing our business relationship with Bickford, PropCo has acquired a $97,000,000 purchase option on the properties which is exercisable over the term of the loan. In 2015, we granted an extension of the loan through June 2018 in return for the extension of the purchase option over the same period. Essential terms of the extended loan remain the same. We are monitoring the performance of this portfolio which currently has an NOI that would presume a capitalization rate on PropCo's purchase option price of approximately 7.5%. The loan and the purchase option creates variable interests in Sycamore, which is a VIE. However, because NHI is not its primary beneficiary, Sycamore is not subject to consolidation.
Investment Highlights
During 2015, we have made or announced the following real estate and note investments ($ in thousands):
Properties | Asset Class | Amount | ||||||
Lease Investments | ||||||||
Chancellor Health Care - acquisition | 1 | SHO | $ | 6,675 | ||||
Brook Retirement Communities - acquisition | 1 | SHO | 6,000 | |||||
Bickford Senior Living - new construction | 5 | SHO | 55,000 | |||||
Bickford Senior Living - acquisition | 1 | SHO | 21,000 | |||||
East Lake Capital Mgmt - acquisition | 3 | SHO | 66,900 | |||||
Note Investments | ||||||||
Life Care Services - refinancing and new construction | 1 | SHO | 154,500 | |||||
$ | 310,075 | |||||||
Chancellor
In an asset acquisition on August 31, 2015, we acquired a 29-unit memory care facility in Portland, Oregon, for $6,772,000 in cash inclusive of closing costs of approximately $97,000. The facility is leased to existing partner Chancellor Health Care for 15 years with renewal options at an initial lease rate of 7.75% plus annual escalators.
34
Brook Retirement Communities
In an asset acquisition on August 31, 2015, we acquired a 42-unit independent living and assisted living community in Roscommon, Michigan, for $6,000,000 in cash plus $49,000 in closing costs. The community is leased to a new partner, The Brook Retirement Communities of Roscommon, Inc., for 10 years with renewal options at an initial lease rate of 7.5% plus annual escalators.
Bickford
On July 31, 2015, our subsidiary, PropCo, acquired a 92 unit assisted living/memory care facility located in Lancaster, Ohio for $21,000,000 in cash. Valuation was based on an 8% capitalization rate on its trailing net operating income performance. The facility is leased to the operating company, OpCo. The initial lease payment is based on an annualized amount of $1,470,000 and is subject to 3% escalation each January and renewal on October 1, 2017.
In February 2015 our joint venture with Bickford announced plans to develop five senior housing facilities in Illinois and Virginia. These five properties will represent the culmination of a program announced in 2012 between NHI and Bickford to construct a total of eight facilities. The first three communities, all in Indiana, opened in 2013 and 2014. Land acquisition and pre-development on the five facilities started in mid-2015 with openings planned beginning in 2016. The total estimated project cost is $55,000,000. Total capitalized costs related to these properties as of December 31, 2015, including land purchases, were $17,268,000. Each community will consist of 60 private-pay assisted living and memory care units managed by Bickford Senior Living.
East Lake
On July 1, 2015, we acquired two senior living campuses in Nashville and Indianapolis and one assisted living/memory care facility in Charlotte for $66,900,000 in cash. In addition, we have committed to East Lake Capital Management (“East Lake”)certain lease incentive payments contingent on reaching and maintaining certain metrics and a contingent earn out of $750,000 payable to the seller upon East Lake reaching certain metrics. As earned, the lease incentive payments, totaling $8,000,000, would be due in installments of up to $4,000,000 in each of years three and four of the lease with any subsequently earned residual due by year seven. At acquisition, we estimated probable contingent payments to the seller totaling $750,000 and have, accordingly, reflected that amount in the Consolidated Balance Sheet. Contingent payments earned will be an addition to the lease base when funded.
We leased the facilities to East Lake for an initial term of 10 years, plus renewal options. The lease calls for an annual payment of $4,683,000 in the first year with fixed annual escalators of 3.5% through year four and 3.0% thereafter. In conjunction with the lease, East Lake acquired a purchase option on the properties as a whole, exercisable beginning in year six of the lease for approximately $81,000,000 and thereafter subject to escalation on a basis consistent with rental escalations and other funding in place. On entering the lease, we committed to funding up to an additional $400,000 for specified capital improvements. The investment will be added to the basis on which the lease amount is calculated.
Life Care Services
On February 10, 2015, we entered into an agreement to lend LCS-Westminster Partnership III LLP (“LCS-WP”), an affiliate of Life Care Services, the manager of the facility, up to $154,500,000. The loan agreement conveys a mortgage interest and will facilitate the construction of Phase II of Timber Ridge at Talus (“Timber Ridge”), a Type-A Continuing Care Retirement Community in the Seattle, WA area.
The loan takes the form of two notes under a master credit agreement. The senior note (“Note A”) totals $60,000,000 at a 6.75% interest rate with 10 basis-point escalators after year three, and has a term of 10 years. We have funded $28,000,000 of Note A as of December 31, 2015. Note A is interest-only and is locked to prepayment for three years. After year three, the prepayment penalty starts at 5% and declines 1% per year. The second note ("Note B") is a construction loan for up to $94,500,000 at an annual interest rate of 8% and a 5 year maturity. We anticipate funding Note B through December 2016 and anticipate substantial repayment with new resident entrance fees upon the opening of Phase II. The total amount funded on Note B was $55,411,000 as of December 31, 2015.
NHI has a purchase option on the entire Timber Ridge property for the greater of fair market value or $115,000,000 during a purchase option window of 120 days that will contingently open in year five or upon earlier stabilization of the development, as defined.
35
Other Lease Activity
Our leases are typically structured as "triple net leases" on single-tenant properties having an initial leasehold term of 10 to 15 years with one or more 5-year renewal options. As such, there may be reporting periods in which we experience few, if any, lease renewals or expirations.
Additionally we had two properties whose lease terms were to expire in 2016. In September 2015 we sold for $9,593,000 these properties with a carrying value of $8,467,000 and recognized a gain on the disposition of $1,126,000. The properties represented the last two skilled nursing facilities of a disposal group that was originally under contract and classified during 2011 and 2012 as held-for-sale. As previously disclosed, the sale for the disposal group as a whole, being subject to certain conditions precedent as to financing, did not occur. NHI then proceeded to dispose of three of the properties in December 2013, the first of the group having been sold in 2011. On completion of these disposals to our tenant, Fundamental, a monthly rental of $250,000 was attached to the two remaining skilled nursing facilities through the end of the original lease term, February 2016, the properties having an average age in excess of 40 years. With the impending cessation of the lease, the two properties were aggressively marketed for immediate sale under conditions less favorable than those prevailing in 2011.
In February 2015, we transitioned the lease of four assisted living facilities in Louisiana to our existing tenant, Senior Living Management (“SLM”). The termination of the prior lease resulted in a write-off for accounting purposes during 2014 of $932,000 in straight-line rent receivable. The scheduled lease payments are the same as in the former lease. The current lease has an initial term of 15 years plus fixed annual escalators after the first year. During 2015 the scope of planned renovations begun in 2014 for an SLM operated facility expanded to include other facilities, including additional work on the Louisiana properties, so that the commitment as of December 31, 2015 now totals $1,430,000. When the renovations are complete, the total amount will be added to the lease base of the respective facilities. As of December 31, 2015, $1,165,000 had been funded on these projects.
Most of our existing leases contain annual escalators in rent payments. For financial statement purposes, rental income is recognized on a straight-line basis over the term of the lease. Certain of our operators hold purchase options allowing them to acquire properties they currently lease from NHI. A summary of these tenant options to purchase senior housing communities, hospitals, medical office buildings and skilled nursing facilities is presented below:
Asset | Number of | Lease | 1st Option | Current | ||
Type | Facilities | Expiration | Open Year | Cash Rent | ||
SNF | 1 | October 2026 | Open | $ | 1,386,000 | |
MOB | 1 | February 2018 | Open | $ | 691,000 | |
SNF | 3 | October 2026 | 2016 | $ | 4,977,000 | |
SNF | 5 | October 2026 | 2018 | $ | 6,158,000 | |
Hosp | 1 | September 2027 | 2018 | $ | 2,204,000 | |
ALF | 8 | December 2024 | 2020 | $ | 3,866,000 | |
Hosp | 1 | March 2025 | 2020 | $ | 1,726,000 | |
SLC | 3 | June 2025 | 2020 | $ | 4,683,000 | |
Various | 9 | — | Thereafter | $ | 7,238,000 | |
When present, tenant purchase options generally give the lessee an option to purchase the underlying property for consideration determined by i) a sliding base dependent upon the extent of appreciation in the property plus a specified proportion of any appreciation; ii) our acquisition costs plus a specified proportion of any appreciation; iii) an agreed capitalization rate applied to the current rental; or iv) our acquisition costs plus a profit floor plus a specified proportion of any appreciation. Where stipulated above, appreciation is to be established by independent appraisal. For options open or coming open in 2016, we are engaged in preliminary negotiations to continue as lessor or in some other capacity.
Assets Held for Sale
During the year ended December 31, 2015, we had one lease coming up for renewal; in August 2015 we committed to a plan to sell the related skilled nursing facility in Idaho. We have reached agreement with the tenant on a sales price of $3,000,000 for the property, which has a carrying value of $1,346,000. We recorded lease income from the property for the years ended December 31, 2015, 2014 and 2013 of $321,000, $313,000, and $306,000, respectively. The Idaho property does not meet the accounting criteria to be reported as a discontinued operation as its disposal will not result in a strategic shift that would have a major effect on our operations or financial results. The sale is expected to close in February 2016.
36
Real Estate and Mortgage Write-downs
Our borrowers and tenants experience periods of significant financial pressures and difficulties similar to other health care providers. Governments at both the federal and state levels have enacted legislation to lower, or at least slow, the growth in payments to health care providers. Furthermore, the cost of professional liability insurance has increased significantly during this same period. Since inception, a number of our facility operators and mortgage loan borrowers have undergone bankruptcy. Others have been forced to surrender properties to us in lieu of foreclosure or, for certain periods, have failed to make timely payments on their obligations to us. We believe that the carrying amounts of our real estate properties are recoverable and that mortgage notes receivable are realizable and supported by the value of the underlying collateral. However, it is possible that future events could require us to make significant adjustments to these carrying amounts.
Potential Effects of Medicare Reimbursement
Our tenants who operate skilled nursing facilities receive a significant portion of their revenues from governmental payors, primarily Medicare (federal) and Medicaid (states). Changes in reimbursement rates and limits on the scope of services reimbursed to skilled nursing facilities could have a material impact on the operators' liquidity and financial condition. The Centers for Medicare & Medicaid Services ("CMS") released a final rule that provides a 1.2% increase in their Medicare reimbursement for fiscal 2016 beginning on October 1, 2015. We currently estimate that our borrowers and lessees will be able to withstand this nominal Medicare increase due to their credit quality, profitability and their debt or lease coverage ratios, although no assurances can be given as to what the ultimate effect that similar Medicare increases on an annual basis would have on each of our borrowers and lessees. In addition, state Medicaid funding is not expected to keep pace with inflation. Federal legislative policies have been adopted and continue to be proposed that would reduce Medicare and/or Medicaid payments to skilled nursing facilities.
37
Results of Operations
The significant items affecting revenues and expenses are described below (in thousands):
Years ended December 31, | Period Change | |||||||||||||
2015 | 2014 | $ | % | |||||||||||
Revenues: | ||||||||||||||
Rental income | ||||||||||||||
7 EFCs and 1 SLC leased to Senior Living Communities | $ | 31,000 | $ | 1,206 | $ | 29,794 | NM | |||||||
ALFs leased to RIDEA joint venture with Bickford | 23,853 | 20,946 | 2,907 | 13.9 | % | |||||||||
1 ALF and 2 SLCs leased to East Lake Capital Management | 2,342 | — | 2,342 | NM | ||||||||||
ILFs leased to an affiliate of Holiday Retirement | 33,351 | 31,915 | 1,436 | 4.5 | % | |||||||||
ALFs leased to Chancellor Health Care | 3,738 | 2,489 | 1,249 | 50.2 | % | |||||||||
3 SNFs and 1 ALF leased to Prestige Senior Living | 3,581 | 2,544 | 1,037 | 40.8 | % | |||||||||
ALFs leased to Brookdale Senior Living | 5,059 | 4,912 | 147 | 3.0 | % | |||||||||
Other new and existing leases | 86,900 | 85,803 | 1,097 | 1.3 | % | |||||||||
189,824 | 149,815 | 40,009 | 26.7 | % | ||||||||||
Straight-line rent adjustments, new and existing leases | 24,623 | 16,464 | 8,159 | 49.6 | % | |||||||||
Total Rental Income | 214,447 | 166,279 | 48,168 | 29.0 | % | |||||||||
Interest income from mortgage and other notes | ||||||||||||||
Timber Ridge | 3,569 | — | 3,569 | NM | ||||||||||
Senior Living Communities construction loan | 411 | 7 | 404 | NM | ||||||||||
Sycamore Street (Bickford affiliate) | 1,161 | 1,137 | 24 | 2.1 | % | |||||||||
Sante Mesa | 574 | 1,203 | (629 | ) | (52.3 | )% | ||||||||
Other new and existing mortgages | 4,263 | 4,666 | (403 | ) | (8.6 | )% | ||||||||
Total Interest Income from Mortgage and Other Notes | 9,978 | 7,013 | 2,965 | 42.3 | % | |||||||||
Investment income and other | 4,563 | 4,217 | 346 | 8.2 | % | |||||||||
Total Revenue | 228,988 | 177,509 | 51,479 | 29.0 | % | |||||||||
Expenses: | ||||||||||||||
Depreciation | ||||||||||||||
7 EFCs and 1 SLC leased to Senior Living Communities | 12,530 | — | 12,530 | NM | ||||||||||
ALFs leased to RIDEA joint venture with Bickford | 7,669 | 6,680 | 989 | 14.8 | % | |||||||||
1 ALF and 2 SLCs leased to East Lake Capital Management | 889 | — | 889 | NM | ||||||||||
3 SNFs and 1 ALF leased to Prestige Senior Living | 1,244 | 892 | 352 | 39.5 | % | |||||||||
ALFs leased to Chancellor Health Care | 1,104 | 739 | 365 | 49.4 | % | |||||||||
Other new and existing assets | 29,727 | 29,767 | (40 | ) | (0.1 | )% | ||||||||
Total Depreciation | 53,163 | 38,078 | 15,085 | 39.6 | % | |||||||||
Interest expense and amortization of debt issuance costs | 37,629 | 24,227 | 13,402 | 55.3 | % | |||||||||
Debt issuance costs expensed due to credit facility modifications | — | 2,145 | (2,145 | ) | NM | |||||||||
Legal | 464 | 209 | 255 | 122.0 | % | |||||||||
Franchise, excise and other taxes | 985 | 620 | 365 | 58.9 | % | |||||||||
Payroll and related compensation expenses | 4,375 | 4,546 | (171 | ) | (3.8 | )% | ||||||||
Dues, marketing and professional fees | 3,292 | 1,812 | 1,480 | 81.7 | % | |||||||||
Non-cash compensation expense | 2,134 | 2,020 | 114 | 5.6 | % | |||||||||
Loan recoveries, net | (491 | ) | — | (491 | ) | NM | ||||||||
Other expenses | 718 | 729 | (11 | ) | (1.5 | )% | ||||||||
102,269 | 74,386 | 27,883 | 37.5 | % | ||||||||||
Income before equity-method investee, income tax benefit (expense), | ||||||||||||||
investment and other gains and noncontrolling interest | 126,719 | 103,123 | 23,596 | 22.9 | % | |||||||||
Income (loss) from equity-method investee | (1,767 | ) | (71 | ) | (1,696 | ) | NM | |||||||
Income tax benefit of taxable REIT subsidiary | 707 | — | 707 | NM | ||||||||||
Investment and other gains | 24,655 | — | 24,655 | NM | ||||||||||
Net income | 150,314 | 103,052 | 47,262 | 45.9 | % | |||||||||
Net income attributable to noncontrolling interest | (1,452 | ) | (1,443 | ) | (9 | ) | NM | |||||||
Net income attributable to common stockholders | $ | 148,862 | $ | 101,609 | $ | 47,253 | 46.5 | % | ||||||
NM - not meaningful | ||||||||||||||
38
Financial highlights of the year ended December 31, 2015, compared to 2014 were as follows:
• | Rental income increased $48,168,000 due primarily to our SLC acquisition in December 2014 and other real estate investments completed during 2015 and 2014. During 2015 we completed $155,575,000 of new real estate investments. During 2014 we completed $555,453,000 of new real estate investments. The increase in rental income included an $8,159,000 increase in straight-line rent adjustments. Generally accepted accounting principles require rental income to be recognized on a straight-line basis over the term of the lease to give effect to scheduled rent escalators. Future increases in rental income depend on our ability to make new investments which meet our underwriting criteria. |
• | Interest income from mortgage and other notes increased $2,965,000 primarily due to borrowings of $83,411,000 on our new loan commitment to the Timber Ridge entrance fee community as described in Investment Highlights. We expect total interest income from our loan portfolio to increase as we continue to fund these loans to Timber Ridge on a monthly basis throughout 2016. We estimate repayment of our construction loan of $94,500,000 to Timber Ridge during 2017. Interest income from our loan portfolio is subject to decrease due to normal maturities, scheduled principal amortization and early payoffs of individual loans. |
• | Depreciation expense recognized in continuing operations increased $15,085,000 compared to the prior year primarily due to new real estate investments completed during 2014 and 2015. |
• | Interest expense, including amortization of debt issuance costs and discounts, increased $13,402,000 primarily as a result of the timing and amount of new borrowings and our strategic focus to refinance short-term borrowings on our revolving credit facility at variable interest rates with long-term debt at fixed rates. This strategy helps to mitigate the risk of rising interest rates and lock in the investment spread between our lease revenue and our cost of debt capital. |
• | Dues, marketing and professional fees have increased as a result of (a) marketing and promotional expenses incurred as NHI continues to participate actively in industry groups and in expanding its awareness among owners and operators in the asset classes in which it makes investments , and (b) the professional fees associated with the volume of new investments and new financing arrangements during 2015. |
• | We received $491,000 as a secured creditor in the final settlement of a bankruptcy proceeding involving one of our former borrowers. The loan had previously been written off. We recorded the receipt as a loan recovery. |
• | The loss from equity method investee of $1,767,000 reflects our pro rata portion of the investee’s net loss for 2015 as described earlier in our discussion of our joint venture with Sycamore. |
• | Investment and other gains for 2015 represents (a) gains of $23,529,000 on the sales of marketable securities and (b) a gain of $1,126,000 on the sale of two properties to our tenant Fundamental. During the fourth quarter of 2015, we sold 1,000,000 shares of LTC common stock and recognized a gain of $23,098,000. |
39
The significant items affecting revenues and expenses are described below (in thousands):
Years ended December 31, | Period Change | |||||||||||||
2014 | 2013 | $ | % | |||||||||||
Revenues: | ||||||||||||||
Rental income | ||||||||||||||
ILFs leased to an affiliate of Holiday Retirement | $ | 31,915 | $ | 787 | 31,128 | NM | ||||||||
ALFs leased to RIDEA joint venture with Bickford | 20,946 | 14,219 | 6,727 | 47.3 | % | |||||||||
SNFs newly leased to NHC (7 ElderTrust facilities) | 3,450 | 350 | 3,100 | NM | ||||||||||
3 SNFs and 1 ALF leased to Prestige Senior Living | 2,544 | — | 2,544 | NM | ||||||||||
SNFs leased to Fundamental Long Term Care | 5,519 | 3,494 | 2,025 | 58.0 | % | |||||||||
ALFs leased to Chancellor Health Care | 2,489 | 1,207 | 1,282 | 106.2 | % | |||||||||
7 EFCs and 1 SLC leased to Senior Living Communities | 1,206 | — | 1,206 | NM | ||||||||||
ALFs leased to Brookdale Senior Living | 4,912 | 4,215 | 697 | 16.5 | % | |||||||||
ALF leased to Discovery Senior Living | 942 | 249 | 693 | NM | ||||||||||
Other new and existing leases | 75,892 | 75,037 | 855 | 1.1 | % | |||||||||
149,815 | 99,558 | 50,257 | 50.5 | % | ||||||||||
Straight-line rent adjustments, new and existing leases | 16,464 | 6,471 | 9,993 | 154.4 | % | |||||||||
Total Rental Income | 166,279 | 106,029 | 60,250 | 56.8 | % | |||||||||
Interest income from mortgage and other notes | ||||||||||||||
Sycamore (Bickford affiliate) | 1,137 | 531 | 606 | 114.1 | % | |||||||||
ElderTrust | — | 644 | (644 | ) | NM | |||||||||
SeniorTrust | — | 475 | (475 | ) | NM | |||||||||
Other new and existing mortgages | 5,876 | 5,983 | (107 | ) | (1.8 | )% | ||||||||
Total Interest Income from Mortgage and Other Notes | 7,013 | 7,633 | (620 | ) | (8.1 | )% | ||||||||
Investment income and other | 4,217 | 4,166 | 51 | 1.2 | % | |||||||||
Total Revenue | 177,509 | 117,828 | 59,681 | 50.7 | % | |||||||||
Expenses: | ||||||||||||||
Depreciation | ||||||||||||||
ILFs leased to an affiliate of Holiday Retirement | 12,915 | — | 12,915 | NM | ||||||||||
ALFs leased to RIDEA joint venture with Bickford | 6,680 | 4,229 | 2,451 | 58.0 | % | |||||||||
3 SNFs and 1 ALF leased to Prestige Senior Living | 892 | — | 892 | NM | ||||||||||
SNFs newly leased to NHC (7 ElderTrust facilities) | 896 | 299 | 597 | NM | ||||||||||
ALFs leased to Chancellor Health Care | 739 | 342 | 397 | 116.1 | % | |||||||||
Other new and existing assets | 15,956 | 15,231 | 725 | 4.8 | % | |||||||||
Total Depreciation | 38,078 | 20,101 | 17,977 | 89.4 | % | |||||||||
Interest expense and amortization of loan costs | 24,227 | 8,813 | 15,414 | NM | ||||||||||
Debt issuance costs expensed due to credit facility modifications | 2,145 | 416 | 1,729 | NM | ||||||||||
Legal | 209 | 784 | (575 | ) | (73.3 | )% | ||||||||
Loan and realty losses, net | — | 1,976 | (1,976 | ) | NM | |||||||||
Other expenses | 9,727 | 9,742 | (15 | ) | (0.2 | )% | ||||||||
74,386 | 41,832 | 32,554 | 77.8 | % | ||||||||||
Income before equity-method investee, income tax benefit (expense), | ||||||||||||||
investment and other gains and noncontrolling interest | 103,123 | 75,996 | 27,127 | 35.7 | % | |||||||||
Income (loss) from equity-method investment | (71 | ) | 324 | (395 | ) | (121.9 | )% | |||||||
Income tax expense of taxable REIT subsidiary | — | (128 | ) | 128 | (100.0 | )% | ||||||||
Investment and other gains | — | 3,306 | (3,306 | ) | NM | |||||||||
Income from continuing operations | 103,052 | 79,498 | 23,554 | 29.6 | % | |||||||||
Income from discontinued operations | — | 5,426 | (5,426 | ) | NM | |||||||||
Gain on sale of real estate | — | 22,258 | (22,258 | ) | NM | |||||||||
Net income | 103,052 | 107,182 | (4,130 | ) | (3.9 | )% | ||||||||
Net income attributable to noncontrolling interest | (1,443 | ) | (999 | ) | (444 | ) | 44.4 | % | ||||||
Net income attributable to common stockholders | $ | 101,609 | $ | 106,183 | $ | (4,574 | ) | (4.3 | )% | |||||
NM - not meaningful | ||||||||||||||
40
Financial highlights of the year ended December 31, 2014, compared to 2013 were as follows:
• | Rental income increased $60,250,000 primarily as a result of new real estate investments. During 2013 we completed $748,939,000 of new real estate investments. During 2014 we made $555,453,000 of new real estate investments. The increase in rental income included a $9,993,000 increase in straight-line rent adjustments. Generally accepted accounting principles require rental income to be recognized on a straight-line basis over the term of the lease to give effect to scheduled rent escalators. Future increases in rental income depend on our ability to make new investments which meet our underwriting criteria. |
• | Interest income from mortgage and other notes decreased $620,000 primarily due to the settlement of outstanding notes receivable balances from ElderTrust and SeniorTrust, partially offset by interest income on a note receivable from Sycamore which began in July 2013. |
• | Depreciation expense recognized in continuing operations increased $17,977,000 compared to the prior year primarily due to new real estate investments completed during 2013 and 2014. |
• | Interest expense relates to borrowings on our credit facility, the convertible senior notes issued in March 2014 and debt assumed in the acquisition of real estate. The $17,143,000 increase in interest expense and amortization of debt issuance costs resulted from (a) the issuance of 3.25% coupon convertible debt of $200,000,000 to reduce floating-rate, lower interest borrowings on our revolving credit facility, and (b) expanded borrowings used to fund new real estate investments in 2014. During the first quarter of 2014, we made modifications to our credit facility and as a result have written off $2,145,000 of previously unamortized debt issuance costs. Upfront fees and other debt-related costs are amortized over the term of the credit facility. On December 31, 2014, we repaid two Fannie Mae mortgage loans and, as a result, recognized the remaining unamortized debt premium balance of $1,655,000. |
• | Legal expenses were $575,000 lower in 2014 when compared to 2013 primarily as a result of litigation which reached final settlement in April 2013. |
• | During 2013 we recorded an impairment of $4,037,000 related to a mortgage note receivable. In September 2013 we received $3,293,000 as full payment of a mortgage note and recorded a recovery of a previous writedown of $2,061,000. |
The results of operations for facilities sold, including the gain or loss on such sales, prior to the adoption of ASU 2014-08 have been reported for 2013 and prior periods as discontinued operations.
41
Liquidity and Capital Resources
Sources and Uses of Funds
Our primary sources of cash include rent payments, principal and interest payments on mortgage and other notes receivable, interest and dividends received on our marketable securities, proceeds from the sales of real property, net proceeds from offerings of equity securities and borrowings from our term loans and revolving credit facility. Our primary uses of cash include dividend distributions to our shareholders, debt service payments (both principal and interest), new investments in real estate and notes and general corporate overhead.
These sources and uses of cash are reflected in our Consolidated Statements of Cash Flows as summarized below (dollars in thousands):
Year Ended | One Year Change | Year Ended | One Year Change | |||||||||||||||||||||
12/31/2015 | 12/31/2014 | $ | % | 12/31/13 | $ | % | ||||||||||||||||||
Cash and cash equivalents at beginning of period | $ | 3,287 | $ | 11,312 | $ | (8,025 | ) | (70.9 | )% | 9,172 | $ | 2,140 | 23.3 | % | ||||||||||
Net cash provided by operating activities | 164,425 | 126,143 | 38,282 | 30.3 | % | 104,193 | 21,950 | 21.1 | % | |||||||||||||||
Net cash used in investing activities | (136,326 | ) | (540,316 | ) | 403,990 | (74.8 | )% | (625,824 | ) | 85,508 | (13.7 | )% | ||||||||||||
Net cash (used in) provided by financing activities | (18,100 | ) | 406,148 | (424,248 | ) | NM | 523,771 | (117,623 | ) | (22.5 | )% | |||||||||||||
Cash and cash equivalents at end of period | $ | 13,286 | $ | 3,287 | $ | 9,999 | 304.2 | % | 11,312 | $ | (8,025 | ) | (70.9 | )% | ||||||||||
Operating Activities – Net cash provided by operating activities for the year ended December 31, 2015 increased primarily as a result of the collection of lease payments on new real estate investments completed during 2014 and 2015.
Investing Activities – Net cash flows used in investing activities for the year ended December 31, 2015 decreased compared to 2014 primarily due to a decrease in real estate investment activity completed during 2015 and the realization of proceeds from sales of marketable securities.
Financing Activities – Net cash flows from financing activities for the year ended December 31, 2015 changed significantly compared to 2014 primarily due to a $340,000,000 reduction in the outstanding balance of our revolving credit facility during 2015 and a $24,000,000 increase in dividends paid to stockholders, partially offset by $325,000,000 of new term loan borrowings.
Liquidity
At December 31, 2015, our liquidity was strong, with $602,030,000 available in cash, highly-liquid marketable securities and borrowing capacity on our revolving credit facility. Aside from particular debt refinancings detailed below, sources of liquidity in 2015 included the conversion, reclassification or reinvestment of funds on deposit and non-marketable preferred stock to highly liquid cash and marketable securities at fair value approximating $86,030,000 on our Consolidated Balance Sheet as of December 31, 2015. Cash collected from our loans and leases is used to pay debt service, expenses of operating the REIT, dividends to stockholders and to make new real estate investments.
During 2015 we termed out $325,000,000 in debt on our revolver as follows:
On November 3, 2015, we issued $50,000,000 of 8-year notes with a coupon of 3.99% and $50,000,000 of 10-year notes with a coupon of 4.33% to a private placement lender.
In January 2015 we issued $125,000,000 of 8-year notes with a coupon of 3.99% and $100,000,000 of 12-year notes with a coupon of 4.51% to a private placement lender.
The above notes are unsecured and require quarterly payments of interest only until maturity. Terms and conditions of the new financings are similar to those under our bank credit facility with the exception of provisions regarding prepayment premiums.
In June 2015, we entered into an amended $800,000,000 senior unsecured credit facility with a group of banks. The facility can be expanded, subject to certain conditions, up to an additional $250,000,000. The amended credit facility provides for: (1) a $550,000,000 revolving credit facility that matures in June 2020 (inclusive of an embedded 1-year extension option) with interest at 150 basis points over LIBOR (43 bps at December 31, 2015); (2) an existing $130,000,000 term loan that matures in June 2020 with interest at 175 basis points over LIBOR of which interest of 3.91% is fixed with an interest rate swap agreement; and (3) two existing term loans which remain in place totaling $120,000,000, maturing in June 2020 and bearing interest at 175 basis points over LIBOR, a notional amount of $40,000,000 being fixed at 3.29% until 2019 and $80,000,000 being fixed at 3.86% until 2020. At closing, the new facility replaced a smaller credit facility last amended in March 2014 that provided for $700,000,000 of total
42
commitments. Our purpose in amending the credit facility was to expand the amount of funds available to draw on our revolving credit facility, to increase the accordion feature, and to extend and conform the maturity of the revolver to that of our term loans.
At December 31, 2015, we had $516,000,000 available to draw on the revolving portion of the credit facility. The unused commitment fee is 40 basis points per annum. The unsecured credit facility requires that we maintain certain financial ratios within limits set by our creditors. To date, these ratios, which are calculated quarterly, have been within the limits required by the credit facility agreements.
In March 2015 we obtained $78,084,000 in Fannie Mae non-recourse financing through KeyBank National Association. The debt financing consists of interest-only payments at 3.79% and a 10-year maturity. The mortgages are secured by thirteen properties in NHI’s joint venture with Bickford Senior Living that previously collateralized Fannie Mae loans totaling $77,267,000, which we retired on December 31, 2014, without penalty, using funds from our revolving credit facility.
The aggregate outstanding balance of our HUD mortgage loans, net of discounts, as of December 31, 2015 was $45,035,000. Our HUD mortgage loans are secured by ten properties in our joint venture with Bickford. Nine mortgage notes require monthly payments of principal and interest from 4.3% to 4.4% (inclusive of mortgage insurance premium) and mature in August and October 2049. One additional HUD mortgage loan assumed in 2014 requires monthly payments of principal and interest of 2.9% (inclusive of mortgage insurance premium) and matures in October 2047. The loan has an outstanding principal balance of $9,311,000 and a net book value of $7,737,000, which approximates fair value.
In March 2014 we issued $200,000,000 of 3.25% senior unsecured convertible notes due April 2021 (the "Notes"). Interest is payable April 1st and October 1st of each year. The Notes are convertible at an initial conversion rate of 13.926 shares of common stock per $1,000 principal amount, representing a conversion price of approximately $71.81 per share for a total of approximately 2,785,200 underlying shares. The conversion rate is subject to adjustment upon the occurrence of certain events, as defined in the indenture governing the Notes, but will not be adjusted for any accrued and unpaid interest except in limited circumstances. Upon conversion, NHI's conversion obligation may be satisfied, at our option, in cash, shares of common stock or a combination of cash and shares of common stock. Because the conversion price was in excess of the average stock price for the year, the impact of the
conversion option was anti-dilutive to the year-end earnings per share calculation and as such had no effect on our earnings per share. As of February 15, 2016 our stock price closed at $57.81. If current prices increase above the initial $71.81 conversion price, some dilution will be attributable to the conversion feature.
As discussed in Note 7 to the consolidated financial statements, accounting rules require that we split the Notes into a debt component and an equity component. The value of the debt component is based upon the estimated fair value of a similar debt instrument without the conversion feature at the time of issuance and was estimated to be approximately $192,238,000. The $7,762,000 difference between the contractual principal on the debt and the value allocated to the debt was recorded as an equity component and represents the estimated value of the conversion feature of the instrument. The excess of the contractual principal amount of the debt over its estimated fair value is amortized to interest expense using the effective interest method, with 3.9% as the effective interest rate, over the term of the Notes.
The total cost of issuing the Notes was $6,063,000, of which $5,788,000 was allocated to the debt component and is subject to amortization over the estimated term of the notes. The remaining $275,000 was allocated to the equity component.
As described in Areas of Focus, in 2015 we utilized our at-the-market equity program (“ATM”) through which we may sell our common shares on an as-needed basis. Accordingly, in November and December 2015, we raised $49,389,000 in new common equity capital, after underwriting discounts and offering expenses, by issuing 830,506 common shares at an average price of $60.33 per share. We used these funds to pay down our line of credit, the additional capital immediately serving to rebalance our leverage and keep our options flexible for further expansion. We continue to explore various other funding sources including bank term loans, convertible debt, traditional equity placement, unsecured bonds and senior notes, debt private placement and secured government agency financing.
As an additional source of investment funding, in November 2015 we converted 2,000,000 shares of LTC preferred stock into 2,000,000 shares of common stock and began reducing our position in the LTC common. As of December 31, 2015, we had sold 1,000,000 common shares and realized net proceeds of $42,164,000 and a gain of $23,098,000. Our tax gain from the sales is adequately sheltered by offsetting depreciation, making all of the proceeds available for deployment. We used these proceeds to pay down our revolving line of credit. As with the equity issuance under our ATM discussed above, the use of funds from the sale of LTC common stock resulted in a significant rebalancing of our leverage and provide further flexibility in structuring future acquisitions. At December 31, 2015, we own 1,293,800 shares of LTC common stock valued at $43.14 per share and a variety of marketable debt securities valued at $16,929,000. We expect to liquidate our marketable securities at appropriate times to fund real estate acquisition opportunities that present themselves.
43
To mitigate our exposure to interest rate risk, we have entered into the following interest rate swap contracts on three of our term loans as of December 31, 2015 (dollars in thousands):
Date Entered | Maturity Date | Fixed Rate | Rate Index | Notional Amount | Fair Value | |||||||||
May 2012 | April 2019 | 3.29% | 1-month LIBOR | $ | 40,000 | $ | (358 | ) | ||||||
June 2013 | June 2020 | 3.86% | 1-month LIBOR | $ | 80,000 | $ | (2,359 | ) | ||||||
March 2014 | June 2020 | 3.91% | 1-month LIBOR | $ | 130,000 | $ | (4,013 | ) | ||||||
For instruments that are designated and qualify as cash flow hedges, the effective portion of the gain or loss on the derivative is reported as a component of other comprehensive income (“OCI”), and reclassified into earnings in the same period, or periods, during which the hedged transaction affects earnings. Gains and losses on the derivative representing either hedge ineffectiveness or hedge components excluded from the assessment of effectiveness are recognized in earnings. Hedge ineffectiveness related to our cash flow hedges, which is reported in current period earnings as interest expense, was not significant for the years ended December 31, 2015, 2014 or 2013.
We periodically refinance the borrowings on our revolving credit facility into longer-term debt instruments. We consider secured debt from U.S. Govt. agencies, including HUD, private placements of unsecured debt, and public offerings of debt and equity. We anticipate that our historically low cost of debt capital will rise in the near to mid-term, as the federal government continues its upward transitioning of the Federal funds rate.
If we modify or replace existing debt, we would incur debt issuance costs. These fees would be subject to amortization over the term of the new debt instrument and may result in the write-off of fees associated with debt which has been replaced or modified. Sustaining long-term dividend growth will require that we consider all forms of capital mentioned above, with the goal of maintaining a low-leverage balance sheet as mitigation against potential adverse changes in the business of our tenants and borrowers.
We intend to comply with REIT dividend requirements that we distribute at least 90% of our annual taxable income for the year ending December 31, 2015 and thereafter. Dividends declared for the fourth quarter of each fiscal year are paid by the end of the following January and are, with some exceptions, treated for tax purposes as having been paid in the fiscal year just ended as provided in IRS Code Sec. 857(b)(8). We declare special dividends when we compute our REIT taxable income in an amount that exceeds our regular dividends for the fiscal year.
Off Balance Sheet Arrangements
We currently have no outstanding guarantees. For additional information on our letter of credit with Sycamore, an affiliate of Bickford, see our discussion in this section under Contractual Obligations and Contingent Liabilities, below. Our equity method investment in OpCo is intended to be self-financing, and aside from initial investments therein, no direct support has been provided by NHI to OpCo since inception on September 30, 2012. We have concluded that OpCo meets the accounting criteria to be considered a VIE. However, because we do not control the entity, nor do we have any role in the day-to-day management, we are not the primary beneficiary of the entity, and we account for our investment using the equity method. We have no material obligation arising from our investment in OpCo, and we believe our maximum exposure to loss at December 31, 2015, due to this involvement, would be limited to our equity interest and a related deferred tax asset of $707,000 at December 31, 2015. Our loans to LCS-WP and our lease with East Lake represent variable interests in those enterprises. However, because we do not control these entities, nor do we have any role in their day-to-day management, we are not their primary beneficiary. Except as discussed below under Contractual Obligations and Contingent Liabilities, we have no further material obligations arising from our transactions with these entities, and we believe our maximum exposure to loss at December 31, 2015, due to this involvement would be limited to our contractual commitments and contingent liabilities and the amount of our current investments with them, as detailed further in Notes 2, 4 and 8 to the consolidated financial statements.
44
Contractual Obligations and Contingent Liabilities
As of December 31, 2015, our contractual payment obligations and contingent liabilities are more fully described in the notes to the consolidated financial statements and were as follows (in thousands):
Total | Less than 1 year | 1-3 years | 3-5 years | More than 5 years | |||||||||||||||
Debt, including interest1 | $ | 1,213,877 | $ | 37,960 | $ | 113,850 | $ | 536,000 | $ | 526,067 | |||||||||
Real estate purchase liabilities | 750 | 750 | — | — | — | ||||||||||||||
Construction commitments | 39,770 | 39,770 | — | — | — | ||||||||||||||
Loan commitments | 79,846 | 79,846 | — | — | — | ||||||||||||||
$ | 1,334,243 | $ | 158,326 | $ | 113,850 | $ | 536,000 | $ | 526,067 | ||||||||||
1 Interest is calculated based on the weighted average interest rate of outstanding debt balances as of December 31, 2015. The calculation also includes an unused commitment fee of .40%.
Commitments and Contingencies
The following table summarizes information as of December 31, 2015 related to our outstanding commitments and contingencies which are more fully described in the notes to the consolidated financial statements.
Asset Class | Type | Total | Funded | Remaining | |||||||||||
Commitments: | |||||||||||||||
Life Care Services | SHO | Construction Loan | $ | 154,500,000 | $ | (83,411,000 | ) | $ | 71,089,000 | ||||||
Bickford Senior Living | SHO | Construction | $ | 55,000,000 | $ | (17,436,000 | ) | $ | 37,564,000 | ||||||
Senior Living Communities | SHO | Revolving Credit | $ | 15,000,000 | $ | (6,282,000 | ) | $ | 8,718,000 | ||||||
Capital Funding Group | Mezz. Note | Revolving Credit | $ | 15,000,000 | $ | (15,000,000 | ) | $ | — | ||||||
Chancellor Health Care | SHO | Construction | $ | 650,000 | $ | (33,000 | ) | $ | 617,000 | ||||||
Santé Partners | SHO | Renovation | $ | 3,500,000 | $ | (2,621,000 | ) | $ | 879,000 | ||||||
Senior Living Management | SHO | Renovation | $ | 1,430,000 | $ | (1,165,000 | ) | $ | 265,000 | ||||||
Bickford Senior Living | SHO | Renovation | $ | 620,000 | $ | (575,000 | ) | $ | 45,000 | ||||||
Sycamore Street (Bickford affiliate) | SHO | Revolving Credit | $ | 500,000 | $ | (461,000 | ) | $ | 39,000 | ||||||
East Lake Capital Management | SHO | Renovation | $ | 400,000 | $ | — | $ | 400,000 | |||||||
Contingencies: | |||||||||||||||
East Lake Capital Management | SHO | Lease Inducement | $ | 8,000,000 | $ | — | $ | 8,000,000 | |||||||
East Lake Capital Management | SHO | Seller Earnout | $ | 750,000 | $ | — | $ | 750,000 | |||||||
Sycamore Street (Bickford affiliate) | SHO | Letter-of-credit | $ | 3,550,000 | $ | — | $ | 3,550,000 | |||||||
Discovery Senior Living | SHO | Lease Inducement | $ | 2,500,000 | $ | — | $ | 2,500,000 | |||||||
Santé Partners | SHO | Lease Inducement | $ | 2,000,000 | $ | — | $ | 2,000,000 | |||||||
Litigation
Our facilities are subject to claims and suits in the ordinary course of business. Our lessees and borrowers have indemnified, and are obligated to continue to indemnify us, against all liabilities arising from the operation of the facilities, and are further obligated to indemnify us against environmental or title problems affecting the real estate underlying such facilities. While there may be lawsuits pending against certain of the owners and/or lessees of the facilities, management believes that the ultimate resolution of all such pending proceedings will have no material adverse effect on our financial condition, results of operations or cash flows.
45
FFO, AFFO & FAD
These supplemental operating performance measures may not be comparable to similarly titled measures used by other REITs. Consequently, our Funds From Operations ("FFO"), Normalized FFO, Normalized Adjusted Funds From Operations ("AFFO") and Normalized Funds Available for Distribution ("FAD") may not provide a meaningful measure of our performance as compared to that of other REITs. Since other REITs may not use our definition of these operating performance measures, caution should be exercised when comparing our Company's FFO, Normalized FFO, Normalized AFFO and Normalized FAD to that of other REITs. These financial performance measures do not represent cash generated from operating activities in accordance with generally accepted accounting principles ("GAAP") (these measures do not include changes in operating assets and liabilities) and therefore should not be considered an alternative to net earnings as an indication of operating performance, or to net cash flow from operating activities as determined by GAAP as a measure of liquidity, and are not necessarily indicative of cash available to fund cash needs.
Funds From Operations - FFO
Our FFO per diluted common share for the year ended December 31, 2015 increased $1.16 (28%) over the same period in 2014. Our normalized FFO for the year ended December 31, 2015 increased $0.47 (11%) over the same period in 2014, primarily as the result of our new real estate investments in 2014 and 2015. FFO, as defined by the National Association of Real Estate Investment Trusts ("NAREIT") and applied by us, is net income (computed in accordance with GAAP), excluding gains (or losses) from sales of real estate property, plus real estate depreciation and amortization, and after adjustments for unconsolidated partnerships and joint ventures, if any. The Company’s computation of FFO may not be comparable to FFO reported by other REITs that do not define the term in accordance with the current NAREIT definition or have a different interpretation of the current NAREIT definition from that of the Company; therefore, caution should be exercised when comparing our Company’s FFO to that of other REITs. Diluted FFO assumes the exercise of stock options and other potentially dilutive securities. Normalized FFO excludes from FFO certain items which, due to their infrequent or unpredictable nature, may create some difficulty in comparing FFO for the current period to similar prior periods, and may include, but are not limited to, impairment of non-real estate assets, gains and losses attributable to the acquisition and disposition of assets and liabilities, and recoveries of previous write-downs.
FFO and normalized FFO are important supplemental measures of operating performance for a REIT. Because the historical cost accounting convention used for real estate assets requires depreciation (except on land), such accounting presentation implies that the value of real estate assets diminishes predictably over time. Since real estate values instead have historically risen and fallen with market conditions, presentations of operating results for a REIT that uses historical cost accounting for depreciation could be less informative, and should be supplemented with a measure such as FFO. The term FFO was designed by the REIT industry to address this issue.
Adjusted Funds From Operations - AFFO
Our normalized AFFO per diluted common share for the year ended December 31, 2015 increased $0.35 (9.3%) over the same period in 2014 due primarily to the impact of real estate investments completed during 2014 and 2015. In addition to the adjustments included in the calculation of normalized FFO, normalized AFFO excludes the impact of any straight-line rent revenue, amortization of the original issue discount on our convertible senior notes and amortization of debt issuance costs.
Normalized AFFO is an important supplemental measure of operating performance for a REIT. GAAP requires a lessor to recognize contractual lease payments into income on a straight-line basis over the expected term of the lease. This straight-line adjustment has the effect of reporting lease income that is significantly more or less than the contractual cash flows received pursuant to the terms of the lease agreement. GAAP also requires the original issue discount of our convertible senior notes and debt issuance costs to be amortized as non-cash adjustments to earnings. Normalized AFFO is useful to our investors as it reflects the growth inherent in the contractual lease payments of our real estate portfolio.
Funds Available for Distribution - FAD
Our normalized FAD per diluted common share for the year ended December 31, 2015 increased $0.35 (9.2%) over the same period in 2014 due primarily to the impact of real estate investments completed during 2014 and 2015. In addition to the adjustments included in the calculation of normalized AFFO, normalized FAD excludes the impact of non-cash stock based compensation. Normalized FAD is an important supplemental measure of operating performance for a REIT as a useful indicator of the ability to distribute dividends to shareholders.
46
The following table reconciles net income attributable to common stockholders, the most directly comparable GAAP metric, to FFO, Normalized FFO, Normalized AFFO and Normalized FAD and is presented for both basic and diluted weighted average common shares (in thousands, except share and per share amounts):
Years ended December 31, | |||||||||||
2015 | 2014 | 2013 | |||||||||
Net income attributable to common stockholders | $ | 148,862 | $ | 101,609 | $ | 106,183 | |||||
Elimination of certain non-cash items in net income: | |||||||||||
Depreciation | 53,163 | 38,078 | 20,101 | ||||||||
Depreciation related to noncontrolling interest | (1,150 | ) | (1,002 | ) | (634 | ) | |||||
Depreciation in discontinued operations | — | — | 557 | ||||||||
Net gain on sales of real estate | (1,126 | ) | — | (22,258 | ) | ||||||
NAREIT FFO attributable to common stockholders | $ | 199,749 | $ | 138,685 | $ | 103,949 | |||||
Investment and other gains | (23,529 | ) | — | (3,256 | ) | ||||||
Debt issuance costs expensed due to credit facility modifications | — | 2,145 | 416 | ||||||||
Write-off of unamortized debt premium | — | (1,655 | ) | — | |||||||
Non-cash write-off of straight-line rent receivable | — | 932 | — | ||||||||
Acquisition costs under business combination accounting | — | 89 | 208 | ||||||||
Recovery of previous write-down | (491 | ) | — | 1,976 | |||||||
Normalized FFO | $ | 175,729 | $ | 140,196 | $ | 103,293 | |||||
Straight-line lease revenue, net | (24,623 | ) | (16,463 | ) | (6,560 | ) | |||||
Non-cash write-off of straight-line rent receivable | — | (932 | ) | — | |||||||
Straight-line lease revenue, net, related to noncontrolling interest | 40 | 71 | 55 | ||||||||
Amortization of original issue discount | 1,101 | 798 | — | ||||||||
Amortization of debt issuance costs | 2,311 | 1,782 | 663 | ||||||||
Amortization of debt issuance costs related to noncontrolling interest | (30 | ) | (11 | ) | (3 | ) | |||||
Normalized AFFO | $ | 154,528 | $ | 125,441 | $ | 97,448 | |||||
Non-cash stock based compensation | 2,134 | 2,020 | 2,339 | ||||||||
Normalized FAD | $ | 156,662 | $ | 127,461 | $ | 99,787 | |||||
BASIC | |||||||||||
Weighted average common shares outstanding | 37,604,594 | 33,375,966 | 28,362,398 | ||||||||
FFO per common share | $ | 5.31 | $ | 4.16 | $ | 3.67 | |||||
Normalized FFO per common share | $ | 4.67 | $ | 4.20 | $ | 3.64 | |||||
Normalized AFFO per common share | $ | 4.11 | $ | 3.76 | $ | 3.44 | |||||
Normalized FAD per common share | $ | 4.17 | $ | 3.82 | $ | 3.52 | |||||
DILUTED | |||||||||||
Weighted average common shares outstanding | 37,644,171 | 33,416,014 | 28,397,702 | ||||||||
FFO per common share | $ | 5.31 | $ | 4.15 | $ | 3.66 | |||||
Normalized FFO per common share | $ | 4.67 | $ | 4.20 | $ | 3.64 | |||||
Normalized AFFO per common share | $ | 4.10 | $ | 3.75 | $ | 3.43 | |||||
Normalized FAD per common share | $ | 4.16 | $ | 3.81 | $ | 3.51 | |||||
47
Adjusted EBITDA
We consider Adjusted EBITDA to be an important supplemental measure because it provides information which we use to evaluate our performance and serves as an indication of our ability to service debt. We define Adjusted EBITDA as consolidated earnings before interest, taxes, depreciation and amortization, including amounts in discontinued operations, excluding real estate asset impairments and gains on dispositions and certain items which, due to their infrequent or unpredictable nature, may create some difficulty in comparing Adjusted EBITDA for the current period to similar prior periods, and may include, but are not limited to, impairment of non-real estate assets, gains and losses attributable to the acquisition and disposition of assets and liabilities, and recoveries of previous write-downs. Since others may not use our definition of Adjusted EBITDA, caution should be exercised when comparing our Adjusted EBITDA to that of other companies.
The following table reconciles net income, the most directly comparable GAAP metric, to Adjusted EBITDA:
December 31, | |||||||||||
2015 | 2014 | 2013 | |||||||||
Net income | $ | 150,314 | $ | 103,052 | $ | 107,182 | |||||
Interest expense at contractual rates | 34,573 | 23,878 | 8,944 | ||||||||
Franchise, excise and other taxes | 985 | 620 | 488 | ||||||||
Income tax benefit (expense) of taxable REIT subsidiary | (707 | ) | — | 128 | |||||||
Depreciation in continuing and discontinued operations | 53,163 | 38,078 | 20,658 | ||||||||
Amortization of debt issuance costs and bond discount | 3,413 | 2,580 | 247 | ||||||||
Net gain on sales of real estate | (1,126 | ) | — | (22,258 | ) | ||||||
Investment and other gains | (23,529 | ) | — | (3,256 | ) | ||||||
Debt issuance costs expensed due to credit facility modifications | — | 2,145 | 416 | ||||||||
Write-off of unamortized debt premium | — | (1,655 | ) | — | |||||||
Non-cash write-off of straight-line rent receivable | — | 932 | — | ||||||||
Acquisition costs under business combination accounting | — | 89 | 208 | ||||||||
Recovery of previous write-down | (491 | ) | — | 1,976 | |||||||
Adjusted EBITDA | $ | 216,595 | $ | 169,719 | $ | 114,733 | |||||
48
ITEM 7A. QUANTITATIVE AND QUALITATIVE DISCLOSURES ABOUT MARKET RISK.
Interest Rate Risk
At December 31, 2015, we were exposed to market risks related to fluctuations in interest rates on approximately $34,000,000 of variable-rate indebtedness (excluding $250,000,000 of variable-rate debt that has been hedged through interest-rate swap contracts) and on our mortgage and other notes receivable. The unused portion ($516,000,000 at December 31, 2015) of our credit facility, should it be drawn upon, is subject to variable rates.
Interest rate fluctuations will generally not affect our future earnings or cash flows on our fixed rate debt and loans receivable unless such instruments mature or are otherwise terminated. However, interest rate changes will affect the fair value of our fixed rate instruments. Conversely, changes in interest rates on variable rate debt and investments would change our future earnings and cash flows, but not significantly affect the fair value of those instruments. Assuming a 50 basis point increase or decrease in the interest rate related to variable-rate debt, and assuming no change in the outstanding balance as of December 31, 2015, net interest expense would increase or decrease annually by approximately $170,000 or $.00 per common share on a diluted basis.
We use derivative financial instruments in the normal course of business to mitigate interest rate risk. We do not use derivative financial instruments for speculative purposes. Derivatives are included in the Consolidated Balance Sheets at their fair value. We may engage in hedging strategies to manage our exposure to market risks in the future, depending on an analysis of the interest rate environment and the costs and risks of such strategies.
The following table sets forth certain information with respect to our debt (dollar amounts in thousands):
December 31, 2015 | December 31, 2014 | ||||||||||||||||||
Balance1 | % of total | Rate5 | Balance1 | % of total | Rate5 | ||||||||||||||
Fixed rate: | |||||||||||||||||||
Convertible senior notes | $ | 200,000 | 21.4 | % | 3.25 | % | $ | 200,000 | 23.0 | % | 3.25 | % | |||||||
Unsecured term loans2 | 575,000 | 61.6 | % | 4.03 | % | 250,000 | 28.7 | % | 3.79 | % | |||||||||
HUD mortgage loans3 | 46,608 | 5.0 | % | 4.04 | % | 47,352 | 5.4 | % | 4.04 | % | |||||||||
Fannie Mae mortgage loans4 | 78,084 | 8.4 | % | 3.79 | % | — | — | — | |||||||||||
Variable rate: | |||||||||||||||||||
Unsecured revolving credit facility | 34,000 | 3.6 | % | 1.93 | % | 374,000 | 42.9 | % | 1.66 | % | |||||||||
$ | 933,692 | 100.0 | % | 3.77 | % | $ | 871,352 | 100.0 | % | 2.77 | % | ||||||||
1 Differs from carrying amount due to unamortized discount. | |||||||||||||||||||
2 Includes seven term loans in 2015 and three term loans in 2014; rate is a weighted average | |||||||||||||||||||
3 Includes 10 HUD mortgages; rate is a weighted average inclusive of a mortgage insurance premium | |||||||||||||||||||
4 Includes 13 Fannie Mae mortgages | |||||||||||||||||||
5 Total is weighted average rate | |||||||||||||||||||
The unsecured term loans in the table above give effect to $40,000,000, $80,000,000, and $130,000,000 notional amount interest rate swaps with maturities of April 2019, June 2020 and June 2020, respectively, that effectively convert variable rate debt to fixed rate debt. These loans bear interest at LIBOR plus a spread, currently 175 basis points, based on our Consolidated Coverage Ratio, as defined.
49
To highlight the sensitivity of our fixed-rate loans to changes in interest rates, the following summary shows the effects on fair value ("FV") assuming a parallel shift of 50 basis points ("bps") in market interest rates for a contract with similar maturities as of December 31, 2015 (dollar amounts in thousands):
Balance | Fair Value1 | FV reflecting change in interest rates | |||||||||||||
Fixed rate: | -50 bps | +50 bps | |||||||||||||
Private placement term loans - unsecured | $ | 325,000 | $ | 322,597 | $ | 334,993 | $ | 310,742 | |||||||
Convertible senior notes | 200,000 | 196,203 | 201,214 | 191,323 | |||||||||||
Fannie Mae mortgage loans | 78,084 | 76,105 | 79,126 | 73,213 | |||||||||||
HUD mortgage loans | 46,609 | 46,161 | 49,605 | 43,047 | |||||||||||
1 The change in fair value of our fixed rate debt was due primarily to the overall change in interest rates. | |||||||||||||||
At December 31, 2015, the fair value of our mortgage loans receivable, discounted for estimated changes in the risk-free rate, was approximately $141,408,000. A 50 basis point increase in market rates would decrease the estimated fair value of our mortgage loans by approximately $2,840,000, while a 50 basis point decrease in such rates would increase their estimated fair value by approximately $2,951,000.
Equity Price Risk
We are exposed to equity price risk, which is the potential change in fair value due to a change in quoted market prices. We account for our investments in marketable securities, with a fair value of $72,744,000 at December 31, 2015, as available-for-sale securities. Increases and decreases in the fair market value of our investments in other marketable securities are unrealized gains and losses that are presented as a component of other comprehensive income. The investments in marketable securities are recorded at their fair value based on quoted market prices. Thus, there is exposure to equity price risk. We monitor our investments in marketable securities to consider evidence of whether any portion of our original investment is likely not to be recoverable, at which time we would record an impairment charge to operations. A hypothetical 10% change in quoted market prices would result in a related $7,274,000 change in the fair value of our investments in marketable securities.
50
ITEM 8. FINANCIAL STATEMENTS AND SUPPLEMENTARY DATA.
REPORT OF INDEPENDENT REGISTERED PUBLIC ACCOUNTING FIRM
Board of Directors and Stockholders
National Health Investors, Inc.
Murfreesboro, Tennessee
We have audited the accompanying consolidated balance sheets of National Health Investors, Inc. as of December 31, 2015 and 2014 and the related consolidated statements of income, comprehensive income, equity, and cash flows for each of the three years in the period ended December 31, 2015. These financial statements are the responsibility of the Company’s management. Our responsibility is to express an opinion on these financial statements based on our audits.
We conducted our audits in accordance with the standards of the Public Company Accounting Oversight Board (United States). Those standards require that we plan and perform the audit to obtain reasonable assurance about whether the financial statements are free of material misstatement. An audit includes examining, on a test basis, evidence supporting the amounts and disclosures in the financial statements, assessing the accounting principles used and significant estimates made by management, as well as evaluating the overall financial statement presentation. We believe that our audits provide a reasonable basis for our opinion.
In our opinion, the consolidated financial statements referred to above present fairly, in all material respects, the financial position of National Health Investors, Inc. at December 31, 2015 and 2014, and the results of its operations and its cash flows for each of the three years in the period ended December 31, 2015, in conformity with accounting principles generally accepted in the United States of America.
We also have audited, in accordance with the standards of the Public Company Accounting Oversight Board (United States), National Health Investors, Inc.’s internal control over financial reporting as of December 31, 2015, based on criteria established in Internal Control — Integrated Framework (2013) issued by the Committee of Sponsoring Organizations of the Treadway Commission (COSO) and our report dated February 17, 2016 expressed an unqualified opinion thereon.
/s/ BDO USA, LLP
Nashville, Tennessee
February 17, 2016
51
NATIONAL HEALTH INVESTORS, INC.
CONSOLIDATED BALANCE SHEETS
(in thousands, except share and per share amounts)
December 31, | |||||||
Assets: | 2015 | 2014 | |||||
Real estate properties: | |||||||
Land | $ | 137,532 | $ | 127,566 | |||
Buildings and improvements | 1,945,323 | 1,854,855 | |||||
Construction in progress | 13,011 | 6,428 | |||||
2,095,866 | 1,988,849 | ||||||
Less accumulated depreciation | (259,059 | ) | (212,300 | ) | |||
Real estate properties, net | 1,836,807 | 1,776,549 | |||||
Mortgage and other notes receivable, net | 135,031 | 63,630 | |||||
Investment in preferred stock, at cost | — | 38,132 | |||||
Cash and cash equivalents | 13,286 | 3,287 | |||||
Marketable securities | 72,744 | 15,503 | |||||
Straight-line rent receivable | 59,777 | 35,154 | |||||
Equity-method investment and other assets | 27,358 | 50,705 | |||||
Assets held for sale, net | 1,346 | — | |||||
Total Assets | $ | 2,146,349 | $ | 1,982,960 | |||
Liabilities and Equity: | |||||||
Debt | $ | 926,257 | $ | 862,726 | |||
Real estate purchase liabilities | 750 | 3,000 | |||||
Accounts payable and accrued expenses | 19,397 | 15,718 | |||||
Dividends payable | 32,637 | 28,864 | |||||
Lease deposit liabilities | 21,275 | 21,648 | |||||
Deferred income | 3,573 | 1,071 | |||||
Total Liabilities | 1,003,889 | 933,027 | |||||
Commitments and Contingencies | |||||||
National Health Investors Stockholders' Equity: | |||||||
Common stock, $.01 par value; 60,000,000 shares authorized; | |||||||
38,396,727 and 37,485,902 shares issued and outstanding, respectively | 384 | 375 | |||||
Capital in excess of par value | 1,085,136 | 1,033,896 | |||||
Cumulative net income in excess (deficit) of dividends | 19,862 | (569 | ) | ||||
Accumulated other comprehensive income | 27,910 | 6,223 | |||||
Total National Health Investors Stockholders' Equity | 1,133,292 | 1,039,925 | |||||
Noncontrolling interest | 9,168 | 10,008 | |||||
Total Equity | 1,142,460 | 1,049,933 | |||||
Total Liabilities and Equity | $ | 2,146,349 | $ | 1,982,960 | |||
The accompanying notes to consolidated financial statements are an integral part of these consolidated financial statements.
52
NATIONAL HEALTH INVESTORS, INC.
CONSOLIDATED STATEMENTS OF INCOME
(in thousands, except share and per share amounts)
Year Ended December 31, | |||||||||||
2015 | 2014 | 2013 | |||||||||
Revenues: | |||||||||||
Rental income | $ | 214,447 | $ | 166,279 | $ | 106,029 | |||||
Interest income from mortgage and other notes | 9,978 | 7,013 | 7,633 | ||||||||
Investment income and other | 4,563 | 4,217 | 4,166 | ||||||||
228,988 | 177,509 | 117,828 | |||||||||
Expenses: | |||||||||||
Depreciation | 53,163 | 38,078 | 20,101 | ||||||||
Interest | 37,629 | 26,372 | 9,229 | ||||||||
Legal | 464 | 209 | 784 | ||||||||
Franchise, excise and other taxes | 985 | 620 | 488 | ||||||||
General and administrative | 10,519 | 9,107 | 9,254 | ||||||||
Loan and realty losses (recoveries), net | (491 | ) | — | 1,976 | |||||||
102,269 | 74,386 | 41,832 | |||||||||
Income before equity-method investee, income tax benefit (expense), investment and | |||||||||||
other gains, discontinued operations and noncontrolling interest | 126,719 | 103,123 | 75,996 | ||||||||
Income (loss) from equity-method investee | (1,767 | ) | (71 | ) | 324 | ||||||
Income tax benefit (expense) of taxable REIT subsidiary | 707 | — | (128 | ) | |||||||
Investment and other gains | 24,655 | — | 3,306 | ||||||||
Income from continuing operations | 150,314 | 103,052 | 79,498 | ||||||||
Discontinued operations | |||||||||||
Income from operations - discontinued | — | — | 5,426 | ||||||||
Gain on sale of discontinued operations | — | — | 22,258 | ||||||||
Income from discontinued operations | — | — | 27,684 | ||||||||
Net income | 150,314 | 103,052 | 107,182 | ||||||||
Less: net income attributable to noncontrolling interest | (1,452 | ) | (1,443 | ) | (999 | ) | |||||
Net income attributable to common stockholders | $ | 148,862 | $ | 101,609 | $ | 106,183 | |||||
Weighted average common shares outstanding: | |||||||||||
Basic | 37,604,594 | 33,375,966 | 28,362,398 | ||||||||
Diluted | 37,644,171 | 33,416,014 | 28,397,702 | ||||||||
Earnings per common share: | |||||||||||
Basic: | |||||||||||
Income from continuing operations attributable to common stockholders | $ | 3.96 | $ | 3.04 | $ | 2.77 | |||||
Discontinued operations | — | — | .97 | ||||||||
Net income per common share attributable to common stockholders | $ | 3.96 | $ | 3.04 | $ | 3.74 | |||||
Diluted: | |||||||||||
Income from continuing operations attributable to common stockholders | $ | 3.95 | $ | 3.04 | $ | 2.77 | |||||
Discontinued operations | — | — | .97 | ||||||||
Net income per common share attributable to common stockholders | $ | 3.95 | $ | 3.04 | $ | 3.74 | |||||
The accompanying notes to consolidated financial statements are an integral part of these consolidated financial statements.
53
NATIONAL HEALTH INVESTORS, INC.
CONSOLIDATED STATEMENTS OF COMPREHENSIVE INCOME
(in thousands)
Year Ended December 31, | |||||||||||
2015 | 2014 | 2013 | |||||||||
Net income | $ | 150,314 | $ | 103,052 | $ | 107,182 | |||||
Other comprehensive income: | |||||||||||
Change in unrealized gains on securities | 46,780 | 2,853 | (234 | ) | |||||||
Less: reclassification adjustment for gains in net income | (23,529 | ) | — | — | |||||||
Increase (decrease) in fair value of cash flow hedge | 2,934 | (2,032 | ) | 3,563 | |||||||
Less: reclassification adjustment for amounts recognized in net income | (4,498 | ) | (4,136 | ) | (1,346 | ) | |||||
Net change in cash flow hedge liability | (1,564 | ) | (6,168 | ) | 2,217 | ||||||
Total other comprehensive income (loss) | 21,687 | (3,315 | ) | 1,983 | |||||||
Comprehensive income | 172,001 | 99,737 | 109,165 | ||||||||
Less: comprehensive income attributable to noncontrolling interest | (1,452 | ) | (1,443 | ) | (999 | ) | |||||
Comprehensive income attributable to common stockholders | $ | 170,549 | $ | 98,294 | $ | 108,166 | |||||
The accompanying notes to consolidated financial statements are an integral part of these consolidated financial statements.
54
NATIONAL HEALTH INVESTORS, INC.
CONSOLIDATED STATEMENTS OF CASH FLOWS
(in thousands)
Year Ended December 31, | |||||||||||
2015 | 2014 | 2013 | |||||||||
Cash flows from operating activities: | |||||||||||
Net income | $ | 150,314 | $ | 103,052 | $ | 107,182 | |||||
Adjustments to reconcile net income to net cash provided by | |||||||||||
operating activities: | |||||||||||
Depreciation | 53,163 | 38,078 | 20,658 | ||||||||
Amortization | 3,472 | 2,611 | 247 | ||||||||
Straight-line rental income | (24,623 | ) | (16,463 | ) | (6,560 | ) | |||||
Non-cash interest income on construction loan | (411 | ) | — | — | |||||||
Unamortized debt premium written off | — | (1,655 | ) | — | |||||||
Write-off of debt issuance costs | — | 2,145 | 416 | ||||||||
Loan and realty losses (recoveries), net | (491 | ) | — | 1,976 | |||||||
Gain on sale of real estate | (1,126 | ) | — | (22,258 | ) | ||||||
Gain on purchase liability settlement | — | — | (3,256 | ) | |||||||
Net realized gains on sales of marketable securities | (23,529 | ) | — | — | |||||||
Share-based compensation | 2,134 | 2,020 | 2,339 | ||||||||
(Income) loss from equity-method investee | 1,767 | 71 | (324 | ) | |||||||
Change in operating assets and liabilities: | |||||||||||
Equity-method investment and other assets | 216 | (2,334 | ) | (659 | ) | ||||||
Accounts payable and accrued expenses | 1,038 | 1,448 | 2,495 | ||||||||
Deferred income | 2,501 | (2,830 | ) | 1,937 | |||||||
Net cash provided by operating activities | 164,425 | 126,143 | 104,193 | ||||||||
Cash flows from investing activities: | |||||||||||
Investment in mortgage and other notes receivable | (92,249 | ) | (4,447 | ) | (11,082 | ) | |||||
Collection of mortgage and other notes receivable | 21,495 | 1,456 | 18,976 | ||||||||
Investment in real estate | (106,315 | ) | (520,505 | ) | (635,971 | ) | |||||
Investment in real estate development | (14,641 | ) | (8,455 | ) | (11,926 | ) | |||||
Investment in renovations of existing real estate | (3,157 | ) | (4,211 | ) | (6,773 | ) | |||||
Payments into facility repair escrows | — | (1,554 | ) | — | |||||||
Payment of real estate purchase liability | — | (2,600 | ) | — | |||||||
Proceeds from disposition of real estate properties | 9,593 | — | 20,952 | ||||||||
Purchases of marketable securities | (8,458 | ) | — | — | |||||||
Proceeds from sales of marketable securities | 57,406 | — | — | ||||||||
Net cash used in investing activities | (136,326 | ) | (540,316 | ) | (625,824 | ) | |||||
Cash flows from financing activities: | |||||||||||
Net change in borrowings under revolving credit facilities | (340,000 | ) | 207,000 | 103,000 | |||||||
Proceeds from convertible senior notes | — | 200,000 | — | ||||||||
Proceeds from issuance of secured debt | 78,084 | 38,007 | — | ||||||||
Proceeds from borrowings on term loans | 325,000 | 130,000 | 330,000 | ||||||||
Payments of term loans | (742 | ) | (328,515 | ) | (99,655 | ) | |||||
Debt issuance costs | (2,608 | ) | (8,443 | ) | (5,867 | ) | |||||
Proceeds from equity offering, net | 49,114 | 270,798 | 282,542 | ||||||||
Proceeds from exercise of stock options | 1 | — | 146 | ||||||||
Distributions to noncontrolling interest | (2,292 | ) | (2,049 | ) | (1,250 | ) | |||||
Dividends paid to stockholders | (124,657 | ) | (100,650 | ) | (85,145 | ) | |||||
Net cash (used in) provided by financing activities | (18,100 | ) | 406,148 | 523,771 | |||||||
Increase (decrease) in cash and cash equivalents | 9,999 | (8,025 | ) | 2,140 | |||||||
Cash and cash equivalents, beginning of period | 3,287 | 11,312 | 9,172 | ||||||||
Cash and cash equivalents, end of period | $ | 13,286 | $ | 3,287 | $ | 11,312 | |||||
The accompanying notes to consolidated financial statements are an integral part of these consolidated financial statements.
55
NATIONAL HEALTH INVESTORS, INC.
CONSOLIDATED STATEMENTS OF CASH FLOWS (CONTINUED)
(in thousands)
Year Ended December 31, | |||||||||||
2015 | 2014 | 2013 | |||||||||
Supplemental disclosure of cash flow information: | |||||||||||
Interest paid, net of amounts capitalized | $ | 31,289 | $ | 22,172 | $ | 7,964 | |||||
Supplemental disclosure of non-cash investing and financing activities: | |||||||||||
Settlement of mortgage note by real estate acquisition | $ | — | $ | — | $ | 13,741 | |||||
Lease escrow deposits | $ | — | $ | — | $ | 22,775 | |||||
Escrow deposit for tax deferred exchange | $ | — | $ | — | $ | 23,813 | |||||
Tax deferred exchange funds applied to investment in real estate | $ | — | $ | 23,813 | $ | — | |||||
Conditional consideration in asset acquisition | $ | 750 | $ | 3,000 | $ | 1,600 | |||||
Settlement of contingent asset acquisition liability | $ | (3,000 | ) | $ | — | $ | — | ||||
Accounts payable increase due to investments in real estate | $ | 1,076 | $ | 2,091 | $ | 3,086 | |||||
Accounts payable increase due to escrow deposits | $ | — | $ | 2,062 | $ | — | |||||
Reclass of note balance into real estate investment | $ | 255 | $ | — | $ | — | |||||
Assumption of debt in real estate acquisition, at fair value | $ | — | $ | 7,858 | $ | 80,528 | |||||
Assignment of net assets in equity-method investee | $ | — | $ | — | $ | 817 | |||||
Conversion of investment in preferred stock to common | $ | 38,132 | $ | — | $ | — | |||||
The accompanying notes to consolidated financial statements are an integral part of these consolidated financial statements.
56
NATIONAL HEALTH INVESTORS, INC.
CONSOLIDATED STATEMENTS OF EQUITY
(in thousands except share and per share amounts)
Common Stock | Capital in Excess of Par Value | Cumulative Net Income in Excess (Deficit) of Dividends | Accumulated Other Comprehensive Income | Total National Health Investors Stockholders' Equity | Noncontrolling Interest | Total Equity | ||||||||||||||||||||||||
Shares | Amount | |||||||||||||||||||||||||||||
Balances at December 31, 2012 | 27,857,217 | $ | 279 | $ | 467,843 | $ | (18,495 | ) | $ | 7,555 | $ | 457,182 | $ | 10,865 | $ | 468,047 | ||||||||||||||
Total comprehensive income | — | — | — | 106,183 | 1,983 | 108,166 | 999 | 109,165 | ||||||||||||||||||||||
Distributions to noncontrolling interest | — | — | — | — | — | — | (1,250 | ) | (1,250 | ) | ||||||||||||||||||||
Issuance of common stock, net | 5,175,000 | 51 | 282,490 | — | — | 282,541 | — | 282,541 | ||||||||||||||||||||||
Shares issued on stock options exercised | 18,959 | — | 146 | — | — | 146 | — | 146 | ||||||||||||||||||||||
Share-based compensation | — | — | 2,339 | — | — | 2,339 | — | 2,339 | ||||||||||||||||||||||
Assignment of net assets in equity-method investee | — | — | 817 | — | — | 817 | — | 817 | ||||||||||||||||||||||
Dividends declared, $2.90 per common share | — | — | — | (84,645 | ) | — | (84,645 | ) | — | (84,645 | ) | |||||||||||||||||||
Balances at December 31, 2013 | 33,051,176 | $ | 330 | $ | 753,635 | $ | 3,043 | $ | 9,538 | $ | 766,546 | $ | 10,614 | $ | 777,160 | |||||||||||||||
Total comprehensive income | — | — | — | 101,609 | (3,315 | ) | 98,294 | 1,443 | 99,737 | |||||||||||||||||||||
Distributions to noncontrolling interest | — | — | — | — | — | — | (2,049 | ) | (2,049 | ) | ||||||||||||||||||||
Issuance of common stock, net | 4,427,500 | 44 | 270,754 | — | — | 270,798 | — | 270,798 | ||||||||||||||||||||||
Shares issued on stock options exercised | 7,226 | 1 | — | — | — | 1 | — | 1 | ||||||||||||||||||||||
Share-based compensation | — | — | 2,020 | — | — | 2,020 | — | 2,020 | ||||||||||||||||||||||
Equity component of convertible debt | — | — | 7,487 | — | — | 7,487 | — | 7,487 | ||||||||||||||||||||||
Dividends declared, $3.08 per common share | — | — | — | (105,221 | ) | — | (105,221 | ) | — | (105,221 | ) | |||||||||||||||||||
Balances at December 31, 2014 | 37,485,902 | $ | 375 | $ | 1,033,896 | $ | (569 | ) | $ | 6,223 | $ | 1,039,925 | $ | 10,008 | $ | 1,049,933 | ||||||||||||||
Total comprehensive income | — | — | — | 148,862 | 21,687 | 170,549 | 1,452 | 172,001 | ||||||||||||||||||||||
Distributions to noncontrolling interest | — | — | — | — | — | — | (2,292 | ) | (2,292 | ) | ||||||||||||||||||||
Issuance of common stock, net | 830,506 | 8 | 49,381 | — | — | 49,389 | — | 49,389 | ||||||||||||||||||||||
Equity offerring costs | — | — | (275 | ) | — | — | (275 | ) | — | (275 | ) | |||||||||||||||||||
Shares issued on stock options exercised | 80,319 | 1 | — | — | — | 1 | — | 1 | ||||||||||||||||||||||
Share-based compensation | — | — | 2,134 | — | — | 2,134 | — | 2,134 | ||||||||||||||||||||||
Dividends declared, $3.40 per common share | — | — | — | (128,431 | ) | — | (128,431 | ) | — | (128,431 | ) | |||||||||||||||||||
Balances at December 31, 2015 | 38,396,727 | $ | 384 | $ | 1,085,136 | $ | 19,862 | $ | 27,910 | $ | 1,133,292 | $ | 9,168 | $ | 1,142,460 | |||||||||||||||
The accompanying notes to consolidated financial statements are an integral part of these consolidated financial statements.
57
NATIONAL HEALTH INVESTORS, INC.
NOTES TO CONSOLIDATED FINANCIAL STATEMENTS
December 31, 2015
NOTE 1. SIGNIFICANT ACCOUNTING POLICIES
The Company - National Health Investors, Inc. ("NHI" or the "Company"), a Maryland corporation incorporated and publicly listed in 1991, is a real estate investment trust (“REIT”) specializing in sale-leaseback, joint-venture, mortgage and mezzanine financing of need-driven and discretionary senior housing and medical investments. Our portfolio consists of real estate investments in independent, assisted and memory care communities, entrance-fee communities, senior living campuses, skilled nursing facilities, specialty hospitals and medical office buildings. Other investments include mortgages and notes, marketable securities, including the common shares of other publicly-held REITs, and a joint venture structured to comply with the provisions of the REIT Investment Diversification Empowerment Act of 2007 (“RIDEA”). Through this RIDEA joint venture, we invest in facility operations, managed by independent third-parties. We fund our real estate investments primarily through: (1) operating cash flow, (2) debt offerings, including bank lines of credit and ordinary term debt, and (3) the sale of equity securities.
Principles of Consolidation - The accompanying consolidated financial statements include our accounts and the accounts of our wholly-owned subsidiaries, joint ventures, partnerships and consolidated variable interest entities ("VIE") where NHI controls the operating activities of the VIE, if any. All intercompany transactions and balances have been eliminated in consolidation. Net income is reduced by the portion of net income attributable to noncontrolling interests.
A VIE is broadly defined as an entity with one or more of the following characteristics: (a) the total equity investment at risk is insufficient to finance the entity's activities without additional subordinated financial support; (b) as a group, the holders of the equity investment at risk lack (i) the ability to make decisions about the entity's activities through voting or similar rights, (ii) the obligation to absorb the expected losses of the entity, or (iii) the right to receive the expected residual returns of the entity; or (c) the equity investors have voting rights that are not proportional to their economic interests, and substantially all of the entity's activities either involve, or are conducted on behalf of, an investor that has disproportionately few voting rights.
We apply Financial Accounting Standards Board ("FASB") guidance for our arrangements with variable interest entities ("VIEs") which requires us to identify entities for which control is achieved through means other than voting rights and to determine which business enterprise is the primary beneficiary of the VIE. In accordance with FASB guidance, management must evaluate each of the Company’s contractual relationships which creates a variable interest in other entities. If the Company has a variable interest and the entity is a VIE, then management must determine whether or not the Company is the primary beneficiary of the VIE. If it is determined that the Company is the primary beneficiary, NHI consolidates the VIE. We identify the primary beneficiary of a VIE as the enterprise that has both: (i) the power to direct the activities of the VIE that most significantly impact the entity's economic performance; and (ii) the obligation to absorb losses or the right to receive benefits of the VIE that could be significant to the entity. We perform this analysis on an ongoing basis.
At December 31, 2015, we held an interest in four unconsolidated VIEs, consisting of 1) a start-up lessee in which NHI's variable interest consists of its leasehold interest, analogous to a financing arrangement, and of which we concluded that NHI was not the primary beneficiary (Note 2); 2) our joint venture in an operating company organized under provisions of the REIT Investment Diversification and Empowerment Act, (“RIDEA”) of which we concluded that NHI was not the primary beneficiary (Note 3); 3) a note receivable from, a guarantee on a letter of credit for, and a purchase option with, an unconsolidated VIE of whom we concluded that NHI was not the primary beneficiary (Note 4); and 4) two construction mortgage notes receivable aggregating $83,411,000 from an unconsolidated VIE of whom we concluded that NHI was not the primary beneficiary (Note 4). Our direct support of the above VIEs has been limited to the transactions described herein, including our commitments and contingencies described in Note 8, and any decision to furnish additional direct support would be at our discretion and not obligatory. We believe our exposure to loss as a result of our involvement with these unconsolidated VIEs would be limited to our carrying value of these investments and the amount of our commitment as guarantor under the letter of credit. Generally, we lack, either directly or through related parties, any material input in the activities that most significantly impact the economic performance of these entities.
We apply FASB guidance related to investments in joint ventures based on the type of controlling rights held by the members' interests in limited liability companies that may preclude consolidation by the majority equity owner in certain circumstances in which the majority equity owner would otherwise consolidate the joint venture.
We structure our joint ventures to be compliant with the provisions of the REIT Investment Diversification and Empowerment Act of 2007 ("RIDEA") which permits NHI to receive rent payments through a triple-net lease between a property company and an operating company and is designed to give NHI the opportunity to capture additional value on the improving performance of
58
the operating company through distributions to a taxable REIT subsidiary ("TRS"). Accordingly, the TRS holds our equity interest in an unconsolidated operating company, which we do not control, and provides an organizational structure that will allow the TRS to engage in a broad range of activities and share in revenues that would otherwise be non-qualifying income under the REIT gross income tests.
Equity-Method Investment - We report our TRS' investment in an unconsolidated entity, over whose operating and financial policies we have the ability to exercise significant influence but not control, under the equity method of accounting. Under this accounting method, our pro rata share of the entity's earnings or losses is included in our Consolidated Statements of Income. Additionally, we adjust our investment carrying amount to reflect our share of changes in an equity-method investee's capital resulting from its capital transactions.
The initial carrying value of our equity-method investment was based on the fair value of the net assets of the entity at the time we acquired our interest. We estimate fair values of the net assets of our equity-method investee based on discounted cash flow models. The inputs we use in these models are based on assumptions that are within a reasonable range of current market rates for the respective investments.
We evaluate our equity-method investment for impairment whenever events or changes in circumstances indicate that the carrying value of our investment may exceed the fair value. If it is determined that a decline in the fair value of our investment is not temporary, and if such reduced fair value is below its carrying value, an impairment is recorded. Determining fair value involves significant judgment. Our estimates consider all available evidence including the present value of the expected future cash flows discounted at market rates, general economic conditions and other relevant factors.
Noncontrolling Interest - We present the portion of any equity that we do not own in entities that we control (and thus consolidate) as noncontrolling interest and classify such interest as a component of consolidated equity separate from total NHI stockholders' equity in our Consolidated Balance Sheets. In addition, we exclude net income attributable to the noncontrolling interest from net income attributable to common shareholders in our Consolidated Statements of Income.
Use of Estimates - The preparation of consolidated financial statements in conformity with accounting principles generally accepted in the U.S. requires management to make estimates and assumptions that affect the reported amounts of assets and liabilities, disclosure of contingent assets and liabilities at the date of the financial statements, and the reported amounts of revenues and expenses during the reporting period. Actual results could differ from those estimates.
Earnings Per Share - The weighted average number of common shares outstanding during the reporting period is used to calculate basic earnings per common share. Diluted earnings per common share assume the exercise of stock options using the treasury stock method, to the extent dilutive. Diluted earnings per share also incorporate the potential dilutive impact of our 3.25% convertible senior notes due 2021. We apply the treasury stock method to our convertible debt instruments, the effect of which is that conversion will not be assumed for purposes of computing diluted earnings per share unless the average share price of our common stock for the period exceeds the conversion price per share.
Fair Value Measurements - Fair value is defined as the exchange price that would be received for an asset or paid to transfer a liability (an exit price) in the principal or most advantageous market for the asset or liability in an orderly transaction between market participants at the measurement date. A three-level fair value hierarchy is required to prioritize the inputs used to measure fair value. This hierarchy requires entities to maximize the use of observable inputs and minimize the use of unobservable inputs.
The three levels of inputs used to measure fair value are as follows:
Level 1 - Quoted prices in active markets for identical assets or liabilities.
Level 2 - Observable inputs other than quoted prices included in Level 1, such as quoted prices for similar assets and liabilities in active markets; quoted prices for identical or similar assets and liabilities in markets that are not active; or other inputs that are observable or can be corroborated by observable market data.
Level 3 - Unobservable inputs that are supported by little or no market activity and that are significant to the fair value of the assets or liabilities. This includes certain pricing models, discounted cash flow methodologies and similar techniques that use significant unobservable inputs.
If the fair value measurement is based on inputs from different levels of the hierarchy, the level within which the entire fair value measurement falls is the lowest level input that is significant to the fair value measurement in its entirety. Our assessment of the significance of a particular input to the fair value measurement in its entirety requires judgment and considers factors specific
59
to the asset or liability. When an event or circumstance alters our assessment of the observability and thus the appropriate classification of an input to a fair value measurement which we deem to be significant to the fair value measurement as a whole, we will transfer that fair value measurement to the appropriate level within the fair value hierarchy.
Real Estate Properties - Real estate properties are recorded at cost or, if acquired through business combination, at fair value, including the fair value of contingent consideration, if any. Cost or fair value at the time of acquisition is allocated among land, buildings, tenant improvements, lease and other intangibles, and personal property. For properties acquired in transactions accounted for as asset purchases, the purchase price allocation is based on the relative fair values of the assets acquired. Cost includes the amount of contingent consideration, if any, deemed to be probable of settlement at the acquisition date. Cost also includes capitalized interest during construction periods. We use the straight-line method of depreciation for buildings over their estimated useful lives of 40 years, and improvements over their estimated useful lives ranging from 3 to 25 years. For contingent consideration arising from business combinations, the liability is adjusted to estimated fair value at each reporting date through earnings. For contingent consideration arising from asset acquisitions, the liability is adjusted to the amount considered probable each reporting period, with changes reflected as an adjustment to the basis of the related assets.
We evaluate the recoverability of the carrying value of our real estate properties on a property-by-property basis. On a quarterly basis, we review our properties for recoverability when events or circumstances, including significant physical changes in the property, significant adverse changes in general economic conditions and significant deteriorations of the underlying cash flows of the property, indicate that the carrying amount of the property may not be recoverable. The need to recognize an impairment charge is based on estimated undiscounted future cash flows from a property compared to the carrying value of that property. If recognition of an impairment charge is necessary, it is measured as the amount by which the carrying amount of the property exceeds the fair value of the property.
Mortgage and Other Notes Receivable - Each quarter, we evaluate the carrying values of our notes receivable on an instrument-by-instrument basis for recoverability when events or circumstances, including the non-receipt of contractual principal and interest payments, significant deteriorations of the financial condition of the borrower and significant adverse changes in general economic conditions, indicate that the carrying amount of the note receivable may not be recoverable. If a note receivable becomes more than 30 days delinquent as to contractual principal or interest payments, the loan is classified as non-performing, and thereafter we recognize all amounts due when received. If necessary, an impairment is measured as the amount by which the carrying amount exceeds the discounted cash flows expected to be received under the note receivable or, if foreclosure is probable, the fair value of the collateral securing the note receivable.
Cash Equivalents - Cash equivalents consist of all highly liquid investments with an original maturity of three months or less.
Concentration of Credit Risks - Our credit risks primarily relate to cash and cash equivalents and investments in mortgage and other notes receivable. Cash and cash equivalents are primarily held in bank accounts and overnight investments. We maintain our bank deposit accounts with large financial institutions in amounts that often exceed federally-insured limits. We have not experienced any losses in such accounts. Our mortgages and other notes receivable consist primarily of secured loans on facilities.
Our financial instruments, principally our investments in marketable securities and notes receivable, are subject to the possibility of loss of the carrying values as a result of either the failure of other parties to perform according to their contractual obligations or changes in market prices which may make the instruments less valuable. We obtain collateral in the form of mortgage liens and other protective rights and continually monitor these rights in order to reduce such possibilities of loss. We evaluate the need to provide for reserves for potential losses on our financial instruments based on management's periodic review of our portfolio on an instrument-by-instrument basis.
Marketable Securities - Investments in marketable debt and equity securities must be categorized as trading, available-for-sale or held-to-maturity. Our investments in marketable equity securities are classified as available-for-sale securities. Unrealized gains and losses on available-for-sale securities are recorded in other comprehensive income. We evaluate our securities for other-than-temporary impairments on at least a quarterly basis. Realized gains and losses from the sale of available-for-sale securities are determined on a specific-identification basis.
A decline in the market value of any available-for-sale or held-to-maturity security below cost that is deemed to be other-than-temporary results in an impairment to reduce the carrying amount to fair value. The impairment is charged to earnings and a new cost basis for the security is established. To determine whether an impairment is other-than-temporary, we consider whether we have the ability and intent to hold the investment until a market price recovery and consider whether evidence indicating the cost of the investment is recoverable outweighs evidence to the contrary. Evidence considered in this assessment includes the reasons for the impairment, the severity and duration of the impairment, changes in value subsequent to year-end and forecasted performance of the investment.
60
Deferred Costs - Costs incurred to acquire debt are amortized by the effective interest method over the term of the related debt.
Deferred Income - Deferred income primarily includes non-refundable loan and lease commitment fees received by us, which are amortized into income over the expected period of the related loan or lease. In the event that our financing commitment to a potential borrower or lessee expires, the related commitment fees are recognized into income immediately. Commitment fees may be charged based on the terms of the loan or lease agreements and the creditworthiness of the parties.
Rental Income - Base rental income is recognized using the straight-line method over the term of the lease to the extent that lease payments are considered collectible. Under certain leases, we receive additional contingent rent, which is calculated on the increase in revenues of the lessee over a base year or base quarter. We recognize contingent rent annually or quarterly when, based on the actual revenues of the lessee, receipt of such income is probable since the target threshold has been achieved. Lease payments that depend on a factor directly related to future use of the property, such as an increase in annual revenues over a base year, are considered to be contingent rentals and are excluded from the schedule of minimum lease payments.
If rental income calculated on a straight-line basis exceeds the cash rent due under a lease, the difference is recorded as an increase to straight-line rent receivable in the Consolidated Balance Sheets and an increase in rental income in the Consolidated Statements of Income. If rental income on a straight-line basis is calculated to be less than cash received, there is a decrease in the same accounts.
We identify a lease as non-performing if a required payment is not received within 30 days of the date it is due. Our policy related to rental income on non-performing leased real estate properties is to recognize rental income in the period when the related cash is received. As of December 31, 2015, we had not identified any of our leases as non-performing.
Mortgage Interest Income - Mortgage interest income is recognized based on the interest rates and principal amounts outstanding on the mortgage notes receivable. Under certain mortgages, we receive additional contingent interest, which is calculated on the increase in the current year revenues of a borrower over a base year. We identify a mortgage loan as non-performing if a required payment is not received within 30 days of the date it is due. Our policy related to mortgage interest income on non-performing mortgage loans is to recognize mortgage interest income in the period when the cash is received. As of December 31, 2015, we had not identified any of our mortgages as non-performing.
Investment Income and Other - Investment income and other includes dividends when declared and interest when earned from our investments in marketable securities, interest on cash and cash equivalents when earned, and amortization of deferred income. Realized gains and losses on sales of marketable securities using the specific-identification method are included as a separate component of continuing operations in the Consolidated Statements of Income as investment and other gains.
Derivatives - In the normal course of business, we are subject to risk from adverse fluctuations in interest rates. We have chosen to manage this risk through the use of derivative financial instruments, primarily interest rate swaps. Counterparties to these contracts are major financial institutions. We are exposed to credit loss in the event of nonperformance by these counterparties. We do not use derivative instruments for trading or speculative purposes. Our objective in managing exposure to market risk is to limit the impact on cash flows.
To qualify for hedge accounting, our interest rate swaps must effectively reduce the risk exposure that they are designed to hedge. In addition, at inception of a qualifying cash flow hedging relationship, the underlying transaction or transactions must be, and be expected to remain, probable of occurring in accordance with our related assertions. All of our hedges are cash flow hedges.
We recognize all derivative instruments, including embedded derivatives required to be bifurcated, as assets or liabilities at their fair value in the Consolidated Balance Sheets. Changes in the fair value of derivative instruments that are not designated as hedges or that do not meet the criteria of hedge accounting are recognized in earnings. For derivatives designated in qualifying cash flow hedging relationships, the change in fair value of the effective portion of the derivatives is recognized in accumulated other comprehensive income (loss), whereas the change in fair value of the ineffective portion is recognized in earnings. Gains and losses are reclassified from accumulated other comprehensive income into earnings once the underlying hedged transaction is recognized in earnings.
Federal Income Taxes - We intend at all times to qualify as a REIT under Sections 856 through 860 of the Internal Revenue Code of 1986, as amended. We record income tax expense or benefit with respect to one of our subsidiaries which is taxed as a Taxable REIT Subsidiary ("TRS") under provisions similar to those applicable to regular corporations. Aside from such income taxes which may be applicable to the taxable income in the TRS, we will not be subject to U.S. federal income tax, provided that we continue to qualify as a REIT and make distributions to stockholders at least equal to or in excess of 90% our taxable income.
61
Accordingly, no provision for federal income taxes has been made in the consolidated financial statements, except for the provision on the taxable income of the TRS, which is included in our consolidated statements of income under the caption, "Income tax benefit (expense) of taxable REIT subsidiary." Our failure to continue to qualify under the applicable REIT qualification rules and regulations would have a material adverse impact on our financial position, results of operations and cash flows.
Earnings and profits, which determine the taxability of dividends to stockholders, differ from net income reported for financial reporting purposes due primarily to differences in the basis of assets, estimated useful lives used to compute depreciation expense, gains on sales of real estate, non-cash compensation expense and recognition of commitment fees.
Our tax returns filed for years beginning in 2012 are subject to examination by taxing authorities. We classify interest and penalties related to uncertain tax positions, if any, in our consolidated financial statements as a component of income tax expense.
Segment Disclosures - We are in the business of owning and financing health care properties. We are managed as one segment, rather than multiple segments for internal purposes and for internal decision making.
Reclassifications - The results of operations for facilities sold, including the gain or loss on such sales, prior to the adoption of ASU 2014-08 have been reported for 2013 and prior periods as discontinued operations in the Consolidated Statements of Income. For all periods presented, we have reclassified the income tax benefit (expense) related to our taxable REIT subsidiary as a separate line item in our Consolidated Statements of Income.
New Accounting Pronouncements - In the first quarter of 2014, we adopted ASU 2014-08, Reporting Discontinued Operations and Disclosures of Disposals of Components of an Entity. Under ASU 2014-08, disposals will be reported as discontinued operations only when the disposal represents a strategic shift that will have a major effect on our operations and financial results. Previously, we reported the disposition of components that were either reporting units, subsidiaries, or asset groups as discontinued operations. ASU 2014-08 is effective for all disposals (or classifications as held for sale) of components that occur on or after December 15, 2014. We have elected early adoption, under which terms we will prospectively apply ASU 2014-08 and report as discontinued operations only those disposals (or classifications as held for sale) that have not been previously reported. Accordingly, we have continued to report the 2013 operations of facilities meeting the accounting criteria for either being sold or held for sale as discontinued operations in the Consolidated Statements of Income.
In May 2014 the Financial Accounting Standards Board (“FASB”) issued ASU 2014-09, Revenue from Contracts with Customers. ASU 2014-09 provides a principles-based approach for a broad range of revenue generating transactions, including the sale of real estate, which will generally require more estimates and more judgment and more disclosures than under current guidance. Because this ASU specifically excludes lease contracts from its scope, its application is not expected to impact our recognition of rental income on a straight-line basis. In August 2015 the FASB issued ASU 2015-14, which defers the effective date of ASU 2014-09, Revenue from Contracts with Customers. ASU 2014-09 is now effective for public entities for annual periods beginning after December 15, 2017, including interim periods therein. Early adoption is permitted only as of annual reporting periods beginning after December 15, 2016, including interim reporting periods within that reporting period. The adoption of ASU 2014-09 is not expected to have a material effect on our consolidated financial statements.
In February 2015 the FASB issued ASU 2015-16, Amendments to the Consolidation Analysis, under ASU 2015-02, which is generally effective for fiscal years and interim periods beginning after December 15, 2015. ASU 2015-02 changes the consolidation analysis for all reporting entities. The changes primarily affect the consolidation of limited partnerships and their equivalents (e.g., limited liability corporations), the consolidation analysis of reporting entities that are involved with VIEs, particularly those that have fee arrangements and related party relationships, as well as structured vehicles such as collateralized debt obligations. The adoption of ASU 2015-16 is not expected to have a material effect on our consolidated financial statements.
In April 2015 the FASB issued ASU 2015-03, Interest-Imputation of Interest, whose primary effect is to mandate that debt issuance costs be reported in the balance sheet as a direct deduction from the face amount of the related liability. Debt issuance costs have previously been presented among assets on the balance sheet. The standard does not affect the recognition and measurement of debt issuance costs. The ASU is effective for public business entities for fiscal years beginning after December 15, 2015, and interim periods within those fiscal years. Early adoption is permitted. In August 2015 the FASB issued ASU 2015-15, Interest-Imputation of Interest (Subtopic 835-30) Presentation and Subsequent Measurement of Debt Issuance Costs Associated with Line-of-Credit Arrangements Amendments to SEC Paragraphs Pursuant to Staff Announcement at June 18, 2015 EITF Meeting. The ASU clarifies the treatment of debt issuance costs related to revolving credit facilities, upon which ASU 2015-03 was silent. ASU 2015-15 notes that the SEC staff would not object to an entity deferring and presenting debt issuance costs as an asset and subsequently amortizing the deferred debt issuance costs ratably over the term of the line-of-credit arrangement, regardless of whether there are any outstanding borrowings on the line-of-credit arrangement. We believe our eventual adoption of these standards on the imputation of interest will have no material effect on our reported financial position and results of operations.
62
At its November 11, 2015, meeting, the FASB agreed on the effective date of the May 2013 Exposure Draft Leases - Joint Project of the FASB and the IASB (the "Standard"), which is in continuing deliberation by the board. Public companies will be required to apply the Standard for all accounting periods beginning after December 15, 2018 - for REITs this means application will be required beginning Jan. 1, 2019. The FASB decided to permit early adoption upon the issuance of the Standard and plans to issue the Standard in early 2016. All leases with lease terms greater than one year will be subject to the Standard, including leases in place as of the adoption date. Management expects that, because of the Standard’s emphasis on lessee accounting, the Standard will have little impact on its accounting for leases. Consistent with present standards, NHI will continue to account for lease revenue on a straight-line basis for most leases. Also consistent with NHI’s current practice, under the Standard only initial direct costs that are incremental to the lessor will be capitalized.
NOTE 2. REAL ESTATE
As of December 31, 2015, we owned 180 health care real estate properties located in 31 states and consisting of 113 senior housing communities, 62 skilled nursing facilities, 3 hospitals and 2 medical office buildings. Our senior housing properties include assisted living facilities, senior living campuses, independent living facilities, and entrance-fee communities. These investments (excluding pre-development costs of $168,000 and our corporate office of $920,000) consisted of properties with an original cost of approximately $2,094,778,000, rented under triple-net leases to 26 lessees.
Acquisitions and New Leases of Real Estate
During the year ended December 31, 2015, we announced the following real estate investments and commitments as described below (dollars in thousands):
Operator | Properties | Asset Class | Amount | |||||
East Lake Capital Mgmt - acquisition | 3 | SHO | $ | 66,900 | ||||
Bickford Senior Living - new construction | 5 | SHO | 55,000 | |||||
Bickford Senior Living - acquisition | 1 | SHO | 21,000 | |||||
Chancellor Health Care - acquisition | 1 | SHO | 6,675 | |||||
Brook Retirement Communities - acquisition | 1 | SHO | 6,000 | |||||
$ | 155,575 | |||||||
Chancellor
On August 31, 2015, we acquired a 29-unit memory care facility in Portland, Oregon, for $6,772,000 in cash, including $97,000 of closing costs. We leased the facility to Chancellor Health Care for 15 years with renewal options at an initial lease rate of 7.75% plus annual escalators. Because the facility was owner-occupied, the acquisition was accounted for as an asset purchase.
Brook Retirement Communities
On August 31, 2015, we acquired a 42-unit independent living and assisted living community in Roscommon, Michigan, for $6,000,000 in cash plus closing costs of $49,000. We leased the facility to The Brook Retirement Communities of Roscommon, Inc., for 10 years with renewal options at an initial lease rate of 7.5% plus annual escalators. Because the facility was owner-occupied, the acquisition was accounted for as an asset purchase.
East Lake
On July 1, 2015, we acquired two senior living campuses in Nashville and Indianapolis and one assisted living/memory care facility in Charlotte for $66,900,000 in cash. We leased the facilities to an affiliate of East Lake Capital Management (“East Lake”) for an initial term of 10 years, plus renewal options. The lease calls for an annual payment of $4,683,000 in the first year with fixed annual escalators of 3.5% through year four and 3.0% thereafter. In conjunction with the lease, East Lake acquired a purchase option on the properties as a whole, exercisable beginning in year six of the lease for approximately $81,000,000 and thereafter subject to escalation on a basis consistent with rental escalations and other funding in place. In connection with the lease, we have committed to invest an additional $400,000 for specified capital improvements. The investment will be added to the basis on which the lease amount is calculated. In addition, we have committed to a lessee earn out of $8,000,000 contingent on reaching and maintaining certain metrics and a contingent earn out of $750,000 payable to the seller upon East Lake reaching
63
certain metrics. At acquisition, we estimated the seller contingent earnout payment to be probable and, accordingly, have reflected that amount in our Consolidated Balance Sheet at December 31, 2015. Contingent payments earned will be an addition to the lease base when funded.
The East Lake Facilities were owner-occupied at acquisition, and accordingly we accounted for the transaction as an asset purchase. Because we neither control East Lake nor have any role in its day-to-day management, we have no material input into activities that most significantly impact the entities’ economic performance, and we account for our transactions with East Lake at amortized cost. We are not obligated to provide further support to East Lake, and accordingly the maximum extent of our exposure to loss is limited to our investment in the facilities.
Bickford
As of December 31, 2015, we owned an 85% equity interest and Sycamore Street, LLC ("Sycamore"), an affiliate of Bickford Senior Living ("Bickford"), owned a 15% equity interest in our consolidated subsidiary ("PropCo") which owns 32 assisted living/memory care facilities plus five facilities under development. The facilities are leased to the operating company, ("OpCo"), in which we retain a non-controlling 85% ownership interest, as discussed in Note 3. The facilities are managed by Bickford. Our joint venture is structured to comply with the provisions of RIDEA.
On July 31, 2015, our subsidiary, PropCo, acquired a 92 unit assisted living/memory care facility located in Lancaster, Ohio for $21,000,000 in cash. The facility was leased within our RIDEA joint venture to the operating company, OpCo, at an initial lease rate of 7% but subject to escalation in January 2016 and lease renewal in 2017 along other properties acquired and leased to OpCo in 2012. Because the facility was owner-occupied, the acquisition was accounted for as an asset purchase.
In February 2015 our joint venture announced it would develop five senior housing facilities in Illinois and Virginia. Each community will be managed by Bickford and will consist of 60 private-pay assisted living and memory care units. Construction started in mid-2015, with openings planned beginning in late 2016. The total estimated project cost is $55,000,000. We have purchased land for four of the new facility sites. Total capitalized costs related to these properties as of December 31, 2015, including land purchases, were $17,268,000. We have accumulated an additional $168,000 in pre-development costs for the one remaining development site.
As of December 31, 2015, the annual contractual rent from OpCo to PropCo is $25,529,000, plus fixed annual escalators. NHI has an exclusive right to Bickford's future acquisitions, development projects and refinancing transactions. Of our total revenues, $24,121,000 (11%), $21,421,000 (12%) and $14,586,000 (12%) were recognized as rental income from Bickford for the years ended December 31, 2015, 2014 and 2013, respectively.
Holiday
As of December 31, 2015, we leased 25 independent living facilities to Holiday AL Holdings, LP, an affiliate of Holiday Retirement ("Holiday"). The master lease term of 17 years began in December 2013 and provides for 2015 cash rent of $33,351,000 plus annual escalators of 4.5% in 2016 and 2017 and a minimum of 3.5% each year thereafter.
Of our total revenues, $43,817,000 (19%), $43,817,000 (25%) and $1,080,000 (1%) were derived from Holiday for the years ended December 31, 2015, 2014 and 2013, including $10,466,000, $11,902,000 and $293,000 in straight-line rent, respectively. Holiday AL Holdings, LP operates the facilities pursuant to a management agreement with a Holiday-affiliated manager.
NHC
As of December 31, 2015, we leased 42 facilities under two master leases to National HealthCare Corporation (“NHC”), a publicly-held company and the lessee of our legacy properties. The facilities leased to NHC consist of 3 independent living facilities and 39 skilled nursing facilities (4 of which are subleased to other parties for whom the lease payments are guaranteed to us by NHC). These facilities are leased to NHC under the terms of an amended master lease agreement originally dated October 17, 1991 ("the 1991 lease") which includes our 35 remaining legacy properties and a master lease agreement dated August 30, 2013 ("the 2013 lease") which includes 7 skilled nursing facilities acquired from a third party.
The 1991 lease has been amended to extend the lease expiration to December 31, 2026. There are two additional 5-year renewal options, each at fair rental value of such leased property as negotiated between the parties and determined without including the value attributable to any improvements to the leased property voluntarily made by NHC at its expense. Under the terms of the lease, the base annual rental is $30,750,000 and rent escalates by 4% of the increase, if any, in each facility's revenue over a 2007 base year. The 2013 lease provides for a base annual rental of $3,450,000 and has a lease expiration of August 2028. Under the terms of the 2013 lease, rent escalates 4% of the increase, if any, in each facility's revenue over a 2014 base year. For
64
both the 1991 lease and the 2013 lease, we refer to this additional rent component as “percentage rent.” During the last three years of the 2013 lease, NHC will have the option to purchase the facilities for $49,000,000.
The following table summarizes the percentage rent income from NHC (in thousands):
Year Ended December 31, | |||||||||||
2015 | 2014 | 2013 | |||||||||
Current year | $ | 2,385 | $ | 2,292 | $ | 2,275 | |||||
Prior year final certification1 | 94 | 15 | 746 | ||||||||
Total percentage rent | $ | 2,479 | $ | 2,307 | $ | 3,021 | |||||
1 For purposes of the percentage rent calculation described in the Master Lease Agreement, NHC’s annual revenue by facility for a given year is certified to NHI by March 31st of the following year.
Of our total revenue from continuing operations, $36,625,000 (16%), $36,446,000 (21%) and $34,756,000 (29%) in 2015, 2014 and 2013, respectively, were derived from NHC.
The chairman of our board of directors is also a director on NHC’s board of directors. As of December 31, 2015, NHC owned 1,630,462 shares of our common stock.
Senior Living Communities
Beginning in December 2014 we leased eight retirement communities with 1,671 units to Senior Living Communities, LLC (“Senior Living”). The 15-year master lease contains two 5-year renewal options and provides for initial cash rent of $31,000,000, plus annual escalators of 4% in years two through four and 3% thereafter.
For the eight Senior Living properties acquired in a business combination and discussed above, the unaudited pro forma revenue, net income and net income available to common stockholders of the combined entity is provided below as if the acquisition date had been January 1, 2013 (in thousands except per share amounts):
2014 | 2013 | ||||||
Revenue | $ | 215,398 | $ | 157,250 | |||
Net income | $ | 119,929 | $ | 125,460 | |||
Net income available to common stockholders | $ | 118,486 | $ | 124,461 | |||
Earnings per common share - basic | $ | 3.16 | $ | 3.80 | |||
Earnings per common share - diluted | $ | 3.16 | $ | 3.79 | |||
Supplemental pro forma information above includes revenues from the lease recognized on a straight-line basis, depreciation, and appropriate interest costs.
Of our total revenues for the year ended December 31, 2015, we recorded $39,422,000 (17%) in lease revenue from Senior Living, of which $8,422,000 represented straight-line rent. For the year ended December 31, 2014, we recorded $1,533,000 in lease revenue and had net earnings of $1,403,000 from this acquisition.
Disposition of Assets
On September 30, 2015, we sold for $9,593,000 two properties with a carrying value of $8,467,000 and recognized a gain on the disposition of $1,126,000. The properties represented the last two skilled nursing facilities of a disposal group that was originally under contract and classified during 2011 and 2012 as held-for-sale. As previously disclosed, the sale for the disposal group as a whole, being subject to certain conditions precedent as to financing, did not occur. NHI then proceeded to dispose of three of the properties in December 2013, the first of the group having been sold in 2011. On completion of these disposals to our tenant, Fundamental, a monthly rental of $250,000 was attached to the two remaining skilled nursing facilities through the end of the original lease term, February 2016, the properties having an average age in excess of 40 years. With the impending cessation of the lease, the two properties were aggressively marketed for immediate sale under conditions less favorable than those prevailing in 2011.
65
Assets Held for Sale
In August 2015 we committed to a plan to sell a skilled nursing facility in Idaho. We have reached agreement with our tenant on a sales price of $3,000,000 for the property, which has a carrying value of $1,346,000. We recorded lease income from the property for the years ended December 31, 2015 and 2014 of $321,000 and $313,000, respectively. The sale is expected to close in the first quarter of 2016.
Future Minimum Lease Payments
At December 31, 2015, the future minimum lease payments (excluding percentage rent) to be received by us under our operating leases with our tenants are as follows (in thousands):
2016 | $ | 192,559 | ||
2017 | 192,040 | |||
2018 | 179,332 | |||
2019 | 175,329 | |||
2020 | 171,947 | |||
Thereafter | 1,438,249 | |||
$ | 2,349,456 | |||
NOTE 3. EQUITY-METHOD INVESTMENT AND OTHER ASSETS
Our equity-method investment in OpCo and other assets consist of the following (in thousands):
As of December 31, | |||||||
2015 | 2014 | ||||||
Equity-method investment in OpCo | $ | 7,657 | $ | 9,424 | |||
Debt issuance costs | 11,814 | 11,491 | |||||
Accounts receivable and other assets | 3,256 | 3,818 | |||||
Replacement reserve and tax escrows | 4,631 | 4,324 | |||||
Lease escrow deposits | — | 21,648 | |||||
$ | 27,358 | $ | 50,705 | ||||
Upon the acquisition of our equity method investment in OpCo, in 2012, our purchase price was allocated to the assets acquired based upon their estimated relative fair values. Accounting guidance for equity method investments requires that we account for the difference between the cost basis of our investment in OpCo and our pro rata share of the amount of underlying equity in the net assets of OpCo as though OpCo were a consolidated subsidiary. Accordingly, the excess of the original purchase price over the fair value of identified tangible assets at acquisition of $8,986,000 is treated as implied goodwill and is subject to periodic review for impairment in conjunction with our equity method investment. When we acquired the Bickford properties in June 2013, an assignment was entered into whereby the operations of the 17 facilities were conveyed by an affiliate of Bickford to OpCo. The transaction mandated the effective cut-off of operating revenues and expenses and the settlement of operating assets and liabilities as of the acquisition date. Specified remaining net tangible assets were assigned to OpCo at the transferor's carryover basis resulting in an adjustment, through NHI's capital in excess of par value to our equity method investment in OpCo, of $817,000. We monitor and periodically review our equity method investment in OpCo for impairment to determine whether a decline, if any, in the value of the investment is other-than temporary. We noted no decline in value as of December 31, 2015.
In July 2015 the balance of funds held as a lease security deposit, payable in December 2030, was reclassified as marketable securities upon the investment of these funds in government agency debt securities and in long-term certificates of deposit. See Note 6.
Replacement reserves and tax escrows include amounts required to be held on deposit in accordance with regulatory agreements governing our Fannie Mae and HUD mortgages.
66
NOTE 4. MORTGAGE AND OTHER NOTES RECEIVABLE
At December 31, 2015, we had investments in mortgage notes receivable with a carrying value of $102,441,000 secured by real estate and UCC liens on the personal property of 9 facilities and other notes receivable with a carrying value of $32,590,000 guaranteed by significant parties to the notes or by cross-collateralization of properties with the same owner. At December 31, 2014, we had investments in mortgage notes receivable with a carrying value of $34,850,000 and other notes receivable with a carrying value of $28,780,000. No allowance for doubtful accounts was considered necessary at December 31, 2015 or 2014.
Timber Ridge
In February 2015, we entered into an agreement to lend LCS-Westminster Partnership III LLP (“LCS-WP”), an affiliate of Life Care Services, the manager of the facility, up to $154,500,000. The loan agreement conveys a mortgage interest and will facilitate the construction of Phase II of Timber Ridge at Talus (“Timber Ridge”), a Type-A Continuing Care Retirement Community in the Seattle, WA area.
The loan takes the form of two notes under a master credit agreement. The senior note (“Note A”) totals $60,000,000 at a 6.75% interest rate with 10 basis-point escalators after year three, and has a term of 10 years. We have funded $28,000,000 of Note A as of December 31, 2015. Note A is interest-only and is locked to prepayment for three years. After year three, the prepayment penalty starts at 5% and declines 1% per year. The second note ("Note B") is a construction loan for up to $94,500,000 at an annual interest rate of 8% and a 5 year maturity. We anticipate funding Note B through December 2016 and anticipate substantial repayment with new resident entrance fees upon the opening of Phase II. The total amount funded on Note B was $55,411,000 as of December 31, 2015.
NHI has a purchase option on the entire Timber Ridge property for the greater of fair market value or $115,000,000 during a purchase option window of 120 days that will contingently open in year five or upon earlier stabilization of the development, as defined. The current basis of our investment in Timber Ridge loans is $83,411,000, but we are obligated to complete the funding of both Notes A and B of up to $154,500,000 which represents the maximum exposure to loss of NHI due to our relationship with Timber Ridge. Because we neither control the entity, nor have any role in its day-to-day management, we account for our investment in LCS-WP at amortized cost.
Senior Living Communities
In connection with the December 2014 Senior Living acquisition, described in Note 2, we provided a $15,000,000 revolving line of credit, the maturity of which mirrors the 15-year term of the master lease. Borrowings are used to finance construction projects within the Senior Living Portfolio, including building additional units. Up to $5,000,000 of the facility may be used to meet general working capital needs. Amounts outstanding under the facility, $6,282,000 at December 31, 2015, bear interest at an annual rate equal to the 10-year U.S. Treasury rate, 2.27% at December 31, 2015, plus 6%.
Sycamore
In July 2013 we extended a $9,200,000 loan to our joint venture partner, Sycamore, to fund a portion of their acquisition from a third party of six senior housing communities consisting of 342 units. The loan is guaranteed by principals of Bickford and has a 12% annual interest. As a result of the loan, PropCo acquired a $97,000,000 purchase option exercisable over the term of the loan, covering all of the properties, in whole or in part. Terms of the loan and the purchase option have been extended through June 2018. In June 2014 we entered into a $500,000 revolving loan to Sycamore to fund pre-development expenses related to potential future projects. Interest is payable monthly at 10% and the note, as extended, matures in June 2018. At December 31, 2015, the revolving loan had an outstanding balance of $461,000. Sycamore is intended to be self-financing, and our direct support has been limited to the loans described herein and a $3,550,000 letter of credit for the benefit of Sycamore. We are not obligated to extend support to Sycamore beyond our current basis in the loans and letter of credit to them; accordingly our investment in this extension of credit represents our maximum exposure to loss. However, because we do not control Sycamore, nor do we have any role in the day-to-day management, we account for loans provided to Sycamore at amortized cost.
Repayments
In June 2015 Santé Partners, LLC (“Santé”) repaid its $11,700,000 mortgage obligation originally scheduled to come due on July 31, 2015. The mortgage was secured by a 70-bed transitional rehabilitation center, for which NHI had held a purchase option. Additionally, in May 2015, NHI was repaid in full on a $1,000,000 mortgage note secured by a skilled nursing facility in Texas.
Writedowns and Recoveries
67
In June 2015 we received 491,000as a secured creditor in the final settlement of a bankruptcy proceeding and recorded a recovery of a previous write-down.
In March 2013 we evaluated the recoverability of mortgage notes receivable from SeniorTrust of Florida, Inc., a Tennessee non-profit organization. As a result of that evaluation, we recorded an impairment of $4,037,000. In June 2013 we received full payment in satisfaction of the remaining balance of $15,000,000 on these notes.
In September 2013 we received $3,293,000 as full payment upon the final maturity of a mortgage note secured by a skilled nursing facility located in Georgia. Of the amount received, we recorded $2,061,000 as a recovery of a previous writedown.
NOTE 5. INVESTMENT IN PREFERRED STOCK, AT COST
Our investment in 2,000,000 shares of LTC Properties, Inc. ("LTC") (a publicly-traded REIT) cumulative preferred stock, carried at its original cost of $38,132,000 in our Consolidated Balance Sheet at December 31, 2014, was not listed on a stock exchange and was considered a non-marketable security. Prior to our conversion of these preferred shares into common stock on November 13, 2015, we received $2,454,000 in preferred dividends during 2015. For each of the years ended December 31, 2014 and 2013, preferred dividends from LTC were $3,273,000. In converting the preferred stock on November 13, 2015, we received 2,000,000 shares of LTC common stock with a readily determinable market value. In December 2015 we sold 1,000,000 of the newly issued shares on the open market. We have classified our remaining LTC common shares as available-for-sale marketable securities.
NOTE 6. INVESTMENTS IN MARKETABLE SECURITIES
Our investments in marketable securities include available-for-sale securities which are reported at fair value and investments in marketable debt securities, also classified as available-for-sale, which consist of U.S. government agency debt and long-term certificates of deposit. Unrealized gains and losses on available-for-sale securities are presented as a component of accumulated other comprehensive income. Realized gains and losses from securities sales are determined based upon specific identification of the securities.
Marketable securities consist of the following (in thousands):
December 31, 2015 | December 31, 2014 | ||||||||||||||
Amortized Cost | Fair Value | Amortized Cost | Fair Value | ||||||||||||
Common stock of other healthcare REITs | $ | 21,040 | $ | 55,815 | $ | 4,088 | $ | 15,503 | |||||||
Debt securities | $ | 17,037 | $ | 16,929 | $ | — | $ | — | |||||||
Our marketable debt securities mature in amounts of $4,089,000 within one to five years, $5,758,000 in years five through ten, and $7,220,000 after ten years. Included among those maturing within five to ten years and beyond ten years are securities callable in 2016 totaling $5,020,000 and $2,000,000, respectively. Included among those maturing beyond ten years are securities callable in 2018, totaling $1,645,000. Marketable debt securities classified earlier in 2015 as held-to-maturity were reclassified as of December 31, 2015, as available-for-sale upon management's strategic decision to entertain alternative investment options.
Net unrealized gains related to available-for-sale securities were $34,667,000 at December 31, 2015 and $11,415,000 at December 31, 2014.
During 2015, 2014 and 2013 we recognized $1,330,000, $716,000, and $667,000, respectively, of dividend and interest income from our marketable securities and have included these amounts in investment income and other in the Consolidated Statements of Income.
During the fourth quarter of 2015 we sold 1,000,000 shares of LTC common stock, for net proceeds of $42,164,000 and recognized a gain of $23,098,000 on the disposition. During 2015 we also sold the common shares of other REITs for net proceeds of $2,448,000 and recorded a gains totaling $334,000.
68
NOTE 7. DEBT
Debt consists of the following (in thousands):
As of December 31, | |||||||
2015 | 2014 | ||||||
Convertible senior notes - unsecured (net of discount of $5,862 and $6,963) | $ | 194,138 | $ | 193,037 | |||
Revolving credit facility - unsecured | 34,000 | 374,000 | |||||
Bank term loans - unsecured | 250,000 | 250,000 | |||||
Private placement term loans - unsecured | 325,000 | — | |||||
HUD mortgage loans (net of discount of $1,573 and $1,662) | 45,035 | 45,689 | |||||
Fannie Mae term loans - secured | 78,084 | — | |||||
$ | 926,257 | $ | 862,726 | ||||
Aggregate principal maturities of debt as of December 31, 2015 for each of the next five years and thereafter are as follows (in thousands):
Twelve months ended December 31 | |||
2016 | $ | 768 | |
2017 | 794 | ||
2018 | 821 | ||
2019 | 849 | ||
2020 | 284,878 | ||
Thereafter | 645,582 | ||
933,692 | |||
Less: discount | (7,435 | ) | |
$ | 926,257 | ||
In November 2015 we issued $50,000,000 of 8-year notes with a coupon of 3.99% and $50,000,000 of 10-year notes with a coupon of 4.33% to a private placement lender. The notes are unsecured and require quarterly payments of interest only until maturity. We used the proceeds from the notes to pay down borrowings on our revolving credit facility. Terms and conditions of the new financing are similar to those under our bank credit facility with the exception of provisions regarding prepayment premiums.
In June 2015 we entered into an amended $800,000,000 senior unsecured credit facility with a group of banks. The facility can be expanded, subject to certain conditions, up to an additional $250,000,000. The amended credit facility provides for: (1) a $550,000,000 revolving credit facility that matures in June 2020 (inclusive of an embedded 1-year extension option) with interest at 150 basis points over LIBOR (43 bps at December 31, 2015); (2) an existing $130,000,000 term loan that matures in June 2020 with interest at 175 basis points over LIBOR; and (3) two existing term loans which remain in place totaling $120,000,000, maturing in June 2020 and bearing interest at 175 basis points over LIBOR. At closing, the new facility replaced a smaller credit facility last amended in March 2014 that provided for $700,000,000 of total commitments. The employment of interest rate swaps for our fixed term debt leaves only our revolving credit facility exposed to variable rate risk. Our swaps and the financial instruments to which they relate are described in the table below, under the caption “Interest Rate Swap Agreements.”
At December 31, 2015 we had $516,000,000 available to draw on the revolving portion of the credit facility. The unused commitment fee is 40 basis points per annum. The unsecured credit facility requires that we maintain certain financial ratios within limits set by our creditors. To date, these ratios, which are calculated quarterly, have been within the limits required by the credit facility agreements.
Pinnacle Financial Partners, Inc. is a bank holding company whose primary business is conducted by its wholly-owned subsidiary, Pinnacle Bank, which is a participating member of our banking group. The chairman of Pinnacle Financial Partners' board of directors is also a director on NHI’s board and is chairman of our audit committee. NHI's local banking transactions are conducted primarily through Pinnacle Bank.
In March 2015 we obtained $78,084,000 in Fannie Mae financing. The term debt financing consists of interest-only payments at an annual rate of 3.79% and a 10-year maturity. The mortgages are non-recourse and secured by thirteen properties in NHI’s
69
joint venture with Bickford. Proceeds were used to reduce borrowings on NHI's unsecured bank credit facility. The notes are secured by the facilities previously pledged as security on Fannie Mae term debt that was retired in December 2014.
In January 2015 we issued $125,000,000 of 8-year notes with a coupon of 3.99% and $100,000,000 of 12-year notes with a coupon of 4.51% to a private placement lender. The notes are unsecured and require quarterly payments of interest only until maturity. We used the proceeds from the notes to pay down borrowings on our revolving credit facility. Terms and conditions of the new financing are similar to those under our bank credit facility with the exception of provisions regarding prepayment premiums.
In March 2014 we issued $200,000,000 of 3.25% senior unsecured convertible notes due April 2021 (the "Notes"). Interest is payable April 1st and October 1st of each year. The Notes are convertible at an initial conversion rate of 13.926 shares of common stock per $1,000 principal amount, representing a conversion price of approximately $71.81 per share for a total of approximately 2,785,200 underlying shares. The conversion rate is subject to adjustment upon the occurrence of certain events, as defined in the indenture governing the Notes, but will not be adjusted for any accrued and unpaid interest except in limited circumstances. The conversion option is considered an "optional net-share settlement conversion feature," meaning that upon conversion, NHI's conversion obligation may be satisfied, at our option, in cash, shares of common stock or a combination of cash and shares of common stock. Because we have the ability and intent to settle the convertible securities in cash upon exercise, we use the treasury stock method to account for potential dilution. For 2015, dilution resulting from the conversion option within our convertible debt is determined by computing an average of incremental shares included in each quarterly diluted EPS computation, resulting in a dilutive effect for the conversion feature of 4,735 shares for the year ended December 31, 2015. If NHI’s current share price increases above the initial $71.81 conversion price, further dilution will be attributable to the conversion feature.
The embedded conversion options (1) do not require net cash settlement, (2) are not conventionally convertible but can be classified in stockholders’ equity under ASC 815-40, and (3) are considered indexed to NHI’s own stock. Therefore, the conversion feature satisfies the conditions to qualify for an exception to the derivative liability rules, and the Notes are split into debt and equity components. The value of the debt component is based upon the estimated fair value of a similar debt instrument without the conversion feature at the time of issuance and was estimated to be approximately $192,238,000. The $7,762,000 difference between the contractual principal on the debt and the value allocated to the debt was recorded as an equity component and represents the estimated value of the conversion feature of the instrument. The excess of the contractual principal amount of the debt over its estimated fair value, the original issue discount, is amortized to interest expense using the effective interest method over the estimated term of the Notes. The effective interest rate used to amortize the debt discount and the liability component of the debt issue costs was approximately 3.9% based on our estimated non-convertible borrowing rate at the date the Notes were issued.
The total cost of issuing the Notes was $6,063,000, $275,000 of which was allocated to the equity component and $5,788,000 of which was allocated to the debt component and subject to amortization over the estimated term of the notes. The remaining unamortized balance at December 31, 2015, was $4,158,000.
Our HUD mortgage loans are secured by ten properties in our joint venture with Bickford. Nine mortgage notes require monthly payments of principal and interest from 4.3% to 4.4% (inclusive of mortgage insurance premium) and mature in August and October 2049. One additional HUD mortgage loan assumed in 2014 requires monthly payments of principal and interest of 2.9% (inclusive of mortgage insurance premium) and matures in October 2047. The loan has an outstanding principal balance of $9,311,000 and a net book value of $7,737,000, which approximates fair value.
The following table summarizes interest expense (in thousands):
Year Ended December 31, | |||||||||||
2015 | 2014 | 2013 | |||||||||
Interest paid at contractual rates | $ | 34,573 | $ | 23,878 | $ | 8,944 | |||||
Capitalized interest | (357 | ) | (576 | ) | (378 | ) | |||||
Amortization of debt premiums, discounts and issuance costs | 3,413 | 2,580 | 247 | ||||||||
Unamortized debt premium written off as a result of debt payoff | — | (1,655 | ) | — | |||||||
Debt issuance costs expensed due to credit facility modifications | — | 2,145 | 416 | ||||||||
Total interest expense | $ | 37,629 | $ | 26,372 | $ | 9,229 | |||||
70
Interest Rate Swap Agreements
We have entered into interest rate swap agreements to fix the interest rates on our bank term loans. For instruments that are designated and qualify as a cash flow hedge, the effective portion of the gain or loss on the derivative is reported as a component of other comprehensive income (“OCI”), and reclassified into earnings in the same period, or periods, during which the hedged transaction affects earnings. Gains and losses on the derivative representing either hedge ineffectiveness or hedge components excluded from the assessment of effectiveness are recognized in earnings. Hedge ineffectiveness related to our cash flow hedges, which is reported in current period earnings as interest expense, was not significant for the years ended December 31, 2015, 2014 or 2013. Approximately $3,401,000 of losses, which are included in accumulated other comprehensive income, are expected to be reclassified into earnings in the next 12 months.
Below is a summary of our swap agreements at December 31, 2015 (dollars in thousands):
Date Entered | Maturity Date | Fixed Rate | Rate Index | Notional Amount | Fair Value | |||||||||
May 2012 | April 2019 | 3.29% | 1-month LIBOR | $ | 40,000 | $ | (358 | ) | ||||||
June 2013 | June 2020 | 3.86% | 1-month LIBOR | $ | 80,000 | $ | (2,359 | ) | ||||||
March 2014 | June 2020 | 3.91% | 1-month LIBOR | $ | 130,000 | $ | (4,013 | ) | ||||||
If the fair value of the hedge is an asset, we include it in our Consolidated Balance Sheets among other assets, and, if a liability, as a component of accrued expenses. See Note 14 for fair value disclosures about our interest rate swap agreements.
NOTE 8. COMMITMENTS AND CONTINGENCIES
Bickford
In February 2015 our joint venture with Bickford announced plans to develop five senior housing facilities in Illinois and Virginia. Each community will be managed by Bickford and consist of 60 private-pay assisted living and memory care units. These five properties will represent the culmination of plans announced in 2012 between NHI and Bickford to construct a total of eight facilities. The first three communities, all in Indiana, opened in 2013 and 2014. Pre-development and land acquisition on the five facilities started in mid-2015 with openings planned beginning in late 2016. The total estimated project cost is $55,000,000. As of December 31, 2015, land and pre-development costs incurred on the project totaled $17,436,000.
In February 2014 we entered into a commitment on a letter of credit for the benefit of Sycamore which holds a minority interest in PropCo. At December 31, 2015, our commitment on the letter of credit totaled $3,550,000.
In June 2014 we entered into a $500,000 revolving loan with Bickford affiliate, Sycamore, to fund pre-development expenses related to potential future projects. Interest is payable monthly at 10% and the note matures in June 2018. At December 31, 2015 the revolving loan had an outstanding balance of $461,000.
Chancellor
At December 31, 2015, we have a continuing commitment with Chancellor Health Care ("Chancellor") to provide up to $650,000 for renovations and improvements related to a recently acquired senior housing community in Oregon. Renovations began on this property during the second quarter of 2015, and we have funded $33,000 as of December 31, 2015. We receive rent income on funds advanced for our construction projects. In September 2015 we completed previously announced $7,500,000 and $500,000 commitments to fund construction of a 46-unit free-standing community on our Linda Valley campus in California and renovation of our recent Maryland acquisition leased to Chancellor, respectively. Beginning October 1, 2015, we entered into a lease with Chancellor for the Linda Valley facility, providing for an initial lease term of 15 years at an annual rate of 9% plus a fixed annual escalator. Funds provided for the Maryland project were added to the facility lease on October 1, 2015, at lease rates in effect at the time the renovations were placed in service and subject to fixed annual escalation.
Discovery
As a lease inducement, we have a contingent commitment to fund a series of payments up to $2,500,000 in connection with our September 2013 lease to Discovery of a senior living campus in Rainbow City, Alabama. Discovery would earn the contingent payments upon gaining, and maintaining, a specified lease coverage ratio. Remaining payments will be assessed for funding in installments of $750,000 through September 2016 when the residual is potentially due. As of December 31, 2015, incurring the
71
contingent payments was not considered probable. Accordingly, no provision for these payments is reflected in the Consolidated Balance Sheet.
East Lake
In connection with our July 2015 lease, NHI has committed to East Lake certain lease incentive payments of $8,000,000 contingent on reaching and maintaining certain metrics, a contingent earnout of $750,000 payable to the seller upon attaining certain metrics, and the funding of an additional $400,000 for specified capital improvements. At acquisition, we estimated the seller contingent earnout payment to be probable and accordingly, have reflected that amount in our Condensed Consolidated Balance Sheet at December 31, 2015. Contingent payments earned will be included in the lease base when funded.
Life Care Services
See Note 4 for a discussion of our loan commitments to Timber Ridge, an affiliate of Life Care Services.
Prestige
In connection with four facilities we purchased and accounted for as an asset acquisition in March 2014 and leased to Prestige Senior Living, we committed to fund contingent earn out payments up to a maximum of $6,390,000 based on the achievement of certain financial metrics as measured periodically through December 31, 2015. At acquisition, we estimated contingent payments of $3,000,000 to be probable of settlement. At December 31, 2015, the facilities had not achieved the required operating metrics and therefore did not qualify for the contingent payments. Accordingly, at December 31, 2015, we wrote off the initial contingent liability of $3,000,000 and recorded a corresponding basis adjustment to the underlying real estate assets.
Santé
We are committed to fund a $3,500,000 expansion and renovation program at our Silverdale, Washington senior living campus and as of December 31, 2015, had funded $2,621,000, which was added to the basis on which the lease amount is calculated. In addition, we have a contingent commitment to fund two lease inducement payments of $1,000,000 each. Santé would earn the payments upon attaining and sustaining a specified lease coverage ratio. If earned, the first payment would be due following calendar year 2015 and the second payment would be due following calendar year 2016. At acquisition, incurring the contingent payments was not considered probable. Accordingly, no provision for these payments is reflected in the Condensed Consolidated Balance Sheet.
Senior Living Communities
In connection with our December 2014 Senior Living acquisition, we have provided a $15,000,000 revolving line of credit to Senior Living, the maturity of which mirrors the term of the master lease. Borrowings will be used to finance construction projects within the Senior Living Portfolio, including building additional units. Up to $5,000,000 of the facility may be used to meet general working capital needs. Amounts outstanding under the facility, $6,282,000 at December 31, 2015, bear interest at an annual rate equal to the 10-year U.S. Treasury rate, 2.27% at December 31, 2015, plus 6%.
Senior Living Management
During 2015 the scope of planned renovations begun in 2014 for an SLM operated facility expanded to include other facilities, including additional work on Louisiana properties recently brought under SLM management, so that the commitment as of December 31, 2015 now totals $1,430,000. When the renovations on each facility are complete, the total amount will be added to the lease base. As of December 31, 2015, $1,165,000 had been funded on these projects.
Signature
In 2012 we provided an affiliate of Signature Senior Living with a revolving loan facility of $1,500,000, bearing interest at a current rate of 10%, to fund pre-development activities internationally. With the extension of $250,000 in funding on March 31, 2015, the facility is fully drawn.
Litigation
Our facilities are subject to claims and suits in the ordinary course of business. Our lessees and borrowers have indemnified, and are obligated to continue to indemnify us, against all liabilities arising from the operation of the facilities, and are further
72
obligated to indemnify us against environmental or title problems affecting the real estate underlying such facilities. While there may be lawsuits pending against certain of the owners and/or lessees of the facilities, management believes that the ultimate resolution of all such pending proceedings will have no material adverse effect on our financial condition, results of operations or cash flows.
NOTE 9. INVESTMENT AND OTHER GAINS
The following table summarizes our investment and other gains (in thousands):
Year Ended December 31, | |||||||||||
2015 | 2014 | 2013 | |||||||||
Gains on sales of marketable securities | 23,529 | — | — | ||||||||
Gain on sale of real estate | 1,126 | — | — | ||||||||
Gain on purchase liability settlement | — | — | 3,256 | ||||||||
Other gains | — | — | 50 | ||||||||
$ | 24,655 | $ | — | $ | 3,306 | ||||||
NOTE 10. SHARE-BASED COMPENSATION
We recognize share-based compensation for all stock options granted over the requisite service period using the fair value of these grants as estimated at the date of grant using the Black-Scholes pricing model, and all restricted stock granted over the requisite service period using the market value of our publicly-traded common stock on the date of grant.
Share-Based Compensation Plans
The Compensation Committee of the Board of Directors ("the Committee") has the authority to select the participants to be granted options; to designate whether the option granted is an incentive stock option ("ISO"), a non-qualified option, or a stock appreciation right; to establish the number of shares of common stock that may be issued upon exercise of the option; to establish the vesting provision for any award; and to establish the term any award may be outstanding. The exercise price of any ISO’s granted will not be less than 100% of the fair market value of the shares of common stock on the date granted and the term of an ISO may not be more than ten years. The exercise price of any non-qualified options granted will not be less than 100% of the fair market value of the shares of common stock on the date granted unless so determined by the Committee.
In May 2012, our stockholders approved the 2012 Stock Incentive Plan ("the 2012 Plan") pursuant to which 1,500,000 shares of our common stock were made available to grant as share-based payments to employees, officers, directors or consultants. Through a vote of our shareholders on May 7, 2015, we have increased the maximum number of shares under the plan from 1,500,000 shares to 3,000,000 shares; increased the automatic annual grant to non-employee directors from 15,000 shares to 20,000 shares; and limited the Company's ability to re-issue shares under the Plan. As of December 31, 2015, there were 1,916,668 shares available for future grants under the 2012 Plan. The individual restricted stock and option grant awards vest over periods up to five years. The term of the options under the 2012 Plan is up to ten years from the date of grant.
In May 2005, our stockholders approved the NHI 2005 Stock Option Plan ("the 2005 Plan") pursuant to which 1,500,000 shares of our common stock were made available to grant as share-based payments to employees, officers, directors or consultants. As of December 31, 2015, the 2005 Plan has expired and no additional shares may be granted under the 2005 Plan. The individual restricted stock and option grant awards vest over periods up to ten years. The term of the options outstanding under the 2005 Plan is up to ten years from the date of grant.
Compensation expense is recognized only for the awards that ultimately vest. Accordingly, forfeitures that were not expected may result in the reversal of previously recorded compensation expense. The compensation expense reported for the years ended December 31, 2015, 2014 and 2013 was $2,134,000, $2,020,000 and $2,339,000, respectively, and is included in general and administrative expense in the Consolidated Statements of Income.
Determining Fair Value of Option Awards
The fair value of each option award was estimated on the grant date using the Black-Scholes option valuation model with the weighted average assumptions indicated in the following table. Each grant is valued as a single award with an expected term based upon expected employee and termination behavior. Compensation cost is recognized on the graded vesting method over the
73
requisite service period for each separately vesting tranche of the award as though the award were, in substance, multiple awards. The expected volatility is derived using daily historical data for periods preceding the date of grant. The risk-free interest rate is the approximate yield on the United States Treasury Strips having a life equal to the expected option life on the date of grant. The expected life is an estimate of the number of years an option will be held before it is exercised.
Stock Options
The weighted average fair value per share of options granted was $4.74, $4.93 and $6.41 for 2015, 2014 and 2013, respectively.
The fair value of each grant is estimated on the date of grant using the Black-Scholes option-pricing model with the following weighted average assumptions:
2015 | 2014 | 2013 | |||
Dividend yield | 4.7% | 5.0% | 4.5% | ||
Expected volatility | 17.8% | 21.5% | 23.8% | ||
Expected lives | 2.8 years | 2.8 years | 2.8 years | ||
Risk-free interest rate | 0.98% | 0.63% | 0.35% | ||
Stock Option Activity
The following tables summarize our outstanding stock options:
Weighted Average | ||||||||||
Number | Weighted Average | Remaining | Aggregate | |||||||
of Shares | Exercise Price | Contractual Life (Years) | Intrinsic Value | |||||||
Outstanding December 31, 2012 | 211,675 | $46.60 | ||||||||
Options granted under 2012 Plan | 360,000 | $64.49 | ||||||||
Options exercised under 2005 Plan | (55,001 | ) | $45.31 | |||||||
Outstanding December 31, 2013 | 516,674 | $59.20 | ||||||||
Options granted under 2012 Plan | 400,000 | $61.31 | ||||||||
Options exercised under 2005 Plan | (26,670 | ) | $47.52 | |||||||
Options exercised under 2012 Plan | (3,333 | ) | $61.31 | |||||||
Options forfeited under 2012 Plan | (15,000 | ) | $64.49 | |||||||
Outstanding December 31, 2014 | 871,671 | $60.43 | ||||||||
Options granted under 2012 Plan | 450,000 | $72.11 | ||||||||
Options granted under 2005 Plan | 20,000 | $72.11 | ||||||||
Options exercised under 2005 Plan | (66,670 | ) | $46.87 | |||||||
Options exercised under 2012 Plan | (421,657 | ) | $63.03 | |||||||
Options canceled under 2012 Plan | (111,668 | ) | $71.95 | |||||||
Outstanding December 31, 2015 | 741,676 | $65.84 | 3.29 | $ | (3,683,000 | ) | ||||
Exercisable December 31, 2015 | 476,663 | $64.12 | 2.99 | $ | (1,550,000 | ) | ||||
74
Remaining | |||||||||
Grant | Number | Exercise | Contractual | ||||||
Date | of Shares | Price | Life in Years | ||||||
2/22/2011 | 15,000 | $ | 45.58 | 0.15 | |||||
2/21/2012 | 48,334 | $ | 47.52 | 1.15 | |||||
2/25/2013 | 116,672 | $ | 64.49 | 2.16 | |||||
2/25/2014 | 201,670 | $ | 61.31 | 3.16 | |||||
2/20/2015 | 360,000 | $ | 72.11 | 4.16 | |||||
Outstanding December 31, 2015 | 741,676 | ||||||||
The weighted average remaining contractual life of all options outstanding at December 31, 2015 is 3.3 years. Including outstanding stock options, our stockholders have authorized an additional 2,658,344 shares of common stock that may be issued under the share-based payments plans.
The following table summarizes our outstanding non-vested stock options:
Number of Shares | Weighted Average Grant Date Fair Value | |||
Non-vested December 31, 2014 | 226,681 | $5.64 | ||
Options granted under 2012 Plan | 450,000 | $4.73 | ||
Options granted under 2005 Plan | 20,000 | $4.91 | ||
Options vested under 2012 Plan | (416,667 | ) | $5.07 | |
Options vested under 2005 Plan | (6,666 | ) | $4.91 | |
Non-vested options canceled under 2012 Plan | (8,335 | ) | $4.91 | |
Non-vested December 31, 2015 | 265,013 | $4.98 | ||
At December 31, 2015, we had $417,000 of unrecognized compensation cost related to unvested stock options, net of expected forfeitures, which is expected to be recognized over the following periods: 2016 - $373,000 and 2017 - $44,000. Stock-based compensation is included in general and administrative expense in the Consolidated Statements of Income.
The intrinsic value of the total options exercised for the years ended December 31, 2015, 2014 and 2013 was $5,551,000 or $12.69 per share; $465,000 or $15.51 per share, and $1,084,000 or $19.71 per share, respectively.
NOTE 11. DISCONTINUED OPERATIONS
We have reclassified, for periods before adoption of ASU 2014-08, the operations of facilities meeting the accounting criteria for properties sold or held for sale as discontinued operations.
In December 2013, we sold three older skilled nursing facilities to affiliates of our current tenant, Fundamental, for $18,500,000 and recorded a gain of $1,269,000 for financial statement purposes. Our lease revenue and depreciation expense from these facilities was $3,316,000 and $475,000, respectively, for the year ended December 31, 2013.
In October 2013, our tenant, Weatherly Associates, LLC, exercised their option to purchase a senior housing facility in Pennsylvania for $5,315,000. The sale was completed in December 2013, and we recorded a gain of $1,619,000 for financial statement purposes. Our lease revenue and depreciation expense from the facility was $352,000 and 83,000, respectively, for the year ended December 31, 2013.
In August 2013 we sold six older skilled nursing facilities to NHC for $21,000,000 and recorded a gain of $19,370,000 for financial statement purposes. Our lease revenue from the facilities was $2,294,000 for the year ended December 31, 2013.
75
NOTE 12. EARNINGS AND DIVIDENDS PER COMMON SHARE
The weighted average number of common shares outstanding during the reporting period is used to calculate basic earnings per common share. Diluted earnings per common share assume the exercise of stock options and vesting of restricted shares using the treasury stock method, to the extent dilutive. For 2015, dilution resulting from the conversion option within our convertible debt is determined by computing an average of incremental shares included in each quarterly diluted EPS computation, resulting in a small dilutive effect for the conversion feature for the year ended December 31, 2015. If NHI’s current share price increases above the initial conversion price, further dilution will be attributable to the conversion feature.
The following table summarizes the average number of common shares and the net income used in the calculation of basic and diluted earnings per common share (in thousands, except share and per share amounts):
Year Ended December 31, | |||||||||||
2015 | 2014 | 2013 | |||||||||
Income from continuing operations attributable to common stockholders | $ | 148,862 | $ | 101,609 | $ | 78,499 | |||||
Discontinued operations | — | — | 27,684 | ||||||||
Net income attributable to common stockholders | $ | 148,862 | $ | 101,609 | $ | 106,183 | |||||
BASIC: | |||||||||||
Weighted average common shares outstanding | 37,604,594 | 33,375,966 | 28,362,398 | ||||||||
Income from continuing operations per common share | $ | 3.96 | $ | 3.04 | $ | 2.77 | |||||
Discontinued operations per common share | — | — | .97 | ||||||||
Net income per common share | $ | 3.96 | $ | 3.04 | $ | 3.74 | |||||
DILUTED: | |||||||||||
Weighted average common shares outstanding | 37,604,594 | 33,375,966 | 28,362,398 | ||||||||
Stock options and restricted shares | 34,842 | 40,048 | 35,304 | ||||||||
Convertible subordinated debentures | 4,735 | — | — | ||||||||
Average dilutive common shares outstanding | 37,644,171 | 33,416,014 | 28,397,702 | ||||||||
Income from continuing operations per common share | $ | 3.95 | $ | 3.04 | $ | 2.77 | |||||
Discontinued operations per common share | — | — | .97 | ||||||||
Net income per common share | $ | 3.95 | $ | 3.04 | $ | 3.74 | |||||
Incremental shares excluded since anti-dilutive: | |||||||||||
Stock options with an exercise price in excess of the average market price for our common shares | 51,603 | 13,831 | 23,883 | ||||||||
Regular dividends declared per common share | $ | 3.40 | $ | 3.08 | $ | 2.90 | |||||
NOTE 13. INCOME TAXES
Beginning with our inception in 1991, we have elected to be taxed as a REIT under the Internal Revenue Code (the "Code"). We have elected that our subsidiary established on September 30, 2012 in connection with the Bickford arrangement (which holds our ownership interest in an operating company) be taxed as a taxable REIT subsidiary ("TRS") under provisions of the Code. The TRS is subject to federal and state income taxes like those applicable to regular corporations. Aside from such income taxes which may be applicable to the taxable income in the TRS, we will not be subject to federal income tax provided that we continue to qualify as a REIT and make distributions to stockholders equal to or in excess of 90% of our taxable income.
76
Per share dividend payments to common stockholders for the last three years are characterized for tax purposes as follows:
(Unaudited) | 2015 | 2014 | 2013 | ||||||||
Ordinary income | $ | 2.62808 | $ | 2.53548 | $ | 2.8590 | |||||
Capital gain | 0.69110 | — | 0.1649 | ||||||||
Return of capital | 0.08082 | 0.54452 | 0.09612 | ||||||||
Dividends paid per common share | $ | 3.40 | $ | 3.08 | $ | 3.12 | |||||
Our consolidated provision for state and federal income tax (benefit) expense for the years ended 2015, 2014, and 2013 was $(583,000), $118,000, and $267,000, respectively. For the years ended 2015, 2014, and 2013 we had no material deferred state or federal income tax.
All of our income tax expense for 2015 and 2014 relates to a franchise tax levied by the state of Texas that has attributes of an income tax. For 2013, tax expense of $128,000 relates to our equity interest in the unconsolidated operating company whose interest is owned by our TRS described above, and $139,000 relates to the Texas franchise tax. For 2015, we recorded a Federal income tax benefit of $707,000 related to losses in our operating subsidiary, offset primarily by Texas Franchise taxes of $124,000 resulting in the net income tax benefit disclosed above of $(583,000). Our state income taxes described above are combined in franchise, excise and other taxes in our Consolidated Statements of Income. Income taxes related to the equity interest in the unconsolidated operating company whose interest is owned by our TRS are included in our Consolidated Statements of Income under the caption Income tax benefit (expense) of taxable REIT subsidiary.
We made state income tax payments of $122,000, $139,000,and $198,000 for the years ended December 31, 2015, 2014, and 2013, respectively.
NOTE 14. FAIR VALUE OF FINANCIAL INSTRUMENTS
Our financial assets and liabilities measured at fair value (based on the hierarchy of the three levels of inputs described in Note 1) on a recurring basis include marketable securities, derivative financial instruments and certain contingent consideration arrangements. Marketable securities consist of common stock of other healthcare REITs. Derivative financial instruments include our interest rate swap agreements. Contingent consideration arrangements relate to certain provisions of recent real estate purchase agreements involving business combinations.
Marketable securities. We utilize quoted prices in active markets to measure debt and equity securities; these items are classified as Level 1 in the hierarchy and include the common stock of other healthcare REITs.
Derivative financial instruments. Derivative financial instruments are valued in the market using discounted cash flow techniques. These techniques incorporate primarily Level 2 inputs. The market inputs are utilized in the discounted cash flow calculation considering the instrument's term, notional amount, discount rate and credit risk. Significant inputs to the derivative valuation model for interest rate swaps are observable in active markets and are classified as Level 2 in the hierarchy.
Contingent consideration. Contingent consideration arrangements are classified as Level 3 and are valued using unobservable inputs about the nature of the contingent arrangement and the counter-party to the arrangement, as well as our assumptions about the probability of full settlement of the contingency.
Assets and liabilities measured at fair value on a recurring basis are as follows (in thousands):
Fair Value Measurement | |||||||||
Balance Sheet Classification | December 31, 2015 | December 31, 2014 | |||||||
Level 1 | |||||||||
Common stock of other healthcare REITs | Marketable securities | $ | 55,815 | $ | 15,503 | ||||
Debt securities | Marketable securities | $ | 16,929 | $ | — | ||||
Level 2 | |||||||||
Interest rate swap liability | Accrued expenses | $ | 6,730 | $ | 5,193 | ||||
77
Carrying values and fair values of financial instruments that are not carried at fair value at December 31, 2015 and 2014 in the Consolidated Balance Sheets are as follows (in thousands):
Carrying Amount | Fair Value Measurement | ||||||||||||||
2015 | 2014 | 2015 | 2014 | ||||||||||||
Level 2 | |||||||||||||||
Variable rate debt | $ | 284,000 | $ | 624,000 | $ | 284,000 | $ | 624,000 | |||||||
Fixed rate debt | $ | 642,257 | $ | 238,726 | $ | 641,066 | $ | 254,150 | |||||||
Level 3 | |||||||||||||||
Mortgage and other notes receivable | $ | 135,031 | $ | 63,630 | $ | 141,408 | $ | 72,435 | |||||||
The fair value of mortgage and other notes receivable is based on credit risk and discount rates that are not observable in the marketplace and therefore represents a Level 3 measurement.
Fixed rate debt. Fixed rate debt is classified as Level 2 and its value is based on quoted prices for similar instruments or calculated utilizing model derived valuations in which significant inputs are observable in active markets.
Carrying amounts of cash and cash equivalents, accounts receivable and accounts payable approximate fair value due to their short-term nature. The fair value of our borrowings under our credit facility are reasonably estimated at their carrying value at December 31, 2015 and 2014, due to the predominance of floating interest rates, which generally reflect market conditions.
NOTE 15. LIMITS ON COMMON STOCK OWNERSHIP
The Company's charter contains certain provisions which are designed to ensure that the Company's status as a REIT is protected for federal income tax purposes. One of these provisions ensures that any transfer which would cause NHI to be beneficially owned by fewer than 100 persons or would cause NHI to be “closely held” under the Internal Revenue Code would be void which, subject to certain exceptions, results in no stockholder being allowed to own, either directly or indirectly pursuant to certain tax attribution rules, more than 9.9% of the Company's common stock. In 1991, the Board created an exception to this ownership limitation for Dr. Carl E. Adams, his spouse, Jennie Mae Adams, and their lineal descendants. Effective May 12, 2008, we entered into Excepted Holder Agreements with W. Andrew Adams and certain members of his family. These written agreements are intended to restate and replace the parties' prior verbal agreement. Based on the Excepted Holder Agreements currently outstanding, the ownership limit for all other stockholders is approximately 7.5%. Our charter gives our Board of Directors broad powers to prohibit and rescind any attempted transfer in violation of the ownership limits. These agreements were entered into in connection with the Company's stock purchase program pursuant to which the Company announced that it would purchase up to 1,000,000 shares of its common stock in the public market from its stockholders.
A separate agreement was entered into with each of the spouse and children of Dr. Carl E. Adams and others within Mr. W. Andrew Adams' family. We needed to enter into such an agreement with each family member because of the complicated ownership attribution rules under Internal Revenue Code. The Agreement permits the Excepted Holders to own common stock in excess of 9.9% up to the limit specifically provided in the individual agreement and not lose rights with respect to such shares. However, if the stockholder's stock ownership exceeds the limit then such shares in excess of the limit become “Excess Stock” and lose voting rights and entitlement to receive dividends. The Excess Stock classification remains in place until the stockholder no longer exceeds the threshold limit specified in the Agreement. The purpose of these agreements is to ensure that the Company does not violate the prohibition against a REIT being closely held. W. Andrew Adams' Excess Holder Agreement also provides that he will not own shares of stock in any tenant of the Company if such ownership would cause the Company to constructively own more than a 9.9% interest in such tenant. This prohibition is designed to protect the Company's status as a REIT for tax purposes.
78
NOTE 16. SELECTED QUARTERLY FINANCIAL DATA (UNAUDITED)
The following table sets forth selected quarterly financial data for the two most recent fiscal years (in thousands, except per share amounts).
2015 | Quarter Ended | ||||||||||||||
March 31, | June 30, | September 30, | December 31, | ||||||||||||
Net revenues | $ | 55,751 | $ | 56,313 | $ | 58,282 | $ | 58,642 | |||||||
Investment and other gains | — | — | 1,126 | 23,529 | |||||||||||
Income from continuing operations attributable to common stockholders | 29,683 | 31,182 | 33,600 | 54,397 | |||||||||||
Net income attributable to common stockholders | $ | 29,683 | $ | 31,182 | $ | 33,600 | $ | 54,397 | |||||||
Weighted average common shares outstanding: | |||||||||||||||
Basic | 37,558,067 | 37,566,221 | 37,566,221 | 37,727,868 | |||||||||||
Diluted | 37,645,265 | 37,607,117 | 37,583,141 | 37,741,162 | |||||||||||
Earnings per common share: | |||||||||||||||
Basic: | |||||||||||||||
Net income attributable to common stockholders | $ | .79 | $ | .83 | $ | .89 | $ | 1.44 | |||||||
Diluted: | |||||||||||||||
Net income attributable to common stockholders | $ | .79 | $ | .83 | $ | .89 | $ | 1.44 | |||||||
2014 | Quarter Ended | ||||||||||||||
March 31, | June 30, | September 30, | December 31, | ||||||||||||
Net revenues | $ | 43,136 | $ | 44,160 | $ | 44,478 | $ | 45,735 | |||||||
Net income attributable to common stockholders | $ | 23,533 | $ | 25,294 | $ | 25,250 | $ | 27,532 | |||||||
Weighted average common shares outstanding: | |||||||||||||||
Basic | 33,051,415 | 33,052,750 | 33,055,992 | 34,343,706 | |||||||||||
Diluted | 33,085,232 | 33,087,283 | 33,088,570 | 34,402,969 | |||||||||||
Earnings per common share: | |||||||||||||||
Basic: | |||||||||||||||
Net income attributable to common stockholders | $ | .71 | $ | .77 | $ | .76 | $ | .80 | |||||||
Diluted: | |||||||||||||||
Net income attributable to common stockholders | $ | .71 | $ | .76 | $ | .76 | $ | .80 | |||||||
79
NOTE 17. SUBSEQUENT EVENTS
Real Estate Investment
On January 19, 2016 we acquired a 98-unit independent living community in Chehalis, Washington for $9,400,000 in cash plus certain closing costs and the funding of an additional $350,000 for specified capital improvements. We will account for the transaction as an asset purchase.
We have leased the community to a partnership between Marathon Development and Village Concepts Retirement Communities for an initial lease term of 15 years. The lease provides for an initial rate of 7.25%, rate escalation of 2.5% in year two, and 3.0% thereafter.
Capital Funding Note
On January 28, 2016, we agreed to a modification of terms for the $15,000,000 revolving credit facility we provide to Capital Funding Group (“CFG”). Principal provisions of the modification will be to extend the maturity date to December 31, 2018, the commencement of monthly fixed principal and interest payments of $150,000, the release of certain amounts from escrow and the reduction of interest going forward from 13.5% to 10%. The modifications were made in recognition of changing market conditions and CFG’s improved credit profile. The effect of the modification is that we will account for the loan as a new loan rather than as a continuation of the existing loan.
ITEM 9. CHANGES IN AND DISAGREEMENTS WITH ACCOUNTANTS ON ACCOUNTING AND FINANCIAL DISCLOSURE.
None.
ITEM 9A. CONTROLS AND PROCEDURES.
Evaluation of Disclosure Control and Procedures. As of December 31, 2015, an evaluation was performed under the supervision and with the participation of our management, including the Chief Executive Officer (“CEO”) and Chief Accounting Officer (“CAO”), of the effectiveness of the design and operation of management’s disclosure controls and procedures (as defined in rules 13a-15(e) and 15d-15(e) under the Securities and Exchange Act of 1934) to ensure information required to be disclosed in our filings under the Securities and Exchange Act of 1934, is (i) recorded, processed, summarized, and reported within the time periods specified in the SEC rules and forms; and (ii) accumulated and communicated to our management, including our CEO and our CAO, as appropriate, to allow timely decisions regarding required disclosure. Management recognizes that any controls and procedures, no matter how well designed and operated, can only provide reasonable assurance of achieving desired control objectives, and management is necessarily required to apply its judgment when evaluating the cost-benefit relationship of potential controls and procedures. Based upon the evaluation, the CEO and CAO concluded that the design and operation of these disclosure controls and procedures were effective as of December 31, 2015.
There were no significant changes in our internal controls or in other factors that could significantly affect these controls subsequent to the date of their evaluation, including any corrective actions with regard to significant deficiencies and material weaknesses.
Changes in Internal Control over Financial Reporting. There were no changes in our internal control over financial reporting identified in management’s evaluation during the three months ended December 31, 2015 that have materially affected, or are reasonably likely to materially affect, our internal control over financial reporting.
80
MANAGEMENT'S ANNUAL REPORT ON INTERNAL CONTROL OVER FINANCIAL REPORTING
The management of National Health Investors, Inc. is responsible for establishing and maintaining adequate internal control over financial reporting as defined in Rules 13a-15(f) and 15d-15(f) under the Securities Exchange Act of 1934. The Company's internal control over financial reporting is designed to provide reasonable assurance regarding the reliability of financial reporting and the preparation of financial statements for external purposes in accordance with generally accepted accounting principles. The Company's internal control over financial reporting includes those policies and procedures that: (i) pertain to the maintenance of records that, in reasonable detail, accurately and fairly reflect the transactions and dispositions of the assets of the Company; (ii) provide reasonable assurance that transactions are recorded as necessary to permit preparation of financial statements in accordance with accounting principles generally accepted in the United States of America, and that receipts and expenditures of the Company are being made only in accordance with authorizations of management and directors of the Company; and (iii) provide reasonable assurance regarding prevention or timely detection of unauthorized acquisition, use or disposition of the Company's assets that could have a material effect on the financial statements.
Because of its inherent limitations, internal control over financial reporting may not prevent or detect misstatements. Also, projections of any evaluation of effectiveness to future periods are subject to the risk that controls may become inadequate because of changes in conditions, or that the degree of compliance with the policies or procedures may deteriorate.
Management assessed the effectiveness of the Company's internal control over financial reporting as of December 31, 2015 using the criteria set forth by the Committee of Sponsoring Organizations of the Treadway Commission (COSO) in Internal Control-Integrated Framework (2013). Based on that assessment, management concluded that the Company's internal control over financial reporting was effective as of December 31, 2015. The Company's independent registered public accounting firm, BDO USA, LLP, has issued an attestation report on the effectiveness of the Company's internal control over financial reporting included herein.
81
REPORT OF INDEPENDENT REGISTERED PUBLIC ACCOUNTING FIRM
Board of Directors and Stockholders
National Health Investors, Inc.
Murfreesboro, Tennessee
We have audited National Health Investors, Inc.’s internal control over financial reporting as of December 31, 2015, based on criteria established in Internal Control – Integrated Framework (2013) issued by the Committee of Sponsoring Organizations of the Treadway Commission (the COSO criteria). National Health Investors, Inc.’s management is responsible for maintaining effective internal control over financial reporting and for its assessment of the effectiveness of internal control over financial reporting, included in the accompanying "Item 9A, Management’s Annual Report on Internal Control Over Financial Reporting." Our responsibility is to express an opinion on the company’s internal control over financial reporting based on our audit.
We conducted our audit in accordance with the standards of the Public Company Accounting Oversight Board (United States). Those standards require that we plan and perform the audit to obtain reasonable assurance about whether effective internal control over financial reporting was maintained in all material respects. Our audit included obtaining an understanding of internal control over financial reporting, assessing the risk that a material weakness exists, and testing and evaluating the design and operating effectiveness of internal control based on the assessed risk. Our audit also included performing such other procedures as we considered necessary in the circumstances. We believe that our audit provides a reasonable basis for our opinion.
A company’s internal control over financial reporting is a process designed to provide reasonable assurance regarding the reliability of financial reporting and the preparation of financial statements for external purposes in accordance with generally accepted accounting principles. A company’s internal control over financial reporting includes those policies and procedures that (1) pertain to the maintenance of records that, in reasonable detail, accurately and fairly reflect the transactions and dispositions of the assets of the company; (2) provide reasonable assurance that transactions are recorded as necessary to permit preparation of financial statements in accordance with generally accepted accounting principles, and that receipts and expenditures of the company are being made only in accordance with authorizations of management and directors of the company; and (3) provide reasonable assurance regarding prevention or timely detection of unauthorized acquisition, use, or disposition of the company’s assets that could have a material effect on the financial statements.
Because of its inherent limitations, internal control over financial reporting may not prevent or detect misstatements. Also, projections of any evaluation of effectiveness to future periods are subject to the risk that controls may become inadequate because of changes in conditions, or that the degree of compliance with the policies or procedures may deteriorate.
In our opinion, National Health Investors, Inc. maintained, in all material respects, effective internal control over financial reporting as of December 31, 2015, based on the COSO criteria.
We also have audited, in accordance with the standards of the Public Company Accounting Oversight Board (United States), the consolidated balance sheets of National Health Investors, Inc. as of December 31, 2015 and 2014, and the related consolidated statements of income, comprehensive income, equity, and cash flows for each of the three years in the period ended December 31, 2015 and our report dated February 17, 2016 expressed an unqualified opinion thereon.
/s/ BDO USA, LLP
Nashville, Tennessee
February 17, 2016
82
ITEM 9B. OTHER INFORMATION.
None.
83
PART III.
ITEM 10. DIRECTORS, EXECUTIVE OFFICERS AND CORPORATE GOVERNANCE.
We have filed with the New York Stock Exchange (“NYSE”) the Annual CEO Certification regarding the Company’s compliance with the NYSE’s Corporate Governance listing standards as required by Section 303A.12(a) of the NYSE Listed Company Manual. Additionally, we have filed as exhibits to this Annual Report on Form 10-K for the year ended December 31, 2015, the applicable certifications of our Chief Executive Officer and our Chief Accounting Officer as required under Section 302 of the Sarbanes-Oxley Act of 2002.
Incorporated by reference from the information in our definitive proxy statement for the 2016 annual meeting of stockholders, which we will file within 120 days of the end of the fiscal year to which this report relates.
ITEM 11. EXECUTIVE COMPENSATION.
Incorporated by reference from the information in our definitive proxy statement for the 2016 annual meeting of stockholders, which we will file within 120 days of the end of the fiscal year to which this report relates.
ITEM 12. SECURITY OWNERSHIP OF CERTAIN BENEFICIAL OWNERS AND MANAGEMENT AND RELATED STOCKHOLDER MATTERS.
Incorporated by reference from the information in our definitive proxy statement for the 2016 annual meeting of stockholders, which we will file within 120 days of the end of the fiscal year to which this report relates.
ITEM 13. CERTAIN RELATIONSHIPS AND RELATED TRANSACTIONS.
Incorporated by reference from the information in our definitive proxy statement for the 2016 annual meeting of stockholders, which we will file within 120 days of the end of the fiscal year to which this report relates.
ITEM 14. PRINCIPAL ACCOUNTANT FEES AND SERVICES.
Incorporated by reference from the information in our definitive proxy statement for the 2016 annual meeting of stockholders, which we will file within 120 days of the end of the fiscal year to which this report relates.
PART IV.
ITEM 15. EXHIBITS AND FINANCIAL STATEMENT SCHEDULES.
(a) (1) Financial Statements
The Consolidated Financial Statements are included in Item 8 and are filed as part of this report.
(2) Financial Statement Schedules
The Financial Statement Schedules and Report of Independent Registered Public Accounting Firm on Financial Statement Schedules are listed in Exhibit 99.1.
(3) Exhibits
Exhibits required as part of this report are listed in the Exhibit Index.
84
SIGNATURES
Pursuant to the requirements of Section 13 or 15(d) of the Securities Exchange Act of 1934, the Registrant has duly caused this report to be signed on its behalf by the undersigned, thereunto duly authorized.
NATIONAL HEALTH INVESTORS, INC. | |
BY:/s/ D. Eric Mendelsohn | |
D. Eric Mendelsohn | |
Date: February 17, 2016 | President and Chief Executive Officer |
Pursuant to the requirements of the Securities Exchange Act of 1934, this Report has been signed below by the following persons on behalf of the registrant and in the capacities and on the dates indicated.
Signature | Title | Date | |
/s/ D. Eric Mendelsohn | President and Chief Executive Officer | February 17, 2016 | |
D. Eric Mendelsohn | (Principal Executive Officer) | ||
/s/ Roger R. Hopkins | Chief Accounting Officer | February 17, 2016 | |
Roger R. Hopkins | (Principal Financial Officer and Principal Accounting Officer) | ||
/s/ W. Andrew Adams | Chairman of the Board | February 17, 2016 | |
W. Andrew Adams | |||
/s/ James R. Jobe | Director | February 17, 2016 | |
James R. Jobe | |||
/s/ Robert A. McCabe, Jr. | Director | February 17, 2016 | |
Robert A. McCabe, Jr. | |||
/s/ Robert T. Webb | Director | February 17, 2016 | |
Robert T. Webb | |||
85
NATIONAL HEALTH INVESTORS, INC.
FORM 10-K FOR THE FISCAL YEAR ENDED DECEMBER 31, 2015
EXHIBIT INDEX | ||
Exhibit No. | Description | Page No. or Location |
3.1 | Articles of Incorporation | Incorporated by reference to Exhibit 3.1 to Form S-11 Registration Statement No. 33-41863 |
3.2 | Amendment to Articles of Incorporation dated as of May 1, 2009 | Incorporated by reference to Exhibit A to the Company's Definitive Proxy Statement filed March 23, 2009 |
3.3 | Amendment to Articles of Incorporation approved by shareholders on May 2, 2014 | Incorporated by reference to Exhibit 3.3 to Form 10-Q dated August 4, 2014 |
3.4 | Restated Bylaws as amended November 5, 2012 | Incorporated by reference to Exhibit 3.3 to Form 10-K filed February 15, 2013 |
3.5 | Amendment No. 1 to Restated Bylaws dated February 14, 2014 | Incorporated by reference to Exhibit 3.4 to Form 10-K filed February 14, 2014 |
4.1 | Form of Common Stock Certificate | Incorporated by reference to Exhibit 39 to Form S-11 Registration Statement No. 33-41863 |
4.2 | Indenture, dated as of March 25, 2014, between National Health Investors, Inc. and The Bank of New York Mellon Trust Company, N.A., as Trustee | Incorporated by reference to Exhibit 4.1 to Form 8-K dated March 31, 2014 |
4.3 | First Supplemental Indenture, dated as of March 25, 2014, to the Indenture, dated as of March 25, 2014, between National Health Investors, Inc. and The Bank of New York Mellon Trust Company, N.A., as Trustee | Incorporated by reference to Exhibit 4.2 to Form 8-K dated March 31, 2014 |
10.1 | Material Contracts | Incorporated by reference to Exhibits 10.1 thru 10.9 to Form S-4 Registration Statement No. 33-41863 |
10.2 | Amendment No. 5 to the Company's Master Agreement to Lease with NHC | Incorporated by reference to Exhibit 10.2 to Form 10-K dated March 10, 2006 |
10.3 | Amendment No. 6 to the Company's Master Agreement to Lease with NHC | Incorporated by reference to Exhibit 10.1 to Form 10-Q dated November 4, 2013 |
10.4 | Amended and Restated Amendment No. 6 to the Company's Master Agreement to Lease with NHC. | Incorporated by reference to Exhibit 10.4 to Form 10-K filed February 14, 2014 |
*10.5 | 1997 Stock Option Plan | Incorporated by reference to the 1997 Proxy Statement as filed |
*10.6 | 2005 Stock Option Plan | Incorporated by reference to Exhibit 4.10 to the Company's registration statement on Form S-8 filed August 4, 2005 |
*10.7 | 2012 Stock Option Plan | Incorporated by reference to Exhibit A to the Company's Proxy Statement filed March 23, 2012 |
*10.8 | First Amendment to the 2005 Stock Option, Restricted Stock & Stock Appreciation Rights Plan | Incorporated by reference to Appendix A to the Company's Proxy Statement filed March 17, 2006 |
*10.9 | Second Amendment to the 2005 Stock Option, Restricted Stock & Stock Appreciation Rights Plan | Incorporated by reference to Exhibit B to the Company's Proxy Statement filed March 23, 2009 |
86
10.10 | Excepted Holder Agreement - W. Andrew Adams | Incorporated by reference to Exhibit 10.6 to Form 10-K dated February 24, 2009 |
10.11 | Excepted Holder Agreement between the Company and Andrea Adams Brown with Schedule A identifying substantially identical agreements and setting forth the material details in which such agreements differ from this agreement. | Incorporated by reference to Exhibit 10.2 to Form 10-Q dated November 3, 2010 |
*10.12 | Employment Agreement with J. Justin Hutchens | Incorporated by reference to Exhibit 10.2 to Form 10-Q dated May 5, 2009 |
*10.13 | Amendment No. 1 dated March 10, 2010 to the Employment Agreement dated February 25, 2009 by and between NHI and J. Justin Hutchens | Incorporated by reference to Exhibit 10.2 to Form 10-Q dated May 7, 2010 |
10.14 | Agreement with Care Foundation of America, Inc. | Incorporated by reference to Exhibit 10.11 to Form 10-K dated February 22, 2010 |
10.15 | $100,000,000 credit facility dated February 1, 2010 by and between NHI and certain subsidiaries and Regions bank, as agent | Incorporated by reference to Exhibit 10.3 to Form 10-Q dated May 7, 2010 |
10.16 | $50 million term loan and a $50 million revolving credit facility with Regions Bank dated November 3, 2010 | Incorporated by reference to Exhibit 10.17 to Form 10-K dated February 16, 2010 |
*10.17 | Second Amendment dated December 29, 2010 to the Employment Agreement dated February 25, 2009 by and between NHI and J. Justin Hutchens. | Incorporated by reference to Exhibit 10.20 to Form 10-K filed February 14, 2014 |
*10.18 | Third Amendment dated May 3, 2011 to the Employment Agreement dated February 25, 2009 by and between NHI and J. Justin Hutchens | Incorporated by reference to Exhibit 10.1 to Form 10-Q for the quarterly period ended June 30, 2011 |
10.19 | Contract to Acquire Properties dated October 31, 2011 by and between National Health Investors, Inc. and Firehole River Real Estate Holdings - Greenville, Ltd., Firehole River Real Estate Holdings - West Houston, Ltd., Legend Oaks - Ennis, LLC, Legend Greenville Healthcare, LLC, Legend Oaks - West Houston, LLC and Legend Oaks - North Houston, LLC | Incorporated by reference to Exhibit 10.1 to Form 10-Q dated November 7, 2011 |
10.20 | Credit Agreement, dated as of November 1, 2011, by and among the Company, Wells Fargo Bank, National Association, as Administrative Agent, and the other lenders named therein. | Incorporated by reference to Exhibit 10.2 to Form 10-Q dated November 7, 2011 |
10.21 | Amended and Restated Credit Agreement dated as of May 1, 2012 among the Corporation, as borrower, the lenders from time to time party thereto and Wells Fargo Bank, National Association, as administrative agent, swing line lender and issuing bank. | Incorporated by reference to Exhibit 10.1 to Form 10-Q dated August 3, 2012 |
10.22 | Extension of Master Agreement to Lease dated December 28, 2012. | Incorporated by reference to Exhibit 10.22 to Form 10-K dated February 15, 2013 |
10.23 | Membership Interest Purchase Agreement dated as of June 24, 3013 among Care Investment Trust Inc., Care YBE Subsidiary LLC and NHI-Bickford RE, LLC. | Incorporated by reference to Exhibit 10.1 to Form 10-Q dated August 5, 2013 |
10.24 | Second Amended and Restated Credit Agreement entered into as of June 28, 2013, by and among National Health Investors, Inc., Each Lender from Time to Time Party Hereto, and Wells Fargo Bank, National Association, as Administrative Agent, the Swing Line Lender and the Issuing Bank. | Incorporated by reference to Exhibit 10.2 to Form 10-Q dated August 5, 2013 |
10.25 | First Amendment dated as of December 23, 2013 to the Second Amended and Restated Credit Agreement dated as of June 28, 2013 by and among National Health Investors, Inc. and Wells Fargo Bank, National Association, as Administrative Agent for the Lenders party to the Credit Agreement. | Incorporated by reference to Exhibit 10.1 to Form 8-K dated December 23, 2013 |
87
10.26 | Master Lease dated as of December 23, 2013 between NHI-REIT of Next House, LLC, Myrtle Beach Retirement Residence LLC and Voorhees Retirement Residence LLC, individually and collectively as Landlord, and NH Master Tenant LLC, as Tenant. | Incorporated by reference to Exhibit 10.2 to Form 8-K dated December 23, 2013 |
10.27 | Guarantee of Lease Agreement dated as of December 23, 2013 between NHI-REIT of Next House, LLC, Myrtle Beach Retirement Residence LLC and Voorhees Retirement Residence LLC, individually and collectively as Landlord, and Holiday AL Holdings, LP as Guarantor. | Incorporated by reference to Exhibit 10.3 to Form 8-K dated December 23, 2013 |
10.28 | Purchase Agreement dated as of November 18, 2013 between the Registrant and certain subsidiaries of Holiday Acquisition Holdings LLC. | Incorporated by reference to Exhibit 10.31 to Form 10-K filed February 14, 2014 |
10.29 | Amendment No. 7 to Master Agreement to Lease with NHC. | Incorporated by reference to Exhibit 10.32 to Form 10-K filed February 14, 2014 |
*10.30 | Amended and Restated Employment Agreement effective as of February 14, 2014 by and between National Health Investors, Inc. and Justin Hutchens. | Incorporated by reference to Exhibit 10.2 to Form 10-Q dated May 5, 2014 |
10.31 | Asset Purchase Agreement dated December 1, 2014 with Senior Living Communities, LLC and certain of its affiliates, relating to the acquisition of a portfolio of eight retirement communities. | Incorporated by reference to Exhibit 10.31 to Form 10-K filed February 17, 2015 |
10.32 | $225 million Note Purchase Agreement dated January 13, 2015 with Prudential Capital Group and certain of its affiliates. | Incorporated by reference to Exhibit 10.32 to Form 10-K filed February 17, 2015 |
*10.33 | First amendment to 2012 Stock Incentive Plan. | Incorporated by reference to Appendix A to Proxy Statement filed March 20, 2015. |
10.34 | Master Credit Agreement dated February 10, 2015 between the Company and LCS-Westminster Partnership | Incorporated by reference to Exhibit 10.2 to Form 10-Q dated May 7, 2015 |
10.35 | Multifamily Loan and Security Agreement for Urbandale Bickford Cottage by and between Care YBE Subsidiary LLC, a Delaware limited liability company, and KeyBank National Association, a national banking association with Appendix 1 identifying substantially identical agreements and setting forth the material details in which such agreements differ from this agreement. | Incorporated by reference to Exhibit 10.3 to Form 10-Q dated May 7, 2015 |
10.36 | Multifamily Loan and Security Agreement for Omaha II Bickford Cottage by and between Care YBE Subsidiary LLC, a Delaware limited liability company, and KeyBank National Association, a national banking association with Appendix 1 identifying substantially identical agreements and setting forth the material details in which such agreements differ from this agreement | Incorporated by reference to Exhibit 10.4 to Form 10-Q dated May 7, 2015 |
10.37 | Third Amendment to Third Amended and Restated Credit Agreement and Incremental Facility Agreement dated as of June 30, 2015 by and among National Health Investors, Inc., the Lenders party thereto, and Wells Fargo Bank, National Association, as administrative agent | Incorporated by reference to Exhibit 10.1 to Form 10-Q dated August 5, 2015 |
10.38 | Amendment to Note Purchase Agreement dated as of June 30, 2015 among the Corporation, The Prudential Insurance Company of America and the other Purchasers named therein | Incorporated by reference to Exhibit 10.2 to Form 10-Q dated August 5, 2015 |
*10.39 | Employment Agreement dated as of October 5, 2015 by and between National Health Investors, Inc. and D. Eric Mendelsohn | Incorporated by reference to Exhibit 10.1 to Form 10-Q dated November 4, 2015 |
88
10.40 | $50,000,000 of 8-year notes with a coupon of 3.99% and $50,000,000 of 10-year notes with a coupon of 4.33% to a private placement lender. | Filed herewith |
12.1 | Statement Regarding Computation of Ratio of Earnings to Fixed Charges and Ratio of Fixed Charges and Preferred Stock Dividends | Filed herewith |
21 | Subsidiaries | Filed herewith |
23.1 | Consent of Independent Registered Public Accounting Firm | Filed herewith |
31.1 | Certification of Chief Executive Officer pursuant to 18 U.S.C. Section 1350, as adopted pursuant to Section 302 of the Sarbanes-Oxley Act of 2002 | Filed Herewith |
31.2 | Certification of Principal Financial Officer pursuant to 18 U.S.C Section 1350, as adopted pursuant to Section 302 of the Sarbanes-Oxley Act of 2002 | Filed Herewith |
32 | Certification of Chief Executive Officer and Principal Financial Officer pursuant to 18 U.S.C. Section 1350, as adopted pursuant to Section 906 of the Sarbanes-Oxley Act of 2002 | Filed Herewith |
99.1 | Financial Statement Schedules | Filed herewith |
**101.INS | XBRL Instance Document | |
**101.SCH | XBRL Taxonomy Extension Schema Document | |
**101.CAL | XBRL Taxonomy Extension Calculation Linkbase Document | |
**101.LAB | XBRL Taxonomy Extension Label Linkbase Document | |
**101.PRE | XBRL Taxonomy Extension Presentation Linkbase Document | |
**101.DEF | XBRL Taxonomy Extension Definition Linkbase Document | |
* Indicates management contract or compensatory plan or arrangement.
** As provided in Rule 406T of Regulation S-T, this information shall not be deemed “filed” for purposes of Sections 11 and 12 of the Securities Act and Section 18 of the Securities Exchange Act or otherwise subject to liability under those sections.
89
NATIONAL HEALTH INVESTORS, INC.
SCHEDULE II - VALUATION AND QUALIFYING ACCOUNTS
FOR THE YEARS ENDED DECEMBER 31, 2015, 2014, AND 2013
(in thousands)
Balance | Additions | ||||||||||||||
Beginning | Charged to Costs | Balance | |||||||||||||
of Period | and Expenses1 | Deductions | End of Period | ||||||||||||
For the year ended December 31, 2015 | |||||||||||||||
Loan loss allowance | $ | — | $ | — | $ | — | $ | — | |||||||
For the year ended December 31, 2014 | |||||||||||||||
Loan loss allowance | $ | — | $ | — | $ | — | $ | — | |||||||
For the year ended December 31, 2013 | |||||||||||||||
Loan loss allowance | $ | — | $ | — | $ | — | $ | — | |||||||
1 In the Consolidated Statements of Income, we report the net amount of our provision for loan and realty losses and our recoveries of amounts previously written down. In 2015, we received $491,000 as a secured creditor in the final settlement of a bankruptcy proceeding and recorded a recovery of a previous write-down. For 2013, net losses were $1,976,000, consisting of a $4,037,000 note impairment and a $2,061,000 recovery and there was no provision for losses during the year.
90
NATIONAL HEALTH INVESTORS, INC. | |||||||||||||||||||||||||||||||||
SCHEDULE III - REAL ESTATE AND ACCUMULATED DEPRECIATION | |||||||||||||||||||||||||||||||||
December 31, 2015 | |||||||||||||||||||||||||||||||||
(in thousands) | |||||||||||||||||||||||||||||||||
Costs | Gross Amount at Which | ||||||||||||||||||||||||||||||||
Initial Cost to Company | Capitalized | Carried at Close of Period | Date | ||||||||||||||||||||||||||||||
Buildings & | Subsequent to | Buildings & | Accumulated | Acquired/ | |||||||||||||||||||||||||||||
Encumbrances | Land | Improvements | Acquisition | Land | Improvements | Total | Depreciation | Constructed | |||||||||||||||||||||||||
Skilled Nursing Facilities | |||||||||||||||||||||||||||||||||
Anniston, AL | $ | — | $ | 70 | $ | 4,477 | $ | — | $ | 70 | $ | 4,477 | $ | 4,547 | $ | 3,273 | 10/17/1991 | ||||||||||||||||
Moulton, AL | — | 25 | 688 | — | 25 | 688 | 713 | 688 | 10/17/1991 | ||||||||||||||||||||||||
Avondale, AZ | — | 453 | 6,678 | — | 453 | 6,678 | 7,131 | 3,408 | 8/13/1996 | ||||||||||||||||||||||||
Brooksville, FL | — | 1,217 | 16,166 | — | 1,217 | 16,166 | 17,383 | 2,391 | 2/1/2010 | ||||||||||||||||||||||||
Crystal River, FL | — | 912 | 12,117 | — | 912 | 12,117 | 13,029 | 1,792 | 2/1/2010 | ||||||||||||||||||||||||
Dade City, FL | — | 605 | 8,042 | — | 605 | 8,042 | 8,647 | 1,190 | 2/1/2010 | ||||||||||||||||||||||||
Hudson, FL (2 facilities) | — | 1,290 | 22,392 | — | 1,290 | 22,392 | 23,682 | 9,443 | Various | ||||||||||||||||||||||||
Merritt Island, FL | — | 701 | 8,869 | — | 701 | 8,869 | 9,570 | 6,740 | 10/17/1991 | ||||||||||||||||||||||||
New Port Richey, FL | — | 228 | 3,023 | — | 228 | 3,023 | 3,251 | 447 | 2/1/2010 | ||||||||||||||||||||||||
Plant City, FL | — | 405 | 8,777 | — | 405 | 8,777 | 9,182 | 6,762 | 10/17/1991 | ||||||||||||||||||||||||
Stuart, FL | — | 787 | 9,048 | — | 787 | 9,048 | 9,835 | 6,982 | 10/17/1991 | ||||||||||||||||||||||||
Trenton, FL | — | 851 | 11,312 | — | 851 | 11,312 | 12,163 | 1,673 | 2/1/2010 | ||||||||||||||||||||||||
Glasgow, KY | — | 33 | 2,110 | — | 33 | 2,110 | 2,143 | 1,953 | 10/17/1991 | ||||||||||||||||||||||||
Greenfield, MA | — | 370 | 4,341 | — | 370 | 4,341 | 4,711 | 267 | 8/30/2013 | ||||||||||||||||||||||||
Holyoke, MA | — | 110 | 943 | — | 110 | 943 | 1,053 | 61 | 8/30/2013 | ||||||||||||||||||||||||
Quincy, MA | — | 450 | 710 | — | 450 | 710 | 1,160 | 43 | 8/30/2013 | ||||||||||||||||||||||||
Taunton, MA | — | 900 | 5,906 | — | 900 | 5,906 | 6,806 | 367 | 8/30/2013 | ||||||||||||||||||||||||
Desloge, MO | — | 178 | 3,804 | — | 178 | 3,804 | 3,982 | 3,108 | 10/17/1991 | ||||||||||||||||||||||||
Joplin, MO | — | 175 | 4,034 | — | 175 | 4,034 | 4,209 | 2,599 | 10/17/1991 | ||||||||||||||||||||||||
Kennett, MO | — | 180 | 4,928 | — | 180 | 4,928 | 5,108 | 4,055 | 10/17/1991 | ||||||||||||||||||||||||
Maryland Heights, MO | — | 482 | 5,512 | — | 482 | 5,512 | 5,994 | 5,139 | 10/17/1991 | ||||||||||||||||||||||||
St. Charles, MO | — | 150 | 4,790 | — | 150 | 4,790 | 4,940 | 3,892 | 10/17/1991 | ||||||||||||||||||||||||
Manchester, NH (2 facilities) | — | 790 | 20,077 | — | 790 | 20,077 | 20,867 | 1,213 | 8/30/2013 | ||||||||||||||||||||||||
Epsom, NH | — | 630 | 2,191 | — | 630 | 2,191 | 2,821 | 141 | 8/30/2013 | ||||||||||||||||||||||||
Albany, OR | — | 190 | 10,415 | — | 190 | 10,415 | 10,605 | 556 | 3/31/2014 | ||||||||||||||||||||||||
Creswell, OR | — | 470 | 8,946 | — | 470 | 8,946 | 9,416 | 480 | 3/31/2014 | ||||||||||||||||||||||||
Forest Grove, OR | — | 540 | 11,848 | — | 540 | 11,848 | 12,388 | 607 | 3/31/2014 | ||||||||||||||||||||||||
Anderson, SC | — | 308 | 4,643 | — | 308 | 4,643 | 4,951 | 4,099 | 10/17/1991 | ||||||||||||||||||||||||
Greenwood, SC | — | 222 | 3,457 | — | 222 | 3,457 | 3,679 | 2,990 | 10/17/1991 | ||||||||||||||||||||||||
Laurens, SC | — | 42 | 3,426 | — | 42 | 3,426 | 3,468 | 2,759 | 10/17/1991 | ||||||||||||||||||||||||
Orangeburg, SC | — | 300 | 3,714 | — | 300 | 3,714 | 4,014 | 740 | 9/25/2008 | ||||||||||||||||||||||||
Athens, TN | — | 38 | 1,463 | — | 38 | 1,463 | 1,501 | 1,322 | 10/17/1991 | ||||||||||||||||||||||||
Chattanooga, TN | — | 143 | 2,309 | — | 143 | 2,309 | 2,452 | 2,098 | 10/17/1991 | ||||||||||||||||||||||||
91
NATIONAL HEALTH INVESTORS, INC. | |||||||||||||||||||||||||||||||||
SCHEDULE III - REAL ESTATE AND ACCUMULATED DEPRECIATION | |||||||||||||||||||||||||||||||||
December 31, 2015 | |||||||||||||||||||||||||||||||||
(in thousands) | |||||||||||||||||||||||||||||||||
Costs | Gross Amount at Which | ||||||||||||||||||||||||||||||||
Initial Cost to Company | Capitalized | Carried at Close of Period | Date | ||||||||||||||||||||||||||||||
Buildings & | Subsequent to | Buildings & | Accumulated | Acquired/ | |||||||||||||||||||||||||||||
Encumbrances | Land | Improvements | Acquisition | Land | Improvements | Total | Depreciation | Constructed | |||||||||||||||||||||||||
Dickson, TN | — | 90 | 3,541 | — | 90 | 3,541 | 3,631 | 2,860 | 10/17/1991 | ||||||||||||||||||||||||
Franklin, TN | — | 47 | 1,130 | — | 47 | 1,130 | 1,177 | 986 | 10/17/1991 | ||||||||||||||||||||||||
Hendersonville, TN | — | 363 | 3,837 | — | 363 | 3,837 | 4,200 | 2,765 | 10/17/1991 | ||||||||||||||||||||||||
Johnson City, TN | — | 85 | 1,918 | — | 85 | 1,918 | 2,003 | 1,825 | 10/17/1991 | ||||||||||||||||||||||||
Lewisburg, TN (2 facilities) | — | 46 | 994 | — | 46 | 994 | 1,040 | 942 | 10/17/1991 | ||||||||||||||||||||||||
McMinnville, TN | — | 73 | 3,618 | — | 73 | 3,618 | 3,691 | 2,887 | 10/17/1991 | ||||||||||||||||||||||||
Milan, TN | — | 41 | 1,826 | — | 41 | 1,826 | 1,867 | 1,589 | 10/17/1991 | ||||||||||||||||||||||||
Pulaski, TN | — | 53 | 3,921 | — | 53 | 3,921 | 3,974 | 3,187 | 10/17/1991 | ||||||||||||||||||||||||
Lawrenceburg, TN | — | 98 | 2,900 | — | 98 | 2,900 | 2,998 | 2,168 | 10/17/1991 | ||||||||||||||||||||||||
Dunlap, TN | — | 35 | 3,679 | — | 35 | 3,679 | 3,714 | 2,752 | 10/17/1991 | ||||||||||||||||||||||||
Smithville, TN | — | 35 | 3,816 | — | 35 | 3,816 | 3,851 | 3,022 | 10/18/1991 | ||||||||||||||||||||||||
Somerville, TN | — | 26 | 677 | — | 26 | 677 | 703 | 653 | 10/19/1991 | ||||||||||||||||||||||||
Sparta, TN | — | 80 | 1,602 | — | 80 | 1,602 | 1,682 | 1,353 | 10/20/1991 | ||||||||||||||||||||||||
Canton, TX | — | 420 | 12,330 | — | 420 | 12,330 | 12,750 | 1,091 | 4/18/2013 | ||||||||||||||||||||||||
Corinth, TX | — | 1,075 | 13,935 | — | 1,075 | 13,935 | 15,010 | 1,326 | 4/18/2013 | ||||||||||||||||||||||||
Ennis, TX | — | 986 | 9,025 | — | 986 | 9,025 | 10,011 | 1,335 | 10/31/2011 | ||||||||||||||||||||||||
Greenville, TX | — | 1,800 | 13,948 | — | 1,800 | 13,948 | 15,748 | 1,855 | 10/31/2011 | ||||||||||||||||||||||||
Houston, TX (4 facilities) | — | 3,458 | 57,061 | — | 3,458 | 57,061 | 60,519 | 9,462 | Various | ||||||||||||||||||||||||
Kyle, TX | — | 1,096 | 12,279 | — | 1,096 | 12,279 | 13,375 | 1,546 | 6/11/2012 | ||||||||||||||||||||||||
Paris, TX | — | 60 | 12,040 | — | 60 | 12,040 | 12,100 | 2,383 | 6/30/2009 | ||||||||||||||||||||||||
San Antonio, TX | — | 300 | 12,150 | — | 300 | 12,150 | 12,450 | 2,610 | 6/30/2009 | ||||||||||||||||||||||||
Bristol, VA | — | 176 | 2,511 | — | 176 | 2,511 | 2,687 | 2,042 | 10/17/1991 | ||||||||||||||||||||||||
— | 24,688 | 399,894 | — | 24,688 | 399,894 | 424,582 | 133,917 | ||||||||||||||||||||||||||
Assisted Living Facilities | |||||||||||||||||||||||||||||||||
Rainbow City, AL | — | 670 | 11,330 | — | 670 | 11,330 | 12,000 | 738 | 10/31/2013 | ||||||||||||||||||||||||
Gilbert, AZ | — | 451 | 3,142 | 79 | 451 | 3,221 | 3,672 | 1,358 | 12/31/1998 | ||||||||||||||||||||||||
Glendale, AZ | — | 387 | 3,823 | 58 | 387 | 3,881 | 4,268 | 1,645 | 12/31/1998 | ||||||||||||||||||||||||
Tucson, AZ (2 facilities) | — | 919 | 6,656 | 190 | 919 | 6,846 | 7,765 | 2,879 | 12/31/1998 | ||||||||||||||||||||||||
Sacramento, CA | — | 660 | 10,840 | — | 660 | 10,840 | 11,500 | 490 | 6/1/2014 | ||||||||||||||||||||||||
Bartow, FL | — | 225 | 3,192 | — | 225 | 3,192 | 3,417 | 493 | 11/30/2010 | ||||||||||||||||||||||||
Lakeland, FL | — | 250 | 3,167 | — | 250 | 3,167 | 3,417 | 491 | 11/30/2010 | ||||||||||||||||||||||||
Maitland, FL | — | 1,687 | 5,428 | — | 1,687 | 5,428 | 7,115 | 2,963 | 8/6/1996 | ||||||||||||||||||||||||
St. Cloud, FL | — | 307 | 3,117 | — | 307 | 3,117 | 3,424 | 483 | 11/30/2010 | ||||||||||||||||||||||||
92
NATIONAL HEALTH INVESTORS, INC. | |||||||||||||||||||||||||||||||||
SCHEDULE III - REAL ESTATE AND ACCUMULATED DEPRECIATION | |||||||||||||||||||||||||||||||||
December 31, 2015 | |||||||||||||||||||||||||||||||||
(in thousands) | |||||||||||||||||||||||||||||||||
Costs | Gross Amount at Which | ||||||||||||||||||||||||||||||||
Initial Cost to Company | Capitalized | Carried at Close of Period | Date | ||||||||||||||||||||||||||||||
Buildings & | Subsequent to | Buildings & | Accumulated | Acquired/ | |||||||||||||||||||||||||||||
Encumbrances | Land | Improvements | Acquisition | Land | Improvements | Total | Depreciation | Constructed | |||||||||||||||||||||||||
Greensboro, GA | — | 572 | 4,849 | 731 | 572 | 5,580 | 6,152 | 580 | 9/15/2011 | ||||||||||||||||||||||||
Ames, IA | 3,193 | 360 | 4,670 | — | 360 | 4,670 | 5,030 | 335 | 6/28/2013 | ||||||||||||||||||||||||
Burlington, IA | 3,901 | 200 | 8,374 | — | 200 | 8,374 | 8,574 | 602 | 6/28/2013 | ||||||||||||||||||||||||
Cedar Falls, IA | 4,013 | 260 | 4,700 | 30 | 260 | 4,730 | 4,990 | 343 | 6/28/2013 | ||||||||||||||||||||||||
Clinton, IA | 2,777 | 133 | 3,215 | 60 | 133 | 3,275 | 3,408 | 477 | 6/30/2010 | ||||||||||||||||||||||||
Ft. Dodge, IA | 4,008 | 100 | 7,208 | — | 100 | 7,208 | 7,308 | 506 | 6/28/2013 | ||||||||||||||||||||||||
Iowa City, IA | 2,521 | 297 | 2,725 | 33 | 297 | 2,758 | 3,055 | 464 | 6/30/2010 | ||||||||||||||||||||||||
Marshalltown, IA | 5,714 | 240 | 6,208 | — | 240 | 6,208 | 6,448 | 443 | 6/28/2013 | ||||||||||||||||||||||||
Muscatine, IA | — | 140 | 1,802 | — | 140 | 1,802 | 1,942 | 146 | 6/28/2013 | ||||||||||||||||||||||||
Urbandale, IA | 8,113 | 540 | 4,292 | — | 540 | 4,292 | 4,832 | 324 | 6/28/2013 | ||||||||||||||||||||||||
Caldwell, ID | — | 320 | 9,353 | — | 320 | 9,353 | 9,673 | 493 | 3/31/2014 | ||||||||||||||||||||||||
Weiser, ID | — | 20 | 2,433 | — | 20 | 2,433 | 2,453 | 191 | 12/21/2012 | ||||||||||||||||||||||||
Aurora, IL | — | 1,364 | 682 | — | 1,364 | 682 | 2,046 | — | Under Construction | ||||||||||||||||||||||||
Bourbonnais, IL | 7,974 | 170 | 16,594 | 15 | 170 | 16,609 | 16,779 | 1,157 | 6/28/2013 | ||||||||||||||||||||||||
Moline, IL | 3,896 | 250 | 5,630 | — | 250 | 5,630 | 5,880 | 407 | 6/28/2013 | ||||||||||||||||||||||||
Peoria, IL | 4,199 | 403 | 4,532 | 248 | 403 | 4,780 | 5,183 | 765 | 10/19/2009 | ||||||||||||||||||||||||
Quincy, IL | 6,055 | 360 | 12,403 | — | 360 | 12,403 | 12,763 | 864 | 6/28/2013 | ||||||||||||||||||||||||
Rockford, IL | 6,412 | 390 | 12,575 | — | 390 | 12,575 | 12,965 | 902 | 6/28/2013 | ||||||||||||||||||||||||
Springfield, IL | 15,386 | 450 | 19,355 | — | 450 | 19,355 | 19,805 | 1,346 | 6/28/2013 | ||||||||||||||||||||||||
Tinley Park, IL | — | 1,618 | 5,172 | — | 1,618 | 5,172 | 6,790 | — | Under Construction | ||||||||||||||||||||||||
Carmel, IN | — | 574 | 7,336 | 353 | 574 | 7,689 | 8,263 | 294 | 11/12/2014 | ||||||||||||||||||||||||
Crawfordsville, IN | 2,559 | 300 | 3,134 | — | 300 | 3,134 | 3,434 | 230 | 6/28/2013 | ||||||||||||||||||||||||
Crown Point, IN | — | 791 | 7,020 | 227 | 791 | 7,247 | 8,038 | 546 | 10/30/2013 | ||||||||||||||||||||||||
Greenwood, IN | — | 463 | 6,810 | 245 | 463 | 7,055 | 7,518 | 535 | 11/7/2013 | ||||||||||||||||||||||||
Lafayette, IN | — | 546 | 4,583 | — | 546 | 4,583 | 5,129 | 674 | 6/30/2010 | ||||||||||||||||||||||||
Wabash, IN | — | 320 | 2,242 | — | 320 | 2,242 | 2,562 | 184 | 6/28/2013 | ||||||||||||||||||||||||
Mission, KS | — | 1,901 | 17,310 | 561 | 1,901 | 17,871 | 19,772 | 1,979 | 9/30/2012 | ||||||||||||||||||||||||
Overland Park, KS | — | 2,199 | 20,026 | — | 2,199 | 20,026 | 22,225 | 2,289 | 9/30/2012 | ||||||||||||||||||||||||
Bastrop, LA | — | 325 | 2,456 | — | 325 | 2,456 | 2,781 | 369 | 4/30/2011 | ||||||||||||||||||||||||
Bossier City, LA | — | 500 | 3,344 | — | 500 | 3,344 | 3,844 | 528 | 4/30/2011 | ||||||||||||||||||||||||
Minden, LA | — | 280 | 1,698 | — | 280 | 1,698 | 1,978 | 253 | 4/30/2011 | ||||||||||||||||||||||||
West Monroe, LA | — | 770 | 5,627 | — | 770 | 5,627 | 6,397 | 794 | 4/30/2011 | ||||||||||||||||||||||||
Baltimore, MD | — | 860 | 8,078 | 533 | 860 | 8,611 | 9,471 | 485 | 10/31/2013 | ||||||||||||||||||||||||
Battle Creek, MI | 3,066 | 398 | 3,093 | 197 | 398 | 3,290 | 3,688 | 530 | 10/19/2009 | ||||||||||||||||||||||||
93
NATIONAL HEALTH INVESTORS, INC. | |||||||||||||||||||||||||||||||||
SCHEDULE III - REAL ESTATE AND ACCUMULATED DEPRECIATION | |||||||||||||||||||||||||||||||||
December 31, 2015 | |||||||||||||||||||||||||||||||||
(in thousands) | |||||||||||||||||||||||||||||||||
Costs | Gross Amount at Which | ||||||||||||||||||||||||||||||||
Initial Cost to Company | Capitalized | Carried at Close of Period | Date | ||||||||||||||||||||||||||||||
Buildings & | Subsequent to | Buildings & | Accumulated | Acquired/ | |||||||||||||||||||||||||||||
Encumbrances | Land | Improvements | Acquisition | Land | Improvements | Total | Depreciation | Constructed | |||||||||||||||||||||||||
Lansing, MI | 6,651 | 340 | 7,908 | 174 | 340 | 8,082 | 8,422 | 1,338 | 10/19/2009 | ||||||||||||||||||||||||
Midland, MI | 5,794 | 504 | 6,612 | 162 | 504 | 6,774 | 7,278 | 1,070 | 10/19/2009 | ||||||||||||||||||||||||
Saginaw, MI | 3,814 | 248 | 4,212 | 162 | 248 | 4,374 | 4,622 | 706 | 10/19/2009 | ||||||||||||||||||||||||
Champlin, MN | — | 980 | 4,430 | — | 980 | 4,430 | 5,410 | 775 | 3/10/2010 | ||||||||||||||||||||||||
Hugo, MN | — | 400 | 3,800 | — | 400 | 3,800 | 4,200 | 648 | 3/10/2010 | ||||||||||||||||||||||||
Maplewood, MN | — | 1,700 | 6,510 | — | 1,700 | 6,510 | 8,210 | 1,130 | 3/10/2010 | ||||||||||||||||||||||||
North Branch, MN | — | 595 | 2,985 | — | 595 | 2,985 | 3,580 | 564 | 3/10/2010 | ||||||||||||||||||||||||
Charlotte, NC | — | 650 | 17,896 | — | 650 | 17,896 | 18,546 | 244 | 7/1/2015 | ||||||||||||||||||||||||
Grand Island, NE | 4,463 | 370 | 5,029 | 219 | 370 | 5,248 | 5,618 | 373 | 6/28/2013 | ||||||||||||||||||||||||
Lincoln, NE | 8,418 | 380 | 10,904 | — | 380 | 10,904 | 11,284 | 753 | 6/28/2013 | ||||||||||||||||||||||||
Omaha, NE | 2,455 | 480 | 7,039 | — | 480 | 7,039 | 7,519 | 493 | 6/28/2013 | ||||||||||||||||||||||||
Lancaster, OH | — | 530 | 20,530 | — | 530 | 20,530 | 21,060 | 264 | 7/31/2015 | ||||||||||||||||||||||||
Marysville, OH | — | 1,250 | 13,950 | — | 1,250 | 13,950 | 15,200 | 1,059 | 7/1/2013 | ||||||||||||||||||||||||
Middletown, OH | 9,311 | 940 | 15,548 | — | 940 | 15,548 | 16,488 | 528 | 10/31/2014 | ||||||||||||||||||||||||
Milwaukie, OR | — | 370 | 5,283 | 33 | 370 | 5,316 | 5,686 | 176 | 9/30/2014 | ||||||||||||||||||||||||
Ontario, OR (2 facilities) | — | 428 | 6,128 | — | 428 | 6,128 | 6,556 | 485 | 12/21/2012 | ||||||||||||||||||||||||
Portland, OR | — | 500 | 6,272 | — | 500 | 6,272 | — | 6,772 | 62 | 8/31/2015 | |||||||||||||||||||||||
Conway, SC | — | 344 | 2,877 | 94 | 344 | 2,971 | 3,315 | 1,253 | 12/31/1998 | ||||||||||||||||||||||||
Gallatin, TN | — | 326 | 2,277 | 61 | 326 | 2,338 | 2,664 | 989 | 3/31/1999 | ||||||||||||||||||||||||
Kingsport, TN | — | 354 | 2,568 | 66 | 354 | 2,634 | 2,988 | 1,111 | 12/31/1998 | ||||||||||||||||||||||||
Tullahoma, TN | — | 191 | 2,216 | 57 | 191 | 2,273 | 2,464 | 941 | 3/31/1999 | ||||||||||||||||||||||||
Fredericksburg, VA | — | 1,615 | 3,110 | — | 1,615 | 3,110 | 4,725 | — | Under Construction | ||||||||||||||||||||||||
Midlothian, VA | — | 1,646 | 2,229 | — | 1,646 | 2,229 | 3,875 | — | Under Construction | ||||||||||||||||||||||||
Beaver Dam, WI | — | 210 | 20,149 | — | 210 | 20,149 | 20,359 | 1,743 | 12/21/2012 | ||||||||||||||||||||||||
124,693 | 39,321 | 460,686 | 4,588 | 39,321 | 465,274 | 504,595 | 48,280 | ||||||||||||||||||||||||||
Independent Living Facilities | |||||||||||||||||||||||||||||||||
Rogers, AR | — | 1,470 | 25,282 | — | 1,470 | 25,282 | 26,752 | 1,383 | 12/23/2013 | ||||||||||||||||||||||||
Fort Smith, AR | — | 590 | 22,447 | — | 590 | 22,447 | 23,037 | 1,223 | 12/23/2013 | ||||||||||||||||||||||||
Pinole, CA | — | 1,020 | 18,066 | — | 1,020 | 18,066 | 19,086 | 984 | 12/23/2013 | ||||||||||||||||||||||||
West Covina, CA | — | 940 | 20,280 | — | 940 | 20,280 | 21,220 | 1,090 | 12/23/2013 | ||||||||||||||||||||||||
Hemet, CA | — | 1,250 | 12,645 | — | 1,250 | 12,645 | 13,895 | 718 | 12/23/2013 | ||||||||||||||||||||||||
Fresno, CA | — | 420 | 10,899 | — | 420 | 10,899 | 11,319 | 627 | 12/23/2013 | ||||||||||||||||||||||||
Merced, CA | — | 350 | 18,712 | — | 350 | 18,712 | 19,062 | 1,024 | 12/23/2013 | ||||||||||||||||||||||||
94
NATIONAL HEALTH INVESTORS, INC. | |||||||||||||||||||||||||||||||||
SCHEDULE III - REAL ESTATE AND ACCUMULATED DEPRECIATION | |||||||||||||||||||||||||||||||||
December 31, 2015 | |||||||||||||||||||||||||||||||||
(in thousands) | |||||||||||||||||||||||||||||||||
Costs | Gross Amount at Which | ||||||||||||||||||||||||||||||||
Initial Cost to Company | Capitalized | Carried at Close of Period | Date | ||||||||||||||||||||||||||||||
Buildings & | Subsequent to | Buildings & | Accumulated | Acquired/ | |||||||||||||||||||||||||||||
Encumbrances | Land | Improvements | Acquisition | Land | Improvements | Total | Depreciation | Constructed | |||||||||||||||||||||||||
Roseville, CA | — | 630 | 31,343 | — | 630 | 31,343 | 31,973 | 1,687 | 12/23/2013 | ||||||||||||||||||||||||
Modesto, CA | — | 1,170 | 22,673 | — | 1,170 | 22,673 | 23,843 | 1,218 | 12/23/2013 | ||||||||||||||||||||||||
Athens, GA | — | 910 | 31,940 | — | 910 | 31,940 | 32,850 | 1,722 | 12/23/2013 | ||||||||||||||||||||||||
Columbus, GA | — | 570 | 8,639 | — | 570 | 8,639 | 9,209 | 505 | 12/23/2013 | ||||||||||||||||||||||||
Savannah, GA | — | 1,200 | 15,851 | — | 1,200 | 15,851 | 17,051 | 880 | 12/23/2013 | ||||||||||||||||||||||||
Boise, ID | — | 400 | 12,422 | — | 400 | 12,422 | 12,822 | 690 | 12/23/2013 | ||||||||||||||||||||||||
Fort Wayne, IN | — | 310 | 12,864 | — | 310 | 12,864 | 13,174 | 736 | 12/23/2013 | ||||||||||||||||||||||||
Kenner, LA | — | 310 | 24,259 | — | 310 | 24,259 | 24,569 | 1,301 | 12/23/2013 | ||||||||||||||||||||||||
St. Charles, MO | — | 344 | 3,181 | — | 344 | 3,181 | 3,525 | 2,339 | 10/17/1991 | ||||||||||||||||||||||||
Voorhees, NJ | — | 670 | 23,710 | — | 670 | 23,710 | 24,380 | 1,270 | 12/23/2013 | ||||||||||||||||||||||||
Gahanna, OH | — | 920 | 22,919 | — | 920 | 22,919 | 23,839 | 1,258 | 12/23/2013 | ||||||||||||||||||||||||
Broken Arrow, OK | — | 2,660 | 18,476 | — | 2,660 | 18,476 | 21,136 | 1,026 | 12/23/2013 | ||||||||||||||||||||||||
Newberg, OR | — | 1,080 | 19,187 | — | 1,080 | 19,187 | 20,267 | 1,059 | 12/23/2013 | ||||||||||||||||||||||||
Myrtle Beach, SC | — | 1,310 | 26,229 | — | 1,310 | 26,229 | 27,539 | 1,408 | 12/23/2013 | ||||||||||||||||||||||||
Greenville, SC | — | 560 | 16,547 | — | 560 | 16,547 | 17,107 | 920 | 12/23/2013 | ||||||||||||||||||||||||
Johnson City, TN | — | 55 | 4,077 | — | 55 | 4,077 | 4,132 | 2,684 | 10/17/1991 | ||||||||||||||||||||||||
Chattanooga, TN | — | 9 | 1,567 | — | 9 | 1,567 | 1,576 | 1,184 | 10/17/1991 | ||||||||||||||||||||||||
Bellevue, WA | — | 780 | 18,692 | — | 780 | 18,692 | 19,472 | 1,012 | 12/23/2013 | ||||||||||||||||||||||||
Vancouver, WA (2 facilities) | — | 1,740 | 23,411 | — | 1,740 | 23,411 | 25,151 | 1,312 | 12/23/2013 | ||||||||||||||||||||||||
Yakima, WA | — | 440 | 14,186 | — | 440 | 14,186 | 14,626 | 780 | 12/23/2013 | ||||||||||||||||||||||||
— | 22,108 | 480,504 | — | 22,108 | 480,504 | 502,612 | 32,040 | ||||||||||||||||||||||||||
Senior Living Campuses | |||||||||||||||||||||||||||||||||
Loma Linda, CA | — | 1,200 | 10,800 | 7,326 | 1,200 | 18,126 | 19,326 | 1,049 | 9/28/2012 | ||||||||||||||||||||||||
Maitland, FL | — | 2,318 | 9,161 | 301 | 2,318 | 9,462 | 11,780 | 5,626 | 8/6/1996 | ||||||||||||||||||||||||
West Palm Beach, FL | — | 2,771 | 4,286 | — | 2,771 | 4,286 | 7,057 | 3,687 | 8/6/1996 | ||||||||||||||||||||||||
Nampa, ID | — | 243 | 4,182 | — | 243 | 4,182 | 4,425 | 2,153 | 8/13/1996 | ||||||||||||||||||||||||
Indianapolis, IN | — | 1,810 | 24,571 | — | 1,810 | 24,571 | 26,381 | 345 | 7/1/2015 | ||||||||||||||||||||||||
Roscommon, MI | — | 44 | 6,005 | — | 44 | 6,005 | 6,049 | 62 | 8/31/2015 | ||||||||||||||||||||||||
Mt. Airy, NC | — | 1,370 | 7,470 | — | 1,370 | 7,470 | 8,840 | 222 | 12/17/2014 | ||||||||||||||||||||||||
Madison, TN | — | 920 | 21,826 | — | 920 | 21,826 | 22,746 | 301 | 7/1/2015 | ||||||||||||||||||||||||
Silverdale, WA | — | 1,750 | 23,860 | 2,166 | 1,750 | 26,026 | 27,776 | 2,410 | 8/16/2012 | ||||||||||||||||||||||||
— | 12,426 | 112,161 | 9,793 | 12,426 | 121,954 | 134,380 | 15,855 | ||||||||||||||||||||||||||
95
NATIONAL HEALTH INVESTORS, INC. | |||||||||||||||||||||||||||||||||
SCHEDULE III - REAL ESTATE AND ACCUMULATED DEPRECIATION | |||||||||||||||||||||||||||||||||
December 31, 2015 | |||||||||||||||||||||||||||||||||
(in thousands) | |||||||||||||||||||||||||||||||||
Costs | Gross Amount at Which | ||||||||||||||||||||||||||||||||
Initial Cost to Company | Capitalized | Carried at Close of Period | Date | ||||||||||||||||||||||||||||||
Buildings & | Subsequent to | Buildings & | Accumulated | Acquired/ | |||||||||||||||||||||||||||||
Encumbrances | Land | Improvements | Acquisition | Land | Improvements | Total | Depreciation | Constructed | |||||||||||||||||||||||||
Entrance-Fee Communities | |||||||||||||||||||||||||||||||||
Fernandina Beach, FL | — | 1,430 | 63,420 | — | 1,430 | 63,420 | 64,850 | 1,765 | 12/17/2014 | ||||||||||||||||||||||||
St. Simons Island, GA | — | 8,770 | 38,070 | — | 8,770 | 38,070 | 46,840 | 1,107 | 12/17/2014 | ||||||||||||||||||||||||
Winston-Salem, NC | — | 8,700 | 73,920 | — | 8,700 | 73,920 | 82,620 | 2,068 | 12/17/2014 | ||||||||||||||||||||||||
Greenville, SC | — | 5,850 | 90,760 | — | 5,850 | 90,760 | 96,610 | 2,505 | 12/17/2014 | ||||||||||||||||||||||||
Myrtle Beach, SC | — | 3,910 | 82,140 | — | 3,910 | 82,140 | 86,050 | 2,323 | 12/17/2014 | ||||||||||||||||||||||||
Pawleys Island, SC | — | 1,480 | 38,620 | — | 1,480 | 38,620 | 40,100 | 1,137 | 12/17/2014 | ||||||||||||||||||||||||
Spartanburg, SC | — | 900 | 49,190 | — | 900 | 49,190 | 50,090 | 1,402 | 12/17/2014 | ||||||||||||||||||||||||
— | 31,040 | 436,120 | — | 31,040 | 436,120 | 467,160 | 12,307 | ||||||||||||||||||||||||||
Medical Office Buildings | |||||||||||||||||||||||||||||||||
Crestview, FL | — | 165 | 3,349 | — | 165 | 3,349 | 3,514 | 2,256 | 6/30/1993 | ||||||||||||||||||||||||
Pasadena, TX | — | 631 | 6,341 | — | 631 | 6,341 | 6,972 | 4,433 | 1/1/1995 | ||||||||||||||||||||||||
— | 796 | 9,690 | — | 796 | 9,690 | 10,486 | 6,689 | ||||||||||||||||||||||||||
Hospitals | |||||||||||||||||||||||||||||||||
La Mesa, CA | — | 4,180 | 8,320 | — | 4,180 | 8,320 | 12,500 | 1,788 | 3/10/2010 | ||||||||||||||||||||||||
Jackson, KY | — | 540 | 10,163 | 7,899 | 540 | 18,062 | 18,602 | 6,545 | 6/12/1992 | ||||||||||||||||||||||||
Murfreesboro, TN | — | 2,444 | 17,585 | — | 2,444 | 17,585 | 20,029 | 1,429 | 10/1/2012 | ||||||||||||||||||||||||
— | 7,164 | 36,068 | 7,899 | 7,164 | 43,967 | 51,131 | 9,762 | ||||||||||||||||||||||||||
Total continuing operations properties | 124,693 | 137,543 | 1,935,123 | 22,280 | 137,543 | 1,957,403 | 2,094,946 | 258,850 | |||||||||||||||||||||||||
Corporate office | — | 157 | 677 | 86 | 157 | 763 | 920 | 209 | |||||||||||||||||||||||||
$ | 124,693 | $ | 137,700 | $ | 1,935,800 | $ | 22,366 | $ | 137,700 | $ | 1,958,166 | $ | 2,095,866 | $ | 259,059 | ||||||||||||||||||
NOTES TO SCHEDULE III - REAL ESTATE AND ACCUMULATED DEPRECIATION
(A) See the notes to the consolidated financial statements.
(B) Depreciation is calculated using estimated useful lives up to 40 years for all completed facilities.
(C) Subsequent to NHC's transfer of the original real estate properties in 1991, we have purchased from NHC $33,909,000 of additions to those properties. As the additions were purchased from NHC rather than developed by us, the $33,909,000 has been included as Initial Cost to Company.
(D) At December 31, 2015, the tax basis of the Company's net real estate assets was $1,838,305.
96
NATIONAL HEALTH INVESTORS, INC. | |||||||||||
SCHEDULE III - REAL ESTATE AND ACCUMULATED DEPRECIATION | |||||||||||
FOR THE YEARS ENDED DECEMBER 31, 2015, 2014 AND 2013 | |||||||||||
(in thousands) | |||||||||||
December 31, | |||||||||||
2015 | 2014 | 2013 | |||||||||
Investment in Real Estate: | |||||||||||
Balance at beginning of period | $ | 1,988,849 | $ | 1,422,002 | $ | 698,536 | |||||
Additions through cash expenditures | 124,113 | 533,171 | 654,670 | ||||||||
Change in property additions in accounts payable | 1,076 | (995 | ) | 3,086 | |||||||
Additions through contingent liabilities | 750 | 3,000 | 1,600 | ||||||||
Reclass of note balance into real estate investment | 255 | — | — | ||||||||
Additions through assumption of debt | — | 7,858 | 80,528 | ||||||||
Tax deferred exchange funds applied to investment in real estate | — | 23,813 | — | ||||||||
Settlement of contingent asset acquisition liability | (3,000 | ) | — | — | |||||||
Additions through settlement of mortgage note | — | — | 13,741 | ||||||||
Sale of properties for cash | (13,563 | ) | — | (30,159 | ) | ||||||
Reclassification to assets held for sale, net | (2,614 | ) | — | — | |||||||
Balance at end of period | $ | 2,095,866 | $ | 1,988,849 | $ | 1,422,002 | |||||
Accumulated Depreciation: | |||||||||||
Balance at beginning of period | $ | 212,300 | $ | 174,262 | $ | 163,146 | |||||
Addition charged to costs and expenses | 53,123 | 38,038 | 20,658 | ||||||||
Sale of properties | (5,096 | ) | — | (9,542 | ) | ||||||
Reclassification to assets held for sale | (1,268 | ) | — | — | |||||||
Balance at end of period | $ | 259,059 | $ | 212,300 | $ | 174,262 | |||||
97
NATIONAL HEALTH INVESTORS, INC. | ||||||||||||||
SCHEDULE IV - MORTGAGE LOANS ON REAL ESTATE | ||||||||||||||
December 31, 2015 | ||||||||||||||
Monthly | Amount Subject To | |||||||||||||
Interest | Maturity | Payment | Prior | Original | Carrying | Delinquent Principal | ||||||||
Rate | Date | Terms | Liens | Face Amount | Amount | or Interest | ||||||||
(in thousands) | ||||||||||||||
First Mortgages: | ||||||||||||||
Skilled nursing facilities: | ||||||||||||||
Grundy, VA | 8.0% | 2032 | $31,000 | $ | 4,396 | $ | 3,019 | |||||||
Virginia Beach, VA | 8.0% | 2031 | $31,000 | 3,814 | 2,715 | |||||||||
Lexington, VA | 8.0% | 2032 | $21,000 | 3,089 | 1,939 | |||||||||
Brookneal, VA | 8.0% | 2031 | $21,000 | 2,780 | 1,906 | |||||||||
Laurel Fork, VA | 8.0% | 2030 | $20,000 | 2,672 | 1,834 | |||||||||
Front Royal, VA | 9.6% | 2027 | $22,000 | 2,367 | 1,524 | |||||||||
Assisted living facility in Owatonna, MN | 7.5% | 2018 | $38,000 | 5,033 | 3,593 | |||||||||
Construction Loan: | ||||||||||||||
Issaquah, WA | 8.0% | 2020 | Interest Only | 55,411 | 55,411 | |||||||||
Issaquah, WA | 6.8% | 2025 | Interest Only | 28,000 | 28,000 | |||||||||
Assisted living facilities: | ||||||||||||||
Naples, FL | 12.0% | 2016 | Interest Only | 2,500 | 2,500 | |||||||||
$ | 102,441 | $ | — | |||||||||||
See the notes to our consolidated financial statements for more information on our mortgage loan receivables.
98
NATIONAL HEALTH INVESTORS, INC. | |||||||||||
SCHEDULE IV - MORTGAGE LOANS ON REAL ESTATE | |||||||||||
FOR THE YEARS ENDED DECEMBER 31, 2015, 2014 AND 2013 | |||||||||||
(in thousands) | |||||||||||
December 31, | |||||||||||
2015 | 2014 | 2013 | |||||||||
Reconciliation of mortgage loans on real estate | |||||||||||
Balance at beginning of period | $ | 34,850 | $ | 34,926 | $ | 68,214 | |||||
Additions: | |||||||||||
New mortgage loans | 83,411 | 1,131 | 1,369 | ||||||||
Total Additions | 83,411 | 1,131 | 1,369 | ||||||||
Deductions: | |||||||||||
Settlement of mortgage note by real estate acquisition | — | — | 13,741 | ||||||||
Impairment of mortgage note | — | — | 4,037 | ||||||||
Collection of principal, less recoveries of previous write-downs | 15,820 | 1,207 | 16,879 | ||||||||
Total Deductions | 15,820 | 1,207 | 34,657 | ||||||||
Balance at end of period | $ | 102,441 | $ | 34,850 | $ | 34,926 | |||||
99