Attached files
| file | filename |
|---|---|
| EX-32.1 - EX-32.1 - WORLD FUEL SERVICES CORP | int-20151231ex3216148cb.htm |
| EX-10.24 - EX-10.24 - WORLD FUEL SERVICES CORP | int-20151231ex1024bff55.htm |
| EX-10.25 - EX-10.25 - WORLD FUEL SERVICES CORP | int-20151231ex102551093.htm |
| EX-31.1 - EX-31.1 - WORLD FUEL SERVICES CORP | int-20151231ex311a8f3df.htm |
| EX-23.1 - EX-23.1 - WORLD FUEL SERVICES CORP | int-20151231ex231486e74.htm |
| EX-31.2 - EX-31.2 - WORLD FUEL SERVICES CORP | int-20151231ex312ef2552.htm |
| EX-21.1 - EX-21.1 - WORLD FUEL SERVICES CORP | int-20151231ex2119cc614.htm |
UNITED STATES SECURITIES AND EXCHANGE COMMISSION
Washington, DC 20549
FORM 10-K
(Mark One)
|
☒ ANNUAL REPORT PURSUANT TO SECTION 13 OR 15(d) OF THE SECURITIES EXCHANGE ACT OF 1934 |
|
OR |
|
☐ TRANSITION REPORT PURSUANT TO SECTION 13 OR 15(d) OF THE SECURITIES EXCHANGE ACT OF 1934 |
COMMISSION FILE NUMBER 1-9533

WORLD FUEL SERVICES CORPORATION
(Exact name of registrant as specified in its charter)
|
Florida |
59-2459427 |
|
(State or other jurisdiction of incorporation or organization) |
(I.R.S. Employer Identification No.) |
|
9800 Northwest 41st Street |
33178 |
|
(Address of principal executive offices) |
(Zip Code) |
|
Registrant’s telephone number, including area code: (305) 428-8000 |
|
|
|
|
|
Securities registered pursuant to Section 12(b) of the Act: |
|
|
Title of each class: |
Name of each exchange on which registered: |
|
Common Stock, |
New York Stock Exchange |
Securities registered pursuant to Section 12(g) of the Act: None
Indicate by check mark if the registrant is a well-known seasoned issuer, as defined in Rule 405 of the Securities Act. Yes ☒ No ☐
Indicate by check mark if the registrant is not required to file reports pursuant to Section 13 or Section 15(d) of the Act. Yes ☐ No ☒
Indicate by check mark whether the registrant (1) has filed all reports required to be filed by Section 13 or 15(d) of the Securities Exchange Act of 1934 during the preceding 12 months (or for such shorter period that the registrant was required to file such reports), and (2) has been subject to such filing requirements for the past 90 days. Yes ☒ No ☐
Indicate by check mark whether the registrant has submitted electronically and posted on its corporate Web site, if any, every Interactive Data File required to be submitted and posted pursuant to Rule 405 of Regulation S-T (§ 232.405 of this chapter) during the preceding 12 months (or for such shorter period that the registrant was required to submit and post such files). Yes ☒ No ☐
Indicate by check mark if disclosure of delinquent filers pursuant to Item 405 of Regulation S-K is not contained herein, and will not be contained, to the best of registrant’s knowledge, in definitive proxy or information statements incorporated by reference in Part III of this Form 10-K or any amendment to this Form 10-K. ☒
Indicate by check mark whether the registrant is a large accelerated filer, an accelerated filer, a non-accelerated filer or a smaller reporting company. See definitions of “large accelerated filer,” “accelerated filer” and “smaller reporting company” in Rule 12b-2 of the Exchange Act. (Check one):
Large accelerated filer ☒ Accelerated filer ☐ Non-Accelerated filer ☐ Smaller Reporting Company ☐
Indicate by check mark whether the registrant is a shell company (as defined in 12b-2 of the Exchange Act). Yes ☐ No ☒
As of June 30, 2015, the registrant’s most recently completed second fiscal quarter, the aggregate market value of the voting and non-voting common equity held by non-affiliates computed by reference to the market price at which the common equity was last sold was $3,382,539,000.
As of February 4, 2016, the registrant had approximately 70,800,000 shares of outstanding common stock, par value $0.01 per share.
Documents incorporated by reference:
Part III – Specified Portions of the Registrant’s Definitive Proxy Statement for the 2016 Annual Meeting of Shareholders.
TABLE OF CONTENTS
Overview
World Fuel Services Corporation (the “Company”) was incorporated in Florida in July 1984 and along with its consolidated subsidiaries is referred to collectively in this Annual Report on Form 10‑K (“2015 10‑K Report”) as “World Fuel,” “we,” “our” and “us.”
We are a global fuel logistics, transaction management and payment processing company, which provides energy management solutions to the aviation, marine and land transportation industries. We compete by providing our customers with value‑added benefits, including single‑supplier convenience, competitive pricing, the availability of trade credit, price risk management, logistical support, fuel quality control and fuel procurement outsourcing. We primarily contract with third parties for the delivery and storage of fuel products, however, we also operate storage facilities and transportation assets.
We have offices throughout the United States and in various foreign jurisdictions, including: the United Kingdom, Denmark, Norway, Sweden, Switzerland, the Netherlands, Germany, Greece, the United Arab Emirates, Russia, Taiwan, South Korea, Singapore, Japan, Hong Kong, Indonesia, Costa Rica, Brazil, Chile, Argentina, Mexico, Colombia, Canada, South Africa, Gibraltar, India and Australia. See “Item 2 – Properties” for a list of principal offices by business segment and “Exhibit 21.1 – Subsidiaries of the Registrant” included in this 2015 10‑K Report for a list of our subsidiaries.
As of February 4, 2016, we employed approximately 4,700 employees globally. Our principal executive office is located at 9800 Northwest 41st Street, Miami, Florida 33178 and our telephone number at this address is 305‑428‑8000. Our internet address is http://www.wfscorp.com and the investor relations section of our website is located at http://ir.wfscorp.com. We make available free of charge, on or through the investor relations section of our website, our Annual Reports on Form 10‑K, Quarterly Reports on Form 10‑Q, Current Reports on Form 8‑K, Proxy Statements and amendments to those reports filed or furnished pursuant to Section 13(a) or 15(d) of the Securities Exchange Act of 1934, as amended (the “Exchange Act”) with the Securities and Exchange Commission (“SEC”) as soon as reasonably practicable after such material is electronically filed with, or furnished to, the SEC. Also posted on our website are our Code of Conduct (“Code of Conduct”), Board of Directors’ committee charters and Corporate Governance Principles. Our internet website and information contained on our internet website are not part of this 2015 10‑K Report and are not incorporated by reference in this 2015 10‑K Report.
Segments
We operate in three reportable segments consisting of aviation, marine and land. In our aviation segment, we offer fuel and related products and services to major commercial airlines, second and third tier airlines, cargo carriers, regional and low cost carriers, airports, fixed based operators, corporate fleets, fractional operators, private aircraft, military fleets and to the United States (“U.S.”) and foreign governments as well as intergovernmental organizations. Our marine segment product and service offerings include fuel, lubricants and related products and services to a broad base of customers, including international container and tanker fleets, commercial cruise lines, yachts and time charter operators, offshore rig owners and operators, the U.S. and foreign governments as well as other fuel suppliers. In our land segment, we offer fuel, crude oil, lubricants, natural gas and related products and services to customers including petroleum distributors operating in the land transportation market, retail petroleum operators, and industrial, commercial, residential and government customers. Within each of our segments we may enter into derivative contracts to mitigate the risk of market price fluctuations and also to offer our customers fuel pricing alternatives to meet their needs. Financial information with respect to our business segments and the geographic areas of our business is provided below and within Note 11 to the accompanying consolidated financial statements included in this 2015 10-K Report.
Aviation Segment
Our aviation‑related service offerings include fuel management, price risk management, ground handling, 24/7 global dispatch services, and international trip planning services, including flight plans, weather reports and overflight permits. In addition, we offer card payment solutions and related processing services. Because fuel is a major component of an aircraft’s operating costs, our customers require cost effective and professional fuel services. We have developed an extensive network of third‑party suppliers and service providers that enables us to provide aviation fuel and related services throughout the world. We believe the breadth of our service offering combined with our global supplier network is a strategic differentiator that allows customers to secure fuel and high‑quality services in locations worldwide on short notice.
We purchase our aviation fuel from suppliers worldwide, which may be delivered into our customers’ aircraft or to a designated storage facility located at one of our suppliers’ locations, pursuant to arrangements with them. Inventory is
1
purchased at airport locations or shipped via pipelines and held at multiple locations for strategic reasons. We also engage in contract sales, which are sales made pursuant to fuel purchase contracts with customers who commit to purchasing fuel from us over the contract term, and spot sales, which are sales that do not involve continuing contractual obligations by our customers to purchase fuel from us. Our cost of fuel is generally tied to market‑based formulas or is government controlled.
Marine Segment
Through our extensive network, we provide our customers with real‑time global market intelligence and rapid access to quality and competitively priced marine fuel 24 hours a day, every day of the year. Our marine fuel-related services include management services for the procurement of fuel, cost control through the use of price hedging instruments, quality control, claims management, and card payment solutions and related processing services.
We serve primarily as a reseller, and accordingly, in those instances we take delivery for fuel purchased from our supplier at the same place and time as the fuel is sold to our customer. We also sell fuel from our inventory, which we maintain in storage facilities that we own or lease. We also serve as a broker and in those cases we are paid a commission for negotiating the fuel purchase transaction between the supplier and the end user and for expediting delivery of the fuel.
The majority of our marine segment activity consists of spot sales. Our cost of fuel is generally tied to spot pricing or market‑based formulas or is government controlled. We also contract with third parties to provide various services for our customers, including fueling of vessels in ports and at sea, and transportation and delivery of fuel and fuel-related products.
Land Segment
Our land‑related services include management services for the procurement of fuel and price risk management. We primarily conduct these activities throughout most of the U.S as well as parts of the United Kingdom and Brazil.
In addition, we offer transaction management services, which include card payment solutions, merchant processing services, payment solutions for tolls across Europe, government payment systems for global fuel procurement and commercial payment programs in the land transportation industry.
In connection with our fuel marketing activities, we serve as a reseller, and in those instances we purchase fuel from a supplier and contemporaneously resell it to our customers through spot and contract sales. The fuel is generally delivered to our customers directly or to a designated tanker truck loading terminal commonly referred to as “racks,” which are owned and operated by our suppliers or other third‑parties. We also maintain inventory in certain strategic locations including pipelines and we transport this inventory by railcar. Our cost of fuel is generally tied to market‑based formulas.
During each of the years presented in the accompanying consolidated financial statements no individual customer accounted for more than 10% of segment or consolidated revenue.
Competitors
We operate globally across industries that are highly fragmented with numerous competitors. Our competitors range in size and complexity from large multinational corporations, principally major oil producers, which have significantly greater capital resources, to relatively small and specialized firms. We compete with major oil producers that market fuel directly to the large commercial airlines, shipping companies and petroleum distributors operating in the land transportation market as well as fuel resellers. We believe that our extensive market knowledge, worldwide footprint, logistics expertise, and the use of derivative contracts to provide fuel pricing alternatives give us the ability to compete within those markets.
Regulation
Our current and past activities are subject to substantial regulation by federal, state and local government agencies, inside and outside the U.S, which enforce laws and regulations governing the transportation, sale, storage and disposal of fuel and the collection, transportation, processing, storage, use and disposal of hazardous substances and wastes, including waste oil and petroleum products. For example, U.S. federal and state environmental laws applicable to us include statutes that: (i) allocate the cost of remedying contamination among specifically identified parties and prevent future contamination; (ii) impose national ambient standards and, in some cases, emission standards, for air pollutants that present a risk to public health or welfare; (iii) govern the management, treatment, storage and disposal of hazardous wastes; and (iv) regulate the discharge of pollutants into waterways. International treaties also prohibit the discharge of petroleum products at sea. The penalties for violations of environmental laws include injunctive relief, recovery of damages for injury to air, water or property, and fines for non‑compliance. See “Item 1A – Risk Factors,” and “Item 3 – Legal Proceedings.”
We may also be affected by new environmental laws and regulations that will apply to us or our customers in the future, some of which could increase the cost or reduce the demand for our products and services. For example, due to concern over the risk of climate change, a number of countries have adopted, or are considering the adoption of, regulatory frameworks to reduce greenhouse gas emissions. In the U.S., the U.S. Environmental Protection Agency has finalized rules requiring the reporting of greenhouse gas (“GHG”) emissions by petroleum product suppliers and facilities meeting certain
2
annual emissions thresholds and to regulate emissions from major sources of GHGs under the Clean Air Act. In other countries, proposed regulations include adoption of cap and trade regimes, carbon taxes, restrictive permitting, increased efficiency standards, and incentives or mandates for renewable energy. Although the ultimate impact of these or other future measures is difficult to accurately predict, they could make our products more expensive or reduce demand for petroleum products, as well as shift demand toward relatively lower-carbon sources. This, in turn, could affect our operations, earnings and competitive position.
Forward‑Looking Statements
Certain statements made in this report and the information incorporated by reference in it, or made by us in other reports, filings with the Securities and Exchange Commission (“SEC”), press releases, teleconferences, industry conferences or otherwise, are “forward-looking statements” within the meaning of the Private Securities Litigation Reform Act of 1995. The forward-looking statements include, without limitation, any statement that may predict, forecast, indicate or imply future results, performance or achievements, and may contain the words “believe,” “anticipate,” “expect,” “estimate,” “project,” “could,” “would,” “will,” “will be,” “will continue,” “will likely result,” “plan,” or words or phrases of similar meaning.
Forward-looking statements are estimates and projections reflecting our best judgment and involve risks, uncertainties or other factors relating to our operations and business environment, all of which are difficult to predict and many of which are beyond our control. The Company’s actual results may differ materially from the future results, performance or achievements expressed or implied by the forward-looking statements. These statements are based on our management’s expectations, beliefs and assumptions concerning future events affecting us, which in turn are based on currently available information.
Examples of forward-looking statements in this 2015 10-K Report include, but are not limited to, our expectations regarding our business strategy, business prospects, operating results, effectiveness of internal controls to manage risk, working capital, liquidity, capital expenditure requirements and future acquisitions. Important assumptions relating to the forward-looking statements include, among others, assumptions regarding demand for our products, the cost, terms and availability of fuel from suppliers, pricing levels, the timing and cost of capital expenditures, outcome of pending litigation, competitive conditions, general economic conditions and synergies relating to acquisitions, joint ventures and alliances. These assumptions could prove inaccurate. Although we believe that the estimates and projections reflected in the forward-looking statements are reasonable, our expectations may prove to be incorrect.
Important factors that could cause actual results to differ materially from the results and events anticipated or implied by such forward-looking statements include, but are not limited to:
|
· |
customer and counterparty creditworthiness and our ability to collect accounts receivable and settle derivative contracts; |
|
· |
changes in the market price of fuel; |
|
· |
changes in the political, economic or regulatory conditions generally and in the markets in which we operate; |
|
· |
our failure to effectively hedge certain financial risks and the use of derivatives; |
|
· |
non-performance by counterparties or customers to derivative contracts; |
|
· |
changes in credit terms extended to us from our suppliers; |
|
· |
non-performance of suppliers on their sale commitments and customers on their purchase commitments; |
|
· |
loss of, or reduced sales to a significant government customer; |
|
· |
non-performance of third-party service providers; |
|
· |
adverse conditions in the industries in which our customers operate, including a continuation of the global economic instability and its impact on the airline and shipping industries; |
|
· |
the impact of cyber and other information security-related incidents; |
|
· |
currency exchange fluctuations; |
|
· |
failure of fuel and other products we sell to meet specifications; |
|
· |
our ability to manage growth; |
|
· |
our ability to effectively integrate and derive benefits from acquired businesses; |
|
· |
material disruptions in the availability or supply of fuel; |
3
|
· |
environmental and other risks associated with the storage, transportation and delivery of petroleum products; |
|
· |
the impact of the Lac-Mégantic derailment and related matters; |
|
· |
risks associated with operating in high risk locations; |
|
· |
uninsured losses; |
|
· |
the impact of natural disasters, such as hurricanes; |
|
· |
our failure to comply with restrictions and covenants in our senior revolving credit facility (“Credit Facility”) and our senior term loans (“Term Loans”); |
|
· |
declines in the value and liquidity of cash equivalents and investments; |
|
· |
our ability to retain and attract senior management and other key employees; |
|
· |
changes in U.S. or foreign tax laws or changes in the mix of taxable income among different tax jurisdictions; |
|
· |
our ability to comply with U.S. and international laws and regulations including those related to anti-corruption, economic sanction programs and environmental matters; |
|
· |
increased levels of competition; |
|
· |
the outcome of litigation and the costs associated in defending any actions; |
|
· |
the liquidity and solvency of banks within our Credit Facility and Term Loans; |
|
· |
increases in interest rates; and |
|
· |
other risks, including those described in “Item 1A - Risk Factors” and those described from time to time in our other filings with the SEC. |
We operate in a very competitive and rapidly changing environment. New risks emerge from time to time. It is not possible for us to predict all of those risks, nor can we assess the impact of all of those risks on our business or the extent to which any factor may cause actual results to differ materially from those contained in any forward-looking statement. The forward-looking statements in this 2015 10-K Report are based on assumptions management believes are reasonable. However, due to the uncertainties associated with forward-looking statements, you should not place undue reliance on any forward-looking statements. Further, forward-looking statements speak only as of the date they are made, and unless required by law, we expressly disclaim any obligation or undertaking to publicly update any of them in light of new information, future events, or otherwise.
For these statements, we claim the protection of the safe harbor for forward-looking statements contained in Section 27A of the Securities Act of 1933, as amended, and Section 21E of the Securities Exchange Act.
We extend credit to most of our customers in connection with their purchases of fuel and services from us, and our business, financial condition, results of operations and cash flows will be adversely affected if we are unable to collect accounts receivable.
We extend credit to certain of our customers in connection with their purchases of fuel and services from us. Our success in attracting customers has been due, in part, to our willingness to extend credit on an unsecured basis to customers, which can include other fuel suppliers, that would otherwise be required to prepay or post letters of credit with other suppliers of fuel and other services. While no single customer represents more than 10% of our total consolidated revenue, diversification of credit risk is limited because we transact primarily within the aviation, marine and land transportation industries.
Our exposure to credit losses will depend on the financial condition of our customers and other factors beyond our control, such as deteriorating conditions in the world economy or in the aviation, marine or land transportation industries, changes in oil prices, political instability, terrorist activities, military action or natural disasters in our market areas. The overall volatility in the credit and financial markets over the past several years increases our potential exposure to customer credit risk because it can make it more difficult for our customers to access sufficient capital to meet their liquidity needs. This market
4
volatility, coupled with a reduction of business activity generally, increases our risks related to our status as an unsecured creditor of many of our customers. Credit losses, if significant, would have a material adverse effect on our business, financial condition, results of operations and cash flows.
Our business is dependent on our ability to obtain financing to meet our capital requirements and fund our future growth, which may be particularly difficult to obtain if there is volatility in the credit or capital markets.
We rely on credit arrangements with banks, suppliers and other parties as a significant source of liquidity for capital requirements not satisfied by operating cash flow. Any inability to obtain credit as and when we need it on commercially reasonable terms or at all, such as in the event there is a substantial tightening of the global credit markets or a significant reduction in supplier trade credit, could have a negative impact on our business, financial condition, and cash flows, as well as our future development and growth. Furthermore, if we are unable to obtain debt financing and instead raise capital through an equity issuance, existing shareholders would be diluted. Even if we are able to obtain debt financing, the restrictions creditors may place on our operations and our increased interest expense and leverage could limit our ability to grow.
Our derivatives transactions with customers, suppliers, merchants and financial institutions expose us to heightened counterparty risk, which could have a material adverse effect on our business.
As part of our price risk management services, we offer certain of our counterparties various pricing structures for future purchases of fuel, including derivatives products designed to hedge exposure to fluctuations in fuel prices. In the ordinary course of business, we enter into fixed forward pricing contracts (“fixed forward contracts”) with our counterparties under which we agree to sell or purchase, as the case may be, certain volumes of fuel at fixed prices. In addition, we may act as a counterparty in swap transactions with some of our customers where the customer may be required to pay us in connection with changes in the price of fuel. Furthermore, we may use derivatives to hedge price risks associated with our fuel inventories and purchase and sale commitments. We typically hedge our financial risk in any of the foregoing types of transactions by entering into derivative instruments with large energy companies, trading houses and financial institutions, on secured and unsecured terms alike.
If we have not required a customer to post collateral in connection with a fixed forward contract or swap transaction, we will have effectively extended unsecured credit to that customer. Based on the volatility of fuel prices, our counterparties may not be willing or able to fulfill their obligations to us under their fixed forward contracts or their swap transactions. In such cases, we would be exposed to losses or costs associated with any such default. For example, in the event the spot market price of fuel at the time of delivery is significantly less than the fixed price, a customer could default on its purchase obligation to us and purchase the fuel at the current spot market rate from another supplier. Meanwhile, we may have entered into a corresponding commitment with a supplier in order to offer our customer specified pricing or terms. Similarly, the counterparties with whom we may hedge our price risk exposure may not be willing or able to fulfill their obligations to us under their swap transactions.
While we generally attempt to structure our agreements such that we are able to recover from the non-performing counterparty any losses or costs we may incur, we may not always be able to recover such amounts and may be exposed to claims for damages, penalties or other costs. Furthermore, although we have credit standards and perform credit evaluations of our customers and suppliers, our evaluations may be inaccurate, or we may fail to effectively monitor exposure of our counterparties, and we cannot ensure that credit performance will not be materially worse than anticipated. Accordingly, should any counterparty fail to honor its obligations under our agreements, we could sustain significant losses that would have a material adverse effect on our business, financial condition, results of operations and cash flows.
We are exposed to various risks in connection with our use of derivatives which could have a material adverse effect on our results of operations.
We enter into financial derivative contracts to mitigate the risk of market price fluctuations in fuel products we sell, to offer our customers fuel pricing alternatives to meet their needs and to mitigate the risk of fluctuations in foreign currency exchange rates. However, our efforts to hedge our exposure to fuel price and exchange rate fluctuations could be ineffective in certain instances. For example, we hedge jet fuel prices with derivatives tied to other petroleum products that often bear some historical correlation to aviation jet fuel (e.g. heating oil in the United States or gasoil in Europe or Asia). If the price of aviation jet fuel and the price of any such products experience divergence in correlation, our attempts to mitigate price risk associated with our aviation business may not be effective. For purposes of hedging, neither heating oil nor gasoil is a perfect substitute for aviation jet fuel and significant pricing differences may occur. There may be times where the change in the price of jet fuel increases or decreases based on market supply and demand fundamentals or disruptive events (e.g. hurricanes) while the change in the price of heating oil or gasoil remains relatively constant.
5
We also enter into proprietary derivative transactions, primarily intended to capitalize on arbitrage opportunities associated with basis, time, quality or geographic spreads related to fuel products we sell. Proprietary derivative transactions, by their nature, often entail exposure to adverse changes in commodity prices in relation to our proprietary positions. Although we have established limits on such exposure, any such adverse changes could result in losses. The risks we face because of our use of financial derivatives can be exacerbated by volatility in the financial and other markets. In addition, we may fail to adequately hedge our risks or could otherwise incur losses if our employees fail to comply with our policies and procedures with respect to hedging or proprietary trading, for example by engaging in unauthorized trading activity, failing to hedge a specific financial risk or failing to observe limits on exposure, which could subject us to financial losses that would have a material adverse effect on our business, financial condition, results of operations and cash flows.
Finally, the majority of our derivatives are not designated as cash flow hedges for accounting purposes, and we therefore recognize changes in the fair market value of these derivatives as a component of revenue or cost of revenue (based on the underlying transaction type) in our consolidated statements of income and comprehensive income. Since the fair value of these derivatives is marked to market at the end of each quarter, changes in the fair value of our derivative instruments as a result of gains or losses may cause our earnings to fluctuate from period to period.
Third parties who fail to provide products or services to us or our customers as agreed could harm our business.
We purchase fuel and other products from suppliers and resell to customers. If the fuel and other products we sell fail to meet the specifications we have agreed to with customers, we could incur significant liabilities if a customer initiates a claim or a lawsuit for which we settle or results in a decision against us. In addition, our relationship with our customers could be adversely affected and adverse publicity about any allegations of contaminated products may negatively affect us, regardless of whether the allegations are true. Although in most cases we have recourse against our suppliers for products that fail to meet contractual specifications, such recourse cannot be assured and may be costly to enforce. For example, several of our supply agreements are with foreign entities, including foreign governments, and are governed by the laws of foreign jurisdictions. If a supplier breaches such agreement, then we may incur the additional costs of determining our rights and obligations under the agreement, under applicable foreign laws, and enforcing an agreement in a foreign jurisdiction. Any significant liability in excess of any applicable insurance coverage could have a material adverse effect on our business, financial condition, results of operations and cash flows.
We also use third parties to provide various services to our customers, including into plane fueling at airports, fueling of vessels in port and at sea and delivering land based fuel. The failure of these third parties to perform these services in accordance with contractual terms for any reason, such as their inability to supply specified fuel or an interruption of their business because of weather, environmental or labor difficulties or political unrest, could affect our relationships with our customers and subject us to claims and other liabilities that could have a material adverse effect on our business, financial condition, results of operations and cash flows.
Due to our international operations, we are subject to U.S. and international laws, including U.S. economic sanctions, the Foreign Corrupt Practices Act (“FCPA”) and similar anti-bribery laws, which can impose significant compliance costs and subject us to civil or criminal penalties for non-compliance.
Doing business on a worldwide basis requires us to comply with the laws and regulations of the U.S. government and various international jurisdictions. These regulations place restrictions on our operations, trade practices and partners and investment decisions. In particular, our international operations are subject to U.S. and foreign anti-corruption laws and regulations, such as the FCPA and the U.K. Anti Bribery Act, and economic sanction programs administered by the U.S. Treasury Department’s Office of Foreign Assets Control (“OFAC”). The FCPA prohibits us from providing anything of value to foreign officials for the purposes of influencing official decisions or obtaining or retaining business and the U.K. Anti Bribery Act prohibits bribery both in the United Kingdom and internationally, as well as bribery across public and private sectors. As part of our business, we regularly deal with state owned enterprises, the employees of which may be considered foreign officials for purposes of the FCPA. In addition, some of the international jurisdictions in which we operate lack a developed legal system and have higher than normal levels of corruption. Our activities in these countries create the risk of improper payments or offers of payments by one of our employees or other parties acting on our behalf.
Furthermore, international trade controls, including economic sanctions, export controls and anti-boycott regulations, are complex, restrict our business dealings with certain countries and individuals, and are constantly changing. Further restrictions may be enacted, amended, enforced or interpreted in a manner that materially impacts our operations. From time to time, certain of our subsidiaries have limited business dealings in countries subject to comprehensive OFAC administered sanctions. These business dealings currently represent an insignificant amount of our consolidated revenue and income and generally consist of the provision of services pursuant to licenses issued by OFAC or as otherwise permitted by applicable sanctions regulations. As a result of the above activities, we are exposed to a heightened risk of violating anti-
6
corruption laws and trade control regulations. Violations of these regulations are punishable by civil penalties, including fines, denial of export privileges, injunctions, asset seizures, debarment from government contracts and revocations or restrictions of licenses, as well as criminal fines and imprisonment.
We have established policies and procedures designed to assist with our compliance with applicable U.S. and international laws and regulations. However, there can be no assurance that our policies and procedures will effectively prevent us from violating these regulations in every transaction in which we may engage, and such a violation could adversely affect our reputation, business, financial condition, results of operations and cash flows. In addition, such a violation could also cause an event of default under our Credit Facility, which if not waived, could result in the acceleration of any outstanding indebtedness, could trigger cross defaults under other agreements to which we are a party (such as certain derivative contracts), and would impair our ability to obtain working capital advances and letters of credit. Such events could adversely affect our business, financial condition, results of operations and cash flows. Finally, various state and municipal governments, universities and other investors maintain prohibitions or restrictions on investments in companies that do business with sanctioned countries, which could adversely affect the market for our securities.
In the past, we have received administrative subpoenas from OFAC requesting information regarding our transactions in countries that are the subject of U.S. sanctions. In responding to these subpoenas, we identified a limited number of transactions that may have resulted in violations of U.S. sanctions regulations or our OFAC issued licenses. In each of these responses, we noted that the transactions identified as potential violations resulted in very small amounts of revenue to us. We routinely take actions to further strengthen our compliance-related policies and procedures. Nevertheless, should OFAC determine that any activities constituted violations of U.S. sanctions regulations, civil penalties, including fines, could be assessed against us. Additionally, in the course of its ongoing reviews, OFAC could request additional information from us, in the form of additional subpoenas or otherwise, and we intend to fully cooperate with any such additional subpoenas or requests. We cannot predict the ultimate outcome of any OFAC review, the total costs to be incurred in response to these reviews, the potential impact on our personnel, the effect of implementing any further measures that may be necessary to ensure full compliance with U.S. sanctions regulations or to what extent, if at all, we could be subject to fines, sanctions or other penalties.
Our fuel storage and transportation operations have inherent risks that could negatively impact our stock price, results of operations and financial condition.
Operating fuel storage and distribution terminals and transporting fuel products involve inherent risks including:
•oil spills and other environmental mishaps;
•fires, collisions and other catastrophic disasters;
•injuries and loss of life;
•severe damage to and destruction of property and equipment; and
•loss of product and business interruption.
Damage arising from such occurrences may result in fines and significant third party claims. We generally maintain insurance to mitigate these types of costs, but there can be no assurance that our insurance would be sufficient to cover the liabilities we might suffer from the occurrence of one or more of the risks described above.
In addition, if we are involved in a spill, leak, fire or other accident involving hazardous substances or if there are releases of fuel or fuel products we own or have custody of, our operations could be disrupted. We could also be subject to material liabilities, such as the cost of investigating and remediating contaminated properties or claims by customers, employees or others who may have been injured, or whose property may have been damaged. These liabilities, to the extent not covered by insurance, could have a material adverse effect on our business, financial condition, results of operations and cash flows. Some environmental laws impose strict liability, which means we could have liability without regard to whether we were negligent or at fault. Any of these occurrences, and any resulting negative media coverage, could have a material adverse effect on our stock price and on our business, financial condition, results of operations and cash flows.
Information technology failures and data security breaches, including as a result of cybersecurity attacks, could negatively impact our results of operations and financial condition, subject us to increased operating costs, and expose us to litigation.
We rely on our computer systems and network infrastructure across our operations. Despite our implementation of security and back-up measures, all of our technology systems are vulnerable to damage, disability or failures due to physical theft, fire, power loss, telecommunications failure, operational error, or other catastrophic events. Our technology systems are
7
also subject to cybersecurity attacks including malware, other malicious software, phishing email attacks, attempts to gain unauthorized access to our data, the unauthorized release, corruption or loss of our data, loss or damage to our data delivery systems, and other electronic security breaches. Due to the large number of transactions that run through our systems each day, significant system down-time or slow-down could have a material impact on our ability to conduct business, process and record transactions, as well as make operational and financial decisions.
In addition to our own vulnerabilities, our reliance on email transmissions over public networks to process certain transactions exposes us to risks associated with the failure of our customers, business partners and other third parties to use appropriate controls to protect sensitive information, as well as to risks of on-line fraud and email scams. Furthermore, despite our efforts to ensure the integrity of our systems and prevent future cybersecurity attacks, it is possible that our business, financial and other systems could be compromised, especially because such attacks can originate from a wide variety of sources including persons involved in organized crime or associated with external service providers. Those parties may also attempt to fraudulently induce employees, customers or other users of our systems to disclose sensitive information in order to gain access to our data or use electronic means to induce the company to enter into fraudulent transactions. Past and future occurrences of such attacks could damage our reputation and our ability to conduct our business, impact our credit and risk exposure decisions, cause us to lose customers or revenues, subject us to litigation and require us to incur significant expense to address and remediate or otherwise resolve these issues, which could have a material adverse effect on our business, financial condition, results of operations and cash flows.
We currently maintain insurance to protect against cybersecurity risks and incidents. However, there can be no assurance that such insurance coverage will be available in the future on commercially reasonable terms or at commercially reasonable rates. In addition, insurance coverage may be insufficient or may not cover certain of these cybersecurity risks and, even if available, the insurance proceeds received for any loss or damage may be insufficient to cover our losses or liabilities without materially adversely affecting our business, financial condition and results of operations.
The personal information that we collect may be vulnerable to breach, theft, loss or misuse that could increase operational costs, result in regulatory penalties and adversely affect our results of operation and financial condition.
In connection with various businesses we operate, such as our transaction management and payment processing businesses, we have access to sensitive, confidential or personal data or information from our employees, customers (both corporate and individual consumers), suppliers and other third parties, some of which may be subject to privacy and security laws, regulations and customer imposed controls. In the ordinary course of business, we collect, process, transmit and retain sensitive information regarding these parties. Despite our efforts to protect this information, our facilities and systems and those of our third party service providers may be vulnerable to security breaches, theft, misplaced or lost data and programming and human errors that could potentially lead to such information being compromised.
Failure to adequately protect this information could lead to substantial fines, penalties, third party liability, remediation costs, potential cancellation of existing contracts and inability to compete for future business. Due to legislative and regulatory rules, we may be required to notify the owners of such information of any data breaches, which could harm our business relationships, reputation and financial results, as well as subject us to litigation or actions by regulatory authorities. Furthermore, there has been heightened legislative and regulatory focus on data security in the U.S. and abroad (particularly in the European Union). Significant changes in applicable regulations may require us to make costly changes to our systems. Although we have taken steps to address these concerns by implementing network security and internal control measures, there can be no assurance that a data security breach will not have a material adverse effect on our business, financial condition, results of operations and cash flows.
Businesses we have acquired or may acquire in the future, as well as strategic investments such as joint venture arrangements, expose us to increased risks.
As part of our growth strategy, we have been acquisitive and intend to continue to explore acquisition opportunities of fuel resellers, logistics and transaction management and payment processing companies, as well as other service and technology businesses. We cannot provide any assurance that we will find attractive acquisition candidates in the future, that we will be able to acquire such candidates on economically acceptable terms or that we will be able to finance acquisitions on economically acceptable terms. If we acquire new businesses in the future, we may incur substantial additional indebtedness and other expenses or we may complete potentially dilutive issuances of equity securities, which may affect the market price of our common stock, inhibit our ability to pay dividends or otherwise restrict our operations. We have also entered into joint venture arrangements and equity investments intended to complement or expand our business, as well as divested of certain of our businesses or assets. These types of transactions can pose substantial risks and liabilities associated with their operations, as well as the risk that our relationships with our partners do not succeed in the manner that we anticipate. These transactions involve significant challenges and risks, including:
8
•our ability to effectively integrate the operations, financial reporting, and personnel of acquired companies and manage acquired businesses or strategic investments, while maintaining uniform standards and controls;
•our ability to realize our investment and anticipated synergies in the acquired businesses or strategic investments;
•the diversion of management’s time and attention from other business concerns, the potentially negative impact of changes in management on existing business relationships and other disruptions of our business;
•the risks associated with entering into businesses or markets in which we may have no or limited direct prior experience;
•the potential loss of key employees, customers or suppliers of the acquired businesses;
•the ability to integrate the IT systems of acquired businesses into our existing IT infrastructure and manage those systems that cannot be effectively integrated;
•the requirement to write down acquired assets as a result of the acquired business or strategic investment being worth less than we paid or invested in it;
•capital expenditure requirements exceeding our estimates;
•the risk that an acquisition or strategic investment could reduce our future earnings; and
•the assumption of material liabilities, exposure to litigation, regulatory noncompliance or unknown liabilities, and no or limited indemnities from sellers or ongoing indemnity obligations to purchasers.
Adverse conditions in the aviation, marine and land transportation industries may have a material adverse effect on our business.
Our business is focused on the marketing of fuel and other related products and services to the aviation, marine and land transportation industries, which are generally affected by economic cycles. Therefore, weak economic conditions can have a negative impact on the business of our customers which may, in turn, have an adverse effect on our business. In addition, any political instability, natural disasters and other weather-related events, terrorist activity or military action that disrupts shipping, flight operations or land transportation will adversely affect our customers and may reduce the demand for our products and services. Our business could also be adversely affected by increased merger activity in the aviation, marine or land transportation industries, which may reduce the number of customers that purchase our products and services, as well as the prices we are able to charge for such products and services.
In addition, the aviation, marine and land transportation industries are subject to continuing changes in laws and regulations, including environmental regulations mandating or incentivizing alternative energy sources or attempting to control or limit emissions and pollution. For example, amendments to the International Convention for the Prevention of Pollution from Ships, or MARPOL, established a phased reduction of the sulfur content in fuel oil and allows for stricter sulfur limits in designated emission control areas. Further changes in laws and regulations applicable to international and national maritime trade are expected over the coming years. Complying with these and other laws and regulations may require capital expenditures by our customers or otherwise increase our customers’ operating costs, which could in turn, reduce the demand for our products and services. Although the ultimate impact of any regulations is difficult to predict accurately, they could have a material adverse effect on our business or on the businesses of our customers.
Our business is subject to seasonal variability, which can cause our revenues and operating results to fluctuate and adversely affect the market price of our shares.
Our operating results are subject to seasonal variability. Our seasonality results from numerous factors, including traditionally higher demand for natural gas and home heating oil during the winter months and aviation and land fuel during the summer months, as well as other seasonal weather patterns. As such, our results for the fourth and first quarters of the year tend to be the strongest while the second quarter is generally the weakest. There can be no assurance that our historic operating results patterns will continue in future periods as we cannot influence or forecast all of these factors. Accordingly, results for any one quarter may not necessarily be indicative of the results that may be achieved for any other quarter or for the full fiscal year. These seasonal fluctuations in our quarterly operating results may therefore adversely affect the market price of our shares.
If we fail to comply with laws or other government regulations applicable to our operations, we could suffer penalties or costs that could have a material adverse effect on our business.
We are required to comply with extensive and complex laws and other regulations in the countries in which we operate, and at the international, federal, state and local government levels relating to, among other things:
•the transportation, handling and delivery of fuel and fuel products;
9
•the operation of fuel storage and distribution facilities;
•workplace safety;
•fuel spillage or seepage;
•environmental protection;
•consumer and data protection;
•payment card industry data security standards;
•government contracting and procurement;
•anti-trust and other applicable competition laws;
•anti-money laundering and statutes and regulations governing the transmission of funds;
•regulatory reporting and licensing requirements; and
•hazardous waste disposal.
Due to the complex and technical nature of these laws and regulations, inadvertent violations may occur. If we fail to comply with these laws or regulations for any reason, we would be required to correct or implement measures to prevent a recurrence of any violations, which could increase our operating costs. If more serious violations were to occur, we could be subject to substantial fines or penalties or to civil or criminal liability. In addition, compliance with existing and future laws regulating the delivery of fuel by barge, truck or railcar, fuel storage terminals and underground storage tanks that we own or operate may require significant capital expenditures and increased operating and maintenance costs. For example, rail incidents in the last several years have led and are likely to continue to lead to additional governmental regulation of rail shipments of crude oil and other fuel products in Canada and the United States and to increased safety standards for the railcars that transport these products, including specifications mandating modified railcar designs, configurations, materials, and equipment. These regulations could result in higher operating costs for us, such as if we are required to pay for the modifications to railcars we lease or such railcars become obsolete, which could adversely affect our operating results.
To the extent that we use third parties in our operations, we are also subject to the risk that we would be held accountable for the failure of these third parties to comply with the laws and regulations of the U.S. and various international jurisdictions. Any significant fines and costs incurred as a result of such regulations could have a material adverse effect on our business and results of operations.
We are subject to unique business risks as a result of selling to government customers and reduced sales to our government customers could adversely affect our profitability.
U.S. and foreign government budget constraints and the withdrawal of armed forces from Afghanistan are expected to continue resulting in a decrease in defense spending, which in turn can cause a significant reduction in sales and related profit in our government services business. Furthermore, due to the nature of these types of conflicts, withdrawals from certain areas may be sudden, subjecting us to losses or higher expenses associated with disposing of unused inventory, removal or abandonment of equipment and relocation of employees. Furthermore, as government contracts are requirements based, profitability associated with our government services business may fluctuate significantly from time to time as a result of the commencement, extension or completion of existing and new government contracts. As a result of complex logistics and extended payment terms for our government customers, sales of products and services to such customers generally carry higher margins than sales to other customers. Accordingly, a decrease in government sales could contribute disproportionately to a reduction in our gross margin and profitability and such decrease could be sudden. The loss of a significant government customer or a material reduction in sales to government customers could adversely affect our business, financial condition, results of operations and cash flows.
In addition, contracting with government agencies is inherently complex. Government contracts are subject to specific procurement regulations and a variety of other requirements, which affects how we transact business with our customers and can impose additional costs on our business operations. Government contracts are also generally subject to oversight, including audits and investigations which could identify violations of these agreements or applicable procurement regulations, such as the Federal Acquisition Regulation for contracts with the U.S. federal government. Such violations could result in a range of consequences including, but not limited to, contract price adjustments, civil and criminal penalties, contract termination, forfeiture of profit and/or suspension of payment, and suspension or debarment from future government contracts. The occurrence of any of these actions could harm our reputation and could have a material adverse impact on our business, financial condition, and results of operations.
Changes in the market price of fuel may have a material adverse effect on our business.
Historically, fuel prices have been extremely volatile and will likely continue to be volatile in the future. Fuel prices are impacted by many factors beyond our control, including:
10
•global economic conditions;
•changes in global crude oil and natural gas prices;
•expected and actual supply and demand for fuel;
•the ability or willingness of the Organization of Petroleum Exporting Countries (“OPEC”) to set and maintain production levels for oil;
•oil and gas production levels by non-OPEC countries;
•geopolitical conditions;
•laws and regulations related to environmental matters, including those mandating or incentivizing alternative energy sources or otherwise addressing global climate change;
•changes in pricing or production controls by various organizations and oil producing countries;
•technological advances affecting energy consumption or supply;
•energy conservation efforts;
•price and availability of alternative fuels; and
•weather.
If fuel prices increase, our customers may not be able to purchase as much fuel from us because of their credit limits with us and the resulting adverse impact on their business could cause them to be unable to make payments owed to us for fuel purchased on credit. They may also choose to reduce the amount of fuel they consume in their operations to reduce costs or comply with new environmental regulations to obtain associated incentives. For example, in the shipping industry a number of container ships sail at reduced speeds, known as “slow steaming,” to conserve fuel and reduce carbon emissions. In any such event, there can be no assurance that the volume of orders from our customers will thereafter increase or that we will be able to replace lost volumes with new customers. In addition, if fuel prices increase, our own credit limits could prevent us from purchasing enough fuel from our suppliers to meet our customers’ demands or could require us to prepay for fuel purchases which would impair our liquidity.
Conversely, extended periods of low fuel prices, particularly when coupled with low price volatility, can also have an adverse effect on our results of operations and overall profitability. This can be due to a number of factors, including decreased demand for our services and price risk management products. Low fuel prices also facilitate increased competition by reducing financial barriers to entry and enabling existing, lower-capitalized competitors to conduct more business as a result of lower working capital requirements.
Finally, we maintain fuel inventories for competitive or logistical reasons. Because fuel is a commodity, we have no control over the changing market value of our inventory. Our inventory is valued using the average cost methodology and is stated at the lower of average cost or market. A rapid decline in fuel prices could cause our inventory value to be higher than market, resulting in our inventory being marked down to market or the inventory itself sold at lower prices. While we attempt to mitigate these fluctuations such as these through hedging, there can be no assurance that such hedges will be effective. Accordingly, if the market value of our inventory is less than our average cost and to the extent our hedges are not effective at mitigating fluctuations in prices, we could record a write down of inventory on hand and a non-cash charge, which could adversely impact our earnings.
Economic, political and other risks associated with international sales and operations could adversely affect our business and future operating results.
Because we offer fuel products and services on a worldwide basis, our business is subject to risks associated with doing business internationally. Our business and future operating results could be harmed by a variety of factors, including:
•trade protection measures and import, export and other licensing requirements, which could increase our costs or prevent us from doing certain business internationally;
•the costs of hiring and retaining senior management for overseas operations;
•difficulty in staffing and managing widespread operations, which could reduce our productivity;
•unexpected changes in regulatory requirements, which may be costly and require significant time to implement;
•laws restricting us from repatriating profits earned from our activities within foreign countries, including the payment of distributions;
•governmental actions that may result in the deprivation of our contractual rights or the inability to obtain or retain authorizations required to conduct our business;
•political risks specific to foreign jurisdictions; and
11
•terrorism, war, civil unrest and natural disasters.
In particular, we operate in certain international markets which have been plagued by corruption and have uncertain regulatory environments, either of which could have a negative impact on our operations there. Furthermore, many countries in which we operate have historically been, and may continue to be, susceptible to recessions or currency devaluation.
We also operate in certain high risk locations that have been experiencing military action, terrorist activity or continued unrest which could disrupt the supply of fuel or otherwise disrupt our operations in those areas. An act of terror could result in disruptions of fuel supply and oil markets, and our facilities could be direct or indirect targets. Terrorist activity may also hinder our ability to transport fuel if our means of transportation become damaged as a result of an attack. In these high risk locations, we may also incur substantial operating costs, including maintaining the safety of our personnel. Furthermore, we cannot guarantee the safety of our personnel in these locations and there is a risk of serious injury or loss of life of employees or subcontractors.
Material disruptions in the availability or supply of fuel would adversely affect our business.
The success of a significant portion of our business depends on our ability to purchase, sell and coordinate delivery of fuel and fuel related services to our customers. Our business would be adversely affected to the extent that political instability, natural disasters, terrorist activity, military action or other conditions disrupt the availability or supply of fuel. In addition, we rely on a single or limited number of suppliers for the provision of fuel and related products and services in certain markets. These parties may have significant negotiating leverage over us, and if they are unable or unwilling to supply us on commercially reasonable terms, our business would be adversely affected.
We face intense competition and, if we are not able to effectively compete in our markets, our revenues and profits may decrease.
Competitive pressures in our markets could adversely affect our competitive position, leading to a possible loss of market share or a decrease in prices, either of which could result in decreased revenues and profits. Our competitors are numerous, ranging from large multinational corporations, which have significantly greater capital resources than we do, to relatively small and specialized firms. In addition to competing with fuel resellers, we also compete with the major oil producers that market fuel directly to the large commercial airlines, shipping companies and petroleum distributors. Although many major oil companies have been divesting their downstream assets, some continue to compete with us in certain markets while others may decide to reenter the market in the future. Our business could be adversely affected because of increased competition from these oil companies, who may choose to increase their direct marketing in order to compete with us or provide less advantageous price and credit terms to us than to our fuel reseller competitors.
If we are unable to retain our senior management and key employees, our business and results of operations could be harmed.
Our ability to maintain our competitive position is largely dependent on the services of our senior management and key personnel. Although we have employment or severance agreements with certain of our key employees, these agreements do not prevent those individuals from ceasing their employment with us at any time. If we are unable to retain existing senior management and key personnel, or to attract other qualified senior management and key personnel on terms satisfactory to us, our business could be adversely affected. While we maintain key man life insurance with respect to certain members of senior management, our coverage levels may not be sufficient to offset any losses we may incur and there is no assurance that we will continue to maintain key man life insurance in the future.
Our failure to comply with the requirements of our Credit Facility and Term Loans could adversely affect our operating flexibility.
We have the ability to borrow money pursuant to a Credit Facility and Term Loans that impose certain operating and financial covenants on us, which restrict our ability to (i) pay dividends, (ii) incur additional debt, (iii) create liens, (iv) make restricted payments, (v) sell assets and (vi) engage in mergers or acquisitions. Our failure or inability to comply with the requirements of these facilities, including meeting certain financial ratios or other covenants, could limit the availability under our Credit Facility or result in an event of default. An event of default, if not cured or waived, would permit acceleration of any outstanding indebtedness under these facilities, could trigger cross defaults under other agreements to which we are a party (such as certain derivative contracts), and would impair our ability to obtain working capital advances and letters of credit, any of which could have a material adverse effect on our business, financial condition, results of operations and cash flows.
12
If we fail to successfully manage the implementation of an upgrade to our global enterprise resource planning (“ERP”) platform, our operations and operating results could be adversely affected.
In 2015, we committed to undertake a multi-year project designed to drive greater improvement in operating efficiencies and optimize scalability, particularly when integrating future acquisitions. We will accomplish this in part by a global design and deployment of an upgrade to our existing ERP platform. We are currently in the early planning phase and the costs incurred to date have not been significant. We expect the total cost of the project over the next three years to range between $30.0 million and $40.0 million. If we fail to successfully implement the upgrade to our existing ERP platform, or should we experience material delays in implementation, our ability to grow our business could be adversely affected. Estimating the expenditures related to an upgrade of an ERP platform is highly complex and subject to variables that can significantly increase costs. Should the actual costs exceed our estimates, our liquidity and results of operations could be adversely affected.
Our operations may be adversely affected by legislation and competition from other energy sources and new or advanced technology.
Fuel competes with other sources of energy, some of which are less costly on an equivalent energy basis. There are significant governmental incentives and consumer pressures to increase the use of alternative fuels in the United States and abroad. A number of automotive, industrial and power generation manufacturers are developing more fuel efficient engines, hybrid engines and alternative clean power systems using fuel cells or clean burning gaseous fuels. The more successful these alternatives become as a result of governmental incentives or regulations, technological advances, consumer demand, improved pricing or otherwise, the greater the potential negative impact on pricing and demand for our products and services and accordingly, our profitability.
In addition, federal, state, local and/or foreign governments may enact legislation or regulations that attempt to control or limit GHGs such as carbon dioxide. Such laws or regulations could impose costs tied to carbon emissions, operational requirements or restrictions, or additional charges to fund energy efficiency activities. They could also provide a cost advantage to alternative energy sources, result in other costs or requirements, such as costs associated with the adoption of new infrastructure and technology to respond to new mandates, or impose costs or restrictions on end users of fuel. For example, some of our customers in the transportation industry may be required to purchase allowances or offsets or incur other costs to comply with existing or future requirements relating to GHG. Finally, the focus on climate change could also negatively impact the reputation of fuel products or services such as those we offer. The occurrence of any of the foregoing events could put upward pressure on the cost of fuel relative to other energy sources, increase our costs and the prices we charge our customers, reduce the demand for our products, and therefore adversely affect our business, financial condition, results of operations and cash flows.
Insurance coverage for some of our operations may be insufficient to cover losses, which may have a material adverse effect on our financial condition and results of operations.
We maintain insurance to cover various risks associated with the operation of our business. Certain risks, however, such as environmental risks, are not fully insurable and our insurance coverage does not cover all potential losses, costs, or liabilities. Accordingly, our insurance policies may not adequately cover or may have exclusions of coverage for certain losses. Therefore, there can be no assurance that our insurance coverage will be available or will be adequate to cover claims that may arise.
Furthermore, our ability to obtain and maintain adequate insurance and the cost of such insurance may be affected by significant claims and conditions in the insurance market over which we have no control. If the cost of insurance increases, we may decide to discontinue certain insurance coverage, reduce our level of coverage or increase our deductibles/retentions in order to offset the cost increase. In addition, our existing types and levels of insurance coverage could become difficult or impossible to obtain in the future. The occurrence of an event that is not fully covered by insurance, the loss of insurance coverage or a significant increase in the cost of insurance could have a material adverse effect on our business, financial condition, results of operations and cash flows.
Current and future litigation could have a material adverse effect on our business and results of operations.
We are currently, and may in the future be, involved in legal proceedings that arise in the ordinary course of our business. Lawsuits and other administrative or legal proceedings can involve substantial costs, including the costs associated with investigation, litigation and possible settlement, judgment, penalty or fine. Although we generally maintain insurance to mitigate certain costs, there can be no assurance that costs associated with lawsuits or other legal proceedings will not exceed the limits of insurance policies. Our business, financial condition, results of operations and cash flows could be adversely affected if a judgment, penalty or fine is not fully covered by insurance.
13
Changes in U.S. or foreign tax laws could adversely affect our business and future operating results.
We are affected by various U.S. and foreign taxes, including income taxes and taxes imposed on the purchase and sale of aviation, marine and land fuel products, such as sales, excise, value added tax, energy, environmental and other taxes. From time to time, we may also benefit from special tax concessions in certain jurisdictions. Changes in U.S. and foreign tax laws, our failure to comply with such laws or the loss of tax concessions could adversely affect our business, financial condition, results of operations and cash flows.
Furthermore, significant judgment is required in determining our worldwide provision for income taxes. In the ordinary course of our business, there are many transactions and calculations where the ultimate tax determination is uncertain. We are regularly under audit by tax authorities and, although we believe our tax estimates are reasonable, the final determination of tax audits and any related litigation could be materially different from our historical income tax provisions and accruals. The results of an audit or litigation could have a material effect on our financial statements in the period or periods for which that determination is made.
Finally, we earn a significant amount of our operating income from outside the U.S., and any repatriation of funds currently held in foreign jurisdictions to the U.S. may result in higher effective income tax rates for the Company. Further, recent developments, including proposals to change U.S. income tax laws regarding how U.S. multinational corporations are taxed on foreign earnings, investigations by the European Commission on illegal state aid, the project by the Organisation for Economic Co-operation and Development on Base Erosion and Profit Shifting and other initiatives, could adversely affect our worldwide effective tax rate, if enacted. Although we cannot predict whether or in what form any changes will be made, if enacted they could have a material adverse impact on our income tax expense, financial condition, results of operations and cash flows.
Fluctuations in foreign exchange rates could materially affect our financial condition and results of operations.
The majority of our business transactions are denominated in U.S. dollars. In certain markets, however, payments to some of our fuel suppliers and from some of our customers are denominated in local currency. We also have certain liabilities, primarily for local operations, including income and transactional taxes, which are denominated in foreign currencies. This subjects us to foreign currency exchange risk. Although we generally use hedging strategies to manage and minimize the impact of foreign currency exchange risk when available, these hedges may be costly and at any given time, only a portion of this risk may be hedged. Accordingly, our exposure to this risk may be substantial and fluctuations in foreign exchange rates could adversely affect our profitability.
In addition, many of our customers are based outside of the U.S. and may be required to purchase U.S. dollars to pay for our products and services. A rapid depreciation or devaluation in currency that affects our customers could have an adverse effect on their operations and their ability to convert local currency to U.S. dollars in order to make required payments to us. This could, in turn, increase our credit losses and adversely affect our business, financial condition, results of operations and cash flows.
Our cash equivalents and investments are subject to risks that may cause illiquidity and losses from declines in value.
Our cash equivalents, principally consisting of overnight investments, bank money market accounts and bank time deposits are subject to credit, liquidity, market and interest rate risk, which can be exacerbated by volatility in the capital markets. Adverse changes in this respect can result in the decline of the fair value of our cash equivalents and therefore our liquidity, which could materially affect our business, financial condition, results of operations and cash flows.
Current and proposed derivatives legislation and rulemaking could have a material adverse effect on our business.
The Dodd Frank Wall Street Transparency and Accountability Act of 2010 (the “Act”) provides for federal regulation of the over the counter (“OTC”) derivative markets both for commodities and securities, and gives the U.S. Commodity Futures Trading Commission (“CFTC”) and the SEC broad authority to regulate such markets and their participants. This includes, among others, derivative transactions linked to crude oil, refined products and natural gas prices. The CFTC and the SEC are continuing to consider, finalize and implement rules governing, among other things, where swaps are transacted (on exchange versus off exchange); how they are transacted (cleared versus uncleared; margined versus unmargined); the differing responsibilities of those who participate in OTC derivatives (end users, swap dealers, major swap participants); and the application of cross-border rules in the global derivatives markets. Further, regulations setting limits on the size of a party’s derivative positions in major energy markets were adopted by the CFTC but vacated after a successful challenge in federal court. In November 2013, the CFTC re-proposed new position limits rules, which would limit trading in options, futures, and swaps contracts related to certain agricultural, metal, and energy commodities, including energy commodities in which we currently engage in derivative transactions. Such rules have not been finalized, and we cannot currently predict whether or when the re-proposed rules will be adopted, in what form the rules will be adopted, or the effect of the final rules,
14
if any, on our businesses. Furthermore, certain of the other requirements under the Act have taken effect and other regulations that could have a significant impact on us are expected to be finalized in the near future.
In addition, various foreign jurisdictions have adopted or are in the process of adopting legislation regulating the use of derivatives, including Singapore and Europe, where we currently conduct certain derivatives activities.
As regulations are finalized, adopted and implemented, we continue to evaluate how legislation will impact our ability to conduct our business. In particular, the Act and any new (or newly implemented) regulations and international legislation could significantly increase the cost of our derivative contracts (including through requirements to post collateral, which could adversely affect our cash flows and liquidity, or subject us directly or indirectly to additional reporting requirements), materially alter the terms of our derivative contracts, reduce our ability to offer derivative and other price management products to our customers, reduce the demand for our price risk management services, reduce the availability of derivatives to protect against risks we encounter, increase price volatility in commodities we buy and sell (and derivatives related to those commodities), affect cash flow and liquidity due to margin calls, reduce our ability to monetize or restructure our existing commodity price contracts, and increase our exposure to less creditworthy counterparties. If the increased cost of derivative contracts is significant or we reduce or limit our derivatives activities as a result of any such legislation or rules, our profitability and results of operations could be adversely affected. Any of these consequences could have a material adverse effect on us, our financial condition, and our results of operations and cash flows.
Item 1B. Unresolved Staff Comments
None.
15
The following table sets forth our principal properties, the majority of which are leased, as of February 4, 2016. We consider all of our properties and facilities to be suitable and adequate for our present needs and do not anticipate that we will experience difficulty in renewing or replacing those leases that expire in 2016 in any material respect.
WORLD FUEL SERVICES CORPORATION AND SUBSIDIARIES
PROPERTIES
|
|
|
|
|
Location |
Principal Use |
Lease Expiration |
|
9800 Northwest 41st Street |
Executive, administrative, operations and sales office for corporate, aviation, marine and land segments |
May 2021 |
|
3340 S. Harlem Avenue |
Administrative, operations and sales office for land segment |
June 2018 |
|
62 Buckingham Gate |
Administrative, operations and sales office for aviation, marine and land segments |
June 2023 |
|
238A Thompson Road #17‑03 |
Administrative, operations and sales office for aviation and marine segments |
March 2020 |
|
Office No. 2003, Swiss Tower |
Sales and marketing office for aviation and marine segments |
March 2017 |
|
Av. Rio Branco 181/3602 – |
Administrative, operations and sales office for aviation, marine and land segments |
December 2016 |
|
Paseo de la Reforma 231, Piso 8 Colonia Cuauhtémoc Delegacion Cuauhtémoc C.P. 06500, Mexico D.F |
Administrative, operations and sales office for aviation segment |
October 2019 |
|
Forum 2, Building N, Level 4, Radial |
Administrative, operations and sales office for aviation and marine segments |
March 2018 |
|
555 West Brown Deer Road, Suite 200 |
Administrative, operations and sales office for land segment |
January 2017 |
|
605 North Highway 169, Suite 1100 & 1200 |
Administrative, operations and sales office for land segment |
June 2018 |
|
25 Mill Street |
Administrative, operations and sales office for aviation segment |
March 2020 |
|
Strommen 6 |
Administrative, operations and sales office for aviation and land segments |
Month-to-month |
|
6000 Metcalf Ln |
Administrative, operations and sales office for land segment |
April 2017 |
|
8650 College Blvd |
Administrative, operations and sales office for aviation, marine and land segments |
August 2017 |
|
Causeway End, Brinkworth, |
Administrative, operations and sales office for land segment |
Owned |
|
300 Flint Ridge Road |
Administrative, operations and sales office for aviation segment |
Owned |
|
4643 South Ulster Street, Suite 350 Denver, Colorado 80237, USA |
Administrative, operations and sales office for land segment |
February 2021 |
|
|
|
|
16
Lac‑Mégantic, Quebec
We, on behalf of DPTS Marketing, LLC (“DPM”), a crude oil marketing joint venture in which we previously owned a 50% membership interest, purchased crude oil from various producers in the Bakken region of North Dakota. Dakota Petroleum Transport Solutions, LLC (“DPTS”), a crude oil transloading joint venture in which we also previously owned a 50% membership interest, arranged for the transloading of the crude oil for DPM into tank cars at its facility in New Town, North Dakota. We leased the tank cars used in the transloading from a number of third party lessors and subleased these tank cars to DPM. We, on behalf of DPM, contracted with Canadian Pacific Railway (“CPR”) for the transportation of the tank cars and the crude oil from New Town, North Dakota to a customer in New Brunswick, Canada. CPR subcontracted a portion of that route to Montreal, Maine and Atlantic Railway (“MMA”). On July 6, 2013, the freight train operated by MMA with tank cars carrying approximately 50,000 barrels of crude oil derailed in Lac-Mégantic, Quebec (the “Derailment”). The Derailment resulted in significant loss of life, damage to the environment from spilled crude oil and extensive property damage.
Between 2013 and 2015, we, certain of our subsidiaries, DPM and DPTS, along with a number of third parties, were sued in various actions in both the United States and Canada, by multiple third parties seeking economic, compensatory and punitive damages allegedly caused by the Derailment. In addition, in 2013, the Quebec Minister for Sustainable Development, Environment, Wildlife and Parks (the “Minister”) issued an order requiring us to recover the spilled crude oil caused by the incident and to otherwise fully remediate the impact of the incident on the environment.
On June 8, 2015, we entered into a settlement agreement (the “Settlement Agreement”) with the Trustee (the “Trustee”) for the U.S. bankruptcy estate of Montreal, Maine & Atlantic Railway, Ltd., Montreal, Maine and Atlantic Canada Co. (“MMAC”), and the monitor (the “Monitor”) in MMAC’s Canadian bankruptcy (collectively, the “MMA Parties”) resolving all claims arising out of the Derailment. On December 22, 2015,the effective date of the bankruptcy plans filed by the Trustee in the U.S. and by MMAC in Canada (the “U.S. Bankruptcy Plan” and the “CCAA Plan” respectively, each a “Plan” and collectively the “Plans”), the Settlement Agreement became final and effective .
Pursuant to the Settlement Agreement, we contributed US$110 million (the “Settlement Payment”) to a compensation fund established to compensate parties who suffered losses as a result of the Derailment. As part of the settlement, we also assigned to the Trustee and MMAC certain claims we have against third parties arising out of the Derailment. The Settlement Payment, as well as substantially all of the related costs and expenses have been recovered from insurance.
In consideration of the Settlement Payment and the assignment of claims to the Trustee and MMAC, we, as well as our former joint ventures, DPTS Marketing, LLC and Dakota Petroleum Transport Solutions, LLC and each of their affiliates (collectively, the “WFS Parties”), received, and will continue to receive, the benefit of the global releases and injunctions set forth in the Plans. These global releases and injunctions bar all claims which may exist now or in the future against the WFS Parties arising out of the Derailment, other than criminal claims which by law may not be released. Under the terms of the Plans and the Settlement Agreement, all actions pending against us were required to be dismissed. Multiple actions have already been dismissed and we expect all actions currently pending against us to be dismissed in due course.
Other Matters
We are a party to various claims, complaints and proceedings arising in the ordinary course of our business operations including, but not limited to: (i) commercial and governmental contract claims, such as property damage, demurrage, personal injury, billing and fuel quality claims, (ii) environmental claims, (iii) bankruptcy preference claims and (iv) tax and administrative claims. We are not currently a party to any such claim, complaint or proceeding that we expect to have a material adverse effect on our business or financial condition. However, any adverse resolution of one or more such claims, complaints or proceedings during a particular reporting period could have a material adverse effect on our consolidated financial statements or disclosures for that period.
Item 4. Mine Safety Disclosures
Not applicable.
17
Item 5. Market for Registrant’s Common Equity, Related Shareholder Matters and Issuer Purchases of Equity Securities
Our common stock is traded on the New York Stock Exchange (“NYSE”) under the symbol INT. As of December 31, 2015, the closing price of our stock on the NYSE was $38.46. The following table sets forth, for each quarter in 2015 and 2014, the high and low closing sales prices of our common stock as reported by the NYSE.
|
|
|
|
|
|
|
|
|
|
|
|
|
Price |
|
|
|
|
|
High |
|
Low |
||
|
2015 |
|
|
|
|
|
|
|
First quarter |
|
$ |
58.28 |
|
$ |
45.66 |
|
Second quarter |
|
|
57.72 |
|
|
47.95 |
|
Third quarter |
|
|
49.29 |
|
|
34.44 |
|
Fourth quarter |
|
|
45.63 |
|
|
35.96 |
|
|
|
|
|
|
|
|
|
2014 |
|
|
|
|
|
|
|
First quarter |
|
$ |
45.66 |
|
$ |
41.40 |
|
Second quarter |
|
|
49.23 |
|
|
42.75 |
|
Third quarter |
|
|
49.24 |
|
|
39.92 |
|
Fourth quarter |
|
|
48.21 |
|
|
36.87 |
As of February 4, 2016, there were 369 shareholders of record of our common stock.
Cash Dividends
The following table sets forth the amount, the declaration date, record date and payment date for each quarterly cash dividend declared in 2015 and 2014.
|
|
|
|
|
|
|
|
|
|
|
|
|
|
Per Share Amount |
|
Declaration Date |
|
Record Date |
|
Payment Date |
|
|
2015 |
|
|
|
|
|
|
|
|
|
|
First quarter |
|
$ |
0.0600 |
|
March 3, 2015 |
|
March 20, 2015 |
|
April 10, 2015 |
|
Second quarter |
|
|
0.0600 |
|
June 1, 2015 |
|
June 19, 2015 |
|
July 10, 2015 |
|
Third quarter |
|
|
0.0600 |
|
September 9, 2015 |
|
September 21, 2015 |
|
October 13, 2015 |
|
Fourth quarter |
|
|
0.0600 |
|
November 24, 2015 |
|
December 18, 2015 |
|
January 8, 2016 |
|
|
|
|
|
|
|
|
|
|
|
|
2014 |
|
|
|
|
|
|
|
|
|
|
First quarter |
|
$ |
0.0375 |
|
March 7, 2014 |
|
March 21, 2014 |
|
April 4, 2014 |
|
Second quarter |
|
|
0.0375 |
|
May 29, 2014 |
|
June 20, 2014 |
|
July 11, 2014 |
|
Third quarter |
|
|
0.0375 |
|
September 3, 2014 |
|
September 19, 2014 |
|
October 10, 2014 |
|
Fourth quarter |
|
|
0.0375 |
|
November 21, 2014 |
|
December 19, 2014 |
|
January 9, 2015 |
Our Credit Facility and Term Loans restrict the payment of cash dividends to a maximum of the sum of (i) $50.0 million plus (ii) 50% of the cumulative consolidated net income for each fiscal quarter beginning with the fiscal quarter ended March 31, 2010, plus (iii) 100% of the net proceeds of all equity issuances made after October 2013. For additional information regarding our Credit Facility and Term Loans, see Note 6 to the accompanying consolidated financial statements, included herein, and “Liquidity and Capital Resources” in “Item 7 – Management’s Discussion and Analysis of Financial Condition and Results of Operations.”
18
Stock Performance
This graph compares the total shareholder return on our common stock with the total return on the Russell 2000 Index and the S&P Energy Index for the five‑year period from December 31, 2010 through December 31, 2015. The cumulative return includes reinvestment of dividends.
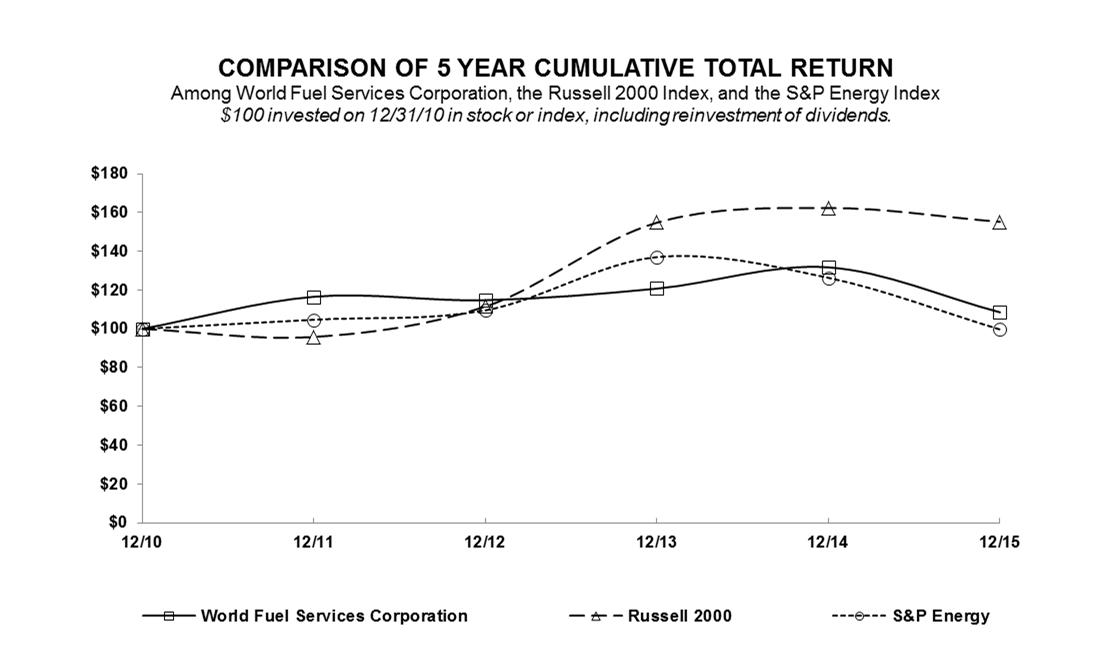
Fiscal year ending December 31.
Copyright© 2016 S&P, a division of The McGraw-Hill Companies Inc. All rights reserved.
Copyright© 2016 Russell Investment Group. All rights reserved.
Equity Compensation Plans
The following table summarizes securities authorized for issuance related to outstanding restricted stock units (“RSUs”) and stock‑settled stock appreciation rights (“SSAR Awards”) under our equity compensation plan (which was approved by our shareholders) and available for future issuance under our equity compensation plan as of December 31, 2015 (in millions, except weighted average price data):
|
|
|
|
|
|
|
|
|
(c) Number of securities |
|
|
|
(a) Maximum number of |
|
|
|
|
|
remaining available |
|
|
|
securities to be issued |
|
|
|
|
for future issuance under |
|
|
|
|
upon exercise of |
|
(b) Weighted average |
|
|
equity compensation plan |
|
|
|
|
outstanding |
|
exercise price of outstanding |
|
|
(excluding securities |
|
|
Plan name or description |
|
RSUs and SSAR Awards |
|
SSAR Awards |
|
|
reflected in column (a)) |
|
|
2006 Omnibus Plan (amended and restated) |
|
1.0 |
|
$ |
10.43 |
(1) |
|
3.2 |
(1) Calculated without taking into account shares of common stock subject to the RSUs reported in column (a) and that will become issuable following vesting of such RSUs without any cash consideration or other payment required.
19
Issuer Purchases of Equity Securities
The following table presents information with respect to repurchases of common stock made by us during the quarterly period ended December 31, 2015 (in thousands, except average price per share):
|
|
|
|
|
|
|
|
|
|
|
|
|
|
|
|
|
|
|
|
Total Number |
|
Approximate Dollar |
|
|
|
|
|
|
|
|
|
of Shares Purchased |
|
Value of Shares that |
|
|
|
|
Total Number |
|
|
|
|
as Part of Publicly |
|
May Yet Be Purchased |
|
|
|
|
of Shares |
|
Average Price |
|
Announced Plans or |
|
Under the Plans or |
||
|
Period |
|
Purchased (1) |
|
Paid Per Share |
|
Programs |
|
Programs (2) |
||
|
10/1/15-10/31/15 |
— |
$ |
— |
— |
$ |
59,524 | ||||
|
11/1/15-11/30/15 |
|
7 |
|
|
45.63 |
|
— |
|
|
59,524 |
|
12/1/15-12/31/15 |
|
— |
|
|
— |
|
— |
|
|
59,524 |
|
Total |
|
7 |
|
$ |
45.63 |
|
— |
|
$ |
59,524 |
|
(1) |
These amounts include shares purchased as part of our publicly announced programs and shares owned and tendered by employees to satisfy the required withholding taxes related to share-based payment awards, which are not deducted from shares available to be purchased under publicly announced programs. |
|
(2) |
In June 2015, our Board of Directors renewed its existing common stock repurchase program by replacing the remainder of the existing program and authorizing the purchase of up to $100.0 million in common stock (the “Repurchase Program”). The Repurchase Program does not require a minimum number of shares of common stock to be purchased, has no expiration date and may be suspended or discontinued at any time. As of December 31, 2015, $59.5 million remains available for purchase under the Repurchase Program. The timing and amount of shares of common stock to be repurchased under the program will depend on market conditions, share price, securities law and other legal requirements and factors. |
For information on repurchases of common stock for the first three quarters of 2015, see the corresponding Quarterly Report on Form 10-Q.
20
Item 6. Selected Financial Data
The following selected consolidated financial data should be read in conjunction with the consolidated financial statements and related notes thereto and Part II, Item 7 of this report appearing under the caption, “Management’s Discussion and Analysis of Financial Condition and Results of Operations” and other financial data and “Risk Factors” included elsewhere in this 2015 10‑K Report. The historical results are not necessarily indicative of the operating results to be expected in the future. All financial information presented has been prepared in U.S. dollars and in accordance with accounting principles generally accepted (“GAAP”) in the United States.
WORLD FUEL SERVICES CORPORATION AND SUBSIDIARIES
SELECTED CONSOLIDATED FINANCIAL DATA
(In millions, except earnings and dividends per share data)
|
|
|
For the Year ended December 31, |
|||||||||||||
|
|
|
2015 (1) |
|
2014 (2) |
|
2013 (3) |
|
2012 (4) |
|
2011 (5) |
|||||
|
Revenue |
|
$ |
30,379.7 |
|
$ |
43,386.4 |
|
$ |
41,561.9 |
|
$ |
38,945.3 |
|
$ |
34,622.9 |
|
Cost of revenue |
|
|
29,519.2 |
|
|
42,572.8 |
|
|
40,809.1 |
|
|
38,271.9 |
|
|
33,987.9 |
|
Gross profit |
|
|
860.5 |
|
|
813.6 |
|
|
752.8 |
|
|
673.4 |
|
|
635.0 |
|
Operating expenses (6) |
|
|
613.3 |
|
|
544.5 |
|
|
488.3 |
|
|
416.4 |
|
|
378.0 |
|
Income from operations |
|
|
247.2 |
|
|
269.1 |
|
|
264.5 |
|
|
257.0 |
|
|
257.0 |
|
Non-operating income (expenses), net (7) |
|
|
(27.9) |
|
|
0.4 |
|
|
(17.7) |
|
|
(17.4) |
|
|
(18.8) |
|
Income before income taxes |
|
|
219.3 |
|
|
269.5 |
|
|
246.7 |
|
|
239.6 |
|
|
238.2 |
|
Provision for income taxes |
|
|
36.3 |
|
|
51.1 |
|
|
39.5 |
|
|
38.2 |
|
|
39.0 |
|
Net income including noncontrolling interest |
|
|
183.0 |
|
|
218.4 |
|
|
207.2 |
|
|
201.4 |
|
|
199.2 |
|
Net (loss) income attributable to noncontrolling interest |
|
|
(3.9) |
|
|
(3.3) |
|
|
4.1 |
|
|
12.0 |
|
|
5.2 |
|
Net income attributable to World Fuel (7) |
|
$ |
186.9 |
|
$ |
221.7 |
|
$ |
203.1 |
|
$ |
189.4 |
|
$ |
194.0 |
|
Basic earnings per common share (7) |
|
$ |
2.66 |
|
$ |
3.13 |
|
$ |
2.85 |
|
$ |
2.66 |
|
$ |
2.74 |
|
Basic weighted average common shares |
|
|
70.2 |
|
|
70.8 |
|
|
71.2 |
|
|
71.2 |
|
|
70.7 |
|
Diluted earnings per common share (7) |
|
$ |
2.64 |
|
$ |
3.11 |
|
$ |
2.83 |
|
$ |
2.64 |
|
$ |
2.71 |
|
Diluted weighted average common shares |
|
|
70.7 |
|
|
71.3 |
|
|
71.8 |
|
|
71.8 |
|
|
71.5 |
|
Cash dividends declared per common share |
|
$ |
0.24 |
|
$ |
0.15 |
|
$ |
0.15 |
|
$ |
0.15 |
|
$ |
0.15 |
|
|
|
As of December 31, |
|||||||||||||
|
|
|
2015 (1) |
|
2014 (2) |
|
2013 (3) |
|
2012 (4) |
|
2011 (5) |
|||||
|
Cash, cash equivalents and short-term investments |
|
$ |
582.5 |
|
$ |
302.3 |
|
$ |
292.0 |
|
$ |
172.7 |
|
$ |
205.4 |
|
Accounts receivable, net |
|
|
1,812.6 |
|
|
2,306.4 |
|
|
2,538.6 |
|
|
2,193.9 |
|
|
2,160.6 |
|
Total current assets |
|
|
3,254.6 |
|
|
3,673.4 |
|
|
3,815.5 |
|
|
3,281.4 |
|
|
3,122.2 |
|
Total assets |
|
|
4,549.4 |
|
|
4,881.0 |
|
|
4,739.3 |
|
|
4,107.8 |
|
|
3,697.2 |
|
Total current liabilities |
|
|
1,762.8 |
|
|
2,239.3 |
|
|
2,514.5 |
|
|
2,149.3 |
|
|
2,026.1 |
|
Total long-term liabilities |
|
|
865.2 |
|
|
776.8 |
|
|
545.9 |
|
|
416.8 |
|
|
324.4 |
|
Total equity (8) |
|
|
1,921.4 |
|
|
1,864.9 |
|
|
1,678.9 |
|
|
1,541.6 |
|
|
1,346.7 |
|
(1) |
In 2015, we acquired all the outstanding stock of Pester Marketing Company (“Pester”) on September 1st and completed four additional acquisitions which were not material, individually or in the aggregate. The financial position and results of operations of these acquisitions have been included in our consolidated financial statements since their respective acquisition dates. |
|
(2) |
In 2014, we acquired i) all of the outstanding stock of Watson Petroleum Limited (now known as WFL (UK) Limited) (“Watson Petroleum”) on March 7th, ii) all of the outstanding stock of Colt International, L.L.C. (“Colt”) on July 29th, and iii) completed three additional acquisitions which were not material, individually or in the aggregate. The financial position and results of operations of these acquisitions have been included in our consolidated financial statements since their respective acquisition dates. |
|
(3) |
In 2013, we completed three acquisitions which were not material individually or in the aggregate. The financial position and results of operations of these acquisitions have been included in our consolidated financial statements since their respective acquisition dates. |
21
|
(4) |
In 2012, we acquired i) certain assets of CarterEnergy Corporation, including the assets comprising its wholesale motor fuel distribution business (the “CarterEnergy business”) on September 1st, ii) certain assets of Multi Service Corporation, including the assets comprising its transaction management business, and all of the outstanding stock of its foreign subsidiaries (the “Multi Service business”) on December 31st and iii) completed three additional acquisitions which were not material individually or in the aggregate. The financial position and results of operations of these acquisitions have been included in our consolidated financial statements since their respective acquisition dates. |
|
(5) |
In 2011, we acquired i) all of the outstanding stock of Nordic Camp Supply ApS and certain affiliates (“NCS”) and ii) all of the outstanding stock of Ascent Aviation Group, Inc. (“Ascent”) on March 1st and April 1st, respectively, and iii) completed six additional acquisitions which were not material individually or in the aggregate. The financial position and results of operations of these acquisitions have been included in our consolidated financial statements since their respective acquisition dates. |
|
(6) |
Included in operating expenses are total non‑cash compensation costs associated with share‑based payment awards of $17.0 million for 2015, $15.8 million for 2014, $16.7 million for 2013, $14.1 million for 2012 and $11.0 million for 2011 and intangible amortization expense of $28.3 million for 2015, $29.1 million for 2014, $22.4 million for 2013, $18.1 million for 2012 and $25.0 million for 2011. |
|
(7) |
Included in non-operating income (expenses), net for 2014 is a gain of $18.1 million related to the sale of our crude oil joint venture interests. The after-tax gain, net of certain related operating expenses was $9.9 million, or $0.14 per basic and diluted share. |
|
(8) |
In 2015, we repurchased 1,584,000 shares of our common stock for an aggregate value of $70.5 million pursuant to the Repurchase Program. In 2014, we repurchased 227,000 shares of our common stock for an aggregate value of $10.0 million pursuant to the Repurchase Program. In 2013, we repurchased 926,000 shares of our common stock for an aggregate value of $35.0 million pursuant to the Repurchase Program. |
Item 7. Management’s Discussion and Analysis of Financial Condition and Results of Operations
The following discussion should be read in conjunction with “Item 6 – Selected Financial Data,” and with the accompanying consolidated financial statements and related notes thereto appearing elsewhere in this 2015 10‑K Report. The following discussion may contain forward‑looking statements, and our actual results may differ significantly from the results suggested by these forward‑looking statements. Some factors that may cause our results to differ materially from the results and events anticipated or implied by such forward‑ looking statements are described in “Item 1A – Risk Factors” and under “Forward-Looking Statements.”
Overview
We are a global fuel logistics, transaction management and payment processing company, principally engaged in the distribution of fuel and related products and services in the aviation, marine and land transportation industries. We compete by providing our customers with value‑added benefits, including single‑supplier convenience, competitive pricing, the availability of trade credit, price risk management, logistical support, fuel quality control and fuel procurement outsourcing. We primarily contract with third parties for the delivery and storage of fuel products, however, we also operate storage facilities and transportation assets.
Reportable Segments
We operate in three reportable segments consisting of aviation, marine and land. In our aviation segment, we offer fuel and related products and services to major commercial airlines, second and third‑tier airlines, cargo carriers, regional and low cost carriers, airports, fixed based operators, corporate fleets, fractional operators, private aircraft, military fleets and to the U.S. and foreign governments as well as intergovernmental organizations. In our marine segment, we offer fuel, lubricants and related products and services to a broad base of marine customers, including international container and tanker fleets, commercial cruise lines, yachts and time‑charter operators, offshore rig owners and operators, the U.S. and foreign governments as well as other fuel suppliers. In our land segment, we offer fuel, crude oil, lubricants and related products and services to petroleum distributors operating in the land transportation market, retail petroleum operators, and industrial, commercial, residential and government customers. Within each of our segments we may enter into derivative contracts to mitigate the risk of market price fluctuations and, also to offer our customers fuel pricing alternatives to meet their needs. In addition, we offer transaction management services which consist of card payment solutions and merchant processing services to customers, primarily in the aviation, marine and land transportation industries.
22
Corporate expenses are allocated to each segment based on usage, where possible, or on other factors according to the nature of the activity. We evaluate and manage our business segments using the performance measurement of income from operations.
The results of operations include the results of (i) Pester commencing on September 1, 2015, (ii) Watson Petroleum commencing on March 7, 2014 and (iii) Colt commencing on July 29, 2014; their respective acquisition dates.
Selected financial information with respect to our business segments is provided in Note 11 to the accompanying consolidated financial statements included in this 2015 10‑K Report.
Results of Operations
In our aviation and land segments, we primarily purchase and resell fuel and other products, and we do not act as brokers. Profit from our aviation and land segments is primarily determined by the volume and the gross profit achieved on fuel resales and a percentage of card payment and processing revenue. In our marine segment, we primarily purchase and resell fuel and also act as brokers for others. Profit from our marine segment is determined primarily by the volume and gross profit achieved on fuel resales and by the volume and commission rate of the brokering business. Profitability in our segments also depends on our operating expenses, which may be significantly affected to the extent that we are required to provide for potential bad debt.
Our revenue and cost of revenue are significantly impacted by world oil and gas prices. Significant movements in fuel prices during any given financial period can have a significant impact on our gross profit, either positively or negatively depending on the direction, volatility and timing of such price movements.
We may experience decreases in future sales volumes and margins as a result of further deterioration in the world economy, declines in the transportation industry, natural disasters and continued conflicts and instability in the Middle East, Asia and Latin America, as well as potential future terrorist activities and possible military retaliation. In addition, because fuel costs represent a significant part of our customers’ operating expenses, volatile and/or high fuel prices can adversely affect our customers’ businesses, and, consequently, the demand for our services and our results of operations. Our hedging activities may not be effective to mitigate volatile fuel prices and may expose us to counterparty risk. See “Item 1A – Risk Factors” of this 2015 10‑K Report.
2015 compared to 2014
Revenue. Our revenue for 2015 was $30.4 billion, a decrease of $13.0 billion, or 30.0%, as compared to 2014. Our revenue during these periods was attributable to the following segments (in millions):
|
|
|
|
|
|
|
|
|
|
|
|
|
|
2015 |
|
2014 |
|
$ Change |
|||
|
Aviation segment |
|
$ |
11,738.2 |
|
$ |
17,268.8 |
|
$ |
(5,530.6) |
|
Marine segment |
|
|
9,367.2 |
|
|
13,843.3 |
|
|
(4,476.1) |
|
Land segment |
|
|
9,274.3 |
|
|
12,274.3 |
|
|
(3,000.0) |
|
Total |
|
$ |
30,379.7 |
|
$ |
43,386.4 |
|
$ |
(13,006.7) |
Our aviation segment revenue for 2015 was $11.7 billion, a decrease of $5.5 billion, or 32.0% as compared to 2014. Of the decrease in aviation segment revenue, $7.4 billion was due to a decrease in the average price per gallon sold as a result of lower average jet fuel prices in 2015 as compared to 2014, which was partially offset by $1.9 billion principally due to increased volume attributable to new and existing customers.
Our marine segment revenue for 2015 was $9.4 billion, a decrease of $4.5 billion, or 32.3% as compared to 2014. Of the decrease in marine segment revenue, $8.2 billion was due to a decrease in the average price per metric ton sold as a result of lower average marine fuel prices in 2015 as compared to 2014, which was partially offset by $3.7 billion due to increased volume attributable to new and existing customers.
Our land segment revenue for 2015 was $9.3 billion, a decrease of $3.0 billion, or 24.4%, as compared to 2014. Of the decrease in land segment revenue, $5.0 billion was due to a decrease in the average price per gallon sold as a result of lower average land fuel prices in 2015 as compared to 2014, which was partially offset by $1.6 billion due to increased volume attributable to new and existing customers and $0.4 billion due to revenue from acquired businesses.
23
Gross Profit. Our gross profit for 2015 was $860.5 million, an increase of $46.9 million, or 5.8%, as compared to 2014. Our gross profit during these periods was attributable to the following segments (in millions):
|
|
|
|
|
|
|
|
|
|
|
|
|
|
2015 |
|
2014 |
|
$ Change |
|||
|
Aviation segment |
|
$ |
361.4 |
|
$ |
321.6 |
|
$ |
39.8 |
|
Marine segment |
|
|
189.6 |
|
|
205.6 |
|
|
(16.0) |
|
Land segment |
|
|
309.5 |
|
|
286.4 |
|
|
23.1 |
|
Total |
|
$ |
860.5 |
|
$ |
813.6 |
|
$ |
46.9 |
Our aviation segment gross profit for 2015 was $361.4 million, an increase of $39.8 million, or 12.4%, as compared to 2014. Of the increase in aviation segment gross profit, $31.0 million was due to increased volume attributable to new and existing customers and $28.7 million was due to gross profit from acquired businesses. These increases were partially offset by $19.9 million in lower gross profit per gallon sold due to fluctuations in customer mix.
Our marine segment gross profit for 2015 was $189.6 million, a decrease of $16.0 million, or 7.8%, as compared to 2014. Of the decrease in marine segment gross profit, $71.2 million was due to lower gross profit per metric ton sold in 2015 as compared to 2014 due to fluctuations in customer mix, which was partially offset by $55.2 million in increased volume attributable to new and existing customers.
Our land segment gross profit for 2015 was $309.5 million, an increase of $23.1 million, or 8.1%, as compared to 2014. Of the increase in land segment gross profit, $37.5 million was due to increased volume attributable to new and existing customers and $28.2 million was due to gross profit from acquired businesses. These increases were partially offset by $42.6 million in lower gross profit per gallon sold due to fluctuations in customer mix.
Operating Expenses. Total operating expenses for 2015 were $613.3 million, an increase of $68.8 million, or 12.6%, as compared to 2014. The following table sets forth our expense categories (in millions):
|
|
|
|
|
|
|
|
|
|
|
|
|
|
2015 |
|
2014 |
|
$ Change |
|||
|
Compensation and employee benefits |
|
$ |
365.8 |
|
$ |
319.8 |
|
$ |
46.0 |
|
Provision for bad debt |
|
|
7.5 |
|
|
3.8 |
|
|
3.7 |
|
General and administrative |
|
|
240.0 |
|
|
220.9 |
|
|
19.1 |
|
Total |
|
$ |
613.3 |
|
$ |
544.5 |
|
$ |
68.8 |
Of the $46.0 million increase in compensation and employee benefits, $24.4 million was due to the inclusion of expenses from acquired businesses and $21.6 million was principally due to compensation for new hires to support our growing global business. Of the $19.1 million increase in general and administrative expenses, $17.2 million was due to the inclusion of expenses from acquired businesses and $1.9 million was due to increased general and administrative expenses to support our growing global business.
Income from Operations. Our income from operations for 2015 was $247.2 million, a decrease of $21.9 million, or 8.1%, as compared to 2014. Income from operations during these periods was attributable to the following segments (in millions):
|
|
|
|
|
|
|
|
|
|
|
|
|
|
2015 |
|
2014 |
|
$ Change |
|||
|
Aviation segment |
|
$ |
131.7 |
|
$ |
142.3 |
|
$ |
(10.6) |
|
Marine segment |
|
|
73.0 |
|
|
90.0 |
|
|
(17.0) |
|
Land segment |
|
|
103.4 |
|
|
90.3 |
|
|
13.1 |
|
|
|
|
308.1 |
|
|
322.6 |
|
|
(14.5) |
|
Corporate overhead – unallocated |
|
|
60.9 |
|
|
53.5 |
|
|
7.4 |
|
Total |
|
$ |
247.2 |
|
$ |
269.1 |
|
$ |
(21.9) |
Our aviation segment income from operations for 2015 was $131.7 million, a decrease of $10.6 million, or 7.4%, as compared to 2014. This decrease resulted from a $50.4 million increase in operating expenses, which was partially offset by $39.8 million in higher gross profit. Of the increase in operating expenses, $28.2 million was related to the inclusion of acquired businesses, $3.8 million was related to the termination of the employment agreement of our former Aviation Segment President and $18.4 million was due to increased operating expenses to support our growing global business.
Our marine segment income from operations for 2015 was $73.0 million, a decrease of $17.0 million, or 18.9%, as compared to 2014. This decrease resulted from $16.0 million in lower gross profit and a $1.0 million increase in operating expenses.
Our land segment income from operations for 2015 was $103.4 million, an increase of $13.1 million, or 14.5%, as compared
24
to 2014. This increase resulted from $23.1 million in higher gross profit, which was partially offset by a $10.0 million increase in operating expenses. The increase in operating expenses was principally due to expenses related to acquired businesses.
Corporate overhead costs not charged to the business segments for 2015 were $60.9 million, an increase of $7.4 million, or 13.8%, as compared to 2014. This increase was principally due to increased expenses to support our growing global business.
Non-Operating (Expenses) Income, net. For 2015, we had non-operating expenses, net of $27.9 million, as compared to non-operating income, net of $0.4 million in 2014. This $28.3 million change was principally due to an $18.1 million gain on the sale of our crude oil joint venture interests in 2014, a $6.7 million reduction of equity earnings in 2015 as compared to 2014 and a $4.7 million increase in interest expense and other financing costs, net, as a result of higher average borrowings in 2015 as compared to 2014. The decrease in earnings from our equity investments is principally related to the sale of our crude oil transloading joint venture in December 2014.
Income Taxes. For 2015, our effective income tax rate was 16.6% and our income tax provision was $36.3 million, as compared to an effective income tax rate of 19.0% and an income tax provision of $51.1 million for 2014. The lower effective income tax rate for 2015, as compared to 2014, resulted principally from differences in the results of our subsidiaries in tax jurisdictions with different income tax rates and a 2014 U.S. gain on the sale of the crude oil joint venture interest. Without the gain on the sale of the crude oil joint venture interest, the 2014 effective income tax rate would have been 17.7%.
Net Loss Attributable to Noncontrolling Interest. For 2015, net loss attributable to noncontrolling interest was $3.9 million as compared to net loss attributable to noncontrolling interest of $3.3 million for 2014.
Net Income and Diluted Earnings per Common Share. Our net income for 2015 was $186.9 million, a decrease of $34.9 million, or 15.7%, as compared to 2014. Diluted earnings per common share for 2015 was $2.64 per common share, a decrease of $0.47 per common share, or 15.1% as compared to 2014.
Non‑GAAP Net Income and Non‑GAAP Diluted Earnings per Common Share. Our non‑GAAP net income for 2015 was $225.1 million, a decrease of $23.9 million, or 9.6%, as compared to 2014. Non‑GAAP diluted earnings per common share for 2015 was $3.18 per common share, a decrease of $0.31 per common share, or 8.9%, as compared to 2014. The following table sets forth the reconciliation between our net income and non‑GAAP net income for 2015 and 2014 (in millions):
|
|
|
2015 |
|
2014 | ||
|
Net income attributable to World Fuel |
|
$ |
186.9 |
|
$ |
221.7 |
|
Share-based compensation expense, net of income taxes of $4.9 and $4.6 for 2015 and 2014, respectively |
|
|
11.4 |
|
|
9.9 |
|
Intangible asset amortization expense, net of income taxes of $6.0 and $6.6 for 2015 and 2014, respectively |
|
|
20.4 |
|
|
22.4 |
|
Expenses related to acquisitions, net of income taxes of $1.1 and $0.2 for 2015 and 2014, respectively |
|
|
3.0 |
|
|
1.9 |
|
Deferred revenue purchase accounting adjustment, net of income taxes of $ 0.4 |
|
|
1.1 |
|
|
— |
|
Termination of employment agreement, net of income taxes of $1.5 |
|
|
2.3 |
|
|
— |
|
Executive non-renewal charge, net of income taxes of $1.7 |
|
|
— |
|
|
3.0 |
|
Gain on the sale of the crude oil joint venture interests (net of certain related operating expenses), net of income taxes of $6.2 |
|
|
— |
|
|
(9.9) |
|
Non-GAAP net income attributable to World Fuel |
|
$ |
225.1 |
|
$ |
249.0 |
25
The following table sets forth the reconciliation between our diluted earnings per common share and our non‑GAAP diluted earnings per common share for 2015 and 2014:
|
|
|
2015 |
|
2014 | ||
|
Diluted earnings per common share |
|
$ |
2.64 |
|
$ |
3.11 |
|
Share-based compensation expense, net of income taxes |
|
|
0.16 |
|
|
0.14 |
|
Intangible asset amortization expense, net of income taxes |
|
|
0.29 |
|
|
0.31 |
|
Expenses related to acquisitions, net of income taxes |
|
|
0.04 |
|
|
0.03 |
|
Deferred revenue purchase accounting adjustment, net of income taxes |
|
|
0.02 |
|
|
— |
|
Termination of employment agreement, net of income taxes |
|
|
0.03 |
|
|
— |
|
Executive non-renewal charge, net of income taxes |
|
|
— |
|
|
0.04 |
|
Gain on the sale of the crude oil joint venture interests (net of certain related operating expenses), net of income taxes |
|
|
— |
|
|
(0.14) |
|
Non-GAAP diluted earnings per common share |
|
$ |
3.18 |
|
$ |
3.49 |
The non-GAAP financial measures exclude costs associated with share-based compensation, amortization of acquired intangible assets, expenses related to acquisitions, deferred revenue purchase accounting adjustments, the termination of employment agreement, the executive non-renewal charge and the gain on the sale of the crude oil joint venture interests (net of certain related operating expenses) primarily because we do not believe they are reflective of the Company’s core operating results. We believe the exclusion of share-based compensation from operating expenses is useful given the variation in expense that can result from changes in the fair value of our common stock, the effect of which is unrelated to the operational conditions that give rise to variations in the components of our operating costs. Also, we believe the exclusion of the amortization of acquired intangible assets, the expenses related to acquisitions, the termination of employment agreement, the executive non-renewal charge and the gain on the sale of the crude oil joint venture interests (net of certain related operating) expenses are useful for purposes of evaluating operating performance of our core operating results and comparing them period over period. In accordance with the fair value provisions applicable to the accounting for business combinations, acquired deferred revenue is often recorded on the opening balance sheet at an amount that is lower than the historical carrying value. Although this acquisition accounting requirement has no impact on our business or cash flows, it adversely impacts our reported GAAP revenue in the reporting periods following an acquisition. We believe that the exclusion of the deferred revenue purchase accounting adjustment is useful to investors as an additional means to reflect trends of our business and provides investors with financial information that facilitates comparison of both historical and future results. We believe that these non-GAAP financial measures, when considered in conjunction with our financial information prepared in accordance with GAAP, are useful to investors to further aid in evaluating the ongoing financial performance of the Company and to provide greater transparency as supplemental information to our GAAP results. Non-GAAP financial measures should not be considered in isolation from, or as a substitute for, financial information prepared in accordance with GAAP. In addition, our presentation of non-GAAP net income and non-GAAP diluted earnings per common share may not be comparable to the presentation of such metrics by other companies. Non-GAAP diluted earnings per common share is computed by dividing non-GAAP net income attributable to World Fuel and available to common shareholders by the sum of the weighted average number of shares of common stock, stock units, restricted stock entitled to dividends not subject to forfeiture and vested RSUs outstanding during the period and the number of additional shares of common stock that would have been outstanding if our outstanding potentially dilutive securities had been issued. Investors are encouraged to review the reconciliation of these non-GAAP measures to their most directly comparable GAAP financial measures.
2014 compared to 2013
Revenue. Our revenue for 2014 was $43.4 billion, an increase of $1.8 billion, or 4.4%, as compared to 2013. Our revenue during these periods was attributable to the following segments (in millions):
|
|
|
|
|
|
|
|
|
|
|
|
|
|
2014 |
|
2013 |
|
$ Change |
|||
|
Aviation segment |
|
$ |
17,268.8 |
|
$ |
16,087.6 |
|
$ |
1,181.2 |
|
Marine segment |
|
|
13,843.3 |
|
|
14,790.3 |
|
|
(947.0) |
|
Land segment |
|
|
12,274.3 |
|
|
10,684.0 |
|
|
1,590.3 |
|
Total |
|
$ |
43,386.4 |
|
$ |
41,561.9 |
|
$ |
1,824.5 |
Our aviation segment revenue for 2014 was $17.3 billion, an increase of $1.2 billion, or 7.3% as compared to 2013. Of the increase in aviation segment revenue, $2.5 billion was due to increased volume attributable to new and existing customers, which was partially offset by $1.3 billion due to a decrease in the average price per gallon sold as a result of lower average jet fuel prices in 2014 as compared to 2013.
26
Our marine segment revenue for 2014 was $13.8 billion, a decrease of $0.9 billion, or 6.4% as compared to 2013. Of the decrease in marine segment revenue, $0.5 billion was due to decreased volume and $0.4 billion was due to a decrease in the average price per metric ton sold in 2014 as compared to 2013.
Our land segment revenue for 2014 was $12.3 billion, an increase of $1.6 billion, or 14.9%, as compared to 2013. Of the increase in land segment revenue, $2.1 billion was due to revenue from acquired businesses and $0.6 billion was due to increased volume attributable to new and existing customers, which was partially offset by $1.1 billion due to a decrease in the average price per gallon sold as a result of lower average land fuel prices in 2014 as compared to 2013.
Gross Profit. Our gross profit for 2014 was $813.6 million, an increase of $60.8 million, or 8.1%, as compared to 2013. Our gross profit during these periods was attributable to the following segments (in millions):
|
|
|
|
|
|
|
|
|
|
|
|
|
|
2014 |
|
2013 |
|
$ Change |
|||
|
Aviation segment |
|
$ |
321.6 |
|
$ |
327.2 |
|
$ |
(5.6) |
|
Marine segment |
|
|
205.6 |
|
|
177.1 |
|
|
28.5 |
|
Land segment |
|
|
286.4 |
|
|
248.5 |
|
|
37.9 |
|
Total |
|
$ |
813.6 |
|
$ |
752.8 |
|
$ |
60.8 |
Our aviation segment gross profit for 2014 was $321.6 million, a decrease of $5.6 million, or 1.7%, as compared to 2013. Of the decrease in aviation segment gross profit, $67.4 million was due to lower gross profit per gallon sold principally due to changes in customer mix. This decrease was partially offset by an increase of $49.4 million due to increased volume attributable to new and existing customers and $12.4 million due to gross profit from acquired businesses.
Our marine segment gross profit for 2014 was $205.6 million, an increase of $28.5 million, or 16.1%, as compared to 2013. Of the increase in marine segment gross profit, $35.0 million was due to increased gross profit per metric ton sold principally due to certain higher margin business activity, which was partially offset by $6.5 million due to decreased volume.
Our land segment gross profit for 2014 was $286.4 million, an increase of $37.9 million, or 15.3%, as compared to 2013. Of the increase in land segment gross profit, $51.2 million was due to gross profit from acquired businesses and $13.6 million was due to increased volume attributable to new and existing customers. This increase was partially offset by $17.0 million in lower gross profit per gallon sold principally due to fluctuations in customer mix. Additionally, our crude oil transloading joint venture, which was deconsolidated effective December 31, 2013, generated $9.9 million in gross profit in 2013 and is not included in our land segment gross profit in 2014.
27
Operating Expenses. Total operating expenses for 2014 were $544.5 million, an increase of $56.2 million, or 11.5%, as compared to 2013. The following table sets forth our expense categories (in millions):
|
|
|
|
|
|
|
|
|
|
|
|
|
|
2014 |
|
2013 |
|
$ Change |
|||
|
Compensation and employee benefits |
|
$ |
319.8 |
|
$ |
288.0 |
|
$ |
31.8 |
|
Provision for bad debt |
|
|
3.8 |
|
|
11.7 |
|
|
(7.9) |
|
General and administrative |
|
|
220.9 |
|
|
188.6 |
|
|
32.3 |
|
Total |
|
$ |
544.5 |
|
$ |
488.3 |
|
$ |
56.2 |
The $31.8 million increase in compensation and employee benefits was principally due to the inclusion of $27.3 million of expenses from acquired businesses and an executive non-renewal charge of $4.8 million related to the non-renewal of the employment agreement of our former Executive Chairman of the Board of Directors. The $7.9 million decrease in provision for bad debt was primarily due to an overall decrease in accounts receivable balances throughout the second half of the year as a result of declining world oil prices. The $32.3 million increase in general and administrative expenses was due to the inclusion of $24.6 million in expenses from acquired businesses and acquisition related expenses and $7.7 million principally due to increased professional fees and general insurance expenses.
Income from Operations. Our income from operations for 2014 was $269.1 million, an increase of $4.6 million, or 1.7%, as compared to 2013. Income from operations during these periods was attributable to the following segments (in millions):
|
|
|
|
|
|
|
|
|
|
|
|
|
|
2014 |
|
2013 |
|
$ Change |
|||
|
Aviation segment |
|
$ |
142.3 |
|
$ |
150.9 |
|
$ |
(8.6) |
|
Marine segment |
|
|
90.0 |
|
|
73.8 |
|
|
16.2 |
|
Land segment |
|
|
90.3 |
|
|
84.8 |
|
|
5.5 |
|
|
|
|
322.6 |
|
|
309.5 |
|
|
13.1 |
|
Corporate overhead – unallocated |
|
|
53.5 |
|
|
45.0 |
|
|
8.5 |
|
Total |
|
$ |
269.1 |
|
$ |
264.5 |
|
$ |
4.6 |
Our aviation segment income from operations for 2014 was $142.3 million, a decrease of $8.6 million, or 5.7%, as compared to 2013. This decrease resulted from $5.6 million in lower gross profit and a $3.0 million increase in operating expenses. Of the increase in aviation segment operating expenses, $9.6 million was due to the inclusion of acquired businesses, which was partially offset by a decrease of $6.6 million principally due to compensation and employee benefits.
Our marine segment income from operations for 2014 was $90.0 million, an increase of $16.2 million, or 21.9%, as compared to 2013. This increase resulted from $28.6 million in higher gross profit, which was partially offset by an increase of $12.3 million in operating expenses. The increase in marine segment operating expenses was principally due to compensation and employee benefits.
Our land segment income from operations for 2014 was $90.3 million, an increase of $5.5 million, or 6.5%, as compared to 2013. This increase resulted from $37.9 million in higher gross profit which was partially offset by an increase of $32.4 million in operating expenses. Of the increase in land segment operating expenses, $40.0 million was due to the inclusion of acquired businesses, which was partially offset by a decrease of $7.6 million principally due to compensation and employee benefits and provision for bad debt.
Corporate overhead costs not charged to the business segments for 2014 were $53.5 million, an increase of $8.5 million, or 18.8%, as compared to 2013. This increase was primarily attributable to the $4.8 million executive non-renewal charge and $3.8 million in increased professional fees.
Non‑Operating Income (Expenses), net. For 2014, we had non-operating income, net of $0.4 million, as compared to non-operating expenses, net of $17.7 million in 2013. This $18.1 million change was due to an $18.1 million gain on the sale of our crude oil joint venture interests in December 2014. Also impacting the change was a $8.0 million increase in interest expense and other financing costs, net, as a result of higher average borrowings in 2014 as compared to 2013, offset by a $5.4 million increase in earnings from our equity investments and a $2.6 million decrease in other non-operating expenses. The increase in earnings from our equity investments is principally related to the 2013 deconsolidation of our crude oil transloading joint venture effective December 31, 2013, which thereafter was accounted for under the equity method until its sale in December 2014.
28
Income Taxes. For 2014, our effective income tax rate was 19.0% and our income tax provision was $51.1 million, as compared to an effective income tax rate of 16.0% and an income tax provision of $39.5 million for 2013. The higher effective income tax rate for 2014 resulted primarily from differences in the results of our subsidiaries in tax jurisdictions with different income tax rates and a U.S. gain on the sale of the crude oil joint venture interests as compared to 2013. Without the gain on the sale of the crude oil joint venture interests, for 2014, our effective income tax rate would have been 17.7%.
Net (Loss) Income Attributable to Noncontrolling Interest. For 2014, net loss attributable to noncontrolling interest was $3.3 million as compared to net income attributable to noncontrolling interest of $4.1 million for 2013. This $7.4 million change is primarily related to the deconsolidation of our crude oil transloading joint venture effective December 31, 2013. Prior to the deconsolidation of this joint venture, its results were included in our results of operations and we recorded net income attributable to noncontrolling interest.
Net Income and Diluted Earnings per Common Share. Our net income for 2014 was $221.7 million, an increase of $18.7 million, or 9.2%, as compared to 2013. Diluted earnings per common share for 2014 was $3.11 per common share, an increase of $0.28 per common share, or 9.9% as compared to 2013.
Non‑GAAP Net Income and Non‑GAAP Diluted Earnings per Common Share. Our non‑GAAP net income for 2014 was $249.1 million, an increase of $18.6 million, or 8.1%, as compared to 2013. Non‑GAAP diluted earnings per common share for 2014 was $3.49 per common share, an increase of $0.27 per common share, or 8.4%, as compared to 2013. The following table sets forth the reconciliation between our net income and non‑GAAP net income for 2014 and 2013 (in millions):
|
|
|
2014 |
|
2013 | ||
|
Net income attributable to World Fuel |
|
$ |
221.7 |
|
$ |
203.1 |
|
Share-based compensation expense, net of income taxes of $4.6 and $5.5 for 2014 and 2013 respectively |
|
|
9.9 |
|
|
11.2 |
|
Intangible asset amortization expense, net of income taxes of $6.6 and $8.1 for 2014 and 2013 respectively |
|
|
22.4 |
|
|
14.4 |
|
Expenses related to acquisitions, net of income taxes of $.02 for 2014 |
|
|
1.9 |
|
|
1.8 |
|
Executive non-renewal charge, net of income taxes of $1.8 |
|
|
3.0 |
|
|
— |
|
Gain on the sale of crude oil joint venture interests (net of certain related operating expenses), net of income taxes of $6.2 |
|
|
(9.8) |
|
|
— |
|
Non-GAAP net income attributable to World Fuel |
|
$ |
249.1 |
|
$ |
230.5 |
The following table sets forth the reconciliation between our diluted earnings per common share and our non‑GAAP diluted earnings per common share for 2014 and 2013:
|
|
|
2014 |
|
2013 | ||
|
Diluted earnings per common share |
|
$ |
3.11 |
|
$ |
2.83 |
|
Share-based compensation expense, net of income taxes |
|
|
0.14 |
|
|
0.16 |
|
Intangible asset amortization expense, net of income taxes |
|
|
0.31 |
|
|
0.20 |
|
Expenses related to acquisitions, net of income taxes |
|
|
0.03 |
|
|
0.03 |
|
Executive non-renewal charge, net of income taxes |
|
|
0.04 |
|
|
— |
|
Gain on the sale of crude oil joint venture interests (net of certain related operating expenses), net of income taxes |
|
|
(0.14) |
|
|
— |
|
Non-GAAP diluted earnings per common share |
|
$ |
3.49 |
|
$ |
3.22 |
The non‑GAAP financial measures exclude costs associated with share based compensation, amortization of acquired intangible assets, expenses related to acquisitions, the executive non-renewal charge and the gain on the sale of the crude oil venture interests (net of certain related operating expenses) primarily because we do not believe they are reflective of the Company’s core operating results. We believe the exclusion of share‑based compensation from operating expenses is useful given the variation in expense that can result from changes in the fair value of our common stock, the effect of which is unrelated to the operational conditions that give rise to variations in the components of our operating costs. Also, we believe the exclusion of the amortization of acquired intangible assets, the expenses related to acquisitions, the executive non-renewal charge and the gain on the sale of the crude oil venture interests (net of certain related operating expenses) are useful for purposes of evaluating operating performance of our core operating results and comparing them period‑over‑ period. We believe that these non‑GAAP financial measures, when considered in conjunction with our financial information prepared in accordance with GAAP, are useful to investors to further aid in evaluating the ongoing financial performance of the Company and to provide greater transparency as supplemental information to our GAAP results. Non‑GAAP financial measures should not be considered in isolation from, or as a substitute for, financial information
29
prepared in accordance with GAAP. In addition, our presentation of non‑GAAP net income and non‑GAAP diluted earnings per common share may not be comparable to the presentation of such metrics by other companies. Non‑GAAP diluted earnings per common share is computed by dividing non‑GAAP net income attributable to World Fuel and available to common shareholders by the sum of the weighted average number of shares of common stock, stock units, restricted stock entitled to dividends not subject to forfeiture and vested RSUs outstanding during the period and the number of additional shares of common stock that would have been outstanding if our outstanding potentially dilutive securities had been issued. Investors are encouraged to review the reconciliation of these non‑GAAP measures to their most directly comparable GAAP financial measures.
Liquidity and Capital Resources
Cash Flows
The following table reflects the major categories of cash flows for 2015, 2014 and 2013. For additional details, please see the consolidated statements of cash flows in the consolidated financial statements.
|
|
|
|
|
|
|
|
|
|
|
|
|
|
2015 |
|
2014 |
|
2013 | |||
|
Net cash provided by operating activities |
|
$ |
447.5 |
|
$ |
141.2 |
|
$ |
264.3 |
|
Net cash used in investing activities |
|
|
(144.7) |
|
|
(297.1) |
|
|
(174.5) |
|
Net cash (used in) provided by financing activities |
|
|
(17.1) |
|
|
169.5 |
|
|
29.5 |
2015 compared to 2014
Operating Activities. For 2015, net cash provided by operating activities was $447.5 million as compared to $141.2 million for 2014. The $306.3 million increase in operating cash flows was primarily due to year-over-year changes in assets and liabilities, net of acquisitions.
Investing Activities. For 2015, net cash used in investing activities was $144.7 million as compared to $297.1 million for 2014. The $152.4 million decrease in cash used in investing activities was principally due to a decrease in the cash used for the acquisition of businesses in 2015 as compared to 2014.
Financing Activities. For 2015, net cash used in financing activities was $17.1 million as compared to $169.5 million provided by financing activities for 2014. The $186.6 million decrease in cash provided by financing activities was principally due to a $126.6 decrease in net borrowing in 2015 as compared to 2014 and $60.5 million increase of common stock repurchases in 2015 as compared to 2014.
2014 compared to 2013
Operating Activities. For 2014, net cash provided by operating activities was $141.2 million as compared to $264.3 million for 2013. The $123.1 million decrease in operating cash flows was principally due to unfavorable year‑over‑year changes in assets and liabilities, net of acquisitions.
Investing Activities. For 2014, net cash used in investing activities was $297.1 million as compared to $174.5 million for 2013. The $122.6 million increase in cash used in investing activities was principally due to an increase in the cash used for the acquisition of businesses in 2014
Financing Activities. For 2014, net cash provided by financing activities was $169.5 million as compared to $29.5 million for 2013. The $140.0 million increase in cash provided by financing activities was principally due to increased net borrowing under our Credit Facility in 2014 compared to 2013.
Other Liquidity Measures
Cash and Cash Equivalents. As of December 31, 2015 and 2014, we had cash and cash equivalents of $582.5 million and $302.3 million, respectively. Our primary uses of cash and cash equivalents are to fund accounts receivable, purchase inventory and make strategic investments, primarily acquisitions. We are usually extended unsecured trade credit from our suppliers for our fuel purchases; however, certain suppliers require us to either prepay or provide a letter of credit. Increases in oil prices can negatively affect liquidity by increasing the amount of cash needed to fund fuel purchases as well as reducing the amount of fuel which we can purchase on an unsecured basis from our suppliers.
In 2015, we committed to undertake a multi-year project designed to drive greater improvement in operating efficiencies and optimize scalability designed to incorporate acquisitions that we may undertake in the future. We will accomplish this
30
in part by a global design and deployment of an upgrade to our existing ERP platform. We are currently in the early planning phase and the cost incurred to date is not considered significant. We expect the total cost of the project over the next three years to range between $30.0 million and $40.0 million.
Credit Facility and Term Loans. We have a Credit Facility which permits borrowing up to $1.26 billion with a sublimit of $400.0 million for the issuance of letters of credit and bankers’ acceptances. Under the Credit Facility, we have the right to request increases in available borrowings up to an additional $150.0 million, subject to the satisfaction of certain conditions. The Credit Facility matures in October 2018. We had outstanding borrowings under our Credit Facility totaling $416.0 million and $420.0 million as of December 31, 2015 and 2014, respectively. Our issued letters of credit under the Credit Facility totaled $5.5 million and $14.8 million as of December 31, 2015 and 2014, respectively. We also had $333.2 million and $241.3 million in Term Loans outstanding as of December 31, 2015 and 2014, respectively. As of December 31, 2015 and 2014, the unused portion of our Credit Facility was $838.5 million and $665.2 million, respectively.
Our liquidity, consisting of cash and cash equivalents and availability under the Credit Facility fluctuates based on a number of factors, including the timing of receipts from our customers and payments to our suppliers as well as commodity prices. Our Credit Facility and our Term Loans contain certain financial and other covenants with which we are required to comply. Our failure to comply with the covenants contained in our Credit Facility and our Term Loans could result in an event of default. An event of default, if not cured or waived, would permit acceleration of any outstanding indebtedness under the Credit Facility and our Term Loans, trigger cross‑defaults under certain other agreements to which we are a party and impair our ability to obtain working capital advances and issue letters of credit, which would have a material adverse effect on our business, financial condition, results of operations and cash flows. As of December 31, 2015, we were in compliance with all financial and other covenants contained in our Credit Facility and our Term Loans.
Other Credit Lines and Receivables Purchase Agreements. Additionally, we have other uncommitted credit lines primarily for the issuance of letters of credit, bank guarantees and bankers’ acceptances. These credit lines are renewable on an annual basis and are subject to fees at market rates. As of December 31, 2015 and 2014, our outstanding letters of credit and bank guarantees under these credit lines totaled $208.4 million and $211.4 million, respectively. We also have Receivables Purchase Agreements (“RPAs”) that allow for the sale of up to an aggregate of $499.0 million of our accounts receivable. As of December 31, 2015, we had sold accounts receivable of $118.4 million under the RPAs.
Short‑Term Debt. As of December 31, 2015, our short‑term debt of $25.5 million primarily represents the current maturities (within the next twelve months) of Term Loan borrowing, certain promissory notes related to acquisitions and capital lease obligations.
We believe that our cash and cash equivalents as of December 31, 2015 (of which $137.3 million was available for use by our U.S. subsidiaries without incurring additional costs) and available funds from our Credit Facility, together with cash flows generated by operations, remain sufficient to fund our working capital and capital expenditure requirements for at least the next twelve months. In addition, to further enhance our liquidity profile, we may choose to raise additional funds which may or may not be needed for additional working capital, capital expenditures or other strategic investments. Our opinions concerning liquidity are based on currently available information. To the extent this information proves to be inaccurate, or if circumstances change, future availability of trade credit or other sources of financing may be reduced and our liquidity would be adversely affected. Factors that may affect the availability of trade credit or other forms of financing include our financial performance (as measured by various factors, including cash provided by operating activities), the state of worldwide credit markets, and our levels of outstanding debt. Depending on the severity and direct impact of these factors on us, financing may be limited or unavailable on terms favorable to us.
Contractual Obligations and Off‑Balance Sheet Arrangements
Our significant contractual obligations and off‑balance sheet arrangements are set forth below. For additional information on any of the following and other contractual obligations and off‑balance sheet arrangements, see Notes 6 and 7 in the notes to the consolidated financial statements in Item 15 of this 2015 10‑K Report.
31
Contractual Obligations
As of December 31, 2015, our contractual obligations were as follows (in millions):
|
|
|
Total |
|
< 1 year |
|
1-3 years |
|
3-5 years |
|
> 5 years |
|||||
|
Debt and interest obligations |
|
$ |
831.3 |
|
$ |
46.8 |
|
$ |
779.5 |
|
$ |
3.6 |
|
$ |
1.4 |
|
Operating lease obligations |
|
|
176.2 |
|
|
42.1 |
|
|
54.7 |
|
|
33.9 |
|
|
45.5 |
|
Employment agreement obligations |
|
|
7.2 |
|
|
6.0 |
|
|
1.2 |
|
|
— |
|
|
— |
|
Derivatives obligations |
|
|
75.0 |
|
|
69.6 |
|
|
5.4 |
|
|
— |
|
|
— |
|
Purchase commitment obligations |
|
|
65.8 |
|
|
57.7 |
|
|
8.1 |
|
|
— |
|
|
— |
|
Other obligations |
|
|
7.6 |
|
|
5.3 |
|
|
2.3 |
|
|
— |
|
|
— |
|
Total |
|
$ |
1,163.1 |
|
|
227.5 |
|
|
851.2 |
|
|
37.5 |
|
|
46.9 |
Debt and Interest Obligations. These obligations include principal and interest payments on fixed‑rate and variable‑rate, fixed‑term debt based on the expected payment dates.
Other Obligations. These obligations primarily consist of deferred compensation arrangements.
Unrecognized Income Tax Liabilities. As of December 31, 2015, our gross liabilities for unrecognized income tax benefits (“Unrecognized Tax Liabilities”), including penalties and interest, were $56.1 million. The timing of any settlement of our Unrecognized Tax Liabilities with the respective taxing authority cannot be reasonably estimated.
Off‑Balance Sheet Arrangements
Letters of Credit and Bank Guarantees. In the normal course of business, we are required to provide letters of credit to certain suppliers. A majority of these letters of credit expire within one year from their issuance, and expired letters of credit are renewed as needed. As of December 31, 2015, we had issued letters of credit and bank guarantees totaling $213.9 million under our Credit Facility and other uncommitted credit lines. For additional information on our Credit Facility and other credit lines, see the discussion in “Liquidity and Capital Resources” above.
Surety Bonds. In the normal course of business, we are required to post bid, performance and garnishment bonds, primarily in our aviation and land segments. As of December 31, 2015, we had $39.1 million in outstanding bonds that were arranged in order to satisfy various security requirements.
Critical Accounting Policies and Estimates
The discussion and analysis of our financial condition and results of operations are based upon our consolidated financial statements included elsewhere in this 2015 10‑K Report, which have been prepared in accordance with accounting principles generally accepted in the United States. The preparation of these financial statements requires management to make estimates and judgments that affect the reported amounts of assets, liabilities, revenues and expenses and related disclosure of contingent assets and liabilities. On an ongoing basis, we evaluate our estimates, including those related to unbilled revenue and related costs of sales, bad debt, share‑based payment awards, derivatives, goodwill and identifiable intangible assets and certain accrued liabilities. We base our estimates on historical experience and on other assumptions that are believed to be reasonable under the circumstances, the results of which form the basis for making judgments about the carrying values of assets and liabilities that are not readily apparent from other sources. Actual results may differ from these estimates under different assumptions or conditions.
We have identified the policies below as critical to our business operations and the understanding of our results of operations. For a detailed discussion on the application of these and other significant accounting policies, see Note 1 to the accompanying consolidated financial statements included in this 2015 10‑K Report.
Accounts Receivable and Allowance for Bad Debt
Credit extension, monitoring and collection are performed for each of our business segments. Each segment has a credit committee that is responsible for approving credit limits above certain amounts, setting and maintaining credit standards, and managing the overall quality of the credit portfolio. We perform ongoing credit evaluations of our customers and adjust credit limits based upon payment history and the customer’s current creditworthiness, as determined by our review of our customer’s credit information. We extend credit on an unsecured basis to most of our customers. Accounts receivable are deemed past due based on contractual terms agreed to with our customers.
We continuously monitor collections and payments from our customers and maintain a provision for estimated credit losses based upon our historical experience with our customers, current market and industry conditions affecting our customers and any specific customer collection issues that we have identified. Historical payment trends may not be a useful indicator
32
of current or future credit worthiness of our customers, particularly in these difficult economic and financial markets. Accounts receivable are reduced by an allowance for bad debt.
If credit losses exceed established allowances, our business, financial condition, results of operations and cash flows may be adversely affected. For additional information on the credit risks inherent in our business, see “Item 1A – Risk Factors” in this 2015 10‑K Report.
Inventories
Inventories are valued using the average cost methodology and are stated at the lower of average cost or market. Components of inventory include fuel purchase costs, the related transportation costs and changes in the estimated fair market values for inventories included in a fair value hedge relationship.
Derivatives
We enter into financial derivative contracts in order to mitigate the risk of market price fluctuations in aviation, marine and land fuel, to offer our customers fuel pricing alternatives to meet their needs and to mitigate the risk of fluctuations in foreign currency exchange rates. We also enter into proprietary derivative transactions, primarily intended to capitalize on arbitrage opportunities related to basis or time spreads related to fuel products we sell. We have applied the normal purchase and normal sales exception (“NPNS”), as provided by accounting guidance for derivative instruments and hedging activities, to certain of our physical forward sales and purchase contracts. While these contracts are considered derivative instruments under the guidance for derivative instruments and hedging activities, they are not recorded at fair value, but rather are recorded in our consolidated financial statements when physical settlement of the contracts occurs. If it is determined that a transaction designated as NPNS no longer meets the scope of the exception, the fair value of the related contract is recorded as an asset or liability on the consolidated balance sheet and the difference between the fair value and the contract amount is immediately recognized through earnings.
Our derivatives that are subject to the accounting guidance for derivative instruments are recognized at their estimated fair market value in accordance with the accounting guidance for fair value measurements. If the derivative does not qualify as a hedge or is not designated as a hedge, changes in the estimated fair market value of the derivative are recognized as a component of revenue, cost of revenue or other income (expense), net (based on the underlying transaction type) in the consolidated statements of income and comprehensive income. Derivatives which qualify for hedge accounting may be designated as either a fair value or cash flow hedge. For our fair value hedges, changes in the estimated fair market value of the hedge instrument and the hedged item are recognized in the same line item as a component of either revenue or cost of revenue (based on the underlying transaction type) in the consolidated statements of income and comprehensive income. For our cash flow hedges, the effective portion of the changes in the fair market value of the hedge is recognized as a component of other comprehensive income in the shareholders’ equity section of the consolidated balance sheets and subsequently reclassified into the same line item as the forecasted transaction when both are settled, while the ineffective portion of the changes in the estimated fair market value of the hedge is recognized as a component of other income (expense), net in the consolidated statements of income and comprehensive income. Cash flows for our hedging instruments used in our hedges are classified in the same category as the cash flow from the hedged items. If for any reason hedge accounting is discontinued, then any cash flows subsequent to the date of discontinuance shall be classified in a manner consistent with the nature of the instrument.
To qualify for hedge accounting, as either a fair value or cash flow hedge, the hedging relationship between the hedging instruments and hedged items must be highly effective over an extended period of time in achieving the offset of changes in fair values or cash flows attributable to the hedged risk at the inception of the hedge. We use a regression analysis based on historical spot prices in assessing the qualification for our fair value hedges. However, our measurement of hedge ineffectiveness for our fair value inventory hedges utilizes spot prices for the hedged item (inventory) and forward or future prices for the hedge instrument. Therefore, the excluded component (forward or future prices) in assessing hedge qualification, along with ineffectiveness, is included as a component of cost of revenue in earnings. Adjustments to the carrying amounts of hedged items are discontinued in instances where the related fair value hedging instrument becomes ineffective and any previously recorded fair market value changes are not adjusted until the fuel is sold.
Goodwill and Identifiable Intangible Assets
Goodwill arises because the purchase price paid reflects numerous factors, including the strategic fit and expected synergies these acquisitions bring to our existing operations. Goodwill is recorded at fair value and is reviewed at least annually at year-end (or more frequently under certain circumstances) for impairment.
Goodwill is evaluated for impairment based on an assessment of qualitative factors to determine whether it is more likely than not that the fair value of any individual reporting unit is less than its carrying amount (Step 0). If we determine that it is more likely than not that the fair value of a reporting unit is greater than its carrying value, then no further testing is required. Otherwise, we would perform the two-step impairment analysis.
33
Step 1 requires us to compare the fair value of the reporting units to which goodwill was assigned to their respective carrying values. In calculating fair value, we use the income approach as our primary indicator of fair value. If the fair value exceeds the carrying value, no further work is required and no impairment loss is recognized. If the carrying value exceeds the fair value, the goodwill of the reporting unit is potentially impaired and the Company would then complete step 2 in order to measure the impairment loss.
In connection with our acquisitions, we record identifiable intangible assets at fair value. Identifiable intangible assets subject to amortization are amortized over their estimated useful lives and are reviewed for impairment whenever events or changes in circumstances indicate that the carrying amount of an asset may not be recoverable. We assess identifiable intangible assets not subject to amortization at least annually for potential impairment.
Revenue Recognition
Revenue from the sale of fuel is recognized when the sales price is fixed or determinable, collectability is reasonably assured and title passes to the customer, which is when the delivery of fuel is made to our customer directly from us, the supplier or a third‑party subcontractor. Our fuel sales are generated as a fuel reseller as well as from on‑hand inventory supply. When acting as a fuel reseller, we generally purchase fuel from the supplier, and contemporaneously resell the fuel to the customer, normally taking delivery for purchased fuel at the same place and time as the delivery is made to the customer. We record the gross sale of the fuel as we generally take inventory risk, have latitude in establishing the sales price, have discretion in the supplier selection, maintain credit risk and are the primary obligor in the sales arrangement.
Revenue from fuel‑related services is recognized when services are performed, the sales price is fixed or determinable and collectability is reasonably assured. We record the sale of fuel‑related services on a gross basis as we generally have latitude in establishing the sales price, have discretion in supplier selection, maintain credit risk and are the primary obligor in the sales arrangement.
Commission from fuel broker services is recognized when services are performed and collectability is reasonably assured. When acting as a fuel broker, we are paid a commission by the supplier.
Revenue from card payment and processing transactions is recognized at the time the purchase is made by the customer using the charge card. Revenue from charge card transactions is generated from processing fees.
Share‑Based Payment Awards
We account for share‑based payment awards on a fair value basis. Under fair value accounting, the grant‑date fair value of the share‑based payment award is amortized as compensation expense, on a straight‑line basis, over the vesting period for both graded and cliff vesting awards. Annual compensation expense for share‑based payment awards is reduced by an expected forfeiture amount on the outstanding share‑based payment awards.
The estimated fair value of stock awards, such as restricted stock and RSUs is based on the grant‑date market value of our common stock, as defined in the respective plans under which the awards were granted. To determine the estimated fair value of SSAR Awards, we use the Black‑Scholes option pricing model. The estimation of the fair value of SSAR Awards on the date of grant using an option‑pricing model is affected by our stock price as well as assumptions regarding a number of complex and subjective variables. These variables include our expected stock price volatility over the term of the awards, actual and projected employee stock option exercise behaviors, risk‑free interest rates and expected dividends. The expected term of SSAR Awards represents the estimated period of time from grant until exercise or conversion and is based on vesting schedules and expected post‑vesting, exercise and employment termination behavior. Expected volatility is based on the historical volatility of our common stock over the period that is equivalent to the award’s expected life. Any adjustment to the historical volatility as an indicator of future volatility would be based on the impact to historical volatility of significant non‑recurring events that would not be expected in the future. Risk‑free interest rates are based on the U.S. Treasury yield curve at the time of grant for the period that is equivalent to the award’s expected life. Dividend yields are based on the historical dividends of World Fuel over the period that is equivalent to the award’s expected life, as adjusted for stock splits.
Cash flows from income tax benefits resulting from income tax deductions in excess of the compensation cost recognized for share‑based payment awards (excess income tax benefits) are classified as financing cash flows. These excess income tax benefits are credited to capital in excess of par value.
Recent Accounting Pronouncements
Information regarding recent accounting pronouncements is included in Note 1 to the accompanying consolidated financial statements included in this 2015 10‑K Report.
34
Item 7A. Quantitative and Qualitative Disclosures About Market Risk
Derivatives
The following describes our derivative classifications:
Cash Flow Hedges. Includes certain commodity contracts we enter into to mitigate the risk of price volatility in forecasted purchases and sales.
Fair Value Hedges. Includes derivatives we enter into in order to hedge price risk associated with our inventory and certain firm commitments relating to fixed price purchase and sale contracts.
Non-designated Derivatives. Includes derivatives we primarily enter into in order to mitigate the risk of market price fluctuations in aviation, marine and land fuel in the form of swaps or futures as well as certain fixed price purchase and sale contracts and proprietary trading. In addition, non-designated derivatives are also entered into to hedge the risk of currency rate fluctuations.
35
As of December 31, 2015, our derivative instruments, at their respective fair value positions were as follows (in millions, except weighted average fixed price and weighted average mark‑to‑market amount):
|
|
|
|
|
|
|
|
|
|
|
|
|
|
|
Weighted |
|
|
|
|
|
|
|
|
|
|
|
|
|
|
|
Weighted |
|
|
Average |
|
|
|
|
|
|
|
|
|
|
|
|
|
|
|
Average |
|
|
Mark-to- |
|
|
Fair |
|
|
|
Settlement |
|
|
|
|
|
|
|
|
Fixed |
|
|
Market |
|
|
Value |
|
Hedge Strategy |
|
Period |
|
Derivative Instrument |
|
Notional |
|
Unit |
|
|
Price |
|
|
Amount |
|
|
Amount |
|
Fair Value Hedge |
|
2016 |
|
Commodity contracts for inventory hedging |
|
2.8 |
|
BBL |
|
$ |
54.104 |
|
$ |
4.929 |
|
$ |
13.8 |
|
|
|
2017 |
|
Commodity contracts for inventory hedging |
|
0.1 |
|
BBL |
|
|
57.576 |
|
|
5.000 |
|
|
0.5 |
|
|
|
|
|
|
|
|
|
|
|
|
|
|
|
|
|
$ |
14.3 |
|
|
|
|
|
|
|
|
|
|
|
|
|
|
|
|
|
|
|
|
Cash Flow Hedge |
|
2016 |
|
Commodity contracts for inventory hedging |
|
9.8 |
|
BBL |
|
|
66.947 |
|
|
0.847 |
|
|
8.3 |
|
|
|
2017 |
|
Commodity contracts for inventory hedging |
|
0.8 |
|
BBL |
|
|
66.784 |
|
|
8.625 |
|
|
6.9 |
|
|
|
|
|
|
|
|
|
|
|
|
|
|
|
|
|
$ |
15.2 |
|
|
|
|
|
|
|
|
|
|
|
|
|
|
|
|
|
|
|
|
Non-Designated |
|
2016 |
|
Commodity contracts (long) |
|
50.9 |
|
BBL |
|
|
45.030 |
|
|
(15.935) |
|
|
(811.1) |
|
|
|
2016 |
|
Commodity contracts (short) |
|
41.8 |
|
BBL |
|
|
54.410 |
|
|
19.770 |
|
|
826.4 |
|
|
|
2017 |
|
Commodity contracts (long) |
|
3.1 |
|
BBL |
|
|
25.400 |
|
|
(2.452) |
|
|
(7.6) |
|
|
|
2017 |
|
Commodity contracts (short) |
|
2.3 |
|
BBL |
|
|
26.810 |
|
|
3.348 |
|
|
7.7 |
|
|
|
2018 |
|
Commodity contracts (long) |
|
0.7 |
|
BBL |
|
|
10.000 |
|
|
2.857 |
|
|
2.0 |
|
|
|
2018 |
|
Commodity contracts (short) |
|
0.5 |
|
BBL |
|
|
11.280 |
|
|
(1.200) |
|
|
(0.6) |
|
|
|
2020 |
|
Commodity contracts (long) |
|
0.1 |
|
BBL |
|
|
21.750 |
|
|
(1.000) |
|
|
(0.1) |
|
|
|
2020 |
|
Commodity contracts (short) |
|
0.1 |
|
BBL |
|
|
18.840 |
|
|
6.000 |
|
|
0.6 |
|
|
|
2016 |
|
Foreign currency contracts |
|
6.5 |
|
AUD |
|
|
0.717 |
|
|
(0.031) |
|
|
(0.2) |
|
|
|
2016 |
|
Foreign currency contracts |
|
4.3 |
|
BRL |
|
|
3.881 |
|
|
— |
|
|
— |
|
|
|
2016 |
|
Foreign currency contracts |
|
82.8 |
|
CAD |
|
|
1.335 |
|
|
0.025 |
|
|
2.1 |
|
|
|
2016 |
|
Foreign currency contracts |
|
0.3 |
|
CHF |
|
|
0.964 |
|
|
— |
|
|
— |
|
|
|
2016 |
|
Foreign currency contracts |
|
4,199.0 |
|
CLP |
|
|
702.379 |
|
|
— |
|
|
— |
|
|
|
2016 |
|
Foreign currency contracts |
|
52,263.5 |
|
COP |
|
|
3,064.704 |
|
|
— |
|
|
0.1 |
|
|
|
2016 |
|
Foreign currency contracts |
|
73.8 |
|
DKK |
|
|
6.854 |
|
|
(0.003) |
|
|
(0.2) |
|
|
|
2016 |
|
Foreign currency contracts |
|
45.7 |
|
EUR |
|
|
1.099 |
|
|
0.033 |
|
|
1.5 |
|
|
|
2016 |
|
Foreign currency contracts |
|
124.7 |
|
GBP |
|
|
1.530 |
|
|
0.023 |
|
|
2.9 |
|
|
|
2016 |
|
Foreign currency contracts |
|
111.4 |
|
INR |
|
|
66.366 |
|
|
— |
|
|
— |
|
|
|
2016 |
|
Foreign currency contracts |
|
546.3 |
|
JPY |
|
|
120.938 |
|
|
— |
|
|
— |
|
|
|
2016 |
|
Foreign currency contracts |
|
1,794.6 |
|
MXN |
|
|
16.803 |
|
|
— |
|
|
(0.1) |
|
|
|
2016 |
|
Foreign currency contracts |
|
47.3 |
|
NOK |
|
|
8.474 |
|
|
0.004 |
|
|
0.2 |
|
|
|
2016 |
|
Foreign currency contracts |
|
12.6 |
|
PLN |
|
|
3.892 |
|
|
0.008 |
|
|
0.1 |
|
|
|
2016 |
|
Foreign currency contracts |
|
42.9 |
|
RON |
|
|
4.083 |
|
|
0.014 |
|
|
0.6 |
|
|
|
2016 |
|
Foreign currency contracts |
|
45.6 |
|
SEK |
|
|
8.343 |
|
|
(0.002) |
|
|
(0.1) |
|
|
|
2016 |
|
Foreign currency contracts |
|
23.8 |
|
SGD |
|
|
1.411 |
|
|
(0.004) |
|
|
(0.1) |
|
|
|
2016 |
|
Foreign currency contracts |
|
109.3 |
|
ZAR |
|
|
14.245 |
|
|
0.001 |
|
|
0.1 |
|
|
|
2017 |
|
Foreign currency contracts |
|
1.8 |
|
EUR |
|
|
1.083 |
|
|
— |
|
|
— |
|
|
|
2017 |
|
Foreign currency contracts |
|
8.0 |
|
GBP |
|
|
1.553 |
|
|
0.063 |
|
|
0.5 |
|
|
|
2017 |
|
Foreign currency contracts |
|
1.7 |
|
EUR |
|
|
1.105 |
|
|
— |
|
|
— |
|
|
|
|
|
|
|
|
|
|
|
|
|
|
|
|
|
$ |
24.7 |
|
|
|
|
|
|
|
|
|
|
|
|
|
|
|
|
|
|
|
Interest Rate
Borrowings under our Credit Facility and Term Loans related to base rate loans or Eurodollar rate loans bear floating interest rates plus applicable margins. As of December 31, 2015, the applicable margins for base rate loans and Eurodollar rate loans were 1.25% and 2.25%, respectively. As of December 31, 2015, we had outstanding borrowings under our Credit Facility totaling $416.0 million and $333.2 million in Term Loans. As of December 31, 2015, the aggregate outstanding balance of our capital lease obligations was $12.0 million, which bear interest at annual rates ranging from 3.0% to 6.3%. Our remaining outstanding debt of $11.0 million as of December 31, 2015 primarily relates to acquisition promissory notes and loans payable to noncontrolling shareholders of a consolidated subsidiary which are payable in varying amounts from July 2016 to May 2018 and bear interest at annual rates ranging from 1.3% to 6.8%.The weighted average interest rate on our short‑term debt was 2.7% as of December 31, 2015. A 1.0% fluctuation in the interest rate on our outstanding debt would result in a $7.6 million change in interest expense during the next twelve months.
Foreign Currency
We analyzed our assets and liabilities denominated in currencies other than their respective functional currencies to identify consolidated currency exposures as of December 31, 2015, including derivatives utilized to hedge such exposures. For these assets and liabilities, we then assessed the effect of a hypothetical uniform 10% strengthening in the value of the U.S. dollar relative to these other currencies. This analysis indicated that the effect on our income before income taxes would not be significant.
36
Item 8. Financial Statements and Supplementary Data
The financial statements, together with the report thereon of PricewaterhouseCoopers LLP dated February 11, 2016, and the Selected Quarterly Financial Data (Unaudited), are set forth in Item 15 of this 2015 10‑K Report.
Item 9. Changes in and Disagreements with Accountants on Accounting and Financial Disclosure
None.
Item 9A. Controls and Procedures
Management’s Evaluation of Disclosure Controls and Procedures
We maintain disclosure controls and procedures that are designed to ensure that information required to be disclosed in the reports that we file or submit under the Exchange Act is recorded, processed, summarized and reported within the time periods specified in the SEC’s rules and forms, and that such information is accumulated and communicated to our management, including our Chief Executive Officer (“CEO”) and our Chief Financial Officer (“CFO”), as appropriate, to allow timely decisions regarding required financial disclosure.
As of the end of the period covered by this report, we evaluated, under the supervision and with the participation of our CEO and CFO, the effectiveness of the design and operation of our disclosure controls and procedures pursuant to Exchange Act Rule 13a‑15(e). Based upon this evaluation, the CEO and CFO concluded that our disclosure controls and procedures were effective at a reasonable assurance level as of December 31, 2015.
Management’s Report on Internal Control over Financial Reporting
Our management is responsible for establishing and maintaining adequate internal control over financial reporting, as such term is defined in Exchange Act Rule 13a‑15(f). Our internal control over financial reporting is a process designed to provide reasonable assurance regarding the reliability of financial reporting and the preparation of financial statements for external purposes in accordance with accounting principles generally accepted in the United States of America. Our internal control over financial reporting includes those policies and procedures that (i) pertain to the maintenance of records that, in reasonable detail, accurately and fairly reflect the transactions and dispositions of our assets; (ii) provide reasonable assurance that transactions are recorded as necessary to permit preparation of financial statements in accordance with accounting principles generally accepted in the United States of America, and that receipts and expenditures are being made only in accordance with authorizations of management and our directors; and (iii) provide reasonable assurance regarding prevention or timely detection of the unauthorized acquisition, use or disposition of assets that could have a material effect on the financial statements.
Because of its inherent limitations, internal control over financial reporting may not prevent or detect misstatements. Also, projections of any evaluation of effectiveness to future periods are subject to the risk that controls may become inadequate because of changes in conditions, or that the degree of compliance with the policies or procedures may deteriorate.
Management has assessed the effectiveness of our internal control over financial reporting as of December 31, 2015 using the framework specified in Internal Control – Integrated Framework (2013) issued by the Committee of Sponsoring Organizations of the Treadway Commission (COSO). Based on such assessment, management has concluded that our internal control over financial reporting was effective as of December 31, 2015. Management has excluded Pester, (the ‘‘Excluded Business’’) from its assessment of internal control over financial reporting as of December 31, 2015, because the Excluded Business was acquired during 2015. The total assets, including goodwill and identifiable intangible assets, and total revenues of the Excluded Businesses represent approximately 1.8% and 0.3%, respectively, of the related consolidated financial statement amounts as of and for the year ended December 31, 2015.
The effectiveness of our internal control over financial reporting as of December 31, 2015 has been audited by PricewaterhouseCoopers LLP, an independent registered certified public accounting firm, as stated in their report appearing herein.
Changes in Internal Control over Financial Reporting
As of December 31, 2015, we have included the Watson Petroleum and Colt businesses, which were acquired in 2014, in our assessment of the effectiveness of our internal control over financial reporting.
37
There were no changes in our internal control over financial reporting that materially affected, or are reasonably likely to materially affect, our internal control over financial reporting during the quarter ended December 31, 2015.
It should be noted that any system of controls, however well designed and operated, can provide only reasonable, and not absolute, assurance that the objectives of the system will be met. In addition, the design of any control system is based in part upon certain assumptions about the likelihood of future events. Because of these and other inherent limitations of control systems, there is only the reasonable assurance that our controls will succeed in achieving their goals under all potential future conditions.
None.
38
Item 10. Directors, Executive Officers and Corporate Governance
We have adopted a Code of Conduct that applies to all of our employees, officers (including our principal executive, financial and accounting officers) and directors. The Code of Conduct is located on our website at http://www.wfscorp.com under “Investor Relations – Corporate Governance – Governance Documents.” We intend to disclose any amendments to our Code of Conduct or waivers with respect to our Code of Conduct granted to our principal executive, financial and accounting officers on our website.
The remaining information regarding our directors, executive officers and corporate governance is incorporated herein by reference from our Definitive Proxy Statement for the 2016 Annual Meeting of Shareholders (“2016 Proxy”) to be filed pursuant to Regulation 14A within 120 days after the close of the fiscal year ended December 31, 2015.
Item 11. Executive Compensation
Information on executive compensation is incorporated herein by reference from our 2016 Proxy to be filed pursuant to Regulation 14A within 120 days after the close of the fiscal year ended December 31, 2015.
Item 12. Security Ownership of Certain Beneficial Owners and Management and Related Shareholder Matters
Information on security ownership of certain beneficial owners and management and related shareholder matters is incorporated herein by reference from our 2016 Proxy to be filed pursuant to Regulation 14A within 120 days after the close of the fiscal year ended December 31, 2015.
Item 13. Certain Relationships and Related Transactions, and Director Independence
Information on certain relationships and related transactions and director independence is incorporated herein by reference from our 2016 Proxy to be filed pursuant to Regulation 14A within 120 days after the close of the fiscal year ended December 31, 2015.
Item 14. Principal Accounting Fees and Services
Information on principal accounting fees and services is incorporated herein by reference from our 2016 Proxy to be filed pursuant to Regulation 14A within 120 days after the close of the fiscal year ended December 31, 2015.
39
Item 15. Exhibits, Financial Statement Schedules
|
(a)(1) |
The following consolidated financial statements are filed as a part of this 2015 10‑K Report: |
||
|
|
Report of Independent Registered Certified Public Accounting Firm. |
43 | |
|
|
Consolidated Balance Sheets as of December 31, 2015 and 2014. |
44 | |
|
|
Consolidated Statements of Income and Comprehensive Income for 2015, 2014 and 2013. |
45 | |
|
|
Consolidated Statements of Shareholders’ Equity for 2015, 2014 and 2013. |
46 | |
|
|
Consolidated Statements of Cash Flows for 2015, 2014 and 2013. |
47 | |
|
|
49 | ||
|
(a)(2) |
Consolidated financial statement schedules have been omitted either because the required information is set forth in the consolidated financial statements or notes thereto, or the information called for is not required. |
||
|
(b) |
The exhibits set forth in the following index of exhibits are filed or incorporated by reference as a part of this 2015 10‑K Report: |
||
40
|
Exhibit No. |
|
Description |
|
3.1 |
|
Restated Articles of Incorporation (incorporated by reference herein to Exhibit 99.2 to our Current Report on Form 8‑K filed on February 3, 2005). |
|
3.2 |
|
Articles of Amendment to Restated Articles of Incorporation (incorporated by reference herein to Exhibit 3.1 to our Current Report on Form 8‑K filed on November 23, 2009). |
|
3.3 |
|
By‑Laws, amended and restated as of August 26, 2011 (incorporated by reference herein to Exhibit 3.1 to our Current Report on Form 8‑K filed on August 29, 2011). |
|
10.1 |
|
Agreement between World Fuel Services Corporation and Paul H. Stebbins, dated March 14, 2008 (incorporated by reference herein to Exhibit 10.1 to our Current Report on Form 8‑K filed on March 20, 2008). * |
|
10.2 |
|
Amendment No. 1, dated August 26, 2011, to Agreement between World Fuel Services Corporation and Paul H. Stebbins (incorporated by reference herein to Exhibit 10.2 to our Current Report on Form 8‑K filed on August 29, 2011). * |
|
10.3 |
|
Amendment No. 2, dated April 11, 2014, to Agreement between World Fuel Services Corporation and Paul H. Stebbins (incorporated by reference herein to Exhibit 10.1 to our Current Report on Form 8‑K filed on April 11, 2014). * |
|
10.4 |
|
Agreement between World Fuel Services Corporation and Michael J. Kasbar, dated March 14, 2008 (incorporated by reference herein to Exhibit 10.2 to our Current Report on Form 8‑K filed on March 20, 2008). * |
|
10.5 |
|
Amendment No. 1, dated August 26, 2011, to Agreement between World Fuel Services Corporation and Michael J. Kasbar (incorporated by reference herein to Exhibit 10.1 to our Current Report on Form 8‑K filed on August 29, 2011). * |
|
10.6 |
|
Amendment No. 2, dated April 9, 2012, to Agreement between World Fuel Services Corporation and Michael J. Kasbar (incorporated by reference herein to Exhibit 10.1 to our Current Report on Form 8‑K filed on April 13, 2012). * |
|
10.7 |
|
Amendment No. 3, dated April 11, 2014, to Agreement between World Fuel Services Corporation and Michael J. Kasbar (incorporated by reference herein to Exhibit 10.2 to our Current Report on Form 8‑K filed on April 11, 2014). * |
|
10.8 |
|
Executive Severance Agreement between World Fuel Services Corporation and Ira M. Birns, dated April 16, 2007 (incorporated by reference herein to Exhibit 10.2 to our Current Report on Form 8‑K filed on April 16, 2007). * |
|
10.9 |
|
Employment Agreement between World Fuel Services, Inc. and Michael S. Clementi, effective January 1, 2008 (incorporated by reference herein to Exhibit 10.3 to our Current Report on Form 8‑K filed on March 20, 2008). * |
|
10.10 |
|
Amendment to Employment Agreement between World Fuel Services, Inc. and Michael S. Clementi, dated May 20, 2011 (incorporated by reference herein to Exhibit 10.1 to our Quarterly Report on Form 10‑Q for the quarter ended June 30, 2011 filed on August 2, 2011). * |
|
10.11 |
|
1993 Non‑Employee Directors Stock Option Plan, as amended and restated (incorporated by reference herein to Exhibit 4.1 to our Registration Statement on Form S‑8 filed on December 20, 2005). * |
|
10.12 |
|
1996 Employee Stock Option Plan (incorporated by reference herein to Exhibit A to our Schedule 14A filed on June 25, 1998). * |
|
10.13 |
|
2001 Omnibus Plan, as amended and restated (incorporated by reference herein to Exhibit 4.2 to our Registration Statement on Form S‑8 filed on December 20, 2005). * |
|
10.14 |
|
2006 Omnibus Plan (incorporated by reference herein to Appendix A to the Company's Definitive Proxy Statement on Schedule 14A filed with the SEC on April 27, 2009. * |
|
10.15 |
|
World Fuel Services Corporation 2013 Executive Incentive Plan (incorporated by reference herein to Exhibit 10.1 to our Current Report on Form 8‑K filed on June 4, 2013). * |
|
10.16 |
|
Form of Named Executive Officer Restricted Stock Unit Grant Agreement under the 2006 Omnibus Plan (incorporated by reference herein to Exhibit 10.4 to our Quarterly Report on Form 10‑Q for the quarter ended June 30, 2011 filed on August 2, 2011). * |
|
10.17 |
|
Form of Named Executive Officer Restricted Stock Agreement under the 2006 Omnibus Plan (incorporated by reference herein to Exhibit 10.5 to our Quarterly Report on Form 10‑Q for the quarter ended June 30, 2011 filed on August 2, 2011). * |
|
10.18 |
|
Form of Stock‑Settled Stock Appreciation Right Agreement in connection with the 2006 Omnibus Plan (incorporated by reference herein to Exhibit 10.3 to our Current Report on Form 8‑K filed on November 7, 2006). * |
|
10.19 |
|
Form of Named Executive Officer Performance‑Based Restricted Stock Grant Agreement under the 2006 Omnibus Plan (incorporated by reference herein to Exhibit 10.1 to our Quarterly Report on Form 10‑Q for the quarter ended September 30, 2012 filed on November 1, 2012). * |
41
|
Exhibit No. |
|
Description |
|
10.20 |
|
Form of Michael J. Kasbar Stock-Settled Stock Appreciation Right Agreement under the 2006 Omnibus Plan (incorporated by reference herein to Exhibit 10.1 to our Quarterly Report on Form 10-Q for the quarter ended June 30, 2014 filed on July 30, 2014). * |
|
10.21 |
|
Form of Ira M. Birns Stock-Settled Stock Appreciation Right Agreement under the 2006 Omnibus Plan (incorporated by reference herein to Exhibit 10.2 to our Quarterly Report on Form 10-Q for the quarter ended June 30, 2014 filed on July 30, 2014). * |
|
10.22 |
|
Form of Named Executive Officer Long-Term Incentive Restricted Stock Unit Grant Agreement under the 2006 Omnibus Plan (incorporated by reference herein to Exhibit 10.1 to our Quarterly Report on Form 10‑Q for the quarter ended June 30, 2015 filed on July 30, 2015). * |
|
10.23 |
|
Form of Michael S. Clementi Restricted Stock Unit Grant Agreement under the 2006 Omnibus Plan (incorporated by reference herein to Exhibit 10.3 to our Quarterly Report on Form 10 Q for the quarter ended June 30, 2011 filed on August 2, 2011).* |
|
10.24 |
|
Form of Non-Employee Director Restricted Stock Unit Grant Agreement under the 2006 Omnibus Plan. * |
|
10.25 |
|
Form of Amendment to 2013 and 2014 Non-Employee Director Restricted Stock Unit Grant Agreements, dated November 24, 2015.* |
|
10.26 |
|
Form of Stock Settled Stock Appreciation Right Agreement (Non-Employee Director) in connection with the 2006 Omnibus Plan (incorporated by reference herein to Exhibit 10.5 to our Current Report on Form 8-K filed on November 7, 2006).* |
|
10.27 |
|
Fourth Amended and Restated Credit Agreement, dated as of October 10, 2013, among World Fuel Services Corporation, World Fuel Services Europe, Ltd. and World Fuel Services (Singapore) Pte Ltd, as borrowers, Bank of America, N.A., as administrative agent, and the financial institutions named therein as lenders (incorporated herein by reference to Exhibit 10.1 to our Current Report on Form 8-K filed on October 11, 2013).* |
|
10.28 |
|
First Amendment to the Fourth Amended and Restated Credit Agreement, dated as of January 30, 2015, among World Fuel Services Corporation, World Fuel Services Europe, Ltd. and World Fuel Services (Singapore) Pte Ltd, as borrowers, Bank of America, N.A., as administrative agent, and the financial institutions named therein as lenders (incorporated herein by reference to Exhibit 10.1 to our Current Report on Form 8-K filed on February 5, 2015). * |
|
21.1 |
|
Subsidiaries of the Registrant. |
|
23.1 |
|
Consent of Independent Registered Certified Public Accounting Firm. |
|
31.1 |
|
Certification of the Chief Executive Officer pursuant to Rule 13a‑14(a) or Rule 15d‑14(a). |
|
31.2 |
|
Certification of the Chief Financial Officer pursuant to Rule 13a‑14(a) or Rule 15d‑14(a). |
|
32.1 |
|
Statement of Chief Executive Officer and Chief Financial Officer under Section 906 of the Sarbanes‑Oxley Act of 2002 (18 U.S.C. Section 1350). |
|
101 |
|
The following materials from World Fuel Services Corporation’s Annual Report on Form 10‑K for the year ended December 31, 2015, formatted in XBRL (Extensible Business Reporting Language); (i) Consolidated Balance Sheets, (ii) Consolidated Statements of Income and Comprehensive Income, (iii) Consolidated Statements of Shareholders’ Equity, (iv) Consolidated Statements of Cash Flows, and (v) Notes to the Consolidated Financial Statements. |
*Management contracts and compensatory plans or arrangements required to be filed as exhibits to this form, pursuant to Item 15(b).
42
REPORT OF INDEPENDENT REGISTERED CERTIFIED
PUBLIC ACCOUNTING FIRM
To the Shareholders and Board of Directors of World Fuel Services Corporation:
In our opinion, the accompanying consolidated balance sheets and the related consolidated statements of income and comprehensive income, shareholders’ equity, and cash flows present fairly, in all material respects, the financial position of World Fuel Services Corporation and its subsidiaries (the “Company”) at December 31, 2015 and 2014, and the results of their operations and their cash flows for each of the three years in the period ended December 31, 2015 in conformity with accounting principles generally accepted in the United States of America. Also in our opinion, the Company maintained, in all material respects, effective internal control over financial reporting as of December 31, 2015, based on criteria established in Internal Control - Integrated Framework (2013) issued by the Committee of Sponsoring Organizations of the Treadway Commission (COSO). The Company's management is responsible for these financial statements, for maintaining effective internal control over financial reporting and for its assessment of the effectiveness of internal control over financial reporting, included in Management's Report on Internal Control over Financial Reporting appearing under Item 9A. Our responsibility is to express opinions on these financial statements and on the Company's internal control over financial reporting based on our integrated audits. We conducted our audits in accordance with the standards of the Public Company Accounting Oversight Board (United States). Those standards require that we plan and perform the audits to obtain reasonable assurance about whether the financial statements are free of material misstatement and whether effective internal control over financial reporting was maintained in all material respects. Our audits of the financial statements included examining, on a test basis, evidence supporting the amounts and disclosures in the financial statements, assessing the accounting principles used and significant estimates made by management, and evaluating the overall financial statement presentation. Our audit of internal control over financial reporting included obtaining an understanding of internal control over financial reporting, assessing the risk that a material weakness exists, and testing and evaluating the design and operating effectiveness of internal control based on the assessed risk. Our audits also included performing such other procedures as we considered necessary in the circumstances. We believe that our audits provide a reasonable basis for our opinions.
A company’s internal control over financial reporting is a process designed to provide reasonable assurance regarding the reliability of financial reporting and the preparation of financial statements for external purposes in accordance with generally accepted accounting principles. A company’s internal control over financial reporting includes those policies and procedures that (i) pertain to the maintenance of records that, in reasonable detail, accurately and fairly reflect the transactions and dispositions of the assets of the company; (ii) provide reasonable assurance that transactions are recorded as necessary to permit preparation of financial statements in accordance with generally accepted accounting principles, and that receipts and expenditures of the company are being made only in accordance with authorizations of management and directors of the company; and (iii) provide reasonable assurance regarding prevention or timely detection of unauthorized acquisition, use, or disposition of the company’s assets that could have a material effect on the financial statements.
Because of its inherent limitations, internal control over financial reporting may not prevent or detect misstatements. Also, projections of any evaluation of effectiveness to future periods are subject to the risk that controls may become inadequate because of changes in conditions, or that the degree of compliance with the policies or procedures may deteriorate.
As described in Management's Report on Internal Control over Financial Reporting appearing in Item 9A of the Company’s 2015 Annual Report on Form 10-K, management has excluded Pester from its assessment of internal control over financial reporting as of December 31, 2015 because this businesses was acquired in a purchase business combination during the year ended December 31, 2015. We have also excluded Pester Marketing Company from our audit of internal control over financial reporting. Pester Marketing Company is a wholly-owned subsidiary whose total assets and revenues represent approximately 1.8% and 0.3%, respectively, of the related consolidated financial statement amounts as of and for the year ended December 31, 2015.
/s/ PricewaterhouseCoopers LLP
Miami, Florida
February 16, 2016
43
WORLD FUEL SERVICES CORPORATION AND SUBSIDIARIES
(In millions, except per share data)
|
|
|
As of December 31, |
||||
|
|
|
2015 |
|
2014 | ||
|
Assets: |
|
|
|
|
|
|
|
Current assets: |
|
|
|
|
|
|
|
Cash and cash equivalents |
|
$ |
582.5 |
|
$ |
302.3 |
|
Accounts receivable, net |
|
|
1,812.6 |
|
|
2,306.4 |
|
Inventories |
|
|
359.1 |
|
|
437.6 |
|
Prepaid expenses |
|
|
57.9 |
|
|
76.9 |
|
Short-term derivative assets, net |
|
|
227.2 |
|
|
303.6 |
|
Other current assets |
|
|
209.8 |
|
|
246.6 |
|
Current assets held for sale |
|
|
5.5 |
|
|
— |
|
Total current assets |
|
|
3,254.6 |
|
|
3,673.4 |
|
Property and equipment, net |
|
|
225.6 |
|
|
203.4 |
|
Goodwill |
|
|
675.8 |
|
|
653.3 |
|
Identifiable intangible and other non-current assets |
|
|
356.9 |
|
|
350.9 |
|
Non-current assets held for sale |
|
|
36.5 |
|
|
— |
|
Total assets |
|
$ |
4,549.4 |
|
$ |
4,881.0 |
|
Liabilities: |
|
|
|
|
|
|
|
Current liabilities: |
|
|
|
|
|
|
|
Short-term debt |
|
$ |
25.5 |
|
$ |
17.9 |
|
Accounts payable |
|
|
1,349.6 |
|
|
1,850.1 |
|
Customer deposits |
|
|
118.3 |
|
|
138.8 |
|
Accrued expenses and other current liabilities |
|
|
263.8 |
|
|
232.5 |
|
Current liabilities held for sale |
|
|
5.6 |
|
|
— |
|
Total current liabilities |
|
|
1,762.8 |
|
|
2,239.3 |
|
Long-term debt |
|
|
746.7 |
|
|
672.0 |
|
Non-current income tax liabilities, net |
|
|
87.7 |
|
|
85.5 |
|
Other long-term liabilities |
|
|
25.8 |
|
|
19.3 |
|
Non-current liabilities held for sale |
|
|
5.0 |
|
|
— |
|
Total liabilities |
|
|
2,628.0 |
|
|
3,016.1 |
|
Commitments and contingencies |
|
|
|
|
|
|
|
Equity: |
|
|
|
|
|
|
|
World Fuel shareholders’ equity: |
|
|
|
|
|
|
|
Preferred stock, $1.00 par value; 100 shares authorized, none issued |
|
|
— |
|
|
— |
|
Common stock, $0.01 par value; 100,000 shares authorized, 70,788 and 72,082 shares issued and outstanding as of December 31, 2015 and 2014 respectively |
|
|
0.7 |
|
|
0.7 |
|
Capital in excess of par value |
|
|
435.3 |
|
|
496.4 |
|
Retained earnings |
|
|
1,588.6 |
|
|
1,418.5 |
|
Accumulated other comprehensive loss |
|
|
(113.2) |
|
|
(60.2) |
|
Total World Fuel shareholders’ equity |
|
|
1,911.4 |
|
|
1,855.4 |
|
Noncontrolling interest equity |
|
|
10.0 |
|
|
9.5 |
|
Total equity |
|
|
1,921.4 |
|
|
1,864.9 |
|
Total liabilities and equity |
|
$ |
4,549.4 |
|
$ |
4,881.0 |
The accompanying notes are an integral part of these consolidated financial statements.
44
WORLD FUEL SERVICES CORPORATION AND SUBSIDIARIES
CONSOLIDATED STATEMENTS OF INCOME AND
COMPREHENSIVE INCOME
(In millions, except earnings per share data)
|
|
|
For the Year ended December 31, |
|||||||
|
|
|
2015 |
|
2014 |
|
2013 | |||
|
Revenue |
|
$ |
30,379.7 |
|
$ |
43,386.4 |
|
$ |
41,561.9 |
|
Cost of revenue |
|
|
29,519.2 |
|
|
42,572.8 |
|
|
40,809.1 |
|
Gross profit |
|
|
860.5 |
|
|
813.6 |
|
|
752.8 |
|
Operating expenses: |
|
|
|
|
|
|
|
|
|
|
Compensation and employee benefits |
|
|
365.8 |
|
|
319.8 |
|
|
288.0 |
|
Provision for bad debt |
|
|
7.5 |
|
|
3.8 |
|
|
11.7 |
|
General and administrative |
|
|
240.0 |
|
|
220.9 |
|
|
188.6 |
|
|
|
|
613.3 |
|
|
544.5 |
|
|
488.3 |
|
Income from operations |
|
|
247.2 |
|
|
269.1 |
|
|
264.5 |
|
Non-operating (expenses) income, net: |
|
|
|
|
|
|
|
|
|
|
Interest expense and other financing costs, net |
|
|
(29.9) |
|
|
(25.2) |
|
|
(17.3) |
|
Other income (expense), net |
|
|
2.0 |
|
|
25.6 |
|
|
(0.4) |
|
|
|
|
(27.9) |
|
|
0.4 |
|
|
(17.7) |
|
Income before income taxes |
|
|
219.3 |
|
|
269.5 |
|
|
246.7 |
|
Provision for income taxes |
|
|
36.3 |
|
|
51.1 |
|
|
39.5 |
|
Net income including noncontrolling interest |
|
|
183.0 |
|
|
218.4 |
|
|
207.2 |
|
Net (loss) income attributable to noncontrolling interest |
|
|
(3.9) |
|
|
(3.3) |
|
|
4.1 |
|
Net income attributable to World Fuel |
|
$ |
186.9 |
|
$ |
221.7 |
|
$ |
203.1 |
|
Basic earnings per common share |
|
$ |
2.66 |
|
$ |
3.13 |
|
$ |
2.85 |
|
Basic weighted average common shares |
|
|
70.2 |
|
|
70.8 |
|
|
71.2 |
|
Diluted earnings per common share |
|
$ |
2.64 |
|
$ |
3.11 |
|
$ |
2.83 |
|
Diluted weighted average common shares |
|
|
70.7 |
|
|
71.3 |
|
|
71.8 |
|
Comprehensive income: |
|
|
|
|
|
|
|
|
|
|
Net income including noncontrolling interest |
|
$ |
183.0 |
|
$ |
218.4 |
|
$ |
207.2 |
|
Other comprehensive (loss) income: |
|
|
|
|
|
|
|
|
|
|
Foreign currency translation adjustments |
|
|
(49.6) |
|
|
(30.9) |
|
|
(13.2) |
|
Cash Flow hedges, net of income tax of $0.8 for 2015 |
|
|
0.6 |
|
|
— |
|
|
(0.1) |
|
|
|
|
(49.0) |
|
|
(30.9) |
|
|
(13.3) |
|
Comprehensive income including noncontrolling interest |
|
|
134.0 |
|
|
187.5 |
|
|
193.9 |
|
Comprehensive income (loss) attributable to noncontrolling interest |
|
|
0.1 |
|
|
(3.3) |
|
|
4.1 |
|
Comprehensive income attributable to World Fuel |
|
$ |
133.9 |
|
$ |
190.8 |
|
$ |
189.8 |
The accompanying notes are an integral part of these consolidated financial statements.
45
WORLD FUEL SERVICES CORPORATION AND SUBSIDIARIES
CONSOLIDATED STATEMENTS OF SHAREHOLDERS’ EQUITY
(In millions)
|
|
|
|
|
|
|
|
Capital |
|
|
|
|
Accumulated |
|
Total |
|
|
|
|
|
||||
|
|
|
|
|
|
|
|
in |
|
|
|
|
Other |
|
World Fuel |
|
Noncontrolling |
|
|
|
||||
|
|
|
Common Stock |
|
Excess of |
|
Retained |
|
Comprehensive |
|
Shareholders’ |
|
Interest |
|
Total |
|||||||||
|
|
|
Shares |
|
Amount |
|
Par Value |
|
Earnings |
|
Loss |
|
Equity |
|
Equity |
|
Equity |
|||||||
|
Balance as of December 31, 2012 |
|
72.1 |
|
$ |
0.7 |
|
$ |
517.6 |
|
$ |
1,014.8 |
|
$ |
(16.0) |
|
$ |
1,517.1 |
|
$ |
24.5 |
|
$ |
1,541.6 |
|
Net income |
|
— |
|
|
— |
|
|
— |
|
|
203.1 |
|
|
— |
|
|
203.1 |
|
|
4.1 |
|
|
207.2 |
|
Cash dividends declared |
|
— |
|
|
— |
|
|
— |
|
|
(10.6) |
|
|
— |
|
|
(10.6) |
|
|
— |
|
|
(10.6) |
|
Investment by noncontrolling interest |
|
— |
|
|
— |
|
|
— |
|
|
— |
|
|
— |
|
|
— |
|
|
17.5 |
|
|
17.5 |
|
Distribution of noncontrolling interest |
|
— |
|
|
— |
|
|
— |
|
|
— |
|
|
— |
|
|
— |
|
|
(15.5) |
|
|
(15.5) |
|
Deconsolidation of crude oil transloading joint venture |
|
— |
|
|
— |
|
|
— |
|
|
— |
|
|
— |
|
|
— |
|
|
(25.6) |
|
|
(25.6) |
|
Amortization of share-based payment awards |
|
— |
|
|
— |
|
|
16.1 |
|
|
— |
|
|
— |
|
|
16.1 |
|
|
— |
|
|
16.1 |
|
Issuance of common stock related to share-based payment awards including income tax benefit of $3.3 |
|
0.7 |
|
|
— |
|
|
3.3 |
|
|
— |
|
|
— |
|
|
3.3 |
|
|
— |
|
|
3.3 |
|
Purchases of common stock tendered by employees to satisfy the required withholding taxes related to share-based payment awards |
|
— |
|
|
— |
|
|
(6.8) |
|
|
— |
|
|
— |
|
|
(6.8) |
|
|
— |
|
|
(6.8) |
|
Purchases of common stock |
|
(0.9) |
|
|
— |
|
|
(35.0) |
|
|
— |
|
|
— |
|
|
(35.0) |
|
|
— |
|
|
(35.0) |
|
Other comprehensive loss |
|
— |
|
|
— |
|
|
— |
|
|
— |
|
|
(13.3) |
|
|
(13.3) |
|
|
— |
|
|
(13.3) |
|
Balance as of December 31, 2013 |
|
71.9 |
|
|
0.7 |
|
|
495.2 |
|
|
1,207.3 |
|
|
(29.3) |
|
|
1,673.9 |
|
|
5.0 |
|
|
1,678.9 |
|
Net income |
|
— |
|
|
— |
|
|
— |
|
|
221.7 |
|
|
— |
|
|
221.7 |
|
|
(3.3) |
|
|
218.4 |
|
Cash dividends declared |
|
— |
|
|
— |
|
|
— |
|
|
(10.5) |
|
|
— |
|
|
(10.5) |
|
|
— |
|
|
(10.5) |
|
Initial noncontrolling interest upon acquisition of businesses |
|
— |
|
|
— |
|
|
— |
|
|
— |
|
|
— |
|
|
— |
|
|
19.4 |
|
|
19.4 |
|
Distribution of noncontrolling interest |
|
— |
|
|
— |
|
|
— |
|
|
— |
|
|
— |
|
|
— |
|
|
(11.6) |
|
|
(11.6) |
|
Amortization of share-based payment awards |
|
— |
|
|
— |
|
|
15.3 |
|
|
— |
|
|
— |
|
|
15.3 |
|
|
— |
|
|
15.3 |
|
Issuance of common stock related to share-based payment awards including income tax benefit of $1.0 |
|
0.5 |
|
|
— |
|
|
1.0 |
|
|
— |
|
|
— |
|
|
1.0 |
|
|
— |
|
|
1.0 |
|
Purchases of common stock tendered by employees to satisfy the required withholding taxes related to share-based payment awards |
|
(0.1) |
|
|
— |
|
|
(5.1) |
|
|
— |
|
|
— |
|
|
(5.1) |
|
|
— |
|
|
(5.1) |
|
Purchases of common stock |
|
(0.2) |
|
|
— |
|
|
(10.0) |
|
|
— |
|
|
— |
|
|
(10.0) |
|
|
— |
|
|
(10.0) |
|
Other comprehensive loss |
|
— |
|
|
— |
|
|
— |
|
|
— |
|
|
(30.9) |
|
|
(30.9) |
|
|
— |
|
|
(30.9) |
|
Balance as of December 31, 2014 |
|
72.1 |
|
|
0.7 |
|
|
496.4 |
|
|
1,418.5 |
|
|
(60.2) |
|
|
1,855.4 |
|
|
9.5 |
|
|
1,864.9 |
|
Net income (loss) |
|
— |
|
|
— |
|
|
— |
|
|
186.9 |
|
|
— |
|
|
186.9 |
|
|
(3.9) |
|
|
183.0 |
|
Cash dividends declared |
|
— |
|
|
— |
|
|
— |
|
|
(16.8) |
|
|
— |
|
|
(16.8) |
|
|
— |
|
|
(16.8) |
|
Investment by noncontrolling interest |
|
— |
|
|
— |
|
|
— |
|
|
— |
|
|
— |
|
|
— |
|
|
0.5 |
|
|
0.5 |
|
Distribution of noncontrolling interest |
|
— |
|
|
— |
|
|
— |
|
|
— |
|
|
— |
|
|
— |
|
|
(0.2) |
|
|
(0.2) |
|
Amortization of share-based payment awards |
|
— |
|
|
— |
|
|
16.8 |
|
|
— |
|
|
— |
|
|
16.8 |
|
|
— |
|
|
16.8 |
|
Issuance of common stock related to share-based payment awards |
|
0.4 |
|
|
— |
|
|
— |
|
|
— |
|
|
— |
|
|
— |
|
|
— |
|
|
— |
|
Purchases of common stock tendered by employees to satisfy the required withholding taxes related to share-based payment awards |
|
(0.1) |
|
|
— |
|
|
(7.3) |
|
|
— |
|
|
— |
|
|
(7.3) |
|
|
— |
|
|
(7.3) |
|
Purchases of common stock |
|
(1.6) |
|
|
— |
|
|
(70.5) |
|
|
— |
|
|
— |
|
|
(70.5) |
|
|
— |
|
|
(70.5) |
|
Other comprehensive (loss) income |
|
— |
|
|
— |
|
|
— |
|
|
— |
|
|
(53.0) |
|
|
(53.0) |
|
|
4.0 |
|
|
(49.0) |
|
Other |
|
— |
|
|
— |
|
|
(0.1) |
|
|
— |
|
|
— |
|
|
(0.1) |
|
|
0.1 |
|
|
— |
|
Balance as of December 31, 2015 |
|
70.8 |
|
$ |
0.7 |
|
$ |
435.3 |
|
$ |
1,588.6 |
|
$ |
(113.2) |
|
$ |
1,911.4 |
|
$ |
10.0 |
|
$ |
1,921.4 |
The accompanying notes are an integral part of these consolidated financial statements.
46
WORLD FUEL SERVICES CORPORATION AND SUBSIDIARIES
CONSOLIDATED STATEMENTS OF CASH FLOWS
(In millions)
|
|
|
For the Year ended December 31, |
|||||||
|
|
|
2015 |
|
2014 |
|
2013 | |||
|
Cash flows from operating activities: |
|
|
|
|
|
|
|
|
|
|
Net income including noncontrolling interest |
|
$ |
183.0 |
|
$ |
218.4 |
|
$ |
207.2 |
|
Adjustments to reconcile net income including noncontrolling interest to net cash provided by operating activities: |
|
|
|
|
|
|
|
|
|
|
Depreciation and amortization |
|
|
63.4 |
|
|
59.4 |
|
|
44.7 |
|
Provision for bad debt |
|
|
7.5 |
|
|
3.8 |
|
|
11.7 |
|
Gain on the sale of crude oil joint venture interests |
|
|
— |
|
|
(18.1) |
|
|
— |
|
Share-based payment award compensation costs |
|
|
17.0 |
|
|
15.8 |
|
|
16.7 |
|
Deferred income tax (benefit) provision |
|
|
(7.2) |
|
|
10.4 |
|
|
(8.2) |
|
Extinguishment of liabilities |
|
|
(8.2) |
|
|
(5.2) |
|
|
(8.5) |
|
Foreign currency losses, net |
|
|
(5.9) |
|
|
(7.0) |
|
|
0.1 |
|
Other |
|
|
3.2 |
|
|
(5.3) |
|
|
2.0 |
|
Changes in assets and liabilities, net of acquisitions: |
|
|
|
|
|
|
|
|
|
|
Accounts receivable, net |
|
|
483.2 |
|
|
462.5 |
|
|
(328.9) |
|
Inventories |
|
|
81.4 |
|
|
232.3 |
|
|
(77.7) |
|
Prepaid expenses |
|
|
10.8 |
|
|
46.5 |
|
|
30.7 |
|
Short-term derivative assets, net |
|
|
74.7 |
|
|
(265.8) |
|
|
3.5 |
|
Other current assets |
|
|
32.2 |
|
|
(30.2) |
|
|
(22.6) |
|
Cash collateral with financial counterparties |
|
|
133.3 |
|
|
(288.0) |
|
|
9.9 |
|
Other non-current assets |
|
|
(1.9) |
|
|
2.9 |
|
|
(19.6) |
|
Accounts payable |
|
|
(481.5) |
|
|
(585.7) |
|
|
385.4 |
|
Customer deposits |
|
|
(17.5) |
|
|
12.8 |
|
|
13.8 |
|
Accrued expenses and other current liabilities |
|
|
(131.0) |
|
|
266.3 |
|
|
(3.5) |
|
Non-current income tax, net and other long-term liabilities |
|
|
11.0 |
|
|
15.4 |
|
|
7.6 |
|
Total adjustments |
|
|
264.5 |
|
|
(77.2) |
|
|
57.1 |
|
Net cash provided by operating activities |
|
|
447.5 |
|
|
141.2 |
|
|
264.3 |
|
Cash flows from investing activities: |
|
|
|
|
|
|
|
|
|
|
Acquisitions of businesses, net of cash acquired and other investments |
|
|
(96.9) |
|
|
(273.6) |
|
|
(76.9) |
|
Capital expenditures |
|
|
(51.0) |
|
|
(50.2) |
|
|
(82.7) |
|
Proceeds from the sale of fixed assets |
|
|
5.3 |
|
|
— |
|
|
— |
|
Escrow payment related to an assumed obligation of an acquired business |
|
|
— |
|
|
(21.7) |
|
|
— |
|
Proceeds from the sale of crude oil joint venture interests |
|
|
— |
|
|
43.0 |
|
|
— |
|
Purchase of investments |
|
|
(2.4) |
|
|
(2.1) |
|
|
(21.6) |
|
Proceeds from the sale of short-term investments |
|
|
— |
|
|
— |
|
|
21.6 |
|
Issuances of notes receivable |
|
|
— |
|
|
— |
|
|
(8.0) |
|
Repayment of notes receivable |
|
|
0.3 |
|
|
7.5 |
|
|
— |
|
Decrease in cash due to deconsolidation of crude oil transloading joint venture |
|
|
— |
|
|
— |
|
|
(6.9) |
|
Net cash used in investing activities |
|
|
(144.7) |
|
|
(297.1) |
|
|
(174.5) |
|
Cash flows from financing activities: |
|
|
|
|
|
|
|
|
|
|
Borrowings of debt |
|
|
4,831.2 |
|
|
5,757.3 |
|
|
4,556.6 |
|
Repayments of debt |
|
|
(4,752.0) |
|
|
(5,551.5) |
|
|
(4,476.3) |
|
Payments of senior revolving credit facility and senior term loan facility loan costs |
|
|
(3.4) |
|
|
— |
|
|
(3.6) |
|
Dividends paid on common stock |
|
|
(15.3) |
|
|
(10.6) |
|
|
(10.7) |
|
Investment by noncontrolling interest |
|
|
0.5 |
|
|
— |
|
|
17.5 |
|
Distribution of noncontrolling interest |
|
|
(0.3) |
|
|
(11.6) |
|
|
(15.5) |
|
Purchases of common stock |
|
|
(70.5) |
|
|
(10.0) |
|
|
(35.0) |
|
Federal and state tax benefits resulting from tax deductions in excess of the compensation cost recognized for share-based payment awards |
|
|
— |
|
|
1.0 |
|
|
3.3 |
|
Purchases of common stock tendered by employees to satisfy the required withholding taxes related to share-based payment awards |
|
|
(7.3) |
|
|
(5.1) |
|
|
(6.8) |
|
Net cash (used in) provided by financing activities |
|
|
(17.1) |
|
|
169.5 |
|
|
29.5 |
|
Effect of exchange rate changes on cash and cash equivalents |
|
|
(5.5) |
|
|
(3.4) |
|
|
0.1 |
|
Net increase in cash and cash equivalents |
|
|
280.2 |
|
|
10.2 |
|
|
119.4 |
|
Cash and cash equivalents, as of beginning of year |
|
|
302.3 |
|
|
292.1 |
|
|
172.7 |
|
Cash and cash equivalents, as of end of year |
|
$ |
582.5 |
|
$ |
302.3 |
|
$ |
292.1 |
The accompanying notes are an integral part of these consolidated financial statements.
47
WORLD FUEL SERVICES CORPORATION AND SUBSIDIARIES
CONSOLIDATED STATEMENTS OF CASH FLOWS – (CONTINUED)
(In millions)
|
|
|
|
|
|
|
|
|
|
|
|
|
|
For the Year ended December 31, |
|||||||
|
|
|
2015 |
|
2014 |
|
2013 | |||
|
Supplemental Disclosures of Cash Flow Information |
|
|
|
|
|
|
|
|
|
|
Cash paid during the year for: |
|
|
|
|
|
|
|
|
|
|
Interest, net of capitalized interest |
|
$ |
33.1 |
|
$ |
29.1 |
|
$ |
19.1 |
|
Income taxes |
|
$ |
44.0 |
|
$ |
40.8 |
|
$ |
34.6 |
Supplemental Schedule of Noncash Investing and Financing Activities
Cash dividends declared, but not yet paid, were $4.2 and $2.6 million as of December 31, 2015 and December 31, 2014.
We had accrued capital expenditures totaling $0.8 million and $3.4 million as of December 31, 2015 and December 31, 2014, respectively, which were recorded in accounts payable.
In November 2014, we utilized £8.8 million ($13.8 million) of the £13.0 million ($21.7 million) escrow account balance for payment of assumed pension exit obligations. During 2015, we utilized an additional £0.8 million ($1.1 million) of the escrow account balance for payment of assumed pension exit obligations and remitted the remaining escrow account balance to the sellers.
In 2013, due to a change in the operational control of our crude oil transloading joint venture from us to our joint venture partner, we recorded a reduction of $44.2 million and $25.6 million in net assets and noncontrolling interest equity, respectively, and an increase of $25.6 million in other investments. The aforementioned joint venture was subsequently sold in December 2015.
In connection with an equity investment, we recorded a current liability and other investment of £10.0 million ($16.3 million) in 2012 and £2.0 million ($2.8 million) in 2013 related to contingent consideration. The aggregate amount of £12.0 million ($19.1 million) was paid in 2013.
In connection with our acquisitions for the years presented, the following table presents the assets acquired, net of cash and liabilities assumed:
|
|
|
|
|
|
|
|
|
|
|
|
|
|
For the Year ended December 31, |
|||||||
|
|
|
2015 |
|
2014 |
|
2013 | |||
|
Assets acquired, net of cash |
|
$ |
154.3 |
|
$ |
611.0 |
|
$ |
77.1 |
|
Liabilities assumed |
|
$ |
61.8 |
|
$ |
314.8 |
|
$ |
36.8 |
In connection with our acquisitions, we issued promissory notes totaling $0.2 million, $9.0 million and $3.0 million in 2015, 2014 and 2013, respectively.
The accompanying notes are an integral part of these consolidated financial statements.
48
WORLD FUEL SERVICES CORPORATION AND SUBSIDIARIES NOTES TO THE CONSOLIDATED FINANCIAL STATEMENTS
1. Nature of Business, Acquisitions, Significant Accounting Policies and Recent Accounting Pronouncements
World Fuel Services Corporation (the “Company”) was incorporated in Florida in July 1984 and along with its consolidated subsidiaries is referred to collectively in this Annual Report on Form 10‑K (“2015 10‑K Report”) as “World Fuel,” “we,” “our” and “us.”
We are a global fuel logistics, transaction management and payment processing company, which provides energy management solutions to the aviation, marine and land transportation industries. We compete by providing our customers with value‑added benefits, including single‑supplier convenience, competitive pricing, the availability of trade credit, price risk management, logistical support, fuel quality control and fuel procurement outsourcing. We primarily contract with third parties for the delivery and storage of fuel products, however, we also operate storage facilities and transportation assets. We operate in three reportable segments consisting of aviation, marine and land. In our aviation segment, we offer fuel and related products and services to major commercial airlines, second and third tier airlines, cargo carriers, regional and low cost carriers, airports, fixed based operators, corporate fleets, fractional operators, private aircraft, military fleets and to the United States (“U.S.”) and foreign governments as well as intergovernmental organizations. Our marine segment product and service offerings include fuel, lubricants and related products and services to a broad base of customers, including international container and tanker fleets, commercial cruise lines, yachts and time charter operators, offshore rig owners and operators, the U.S. and foreign governments as well as other fuel suppliers. In our land segment, we offer fuel, crude oil, lubricants, natural gas and related products and services to customers including petroleum distributors operating in the land transportation market, retail petroleum operators, and industrial, commercial, residential and government customers.
2015 Acquisitions
On September 1, 2015, we completed the acquisition of all of the outstanding stock of Pester Marketing Company (“Pester”), a leading distributor, transporter, and blender of branded motor fuels and lubricants to wholesale, industrial, commercial and agricultural customers. Pester is headquartered in Denver, Colorado and is also a leading operator of retail convenience stores in the Rocky Mountain region.
In addition to the above acquisition, in 2015 we completed three acquisitions in our land segment and one acquisition in our aviation segment which were not material individually or in the aggregate.
The estimated aggregate purchase price for the 2015 acquisitions was 3 million, and is subject to change based on the final value of the net assets acquired. The following reconciles the estimated aggregate purchase price for the 2015 acquisitions to the cash paid for the acquisitions, net of cash acquired (in millions):
|
Estimated purchase price |
|
$ |
102.3 |
|
Less: Cash acquired |
|
|
8.7 |
|
Estimated purchase price, net of cash acquired |
|
|
93.6 |
|
Less: Amounts due to sellers and promissory notes issued |
|
|
0.5 |
|
Cash paid for acquisition of businesses |
|
$ |
93.1 |
The estimated purchase price of the 2015 acquisitions was allocated to the assets acquired and liabilities assumed based on their estimated fair value as of the acquisition date. Since the valuations of the assets acquired and liabilities assumed in connection with the 2015 acquisitions have not been finalized, the allocation of the purchase price of these acquisitions may change. The estimated purchase price allocation for the 2015 acquisitions is as follows (in millions):
49
|
|
|
|
|
|
Assets acquired: |
|
|
|
|
Cash and cash equivalents |
|
$ |
8.7 |
|
Accounts receivable |
|
|
8.9 |
|
Inventories |
|
|
7.4 |
|
Property and equipment |
|
|
40.7 |
|
Identifiable intangible assets |
|
|
25.9 |
|
Goodwill |
|
|
39.4 |
|
Other current and long-term assets |
|
|
31.1 |
|
Liabilities assumed: |
|
|
|
|
Short-term debt |
|
|
(0.5) |
|
Accounts payable |
|
|
(10.7) |
|
Customer Deposits |
|
|
(1.5) |
|
Accrued expenses and other current liabilities |
|
|
(38.6) |
|
Non-current income tax liabilities and other long term liabilities |
|
|
(8.5) |
|
Estimated purchase price |
|
$ |
102.3 |
In connection with the 2015 acquisitions, we recorded goodwill of $39.4 million of which $1.7 million is anticipated to be deductible for tax purposes. The identifiable intangible assets consisted of $18.1 million of customer relationships, $4.8 million of supplier relationships and $2.1 million of other identifiable intangible assets with weighted average lives of 5.3 years, 6.2 years and 3.4 years, respectively, as well as $0.9 million of indefinite-lived trademark/trade name rights.
The following presents the unaudited pro forma results for 2015 and 2014 as if the 2015 and 2014 acquisitions had been completed on January 1, 2014 (in millions, except per share data):
|
|
|
2015 |
|
2014 | ||
|
|
|
(pro forma) |
|
(pro forma) |
||
|
Revenue |
|
$ |
30,952.0 |
|
$ |
44,432.0 |
|
Net income attributable to World Fuel |
|
$ |
190.6 |
|
$ |
231.1 |
|
|
|
|
|
|
|
|
|
Earnings per common share: |
|
|
|
|
|
|
|
Basic |
|
$ |
2.71 |
|
$ |
3.26 |
|
Diluted |
|
$ |
2.70 |
|
$ |
3.24 |
The financial position, results of operations and cash flows of the 2015 acquisitions have been included in our consolidated financial statements since their respective acquisition dates and did not have a significant impact on our revenue and net income for the 2015.
2014 Acquisitions
On March 7, 2014, we completed the acquisition of all of the outstanding stock of Watson Petroleum Limited (now known as WFL (UK) Limited) (“Watson Petroleum”) a leading distributor of gasoline, diesel, heating oil, lubricants and other products and related services. Watson Petroleum is headquartered in Brinkworth, England and is one of the largest fuel distributors in the United Kingdom. The purchase price of Watson Petroleum was $164.3 million.
On July 29, 2014, we completed the acquisition of all of the outstanding stock of Colt International, L.L.C. (“Colt”) a leading provider of contract fuel and international trip planning services in the general aviation marketplace. Colt is headquartered in Houston, Texas and offers services at more than 3,000 locations. The purchase price of Colt was $72.9 million.
In addition to the above acquisitions, in 2014, we completed two acquisitions in our aviation segment and one acquisition in our marine segment, which were not material individually or in the aggregate.
The financial position, results of operations and cash flows of the 2014 acquisitions have been included in our consolidated financial statements since their respective acquisition dates.
50
The following reconciles the aggregate purchase price for the 2014 acquisitions to the cash paid for the acquisitions, net of cash acquired (in millions):
|
Purchase price |
|
$ |
295.8 |
|
Less: Cash acquired |
|
|
20.2 |
|
Purchase price, net of cash acquired |
|
|
275.6 |
|
Less: Promissory notes issued |
|
|
9.0 |
|
Less: Amounts due to sellers |
|
|
3.4 |
|
Cash paid for acquisition of businesses |
|
$ |
263.2 |
The purchase price for each of the 2014 acquisitions was allocated to the assets acquired and liabilities assumed based on their estimated fair value at the acquisition date. On an aggregate basis, the purchase price allocation for the 2014 acquisitions is as follows (in millions):
|
Assets acquired: |
|
|
|
|
Cash and cash equivalents |
|
$ |
20.2 |
|
Accounts receivable |
|
|
257.9 |
|
Inventories |
|
|
14.4 |
|
Property and equipment |
|
|
55.9 |
|
Identifiable intangible assets |
|
|
83.5 |
|
Goodwill |
|
|
177.8 |
|
Other current and long-term assets |
|
|
22.5 |
|
Liabilities assumed: |
|
|
|
|
Accounts payable |
|
|
(247.6) |
|
Accrued expenses and other current liabilities |
|
|
(50.7) |
|
Other long-term liabilities |
|
|
(18.7) |
|
Initial noncontrolling interest upon acquisition of businesses |
|
|
(19.4) |
|
Estimated purchase price |
|
$ |
295.8 |
In connection with the acquisition of Watson Petroleum, we made a payment of £13.0 million ($21.7 million) to an escrow account related to an estimated assumed pension exit obligation and amounts due to sellers. During 2015, we completed the pension buy-out and the remaining escrow account balance of £3.4 million ($5.1 million) was paid to the sellers. As of December 31, 2015 we had an additional amount due to sellers of £2.1 million ($3.0 million) which is included in accrued expenses and other current liabilities in the accompanying consolidated balance sheets.
For our 2014 acquisitions, we recorded goodwill of $177.8 million, of which $22.4 million is anticipated to be deductible for tax purposes. The aggregate identifiable intangible assets consisted of $55.5 million of customer relationships and $16.5 million of other identifiable intangible assets with weighted average lives of 4.9 years and 5.0 years, respectively, as well as $11.5 million of indefinite-lived trademark/trade name rights.
The following presents the unaudited pro forma results for 2014 and 2013, as if the 2014 acquisitions had been completed on January 1, 2013 (in millions, except per share data):
|
|
|
2014 |
|
2013 | ||
|
|
|
(pro forma) |
|
(pro forma) |
||
|
Revenue |
|
$ |
44,071.8 |
|
$ |
44,098.8 |
|
Net income attributable to World Fuel |
|
$ |
226.6 |
|
$ |
216.4 |
|
|
|
|
|
|
|
|
|
Earnings per common share: |
|
|
|
|
|
|
|
Basic |
|
$ |
3.20 |
|
$ |
3.04 |
|
Diluted |
|
$ |
3.18 |
|
$ |
3.01 |
In the aggregate, the 2014 acquisitions did not have a significant impact on our revenue and net income for 2014.
51
2013 Acquisitions
In 2013, we completed three acquisitions in our land segment, which were not material individually or in the aggregate. The financial position, results of operations and cash flows of the 2013 acquisitions have been included in our consolidated financial statements since their respective acquisition dates.
The following reconciles the aggregate purchase price for the 2013 acquisitions to the cash paid for the acquisitions, net of cash acquired (in millions):
|
The purchase price for each of the 2013 acquisitions was allocated to the assets acquired and liabilities assumed based on their estimate |
|
|
|
|
Purchase price |
|
$ |
43.8 |
|
Less: Cash acquired |
|
|
3.3 |
|
Purchase price, net of cash acquired |
|
|
40.5 |
|
Less: Promissory notes issued |
|
|
3.0 |
|
Cash paid for acquisition of businesses |
|
$ |
37.5 |
During 2014, we completed the valuation of the assets acquired and liabilities assumed for the 2013 acquisitions. As a result, during 2014, we completed the purchase price allocation which primarily resulted in a $0.4 million increase to goodwill and a $0.5 million reduction in identifiable intangible assets. Additionally, in 2014, we paid $0.1 million of the amounts due to sellers that were outstanding as of December 31, 2013.
The purchase price for each of the 2013 acquisitions was allocated to the assets acquired and liabilities assumed based on their estimated fair value at the acquisition date. On an aggregate basis, the purchase price allocation for the 2013 acquisitions is as follows (in millions):
|
Assets acquired: |
|
|
|
|
Cash and cash equivalents |
|
$ |
3.3 |
|
Accounts receivable |
|
|
31.3 |
|
Inventories |
|
|
8.8 |
|
Property and equipment |
|
|
3.9 |
|
Identifiable intangible assets |
|
|
13.5 |
|
Goodwill |
|
|
16.5 |
|
Other current and long-term assets |
|
|
2.7 |
|
Liabilities assumed: |
|
|
|
|
Accounts payable |
|
|
(29.6) |
|
Accrued expenses and other current liabilities |
|
|
(3.5) |
|
Other long-term liabilities |
|
|
(3.1) |
|
Purchase price |
|
$ |
43.8 |
Significant Accounting Policies
Basis of Consolidation
The accompanying consolidated financial statements and related notes include the accounts of our wholly‑owned and majority‑owned subsidiaries and joint ventures where we exercise operational control or have a primary benefit of its profits. All significant intercompany accounts, transactions and profits are eliminated upon consolidation.
Use of Estimates
The preparation of consolidated financial statements in conformity with accounting principles generally accepted in the United States requires us to make certain estimates and assumptions that affect the reported amounts of assets and liabilities, disclosure of contingent assets and liabilities at the date of the financial statements and the reported amounts of revenue and expenses during the reporting period. Accordingly, actual results could materially differ from estimated amounts. We evaluate our estimated assumptions based on historical experience and on various other assumptions that are believed to be reasonable, the results of which form the basis for making judgments about the carrying values of assets and liabilities.
Fair Value of Financial Instruments
The carrying amounts of cash, cash equivalents, accounts receivable, accounts payable and accrued expenses approximate fair value based on the short maturities of these instruments.
52
We measure our cash surrender value of life insurance contracts, derivative contracts and related hedged items at their fair value in accordance with accounting guidance for fair value measurement. We believe the carrying value of our debt approximates fair value since these obligations bear interest at variable rates or fixed rates which are not significantly different than market rates.
The accounting guidance on fair value measurements and disclosures establishes a hierarchy for inputs used in measuring fair value that maximizes the use of observable inputs and minimizes the use of unobservable inputs by requiring that the most observable inputs be used when available. Observable inputs are inputs that market participants would use in pricing the asset or liability developed based on market data obtained from sources independent of us. Unobservable inputs are inputs that reflect our assumptions about the assumptions market participants would use in pricing the asset or liability developed based on the best information available under the circumstances. The hierarchy is broken down into three levels based on the reliability of the inputs as follows:
|
1. |
Level 1 Inputs – Quoted prices (unadjusted) in active markets for identical assets or liabilities that we have the ability to access. |
|
2. |
Level 2 Inputs – Inputs other than quoted prices included within Level 1 that are observable for the asset or liability, either directly or indirectly. We perform annual back‑testing to validate that these inputs represent observable inputs that market participants use in pricing an asset or liability. |
|
3. |
Level 3 Inputs – Inputs that are unobservable for the asset or liability. |
The availability of observable inputs can vary and is affected by a wide variety of factors. To the extent that valuation is based on inputs that are less observable or unobservable in the market, the determination of fair value requires more judgment. Accordingly, the degree of judgment exercised by us in determining fair value is greatest for instruments categorized in Level 3. In certain cases, the inputs used to measure fair value of a specific asset or liability may fall into different levels of the fair value hierarchy. In such cases, for disclosure purposes, the level in the fair value hierarchy within which the fair value measurement in its entirety falls is determined based on the lowest level input that is significant to the fair value measurement in its entirety.
Fair value is a market‑based measure considered from the perspective of a market participant who holds the asset or owes the liability rather than an entity‑specific measure. Therefore, even when market assumptions are not readily available, our own assumptions are set to reflect those that we feel market participants would use in pricing the asset or liability at the measurement date.
Assets and liabilities that are recorded at fair value have been categorized based upon the fair value hierarchy. Our Level 1 items consist of exchange traded futures. Our Level 2 items consist of commodity swaps, commodity collars, non‑designated derivatives in the form of physical forward purchase or sales commitments, hedged inventories and hedged physical forward purchase or sales commitments. Our Level 3 items consist of physical forward purchase or sales commitments, foreign currency forward contracts and the Earn‑out liability. Realized and unrealized gains and losses of our physical forward purchase or sales commitments measured at fair value on a recurring basis that utilized Level 3 inputs are recognized as a component of either revenue or cost of revenue (based on the underlying transaction type). Realized and unrealized gains and losses of our foreign currency forward contracts which were not treated as cash flow hedges, measured at fair value on a recurring basis that utilized Level 3 inputs are recognized as other expense/income. Realized and unrealized gains and losses of our short‑term investments measured at fair value on a recurring basis that utilized Level 3 inputs are recognized as other expense/income.
Derivative instruments can have bid and ask prices that may be observed in the marketplace. Bid prices reflect the highest price that a market participant is willing to pay and ask prices reflect the lowest price that a market participant is willing to accept. Our policy is to consistently apply mid‑ market pricing for valuation of our derivative instruments.
Fair value of derivative commodity contracts and hedged item commitments is derived using forward prices that take into account commodity prices, interest rates, credit risk ratings, option volatility and currency rates. In accordance with the guidance on fair value measurements and disclosures, the impact of our credit risk rating is also considered when measuring the fair value of liabilities. The fair value of derivative instruments may be based on a combination of valuation inputs that are on different hierarchy levels. The fair value disclosures are determined based on the lowest level input that is significant to the fair value measurement in its entirety. The nature of inputs that are considered Level 3 are model inputs. Commodity contracts categorized in Level 3 are due to the significance of the unobservable model inputs to their respective fair values. The unobservable model inputs, such as basis differentials, are based on the difference between the historical prices of our prior transactions and the underlying observable data as well as certain risks related to non-performance. The effect on our income before income taxes of a 10% change in the model input for non-performance risk would not be significant. Fair
53
value of hedged item inventories is derived using spot commodity prices and basis differentials. Fair value of foreign currency contracts is derived using forward prices that take into account interest rates, credit risk ratings and currency rates. Factors that could warrant a Level 2 input to move to a Level 3 input may include lack of observable market data because of a decrease in market activity, a degradation of a short‑term investment which requires us to value the investment based on a Level 3 input, or a change in significance of a Level 3 input to the fair value measurement in its entirety. Our policy is to recognize transfers between Level 1, 2 or 3 as of the beginning of the reporting period in which the event or change in circumstances caused the transfer to occur.
There were no significant changes to our valuation techniques during 2015 and 2014.
Cash and Cash Equivalents
Our cash equivalents consist principally of overnight investments, bank money market accounts and bank time deposits which have an original maturity date of less than 90 days. These securities are carried at cost, which approximates market value.
Accounts Receivable and Allowance for Bad Debt
Credit extension, monitoring and collection are performed for each of our business segments. Each segment has a credit committee that is responsible for approving credit limits above certain amounts, setting and maintaining credit standards, and managing the overall quality of the credit portfolio. We perform ongoing credit evaluations of our customers and adjust credit limits based upon payment history and the customer’s current creditworthiness, as determined by our review of our customer’s credit information. We extend credit on an unsecured basis to most of our customers. Accounts receivable are deemed past due based on contractual terms agreed to with our customers.
We continuously monitor collections and payments from our customers and maintain a provision for estimated credit losses based upon our historical experience with our customers, current market and industry conditions affecting our customers and any specific customer collection issues that we have identified. Historical payment trends may not be a useful indicator of current or future credit worthiness of our customers, particularly in these difficult economic and financial markets. Accounts receivable are reduced by an allowance for bad debt.
Inventories
Inventories are valued using the average cost methodology and are stated at the lower of average cost or market. Components of inventory include fuel purchase costs, the related transportation costs and changes in the estimated fair market values for inventories included in a fair value hedge relationship.
Derivatives
We enter into financial derivative contracts in order to mitigate the risk of market price fluctuations in aviation, marine and land fuel, to offer our customers fuel pricing alternatives to meet their needs and to mitigate the risk of fluctuations in foreign currency exchange rates. We also enter into proprietary derivative transactions, primarily intended to capitalize on arbitrage opportunities related to basis or time spreads related to fuel products we sell. We have applied the normal purchase and normal sales exception (“NPNS”), as provided by accounting guidance for derivative instruments and hedging activities, to certain of our physical forward sales and purchase contracts. While these contracts are considered derivative instruments under the guidance for derivative instruments and hedging activities, they are not recorded at fair value, but rather are recorded in our consolidated financial statements when physical settlement of the contracts occurs. If it is determined that a transaction designated as NPNS no longer meets the scope of the exception, the fair value of the related contract is recorded as an asset or liability on the consolidated balance sheets and the difference between the fair value and the contract amount is immediately recognized through earnings.
Our derivatives that are subject to the accounting guidance for derivative instruments are recognized at their estimated fair market value in accordance with the accounting guidance for fair value measurements. If the derivative does not qualify as a hedge or is not designated as a hedge, changes in the estimated fair market value of the derivative are recognized as a component of revenue, cost of revenue or other income (expense), net (based on the underlying transaction type) in the consolidated statements of income and comprehensive income. Derivatives which qualify for hedge accounting may be designated as either a fair value or cash flow hedge. For our fair value hedges, changes in the estimated fair market value of the hedge instrument and the hedged item are recognized in the same line item as a component of either revenue or cost of revenue (based on the underlying transaction type) in the consolidated statements of income and comprehensive income. For our cash flow hedges, the effective portion of the changes in the fair market value of the hedge is recognized as a component of other comprehensive income in the shareholders’ equity section of the consolidated balance sheets and subsequently reclassified into the same line item as the forecasted transaction when both are settled, while the ineffective portion of the changes in the estimated fair market value of the hedge is recognized as a component of other income (expense), net in the consolidated statements of income and comprehensive income. Cash flows for our hedging instruments used in our hedges are classified in the same category as the cash flow from the hedged items. If for any reason
54
hedge accounting is discontinued, then any cash flows subsequent to the date of discontinuance shall be classified in a manner consistent with the nature of the instrument.
To qualify for hedge accounting, as either a fair value or cash flow hedge, the hedging relationship between the hedging instruments and hedged items must be highly effective over an extended period of time in achieving the offset of changes in fair values or cash flows attributable to the hedged risk at the inception of the hedge. We use a regression analysis based on historical spot prices in assessing the qualification for our fair value hedges. However, our measurement of hedge ineffectiveness for our fair value inventory hedges utilizes spot prices for the hedged item (inventory) and forward or future prices for the hedge instrument. Therefore, the excluded component (forward or future prices) in assessing hedge qualification, along with ineffectiveness, is included as a component of cost of revenue in earnings. Adjustments to the carrying amounts of hedged items are discontinued in instances where the related fair value hedging instrument becomes ineffective and any previously recorded fair market value changes are not adjusted until the fuel is sold.
For more information on our derivatives, see Note 3.
Property and Equipment
Property and equipment are carried at cost less accumulated depreciation and amortization. Depreciation and amortization are calculated using the straight‑line method over the estimated useful lives of the assets. Costs of major additions and improvements are capitalized while expenditures for maintenance and repairs, which do not extend the life of the asset, are expensed. Upon sale or disposition of property and equipment, the cost and related accumulated depreciation and amortization are eliminated from the accounts and any resulting gain or loss is credited or charged to income. Long‑lived assets held and used by us are reviewed based on market factors and operational considerations for impairment whenever events or changes in circumstances indicate that the carrying amount of an asset may not be recoverable.
Purchases of computer software are capitalized. External costs and certain internal costs (including payroll and payroll‑related costs of employees) directly associated with developing significant computer software applications for internal use are capitalized. Training and data conversion costs are expensed as incurred. Computer software costs are amortized using the straight‑line method over the estimated useful life of the software.
Goodwill and Identifiable Intangible Assets
Goodwill arises because the purchase price paid reflects numerous factors, including the strategic fit and expected synergies these acquisitions bring to our existing operations. Goodwill is recorded at fair value and is reviewed at least annually at year-end (or more frequently under certain circumstances) for impairment.
Goodwill is evaluated for impairment based on an assessment of qualitative factors to determine whether it is more likely than not that the fair value of any individual reporting unit is less than its carrying amount (Step 0). If we determine that it is more likely than not that the fair value of a reporting unit is greater than its carrying value, then no further testing is required. Otherwise, we would perform the two-step impairment analysis.
Step 1 requires us to compare the fair value of the reporting units to which goodwill was assigned to their respective carrying values. In calculating fair value, we use the income approach as our primary indicator of fair value. If the fair value exceeds the carrying value, no further work is required and no impairment loss is recognized. If the carrying value exceeds the fair value, the goodwill of the reporting unit is potentially impaired and the Company would then complete step 2 in order to measure the impairment loss.
In connection with our acquisitions, we record identifiable intangible assets at fair value. Identifiable intangible assets subject to amortization are amortized over their estimated useful lives and are reviewed for impairment whenever events or changes in circumstances indicate that the carrying amount of an asset may not be recoverable. We assess identifiable intangible assets not subject to amortization at least annually for potential impairment.
Other Investments
Our other investments consist primarily of equity investments, net of basis adjustments. These investments are accounted for under the equity method as we own less than 50 percent of the entities and exercise significant influence over the investee, but do not have operational or financial control. As of December 31, 2015 and 2014, we had other investments of $71.1 million and $69.5 million, respectively, which are included within identifiable intangible and other non‑current assets.
Extinguishment of Liabilities
In the normal course of business, we accrue liabilities for fuel and services received for which invoices have not yet been received. These liabilities are derecognized, or extinguished, if either (i) payment is made to relieve our obligation for the
55
liability or (ii) we are legally released from our obligation for the liability, such as when our legal obligations with respect to such liabilities lapse or otherwise no longer exist. We derecognized vendor liability accruals due to the legal release of our obligations in the amount of $8.2 million, $5.2 million and $8.5 million during 2015, 2014 and 2013, respectively, which is reflected as a reduction of cost of revenue in the accompanying consolidated statements of income and comprehensive income.
Revenue Recognition
Revenue from the sale of fuel is recognized when the sales price is fixed or determinable, collectability is reasonably assured and title passes to the customer, which is when the delivery of fuel is made to our customer directly from us, the supplier or a third‑party subcontractor. Our fuel sales are generated as a fuel reseller as well as from on‑hand inventory supply. When acting as a fuel reseller, we generally purchase fuel from the supplier, and contemporaneously resell the fuel to the customer, normally taking delivery for purchased fuel at the same place and time as the delivery is made to the customer. We record the gross sale of the fuel as we generally take inventory risk, have latitude in establishing the sales price, have discretion in the supplier selection, maintain credit risk and are the primary obligor in the sales arrangement.
Revenue from fuel‑related services is recognized when services are performed, the sales price is fixed or determinable and collectability is reasonably assured. We record the sale of fuel‑related services on a gross basis as we generally have latitude in establishing the sales price, have discretion in supplier selection, maintain credit risk and are the primary obligor in the sales arrangement.
Commission from fuel broker services is recognized when services are performed and collectability is reasonably assured. When acting as a fuel broker, we are paid a commission by the supplier.
Revenue from card payment and processing transactions is recognized at the time the purchase is made by the customer using the charge card. Revenue from charge card transactions is generated from processing fees.
Vendor and Customer Rebates and Branding Allowances
We receive vendor rebates and branding allowances from a number of our fuel suppliers. Typically, a portion of the rebates and allowances is passed on to our customers under the same terms as required by our fuel suppliers. Generally, volume rebates are received from vendors under structured programs based on the level of fuel purchased or sold as specified in the applicable vendor agreements. Many of the vendor agreements require repayment of all or a portion of the amount received if we (or our customers, typically branded dealers) elect to discontinue selling the specified brand of fuel at certain locations. As of December 31, 2015, the estimated amount of fuel rebates and branding allowances that would have to be repaid upon de‑branding at these locations, net of the amount due to us from the branded dealers under similar agreements between us and such dealers were not significant. No liability is recorded for the amount of obligations which would become payable upon de‑branding.
Some of these vendor rebate and branding allowance arrangements require that we make assumptions and judgments regarding, for example, the likelihood of attaining specified levels of purchases or selling specified volume of products. We routinely review the relevant, significant factors and make adjustments when the facts and circumstances dictate that an adjustment is warranted.
Vendor volume rebates are recognized as a reduction of cost of revenue in the period earned when realization is probable and estimatable and when certain other conditions are met. The rebates passed on to our customers are recognized as a reduction of revenue in the period earned in accordance with the applicable customer agreements. The rebate terms of the customer agreements are generally similar to those of the vendor agreements. We also receive branding allowances from fuel suppliers to defray the costs of branding and enhancing certain of our customer locations. The branding allowances received are recorded as a reduction of cost of revenue. The amounts recorded as a reduction of revenue related to volume rebates and branding allowance arrangements paid to our customers and the amounts recorded as a reduction to cost of revenue related to volume rebates received from vendors were not significant during each of the years presented on the consolidated statements of income and comprehensive income.
Share‑Based Payment Awards
We account for share‑based payment awards on a fair value basis. Under fair value accounting, the grant‑date fair value of the share‑based payment award is amortized as compensation expense, on a straight‑line basis, over the vesting period for both graded and cliff vesting awards. Annual compensation expense for share‑based payment awards is reduced by an expected forfeiture amount on outstanding share‑based payment awards.
The estimated fair value of stock awards, such as restricted stock and restricted stock units (“RSUs”) is based on the grant‑date market value of our common stock, as defined in the respective plans under which the awards were granted. To
56
determine the estimated fair value of stock‑settled stock appreciation rights (“SSAR Awards”), we use the Black‑Scholes option pricing model. The estimation of the fair value of SSAR Awards on the date of grant using an option‑pricing model is affected by our stock price as well as assumptions regarding a number of complex and subjective variables. These variables include our expected stock price volatility over the term of the awards, actual and projected employee stock option exercise behaviors, risk‑ free interest rates and expected dividends. The expected term of SSAR Awards represents the estimated period of time from grant until exercise or conversion and is based on vesting schedules and expected post‑vesting, exercise and employment termination behavior. Expected volatility is based on the historical volatility of our common stock over the period that is equivalent to the award’s expected life. Any adjustment to the historical volatility as an indicator of future volatility would be based on the impact to historical volatility of significant non‑recurring events that would not be expected in the future. Risk‑free interest rates are based on the U.S. Treasury yield curve at the time of grant for the period that is equivalent to the award’s expected life. Dividend yields are based on the historical dividends of World Fuel over the period that is equivalent to the award’s expected life, as adjusted for stock splits.
Cash flows from income tax benefits resulting from income tax deductions in excess of the compensation cost recognized for share‑based payment awards (excess income tax benefits) are classified as financing cash flows. These excess income tax benefits are credited to capital in excess of par value.
Foreign Currency
The functional currency of our U.S. and foreign subsidiaries is the U.S. dollar, except for certain subsidiaries which utilize their respective local currency as their functional currency. Foreign currency transaction gains and losses are recognized upon settlement of foreign currency transactions. In addition, for unsettled foreign currency transactions, foreign currency translation gains and losses are recognized for changes between the transaction exchange rates and month‑end exchange rates. Foreign currency transaction gains and losses are included in other income (expense), net, in the accompanying consolidated statements of income and comprehensive income in the period incurred. We recorded net foreign currency transaction losses of $1.9 million, $1.0 million and $2.8 million in 2015, 2014 and 2013, respectively.
Revenues and expenses of the subsidiaries that have a functional currency other than the U.S. dollar have been translated into U.S. dollars at average exchange rates prevailing during the period. The assets and liabilities of these subsidiaries have been translated at the rates of exchange on the balance sheet dates. The resulting translation gain and loss adjustments are recorded in accumulated other comprehensive income as a separate component of shareholders’ equity. We recorded in accumulated other comprehensive income net foreign currency translation adjustment losses of $49.6 million (net of $4.0 million of net foreign currency translation adjustment losses attributable to non-controlling interest), $30.9 million and $13.2 million in 2015, 2014 and 2013, respectively. Cumulative foreign currency translation adjustments included in accumulated other comprehensive income amounted to net losses of $113.8 million, $60.2 million and $29.3 million as of December 31, 2015, 2014 and 2013, respectively.
Income Taxes
Income taxes are accounted for under the asset and liability method. Under this method, deferred tax assets and liabilities are recognized for the future tax consequences attributable to differences between the financial statement carrying amounts of existing assets and liabilities and their respective tax bases, and operating loss and income tax credit carryforwards. Deferred tax assets and liabilities are measured using enacted income tax rates expected to apply to taxable income in the years in which those temporary differences are expected to be recovered or settled. The effect on deferred tax assets and liabilities of a change in income tax rates is recognized in the income tax provision in the period that includes the enactment date.
We must assess the likelihood that our deferred tax assets will be recovered from our future taxable income, and to the extent we believe that recovery is not likely, we must establish a valuation allowance against those deferred tax assets. Deferred tax liabilities generally represent items for which we have already taken a deduction in our income tax return, but we have not yet recognized the items as expenses in our results of operations.
Significant judgment is required in evaluating our tax positions, and in determining our provisions for income taxes, our deferred tax assets and liabilities and any valuation allowance recorded against our net deferred tax assets. We establish reserves when, despite our belief that the income tax return positions are fully supportable, certain positions are likely to be challenged and we may ultimately not prevail in defending those positions.
U.S. income taxes have not been recognized on undistributed earnings of foreign subsidiaries. Our intention is to reinvest these earnings permanently in active non‑U.S. business operations. Therefore, no income tax liability has been accrued for these earnings. Because of the availability of U.S. foreign tax credits, it is not practicable to determine the amount of U.S. income tax payable if such earnings are not reinvested indefinitely.
57
Earnings per Common Share
Basic earnings per common share is computed by dividing net income attributable to World Fuel and available to common shareholders by the sum of the weighted average number of shares of common stock, stock units, restricted stock entitled to dividends not subject to forfeiture and vested RSUs outstanding during the period. Diluted earnings per common share is computed by dividing net income attributable to World Fuel and available to common shareholders by the sum of the weighted average number of shares of common stock, stock units, restricted stock entitled to dividends not subject to forfeiture and vested RSUs outstanding during the period and the number of additional shares of common stock that would have been outstanding if our outstanding potentially dilutive securities had been issued. Potentially dilutive securities include restricted stock subject to forfeitable dividends, non‑vested RSUs and SSAR Awards. The dilutive effect of potentially dilutive securities is reflected in diluted earnings per common share by application of the treasury stock method. Under the treasury stock method, an increase in the fair market value of our common stock can result in a greater dilutive effect from potentially dilutive securities.
The following table sets forth the computation of basic and diluted earnings per common share for the periods presented (in millions, except per share amounts):
|
|
|
|
|
|
|
|
|
|
|
|
|
|
2015 |
|
2014 |
|
2013 | |||
|
Numerator: |
|
|
|
|
|
|
|
|
|
|
Net income attributable to World Fuel |
|
$ |
186.9 |
|
$ |
221.7 |
|
$ |
203.1 |
|
Denominator: |
|
|
|
|
|
|
|
|
|
|
Weighted average common shares for basic earnings per common share |
|
|
70.2 |
|
|
70.8 |
|
|
71.2 |
|
Effect of dilutive securities |
|
|
0.5 |
|
|
0.5 |
|
|
0.6 |
|
Weighted average common shares for diluted earnings per common share |
|
|
70.7 |
|
|
71.3 |
|
|
71.8 |
|
Weighted average securities which are not included in the calculation of diluted earnings per common share because their impact is anti-dilutive or their performance conditions have not been met |
|
|
1.0 |
|
|
0.9 |
|
|
0.6 |
|
Basic earnings per common share |
|
$ |
2.66 |
|
$ |
3.13 |
|
$ |
2.85 |
|
Diluted earnings per common share |
|
$ |
2.64 |
|
$ |
3.11 |
|
$ |
2.83 |
Recent Accounting Pronouncements
Financial Instruments – Overall: Recognition and Measurement of Financial Assets and Financial Liabilities. In January 2016, the Financial Accounting Standards Board (“FASB”) issued an Accounting Standards Update (“ASU”) to address certain aspects of recognition, measurement, presentation, and disclosure of financial instruments. The ASU supersedes the guidance to classify equity securities with readily determinable fair values into different categories, and requires equity securities (except those that are accounted for under the equity method or those that result in consolidation of the investee) to be measured at fair value with changes in the fair value recognized through net income. It also simplifies the impairment assessment of equity investments without readily determinable fair values by requiring assessment for impairment qualitatively at each reporting period. This update is effective at the beginning of our 2018 fiscal year. We are currently evaluating whether the adoption of this new guidance will have a significant impact on our consolidated financial statements and disclosures.
Income Taxes: Balance Sheet Classification of Deferred Taxes. In November 2015, the FASB issued an ASU that changes how deferred taxes are classified on organizations’ balance sheets. The ASU eliminates the current requirement for organizations to present deferred tax liabilities and assets as current and noncurrent in a classified balance sheet. Instead, organizations will be required to classify all deferred tax assets and liabilities as noncurrent. The adoption of this ASU (pursuant to early adoption provisions) resulted in our deferred tax assets and liabilities being presented as non-current as of December 31, 2015. The guidance has been applied prospectively; therefore, the accompanying consolidated balance sheet as of December 31, 2014 was not adjusted.
Business Combinations: Simplifying the Accounting for Measurement – Period Adjustments. In September 2015, FASB issued an ASU, to simplify the accounting for adjustments made to provisional amounts recognized in a business combination; the amendments eliminate the requirement to retrospectively account for those adjustments. The ASU will require that an acquirer recognize adjustments to provisional amounts that are identified during the measurement period in the reporting period in which the adjustment amounts are determined. It also requires that the acquirer record, in the same period’s financial statements, the effect on earnings of changes in depreciation, amortization, or other income effects, if any, as a result of the change to the provisional amounts, calculated as if the accounting had been completed at the acquisition date. This update is effective at the beginning of our 2016 fiscal year. We do not believe the adoption of this new guidance will have a significant impact on our consolidated financial statements and disclosures.
58
Inventory: Simplifying the Measurement of Inventory. In July 2015, the FASB issued an ASU which simplifies the guidance on the subsequent measurement of inventory by requiring inventory within the scope of this update to be measured at the lower of cost or net realizable value rather than the lower of cost or market. This update is effective at the beginning of our 2017 fiscal year. We are currently evaluating whether the adoption of this new guidance will have a significant impact on our consolidated financial statements and disclosures.
Interest—Imputation of Interest: Simplifying the Presentation of Debt Issuance Costs. In April 2015, the FASB issued an ASU which requires that debt issuance costs related to a recognized debt liability be presented in the balance sheet as a direct deduction from the carrying amount of that debt liability, consistent with debt discounts. The recognition and measurement guidance for debt issuance costs are not affected by the amendments in this ASU. This update is effective at the beginning of our 2016 fiscal year. We do not believe the adoption of this new guidance will have a significant impact on our consolidated financial statements and disclosures.
Consolidation: Amendments to the Consolidation Analysis. In February 2015, the FASB issued an ASU which is intended to improve targeted areas of consolidation guidance for legal entities such as limited partnerships, limited liability corporations, and securitization structures. This update is effective at the beginning of our 2016 fiscal year. We do not believe the adoption of this new guidance will have a significant impact on our consolidated financial statements and disclosures.
Income Statement-Extraordinary and Unusual Items: Simplifying Income Statement Presentation by Eliminating the Concept of Extraordinary Items. In January 2015, the FASB issued an ASU which eliminates from generally accepted accounting principles in the United States the concept of extraordinary items. This update is effective at the beginning of our 2016 fiscal year. We do not believe the adoption of this new guidance will have a significant impact on our consolidated financial statements and disclosures.
Derivatives and Hedging: Determining Whether the Host Contract in a Hybrid Financial Instrument Issued in the Form of a Share Is More Akin to Debt or to Equity. In November 2014, the FASB issued an ASU which clarifies how current generally accepted accounting principles in the United States should be interpreted in evaluating the economic characteristics and risks of a host contract in a hybrid financial instrument that is issued in the form of a share. This update is effective at the beginning of our 2016 fiscal year. We do not believe the adoption of this new guidance will have a significant impact on our consolidated financial statements and disclosures.
Presentation of Financial Statements-Going Concern: Disclosure of Uncertainties about an Entity’s Ability to Continue as a Going Concern. In August 2014, the FASB issued an ASU which requires management of the Company to evaluate whether there is substantial doubt about the Company’s ability to continue as a going concern. This update is effective at the beginning of our 2017 fiscal year. We do not believe the adoption of this new guidance will have an impact on our financial statement disclosures.
Compensation-Stock Compensation. Accounting for Share-Based Payments When the Terms of an Award Provide That a Performance Target Could Be Achieved after the Requisite Service Period. In June 2014, the FASB issued an ASU which includes guidance that requires a performance target that affects vesting and that could be achieved after the requisite service period to be treated as a performance condition. This update is effective at the beginning of our 2016 fiscal year. We do not believe the adoption of this new guidance will have a significant impact on our consolidated financial statements and disclosures.
Transfers and Servicing: Repurchase-to-Maturity Transactions, Repurchase Financings, and Disclosures. In June 2014, the FASB issued an ASU which changes the accounting for repurchase-to-maturity transactions and repurchase financing arrangements. It also requires additional disclosures about repurchase agreements and other similar transactions. This update became effective at the beginning of our 2015 fiscal year. The adoption of this ASU did not have a significant impact on our consolidated financial statements and disclosures.
Revenue from Contracts with Customers. In May 2014, the FASB issued an ASU which provides guidance for revenue recognition for any entity that either enters into contracts with customers to transfer goods or services or enters into contracts for the transfer of non-financial assets. The ASU will replace most existing revenue recognition guidance in generally accepted accounting principles in the United States when it becomes effective. This update is effective at the beginning of our 2018 fiscal year. We are currently evaluating whether the adoption of this new guidance will have a significant impact on our consolidated financial statements and disclosures.
59
Presentation of Financial Statements and Property, Plant, and Equipment: Reporting Discontinued Operations and Disclosures of Disposals of Components of an Entity. In April 2014, the FASB issued an ASU which changes the criteria for reporting discontinued operations and enhances disclosures in this area. It also addresses sources of confusion and inconsistent application related to financial reporting of discontinued operations guidance. This update became effective at the beginning of our 2015 fiscal year. The adoption of this ASU did not have a significant impact on our consolidated financial statements and disclosures.
2. Accounts Receivable
We had accounts receivable of $1.8 billion and $2.3 billion, net of an allowance for bad debt of $25.0 million and $25.7 million, as of December 31, 2015 and 2014, respectively. Accounts receivable are written‑off when it becomes apparent based upon age or customer circumstances that such amounts will not be collected.
The following table sets forth activities in our allowance for bad debt (in millions):
|
|
|
2015 |
|
2014 |
|
2013 | |||
|
Balance as of beginning of period |
|
$ |
25.7 |
|
$ |
29.1 |
|
$ |
23.7 |
|
Charges to provision for bad debt |
|
|
7.5 |
|
|
3.8 |
|
|
11.7 |
|
Write-off of uncollectible accounts receivable |
|
|
(8.3) |
|
|
(8.0) |
|
|
(6.9) |
|
Recoveries of bad debt |
|
|
0.5 |
|
|
0.8 |
|
|
0.6 |
|
Translation Adjustments |
|
|
(0.4) |
|
|
— |
|
|
— |
|
Balance as of end of period |
|
$ |
25.0 |
|
$ |
25.7 |
|
$ |
29.1 |
Included in accounts receivable is a retained beneficial interest related to accounts receivable sold under our receivables purchase agreements. The retained beneficial interest was not significant as of December 31, 2015 and 2014.
3. Derivatives
The following describes our derivative classifications:
Cash Flow Hedges. Includes certain commodity contracts we enter into to mitigate the risk of price volatility in forecasted purchases and sales.
Fair Value Hedges. Includes derivatives we enter into in order to hedge price risk associated with our inventory and certain firm commitments relating to fixed price purchase and sale contracts.
Non-designated Derivatives. Includes derivatives we primarily enter into in order to mitigate the risk of market price fluctuations in aviation, marine and land fuel in the form of swaps or futures as well as certain fixed price purchase and sale contracts and proprietary trading. In addition, non-designated derivatives are entered into to hedge the risk of currency rate fluctuations.
For additional information on our derivatives accounting policy, see Note 1.
60
As of December 31, 2015, our derivative instruments, at their respective fair value positions were as follows (in millions, except weighted average fixed price and weighted average mark‑to‑market amount):
|
|
|
|
|
|
|
|
|
|
|
|
|
|
|
Weighted |
|
|
|
|
|
|
|
|
|
|
|
|
|
|
|
Weighted |
|
|
Average |
|
|
|
|
|
|
|
|
|
|
|
|
|
|
|
Average |
|
|
Mark-to- |
|
|
Fair |
|
|
|
Settlement |
|
|
|
|
|
|
|
|
Fixed |
|
|
Market |
|
|
Value |
|
Hedge Strategy |
|
Period |
|
Derivative Instrument |
|
Notional |
|
Unit |
|
|
Price |
|
|
Amount |
|
|
Amount |
|
Fair Value Hedge |
|
2016 |
|
Commodity contracts for inventory hedging |
|
2.8 |
|
BBL |
|
$ |
54.104 |
|
$ |
4.929 |
|
$ |
13.8 |
|
|
|
2017 |
|
Commodity contracts for inventory hedging |
|
0.1 |
|
BBL |
|
|
57.576 |
|
|
5.000 |
|
|
0.5 |
|
|
|
|
|
|
|
|
|
|
|
|
|
|
|
|
|
$ |
14.3 |
|
|
|
|
|
|
|
|
|
|
|
|
|
|
|
|
|
|
|
|
Cash Flow Hedge |
|
2016 |
|
Commodity contracts for inventory hedging |
|
9.8 |
|
BBL |
|
|
66.947 |
|
|
0.847 |
|
|
8.3 |
|
|
|
2017 |
|
Commodity contracts for inventory hedging |
|
0.8 |
|
BBL |
|
|
66.784 |
|
|
8.625 |
|
|
6.9 |
|
|
|
|
|
|
|
|
|
|
|
|
|
|
|
|
|
$ |
15.2 |
|
|
|
|
|
|
|
|
|
|
|
|
|
|
|
|
|
|
|
|
Non-Designated |
|
2016 |
|
Commodity contracts (long) |
|
50.9 |
|
BBL |
|
|
45.030 |
|
|
(15.935) |
|
|
(811.1) |
|
|
|
2016 |
|
Commodity contracts (short) |
|
41.8 |
|
BBL |
|
|
54.410 |
|
|
19.770 |
|
|
826.4 |
|
|
|
2017 |
|
Commodity contracts (long) |
|
3.1 |
|
BBL |
|
|
25.400 |
|
|
(2.452) |
|
|
(7.6) |
|
|
|
2017 |
|
Commodity contracts (short) |
|
2.3 |
|
BBL |
|
|
26.810 |
|
|
3.348 |
|
|
7.7 |
|
|
|
2018 |
|
Commodity contracts (long) |
|
0.7 |
|
BBL |
|
|
10.000 |
|
|
2.857 |
|
|
2.0 |
|
|
|
2018 |
|
Commodity contracts (short) |
|
0.5 |
|
BBL |
|
|
11.280 |
|
|
(1.200) |
|
|
(0.6) |
|
|
|
2020 |
|
Commodity contracts (long) |
|
0.1 |
|
BBL |
|
|
21.750 |
|
|
(1.000) |
|
|
(0.1) |
|
|
|
2020 |
|
Commodity contracts (short) |
|
0.1 |
|
BBL |
|
|
18.840 |
|
|
6.000 |
|
|
0.6 |
|
|
|
2016 |
|
Foreign currency contracts |
|
6.5 |
|
AUD |
|
|
0.717 |
|
|
(0.031) |
|
|
(0.2) |
|
|
|
2016 |
|
Foreign currency contracts |
|
4.3 |
|
BRL |
|
|
3.881 |
|
|
— |
|
|
— |
|
|
|
2016 |
|
Foreign currency contracts |
|
82.8 |
|
CAD |
|
|
1.335 |
|
|
0.025 |
|
|
2.1 |
|
|
|
2016 |
|
Foreign currency contracts |
|
0.3 |
|
CHF |
|
|
0.964 |
|
|
— |
|
|
— |
|
|
|
2016 |
|
Foreign currency contracts |
|
4,199.0 |
|
CLP |
|
|
702.379 |
|
|
— |
|
|
— |
|
|
|
2016 |
|
Foreign currency contracts |
|
52,263.5 |
|
COP |
|
|
3,064.704 |
|
|
— |
|
|
0.1 |
|
|
|
2016 |
|
Foreign currency contracts |
|
73.8 |
|
DKK |
|
|
6.854 |
|
|
(0.003) |
|
|
(0.2) |
|
|
|
2016 |
|
Foreign currency contracts |
|
45.7 |
|
EUR |
|
|
1.099 |
|
|
0.033 |
|
|
1.5 |
|
|
|
2016 |
|
Foreign currency contracts |
|
124.7 |
|
GBP |
|
|
1.530 |
|
|
0.023 |
|
|
2.9 |
|
|
|
2016 |
|
Foreign currency contracts |
|
111.4 |
|
INR |
|
|
66.366 |
|
|
— |
|
|
— |
|
|
|
2016 |
|
Foreign currency contracts |
|
546.3 |
|
JPY |
|
|
120.938 |
|
|
— |
|
|
— |
|
|
|
2016 |
|
Foreign currency contracts |
|
1,794.6 |
|
MXN |
|
|
16.803 |
|
|
— |
|
|
(0.1) |
|
|
|
2016 |
|
Foreign currency contracts |
|
47.3 |
|
NOK |
|
|
8.474 |
|
|
0.004 |
|
|
0.2 |
|
|
|
2016 |
|
Foreign currency contracts |
|
12.6 |
|
PLN |
|
|
3.892 |
|
|
0.008 |
|
|
0.1 |
|
|
|
2016 |
|
Foreign currency contracts |
|
42.9 |
|
RON |
|
|
4.083 |
|
|
0.014 |
|
|
0.6 |
|
|
|
2016 |
|
Foreign currency contracts |
|
45.6 |
|
SEK |
|
|
8.343 |
|
|
(0.002) |
|
|
(0.1) |
|
|
|
2016 |
|
Foreign currency contracts |
|
23.8 |
|
SGD |
|
|
1.411 |
|
|
(0.004) |
|
|
(0.1) |
|
|
|
2016 |
|
Foreign currency contracts |
|
109.3 |
|
ZAR |
|
|
14.245 |
|
|
0.001 |
|
|
0.1 |
|
|
|
2017 |
|
Foreign currency contracts |
|
1.8 |
|
EUR |
|
|
1.083 |
|
|
— |
|
|
— |
|
|
|
2017 |
|
Foreign currency contracts |
|
8.0 |
|
GBP |
|
|
1.553 |
|
|
0.063 |
|
|
0.5 |
|
|
|
2017 |
|
Foreign currency contracts |
|
1.7 |
|
EUR |
|
|
1.105 |
|
|
— |
|
|
— |
|
|
|
|
|
|
|
|
|
|
|
|
|
|
|
|
|
$ |
24.7 |
|
|
|
|
|
|
|
|
|
|
|
|
|
|
|
|
|
|
|
61
The following table presents information about our derivative instruments measured at fair value at their gross amounts and their locations on the consolidated balance sheets (in millions):
|
|
|
|
|
As of December 31, |
||||
|
|
|
Balance Sheet Location |
|
2015 |
|
2014 | ||
|
Derivative assets: |
|
|
|
|
|
|
|
|
|
Derivatives designated as hedging instruments |
|
|
|
|
|
|
||
|
Commodity contracts |
|
Short-term derivative assets, net |
|
$ |
114.0 |
|
$ |
18.8 |
|
Commodity contracts |
|
Long-term derivative assets, net |
|
|
7.4 |
|
|
— |
|
Commodity contracts |
|
Accrued expenses and other current liabilities |
|
|
6.3 |
|
|
4.7 |
|
|
|
|
|
|
127.7 |
|
|
23.5 |
|
Derivatives not designated as hedging instruments |
|
|
|
|
|
|
||
|
Commodity contracts |
|
Short-term derivative assets, net |
|
|
241.4 |
|
|
399.0 |
|
Commodity contracts |
|
Identifiable intangible and other non-current assets |
|
|
17.0 |
|
|
12.1 |
|
Commodity contracts |
|
Accrued expenses and other current liabilities |
|
|
120.4 |
|
|
234.1 |
|
Commodity contracts |
|
Other long-term liabilities |
|
|
4.0 |
|
|
4.8 |
|
Foreign currency contracts |
|
Short-term derivative assets, net |
|
|
10.9 |
|
|
21.3 |
|
Foreign currency contracts |
|
Identifiable intangible and other non-current assets |
|
|
0.7 |
|
|
0.5 |
|
Foreign currency contracts |
|
Accrued expenses and other current liabilities |
|
|
0.8 |
|
|
— |
|
|
|
|
|
|
395.2 |
|
|
671.8 |
|
|
|
|
|
$ |
522.9 |
|
$ |
695.3 |
|
Derivative liabilities: |
|
|
|
|
|
|
|
|
|
Derivatives designated as hedging instruments |
|
|
|
|
|
|
||
|
Commodity contracts |
|
Short-term derivative assets, net |
|
$ |
95.3 |
|
$ |
1.0 |
|
Commodity contracts |
|
Accrued expenses and other current liabilities |
|
|
2.9 |
|
|
0.7 |
|
|
|
|
|
|
98.2 |
|
|
1.7 |
|
Derivatives not designated as hedging instruments |
|
|
|
|
|
|
||
|
Commodity contracts |
|
Short-term derivative assets, net |
|
|
26.6 |
|
|
76.0 |
|
Commodity contracts |
|
Identifiable intangible and other non-current assets |
|
|
4.8 |
|
|
0.6 |
|
Commodity contracts |
|
Accrued expenses and other current liabilities |
|
|
319.9 |
|
|
530.0 |
|
Commodity contracts |
|
Other long-term liabilities |
|
|
14.2 |
|
|
29.3 |
|
Foreign currency contracts |
|
Short-term derivative assets, net |
|
|
3.3 |
|
|
12.0 |
|
Foreign currency contracts |
|
Accrued expenses and other current liabilities |
|
|
1.7 |
|
|
— |
|
|
|
|
|
|
370.5 |
|
|
647.9 |
|
|
|
|
|
$ |
468.7 |
|
$ |
649.6 |
For information regarding our derivative instruments measured at fair value after netting and collateral and their locations on the consolidated balance sheets, see Note 10.
The following table presents the effect and financial statement location of our derivative instruments and related hedged items in fair value hedging relationships on our consolidated statements of income and comprehensive income (in millions):
|
Derivative |
Realized and Unrealized |
Realized and Unrealized |
||||||||||||||||||||||
|
Instruments |
Location |
Gain (Loss) |
Hedged Items |
Location |
Gain (Loss) |
|||||||||||||||||||
|
For the year ended December 31, |
For the year ended December 31, |
|||||||||||||||||||||||
|
|
|
|
|
2015 |
|
2014 |
|
2013 |
|
|
|
|
|
2015 |
|
2014 |
|
2013 | ||||||
|
Commodity contracts |
|
Revenue |
|
$ |
49.3 |
|
$ |
— |
|
$ |
— |
|
|
|
|
|
|
|
|
|
|
|
|
|
|
Commodity contracts |
|
Cost of revenue |
|
|
37.5 |
|
|
132.2 |
|
|
2.7 |
|
Inventories |
|
Cost of revenue |
|
$ |
(70.7) |
|
$ |
(150.9) |
|
$ |
3.1 |
|
|
|
|
|
$ |
86.8 |
|
$ |
132.2 |
|
$ |
2.7 |
|
|
|
|
|
$ |
(70.7) |
|
$ |
(150.9) |
|
$ |
3.1 |
There were no gains or losses for the year ended December 31, 2015, 2014 and 2013 that were excluded from the assessment of the effectiveness of our fair value hedges.
62
The following table presents the effect and financial statement location of our derivative instruments in cash flow hedging relationships on our accumulated other comprehensive income and consolidated statements of income and comprehensive income (in millions):
|
|
|
|
Amount of Gain (Loss) Recognized in Accumulated Other Comprehensive Income (Effective Portion) |
|
Location of Realized Gain (Loss) |
|
Amount of Gain (Loss) Reclassified from Accumulated Other Comprehensive Income (Effective Portion) |
|
|
Amount of Gain (Loss) Recognized in Income (Ineffective Portion) |
||||||||||
|
Derivative Instruments |
|
|
2015 | 2014 |
|
(Effective Portion) |
|
2015 |
|
|
2014 |
|
|
2015 |
|
|
2014 | |||
|
|
|
|
|
|
|
|
|
|
|
|
|
|
|
|
|
|
|
|
|
|
|
Commodity Contracts |
|
$ |
106.2 |
|
$ |
— |
|
Revenue |
|
$ |
6.1 |
|
$ |
— |
|
$ |
28.6 |
|
$ |
— |
|
Commodity Contracts |
|
|
(105.6) |
|
|
— |
|
Cost of revenue |
|
|
(5.7) |
|
|
— |
|
|
(17.8) |
|
|
— |
|
Total |
|
$ |
0.6 |
|
$ |
— |
|
|
|
$ |
0.4 |
|
$ |
— |
|
$ |
10.8 |
|
$ |
— |
In the event forecasted cash outflows are less than the hedged amounts, a portion or all of the gain or losses recorded in accumulated other comprehensive income are reclassified to the consolidated statements of income and comprehensive income. As of December 31, 2015, the maximum amount that could be reclassified to the consolidated statements of income and comprehensive income for the next twelve months is not significant.
The following table presents the effect and financial statement location of our derivative instruments not designated as hedging instruments on our consolidated statements of income and comprehensive income (in millions):
|
Derivatives |
|
Location |
Realized and Unrealized Gain (Loss) |
||||||||
|
|
|
|
|
For the Year ended December 31, |
|||||||
|
|
|
|
|
2015 |
|
2014 |
|
2013 | |||
|
Commodity contracts |
|
Revenue |
|
$ |
171.7 |
|
$ |
64.5 |
|
$ |
25.4 |
|
Commodity contracts |
|
Cost of revenue |
|
|
(139.0) |
|
|
2.2 |
|
|
(5.4) |
|
Foreign currency contracts |
|
Revenue |
|
|
4.1 |
|
|
4.3 |
|
|
— |
|
Foreign currency contracts |
|
Other income (expense), net |
|
|
9.5 |
|
|
12.6 |
|
|
(4.0) |
|
|
|
|
|
$ |
46.3 |
|
$ |
83.6 |
|
$ |
16.0 |
We enter into derivative instrument contracts which may require us to periodically post collateral. Certain of these derivative contracts contain clauses that are similar to credit-risk-related contingent features, including material adverse change, general adequate assurance and internal credit review clauses that may require additional collateral to be posted and/or settlement of the instruments in the event an aforementioned clause is triggered. The triggering events are not a quantifiable measure; rather they are based on good faith and reasonable determination by the counterparty that the triggers have occurred. As of December 31, 2015, the net liability position for such contracts is $63.2 million, the collateral posted is $28.1 million and the amount of assets required to be posted and/or to settle the positions should a credit-risk contingent feature be triggered is $35.1 million. As of December 31, 2014, the net liability position for such contracts is $111.7 million, the collateral posted is $89.4 million and the amount of assets required to be posted and/or to settle the positions should a credit-risk contingent feature be triggered is $22.3 million
63
4. Property and Equipment
The amount of property and equipment and their respective estimated useful lives are as follows (in millions, except estimated useful lives):
|
|
|
As of December 31, |
|
Estimated |
||||
|
|
|
2015 |
|
2014 |
|
Useful Lives |
||
|
Land |
|
$ |
31.6 |
|
$ |
17.7 |
|
Indefinite |
|
Buildings and leasehold improvements |
|
|
41.2 |
|
|
43.7 |
|
3 - 40 years |
|
Office equipment, furniture and fixtures |
|
|
14.1 |
|
|
13.6 |
|
3 - 10 years |
|
Computer equipment and software costs |
|
|
118.9 |
|
|
102.7 |
|
3 - 10 years |
|
Machinery, equipment and vehicles |
|
|
160.1 |
|
|
132.5 |
|
3 - 40 years |
|
|
|
|
365.9 |
|
|
310.2 |
|
|
|
Accumulated depreciation and amortization |
|
|
140.3 |
|
|
106.8 |
|
|
|
|
|
$ |
225.6 |
|
$ |
203.4 |
|
|
For 2015, 2014 and 2013, we recorded depreciation expense of $35.1 million, $30.3 million and $22.0 million, respectively.
The amount of computer software costs, including capitalized internally developed software costs are as follows (in millions):
|
|
|
|
|
|
|
|
|
|
|
As of December 31, |
||||
|
|
|
2015 |
|
2014 | ||
|
Computer software costs |
|
$ |
91.4 |
|
$ |
76.8 |
|
Accumulated amortization |
|
|
55.8 |
|
|
45.2 |
|
Computer software costs, net |
|
$ |
35.6 |
|
$ |
31.6 |
Included in capitalized computer software costs are costs incurred in connection with software development in progress of $7.0 million and $4.7 million as of December 31, 2015 and 2014, respectively. For 2015, 2014 and 2013, we recorded amortization expense related to computer software costs of $10.7 million, $9.8 million and $7.8 million, respectively.
The assets and accumulated amortization recorded under capital leases are as follows (in millions):
|
|
|
As of December 31, |
||||
|
|
|
2015 |
|
2014 | ||
|
Capital leases |
|
$ |
23.0 |
|
$ |
17.7 |
|
Accumulated amortization |
|
|
11.0 |
|
|
5.5 |
|
Capital leases, net |
|
$ |
12.0 |
|
$ |
12.2 |
5. Goodwill and Identifiable Intangible Assets
In 2015, we used qualitative factors to review goodwill for impairment for all of our reporting units and performed a quantitative analysis to review our identifiable intangible assets not subject to amortization for impairment. As a result of performing the aforementioned assessments, we determined that no impairment existed as of December 31, 2015 and, therefore, there were no write‑downs to any of our goodwill or identifiable intangible assets not subject to amortization.
64
Goodwill
The following table provides information regarding changes in goodwill (in millions):
|
|
|
Aviation |
|
Marine |
|
Land |
|
|
|
|||
|
|
|
Segment |
|
Segment |
|
Segment |
|
Total |
||||
|
As of December 31, 2013 |
|
$ |
115.5 |
|
$ |
69.1 |
|
$ |
299.0 |
|
$ |
483.6 |
|
2014 acquisitions |
|
|
58.9 |
|
|
4.7 |
|
|
114.3 |
|
|
177.9 |
|
Adjustment of purchase price allocations – 2013 acquisitions |
|
|
— |
|
|
— |
|
|
0.4 |
|
|
0.4 |
|
Foreign currency translation of non-USD functional currency subsidiary goodwill |
|
|
(0.1) |
|
|
(0.7) |
|
|
(7.8) |
|
|
(8.6) |
|
As of December 31, 2014 |
|
|
174.3 |
|
|
73.1 |
|
|
405.9 |
|
|
653.3 |
|
2015 acquisitions |
|
|
1.7 |
|
|
— |
|
|
37.7 |
|
|
39.4 |
|
Goodwill classified as held for sale |
|
|
— |
|
|
— |
|
|
(5.9) |
|
|
(5.9) |
|
Foreign currency translation of non-USD functional currency subsidiary goodwill |
|
|
(2.3) |
|
|
(1.7) |
|
|
(7.0) |
|
|
(11.0) |
|
As of December 31, 2015 |
|
$ |
173.7 |
|
$ |
71.4 |
|
$ |
430.7 |
|
$ |
675.8 |
Identifiable Intangible Assets
The following table provides information about our identifiable intangible assets (in millions):
|
|
|
As of December 31, 2015 |
|
As of December 31, 2014 |
||||||||||||||
|
|
|
Gross |
|
|
|
|
|
|
|
Gross |
|
|
|
|
|
|
||
|
|
|
Carrying |
|
Accumulated |
|
|
|
|
Carrying |
|
Accumulated |
|
|
|
||||
|
|
|
Amount |
|
Amortization |
|
Net |
|
Amount |
|
Amortization |
|
Net |
||||||
|
Intangible assets subject to amortization: |
|
|
|
|
|
|
|
|
|
|
|
|
|
|
|
|
|
|
|
Customer relationships |
|
$ |
255.5 |
|
$ |
125.4 |
|
$ |
130.1 |
|
$ |
243.1 |
|
$ |
104.4 |
|
$ |
138.7 |
|
Supplier agreements |
|
|
38.5 |
|
|
10.7 |
|
|
27.8 |
|
|
33.7 |
|
|
9.1 |
|
|
24.6 |
|
Others |
|
|
37.2 |
|
|
16.1 |
|
|
21.1 |
|
|
33.7 |
|
|
11.3 |
|
|
22.4 |
|
|
|
|
331.2 |
|
|
152.2 |
|
|
179.0 |
|
|
310.5 |
|
|
124.8 |
|
|
185.7 |
|
Intangible assets not subject to amortization: |
|
|
|
|
|
|
|
|
|
|
|
|
|
|
|
|
|
|
|
Trademark/trade name rights |
|
|
31.9 |
|
|
— |
|
|
31.9 |
|
|
31.9 |
|
|
— |
|
|
31.9 |
|
|
|
$ |
363.1 |
|
$ |
152.2 |
|
$ |
210.9 |
|
$ |
342.4 |
|
$ |
124.8 |
|
$ |
217.6 |
Intangible amortization expense for 2015, 2014 and 2013 was $28.3 million, $29.1 million and $22.4 million, respectively.
The future estimated amortization of our identifiable intangible assets is as follows (in millions):
|
|
|
|
|
|
Year Ended December 31, |
|
|
|
|
2016 |
|
$ |
32.3 |
|
2017 |
|
|
27.5 |
|
2018 |
|
|
23.8 |
|
2019 |
|
|
19.6 |
|
2020 |
|
|
16.8 |
|
Thereafter |
|
|
59.0 |
|
|
|
$ |
179.0 |
6. Debt
We have a Credit facility which permits borrowing up to $1.26 billion with a sublimit of $400.0 for the issuance of letters of credit and bankers’ acceptances. Under the Credit Facility, we have the right to request increases in available borrowings up to an additional $150.0 million, subject to the satisfaction of certain conditions. The Credit Facility matures in October 2018. We had outstanding borrowings under our Credit Facility totaling $416.0 million and $420.0 million as of December 31, 2015 and 2014, respectively.
65
Our issued letters of credit under the Credit Facility totaled $5.5 million and $14.8 million as of December 31, 2015 and 2014, respectively. We also had $333.2 million and $241.3 million in Term Loans outstanding as of December 31, 2015 and 2014, respectively. As of December 31, 2015 and 2014, the unused portion of our Credit Facility was $838.5 million and $665.2 million, respectively.
Borrowings under our Credit Facility and Term Loans related to base rate loans or Eurodollar rate loans bear floating interest rates plus applicable margins. As of December 31, 2015, the applicable margins for base rate loans and Eurodollar rate loans were 1.25% and 2.25%, respectively. Letters of credit issued under our Credit Facility are subject to letter of credit fees of 2.50% as of December 31, 2015, and the unused portion of our Credit Facility is subject to commitment fees of 0.30% as of December 31, 2015.
Our Credit Facility and our Term Loans contain certain financial and other covenants with which we are required to comply. Our failure to comply with the covenants contained in our Credit Facility and our Term Loans could result in an event of default. An event of default, if not cured or waived, would permit acceleration of any outstanding indebtedness under the Credit Facility and our Term Loans, trigger cross‑defaults under certain other agreements to which we are a party and impair our ability to obtain working capital advances and issue letters of credit, which would have a material adverse effect on our business, financial condition, results of operations and cash flows. As of December 31, 2015, we were in compliance with all financial and other covenants contained in our Credit Facility and our Term Loans.
Outside of our Credit Facility we have other uncommitted credit lines primarily for the issuance of letters of credit, bank guarantees and bankers’ acceptances. These credit lines are renewable on an annual basis and are subject to fees at market rates. As of December 31, 2015 and 2014, our outstanding letters of credit and bank guarantees under these credit lines totaled $208.4 million and $211.4 million, respectively.
Substantially all of the letters of credit and bank guarantees issued under our Credit Facility and the uncommitted credit lines were provided to suppliers in the normal course of business and generally expire within one year of issuance. Expired letters of credit and bank guarantees are renewed as needed.
Our debt consisted of the following (in millions):
|
|
|
|
|
|
|
|
|
|
|
As of December 31, |
||||
|
|
|
2015 |
|
2014 | ||
|
Credit Facility |
|
$ |
416.0 |
|
$ |
420.0 |
|
Term Loans |
|
|
333.2 |
|
|
241.3 |
|
Capital leases |
|
|
12.0 |
|
|
11.4 |
|
Other |
|
|
11.0 |
|
|
17.2 |
|
Total debt |
|
|
772.2 |
|
|
689.9 |
|
Short-term debt |
|
|
25.5 |
|
|
17.9 |
|
Long-term debt |
|
$ |
746.7 |
|
$ |
672.0 |
The capital lease obligations are payable in varying amounts through February 2023 and bear interest at annual rates ranging from 3.0% to 6.3% as of December 31, 2015. The other debt primarily relates to acquisition promissory notes and loans payable to noncontrolling shareholders of a consolidated subsidiary which are payable in varying amounts from July 2016 to May 2018 and bear interest at annual rates ranging from 1.3% to 6.8% as of December 31, 2015. The weighted average interest rate on our short‑term debt was 2.7% and 2.2% as of December 31, 2015 and 2014, respectively.
As of December 31, 2015, the aggregate annual maturities of debt are as follows (in millions):
|
Year Ended December 31, |
|
|
|
|
2016 |
|
$ |
25.5 |
|
2017 |
|
|
27.5 |
|
2018 |
|
|
715.6 |
|
2019 |
|
|
1.4 |
|
2020 |
|
|
0.9 |
|
Thereafter |
|
|
1.3 |
|
|
|
$ |
772.2 |
66
The following table provides additional information about our interest income and expense and other financing costs, net (in millions):
|
|
|
|
|
|
|
|
|
|
|
|
|
|
2015 |
|
2014 |
|
2013 | |||
|
Interest income |
|
$ |
5.0 |
|
$ |
6.0 |
|
$ |
3.9 |
|
Interest expense and other financing costs |
|
|
(34.9) |
|
|
(31.2) |
|
|
(21.2) |
|
|
|
$ |
(29.9) |
|
$ |
(25.2) |
|
$ |
(17.3) |
7. Commitments and Contingencies
Surety Bonds
In the normal course of business, we are required to post bid, performance and garnishment bonds. The majority of the surety bonds posted relate to our aviation and land segments. As of December 31, 2015 and 2014, we had outstanding bonds that were arranged in order to satisfy various security requirements of $39.1 million and $38.7 million, respectively. Most of these bonds provide financial security for obligations which have already been recorded as liabilities.
Lease Commitments
As of December 31, 2015, our future minimum lease payments under non‑cancelable operating leases were as follows (in millions):
|
|
|
|
|
|
Year Ended December 31, |
|
|
|
|
2016 |
|
$ |
42.1 |
|
2017 |
|
|
31.3 |
|
2018 |
|
|
23.4 |
|
2019 |
|
|
18.8 |
|
2020 |
|
|
15.1 |
|
Thereafter |
|
|
45.5 |
|
|
|
$ |
176.2 |
We incurred rental expense for all properties and equipment of $31.6 million, $29.2 million and $24.7 million for 2015, 2014 and 2013, respectively. Minimum payments have not been reduced by minimum sublease rentals of $37.5 million due in the future under non-cancelable subleases.
Sales and Purchase Commitments
As of December 31, 2015, fixed sales and purchase commitments under our derivative programs amounted to $270.2 million and $65.9 million, respectively.
Additionally, as of December 31, 2015, we had entered into certain other fixed price sales commitments with corresponding fixed price purchase commitments, the majority of which were satisfied within one week. These sales and purchase commitments were made in the normal course of business.
Agreements with Executive Officers and Key Employees
We have an agreement with our Chairman, President and Chief Executive Officer, Michael J. Kasbar, for his continued employment with the Company which provides for an annual base salary as determined by our Compensation Committee in its sole discretion (currently $750,000), termination severance benefits, and such incentives and other compensation and amounts as our Compensation Committee may determine from time to time in its sole discretion. The Kasbar agreement, as amended, expires on December 31, 2016, unless terminated earlier, and will automatically extend for successive one year terms unless either party provides written notice to the other at least one year prior to the expiration of the term that such party does not want to extend the term. Pursuant to his amended agreement, Mr. Kasbar is entitled to receive cash severance payments if: (a) we terminate his employment without cause following a change of control or for any reason other than death, disability or cause; (b) he resigns for good reason (generally a reduction in his responsibilities or compensation, or a breach by us), or resigns following a change of control; or (c) either he elects or we elect not to extend the term of the agreement, as amended. The severance payments are equal to $5.0 million for a termination following a change of control and $3.0 million in the other scenarios described above, a portion of which will be payable two years after the termination of Mr. Kasbar’s employment.
67
All of Mr. Kasbar’s outstanding SSAR Awards, restricted stock and RSUs (collectively, “outstanding equity awards”) will immediately vest in each scenario described in (a) and (b) above following a change of control, except for awards assumed or substituted by a successor company, in which case, such awards shall continue to vest in accordance with their applicable terms. In each scenario described in (a), (b) or (c) above where there has not been a change of control, Mr. Kasbar’s outstanding equity awards will generally vest over a two year period following termination of his employment, with any remaining unvested awards vesting on the last day of such two year period. For each scenario described above, awards with multiple annual performance conditions must satisfy certain other requirements in order to have their vesting terms accelerated.
We have also entered into employment agreements or separation agreements with certain of our other executive officers and key employees. These agreements provide for minimum salary levels, and, in most cases, bonuses which are payable if specified performance goals are attained. Some executive officers and key employees are also entitled to severance benefits upon termination or non-renewal of their contracts under certain circumstances.
As of December 31, 2015, the approximate future minimum commitments under these agreements, excluding discretionary and performance bonuses, are as follows (in millions):
|
Year Ended December 31, |
|
|
|
|
2016 |
|
$ |
6.0 |
|
2017 |
|
|
1.2 |
|
|
|
$ |
7.2 |
Termination of Employment Agreement
On March 13, 2015, we agreed with Mr. Michael S. Clementi that he would retire from his position as Aviation Segment President, effective March 16, 2015. In connection with the termination of his employment agreement, we recorded a charge totaling $3.8 million in March 2015, which included non-cash expenses of $0.8 million related to previously awarded stock compensation. As of December 31, 2015, $0.8 million of the cash portion of the termination of the employment agreement charge was included in accrued expenses and other current liabilities and $1.9 million was included in other long-term liabilities in the accompanying consolidated balance sheets.
Deferred Compensation Plans and Pension
We maintain a 401(k) defined contribution plan which covers all U.S. employees who meet minimum requirements and elect to participate. We are currently making a match contribution of 50% for each 1% of the participants' contributions up to 6% of the participants' contributions. Annual contributions by us are made at our sole discretion, as approved by the Compensation Committee. Additionally, certain of our foreign subsidiaries have defined contribution plans, which allow for voluntary contributions by the employees. In some cases, we make employer contributions on behalf of the employees. The expenses for our contributions under these plans were not significant during each of the years presented on the consolidated statements of income and comprehensive income.
68
We offer a non-qualified deferred compensation (“NQDC”) plan to certain eligible employees, excluding our named executive officers, whereby the participants may defer a portion of their compensation. We do not match any participant deferrals under the NQDC plan. Participants can elect from a variety of investment choices for their deferred compensation and gains and losses on these investments are credited to their respective accounts. The deferred compensation payable amount under this NQDC plan is subject to the claims of our general creditors and was $3.3 million and $2.3 million as of December 31, 2015 and December 31, 2014, respectively, which was included in other long-term liabilities in the accompanying consolidated balance sheets.
In connection with our acquisition of Watson Petroleum, we assumed their defined benefit pension plan (the “Watson Plan”), which provides participants benefits based on salary at retirement or an earlier date of leaving service. As part of the allocation of the estimated purchase price to assets acquired and liabilities assumed for Watson Petroleum, we recorded an assumed pension exit obligation of £9.6 million ($16.0 million). During 2015, we completed the pension buy-out, therefore, as of December 31, 2015 there are no other assets or liabilities on our consolidated balance sheet related to the Watson Plan. Additionally, the expenses for the Watson Plan recorded in our consolidated statements of income and comprehensive income for 2015 were not significant.
Environmental and Other Liabilities; Uninsured Risks
We provide various services to customers, including into‑plane fueling at airports, fueling of vessels in‑port and at‑sea, and transportation and storage of fuel and fuel products. We are therefore subject to possible claims by customers, regulators and others who may be injured by a fuel spill or other accident. In addition, we may be held liable for damages to the environment arising out of such events. Although we generally maintain liability insurance for these types of events, such insurance may be inadequate. If we are held liable for any damages, and the liability is not adequately covered by insurance and is of sufficient magnitude, our financial position and results of operations will be adversely affected.
Compliance with existing and future environmental laws regulating underground storage tanks located at the retail gasoline stations that we operate may require significant capital expenditures and increased operating and maintenance costs. The remediation costs and other costs required to clean up or treat contaminated sites could be substantial. We pay tank registration fees and other taxes to state trust funds established in our operating areas and maintain private insurance coverage in support of future remediation obligations. These state trust funds or other responsible third parties including insurers are expected to pay or reimburse us for remediation expenses less a deductible. To the extent third parties do not pay for remediation as we anticipate, we will be obligated to make these payments. These payments could materially adversely affect our financial condition, results of operations and cash flows. Reimbursements from state trust funds will be dependent on the maintenance and continued solvency of the various funds.
Although we continuously review the adequacy of our insurance coverage, we may lack adequate coverage for various risks, including environmental claims. Furthermore, our ability to obtain and maintain adequate insurance and the cost of such insurance may be affected by significant claims, such as the Lac‑Mégantic derailment described below, and conditions in the insurance market over which we have no control. An uninsured or under‑insured claim arising out of our activities, if successful and of sufficient magnitude, will have a material adverse effect on our financial position, results of operations and cash flows.
Legal Matters
Lac‑Mégantic, Quebec
We, on behalf of DPTS Marketing, LLC (“DPM”), a crude oil marketing joint venture in which we previously owned a 50% membership interest, purchased crude oil from various producers in the Bakken region of North Dakota. Dakota Petroleum Transport Solutions, LLC (“DPTS”), a crude oil transloading joint venture in which we also previously owned a 50% membership interest, arranged for the transloading of the crude oil for DPM into tank cars at its facility in New Town, North Dakota (the “Pioneer Terminal”). We leased the tank cars used in the transloading from a number of third party lessors and subleased these tank cars to DPM (the “Railcar Subleases”). We, on behalf of DPM, contracted with Canadian Pacific Railway (“CPR”) for the transportation of the tank cars and the crude oil from New Town, North Dakota to a customer in New Brunswick, Canada. CPR subcontracted a portion of that route to Montreal, Maine and Atlantic Railway (“MMA”). On July 6, 2013, the freight train operated by MMA with tank cars carrying approximately 50,000 barrels of crude oil derailed in Lac-Mégantic, Quebec (the “Derailment”). The Derailment resulted in significant loss of life, damage to the environment from spilled crude oil and extensive property damage.
Between 2013 and 2015, we, certain of our subsidiaries, DPM and DPTS, along with a number of third parties, were sued in various actions in both the United States and Canada, by multiple third parties seeking economic, compensatory and
69
punitive damages allegedly caused by the Derailment. In addition, in 2013, the Quebec Minister for Sustainable Development, Environment, Wildlife and Parks (the “Minister”) issued an order requiring us to recover the spilled crude oil caused by the incident and to otherwise fully remediate the impact of the incident on the environment.
On June 8, 2015, we entered into a settlement agreement (the “Settlement Agreement”) with the Trustee (the “Trustee”) for the U.S. bankruptcy estate of Montreal, Maine & Atlantic Railway, Ltd., Montreal, Maine and Atlantic Canada Co. (“MMAC”), and the monitor (the “Monitor”) in MMAC’s Canadian bankruptcy (collectively, the “MMA Parties”) resolving all claims arising out of the Derailment. On December 22, 2015, the effective date of the bankruptcy plans filed by the Trustee in the U.S. and by MMAC in Canada (the “U.S. Bankruptcy Plan” and the “CCAA Plan” respectively, each a “Plan” and collectively the “Plans”), the Settlement Agreement became final and effective. Pursuant to the Settlement Agreement, we contributed US$110 million (the “Settlement Payment”) to a compensation fund established to compensate parties who suffered losses as a result of the Derailment. As part of the settlement, we also assigned to the Trustee and MMAC certain claims we have against third parties arising out of the Derailment.
In consideration of the Settlement Payment and the assignment of claims to the Trustee and MMAC, we, as well as our former joint ventures, DPTS Marketing, LLC and Dakota Petroleum Transport Solutions, LLC and each of their affiliates (collectively, the “WFS Parties”), received, and will continue to receive, the benefit of the global releases and injunctions set forth in the Plans. These global releases and injunctions bar all claims which may exist now or in the future against the WFS Parties arising out of the Derailment, other than criminal claims which by law may not be released.
Substantially all of the liabilities incurred in connection with the incident have been recovered from insurance through December 31, 2015. As of December 31, 2015, the remaining outstanding amounts are not significant.
Other Matters
In connection with a theft of fuel product valued at approximately $18.0 million, we recorded an insurance receivable for the full amount of the loss, which is included in other current assets in the accompanying consolidated balance sheet. On July 31, 2014, our insurer, AGCS Marine Insurance Company (“AGCS”), filed a declaratory judgment action against us in the United States District Court for the Southern District of New York seeking a court ruling that the loss is not covered under our policy. During the quarter ended December 31, 2014, we filed an answer to the AGCS complaint and counterclaims against AGCS for declaratory judgment and breach of contract seeking a court ruling that the loss is covered under the policy, an award of damages equal to the full amount of our loss plus interest, as well as fees and costs. We and AGCS have filed cross-motions for summary judgment and both motions are set for hearing in March 2016. No trial date has been set. We believe AGCS’ position is without merit and we intend to vigorously pursue our rights. However, due to the complexities and uncertainties inherent in litigation, we can provide no assurance that we will recover the full amount of the loss.
We are a party to various claims, complaints and proceedings arising in the ordinary course of our business including, but not limited to, environmental claims, commercial and governmental contract claims, such as property damage, demurrage, personal injury, billing and fuel quality claims, as well as bankruptcy preference claims and tax and administrative claims. We have established loss provisions for these ordinary course claims as well as other matters in which losses are probable and can be reasonably estimated. As of December 30, 2015, we had recorded certain reserves which were not significant. For those matters where a reserve has not been established and for which we believe a loss is reasonably possible, as well as for matters where a reserve has been recorded but for which an exposure to loss in excess of the amount accrued is reasonably possible, we believe that such losses will not have a material adverse effect on our consolidated financial statements. However, any adverse resolution of one or more such claims, complaints or proceedings during a particular period could have a material adverse effect on our consolidated financial statements or disclosures for that period.
Our estimates regarding potential losses and materiality are based on our judgment and assessment of the claims utilizing currently available information. Although we will continue to reassess our reserves and estimates based on future developments, our objective assessment of the legal merits of such claims may not always be predictive of the outcome and actual results may vary from our current estimates.
70
8. Shareholders’ Equity
Dividends
We declared cash dividends of $0.24 per share of common stock for 2015 and $0.15 for 2014 and 2013. Our Credit Facility and Term Loans have restrictions regarding the maximum amount of cash dividends allowed to be paid. The payment of the above‑referenced cash dividends was in compliance with the Credit Facility and Term Loans.
Stock Repurchase Programs
Our Board of Directors, from time to time, has authorized stock repurchase programs under the terms of which we may repurchase our common stock, subject to certain restrictions contained in our Credit Facility and Term Loans. In October 2008, our Board of Directors authorized a $50.0 million common stock repurchase program (the “Repurchase Program”). In 2013, we repurchased 926,000 shares of our common stock for an aggregate value of $35.0 million pursuant to the Repurchase Program. In May 2014, our Board of Directors renewed the Repurchase Program, replacing the remainder of the October 2008 share repurchase program and authorizing the purchase of up to $65.0 million in common stock. During 2014 and from January 1, 2015 through May 31, 2015, pursuant to the Repurchase Program, we repurchased 227,000 shares of our common stock for an aggregate value of $10.0 million and 584,000 shares of our common stock for an aggregate value of $30.0 million, respectively.
In June 2015, our Board of Directors renewed its existing common stock repurchase program by replacing the remainder of the existing program and authorizing the purchase of up to $100.0 million in common stock (the “Repurchase Program”). The Repurchase Program does not require a minimum number of shares of common stock to be purchased, has no expiration date and may be suspended or discontinued at any time. From July 1, 2015 through December 31, 2015, we repurchased 1,000,000 shares of our common stock for an aggregate value of $40.5 million pursuant to the Repurchase Program. As of December 31, 2015, $59.5 million remains available for purchase under the Repurchase Program. The timing and amount of shares of common stock to be repurchased under the program will depend on market conditions, share price, securities law and other legal requirements and factors.
Share‑Based Payment Plans
Plan Summary and Description
In 2006, our shareholders approved the 2006 Omnibus Plan, in 2009, our shareholders approved an amendment and restatement of such plan and, in 2015, our shareholders reapproved the material terms of the performance measures under such plan (collectively, the “2006 Plan”). The 2006 Plan is administered by the Compensation Committee of the Board of Directors (the “Compensation Committee”). The purpose of the 2006 Plan is to (i) attract and retain persons eligible to participate in the 2006 Plan; (ii) motivate participants, by means of appropriate incentives, to achieve long‑range goals; (iii) provide incentive compensation opportunities that are competitive with those of other similar companies; and (iv) further align participants’ interests with those of our other shareholders through compensation that is based on the value of our common stock. The goal is to promote the long‑term financial interest of World Fuel and its subsidiaries, including the growth in value of our equity and enhancement of long‑term shareholder return. The persons eligible to receive awards under the 2006 Plan are our employees, officers, and members of the Board of Directors, or any consultant or other person who performs services for us.
The provisions of the 2006 Plan authorize the grant of stock options which can be “qualified” or “nonqualified” under the Internal Revenue Code of 1986, as amended, restricted stock, RSUs, SSAR Awards, performance shares and performance units and other share‑ based awards. The 2006 Plan is unlimited in duration and, in the event of its termination, the 2006 Plan will remain in effect as long as any awards granted under it remain outstanding. No awards may be granted under the 2006 Plan after June 2016. The term and vesting period of awards granted under the 2006 Plan are established on a per grant basis, but options and SSAR Awards may not remain exercisable after the seven‑year anniversary of the date of grant.
Under the 2006 Plan, 4,900,000 shares of common stock are authorized for issuance. Additional shares of common stock that are authorized for issuance under the 2006 Plan include any shares that were available for future grant under any of our prior stock plans, and any shares in respect of awards granted under the 2006 Plan or any prior plans that expire or are forfeited or canceled.
Furthermore, any employee’s shares used to satisfy the withholding taxes due upon vesting of any awards granted under the 2006 plan or exercise of stock options are added to the maximum number of shares authorized for issuance under the 2006 Plan.
71
The following table summarizes the outstanding awards issued pursuant to the 2006 Plan described above as of December 31, 2015 and the remaining shares of common stock available for future issuance (in millions):
|
|
|
|
|
|
|
|
|
|
|
|
|
|
|
|
|
|
|
Remaining |
|
|
|
|
|
|
|
|
|
shares of |
|
|
|
|
|
|
|
|
|
common stock |
|
|
|
Restricted |
|
|
|
SSAR |
|
available for |
|
Plan name |
|
Stock |
|
RSUs |
|
Awards |
|
future issuance |
|
2006 Plan (1) |
|
1.4 |
|
0.7 |
|
0.2 |
|
3.2 |
|
(1) |
As of December 31, 2015, unvested restricted stock will vest between February 2016 and August 2020, unvested RSUs will vest between February 2016 and May 2020 and the outstanding SSAR Awards will expire between March 2018 and March 2020. RSUs granted to non‑employee directors under the 2006 Plan prior to 2011 remain outstanding until the date the non‑employee director ceases, for any reason, to be a member of the Board of Directors. |
Restricted Stock Awards
The following table summarizes the status of our unvested restricted stock outstanding and related transactions for each of the following years (in millions, except weighted average grant‑date fair value price and weighted average remaining vesting term data):
|
|
|
|
|
|
|
|
|
|
|
|
|
Unvested Restricted Stock Outstanding |
||||||||||
|
|
|
|
|
|
|
|
|
|
|
Weighted |
|
|
|
|
|
Weighted |
|
|
|
|
Average |
|
|
|
|
|
|
Average |
|
|
|
|
Remaining |
|
|
|
|
Unvested |
|
Grant-date |
|
|
Aggregate |
|
Vesting |
|
|
|
|
Restricted |
|
Fair Value |
|
|
Intrinsic |
|
Term |
|
|
|
|
Stock |
|
Price |
|
|
Value |
|
(in Years) |
|
|
As of December 31, 2012 |
|
1.1 |
|
$ |
39.38 |
|
$ |
45.3 |
|
3.4 |
|
Granted |
|
0.3 |
|
|
41.83 |
|
|
|
|
|
|
Vested |
|
— |
|
|
37.00 |
|
|
|
|
|
|
Forfeited |
|
— |
|
|
38.89 |
|
|
|
|
|
|
As of December 31, 2013 |
|
1.4 |
|
|
40.07 |
|
|
59.3 |
|
2.7 |
|
Granted |
|
0.3 |
|
|
44.18 |
|
|
|
|
|
|
Vested |
|
(0.2) |
|
|
38.00 |
|
|
|
|
|
|
Forfeited |
|
— |
|
|
39.58 |
|
|
|
|
|
|
As of December 31, 2014 |
|
1.5 |
|
|
41.18 |
|
|
70.2 |
|
2.1 |
|
Granted |
|
0.2 |
|
|
49.95 |
|
|
|
|
|
|
Vested |
|
(0.2) |
|
|
39.63 |
|
|
|
|
|
|
Forfeited |
|
(0.1) |
|
|
41.84 |
|
|
|
|
|
|
As of December 31, 2015 |
|
1.4 |
|
$ |
42.69 |
|
$ |
54.9 |
|
1.4 |
The aggregate value of restricted stock which vested during 2015, 2014 and 2013 was $9.9 million, $7.1 million and $1.7 million, respectively, based on the average high and low market price of our common stock at the vesting date.
72
RSU Awards
The following table summarizes the status of our RSUs and related transactions for each of the following years (in millions, except for weighted average grant‑date fair value data and weighted average remaining contractual life):
|
|
|
|
|
|
|
|
|
|
|
|
|
RSUs Outstanding |
||||||||||
|
|
|
|
|
|
|
|
|
|
|
Weighted |
|
|
|
|
|
|
|
|
|
|
|
Average |
|
|
|
|
|
Weighted |
|
|
|
|
Remaining |
|
|
|
|
|
|
Average |
|
|
Aggregate |
|
Contractual |
|
|
|
|
|
|
Grant-date |
|
|
Intrinsic |
|
Life |
|
|
|
|
RSUs |
|
Fair Value |
|
|
Value |
|
(in Years) |
|
|
As of December 31, 2012 |
|
1.0 |
|
$ |
34.06 |
|
$ |
39.9 |
|
1.5 |
|
Granted |
|
— |
|
|
40.59 |
|
|
|
|
|
|
Issued |
|
(0.3) |
|
|
32.00 |
|
|
|
|
|
|
Forfeited |
|
— |
|
|
35.92 |
|
|
|
|
|
|
As of December 31, 2013 |
|
0.7 |
|
|
35.61 |
|
|
31.8 |
|
1.3 |
|
Granted |
|
0.3 |
|
|
44.34 |
|
|
|
|
|
|
Issued |
|
(0.2) |
|
|
36.67 |
|
|
|
|
|
|
Forfeited |
|
- |
|
|
40.25 |
|
|
|
|
|
|
As of December 31, 2014 |
|
0.8 |
|
|
38.55 |
|
|
36.9 |
|
1.5 |
|
Granted |
|
0.2 |
|
|
51.00 |
|
|
|
|
|
|
Issued |
|
(0.3) |
|
|
38.80 |
|
|
|
|
|
|
Forfeited |
|
— |
|
|
42.65 |
|
|
|
|
|
|
As of December 31, 2015 |
|
0.7 |
|
$ |
43.10 |
|
$ |
28.0 |
|
1.7 |
The aggregate intrinsic value of RSUs issued during 2015, 2014 and 2013 was $15.3 million, $10.1 million and $11.3 million, respectively.
SSAR Awards
The following table summarizes the status of our outstanding and exercisable SSAR Awards and related transactions for each of the following years (in millions, except weighted average exercise price and weighted average remaining contractual life data):
|
|
|
SSAR Awards Outstanding |
|
SSAR Awards Exercisable |
||||||||||||||||
|
|
|
|
|
|
|
|
|
Weighted |
|
|
|
|
|
|
|
Weighted |
||||
|
|
|
|
|
|
|
|
|
Average |
|
|
|
|
|
|
|
Average |
||||
|
|
|
|
|
Weighted |
|
|
|
Remaining |
|
|
|
Weighted |
|
|
|
Remaining |
||||
|
|
|
|
|
Average |
|
Aggregate |
|
Contractual |
|
|
|
Average |
|
Aggregate |
|
Contractual |
||||
|
|
|
SSAR |
|
Exercise |
|
Intrinsic |
|
Life |
|
SSAR |
|
Exercise |
|
Intrinsic |
|
Life |
||||
|
|
|
Awards |
|
Price |
|
Value |
|
(in Years) |
|
Awards |
|
Price |
|
Value |
|
(in Years) |
||||
|
As of December 31, 2012 |
|
0.4 |
|
$ |
15.30 |
|
$ |
10.9 |
|
0.6 |
|
0.3 |
|
|
16.02 |
|
|
8.1 |
|
0.7 |
|
Granted |
|
0.2 |
|
|
41.42 |
|
|
|
|
|
|
|
|
|
|
|
|
|
|
|
|
Exercised |
|
(0.4) |
|
|
14.07 |
|
|
|
|
|
|
|
|
|
|
|
|
|
|
|
|
Forfeited |
|
— |
|
|
37.34 |
|
|
|
|
|
|
|
|
|
|
|
|
|
|
|
|
As of December 31, 2013 |
|
0.2 |
|
|
37.69 |
|
|
1.5 |
|
3.6 |
|
— |
|
|
23.25 |
|
|
1.1 |
|
1.0 |
|
Exercised |
|
— |
|
|
22.26 |
|
|
|
|
|
|
|
|
|
|
|
|
|
|
|
|
Forfeited |
|
— |
|
|
40.91 |
|
|
|
|
|
|
|
|
|
|
|
|
|
|
|
|
As of December 31, 2014 |
|
0.2 |
|
|
40.06 |
|
|
1.5 |
|
3.0 |
|
— |
|
$ |
35.81 |
|
$ |
0.6 |
|
2.2 |
|
Granted |
|
— |
|
|
57.48 |
|
|
|
|
|
|
|
|
|
|
|
|
|
|
|
|
Exercised |
|
— |
|
|
25.08 |
|
|
|
|
|
|
|
|
|
|
|
|
|
|
|
|
As of December 31, 2015 |
|
0.2 |
|
$ |
42.91 |
|
$ |
— |
|
2.5 |
|
— |
|
$ |
42.06 |
|
$ |
— |
|
2.2 |
The aggregate intrinsic value of SSAR Awards exercised during 2015, 2014 and 2013 was $0.5 million, $0.8 million and $9.1 million, respectively, based on the difference between the average of the high and low market price of our common stock at the exercise date and the SSAR Award exercise price.
As discussed in Note 1, we currently use the Black Scholes option pricing model to estimate the fair value of SSAR Awards granted to employees and non‑employee directors. The weighted average fair value of the SSAR Awards for 2015 was $14.78 and the assumptions used to determine such fair value were as follows: expected term of 4.3 years, volatility of 30.2%, dividend yields of 0.3% and risk‑free interest rates of 1.2%.There were no SSAR Awards issued in 2014. The
73
weighted average fair value of the SSAR Awards for 2013 was $11.65 and the assumptions used to determine such fair value were as follows: expected term of 4.1 years, volatility of 38.0%, dividend yields of 0.4% and risk‑free interest rates of 0.6%.
Unrecognized Compensation Cost
As of December 31, 2015, there was $32.6 million of total unrecognized compensation cost related to unvested share‑based payment awards, which is included as capital in excess of par value in the accompanying consolidated balance sheets. The unrecognized compensation cost as of December 31, 2015 is expected to be recognized as compensation expense over a weighted average period of 1.4 years as follows (in millions):
|
|
|
|
|
|
Year Ended December 31, |
|
|
|
|
2016 |
|
$ |
14.6 |
|
2017 |
|
|
10.8 |
|
2018 |
|
|
5.7 |
|
2019 |
|
|
1.3 |
|
2020 |
|
|
0.2 |
|
|
|
$ |
32.6 |
Other Comprehensive Loss and Accumulated Other Comprehensive Loss
Our other comprehensive loss, consisting of foreign currency translation adjustments related to our subsidiaries that have a functional currency other than the U.S. dollar and cash flow hedges, was as follows (in millions):
|
|
|
Foreign |
|
|
|
|
Accumulated |
||
|
|
|
Currency |
|
|
|
|
Other |
||
|
|
|
Translation |
|
Cash |
|
Comprehensive |
|||
|
|
|
Adjustments |
|
Flow Hedges |
|
Loss |
|||
|
Balance as of December 31, 2013 |
|
$ |
(29.3) |
|
$ |
— |
|
$ |
(29.3) |
|
Other comprehensive loss |
|
|
(30.9) |
|
|
— |
|
|
(30.9) |
|
Balance as of December 31, 2014 |
|
|
(60.2) |
|
|
— |
|
|
(60.2) |
|
Other comprehensive loss |
|
|
(49.6) |
|
|
0.6 |
|
|
(49.0) |
|
Less: Net other comprehensive income attributable to noncontrolling interest |
|
|
4.0 |
|
|
— |
|
|
4.0 |
|
Balance as of December 31, 2015 |
|
$ |
(113.8) |
|
$ |
0.6 |
|
$ |
(113.2) |
The foreign currency translation adjustment losses for 2015 and 2014 were primarily due to the strengthening of the U.S. dollar as compared to the Brazilian Real and the British Pound.
9. Income Taxes
U.S. and foreign income before income taxes consist of the following (in millions):
|
|
|
|
|
|
|
|
|
|
|
|
|
|
2015 |
|
2014 |
|
2013 | |||
|
United States |
|
$ |
1.2 |
|
$ |
56.5 |
|
$ |
31.8 |
|
Foreign |
|
|
218.1 |
|
|
213.0 |
|
|
214.9 |
|
|
|
$ |
219.3 |
|
$ |
269.5 |
|
$ |
246.7 |
74
The income tax provision (benefit) related to income before income taxes consists of the following components (in millions):
|
|
|
|
|
|
|
|
|
|
|
|
|
|
2015 |
|
2014 |
|
2013 | |||
|
Current: |
|
|
|
|
|
|
|
|
|
|
U.S. federal statutory tax |
|
$ |
(10.7) |
|
$ |
14.8 |
|
$ |
8.2 |
|
State |
|
|
0.6 |
|
|
2.5 |
|
|
1.8 |
|
Foreign |
|
|
29.6 |
|
|
22.0 |
|
|
36.2 |
|
|
|
|
19.5 |
|
|
39.3 |
|
|
46.2 |
|
Deferred: |
|
|
|
|
|
|
|
|
|
|
U.S. federal statutory tax |
|
|
4.6 |
|
|
10.7 |
|
|
2.2 |
|
State |
|
|
3.0 |
|
|
2.7 |
|
|
0.6 |
|
Foreign |
|
|
(14.8) |
|
|
(3.0) |
|
|
(11.0) |
|
|
|
|
(7.2) |
|
|
10.4 |
|
|
(8.2) |
|
Non-current tax expense (income) |
|
|
24.0 |
|
|
1.4 |
|
|
1.5 |
|
|
|
$ |
36.3 |
|
$ |
51.1 |
|
$ |
39.5 |
Non‑current tax expense (income) is primarily related to income tax associated with the reserve for uncertain tax positions.
A reconciliation of the U.S. federal statutory income tax rate to our effective income tax rate is as follows:
|
|
|
2015 |
|
2014 |
|
2013 |
|
|
U.S. federal statutory tax rate |
|
35.0 |
% |
35.0 |
% |
35.0 |
% |
|
Foreign earnings, net of foreign taxes |
|
(28.2) |
|
(18.1) |
|
(18.7) |
|
|
State income taxes, net of U.S. federal income tax benefit |
|
1.1 |
|
1.3 |
|
0.6 |
|
|
U.S. tax on deemed dividends |
|
6.1 |
|
1.0 |
|
1.4 |
|
|
Brazil foreign currency effect on other comprehensive income |
|
(5.4) |
|
(1.5) |
|
(1.4) |
|
|
Other permanent differences |
|
8.0 |
|
1.3 |
|
(0.9) |
|
|
Effective income tax rate |
|
16.6 |
% |
19.0 |
% |
16.0 |
% |
For 2015, our effective income tax rate was 16.6%, for an income tax provision of $36.3 million, as compared to an effective income tax rate of 19.0% and an income tax provision of $51.1 million for 2014. The lower effective income tax rate for 2015, as compared to 2014, resulted principally from differences in the results of our subsidiaries in tax jurisdictions with different income tax rates and a 2014 U.S. gain on the sale of the crude oil joint venture. Without the gain on the sale of the crude oil joint venture interests, the 2014 effective income tax rate would have been 17.7%.
For 2014, our effective income tax rate was 19.0%, for an income tax provision of $51.1 million, as compared to an effective income tax rate of 16.0% and an income tax provision of $39.5 million for 2013. The higher effective income tax rate for 2014 resulted primarily from differences in the results of our subsidiaries in tax jurisdictions with different income tax rates and a U.S. gain on the sale of the crude oil joint venture interests as compared to 2013. Without the gain on the sale of the crude oil joint venture interests, for 2014, our effective income tax rate would have been 17.7%.
For 2013, our effective income tax rate was 16.0%, for an income tax provision of $39.5 million, as compared to an effective income tax rate of 16.0% and an income tax provision of $38.2 million for 2012. The effective income tax rate for 2013 remained flat compared to 2012. However, there were underlying differences in the actual results of our subsidiaries in tax jurisdictions with different income tax rates as compared to 2012 and differences in outstanding uncertain tax positions net of certain nonrecurring discrete tax items including statute lapses, audit settlements, and a change in estimate.
U.S. income taxes have not been provided on undistributed earnings of foreign subsidiaries. As of December 31, 2015 and 2014, we had $1.5 billion and $1.3 billion, respectively, of earnings attributable to foreign subsidiaries. Our intention is to reinvest these earnings permanently in active non‑U.S. business operations. Therefore, no income tax liability has been accrued for these earnings. Because of the availability of U.S. foreign tax credits, it is not practicable to determine the amount of U.S. income tax payable if such earnings are not reinvested indefinitely.
75
The temporary differences which comprise our net deferred tax liabilities are as follows (in millions):
|
|
|
As of December 31, |
||||
|
|
|
2015 |
|
2014 | ||
|
Gross Deferred Tax Assets: |
|
|
|
|
|
|
|
Bad debt reserve |
|
$ |
5.0 |
|
$ |
5.5 |
|
Net operating loss |
|
|
13.0 |
|
|
4.8 |
|
Accrued and other share-based compensation |
|
|
20.6 |
|
|
21.6 |
|
Accrued expenses |
|
|
— |
|
|
8.6 |
|
U.S. foreign income tax credits |
|
|
5.3 |
|
|
— |
|
Other income tax credits |
|
|
0.7 |
|
|
— |
|
Customer deposits |
|
|
5.7 |
|
|
6.1 |
|
Installment sale |
|
|
6.7 |
|
|
6.6 |
|
Cash flow hedges |
|
|
0.8 |
|
|
— |
|
Unrealized foreign exchange |
|
|
18.2 |
|
|
7.6 |
|
Total gross deferred tax assets |
|
|
76.0 |
|
|
60.8 |
|
Less: Valuation allowance |
|
|
2.9 |
|
|
— |
|
Gross deferred tax assets, net of valuation allowance |
|
|
73.1 |
|
|
60.8 |
|
Deferred Tax Liabilities: |
|
|
|
|
|
|
|
Depreciation |
|
|
(20.8) |
|
|
(13.1) |
|
Goodwill and intangible assets |
|
|
(56.2) |
|
|
(45.3) |
|
Prepaid expenses, deductible for tax purposes |
|
|
(4.4) |
|
|
(4.5) |
|
Accrued expenses |
|
|
(2.5) |
|
|
— |
|
Unrealized derivatives |
|
|
(5.1) |
|
|
(8.2) |
|
Other |
|
|
— |
|
|
(1.2) |
|
Total gross deferred tax liabilities |
|
|
(89.0) |
|
|
(72.3) |
|
Net deferred tax liability |
|
$ |
(15.9) |
|
$ |
(11.5) |
|
Reported on the consolidated balance sheets as: |
|
|
|
|
|
|
|
Other current assets for deferred tax assets, current |
|
$ |
— |
|
$ |
22.8 |
|
Identifiable intangible and other non-current assets for deferred tax assets, non-current |
|
$ |
20.7 |
|
$ |
15.6 |
|
Accrued expenses and other current liabilities for deferred tax liabilities, current |
|
$ |
— |
|
$ |
0.4 |
|
Non-current income tax liabilities, net for deferred tax liabilities, non-current |
|
$ |
36.6 |
|
$ |
49.4 |
As of December 31, 2015 and 2014, we had net operating losses (“NOLs”) of approximately $42.2 million and $19.9 million, respectively. The NOLs as of December 31, 2015 originated in various countries including the United States, Brazil, Puerto Rico, the United Kingdom, Chile, Argentina and The Netherlands. Our NOL carryforward includes $6.0 million from the acquisition of Pester which is subject to an annual limitation as a result of the change in ownership pursuant to Section 382 of the Internal Revenue Code of 1986, as amended. We have recorded a deferred tax asset of $13.0 million reflecting the benefit of the NOL carryforward as of December 31, 2015. This deferred tax asset expires as follows (in millions):
|
|
|
Deferred |
|
|
Expiration Date |
|
Tax Asset |
|
|
December 31, 2016 |
|
$ |
0.1 |
|
December 31, 2020 |
|
|
0.6 |
|
December 31, 2021 |
|
|
0.1 |
|
December 31, 2022 |
|
|
0.1 |
|
December 31, 2023 |
|
|
0.3 |
|
December 31, 2024 |
|
|
1.1 |
|
December 31, 2025 |
|
|
0.1 |
|
March 31, 2032 |
|
|
0.3 |
|
March 31, 2033 |
|
|
0.5 |
|
March 31, 2034 |
|
|
1.2 |
|
December 31, 2035 |
|
|
5.6 |
|
Indefinite |
|
|
3.0 |
|
Total |
|
$ |
13.0 |
76
We assessed the available positive and negative evidence to estimate if sufficient future taxable income will be generated to use the existing deferred tax assets. On the basis of this evaluation, as of December 31, 2015, a valuation allowance of $2.9 million has been recorded to recognize only the portion of the deferred tax asset that is more likely than not to be realized. The amount of the deferred tax asset considered realizable could be adjusted if estimates of future taxable income during the carryforward period change or if objective negative evidence in the form of cumulative losses is no longer present and additional weight may be given to subjective evidence such as growth projections.
In addition, as a result of certain realization requirements of accounting guidance on stock compensation, the table of deferred tax assets and liabilities shown above does not include certain deferred tax assets as of December 31, 2015 and 2014 that arose directly from income tax deductions related to equity compensation in excess of compensation recognized for financial reporting. As of December 31, 2015 and 2014, we had no foreign tax credits related to the excess stock compensation deductions that resulted in an income tax deduction or credit before the realization of the income tax benefit from the deduction or credit. We use the “with and without” method for purposes of determining when excess income tax benefits have been realized.
As of December 31, 2015 and 2014, our annual capital in excess of par value pool of windfall income tax benefits related to employee compensation was estimated to be nil and $1.0 million, respectively. As of December 31, 2015, we had unrecognized U.S. NOLs of $4.5 million related to the exercise of stock awards. When realized, the U.S. NOL will result in a benefit recorded in additional paid in capital of $1.6 million, with a corresponding decrease in income tax payable.
We operated under a special income tax concession in Singapore which began January 1, 2008. Our current five year special income tax concession was effective on January 1, 2013. The special income tax concession is conditional upon our meeting certain employment and investment thresholds which, if not met in accordance with our agreement, may eliminate the benefit beginning with the first year in which the conditions are not satisfied. The income tax concession reduces the income tax rate on qualified sales and the impact of this income tax concession decreased foreign income taxes by $5.0 million, $7.5 million and $6.2 million for 2015, 2014 and 2013, respectively. The impact of the income tax concession on basic earnings per common share was $0.07 for 2015, $0.11 for 2014 and $0.09 for 2013. On a diluted earnings per common share basis, the impact was $0.07 for 2015, $0.10 for 2014 and $0.09 for 2013.
Income Tax Contingencies
We recorded an increase of $22.4 million of liabilities related to unrecognized income tax benefits (“Unrecognized Tax Liabilities”) and a decrease of $0.4 million of assets related to unrecognized income tax benefits (“Unrecognized Tax Assets”) during 2015. In addition, during 2015, we recorded a decrease of $0.7 million to our Unrecognized Tax Liabilities related to a foreign currency translation gain, which is included in other income (expense), net, in the accompanying consolidated statements of income and comprehensive income. As of December 31, 2015, our Unrecognized Tax Liabilities, including penalties and interest, were $56.1 million and our Unrecognized Tax Assets were $1.9 million.
We recorded a decrease of $2.1 million of liabilities related to unrecognized income tax benefits (“Unrecognized Tax Liabilities”) and a decrease of $4.5 million of assets related to unrecognized income tax benefits (“Unrecognized Tax Assets”) during 2014. In addition, during 2014, we recorded a decrease of $0.5 million to our Unrecognized Tax Liabilities related to a foreign currency translation gain, which is included in other income (expense), net, in the accompanying consolidated statements of income and comprehensive income. As of December 31, 2014, our Unrecognized Tax Liabilities, including penalties and interest, were $33.0 million and our Unrecognized Tax Assets were $2.3 million.
The following is a tabular reconciliation of the total amounts of unrecognized income tax benefits for the year (in millions):
|
|
|
|
|
|
|
|
|
|
|
|
|
|
2015 |
|
2014 |
|
2013 | |||
|
Unrecognized Tax Liabilities – opening balance |
|
$ |
24.3 |
|
$ |
26.5 |
|
$ |
22.3 |
|
Gross increases – tax positions in prior period |
|
|
9.2 |
|
|
— |
|
|
2.6 |
|
Gross decreases – tax positions in prior period |
|
|
(4.8) |
|
|
(2.8) |
|
|
— |
|
Gross increases – tax positions in current period |
|
|
20.9 |
|
|
6.6 |
|
|
5.0 |
|
Gross decreases – tax positions in current period |
|
|
— |
|
|
— |
|
|
— |
|
Settlements |
|
|
— |
|
|
(3.6) |
|
|
— |
|
Lapse of statute of limitations |
|
|
(2.9) |
|
|
(2.4) |
|
|
(3.4) |
|
Unrecognized Tax Liabilities – ending balance |
|
$ |
46.7 |
|
$ |
24.3 |
|
$ |
26.5 |
If our uncertain tax positions as of December 31, 2015 are settled by the taxing authorities in our favor, our income tax expense would be reduced by $45.3 million (exclusive of interest and penalties) in the period the matter is considered settled in accordance with Accounting Standards Codification 740. This would have the impact of reducing our 2015 effective
77
income tax rate by 20.7%. As of December 31, 2015, it does not appear that the total amount of our unrecognized income tax benefits will significantly increase or decrease within the next twelve months.
We record accrued interest and penalties related to unrecognized income tax benefits as income tax expense. Related to the uncertain income tax benefits noted above, for interest we recorded expense of $0.9 million during 2015 and income of $0.6 million and $0.6 million during 2014 and 2013, respectively. For penalties, we recorded income of $0.3 million, $0.3 million and $0.3 million during 2015, 2014 and 2013, respectively. As of December 31, 2015 and 2014, we had recognized liabilities of $5.2 million and $4.2 million for interest and $4.2 million and $4.5 million for penalties, respectively.
In many cases, our uncertain tax positions are related to tax years that remain subject to examination by the relevant taxing authorities. The following table summarizes these open tax years by jurisdiction with major uncertain tax positions:
|
|
|
|
|
|
|
|
|
Open Tax Year |
||
|
|
|
Examination |
|
Examination not |
|
Jurisdiction |
|
in progress |
|
yet initiated |
|
United States |
|
2011,2012 |
|
2013 - 2015 |
|
Singapore |
|
None |
|
2011 - 2015 |
|
United Kingdom |
|
None |
|
2012 - 2015 |
|
Brazil |
|
2009 |
|
2010 - 2015 |
|
Chile |
|
None |
|
2013 - 2015 |
|
Denmark |
|
None |
|
2013 - 2015 |
10. Fair Value Measurements
The carrying amounts of cash and cash equivalents, accounts receivable, net, accounts payable and accrued expenses and other current liabilities approximate fair value based on the short‑term maturities of these instruments. Fair value for our debt and notes receivable is derived using a discounted cash flow valuation methodology. The carrying values of these instruments approximate fair value since these instruments bear interest either at variable rates or fixed rates which are not significantly different than market rates. Based on the fair value hierarchy, our debt of $746.6 million and $689.9 million as of December 31, 2015 and December 31, 2014, respectively, and our notes receivable of $7.4 million and $7.0 million as of December 31, 2015 and December 31, 2014, respectively are categorized in Level 3.
78
The following table presents information about our assets and liabilities that are measured at fair value on a recurring basis as of December 31, 2015 and 2014 (in millions):
|
|
|
|
|
|
|
|
|
|
|
|
|
|
|
Netting and |
|
|
|
|
|
|
|
Level 1 |
|
Level 2 |
|
Level 3 |
|
Sub-Total |
|
Collateral |
|
Total |
||||||
|
2015 |
|
|
|
|
|
|
|
|
|
|
|
|
|
|
|
|
|
|
|
Assets: |
|
|
|
|
|
|
|
|
|
|
|
|
|
|
|
|
|
|
|
Commodity contracts |
|
$ |
255.4 |
|
$ |
251.9 |
|
$ |
3.2 |
|
$ |
510.5 |
|
$ |
(279.0) |
|
$ |
231.5 |
|
Foreign currency contracts |
|
|
— |
|
|
12.4 |
|
|
— |
|
|
12.4 |
|
|
(4.1) |
|
|
8.3 |
|
Cash surrender value of life insurance |
|
|
— |
|
|
2.4 |
|
|
— |
|
|
2.4 |
|
|
— |
|
|
2.4 |
|
Total |
|
$ |
255.4 |
|
$ |
266.7 |
|
$ |
3.2 |
|
$ |
525.3 |
|
$ |
(283.1) |
|
$ |
242.2 |
|
Liabilities: |
|
|
|
|
|
|
|
|
|
|
|
|
|
|
|
|
|
|
|
Commodity contracts |
|
$ |
340.1 |
|
$ |
123.4 |
|
$ |
0.2 |
|
$ |
463.7 |
|
$ |
(389.6) |
|
$ |
74.1 |
|
Foreign currency contracts |
|
|
— |
|
|
5.0 |
|
|
— |
|
|
5.0 |
|
|
(4.1) |
|
|
0.9 |
|
Inventories |
|
|
— |
|
|
14.3 |
|
|
|
|
|
14.3 |
|
|
— |
|
|
14.3 |
|
Total |
|
$ |
340.1 |
|
$ |
142.7 |
|
$ |
0.2 |
|
$ |
483.0 |
|
$ |
(393.7) |
|
$ |
89.3 |
|
2014 |
|
|
|
|
|
|
|
|
|
|
|
|
|
|
|
|
|
|
|
Assets: |
|
|
|
|
|
|
|
|
|
|
|
|
|
|
|
|
|
|
|
Commodity contracts |
|
$ |
173.7 |
|
$ |
495.6 |
|
$ |
4.2 |
|
$ |
673.5 |
|
$ |
(368.0) |
|
$ |
305.5 |
|
Foreign currency contracts |
|
|
— |
|
|
21.8 |
|
|
— |
|
|
21.8 |
|
|
(12.0) |
|
|
9.8 |
|
Cash surrender value of life insurance |
|
|
— |
|
|
2.2 |
|
|
— |
|
|
2.2 |
|
|
— |
|
|
2.2 |
|
Total |
|
$ |
173.7 |
|
$ |
519.6 |
|
$ |
4.2 |
|
$ |
697.5 |
|
$ |
(380.0) |
|
$ |
317.5 |
|
Liabilities: |
|
|
|
|
|
|
|
|
|
|
|
|
|
|
|
|
|
|
|
Commodity contracts |
|
$ |
306.4 |
|
$ |
329.9 |
|
$ |
1.3 |
|
$ |
637.6 |
|
$ |
(595.6) |
|
$ |
42.0 |
|
Foreign currency contracts |
|
|
— |
|
|
12.0 |
|
|
— |
|
|
12.0 |
|
|
(12.0) |
|
|
— |
|
Inventories |
|
|
— |
|
|
22.9 |
|
|
— |
|
|
22.9 |
|
|
— |
|
|
22.9 |
|
Total |
|
$ |
306.4 |
|
$ |
364.8 |
|
$ |
1.3 |
|
$ |
672.5 |
|
$ |
(607.6) |
|
$ |
64.9 |
The cash surrender value of life insurance is in connection with the NQDC plan and was included in identifiable intangible and other non-current assets in the accompanying consolidated balance sheets.
Nonrecurring Fair Value Measurements. In connection with the acquisition of all of the outstanding stock of Pester, we committed to a plan to sell certain assets and liabilities of Pester’s fuel retail business. The fair value of the assets and liabilities held for sale were measured using a discounted cash flow valuation methodology. In accordance with the applicable accounting guidance, the long-lived assets held for sale were recorded at fair value less cost to sell at the acquisition date. The carrying amounts of the current assets and liabilities held for sale approximate fair value based on the short-term maturities of these instruments. Based on the fair value hierarchy, as of December 31, 2015, the fair value of the asset disposal group (excluding inventories) of $37.8 million and the liability disposal group of $10.6 million were categorized as Level 3, as significant unobservable inputs were used in the valuation of such assets and liabilities. The inventories of $4.2 million as of December 31, 2015 were categorized as Level 2 as they were valued based on the price to retailers in a wholesale market.
79
The following table presents information regarding the balance sheet location of our commodity and foreign currency contracts net assets and liabilities (in millions):
|
|
|
|
|
|
|
|
|
|
|
As of December 31, |
||||
|
|
|
2015 |
|
2014 | ||
|
Commodity Contracts |
|
|
|
|
|
|
|
Assets: |
|
|
|
|
|
|
|
Short-term derivative assets, net |
|
$ |
212.6 |
|
$ |
294.3 |
|
Identifiable intangible and other non-current assets |
|
|
18.9 |
|
|
11.2 |
|
Total net assets |
|
$ |
231.5 |
|
$ |
305.5 |
|
Liabilities: |
|
|
|
|
|
|
|
Accrued expenses and other current liabilities |
|
$ |
68.7 |
|
$ |
41.3 |
|
Other long-term liabilities |
|
|
5.4 |
|
|
0.7 |
|
Total net liabilities |
|
$ |
74.1 |
|
$ |
42.0 |
|
Foreign Currency Contracts |
|
|
|
|
|
|
|
Assets: |
|
|
|
|
|
|
|
Short-term derivative assets, net |
|
$ |
7.6 |
|
$ |
9.3 |
|
Identifiable intangible and other non-current assets |
|
|
0.7 |
|
|
0.5 |
|
Total net assets |
|
$ |
8.3 |
|
$ |
9.8 |
|
Liabilities: |
|
|
|
|
|
|
|
Accrued expenses and other current liabilities |
|
$ |
0.9 |
|
$ |
— |
|
Total net liabilities |
|
$ |
0.9 |
|
$ |
— |
For our derivative contracts, we may enter into master netting, collateral and offset agreements with counterparties. These agreements provide us the ability to offset a counterparty’s rights and obligations, request additional collateral when necessary or liquidate the collateral in the event of counterparty default. We net fair value of cash collateral paid or received against fair value amounts recognized for net derivative positions executed with the same counterparty under the same master netting or offset agreement.
As of December 31, 2015, we had $174.6 million of cash collateral deposits held by financial counterparties, of which $132.2 million have been offset against the total amount of commodity fair value liabilities in the above table and the remaining $42.4 million is included in other current assets in the accompanying consolidated balance sheets. In addition, as of December 31, 2015, we have offset $21.6 million of cash collateral deposits received from customers against the total amount of commodity fair value assets in the above table. As of December 31, 2014, we had $301.0 million of cash collateral deposits held by financial counterparties, of which $274.3 million have been offset against the total amount of commodity fair value liabilities in the above table and the remaining $26.7 million is included in other current assets in the accompanying consolidated balance sheets. In addition, as of December 31, 2014, we have offset $46.7 million of cash collateral deposits received from customers against the total amount of commodity fair value assets in the above table.
The following table presents information about our assets and liabilities that are measured at fair value on a recurring basis that utilized Level 3 inputs for the periods presented (in millions):
|
|
|
Beginning of Period |
|
Realized and Unrealized Gains (Losses) Included in Earnings |
|
Settlements |
|
|
Transfers into Level 3 |
|
|
End of Period |
|
|
Change in Unrealized Gains (Losses) Relating to Assets and Liabilities that are Held at end of Period |
|
Location of Realized and Unrealized gains (Losses) in Earnings |
|||
|
2015 |
|
|
|
|
|
|
|
|
|
|
|
|
|
|
|
|
|
|
|
|
|
Assets: |
|
|
|
|
|
|
|
|
|
|
|
|
|
|
|
|
|
|
|
|
|
Commodity contracts |
|
$ |
4.2 |
|
$ |
3.4 |
|
$ |
5.3 |
|
$ |
1.0 |
|
$ |
3.3 |
|
$ |
2.8 |
|
Revenue |
|
Liabilities: |
|
|
|
|
|
|
|
|
|
|
|
|
|
|
|
|
|
|
|
|
|
Commodity contracts |
|
$ |
1.3 |
|
$ |
0.6 |
|
$ |
0.5 |
|
$ |
(0.1) |
|
$ |
0.3 |
|
$ |
0.2 |
|
Cost of revenue |
|
2014 |
|
|
|
|
|
|
|
|
|
|
|
|
|
|
|
|
|
|
|
|
|
Assets: |
|
|
|
|
|
|
|
|
|
|
|
|
|
|
|
|
|
|
|
|
|
Commodity contracts |
|
$ |
— |
|
$ |
12.7 |
|
$ |
8.9 |
|
$ |
0.4 |
|
$ |
4.2 |
|
$ |
4.2 |
|
Revenue |
|
Liabilities: |
|
|
|
|
|
|
|
|
|
|
|
|
|
|
|
|
|
|
|
|
|
Commodity contracts |
|
$ |
— |
|
$ |
(1.4) |
|
$ |
0.1 |
|
$ |
— |
|
$ |
(1.3) |
|
$ |
(1.3) |
|
Cost of revenue |
80
The nature of inputs that are considered Level 3 are modeled inputs. Commodity contracts are categorized in Level 3 due to the significance of the unobservable model inputs to their respective fair values. The unobservable model inputs, such as basis differentials, are based on the difference between the historical prices of our prior transactions and the underlying observable data as well as certain risk related to non-performance. The effect on our income before income taxes of a 10% change in the model input for non-performance risk would not be significant. There were no transfers between Level 1 and Level 2 during the periods presented. Transfers between Level 2 and Level 3 were due to the increased significance of basis adjustments which are Level 3 measurements.
11. Business Segments, Geographic Information, and Major Customers
Business Segments
Based on the nature of operations and quantitative thresholds pursuant to the accounting guidance on segment reporting, we have three reportable operating business segments: aviation, marine and land. Corporate expenses are allocated to the segments based on usage, where possible, or on other factors according to the nature of the activity. Please refer to Note 1 for the dates that the results of operations and related assets and liabilities of our acquisitions have been included in our operating segments. The accounting policies of the reportable operating segments are the same as those described in the Summary of Significant Accounting Policies (see Note 1).
Information concerning our revenue, gross profit, income from operations, depreciation and amortization and capital expenditures by segment is as follows (in millions):
|
|
|
|
|
|
|
|
|
|
|
|
|
|
For the Year ended December 31, |
|||||||
|
|
|
2015 |
|
2014 |
|
2013 | |||
|
Revenue: |
|
|
|
|
|
|
|
|
|
|
Aviation segment |
|
$ |
11,738.2 |
|
$ |
17,268.8 |
|
$ |
16,087.6 |
|
Marine segment |
|
|
9,367.2 |
|
|
13,843.3 |
|
|
14,790.3 |
|
Land segment |
|
|
9,274.3 |
|
|
12,274.3 |
|
|
10,684.0 |
|
|
|
$ |
30,379.7 |
|
$ |
43,386.4 |
|
$ |
41,561.9 |
|
Gross profit: |
|
|
|
|
|
|
|
|
|
|
Aviation segment |
|
$ |
361.4 |
|
$ |
321.6 |
|
$ |
327.2 |
|
Marine segment |
|
|
189.6 |
|
|
205.6 |
|
|
177.1 |
|
Land segment |
|
|
309.5 |
|
|
286.4 |
|
|
248.5 |
|
|
|
$ |
860.5 |
|
$ |
813.6 |
|
$ |
752.8 |
|
Income from operations: |
|
|
|
|
|
|
|
|
|
|
Aviation segment |
|
$ |
131.7 |
|
$ |
142.3 |
|
$ |
150.9 |
|
Marine segment |
|
|
73.0 |
|
|
90.0 |
|
|
73.8 |
|
Land segment |
|
|
103.4 |
|
|
90.3 |
|
|
84.8 |
|
|
|
|
308.1 |
|
|
322.6 |
|
|
309.5 |
|
Corporate overhead – unallocated |
|
|
60.9 |
|
|
53.5 |
|
|
45.0 |
|
|
|
$ |
247.2 |
|
$ |
269.1 |
|
$ |
264.5 |
|
Depreciation and amortization: |
|
|
|
|
|
|
|
|
|
|
Aviation segment, includes allocation from corporate |
|
$ |
22.5 |
|
$ |
15.4 |
|
$ |
15.9 |
|
Marine segment, includes allocation from corporate |
|
|
6.4 |
|
|
5.6 |
|
|
5.4 |
|
Land segment, includes allocation from corporate |
|
|
30.8 |
|
|
34.7 |
|
|
20.8 |
|
Corporate |
|
|
3.7 |
|
|
3.7 |
|
|
2.6 |
|
|
|
$ |
63.4 |
|
$ |
59.4 |
|
$ |
44.7 |
|
Capital expenditures: |
|
|
|
|
|
|
|
|
|
|
Aviation segment |
|
$ |
13.4 |
|
$ |
9.0 |
|
$ |
5.8 |
|
Marine segment |
|
|
8.0 |
|
|
13.9 |
|
|
17.3 |
|
Land segment |
|
|
16.4 |
|
|
16.0 |
|
|
54.3 |
|
Corporate |
|
|
10.6 |
|
|
12.9 |
|
|
5.3 |
|
|
|
$ |
48.4 |
|
$ |
51.8 |
|
$ |
82.7 |
81
Information concerning our accounts receivable, net, goodwill, identifiable intangible assets, net and total assets by segment is as follows (in millions):
|
|
|
|
|
|
|
|
|
|
|
As of December 31, |
||||
|
|
|
2015 |
|
2014 | ||
|
Accounts receivable, net: |
|
|
|
|
|
|
|
Aviation segment, net of allowance for bad debt of $6.1 and $7.9 as of December 31, 2015 and 2014 respectively |
|
$ |
571.6 |
|
$ |
685.1 |
|
Marine segment, net of allowance for bad debt of $10.6 and $8.4 as of December 31, 2015 and 2014 respectively |
|
|
611.2 |
|
|
974.0 |
|
Land segment, net of allowance for bad debt of $7.2 and $9.4 as of December 31, 2015 and 2014 respectively |
|
|
629.8 |
|
|
647.3 |
|
|
|
$ |
1,812.6 |
|
$ |
2,306.4 |
|
Goodwill: |
|
|
|
|
|
|
|
Aviation segment |
|
$ |
173.7 |
|
$ |
174.3 |
|
Marine segment |
|
|
71.4 |
|
|
73.1 |
|
Land segment |
|
|
430.7 |
|
|
405.9 |
|
|
|
$ |
675.8 |
|
$ |
653.3 |
|
Identifiable intangible assets, net: |
|
|
|
|
|
|
|
Aviation segment |
|
$ |
64.7 |
|
$ |
72.9 |
|
Marine segment |
|
|
6.0 |
|
|
7.2 |
|
Land segment |
|
|
140.2 |
|
|
137.5 |
|
|
|
$ |
210.9 |
|
$ |
217.6 |
|
Total assets: |
|
|
|
|
|
|
|
Aviation segment |
|
$ |
1,546.4 |
|
$ |
1,636.5 |
|
Marine segment |
|
|
1,165.6 |
|
|
1,483.0 |
|
Land segment |
|
|
1,651.5 |
|
|
1,570.6 |
|
Corporate |
|
|
185.9 |
|
|
190.9 |
|
|
|
$ |
4,549.4 |
|
$ |
4,881.0 |
Geographic Information
Information concerning our revenue, income from operations, non‑current assets and total assets, as segregated between the Americas, EMEA (Europe, Middle East and Africa) and the Asia/Pacific regions, is presented as follows, based on the country of incorporation of the relevant subsidiary (in millions):
|
|
|
|
|
|
|
|
|
|
|
|
|
|
For the Year ended December 31, |
|||||||
|
|
|
2015 |
|
2014 |
|
2013 | |||
|
Revenue: |
|
|
|
|
|
|
|
|
|
|
United States |
|
$ |
15,494.6 |
|
$ |
21,514.3 |
|
$ |
21,149.2 |
|
EMEA (1) |
|
|
6,382.2 |
|
|
8,612.8 |
|
|
7,017.5 |
|
Asia/Pacific (2) |
|
|
5,863.4 |
|
|
9,844.7 |
|
|
10,215.4 |
|
Americas, excluding United States |
|
|
2,639.5 |
|
|
3,414.6 |
|
|
3,179.8 |
|
Total |
|
$ |
30,379.7 |
|
$ |
43,386.4 |
|
$ |
41,561.9 |
|
Income from operations: |
|
|
|
|
|
|
|
|
|
|
United States |
|
$ |
16.9 |
|
$ |
52.2 |
|
$ |
50.0 |
|
EMEA |
|
|
157.7 |
|
|
121.7 |
|
|
109.6 |
|
Asia/Pacific |
|
|
54.4 |
|
|
74.7 |
|
|
70.6 |
|
Americas, excluding United States |
|
|
18.2 |
|
|
20.5 |
|
|
34.3 |
|
Total |
|
$ |
247.2 |
|
$ |
269.1 |
|
$ |
264.5 |
82
|
|
|
|
|
|
|
|
|
|
|
As of December 31, |
||||
|
|
|
2015 |
|
2014 | ||
|
Non-current assets: |
|
|
|
|
|
|
|
United States |
|
$ |
639.9 |
|
$ |
548.1 |
|
EMEA |
|
|
604.6 |
|
|
595.4 |
|
Asia/Pacific |
|
|
5.3 |
|
|
12.3 |
|
Americas, excluding United States |
|
|
45.0 |
|
|
51.8 |
|
Total |
|
$ |
1,294.8 |
|
$ |
1,207.6 |
|
Total assets: |
|
|
|
|
|
|
|
United States |
|
$ |
1,899.3 |
|
$ |
1,908.1 |
|
EMEA |
|
|
1,719.5 |
|
|
1,697.7 |
|
Asia/Pacific |
|
|
614.9 |
|
|
922.7 |
|
Americas, excluding United States |
|
|
315.7 |
|
|
352.5 |
|
Total |
|
$ |
4,549.4 |
|
$ |
4,881.0 |
|
(1) |
Includes revenue related to the United Kingdom of $4.7 billion, $6.2 billion and $5.0 billion for 2015, 2014 and 2013, respectively. |
(2) Includes revenue related to Singapore of $5.8 billion, $9.7 billion and $10.1 billion for 2015, 2014 and 2013, respectively.
Major Customers
During each of the years presented on the consolidated statements of income and comprehensive income, none of our customers accounted for more than 10% of total consolidated revenue.
12. Summary Quarterly Information (Unaudited)
The following is a summary of the unaudited quarterly results for 2015 and 2014 (in millions, except earnings per share data):
|
|
|
March 31, |
|
June 30, |
|
September 30, |
|
December 31, |
||||
|
|
|
2015 (1) |
|
2015 (1) |
|
2015 (1)(2) |
|
2015 (1)(2) |
||||
|
Revenue |
|
$ |
7,340.7 |
|
$ |
8,496.4 |
|
$ |
7,810.7 |
|
$ |
6,731.9 |
|
Gross profit |
|
$ |
215.4 |
|
$ |
190.4 |
|
$ |
226.7 |
|
$ |
228.0 |
|
Net income including noncontrolling interest |
|
$ |
54.6 |
|
$ |
28.4 |
|
$ |
48.6 |
|
$ |
51.4 |
|
Net income attributable to World Fuel |
|
$ |
55.6 |
|
$ |
29.9 |
|
$ |
49.6 |
|
$ |
51.8 |
|
Basic earnings per common share (7) |
|
$ |
0.79 |
|
$ |
0.42 |
|
$ |
0.71 |
|
$ |
0.75 |
|
Diluted earnings per common share (7) |
|
$ |
0.78 |
|
$ |
0.42 |
|
$ |
0.71 |
|
$ |
0.74 |
|
|
|
March 31, |
|
June 30, |
|
September 30, |
|
December 31, |
||||
|
|
|
2014 (3) |
|
2014 (3)(4) |
|
2014 (3)(4)(5) |
|
2014 (3)(4)(5)(6) |
||||
|
Revenue |
|
$ |
10,550.9 |
|
$ |
11,342.5 |
|
$ |
11,713.4 |
|
$ |
9,779.5 |
|
Gross profit |
|
$ |
188.0 |
|
$ |
191.5 |
|
$ |
214.6 |
|
$ |
219.5 |
|
Net income including noncontrolling interest |
|
$ |
50.5 |
|
$ |
46.3 |
|
$ |
54.4 |
|
$ |
67.1 |
|
Net income attributable to World Fuel |
|
$ |
50.7 |
|
$ |
48.2 |
|
$ |
55.6 |
|
$ |
67.1 |
|
Basic earnings per common share (7) |
|
$ |
0.72 |
|
$ |
0.68 |
|
$ |
0.79 |
|
$ |
0.95 |
|
Diluted earnings per common share |
|
$ |
0.71 |
|
$ |
0.68 |
|
$ |
0.78 |
|
$ |
0.94 |
|
(1) |
Includes the after-tax termination of employment agreement of $2.3 million, or $0.03 per basic and diluted share in the first quarter of 2015. |
|
(2) |
Includes the Pester Marketing operations since September 1, 2015 as a result of the acquisition. |
|
(3) |
Includes the Watson Petroleum operations since March 7, 2014 as a result of the acquisition. |
|
(4) |
Includes after-tax executive non-renewal charge of $3.0 million, or $0.04 per basic and diluted share in the second quarter of 2014. |
|
(5) |
Includes Colt operations since July 29, 2014 as a result of the acquisition. |
|
(6) |
Includes after-tax gain on the sale of the crude oil joint venture interests of $9.9 million, or $0.14 per basic and diluted share in the fourth quarter of 2014. |
|
(7) |
Basic and diluted earnings per share are computed independently for each quarter and the full year based upon respective weighted average shares outstanding. Therefore, the sum of the quarterly basic and diluted earnings per share amounts may not equal the |
83
annual basic and diluted earnings per share amounts reported. |
13. Assets and Liabilities Held for Sale
In connection with the acquisition of all of the outstanding stock of Pester, we committed to a plan to sell certain assets and liabilities of Pester’s fuel retail business. As all of the criteria for classification as held for sale were met, those assets and liabilities of the business were presented separately as held for sale in our consolidated balance sheets as of December 31, 2015. Current assets held for sale of the disposal group, which includes inventories and other current assets, were $5.5 million. The non-current assets held for sale, which include property and equipment, goodwill and identifiable intangible assets, were $36.5 million. Current liabilities held for sale, which includes accounts payable and accrued expenses and other current liabilities, were $5.6 million. Non-current liabilities held for sale, comprised of deferred tax liabilities, were $5.0 million. These net assets have been reported as part of our land segment.
14. Subsequent Event
In February 2016, we signed a definitive agreement to acquire from certain ExxonMobil affiliates their aviation fueling operations at 83 airports in Canada, the United Kingdom, Germany, Italy, Australia and New Zealand. Further, an additional three locations in France are expected to be added to the definitive agreement subject to certain required reviews associated with such transaction. The transaction will close in phases, with the majority of locations expected to close during the second half of 2016. The transaction is subject to customary regulatory consents and closing conditions, including securing third party consents and therefore there can be no assurance that we will be successful in closing the acquisition.
84
Pursuant to the requirements of Section 13 or 15(d) of the Securities Exchange Act of 1934, the registrant has duly caused this Form 10‑K to be signed on its behalf by the undersigned, thereunto duly authorized, on the 16th day of February 2016.
WORLD FUEL SERVICES CORPORATION
|
/s/ MICHAEL J. KASBAR
Michael J. Kasbar |
|
|
|
|
|
/s/ IRA M. BIRNS
Ira M. Birns |
|
Pursuant to the requirements of the Securities Exchange Act of 1934, this Form 10‑K has been signed below by the following persons on behalf of the registrant and in the capacities indicated on the 16th day of February 2016.
|
Signature |
Title |
|
/s/ MICHAEL J. KASBAR Michael J. Kasbar |
Chairman, President and Chief Executive Officer |
|
/s/ IRA M. BIRNS Ira M. Birns |
Executive Vice President and Chief Financial Officer |
|
/s/ CARLOS M. VELAZQUEZ Carlos M. Velazquez |
Senior Vice President and Chief Accounting Officer |
|
/s/ KEN BAKSHI Ken Bakshi |
Director |
|
/s/ JORGE L. BENITEZ Jorge L. Benitez |
Director |
|
/s/ RICHARD A. KASSAR Richard A. Kassar |
Director |
|
/s/ MYLES KLEIN Myles Klein |
Director |
|
/s/ JOHN L. MANLEY John L. Manley |
Director |
|
/s/ J. THOMAS PRESBY J. Thomas Presby |
Director |
|
/s/ STEPHEN K. RODDENBERRY Stephen K. Roddenberry |
Director |
|
/s/ PAUL H. STEBBINS Paul H. Stebbins |
Director |
85