Attached files
Table of Contents
UNITED STATES
SECURITIES AND EXCHANGE COMMISSION
Washington, DC 20549
FORM 10-K
(Mark One)
| x | ANNUAL REPORT PURSUANT TO SECTION 13 OR 15(d) OF THE SECURITIES EXCHANGE ACT OF 1934 |
FOR THE FISCAL YEAR ENDED DECEMBER 31, 2009
OR
| ¨ | TRANSITION REPORT PURSUANT TO SECTION 13 OR 15(d) OF THE SECURITIES EXCHANGE ACT OF 1934 |
FOR THE TRANSITION PERIOD FROM TO
COMMISSION FILE NUMBER 1-9533

WORLD FUEL SERVICES CORPORATION
(Exact name of registrant as specified in its charter)
| Florida | 59-2459427 | |
| (State or other jurisdiction of incorporation or organization) | (I.R.S. Employer Identification No.) |
| 9800 Northwest 41st Street, Suite 400 Miami, Florida |
33178 | |
| (Address of principal executive offices) | (Zip Code) |
Registrant’s telephone number, including area code: (305) 428-8000
Securities registered pursuant to Section 12(b) of the Act:
| Title of each class: |
Name of each exchange on which registered: | |
| Common Stock, par value $0.01 per share |
New York Stock Exchange |
Securities registered pursuant to Section 12(g) of the Act: None
Indicate by check mark if the registrant is a well-known seasoned issuer, as defined in Rule 405 of the Securities Act. Yes x No ¨
Indicate by check mark if the registrant is not required to file reports pursuant to Section 13 or Section 15(d) of the Act. Yes ¨ No x
Indicate by check mark whether the registrant (1) has filed all reports required to be filed by Section 13 or 15(d) of the Securities Exchange Act of 1934 during the preceding 12 months (or for such shorter period that the registrant was required to file such reports), and (2) has been subject to such filing requirements for the past 90 days. Yes x No ¨
Indicate by check mark whether the registrant has submitted electronically and posted on its corporate Web site, if any, every Interactive Data File required to be submitted and posted pursuant to Rule 405 of Regulation S-T (§ 232.405 of this chapter) during the preceding 12 months (or for such shorter period that the registrant was required to submit and post such files). Yes ¨ No ¨
Indicate by check mark if disclosure of delinquent filers pursuant to Item 405 of Regulation S-K is not contained herein, and will not be contained, to the best of registrant’s knowledge, in definitive proxy or information statements incorporated by reference in Part III of this Form 10-K or any amendment to this Form 10-K. ¨
Indicate by check mark whether the registrant is a large accelerated filer, an accelerated filer, a non-accelerated filer or a smaller reporting company. See definitions of “large accelerated filer,” “accelerated filer” and “smaller reporting company” in Rule 12b-2 of the Exchange Act. (Check one):
Large accelerated filer x Accelerated filer ¨ Non-Accelerated filer ¨ Smaller Reporting Company ¨
Indicate by check mark whether the registrant is a shell company (as defined in 12b-2 of the Exchange Act). Yes ¨ No x
As of June 30, 2009, the aggregate market value of the voting and non-voting common equity held by non-affiliates computed by reference to the market price at which the common equity was last sold was $1,153,680,997.
As of February 18, 2010, the registrant had approximately 59,385,000 shares of outstanding common stock, par value $0.01 per share, which reflects a two-for-one stock split effective in December 2009.
Documents incorporated by reference:
Part III—Specified Portions of the Registrant’s Definitive Proxy Statement for the 2010 Annual Meeting of Shareholders.
Table of Contents
Table of Contents
| Item 1. | Business |
Overview
World Fuel Services Corporation (the “Company”) was incorporated in Florida in July 1984 and along with its consolidated subsidiaries is referred to collectively in this Annual Report on Form 10-K (“Form 10-K”) as “World Fuel,” “we,” “our” and “us.” We commenced business as a recycler and reseller of used oil and provider of aviation services. We have since ceased the activities of a recycler and reseller of used oil. In 1986, we diversified our operations by entering the aviation fuel business. In 1995, we entered the marine fuel and related services business by acquiring the Trans-Tec group of companies. In 2003, we entered the land fuel and related services business.
We are engaged in the marketing and sale of marine, aviation and land fuel products and related services on a worldwide basis. We compete by providing our customers value-added benefits, including single-supplier convenience, competitive pricing, the availability of trade credit, price risk management, logistical support, fuel quality control and fuel procurement outsourcing. We have three reportable operating business segments: marine, aviation and land. In conjunction with our segment operations, we own and operate a small number of fuel storage terminals in the United Kingdom and lease storage facilities from third parties in other jurisdictions. We generally contract with third parties for the delivery of fuel products; however, in certain jurisdictions, we own, lease or charter road tankers, fuel barges, railcars and other delivery vessels which we use in connection with our fuel supply operations. In our marine segment, we offer fuel and related services to a broad base of maritime customers, including international container and tanker fleets, commercial cruise lines and time-charter operators, as well as to the U.S. and foreign governments. In our aviation segment, we offer fuel and related services to major commercial airlines, second and third-tier airlines, cargo carriers, regional and low cost carriers, corporate fleets, fractional operators, private aircraft, military fleets and to the U.S. and foreign governments, as well as offer a private label charge card used to purchase aviation fuel and related services to customers in the general aviation industry. In our land segment, we offer fuel and related services to petroleum distributors operating in the land transportation market, retail petroleum operators, and industrial, commercial and government customers. We also operate a small number of retail gasoline stations in the U.S.
We have offices located in the United States, the United Kingdom, Denmark, Norway, the Netherlands, Germany, Greece, Turkey, the United Arab Emirates, Russia, Taiwan, South Korea, Singapore, Japan, Hong Kong, Costa Rica, Brazil, Chile, Argentina, Mexico, Colombia, Canada and South Africa. See “Item 2—Properties” for a list of principal offices by business segment and “Exhibit 21.1—Subsidiaries of the Registrant” included in this Form 10-K for a list of our subsidiaries.
Financial information with respect to our business segments and the geographic areas of our business is provided in Note 12 to the accompanying consolidated financial statements included in this Form 10-K.
Our principal executive offices are located at 9800 Northwest 41st Street, Suite 400, Miami, Florida 33178 and our telephone number at this address is (305) 428-8000. Our internet address is www.wfscorp.com and the investor relations section of our website is located at http://ir.wfscorp.com. We make available free of charge, on or through the investor relations section of our website, our Annual Reports on Form 10-K, Quarterly Reports on Form 10-Q, Current Reports on Form 8-K, Proxy Statements and amendments to those reports filed or furnished pursuant to Section 13(a) or 15(d) of the Securities Exchange Act of 1934 (the “Exchange Act”) with the Securities and Exchange Commission (“SEC”) as soon as reasonably practicable after such material is electronically filed with, or furnished to, the SEC. Also posted on our website are our Code of Corporate Conduct and Ethics, Board of Directors’ committee charters and Corporate Governance Principles. Our internet website and information contained on our internet website are not part of this Form 10-K and are not incorporated by reference in this Form 10-K.
1
Table of Contents
Marine Segment
We market fuel and related services to a broad base of customers, including international container and tanker fleets, commercial cruise lines and time-charter operators, as well as to the U.S. and foreign governments. We provide marine fuel and related services throughout most of the world under the following trade names: World Fuel, Trans-Tec, Bunkerfuels, Oil Shipping, Marine Energy, Norse Bunker, Casa Petro, Henty Oil and Tramp Oil.
Through our extensive network of offices, we provide our customers global market intelligence and rapid access to quality and competitively priced marine fuel, 24 hours a day, every day of the year. Our marine fuel related services include management services for the procurement of fuel, cost control through the use of price hedging instruments, quality control and claims management. Our customers require cost effective and professional fuel services, since the cost of fuel is a major component of a vessel’s operating overhead.
As ship owners, time charter operators and suppliers continue to outsource their marine fuel purchasing and/or marketing needs, our value-added services have become an integral part of the oil and transportation industries’ push to shed non-core functions and reduce costs. Suppliers use our global sales, marketing and financial infrastructure to sell a spot or ratable volume of product to a diverse, international purchasing community. End customers use our real-time analysis of the availability, quality, and price of marine fuels in ports worldwide to maximize their competitive position.
In our marine segment, we primarily act as a reseller, taking delivery for fuel purchased at the same place and time as the fuel is sold. When acting as a reseller, we generally purchase fuel from a supplier, mark it up, and contemporaneously resell the fuel to a customer, normally taking delivery for purchased fuel at the same place and time as we make delivery for fuel sold. We maintain inventory in certain locations for competitive reasons in both storage facilities owned and leased by us. Inventory is generally hedged in an effort to protect us against price risk. The majority of the marine segment activity is related to spot sales which are sales that do not involve continuing contractual obligations by our customers to purchase fuel from us. We extend unsecured credit to most of our customers.
We also act as a broker. When acting as a broker, we negotiate the transaction by arranging the fuel purchase contract between the supplier and the end user and expedite the arrangements for the delivery of fuel. When acting as a broker, we are paid a commission by the supplier.
We purchase our marine fuel from suppliers worldwide. We also enter into derivative contracts in order to mitigate the risk of market price fluctuations and to offer our customers fuel pricing alternatives to meet their needs. Our cost of fuel is generally tied to spot pricing, market-based formulas or is government controlled. We are usually extended unsecured trade credit from our suppliers for our fuel purchases. However, certain suppliers require us to provide a letter of credit. We may prepay our fuel purchases when limited by the amount of credit extended to us by suppliers or as required to transact business in certain countries.
We utilize subcontractors to provide various services to customers, including fueling of vessels in port and at sea, and transportation of fuel and fuel products.
During each of the years presented in the accompanying consolidated statements of income, none of our marine customers accounted for more than 10% of total consolidated revenue.
Aviation Segment
We market fuel and related services to major commercial airlines, second and third-tier airlines, cargo carriers, regional and low-cost carriers, corporate fleets, fractional operators, private aircraft, military fleets and to the U.S. and foreign governments. Our aviation-related services include fuel management, price risk management, arranging ground handling and arranging and providing international trip planning, including flight
2
Table of Contents
plans, weather reports and overflight permits. We also offer a private label charge card to customers in the general aviation industry. We have developed an extensive network that enables us to provide aviation fuel and related services throughout most of the world under the following trade names: World Fuel, PAFCO, PetroServicios de Mexico, Tramp Oil, PetroServicios de Costa Rica, Baseops, Airdata and AVCARD.
In general, the aviation industry is capital intensive and highly leveraged. Recognizing the financial risks of the airline industry, fuel suppliers generally refrain from extending unsecured lines of credit to airlines and avoid doing business with certain airlines directly. Consequently, most carriers are required to post a cash collateralized letter of credit or prepay for fuel purchases. This negatively impacts the airlines’ working capital. We recognize that the extension of credit is a risk, but believe it is also a significant area of opportunity. Accordingly, we extend unsecured credit to most of our customers.
We purchase our aviation fuel from suppliers worldwide. Our cost of fuel is generally tied to market-based formulas or is government controlled. We are usually extended unsecured trade credit from our suppliers for our fuel purchases. However, certain suppliers require us to provide a letter of credit. We may prepay our fuel purchases when limited by the amount of credit extended to us by suppliers or as required to transact business in certain countries. We also enter into derivative contracts in order to mitigate the risk of market price fluctuations and to offer our customers fuel pricing alternatives to meet their needs.
Fuel is typically delivered into our customers’ aircraft or designated storage directly from our suppliers or from our fuel inventory. Inventory is held at multiple locations for competitive reasons. Inventory is purchased at airport locations or shipped via pipelines. Inventory in pipelines is hedged in an effort to protect us against price risk. We have arrangements with our suppliers and other third parties for the storage and delivery of fuel. We engage in spot sales and contract sales. Spot sales are sales that do not involve continuing contractual obligations by our customers to purchase fuel from us, whereas contract sales are made pursuant to fuel purchase contracts with our customers who commit to purchasing fuel from us over the contract term.
We utilize subcontractors to provide various services to customers, including into-plane fueling at airports and transportation and storage of fuel and fuel products.
During each of the years presented in the accompanying consolidated statements of income, none of our aviation customers accounted for more than 10% of total consolidated revenue.
Land Segment
We market fuel and related services to petroleum distributors operating in the land transportation market, retail petroleum operators and industrial, commercial and government customers and operate a small number of retail gasoline stations. Our land-related services include management services for the procurement of fuel and price risk management. We provide land fuel and related services throughout most of the United States as well as parts of Brazil and the United Kingdom under the following trade names: World Fuel, Tobras, Henty Oil and Texor.
In our land segment, we principally act as a reseller. When acting as a reseller, we generally purchase fuel from a supplier, mark it up and contemporaneously resell it to our customers through spot sales and contract sales. We purchase our land fuel from suppliers throughout the United States as well as parts of Brazil and the United Kingdom. Our suppliers typically extend us unsecured trade credit for our fuel purchases. Our cost of fuel is generally tied to market-based formulas. We extend unsecured credit to most of our customers and offer them fuel-pricing alternatives through our price risk management services.
Fuel is delivered to our customers directly at designated tanker truck loading terminals commonly referred to as “racks” or directly to customer locations through third party carriers. These racks are owned and operated by our suppliers or third-party consortiums. We engage in spot sales and contract sales. Spot sales are sales that
3
Table of Contents
do not involve continuing contractual obligations by our customers to purchase fuel from us. Contract sales are made pursuant to fuel purchase contracts with our customers who commit to purchasing specified volume of fuel from us over the contract term. We also enter into derivative contracts to offer our customers fuel pricing alternatives to meet their needs.
During each of the years presented in the accompanying consolidated statements of income, none of our land customers accounted for more than 10% of total consolidated revenue.
Competitors
Our competitors within the highly fragmented world-wide downstream markets of marine, aviation and land fuel are numerous, ranging from large multinational corporations, principally major oil producers, which have significantly greater capital resources, to relatively small and specialized firms. We compete with the major oil producers that market fuel directly to the large commercial airlines, shipping companies and petroleum distributors operating in the land transportation market as well as fuel resellers. We believe that our extensive market knowledge, worldwide presence, logistical expertise, extension of credit and use of derivatives to provide fuel pricing alternatives give us the ability to compete in the marketplace.
Employees
As of February 18, 2010, we employed 1,249 people worldwide.
Regulation
Our current and past activities are subject to substantial regulation by federal, state and local government agencies, inside and outside the United States, which enforce laws and regulations governing the transportation, sale, storage and disposal of fuel and the collection, transportation, processing, storage, use and disposal of hazardous substances and wastes, including waste oil and petroleum products. For example, U.S. federal and state environmental laws applicable to us include statutes that: (i) allocate the cost of remedying contamination among specifically identified parties and prevent future contamination; (ii) impose national ambient standards and, in some cases, emission standards, for air pollutants that present a risk to public health or welfare; (iii) govern the management, treatment, storage and disposal of hazardous wastes; and (iv) regulate the discharge of pollutants into waterways. International treaties also prohibit the discharge of petroleum products at sea. The penalties for violations of environmental laws include injunctive relief, recovery of damages for injury to air, water or property, and fines for non-compliance. See “Item 1A—Risk Factors,” and “Item 3—Legal Proceedings.”
We may also be affected by new environmental laws and regulations that apply to us or our customers in the future, which could reduce the demand for our products and services. For example, as a result of international efforts to address climate change concerns, international accords aimed at reducing greenhouse gas (“GHG”) emissions have been ratified by many countries outside of the U.S. In the U.S., several bills have been introduced in Congress, one of which has been passed by the House, that would compel carbon dioxide (“CO2”) emission reductions, and a number of U.S. states are discussing either state-specific legislation or participation in regional programs that could mandate future reductions in GHG emissions or otherwise manage those emissions. Although the likelihood of such measures being enacted and the specific requirements of any such regime are highly uncertain, they could affect our operations, earnings and competitive position.
Forward-Looking Statements
Certain statements made in this report and the information incorporated by reference in it, or made by us in other reports, filings with the SEC, press releases, teleconferences, industry conferences or otherwise, are “forward-looking statements” within the meaning of the Private Securities Litigation Reform Act of 1995. The forward-looking statements include, without limitation, any statement that may predict, forecast, indicate or
4
Table of Contents
imply future results, performance or achievements, and may contain the words “believe,” “anticipate,” “expect,” “estimate,” “project,” “could,” “would,” “will,” “will be,” “will continue,” “will likely result,” “plan,” or words or phrases of similar meaning.
Forward-looking statements are estimates and projections reflecting our best judgment and involve risks, uncertainties or other factors relating to our operations and business environment, all of which are difficult to predict and many of which are beyond our control which may cause actual results to differ materially from the future results, performance or achievements expressed or implied by the forward-looking statements. These statements are based on our management’s expectations, beliefs and assumptions concerning future events affecting us, which in turn are based on currently available information.
Examples of forward-looking statements in this report include, but are not limited to, our expectations regarding our business strategy, business prospects, operating results, effectiveness of internal controls to manage risk, working capital, liquidity, capital expenditure requirements and future acquisitions. Important assumptions relating to the forward-looking statements include, among others, assumptions regarding demand for our products, the cost, terms and availability of fuel from suppliers, pricing levels, the timing and cost of capital expenditures, outcomes of pending litigation, competitive conditions, general economic conditions and synergies relating to acquisitions, joint ventures and alliances. These assumptions could prove inaccurate. Although we believe that the estimates and projections reflected in the forward-looking statements are reasonable, our expectations may prove to be incorrect.
Important factors that could cause actual results to differ materially from the results and events anticipated or implied by such forward-looking statements include, but are not limited to:
| • | customer and counterparty creditworthiness and our ability to collect accounts receivable and settle derivative contracts; |
| • | changes in the market price of fuel; |
| • | changes in the political, economic or regulatory conditions generally and in the markets in which we operate; |
| • | our failure to effectively hedge certain financial risks and the use of derivatives; |
| • | non-performance by counterparties or customers to derivatives contracts; |
| • | changes in credit terms extended to us from our suppliers; |
| • | non-performance of suppliers on their sale commitments and customers on their purchase commitments; |
| • | non-performance of third-party service providers; |
| • | adverse conditions in the industries in which our customers operate, including a continuation of the global recession and its impact on the airline shipping industries; |
| • | currency exchange fluctuations; |
| • | failure of the fuel we sell to meet specifications; |
| • | our ability to manage growth; |
| • | our ability to integrate acquired businesses; |
| • | material disruptions in the availability or supply of fuel; |
| • | uninsured losses; |
| • | the impact of natural disasters, such as hurricanes; |
| • | our failure to comply with restrictions and covenants in our senior revolving credit facility (“Credit Facility”); |
5
Table of Contents
| • | the liquidity and solvency of banks within our Credit Facility and the facility to sell certain of our accounts receivable; |
| • | increases in interest rates; |
| • | declines in the value and liquidity of cash equivalents and investments; |
| • | our ability to retain and attract senior management and other key employees; |
| • | changes in U.S. or foreign tax laws or changes in the mix of taxable income among different tax jurisdictions; |
| • | our ability to comply with U.S. and international laws and regulations including those related to anti-corruption, economic sanction programs and environmental matters; |
| • | increased levels of competition; |
| • | the outcome of litigation; and |
| • | other risks, including those described in “Item 1A—Risk Factors” and those described from time to time in our filings with the SEC. |
We operate in a very competitive and rapidly changing environment. New risks emerge from time to time. It is not possible for us to predict all of those risks, nor can we assess the impact of all of those risks on our business or the extent to which any factor may cause actual results to differ materially from those contained in any forward-looking statement. The forward-looking statements in this Form 10-K are based on assumptions management believes are reasonable. However, due to the uncertainties associated with forward-looking statements, you should not place undue reliance on any forward-looking statements. Further, forward-looking statements speak only as of the date they are made, and, unless required by law, we expressly disclaim any obligation or undertaking to publicly update any of them in light of new information, future events or otherwise.
For these statements, we claim the protection of the safe harbor for forward-looking statements contained in Section 27A of the Securities Act of 1933 and Section 21E of the Securities Exchange Act of 1934 (the “Exchange Act”).
| Item 1A. | Risk Factors |
We extend unsecured credit to most of our customers in connection with their purchases of fuel from us, and our business, financial condition and results of operations will be adversely affected if we are unable to collect accounts receivable.
We extend unsecured credit to most of our customers in connection with their purchases of fuel from us. Our success in attracting customers has been due, in part, to our willingness to extend credit on an unsecured basis to customers that would otherwise be required to prepay or post letters of credit with other suppliers of fuel and related services. While no single customer represents more than 10% of our total consolidated revenue, diversification of credit risk is limited because we sell primarily within the marine, aviation and land transportation industries.
Our exposure to credit losses will depend on the financial condition of our customers and other factors beyond our control, such as deteriorating conditions in the world economy or in the marine, aviation or land transportation industries, political instability, terrorist activities, military action and natural disasters in our market areas. The unprecedented levels of disruption and volatility in the credit and financial markets over the past several years have increased our possible exposure to customer credit risk because it has made it harder for our customers to access sufficient capital to meet their liquidity needs. This market turmoil coupled with a reduction of business activity generally increases our risks related to our status as an unsecured creditor of most of our customers. Credit losses, if significant, would have a material adverse effect on our business, financial condition and results of operations.
6
Table of Contents
We are exposed to counterparty risk in connection with certain of our contracts. The soundness of our counterparties, which include our customers and suppliers and financial institutions, could adversely affect us.
We have exposure to the marine, aviation and land fuel industries as well as to our customers and suppliers in those industries. As part of our price risk management services, we offer our customers various pricing structures on future purchases of fuel, as well as derivative products designed to assist our customers in hedging their exposure to fluctuations in fuel prices. For example, in the ordinary course of our business we enter into fixed forward pricing contracts with our customers and suppliers under which we agree to sell or purchase, as the case may be, fuel at fixed prices and they agree to purchase or sell, as the case may be, fixed volumes of fuel during the term of the contract. If there is a significant fluctuation in the price of fuel, there is a risk they could decide to, or be forced to, default under their obligations to us. Even if the counterparty to a fixed forward pricing contract does not default, if a customer has agreed to purchase fuel from us at a fixed price and the price of fuel drops, we will be functionally extending unsecured credit to that customer at the time the fuel is purchased. We have credit standards and perform credit evaluations of our customers and suppliers, which are based in part on our credit history with the applicable party. In this difficult economic environment, our credit evaluations may be inaccurate and we cannot assure you that credit performance will not be materially worse than anticipated, and, as a result, materially and adversely affect our business, financial position and results of operations.
We also use derivatives to hedge certain of our fuel inventories and certain purchase and sale commitments. In connection with these activities, we are exposed to financial risk associated with fluctuations in fuel prices. We typically hedge this risk by entering into commodity-based derivative instruments with financial institution counterparties, such as broker/dealers, commercial banks and investment banks. These transactions are typically done on an unsecured basis and should the counterparty fail to honor its obligations under our agreements with them, we could sustain significant losses which could have a material adverse effect on our business, financial condition and results of operations.
In addition, the U.S. Senate, U.S. House of Representatives, U.S. Commodity Futures Trading Commission and other U.S. and foreign regulators have considered, and are expected to continue considering, greater regulation of oil, gas and other energy markets. The regulation under consideration includes, among other things, proposed position limits, climate change legislation and legislation that would require the central clearance of over-the-counter derivatives. The timing and scope of any regulation is uncertain, but such regulation could limit our ability to offer derivative and other pricing structure products and may change the volatility in the commodity and underlying markets, any of which could have a material adverse effect on our and our customers’ business, financial condition and results of operations.
We are exposed to various risks in connection with our use of derivatives.
We enter into financial derivative contracts in order to mitigate the risk of market price fluctuations in marine, aviation and land fuel, to offer our customers fuel pricing alternatives to meet their needs and in order to mitigate the risk of fluctuations in foreign currency exchange rates. From time to time, we also enter into certain limited risk derivative transactions which are speculative in nature, primarily basis spreads related to fuel products sold by the company. The majority of our derivatives are not designated as cash flow hedges for accounting purposes and therefore changes in the fair market value of such derivatives are recognized as a component of revenue or cost of revenue (based on the underlying transaction type) in our consolidated income statement. Our efforts to hedge our exposure to fuel price fluctuations could be ineffective. For example, there currently is no market for aviation jet fuel futures so we enter into hedging transactions with respect to our aviation business by trading in heating oil futures. To the extent the price of aviation jet fuel and heating oil are not correlated, then our attempts to mitigate price risk associated with our aviation business would not be effective. For purposes of hedging, heating oil is not a perfect substitute for aviation jet fuel and it is not unseen for short-term significant differences in the pricing to occur. For example, in the period immediately following Hurricane Katrina in 2005, the price of aviation jet fuel increased substantially while the price of heating oil remained relatively constant. Our hedging activity is in the Level II and Level III categories within the fair value
7
Table of Contents
hierarchy set out by accounting guidance for fair value measurements and as such requires a high degree of subjective assessment and judgment by management in connection with determining fair value. The risks we face because of our use of financial derivatives have been exacerbated by the recent volatility in the financial and other markets. In addition, we may fail to adequately hedge our risks if our employees fail to comply with our policies and procedures on hedging, for example by failing to hedge a specific financial risk, which could subject us to significant financial losses which could have a material adverse effect on our business, financial condition and results of operations.
Changes in the market price of fuel may have a material adverse effect on our business.
Fuel prices which have been extremely volatile in the recent past, are likely to continue to be volatile in the future, and depend on factors outside the control of the Company, such as:
| • | expected and actual supply and demand for fuel; |
| • | political conditions |
| • | laws and regulations related to environmental matters, including those mandating or incentivizing alternative energy sources or otherwise addressing global climate change; |
| • | changes in pricing or production controls by OPEC; |
| • | technological advances affecting energy consumption and supply; |
| • | energy conversation efforts; |
| • | price and availability of alternative fuels; and |
| • | weather. |
A rapid decline in fuel prices could cause our inventory value to be higher than market resulting in our inventory being marked down to market or the inventory itself may ultimately have to be sold at lower prices. If fuel prices increase, our customers may not be able to purchase as much fuel from us because of their credit limits, which could also adversely impact their businesses sufficiently to cause them to be unable to make payments owed to us for fuel we permitted them to purchase on credit. They may also choose to reduce the amount of fuel they consume in their operations to reduce costs or to otherwise comply with new environmental regulations or to obtain incentives associated therewith. There would be no assurance that the volume of orders from our customers would increase again or that we would be able to replace lost volumes by courting new customers. In addition, if fuel prices increase, our own credit limits could prevent us from purchasing enough fuel from our suppliers to meet our customers’ demands or could require us to use so much cash for fuel purchases as to impair our liquidity.
We maintain fuel inventories for competitive reasons. Because fuel is a commodity, we have no control over the changing market value of our inventory. Our inventory is valued using the average cost methodology and is stated at the lower of average cost or market. Accordingly, if the market value of our inventory was less than our average cost, we would record a write-down of inventory and a non-cash charge to cost of revenue. In addition, we may not be able to sell our inventory at the market value or average cost reflected in our financial statements at any given time.
Economic, political and other risks associated with international sales and operations could adversely affect our business and future operating results.
Because we resell fuel worldwide, our business is subject to risks associated with doing business internationally. Our business and future operating results could be harmed by a variety of factors, including:
| • | trade protection measures and import or export licensing requirements, which could increase our costs of doing business internationally; |
| • | the costs of hiring and retaining senior management for overseas operations; |
8
Table of Contents
| • | difficulty in staffing and managing widespread operations, which could reduce our productivity; |
| • | unexpected changes in regulatory requirements, which may be costly and require significant time to implement; |
| • | laws restricting us from repatriating profits earned from our activities within foreign countries, including the payment of distributions; |
| • | political risks specific to foreign jurisdictions; and |
| • | terrorism, war, civil unrest and natural disasters. |
In particular, we operate in emerging markets, such as Russia and certain countries in Asia and Latin America, which have been plagued by corruption and have uncertain regulatory environments, both of which could have a negative impact on our operations there. Many countries in which we operate historically have been and may continue to be susceptible to recessions or currency devaluation.
Fluctuations in foreign exchange rates could materially affect our reported results.
The majority of our business transactions are denominated in U.S. dollars. However, in certain markets, payments to some of our fuel suppliers and from some of our customers are denominated in local currency. We also have certain liabilities primarily for local operations, including income and transactional taxes, which are denominated in foreign currencies. This subjects us to foreign currency exchange risk. Although we use hedging strategies to manage and minimize the impact of foreign currency exchange risk, at any given time, only a portion of such risk may be hedged and such risk may be substantial. As a result, fluctuations in foreign exchange rates could adversely affect our profitability.
In addition, many of our customers are foreign customers and may be required to purchase U.S. dollars to pay for our products and services. A rapid depreciation or devaluation in currency affecting our customers could have an adverse effect on our customers’ operations and their ability to convert local currency to U.S. dollars to make required payments to us. This would in turn increase our credit losses which would adversely affect our business, financial condition and results of operations.
Third parties who fail to provide services to us and our customers as agreed could harm our business.
We use third parties to provide various services to our customers, including into-plane fueling at airports, fueling of vessels in port and at sea and delivering land-based fuel. The failure of these third parties to perform these services in accordance with the agreed terms for any reason, such as an interruption of their business because of weather, environmental or labor difficulties or political unrest, could affect our relationships with our customers and subject us to claims and other liabilities which might have a material adverse effect on our business, financial condition and results of operations.
To the extent that we use third parties in our operations in emerging markets, we are subject to the risk that we could be held accountable for the failure of these third parties to comply with the laws and regulations of the U.S. government and various international jurisdictions.
If the fuel we purchase from our suppliers fails to meet the specifications we have agreed to supply to our customers, our business could be adversely affected.
We purchase the fuel we resell from various suppliers. If the fuel fails to meet the specifications we have agreed to supply to our customers, our relationship with our customers could be adversely affected and we could be subject to claims and other liabilities which could have a material adverse effect on our business, financial condition and results of operations. Although in most cases we have recourse against our suppliers for fuel which fails to meet agreed specifications, such recourse cannot be assured.
9
Table of Contents
Non-performance of suppliers on their sale commitments and customers on their purchase commitments could disrupt our business.
We enter into sale and purchase agreements with customers and suppliers for fuel at fixed prices. To the extent either a customer or supplier fails to perform on their commitment, we may be required to sell or purchase the fuel at prevailing market rates, which could be significantly different than the fixed price within the sale and purchase agreements and therefore could have a material adverse effect on our business, financial condition and results of operations.
Material disruptions in the availability or supply of fuel would adversely affect our business.
The success of our business depends on our ability to purchase, sell and coordinate delivery of fuel and fuel-related services to our customers. Our business would be adversely affected to the extent that political instability, natural disasters, such as hurricanes, terrorist activity, military action or other conditions disrupt the availability or supply of fuel. In addition, we rely on a single or limited number of suppliers for the provision of fuel and related services in certain markets. These parties may have significant negotiation leverage over us and should they be unable or unwilling to supply us on commercially reasonable terms, our business would be adversely affected.
Adverse conditions in the marine, aviation and land transportation industries may have an adverse effect on our business.
Our business is focused on the marketing of fuel and fuel-related services to the marine, aviation and land transportation industries. Therefore, any adverse economic conditions in these industries may have an adverse effect on our business. Recently, the aviation industry has experienced a decline in passenger traffic, and the marine industry has witnessed a slowdown in shipping, in both cases as a result of the deterioration of the global economy. In addition, any political instability, natural disasters, terrorist activity or military action that disrupts shipping, flight operations or land transportation will adversely affect our customers and may reduce the demand for our products and services. Our business could also be adversely affected by increased merger activity in the marine, aviation and land transportation industries, which may reduce the number of customers that purchase our products and services, as well as the prices we are able to charge for such products and services.
In addition, the marine, aviation and land transportation industries are subject to laws and regulations related to environmental matters, including those mandating or incentivizing alternative energy sources or otherwise addressing global climate change, which may reduce the demand for our products and services. The scientific community, led largely by the Intergovernmental Panel on Climate Change, has provided scientific evidence that human activity, and particularly the combustion of fossil fuels, has increased the levels of GHGs in the atmosphere and contributed to observed changes in the global climate system. These findings have led to proposals for substantial transformation of the world’s energy production and transportation systems in order to slow, and ultimately reduce, the production of CO2 and other GHG emissions sufficiently to reduce their atmospheric concentrations. As a result of requirements for GHG emissions, our customers could be required to purchase allowances or offsets to emit GHGs or other regulated pollutants or to pay taxes on such emissions. The ultimate legislation and regulations that result from these activities could have a material impact on our business and on the businesses of our customers.
Insurance coverage for some of our operations may be insufficient to cover losses.
We do not maintain insurance coverage for various risks, such as the acts or omissions of our subcontractors and war and terrorism. Even if we are faced with a liability in connection with which we do maintain insurance, our insurance coverage may be inadequate, such as with environmental claims. Also, if we take, or fail to take, certain actions, such as, our insurance carriers may refuse to pay particular claims. If the cost of insurance increases, we may decide to discontinue certain insurance coverage or reduce our level of coverage to offset the cost increase. In addition, insurance coverage that we currently have could become difficult or impossible to obtain in the future.
10
Table of Contents
Our failure to comply with the restrictions of our Credit Facility could adversely affect our operating flexibility.
We have the ability to borrow money pursuant to a Credit Facility that imposes certain operating and financial covenants on us, such as limiting or prohibiting our ability to pay dividends, incur additional debt, create liens, make restricted payments, sell assets or engage in mergers or acquisitions. Our failure to comply with obligations under the Credit Facility, including meeting certain financial ratios, could result in an event of default. An event of default, if not cured or waived, would permit acceleration of any outstanding indebtedness under the Credit Facility, could trigger cross-defaults under other agreements to which we are a party, such as certain derivatives contracts and promissory notes issued in connection with acquisitions, and would impair our ability to obtain working capital advances and letters of credit, which could have a material adverse effect on our business, financial condition and results of operations.
Our cash equivalents and investments are subject to risks which may cause illiquidity and losses from declines in value.
Our cash equivalents, principally consisting of overnight investments, bank money market accounts, bank time deposits, money market mutual funds, investment grade commercial paper, and investments are subject to credit, liquidity, market and interest rate risk, which have all been exacerbated recently due to the unprecedented volatility of the capital markets. Adverse changes to these risks have resulted, and could further result, in the decline of the fair value in our cash equivalents and investments, and could materially affect our financial condition, results of operations, and cash flows.
Increases in interest rates, the failure of our interest rate protection arrangements, if any, to reduce our interest rate volatility or both may increase our interest expense and adversely affect our cash flow and our ability to service our indebtedness.
Borrowings under our Credit Facility are subject to variable interest rates. However, from time to time, we may enter into interest rate protection arrangements that, in effect, fix the rate of interest on our debt. The amount of debt covered by such arrangements may change depending on our working capital needs. As of December 31, 2009, we had no outstanding borrowings under our Credit Facility or outstanding interest rate protection arrangements. Should we borrow under our Credit Facility, an increase in interest rates, our failure to maintain adequate interest rate protection arrangements or both would increase our interest expense and could adversely affect our cash flow and our ability to service our indebtedness.
Our business is dependent on the ability to obtain financing to meet our capital requirements and fund our future growth, which may be particularly difficult to obtain because of the recent tightening and volatility of the credit and capital markets.
We rely on credit arrangements with banks, suppliers and other parties as a significant source of liquidity for capital requirements not satisfied by operating cash flow. Over the last several years there has been a substantial tightening of the global credit markets, which, along with our then-current financial condition and the restrictions in our existing debt agreements, could affect our ability to obtain credit as and when we need it on commercially reasonable terms or at all and, consequently, could have a negative impact on our future development and growth. If we are unable to obtain debt financing and instead raise capital through an equity issuance, existing shareholders would be diluted. Even if we are able to obtain debt financing, the restrictions creditors place on our operations and our increased interest expense and leverage could limit our ability to grow.
If we are unable to retain our senior management and key employees, our business and results of operations could be harmed.
Our ability to maintain our competitive position is dependent largely on the services of our senior management and professional team. Although we have employment agreements with certain of our key executive
11
Table of Contents
officers, the employment agreements do not prevent those officers from ceasing their employment with us at any time. If we are unable to retain the existing senior management and professional personnel, or to attract other qualified senior management and professional personnel on terms satisfactory to us, our business will be adversely affected. While we maintain key man life insurance with respect to certain members of our senior management, our coverage levels may not be sufficient to offset any losses we may suffer as a result of our loss of the officers, and there is no assurance that we will continue to maintain key man life insurance in the future.
Businesses we have acquired or may acquire in the future as well as strategic investments will expose us to increased operating risks.
As part of our growth strategy, we have been acquisitive and intend to continue to explore acquisition opportunities of fuel resellers and other related service businesses. For example, we purchased Henty Oil Limited, Tank and Marine Engineering Limited and Henty Shipping Services Limited (collectively, “Henty”) and certain assets of TGS Petroleum, Inc. (the “TGS business”) in 2009. We cannot provide any assurance that we will find attractive acquisition candidates in the future, that we will be able to acquire such candidates on economically acceptable terms, or that we will be able to finance acquisitions on economically acceptable terms. Even if we are able to acquire new businesses in the future, they could result in the incurrence of substantial additional indebtedness and other expenses or potentially dilutive issuances of equity securities and may affect the market price of our common stock, inhibit our ability to pay dividends or restrict our operations.
These investments could expose us to additional business and operating risks and uncertainties, including:
| • | the ability to effectively integrate and manage acquired businesses or strategic investments, while maintaining uniform standards and controls; |
| • | the ability to realize our investment and anticipated synergies in the acquired businesses or strategic investments; |
| • | the diversion of management’s time and attention from other business concerns, the potentially negative impact of changes in management on existing business relationships, and other disruptions of our business; |
| • | the risk of entering markets in which we may have no or limited direct prior experience; |
| • | the potential loss of key employees, customers or suppliers of the acquired businesses; |
| • | the requirement to write-down acquired assets as a result of the acquired business being worth less than we paid for it; |
| • | additional capital expenditure requirements; |
| • | the risk that an acquisition or strategic investment could reduce our future earnings; and |
| • | the assumption of material liabilities, exposure to unknown liabilities, and no or limited indemnities. |
Changes in U.S. or foreign tax laws could adversely affect our business and future operating results.
We are affected by various U.S. and foreign taxes imposed on the purchase and sale of marine, aviation and land fuel products. These taxes include sales, excise, GST, VAT, and other taxes. Changes in U.S. and foreign tax laws or our failure to comply with those tax laws could adversely affect our business and operating results.
Our international operations require us to comply with applicable U.S and international laws and regulations.
Doing business on a worldwide basis requires the Company and its subsidiaries to comply with the laws and regulations of the U.S. government and various international jurisdictions. These regulations place restrictions on our operations, trade practices and partners and investment decisions. In particular, our international operations
12
Table of Contents
are subject to U.S. and foreign anti-corruption laws and regulations, such as the Foreign Corrupt Practices Act (“FCPA”), and economic sanction programs administered by the U.S. Treasury Department’s Office of Foreign Assets Control (“OFAC”). The FCPA prohibits us from providing anything of value to foreign officials for the purposes of influencing official decisions or obtaining or retaining business. As part of our business, we regularly deal with state-owned business enterprises, the employees of which are considered foreign officials for purposes of the FCPA. In addition, some of the international locations in which we operate lack a developed legal system and have higher than normal levels of corruption. Economic sanctions programs restrict our business dealings with certain countries and individuals. From time to time, certain of our subsidiaries have had limited business dealings in countries subject to comprehensive OFAC-administered sanctions, specifically Cuba, Iran and Sudan. These business dealings, which represent an insignificant amount of our consolidated revenues and income, generally consist of the purchase of overflight permits and the provision of flight support and fuel services pursuant to licenses issued by OFAC or as otherwise permitted by U.S. sanctions regulations. As a result of the above activities, we are exposed to a heightened risk of violating anti-corruption laws and OFAC regulations. Violations of these regulations are punishable by civil penalties, including fines, denial of export privileges, injunctions, asset seizures, debarment from government contracts and revocations or restrictions of licenses, as well as criminal fines and imprisonment.
We have established policies and procedures designed to assist the Company’s and its personnel’s compliance with applicable U.S. and international laws and regulations. However, there can be no assurance that our policies and procedures will effectively prevent us from violating these regulations in every transaction in which we may engage, and such a violation could adversely affect our reputation, business, financial condition and results of operations. In addition, various state and municipal governments, universities and other investors maintain prohibitions or restrictions on investments in companies that do business with sanctioned countries which could adversely affect the market for our securities.
On April 19, 2009, we received an administrative subpoena from the U.S. Treasury Department’s Office of Foreign Assets Control (“OFAC”) requesting information regarding transactions that the Company has conducted involving Cuba since April 1, 2004. Upon receipt of this subpoena, we initiated an internal review to identify transactions involving Cuba, and we voluntarily expanded the scope of this review to include transactions involving Iran and Sudan. On December 8, 2009, we received a separate administrative subpoena from OFAC requesting information regarding the Company’s transactions involving Sudanese overflight payments since June 30, 2008. We responded to both subpoenas and identified certain transactions that may have resulted in violations of U.S. sanctions regulations or our OFAC-issued licenses, including the failure to make certain periodic reports as required by our OFAC-issued licenses and a small number of sanctioned country-related transactions which took place after one of our licenses had expired. In our responses to OFAC, we noted that the transactions we identified as potential violations resulted in very small amounts of revenue to us, and that we intend to take certain remedial actions to further strengthen our compliance related policies and procedures. Nevertheless, should OFAC determine that these activities constituted violations of U.S. sanctions regulations, civil penalties, including fines, could be assessed against the Company. Additionally, in the course of its ongoing review, OFAC could request additional information from us, in the form of additional subpoenas or otherwise, and we intend to fully cooperate with any such additional subpoenas or requests. We cannot predict the ultimate outcome of the OFAC review, the total costs to be incurred in response to this review, the potential impact on our personnel, the effect of implementing any further measures that may be necessary to ensure full compliance with U.S. sanctions regulations or to what extent, if at all, we could be subject to fines, sanctions or other penalties.
We face intense competition and, if we are not able to effectively compete in our markets, our revenues and profits may decrease.
Competitive pressures in our markets could adversely affect our competitive position, leading to a possible loss of market share or a decrease in prices, either of which could result in decreased revenues and profits. Our competitors are numerous, ranging from large multinational corporations, which have significantly greater capital resources, to relatively small and specialized firms. In addition to competing with fuel resellers, we also compete
13
Table of Contents
with the major oil producers that market fuel directly to the large commercial airlines, shipping companies and petroleum distributors operating in the land transportation market. Our business could be adversely affected because of increased competition from the larger oil companies, who may choose to directly market to airlines, shipping companies and petroleum distributors operating in the land transportation market, or to provide less advantageous price and credit terms to us than to our fuel reseller competitors.
If we fail to comply with environmental laws and other government regulations applicable to our operations, we could suffer penalties or costs that could have a material adverse effect on our business.
We are required to comply with extensive and complex environmental laws and other regulations at the international, federal, state and local government levels relating to, among other things:
| • | the handling of fuel and fuel products; |
| • | the operation of fuel storage and distribution facilities; |
| • | workplace safety; |
| • | fuel spillage or seepage; |
| • | environmental damage; and |
| • | hazardous waste disposal. |
If we should fail to comply with these laws and other regulations, we could be subject to substantial fines or penalties and to civil and criminal liability.
If we are involved in a spill, leak, fire, explosion or other accident involving hazardous substances or if there are releases of fuel or fuel products we own, our operations could be disrupted and we could be subject to material liabilities, such as the cost of investigating and remediating contaminated properties or claims by customers, employees or others who may have been injured, or whose property may have been damaged. These liabilities could have a material adverse effect on our business, financial condition and results of operations. Some environmental laws impose strict liability, which means we could have liability without regard to whether we were negligent or at fault.
In addition, compliance with existing and future environmental laws regulating fuel storage terminals, fuel delivery vessels and barges and underground storage tanks that we own or operate may require significant capital expenditures and increased operating and maintenance costs. The remediation and other costs required to clean up or treat contaminated sites could be substantial.
Our fuel storage and vessel and barge operations have inherent risks that could negatively impact our results of operations and financial condition.
Operating fuel storage terminals and fuel delivery vessels and barges carries with it the inherent risks of oil spills and other environmental mishaps, fires, collisions and other catastrophic disasters, loss of life, severe damage to and destruction of property and equipment, loss of product and business interruption. Damage arising from such occurrences may result in third party lawsuits asserting large claims. We maintain insurance to mitigate these costs, but there can be no assurance that our insurance would be sufficient to cover the liabilities suffered by us from the occurrence of one or more of the risks described above. Further, if we are negligent or otherwise responsible in connection with any such event, our insurance may not cover our claim. The media coverage resulting from any of these occurrences could have a material adverse effect on our stock price and on our business, results of operations, cash flows and financial condition.
14
Table of Contents
If we are held liable for clean up and other costs related to several businesses we exited, which handled hazardous and non-hazardous waste, such liability could adversely affect our business and financial condition.
We have exited several businesses, such as the used oil recycling business, that handled hazardous and non-hazardous waste. We treated and/or transported this waste to various disposal facilities in the United States. We have been sued in the past and may be sued in the future as a potentially responsible party for the clean up of such disposal facilities and may be held liable for these and other clean up costs pursuant to U.S. federal and state laws and regulations. In addition, under these laws and regulations, we may be required to clean up facilities previously operated by us.
Our operations may be adversely affected by competition from other energy sources.
Fuel competes with other sources of energy, some of which are less costly on an equivalent energy basis. In addition, we cannot predict the effect that the development of alternative energy sources might have on our operations.
Current and future litigation could have an adverse effect on the Company.
The Company is currently involved in certain legal proceedings in the ordinary course of its business. Lawsuits and other legal proceedings can involve substantial costs, including the costs associated with investigation, litigation and possible settlement, judgment, penalty or fine. Although insurance is maintained to mitigate these costs, there can be no assurance that costs associated with lawsuits or other legal proceedings will not exceed the limits of insurance policies. The Company’s results of operations could be adversely affected if a judgment, penalty or fine is not fully covered by insurance.
We are exposed to risks from legislation requiring companies to have adequate internal controls over financial reporting and to evaluate those internal controls.
Section 404 of the Sarbanes-Oxley Act of 2002 requires our management to assess, and our independent registered public accounting firm to attest to, the effectiveness of our internal control structure and procedures for financial reporting. We completed an evaluation of the effectiveness of our internal control over financial reporting as of December 31, 2009, and we have an ongoing program to perform the system and process evaluation and testing necessary to continue to comply with these requirements. In addition, we have expansive international operations, the scope and breadth of which exacerbate the risks associated with our internal controls. Accordingly, we expect to continue to incur increased expense and to devote additional management resources to Section 404 compliance. In the event that our chief executive officer, chief financial officer or independent registered public accounting firm determines that our internal control over financial reporting is not effective as defined under Section 404, investor perceptions and our reputation may be adversely affected and the market price of our stock could decline. Moreover, even if we and our auditors do not identify any concerns about our internal control system, it may not prevent all potential errors or fraud.
We may not achieve sufficient earnings to pay dividends to our shareholders.
We currently intend to pay regular cash dividends on a quarterly basis, but may be restricted from doing so by the terms of our Credit Facility or may not achieve sufficient earnings to pay some or any dividends. The amount of cash we have available for distribution depends primarily on our cash flow, and not solely on profitability, which will be affected by non-cash items. As a result, we may make cash distributions during periods when we record losses and may not make cash distributions during periods when we record net income.
An increase in interest rates may cause the market price of our common shares to decline.
Like all equity investments, an investment in our common shares is subject to certain risks. In exchange for accepting these risks, investors may expect to receive a higher rate of return than would otherwise be obtainable
15
Table of Contents
from lower-risk investments. Accordingly, as interest rates rise, the ability of investors to obtain higher risk-adjusted rates of return by purchasing government-backed debt securities may cause a corresponding decline in demand for riskier investments generally, including yield-based equity investments such as publicly traded corporate interests. Reduced demand for our common shares resulting from investors seeking other more favorable investment opportunities may cause the trading price of our common shares to decline.
Failure to comply with state laws regulating the sale of alcohol and tobacco products in our convenience stores may result in the loss of necessary licenses and the imposition of penalties on us, which could have an adverse effect on our business.
State laws regulate the sale of alcohol and tobacco products in our convenience stores. A violation or change of these laws could adversely affect our business, financial condition and results of operations because state and local regulatory agencies have the power to approve, revoke, suspend or deny applications for, and renewals of, permits and licenses relating to the sale of these products or to seek other remedies.
| Item 1B. | Unresolved Staff Comments |
None.
| Item 2. | Properties |
The following table sets forth our principal properties, all of which are leased, as of February 18, 2010. We consider all of our properties and facilities to be suitable and adequate for our present needs and do not anticipate that we will experience difficulty in renewing or replacing those leases that expire in 2010 in any material respect.
16
Table of Contents
WORLD FUEL SERVICES CORPORATION and SUBSIDIARIES
PROPERTIES
| Location |
Principal Use |
Lease Expiration | ||
| 9800 Northwest 41st Street, Suite 400 Miami, FL 33178, USA |
Executive, administrative, operations and sales office for corporate, marine, aviation and land segments |
Three leases: May 2011, March 2013 and January 2014 | ||
| 333 Cypress Run #200 Houston, Texas 77094, USA |
Administrative, operations and sales office |
April 2014 | ||
| 23 Wallace Street Red Bank, NJ 07701, USA |
Administrative, operations and sales office |
December 2016 | ||
| 3340 S. Harlem Avenue Riverside, IL 60546, USA |
Administrative, operations and sales office |
June 2018 | ||
| 4 North Park Drive, suite 412 Hunt Valley, Maryland 21030, USA |
Administrative, operations and sales office |
May 2010 | ||
| 1101 Fifth Avenue, Suite 280 San Rafeal, CA 94901, USA |
Administrative, operations and sales office |
July 2013 | ||
| Portland House 13th Floor Bressenden Place London, UK SW1E6BH |
Administrative, operations and sales office |
March 2015 | ||
| Kingfisher House North Park Gatwick Road Crawley, West Sussex, UK RH102XN |
Administrative, operations and sales office |
September 2015 | ||
| 238A Thompson Road #17-08 Novena Square Tower A Singapore 307684 |
Administrative, operations and sales office |
December 2010 | ||
| The Phoenix, 17th Floor Nos. 21-25, Luard Road Wanchai, Hong Kong |
Marketing office for marine segment |
January 2013 | ||
| 9 F/L., Dongwon-Bldg., 128-27 Dangju—Dong, Chongno—Ku Seoul, 110-759, South Korea |
Marketing office for marine segment |
September 2010 | ||
| 4th floor, Tozan Building, 4-4-2 Nihonbashi Hon-Cho, Chuo-Ku Tokyo 103-0023, Japan |
Marketing office for marine segment |
June 2010 | ||
| The Fairmont Dubai Hotel Building, Office 1701, Sheikh Zayed Road Dubai, United Arab Emirates |
Marketing office for marine segment |
February 2011 | ||
| The Foundry, 4th Floor, Unit 1, Cardiff Rd Green Point, South Africa 8001 |
Marketing office for marine segment |
August 2011 | ||
| Av. Rio Branco 181/3004 Rio de Janeiro, Brazil 20040 007 |
Sales office for marine segment |
December 2010 | ||
| Calle Francisco Sarabia No. 34 B Colonia Penon de los Banos Delegación Venustiano Carranza C.P. 15520, Mexico D.F. |
Administrative, operations and sales office |
September 2011 | ||
| Calle 93B No. 11A-33, Oficina 303 Bogota, Colombia |
Administrative, operations and sales office |
August 2010 | ||
| Oficentro Ejécutivo La Sabana Sur, Edificio #7, Piso 2 San José, Costa Rica |
Administrative, operations and sales office |
March 2013 | ||
| Huskisson Dock No.1, Liverpool Docks Liverpool, UK L30AT |
Administrative, operations and sales office |
April 2011 |
17
Table of Contents
| Item 3. | Legal Proceedings |
Miami Airport Litigation
In April 2001, Miami-Dade County, Florida (the “County”) filed suit (the “County Suit”) in the state circuit court in and for Miami-Dade County against 17 defendants to seek reimbursement for the cost of remediating environmental contamination at Miami International Airport (the “Airport”).
Also in April 2001, the County sent a letter to approximately 250 potentially responsible parties (“PRP’s”), including World Fuel Services Corporation and one of our subsidiaries, advising of our potential liability for the clean-up costs of the contamination that is the subject of the County Suit. The County has threatened to add the PRP’s as defendants in the County Suit, unless they agree to share in the cost of the environmental clean-up at the Airport. We have advised the County that: (i) neither we nor any of our subsidiaries were responsible for any environmental contamination at the Airport, and (ii) to the extent that we or any of our subsidiaries were so responsible, our liability was subject to indemnification by the County pursuant to the indemnity provisions contained in our lease agreement with the County.
If we are added as a defendant in the County Suit, we would vigorously defend any claims, and we believe our liability in these matters (if any) should be adequately covered by the indemnification obligations of the County.
Panama Litigation
In July 2005, Atlantic Service Supply, S.A. (“Atlantic”), a Panamanian fuel barge operator, filed suit against Tramp Oil & Marine Limited (“TOM”), one of our subsidiaries, alleging that TOM is jointly and severally liable for barging fees of $1.0 million owed to Atlantic by Isthmian Petroleum Supply & Services, S.A. (“Isthmian”). In July 2007, the court ruled against Atlantic, finding that TOM was not liable for any barging fees owed to Atlantic by Isthmian. Isthmian has appealed this ruling. TOM and Isthmian were parties to an agreement pursuant to which Isthmian provided storage, delivery and other fuel-related services to TOM in Panama. In its suit, Atlantic alleges (i) Isthmian breached a barge charter agreement entered into between the two parties, (ii) Isthmian entered into the agreement as an agent on behalf of TOM, and (iii) TOM is liable, as a principal, for Isthmian’s breach of the agreement. We believe this suit is without merit and we intend to vigorously defend the action.
In August 2005, TOM filed a lawsuit against Isthmian seeking damages of $3.1 million for breach of contract and wrongful conversion of fuel owned by TOM. In September 2005, Isthmian filed a counterclaim against TOM alleging that TOM is in breach of contract and seeking $5.0 million in damages. These actions are pending in a Panamanian maritime court. We believe Isthmian’s suit against TOM is without merit and we intend to vigorously defend the action.
Brendan Airways Litigation
One of our subsidiaries, World Fuel Services, Inc. (“WFSI”), is involved in a dispute with Brendan Airways, LLC (“Brendan”), an aviation fuel customer, with respect to certain amounts Brendan claims to have been overcharged in connection with fuel sale transactions from 2003 to 2006. In August 2007, WFSI filed an action in the state circuit court in and for Miami-Dade County, Florida, seeking declaratory relief with respect to the matters disputed by Brendan. In October 2007, Brendan filed a counterclaim against WFSI. In February 2008, the court dismissed WFSI’s declaratory action. Brendan’s counterclaim remains pending as a separate lawsuit against WFSI, and Brendan is seeking $3.5 million in damages in its pending action. In October 2009, Brendan filed a motion with the court seeking, among other things, leave to file a third amended complaint to add various additional claims, including a claim under the Florida Racketeer Influenced and Corrupt Organizations (“RICO”) Act, and claims for civil conspiracy, promissory estoppel and constructive fraud. In January 2010, the court ruled that Brendan may not amend the complaint to assert claims for violation of Florida’s RICO Act or for civil conspiracy. We believe Brendan’s claims are without merit, and we intend to vigorously defend all of Brendan’s claims.
18
Table of Contents
TransContinental Litigation
In April 2009, Soneet Kapila (the “Plaintiff”), as Chapter 11 Trustee for Louis Pearlman, TransContinental Airlines, Inc., and Louis J. Pearlman Enterprises, Inc. (collectively, the “Debtors”), filed a complaint in the United States Bankruptcy Court for the Middle District of Florida against WFSI seeking $0.5 million in damages, representing payments made by the Debtors for the benefit of Planet Aviation, Inc., a WFSI customer, for which the Debtors claim they received no consideration. In June 2009, the Plaintiff, as Chapter 11 Trustee for TransContinental Aviation, Inc. (“TCA”), filed a complaint in the United States Bankruptcy Court for the Middle District of Florida against WFSI seeking $1.3 million in damages, representing payments made by TCA for which TCA claims it did not receive adequate value. We believe the claims asserted are without merit and we intend to vigorously defend these claims.
Other Matters
As of December 31, 2009, we had recorded certain reserves related to the proceedings described above which were not significant. Because the outcome of litigation is inherently uncertain, we may not prevail in these proceedings and we cannot estimate our ultimate exposure in such proceedings if we do not prevail. Accordingly, a ruling against us in any of the above proceedings could have a material adverse effect on our financial condition, results of operations or cash flows.
In addition to the matters described above, we are involved in litigation and administrative proceedings primarily arising in the normal course of our business. In the opinion of management, except as set forth above, our liability, if any, under any other pending litigation or administrative proceedings, even if determined adversely, would not materially affect our financial condition, results of operations or cash flows.
| Item 4. | Submission of Matters to a Vote of Security Holders |
No matter was submitted to a vote of shareholders, through the solicitation of proxies or otherwise, during the quarter ended December 31, 2009.
19
Table of Contents
| Item 5. | Market for Registrant’s Common Equity, Related Shareholder Matters and Issuer Purchases of Equity Securities |
In November 2009, we announced a two-for-one split of our common stock. The additional shares issued pursuant to the stock split were distributed in December 2009 to shareholders of record on November 30, 2009. All references in this Form 10-K to number of shares and per share amounts prior to the stock split have been retroactively restated to reflect the stock split.
Our common stock is traded on the New York Stock Exchange (“NYSE”) under the symbol INT. As of February 18, 2010, there were 259 shareholders of record of our common stock and the closing price of our stock on the NYSE was $23.62. The following table sets forth, for each quarter in 2009 and 2008, the high and low closing sales prices of our common stock as reported by the NYSE.
| Price | ||||||
| High | Low | |||||
| 2009 |
||||||
| First quarter |
$ | 18.38 | $ | 13.08 | ||
| Second quarter |
23.91 | 15.43 | ||||
| Third quarter |
25.23 | 18.62 | ||||
| Fourth quarter |
27.58 | 23.23 | ||||
| 2008 |
||||||
| First quarter |
$ | 15.64 | $ | 12.21 | ||
| Second quarter |
15.86 | 10.60 | ||||
| Third quarter |
14.88 | 9.79 | ||||
| Fourth quarter |
19.23 | 7.81 | ||||
Cash Dividends
The following table sets forth the amount, the declaration date, record date and payment date for each quarterly cash dividend declared in 2009 and 2008.
| Per Share Amount |
Declaration Date | Record Date | Payment Date | ||||||
| 2009 |
|||||||||
| First quarter |
$ | 0.0375 | February 26, 2009 | March 20, 2009 | April 8, 2009 | ||||
| Second quarter |
0.0375 | June 4, 2009 | June 19, 2009 | July 8, 2009 | |||||
| Third quarter |
0.0375 | September 3, 2009 | September 18, 2009 | October 7, 2009 | |||||
| Fourth quarter |
0.0375 | December 3, 2009 | December 18, 2009 | January 6, 2010 | |||||
| 2008 |
|||||||||
| First quarter |
$ | 0.0188 | March 7, 2008 | March 21, 2008 | April 9, 2008 | ||||
| Second quarter |
0.0188 | June 6, 2008 | June 18, 2008 | July 9, 2008 | |||||
| Third quarter |
0.0188 | September 5, 2008 | September 19, 2008 | October 8, 2008 | |||||
| Fourth quarter |
0.0188 | December 5, 2008 | December 19, 2008 | January 7, 2009 | |||||
Our Credit Facility restricts the payment of cash dividends to a maximum of 50% of our net income for the four quarters preceding the date of the dividend. The payments of the above dividends were in compliance with the Credit Facility. For additional information regarding our Credit Facility, see Note 7 to the accompanying consolidated financial statements, included herein, and “Liquidity and Capital Resources” in “Item 7—Management’s Discussion and Analysis of Financial Condition and Results of Operations.”
20
Table of Contents
Stock Performance
This graph compares the total shareholder return on our common stock with the total return on the Russell 2000 Index and the S&P Energy Index for the five-year period from December 31, 2004 through December 31, 2009. The cumulative return includes reinvestment of dividends.
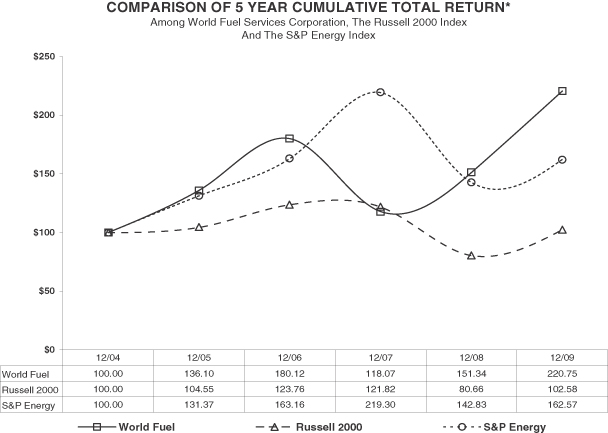
| * | $100.00 invested on December 31, 2004 in stock or index, including reinvestment of dividends. Fiscal year ending December 31st. |
Copyright© 2010 S&P, a division of The McGraw-Hill Companies Inc. All rights reserved.
21
Table of Contents
Equity Compensation Plans
The following table summarizes securities authorized for issuance related to outstanding stock options and stock-settled stock appreciation rights, which are referred to collectively as “Option Awards” and restricted stock units (“RSUs”) under our various equity compensation plans (which were all approved by our shareholders) as of December 31, 2009 (in thousands, except weighted average price data):
| Plan name or description |
(a) Maximum number of securities to be issued upon exercise of outstanding Option Awards and RSUs |
(b) Weighted average exercise or conversion price of outstanding Option Awards and RSUs |
(c) Number of securities remaining available for future issuance under equity compensation plans (excluding securities reflected in column (a)) | ||||
| 2006 Omnibus Plan |
2,302 | $ | 10.63 | 4,404 | |||
| 2001 Omnibus Plan |
526 | 17.42 | — | ||||
| 1996 Employee Stock Option Plan |
94 | 2.98 | — | ||||
| 1993 Non-Employee Directors Stock Option Plan |
40 | 12.50 | — | ||||
| 2,962 | $ | 11.62 | 4,404 | ||||
There are no outstanding warrants to purchase our common stock.
Repurchase of Common Stock
The following table presents information with respect to repurchases of common stock made by us during the quarterly period ended December 31, 2009 (in thousands, except average price per share):
| Period |
Total Number of Shares Purchased (1) |
Average Price Per Share Paid |
Total Number of Shares Purchased as Part of Publicly Announced Plans or Programs (2) |
Total Cost of Shares Purchased as Part of Publicly Announced Plans or Programs (2) |
Remaining Authorized Stock Repurchases under Publicly Announced Plans or Programs (2) | ||||||||
| 10/1/09-10/31/09 |
— | $ | — | — | $ | — | $ | 50,000 | |||||
| 11/1/09-11/30/09 |
2 | 26.64 | — | — | 50,000 | ||||||||
| 12/1/09-12/31/09 |
— | — | — | — | 50,000 | ||||||||
| Total |
2 | $ | 26.64 | — | $ | — | $ | 50,000 | |||||
| (1) | These shares relate to the purchase of stock tendered by employees to exercise share-based payment awards and satisfy the required withholding taxes related to share-based payment awards. |
| (2) | In October 2008, our Board of Directors authorized a $50.0 million share repurchase program. The program does not require a minimum number of shares to be purchased and has no expiration date but may be suspended or discontinued at any time. As of December 31, 2009, no shares of our common stock had been repurchased under this program. The timing and amount of shares to be repurchased under the program will depend on market conditions, share price, securities law and other legal requirements and other factors. |
For information on repurchases of common stock for the first three quarters of 2009, see the corresponding Form 10-Q for each such quarter. The number of shares and per share amounts on each corresponding Form 10-Q do not reflect the December 2009 stock split.
22
Table of Contents
| Item 6. | Selected Financial Data |
The following selected consolidated financial data should be read in conjunction with the consolidated financial statements and related notes thereto and Part II, Item 7 of this report appearing under the caption, “Management’s Discussion and Analysis of Financial Condition and Results of Operations” and other financial data and “Risk Factors” included elsewhere in this Form 10-K. The historical results are not necessarily indicative of the operating results to be expected in the future. All financial information presented has been prepared in U.S. dollars and in accordance with accounting principles generally accepted in the United States.
WORLD FUEL SERVICES CORPORATION AND SUBSIDIARIES
SELECTED FINANCIAL DATA
(In thousands, except earnings and dividends per share data)
| For the Year ended December 31, | |||||||||||||||||
| 2009 (1) | 2008 (2) | 2007 (3) | 2006 | 2005 | |||||||||||||
| Revenue |
$ | 11,295,177 | $ | 18,509,403 | $ | 13,729,555 | $ | 10,785,136 | $ | 8,733,947 | |||||||
| Cost of revenue |
10,919,586 | 18,114,020 | 13,484,283 | 10,571,067 | 8,555,283 | ||||||||||||
| Gross profit |
375,591 | 395,383 | 245,272 | 214,069 | 178,664 | ||||||||||||
| Operating expenses (4) |
221,596 | 241,643 | 159,384 | 137,423 | 122,044 | ||||||||||||
| Income from operations |
153,995 | 153,740 | 85,888 | 76,646 | 56,620 | ||||||||||||
| Other expense (income), net |
4,086 | 16,165 | (698 | ) | (4,753 | ) | 792 | ||||||||||
| Income before taxes |
149,909 | 137,575 | 86,586 | 81,399 | 55,828 | ||||||||||||
| Provision for income taxes |
32,346 | 32,370 | 21,235 | 17,353 | 15,475 | ||||||||||||
| Net income including noncontolling interest |
117,563 | 105,205 | 65,351 | 64,046 | 40,353 | ||||||||||||
| Less: net income attributable to noncontrolling interest |
424 | 166 | 578 | 98 | 744 | ||||||||||||
| Net income attributable to World Fuel |
$ | 117,139 | $ | 105,039 | $ | 64,773 | $ | 63,948 | $ | 39,609 | |||||||
| Basic earnings per share (6)(7) |
$ | 1.99 | $ | 1.82 | $ | 1.14 | $ | 1.15 | $ | 0.82 | |||||||
| Basic weighted average shares (6)(7) |
59,003 | 57,707 | 56,853 | 55,710 | 48,327 | ||||||||||||
| Diluted earnings per share (6)(7) |
$ | 1.96 | $ | 1.80 | $ | 1.11 | $ | 1.12 | $ | 0.79 | |||||||
| Diluted weighted average shares (6)(7) |
59,901 | 58,244 | 58,346 | 56,870 | 50,428 | ||||||||||||
| Cash dividends declared per share |
$ | 0.15 | $ | 0.075 | $ | 0.075 | $ | 0.075 | $ | 0.075 | |||||||
| As of December 31, | |||||||||||||||||
| 2009 (1) | 2008 (2) | 2007 (3) | 2006 | 2005 (5) | |||||||||||||
| Cash, cash equivalents and short-term investments |
$ | 306,943 | $ | 322,452 | $ | 44,251 | $ | 188,995 | $ | 143,284 | |||||||
| Accounts receivable, net |
951,398 | 676,100 | 1,370,656 | 860,084 | 689,605 | ||||||||||||
| Total current assets |
1,463,978 | 1,172,150 | 1,665,308 | 1,196,091 | 948,310 | ||||||||||||
| Total assets |
1,741,228 | 1,404,626 | 1,798,046 | 1,277,400 | 1,014,001 | ||||||||||||
| Total current liabilities (6) |
947,742 | 750,787 | 1,230,328 | 826,130 | 634,613 | ||||||||||||
| Total long-term liabilities |
60,237 | 45,693 | 83,058 | 24,670 | 25,098 | ||||||||||||
| Total shareholders’ equity (6) |
733,249 | 608,146 | 484,660 | 426,600 | 354,290 | ||||||||||||
| (1) | In April 2009, we acquired Henty and the TGS business. The financial position and results of operations of these acquisitions have been included in our consolidated financial statements since April 1, 2009. |
23
Table of Contents
| (2) | In June 2008, we acquired certain assets of Texor Petroleum Company, Inc., (the “Texor business”). The financial position and results of operations of this acquisition have been included in our consolidated financial statements since June 1, 2008. |
| (3) | In December 2007, we acquired all of the outstanding stock of each of Kropp Holdings, Inc., and Avcard Services, Ltd. (collectively, “AVCARD”). The financial position and results of operations of this acquisition have been included in our consolidated financial statements since December 1, 2007. |
| (4) | Included in operating expenses are total compensation costs associated with share-based payment awards of $6.5 million, $14.7 million (including special bonus awards of $4.5 million, which were settled in our common stock in 2009), $7.2 million, $7.0 million and $4.0 million for 2009, 2008, 2007, 2006 and 2005, respectively. |
| (5) | In September 2005, we completed a public offering of 8,223,000 shares of our common stock at a price of $15.50 per share. We received net proceeds of $120.3 million from the offering, after deducting $6.4 million in commissions paid to the underwriters and $0.8 million in other expenses incurred in connection with the offering, which was recorded as an increase to shareholders’ equity. |
| (6) | Certain amounts in prior years have been reclassified to conform to current year’s presentation in connection with the adoption of certain new accounting standards in 2009. |
| (7) | All references to number of shares and per share amounts retroactively reflect the increase in the number of shares as a result of the December 2009 two-for-one stock split. |
| Item 7. | Management’s Discussion and Analysis of Financial Condition and Results of Operations |
The following discussion should be read in conjunction with “Item 6—Selected Financial Data,” and with the accompanying consolidated financial statements and related notes thereto appearing elsewhere in this Form 10-K. The following discussion may contain forward-looking statements, and our actual results may differ significantly from the results suggested by these forward-looking statements. Some factors that may cause our results to differ materially from the results and events anticipated or implied by such forward-looking statements are described in “Item 1A—Risk Factors.”
Overview
We are engaged in the marketing and sale of marine, aviation and land fuel products and related services on a worldwide basis. We compete by providing our customers value-added benefits, including single-supplier convenience, competitive pricing, the availability of trade credit, price risk management, logistical support, fuel quality control and fuel procurement outsourcing. For additional information on derivatives, see “Significant Accounting Polices” in Note 1 of this Form 10-K. We have three reportable operating business segments: marine, aviation and land. In our marine segment, we offer fuel and related services to a broad base of maritime customers, including international container and tanker fleets, commercial cruise lines and time-charter operators, as well as to the U.S. and foreign governments. In our aviation segment, we offer fuel and related services to major commercial airlines, second and third-tier airlines, cargo carriers, regional and low cost carriers, corporate fleets, fractional operators, private aircraft, military fleets and to the U.S. and foreign governments, as well as a private label charge card used to purchase aviation fuel and related services to customers in the general aviation industry. In our land segment, we offer fuel and related services to petroleum distributors operating in the land transportation market, retail petroleum operators, industrial, commercial and government customers. We also operate a small number of retail gasoline stations in the U.S.
In our marine segment, we primarily purchase and resell fuel and also act as brokers for others. Profit from our marine segment is determined primarily by the volume and gross profit achieved on fuel resales and by the volume and commission rate of the brokering business. In our aviation and land segments, we primarily purchase and resell fuel, and we do not act as brokers. Profit from our aviation and land segments is primarily determined by the volume and the gross profit achieved on fuel resales, and in the case of the aviation segment, a percentage
24
Table of Contents
of processed charge card revenue. Our profitability in our segments also depends on our operating expenses, which may be significantly affected to the extent that we are required to provide for potential bad debt.
Our revenue and cost of revenue are significantly impacted by world oil prices, as evidenced in part by our revenue and cost of revenue increases in recent fiscal years and the decrease in 2009, while our gross profit is not necessarily impacted by changes in world oil prices. However, due to our inventory average costing methodology, significant movements in fuel prices during any given financial period can have a significant impact on our gross profit, either positively or negatively depending on the direction, volatility and timing of such price movements.
We may experience decreases in future sales volumes and margins as a result of the ongoing deterioration in the world economy, transportation industry, natural disasters and continued conflicts and instability in the Middle East, Asia and Latin America, as well as potential future terrorist activities and possible military retaliation. In addition, because fuel costs represent a significant part of our customers’ operating expenses, volatile and/or high fuel prices can adversely affect our customers’ businesses, and consequently the demand for our services and our results of operations. Our hedging activities may not be effective to mitigate volatile fuel prices and may expose us to counterparty risk. See “Item 1A—Risk Factors” of this Form 10-K.
Reportable Segments
We have three reportable operating segments: marine, aviation and land. Corporate expenses are allocated to the segment based on usage, where possible, or on other factors according to the nature of the activity. We evaluate and manage our business segments using the performance measurement of income from operations. Financial information with respect to our business segments is provided in Note 12 to the accompanying consolidated financial statements included in this Form 10-K.
Critical Accounting Policies and Estimates
The discussion and analysis of our financial condition and results of operations are based upon our consolidated financial statements included elsewhere in this Form 10-K, which have been prepared in accordance with accounting principles generally accepted in the United States. The preparation of these financial statements requires management to make estimates and judgments that affect the reported amounts of assets, liabilities, revenues and expenses and related disclosure of contingent assets and liabilities. On an ongoing basis, we evaluate our estimates, including those related to unbilled revenue and related costs of sales, bad debt, share-based payment awards, investments, derivatives, goodwill and identifiable intangible assets and certain accrued liabilities. We base our estimates on historical experience and on other assumptions that are believed to be reasonable under the circumstances, the results of which form the basis for making judgments about the carrying values of assets and liabilities that are not readily apparent from other sources. Actual results may differ from these estimates under different assumptions or conditions.
We have identified the policies below as critical to our business operations and the understanding of our results of operations. For a detailed discussion on the application of these and other significant accounting policies, see Note 1 to the accompanying consolidated financial statements included in this Form 10-K.
Revenue Recognition
Revenue from the sale of fuel is recognized when the sales price is fixed or determinable, collectability is reasonably assured and title passes to the customer, which is when the delivery of fuel is made to our customer directly from us, the supplier or a third-party subcontractor. Our fuel sales are generated as a fuel reseller as well as from on-hand inventory supply. When acting as a fuel reseller, we generally purchase fuel from the supplier, mark it up and contemporaneously resell the fuel to the customer, normally taking delivery for purchased fuel at the same place and time as the delivery is made. We record the gross sale of the fuel as we generally take inventory risk, have latitude in establishing the sales price, have discretion in the supplier selection, maintain credit risk and are the primary obligor in the sales arrangement.
25
Table of Contents
Revenue from fuel-related services is recognized when services are performed, the sales price is fixed or determinable and collectability is reasonably assured. We record the sale of fuel-related services on a gross basis as we generally have latitude in establishing the sales price, have discretion in supplier selection, maintain credit risk and are the primary obligor in the sales arrangement.
Commission from fuel broker services is recognized when services are performed and collectability is reasonably assured. When acting as a fuel broker, we are paid a commission by the supplier.
Revenue from charge card transactions is recognized at the time the purchase is made by the customer using the charge card. Revenue from charge card transactions is generated from processing fees.
Share-Based Payment Awards
We account for share-based payment awards on a fair value basis. Under fair value accounting, the grant-date fair value of the share-based payment award is amortized as compensation expense, on a straight-line basis, over the vesting period for both graded and cliff vesting awards. Annual compensation expense for share-based payment awards is reduced by an expected forfeiture amount on the outstanding share-based payment awards.
We use the Black-Scholes option pricing model to estimate the fair value of Option Awards. The estimation of the fair value of Option Awards on the date of grant using an option-pricing model is affected by our stock price as well as assumptions regarding a number of complex and subjective variables. These variables include our expected stock price volatility over the term of the awards, actual and projected employee stock option exercise behaviors, risk-free interest rates and expected dividends. The expected term of Option Awards represents the estimated period of time from grant until exercise or conversion and is based on vesting schedules and expected post-vesting, exercise and employment termination behavior. Expected volatility is based on the historical volatility of our common stock over the period that is equivalent to the award’s expected life. Any adjustment to the historical volatility as an indicator of future volatility would be based on the impact to historical volatility of significant non-recurring events that would not be expected in the future. Risk-free interest rates are based on the U.S. Treasury yield curve at the time of grant for the period that is equivalent to the award’s expected life. Dividend yields are based on the historical dividends of World Fuel over the period that is equivalent to the award’s expected life, as adjusted for stock splits.
The estimated fair value of common stock, restricted stock and restricted stock units is based on the grant-date market value of our common stock, as defined in the respective plans under which the awards were granted.
Cash flows from tax benefits resulting from tax deductions in excess of the compensation cost recognized for share-based payment awards (excess tax benefits) are classified as financing cash flows. These excess income tax benefits were credited to capital in excess of par value.
Accounts Receivable and Allowance for Bad Debt
Credit extension, monitoring and collection are performed for each of our business segments. Each segment has a credit committee that is responsible for approving credit limits, setting and maintaining credit standards and managing the overall quality of the credit portfolio. We perform ongoing credit evaluations of our customers and adjust credit limits based upon a customer’s payment history and creditworthiness, as determined by our review of our customer’s credit information. We extend credit on an unsecured basis to most of our customers. Accounts receivable are deemed past due based on contractual terms agreed with our customers.
We continuously monitor collections and payments from our customers and maintain a provision for estimated credit losses based upon our historical experience with our customers, current market and industry conditions affecting our customers and any specific customer collection issues that we have identified. Historical payment trends may not be a useful indicator of current or future credit worthiness of our customers, particularly in these unprecedented difficult economic and financial markets. Accounts receivable are reduced by an allowance for estimated credit losses.
26
Table of Contents
If credit losses exceed established allowances, our results of operations and financial condition may be adversely affected. For additional information on the credit risks inherent in our business, see “Item 1A—Risk Factors” of this Form 10-K.
Inventories
Inventories are valued using the average cost methodology and are stated at the lower of average cost or market. Components of inventory include fuel purchase costs, the related transportation costs, storage fees, and for inventories included in a fair value hedge relationship, changes in the estimated fair market values.
Derivatives
We enter into derivative contracts in order to mitigate the risk of market price fluctuations in marine, aviation and land fuel, to offer our customers fuel pricing alternatives to meet their needs. From time to time, we also enter into certain limited risk derivative transactions which are speculative in nature, primarily basis spreads related to fuel products sold by the company. We also enter into derivatives in order to mitigate the risk of fluctuations in foreign currency exchange rates. We have applied the normal purchase and normal sales exception (“NPNS”), as provided by accounting guidance for derivative instruments and hedging activities, to certain of our physical forward sales and purchase contracts. While these contracts are considered derivative instruments under the guidance for derivative instruments and hedging activities, they are not recorded at fair value, but rather are recorded in our consolidated financial statements when physical settlement of the contracts occurs. If it is determined that a transaction designated as NPNS no longer meets the scope of the exception, the fair value of the related contract is recorded as an asset or liability on the consolidated balance sheet and the difference between the fair value and the contract amount is immediately recognized through earnings.
Our derivatives that are subject to the accounting guidance for derivative instruments are recognized at their estimated fair market value in accordance with the accounting guidance for fair value measurements. If the derivative does not qualify as a hedge or is not designated as a hedge, changes in the estimated fair market value of the derivative are recognized as a component of revenue or cost of revenue (based on the underlying transaction type) in the consolidated statement of income. Derivatives which qualify for hedge accounting may be designated as either a fair value or cash flow hedge. For our fair value hedges, changes in the estimated fair market value of the hedge instrument and the hedged item are recognized in the same line item as a component of either revenue or cost of revenue (based on the underlying transaction type) in the consolidated statement of income. For our cash flow hedges, the effective portion of the changes in the fair market value of the hedge is recognized as a component of other comprehensive income in the shareholders’ equity section of the consolidated balance sheet and subsequently reclassified into the same line item as the forecasted transaction when both are settled, while the ineffective portion of the changes in the estimated fair market value of the hedge is recognized as a component of other non-operating expense/income in the consolidated statement of income. Cash flows for our hedging instruments used in our hedges are classified in the same category as the cash flow from the hedged items. If for any reason hedge accounting is discontinued, then any cash flows subsequent to the date of discontinuance shall be classified consistent with the nature of the instrument.
To qualify for hedge accounting, as either a fair value or cash flow hedge, the hedging relationship between the hedging instruments and hedged items must be highly effective over an extended period of time in achieving the offset of changes in fair values or cash flows attributable to the hedged risk at the inception of the hedge. We use a regression analysis based on historical spot prices in assessing the qualification for our fair value hedges. However, our measurement of hedge ineffectiveness for our fair value inventory hedges utilizes spot prices for the hedged item (inventory) and forward or future prices for the hedge instrument. Therefore, the excluded component (forward or futures prices) in assessing hedge qualification, along with ineffectiveness, is included as a component of cost of revenue in earnings. Adjustments to the carrying amounts of hedged items is discontinued in instances where the related fair value hedging instrument becomes ineffective and any previously recorded fair market value changes are not adjusted until the fuel is sold.
27
Table of Contents
Goodwill and Identifiable Intangible Assets
Goodwill represents our cost in excess of the estimated fair value of net assets, including identifiable intangible assets of acquired businesses or companies. Goodwill is not subject to periodic amortization; instead, it is reviewed annually at year-end (or more frequently under certain circumstances) for impairment. The initial step of the goodwill impairment test compares the estimated fair value of a reporting unit, which is the same as our reporting segments, with its carrying amount, including goodwill. The fair value of our reporting segments is estimated using discounted cash flows and market capitalization methodologies.
In connection with our acquisitions, we recorded identifiable intangible assets existing at the date of the acquisitions for customer relationships, supplier and, non-compete agreements and trademark/trade name rights. Identifiable intangible assets subject to amortization are amortized over their estimated lives and are reviewed for impairment whenever events or changes in circumstances indicate that the carrying amount of an asset may not be recoverable based on market factors and operational considerations. Identifiable intangible assets not subject to amortization are reviewed annually for impairment by comparing the estimated fair value of the intangible asset with its carrying value.
Results of Operations
The results of operations do not include the results of Henty (marine and land segments) or the TGS business (land segment) prior to April 1, 2009, the results of the Texor business (land segment) prior to June 1, 2008 or the results of AVCARD (aviation segment) prior to December 1, 2007, the respective acquisition date of each of these acquired businesses.
2009 compared to 2008
Revenue. Our revenue for 2009 was $11.3 billion, a decrease of $7.2 billion, or 39.0%, as compared to 2008. Our revenue during these periods was attributable to the following segments (in thousands):
| 2009 | 2008 | $ Change | ||||||||
| Marine segment |
$ | 6,040,643 | $ | 9,915,291 | $ | (3,874,648 | ) | |||
| Aviation segment |
4,049,565 | 7,294,466 | (3,244,901 | ) | ||||||
| Land segment |
1,204,969 | 1,299,646 | (94,677 | ) | ||||||
| Total |
$ | 11,295,177 | $ | 18,509,403 | $ | (7,214,226 | ) | |||
Our marine segment contributed $6.0 billion in revenue for 2009, a decrease of $3.9 billion, or 39.1%, as compared to 2008. Of the total decrease in marine segment revenue, $2.4 billion was due to decreased sales volume primarily attributable to the deterioration in the overall volumes in the shipping industry compared to last year and our conscious effort to shed risk. The remaining decrease of $1.5 billion was due to a decrease in the average price per metric ton sold as a result of lower world oil prices in 2009.
Our aviation segment contributed $4.0 billion in revenue for 2009, a decrease of $3.2 billion, or 44.5%, as compared to 2008. Of the total decrease in aviation segment revenue, $2.7 billion was due to a decrease in the average price per gallon sold as a result of lower world oil prices in 2009 compared to record prices in 2008. The remaining decrease of $501.1 million was due to decreased sales volume, reflecting the result of our efforts to change the business mix to yield higher margins and our continued efforts to achieve risk adjusted returns on invested capital, primarily in the first half of 2009.
Our land segment contributed $1.2 billion in revenue for 2009, a decrease of $94.7 million, or 7.3%, as compared to 2008. Of the total decrease in land segment revenue, $349.5 million was due to a decrease in the average price per gallon sold as a result of lower world oil prices in 2009. Offsetting this decrease was $254.8 million primarily due to increased sales volume attributable to incremental sales due to the inclusion of the results of the Texor business for all of 2009 and Henty and the TGS business since April 2009.
28
Table of Contents
Gross Profit. Our gross profit for 2009 was $375.6 million, a decrease of $19.8 million, or 5.0%, as compared to 2008. Our gross profit during these periods was attributable to the following segments (in thousands):
| 2009 | 2008 | $ Change | ||||||||
| Marine segment |
$ | 168,890 | $ | 203,345 | $ | (34,455 | ) | |||
| Aviation segment |
163,730 | 165,834 | (2,104 | ) | ||||||
| Land segment |
42,971 | 26,204 | 16,767 | |||||||
| Total |
$ | 375,591 | $ | 395,383 | $ | (19,792 | ) | |||
Our marine segment gross profit for 2009 was $168.9 million, a decrease of $34.5 million, or 16.9%, as compared to 2008. In 2008, we were presented with extraordinary market opportunities, primarily in the second and third quarters, due to near record fuel prices, volatility and general financing constraints in the global credit market resulting in record gross profit. Of the total decrease in marine segment gross profit, $49.6 million was due to decreased sales volume primarily attributable to the deterioration in the overall volumes in the shipping industry compared to last year, which was partially offset by $15.1 million in increased gross profit per metric ton sold due to our continued efforts to achieve risk adjusted returns on invested capital which began in the latter part of the second quarter of 2008.
Our aviation segment gross profit for 2009 was $163.7 million, a decrease of $2.1 million, or 1.3%, as compared to 2008. Of the decrease in aviation segment gross profit, $3.6 million was due to decreased sales volume which was partially offset by $1.5 million in higher gross profit per gallon sold, reflecting the result of our efforts to change the business mix to yield higher margins and our continued efforts to achieve risk adjusted returns on invested capital.
Our land segment gross profit for 2009 was $43.0 million, an increase of $16.8 million, or 64.0%, as compared to 2008. Of the increase in land segment gross profit, $13.5 million was primarily due to the inclusion of the results of the Texor business for all of 2009 and the acquisitions of Henty and the TGS business, which were both completed in April 2009. The remaining increase of $3.3 million relates to a higher gross profit per gallon sold.
Operating Expenses. Total operating expenses for 2009 were $221.6 million, a decrease of $20.0 million, or 8.3%, as compared to 2008. The following table sets forth our expense categories (in thousands):
| 2009 | 2008 | $ Change | ||||||||
| Compensation and employee benefits |
$ | 137,408 | $ | 140,280 | $ | (2,872 | ) | |||
| Provision for bad debt |
4,552 | 16,081 | (11,529 | ) | ||||||
| General and administrative |
79,636 | 85,282 | (5,646 | ) | ||||||
| Total |
$ | 221,596 | $ | 241,643 | $ | (20,047 | ) | |||
Of the total decrease in operating expenses, $2.9 million was related to compensation and employee benefits, $11.5 million was related to provision for bad debt and $5.6 million was related to general and administrative expenses. The decrease in compensation and employee benefits was primarily due to a reduction in incentive based compensation offset by salaries for new hires to support our growing global business and salaries related to employees of acquired businesses. The lower provision for bad debt was primarily attributable to the substantially greater bad debt provision in 2008 which resulted from near record fuel prices and corresponding accounts receivable. Additionally, during 2009, we were successful in making favorable changes in the customer mix as a result of our efforts to reduce exposure to high risk counterparties in the 2009 receivable portfolio as compared to 2008. The decrease in general and administrative expenses was due to our continuing efforts to control spending.
29
Table of Contents
Income from Operations. Our income from operations for 2009 was $154.0 million, an increase of $0.3 million, or 0.2%, as compared to 2008. Income from operations during these periods was attributable to the following segments (in thousands):
| 2009 | 2008 | $ Change | ||||||||||
| Marine segment |
$ | 97,636 | $ | 121,818 | $ | (24,182 | ) | |||||
| Aviation segment |
75,462 | 68,142 | 7,320 | |||||||||
| Land segment |
10,778 | 3,489 | 7,289 | |||||||||
| 183,876 | 193,449 | (9,573 | ) | |||||||||
| Corporate overhead—unallocated |
(29,881 | ) | (39,709 | ) | (9,828 | ) | ||||||
| Total |
$ | 153,995 | $ | 153,740 | $ | 255 | ||||||
Our marine segment earned $97.6 million in income from operations for 2009, a decrease of $24.2 million, or 19.9%, as compared to 2008. This decrease resulted from $34.5 million in lower gross profit, which was partially offset by $10.3 million in decreased operating expenses. The decrease in marine segment operating expenses was attributable to decreases in compensation and employee benefits, general and administrative expenses and provision for bad debt.
Our aviation segment income from operations was $75.5 million for 2009, an increase of $7.3 million, or 10.7%, as compared to 2008. This increase resulted from decreased operating expenses of $9.4 million which was partially offset by $2.1 million in lower gross profit. The decrease in aviation segment operating expenses was attributable to decreases in provision for bad debt and general and administrative expenses.
Our land segment income from operations was $10.8 million for 2009, an increase of $7.3 million, as compared to 2008. The increase resulted from incremental income from operations due to full year results for the Texor business, and Henty and the TGS business acquired in April 2009.
Corporate overhead costs not charged to the business segments were $29.9 million for 2009, a decrease of $9.8 million, or 24.7%, as compared to 2008. The decrease in corporate overhead costs not charged to the business segments was attributable to decreases in compensation and employee benefits, primarily as a result of a larger amount of bonuses and stock compensation, including a special bonus award of $5.0 million, in 2008, which was partially offset by increases in general and administrative expenses.
Other Income and Expense, net. For 2009, we had other expense, net of $4.1 million a decrease of $12.1 million, or 74.7%, as compared to other expense, net of $16.2 million for 2008. This decrease was primarily due to foreign currency losses related to our subsidiaries in Brazil during 2008 which we did not experience in 2009 due to a change in functional currency and a reduction in foreign exchange losses and decreased interest expense related to lower outstanding borrowings under our Credit Facility in 2009.
Taxes. For 2009, our effective tax rate was 21.6% and our income tax provision was $32.3 million, as compared to an effective tax rate of 23.5% and an income tax provision of $32.4 million for 2008. The lower effective tax rate for 2009 resulted primarily from differences in the results of our subsidiaries in tax jurisdictions with different tax rates as compared to 2008.
Net Income and Diluted Earnings per Share. Our net income for 2009 was $117.1 million, an increase of $12.1 million, or 11.5%, as compared to 2008. Diluted earnings per share for 2009 was $1.96 per share, an increase of $0.16 per share, or 8.9%, as compared to 2008.
30
Table of Contents
2008 compared to 2007
Revenue. Our revenue for 2008 was $18.5 billion, an increase of $4.8 billion, or 34.8%, as compared to 2007. The significant increase in revenue from 2007 in total is primarily due to the rise in prices during most of the first three quarters of 2008 despite a sharp decline in oil prices during the fourth quarter. Our revenue during these periods was attributable to the following segments (in thousands):
| 2008 | 2007 | $ Change | |||||||
| Marine segment |
$ | 9,915,291 | $ | 7,665,801 | $ | 2,249,490 | |||
| Aviation segment |
7,294,466 | 5,460,838 | 1,833,628 | ||||||
| Land segment |
1,299,646 | 602,916 | 696,730 | ||||||
| Total |
$ | 18,509,403 | $ | 13,729,555 | $ | 4,779,848 | |||
Our marine segment contributed $9.9 billion in revenue for 2008, an increase of $2.2 billion, or 29.3%, as compared to 2007. Of the total increase in marine segment revenue, $1.9 billion was due to an increase in the average price per metric ton sold as a result of higher world oil prices in 2008. The remaining increase of $273.6 million was due to increased sales volume to both new and existing customers.
Our aviation segment contributed $7.3 billion in revenue for 2008, an increase of $1.8 billion, or 33.6%, as compared to 2007. Of the total increase in aviation segment revenue, $2.1 billion was due to an increase in the average price per gallon sold as a result of higher world oil prices in 2008. Partially offsetting this increase was $267.5 million in decreased sales volume primarily attributable to our efforts to reduce low margin business and to eliminate certain high risk business, offset by the incremental sales volume contributed by our AVCARD acquisition.
Our land segment contributed $1.3 billion in revenue for 2008, an increase of $696.7 million as compared to $602.9 million in 2007. Of the total increase in land segment revenue, $508.1 million was due to increased sales volume attributable to incremental sales resulting from the acquisition of the Texor business, which was completed in June 2008, partially offset by decreased volume in our existing business. The remaining increase of $188.6 million was due to an increase in the average price per gallon sold as a result of higher world oil prices in 2008.
Gross Profit. Our gross profit for 2008 was $395.4 million, an increase of $150.1 million, or 61.2%, as compared to 2007. Our gross profit during these years was attributable to the following segments (in thousands):
| 2008 | 2007 | $ Change | |||||||
| Marine segment |
$ | 203,345 | $ | 114,505 | $ | 88,840 | |||
| Aviation segment |
165,834 | 122,797 | 43,037 | ||||||
| Land segment |
26,204 | 7,970 | 18,234 | ||||||
| Total |
$ | 395,383 | $ | 245,272 | $ | 150,111 | |||
Our marine segment gross profit for 2008 was $203.3 million, an increase of $88.8 million, or 77.6%, as compared to 2007. Contributing to the total increase in marine segment gross profit was $84.5 million in increased gross profit per metric ton sold due to favorable market conditions, as well as a focus to increase our return relative to invested working capital and $4.3 million due to increased sales volume.
Our aviation segment gross profit for 2008 was $165.8 million, an increase of $43.0 million, or 35.0%, as compared to 2007. Of the increase in aviation gross profit, $48.0 million was due to higher gross profit per gallon sold, which reflects favorable market conditions and the timing of price movements relative to our inventory position as well as changes in business mix yielding higher margins. Partially offsetting this increase was a decrease in aviation gross profit of $5.0 million due to net decreased sales volume primarily attributable to our
31
Table of Contents
efforts to reduce low margin business and to eliminate certain high risk business and decreased gross profit related to aviation services, partially offset by the incremental sales volume contributed by our AVCARD acquisition.
Our land segment gross profit for 2008 was $26.2 million, an increase of $18.2 million, as compared to $8.0 million in 2007. The increase was primarily due to the inclusion of the results of the Texor business as well as higher gross profit per gallon from our pre-existing business.
Operating Expenses. Total operating expenses for 2008 were $241.6 million, an increase of $82.3 million, or 51.6%, as compared to 2007. The following table sets forth our expense categories (in thousands):
| 2008 | 2007 | $ Change | |||||||
| Compensation and employee benefits |
$ | 140,280 | $ | 93,732 | $ | 46,548 | |||
| Provision for bad debt |
16,081 | 1,892 | 14,189 | ||||||
| General and administrative |
85,282 | 63,760 | 21,522 | ||||||
| Total |
$ | 241,643 | $ | 159,384 | $ | 82,259 | |||
Of the total increase in operating expenses, $46.5 million was related to compensation and employee benefits, $14.2 million was related to the provision for bad debt and $21.5 million was related to general and administrative expenses. The increase in compensation and employee benefits was primarily due to higher incentive compensation, including special bonus awards to our CEO, Chief Operating Officer, CFO and Chief Risk and Administrative Officer as a result of our strong financial performance in 2008, new hires to support our growing global business, and the incremental compensation and employee benefits costs related to the acquisitions of AVCARD and the Texor business. The increase in provision for bad debt was primarily due to our assessment of risk related to certain of our customers due in part to higher fuel prices and the consideration of the transportation economies of the regions in which we conduct business and its impact on our customers, which resulted in an increase in the provision for certain accounts in 2008. The increase in general and administrative expenses of $21.5 million, which includes the incremental general and administrative expenses related to the acquisitions of AVCARD and the Texor business, was primarily attributable to the following expenses: depreciation and amortization, including amortization of the intangible assets related to the acquisitions of AVCARD and the Texor business, and depreciation from our enterprise integration project that went live in February 2008, professional and consulting fees, office rent and telecommunication expenses.
Income from Operations. Our income from operations for 2008 was $153.7 million, an increase of $67.9 million, or 79.0%, as compared to 2007. Income from operations during these years was attributable to the following segments (in thousands):
| 2008 | 2007 | $ Change | |||||||||
| Marine segment |
$ | 121,818 | $ | 50,844 | $ | 70,974 | |||||
| Aviation segment |
68,142 | 60,796 | 7,346 | ||||||||
| Land segment |
3,489 | 1,237 | 2,252 | ||||||||
| 193,449 | 112,877 | 80,572 | |||||||||
| Corporate overhead—unallocated |
(39,709 | ) | (26,989 | ) | 12,720 | ||||||
| Total |
$ | 153,740 | $ | 85,888 | $ | 67,852 | |||||
Our marine segment earned $121.8 million in income from operations for 2008, an increase of $71.0 million as compared to $50.8 million in 2007. This increase resulted from $88.8 million in higher gross profit, which was partially offset by increased operating expenses of $17.8 million. The increase in marine segment operating expenses, which includes an increase in allocated corporate expenses, was attributable to increases in compensation and employee benefits, primarily increases in incentive-based compensation, and general and administrative expenses, which was partially offset by a reduction in provision for bad debt.
32
Table of Contents
Our aviation segment income from operations was $68.1 million for 2008, an increase of $7.3 million, or 12.1%, as compared to 2007. This increase resulted from $43.0 million in higher gross profit, which was offset by increased operating expenses of $35.7 million. The increase in aviation segment operating expenses, which includes an increase in allocated corporate expenses and AVCARD’s incremental operating expenses, was attributable to increases in compensation and employee benefits, provision for bad debt and general and administrative expenses.
Our land segment income from operations was $3.5 million for 2008, an increase of $2.3 million as compared to $1.2 million in 2007. This increase resulted from the incremental income from operations as a result of the acquisition of the Texor business, partially offset by an increase in land segment operating expenses attributable to increases in compensation and employee benefits, provision for bad debt and general and administrative expenses.
Corporate overhead costs not charged to the business segments were $39.7 million for 2008, an increase of $12.7 million, or 47.1%, as compared to 2007. The increase in corporate overhead costs was primarily attributable to increases in compensation and employee benefits, including incentive-based compensation and special bonus awards, and general and administrative expenses.
Other Income and Expense, net. For 2008, we had other expense, net of $16.2 million compared to other income, net of $0.7 million for 2007. This $16.9 million change was primarily due to increased interest expense related to higher outstanding borrowings under our Credit Facility, including fees related to the establishment of a facility to sell certain of our accounts receivable, increased foreign exchange losses and decreased interest income, partially offset by a $1.9 million investment impairment charge in 2007.
Taxes. For 2008, our effective tax rate was 23.5% and our income tax provision was $32.4 million, as compared to an effective tax rate of 24.5% and an income tax provision of $21.2 million for 2007. The lower effective tax rate for 2008 resulted primarily from fluctuations in the actual results achieved by our subsidiaries in tax jurisdictions with different tax rates.
Net Income and Diluted Earnings per Share. Net income for 2008 was $105.0 million, an increase of $40.3 million, or 62.2%, as compared to 2007. Diluted earnings per share for 2008 was $1.80 per share, an increase of $0.69 per share, or 62.2%, as compared to 2007.
Liquidity and Capital Resources
Over the past several years the global financial markets have experienced unprecedented volatility, and we continue to closely monitor the potential impact of these market conditions on our liquidity. Despite this unprecedented volatility, to date, these market conditions have not had a material adverse impact on our liquidity. The following table reflects the major categories of cash flows for 2009, 2008 and 2007. For additional details, please see the consolidated statements of cash flows in the consolidated financial statements.
| 2009 | 2008 | 2007 | ||||||||||
| Net cash provided by (used in) operating activities |
$ | 77,921 | $ | 393,452 | $ | (77,927 | ) | |||||
| Net cash used in investing activities |
(61,828 | ) | (100,157 | ) | (68,988 | ) | ||||||
| Net cash (used in) provided by financing activities |
(34,436 | ) | (13,372 | ) | 6,571 | |||||||
2009 compared to 2008
Operating Activities. For 2009, net cash provided by operating activities totaled $78.0 million as compared to $393.5 million in 2008. The change in cash flow provided by operating activities was primarily due to reduced cash flow provided from operating assets and liabilities primarily as a result of a steep decline in oil prices in the latter part of 2008 as compared to relatively stable oil prices in 2009 and increased inventory positions in 2009.
33
Table of Contents
Investing Activities. During 2009, net cash used in investing activities was $61.8 million as compared to $100.2 million in 2008. The decrease in cash used in investing activities in 2009 was due to a reduction in the amount paid for acquisitions.
Financing Activities. For 2009, net cash used in financing activities was $34.4 million as compared to $13.4 million in 2008. The increase in cash used in financing activities in 2009 was primarily due to repayments of debt consisting of bankers’ acceptances and promissory notes issued in connection with our acquisitions.
2008 compared to 2007
Operating Activities. For 2008, net cash provided by operating activities totaled $393.5 million as compared to net cash used in operating activities of $77.9 million in 2007. The increase in cash flow provided by operating activities was primarily due to increased net income and a reduction in operating assets and liabilities resulting from a decline in oil prices and an improvement in our net trade cycle as compared to 2007.
Investing Activities. During 2008, net cash used in investing activities was $100.2 million as compared to $69.0 million in 2007. The increase in cash used in investing activities in 2008 was due to increased acquisition activity which was offset by a reduction in capital expenditures. In 2008, we acquired the Texor business for $93.4 million net of cash acquired of $0.3 million.
Financing Activities. For 2008, net cash used in financing activities was $13.4 million as compared to net cash provided by financing activities of $6.6 million in 2007. The increase in cash used in financing activities in 2008 was primarily due to a $40.0 million debt repayment under our Credit Facility which was offset by borrowings under our BA Facility of $14.5 million, a net increase of $10.0 million resulting from the payment of restricted cash held as collateral from a customer and $5.8 million in federal and state tax benefits resulting from a tax deduction in excess of compensation cost recognized for share-based payment awards.
Other Liquidity Measures
Cash and Cash Equivalents. As of December 31, 2009, we had $298.8 million of cash and cash equivalents compared to $314.4 million of cash and cash equivalents as of December 31, 2008. Our primary uses of cash and cash equivalents are to fund accounts receivable, purchase inventory and make strategic investments, primarily acquisitions. We are usually extended unsecured trade credit from our suppliers for our fuel purchases; however, certain suppliers require us to provide a letter of credit. Increases in oil prices can negatively affect liquidity by increasing the amount of cash needed to fund fuel purchases as well as reducing the amount of fuel which we can purchase on an unsecured basis from our suppliers.
Short Term Investments. At December 31, 2009 and 2008, our short-term investments consisted of $8.1 million of commercial paper with a par value of $10.0 million. On the maturity date of the investment, the issuer of the commercial paper defaulted on its repayment obligation. In April 2008, the commercial paper issuer was placed into receivership. The commercial paper is no longer highly liquid and an observable market does not exist, therefore a readily determinable fair market value of the investment is not available. In February 2009, the High Court of Justice, Chancery Division, Companies Court in the United Kingdom ruled that, based on the maturity date of the commercial paper held by us, we should receive payment ahead of other holders of the commercial paper. Then, in June 2009, the Court of Appeal, Civil Division in the United Kingdom upheld the ruling of the High Court of Justice. Finally, in November 2009, the Supreme Court of the United Kingdom ordered that the permission to appeal be refused, thus, exhausting any further appeals of the lower courts’ rulings.
While we currently believe that we will be able to collect the commercial paper’s par value based on the court judgment noted above, we have maintained the carrying value of our commercial paper at $8.1 million as of December 31, 2009 due to the uncertainties as a result of the receiver’s attempts to obtain settlement, indemnity and retention agreements from various interest parties prior to the distribution of any proceeds.
34
Table of Contents
Credit Facility. Our Credit Facility permits borrowings of up to $475.0 million with a sublimit of $125.0 million for the issuance of letters of credit and bankers’ acceptances. Under the Credit Facility, we have the right to request increases in available borrowings up to an additional $75.0 million, subject to the satisfaction of certain conditions. We had no outstanding borrowings under our Credit Facility at December 31, 2009 and 2008. Our issued letters of credit under the Credit Facility totaled $47.3 million and $50.2 million at December 31, 2009 and 2008, respectively. There were no outstanding bankers’ acceptances under our Credit Facility at December 31, 2009 and 2008. We had $427.7 million of availability under our Credit Facility at December 31, 2009. The Credit Facility expires in December 2012.
Outstanding borrowings under our Credit Facility, our cash and cash equivalents and short-term investments fluctuate primarily based on operating cash flow, most significantly, the timing of receipts from our customers and payments to our suppliers. Higher interest rates can have a negative effect on our liquidity due to higher costs of borrowing under our Credit Facility.
Our Credit Facility contains certain operating and financial covenants with which we are required to comply. Our failure to comply with the operating and financial covenants contained in our Credit Facility could result in an event of default. An event of default, if not cured or waived, would permit acceleration of any outstanding indebtedness under the Credit Facility, trigger cross-defaults under other agreements to which we are a party and impair our ability to obtain working capital advances and letters of credit, which would have a material adverse effect on our business, financial condition and results of operations. As of December 31, 2009, we believe we were in compliance with all covenants contained in our Credit Facility.
Accounts Receivable Facility. We have a Master Accounts Receivable Purchase Agreement with a syndicate of financial institutions which establishes a facility (the “Receivable Facility”) for us to sell up to an aggregate of $160.0 million of our accounts receivable on a revolving basis. As of December 31, 2009 and 2008, no accounts receivable had been sold under the Receivable Facility. The Receivable Facility may be increased to up to $250.0 million, subject to the satisfaction of certain conditions, and matures in September 2010 unless an event of termination occurs or the term is extended for subsequent one-year terms with the prior written consent of the syndicate of financial institutions. The Receivable Facility contains customary termination events, including, among other things, the failure to make timely payments under the Receivable Facility, the breach of covenants and the occurrence and continuance of events of default under our Credit Facility. In October 2009, we amended our Receivable Facility to provide that, subject to the satisfaction of certain conditions, a termination event would not occur if one of the two specified rating agencies ceased to cover the insurer of the receivables.
Other Credit Lines. We have unsecured credit lines aggregating $50.0 million for the issuance of letters of credit and bank guarantees. Letters of credit issued under these credit lines are subject to fees at market rates. These credit lines are renewable on an annual basis. As of December 31, 2009 and 2008, our outstanding letters of credit and bank guarantees under these credit lines totaled $20.2 million and $20.9 million, respectively.
Additionally, we have a separate $15.0 million credit facility for the issuance of bankers’ acceptances (the “BA Facility”) with one of the banks participating in our Credit Facility. The BA Facility is a continuing facility that will remain in full force and effect until revoked by us or the bank. Bankers’ acceptances issued under the BA Facility are subject to commissions and fees (finance charges) at the bank’s prevailing rate on the date of acceptance. There were no outstanding bankers’ acceptances under the BA Facility at December 31, 2009. As of December 31, 2008, we had $14.7 million of outstanding bankers’ acceptances.
We believe that available funds from existing cash and cash equivalents, our Credit Facility and the Receivable Facility, together with cash flows generated by operations, remain sufficient to fund our working capital and capital expenditure requirements for at least the next twelve months. In addition, to further enhance our liquidity profile, we may choose to raise additional funds which may or may not be needed for additional working capital, capital expenditures or other strategic investments. Our opinions concerning liquidity are based on currently available information. To the extent this information proves to be inaccurate, or if circumstances
35
Table of Contents
change, future availability of trade credit or other sources of financing may be reduced and our liquidity would be adversely affected. Factors that may affect the availability of trade credit or other forms of financing include our performance (as measured by various factors, including cash provided from operating activities), the state of worldwide credit markets, and our levels of outstanding debt. Depending on the severity and direct impact of these factors on us, financing may be limited or not available when needed or desired on terms that are favorable to us.
Contractual Obligations and Off-Balance Sheet Arrangements
Our significant contractual obligations and off-balance sheet arrangements are set forth below. For additional information on any of the following and other contractual obligations and off-balance sheet arrangements, see Notes 7 and 10 in the notes to the consolidated financial statements in Item 15 of this Form 10-K.
Contractual Obligations
As of December 31, 2009, our contractual obligations were as follows (in thousands):
| Total | < 1 year | 1-3 years | 3- 5 years | > 5 years | |||||||||||
| Debt and interest obligations |
$ | 18,324 | $ | 7,749 | $ | 8,760 | $ | 1,815 | $ | — | |||||
| Operating lease obligations |
32,426 | 6,619 | 11,028 | 7,627 | 7,152 | ||||||||||
| Employment agreement obligations |
18,035 | 6,949 | 11,086 | — | — | ||||||||||
| Derivatives obligations |
10,741 | 10,616 | 125 | — | — | ||||||||||
| Purchase commitment obligations |
19,543 | 19,543 | — | — | — | ||||||||||
| Other obligations |
3,260 | 1,968 | 1,107 | — | 185 | ||||||||||
| Total |
$ | 102,329 | $ | 53,444 | $ | 32,106 | $ | 9,442 | $ | 7,337 | |||||
Debt and Interest Obligations. These obligations include principal and interest payments on fixed-rate and variable-rate, fixed-term debt based on the expected payment dates.
Other Obligations. These obligations consist of deferred compensation arrangements and contracts with minimum service fees.
Unrecognized Tax Liabilities. As of December 31, 2009, our liabilities for unrecognized tax benefits (“Unrecognized Tax Liabilities”) were $37.7 million. The timing of any settlement of our Unrecognized Tax Liabilities with the respective taxing authority cannot be reasonably estimated.
Off-Balance Sheet Arrangements
Letters of Credit and Bank Guarantees. In the normal course of business, we are required to provide letters of credit to certain suppliers. A majority of these letters of credit expire within one year from their issuance, and expired letters of credit are renewed as needed. As of December 31, 2009, we had issued letters of credit and bank guarantees totaling $67.5 million under our Credit Facility and other unsecured credit lines. For additional information on our Credit Facility and credit lines, see the discussion thereof in “Liquidity and Capital Resources” above.
Surety Bonds. In the normal course of business, we are required to post bid, performance and garnishment bonds. The majority of the surety bonds posted relate to our aviation segment. As of December 31, 2009, we had $17.7 million in outstanding bonds that were arranged in order to satisfy various security requirements.
36
Table of Contents
Recent Accounting Pronouncements
Information regarding recent accounting pronouncements is included in Note 1 to the accompanying consolidated financial statements included in this Form 10-K.
| Item 7A. | Quantitative and Qualitative Disclosures About Market Risk |
Derivatives
The following describes our derivative classifications:
Cash Flow Hedges. Includes certain of our foreign currency forward contracts we enter into in order to mitigate the risk of currency exchange rate fluctuations. There were no outstanding cash flow hedges as of December 31, 2009. We recorded an unrealized net loss of $1.5 million, which was included in accumulated other comprehensive income (loss) in shareholders’ equity as of December 31, 2008.
Fair Value Hedges. Includes derivatives we enter into in order to hedge price risk associated with some of our inventory and certain firm commitments relating to fixed price purchase and sale contracts. As of December 31, 2009 and 2008, we recorded an unrealized net gain of $2.9 million and an unrealized net loss of $1.4 million, respectively, related to the ineffectiveness of our fair value hedge positions on the respective dates.
Non-designated Derivatives. Includes derivatives we primarily enter into in order to mitigate the risk of market price fluctuations in marine, aviation and land fuel in the form of swaps as well as fixed price purchase and sale contracts and to offer our customers fuel pricing alternatives to meet their needs. In addition, non-designated derivatives are also entered into to hedge the risk of currency rate fluctuations. As of December 31, 2009 and 2008, we recorded an unrealized net gain of $1.2 million and $1.3 million, respectively, related to our non-designated derivative positions on the respective dates.
37
Table of Contents
As of December 31, 2009, our derivative instruments and related hedged items, if designated in a fair value hedging relationship, at their respective fair value positions were as follows (in thousands, except mark-to-market prices):
| Hedge Strategy | Settlement |
Derivative Instrument |
Notional | Unit | Mark-to- Market Prices |
Mark-to- Market |
|||||||||
| Fair value hedge | 2010 | Commodity contracts for firm commitment hedging (long) | 4,644 | GAL | $ | 0.056 | $ | 259 | |||||||
| 2010 | Firm sales commitments hedged item | 4,644 | GAL | 0.054 | (252 | ) | |||||||||
| 2010 | Firm sales commitments hedged item | 301 | GAL | 0.153 | 46 | (1) | |||||||||
| 2010 | Commodity contracts for inventory hedging (short) | 24,855 | GAL | 0.086 | (2,138 | ) | |||||||||
| 2010 | Inventory hedged item | 24,855 | GAL | 0.096 | 2,394 | ||||||||||
| 2010 | Commodity contracts for firm commitment hedging (long) | 28 | MT | 49.250 | 1,379 | ||||||||||
| 2010 | Firm sale commitments hedged item | 28 | MT | 44.286 | (1,240 | ) | |||||||||
| 2010 | Commodity contracts for firm commitment hedging (short) | 23 | MT | 14.130 | (325 | ) | |||||||||
| 2010 | Firm purchase commitments hedged item | 23 | MT | 15.957 | 367 | ||||||||||
| 2010 | Commodity contracts for inventory hedging (short) | 59 | MT | 13.492 | (796 | ) | |||||||||
| 2010 | Inventory hedged item | 59 | MT | 53.797 | 3,174 | ||||||||||
| $ | 2,868 | ||||||||||||||
| Non-designated | 2010 | Commodity contracts (long) | 16,669 | GAL | 0.168 | $ | 2,796 | ||||||||
| 2010 | Commodity contracts (short) | 16,404 | GAL | 0.166 | (2,730 | ) | |||||||||
| 2010 | Commodity contracts (long) | 237 | MT | 43.143 | 10,225 | ||||||||||
| 2010 | Commodity contracts (short) | 214 | MT | 42.182 | (9,027 | ) | |||||||||
| 2010 | Foreign currency contracts (long) | 2,917 | BRL | 0.005 | 16 | ||||||||||
| 2010 | Foreign currency contracts (long) | 114 | CAD | 0.009 | (1 | ) | |||||||||
| 2010 | Foreign currency contracts (long) | 3,790,577 | CLP | 0.000 | (87 | ) | |||||||||
| 2010 | Foreign currency contracts (long) | 4,198 | GBP | 0.016 | (67 | ) | |||||||||
| 2010 | Foreign currency contracts (long) | 840 | HKD | — | — | ||||||||||
| 2010 | Foreign currency contracts (short) | 589 | GBP | 0.020 | (12 | ) | |||||||||
| 2011 | Commodity contracts (long) | 229 | GAL | 0.061 | 14 | ||||||||||
| 2011 | Commodity contracts (short) | 229 | GAL | 0.013 | (3 | ) | |||||||||
| 2011 | Commodity contracts (long) | 4 | MT | 36.250 | 145 | ||||||||||
| 2011 | Commodity contracts (short) | 4 | MT | 28.000 | (112 | ) | |||||||||
| $ | 1,157 | ||||||||||||||
| (1) | The Mark-to-Market represents the unrealized fair value of the hedged item in a fair value hedge relationship, which unlike its corresponding hedging instrument, has not yet been settled. |
Interest Rate
Borrowings under our $475.0 million Credit Facility are subject to variable interest rates. As of December 31, 2009, we had no outstanding borrowings under our Credit Facility. As of December 31, 2009, the aggregate outstanding balance of our promissory notes issued in connection with our acquisitions was $13.6 million, of which $9.3 million bears interest at an annual rate equal to LIBOR plus 2.0% with a provision for a minimum rate of 4.0% and a maximum rate of 6.0% and $4.3 million bears interest at an annual rate equal to LIBOR plus 1.0% with a provision for a minimum rate of 4.0% and a maximum rate of 6.0%. At December 31,
38
Table of Contents
2009, the annual interest rate for the two LIBOR promissory notes was 4.0%. The remaining outstanding debt of $3.0 million as of December 31, 2009, primarily relates to loans payable to noncontrolling shareholders of a subsidiary, which bears interest at annual rates ranging from 3.7% to 6.7%.
| Item 8. | Financial Statements and Supplementary Data |
The financial statements, together with the report thereon of PricewaterhouseCoopers LLP dated February 25, 2010, and the Selected Quarterly Financial Data (Unaudited), are set forth in Item 15 of this Form 10-K.
| Item 9. | Changes in and Disagreements with Accountants on Accounting and Financial Disclosure |
None.
| Item 9A. | Controls and Procedures |
Management’s Evaluation of Disclosure Controls and Procedures
We maintain disclosure controls and procedures that are designed to ensure that information required to be disclosed in the reports that we file or submit under the Exchange Act is recorded, processed, summarized and reported within the time periods specified in the SEC’s rules and forms, and that such information is accumulated and communicated to our management, including our CEO and CFO, as appropriate, to allow timely decisions regarding required financial disclosure.
As of the end of the period covered by this report, we evaluated, under the supervision and with the participation of our CEO and CFO, the effectiveness of the design and operation of our disclosure controls and procedures pursuant to Exchange Act Rule 13a-15(e). Based upon this evaluation, the CEO and CFO concluded that our disclosure controls and procedures were effective at a reasonable assurance level as of December 31, 2009.
Management’s Report on Internal Control over Financial Reporting
Our management is responsible for establishing and maintaining adequate internal control over financial reporting, as such term is defined in Exchange Act Rule 13a-15(f). Our internal control over financial reporting is a process designed to provide reasonable assurance regarding the reliability of financial reporting and the preparation of financial statements for external purposes in accordance with generally accepted accounting principles in the United States of America. Our internal control over financial reporting includes those policies and procedures that (i) pertain to the maintenance of records that, in reasonable detail, accurately and fairly reflect the transactions and dispositions of our assets; (ii) provide reasonable assurance that transactions are recorded as necessary to permit preparation of financial statements in accordance with generally accepted accounting principles in the United States of America, and that receipts and expenditures are being made only in accordance with authorizations of management and our directors; and (iii) provide reasonable assurance regarding prevention or timely detection of unauthorized acquisition, use or disposition of assets that could have a material effect on the financial statements.
Because of its inherent limitations, internal control over financial reporting may not prevent or detect misstatements. Also, projections of any evaluation of effectiveness to future periods are subject to the risk that controls may become inadequate because of changes in conditions, or that the degree of compliance with the policies or procedures may deteriorate.
Management has assessed the effectiveness of our internal control over financial reporting as of December 31, 2009 using the framework specified in Internal Control—Integrated Framework issued by the
39
Table of Contents
Committee of Sponsoring Organizations of the Treadway Commission (COSO). Based on such assessment, management has concluded that our internal control over financial reporting was effective as of December 31, 2009.
The effectiveness of our internal control over financial reporting as of December 31, 2009 has been audited by PricewaterhouseCoopers LLP, an independent registered certified public accounting firm, as stated in their report appearing herein.
Changes in Internal Control over Financial Reporting
As of December 31, 2009, we have included the Texor business, which was acquired in June 2008, in our assessment of the effectiveness of our internal control over financial reporting.
There were no changes in our internal control over financial reporting that materially affected, or are reasonably likely to materially affect, our internal control over financial reporting during the quarter ended December 31, 2009.
It should be noted that any system of controls, however well designed and operated, can provide only reasonable, and not absolute, assurance that the objectives of the system will be met. In addition, the design of any control system is based in part upon certain assumptions about the likelihood of future events. Because of these and other inherent limitations of control systems, there is only the reasonable assurance that our controls will succeed in achieving their goals under all potential future conditions.
| Item 9B. | Other Information |
Agreement for Advancement of Expenses
On February 25, 2010, WFSI, one of our subsidiaries and a Texas corporation, entered into an agreement for the advancement of expenses (the “Agreement”) with Michael S. Clementi, President of our Aviation segment, in connection with the Brendan litigation. Pursuant to the Agreement, WFSI will advance Mr. Clementi certain expenses incurred by him to defend the Brendan litigation or any similar action related thereto, and Mr. Clementi will repay the advances to WFSI in the event that a court of competent jurisdiction finds that (i) he did not meet the applicable standard of conduct necessary for indemnification or (ii) he was not entitled to indemnification by WFSI under Texas law. The foregoing description of the Agreement is qualified in its entirety by reference to the full and complete terms of the Agreement, which is filed with this Form 10-K as Exhibit 10.20.
40
Table of Contents
| Item 10. | Directors, Executive Officers and Corporate Governance |
Information on our directors, executive officers and corporate governance is incorporated herein by reference from our Definitive Proxy Statement for the 2010 Annual Meeting of Shareholders to be filed pursuant to Regulation 14A within 120 days after the close of the fiscal year ended December 31, 2009.
| Item 11. | Executive Compensation |
Information on executive compensation is incorporated herein by reference from our Definitive Proxy Statement for the 2010 Annual Meeting of Shareholders to be filed pursuant to Regulation 14A within 120 days after the close of the fiscal year ended December 31, 2009.
| Item 12. | Security Ownership of Certain Beneficial Owners and Management and Related Shareholder Matters |
Information on security ownership of certain beneficial owners and management and related shareholder matters is incorporated herein by reference from our Definitive Proxy Statement for the 2010 Annual Meeting of Shareholders to be filed pursuant to Regulation 14A within 120 days after the close of the fiscal year ended December 31, 2009.
| Item 13. | Certain Relationships and Related Transactions, and Director Independence |
Information on certain relationships and related transactions and director independence is incorporated herein by reference from our Definitive Proxy Statement for the 2010 Annual Meeting of Shareholders to be filed pursuant to Regulation 14A within 120 days after the close of the fiscal year ended December 31, 2009.
| Item 14. | Principal Accounting Fees and Services |
Information on principal accounting fees and services is incorporated herein by reference from our Definitive Proxy Statement for the 2010 Annual Meeting of Shareholders to be filed pursuant to Regulation 14A within 120 days after the close of the fiscal year ended December 31, 2009.
41
Table of Contents
| Item 15. | Exhibits, Financial Statement Schedules |
| (a)(1) | The following consolidated financial statements are filed as a part of this Form 10-K: |
| (a)(2) | Consolidated financial statement schedules have been omitted either because the required information is set forth in the consolidated financial statements or notes thereto, or the information called for is not required. |
| (b) | The exhibits set forth in the following index of exhibits are filed or incorporated by reference as a part of this Form 10-K: |
| Exhibit No. |
Description | |
| 2.1 | Asset Purchase Agreement by and among World Fuel Services Corporation, World Fuel Services, Inc., Texor Petroleum Company, Inc., Thomas E. Gleitsman and Anthony E. Speiser, dated March 28, 2008 (incorporated by reference herein to our Quarterly Report on Form 10-Q for the quarter ended March 31, 2008 filed on May 8, 2008). | |
| 3.1 | Restated Articles of Incorporation (incorporated by reference herein to Exhibit 99.2 to our Current Report on Form 8-K filed on February 3, 2005). | |
| 3.2 | Articles of Amendment to Restated Articles of Incorporation (incorporated by reference herein to Exhibit 3.1 to our Current Report on Form 8-K filed on November 23, 2009). | |
| 3.3 | By-Laws, amended and restated as of November 14, 2008 (incorporated by reference herein to Exhibit 3.1 to our Current Report on Form 8-K filed on November 20, 2008). | |
| 10.1 | Agreement between World Fuel Services Corporation and Paul H. Stebbins, dated March 14, 2008 (incorporated by reference herein to Exhibit 10.1 to our Current Report on Form 8-K filed on March 20, 2008). * | |
| 10.2 | Agreement between World Fuel Services Corporation and Michael J. Kasbar, dated March 14, 2008 (incorporated by reference herein to Exhibit 10.2 to our Current Report on Form 8-K filed on March 20, 2008). * | |
| 10.3 | Executive Severance Agreement between World Fuel Services Corporation and Ira M. Birns, dated April 16, 2007 (incorporated by reference herein to Exhibit 10.2 to our Current Report on Form 8-K filed on April 16, 2007). * | |
| 10.4 | Employment Agreement between World Fuel Services, Inc. and Michael S. Clementi, effective January 1, 2008 (incorporated by reference herein to Exhibit 10.3 to our Current Report on Form 8-K filed on March 20, 2008). * | |
| 10.5 | 1993 Non-Employee Directors Stock Option Plan, as amended and restated (incorporated by reference herein to Exhibit 4.1 to our Registration Statement on Form S-8 filed on December 20, 2005). * | |
42
Table of Contents
| Exhibit No. |
Description | |
| 10.6 | 1996 Employee Stock Option Plan (incorporated by reference herein to Exhibit A to our Schedule 14A filed on June 25, 1998). * | |
| 10.7 | 2001 Omnibus Plan, as amended and restated (incorporated by reference herein to Exhibit 4.2 to our Registration Statement on Form S-8 filed on December 20, 2005). * | |
| 10.8 | 2006 Omnibus Plan (incorporated by reference herein to Exhibit 10.1 to our Current Report on Form 8-K filed on November 7, 2006). * | |
| 10.9 | First Amendment to the World Fuel Services Corporation 2006 Omnibus Plan, effective February 26, 2008 (incorporated by reference herein to Exhibit 10.2 to our Quarterly Report on Form 10-Q for the quarter ended June 30, 2008 filed on August 7, 2008). * | |
| 10.10 | Second Amendment to the World Fuel Services Corporation 2006 Omnibus Plan, effective June 3, 2008 (incorporated by reference herein to Exhibit 10.2 to our Quarterly Report on Form 10-Q for the quarter ended June 30, 2008 filed on August 7, 2008). * | |
| 10.11 | 2008 Executive Incentive Plan (incorporated by reference herein to Exhibit 10.1 to our Quarterly Report on Form 10-Q for the quarter ended June 30, 2008 filed on August 7, 2008). * | |
| 10.12 | First Amendment to the World Fuel Services Corporation 2008 Executive Incentive Plan, effective December 19, 2008 (incorporated by reference herein to Exhibit 10.12 to our Annual Report on Form 10-K for the fiscal year ended December 31, 2008).. * | |
| 10.13 | Form of Restricted Stock Grant Agreement in connection with the 2006 Omnibus Plan (incorporated by reference herein to Exhibit 10.2 to our Current Report on Form 8-K filed on November 7, 2006). * | |
| 10.14 | Form of Stock-Settled Stock Appreciation Right Agreement in connection with the 2006 Omnibus Plan (incorporated by reference herein to Exhibit 10.3 to our Current Report on Form 8-K filed on November 7, 2006). * | |
| 10.15 | Form of Restricted Stock Units Grant Agreement (Non-Employee Director) in connection with the 2006 Omnibus Plan (incorporated by reference herein to Exhibit 10.4 to our Current Report on Form 8-K filed on November 7, 2006). * | |
| 10.16 | Form of Stock-Settled Stock Appreciation Right Agreement (Non-Employee Director) in connection with the 2006 Omnibus Plan (incorporated by reference herein to Exhibit 10.5 to our Current Report on Form 8-K filed on November 7, 2006). * | |
| 10.17 | Limited Consent and Amendment No. 2 to Second Amended and Restated Credit Agreement by and among World Fuel Services Corporation, World Fuel Services Europe, Ltd. and World Fuel Services (Singapore) Pte. Ltd., as borrowers, the financial institutions signatory thereto as lenders, and Bank of America, N.A., as administrative agent, dated September 4, 2008 and effective as of June 30, 2008 (incorporated by reference herein to Exhibit 10.1 to our Quarterly Report on Form 10-Q for the quarter ended September 30, 2008 filed on November 6, 2008). | |
| 10.18 | Master Accounts Receivable Purchase Agreement among World Fuel Services, Inc., World Fuel Services Europe, Ltd., World Fuel Services (Singapore) Pte. Ltd., as the sellers, and World Fuel Services Corporation, as the parent, the banks party thereto, and HSBC Bank USA, National Association, as the administrative agent, dated as of September 30, 2008 (incorporated by reference herein to Exhibit 10.1 to our Current Report on Form 8-K filed on October 3, 2008). | |
| 10.19 | Amendment No. 1 to Master Accounts Receivable Purchase Agreement among World Fuel Services, Inc., World Fuel Services Europe, Ltd., World Fuel Services (Singapore ) Pte Ltd, as the sellers, and World Fuel Services Corporation, as the parent, the banks party thereto, and HSBC Bank USA, National Association, as the administrative agent, dated October 28, 2009 (incorporated by reference herein to our Quarterly Report on Form 10-Q for the quarter ended September 30, 2009 filed on November 3, 2009). | |
43
Table of Contents
| Exhibit No. |
Description | |
| 10.20 | Agreement for Advancement of Expenses by and between World Fuel Services, Inc. and Michael S. Clementi, dated as of February 25, 2010. | |
| 21.1 | Subsidiaries of the Registrant. | |
| 23.1 | Consent of Independent Registered Certified Public Accounting Firm. | |
| 31.1 | Certification of the Chief Executive Officer pursuant to Rule 13a-14(a) or Rule 15d-14(a). | |
| 31.2 | Certification of the Chief Financial Officer pursuant to Rule 13a-14(a) or Rule 15d-14(a). | |
| 32.1 | Statement of Chief Executive Officer and Chief Financial Officer under Section 906 of the Sarbanes-Oxley Act of 2002 (18 U.S.C. Section 1350). | |
| * | Management contracts and compensatory plans or arrangements required to be filed as exhibits to this form, pursuant to Item 15(b). |
44
Table of Contents
REPORT OF INDEPENDENT REGISTERED CERTIFIED PUBLIC ACCOUNTING FIRM
To the Shareholders and Board of Directors
of World Fuel Services Corporation:
In our opinion, the accompanying consolidated balance sheets and the related consolidated statements of income, shareholders’ equity and comprehensive income, and cash flows present fairly, in all material respects, the financial position of World Fuel Services Corporation and its subsidiaries (the “Company”) at December 31, 2009 and 2008, and the results of their operations and their cash flows for each of the three years in the period ended December 31, 2009 in conformity with accounting principles generally accepted in the United States of America. Also in our opinion, the Company maintained, in all material respects, effective internal control over financial reporting as of December 31, 2009, based on criteria established in Internal Control—Integrated Framework issued by the Committee of Sponsoring Organizations of the Treadway Commission (COSO). The Company’s management is responsible for these financial statements, for maintaining effective internal control over financial reporting and for its assessment of the effectiveness of internal control over financial reporting, included in Management’s Report on Internal Control over Financial Reporting appearing under item 9A. Our responsibility is to express opinions on these financial statements and on the Company’s internal control over financial reporting based on our integrated audits. We conducted our audits in accordance with the standards of the Public Company Accounting Oversight Board (United States). Those standards require that we plan and perform the audits to obtain reasonable assurance about whether the financial statements are free of material misstatement and whether effective internal control over financial reporting was maintained in all material respects. Our audits of the financial statements included examining, on a test basis, evidence supporting the amounts and disclosures in the financial statements, assessing the accounting principles used and significant estimates made by management, and evaluating the overall financial statement presentation. Our audit of internal control over financial reporting included obtaining an understanding of internal control over financial reporting, assessing the risk that a material weakness exists, and testing and evaluating the design and operating effectiveness of internal control based on the assessed risk. Our audits also included performing such other procedures as we considered necessary in the circumstances. We believe that our audits provide a reasonable basis for our opinions.
As discussed in Note 11 to the consolidated financial statements, in 2008 the Company changed its method of accounting for fair value measurements.
A company’s internal control over financial reporting is a process designed to provide reasonable assurance regarding the reliability of financial reporting and the preparation of financial statements for external purposes in accordance with generally accepted accounting principles. A company’s internal control over financial reporting includes those policies and procedures that (i) pertain to the maintenance of records that, in reasonable detail, accurately and fairly reflect the transactions and dispositions of the assets of the company; (ii) provide reasonable assurance that transactions are recorded as necessary to permit preparation of financial statements in accordance with generally accepted accounting principles, and that receipts and expenditures of the company are being made only in accordance with authorizations of management and directors of the company; and (iii) provide reasonable assurance regarding prevention or timely detection of unauthorized acquisition, use, or disposition of the company’s assets that could have a material effect on the financial statements.
Because of its inherent limitations, internal control over financial reporting may not prevent or detect misstatements. Also, projections of any evaluation of effectiveness to future periods are subject to the risk that controls may become inadequate because of changes in conditions, or that the degree of compliance with the policies or procedures may deteriorate.
/s/ PricewaterhouseCoopers LLP
Miami, Florida
February 25, 2010
45
Table of Contents
WORLD FUEL SERVICES CORPORATION AND SUBSIDIARIES
CONSOLIDATED BALANCE SHEETS
(In thousands, except per share data)
| As of December 31, | |||||||
| 2009 | 2008 | ||||||
| Assets: |
|||||||
| Current assets: |
|||||||
| Cash and cash equivalents |
$ | 298,843 | $ | 314,352 | |||
| Short-term investments |
8,100 | 8,100 | |||||
| Accounts receivable, net |
951,398 | 676,100 | |||||
| Inventories |
126,793 | 28,726 | |||||
| Short-term derivative assets |
12,257 | 72,260 | |||||
| Prepaid expenses and other current assets |
66,587 | 72,612 | |||||
| Total current assets |
1,463,978 | 1,172,150 | |||||
| Property and equipment, net |
38,777 | 35,328 | |||||
| Goodwill |
153,841 | 122,010 | |||||
| Identifiable intangible assets, net |
72,805 | 59,189 | |||||
| Non-current income tax assets, net |
— | 6,827 | |||||
| Other assets |
11,827 | 9,122 | |||||
| Total assets |
$ | 1,741,228 | $ | 1,404,626 | |||
| Liabilities and equity: |
|||||||
| Liabilities: |
|||||||
| Current liabilities: |
|||||||
| Short-term debt |
$ | 6,684 | $ | 23,840 | |||
| Accounts payable |
796,978 | 548,876 | |||||
| Short-term derivative liabilities, net |
10,616 | 66,302 | |||||
| Customer deposits |
63,967 | 40,961 | |||||
| Accrued expenses and other current liabilities |
69,497 | 70,808 | |||||
| Total current liabilities |
947,742 | 750,787 | |||||
| Long-term debt |
9,925 | 9,537 | |||||
| Non-current income tax liabilities, net |
39,164 | 30,546 | |||||
| Deferred compensation and other long-term liabilities |
11,148 | 5,610 | |||||
| Total liabilities |
1,007,979 | 796,480 | |||||
| Commitments and contingencies |
|||||||
| Equity: |
|||||||
| World Fuel shareholders’ equity: |
|||||||
| Preferred stock, $1.00 par value; shares of 100 authorized, none issued |
— | — | |||||
| Common stock, $0.01 par value; shares of 100,000 authorized, shares of 59,385 and 58,590 issued and outstanding at December 31, 2009 and 2008, respectively |
594 | 586 | |||||
| Capital in excess of par value |
213,414 | 204,749 | |||||
| Retained earnings |
515,218 | 406,953 | |||||
| Accumulated other comprehensive income (loss) |
3,795 | (4,401 | ) | ||||
| Total World Fuel shareholders’ equity |
733,021 | 607,887 | |||||
| Noncontrolling interest equity |
228 | 259 | |||||
| Total equity |
733,249 | 608,146 | |||||
| Total liabilities and equity |
$ | 1,741,228 | $ | 1,404,626 | |||
The accompanying notes are an integral part of these consolidated financial statements.
46
Table of Contents
WORLD FUEL SERVICES CORPORATION AND SUBSIDIARIES
CONSOLIDATED STATEMENTS OF INCOME
(In thousands, except earnings per share data)
| For the Year ended December 31, | ||||||||||
| 2009 | 2008 | 2007 | ||||||||
| Revenue |
$ | 11,295,177 | $ | 18,509,403 | $ | 13,729,555 | ||||
| Cost of revenue |
10,919,586 | 18,114,020 | 13,484,283 | |||||||
| Gross profit |
375,591 | 395,383 | 245,272 | |||||||
| Operating expenses: |
||||||||||
| Compensation and employee benefits |
137,408 | 140,280 | 93,732 | |||||||
| Provision for bad debt |
4,552 | 16,081 | 1,892 | |||||||
| General and administrative |
79,636 | 85,282 | 63,760 | |||||||
| 221,596 | 241,643 | 159,384 | ||||||||
| Income from operations |
153,995 | 153,740 | 85,888 | |||||||
| Other expense (income), net: |
||||||||||
| Interest expense and other financing costs, net |
3,663 | 8,455 | (3,111 | ) | ||||||
| Other, net |
423 | 7,710 | 2,413 | |||||||
| 4,086 | 16,165 | (698 | ) | |||||||
| Income before taxes |
149,909 | 137,575 | 86,586 | |||||||
| Provision for income taxes |
32,346 | 32,370 | 21,235 | |||||||
| Net income including noncontrolling interest |
117,563 | 105,205 | 65,351 | |||||||
| Less: net income attributable to noncontrolling interest |
424 | 166 | 578 | |||||||
| Net income attributable to World Fuel |
$ | 117,139 | $ | 105,039 | $ | 64,773 | ||||
| Basic earnings per share |
$ | 1.99 | $ | 1.82 | $ | 1.14 | ||||
| Basic weighted average shares |
59,003 | 57,707 | 56,853 | |||||||
| Diluted earnings per share |
$ | 1.96 | $ | 1.80 | $ | 1.11 | ||||
| Diluted weighted average shares |
59,901 | 58,244 | 58,346 | |||||||
The accompanying notes are an integral part of these consolidated financial statements.
47
Table of Contents
WORLD FUEL SERVICES CORPORATION AND SUBSIDIARIES
CONSOLIDATED STATEMENTS OF SHAREHOLDERS’ EQUITY AND COMPREHENSIVE INCOME
(In thousands)
| Common Stock | Capital in Excess of Par Value |
Retained Earnings |
Accumulated Other Comprehensive Income |
World Fuel Shareholders’ Equity |
Noncontrolling Interest Equity |
Total | |||||||||||||||||||||||||
| Shares | Amount | ||||||||||||||||||||||||||||||
| Balance at December 31, 2006 |
56,976 | $ | 570 | $ | 169,990 | $ | 255,245 | $ | 164 | $ | 425,969 | $ | 631 | $ | 426,600 | ||||||||||||||||
| Comprehensive income: |
|||||||||||||||||||||||||||||||
| Net income |
— | — | — | 64,773 | — | 64,773 | 578 | 65,351 | |||||||||||||||||||||||
| Mark-to-market of short-term investments, net of income tax benefit of $81 |
— | — | — | — | (129 | ) | (129 | ) | — | (129 | ) | ||||||||||||||||||||
| Comprehensive income |
64,644 | 578 | 65,222 | ||||||||||||||||||||||||||||
| Cash dividends declared |
— | — | — | (4,275 | ) | — | (4,275 | ) | — | (4,275 | ) | ||||||||||||||||||||
| Distribution of noncontrolling interest |
— | — | — | — | — | — | (426 | ) | (426 | ) | |||||||||||||||||||||
| Amortization of share-based payment awards |
— | — | 7,166 | — | — | 7,166 | — | 7,166 | |||||||||||||||||||||||
| Issuance of shares related to share-based payment awards including tax benefit of $3,883 |
408 | 4 | 4,935 | — | — | 4,939 | — | 4,939 | |||||||||||||||||||||||
| Purchases of stock tendered by employees to satisfy the required withholding taxes related to share-based payment awards |
(118 | ) | (1 | ) | (2,582 | ) | — | — | (2,583 | ) | — | (2,583 | ) | ||||||||||||||||||
| Cumulative adjustment for the adoption of accounting standard for unrecognized tax liabilities |
— | — | — | (11,986 | ) | — | (11,986 | ) | — | (11,986 | ) | ||||||||||||||||||||
| Other |
(108 | ) | (1 | ) | 4 | — | — | 3 | — | 3 | |||||||||||||||||||||
| Balance at December 31, 2007 |
57,158 | 572 | 179,513 | 303,757 | 35 | 483,877 | 783 | 484,660 | |||||||||||||||||||||||
| Comprehensive income: |
|||||||||||||||||||||||||||||||
| Net income |
— | — | — | 105,039 | — | 105,039 | 166 | 105,205 | |||||||||||||||||||||||
| Foreign currency translation adjustment |
— | — | — | — | (3,340 | ) | (3,340 | ) | — | (3,340 | ) | ||||||||||||||||||||
| Change in effective portion of cash flow hedges, net of income tax benefit of $433 |
— | — | — | — | (1,096 | ) | (1,096 | ) | — | (1,096 | ) | ||||||||||||||||||||
| Comprehensive income |
100,603 | 166 | 100,769 | ||||||||||||||||||||||||||||
| Cash dividends declared |
— | — | — | (4,345 | ) | — | (4,345 | ) | — | (4,345 | ) | ||||||||||||||||||||
| Distribution of noncontrolling interest |
— | — | — | — | — | (690 | ) | (690 | ) | ||||||||||||||||||||||
| Amortization of share-based payment awards |
— | — | 8,643 | — | — | 8,643 | — | 8,643 | |||||||||||||||||||||||
| Issuance of shares related to share-based payment awards including income tax benefit of $5,842 |
656 | 6 | 7,146 | — | — | 7,152 | — | 7,152 | |||||||||||||||||||||||
| Purchases of stock tendered by employees to satisfy the required withholding taxes related to share-based payment awards |
(22 | ) | — | (297 | ) | — | — | (297 | ) | — | (297 | ) | |||||||||||||||||||
| Issuance of shares related to acquisition |
820 | 8 | 9,876 | — | — | 9,884 | — | 9,884 | |||||||||||||||||||||||
| Cumulative adjustment for the adoption of accounting standard on fair value measurements |
— | — | — | 2,502 | — | 2,502 | — | 2,502 | |||||||||||||||||||||||
| Other |
(22 | ) | — | (132 | ) | — | — | (132 | ) | — | (132 | ) | |||||||||||||||||||
| Balance at December 31, 2008 |
58,590 | 586 | 204,749 | 406,953 | (4,401 | ) | 607,887 | 259 | 608,146 | ||||||||||||||||||||||
The accompanying notes are an integral part of these consolidated financial statements.
48
Table of Contents
WORLD FUEL SERVICES CORPORATION AND SUBSIDIARIES
CONSOLIDATED STATEMENTS OF SHAREHOLDERS’ EQUITY AND COMPREHENSIVE INCOME—(Continued)
(In thousands)
| Common Stock | Capital in Excess of Par Value |
Retained Earnings |
Accumulated Other Comprehensive Income |
World Fuel Shareholders’ Equity |
Noncontrolling Interest Equity |
Total | ||||||||||||||||||||||||
| Shares | Amount | |||||||||||||||||||||||||||||
| Comprehensive income: |
||||||||||||||||||||||||||||||
| Net income |
— | $ | — | $ | — | $ | 117,139 | $ | — | $ | 117,139 | $ | 424 | $ | 117,563 | |||||||||||||||
| Foreign currency translation adjustment |
— | — | — | — | 7,135 | 7,135 | — | 7,135 | ||||||||||||||||||||||
| Change in effective portion of cash flow hedges, net of income tax provision of $413 |
— | — | — | — | 1,061 | 1,061 | — | 1,061 | ||||||||||||||||||||||
| Comprehensive income |
125,335 | 424 | 125,759 | |||||||||||||||||||||||||||
| Cash dividends declared |
— | — | — | (8,872 | ) | — | (8,872 | ) | — | (8,872 | ) | |||||||||||||||||||
| Distribution of noncontrolling interest |
— | — | — | — | — | — | (455 | ) | (455 | ) | ||||||||||||||||||||
| Amortization of share-based payment awards |
— | — | 6,763 | — | — | 6,763 | — | 6,763 | ||||||||||||||||||||||
| Issuance of shares related to share-based payment awards |
1,095 | 11 | 6,848 | — | — | 6,859 | — | 6,859 | ||||||||||||||||||||||
| Purchases of stock tendered by employees to satisfy the required withholding taxes related to share-based payment awards |
(278 | ) | (3 | ) | (4,951 | ) | — | — | (4,954 | ) | — | (4,954 | ) | |||||||||||||||||
| Other |
(22 | ) | — | 5 | (2 | ) | — | 3 | — | 3 | ||||||||||||||||||||
| Balance at December 31, 2009 |
59,385 | $ | 594 | $ | 213,414 | $ | 515,218 | $ | 3,795 | $ | 733,021 | $ | 228 | $ | 733,249 | |||||||||||||||
The accompanying notes are an integral part of these consolidated financial statements.
49
Table of Contents
WORLD FUEL SERVICES CORPORATION AND SUBSIDIARIES
CONSOLIDATED STATEMENTS OF CASH FLOWS
(In thousands)
| For the Year ended December 31, | ||||||||||||
| 2009 | 2008 | 2007 | ||||||||||
| Cash flows from operating activities: |
||||||||||||
| Net income including noncontrolling interest |
$ | 117,563 | $ | 105,205 | $ | 65,351 | ||||||
| Adjustments to reconcile net income including noncontrolling interest to net cash provided by (used in) operating activities— |
||||||||||||
| Depreciation and amortization |
16,956 | 13,870 | 6,901 | |||||||||
| Provision for bad debt |
4,552 | 16,081 | 1,892 | |||||||||
| Deferred income tax provision (benefit) |
7,495 | (5,390 | ) | (3,020 | ) | |||||||
| Share-based payment award compensation costs |
6,480 | 14,674 | 7,166 | |||||||||
| Foreign currency gains, net |
(1,163 | ) | (652 | ) | — | |||||||
| Software write-down |
— | — | 2,445 | |||||||||
| Impairment on short-term investments |
— | — | 1,900 | |||||||||
| Other |
1,052 | 275 | 449 | |||||||||
| Changes in assets and liabilities, net of acquisitions |
||||||||||||
| Accounts receivable, net |
(262,912 | ) | 706,912 | (454,293 | ) | |||||||
| Inventories |
(93,606 | ) | 75,700 | (28,510 | ) | |||||||
| Short-term derivative assets, net |
60,011 | 17,013 | (49,619 | ) | ||||||||
| Prepaid expenses and other current assets |
2,646 | (19,991 | ) | (7,563 | ) | |||||||
| Non-current income tax and other assets |
(2,706 | ) | 4,566 | (9,094 | ) | |||||||
| Accounts payable |
242,611 | (531,315 | ) | 316,277 | ||||||||
| Short-term derivative liabilities, net |
(54,212 | ) | (23,061 | ) | 54,093 | |||||||
| Customer deposits |
22,592 | 1,968 | 14,340 | |||||||||
| Accrued expenses and other current liabilities |
3,443 | 20,973 | (6,829 | ) | ||||||||
| Non-current income tax, deferred compensation and other long-term liabilities |
7,119 | (3,376 | ) | 10,187 | ||||||||
| Total adjustments |
(39,642 | ) | 288,247 | (143,278 | ) | |||||||
| Net cash provided by (used in) operating activities |
77,921 | 393,452 | (77,927 | ) | ||||||||
| Cash flows from investing activities: |
||||||||||||
| Capital expenditures |
(6,493 | ) | (6,791 | ) | (16,581 | ) | ||||||
| Funding arrangement to service provider |
(3,353 | ) | — | — | ||||||||
| Purchase of short-term investments |
(25,185 | ) | — | (30,060 | ) | |||||||
| Proceeds from the sale of short-term investments |
25,185 | — | 32,560 | |||||||||
| Acquisition of businesses, net of cash acquired |
(51,982 | ) | (93,366 | ) | (54,907 | ) | ||||||
| Net cash used in investing activities |
(61,828 | ) | (100,157 | ) | (68,988 | ) | ||||||
| Cash flows from financing activities: |
||||||||||||
| Dividends paid on common stock |
(7,747 | ) | (4,335 | ) | (4,253 | ) | ||||||
| Distribution of noncontrolling interest |
(451 | ) | (690 | ) | (426 | ) | ||||||
| Borrowings under senior revolving credit facility |
— | 1,871,578 | 276,000 | |||||||||
| Repayments under senior revolving credit facility |
— | (1,911,578 | ) | (256,000 | ) | |||||||
| Payment of senior revolving credit facility loan costs |
— | — | (1,278 | ) | ||||||||
| Borrowings of debt other than senior revolving credit facility |
2,074 | 14,507 | — | |||||||||
| Repayments of debt other than senior revolving credit facility |
(24,379 | ) | — | — | ||||||||
| Proceeds from exercise of stock options |
1,013 | 2,612 | 1,056 | |||||||||
| Federal and state tax benefits resulting from tax deductions in excess of the compensation cost recognized for share-based payment awards |
— | 5,842 | 3,883 | |||||||||
| Purchases of stock tendered by employees to satisfy the required withholding taxes related to share-based payment awards |
(4,954 | ) | (1,599 | ) | (2,583 | ) | ||||||
| Restricted cash |
— | 10,000 | (10,000 | ) | ||||||||
| Other |
8 | 291 | 172 | |||||||||
| Net cash (used in) provided by financing activities |
(34,436 | ) | (13,372 | ) | 6,571 | |||||||
| Effect of exchange rate changes on cash and cash equivalents |
2,834 | (1,722 | ) | — | ||||||||
| Net (decrease) increase in cash and cash equivalents |
(15,509 | ) | 278,201 | (140,344 | ) | |||||||
| Cash and cash equivalents, at beginning of period |
314,352 | 36,151 | 176,495 | |||||||||
| Cash and cash equivalents, at end of period |
$ | 298,843 | $ | 314,352 | $ | 36,151 | ||||||
| Supplemental Disclosures of Cash Flow Information |
||||||||||||
| Cash paid during the period for: |
||||||||||||
| Interest, net of capitalized interest |
$ | 4,414 | $ | 9,091 | $ | 709 | ||||||
| Income taxes |
$ | 29,820 | $ | 20,756 | $ | 19,760 | ||||||
The accompanying notes are an integral part of these consolidated financial statements.
50
Table of Contents
WORLD FUEL SERVICES CORPORATION AND SUBSIDIARIES
CONSOLIDATED STATEMENTS OF CASH FLOWS—(Continued)
(In thousands)
Supplemental Schedule of Noncash Investing and Financing Activities
Cash dividends declared, but not yet paid, were $2.2 million and $1.1 million at December 31, 2009 and 2008, respectively, and were paid in January 2010 and 2009.
In connection with our acquisitions, we issued promissory notes of $4.3 million, $14.0 million and $5.0 million in April 2009, June 2008 and December 2007, respectively, and equity of $9.9 million in June 2008.
In 2009, we issued $5.8 million in equity to certain employees which was previously recorded in accrued expenses and other current liabilities, and deferred compensation and other long-term liabilities in the amount of $4.5 million and $1.3 million, respectively.
In connection with the March 2006 acquisition of the remaining 33% of the outstanding interest of Tramp Oil (Brasil) Limitada from the noncontrolling interest owners, we recorded a liability and an increase in goodwill of $4.5 million related to purchase price adjustment due to the achievement of certain operating income targets in 2008. Payment of the liability was made in April 2009 and included in acquisition of businesses, net of cash acquired.
We had unpaid capital expenditures of $1.3 million for 2007, which were included in accrued expenses and other current liabilities as of December 31, 2007.
In connection with our acquisitions for the periods presented, the following table presents the assets acquired, net of cash, and liabilities assumed:
| For the Year ended December 31, | |||||||||
| 2009 | 2008 | 2007 | |||||||
| Assets acquired, net of cash acquired |
$ | 71,225 | $ | 136,487 | $ | 92,078 | |||
| Liabilities assumed |
$ | 13,287 | $ | 19,237 | $ | 32,171 | |||
The accompanying notes are an integral part of these consolidated financial statements.
51
Table of Contents
WORLD FUEL SERVICES CORPORATION AND SUBSIDIARIES
NOTES TO THE CONSOLIDATED FINANCIAL STATEMENTS
1. Nature of Business, Acquisitions, Significant Accounting Policies and Recent Accounting Pronouncements
Nature of Business
World Fuel Services Corporation (the “Company”) was incorporated in Florida in July 1984 and along with its consolidated subsidiaries is referred to collectively as “World Fuel,” “we,” “our” and “us.” We commenced business as a recycler and reseller of used oil and provider of aviation services. We have since ceased the activities of a recycler and reseller of used oil. In 1986, we diversified our operations by entering the aviation fuel services business. In 1995, we entered the marine fuel and related services business by acquiring the Trans-Tec group of companies. In 2003, we started the land fuel and related services business.
We are engaged in the marketing and sale of marine, aviation and land fuel products and related services on a worldwide basis. We compete by providing our customers value-added benefits, including single-supplier convenience, competitive pricing, the availability of trade credit, price risk management, logistical support, fuel quality control and fuel procurement outsourcing. We have three operating business segments: marine, aviation and land. In our marine segment, we offer fuel and related services to a broad base of maritime customers, including international container and tanker fleets and time-charter operators, as well as to the U.S. and foreign governments. In our aviation segment, we offer fuel and related services to major commercial airlines, second and third-tier airlines, cargo carriers, regional and low cost carriers, corporate fleets, fractional operators, private aircraft, military fleets and to the U.S. and foreign governments, as well as offer a private label charge card to purchase aviation fuel and related services to customers in the general aviation industry. In our land segment, we offer fuel and related services to petroleum distributors operating in the land transportation market, and retail petroleum operators and industrial, commercial and government customers.
Acquisitions
2009 Acquisitions
In April 2009, we acquired all of the outstanding stock of each of Henty Oil Limited, Tank and Marine Engineering Limited and Henty Shipping Services Limited (collectively, “Henty”), a leading independent provider of marine and land based fuels in the United Kingdom. Henty services three ports on the Irish Sea and provides fuel and gas oil to a broad range of customers throughout the United Kingdom. Also in April 2009, we completed the acquisition of certain assets of TGS Petroleum, Inc., including the assets comprising its wholesale motor fuel distribution business (the “TGS business”). The TGS business, based in Chicago, Illinois, is primarily an independent distributor of branded and unbranded gasoline and diesel fuel to retail petroleum operators. The financial position and results of operations of Henty and the TGS business have been included in our consolidated financial statements since April 1, 2009. The aggregate revenue and net income contributed by our acquisitions of Henty and the TGS business was $272.0 million and $4.7 million, respectively, for 2009.
The acquisition date estimated aggregate purchase price of these two acquisitions was $61.3 million. The aggregate initial consideration is presented in the following table:
| Initial cash paid |
$ | 50,902 | |
| Promissory note issued |
4,260 | ||
| Estimated contingent consideration (Earn-out) |
6,177 | ||
| $ | 61,339 | ||
52
Table of Contents
WORLD FUEL SERVICES CORPORATION AND SUBSIDIARIES
NOTES TO THE CONSOLIDATED FINANCIAL STATEMENTS—(Continued)
The Henty purchase agreement includes a contingent consideration clause (the “Earn-out”) based on Henty meeting certain operating targets over the three-year period ending April 30, 2012. The maximum Earn-out that may be paid is £9.0 million ($14.5 million as of December 31, 2009) if all operating targets are achieved. In accordance with accounting guidance for business combinations that became effective on January 1, 2009, we estimated the fair value of the Earn-out as of the acquisition date to be £4.2 million ($6.2 million) which was recorded as a liability and as part of the purchase consideration as of the date of acquisition. We estimated the acquisition date fair value based on our assessment of the probability of Henty achieving certain operating targets over the three-year period. The accounting guidance for business combinations requires us to estimate the fair value of the Earn-out at each reporting period. Any subsequent changes to the estimated fair value will be recorded through earnings in the period that the estimated fair value changes, which may have a material effect on our consolidated statement of operations in the period the change occurs. The change in the estimated fair value of the Earn-out from the acquisition date to December 31, 2009 was not significant. In addition, the Earn-out is denominated in British pounds sterling, and therefore, the Earn-out liability is subject to revaluation each period which could result in the recognition of material foreign currency gains and losses in our consolidated statement of income in the reporting period in which they occur. We have entered into derivative contracts in order to mitigate the impact of the foreign currency revaluation. For the three months ended December 31, 2009 and from the acquisition date to December 31, 2009, the net foreign exchange gain or loss in connection with the Earn-out liability was not significant.
The purchase price for each of the Henty and the TGS business acquisitions was allocated to the acquired net assets based on their estimated fair value. As of the acquisition date, we recorded (i) identifiable intangible assets in the aggregate of $22.0 million and (ii) goodwill of $30.0 million, of which $12.1 million is anticipated to be deductible for tax purposes. Goodwill reflects the future earnings and cash flow potential of the acquired business in excess of the fair values that are assigned to all other identifiable assets and liabilities. Goodwill arises because the purchase price paid reflects numerous factors including the strategic fit and expected synergies these targets bring to existing operations and the prevailing market value for comparable companies. The identified intangible assets of Henty and the TGS business and their weighted average lives are as follows (in thousands):
| Weighted Average Lives | |||||
| Customer relationships |
$ | 18,122 | 7 years | ||
| Supplier agreements |
2,500 | 15 years | |||
| Trademark/trade name rights |
727 | Indefinite | |||
| Non compete agreements |
610 | 2 years | |||
| $ | 21,959 | ||||
53
Table of Contents
WORLD FUEL SERVICES CORPORATION AND SUBSIDIARIES
NOTES TO THE CONSOLIDATED FINANCIAL STATEMENTS—(Continued)
The following reconciles the estimated aggregate acquisition date fair values of the assets acquired and liabilities assumed with the aggregate purchase price paid in cash for the Henty and the TGS business acquisitions, net of cash acquired (in thousands):
| Assets acquired: |
||||
| Cash |
$ | 3,401 | ||
| Accounts receivable |
8,506 | |||
| Inventories |
4,273 | |||
| Prepaid expenses and other current assets |
1,061 | |||
| Property and equipment |
5,572 | |||
| Identifiable intangible assets |
21,959 | |||
| Goodwill |
29,854 | |||
| Liabilities assumed: |
||||
| Short-term debt |
(671 | ) | ||
| Accounts payable |
(5,190 | ) | ||
| Accrued expenses and other current liabilities |
(2,159 | ) | ||
| Long-term liabilities and deferred tax liabilities |
(5,267 | ) | ||
| Purchase price |
61,339 | |||
| Promissory notes issued |
(4,260 | ) | ||
| Contingent consideration |
(6,177 | ) | ||
| Cash paid for acquisition of businesses |
50,902 | |||
| Cash acquired |
(3,401 | ) | ||
| Cash paid for acquisition of businesses, net of cash acquired |
$ | 47,501 | ||
2008 Acquisition
In June 2008, we completed the acquisition of certain assets of Texor Petroleum Company, Inc., including the assets comprising its wholesale motor fuel distribution business and the Texor Petroleum trade name (the “Texor business”). In connection with the acquisition, we also acquired the rights to operate eight retail gasoline stations. The financial position and results of operations of the Texor business have been included in our consolidated financial statements since June 1, 2008. The Texor business is primarily an independent distributor of branded and unbranded gasoline and diesel fuel to retail petroleum operators and industrial, commercial and government customers and operates a small number of retail gasoline stations.
2007 Acquisition
In December 2007, we acquired all of the outstanding stock of each of Kropp Holdings, Inc., and Avcard Service, Ltd., which we collectively refer to as AVCARD, the brand name under which it does business. AVCARD offers a private label charge card and sells aviation fuel to the general aviation industry. The aggregate purchase price for the stock was $63.4 million, including acquisition costs of $0.6 million. The aggregate purchase price consisted of $58.4 million in cash and $5.0 million in the form of a promissory note.
Under the terms of the purchase agreement, the sellers agreed to indemnify us (by cash payment or offsetting against the promissory note) for acquired receivables that existed as of the date of acquisition that were not collected within 120 days of the acquisition as well as other indemnifiable items. To the extent that we have been indemnified with respect to certain accounts and such accounts are subsequently collected by us within two years from the date of acquisition, we are obligated to reimburse the sellers, less any related collection costs, in
54
Table of Contents
WORLD FUEL SERVICES CORPORATION AND SUBSIDIARIES
NOTES TO THE CONSOLIDATED FINANCIAL STATEMENTS—(Continued)
the same manner in which we were indemnified. The indemnification amount of $0.6 million was netted from the promissory note, which was paid in December 2009 and is included in repayments of debt other than senior revolving credit facility, in the accompanying consolidated statements of cash flows.
Pro Forma Information
The following presents the unaudited pro forma results for 2009 as if the Henty and TGS business acquisitions had been completed on January 1, 2009, the unaudited pro forma results for 2008 as if the Texor, Henty and TGS business acquisitions had been completed on January 1, 2008 and the unaudited pro forma results for 2007 as if the AVCARD and Texor business acquisitions had been completed on January 1, 2007 (in thousands, except per share data):
| 2009 | 2008 | 2007 | |||||||
| (pro forma) | (pro forma) | (pro forma) | |||||||
| Revenue |
11,360,935 | 19,504,941 | 14,743,621 | ||||||
| Net income attributable to World Fuel |
117,782 | 111,993 | 66,371 | ||||||
| Earnings per share: |
|||||||||
| Basic |
$ | 2.00 | $ | 1.93 | $ | 1.16 | |||
| Diluted |
$ | 1.97 | $ | 1.92 | $ | 1.13 | |||
Significant Accounting Policies
Basis of Consolidation
The accompanying consolidated financial statements and related notes to the consolidated financial statements include our accounts and those of our majority-owned or controlled subsidiaries, after elimination of all significant intercompany accounts, transactions, and profits.
Use of Estimates
The preparation of consolidated financial statements in conformity with accounting principles generally accepted in the United States requires us to make certain estimates and assumptions that affect the reported amounts of assets and liabilities, disclosure of contingent assets and liabilities at the date of the financial statements and the reported amounts of revenue and expenses during the reporting period. Accordingly, actual results could materially differ from estimated amounts. We evaluate our estimated assumptions based on historical experience and on various other assumptions that are believed to be reasonable, the results of which form the basis for making judgments about the carrying values of assets and liabilities.
Fair Value of Financial Instruments
The carrying amounts of cash, cash equivalents other than money market mutual funds, accounts receivable, accounts payable and accrued expenses approximate fair value based on the short maturities of these instruments.
We measure our money market mutual funds and derivative contracts at their fair value in accordance with accounting guidance for fair value measurement. We believe the carrying value of our debt approximates fair value since these obligations bear interest at variable rates or fixed rates which are not significantly different than market rates.
The accounting guidance on fair value measurements and disclosures establishes a hierarchy for inputs used in measuring fair value that maximizes the use of observable inputs and minimizes the use of unobservable
55
Table of Contents
WORLD FUEL SERVICES CORPORATION AND SUBSIDIARIES
NOTES TO THE CONSOLIDATED FINANCIAL STATEMENTS—(Continued)
inputs by requiring that the most observable inputs be used when available. Observable inputs are inputs that market participants would use in pricing the asset or liability developed based on market data obtained from sources independent of us. Unobservable inputs are inputs that reflect our assumptions about the assumptions market participants would use in pricing the asset or liability developed based on the best information available under the circumstances. The hierarchy is broken down into three levels based on the reliability of the inputs as follows:
| 1. | Level 1 Inputs—Quoted prices (unadjusted) in active markets for identical assets or liabilities that we have the ability to access. |
| 2. | Level 2 Inputs—Inputs other than quoted prices included within Level 1 that are observable for the asset or liability, either directly or indirectly. We perform annual back-testing to validate that these inputs represent observable inputs that market participants use in pricing an asset or liability. |
| 3. | Level 3 Inputs—Inputs that are unobservable for the asset or liability. |
The availability of observable inputs can vary and is affected by a wide variety of factors. To the extent that valuation is based on inputs that are less observable or unobservable in the market, the determination of fair value requires more judgment. Accordingly, the degree of judgment exercised by us in determining fair value is greatest for instruments categorized in Level 3. In certain cases, the inputs used to measure fair value of a specific asset or liability may fall into different levels of the fair value hierarchy. In such cases, for disclosure purposes the level in the fair value hierarchy within which the fair value measurement in its entirety falls is determined based on the lowest level input that is significant to the fair value measurement in its entirety.
Fair value is a market-based measure considered from the perspective of a market participant who holds the asset or owes the liability rather than an entity-specific measure. Therefore, even when market assumptions are not readily available, our own assumptions are set to reflect those that we feel market participants would use in pricing the asset or liability at the measurement date.
Assets and liabilities that are recorded at fair value have been categorized based upon the fair value hierarchy. Our Level 1 items consist of exchange traded futures. Our Level 2 items consist of commodity swaps, commodity collars, non-designated derivatives in the form of physical forward purchase or sales commitments, hedged inventories and hedged physical forward purchase or sales commitments. Our Level 3 items consist of physical forward purchase or sales commitments, foreign currency forward contracts and the Earn-out liability. Realized and unrealized gains and losses of our physical forward purchase or sales commitments measured at fair value on a recurring basis that utilized Level 3 inputs are recognized as a component of either revenue or cost of revenue (based on the underlying transaction type). Realized and unrealized gains and losses of our foreign currency forward contracts which were not treated as cash flow hedges, measured at fair value on a recurring basis that utilized Level 3 inputs are recognized as other expense/income. Realized and unrealized gains and losses of our short-term investments measured at fair value on a recurring basis that utilized Level 3 inputs are recognized as other expense/income.
Derivative instruments can have bid and ask prices that may be observed in the marketplace. Bid prices reflect the highest price that a market participant is willing to pay and ask prices reflect the lowest price that a market participant is willing to accept. Our policy is to consistently apply mid-market pricing for valuation of our derivative instruments.
Fair value of derivative instruments is derived using forward prices that take into account commodity prices, interest rates, credit risk ratings, option volatility and currency rates. In accordance with the guidance on fair value measurements and disclosures, the impact of our credit risk rating is also considered when measuring the fair value of liabilities. The fair value of derivative instruments may be based on a combination of valuation
56
Table of Contents
WORLD FUEL SERVICES CORPORATION AND SUBSIDIARIES
NOTES TO THE CONSOLIDATED FINANCIAL STATEMENTS—(Continued)
inputs that are on different hierarchy levels. The fair value disclosures are determined based on the lowest level input that is significant to the fair value measurement in its entirety. The nature of inputs that are considered Level 3 are modeled inputs. Factors that could warrant a Level 2 input to move to a Level 3 input may include lack of observable market data because of a decrease in market activity, a degradation of a short-term investment which requires us to value the investment based on a Level 3 input, or a change in significance of a Level 3 input to the fair value measurement in its entirety.
There were no significant changes to our valuation techniques during 2009 and 2008.
Cash and Cash Equivalents
On a daily basis, cash in excess of current operating requirements is invested in various highly liquid securities typically having an original maturity date of less than 90 days. These securities are carried at cost, which approximates market value, and are classified as cash equivalents. Our cash equivalents consist principally of overnight investments, bank money market accounts, bank time deposits, money market mutual funds and investment grade commercial paper.
Accounts Receivable and Allowance for Bad Debt
Credit extension, monitoring and collection are performed for each of our business segments. Each segment has a credit committee that is responsible for approving credit limits above certain amounts, setting and maintaining credit standards, and managing the overall quality of the credit portfolio. We perform ongoing credit evaluations of our customers and adjust credit limits based upon payment history and the customer’s current creditworthiness, as determined by our review of our customer’s credit information. We extend credit on an unsecured basis to most of our customers. Accounts receivable are deemed past due based on contractual terms agreed with our customers.
We continuously monitor collections and payments from our customers and maintain a provision for estimated credit losses based upon our historical experience with our customers, current market and industry conditions of our customers, and any specific customer collection issues that we have identified. Accounts receivable are reduced by an allowance for estimated credit losses.
Inventories
Inventories are valued using the average cost methodology and are stated at the lower of average cost or market. Components of inventory include fuel purchase costs, the related transportation costs, storage fees, and for inventories included in a fair value hedge relationship, changes in the estimated fair market values.
Derivatives
We enter into derivative contracts in order to mitigate the risk of market price fluctuations in marine, aviation and land fuel, to offer our customers fuel pricing alternatives to meet their needs. From time to time, we also enter into certain limited risk derivative transactions which are speculative in nature, primarily basis spreads related to fuel products sold by the company. We also enter into derivatives in order to mitigate the risk of fluctuations in foreign currency exchange rates. We have applied the normal purchase and normal sales exception (“NPNS”), as provided by accounting guidance for derivative instruments and hedging activities, to certain of our physical forward sales and purchase contracts. While these contracts are considered derivative instruments under the guidance for derivative instruments and hedging activities, they are not recorded at fair value, but rather are recorded in our consolidated financial statements when physical settlement of the contracts occurs. If it is
57
Table of Contents
WORLD FUEL SERVICES CORPORATION AND SUBSIDIARIES
NOTES TO THE CONSOLIDATED FINANCIAL STATEMENTS—(Continued)
determined that a transaction designated as NPNS no longer meets the scope of the exception, the fair value of the related contract is recorded as an asset or liability on the consolidated balance sheet and the difference between the fair value and the contract amount is immediately recognized through earnings.
Our derivatives that are subject to the accounting guidance for derivative instruments are recognized at their estimated fair market value in accordance with the accounting guidance for fair value measurements. If the derivative does not qualify as a hedge or is not designated as a hedge, changes in the estimated fair market value of the derivative are recognized as a component of revenue or cost of revenue (based on the underlying transaction type) in the consolidated statement of income. Derivatives which qualify for hedge accounting may be designated as either a fair value or cash flow hedge. For our fair value hedges, changes in the estimated fair market value of the hedge instrument and the hedged item are recognized in the same line item as a component of either revenue or cost of revenue (based on the underlying transaction type) in the consolidated statement of income. For our cash flow hedges, the effective portion of the changes in the fair market value of the hedge is recognized as a component of other comprehensive income in the shareholders’ equity section of the consolidated balance sheet and subsequently reclassified into the same line item as the forecasted transaction when both are settled, while the ineffective portion of the changes in the estimated fair market value of the hedge is recognized as a component of other non-operating expense/income in the consolidated statement of income. Cash flows for our hedging instruments used in our hedges are classified in the same category as the cash flow from the hedged items. If for any reason hedge accounting is discontinued, then any cash flows subsequent to the date of discontinuance shall be classified consistent with the nature of the instrument.
To qualify for hedge accounting, as either a fair value or cash flow hedge, the hedging relationship between the hedging instruments and hedged items must be highly effective over an extended period of time in achieving the offset of changes in fair values or cash flows attributable to the hedged risk at the inception of the hedge. We use a regression analysis based on historical spot prices in assessing the qualification for our fair value hedges. However, our measurement of hedge ineffectiveness for our fair value inventory hedges utilizes spot prices for the hedged item (inventory) and forward or future prices for the hedge instrument. Therefore, the excluded component (forward or futures prices) in assessing hedge qualification, along with ineffectiveness, is included as a component of cost of revenue in earnings. Adjustments to the carrying amounts of hedged items is discontinued in instances where the related fair value hedging instrument becomes ineffective and any previously recorded fair market value changes are not adjusted until the fuel is sold.
For additional information on our derivatives, see Note 4.
Property and Equipment
Property and equipment are carried at cost less accumulated depreciation and amortization. Depreciation and amortization are calculated using the straight-line method over the estimated useful lives of the assets. Costs of major additions and improvements are capitalized while expenditures for maintenance and repairs, which do not extend the life of the asset, are expensed. Upon sale or disposition of property and equipment, the cost and related accumulated depreciation and amortization are eliminated from the accounts and any resulting gain or loss is credited or charged to income. Long-lived assets held and used by us are reviewed based on market factors and operational considerations for impairment whenever events or changes in circumstances indicate that the carrying amount of an asset may not be recoverable.
Purchases of computer software are capitalized. External costs and certain internal costs (including payroll and payroll-related costs of employees) directly associated with developing significant computer software applications for internal use are capitalized. Training and data conversion costs are expensed as incurred. Computer software costs are amortized using the straight-line method over the estimated useful life of the software.
58
Table of Contents
WORLD FUEL SERVICES CORPORATION AND SUBSIDIARIES
NOTES TO THE CONSOLIDATED FINANCIAL STATEMENTS—(Continued)
Goodwill and Identifiable Intangible Assets
Goodwill represents our cost in excess of the estimated fair value of net assets, including identifiable intangible assets, of acquired businesses or companies. Goodwill is not subject to periodic amortization; instead, it is reviewed annually at year-end (or more frequently under certain circumstances) for impairment. The initial step of the goodwill impairment test compares the estimated fair value of a reporting unit, which is the same as our reporting segments, with its carrying amount, including goodwill. The fair value of our reporting segments is estimated using discounted cash flows and market capitalization methodologies.
In connection with our acquisitions, we recorded identifiable intangible assets existing at the date of the acquisitions for customer relationships, supplier and non-compete agreements and trademark/trade name rights. Identifiable intangible assets subject to amortization are amortized over their estimated lives and are reviewed for impairment whenever events or changes in circumstances indicate that the carrying amount of an asset may not be recoverable based on market factors and operational considerations. Identifiable intangible assets not subject to amortization are reviewed annually for impairment by comparing the estimated fair value of the intangible asset with its carrying value.
Extinguishment of Liability
In the normal course of business, we accrue liabilities for fuel and services received for which invoices have not yet been received. These liabilities are derecognized, or extinguished, if either (i) payment is made to relieve our obligation for the liability or (ii) we are legally released from our obligation for the liability, such as when our legal obligations with respect to such liabilities lapse or otherwise no longer exist. During 2009, we derecognized vendor liability accruals due to the legal release of our obligations in the amount of $8.6 million, as compared to $8.5 million during 2008, which is reflected as a reduction of cost of revenue in the accompanying consolidated statements of income.
Revenue Recognition
Revenue from the sale of fuel is recognized when the sales price is fixed or determinable, collectability is reasonably assured and title passes to the customer, which is when the delivery of fuel is made to our customer directly from us, the supplier or a third-party subcontractor. Our fuel sales are generated as a fuel reseller as well as from on-hand inventory supply. When acting as a fuel reseller, we generally purchase fuel from the supplier, mark it up, and contemporaneously resell the fuel to the customer, normally taking delivery for purchased fuel at the same place and time as the delivery is made. We record the gross sale of the fuel as we generally take inventory risk, have latitude in establishing the sales price, have discretion in the supplier selection, maintain credit risk and are the primary obligor in the sales arrangement.
Revenue from fuel-related services is recognized when services are performed, the sales price is fixed or determinable and collectability is reasonably assured. We record the gross sale of fuel-related services as we generally have latitude in establishing the sales price, have discretion in supplier selection, maintain credit risk and are the primary obligor in the sales arrangement.
Commission from fuel broker services is recognized when services are performed and collectability is reasonably assured. When acting as a fuel broker, we are paid a commission by the supplier.
Revenue from charge card transactions is recognized at the time the purchase is made by the customer using the charge card. Revenue from charge card transactions is generated from processing fees.
59
Table of Contents
WORLD FUEL SERVICES CORPORATION AND SUBSIDIARIES
NOTES TO THE CONSOLIDATED FINANCIAL STATEMENTS—(Continued)
Vendor and Customer Rebates and Branding Allowances
From time to time, we receive vendor rebates and provide customer rebates. Generally, volume rebates are received from vendors under structured programs based on the level of fuel purchased or sold as specified in the applicable vendor agreements. These volume rebates are recognized as a reduction of cost of revenue in the period earned when realization is probable and estimatable and when certain other conditions are met. A portion of the rebates received from vendors is passed along to our customers. These rebates to our customers are recognized as a reduction of revenue in the period earned in accordance with the applicable customer agreements. The rebate terms of the customer agreements are generally similar to those of the vendor agreements. From time to time, in our land segment, we also receive branding allowances from fuel suppliers to defray the costs of branding and enhancing certain of our customer locations. The branding allowances received are recorded as a reduction of cost of revenue.
Some of these vendor rebate and promotional allowance arrangements require that we make assumptions and judgments regarding, for example, the likelihood of attaining specified levels of purchases or selling specified volume of products. We routinely review the relevant, significant factors and make adjustments when the facts and circumstances dictate that an adjustment is warranted.
The amounts recorded as a reduction of revenue related to volume rebates and promotional allowance arrangements paid to our customers were $3.0 million and $1.3 million in 2009 and 2008, respectively, and the amounts recorded as a reduction of cost of revenue related to volume rebates received from vendors were $6.6 million and $4.1 million in 2009 and 2008, respectively.
Share-Based Payment Awards
We account for share-based payment awards on a fair value basis. Under fair value accounting, the grant-date fair value of the share-based payment award is amortized as compensation expense, on a straight-line basis, over the vesting period for both graded and cliff vesting awards. Annual compensation expense for share-based payment awards is reduced by an expected forfeiture amount on outstanding share-based payment awards.
We use the Black-Scholes option pricing model to estimate the fair value of stock options and stock-settled stock appreciation rights, which are referred to collectively as “Option Awards.” The estimation of the fair value of Option Awards on the date of grant using an option-pricing model is affected by our stock price as well as assumptions regarding a number of complex and subjective variables. These variables include our expected stock price volatility over the term of the awards, actual and projected employee stock option exercise behaviors, risk-free interest rates and expected dividends. The expected term of the Option Awards represents the estimated period of time from grant until exercise or conversion and is based on vesting schedules and expected post-vesting, exercise and employment termination behavior. Expected volatility is based on the historical volatility of our common stock over the period that is equivalent to the award’s expected life. Any adjustment to the historical volatility as an indicator of future volatility would be based on the impact to historical volatility of significant non-recurring events that would not be expected in the future. Risk-free interest rates are based on the U.S. Treasury yield curve at the time of grant for the period that is equivalent to the award’s expected life. Dividend yields are based on the historical dividends of World Fuel over the period that is equivalent to the award’s expected life, as adjusted for stock splits.
The estimated fair value of common stock, restricted stock and restricted stock units (“RSUs”) is based on the grant-date market value of our common stock, as defined in the respective plans under which the awards were granted.
60
Table of Contents
WORLD FUEL SERVICES CORPORATION AND SUBSIDIARIES
NOTES TO THE CONSOLIDATED FINANCIAL STATEMENTS—(Continued)
Cash flows from tax benefits resulting from tax deductions in excess of the compensation cost recognized for share-based payment awards (excess tax benefits) are classified as financing cash flows. These excess income tax benefits were credited to capital in excess of par value.
Foreign Currency
The functional currency of our U.S. and foreign subsidiaries, except for our two subsidiaries in Brazil, is the U.S. dollar. Foreign currency transaction gains and losses are recognized upon settlement of foreign currency transactions. In addition, for unsettled foreign currency transactions, foreign currency translation gains and losses are recognized for changes between the transaction exchange rates and month-end exchange rates. Foreign currency transaction gains and losses are included in other, net, in the accompanying consolidated statements of income in the period incurred. We recorded net foreign currency transaction losses of $0.6 million, $8.1 million and $0.6 million in 2009, 2008 and 2007, respectively.
Commencing in October 2008, the financial position and results of operations of our two subsidiaries in Brazil were measured using the Brazilian real as the functional currency. Revenues and expenses of the subsidiaries have been translated into U.S. dollars at average exchange rates prevailing during the period. Assets and liabilities have been translated at the rates of exchange on the balance sheet dates. The resulting translation gain and loss adjustments are recorded in accumulated other comprehensive income as a separate component of shareholders’ equity. We recorded a net foreign currency translation adjustment gain of $7.1 million in 2009 and a net foreign currency translation loss of $3.3 million in 2008.
Income Taxes
Income taxes are accounted for under the asset and liability method. Under this method, deferred tax assets and liabilities are recognized for the future tax consequences attributable to differences between the financial statement carrying amounts of existing assets and liabilities and their respective tax bases, and operating loss and tax credit carryforwards. Deferred tax assets and liabilities are measured using enacted tax rates expected to apply to taxable income in the years in which those temporary differences are expected to be recovered or settled. The effect on deferred tax assets and liabilities of a change in tax rates is recognized in the income tax provision in the period that includes the enactment date.
We must assess the likelihood that our deferred tax assets will be recovered from our future taxable income, and to the extent we believe that recovery is not likely, we must establish a valuation allowance against those deferred tax assets. Deferred tax liabilities generally represent items for which we have already taken a deduction in our tax return, but we have not yet recognized the items as expenses in our results of operations.
Significant judgment is required in evaluating our tax positions, and in determining our provisions for income taxes, our deferred tax assets and liabilities and any valuation allowance recorded against our net deferred assets. We establish reserves when, despite our belief that the tax return positions are fully supportable, certain positions are likely to be challenged and we may ultimately not prevail in defending those positions.
U.S. income and foreign withholding taxes have not been recognized on undistributed earnings of foreign subsidiaries. It is not practicable to estimate the amount of taxes that might be payable, if distributed. Our intention is to reinvest these undistributed earnings permanently or to repatriate the undistributed earnings only when it is tax effective to do so.
61
Table of Contents
WORLD FUEL SERVICES CORPORATION AND SUBSIDIARIES
NOTES TO THE CONSOLIDATED FINANCIAL STATEMENTS—(Continued)
Earnings per Share
Basic earnings per share is computed by dividing net income attributable to World Fuel and available to common shareholders by the sum of the weighted average number of shares of common stock, stock units, restricted stock entitled to dividends not subject to forfeiture and vested RSUs outstanding during the period. Diluted earnings per share is computed by dividing net income attributable to World Fuel and available to common shareholders by the sum of the weighted average number of shares of common stock, stock units, restricted stock entitled to dividends not subject to forfeiture and vested RSUs outstanding during the period and the number of additional shares of common stock that would have been outstanding if our outstanding potentially dilutive securities had been issued. Potentially dilutive securities include Option Awards, restricted stock subject to forfeitable dividends and non-vested RSUs. The dilutive effect of potentially dilutive securities is reflected in diluted earnings per share by application of the treasury stock method. Under the treasury stock method, an increase in the fair market value of our common stock can result in a greater dilutive effect from potentially dilutive securities.
The following table sets forth the computation of basic and diluted earnings per share for the periods presented (in thousands, except per share amounts):
| 2009 | 2008 | 2007 | |||||||
| Numerator: |
|||||||||
| Net income attributable to World Fuel |
$ | 117,139 | $ | 105,039 | $ | 64,773 | |||
| Denominator: |
|||||||||
| Weighted average common shares for basic earnings per share |
59,003 | 57,707 | 56,853 | ||||||
| Effect of dilutive securities |
898 | 537 | 1,493 | ||||||
| Weighted average common shares for diluted earnings per share |
59,901 | 58,244 | 58,346 | ||||||
| Weighted average anti-dilutive securities which are not included in the calculation of diluted earnings per share |
803 | 1,477 | 1,062 | ||||||
| Basic earnings per share |
$ | 1.99 | $ | 1.82 | $ | 1.14 | |||
| Diluted earnings per share |
$ | 1.96 | $ | 1.80 | $ | 1.11 | |||
The earnings per share data for 2008 and 2007 were adjusted in accordance with the adoption of accounting guidance for determining whether instruments granted in share-based payment transactions are participating securities. See Recent Accounting Pronouncements discussed below for additional information.
Reclassifications
Certain amounts in prior years have been reclassified to conform to current year’s presentation.
Stock Split
In November 2009, we announced a two-for-one stock split of our common stock. The additional shares issued pursuant to the stock split were distributed in December 2009 to shareholders of record as of November 30, 2009. In connection with the stock split, in November 2009, our Board of Directors approved an increase in World Fuel’s authorized stock from 50,000,000 to 100,000,000 shares. Shareholders’ equity has been
62
Table of Contents
WORLD FUEL SERVICES CORPORATION AND SUBSIDIARIES
NOTES TO THE CONSOLIDATED FINANCIAL STATEMENTS—(Continued)
restated to give retroactive recognition to the stock split for all periods presented by reclassifying the par value of the additional shares arising from the split from capital in excess of par value to common stock. All references to number of shares and per share amounts in the financial statements and notes to the financial statements reflect the increase in the number of shares of common stock authorized for issuance and the stock split.
Recent Accounting Pronouncements
FASB Accounting Standards Codification. In June 2009, the Financial Accounting Standards Board (“FASB”) issued new accounting standards that establish the FASB Accounting Standards Codification (the “Codification”) as the official single source of authoritative U.S. generally accepted accounting principles and supersedes all previous accounting standards. All other accounting guidance not included in the Codification will be considered non-authoritative. The Codification also includes all relevant Securities and Exchange Commission (“SEC”) guidance organized using the same topical structure in separate sections within the Codification. Following the Codification, the FASB will not issue new standards in the form of Statements, FASB Staff Positions or Emerging Issues Task Force Abstracts. Instead, it will issue accounting standards updates which will serve to update the Codification, provide background information about the guidance and provide the basis for conclusions on the changes to the Codification. The Codification is not intended to change GAAP, but it will change the way GAAP is organized and presented. We adopted this accounting guidance in the third quarter of 2009 which resulted in references to accounting guidance in our SEC filings being consistent with the Codification.
Fair Value Measurements and Disclosures: Improving Disclosures about Fair Value Measurements. In January 2010, the FASB issued an accounting standard update which provides additional guidance to improve disclosures regarding fair value measurements. The new disclosures required by this update require an entity to disclose separately the amounts of significant transfers in and out of Level 1 and Level 2 fair value measurements and to describe the reasons for the transfers. In addition, this guidance requires a gross presentation of the Level 3 activity and provides clarification to existing requirements on the level of disaggregation and disclosures regarding inputs and valuation techniques. This guidance will be effective for interim and annual reporting periods beginning after December 15, 2009, except for the disclosures on the Level 3 activity, which will be effective beginning after December 15, 2010, and for interim periods within those fiscal years. Other than the requirement of additional derivative disclosures in future interim and annual reporting periods, the adoption of this guidance will not have a material impact on our consolidated financial statements.
Equity: Accounting for Distributions to Shareholders with Components of Stock and Cash. In January 2010, the FASB issued an accounting standard update for accounting for distributions to shareholders with components of stock and cash. This update clarifies that the stock portion of a distribution to shareholders that allows them to elect to receive cash or stock with a potential limitation on the total amount of cash that all shareholders can elect to receive in the aggregate is considered a share issuance that is reflected in the earnings per share calculations prospectively and is not a stock dividend for purposes of applying accounting guidance on equity and earnings per share. This guidance will be effective for interim and annual periods ending after December 15, 2009, and should be applied retrospectively. The adoption of this accounting standard update did not have a material impact on our consolidated financial statements and disclosures.
Fair Value Measurements and Disclosures: Measuring Liabilities at Fair Value. In the third quarter of 2009, we adopted an accounting standard update to fair value measurements and disclosures for measuring liabilities at fair value. This update clarifies that when a quoted price in an active market for the identical liability is not available, a reporting entity is required to measure fair value using one or more of the following techniques: (i) a valuation technique that uses either the quoted price of the identical liability when traded as an asset or quoted prices for similar liabilities when traded as an asset; or (ii) another valuation technique that is
63
Table of Contents
WORLD FUEL SERVICES CORPORATION AND SUBSIDIARIES
NOTES TO THE CONSOLIDATED FINANCIAL STATEMENTS—(Continued)
consistent with the fair value measurement principles in the Codification such as the income and market approach to valuation. The amendments in this update also clarify that when estimating the fair value of a liability, a reporting entity is not required to include a separate input or adjustment to other inputs relating to the existence of a restriction that prevents the transfer of the liability. This update further clarifies that if the fair value of a liability is determined by reference to a quoted price in an active market for an identical liability, that price would be considered a Level 1 measurement in the fair value hierarchy. Similarly, if the identical liability has a quoted price when traded as an asset in an active market, it is also a Level 1 fair value measurement if no adjustments to the quoted price of the asset are required. The adoption of this accounting standard update did not have a material impact on our consolidated financial statements and disclosures.
Revenue Recognition: Multiple-Deliverable Revenue Arrangements. In October 2009, the FASB issued an accounting standard update to revenue recognition relating to multiple-deliverable revenue arrangements. This update modifies the fair value requirements of existing accounting guidance by allowing the use of the “best estimate of selling price” in addition to vendor-specific objective evidence (“VSOE”) and third-party evidence (“TPE”) for determining the selling price of a deliverable. A vendor is now required to use its best estimate of the selling price when VSOE or TPE of the selling price cannot be determined. In addition, the residual method of allocating arrangement consideration is no longer permitted. This update requires expanded qualitative and quantitative disclosures and is effective for fiscal years beginning on or after June 15, 2010. These updates may be applied either prospectively from the beginning of the fiscal year for new or materially modified arrangements or retrospectively. We are currently assessing the impact, if any, that the adoption of this update will have on our consolidated financial statements and disclosures.
Variable Interest Entities. In June 2009, the FASB revised the accounting guidance for consolidation of variable interest entities. In December 2009, the FASB issued various technical updates to this guidance. This guidance includes (i) the elimination of the exemption for qualifying special purpose entities, (ii) a new approach for determining who should consolidate a variable-interest entity, and (iii) changes to when it is necessary to reassess who should consolidate a variable-interest entity. This guidance will be effective for fiscal years beginning after November 15, 2009. We do not believe that the adoption of this accounting guidance will have a material impact on our consolidated financial statements and disclosures.
Accounting for Transfers of Financial Assets. In June 2009, the FASB revised the accounting guidance for transfers and servicing of financial assets and extinguishment of liabilities. In December 2009, the FASB issued various technical updates to this guidance. This guidance eliminates the concept of a “qualifying special purpose entity,” changes the requirements for derecognizing financial assets, and requires additional disclosures in order to enhance information to users of financial statements by providing greater transparency about transfers of financial assets, including securitization transactions, and an entity’s continuing involvement in and exposure to the risks related to transferred financial assets. This guidance is effective for fiscal years beginning after November 15, 2009. We do not believe that the adoption of this accounting guidance will have a material impact on our consolidated financial statements and disclosures.
Subsequent Events. In the second quarter of 2009, we adopted new accounting guidance for accounting and reporting subsequent events. This guidance establishes general standards of accounting and disclosure for events that occur after the balance sheet date but before financial statements are issued or are available to be issued and requires that companies disclose the date through which they have evaluated such subsequent events. This guidance does not apply to subsequent events or transactions that are within the scope of other applicable generally accepted accounting principles that provide for different treatment of such events or transactions. We have evaluated subsequent events through February 25, 2009, the date of the filing of this 10-K Report, and there were no material subsequent events to report.
64
Table of Contents
WORLD FUEL SERVICES CORPORATION AND SUBSIDIARIES
NOTES TO THE CONSOLIDATED FINANCIAL STATEMENTS—(Continued)
Recognition and Presentation of Other-Than-Temporary Impairments. In the second quarter of 2009, we adopted new accounting guidance for the recognition and presentation of other-than-temporary impairments. This guidance amends the other-than-temporary impairment guidance for debt securities to make the guidance more operational and to improve the presentation and disclosure of other-than-temporary impairments on debt and equity securities. The adoption of this guidance did not have a material impact on our consolidated financial statements and disclosures.
Determining Fair Values When the Volume and Level of Activity for the Asset or Liability Have Significantly Decreased and Identifying Transactions That Are Not Orderly. In the second quarter of 2009, we adopted new accounting guidance for determining fair values when the volume and level of activity for the asset or liability have significantly decreased and identifying transactions that are not orderly. This guidance provides additional guidance for estimating fair value when the market activity for an asset or liability has declined significantly. The adoption of this guidance did not have a material impact on our consolidated financial statements and disclosures.
Interim Disclosures about Fair Value of Financial Instruments. In the second quarter of 2009, we adopted new accounting guidance for interim disclosures about fair value of financial instruments. This guidance increases the frequency of the disclosures about fair value with the objective of improving the transparency of financial reporting. See Significant Accounting Policies included herein for appropriate disclosures.
Disclosures about Credit Derivatives and Certain Guarantees. In the first quarter of 2009, we adopted revised accounting guidance for disclosures about credit derivatives and certain guarantees. This guidance requires various disclosures by sellers of credit derivatives, including credit derivatives embedded in hybrid instruments. Additionally, this guidance amends a guarantor’s accounting and disclosure requirements for guarantees, including indirect guarantees of indebtedness of others, by requiring an additional disclosure about the current status of the payment/performance risk of a guarantee. Furthermore, this guidance clarifies that the FASB’s intent with respect to disclosures about derivative instruments and hedging activities. The adoption of this guidance did not have a material impact on our consolidated financial statements and disclosures.
Disclosures about Derivative Instruments and Hedging Activities. In the first quarter of 2009, we adopted new accounting guidance for disclosures about derivative instruments and hedging activities. This guidance requires companies with derivative instruments to disclose information that should enable financial statement users to understand how and why a company uses derivative instruments, how derivative instruments and related hedged items are accounted for under current guidance for derivative activities and hedging instruments and how derivative instruments and related hedged items affect a company’s financial position, financial performance and cash flows. This guidance also requires disclosures of the fair value of credit-risk-related contingent features in derivative agreements. The adoption of this guidance did not have a material impact on our consolidated financial statements.
Determining Whether Instruments Granted in Share-Based Payment Transactions are Participating Securities. Effective January 1, 2009, we adopted accounting guidance for determining whether instruments granted in share-based payment transactions are participating securities. This guidance states that unvested share-based payment awards that contain nonforfeitable rights to dividends or dividend equivalents (whether paid or unpaid) are participating securities and shall be included in the computation of earnings per share under the two-class method. In addition, all prior-period earnings per share data shall be adjusted retrospectively to conform to the provisions of this guidance. The adoption of this guidance resulted in (i) a decrease of $0.01 in basic and no change in diluted earnings per share for 2009, (ii) a decrease of $0.01 in basic and diluted earnings per share for 2008, and (iii) a decrease of $0.01 in basic and no change in diluted earnings per share for 2007.
65
Table of Contents
WORLD FUEL SERVICES CORPORATION AND SUBSIDIARIES
NOTES TO THE CONSOLIDATED FINANCIAL STATEMENTS—(Continued)
Determination of the Useful Life of Intangible Assets. Effective January 1, 2009, we adopted new accounting guidance on the determination of the useful life of intangible assets. This guidance amends the factors under previous guidance for goodwill and other intangible assets that should be considered in developing renewal or extension assumptions used to determine the useful life of a recognized intangible asset. The intent of this guidance is to improve the consistency between the useful life of a recognized intangible asset under the previous guidance and the period of expected cash flows used to measure the fair value of the asset under guidance for business combinations and other generally accepted accounting principles in the United States. The adoption of this guidance did not have a material impact on our consolidated financial statements and disclosures.
Fair Value Measurements for Nonfinancial Assets and Liabilities. Effective January 1, 2009, we adopted new accounting guidance for nonfinancial assets and liabilities, except those that are recognized or disclosed at fair value in the financial statements on a recurring basis (at least annually). We adopted the fair value measurements guidance for financial assets and liabilities effective January 1, 2008 and the effective date of the fair value measurements guidance for nonfinancial assets and liabilities was delayed one year by FASB. This guidance defines fair value, establishes guidelines for measuring fair value and expands disclosures regarding fair value measurements. The adoption of this guidance for such nonfinancial assets and liabilities did not have a material impact on our consolidated financial statements and disclosures.
Business Combinations. Effective January 1, 2009, we adopted new accounting guidance for business combinations which is intended to improve, simplify and converge internationally the accounting for business combinations in consolidated financial statements. Under this guidance, an acquiring entity will be required to recognize all of the assets acquired and liabilities assumed in a transaction at the acquisition date fair value with limited exceptions. In addition, this guidance includes a substantial number of new disclosure requirements. We also adopted accounting guidance for assets acquired and liabilities assumed in a business combination that arise from contingencies. This guidance requires that such assets and liabilities be recognized at fair value per accounting guidance on fair value measurements, provided that the acquisition date fair value can be reasonably determined. If the fair value cannot be reasonably determined, the asset or liability should be recognized in accordance with accounting guidance for contingencies and reasonable estimation of the amount of a loss. This guidance did not have an immediate impact on our consolidated financial statements upon adoption and has been applied to the business combinations disclosed in Acquisitions discussed above.
Noncontrolling Interests in Consolidated Financial Statements. Effective January 1, 2009, we adopted new accounting guidance for noncontrolling interests in consolidated financial statements. This guidance establishes new accounting and reporting standards for the noncontrolling interest in a subsidiary and for the deconsolidation of a subsidiary. The intent of this guidance is to improve the relevance, comparability and transparency of financial information provided to investors by requiring all entities to report noncontrolling interests in subsidiaries in the same way as equity is reported in the consolidated financial statements. This guidance includes expanded disclosure requirements regarding the interests of the parent and its noncontrolling interest. As a result, upon adoption, we retroactively reclassified the minority interest in consolidated subsidiaries balance, which was previously included in accrued expenses and other current liabilities, to a new component of equity, which is reflected in the accompanying consolidated statement of shareholders’ equity. During the third quarter of 2009, we identified $0.2 million of minority interest that had not been previously reclassified to equity in the presentation for the Quarterly Report on Form 10-Q for the first and second quarters of 2009. The amount, which was not considered significant, was reclassified and is properly presented in the accompanying consolidated balance sheets included herein. The adoption of this guidance also impacted certain captions previously used in the consolidated statement of income, namely identifying net income including noncontrolling interest and net income attributable to World Fuel. Additional disclosures required by this standard are included in the statement of shareholders’ equity and comprehensive income.
66
Table of Contents
WORLD FUEL SERVICES CORPORATION AND SUBSIDIARIES
NOTES TO THE CONSOLIDATED FINANCIAL STATEMENTS—(Continued)
2. Short-Term Investments
At December 31, 2009 and 2008, our short-term investments consisted of $8.1 million of commercial paper with a par value of $10.0 million. On the maturity date of the investment, the issuer of the commercial paper defaulted on its repayment obligation. In April 2008, the commercial paper issuer was placed into receivership. The commercial paper is no longer highly liquid and an observable market does not exist, therefore a readily determinable fair market value of the investment is not available. In February 2009, the High Court of Justice, Chancery Division, Companies Court in the United Kingdom ruled that, based on the maturity date of the commercial paper held by us, we should receive payment ahead of other holders of the commercial paper. Then, in June 2009, the Court of Appeal, Civil Division in the United Kingdom upheld the ruling of the High Court of Justice. Finally, in November 2009, the Supreme Court of the United Kingdom ordered that the permission to appeal be refused, thus, exhausting any further appeals of the lower courts’ rulings.
While we currently believe that we will be able to collect the commercial paper’s par value based on the court judgment noted above, we have maintained the carrying value of our commercial paper at $8.1 million as of December 31, 2009 due to the uncertainties as a result of the receiver’s attempts to obtain settlement, indemnity and retention agreements from various interest parties prior to the distribution of any proceeds.
3. Accounts Receivable
We had accounts receivable of $951.4 million and $676.1 million, net of an allowance for bad debt of $19.7 million and $23.3 million, as of December 31, 2009 and 2008, respectively. Accounts receivable are written-off when it becomes apparent based upon age or customer circumstances that such amounts will not be collected. The following table sets forth activities in our allowance for bad debt (in thousands):
| 2009 | 2008 | 2007 | ||||||||||
| Balance at beginning of period |
$ | 23,271 | $ | 12,644 | $ | 14,283 | ||||||
| Charges to provision for bad debt |
4,552 | 16,081 | 1,892 | |||||||||
| Write-off of uncollectible accounts receivable |
(8,800 | ) | (5,866 | ) | (3,733 | ) | ||||||
| Recoveries of bad debt |
667 | 412 | 202 | |||||||||
| Balance at end of period |
$ | 19,690 | $ | 23,271 | $ | 12,644 | ||||||
Included in accounts receivable, as of December 31, 2009, 2008 and 2007, were net receivables due from Signature, a related party, of $10.4 million, $7.1 million and $13.9 million, respectively. For 2009, 2008 and 2007, sales to Signature from Page Avjet Fuel Co LLC (“PAFCO”) amounted to $107.7 million, $210.2 million and $147.0 million, respectively. In addition to PAFCO’s sales to Signature, in the normal course of business, we utilize Signature and Aircraft Service International Group (“ASIG”), a sister company of Signature, as subcontractors to provide various services to customers, including into-plane fueling at airports, and transportation and storage of fuel and fuel products. These activities with Signature and ASIG were not considered to be significant.
We have a Master Accounts Receivable Purchase Agreement with a syndicate of financial institutions which establishes a facility (the “Receivable Facility”) for us to sell up to an aggregate of $160.0 million of our accounts receivable on a revolving basis. As of December 31, 2009, no accounts receivable had been sold under the Receivable Facility. The Receivable Facility may be increased to up to $250.0 million, subject to the satisfaction of certain conditions, and matures in September 2010 unless an event of termination occurs or the term is extended for subsequent one-year terms with the prior written consent of the syndicate of financial institutions. The Receivable Facility contains customary termination events, including, among other things, the
67
Table of Contents
WORLD FUEL SERVICES CORPORATION AND SUBSIDIARIES
NOTES TO THE CONSOLIDATED FINANCIAL STATEMENTS—(Continued)
failure to make timely payments under the Receivable Facility, the breach of covenants, and the occurrence and continuance of events of default under our senior revolving credit facility. In October 2009, we amended our Receivable Facility to provide that, subject to the satisfaction of certain conditions, a termination event will not occur if one of the two specified rating agencies ceases to cover the insurer of the receivables. We recorded $1.2 million and $1.2 million of fees including unused fees, related to the Receivable Facility in 2009 and 2008, respectively, which is included in interest expense and other financing costs, net in the accompanying consolidated statements of income.
4. Derivatives
The following describes our derivative classifications:
Cash Flow Hedges. Includes certain of our foreign currency forward contracts we enter into in order to mitigate the risk of currency exchange rate fluctuations. There were no outstanding cash flow hedges as of December 31, 2009. We recorded an unrealized net loss of $1.5 million, which was included in accumulated other comprehensive income (loss) in shareholders’ equity as of December 31, 2008 related to outstanding cash flow hedges.
Fair Value Hedges. Includes derivatives we enter into in order to hedge price risk associated with some of our inventory and certain firm commitments relating to fixed price purchase and sale contracts. As of December 31, 2009 and 2008, we recorded an unrealized net gain of $2.9 million and an unrealized net loss of $1.4 million, respectively, related to the ineffectiveness of our fair value hedge positions on the respective dates.
Non-designated Derivatives. Includes derivatives we primarily enter into in order to mitigate the risk of market price fluctuations in marine, aviation and land fuel in the form of swaps as well as fixed price purchase and sale contracts and to offer our customers fuel pricing alternatives to meet their needs. In addition, non-designated derivatives are also entered into to hedge the risk of currency rate fluctuations. As of December 31, 2009 and 2008, we recorded an unrealized net gain of $1.2 million and $1.3 million, respectively, related to our non-designated derivative positions on the respective dates.
For additional information on our derivatives accounting policy, see Note 1.
68
Table of Contents
WORLD FUEL SERVICES CORPORATION AND SUBSIDIARIES
NOTES TO THE CONSOLIDATED FINANCIAL STATEMENTS—(Continued)
As of December 31, 2009, our derivative instruments and related hedged items, if designated in a fair value hedging relationship, at their respective fair value positions were as follows (in thousands, except mark-to-market prices):
| Hedge Strategy |
Settlement |
Derivative Instrument |
Notional | Unit | Mark-to- Market Prices |
Mark-to- Market |
|||||||||
| Fair value hedge |
2010 | Commodity contracts for firm commitment hedging (long) | 4,644 | GAL | $ | 0.056 | $ | 259 | |||||||
| 2010 | Firm sales commitments hedged item | 4,644 | GAL | 0.054 | (252 | ) | |||||||||
| 2010 | Firm sales commitments hedged item | 301 | GAL | 0.153 | 46 | (1) | |||||||||
| 2010 | Commodity contracts for inventory hedging (short) | 24,855 | GAL | 0.086 | (2,138 | ) | |||||||||
| 2010 | Inventory hedged item | 24,855 | GAL | 0.096 | 2,394 | ||||||||||
| 2010 | Commodity contracts for firm | ||||||||||||||
| commitment hedging (long) | 28 | MT | 49.250 | 1,379 | |||||||||||
| 2010 | Firm sale commitments hedged item | 28 | MT | 44.286 | (1,240 | ) | |||||||||
| 2010 | Commodity contracts for firm | ||||||||||||||
| commitment hedging (short) | 23 | MT | 14.130 | (325 | ) | ||||||||||
| 2010 | Firm purchase commitments hedged item | 23 | MT | 15.957 | 367 | ||||||||||
| 2010 | Commodity contracts for inventory hedging (short) | 59 | MT | 13.492 | (796 | ) | |||||||||
| 2010 | Inventory hedged item | 59 | MT | 53.797 | 3,174 | ||||||||||
| $ | 2,868 | ||||||||||||||
| Non-designated |
2010 | Commodity contracts (long) | 16,669 | GAL | 0.168 | $ | 2,796 | ||||||||
| 2010 | Commodity contracts (short) | 16,404 | GAL | 0.166 | (2,730 | ) | |||||||||
| 2010 | Commodity contracts (long) | 237 | MT | 43.143 | 10,225 | ||||||||||
| 2010 | Commodity contracts (short) | 214 | MT | 42.182 | (9,027 | ) | |||||||||
| 2010 | Foreign currency contracts (long) | 2,917 | BRL | 0.005 | 16 | ||||||||||
| 2010 | Foreign currency contracts (long) | 114 | CAD | 0.009 | (1 | ) | |||||||||
| 2010 | Foreign currency contracts (long) | 3,790,577 | CLP | 0.000 | (87 | ) | |||||||||
| 2010 | Foreign currency contracts (long) | 4,198 | GBP | 0.016 | (67 | ) | |||||||||
| 2010 | Foreign currency contracts (long) | 840 | HKD | — | — | ||||||||||
| 2010 | Foreign currency contracts (short) | 589 | GBP | 0.020 | (12 | ) | |||||||||
| 2011 | Commodity contracts (long) | 229 | GAL | 0.061 | 14 | ||||||||||
| 2011 | Commodity contracts (short) | 229 | GAL | 0.013 | (3 | ) | |||||||||
| 2011 | Commodity contracts (long) | 4 | MT | 36.250 | 145 | ||||||||||
| 2011 | Commodity contracts (short) | 4 | MT | 28.000 | (112 | ) | |||||||||
| $ | 1,157 | ||||||||||||||
| (1) | The Mark-to-Market represents the unrealized fair value of the hedged item in a fair value hedge relationship, which unlike its corresponding hedging instrument, has not yet been settled. |
69
Table of Contents
WORLD FUEL SERVICES CORPORATION AND SUBSIDIARIES
NOTES TO THE CONSOLIDATED FINANCIAL STATEMENTS—(Continued)
The following table presents information about our derivative instruments measured at fair value and their locations on the consolidated balance sheet as of December 31, 2009 (in thousands):
| Balance Sheet Location |
|||||
| Derivative assets: |
|||||
| Derivatives designated as hedging instruments |
|||||
| Commodity contracts |
Short-term derivative assets, net | $ | 1,633 | ||
| Commodity contracts |
Short-term derivative liabilities, net | 187 | |||
| Total hedging instrument derivatives |
1,820 | ||||
| Derivatives not designated as hedging instruments |
|||||
| Commodity contracts |
Short-term derivative assets, net | 10,652 | |||
| Commodity contracts |
Short-term derivative liabilities, net | 1,701 | |||
| Commodity contracts |
Other assets | 169 | |||
| Commodity contracts |
Deferred compensation and other | ||||
| long-term liabilities | 2 | ||||
| Foreign exchange contracts |
Short-term derivative assets, net | 4 | |||
| Total non-designated derivatives |
12,528 | ||||
| Total derivative assets |
$ | 14,348 | |||
| Derivative liabilities: |
|||||
| Derivatives designated as hedging instruments |
|||||
| Commodity contracts |
Short-term derivative assets, net | $ | 74 | ||
| Commodity contracts |
Short-term derivative liabilities, net | 3,367 | |||
| Total hedging instrument derivatives |
3,441 | ||||
| Derivatives not designated as hedging instruments |
|||||
| Commodity contracts |
Short-term derivative assets, net | 362 | |||
| Commodity contracts |
Short-term derivative liabilities, net | 10,727 | |||
| Commodity contracts |
Deferred compensation and other | ||||
| long-term liabilities | 127 | ||||
| Foreign exchange contracts |
Short-term derivative liabilities, net | 155 | |||
| Total non-designated derivatives |
11,371 | ||||
| Total derivative liabilities |
$ | 14,812 | |||
The following table presents the effect and financial statement location of our derivative instruments and related hedged items in fair value hedging relationships on our consolidated statement of income for the year ended December 31, 2009 (in thousands):
| Derivatives |
Location | Realized and Unrealized Gain (Loss) |
Hedged Items | Location | Realized and Unrealized Gain (Loss) |
|||||||||
| Commodity contracts |
Revenue | $ | 14,117 | Firm commitments | Revenue | $ | (14,227 | ) | ||||||
| Commodity contracts |
Cost of revenue | (13,162 | ) | Firm commitments | Cost of revenue | 12,193 | ||||||||
| Commodity contracts |
Cost of revenue | (19,269 | ) | Inventory | Cost of revenue | 23,105 | ||||||||
| Total |
$ | (18,314 | ) | $ | 21,071 | |||||||||
70
Table of Contents
WORLD FUEL SERVICES CORPORATION AND SUBSIDIARIES
NOTES TO THE CONSOLIDATED FINANCIAL STATEMENTS—(Continued)
There were no gains or losses for the year ended December 31, 2009 that were excluded from the assessment of the effectiveness of our fair value hedges.
The following table presents the effect and financial statement location of our derivative instruments in cash flow hedging relationships on our accumulated other comprehensive income (loss) and consolidated statements of income for the year ended December 31, 2009 (in thousands):
| Derivatives |
Unrealized Gain (Loss) Recorded in Accumulated Other Comprehensive Income (Loss) (Effective Portion) |
Location of Realized Gain (Loss) (Effective Portion) |
Realized Gain (Loss) (Effective Portion) |
Location of Realized Gain (Loss) (Ineffective Portion and Amount Excluded from Effectiveness Testing) |
Realized Gain (Loss) (Ineffective Portion and Amount Excluded from Effectiveness Testing) | ||||||||||
| Foreign exchange contracts |
$ | (39 | ) | Revenue | $ | (38 | ) | Revenue | $ | — | |||||
| Foreign exchange contracts |
631 | Cost of revenue | 131 | Cost of revenue | — | ||||||||||
| Foreign exchange contracts |
1,022 | Operating expenses | 47 | Operating expenses | — | ||||||||||
| Total |
$ | 1,614 | $ | 140 | $ | — | |||||||||
In the event forecasted foreign currency cash outflows are less than the hedged amounts, a portion or all of the gains or losses recorded in accumulated other comprehensive income (loss) would be reclassified to the consolidated statement of income. During the year ended December 31, 2009, there were no amounts reclassified to the consolidated statement of income.
The following table presents the effect and financial statement location of our derivative instruments not designated as hedging instruments on our consolidated statements of income for the year ended December 31, 2009 (in thousands):
| Derivatives |
Location |
Realized and Unrealized Gain (Loss) | |||
| Commodity contracts |
Revenue | $ | 3,590 | ||
| Commodity contracts |
Cost of revenue | 2,087 | |||
| Foreign exchange contracts |
Other, net | 1,583 | |||
| Total |
$ | 7,260 | |||
We enter into derivative instrument contracts which may require us to periodically post collateral. Certain of these derivative contracts contain clauses that are similar to credit-risk-related contingent features, including material adverse change, general adequate assurance and internal credit review clauses that may require additional collateral to be posted and/or settlement of the instruments in the event an aforementioned clause is triggered. The triggering events are not a quantifiable measure; rather they are based on good faith and reasonable determination by the counterparty that the triggers have occurred. The net liability position for such contracts, the collateral posted and the amount of assets required to be posted and/or to settle the positions should a contingent feature be triggered is not significant as of December 31, 2009.
71
Table of Contents
WORLD FUEL SERVICES CORPORATION AND SUBSIDIARIES
NOTES TO THE CONSOLIDATED FINANCIAL STATEMENTS—(Continued)
5. Property and Equipment
The amount of property and equipment and their respective estimated useful lives are as follows (in thousands, except estimated useful lives):
| As of December 31, | Estimated Useful Lives | |||||||||
| 2009 | 2008 | |||||||||
| Leasehold improvements |
$ | 9,018 | $ | 7,594 | 5 - 10 years | |||||
| Office equipment, furniture and fixture |
5,269 | 3,868 | 3 - 7 years | |||||||
| Computer equipment and software costs |
49,306 | 47,352 | 3 - 9 years | |||||||
| Machinery and equipment |
5,426 | 656 | 3 - 10 years | |||||||
| 69,019 | 59,470 | |||||||||
| Accumulated depreciation and amortization |
(30,242 | ) | (24,142 | ) | ||||||
| $ | 38,777 | $ | 35,328 | |||||||
As of December 31, 2009 and 2008, computer software costs, including capitalized internally developed software costs, amounted to $23.6 million and $23.8 million, net of accumulated amortization of $11.9 million and $8.3 million, respectively. For 2009, 2008 and 2007, we recorded amortization expense related to computer software costs of $4.0 million, $4.0 million and $2.0 million, respectively.
6. Goodwill and Identifiable Intangible Assets
Goodwill
As of December 31, 2009 and 2008, goodwill was $153.8 million and $122.0 million, respectively. Based on the results of comparing the estimated fair value of our reporting units, which is the same as our reporting segments, with its carrying amount performed in accordance with the initial step of the goodwill impairment test, goodwill in each of our reporting segments was not considered impaired as of December 31, 2009 and 2008.
The following table provides changes in goodwill for each of the following years (in thousands):
| Marine Segment |
Aviation Segment |
Land Segment |
Total | |||||||||||
| At December 31, 2006 |
$ | 36,112 | $ | 8,054 | $ | 155 | $ | 44,321 | ||||||
| AVCARD acquisition |
— | 7,783 | — | 7,783 | ||||||||||
| At December 31, 2007 |
36,112 | 15,837 | 155 | 52,104 | ||||||||||
| Texor business acquisition |
— | — | 66,032 | 66,032 | ||||||||||
| Tramp Oil (Brasil) Limitada (“Brazil subsidiary”) contingent consideration adjustment |
4,480 | — | — | 4,480 | ||||||||||
| Foreign currency translation of Brazil subsidiary goodwill |
(906 | ) | — | — | (906 | ) | ||||||||
| AVCARD purchase price allocation adjustment |
— | 300 | — | 300 | ||||||||||
| At December 31, 2008 |
39,686 | 16,137 | 66,187 | 122,010 | ||||||||||
| Henty and the TGS business acquisitions |
14,051 | — | 15,803 | 29,854 | ||||||||||
| Foreign currency translation of Brazil subsidiary goodwill |
1,977 | — | — | 1,977 | ||||||||||
| At December 31, 2009 |
$ | 55,714 | $ | 16,137 | $ | 81,990 | $ | 153,841 | ||||||
72
Table of Contents
WORLD FUEL SERVICES CORPORATION AND SUBSIDIARIES
NOTES TO THE CONSOLIDATED FINANCIAL STATEMENTS—(Continued)
Identifiable Intangible Assets
The following table provides information about our identifiable intangible assets for each of the following years (in thousands):
| As of December 31, 2009 | As of December 31, 2008 | |||||||||||||||||||
| Gross Carrying Amount |
Accumulated Amortization |
Net | Gross Carrying Amount |
Accumulated Amortization |
Net | |||||||||||||||
| Intangible assets subject to amortization: |
||||||||||||||||||||
| Customer relationships |
$ | 62,362 | $ | (16,812 | ) | $ | 45,550 | $ | 44,240 | $ | (10,157 | ) | $ | 34,083 | ||||||
| Supplier agreements |
19,300 | (1,473 | ) | 17,827 | 16,800 | (649 | ) | 16,151 | ||||||||||||
| Non-compete agreements |
3,910 | (1,809 | ) | 2,101 | 3,300 | (1,063 | ) | 2,237 | ||||||||||||
| Others |
787 | (188 | ) | 599 | 787 | (69 | ) | 718 | ||||||||||||
| 86,359 | (20,282 | ) | 66,077 | 65,127 | (11,938 | ) | 53,189 | |||||||||||||
| Intangible assets not subject to amortization: |
||||||||||||||||||||
| Trademark/trade name rights |
6,728 | — | 6,728 | 6,000 | — | 6,000 | ||||||||||||||
| $ | 93,087 | $ | (20,282 | ) | $ | 72,805 | $ | 71,127 | $ | (11,938 | ) | $ | 59,189 | |||||||
Intangible amortization expense for 2009, 2008 and 2007 was $8.3 million, $5.6 million and $1.4 million, respectively. The future estimated amortization of our identifiable intangible assets is as follows (in thousands):
| Year Ended December 31, |
|||
| 2010 |
$ | 7,931 | |
| 2011 |
6,291 | ||
| 2012 |
5,355 | ||
| 2013 |
4,662 | ||
| 2014 |
4,246 | ||
| Thereafter |
37,592 | ||
| $ | 66,077 | ||
7. Debt
We have an unsecured senior revolving credit facility (the “Credit Facility”) which permits borrowings of up to $475.0 million with a sublimit of $125.0 million for the issuance of letters of credit and bankers’ acceptances. Under the Credit Facility we have the right to request increases in available borrowings up to an additional $75.0 million, subject to the satisfaction of certain conditions. We had no outstanding borrowings under our Credit Facility at December 31, 2009. Our issued letters of credit under the Credit Facility totaled $47.3 million at December 31, 2009. No bankers’ acceptances had been issued under our Credit Facility at December 31, 2009. We had $427.7 million of availability under our Credit Facility at December 31, 2009. The Credit Facility expires on December 21, 2012.
Borrowings under our Credit Facility bear interest at market rates plus applicable margins ranging from 0% to 1.5% for U.S. Prime Rate loans and 1.00% to 2.50% for LIBOR Rate loans. The unused portion of our Credit Facility is subject to fees (“Commitment Fees”) ranging from 0.20% to 0.375%. Letters of credit issued under our Credit Facility are subject to fees (“L/C Fees”) ranging from 1.00% to 2.50%. Interest, Commitment Fees and L/C Fees are payable quarterly and at maturity in arrears. As of December 31, 2009, our Commitment Fees and L/C Fees rates were 0.20% and 1.00%, respectively.
73
Table of Contents
WORLD FUEL SERVICES CORPORATION AND SUBSIDIARIES
NOTES TO THE CONSOLIDATED FINANCIAL STATEMENTS—(Continued)
Our Credit Facility contains certain operating and financial covenants with which we are required to comply. Our failure to comply with the operating and financial covenants contained in our Credit Facility could result in an event of default. An event of default, if not cured or waived, would permit acceleration of any outstanding indebtedness under the Credit Facility, trigger cross-defaults under other agreements to which we are a party and impair our ability to obtain working capital advances and letters of credit, which would have a material adverse effect on our business, financial condition and results of operations.
Outside of our Credit Facility we have unsecured credit lines aggregating to $50.0 million for the issuance of letters of credit and bank guarantees. Letters of credit and bank guarantees issued under these credit lines are subject to fees at market rates payable semiannually and at maturity in arrears. These credit lines are renewable on an annual basis. As of December 31, 2009, our outstanding letters of credit and bank guarantees under these credit lines totaled $20.2 million.
Additionally, we have a separate $15.0 million credit facility for the issuance of bankers’ acceptances (the “BA Facility”) with one of the banks participating in our Credit Facility. The BA Facility will remain in full force and effect until revoked by us or the bank. Bankers’ acceptances issued under the BA Facility are subject to commissions and fees (finance charges) at the bank’s prevailing rate on the date of acceptance. We had no outstanding borrowings under our BA Facility at December 31, 2009.
Substantially all of the letters of credit and bank guarantees issued under our Credit Facility and the unsecured credit lines were provided to suppliers in the normal course of business and generally expire within one year of issuance. Expired letters of credit and bank guarantees are renewed as needed.
Our debt consisted of the following (in thousands):
| As of December 31, | ||||||
| 2009 | 2008 | |||||
| Banker’s acceptances (principal and interest) |
$ | — | $ | 14,670 | ||
| Acquisition promissory notes, payable in varying amounts from June 2010 to April 2014, bearing interest at annual rates of 4.0% as of December 31, 2009 |
13,593 | 18,295 | ||||
| Loans payable to noncontrolling shareholders of a subsidiary, payable in varying amounts from April 2011 to December 2011, bearing interest at annual rates ranging from 3.7% to 6.7% as of December 31, 2009 |
3,011 | 53 | ||||
| Other |
5 | 359 | ||||
| Total debt |
16,609 | 33,377 | ||||
| Short-term debt |
6,684 | 23,840 | ||||
| Long-term debt |
$ | 9,925 | $ | 9,537 | ||
74
Table of Contents
WORLD FUEL SERVICES CORPORATION AND SUBSIDIARIES
NOTES TO THE CONSOLIDATED FINANCIAL STATEMENTS—(Continued)
As of December 31, 2009, the aggregate annual maturities of debt are as follows (in thousands):
| Year Ended December 31, |
|||
| 2010 |
$ | 6,684 | |
| 2011 |
6,832 | ||
| 2012 |
1,389 | ||
| 2013 |
852 | ||
| 2014 |
852 | ||
| $ | 16,609 | ||
The following table provides additional information about our interest, net (in thousands):
| 2009 | 2008 | 2007 | ||||||||||
| Interest income |
$ | 1,216 | $ | 1,886 | $ | 5,030 | ||||||
| Interest expense and other financing costs |
(4,879 | ) | (10,341 | ) | (1,919 | ) | ||||||
| $ | (3,663 | ) | $ | (8,455 | ) | $ | 3,111 | |||||
8. Shareholders’ Equity
Dividends
We declared cash dividends of $0.15 per share for 2009 and $0.075 per share for 2008 and 2007. Our Credit Facility restricts the payment of cash dividends to a maximum of 50% of our net income for the four quarters preceding the date of the dividend. The payments of the above dividends were in compliance with the Credit Facility.
Stock Repurchase Programs
Our Board of Directors, from time to time, has authorized stock repurchase programs under the terms of which we may repurchase our common stock, subject to certain restrictions contained in our Credit Facility. We did not repurchase any shares of common stock under any stock repurchase program in 2009, 2008 or 2007. As of December 31, 2009, we have $50.0 million available to repurchase shares under our share repurchase program.
Non-Employee Director Stock Deferral Plan
We adopted the 2003 Stock Deferral Plan for Non-Employee Directors (the “Stock Deferral Plan”) to provide for deferral of stock grants. Under the Stock Deferral Plan, each non-employee director could elect to have any annual stock grants paid in stock units, in lieu of stock, with each stock unit being equivalent to one share of our common stock and deferred as provided in the Stock Deferral Plan. As of each cash dividend payment date with respect to our common stock, each participant in the Stock Deferral Plan has credited to his or her account, as maintained by us, a number of stock units equal to the quotient obtained by dividing: (a) the product of (i) the cash dividend payable with respect to each share of common stock on such date and (ii) the total number of stock units credited to his or her account as of the close of business on the record date applicable to such dividend payment date by (b) the fair market value of one share of common stock on such dividend payment date. Upon the participant’s termination of service as our director for any reason, or upon a change of control, the participant will receive a number of shares of common stock equal to the number of stock units credited to his account.
75
Table of Contents
WORLD FUEL SERVICES CORPORATION AND SUBSIDIARIES
NOTES TO THE CONSOLIDATED FINANCIAL STATEMENTS—(Continued)
The estimated fair value of stock and stock units issued to non-employee directors under the Stock Deferral Plan is based on the market value of our common stock on the date of grant and recorded as non-employee director compensation expense. Outstanding stock units issued to non-employee directors under the Stock Deferral Plan are included as capital in excess of par value in shareholders’ equity. There were approximately 24,000 stock units outstanding as of December 31, 2009 and 2008. The aggregate carrying value of the outstanding stock units was $0.2 million at December 31, 2009 and 2008, which is included in capital in excess of par value in the accompanying consolidated balance sheets.
Share-Based Payment Plans
Plan Summary and Description
In 1994, our shareholders approved the 1993 Non-Employee Directors Stock Option Plan, as amended (the “1993 Plan,”) which was replaced by the 2006 Omnibus Plan, as amended (the “2006 Plan”). As of December 31, 2009, there were 40,000 Option Awards outstanding under the 1993 Plan, and these Option Awards will expire on June 2010. The 1993 Plan will remain in effect so long as there are outstanding stock options which have not been exercised and, accordingly, the outstanding Options Awards continue to be governed by the 1993 Plan.
In 1997, our shareholders approved the 1996 Employee Stock Option Plan, as amended (the “1996 Plan”). The 1996 Plan was replaced by the 2001 Omnibus Plan, as amended (the “2001 Plan”), as amended. As of December 31, 2009, there were 94,000 Option Awards outstanding under the 1996 Plan, and these Option Awards will expire on October 2011. The 1996 Plan will remain in effect so long as there are outstanding Option Awards which have not been exercised and, accordingly, the outstanding Option Awards continue to be governed by the 1996 Plan.
In 2001, our shareholders approved the 2001 Plan. The 2001 Plan was replaced by the 2006 Plan. As of December 31, 2009, there were 526,000 Option Awards outstanding under the 2001 Plan. As of December 31, 2009, the outstanding Option Awards will expire between June 2010 and March 2011. The 2001 Plan will remain in effect so long as there are outstanding Option Awards which have not been exercised or outstanding restricted stock which have not vested and, accordingly, such outstanding awards continue to be governed by the 2001 Plan.
In June 2006, our shareholders approved the 2006 Plan. The 2006 Plan is administered by the Compensation Committee of the Board of Directors (the “Compensation Committee”). The purpose of the 2006 Plan is to (i) attract and retain persons eligible to participate in the 2006 Plan; (ii) motivate participants, by means of appropriate incentives, to achieve long-range goals; (iii) provide incentive compensation opportunities that are competitive with those of other similar companies; and (iv) further align participants’ interests with those of World Fuel’s other shareholders through compensation that is based on the value of our common stock. The goal is to promote the long-term financial interest of World Fuel and its subsidiaries, including the growth in value of our equity and enhancement of long-term shareholder return. The persons eligible to receive awards under the 2006 Plan are our employees, officers, and members of the Board of Directors, or any consultant or other person who performs services for us.
The provisions of the 2006 Plan authorize the grant of stock options which can be “qualified” or “nonqualified” under the Internal Revenue Code of 1986, as amended, stock appreciation rights, restricted stock, RSUs, other share-based awards, performance shares and performance units. The 2006 Plan is unlimited in duration and, in the event of its termination, the 2006 Plan will remain in effect as long as any of the above
76
Table of Contents
WORLD FUEL SERVICES CORPORATION AND SUBSIDIARIES
NOTES TO THE CONSOLIDATED FINANCIAL STATEMENTS—(Continued)
awards are outstanding. No awards may be granted under the 2006 Plan after June 2016. The term and vesting period of awards granted under the 2006 Plan are established on a per grant basis, but options or stock appreciation rights may not remain exercisable after the seven-year anniversary of the date of grant.
In 2009, our shareholders approved an increase to the number of shares of common stock authorized for issuance pursuant to the 2006 Plan by 1,900,000 shares for a total of 4,900,000 shares. Additional shares of common stock that may be granted under the 2006 Plan include any shares that were available for future grant under any of our prior stock plans, and any stock or stock options granted under the 2006 Plan or any prior plans that are forfeited, expired or canceled. Furthermore, any shares purchased by us from employees to satisfy the Option Award exercise prices and/or withholding taxes due upon vesting of restricted stock or RSUs and exercise of Option Awards are added to the maximum number of shares that may be issued under the 2006 Plan. As of December 31, 2009, the aggregate number of shares of common stock which may be issued under the 2006 Plan was approximately 4,372,000. As of December 31, 2009, there were 1,401,000 Option Awards, 359,000 restricted stock and 901,000 RSUs outstanding and/or unvested under the 2006 Plan. As of December 31, 2009, the outstanding Option Awards will expire between June 2011 and December 2015, unvested restricted stock will vest between March 2010 and March 2013 and unvested RSUs will vest between March 2010 and December 2015. RSUs granted to non-employee directors under the 2006 Plan will vest equally on a monthly basis over a one year period. Once vested, the RSUs will remain outstanding until the date that the non-employee director to whom they were granted ceases, for any reason, to be a member of the Board of Directors.
The following table summarizes the outstanding awards issued pursuant to the plans described above as of December 31, 2009 and the remaining shares of common stock available for future issuance (in thousands):
| Plan name |
Option Awards |
Restricted Stock |
RSUs | Remaining shares of common stock available for future issuance | ||||
| 2006 Plan |
1,401 | 359 | 901 | 4,404 | ||||
| 2001 Plan |
526 | 60 | — | — | ||||
| 1996 Plan |
94 | — | — | — | ||||
| 1993 Plan |
40 | — | — | — | ||||
| 2,061 | 419 | 901 | 4,404 | |||||
77
Table of Contents
WORLD FUEL SERVICES CORPORATION AND SUBSIDIARIES
NOTES TO THE CONSOLIDATED FINANCIAL STATEMENTS—(Continued)
Options Awards
The following table summarizes the status of our outstanding and exercisable Option Awards and related transactions for each of the following years (in thousands, except weighted average exercise price and weighted average remaining contractual life data):
| Option Awards Outstanding | Option Awards Exercisable | ||||||||||||||||||||
| Options Awards |
Weighted Average Exercise Price |
Aggregate Intrinsic Value |
Weighted Average Remaining Contractual Life (in Years) |
Options Awards |
Weighted Average Exercise Price |
Aggregate Intrinsic Value |
Weighted Average Remaining Contractual Life (in Years) | ||||||||||||||
| At December 31, 2006 |
4,502 | $ | 12.46 | $ | 44,340 | 3.1 | 1,950 | $ | 6.77 | $ | 30,331 | 1.9 | |||||||||
| Granted |
86 | 21.04 | |||||||||||||||||||
| Exercised |
(164 | ) | 5.86 | ||||||||||||||||||
| Forfeited |
(16 | ) | 20.10 | ||||||||||||||||||
| At December 31, 2007 |
4,408 | 12.85 | 15,297 | 2.2 | 2,306 | 8.31 | 14,578 | 1.2 | |||||||||||||
| Granted |
736 | 13.42 | |||||||||||||||||||
| Exercised |
(1,349 | ) | 6.90 | ||||||||||||||||||
| Forfeited |
(6 | ) | 21.10 | ||||||||||||||||||
| At December 31, 2008 |
3,789 | 15.06 | 16,654 | 2.4 | 1,168 | 11.02 | 9,772 | 1.3 | |||||||||||||
| Granted |
48 | 21.78 | |||||||||||||||||||
| Exercised |
(1,759 | ) | 13.27 | ||||||||||||||||||
| Forfeited |
(17 | ) | 21.22 | ||||||||||||||||||
| At December 31, 2009 |
2,061 | $ | 16.70 | $ | 20,914 | 2.1 | 1,419 | $ | 17.62 | $ | 13,109 | 1.6 | |||||||||
As discussed in Note 1, we currently use the Black-Scholes option pricing model to estimate the fair value of Option Awards granted to employees and non-employee directors. The aggregate intrinsic value of Option Awards exercised during 2009, 2008 and 2007 was $16.1 million, $7.1 million and $2.4 million, respectively, based on the difference between the average of the high and low market price of our common stock at the exercise date and the Option Award exercise price.
The weighted average fair value of the Option Awards and the assumptions used to determine such fair value for each of the following years are as follows:
| 2009 | 2008 | 2007 | ||||||||||
| Weighted average fair value of Option Awards |
$ | 9.33 | $ | 4.05 | $ | 6.67 | ||||||
| Expected term (in years) |
4.0 | 4.0 | 3.2 | |||||||||
| Volatility |
58.9 | % | 41.3 | % | 38.5 | % | ||||||
| Dividend yields |
0.7 | % | 0.6 | % | 0.3 | % | ||||||
| Risk-free interest rates |
1.9 | % | 2.3 | % | 4.8 | % | ||||||
78
Table of Contents
WORLD FUEL SERVICES CORPORATION AND SUBSIDIARIES
NOTES TO THE CONSOLIDATED FINANCIAL STATEMENTS—(Continued)
Restricted Stock Awards
The following table summarizes the status of our unvested restricted stock outstanding and related transactions for each of the following years (in thousands, except weighted average grant-date fair value price and weighted average remaining vesting term data):
| Unvested Restricted Stock Outstanding | |||||||||||
| Unvested Restricted Stock |
Weighted Average Grant-date Fair Value Price |
Aggregate Intrinsic Value |
Weighted Average Remaining Vesting Term (in Years) | ||||||||
| At December 31, 2006 |
1,084 | $ | 13.20 | $ | 24,097 | 2.1 | |||||
| Granted |
216 | 19.12 | |||||||||
| Vested |
(444 | ) | 8.15 | ||||||||
| Forfeited |
(108 | ) | 18.26 | ||||||||
| At December 31, 2007 |
748 | 17.35 | 10,825 | 2.8 | |||||||
| Vested |
(115 | ) | 12.35 | ||||||||
| Forfeited |
(22 | ) | 17.48 | ||||||||
| At December 31, 2008 |
611 | 18.73 | 11,427 | 2.2 | |||||||
| Vested |
(135 | ) | 12.43 | ||||||||
| Forfeited |
(57 | ) | 19.12 | ||||||||
| At December 31, 2009 |
419 | $ | 20.88 | $ | 11,245 | 1.7 | |||||
The aggregate value of restricted stock which vested during 2009, 2008 and 2007 was $3.6 million, $1.6 million and $9.6 million, respectively, based on the average high and low market price of our common stock at the vesting date.
RSU Awards
The following table summarizes the status of our RSUs and related transactions for each of the following years (in thousands, except for weighted average grant-date fair value data and weighted average remaining contractual life):
| RSUs Outstanding | RSUs Exercisable | ||||||||||||||||||
| RSUs | Weighted Average Grant-date Fair Value |
Aggregate Intrinsic Value |
Weighted Average Remaining Contractual Life (in Years) |
RSUs | Weighted Average Grant-date Fair Value |
Aggregate Intrinsic Value | |||||||||||||
| At December 31, 2006 |
21 | $ | 21.23 | $ | 467 | — | 10 | $ | 21.23 | $ | 233 | ||||||||
| Granted |
16 | 20.35 | |||||||||||||||||
| Exercised |
(6 | ) | 21.23 | ||||||||||||||||
| At December 31, 2007 |
31 | 20.75 | 473 | — | 26 | 20.87 | 366 | ||||||||||||
| Granted |
258 | 12.67 | |||||||||||||||||
| Forfeited |
(4 | ) | 12.98 | ||||||||||||||||
| At December 31, 2008 |
285 | 13.59 | 5,276 | 3.6 | 48 | 17.93 | 886 | ||||||||||||
| Granted |
639 | 14.88 | |||||||||||||||||
| Exercised |
(10 | ) | 12.29 | ||||||||||||||||
| Forfeited |
(13 | ) | 13.70 | ||||||||||||||||
| At December 31, 2009 |
901 | $ | 14.52 | $ | 24,131 | 2.5 | 73 | $ | 17.11 | $ | 1,955 | ||||||||
79
Table of Contents
WORLD FUEL SERVICES CORPORATION AND SUBSIDIARIES
NOTES TO THE CONSOLIDATED FINANCIAL STATEMENTS—(Continued)
Exercisable RSUs are only held by our non-employee directors. Upon the date that the non-employee director ceases, for any reason, to be a member of the Board of Directors, shares of our common stock will be issued to satisfy these exercisable RSUs.
The weighted average grant-date fair value of the restricted stock and RSUs granted under share-based payment plans during 2009, 2008 and 2007 was $14.88 per share, $12.67 per share and $20.93 per share, respectively.
Common Stock Awards
As partial settlement of a special bonus award recorded in 2008 (see Note 10), we issued $4.5 million, or 162,338 shares, of our common stock in March 2009.
Unrecognized Compensation Cost
As of December 31, 2009, there was $11.0 million of total unrecognized compensation cost related to non-vested share-based payment awards, which is included as capital in excess of par value in the accompanying consolidated balance sheet. The unrecognized compensation cost at December 31, 2009 is expected to be recognized as compensation expense over a weighted average period of 1.2 years as follows (in thousands):
| Year Ended December 31, |
|||
| 2010 |
$ | 6,561 | |
| 2011 |
3,246 | ||
| 2012 |
975 | ||
| 2013 |
152 | ||
| 2014 |
44 | ||
| $ | 10,978 | ||
9. Income Taxes
U.S. and foreign income (loss) before income taxes consist of the following (in thousands):
| 2009 | 2008 | 2007 | |||||||||
| United States |
$ | 3,916 | $ | (1,132 | ) | $ | (919 | ) | |||
| Foreign |
145,993 | 138,707 | 87,505 | ||||||||
| $ | 149,909 | $ | 137,575 | $ | 86,586 | ||||||
80
Table of Contents
WORLD FUEL SERVICES CORPORATION AND SUBSIDIARIES
NOTES TO THE CONSOLIDATED FINANCIAL STATEMENTS—(Continued)
The income tax provision (benefit) related to income before taxes consists of the following components (in thousands):
| 2009 | 2008 | 2007 | ||||||||||
| Current: |
||||||||||||
| U.S. federal statutory tax rate |
$ | — | $ | — | $ | — | ||||||
| State |
(242 | ) | 4,004 | 2,266 | ||||||||
| Foreign |
20,897 | 22,850 | 15,139 | |||||||||
| 20,655 | 26,854 | 17,405 | ||||||||||
| Deferred: |
||||||||||||
| U.S. federal statutory tax rate |
5,126 | (4,676 | ) | (2,721 | ) | |||||||
| State |
625 | (888 | ) | (505 | ) | |||||||
| Foreign |
2,168 | 174 | 206 | |||||||||
| 7,919 | (5,390 | ) | (3,020 | ) | ||||||||
| Non-current tax expense |
3,772 | 10,906 | 6,850 | |||||||||
| Total |
$ | 32,346 | $ | 32,370 | $ | 21,235 | ||||||
The significant items included in non-current tax expense are tax expense resulting from allocating the tax benefit for stock based compensation to shareholder’s equity of $3.9 million and $3.9 million, for 2008 and 2007, respectively as well as tax expense associated with the reserve for uncertain tax positions of $3.8 million, $5.0 million and $3.0 million for 2009, 2008 and 2007, respectively.
A reconciliation of the U.S. federal statutory tax rate to our effective income tax rate is as follows:
| 2009 | 2008 | 2007 | |||||||
| U.S. federal statutory tax rate |
35.0 | % | 35.0 | % | 35.0 | % | |||
| Foreign earnings, net of foreign taxes |
(16.9 | ) | (15.4 | ) | (12.9 | ) | |||
| Foreign dividend repatriation |
— | — | — | ||||||
| State income taxes, net of U.S. federal income tax benefit |
— | 1.1 | 1.3 | ||||||
| Income tax credits |
— | — | — | ||||||
| Other permanent differences |
3.5 | 2.8 | 1.1 | ||||||
| Effective income tax rate |
21.6 | % | 23.5 | % | 24.5 | % | |||
For 2009, our effective tax rate was 21.6%, for an income tax provision of $32.3 million, as compared to an effective tax rate of 23.5% and $32.4 million for 2008. The lower effective tax rate for 2009 resulted primarily from fluctuations in the results achieved by our subsidiaries in tax jurisdictions with different tax rates.
For 2008, our effective tax rate was 23.5%, for an income tax provision of $32.4 million, as compared to an effective tax rate of 24.5% and $21.2 million for 2007. The lower effective tax rate for 2008 resulted primarily from fluctuations in the actual results achieved by our subsidiaries in tax jurisdictions with different tax rates.
U.S. income taxes have not been provided on undistributed earnings of foreign subsidiaries. As of December 31, 2009, 2008 and 2007, we had $459.0 million, $374.8 million and $244.6 million, respectively, of earnings attributable to foreign subsidiaries. Our intention is to reinvest these earnings permanently or to repatriate the earnings only when it is tax effective to do so. It is not practicable to determine the amount of U.S. income and foreign withholding tax payable in the event all such foreign earnings are repatriated.
81
Table of Contents
WORLD FUEL SERVICES CORPORATION AND SUBSIDIARIES
NOTES TO THE CONSOLIDATED FINANCIAL STATEMENTS—(Continued)
The temporary differences which comprise our net deferred income tax assets are as follows (in thousands):
| As of December 31, | ||||||||
| 2009 | 2008 | |||||||
| Excess of provision for bad debts over charge-offs |
$ | 4,721 | $ | 5,607 | ||||
| Net operating loss |
219 | 90 | ||||||
| Income tax credits |
257 | 2,556 | ||||||
| Excess of financial reporting over tax (tax over financial reporting) for depreciation of fixed assets |
(2,285 | ) | (1,410 | ) | ||||
| Excess of tax over financial reporting amortization of identifiable intangible assets and goodwill |
(9,759 | ) | (4,727 | ) | ||||
| Accrued compensation expenses recognized for financial reporting purposes, not currently deductible for tax purposes |
13,064 | 12,912 | ||||||
| Accrued expenses recognized for financial reporting purposes, not currently deductible for tax purposes |
(46 | ) | 5,686 | |||||
| 6,171 | 20,714 | |||||||
| Valuation allowance |
(257 | ) | (2,556 | ) | ||||
| Total deferred income tax assets, net |
$ | 5,914 | $ | 18,158 | ||||
| Deferred income tax assets, current |
$ | 7,291 | $ | 11,331 | ||||
| Deferred income tax liabilities, non-current |
$ | (1,377 | ) | $ | — | |||
| Deferred income tax assets, non-current |
$ | — | $ | 6,827 | ||||
In the accompanying balance sheets, the current deferred income tax assets are included in prepaid expenses and other current assets, and the non-current income tax assets are included in other assets. The income tax credit of $0.3 million and $2.6 million at December 31, 2009 and 2008, respectively, are comprised of foreign tax credit (“FTC”) carryforwards. The FTC carryforwards will begin to expire in 2016, if unused. As of and for the years ended December 31, 2009 and 2008, we recorded a valuation allowance of $0.3 million and $2.6 million, respectively, to reduce the value of FTC carryforwards to the estimated realizable amount.
As of December 31, 2009 and 2008, we had foreign net operating losses (“NOLs”) of $0.8 million and $0.3 million, respectively. The foreign NOLs have an unlimited carryforward period.
In addition, as a result of certain realization requirements of accounting guidance on stock compensation, the table of deferred tax assets and liabilities shown above does not include certain deferred tax assets at December 31, 2009 and 2008 that arose directly from tax deductions related to equity compensation in excess of compensation recognized for financial reporting. As of December 31, 2009 and 2008, we had no unrecognized U.S. federal NOLs. As of December 31, 2009 and 2008, we had FTCs of $7.9 million and $7.2 million, respectively, related to the excess stock compensation deductions that resulted in a tax deduction or credit before the realization of the tax benefit from the deduction or credit. When realized, the FTCs will result in a benefit recorded in additional paid in capital with a corresponding decrease in income tax payable. We use the “with and without” method for purposes of determining when excess tax benefits have been realized.
As of December 31, 2009, 2008 and 2007, our APIC pool of windfall tax benefits related to employee compensation was estimated to be $3.1 million, $8.5 million and $15.4 million, respectively.
We operate under a special tax concession in Singapore which is effective through 2012 and is conditional upon our meeting certain employment and investment thresholds during the effective period. If the employment
82
Table of Contents
WORLD FUEL SERVICES CORPORATION AND SUBSIDIARIES
NOTES TO THE CONSOLIDATED FINANCIAL STATEMENTS—(Continued)
and investment thresholds are not met in accordance with our agreement, the tax concession may be eliminated retroactively to the beginning of 2008. This special tax concession may be extended beyond 2012 if certain additional requirements are satisfied. The tax concession reduces the tax rate on qualified sales and the impact of this tax concession decreased foreign taxes by $6.5 million, $7.1 million and $1.9 million for 2009, 2008 and 2007, respectively. The impact of the tax concession on diluted earnings per share was $0.11 per share, $0.12 per share and $0.03 per share for 2009, 2008 and 2007, respectively.
Tax Contingencies
We recorded an increase of $6.7 million of additional liabilities for unrecognized tax benefits (“Unrecognized Tax Liabilities”) and an increase of $2.9 million of assets related to unrecognized tax benefits (“Unrecognized Tax Assets”) during 2009. In addition, during 2009, we recorded an increase of $0.5 million to our Unrecognized Tax Liabilities related to a foreign currency translation expense, which is included in other expense, net, in the accompanying consolidated statements of income. As of December 31, 2009, our Unrecognized Tax Liabilities were $37.7 million and our Unrecognized Tax Assets were $8.0 million.
We recorded an increase of $4.8 million to our Unrecognized Tax Liabilities and an increase of $0.9 million of assets related to our Unrecognized Tax Assets during 2008. In addition, during 2008, we recorded a decrease of $1.1 million to our Unrecognized Tax Liabilities related to a foreign currency translation expense, which is included in other expense, net, in the accompanying consolidated statements of income. As of December 31, 2008, our Unrecognized Tax Liabilities were $30.5 million and our Unrecognized Tax Assets were $5.1 million.
The following is a tabular reconciliation of the total amounts of unrecognized tax benefits for the year:
| 2009 | 2008 | 2007 | ||||||||||
| Unrecognized tax benefit—opening balance |
$ | 21,624 | $ | 17,886 | $ | 16,388 | ||||||
| Gross decreases—tax positions in prior period |
(275 | ) | (30 | ) | (472 | ) | ||||||
| Gross increases—tax positions in current period |
6,596 | 4,476 | 3,841 | |||||||||
| Gross decreases—tax positions in current period |
— | (62 | ) | (2,016 | ) | |||||||
| Gross increases—acquired entities |
— | — | 397 | |||||||||
| Settlements |
— | — | — | |||||||||
| Lapse of statute of limitations |
(787 | ) | (646 | ) | (252 | ) | ||||||
| Unrecognized tax benefit—ending balance |
$ | 27,158 | $ | 21,624 | $ | 17,886 | ||||||
If our uncertain tax positions as of December 31, 2009 are sustained by the taxing authorities in our favor, our income tax expense would be reduced by $19.6 million in the period the matter is considered settled in accordance with FIN 48. As of December 31, 2009, it does not appear that the total amount of our unrecognized tax benefits will significantly increase or decrease within the next 12 months.
We record accrued interest and penalties related to unrecognized tax benefits as income tax expense. Related to the uncertain tax benefits noted above, we recorded $0.8 million, $0.7 million and $1.2 million for interest and $0.8 million, $0.3 million and $0.7 for penalties, during 2009, 2008 and 2007, respectively. As of December 31, 2009 and 2008, we had recognized liabilities of $5.3 million and $4.5 million for interest and $5.2 million and $4.4 million for penalties, respectively.
83
Table of Contents
WORLD FUEL SERVICES CORPORATION AND SUBSIDIARIES
NOTES TO THE CONSOLIDATED FINANCIAL STATEMENTS—(Continued)
In many cases, our uncertain tax positions are related to tax years that remain subject to examination by the relevant tax authorities. The following table summarizes these open tax years by jurisdiction with major uncertain tax positions:
| Open Tax Year | ||||
| Jurisdiction |
Examination in progress |
Examination not yet initiated | ||
| United States |
None | 2006-2009 | ||
| Colombia |
None | 2004-2009 | ||
| Mexico |
None | 2003-2009 | ||
| Singapore |
None | 2004-2009 | ||
| United Kingdom |
None | 2006-2009 | ||
10. Commitments and Contingencies
Surety Bonds
In the normal course of business, we are required to post bid, performance and garnishment bonds. The majority of the surety bonds posted relate to our aviation segment. As of December 31, 2009 and 2008, we had outstanding bonds that were arranged in order to satisfy various security requirements of $17.7 million and $27.6 million, respectively. Most of these bonds provide financial security for obligations which have already been recorded as liabilities.
Lease Commitments
As of December 31, 2009, our future minimum lease payments under non-cancelable operating leases were as follows (in thousands):
| Year Ended December 31, |
|||
| 2010 |
6,619 | ||
| 2011 |
5,900 | ||
| 2012 |
5,128 | ||
| 2013 |
4,186 | ||
| 2014 |
3,441 | ||
| Thereafter |
7,152 | ||
| $ | 32,426 | ||
We incurred rental expense for all properties and equipment of $9.1 million, $8.8 million and $5.3 million for 2009, 2008 and 2007, respectively.
In the normal course of business, we may enter into service contracts with minimum service fee commitments for telecommunication and computer software services. As of December 31, 2009, we had $0.3 million of such commitments over the next year. All other service contracts had insignificant minimum service fee commitments.
Sales and Purchase Commitments
As of December 31, 2009, fixed sales and purchase commitments under our derivative programs amounted to $31.8 million and $19.5 million, respectively.
84
Table of Contents
WORLD FUEL SERVICES CORPORATION AND SUBSIDIARIES
NOTES TO THE CONSOLIDATED FINANCIAL STATEMENTS—(Continued)
Additionally, as of December 31, 2009, we had entered into certain other fixed price purchase commitments with corresponding fixed price sales commitments, the majority of which were satisfied within a two-week period. These purchase and sales commitments were made in the normal course of business.
Vendor and Customer Rebate and Branding Allowances
We receive rebates and branding allowances from a number of our fuel suppliers. Typically, a portion of the rebates and allowances is passed on to our customers under the same terms as required by our fuel suppliers. Many of the agreements require repayment of all or a portion of the amount received if we (or our customers, typically branded dealers in our land segment) elect to discontinue selling the specified brand of fuel at certain locations. As of December 31, 2009, the estimated amount of fuel rebates and branding allowances that would have to be repaid upon de-branding at these locations was $19.8 million. Of this amount, $17.2 million would be due to us from the branded dealers under similar agreements between us and such dealers. No liability is recorded for the amount of obligations which would become payable upon debranding.
Agreements with Executive Officers and Key Employees
In March 2008, we entered into new agreements with both our Chairman and Chief Executive Officer (“CEO”) and President and Chief Operating Officer (“COO”) containing identical terms, which, among other things, provide for such base salary, incentives and other compensation and amounts as our Compensation Committee may determine from time to time in its sole discretion and certain termination severance benefits. The CEO and COO agreements expire four years from the execution date, unless terminated earlier, and will automatically extend for successive one-year terms unless either party provides written notice to the other at least one year prior to the expiration of the term that such party does not want to extend the term.
Pursuant to their agreements, our CEO and COO are entitled to receive a cash severance payment if: (a) we terminate the executive’s employment without cause following a change of control or for any reason other than death, disability or cause; (b) the executive resigns for good reason (generally a reduction in his responsibilities or compensation, or a breach by us), or resigns for good reason following a change of control; or (c) either the executive elects or we elect not to extend the term of the agreement. The severance payment is equal to $5.0 million for a termination following a change of control and $3.0 million in the other scenarios described above, a portion of which will be payable two years after the termination of the executive’s employment. Upon any such termination, we will continue to provide coverage to the executive under our group insurance plans until he is no longer eligible for coverage under COBRA. Thereafter, we will reimburse the executive for the cost of obtaining private health insurance coverage for a certain period of time.
All of the executive’s outstanding Option Awards, restricted stock and RSU awards will immediately vest in each scenario described in (a), (b) and (c) above except for awards assumed or substituted by a successor company in the event of a change of control and awards with multiple annual performance conditions. Any awards assumed or substituted will vest over a two-year period following termination of the executive’s employment while awards with multiple annual performance conditions must satisfy certain other requirements in order to have their vesting terms accelerated.
The agreements also provide that in the event that any amount or benefit payable under the agreements, taken together with any amounts or benefits otherwise payable to the executive by us or any affiliated company, are subject to excise tax payments or parachute payments under Section 4999 of the Internal Revenue Code, such amounts or benefits will be reduced but only if and to the extent that the after-tax present value of such amounts or benefits as so reduced would exceed the after-tax present value received by the executive before such reduction.
85
Table of Contents
WORLD FUEL SERVICES CORPORATION AND SUBSIDIARIES
NOTES TO THE CONSOLIDATED FINANCIAL STATEMENTS—(Continued)
We have also entered into employment agreements or separation agreements with certain of our other executive officers and key employees. These agreements provide for minimum salary levels, and, in most cases, bonuses which are payable if specified performance goals are attained. Some executive officers and key employees are also entitled to severance benefits upon termination or non-renewal of their contracts under certain circumstances.
As of December 31, 2009, the approximate future minimum commitments under these agreements, excluding discretionary and performance bonuses, are as follows (in thousands):
| Year Ended December 31, |
|||
| 2010 |
$ | 6,949 | |
| 2011 |
5,936 | ||
| 2012 |
5,150 | ||
| $ | 18,035 | ||
Named Executive Officer Incentive and Special Bonus Awards
Our CEO, COO, Chief Financial Officer (“CFO”), Chief Risk and Administrative Officer (“CRAO”) and Aviation Segment President (“Aviation President”), referred to collectively in this Form 10-K as Named Executive Officers (“NEOs”), are eligible to receive annual cash incentive awards upon the achievement of certain annual performance targets as per our executive incentive plan. The 2009 and 2008 performance targets for the CEO, COO, CFO and CRAO were generally based on the growth of our net income while the 2009 and 2008 performance targets for the Aviation President were generally based on achieving certain levels of aviation net operating income. The 2007 performance targets for our NEOs were generally based on the growth of our net income.
For 2009, based on the achievement of certain performance targets, in the aggregate, our NEOs earned $2.8 million of annual cash incentive awards. For 2008, based on the achievement of the maximum performance targets, our CEO, COO, CFO and CRAO, in the aggregate, earned maximum annual cash incentive awards of $3.5 million while our Aviation President earned $0.6 million, including a discretionary bonus award of $0.2 million. In addition, as a result of our strong financial performance in 2008, the Compensation Committee of the Board of Directors made special bonus awards to our CEO, COO, CFO and CRAO aggregating $5.0 million, of which $4.5 million was settled in our common stock and $0.5 million in cash. In the aggregate, the total amount of cash incentive and special bonus awards earned by the NEOs was $9.1 million for 2008. For 2007, the minimum performance targets were not met, and the NEOs did not earn any annual cash incentive awards. However, our CFO received a guaranteed minimum annual bonus for 2007 pursuant to the terms of his employment offer letter.
Deferred Compensation Plans
We maintain long-term service programs under which certain key employees receive cash awards for long-term service. As of December 31, 2009 and 2008, our liabilities under these programs were $0.6 million and $0.4 million, respectively.
As of December 31, 2009 and 2008, deferred sales bonus of $2.1 million and $3.0 million, respectively, was accrued in deferred compensation and other long-term liabilities in the accompanying balance sheets.
We maintain a 401(k) defined contribution plan which covers all U.S. employees who meet minimum requirements and elect to participate. Participants may contribute up to 15% of their compensation, subject to
86
Table of Contents
WORLD FUEL SERVICES CORPORATION AND SUBSIDIARIES
NOTES TO THE CONSOLIDATED FINANCIAL STATEMENTS—(Continued)
certain limitations. During 2009 and 2008, we made matching contributions of 50% for each 1% of the participants’ contributions up to 6% of the participants’ contributions. During 2007, we made matching contributions of 25% for each 1% of the participants’ contributions up to 4% of the participants’ contributions. Annual contributions by us are made at our sole discretion, as approved by the Compensation Committee. We recorded expenses for our contributions of $1.0 million, $0.8 million and $0.2 million for 2009, 2008 and 2007, respectively.
Certain of our foreign subsidiaries have defined contribution plans, which allow for voluntary contributions by the employees. The foreign subsidiaries paid all general and administrative expenses of the plans and in some cases made employer contributions on behalf of the employees. We recorded expenses for our contributions of $1.0 million, $0.8 million and $0.8 million for 2009, 2008 and 2007, respectively.
Environmental and Other Liabilities; Uninsured Risks
We utilize subcontractors to provide various services to customers, including into-plane fueling at airports, fueling of vessels in-port and at-sea, and transportation and storage of fuel and fuel products. We are subject to possible claims by customers, regulators and others who may be injured by a fuel spill or other accident. In addition, we may be held liable for damages to the environment arising out of such events. Although we generally require our subcontractors to carry liability insurance, not all subcontractors carry adequate insurance. Our marine and land businesses do not have liability insurance to cover the acts or omissions of our subcontractors. None of our liability insurance covers acts of war and terrorism. If we are held responsible for any acts of war or terrorism, accident or other event, and the liability is not adequately covered by insurance and is of sufficient magnitude, our financial position and results of operations will be adversely affected.
We have exited several businesses which handled hazardous and non-hazardous waste. We treated and/or transported this waste to various disposal facilities. We may be held liable as a potentially responsible party for the clean-up of such disposal facilities or be required to clean up facilities previously operated by us, pursuant to current U.S. federal and state laws and regulation. In addition, compliance with existing and future environmental laws regulating underground storage tanks located at the retail gasoline stations that we operate may require significant capital expenditures and increased operating and maintenance costs. The remediation costs and other costs required to clean up or treat contaminated sites could be substantial. We pay tank registration fees and other taxes to state trust funds established in our operating areas and maintain private insurance coverage in support of future remediation obligations. These state trust funds or other responsible third parties including insurers are expected to pay or reimburse us for remediation expenses less a deductible. To the extent third parties do not pay for remediation as we anticipate, we will be obligated to make these payments. These payments could materially adversely affect our financial condition and results of operations. Reimbursements from state trust funds will be dependent on the maintenance and continued solvency of the various funds.
Although we continuously review the adequacy of our insurance coverage, we may lack adequate coverage for various risks, such as environmental claims. An uninsured or under-insured claim arising out of our activities, if successful and of sufficient magnitude, will have a material adverse effect on our financial position and results of operations.
Legal Matters
Miami Airport Litigation
In April 2001, Miami-Dade County, Florida (the “County”) filed suit (the “County Suit”) in the state circuit court in and for Miami-Dade County against 17 defendants to seek reimbursement for the cost of remediating environmental contamination at Miami International Airport (the “Airport”).
87
Table of Contents
WORLD FUEL SERVICES CORPORATION AND SUBSIDIARIES
NOTES TO THE CONSOLIDATED FINANCIAL STATEMENTS—(Continued)
Also in April 2001, the County sent a letter to approximately 250 potentially responsible parties (“PRP’s”), including World Fuel Services Corporation and one of our subsidiaries, advising of our potential liability for the clean-up costs of the contamination that is the subject of the County Suit. The County has threatened to add the PRP’s as defendants in the County Suit, unless they agree to share in the cost of the environmental clean-up at the Airport. We have advised the County that: (i) neither we nor any of our subsidiaries were responsible for any environmental contamination at the Airport, and (ii) to the extent that we or any of our subsidiaries were so responsible, our liability was subject to indemnification by the County pursuant to the indemnity provisions contained in our lease agreement with the County.
If we are added as a defendant in the County Suit, we would vigorously defend any claims, and we believe our liability in these matters (if any) should be adequately covered by the indemnification obligations of the County.
Panama Litigation
In July 2005, Atlantic Service Supply, S.A. (“Atlantic”), a Panamanian fuel barge operator, filed suit against Tramp Oil & Marine Limited (“TOM”), one of our subsidiaries, alleging that TOM is jointly and severally liable for barging fees of $1.0 million owed to Atlantic by Isthmian Petroleum Supply & Services, S.A. (“Isthmian”). In July 2007, the court ruled against Atlantic, finding that TOM was not liable for any barging fees owed to Atlantic by Isthmian. Isthmian has appealed this ruling. TOM and Isthmian were parties to an agreement pursuant to which Isthmian provided storage, delivery and other fuel-related services to TOM in Panama. In its suit, Atlantic alleges (i) Isthmian breached a barge charter agreement entered into between the two parties, (ii) Isthmian entered into the agreement as an agent on behalf of TOM, and (iii) TOM is liable, as a principal, for Isthmian’s breach of the agreement. We believe this suit is without merit and we intend to vigorously defend the action.
In August 2005, TOM filed a lawsuit against Isthmian seeking damages of $3.1 million for breach of contract and wrongful conversion of fuel owned by TOM. In September 2005, Isthmian filed a counterclaim against TOM alleging that TOM is in breach of contract and seeking $5.0 million in damages. These actions are pending in a Panamanian maritime court. We believe Isthmian’s suit against TOM is without merit and we intend to vigorously defend the action.
Brendan Airways Litigation
One of our subsidiaries, World Fuel Services, Inc. (“WFSI”), is involved in a dispute with Brendan Airways, LLC (“Brendan”), an aviation fuel customer, with respect to certain amounts Brendan claims to have been overcharged in connection with fuel sale transactions from 2003 to 2006. In August 2007, WFSI filed an action in the state circuit court in and for Miami-Dade County, Florida, seeking declaratory relief with respect to the matters disputed by Brendan. In October 2007, Brendan filed a counterclaim against WFSI. In February 2008, the court dismissed WFSI’s declaratory action. Brendan’s counterclaim remains pending as a separate lawsuit against WFSI, and Brendan is seeking $3.5 million in damages in its pending action. In October 2009, Brendan filed a motion with the court seeking, among other things, leave to file a third amended complaint to add various additional claims, including a claim under the Florida Racketeer Influenced and Corrupt Organizations (“RICO”) Act, and claims for civil conspiracy, promissory estoppel and constructive fraud. In January 2010, the court ruled that Brendan may not amend the complaint to assert claims for violation of Florida’s RICO Act or for civil conspiracy. We believe Brendan’s claims are without merit and we intend to vigorously defend all of Brendan’s claims.
88
Table of Contents
WORLD FUEL SERVICES CORPORATION AND SUBSIDIARIES
NOTES TO THE CONSOLIDATED FINANCIAL STATEMENTS—(Continued)
TransContinental Litigation
In April 2009, Soneet Kapila (the “Plaintiff”), as Chapter 11 Trustee for Louis Pearlman, TransContinental Airlines, Inc., and Louis J. Pearlman Enterprises, Inc. (collectively, the “Debtors”), filed a complaint in the United States Bankruptcy Court for the Middle District of Florida against WFSI seeking $0.5 million in damages, representing payments made by the Debtors for the benefit of Planet Aviation, Inc., a WFSI customer, for which the Debtors claim they received no consideration. In June 2009, the Plaintiff, as Chapter 11 Trustee for TransContinental Aviation, Inc. (“TCA”), filed a complaint in the United States Bankruptcy Court for the Middle District of Florida against WFSI seeking $1.3 million in damages, representing payments made by TCA for which TCA claims it did not receive adequate value. We believe the claims asserted are without merit and we intend to vigorously defend these claims.
Other Matters
As of December 31, 2009, we had recorded certain reserves related to the proceedings described above which were not significant. Because the outcome of litigation is inherently uncertain, we may not prevail in these proceedings and we cannot estimate our ultimate exposure in such proceedings if we do not prevail. Accordingly, a ruling against us in any of the above proceedings could have a material adverse effect on our financial condition, results of operations or cash flows.
In addition to the matters described above, we are involved in litigation and administrative proceedings primarily arising in the normal course of our business. In the opinion of management, except as set forth above, our liability, if any, under any other pending litigation or administrative proceedings, even if determined adversely, would not materially affect our financial condition, results of operations or cash flows.
89
Table of Contents
WORLD FUEL SERVICES CORPORATION AND SUBSIDIARIES
NOTES TO THE CONSOLIDATED FINANCIAL STATEMENTS—(Continued)
11. Fair Value Measurements for Financial Assets and Liabilities
In connection with the adoption of the new accounting standard for fair value measurements on January 1, 2008, we recorded a cumulative adjustment to retained earnings of $2.5 million, net of $0.3 million in income tax, related to the deferred gains of certain derivative transactions. Accordingly, the revenue and gross profit related to these transactions were not recognized in our consolidated statements of income when these transactions were settled primarily in 2008.
The following table presents information about our assets and liabilities that are measured at fair value on a recurring basis as of December 31, 2009 and 2008, respectively (in thousands):
| Level 1 | Level 2 | Level 3 | Sub-Total | Netting and Collateral |
Total | ||||||||||||||
| 2009 |
|||||||||||||||||||
| Assets: |
|||||||||||||||||||
| Cash equivalents |
$ | 106 | $ | — | $ | — | $ | 106 | $ | — | $ | 106 | |||||||
| Derivatives |
191 | 14,153 | 4 | 14,348 | (2,326 | ) | 12,022 | ||||||||||||
| Hedged item inventories |
— | 5,575 | — | 5,575 | (7 | ) | 5,568 | ||||||||||||
| Hedged item commitments |
— | 407 | — | 407 | (3 | ) | 404 | ||||||||||||
| Total |
$ | 297 | $ | 20,135 | $ | 4 | $ | 20,436 | $ | (2,336 | ) | $ | 18,000 | ||||||
| Liabilities: |
|||||||||||||||||||
| Derivatives |
$ | 2,944 | $ | 11,710 | $ | 158 | $ | 14,812 | $ | (5,554 | ) | $ | 9,258 | ||||||
| Hedged item inventories |
— | 7 | — | 7 | (7 | ) | — | ||||||||||||
| Hedged item commitments |
— | 1,486 | — | 1,486 | (3 | ) | 1,483 | ||||||||||||
| Earn-out |
— | — | 6,728 | 6,728 | — | 6,728 | |||||||||||||
| Total |
$ | 2,944 | $ | 13,203 | $ | 6,886 | $ | 23,033 | $ | (5,564 | ) | $ | 17,469 | ||||||
| 2008 |
|||||||||||||||||||
| Assets: |
|||||||||||||||||||
| Derivatives |
$ | 6 | $ | 292,138 | $ | 40 | $ | 292,184 | $ | (222,100 | ) | $ | 70,084 | ||||||
| Hedged item inventories |
— | 781 | — | 781 | — | 781 | |||||||||||||
| Hedged item commitments |
— | 2,233 | — | 2,233 | (57 | ) | 2,176 | ||||||||||||
| Total |
$ | 6 | $ | 295,152 | $ | 40 | $ | 295,198 | $ | (222,157 | ) | $ | 73,041 | ||||||
| Liabilities: |
|||||||||||||||||||
| Derivatives |
$ | 357 | $ | 277,259 | $ | 6,478 | $ | 284,094 | $ | (228,761 | ) | $ | 55,333 | ||||||
| Hedged item inventories |
— | 1,637 | — | 1,637 | — | 1,637 | |||||||||||||
| Hedged item commitments |
— | 10,728 | 298 | 11,026 | (57 | ) | 10,969 | ||||||||||||
| Total |
$ | 357 | $ | 289,624 | $ | 6,776 | $ | 296,757 | $ | (228,818 | ) | $ | 67,939 | ||||||
For our derivatives related contracts, we may enter into master netting, collateral and offset agreements with counterparties. These agreements provide us the ability to offset a counterparty’s rights and obligations, request additional collateral when necessary or liquidate the collateral in the event of counterparty default. We net fair value of cash collateral paid or received against fair value amounts recognized for net derivative related positions executed with the same counterparty under the same master netting or offset agreement.
The amounts for each of the fair value levels as of December 31, 2008 shown above have been presented on a gross basis, and all netting of such amounts are included in the netting and collateral column. The data as
90
Table of Contents
WORLD FUEL SERVICES CORPORATION AND SUBSIDIARIES
NOTES TO THE CONSOLIDATED FINANCIAL STATEMENTS—(Continued)
previously presented in our 2008 10-K Report included some netting within the level information. The information has been amended herein to be consistent with the 2009 presentation in order to improve comparability to the newly required information in accordance with the first quarter adoption of accounting guidance designed to enhance disclosures for derivative instruments and hedging activities.
There were no amounts recognized for the obligation to return cash collateral that has been offset against fair value assets included within netting and collateral in the above table. The amounts recognized as of December 31, 2008 was $50.0 million. The amount recognized for the right to reclaim cash collateral that has been offset against fair value liabilities included within netting and collateral in the table above was $3.2 million and $56.0 million as of December 31, 2009 and 2008, respectively.
The following table presents information about our assets and liabilities that are measured at fair value on a recurring basis that utilized Level 3 inputs for 2009 and 2008, respectively, (in thousands):
| Realized and Unrealized Gains (Losses) |
Purchases, Sales, Contingent Consideration, Other Settlements and Issuances, net |
Transfers in and/or out of Level 3 |
Change in Unrealized Gains (Losses) Relating to Instruments Still Held at end of Period |
||||||||||||
| 2009 |
|||||||||||||||
| Assets: |
|||||||||||||||
| Derivatives |
$ | 2,387 | $ | (2,423 | ) | $ | — | $ | 4 | ||||||
| Total |
$ | 2,387 | $ | (2,423 | ) | $ | — | $ | 4 | ||||||
| Liabilities: |
|||||||||||||||
| Derivatives |
$ | (2,879 | ) | $ | (9,199 | ) | $ | — | $ | (158 | ) | ||||
| Hedged item commitments |
— | (298 | ) | — | — | ||||||||||
| Earn-out |
(551 | ) | 6,177 | — | (551 | ) | |||||||||
| Total |
$ | (3,430 | ) | $ | (3,320 | ) | $ | — | $ | (709 | ) | ||||
| 2008 |
|||||||||||||||
| Assets: |
|||||||||||||||
| Derivatives |
$ | 1,903 | $ | (1,863 | ) | $ | — | $ | — | ||||||
| Hedged item commitments |
(7,960 | ) | (9,143 | ) | 17,103 | — | |||||||||
| Total |
$ | (6,057 | ) | $ | (11,006 | ) | $ | 17,103 | $ | — | |||||
| Liabilities: |
|||||||||||||||
| Derivatives |
$ | (8,784 | ) | $ | (2,306 | ) | $ | — | $ | — | |||||
| Hedged item commitments |
(994 | ) | (696 | ) | — | — | |||||||||
| Total |
$ | (9,778 | ) | $ | (3,002 | ) | $ | — | $ | — | |||||
The unrealized loss on the Earn-out shown in the above table represents foreign currency losses recorded during 2009 for changes between the acquisition date exchange rate and the month-end exchange rate at December 31, 2009. This amount does not include the offset to the foreign currency losses as a result of foreign currency hedges executed during 2009 related to this exposure.
91
Table of Contents
WORLD FUEL SERVICES CORPORATION AND SUBSIDIARIES
NOTES TO THE CONSOLIDATED FINANCIAL STATEMENTS—(Continued)
12. Business Segments, Geographic Information, and Major Customers
Business Segments
Based on the nature of operations and quantitative thresholds pursuant to the accounting guidance on segment reporting, we have three reportable operating business segments: marine, aviation and land. Corporate expenses are allocated to the segments based on usage, where possible, or on other factors according to the nature of the activity. The results of operations and related assets and liabilities of our acquisition of Henty are included in our marine and land segment and in our marine segment for the TGS business since April 1, 2009. The results of operations and related assets and liabilities of our acquisition of the Texor business are included in our land segment since June 1, 2008. The results of operations and related assets and liabilities of our AVCARD acquisition are included in our aviation segment since December 1, 2007. The accounting policies of the reportable operating segments are the same as those described in the Summary of Significant Accounting Policies (see Note 1).
Information concerning our revenue, income from operations, depreciation and amortization and capital expenditures by segment is as follows (in thousands):
| For the Year ended December 31, | ||||||||||||
| 2009 | 2008 | 2007 | ||||||||||
| Revenue: |
||||||||||||
| Marine segment |
$ | 6,040,643 | $ | 9,915,291 | $ | 7,665,801 | ||||||
| Aviation segment |
4,049,565 | 7,294,466 | 5,460,838 | |||||||||
| Land segment |
1,204,969 | 1,299,646 | 602,916 | |||||||||
| $ | 11,295,177 | $ | 18,509,403 | $ | 13,729,555 | |||||||
| Gross profit |
||||||||||||
| Marine segment |
$ | 168,890 | $ | 203,345 | $ | 114,505 | ||||||
| Aviation segment |
163,730 | 165,834 | 122,797 | |||||||||
| Land segment |
42,971 | 26,204 | 7,970 | |||||||||
| $ | 375,591 | $ | 395,383 | $ | 245,272 | |||||||
| Income from operations: |
||||||||||||
| Marine segment |
$ | 97,636 | $ | 121,818 | $ | 50,844 | ||||||
| Aviation segment |
75,462 | 68,142 | 60,796 | |||||||||
| Land segment |
10,778 | 3,489 | 1,237 | |||||||||
| 183,876 | 193,449 | 112,877 | ||||||||||
| Corporate overhead |
(29,881 | ) | (39,709 | ) | (26,989 | ) | ||||||
| $ | 153,995 | $ | 153,740 | $ | 85,888 | |||||||
| Depreciation and amortization: |
||||||||||||
| Marine segment, includes allocation from corporate |
$ | 3,288 | $ | 2,916 | $ | 2,255 | ||||||
| Aviation segment, includes allocation from corporate |
5,391 | 4,836 | 1,543 | |||||||||
| Land segment, includes allocation from corporate |
5,808 | 3,034 | 157 | |||||||||
| Corporate |
2,469 | 3,084 | 2,946 | |||||||||
| $ | 16,956 | $ | 13,870 | $ | 6,901 | |||||||
| Capital expenditures: |
||||||||||||
| Marine segment |
$ | 820 | $ | 510 | $ | 1,642 | ||||||
| Aviation segment |
585 | 985 | 1,010 | |||||||||
| Land segment |
476 | 204 | 59 | |||||||||
| Corporate |
4,612 | 4,196 | 13,726 | |||||||||
| $ | 6,493 | $ | 5,895 | $ | 16,437 | |||||||
92
Table of Contents
WORLD FUEL SERVICES CORPORATION AND SUBSIDIARIES
NOTES TO THE CONSOLIDATED FINANCIAL STATEMENTS—(Continued)
Information concerning our accounts receivable, goodwill, identifiable intangible assets, net and total assets by segment is as follows (in thousands):
| As of December 31, | ||||||
| 2009 | 2008 | |||||
| Accounts receivable, net: |
||||||
| Marine segment, net of allowance for bad debt of $ 8,415 and $8,637 at December 31, 2009 and 2008, respectively |
$ | 663,411 | $ | 444,735 | ||
| Aviation segment, net of allowance for bad debt of $7,878 and $12,020 at December 31, 2009 and 2008, respectively |
227,689 | 196,944 | ||||
| Land segment, net of allowance for bad debt of $3,397 and $2,614 at December 31, 2009 and 2008, respectively |
60,298 | 34,421 | ||||
| $ | 951,398 | $ | 676,100 | |||
| Goodwill |
||||||
| Marine segment |
$ | 55,714 | $ | 39,686 | ||
| Aviation segment |
16,137 | 16,137 | ||||
| Land segment |
81,990 | 66,187 | ||||
| $ | 153,841 | $ | 122,010 | |||
| Identifiable intangible assets, net |
||||||
| Marine segment |
$ | 10,449 | $ | 2,465 | ||
| Aviation segment |
19,679 | 21,115 | ||||
| Land segment |
42,677 | 35,609 | ||||
| $ | 72,805 | $ | 59,189 | |||
| Total assets: |
||||||
| Marine segment |
$ | 854,331 | $ | 683,124 | ||
| Aviation segment |
391,558 | 339,584 | ||||
| Land segment |
207,722 | 150,826 | ||||
| Corporate |
287,617 | 231,092 | ||||
| $ | 1,741,228 | $ | 1,404,626 | |||
93
Table of Contents
WORLD FUEL SERVICES CORPORATION AND SUBSIDIARIES
NOTES TO THE CONSOLIDATED FINANCIAL STATEMENTS—(Continued)
Geographic Information
Information concerning our revenue, income from operations, non-current and total assets, as segregated between U.S. and foreign, is presented as follows, based on the country of incorporation of the relevant subsidiary (in thousands):
| For the Year ended December 31, | ||||||||||
| 2009 | 2008 | 2007 | ||||||||
| Revenue: |
||||||||||
| United States |
$ | 5,041,821 | $ | 8,462,570 | $ | 5,790,071 | ||||
| Singapore |
3,323,898 | 5,479,164 | 4,413,900 | |||||||
| United Kingdom |
1,619,887 | 3,286,504 | 2,143,646 | |||||||
| Other foreign countries |
1,309,571 | 1,281,165 | 1,381,938 | |||||||
| Total |
$ | 11,295,177 | $ | 18,509,403 | $ | 13,729,555 | ||||
| Income (loss) from operations: |
||||||||||
| United States |
$ | 15,425 | $ | 7,789 | $ | (289 | ) | |||
| Singapore |
66,417 | 67,666 | 44,875 | |||||||
| United Kingdom |
35,699 | 41,759 | 17,265 | |||||||
| Other foreign countries |
36,454 | 36,526 | 24,037 | |||||||
| Total |
$ | 153,995 | $ | 153,740 | $ | 85,888 | ||||
| As of December 31, | ||||||||||
| 2009 | 2008 | |||||||||
| Non-current assets: |
||||||||||
| United States |
$ | 165,010 | $ | 189,911 | ||||||
| Singapore |
723 | 858 | ||||||||
| United Kingdom |
90,710 | 15,780 | ||||||||
| Other foreign countries |
20,807 | 25,927 | ||||||||
| $ | 277,250 | $ | 232,476 | |||||||
| Total assets: |
||||||||||
| United States |
$ | 595,163 | $ | 601,179 | ||||||
| Singapore |
572,254 | 377,063 | ||||||||
| United Kingdom |
382,147 | 333,085 | ||||||||
| Other foreign countries |
191,664 | 93,299 | ||||||||
| $ | 1,741,228 | $ | 1,404,626 | |||||||
Major Customers
During each of the years presented on the consolidated statements of income, none of our customers accounted for more than 10% of total consolidated revenue.
94
Table of Contents
WORLD FUEL SERVICES CORPORATION AND SUBSIDIARIES
NOTES TO THE CONSOLIDATED FINANCIAL STATEMENTS—(Continued)
13. Summary Quarterly Information (Unaudited)
The following is a summary of the unaudited quarterly results for 2009 and 2008 (in thousands, except earnings per share data):
| March 31, 2009 |
June 30, 2009 (1) |
September 30, 2009 (1) |
December 31, 2009 (1) |
||||||||||
| Revenue |
$ | 2,013,943 | $ | 2,533,340 | $ | 3,202,653 | $ | 3,545,241 | |||||
| Gross profit |
$ | 87,335 | $ | 91,568 | $ | 94,732 | $ | 101,956 | |||||
| Net income including noncontrolling interest |
$ | 25,819 | $ | 27,943 | $ | 29,097 | $ | 34,704 | |||||
| Net income attributable to World Fuel |
$ | 25,830 | $ | 27,742 | $ | 29,072 | $ | 34,495 | |||||
| Basic earnings per share (5) |
$ | 0.44 | $ | 0.47 | $ | 0.49 | $ | 0.58 | |||||
| Diluted earnings per share (5) |
$ | 0.44 | $ | 0.46 | $ | 0.48 | $ | 0.57 | |||||
| March 31, 2008 |
June 30, 2008 (2) |
September 30, 2008 (2) |
December 31, 2008 (2) |
||||||||||
| Revenue |
$ | 4,491,486 | $ | 5,651,118 | $ | 5,453,351 | $ | 2,913,448 | |||||
| Gross profit |
$ | 73,809 | $ | 94,322 | $ | 123,805 | $ | 103,447 | |||||
| Net income including noncontrolling interest |
$ | 15,895 | $ | 20,576 | $ | 40,120 | $ | 28,614 | (3)(4) | ||||
| Net income attributable to World Fuel |
$ | 15,753 | $ | 20,548 | $ | 40,085 | $ | 28,653 | (3)(4) | ||||
| Basic earnings per share |
$ | 0.28 | $ | 0.36 | $ | 0.69 | $ | 0.49 | (3)(4) | ||||
| Diluted earnings per share (5) |
$ | 0.27 | $ | 0.35 | $ | 0.68 | $ | 0.49 | (3)(4) | ||||
| (1) | Includes Henty and TGS business operations since April 1, 2009 as a result of the acquisitions. (2) Includes Texor business operations since June 1, 2008 as a result of the acquisition. |
| (3) | Includes approximately $4.1 million in pre-tax foreign currency losses that relate to prior quarterly periods in 2008, none of which were considered material individually or in the aggregate. The out-of-period after-tax amount of the net foreign currency losses was approximately $3.8 million, or $0.06 per basic and diluted share in the fourth quarter. In addition, because these amounts were all within 2008, there was no impact to the income statement for the full fiscal year. |
| (4) | Includes special awards to our CEO, COO, CFO and CRAO aggregating $5.0 million, of which $4.5 million was in the form of stock and $0.5 million in cash. The after-tax charge for the special awards aggregated to $4.3 million, or $0.07 per basic and diluted share. |
| (5) | Basic and diluted earnings per share are computed independently for each quarter and the full year based upon respective weighted average shares outstanding. Therefore, the sum of the quarterly basic and diluted earnings per share amounts may not equal the annual basic earnings per share amount reported. |
95
Table of Contents
Pursuant to the requirements of Section 13 or 15(d) of the Securities Exchange Act of 1934, the registrant has duly caused this Form 10-K to be signed on its behalf by the undersigned, thereunto duly authorized, on the 25th day of February 2010.
| WORLD FUEL SERVICES CORPORATION |
| /s/ MICHAEL J. KASBAR |
| Michael J. Kasbar Director, President and Chief Operating Officer |
Pursuant to the requirements of the Securities Exchange Act of 1934, this Form 10-K has been signed below by the following persons on behalf of the registrant and in the capacities on the 25th day of February 2010.
| Signature |
Title | |
| /s/ PAUL H. STEBBINS Paul H. Stebbins |
Chairman of the Board and Chief Executive Officer (Principal Executive Officer) | |
| /s/ MICHAEL J. KASBAR Michael J. Kasbar |
Director, President and Chief Operating Officer | |
| /s/ IRA M. BIRNS Ira M. Birns |
Executive Vice President and Chief Financial Officer (Principal Financial Officer) | |
| /s/ PAUL M. NOBEL Paul M. Nobel |
Senior Vice President and Chief Accounting Officer (Principal Accounting Officer) | |
| /s/ KEN BAKSHI Ken Bakshi |
Director | |
| /s/ JOACHIM HEEL Joachim Heel |
Director | |
| /s/ RICHARD A. KASSAR Richard A. Kassar |
Director | |
| /s/ MYLES KLEIN Myles Klein |
Director | |
| /s/ J. THOMAS PRESBY J. Thomas Presby |
Director | |
| /s/ STEPHEN K. RODDENBERRY Stephen K. Roddenberry |
Director | |