Attached files
| file | filename |
|---|---|
| 8-K - 8-K - IHS Inc. | q4-15earningsrelease.htm |
| EX-99.1 - MEDIA RELEASE - IHS Inc. | exh991q415.htm |

Q4 2015 Earnings Call Supplemental Information January 12, 2016

© 2016 IHS Safe harbor: refer to IHS.com for detailed information Forward-Looking Statements This presentation contains “forward-looking statements” within the meaning of the safe harbor provisions of the U.S. Private Securities Litigation Reform Act of 1995. Forward-looking statements can be identified by words such as: “anticipate,” “intend,” “plan,” “goal,” “seek,” “aim,” “strive,” “believe,” “project,” “predict,” "estimate," "expect," “continue,” "strategy," "future," "likely," "may," “might,” "should," "will," the negative of these terms and similar references to future periods. Examples of forward-looking statements include, among others, statements we make regarding guidance relating to net income, net income per share, and expected operating results, such as revenue growth and earnings. Forward-looking statements are neither historical facts nor assurances of future performance. Instead, they are based only on our current beliefs, expectations and assumptions regarding the future of our business, future plans and strategies, projections, anticipated events and trends, the economy and other future conditions. Because forward-looking statements relate to the future, they are subject to inherent uncertainties, risks and changes in circumstances that are difficult to predict and many of which are outside of our control. Our actual results and financial condition may differ materially from those indicated in the forward-looking statements. Therefore, you should not rely on any of these forward-looking statements. Important factors that could cause our actual results and financial condition to differ materially from those indicated in the forward-looking statements include, among others, the following: economic and financial conditions, including volatility in interest and exchange rates; our ability to manage system failures, capacity constraints, and cyber risks; our ability to successfully manage risks associated with changes in demand for our products and services as well as changes in our targeted industries; our ability to develop new platforms to deliver our products and services, pricing, and other competitive pressures, and changes in laws and regulations governing our business; the extent to which we are successful in gaining new long- term relationships with customers or retaining existing ones and the level of service failures that could lead customers to use competitors' services; our ability to successfully identify and integrate acquisitions into our existing businesses and manage risks associated therewith; our ability to satisfy our debt obligations and our other ongoing business obligations; and the other factors described under the caption “Risk Factors” in our most recent annual report on Form 10-K, along with our other filings with the U.S. Securities and Exchange Commission. Any forward-looking statement made by us in this presentation is based only on information currently available to us and speaks only as of the date on which it is made. We undertake no obligation to publicly update any forward-looking statement, whether written or oral, that may be made from time to time, whether as a result of new information, future developments or otherwise. -------------- Throughout this presentation, we refer to non-GAAP financial measures intended to supplement our financial statements that are based on U.S. generally accepted accounting principles (GAAP). Examples of non-GAAP measures include “EBITDA,” “Adjusted EBITDA,” “Free Cash Flow,” “Adjusted Free Cash Flow,” and “Adjusted EPS.” Definitions of our non-GAAP measures, as well as reconciliations of comparable GAAP measures to non-GAAP measures, are provided with the schedules to our quarterly earnings releases. Our most recent non-GAAP reconciliations were furnished as an exhibit to a Form 8-K on January 12, 2016, and are available on our website (www.ihs.com). 2

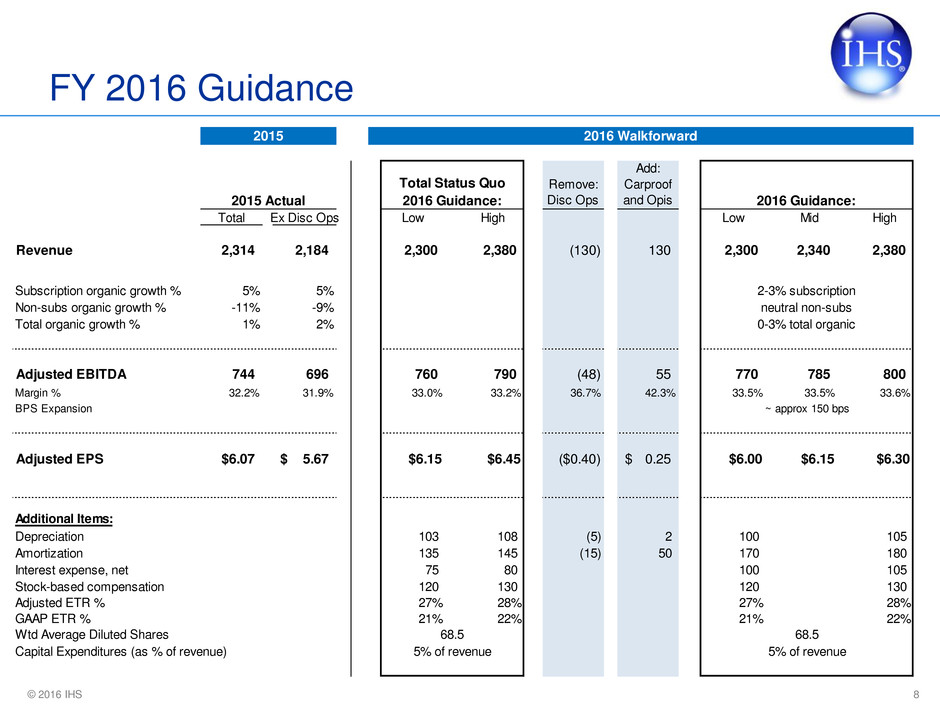
© 2016 IHS Summary • The following slides should help make clear performance against 2015 goals and help to model 2016: • Slide 4: Shows 2015 summary results both before and after Discontinued Operations • Slide 5: Shows 2015 revenue distribution by new reporting segments, by product group, EXCLUDING DiscOps • Slide 6: Quarterly revenue for 2014 and 2015 by new reporting segment and EXCLUDING DiscOps • Slide 7: Annual revenue and profit for 2013, and quarterly revenue and profit for 2014 and 2015 by new reporting segment and EXCLUDING DiscOps • Slide 8: 2016 Guidance – showing detailed impact of DiscOps and 2 recently announced acquisitions • Slides 9–10: Carproof acquisition overview • Slides 11-17: Opis acquisition overview 3 Note: The press release includes schedules that reflect both results including and results excluding discontinued operations . The segment sch dules in the fol owing slides reflect results excluding discontinued operations.

© 2016 IHS Actual Results Total and Excluding Discontinued Operations 4 Total Remove: Disc Ops Excluding Disc Ops Total Remove: Disc Ops Excluding Disc Ops Revenue 2,231 (151) 2,080 2,314 (130) 2,184 Growth % 21% 23% 4% 5% Subscription organic growth % 6% 6% 5% 5% Non-subs organic growth % -1% -2% -11% -9% Total organic growth % 4% 5% 1% 2% Adjusted EBITDA 690 (56) 634 744 (48) 696 Margin % 30.9% 30.5% 32.2% 31.9% Adjusted EPS $5.90 ($0.48) $5.42 $6.07 ($0.40) $5.67 Growth % 17% 19% 3% 5% Additional Items: Depreciation 68 (3) 65 90 (5) 85 Amortization 134 (18) 116 146 (16) 130 Interest expense, net 54 - 54 70 - 70 Stock-based compensation 167 (8) 159 135 (6) 129 Adjusted ETR % 28% 36% 27% 28% 36% 27% GAAP ETR % 22% 20% 5% 21% Wtd Average Diluted Shares 69 69 69 69 2014 Actual 2015 Actual

© 2016 IHS FY 2015 Revenue Distribution Excluding Discontinued Operations 5 Resources ~40% of Total Revenue Energy ~90% Chemicals ~10% Transportation ~35% of Total Revenue Autos ~76% AD&S ~10% Maritime ~14% Consolidated Markets ~25% of Total Revenue Technology ~22% ECR ~21% PD ~57% Higher margin, more profitable models Primarily INFORMATION BUSINESSES Royalty-bearing (PD) Primarily MARKET RESEARCH

© 2016 IHS Quarterly Revenue by Segment Excluding Discontinued Operations 6 $ in thousands Q1 Q2 Q3 Q4 FY Q1 Q2 Q3 Q4 FY Resources 217.5 243.9 229.1 236.7 927.2 217.6 234.7 217.7 214.6 884.6 Transportation 154.8 163.0 166.5 178.3 662.5 175.7 190.3 193.4 199.0 758.4 CMS 117.9 123.0 123.1 126.1 490.0 120.6 132.0 146.7 142.0 541.3 Total 490.1 529.9 518.7 541.1 2,079.8 513.9 556.9 557.8 555.7 2,184.3 Resources 27.0 22.2 10.8 2.1 62.1 0.1 (9.2) (11.4) (22.1) (42.6) Transportation 109.7 117.9 65.4 15.7 308.8 21.0 27.3 26.9 20.7 95.9 CMS 5.8 6.9 (0.8) 5.1 16.9 2.7 9.0 23.7 15.9 51.3 Total 142.5 147.0 75.4 22.9 387.8 23.8 27.1 39.1 14.6 104.5 Resources 14% 10% 5% 1% 7% 0% -4% -5% -9% -5% Transportation 244% 261% 65% 10% 87% 14% 17% 16% 12% 14% CMS 5% 6% -1% 4% 4% 2% 7% 19% 13% 10% Total 41% 38% 17% 4% 23% 5% 5% 8% 3% 5% Resources 8% 8% 7% 6% 7% 6% 2% 2% -3% 2% Transportation 2% 5% 7% 8% 7% 9% 10% 12% 11% 11% CMS 4% 4% 5% 6% 5% 5% 4% 4% 4% 4% Total 6% 7% 6% 7% 6% 7% 5% 5% 3% 5% Resources 2% 0% 1% -10% -2% -28% -23% -30% -30% -27% Transportation -12% 4% 5% 5% 3% 3% 5% 12% 2% 5% CMS 9% 2% -29% -5% -8% -19% -18% 35% 2% 0% Total 2% 1% -7% -3% -2% -15% -12% 0% -10% -9% Resources 7% 6% 6% 2% 5% 0% -4% -4% -8% -4% Transportation -1% 5% 7% 8% 6% 7% 9% 12% 9% 9% CMS 5% 4% -3% 4% 2% 1% 0% 9% 3% 4% Total 5% 5% 3% 4% 5% 3% 1% 4% 0% 2% 2014 2015 Su bsc rip tio n No n- Su bsc rip tio n To ta l O rg an ic G ro w th % R ev en ue Gr ow th $ Gr ow th % Ab so lu te G ro w th

© 2016 IHS Quarterly Financial Information by Segment Excluding Discontinued Operations 7 $ in thousands 2013 FY Q1 Q2 Q3 Q4 FY Q1 Q2 Q3 Q4 FY Resources 865.1 217.5 243.9 229.1 236.7 927.2 217.6 234.7 217.7 214.6 884.6 Transportation 353.8 154.8 163.0 166.5 178.3 662.5 175.7 190.3 193.4 199.0 758.4 CMS 473.1 117.9 123.0 123.1 126.1 490.0 120.6 132.0 146.7 142.0 541.3 Total 1,692.0 490.1 529.9 518.7 541.1 2,079.8 513.9 556.9 557.8 555.7 2,184.3 Resources 353.6 82.8 98.2 93.5 96.4 370.9 85.5 89.9 90.9 90.5 356.8 Transportation 125.2 55.8 52.5 59.4 66.5 234.3 62.3 69.3 72.4 78.8 282.7 CMS 81.1 19.6 22.8 22.2 23.4 88.0 19.5 24.2 29.1 34.0 106.8 Corporate (50.8) (11.5) (15.1) (15.3) (17.1) (59.0) (8.0) (12.4) (12.7) (16.8) (49.9) Total 509.1 146.7 158.5 159.7 169.3 634.2 159.3 171.0 179.7 186.5 696.4 Resources 40.9% 38.1% 40.3% 40.8% 40.7% 40.0% 39.3% 38.3% 41.8% 42.2% 40.3% Transportation 35.4% 36.1% 32.2% 35.6% 37.3% 35.4% 35.4% 36.4% 37.4% 39.6% 37.3% CMS 17.1% 16.6% 18.6% 18.0% 18.6% 18.0% 16.2% 18.3% 19.8% 23.9% 19.7% Total 30.1% 29.9% 29.9% 30.8% 31.3% 30.5% 31.0% 30.7% 32.2% 33.6% 31.9% Resources 69.2 24.1 18.4 21.0 21.0 84.5 29.0 25.7 20.1 33.7 108.5 Transportation 57.9 18.1 17.6 17.8 20.3 73.9 21.6 21.5 20.3 25.7 89.1 CMS 48.2 9.1 8.6 8.6 9.5 35.8 13.7 14.5 15.0 14.2 57.4 Corporate 160.1 42.0 34.0 45.8 40.7 162.5 31.4 33.7 33.1 35.3 133.5 Total 335.3 93.3 78.6 93.3 91.5 356.7 95.7 95.4 88.5 108.9 388.6 Resources 284.5 58.7 79.8 72.4 75.5 286.4 56.5 64.2 70.9 56.8 248.3 Transportation 67.3 37.7 34.9 41.5 46.2 160.4 40.6 47.8 52.1 53.1 193.7 CMS 32.9 10.5 14.3 13.6 13.9 52.2 5.9 9.7 14.0 19.7 49.3 Corporate (210.8) (53.5) (49.2) (61.0) (57.8) (221.5) (40.1) (45.5) (45.9) (52.0) (183.4) Total 173.8 53.4 79.8 66.5 77.7 277.5 62.9 76.2 91.1 77.6 307.8 2014 2015 Op er ati ng In co me GA AP Ad jus tm en ts Ab so lut e $ R ev en ue Ad jus ted E BI TD A Ab so lut e $ Ma rg in %

© 2016 IHS FY 2016 Guidance 8 Remove: Disc Ops Add: Carproof and Opis Total Ex Disc Ops Low High Low Mid High Revenue 2,314 2,184 2,300 2,380 (130) 130 2,300 2,340 2,380 Subscription organic growth % 5% 5% Non-subs organic growth % -11% -9% Total organic growth % 1% 2% Adjusted EBITDA 744 696 760 790 (48) 55 770 785 800 Margin % 32.2% 31.9% 33.0% 33.2% 36.7% 42.3% 33.5% 33.5% 33.6% BPS Expansion Adjusted EPS $6.07 5.67$ $6.15 $6.45 ($0.40) 0.25$ $6.00 $6.15 $6.30 Additional Items: Depreciation 90 85 103 108 (5) 2 100 105 Amortization 146 130 135 145 (15) 50 170 180 Interest expense, net 70 70 75 80 100 105 Stock-based compensation 135 129 120 130 120 130 Adjusted ETR % 28% 27% 27% 28% 27% 28% GAAP ETR % 21% 22% 21% 22% Wtd Average Diluted Shares 69 69 Capital Expenditures (as % of revenue) 2015 0-3% total organic 2016 Walkforward 2-3% subscription neutral non-subs 68.5 68.5 ~ approx 150 bps 5% of revenue 5% of revenue Total Status Quo 2016 Guidance: 2016 Guidance:2015 Actual

© 2016 IHS CarProof • Leading Canada-based provider of products and services in vehicle history, appraisal and valuation for the automotive industry including auto dealers, auto auctions, OEMs, lenders, insurers, governments, law enforcement agencies and consumers. • Purchase price of $460 million USD • 2016 Revenue multiple of 6.5x • 2016 EBITDA multiple of 16.0x • Other economic benefits include Canadian tax rate and use of foreign cash • Financial characteristics: • Mid teens organic growth • Adj. EBITDA margin of approximately 40% • Strong cash flow conversion 9

© 2016 IHS CarProof • Strategic Rationale: • Extends IHS’ leading vehicle history report business into Canada • Combination of Carfax and CarProof will accelerate product development • Extend new value add services (pricing, used car listings) into both markets • Further diversifies IHS Auto into used car market • Business model characteristics: • Information intensive • B2B highly recurring revenue model • Low customer revenue concentration 10

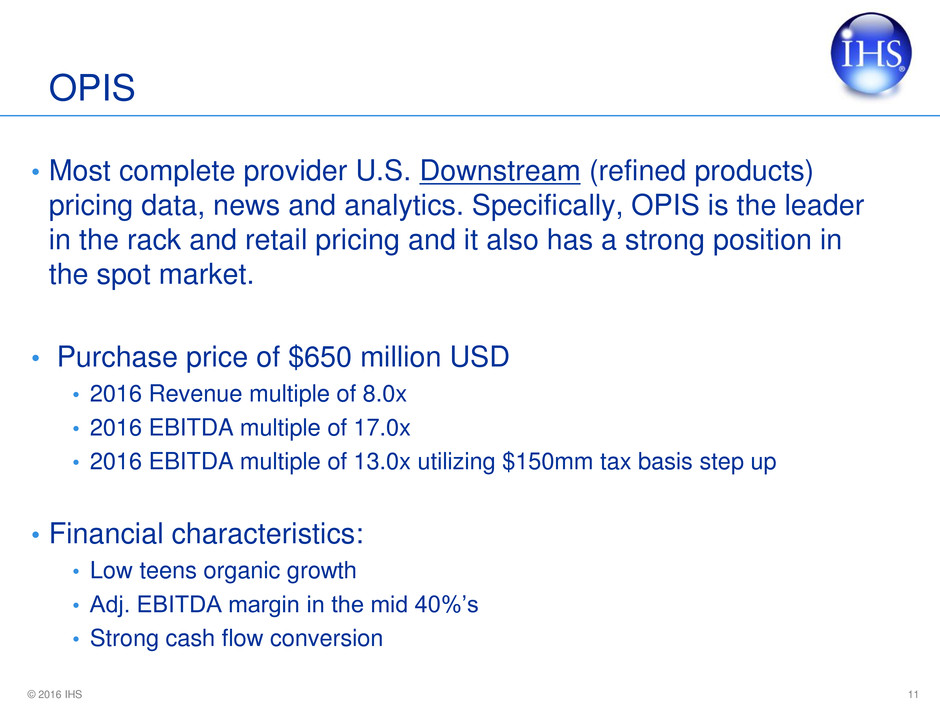
© 2016 IHS OPIS • Most complete provider U.S. Downstream (refined products) pricing data, news and analytics. Specifically, OPIS is the leader in the rack and retail pricing and it also has a strong position in the spot market. • Purchase price of $650 million USD • 2016 Revenue multiple of 8.0x • 2016 EBITDA multiple of 17.0x • 2016 EBITDA multiple of 13.0x utilizing $150mm tax basis step up • Financial characteristics: • Low teens organic growth • Adj. EBITDA margin in the mid 40%’s • Strong cash flow conversion 11

© 2016 IHS OPIS • Strategic Rationale: • Downstream focus which further diversifies our Up/Midstream concentration • Entry into petroleum pricing information, new area for IHS • Visibility across entire petroleum value chain, from wellhead to consumer • Business model characteristics: • Information and analytics intensive • Embedded within customers’ workflows, ERP’s and everyday decisions • Benchmark status in Rack and select Spot markets • Highly recurring subscription based revenue model • Low customer revenue concentration – no customer more than 3% of rev • Broad base of ~7,000 customers 12

© 2016 IHS OPIS Overview 13 Refiners Traders Brokers NGLs / PetChems Large end-users Chemical producers E & P companies Agriculture producers Financial Spot prices Suppliers Wholesalers Retailers Fleets Construction companies Biofuel producers Financial Rack prices Refiners Wholesalers Fleets Financial Auto manufacturers Consumer Media Volume data Retail prices Conferences News Directories Other OPIS Core Pricing, News and Analytics / Decision Support Tools

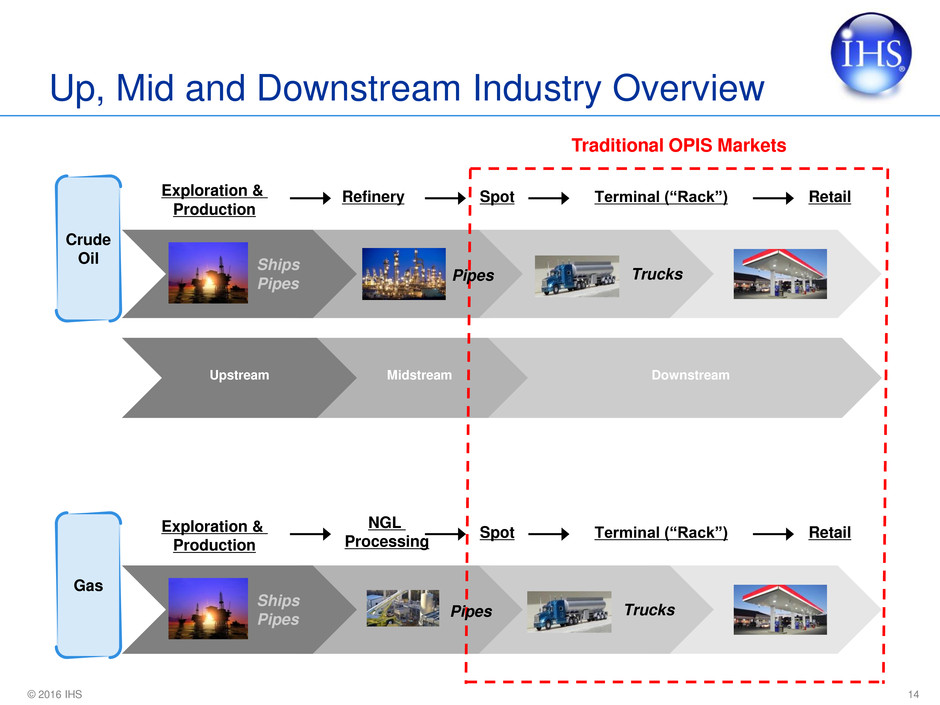
© 2016 IHS Up, Mid and Downstream Industry Overview 14 Upstream Midstream Downstream Crude Oil Exploration & Production Refinery Terminal (“Rack”) Ships Pipes Trucks Spot Retail Gas Exploration & Production NGL Processing Terminal (“Rack”) Ships Pipes Trucks Spot Retail Traditional OPIS Markets Pipes Pipes

© 2016 IHS How OPIS Prices and Benchmarks Are Used 15 Rack In d e x Rack In d e x Rack In d e x Rack In d e x S p o t In d e x S p o t In d e x Wholesalers Rack Price Spot Index Diesel Fuel Jet fuel Kerosene Biodiesel OPIS Covered Products Gasoline Heating oil LPG Refinery feedstocks Ethanol S p o t In d e x Gas stations School districts Commercial fleets U.S. Government Airlines Refiners Traders Refiners Traders OPIS’ “must have” information and analysis are used for commercial contracts and to settle trades

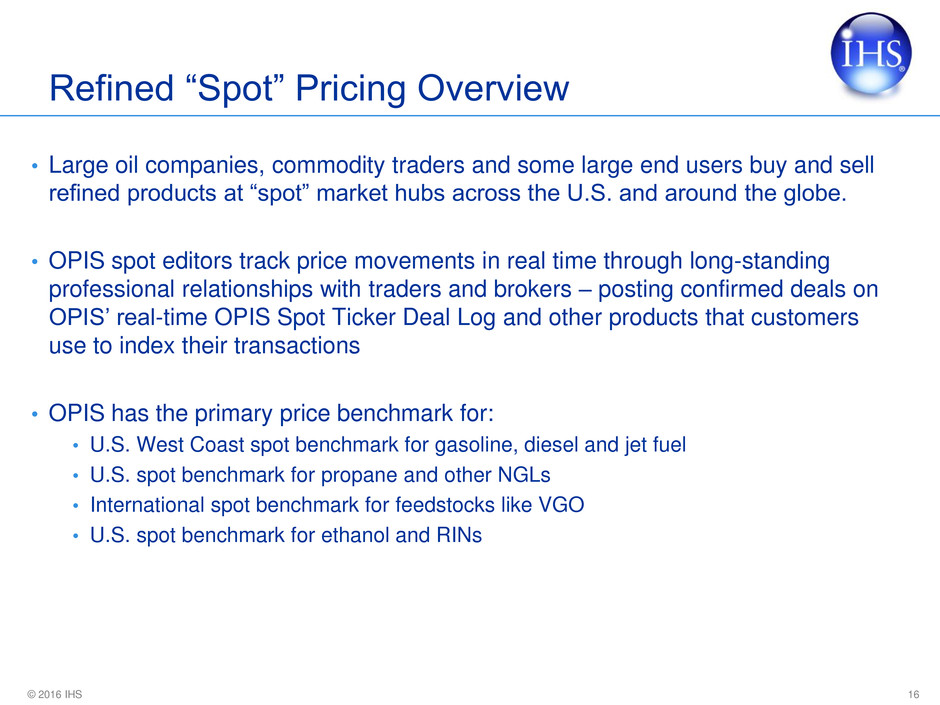
© 2016 IHS Refined “Spot” Pricing Overview • Large oil companies, commodity traders and some large end users buy and sell refined products at “spot” market hubs across the U.S. and around the globe. • OPIS spot editors track price movements in real time through long-standing professional relationships with traders and brokers – posting confirmed deals on OPIS’ real-time OPIS Spot Ticker Deal Log and other products that customers use to index their transactions • OPIS has the primary price benchmark for: • U.S. West Coast spot benchmark for gasoline, diesel and jet fuel • U.S. spot benchmark for propane and other NGLs • International spot benchmark for feedstocks like VGO • U.S. spot benchmark for ethanol and RINs 16

© 2016 IHS Wholesale “Rack” Pricing • Each day large fuel suppliers (typically oil companies) notify wholesalers of the prices they are charging for product at their terminal locations; this price is called the “rack” or “terminal” price • OPIS pioneered rack price delivery in 1981 and now maintains the most comprehensive database of U.S. wholesale petroleum prices – publishing more than 30,000 rack prices every day from over 1,500 terminals at more than 400 market locations • OPIS collects millions of individual rack price notifications each day, electronically “normalizing” these prices down to 30,000+ supplier prices offered any given day • Customers depend on OPIS Rack prices for a variety of purposes: • Benchmark to ensure they are receiving the best terms and the price they are being charged is accurate • Determine what price to sell or resell branded and unbranded product • Analyze pricing trends and supply-demand mechanics before deciding to post in a rack market • Structure contracts or RFPs that use an OPIS Rack price as the basis of the transaction • Reconcile invoices • Provide transparency in their pricing • Forecast profitability and capital budgeting 17

© 2016 IHS Retail Gasoline and Diesel Pricing Overview • OPIS is the leading North American and European provider of real-time and historical retail fuel prices and operating margin • In 1999, OPIS launched the first retail fuel pricing database in North America • OPIS receives ~2 million gasoline and diesel prices daily for nearly 140,000 retail outlets in North America • Fuel players including traditional major brands, regional independents, convenience store chains, supermarkets, and big box stores provide OPIS with pricing • OPIS saves retailers time and money by providing street price survey data electronically in real- time so retailers no longer have to canvas their trade areas physically to see competitors’ pricing • OPIS’ unique position in rack and spot price discovery allows it to use its retail price database to provide fuel profit margin visibility throughout the supply chain • OPIS has long-term exclusive data relationships 18
