Attached files
| file | filename |
|---|---|
| EXCEL - IDEA: XBRL DOCUMENT - IHS Inc. | Financial_Report.xls |
| EX-21 - SUBSIDIARIES OF REGISTRANT - IHS Inc. | ex21q414.htm |
| EX-32 - CEO/CFO CERTIFICATION - IHS Inc. | ex32q414.htm |
| EX-23 - CONSENT OF ERNST & YOUNG LLP - IHS Inc. | ex23q414.htm |
| EX-10.1 - LONG-TERM INCENTIVE PLAN - IHS Inc. | ex101q414.htm |
| EX-31.2 - CFO CERTIFICATION - IHS Inc. | ex312q414.htm |
| EX-31.1 - CEO CERTIFICATION - IHS Inc. | ex311q414.htm |
| EX-10.35 - CREDIT AGREEMENT - IHS Inc. | ex1035q414.htm |
| EX-10.38 - AMENDED AND RESTATED CREDIT AGREEMENT - IHS Inc. | ex1038q414.htm |
| EX-10.15 - DEFERRED COMPENSATION PLAN - IHS Inc. | ex1015q414.htm |
| EX-10.16 - DEFERRED COMPENSATION PLAN ADOPTION AGREEMENT - IHS Inc. | ex1016q414.htm |
| EX-10.14 - RECOUPMENT OF INCENTIVE COMPENSATION POLICY - IHS Inc. | ex1014q414.htm |
| EX-24 - POWER OF ATTORNEY - IHS Inc. | ex24powerofattorney2014.htm |
| EX-10.13 - HEDGING AND PLEDGING POLICY - IHS Inc. | ex1013q414.htm |
UNITED STATES
SECURITIES AND EXCHANGE COMMISSION
Washington, D.C. 20549
___________________________________________________
FORM 10-K
___________________________________________________
x | ANNUAL REPORT PURSUANT TO SECTION 13 OR 15(d) OF THE SECURITIES EXCHANGE ACT OF 1934 |
For the fiscal year ended November 30, 2014
OR
o | TRANSITION REPORT PURSUANT TO SECTION 13 OR 15(d) OF THE SECURITIES EXCHANGE ACT OF 1934 |
For the transition period from to
Commission file number 001-32511
___________________________________________________
IHS INC.
(Exact name of registrant as specified in its charter)
___________________________________________________
Delaware | 13-3769440 | |
(State or Other Jurisdiction of Incorporation or Organization) | (IRS Employer Identification No.) | |
15 Inverness Way East
Englewood, CO 80112
(Address of Principal Executive Offices)
(303) 790-0600
(Registrant’s telephone number, including area code)
___________________________________________________
Securities registered pursuant to Section 12(b) of the Act:
Title of each class | Name of each exchange on which registered | |
Class A Common Stock, $0.01 par value per share | New York Stock Exchange | |
Series A junior participating preferred stock purchase rights (attached to the Class A Common Stock) | ||
Securities registered pursuant to Section 12(g) of the Act:
None.
___________________________________________________
Indicate by check mark if the registrant is a well-known seasoned issuer, as defined in Rule 405 of the Securities Act. x Yes o No
Indicate by check mark if the registrant is not required to file reports pursuant to Section 13 or 15(d) of the Act. o Yes x No
Indicate by check mark whether the registrant (1) has filed all reports required to be filed by Section 13 or 15(d) of the Securities Exchange Act of 1934 during the preceding 12 months (or for such shorter period that the registrant was required to file such reports), and (2) has been subject to such filing requirements for the past 90 days. x Yes o No
Indicate by check mark whether the registrant has submitted electronically and posted on its corporate Web site, if any, every Interactive Data File required to be submitted and posted pursuant to Rule 405 of Regulation S-T (§232.405 of this chapter)
during the preceding 12 months (or for such shorter period that the registrant was required to submit and post such files). x Yes o No
Indicate by check mark if disclosure of delinquent filers pursuant to Item 405 of Regulation S-K is not contained herein, and will not be contained, to the best of registrant's knowledge, in definitive proxy or information statements incorporated by reference in Part III of this Form 10-K or any amendment to this Form 10-K. o
Indicate by check mark whether the registrant is a large accelerated filer, an accelerated filer, a non-accelerated filer, or a smaller reporting company. See the definitions of “large accelerated filer,” “accelerated filer” and “smaller reporting company” in Rule 12b-2 of the Exchange Act.
Large accelerated filer | x | Accelerated filer | o | ||
Non-accelerated filer | o (Do not check if a smaller reporting company) | Smaller Reporting Company | o | ||
Indicate by check mark whether the registrant is a shell company (as defined in Rule 12b-2 of the Exchange Act). o Yes x No
The aggregate market value of the voting and non-voting common equity held by non-affiliates, based upon the closing price for the Class A Common Stock as reported on the New York Stock Exchange composite tape on the last business day of the registrant's most recently completed second fiscal quarter, was approximately $6.3 billion. All executive officers, directors, and holders of five percent or more of the outstanding Class A Common Stock of the registrant have been deemed, solely for purposes of the foregoing calculation, to be "affiliates" of the registrant.
As of December 31, 2014, there were 68,381,329 shares of our Class A Common Stock outstanding.
DOCUMENTS INCORPORATED BY REFERENCE
The information required by Part III of the Form 10-K, to the extent not set forth herein, is incorporated herein by reference from the registrant's definitive proxy statement on Schedule 14A for the Annual Meeting of Stockholders to be held on April 8, 2014, to be filed with the Securities and Exchange Commission pursuant to Regulation 14A not later than 120 days after the close of the registrant's fiscal year.
TABLE OF CONTENTS
Page | |||
Item 1. | |||
Item 1A. | |||
Item 1B. | |||
Item 2. | |||
Item 3. | |||
Item 4. | |||
Item 5. | |||
Item 6. | |||
Item 7. | |||
Item 7A. | |||
Item 8. | |||
Item 9. | |||
Item 9A. | |||
Item 9B. | |||
Item 10. | |||
Item 11. | |||
Item 12. | |||
Item 13. | |||
Item 14. | |||
Item 15. | |||
2
Cautionary Note Regarding Forward-Looking Statements
This annual report on Form 10-K contains “forward-looking statements” within the meaning of the safe harbor provisions of the U.S. Private Securities Litigation Reform Act of 1995. Forward-looking statements can be identified by words such as: “anticipate,” “intend,” “plan,” “goal,” “seek,” “aim,” “strive,” “believe,” “project,” “predict,” “estimate,” “expect,” “continue,” “strategy,” “future,” “likely,” “may,” “might,” “should,” “will,” the negative of these terms, and similar references to future periods. Examples of forward-looking statements include, among others, statements we make regarding: guidance and predictions relating to expected operating results, such as revenue growth and earnings; strategic actions, including acquisitions and dispositions, anticipated benefits from strategic actions, and our success in integrating acquired businesses; anticipated levels of capital expenditures in future periods; our belief that we have sufficient liquidity to fund our ongoing business operations; expectations of the effect on our financial condition of claims, litigation, environmental costs, contingent liabilities and governmental and regulatory investigations and proceedings; and our strategy for customer retention, growth, product development, market position, financial results, and reserves.
Forward-looking statements are neither historical facts nor assurances of future performance. Instead, they are based only on our current beliefs, expectations, and assumptions regarding the future of our business, future plans and strategies, projections, anticipated events and trends, the economy, and other future conditions. Because forward-looking statements relate to the future, they are subject to inherent uncertainties, risks, and changes in circumstances that are difficult to predict and many of which are outside of our control. Our actual results and financial condition may differ materially from those indicated in the forward-looking statements. Therefore, you should not rely on any of these forward-looking statements. Important factors that could cause our actual results and financial condition to differ materially from those indicated in the forward-looking statements include, among others, the following: economic and financial conditions, including volatility in interest and exchange rates; our ability to manage system failures, capacity constraints, and cyber risks; our ability to successfully manage risks associated with changes in demand for our products and services as well as changes in our targeted industries; our ability to develop new platforms to deliver our products and services, pricing, and other competitive pressures, and changes in laws and regulations governing our business; the extent to which we are successful in gaining new long-term relationships with customers or retaining existing ones and the level of service failures that could lead customers to use competitors' services; our ability to successfully identify and integrate acquisitions into our existing businesses and manage risks associated therewith; our ability to satisfy our debt obligations and our other ongoing business obligations; and the other factors described under the caption “Risk Factors” in this annual report on Form 10-K, along with our other filings with the U.S. Securities and Exchange Commission (SEC).
Any forward-looking statement made by us in this annual report on Form 10-K is based only on information currently available to us and speaks only as of the date on which it is made. We undertake no obligation to publicly update any forward-looking statement, whether written or oral, that may be made from time to time, whether as a result of new information, future developments or otherwise.
Website and Social Media Disclosure
We use our website (www.ihs.com) and corporate Twitter account (@IHS) as channels of distribution of company information. The information we post through these channels may be deemed material; therefore, investors should monitor these channels in addition to our press releases, SEC filings, and public conference calls and webcasts. None of the information provided on our website, in our press releases, public conference calls and webcasts, or through social media channels is incorporated into, or deemed to be a part of, this annual report on Form 10-K.
Fiscal Year End
Our fiscal year ends on November 30 of each year. Unless otherwise indicated, references in this Annual Report to an individual year means the fiscal year ended November 30. For example, “2014” refers to the fiscal year ended November 30, 2014.
3
PART I
Item 1. Business
Our Vision
Our vision is to be the Source for Critical Information and Insight that powers growth and value for our customers. We intend to be the source that customers trust, rely upon and come to first when they need to better understand the present and anticipate the future.
Our Business
We are a leading source of information, insight, and analytics in critical areas that shape today’s business landscape. Businesses and governments around the globe rely on our comprehensive content, expert independent analysis, and flexible delivery methods. Our aim is to embed our solutions within the entire spectrum of our customers’ organizations, enabling executive level capital deployment strategies and following decision-making activities throughout their organizations to front-line employees tasked with managing complex core daily operations. We serve customers across global interconnected capital-intensive industries, including energy and natural resources, chemicals, technology, automotive, aerospace and defense, and maritime and trade.
As further described below, our core competency is sourcing data and transforming it into critical information and insight that businesses, governments, and others use to make high-impact decisions with confidence. We are a sought-after resource for those who require and demand the most accurate and expertly analyzed information available. We are dedicated to providing the information and expert analysis our customers need to make critical decisions that drive growth and value for their operations.
By integrating and connecting our information, analytics, and research and analysis with proprietary and widely used decision-support technology on scalable platforms, we produce critical information and analytical solutions designed to meet our customers’ needs. Our product development teams have also created proprietary Web services and application interfaces that enhance access to our information. These services allow our customers to integrate our information with other data, business processes, and applications (such as computer-aided design, enterprise resource planning (ERP), supply chain management, and product data/lifecycle management).
We have been in business since 1959 and became a publicly traded company on the New York Stock Exchange in 2005. Headquartered in Englewood, Colorado, USA, we are committed to sustainable, profitable growth and employ approximately 8,800 people in 32 countries around the world.
Our Objectives
To achieve our vision of being the Source for Critical Information and Insight, we have established five inter-dependent objectives upon which we focus our efforts, as described below. We externally benchmark our progress annually against these five objectives. To measure customer satisfaction (which we refer to as Customer Delight) and colleague success, we use third-party surveys and develop goals based on those metrics. For 2015, our corporate objectives are:
• | Improve Customer Delight; |
•Foster a culture that enables colleague success;
•Deliver profitable top- and bottom-line growth;
•Provide an opportunity for stockholder success relative to our peer group; and
•Improve corporate sustainability and responsibility.
Our Strategy
Our strategy is comprised of the following priorities:
Commercial expansion. We intend to continue our business expansion through new product development and customer development and market penetration, as described in the following actions:
4
• | Continue developing new products and analytics. We believe we have a distinctive ability to develop decision-support tools and related services based on our critical information in the industries we serve. We plan to continue to leverage our information and insight expertise to develop new and integrated product platforms and offerings for our customers. |
• | Expand customer relationships. We believe there is significant opportunity to grow within our Target 1000 customer accounts (which consists of high-growth, high-opportunity accounts), and we intend to expand those relationships by cross-selling and up-selling additional information, tools, and analytics that will support customers in their operating, capital, and strategic decision processes. |
• | Leverage our global footprint. Our global sales and marketing organizations have broad geographic reach, which makes it easier for our customers to do business with us. We plan to continue to expand our global reach by investing in key geographical markets to drive continued revenue growth. |
Operational excellence. We have made significant infrastructure investments to scale our internal applications, including implementation of a common ERP and sales management system. Our operational excellence initiative is focused on continuing to refine, enhance, and leverage our systems and processes to drive further operational simplicity and efficiency, and accommodate future revenue growth without having to incur proportional cost increases to support that growth.
Strategic acquisitions. Acquisitions are a key part of our growth strategy. We focus on acquisitions that have long-term growth potential, target high-growth markets, and fill a strategic need in our business portfolio as we seek to provide comprehensive solutions to our customers. We have deployed approximately $4.0 billion in capital on more than 60 acquisitions since 2005, and we plan to continue to selectively acquire strategic assets in our target industries in order to further enhance our product offerings and market position.
Our Global Sales and Operating Model
To best serve our customers and be as close to them as possible, we are organized by geographies into three business segments:
•Americas, which includes the United States, Canada, and Latin America;
•EMEA, which includes Europe, the Middle East, and Africa; and
•APAC, or Asia Pacific.
Our integrated global organization is designed to make it easier for our customers to do business with us by providing a cohesive, consistent, and effective sales-and-marketing approach in each local region. By structuring our business around customers and the regions in which they reside, we are better able to serve the specific needs of our customers both in their local markets and globally. We believe a regional structure provides a solid foundation for profitable growth as it provides an efficient platform to bring new products and services to customers and supports growth in existing accounts and with new customers and markets.
Our Core Competency: Transforming Data into Critical Information and Insight
Our customers benefit from a concentration of intellectual wealth and thought leadership throughout a variety of industries. We believe that our global team of information and industry experts, research analysts, and economists provide our customers with leading strategic information and research.
We convert raw data into critical information through a series of transformational steps that reduce the uncertainty that is inherent in unrefined data. At each step along the way, we work to ensure quality of the data transformation across four dimensions, which we call the "4 Cs":
Correctness | Validate data accuracy through comparison to external reference points. | |
Currency | Deliver new and updated content in a timely manner. | |
Completeness | Provide the right data attributes and analysis to ensure that customers have all of the necessary information to make critical decisions. | |
Consistency | Standardize identifiers and content across databases and products to be sure customers receive consistent information regardless of product platform. | |
5
We have standardized the data transformation process into seven steps. The order of the steps and the need to perform quality checks throughout the process is important because the quality of each step is dependent on the quality of all of the preceding steps. The seven-step process we follow in transforming data into critical information and insight involves the following:
Source data | We locate hundreds of possible data sources and then evaluate them for correctness, currency, and completeness. | |
Capture | We collect documents and digital feeds, harvest content from publicly available sources, visit sites for updates, etc. Once the data is aggregated, we validate and normalize the data before loading it into our proprietary databases. | |
Match | We link disparate instances of the same attribute. This knowledge-based activity ensures consistency over time and across sources, eliminating unlinked information about a single well, a single part, a single chemical, etc. | |
Identify | We attach an IHS identifier to matched information to ensure that the matched information stays linked. We also confirm that industry standard identifiers, which often vary over time, are accurate and appropriately matched to the IHS identifier. | |
Relate | We identify logical relationships and associations between entities and link those relationships through identification numbers. Examples include corporate parent and subsidiary relationships, leases and associated wells, international standards, and national standards. This step supplies the context for analysis. | |
Analyze | We use our industry experts to review, analyze, and add context and editorial commentary to the data to transform it into critical information and expert analysis for our customers. | |
Model and Forecast | We use our critical information and expert analysis to produce additional insight by providing unbiased research and intelligence with proprietary models and forecasting tools. Our experts use their extensive experience to build models and forecasting tools for our customers' use. | |
Using this seven-step process and the "4 Cs" of quality, we seek to transform data into critical information and insight that is both useful to our customers and available where and when they need it. This process also provides the foundation for our integrated solutions that combine our products and services to create differentiated solutions for the customers in our target industries.
Our Customers
We have a diverse customer base, ranging from large entities such as multinational companies and governments to small companies and technical professionals that span many industries, geographies, and end markets. Our customer base includes approximately 75 percent of the Fortune Global 500. Our largest 1,000 customers account for almost two-thirds of our revenue, yet no single customer represents more than 10 percent of our total revenue.
Our customers participate in global interconnected capital-intensive industries, and we are continuing to build on our existing scale to integrate our comprehensive content, expertise, tools, technology, and research and analysis to produce a differentiated solution set that places us at the heart of many of our customers’ core workflows. The result is a primarily subscription-based business, which tends to generate recurring revenue and cash flow for us. Subscription agreements generally represent approximately 75 percent of our total revenue, and are typically annual and non-cancellable for the term of the subscription and may contain provisions for minimum monthly payments. As evidenced by our organic revenue growth rates over the years, our subscription revenue is generally stable and predictable, and we have long-term relationships with many of our customers.
We develop our products and services based on customer needs in the target industries we serve and in the workflows that our customers use. By connecting our comprehensive content and expertise to our customers' workflows across our target industries, we strive to create value for our customers by uniquely addressing capital and operating decisions across our customers' entire supply chains and each of their target markets globally.
6
Within each of our geographic segments, our sales force is organized based on the size of our customers, our expertise in key vertical industries, and our horizontal workflows, as described below.
Vertical Industries
Our target industry sectors have many attributes in common. They are large, complex, global industries that have significant annual capital and operating outlays measured in the trillions of dollars. These industries rely on information and make critical decisions based on the comprehensive content, expert analysis, and workflow tools and technologies that we provide.
We have developed substantial breadth and depth of information and expertise in six main vertical industries within two product categories:
Resources
• | Energy and Natural Resources. This industry sector includes specific industries such as Oil & Gas, Coal, and Power & Utilities. All of our other target industries incur significant expense in this industry sector. Our content and analysis provides worldwide information on millions of wells, pipeline miles, and regulatory and mineral rights documents, as well as global information on oil and gas fields, basins, and operating assets and thousands of power and industrial plants. |
• | Chemicals. Our Chemicals content and analysis includes data for manufacturing processes, as well as capital expenditure, cost, price, production, trade, demand, and capacity industry analysis and forecasts for more than 250 chemicals in more than 50 countries. We also have an extensive library of detailed techno-economic analyses of chemicals and refining process technologies. We provide a number of consulting services including training, strategy development, and project development offerings to the chemical and related industries. Our business information services track current events, supply high-velocity information, and hold conferences related to the chemical industry. |
Industrials
• | Automotive. With the addition of R. L. Polk (which includes CARFAX, a leading provider of vehicle history information) in 2013, we substantially increased our value creation proposition by providing a comprehensive global view of the automotive value chain to our customers. We provide original equipment manufacturers (OEMs) and the automotive supply chain with authoritative analysis and forecasts of sales and production for light vehicles, medium and heavy commercial vehicles, powertrain, components, and technology systems across all major markets. We also provide a wide range of performance measurement tools and marketing solutions for car makers, dealers, and agencies. |
• | Technology. This industry sector includes the electronics, telecommunications, and media industries. We deliver comprehensive insight and tools for managing second source and component lifecycles, leveraging our component database of 400 million parts. We also perform teardown analysis to benchmark costs and design practices. Our Technology solutions enable customers to optimize their supplier and customer engagement strategy and differentiate their product portfolio from the competition through market share, supply chain, and technology adoption analyses and forecasts on a geographic, industry, and company level. |
• | Aerospace, Defense & Security. Our Aerospace, Defense & Security data and analysis provides specifications for thousands of military vehicles, naval vessels, and aircraft types. Our budget forecasts cover more than 95 percent of global defense spending, and we have analyzed more than 150,000 terrorism-related events, with more analyzed and added each day. |
• | Maritime & Trade. Our Maritime & Trade content and analysis provides comprehensive data on close to 200,000 ships operating in international waters, as well as monthly import and export statistics on more than 80 countries and tracking more than 90 percent of international trade by value. |
We support significant capital and operating decisions in these large global markets with the information, expertise, knowledge, specialized tools, and technologies that we provide. Many of these vertical industries are significantly interconnected, and our multi-disciplinary industry capabilities allow us to support them and the needs of a broad range of additional end markets that depend on these six industry sectors as critical elements of their supply chains, cost structures, and
7
investment decisions. Such additional end markets include Financials, Retail, Governments, Construction, and Consumer Products.
Horizontal Workflows
We focus on how customers within our target industry sectors and end markets make daily operating and capital investment decisions. We identify specific customer functions and the use of information, insight, analysis, tools, and technology in their daily workflows, and then develop the information, expertise, software tools, and technologies that integrate with their decision processes to enhance their success. We focus on four customer workflows that cover the spectrum from executive and strategic decisions to daily operations:
• | Strategy, Planning, and Analysis |
•Energy Technical
•Product Design
•Operational Excellence & Risk Management
Our targeted workflows and sample roles are outlined below:
Workflow | Sample Roles |
Strategy, Planning, and Analysis | Strategic Planning, Corporate Development, M&A, Investment Analysis, Risk Assessment, Business Development, and Trading |
Energy Technical | Geo-science, Petroleum Engineering |
Product Design | Engineering, Design, Research and Development |
Operational Excellence & Risk Management | Sustainability, Regulatory, Environment, Health and Safety, Procurement, Logistics, Operations, and Manufacturing |
• | Strategy, Planning, and Analysis. We provide strategic and commercial professionals with information, research, and tools that support a wide range of commercial decisions and processes, including capital investments, country-entry strategies, acquisitions, annual strategic planning processes, and monthly/quarterly production and sales forecasts. An example of the value we provide in this workflow is in Energy Insight, where we provide oil and gas producers with strategic analysis on upstream opportunities, provide downstream operators with forecasts of supply and demand for all petroleum products, and provide the gas and power utility sector with research on energy policy and its impact on power supply and demand. We underpin our solutions in this workflow with our economic and country risk capabilities, which translate high-level macroeconomic, political, and security drivers into industry-level demand forecasts and risk factors. We support customers primarily in heavy-asset industries where there is significant capital expenditure, long investment cycles, and important external macroeconomic and policy drivers. These industries require independent, authoritative, and rigorous third-party market information and analysis as critical inputs into strategic decisions. |
• | Energy Technical. Access to cost-effective, reliable, and safe energy sources is one of the most critical issues our society faces. We believe that increased competition for global hydrocarbon energy sources and the increased capital and operational costs required for their exploration, production, transportation, refining, and delivery of the final product to end customers drives demand for connected solutions consisting of raw data, information, insight, and relevant answer products. Supported by a robust service capability, we offer our customers a differentiated solution set that enables accurate, informed, and timely critical decisions. Our Energy Technical offerings include information, software, and advisory services addressing areas such as oil and gas production, geological information, energy activity, strategic planning, reconnaissance, geophysics, production engineering, production optimization, and information and research on unconventional hydrocarbon resources (e.g., shale gas, coal bed methane, and heavy oil). |
• | Product Design. Our Product Design solutions provide technical professionals with the information and insight required to more effectively design products, complete engineering projects, solve technical problems, and address the complex supply chain challenges of today's rapidly changing global economy. Our goal is to provide engineers, scientists, technical professionals, supply chain management, procurement executives, risk managers, and materials management professionals with the technical information and expertise necessary to help them make better decisions, solve complex problems more quickly, and execute their strategies to minimize risk and maximize operational efficiency and profitability. Our Product Design offerings include content and analysis on millions of engineering and technical standards, codes, specifications, handbooks, reference books, journals, and other scientific and technical documents, as well as software-based engineering decision engines for innovation, productivity, and quality. |
8
• | Operational Excellence & Risk Management. Our Operational Excellence & Risk Management solutions advance critical decisions associated with environmental, health, and safety operational risk, product stewardship, greenhouse gas, and corporate social responsibility, as well as advisory services that enable our customers to address the complex supply chain challenges of today's rapidly changing global economy. We deliver information management capabilities that enable the convergence of Operational Excellence & Risk Management information and processes to provide metrics and analytics that promote operational excellence and cost reduction, as well as compliance assurance and non-financial performance management. Our Operational Excellence & Risk Management offerings include solutions that cover air, water, and waste emissions management and reporting, regulatory compliance, sustainability, energy management, trade flows, commodity and component pricing and availability, supply chain market opportunity and risk, and supplier performance and viability metrics, among others. |
Sales and Marketing
Our sales teams are organized to support our customers across our three geographic segments; thus, our customer-facing efforts are designed to be aligned with our customers by industry and workflow within their local market. We also conduct regular customer surveys to understand both current customer satisfaction levels and potential opportunities for improvement, which we then use to provide additional direction to sales and marketing about key areas of focus.
Our strategic account management teams address the needs of our largest customers. Our account managers support the customer renewal process. New customer acquisition is largely conducted by our account managers and new business teams. These sales organizations identify potential new customer opportunities and develop the sales approach for larger new business opportunities. Our inside sales team pursues smaller new-customer opportunities. We enhance our sales model with e-commerce platforms that provide our customers and prospects with the ability to buy ad hoc reports. We also use a network of channel partners to reach customers in locations where it is not cost-effective to use our sales teams or maintain a sales office. Our channel partner network represents less than 5 percent of our total revenue.
Our marketing organization defines our marketing strategy and drives operational execution. A primary focus for marketing strategy is to empower IHS brand awareness, revenue acceleration, and market leadership across our key industries and workflows for all products and services globally. Functionally, this includes corporate marketing, product marketing, field marketing, and e-commerce.
Competition
We believe the principal competitive factors in our business include the following:
• | Depth, breadth, timeliness, and accuracy of information provided; |
•Quality of decision-support tools and services;
•Quality and relevance of our analysis and insight;
•Ease of use;
•Customer support; and
•Value for price.
We believe that we compete favorably on each of these factors. Although we face competition in specific industries and with respect to specific offerings, we do not believe that we have a direct competitor across all of our workflows and industry solutions due to the depth and breadth of our offerings. Competitors within specific industries or with respect to specific offerings are described below.
9
Strategy, Planning, and Analysis | Our Strategy, Planning, and Analysis offerings compete generally by customer market. Among others, we compete in Energy markets with offerings from Wood Mackenzie, Ltd., and PIRA Energy Group; in Aerospace & Defense markets with offerings from Forecast International and Defense News; in Maritime markets with offerings from Informa plc; in Automotive markets with offerings from LMC Automotive, Urban Science, and Experian and, with respect to vehicle history reports, principally with Experian and various other providers approved by the National Motor Vehicle Title Information System of the United States Department of Justice; in Technology markets with offerings from Gartner; and in Chemicals markets with offerings from Reed Elsevier and Nexant. Our economic and country risk and forecasting offerings compete with offerings from the Economist Intelligence Unit and Oxford Economics, among others. | |
Energy Technical | Our Energy Technical critical information offerings compete with offerings from Drilling Info, Inc., TGS-Nopec Geophysical Company, Wood Mackenzie Ltd., and Deloitte Touche Tohmatsu Limited, among others. Our geo-sciences software competes with products from Schlumberger Limited, Halliburton Company, and LMKR, among others. | |
Product Design | Our Product Design offerings compete with offerings of SAI Global, Techstreet, Thomas Publishing, and the standards developing organizations, among others. Our electronics design offerings compete with offerings from Arrow Electronics and parts manufacturers and distributors, among others. | |
Operational Excellence & Risk Management | Our Operational Excellence & Risk Management offerings compete with offerings from SAP and Enablon, among others. | |
Government Contracts
We sell our products to various government agencies and entities. No individual contract is significant to our business. Although some of our government contracts are subject to terms that would allow renegotiation of profits or termination at the election of the government, we believe that no renegotiation or termination of any individual contract or subcontract at the election of the government would have a material adverse effect on our financial results.
Intellectual Property
We rely heavily on intellectual property, including the intellectual property we own and license. We regard our trademarks, copyrights, licenses, and other intellectual property as valuable assets and use intellectual property laws, as well as license and confidentiality agreements with our employees, customers, channel partners, and others, to protect our rights. In addition, we exercise reasonable measures to protect our intellectual property rights and enforce these rights when we become aware of any potential or actual violation or misuse.
Intellectual property licensed from third parties, including standards development organizations (SDOs), government agencies, and manufacturers, is a component of our offerings and, in many cases, cannot be independently replaced or recreated by us or others. We have longstanding relationships with most of the third parties from whom we license information. Almost all of the licenses that we rely upon are nonexclusive and expire within one to two years, unless renewed.
We maintain registered trademarks in jurisdictions around the world. In addition, we have obtained patents and applied for patents in the United States, primarily related to our software portfolio, including our IHS Kingdom and IHS Goldfire products. For more information relating to our intellectual property rights, see "Risk Factors - We may not be able to protect intellectual property rights."
Employees
As of November 30, 2014, we had approximately 8,800 employees located in 32 countries around the world.
Seasonality
Our business has seasonal aspects. Our fourth quarter typically generates our highest quarterly levels of revenue and profit. Conversely, our first quarter generally has our lowest quarterly levels of revenue and profit. We also experience event-driven seasonality in our business; for instance, IHS Energy CERAWeek, an annual energy executive gathering, is held during
10
our second quarter. Another example is the biennial release of the Boiler Pressure Vessel Code (BPVC) engineering standard, which generates revenue for us predominantly in the third quarter of every other year. We most recently recognized a benefit in connection with the BPVC release in the third quarter of 2013.
Financial Information about Segments and Geographic Area
See "Item 8 - Financial Statements and Supplementary Data - Notes to Consolidated Financial Statements - Note 19" in Part II of this Form 10-K for information with respect to each segment's revenues, operating income, and total assets and for information with respect to our revenues and long-lived assets for the U.S., individual material foreign countries, and the rest of the world in aggregate. See also "Risk Factors - Our international operations are subject to exchange rate fluctuations and other risks relating to worldwide operations."
Available Information
Our annual report on Form 10-K, quarterly reports on Form 10-Q, current reports on Form 8-K, and amendments to those reports are available, without charge, on our website, www.ihs.com, as soon as reasonably practicable after they are electronically filed with or furnished to the SEC. We have also posted our code of ethics, which we refer to as our Business Code of Conduct, on our website. Copies of each of these documents are also available, without charge, from IHS Investor Relations and Corporate Communications, 15 Inverness Way East, Englewood, CO 80112.
Item 1A. Risk Factors
In addition to the other information provided in this Form 10-K, you should carefully consider the risks described in this section. The risks described below are not the only risks that could adversely affect our business; other risks currently deemed immaterial or additional risks not currently known to us could also adversely affect us. These and other factors could have a material adverse effect on the value of your investment in our securities, meaning that you could lose all or part of your investment.
Note that this section includes forward-looking statements and future expectations as of the date of this Form 10-K. This discussion of Risk Factors should be read in conjunction with “Management's Discussion and Analysis of Financial Condition and Results of Operations” and the consolidated financial statements and related notes in Part II of this Form 10-K.
Achieving our growth objectives may prove unsuccessful.
We seek to achieve our growth objectives by enhancing our offerings to meet the needs of our customers through organic development, including by delivering integrated workflow platforms, cross-selling our products across our existing customer base and acquiring new customers, entering into strategic partnerships, and acquisitions. If we are unable to successfully execute on our strategies to achieve our growth objectives, our growth rates could be adversely affected. An additional factor that may adversely affect our growth rates is continued global economic uncertainty. Our non-subscription business in particular may be adversely affected by decisions on the part of our customers to defer spending in uncertain economic environments.
If we are unable to consistently renew and enter into new subscriptions for our offerings, our results could weaken.
The majority of our revenue is based on subscriptions to our offerings. In 2014, we derived approximately 77 percent of our revenues from subscriptions, which revenue we recognize ratably over the subscription terms. Our operating results depend on our ability to achieve and sustain high renewal rates on our existing subscription base and to enter into new subscription arrangements at acceptable prices and other commercially acceptable terms. Failure to meet one or more of these subscription objectives could have a material adverse effect on our business, financial condition, and operating results.
The loss of, or the inability to attract and retain, key personnel could impair our future success.
Our future success depends to a large extent on the continued service of our employees, including our experts in research and analysis and other areas, as well as colleagues in sales, marketing, product development, critical operational roles, and management, including our executive officers. We must maintain our ability to attract, motivate, and retain highly qualified colleagues in order to support our customers and achieve business results. The loss of the services of key personnel and our inability to recruit effective replacements or to otherwise attract, motivate, or retain highly qualified personnel could have a material adverse effect on our business, financial condition, and operating results.
11
We could experience system failures or capacity constraints that could negatively impact our business.
Our ability to provide reliable service largely depends on the efficient and uninterrupted operation of complex systems, relying on people, processes, and technology to function effectively. Some elements of these systems have been outsourced to third-party providers. Some of our systems have been consolidated for the purpose of enhancing scalability and efficiency, which increases our dependency on a smaller number of systems. Any significant interruption to, failure of, or security breaches affecting, our systems could result in significant expense to repair, replace or remediate systems, equipment or facilities, a loss of customers, and harm to our business and reputation. Interruption, system failures or security breaches could result from a wide variety of causes, including the possibility of failures at third-party data centers, disruptions to the Internet, malicious attacks or cyber incidents such as unauthorized access, loss or destruction of data (including confidential and/or personal customer information), account takeovers, computer viruses or other malicious code, and the loss or failure of systems over which we have no control. The failure of our systems, or the loss of data, could result in legal claims or proceedings, disruption to our operations, damage to our reputation and remediation costs, which could individually or in the aggregate adversely affect our business and our insurance may not be adequate to compensate us for all losses, failures, or breaches.
Fraudulent or unpermitted data access and other security or privacy breaches may negatively impact our business and harm our reputation.
Security breaches in our facilities, computer networks, and databases may cause harm to our business and reputation and result in a loss of customers. Our systems may be vulnerable to physical break-ins, computer viruses, attacks by hackers and similar disruptive problems. Third-party contractors also may experience security breaches involving the storage and transmission of proprietary information. If users gain improper access to our databases, they may be able to steal, publish, delete or modify information included in our products or confidential or sensitive customer information that is stored or transmitted on our networks. Any misappropriation and/or misuse of our information could result in us, among other things, being in breach of certain data protection and related legislation, including regulations relating to the privacy of personal or payment card information.
A security or privacy breach may affect us in the following ways:
• | deterring customers from using our solutions; |
• | deterring data suppliers from supplying data to us; |
• | harming our reputation; |
• | exposing us to liability; |
• | increasing expenses to correct problems caused by the breach; |
• | affecting our ability to meet customers’ expectations; or |
• | causing inquiry from governmental authorities. |
Incidents in which customer data has been fraudulently or improperly acquired or viewed, or any other security or privacy breaches, may occur and could go undetected. We have experienced cybersecurity attacks, as have many of our customers and suppliers. While prior cybersecurity attacks have not had a material adverse effect on our financial results, we have taken and are taking reasonable steps to prevent future events, including implementation of system security measures, information back-up and disaster recovery processes. However, these steps may not be effective and there can be no assurance that any such steps can be effective against all possible risks.
If we are unable to successfully identify acquisitions or we experience integration or other risks resulting from our acquisitions, our financial results may be adversely affected.
As we continue pursuing selective acquisitions to support our business and growth strategy, we seek to be a disciplined acquirer, and there can be no assurance that we will be able to identify suitable candidates for successful acquisition at acceptable prices. In addition, our ability to achieve the expected returns and synergies from our past and future acquisitions and alliances depends in part upon our ability to effectively integrate the offerings, technology, sales, administrative functions, and personnel of these businesses into our business. We cannot assure you that we will be successful in integrating acquired businesses or that our acquired businesses will perform at the levels we anticipate. In addition, our past and future acquisitions may subject us to unanticipated risks or liabilities or disrupt our operations.
We depend on content obtained externally to support certain of our offerings, and the inability to continue to obtain access could prove harmful to our business.
12
We obtain data from a wide variety of external sources that we transform into critical information and insight and use to create integrated solutions for our customers. Certain of our offerings include content that is either purchased or licensed from third parties. In particular, our industry standards offerings that are part of our Product Design workflow rely on information licensed from SDOs. Offerings that rely upon SDO information accounted for less than 15 percent of our total revenue in 2014. We believe that the content licensed from many of these third parties, including the SDOs, cannot be obtained from alternate sources on favorable terms, if at all. Our license agreements with these third parties are generally nonexclusive and many are terminable on less than one year's notice. In addition, many of these third parties, including the SDOs, compete with one another and with us. If we lose access to a significant number of data sources and cannot replace the data through alternative sources or we are unable to obtain information licensed to us at cost-effective prices, specific customer solutions may be impacted and it could adversely affect the quality of our offerings and our business, financial condition, and operating results.
Our strategic investments and cost reduction initiatives may not result in anticipated savings or more efficient operations.
Over the past several years, including in 2014, we implemented significant strategic initiatives to reduce our cost structure, standardize our operations, and improve our ability to grow. We are deploying new processes and many of our colleagues across the business are changing the way they perform certain roles to capture efficiencies. We must also continue to invest in enhancing our existing products, including the development of new platforms to deliver our products, to meet the needs of our customers and differentiate our offerings from those of our competitors. There is risk that we may not realize the full potential benefit of our investments.
We may not be able to protect intellectual property rights.
We rely on copyright laws and nondisclosure, license, and confidentiality arrangements to protect our proprietary rights as well as the intellectual property rights of third parties whose content we license. However, we cannot assure you that the steps we have taken to protect our intellectual property rights, and the rights of those from whom we license intellectual property, are adequate to prevent unauthorized use, misappropriation, or theft of our intellectual property. We may also not be able to detect unauthorized uses or take timely and effective steps to remedy unauthorized conduct. In particular, a portion of our revenues are derived from jurisdictions where adequately protecting intellectual property rights may prove more challenging or impossible. To prevent or respond to unauthorized uses of our intellectual property, we might be required to engage in costly and time-consuming litigation and we may not ultimately prevail.
We may be exposed to litigation related to content we make available to customers and we may face legal liability or damage to our reputation if our customers are not satisfied with our offerings or if our offerings are misused.
Our business relies on licensing and delivering intellectual property to our customers and obtaining intellectual property from our suppliers. Accordingly, we may face potential liability for, among other things, breach of contract, negligence, and copyright and trademark infringement. Even litigation or infringement claims that lack merit may expose us to material expense or reputational damage. Damage to our reputation for any reason could adversely affect our ability to attract and retain customers, employees, and information suppliers. In addition, if the information in our offerings is incorrect for any reason, or if it is misused or used inappropriately, we could be subject to reputational damage or litigation that could exceed the value of any insurance coverage and adversely affect our business.
We rely on independent contractors and third parties whose actions could have a material adverse effect on our business.
We use independent contractors to help us obtain certain information. In addition, we rely on third-party dealers to sell our offerings in locations where we do not maintain a sales office or sales teams. We are limited in our ability to monitor and direct the activities of our independent contractors, but if any actions or business practices of these individuals or entities violate our policies or procedures or are otherwise deemed inappropriate or illegal, we could be subject to litigation, regulatory sanctions, or reputational damage, any of which could have a material adverse effect on our business.
As part of our strategic business model, we outsource certain operations and engage independent contractors to perform work in various locations around the world. For example, we outsource certain data hosting functions, as well as certain functions involving our data transformation process, to business partners who we believe offer us deep expertise in these areas, as well as scalability and cost effective services. By entering into these independent contractor arrangements and relying on them for critical business functions, we face risks that one or more independent contractors may unexpectedly cease operations, that they may perform work that deviates from our standards, that events in a given region may disrupt the independent contractor's operations, or that we may not be able to adequately protect our intellectual property. If these or other unforeseen risks were to occur, they could adversely affect our business.
13
We operate in competitive markets, which may adversely affect our market share and financial results.
While we do not believe that we have a direct competitor across all of our workflows and industry solutions, we face competition in specific industries and with respect to specific offerings. We may also face competition from organizations and businesses that have not traditionally competed with us but that could adapt their products and services or utilize significant financial and information-gathering resources, recognized brands, or technological expertise to begin competing with us. We believe that competitors are continuously enhancing their products and services, developing new products and services, and investing in technology to better serve the needs of their existing customers and to attract new customers. Increased competition could require us to make additional capital investments. Some of our competitors may also choose to sell products competitive with ours at lower prices, which may require us to reduce the prices of our offerings. An increase in our capital investments or price reductions by our competitors could negatively impact our margins and results of operations.
Some of the critical information we use in our offerings is publicly available in raw form at little or no cost.
The Internet, widespread availability of sophisticated search engines, and pervasive wireless data delivery have simplified the process of locating, gathering, and disseminating data, potentially diminishing the perceived value of our offerings. While we believe our offerings are distinguished by such factors as currency, accuracy and completeness, and our analysis and other added value, if users choose to obtain the information they need from public or other sources, our business, financial condition, and results of operations could be adversely affected.
Our brand and reputation are key assets and competitive advantages of our company and our business may be affected by how we are perceived in the marketplace.
Our ability to attract and retain customers is affected by external perceptions of our brand and reputation. Reputational damage from negative perceptions or publicity could damage our reputation with customers, prospects, and the public generally. Although we monitor developments for areas of potential risk to our reputation and brand, negative perceptions or publicity could have a material adverse effect on our business and financial results.
Changes in the legislative, regulatory, and commercial environments in which we operate may adversely impact our ability to collect, compile, use, and publish data and may impact our financial results.
Certain types of information we collect, compile, use, and publish, including offerings in our IHS Automotive and CARFAX businesses, are subject to regulation by governmental authorities in jurisdictions in which we operate. In addition, there is increasing concern among certain privacy advocates and government regulators regarding marketing and privacy matters, particularly as they relate to individual privacy interests. These concerns may result in new or amended laws and regulations. Future laws and regulations with respect to the collection, compilation, use, and publication of information and consumer privacy could result in limitations on our operations, increased compliance or litigation expense, adverse publicity, or loss of revenue, which could have a material adverse effect on our business, financial condition, and operating results. It is also possible that we could be prohibited from collecting or disseminating certain types of data, which could affect our ability to meet our customers’ needs.
Our international operations are subject to exchange rate fluctuations and other risks relating to worldwide operations.
We operate in many countries around the world and a significant part of our revenue comes from international sales. In 2014, we generated approximately 40 percent of our revenues from sales outside the United States. Approximately 20 percent of our revenue is transacted in currencies other than the U.S. dollar. We earn revenues, pay expenses, own assets, and incur liabilities in countries using currencies other than the U.S. dollar, including the British Pound, the Canadian Dollar, and the Euro. Because our consolidated financial statements are presented in U.S. dollars, we must translate revenues, income, expenses, and the value of assets and liabilities into U.S. dollars at exchange rates in effect during or at the end of each reporting period. We may use derivative financial instruments to reduce our net exposure to currency exchange rate fluctuations. Nevertheless, increases or decreases in the value of the U.S. dollar against other major currencies can materially affect our net operating revenues, operating income, and the value of balance sheet items denominated in foreign currencies.
Operating in many jurisdictions around the world, we may be affected by: changes in tax rates and tax laws or their interpretation, including changes related to tax holidays or tax incentives; trade protection laws, policies and measures, and other regulatory requirements affecting trade and investment; unexpected changes in regulatory requirements; social, political, labor, or economic conditions in a specific country or region; and difficulties in staffing and managing local operations. We must also manage the uncertainties of obtaining data and creating solutions that are relevant to particular geographic markets; differing
14
levels of intellectual property protection in various jurisdictions; and potential adverse tax consequences on the repatriation of funds. In addition, as we operate our business around the world, we must manage the potential conflicts between locally accepted business practices in any given jurisdiction and our obligations to comply with laws and regulations, including anti-corruption regulations applicable to us, such as the U.S. Foreign Corrupt Practices Act and the UK Bribery Act. We have developed and instituted a corporate compliance program which includes, among other things, employee training and the creation of appropriate policies defining employee behavior that mandate adherence to laws. While we implement policies and procedures intended to promote and facilitate compliance with all applicable laws, our employees, contractors, and agents, as well as those independent companies to which we outsource certain business operations, may take actions in violation of our policies. Any such violation, even if prohibited by our policies, could have an adverse effect on our business and reputation.
Our inability to manage some or all of these risks of operating a global business could have a material adverse effect on our business, financial condition, and operating results.
Our business performance might not be sufficient for us to meet the full-year financial guidance that we provide publicly.
We provide full-year financial guidance to the public based upon our assumptions regarding our expected financial performance. For example, we provide assumptions regarding our ability to grow revenue and to achieve our profitability targets. While we believe that our annual financial guidance provides investors and analysts with insight to our view of the company's future performance, such financial guidance is based on assumptions that may not always prove to be accurate and may vary from actual results. If we fail to meet the full-year financial guidance that we provide, or if we find it necessary to revise such guidance during the year, the market value of our common stock could be adversely affected.
The price of our common stock may be volatile and may be affected by market conditions beyond our control.
Our share price is likely to fluctuate in the future because of the volatility of the stock market in general and a variety of factors, many of which are beyond our control. Market fluctuations could result in volatility in the price of shares of our common stock, one possible outcome of which could be a decline in the value of your investment. In addition, if our operating results fail to meet the expectations of stock analysts or investors, or if we are perceived by the market to suffer material business or reputational damage, we may experience a significant decline in the trading price of our common stock.
Our indebtedness could adversely affect our business, financial condition, and results of operations.
Our indebtedness could have significant consequences on our future operations, including:
• | making it more difficult for us to satisfy our debt obligations and our other ongoing business obligations, which may result in defaults; |
• | events of default if we fail to comply with the financial and other covenants contained in the agreements governing our debt instruments, which could result in all of our debt becoming immediately due and payable or require us to negotiate an amendment to financial or other covenants that could cause us to incur additional fees and expenses; |
• | sensitivity to interest rate increases on our variable rate outstanding indebtedness, which could cause our debt service obligations to increase significantly; |
• | reducing the availability of our cash flow to fund working capital, capital expenditures, acquisitions and other general corporate purposes, and limiting our ability to obtain additional financing for these purposes; |
• | limiting our flexibility in planning for, or reacting to, and increasing our vulnerability to, changes in our business, the industries in which we operate, and the overall economy; |
• | placing us at a competitive disadvantage compared to any of our competitors that have less debt or are less leveraged; and |
• | increasing our vulnerability to the impact of adverse economic and industry conditions. |
Our ability to meet our payment and other obligations under our debt instruments depends on our ability to generate significant cash flow in the future. This, to some extent, is subject to general economic, financial, competitive, legislative and regulatory factors as well as other factors that are beyond our control. We cannot assure you that our business will generate cash flow from operations, or that future borrowings will be available to us under our existing or any future credit facilities or otherwise, in an amount sufficient to enable us to meet our debt obligations and to fund other liquidity needs. We may incur substantial additional indebtedness, including secured indebtedness, for many reasons, including to fund acquisitions. If we add additional debt or other liabilities, the related risks that we face could intensify.
Item 1B. Unresolved Staff Comments
15
None.
Item 2. Properties
Our Facilities
Our colleagues work in offices at 129 locations around the world, comprised of 67 offices in the Americas (54 in the United States), 38 offices in EMEA, and 24 offices in APAC. We own the buildings at three of our facilities, including our headquarters in Englewood, Colorado, and two other office locations. All of our other facilities are leased with terms ranging from month-to-month at several locations to an expiration date in 2027 for one of our facilities. We believe that our properties, taken as a whole, are in good operating condition, are suitable and adequate for our current business operations, and that additional or alternative space will be available on commercially reasonable terms for future use and expansion.
Item 3. Legal Proceedings
See "Item 8 - Financial Statements and Supplementary Data - Notes to Consolidated Financial Statements - Note 15" in Part II of this Form 10-K for information about legal proceedings.
Item 4. Mine Safety Disclosures
Not applicable.
PART II
Item 5. Market for the Registrant's Common Equity, Related Stockholder Matters and Issuer Purchases of Equity Securities
Our Class A common stock is quoted on the New York Stock Exchange under the symbol “IHS.” The following table sets forth for the indicated periods the high and low sales prices per share for our Class A common stock on the New York Stock Exchange:
Fiscal Year 2014 Quarters Ended: | High | Low | ||||||
February 28, 2014 | $ | 123.95 | $ | 110.44 | ||||
May 31, 2014 | 126.83 | 116.76 | ||||||
August 31, 2014 | 143.49 | 124.62 | ||||||
November 30, 2014 | 143.92 | 118.41 | ||||||
Fiscal Year 2013 Quarters Ended: | High | Low | ||||||
February 28, 2013 | $ | 109.69 | $ | 89.58 | ||||
May 31, 2013 | 115.64 | 95.43 | ||||||
August 31, 2013 | 117.12 | 95.03 | ||||||
November 30, 2013 | 117.65 | 107.31 | ||||||
We have been advised by our transfer agent, American Stock Transfer, that we had 58 holders of record of our Class A Common Stock as of December 31, 2014. Based on reports of security position listings and the number of proxies requested by brokers in conjunction with the prior year’s annual meeting of stockholders, we believe we have approximately 41,000 beneficial holders of our Class A Common Stock.
Our authorized capital stock consists of 160,000,000 shares of Class A common stock. The holders of our Class A common stock are entitled to one vote per share.
Dividend Policy
We have not previously paid a dividend, and we do not anticipate paying any dividends in the foreseeable future.
16
Securities Authorized for Issuance Under Equity Compensation Plans
The following table sets forth information as of the end of fiscal year 2014 with respect to compensation plans under which equity securities are authorized for issuance.
Equity Compensation Plan Information | |||||||||
Plan Category | Number of securities to be issued upon exercise of outstanding options, warrants and rights ( a ) | Weighted-average exercise price of outstanding options, warrants, and rights ( b ) | Number of securities remaining available for issuance under equity compensation plans (excluding securities reflected in column (a)) ( c ) | ||||||
Equity compensation plans approved by security holders | 3,379,506 | (1) | N/A | (2) | 2,177,440 | (3) | |||
Equity compensation plans not approved by security holders | N/A | N/A | N/A | ||||||
Total | 3,379,506 | N/A | 2,177,440 | ||||||
(1) Includes (a) 2,304,974 restricted stock units and performance stock units at target performance levels that were issued with no exercise price or other consideration, (b) 938,531 shares reserved for issuance if above target performance levels on performance-based stock units are met, (c) 121,848 deferred stock units payable to non-employee directors upon their termination of service, and (d) 14,153 restricted stock units that are payable in cash. | |||||||||
(2) There are no outstanding stock options, warrants, or rights. | |||||||||
(3) Includes shares surrendered to the Company upon vesting of time- and performance-based restricted stock units for a value equal to their minimum statutory tax liability. | |||||||||
Issuer Purchases of Equity Securities
The following table provides detail about our share repurchases during the three months ended November 30, 2014. See "Item 8 - Financial Statements and Supplementary Data - Notes to Consolidated Financial Statements - Note 16" in Part II of this Form 10-K for information regarding our stock repurchase programs.
Total Number of Shares Purchased (1) | Average Price Paid per Share | Total Number of Shares Purchased as Part of Publicly Announced Plans or Programs | Maximum Dollar Value of Shares That May Yet Be Purchased Under the Plans or Programs (in thousands) (3) | ||||||||||
September 1 - September 30, 2014: | |||||||||||||
Share repurchase programs (1) | — | $ | — | — | $ | 4,021 | |||||||
Employee transactions (2) | — | $ | — | N/A | N/A | ||||||||
October 1 - October 31, 2014: | |||||||||||||
Share repurchase programs (1) | — | $ | — | — | $ | 4,021 | |||||||
Employee transactions (2) | 8,668 | $ | 123.92 | N/A | N/A | ||||||||
November 1 - November 30, 2014: | |||||||||||||
Share repurchase programs (1) | — | $ | — | — | $ | 4,021 | |||||||
Employee transactions (2) | 77,749 | $ | 129.94 | N/A | N/A | ||||||||
Total share repurchases | 86,417 | $ | 129.33 | — | |||||||||
(1) In March 2011, our board of directors authorized the repurchase of up to one million shares of Class A common stock per fiscal year in the open market (the March 2011 Program). We may execute on this program at our discretion, balancing dilution offset with other investment opportunities of the business, including acquisitions. The March 2011 Program does not have an expiration date.
In October 2012, our board of directors authorized the repurchase of shares of Class A common stock with a maximum aggregate value of $100 million (the October 2012 Program). We may repurchase shares of Class A common stock in open market purchases or through privately negotiated transactions in compliance with Rule 10b-18 under the Securities Exchange Act of 1934, as amended (Exchange Act), subject to market conditions, applicable legal requirements, and other relevant factors. The October 2012 Program does not obligate us to repurchase any dollar amount or number of shares of Class A common stock, and it may be suspended at any time at our discretion.
17
(2) Amounts represent shares of Class A common stock surrendered by employees in an amount equal to the statutory tax liability associated with the vesting of their equity awards. We then pay the statutory tax on behalf of the employee. Our board of directors approved this program in 2006 in an effort to reduce the dilutive effects of employee equity grants.
(3) Amounts represent remaining dollar value of shares of Class A common stock that may yet be purchased under the October 2012 Program. In addition, the March 2011 Program allows us to repurchase up to one million additional shares of Class A common stock per fiscal year. Since no common shares were repurchased under the March 2011 Program in fiscal 2014, at the end of each of September 2014, October 2014, and November 2014, there were one million shares of Class A common stock that may yet have been purchased at the end of each of those months under the March 2011 Program.
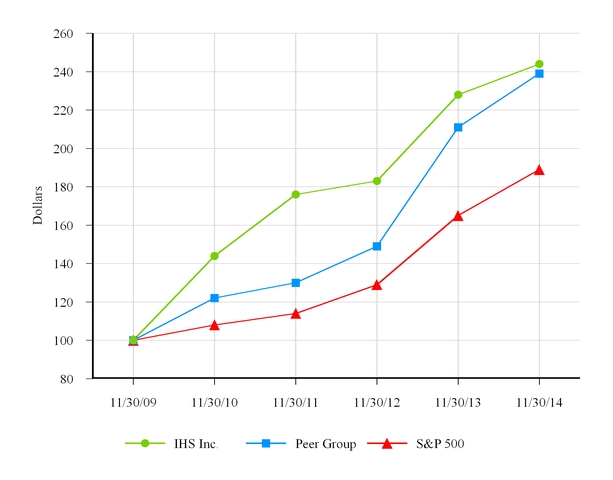
Performance Graph
The following graph compares our total cumulative stockholder return with the Standard & Poor's Composite Stock Index (S&P 500) and a peer index representing the total price change of The Corporate Executive Board Company; The Dun & Bradstreet Corporation; Equifax Inc.; FactSet Research Systems Inc.; Gartner, Inc.; McGraw Hill Financial, Inc.; Moody’s Corporation; MSCI Inc.; Nielsen Holdings N.V.; Solera Holdings, Inc.; Thomson Reuters Corporation; and Verisk Analytics, Inc.
The graph assumes a $100 cash investment on November 30, 2009 and the reinvestment of all dividends (which we did not pay). This graph is not indicative of future financial performance.
Comparison of Cumulative Total Return Among IHS Inc., S&P 500 Index, and Peer Group
18
Item 6. Selected Financial Data
You should read the following selected consolidated financial data in conjunction with "Management's Discussion and Analysis of Financial Condition and Results of Operations" and our consolidated financial statements and the related notes appearing in Part II of this Form 10-K.
Years Ended November 30, | |||||||||||||||
2014 | 2013 | 2012 | 2011 | 2010 | |||||||||||
(in thousands, except for per share amounts) | |||||||||||||||
Statement of Operations Data: | |||||||||||||||
Revenue | $ | 2,230,794 | $ | 1,840,631 | $ | 1,529,869 | $ | 1,325,638 | $ | 1,057,742 | |||||
Income from continuing operations | 194,549 | 131,834 | 158,149 | 135,289 | 133,517 | ||||||||||
Income (loss) from discontinued operations | — | (101 | ) | 19 | 126 | 4,223 | |||||||||
Net income | 194,549 | 131,733 | 158,168 | 135,415 | 137,740 | ||||||||||
Basic earnings per share: | |||||||||||||||
Income from continuing operations | $ | 2.85 | $ | 1.98 | $ | 2.40 | $ | 2.08 | $ | 2.09 | |||||
Income from discontinued operations | — | — | — | — | 0.07 | ||||||||||
Net income | $ | 2.85 | $ | 1.98 | $ | 2.40 | $ | 2.09 | $ | 2.15 | |||||
Diluted earnings per share: | |||||||||||||||
Income from continuing operations | $ | 2.81 | $ | 1.95 | $ | 2.37 | $ | 2.06 | $ | 2.06 | |||||
Income from discontinued operations | — | — | — | — | 0.07 | ||||||||||
Net income | $ | 2.81 | $ | 1.95 | $ | 2.37 | $ | 2.06 | $ | 2.13 | |||||
Balance Sheet Data (as of period end): | |||||||||||||||
Cash and cash equivalents | $ | 153,156 | $ | 258,367 | $ | 345,008 | $ | 234,685 | $ | 200,735 | |||||
Total assets | 5,348,430 | 5,359,613 | 3,549,211 | 3,073,037 | 2,155,702 | ||||||||||
Total long-term debt and capital leases | 1,806,098 | 1,779,065 | 890,922 | 658,911 | 275,095 | ||||||||||
Total stockholders' equity | 2,159,546 | 1,906,963 | 1,584,358 | 1,384,729 | 1,176,081 | ||||||||||
19
Item 7. | Management’s Discussion and Analysis of Financial Condition and Results of Operations |
The following discussion of our financial condition and operating results should be read in conjunction with other information and disclosures elsewhere in this Form 10-K, including “Selected Financial Data,” our consolidated financial statements and accompanying notes, and "Website and Social Media Disclosure." The following discussion includes forward-looking statements as described in “Cautionary Note Regarding Forward-Looking Statements” in this Form 10-K. A detailed discussion of risks and uncertainties that could cause actual results and events to differ materially from such forward-looking statements is outlined under “Risk Factors” in this Form 10-K.
Executive Summary
Business Overview
We are a leading source of information, insight, and analytics in critical areas that shape today's business landscape. Businesses and governments in more than 150 countries around the globe rely on our comprehensive content, expert independent analysis, and flexible delivery methods. Our aim is to embed our solutions within the entire spectrum of our customers’ organization, enabling executive level capital deployment strategies and following decision-making activities throughout their organizations to front-line employees tasked with managing their company’s complex core daily operations. We have been in business since 1959 and became a publicly traded company on the New York Stock Exchange in 2005. Headquartered in Englewood, Colorado, USA, we are committed to sustainable, profitable growth and employ approximately 8,800 people in 32 countries around the world.
Inherent in all of our strategies is a firm commitment to put our customers first in everything that we do. To best serve our customers and be as close to them as possible, we are organized by geographies into three business segments: Americas, EMEA, and APAC. Our integrated global organization is designed to make it easier for our customers to do business with us by providing a cohesive, consistent, and effective sales-and-marketing approach in each local region.
Subscriptions represented approximately 77 percent of our total revenue in 2014. Our subscription agreements are typically annual and non-cancellable for the term of the subscription and may contain provisions for minimum monthly payments. For subscription revenue, the timing of our cash flows generally precedes the recognition of revenue and income, and therefore, we typically have good revenue visibility.
Our business has seasonal aspects. Our fourth quarter typically generates our highest quarterly levels of revenue and profit. Conversely, our first quarter generally has our lowest quarterly levels of revenue and profit. We also experience event-driven seasonality in our business; for instance, IHS Energy CERAWeek, an annual energy executive gathering, is held during our second quarter. Another example is the biennial release of the Boiler Pressure Vessel Code (BPVC) engineering standard, which generates revenue for us predominantly in the third quarter of every other year. We most recently recognized a benefit in connection with the BPVC release in the third quarter of 2013.
During 2014, we focused on advancing our strategic priorities of commercial expansion and operational excellence, as described below.
• | Commercial expansion. We introduced a number of new products and analytics during 2014, including five major technical releases on IHS Connect, our business and market intelligence platform that provides efficient access to industry analysis, in-depth market research, and economic forecasts. We made progress on our IHS Engineering Workbench with two major commercial launches (Engineering360 and Knowledge Collections), as well as completing further development and releases of our Energy platforms and IHS Sphera, our Operational Excellence and Risk Management enterprise platform. |
We also made progress on expanding customer relationships and leveraging our global footprint in 2014, as we focused on working with our Target 1000 accounts (which includes existing customers and potential new customers) and building business momentum with our global field sales teams, inside sales infrastructure, and eCommerce platform.
• | Operational excellence. We continue to concentrate our focus on improving our internal systems and processes to allow us to be more efficient every day, and our efforts are designed to allow us to capture new growth and expand margins as we fully leverage our global infrastructure. During 2014, we made progress in further developing our sales |
20
systems, pipelines, and opportunity management in addition to refining our ERP system and accounting and customer care centers of excellence.
In 2015, we expect to continue to focus on these key strategic priorities, as well as expand our business through strategic acquisitions.
Key Performance Indicators
We believe that revenue growth, Adjusted EBITDA (both in dollars and margin), and free cash flow are the key measures of our success. Adjusted EBITDA and free cash flow are financial measures that are not prepared in accordance with U.S. generally accepted accounting principles (non-GAAP).
Revenue growth. We review year-over-year revenue growth in our segments as a key measure of our success in addressing customer needs in each region of the world in which we operate. We measure revenue growth in terms of organic, acquisitive, and foreign currency impacts. We define these components as follows:
• | Organic – We define organic revenue growth as total revenue growth from continuing operations for all factors other than acquisitions and foreign currency movements. We drive this type of revenue growth through value realization (pricing), expanding wallet share of existing customers through up-selling and cross-selling efforts, securing new customer business, and through the sale of new or enhanced product offerings. |
• | Acquisitive – We define acquisition-related revenue as the revenue generated from acquired products and services from the date of acquisition to the first anniversary date of that acquisition. This type of growth comes as a result of our strategy to purchase, integrate, and leverage the value of assets we acquire. We also include the impact of divestitures in this growth metric. |
• | Foreign currency – We define the foreign currency impact on revenue as the difference between current revenue at current exchange rates and current revenue at the corresponding prior period exchange rates. Due to the significance of revenue transacted in foreign currencies, we measure the impact of foreign currency movements on revenue. |
We also measure and report revenue by transaction type. Understanding revenue by transaction type helps us identify broad changes in product mix. We summarize our transaction type revenue into the following two categories:
• | Subscription revenue represents the significant majority of our revenue, and is comprised of subscriptions to our various information offerings and software maintenance. |
• | Non-subscription revenue represents consulting (e.g., research and analysis, modeling, and forecasting), services, single-document product sales, software license sales and associated services, conferences and events, and advertising. Our non-subscription products and services are an important part of our business because they complement our subscription business in creating strong and comprehensive customer relationships. |
We have also recently begun measuring and reporting revenue by product category, which helps us understand performance based on our capabilities within key vertical industries and horizontal workflows.
Non-GAAP measures. We use non-GAAP financial measures such as EBITDA, Adjusted EBITDA, and free cash flow in our operational and financial decision-making, and believe that such measures allow us to focus on what we deem to be more reliable indicators of ongoing operating performance (Adjusted EBITDA) and our ability to generate cash flow from operations (free cash flow). We also believe that investors may find non-GAAP financial measures useful for the same reasons, although we caution readers that non-GAAP financial measures are not a substitute for GAAP financial measures or disclosures. None of these non-GAAP financial measures are recognized terms under GAAP and do not purport to be an alternative to net income or operating cash flow as an indicator of operating performance or any other GAAP measure. Throughout this section on management’s discussion and analysis and on our website (www.ihs.com), we provide reconciliations of these non-GAAP financial measures to the most directly comparable GAAP measures.
EBITDA and Adjusted EBITDA. EBITDA and Adjusted EBITDA are used by many of our investors, research analysts, investment bankers, and lenders to assess our operating performance. For example, a measure similar to Adjusted EBITDA is required by the lenders under our term loan and revolving credit agreements. We define EBITDA as net income plus or minus net interest, plus provision for income taxes, depreciation, and amortization.
21
Our definition of Adjusted EBITDA further excludes primarily non-cash items and other items that management does not consider to be useful in assessing our operating performance (e.g., stock-based compensation expense, restructuring charges, acquisition-related costs, asset impairment charges, gain or loss on sale of assets, gain or loss on debt extinguishment, pension mark-to-market and settlement expense, and income or loss from discontinued operations).
Free Cash Flow. We define free cash flow as net cash provided by operating activities less capital expenditures.
Because not all companies use identical calculations, our presentation of non-GAAP financial measures may not be comparable to other similarly titled measures of other companies. However, these measures can still be useful in evaluating our performance against our peer companies because we believe the measures provide users with valuable insight into key components of GAAP financial disclosures. For example, a company with higher GAAP net income may not be as appealing to investors if its net income is more heavily comprised of gains on asset sales. Likewise, eliminating the effects of interest income and expense moderates the impact of a company’s capital structure on its performance.
Strategic Acquisitions
We paid a total purchase price of approximately $210 million for acquisitions we completed during the year ended November 30, 2014. We paid a total purchase price of approximately $1.6 billion for acquisitions we completed during the year ended November 30, 2013, and we paid a total purchase price of approximately $306 million for acquisitions we completed during the year ended November 30, 2012. Our consolidated financial statements include the results of operations and cash flows for these business combinations beginning on their respective dates of acquisition.
Acquisitions are a key part of our growth strategy, and we expect that they will continue to be important for us. We focus on acquisitions that have long-term growth potential, target high-growth markets, and fill a strategic need in our business portfolio as we seek to provide comprehensive solutions to our customers. For example, the acquisition of R. L. Polk (Polk acquisition) in July 2013 supported our value creation proposition by providing a comprehensive global view of the automotive value chain to our customers. Acquisitions also provide us with increased organic growth potential as we integrate these new offerings for our customers. For a more detailed description of our recent acquisition activity, see "Item 8 - Financial Statements and Supplementary Data - Notes to Consolidated Financial Statements - Note 3" in Part II of this Form 10-K.
Global Operations
Approximately 40 percent of our revenue is transacted outside of the United States; however, only about 20 percent of our revenue is transacted in currencies other than the U.S. dollar. As a result, a strengthening U.S. dollar relative to certain currencies has historically resulted in a negative impact to our revenue; conversely, a weakening U.S. dollar has historically resulted in a positive impact on our revenue. However, the impact on operating income is diminished due to certain operating expenses denominated in currencies other than the U.S. dollar. Our largest foreign currency revenue exposures, in order of magnitude, are the British Pound, the Canadian Dollar, and the Euro. See "Quantitative and Qualitative Disclosures About Market Risk – Foreign Currency Exchange Rate Risk" for additional discussion of the impacts of foreign currencies on our operations.
Pricing information
We customize many of our sales offerings to meet individual customer needs and base our pricing on a number of factors, including the number of customer locations, the number of simultaneous users, various segmentation methods such as customer size, and the breadth of the content to be included in the offering. Because of the level of offering customization we employ, it is difficult for us to evaluate pricing impacts on a period-to-period basis. This analysis is further complicated by the fact that the offering sets purchased by customers are often not constant between periods. As a result, we are not able to precisely differentiate between pricing and volume impacts on changes in revenue.
Other Items
Cost of operating our business. We incur our cost of revenue primarily through acquiring, managing, and delivering our offerings. These costs include personnel, information technology, and occupancy costs, as well as royalty payments to third-party information providers. Royalty payments are based on the level of subscription sales from certain product offerings. Our sales, general, and administrative expenses include wages and other personnel costs, commissions, corporate occupancy costs, and marketing costs.
22
A large portion of our operating expenses are not directly commensurate with volume sold, particularly in our subscription-based business. Some of our revenue is driven from the sale of specifications and standards; a portion of this content is obtained from standards development organizations.
Stock-based compensation expense. We issue equity awards to our employees, almost exclusively restricted stock units, for which we record cost over the respective vesting periods. The typical vesting period is three years. As of November 30, 2014, we had approximately 2.3 million unvested stock-based awards outstanding, of which approximately 1.3 million were performance-based awards. The majority of the annual grants for our highest-ranking employees are performance-based awards. The vesting of the performance shares granted in 2013 and 2014 is principally based on achieving certain financial performance levels during fiscal years 2015 and 2016, respectively.
As of November 30, 2014, we believe that more than the target number of shares issuable for the 2015 and 2016 fiscal years will vest based on meeting certain performance targets. Using these estimates in addition to estimated 2015 grants, projected stock-based compensation expense for 2015 is expected to be approximately $150-160 million. Grant date fair values for 2015 grants that differ from our projections or a change in the actual performance levels that we achieve could result in a change in the actual amount of stock-based compensation that we recognize. For example, in the event we do not achieve the projected performance metrics for 2015 or 2016, our stock-based compensation expense could decrease. Conversely, if we exceed the projected performance metrics, our stock-based compensation could increase.
Pension and postretirement benefits. We provide the following pension and postretirement plans:
• | U.S. Retirement Income Plan (U.S. RIP) – this frozen defined-benefit plan covers a substantial number of our employees in the United States. |
• | U.K. Retirement Income Plan (U.K. RIP) – this frozen defined-benefit plan covers a limited number of our employees in the United Kingdom. |
• | Postretirement medical plan – this plan is a contributory fixed payment plan that provides access to group rates for U.S. employees who meet specified conditions. |
• | Supplemental Income Plan (SIP) – this plan is a non-qualified pension plan for certain company personnel. |
Effective July 11, 2014, we discontinued future accruals to the U.S. RIP and SIP. In lieu of future accruals to the U.S. RIP and SIP, we will now provide an annual company non-elective contribution to the 401(k) accounts of affected eligible employees if they are active employees at the end of the calendar year.
Critical Accounting Policies and Estimates
Our consolidated financial statements are prepared in accordance with U.S. GAAP. In applying U.S. GAAP, we make significant estimates and judgments that affect our reported amounts of assets, liabilities, revenues, and expenses, as well as disclosure of contingent assets and liabilities. We believe that our accounting estimates and judgments are reasonable when made, but in many instances, alternative estimates and judgments would also be acceptable. In addition, changes in the accounting estimates are reasonably likely to occur from period to period. Accordingly, actual results could differ significantly from our estimates. To the extent that there are material differences between these estimates and actual results, our financial condition or results of operations will be affected. We base our estimates on historical experience and other assumptions that we believe are reasonable, and we evaluate these estimates on an ongoing basis. We refer to accounting estimates of this type as critical accounting policies and estimates, which are discussed further below.
Revenue Recognition. The majority of our offerings are provided under agreements containing standard terms and conditions. Approximately 77 percent of our 2014 revenue was derived from the sale of subscriptions, which is initially deferred and then recognized ratably as delivered over the subscription period. These standard agreements typically do not require any significant judgments about when revenue should be recognized. For non-standard agreements, we generally make judgments about revenue recognition matters such as whether sufficient legally binding terms and conditions exist and whether customer acceptance has been received.
We review customer agreements and utilize advice from legal counsel, as appropriate, in evaluating the binding nature of contract terms and conditions, as well as whether customer acceptance has been achieved. We estimate progress on consulting project deliverables based on our knowledge and judgment about the current status of individual consulting engagements.
Historically, our judgments and estimates have been reasonably accurate, as we have not experienced significant disputes with our customers regarding the timing and acceptance of delivered products and services. However, our actual experience in future periods with respect to binding terms and conditions and customer acceptance may differ from our historical experience.
23
Business Combinations. We allocate the total cost of an acquisition to the underlying net assets based on their respective estimated fair values. As part of this allocation process, we identify and attribute values and estimated lives to the intangible assets acquired. These determinations involve significant estimates and assumptions about several highly subjective variables, including future cash flows, discount rates, and asset lives. There are also different valuation models for each component, the selection of which requires considerable judgment. Our estimates and assumptions may be based, in part, on the availability of listed market prices or other transparent market data. These determinations will affect the amount of amortization expense recognized in future periods. We base our fair value estimates on assumptions we believe are reasonable, but recognize that the assumptions are inherently uncertain. Depending on the size of the purchase price of a particular acquisition and the mix of intangible assets acquired, the purchase price allocation could be materially impacted by applying a different set of assumptions and estimates.
Goodwill and Other Intangible Assets. We make various assumptions about our goodwill and other intangible assets, including their estimated useful lives and whether any potential impairment events have occurred. We perform impairment analyses on the carrying values of goodwill and indefinite-lived intangible assets at least annually. Additionally, we review the carrying value of goodwill and other intangible assets whenever events or changes in circumstances indicate that their carrying amounts may not be recoverable. Examples of such events or changes in circumstances, many of which are subjective in nature, include the following:
•Significant negative industry or economic trends;
•A significant change in the manner of our use of the acquired assets or our strategy;
•A significant decrease in the market value of the asset; and
•A significant change in legal factors or in the business climate that could affect the value of the asset.
If an impairment indicator is present, we perform an analysis to confirm whether an impairment has actually occurred and if so, the amount of the required charge.
For finite-lived intangible assets, we review the carrying amount at least annually to determine whether current events or circumstances require an adjustment to the carrying amount. A finite-lived intangible asset is considered to be impaired if its carrying value exceeds the estimated future undiscounted cash flows to be derived from it. We exercise judgment in selecting the assumptions used in the estimated future undiscounted cash flows analysis. Any impairment is measured by the amount that the carrying value of such assets exceeds their fair value.
For indefinite-lived intangible assets other than goodwill, we first conduct a qualitative analysis to determine whether we believe it is more likely than not that an asset has been impaired. If we believe an impairment has occurred, we then evaluate for impairment by comparing the amount by which the carrying value of the asset exceeds its fair value, primarily based on estimated discounted cash flows. We exercise judgment in selecting the assumptions used in the estimated discounted cash flows analysis.
For goodwill, we determine the fair value of each reporting unit, then compare the fair value of each reporting unit to its carrying value. If carrying value exceeds fair value for any reporting unit, then we calculate and compare the implied fair value of goodwill to the carrying amount of goodwill and record an impairment charge for any excess of carrying value over implied fair value.
The determination of fair value requires a number of significant assumptions and judgments, including assumptions about future economic conditions, revenue growth, operating margins, and discount rates. The use of different estimates or assumptions within our projected future cash flows model, or the use of a methodology other than a projected future cash flow model, could result in significantly different fair values for our goodwill and other intangible assets.
Income Taxes. We exercise significant judgment in determining our provision for income taxes, current tax assets and liabilities, deferred tax assets and liabilities, future taxable income (for purposes of assessing our ability to realize future benefit from our deferred tax assets), and recorded reserves related to uncertain tax positions. A valuation allowance is established to reduce our deferred tax assets to the amount that is considered more likely than not to be realized through the generation of future taxable income and other tax planning opportunities. To the extent that a determination is made to establish or adjust a valuation allowance, the expense or benefit is recorded in the period in which the determination is made.
If actual results differ from estimates we have used, or if we adjust these estimates in future periods, our operating results and financial position could be materially affected.
24
Pension and Postretirement Benefits. During the fourth quarter of each fiscal year (or upon any remeasurement date), we immediately recognize net actuarial gains or losses in excess of a corridor in our operating results. The corridor amount is equivalent to 10 percent of the greater of the market-related value of plan assets or the plan's benefit obligation at the beginning of the year. We use the actual fair value of plan assets at the measurement date as the measure of the market-related value of plan assets.
Our pension expense and associated pension liability requires the use of judgment in determining assumptions about the estimated long-term rate of return on plan assets and the discount rate, as well as various demographic assumptions. Our pension investment strategy is designed to align the majority of our pension assets with the underlying pension liability, which minimizes volatility caused by changes in asset returns and discount rates. Our pension expense estimates are updated for actual experience through the remeasurement process in the fourth quarter, or sooner if earlier remeasurements are required. For 2014, as a result of the U.S. RIP plan freeze on July 11, 2014 and the associated remeasurement, we used a full-year weighted-average 5.2 percent expected long-term rate of return on plan assets and a 4.7 percent discount rate for the U.S. RIP. The actual return on U.S. RIP plan assets during 2014 was 14 percent. The difference between actual return on plan assets and expected return on plan assets was largely mitigated by the offsetting change in the pension liability resulting from movements in the discount rate.
Our pension and postretirement benefit assumptions are determined as follows:
• | We utilize a bond matching model that averages a bond universe of about 500 AA-graded non-callable bonds between the 10th and 90th percentiles for each maturity group as a proxy for setting the discount rate at year-end. |
• | Asset returns are based upon the anticipated average rate of earnings expected on invested funds of the plan over the long-term. We determined our expected return on plan assets by using the discount rate (which approximates the return on the debt securities in our portfolio) with a slight uplift for the impact of the portion of plan assets invested in equity securities. |
• | Demographic assumptions (such as turnover, retirement, and disability) are based upon historical experience and are monitored on a continuing basis to determine if adjustments to these assumptions are warranted in order to better reflect anticipated future experience. |
• | Mortality assumptions are based on recognized actuarial tables. New mortality table studies were released during 2014 that significantly increase life expectancy assumptions, and we have incorporated those new assumptions in our analysis. |
Depending on the assumptions and estimates used, our net periodic pension and postretirement benefit expense could vary significantly within a range of possible outcomes and could have a material impact on our financial results.
Discount rates and expected rates of return on plan assets are selected at the end of a given fiscal year and will impact expense in the subsequent year. A fifty-basis-point decrease in certain assumptions made at the beginning of 2014 would have resulted in the following effects on 2014 pension expense and the projected benefit obligation (PBO) as of November 30, 2014 (in thousands):
25
Impact to Pension Results - U.S. RIP | ||||||||
Change in assumption | Increase/(Decrease) to 2014 Pre-Tax Expense | Increase/(Decrease) to November 30, 2014 PBO | ||||||
50-basis-point decrease in discount rate | $ | 7,940 | $ | 8,706 | ||||
50-basis-point increase in discount rate | $ | (570 | ) | $ | (7,814 | ) | ||
50-basis-point decrease in expected return on assets | $ | 561 | $ | — | ||||
50-basis-point increase in expected return on assets | $ | (561 | ) | $ | — | |||
Impact to Pension Results - U.K. RIP | ||||||||
Change in assumption | Increase/(Decrease) to 2014 Pre-Tax Expense | Increase/(Decrease) to November 30, 2014 PBO | ||||||
50-basis-point decrease in discount rate | $ | 3,513 | $ | 4,730 | ||||
50-basis-point increase in discount rate | $ | 24 | $ | (4,329 | ) | |||
50-basis-point decrease in expected return on assets | $ | 217 | $ | — | ||||
50-basis-point increase in expected return on assets | $ | (217 | ) | $ | — | |||
Stock-Based Compensation. Our stock plans provide for the grant of various equity awards, including performance-based awards. For time-based restricted stock unit grants, we calculate stock-based compensation cost by multiplying the grant date fair market value by the number of shares granted, reduced for estimated forfeitures. The estimated forfeiture rate is based on historical experience, and we periodically review our forfeiture assumptions based on actual experience.
For performance-based restricted stock unit grants, we calculate stock-based compensation cost by multiplying the grant date fair market value by the number of shares granted, reduced for estimated forfeitures. Each quarter, we evaluate the probability of the number of shares that are expected to vest and adjust our stock-based compensation expense as appropriate. For example, in the event we do not achieve the projected performance metrics for 2015 or 2016, our stock-based compensation expense would decrease. Conversely, if we exceed the projected performance metrics, our stock-based compensation would increase.
Results of Operations
Total Revenue
Total revenue for 2014 increased 21 percent compared to the same period of 2013. Total revenue for 2013 increased 20 percent compared to the same period in 2012. The table below displays the percentage point change in revenue due to organic, acquisitive, and foreign currency factors when comparing 2014 to 2013 and 2013 to 2012.
Increase (Decrease) in Total Revenue | |||||||||
(All amounts represent percentage points) | Organic | Acquisitive | Foreign Currency | ||||||
2014 vs. 2013 | 4 | % | 17 | % | — | % | |||
2013 vs. 2012 | 4 | % | 17 | % | (1 | )% | |||
Organic revenue growth for both 2014 and 2013 was primarily attributable to continued consistent performance in our subscription-based business, which provided a 6 percent organic revenue growth rate in both 2014 and 2013. The subscription-based business represented 77 percent of total revenue in 2014 and 76 percent of total revenue in 2013. The non-subscription business decreased organically by 1 percent in 2014, with the growth rate adversely impacted by the biennial cycle of the BPVC standard, which was last released in the third quarter of 2013. Normalizing for the BPVC release cycle, we had a 1 percent non-subscription organic revenue growth rate for the year ended November 30, 2014. The non-subscription business decreased organically in 2013 by 3 percent (decreased by 5 percent when normalized for the BPVC release).
Acquisition-related revenue growth for 2014 was primarily due to the run-out of the Polk acquisition from the third quarter of 2013, as well as the run-out of other 2013 acquisitions. Our 2014 acquisitions also contributed to the increase and included the following:
•Global Trade Information Services and PCI Acrylonitrile in August 2014, and
26
•DisplaySearch, Solarbuzz, and PacWest Consulting Partners in November 2014.
Acquisition-related revenue growth for 2013 was primarily due to the Polk acquisition in the third quarter of 2013, as well as our other 2013 acquisitions and the run-out of our 2012 acquisitions. In addition to the Polk acquisition, our 2013 acquisitions included the following:
•Exclusive Analysis; the business of Dodson Data Systems; and Energy Publishing in the first quarter of 2013;
•Fekete Associates and Waterborne Energy in the second quarter of 2013; and
•PFC Energy in the third quarter of 2013.
Foreign currency movements had a negligible impact on our 2014 increase in revenue and had a minor adverse impact on our 2013 increase in revenue. Due to the extent of our global operations, foreign currency movements could continue to have an adverse impact on our results in the future.
Revenue by Segment
Year ended November 30, | % Change 2014 vs. 2013 | % Change 2013 vs. 2012 | ||||||||||||||||
(In thousands, except percentages) | 2014 | 2013 | 2012 | |||||||||||||||
Revenue: | ||||||||||||||||||
Americas | $ | 1,470,282 | $ | 1,162,582 | 912,490 | 26 | % | 27 | % | |||||||||
EMEA | 549,061 | 483,373 | 443,385 | 14 | % | 9 | % | |||||||||||
APAC | 211,451 | 194,676 | 173,994 | 9 | % | 12 | % | |||||||||||
Total revenue | $ | 2,230,794 | $ | 1,840,631 | $ | 1,529,869 | 21 | % | 20 | % | ||||||||
As a percent of total revenue: | ||||||||||||||||||
Americas | 66 | % | 63 | % | 60 | % | ||||||||||||
EMEA | 25 | % | 26 | % | 29 | % | ||||||||||||
APAC | 9 | % | 11 | % | 11 | % | ||||||||||||
Americas revenue as a percent of total revenue increased in 2013 and 2014 principally as a result of the Polk acquisition, whose revenue is predominantly generated in the U.S. The percentage change in revenue for each geographic segment is due to the factors described in the following table.
2014 vs. 2013 | 2013 vs. 2012 | ||||||||||||||||
(All amounts represent percentage points) | Organic | Acquisitive | Foreign Currency | Organic | Acquisitive | Foreign Currency | |||||||||||
Americas revenue | 4 | % | 23 | % | (1 | )% | 4 | % | 24 | % | — | % | |||||
EMEA revenue | 6 | % | 5 | % | 2 | % | 3 | % | 7 | % | (1 | )% | |||||
APAC revenue | 4 | % | 5 | % | (1 | )% | 7 | % | 6 | % | (1 | )% | |||||
We continue to experience organic revenue growth in all three geographies, with subscription-based revenue driving the majority of the increases in each of the geographies, as subscription revenue continues to provide a stable revenue stream that generates a predictable and significant cash flow. Acquisitive growth in all three geographic segments for both years was mostly due to the Polk acquisition in the third quarter of 2013. Regional geographic foreign currency movements largely offset each other in 2014 and only had a slight adverse effect on 2013.
Americas organic revenue growth was driven largely by a 5 percent increase in subscription revenue in 2014 and a 6 percent increase in subscription revenue in 2013. Americas non-subscription organic revenue growth declined 2 percent in 2014 and 3 percent in 2013. Normalizing for the BPVC impact, Americas non-subscription organic revenue growth declined 1 percent in 2014 and 6 percent in 2013. The 2013 decline reflected a decrease in consulting revenue and software license revenue.
EMEA organic revenue growth was driven largely by a 7 percent increase in subscription revenue in 2014 and a 6 percent increase in subscription revenue in 2013. EMEA non-subscription organic revenue growth was 4 percent in 2014 and negative 7 percent in 2013. The 2014 non-subscription organic revenue improvement reflected improving economics in the region, while the 2013 results were a result of lingering economic softness in EMEA.
27
APAC organic revenue growth was driven largely by a 6 percent increase in subscription revenue in 2014 and a 7 percent increase in subscription revenue in 2013. APAC non-subscription organic revenue growth was flat in 2014 compared to a 7 percent organic growth rate in 2013. The 2013 non-subscription growth was primarily due to consulting engagements in the first nine months of 2013.
Revenue by Transaction Type
Year ended November 30, | % Change 2014 vs. 2013 | % Change 2013 vs. 2012 | ||||||||||||||||
(In thousands, except percentages) | 2014 | 2013 | 2012 | |||||||||||||||
Revenue: | ||||||||||||||||||
Subscription | $ | 1,719,617 | $ | 1,404,984 | $ | 1,157,347 | 22 | % | 21 | % | ||||||||
Non-subscription revenue | 511,177 | 435,647 | 372,522 | 17 | % | 17 | % | |||||||||||
Total revenue | $ | 2,230,794 | $ | 1,840,631 | $ | 1,529,869 | 21 | % | 20 | % | ||||||||
As a percent of total revenue: | ||||||||||||||||||
Subscription | 77 | % | 76 | % | 76 | % | ||||||||||||
Non-subscription revenue | 23 | % | 24 | % | 24 | % | ||||||||||||
Subscriptions represent a steady and predictable source of revenue for us, and we continue to see consistent growth and stable renewal rates, as evidenced by our 6 percent organic subscription revenue growth in both 2014 and 2013. This trend is especially important for us, as subscription-based revenue is at the core of our business model. The majority of the remaining growth was due to the Polk acquisition.
Organic non-subscription revenue growth was a negative 1 percent for 2014 and a negative 3 percent for 2013. Normalizing for the BPVC impact, organic non-subscription revenue growth was 1 percent for 2014 and negative 5 percent for 2013. The 2013 decline reflected a mix of some underperforming non-strategic assets, weakness in customers' discretionary spending globally, and the impact of the U.S. government's sequestration.
Revenue by Product Category
Year ended November 30, | % Change 2014 vs. 2013 | % Change 2013 vs. 2012 | ||||||||||||||||
(In thousands, except percentages) | 2014 | 2013 | 2012 | |||||||||||||||
Revenue: | ||||||||||||||||||
Resources | $ | 927,211 | $ | 865,125 | 775,331 | 7 | % | 12 | % | |||||||||
Industrials | 736,394 | 427,623 | 259,063 | 72 | % | 65 | % | |||||||||||
Horizontal products | 567,189 | 547,883 | 495,475 | 4 | % | 11 | % | |||||||||||
Total revenue | $ | 2,230,794 | $ | 1,840,631 | $ | 1,529,869 | 21 | % | 20 | % | ||||||||
Resources revenue increases in 2014 and 2013 were largely due to 5 percent organic revenue growth in 2014 and 6 percent organic growth in 2013. Industrials revenue increases for both years were primarily driven by the Polk acquisition, aided in 2014 by 4 percent organic growth and impacted in 2013 by negative 2 percent organic growth. Horizontal products revenue increases in 2014 and 2013 were largely due to 3 percent organic revenue growth in 2014 and 4 percent organic revenue growth in 2013. Normalized for the BPVC impact, Horizontal products organic revenue growth was 4 percent in 2014 and 2 percent in 2013.
In terms of product categories, our Resources organic growth may be negatively impacted in 2015 due to the current energy market environment. Our Industrials organic revenue growth improved during 2014 and we expect to see continued year-over-year organic growth improvement in Industrials in 2015.
28
Operating Expenses
The following table shows our operating expenses and the associated percentages of revenue.
Year ended November 30, | % Change 2014 vs. 2013 | % Change 2013 vs. 2012 | |||||||||||||||
(In thousands, except percentages) | 2014 | 2013 | 2012 | ||||||||||||||
Operating expenses: | |||||||||||||||||
Cost of revenue | $ | 879,051 | $ | 748,184 | $ | 624,514 | 17 | % | 20 | % | |||||||
SG&A expense | $ | 828,158 | $ | 680,989 | $ | 534,043 | 22 | % | 28 | % | |||||||
Depreciation and amortization expense | $ | 202,145 | $ | 158,737 | $ | 118,243 | 27 | % | 34 | % | |||||||
As a percent of revenue: | |||||||||||||||||
Cost of revenue | 39 | % | 41 | % | 41 | % | |||||||||||
SG&A expense | 37 | % | 37 | % | 35 | % | |||||||||||
Depreciation and amortization expense | 9 | % | 9 | % | 8 | % | |||||||||||
Supplemental information: | |||||||||||||||||
SG&A expense excluding stock-based compensation | $ | 669,319 | $ | 526,809 | $ | 418,706 | 27 | % | 26 | % | |||||||
As a percent of revenue | 30 | % | 29 | % | 27 | % | |||||||||||
Cost of Revenue
As a percent of revenue, cost of revenue decreased in 2014 primarily due to product mix improvements, particularly because we did not have the typically higher costs of the BPVC release this year. We have also seen decreases in cost of revenue as a percent of sales as we focus on becoming more operationally efficient. We expect to continue to invest in our people, platforms, processes, and products in support of our goals to increase top- and bottom-line growth.
Selling, General and Administrative (SG&A) Expense
We evaluate our SG&A expense excluding stock-based compensation expense. Our SG&A expense as a percent of revenue has increased slightly in 2013 and 2014 as we expand our sales and marketing forces to drive scale and growth in key industries and core markets.
The increase in stock-based compensation expense from 2012 to 2013 was a result of an increase in the number of employees, an increase in our stock price, and the achievement or overachievement of certain performance metrics. The slight increase in stock-based compensation from 2013 to 2014 reflected progress towards our goal of managing stock-based compensation expense on a relatively flat dollar basis.
Depreciation and Amortization Expense
Depreciation and amortization expense has remained relatively flat as a percentage of revenue, but has increased in total dollar amount primarily due to the increase in depreciable and amortizable assets from the Polk acquisition, as well as increases in capital expenditures of approximately $24 million in 2014 and $26 million in 2013 related to our various infrastructure initiatives.
Restructuring
We incurred $9 million of restructuring charges during 2014, which reflects our continuing efforts to consolidate positions, locations, and data centers. We incurred $13 million of restructuring charges in 2013 and $17 million of restructuring charges in 2012. We continue to realize benefits with respect to our infrastructure initiatives that allow us to simplify our processes and standardize our platforms in order to enable our existing workforce to accomplish more with the same or fewer resources.
Acquisition-related Costs
29
In 2014, we incurred $2 million of costs associated with acquisitions, including severance, lease abandonments, and professional fees. We incurred $23 million of acquisition-related costs in 2013 and $4 million of acquisition-related costs in 2012. The increased costs in 2013 were primarily attributable to the Polk acquisition, including investment adviser fees, severance, a lease abandonment, and legal and professional fees. Because acquisitions are a key component of our growth strategy, we expect that we will continue to incur similar costs for future acquisitions.
Pension and Postretirement Expense
The following table shows the components of net periodic pension and postretirement expense:
Year ended November 30, | ||||||||||||
(In thousands) | 2014 | 2013 | 2012 | |||||||||
Net service cost | $ | 5,315 | $ | 8,999 | $ | 7,996 | ||||||
Settlement expense | — | — | 4,930 | |||||||||
Fourth quarter mark-to-market adjustment | 1,459 | 2,620 | 11,991 | |||||||||
Total | $ | 6,774 | $ | 11,619 | $ | 24,917 | ||||||
Net service cost decreased in 2014 due to the decision to discontinue future accruals to the U.S. RIP and SIP. Settlement expense and the fourth quarter mark-to-market adjustment in 2012 was associated with lump-sum buyout offers that we made that year. The fourth quarter mark-to-market adjustments in 2013 and 2014 were largely due to updated actuarial census data assumptions, including the new mortality table assumption in 2014. We exclude settlement expense and the fourth quarter mark-to-market adjustment from our Adjusted EBITDA metric, as we do not regard those items to be indicative of ongoing operating performance.
We expect 2015 net service cost, prior to any fourth quarter mark-to-market adjustments, to be approximately $2 million.
Loss on Sale of Assets
In 2013 and 2014, we disposed of certain non-core, non-strategic assets as part of a continuing evaluation of our asset portfolio.
Operating Income by Segment
Year ended November 30, | % Change 2014 vs. 2013 | % Change 2013 vs. 2012 | |||||||||||||||
(In thousands, except percentages) | 2014 | 2013 | 2012 | ||||||||||||||
Operating income: | |||||||||||||||||
Americas | $ | 356,310 | $ | 303,803 | $ | 262,953 | 17 | % | 16 | % | |||||||
EMEA | 129,766 | 81,048 | 95,144 | 60 | % | (15 | )% | ||||||||||
APAC | 48,792 | 42,089 | 46,042 | 16 | % | (9 | )% | ||||||||||
Shared services | (231,276 | ) | (228,736 | ) | (196,852 | ) | |||||||||||
Total operating income | $ | 303,592 | $ | 198,204 | $ | 207,287 | 53 | % | (4 | )% | |||||||
As a percent of segment revenue: | |||||||||||||||||
Americas | 24 | % | 26 | % | 29 | % | |||||||||||
EMEA | 24 | % | 17 | % | 21 | % | |||||||||||
APAC | 23 | % | 22 | % | 26 | % | |||||||||||
The decrease in Americas operating income margin from 2012 to 2014 was primarily driven by increases in depreciation expense (associated with increasing capital expenditures), amortization expense (primarily associated with intangible assets acquired through the Polk acquisition), and interest expense (associated with increased debt leverage to fund the Polk acquisition). Because of the significance of the intangible assets acquired in the Polk acquisition and increased interest expense associated with our recent debt refinancing, we anticipate that operating income margin for the Americas will continue to be lower than in previous years.
30
In 2013, EMEA operating income margin declined primarily because of product mix, investment in growth, and increased selling costs. Increases in intangible asset amortization and acquisition-related costs, as well as a loss on sale of EMEA assets, further contributed to the 2013 decline. In 2014, we saw a reversal of this trend as a result of improved economics in the region and the completion of our EMEA sales reorganization.
The 2013 decrease in APAC operating income margin was primarily due to product mix changes and continued investment in our sales and operations teams in the region. In 2014, we continued to invest in our APAC sales and operations teams as we seek to increase our footprint in the region.
Shared services operating expense increased primarily because of the increase in stock-based compensation expense for 2014. We allocate all stock-based compensation expense to our shared services function. A portion of this increase was offset by a decrease in pension and postretirement expense.
Provision for Income Taxes
Our effective tax rate for the year ended November 30, 2014 was 21.9 percent, compared to 14.9 percent in 2013 and 15.7 percent in 2012. The effective tax rate for fiscal year 2014 varied from the effective tax rates for fiscal years 2013 and 2012 primarily as a result of the significant U.S. presence of the Polk business, which has a higher effective tax rate than other jurisdictions.
Adjusted EBITDA (non-GAAP measure)
Year ended November 30, | % Change 2014 vs. 2013 | % Change 2013 vs. 2012 | |||||||||||||||
(In thousands, except percentages) | 2014 | 2013 | 2012 | ||||||||||||||
Net income | $ | 194,549 | $ | 131,733 | $ | 158,168 | 48 | % | (17 | )% | |||||||
Interest income | (988 | ) | (1,271 | ) | (999 | ) | |||||||||||
Interest expense | 55,383 | 44,582 | 20,573 | ||||||||||||||
Provision for income taxes | 54,648 | 23,059 | 29,564 | ||||||||||||||
Depreciation | 68,347 | 48,799 | 36,131 | ||||||||||||||
Amortization | 133,798 | 109,938 | 82,112 | ||||||||||||||
EBITDA | $ | 505,737 | $ | 356,840 | $ | 325,549 | 42 | % | 10 | % | |||||||
Stock-based compensation expense | 167,359 | 162,451 | 121,543 | ||||||||||||||
Restructuring charges | 9,272 | 13,458 | 16,829 | ||||||||||||||
Acquisition-related costs | 1,901 | 23,428 | 4,147 | ||||||||||||||
Impairment of assets | — | 1,629 | — | ||||||||||||||
Loss on sale of assets | 2,654 | 1,241 | — | ||||||||||||||
Loss on debt extinguishment | 1,422 | — | — | ||||||||||||||
Pension mark-to-market and settlement expense | 1,459 | 2,620 | 16,922 | ||||||||||||||
Income from discontinued operations, net | — | 101 | (19 | ) | |||||||||||||
Adjusted EBITDA | $ | 689,804 | $ | 561,768 | $ | 484,971 | 23 | % | 16 | % | |||||||
Adjusted EBITDA as a percentage of revenue | 30.9 | % | 30.5 | % | 31.7 | % | |||||||||||
Our Adjusted EBITDA margin performance for 2013 decreased primarily as a result of significant 2013 acquisition activity and discrete one-time investments. Our margin performance for 2014 improved from 2013 as we continued to focus on acquisition integration and as a result of the operating leverage in our business model. We anticipate that margins will increase again in 2015 as we continue to focus on improving core margins, leveraging our subscription-based business model, and further integrating our acquisitions.
Financial Condition
31
(In thousands, except percentages) | As of November 30, 2014 | As of November 30, 2013 | Dollar change | Percent change | ||||||||||
Accounts receivable, net | $ | 421,374 | $ | 459,263 | $ | (37,889 | ) | (8 | )% | |||||
Accrued compensation | $ | 101,875 | $ | 89,460 | $ | 12,415 | 14 | % | ||||||
Deferred revenue | $ | 596,187 | $ | 560,010 | $ | 36,177 | 6 | % | ||||||
The decrease in our accounts receivable balance was primarily due to the strength of our cash collections in 2014. The increase in accrued compensation was primarily due to the higher attainment of certain performance objectives associated with our annual incentive plan, as well as an increase in accrued commissions. The increase in deferred revenue was due to organic growth in the business.
Liquidity and Capital Resources
As of November 30, 2014, we had cash and cash equivalents of $153 million, of which approximately $109 million was held by our foreign subsidiaries. Cash held by our foreign subsidiaries could be subject to U.S. federal income tax if we decided to repatriate any of that cash to the U.S.; however, our intent is to permanently reinvest these funds outside of the U.S. and our current plans do not demonstrate a need to repatriate them to fund our operations in jurisdictions outside of where they are held. We also had $1.8 billion of debt as of November 30, 2014, which resulted in an increase in interest expense in 2014 compared to 2013. We expect that the increased debt, as well as our recent refinancing to fix interest rates on a larger portion of our debt, will result in higher interest expense in the near future. For 2014, our free cash flow was $514 million and the ratio of free cash flow to Adjusted EBITDA was approximately 74 percent. Over the longer term, we anticipate that this ratio will be in the mid-60s range, reflecting increased interest expense and an increase in our cash taxes. Because of our cash, debt, and cash flow positions, we believe we will have sufficient cash to meet our ongoing working capital and capital expenditure needs.
Historically, we were not required to make cash contributions to our U.S. RIP pension plan because of its funded status. However, due to the global economic downturn, which negatively impacted the returns on our pension assets, we were required to make a cash contribution to our U.S. RIP in fiscal 2012. In considering that requirement and the various changes to our pension strategy, we made a $65 million contribution to the pension plan in December 2011, the first month of our 2012 fiscal year. In December 2012, the first month of our 2013 fiscal year, we made a $10 million contribution to the pension plan to fund estimated 2013 pension costs. In September 2014, we made a $10 million contribution to our U.S. RIP in order to increase plan funding and avoid certain additional variable rate premium costs. We are not required to and do not currently expect to contribute to the U.S. RIP in 2015.
During the third quarter of 2013, we completed the Polk acquisition, which we funded with a combination of cash and stock. We funded the cash portion of the transaction consideration using cash on hand, cash from our existing revolving credit facility, and a new bank term loan. In October 2014, we refinanced our revolving credit facility and term loans and completed a bond offering. The terms and conditions of the new agreements, including financial covenants, offer us flexibility to pursue our growth strategies. Our leverage ratio as of November 30, 2014, was approximately 2.6x. The credit agreements allow for leverage up to 3.5x, with the ability to temporarily increase that leverage to 3.75x for two quarters. As of November 30, 2014, we had approximately $915 million available under our revolving credit facility. Please refer to "Item 8 - Financial Statements and Supplementary Data - Notes to Consolidated Financial Statements - Note 8" in Part II of this Form 10-K for a discussion of the current status of our debt arrangements.
Our future capital requirements will depend on many factors, including the level of future acquisitions, the need for additional facilities or facility improvements, the timing and extent of spending to support product development efforts, information technology infrastructure investments, investments in our internal business applications, and the continued market acceptance of our offerings. We could be required, or could elect, to seek additional funding through public or private equity or debt financings; however, additional funds may not be available on terms acceptable to us. We currently expect our capital expenditures to be approximately 5 to 6 percent of revenue in 2015.
Cash Flows
Year ended November 30, | % Change 2014 vs. 2013 | % Change 2013 vs. 2012 | |||||||||||||||
(In thousands, except percentages) | 2014 | 2013 | 2012 | ||||||||||||||
Net cash provided by operating activities | $ | 628,099 | $ | 496,155 | $ | 314,373 | 27 | % | 58 | % | |||||||
Net cash used in investing activities | $ | (324,011 | ) | $ | (1,571,897 | ) | $ | (375,260 | ) | (79 | )% | 319 | % | ||||
Net cash provided by (used in) financing activities | $ | (397,861 | ) | $ | 1,006,450 | $ | 179,411 | (140 | )% | 461 | % | ||||||
32
The increase in net cash provided by operating activities was largely due to continued business performance improvements, including strong cash collections in 2014. Part of the improvement also came from decreased funding of the U.S. RIP ($10 million in each of 2014 and 2013, compared to $65 million in 2012), additive cash flow from recent acquisitions (most notably from the Polk acquisition), and favorable cash tax refund timing in 2013. Our subscription-based business model continues to be a cash flow generator that is aided by positive working capital characteristics that do not generally require substantial working capital increases to support our growth.
The increase in net cash used in investing activities in 2013 was principally due to the Polk acquisition that we completed in 2013. Part of our investing activity increases from 2012 to 2014 was attributable to increased capital expenditures associated with continued investment in our product development and infrastructure initiatives.
The increase in net cash provided by financing activities for 2013 was principally due to the significant amount of borrowings that we used to fund the Polk acquisition, in addition to the associated debt issuance costs; in 2014, we began to repay those borrowings as we reduced our debt leverage. In the fourth quarter of 2012, we began a treasury share repurchase program that we continued through the first quarter of 2013; the total purchase price was approximately $96 million, with $50 million purchased in the fourth quarter of 2012 and $46 million purchased in the first quarter of 2013.
Free Cash Flow (non-GAAP measure)
The following table reconciles our non-GAAP free cash flow measure to net cash provided by operating activities.
Year ended November 30, | % Change 2014 vs. 2013 | % Change 2013 vs. 2012 | |||||||||||||||
(In thousands, except percentages) | 2014 | 2013 | 2012 | ||||||||||||||
Net cash provided by operating activities | $ | 628,099 | $ | 496,155 | $ | 314,373 | |||||||||||
Capital expenditures on property and equipment | (114,453 | ) | (90,734 | ) | (64,732 | ) | |||||||||||
Free cash flow | $ | 513,646 | $ | 405,421 | $ | 249,641 | 27 | % | 62 | % | |||||||
Our free cash flow has historically been strong, and we expect that it will continue to be a significant source of funding for our business strategy of growth through organic and acquisitive means.
Credit Facility and Other Debt
Please refer to "Item 8 - Financial Statements and Supplementary Data - Notes to Consolidated Financial Statements - Note 8" in Part II of this Form 10-K for a discussion of the current status of our debt arrangements.
Share Repurchase Programs
Please refer to Part II, Item 5 and "Item 8 - Financial Statements and Supplementary Data - Notes to Consolidated Financial Statements - Note 16" in Part II of this Form 10-K for a discussion of our share repurchase programs.
Off-Balance Sheet Transactions
We have no off-balance sheet transactions.
Contractual Obligations and Commercial Commitments
We have various contractual obligations and commercial commitments that are recorded as liabilities in our consolidated financial statements. Other items, such as certain purchase commitments and other executory contracts, are not recognized as liabilities in our consolidated financial statements but are required to be disclosed. The following table summarizes our contractual obligations and commercial commitments as of November 30, 2014, along with the obligations associated with our term loans and notes, and the future periods in which such obligations are expected to be settled in cash (in thousands):
33
Payment due by period | ||||||||||||||||||||
Contractual Obligations and Commercial Commitments | Total | Less than 1 year | 1 - 3 years | 3 - 5 years | More than 5 years | |||||||||||||||
Term loans, notes, and interest | $ | 1,853,508 | $ | 89,134 | $ | 232,702 | $ | 677,340 | $ | 854,332 | ||||||||||
Operating lease obligations | 273,050 | 56,159 | 100,827 | 62,615 | 53,449 | |||||||||||||||
Unconditional purchase obligations | 45,121 | 26,848 | 16,449 | 1,824 | — | |||||||||||||||
Total | $ | 2,171,679 | $ | 172,141 | $ | 349,978 | $ | 741,779 | $ | 907,781 | ||||||||||
We expect to contribute approximately $3 million to our pension and postretirement benefit plans in 2015.
In addition to the term loans and notes, we also have $385 million of outstanding borrowings under our $1.3 billion 2014 revolving facility at a current annual interest rate of 1.65 percent. The facility has a five-year term ending in October 2019. We also have approximately $7 million in capital lease obligations.
Recent Accounting Pronouncements
Please refer to "Item 8 - Financial Statements and Supplementary Data - Notes to Consolidated Financial Statements - Note 2" in Part II of this Form 10-K for a discussion of recent accounting pronouncements and their anticipated effect on our business.
Item 7A. Quantitative and Qualitative Disclosures About Market Risk
Market risk refers to potential losses from adverse changes in market rates and prices. We are exposed to market risk primarily in the form of interest rate, foreign currency exchange rate, and credit risk. We actively monitor these exposures. In order to manage these exposures, we use derivative financial instruments, including interest rate swaps and foreign currency forwards. Our objective is to reduce fluctuations in revenue, earnings, and cash flows resulting from changes in interest rates and foreign currency rates. We do not use derivatives for speculative purposes.
Interest Rate Risk
As of November 30, 2014, we had no investments other than cash and cash equivalents and therefore we were not exposed to material interest rate risk on investments.
Our 2014 revolving facility and our 2013 term loan borrowings are subject to variable interest rates. We use interest rate swaps in order to fix a portion of our variable rate debt as part of our overall interest rate risk management strategy. As of November 30, 2014, we had $1,085 million of floating-rate debt at a 1.68 percent weighted-average interest rate, of which $100 million was subject to effective floating-to-fixed interest rate swaps. A hypothetical increase in interest rates of 100 basis points applied to our floating rate indebtedness would increase annual interest expense by approximately $10 million ($11 million without giving effect to any of our interest rate swaps).
Foreign Currency Exchange Rate Risk
Our consolidated financial statements are expressed in U.S. dollars, but a portion of our business is conducted in currencies other than U.S. dollars. Changes in the exchange rates for such currencies into U.S. dollars can affect our revenues, earnings, and the carrying values of our assets and liabilities in our consolidated balance sheet, either positively or negatively. Fluctuations in foreign currency rates increased (decreased) our revenues by $3 million, $(8) million, and $(9) million for the years ended November 30, 2014, 2013, and 2012, respectively, and increased (decreased) our operating income by $(2) million, $0 million, and $1 million for the same respective periods. The translation effects of changes in exchange rates in our consolidated balance sheet are recorded within the cumulative translation adjustment component of our stockholders’ equity. In 2014, we recorded a cumulative translation loss of $37 million, reflecting changes in exchange rates of various currencies compared to the U.S. dollar.
A hypothetical ten percent change in the currencies that we are primarily exposed to would have impacted our 2014 revenue and operating income by approximately $45 million and $10 million, respectively. Approximately 80% of total revenue was earned in subsidiaries with the U.S. dollar as the functional currency.
34
Credit Risk
We are exposed to credit risk associated with cash equivalents, foreign currency and interest rate derivatives, and trade receivables. We do not believe that our cash equivalents or foreign currency and interest rate derivatives present significant credit risks because the counterparties to the instruments consist of major financial institutions that are financially sound or have been capitalized by the U.S. government, and we manage the notional amount of contracts entered into with any one counterparty. Substantially all trade receivable balances are unsecured. The concentration of credit risk with respect to trade receivables is limited by the large number of customers in our customer base and their dispersion across various industries and geographic areas. We perform ongoing credit evaluations of our customers and maintain an allowance for potential credit losses.
Item 8. | Financial Statements and Supplementary Data |
Index to Consolidated Financial Statements
Consolidated Financial Statements |
35
Report of Independent Registered Public Accounting Firm
The Board of Directors and Stockholders of IHS Inc.
We have audited the accompanying consolidated balance sheets of IHS Inc. (the Company) as of November 30, 2014 and 2013, and the related consolidated statements of operations, comprehensive income, cash flows and changes in stockholders' equity for each of the three years in the period ended November 30, 2014. These financial statements are the responsibility of the Company's management. Our responsibility is to express an opinion on these financial statements based on our audits.
We conducted our audits in accordance with the standards of the Public Company Accounting Oversight Board (United States). Those standards require that we plan and perform the audit to obtain reasonable assurance about whether the financial statements are free of material misstatement. An audit includes examining, on a test basis, evidence supporting the amounts and disclosures in the financial statements. An audit also includes assessing the accounting principles used and significant estimates made by management, as well as evaluating the overall financial statement presentation. We believe that our audits provide a reasonable basis for our opinion.
In our opinion, the financial statements referred to above present fairly, in all material respects, the consolidated financial position of IHS Inc. at November 30, 2014 and 2013, and the consolidated results of its operations and its cash flows for each of the three years in the period ended November 30, 2014, in conformity with U.S. generally accepted accounting principles.
We also have audited, in accordance with the standards of the Public Company Accounting Oversight Board (United States), IHS Inc.'s internal control over financial reporting as of November 30, 2014, based on criteria established in Internal Control-Integrated Framework issued by the Committee of Sponsoring Organizations of the Treadway Commission (1992 Framework) and our report dated January 16, 2015 expressed an unqualified opinion thereon.
/s/ Ernst & Young
Denver, Colorado
January 16, 2015
36
Management’s Report on Internal Control over Financial Reporting
Our management is responsible for establishing and maintaining adequate internal control over financial reporting, as such term is defined in Exchange Act Rules 13a-15(f) and 15d-15(f). Under the supervision and with the participation of our management, including our Chief Executive Officer and Chief Financial Officer, we conducted an evaluation of the effectiveness of our internal control over financial reporting as of November 30, 2014, based on the framework in Internal Control—Integrated Framework issued by the Committee of Sponsoring Organizations of the Treadway Commission (1992 Framework). Based on that evaluation, our management concluded that our internal control over financial reporting was effective as of November 30, 2014.
Our independent registered public accounting firm has issued an audit report on our internal control over financial reporting. Their report appears on the following page.
Because of its inherent limitations, internal control over financial reporting may not prevent or detect misstatements. Therefore, even those systems determined to be effective can provide only reasonable assurance with respect to financial statement preparation and presentation.
Date: January 16, 2015
/s/ Scott Key | |
Scott Key | |
President and Chief Executive Officer | |
/s/ Todd S. Hyatt | |
Todd S. Hyatt | |
Executive Vice President, Chief Financial Officer | |
37
Report of Independent Registered Public Accounting Firm
The Board of Directors and Stockholders of IHS Inc.
We have audited IHS Inc.'s internal control over financial reporting as of November 30, 2014, based on criteria established in Internal Control-Integrated Framework issued by the Committee of Sponsoring Organizations of the Treadway Commission (1992 Framework) (the COSO criteria). IHS Inc.'s management is responsible for maintaining effective internal control over financial reporting, and for its assessment of the effectiveness of internal control over financial reporting included in the accompanying Management's Report on Internal Control over Financial Reporting. Our responsibility is to express an opinion on the Company's internal control over financial reporting based on our audit.
We conducted our audit in accordance with the standards of the Public Company Accounting Oversight Board (United States). Those standards require that we plan and perform the audit to obtain reasonable assurance about whether effective internal control over financial reporting was maintained in all material respects. Our audit included obtaining an understanding of internal control over financial reporting, assessing the risk that a material weakness exists, testing and evaluating the design and operating effectiveness of internal control based on the assessed risk, and performing such other procedures as we considered necessary in the circumstances. We believe that our audit provides a reasonable basis for our opinion.
A company's internal control over financial reporting is a process designed to provide reasonable assurance regarding the reliability of financial reporting and the preparation of financial statements for external purposes in accordance with generally accepted accounting principles. A company's internal control over financial reporting includes those policies and procedures that (1) pertain to the maintenance of records that, in reasonable detail, accurately and fairly reflect the transactions and dispositions of the assets of the company; (2) provide reasonable assurance that transactions are recorded as necessary to permit preparation of financial statements in accordance with generally accepted accounting principles, and that receipts and expenditures of the company are being made only in accordance with authorizations of management and directors of the company; and (3) provide reasonable assurance regarding prevention or timely detection of unauthorized acquisition, use, or disposition of the company's assets that could have a material effect on the financial statements.
Because of its inherent limitations, internal control over financial reporting may not prevent or detect misstatements. Also, projections of any evaluation of effectiveness to future periods are subject to the risk that controls may become inadequate because of changes in conditions, or that the degree of compliance with the policies or procedures may deteriorate.
In our opinion, IHS Inc. maintained, in all material respects, effective internal control over financial reporting as of November 30, 2014, based on the COSO criteria.
We also have audited, in accordance with the standards of the Public Company Accounting Oversight Board (United States), the consolidated balance sheets of IHS Inc. as of November 30, 2014 and 2013, and the related consolidated statements of operations, comprehensive income, cash flows and changes in stockholders' equity for each of the three years in the period ended November 30, 2014 of IHS Inc. and our report dated January 16, 2015 expressed an unqualified opinion thereon.
/s/ Ernst & Young
Denver, Colorado
January 16, 2015
38
IHS INC.
CONSOLIDATED BALANCE SHEETS
(In thousands, except for share and per-share amounts)
As of | As of | ||||||
November 30, 2014 | November 30, 2013 | ||||||
Assets | |||||||
Current assets: | |||||||
Cash and cash equivalents | $ | 153,156 | $ | 258,367 | |||
Accounts receivable, net | 421,374 | 459,263 | |||||
Income tax receivable | 2,283 | — | |||||
Deferred subscription costs | 51,021 | 49,327 | |||||
Deferred income taxes | 81,780 | 70,818 | |||||
Other | 60,973 | 43,065 | |||||
Total current assets | 770,587 | 880,840 | |||||
Non-current assets: | |||||||
Property and equipment, net | 301,419 | 245,566 | |||||
Intangible assets, net | 1,091,109 | 1,144,464 | |||||
Goodwill | 3,157,324 | 3,065,181 | |||||
Other | 27,991 | 23,562 | |||||
Total non-current assets | 4,577,843 | 4,478,773 | |||||
Total assets | $ | 5,348,430 | $ | 5,359,613 | |||
Liabilities and stockholders’ equity | |||||||
Current liabilities: | |||||||
Short-term debt | $ | 36,257 | $ | 395,527 | |||
Accounts payable | 52,245 | 57,001 | |||||
Accrued compensation | 101,875 | 89,460 | |||||
Accrued royalties | 37,346 | 36,289 | |||||
Other accrued expenses | 131,147 | 98,187 | |||||
Income tax payable | — | 9,961 | |||||
Deferred revenue | 596,187 | 560,010 | |||||
Total current liabilities | 955,057 | 1,246,435 | |||||
Long-term debt | 1,806,098 | 1,779,065 | |||||
Accrued pension and postretirement liability | 29,139 | 27,191 | |||||
Deferred income taxes | 347,419 | 361,267 | |||||
Other liabilities | 51,171 | 38,692 | |||||
Commitments and contingencies | |||||||
Stockholders’ equity: | |||||||
Class A common stock, $0.01 par value per share, 160,000,000 shares authorized, 69,391,577 and 67,901,101 shares issued, and 68,372,176 and 67,382,298 shares outstanding at November 30, 2014 and November 30, 2013, respectively | 694 | 679 | |||||
Additional paid-in capital | 956,381 | 788,670 | |||||
Treasury stock, at cost: 1,019,401 and 518,803 shares at November 30, 2014 and November 30, 2013, respectively | (105,873 | ) | (45,945 | ) | |||
Retained earnings | 1,415,069 | 1,220,520 | |||||
Accumulated other comprehensive loss | (106,725 | ) | (56,961 | ) | |||
Total stockholders’ equity | 2,159,546 | 1,906,963 | |||||
Total liabilities and stockholders’ equity | $ | 5,348,430 | $ | 5,359,613 | |||
See accompanying notes.
39
IHS INC.
CONSOLIDATED STATEMENTS OF OPERATIONS
(In thousands, except for per-share amounts)
Year ended November 30, | ||||||||||||
2014 | 2013 | 2012 | ||||||||||
Revenue | $ | 2,230,794 | $ | 1,840,631 | $ | 1,529,869 | ||||||
Operating expenses: | ||||||||||||
Cost of revenue | 879,051 | 748,184 | 624,514 | |||||||||
Selling, general and administrative | 828,158 | 680,989 | 534,043 | |||||||||
Depreciation and amortization | 202,145 | 158,737 | 118,243 | |||||||||
Restructuring charges | 9,272 | 13,458 | 16,829 | |||||||||
Acquisition-related costs | 1,901 | 23,428 | 4,147 | |||||||||
Net periodic pension and postretirement expense | 6,774 | 11,619 | 24,917 | |||||||||
Other expense (income), net | (99 | ) | 6,012 | (111 | ) | |||||||
Total operating expenses | 1,927,202 | 1,642,427 | 1,322,582 | |||||||||
Operating income | 303,592 | 198,204 | 207,287 | |||||||||
Interest income | 988 | 1,271 | 999 | |||||||||
Interest expense | (55,383 | ) | (44,582 | ) | (20,573 | ) | ||||||
Non-operating expense, net | (54,395 | ) | (43,311 | ) | (19,574 | ) | ||||||
Income from continuing operations before income taxes | 249,197 | 154,893 | 187,713 | |||||||||
Provision for income taxes | (54,648 | ) | (23,059 | ) | (29,564 | ) | ||||||
Income from continuing operations | 194,549 | 131,834 | 158,149 | |||||||||
Income (loss) from discontinued operations, net | — | (101 | ) | 19 | ||||||||
Net income | $ | 194,549 | $ | 131,733 | $ | 158,168 | ||||||
Basic earnings per share: | ||||||||||||
Income from continuing operations | $ | 2.85 | $ | 1.98 | $ | 2.40 | ||||||
Income (loss) from discontinued operations, net | — | — | — | |||||||||
Net income | $ | 2.85 | $ | 1.98 | $ | 2.40 | ||||||
Weighted average shares used in computing basic earnings per share | 68,163 | 66,434 | 65,840 | |||||||||
Diluted earnings per share: | ||||||||||||
Income from continuing operations | $ | 2.81 | $ | 1.95 | $ | 2.37 | ||||||
Income (loss) from discontinued operations, net | — | — | — | |||||||||
Net income | $ | 2.81 | $ | 1.95 | $ | 2.37 | ||||||
Weighted average shares used in computing diluted earnings per share | 69,120 | 67,442 | 66,735 | |||||||||
See accompanying notes.
40
IHS INC.
CONSOLIDATED STATEMENTS OF COMPREHENSIVE INCOME
(In thousands)
Year ended November 30, | ||||||||||||
2014 | 2013 | 2012 | ||||||||||
Net income | $ | 194,549 | $ | 131,733 | $ | 158,168 | ||||||
Other comprehensive income (loss), net of tax: | ||||||||||||
Unrealized gain (loss) on hedging activities (1) | (7,283 | ) | 26 | (307 | ) | |||||||
Net pension liability adjustment (2) | (5,412 | ) | 897 | (3,421 | ) | |||||||
Foreign currency translation adjustment | (37,069 | ) | (11,191 | ) | 6,237 | |||||||
Total other comprehensive income (loss) | (49,764 | ) | (10,268 | ) | 2,509 | |||||||
Comprehensive income | $ | 144,785 | $ | 121,465 | $ | 160,677 | ||||||
(1) Net of tax benefit of $4,755; $74; and $188 for the years ended November 30, 2014, 2013, and 2012, respectively. | ||||||||||||
(2) Net of tax benefit (expense) of $3,215; $(259); and $1,382 for the years ended November 30, 2014, 2013, and 2012, respectively. | ||||||||||||
See accompanying notes.
41
IHS INC.
CONSOLIDATED STATEMENTS OF CASH FLOWS
(In thousands)
Year ended November 30, | |||||||||||
2014 | 2013 | 2012 | |||||||||
Operating activities: | |||||||||||
Net income | $ | 194,549 | $ | 131,733 | $ | 158,168 | |||||
Reconciliation of net income to net cash provided by operating activities: | |||||||||||
Depreciation and amortization | 202,145 | 158,737 | 118,243 | ||||||||
Stock-based compensation expense | 167,359 | 162,451 | 121,543 | ||||||||
Impairment of assets | — | 1,629 | — | ||||||||
Excess tax benefit from stock-based compensation | (13,297 | ) | (14,334 | ) | (13,199 | ) | |||||
Net periodic pension and postretirement expense | 6,774 | 11,619 | 24,917 | ||||||||
Pension and postretirement contributions | (13,452 | ) | (13,299 | ) | (68,339 | ) | |||||
Deferred income taxes | (10,285 | ) | (34,312 | ) | (16,451 | ) | |||||
Change in assets and liabilities: | |||||||||||
Accounts receivable, net | 36,418 | (24,427 | ) | (35,410 | ) | ||||||
Other current assets | (8,834 | ) | (672 | ) | (2,246 | ) | |||||
Accounts payable | (11,425 | ) | (10,069 | ) | 22,383 | ||||||
Accrued expenses | 36,073 | 50,753 | (17,567 | ) | |||||||
Income tax payable | 6,254 | 65,887 | 21,220 | ||||||||
Deferred revenue | 29,713 | 10,378 | 692 | ||||||||
Other liabilities | 6,107 | 81 | 419 | ||||||||
Net cash provided by operating activities | 628,099 | 496,155 | 314,373 | ||||||||
Investing activities: | |||||||||||
Capital expenditures on property and equipment | (114,453 | ) | (90,734 | ) | (64,732 | ) | |||||
Acquisitions of businesses, net of cash acquired | (210,395 | ) | (1,487,034 | ) | (306,268 | ) | |||||
Intangible assets acquired | (714 | ) | — | (3,700 | ) | ||||||
Change in other assets | (4,608 | ) | 1,347 | 1,708 | |||||||
Settlements of forward contracts | 6,159 | 4,524 | (2,268 | ) | |||||||
Net cash used in investing activities | (324,011 | ) | (1,571,897 | ) | (375,260 | ) | |||||
Financing activities: | |||||||||||
Proceeds from borrowings | 2,485,000 | 1,375,000 | 750,001 | ||||||||
Repayment of borrowings | (2,817,236 | ) | (268,909 | ) | (493,080 | ) | |||||
Payment of debt issuance costs | (18,994 | ) | (17,360 | ) | (824 | ) | |||||
Excess tax benefit from stock-based compensation | 13,297 | 14,334 | 13,199 | ||||||||
Proceeds from the exercise of employee stock options | — | 549 | 2,938 | ||||||||
Repurchases of common stock | (59,928 | ) | (97,164 | ) | (92,823 | ) | |||||
Net cash provided by (used in) financing activities | (397,861 | ) | 1,006,450 | 179,411 | |||||||
Foreign exchange impact on cash balance | (11,438 | ) | (17,349 | ) | (8,201 | ) | |||||
Net increase (decrease) in cash and cash equivalents | (105,211 | ) | (86,641 | ) | 110,323 | ||||||
Cash and cash equivalents at the beginning of the period | 258,367 | 345,008 | 234,685 | ||||||||
Cash and cash equivalents at the end of the period | $ | 153,156 | $ | 258,367 | $ | 345,008 | |||||
See accompanying notes.
42
IHS INC.
CONSOLIDATED STATEMENTS OF CHANGES IN STOCKHOLDERS’ EQUITY
(In thousands)
Class A Common Stock | Additional Paid-In Capital | Accumulated Other Comprehensive Loss | ||||||||||||||||||||||||
Shares Outstanding | Amount | Treasury Stock | Retained Earnings | Total | ||||||||||||||||||||||
Balance at November 30, 2011 | 65,122 | $ | 675 | $ | 636,440 | $ | (133,803 | ) | $ | 930,619 | $ | (49,202 | ) | $ | 1,384,729 | |||||||||||
Stock-based award activity | 1,019 | 1 | 31,770 | 43,769 | — | — | 75,540 | |||||||||||||||||||
Excess tax benefit on vested shares | — | — | 13,199 | — | — | — | 13,199 | |||||||||||||||||||
Repurchases of common stock | (563 | ) | — | — | (49,787 | ) | — | — | (49,787 | ) | ||||||||||||||||
Net income | — | — | — | — | 158,168 | — | 158,168 | |||||||||||||||||||
Other comprehensive income | — | — | — | — | — | 2,509 | 2,509 | |||||||||||||||||||
Balance at November 30, 2012 | 65,578 | 676 | 681,409 | (139,821 | ) | 1,088,787 | (46,693 | ) | 1,584,358 | |||||||||||||||||
Stock-based award activity | 938 | 3 | 64,383 | 37,123 | — | — | 101,509 | |||||||||||||||||||
Excess tax benefit on vested shares | — | — | 14,334 | — | — | — | 14,334 | |||||||||||||||||||
Repurchases of common stock | (468 | ) | — | — | (46,189 | ) | — | — | (46,189 | ) | ||||||||||||||||
Shares issued for acquisition | 1,334 | — | 28,544 | 102,942 | — | — | 131,486 | |||||||||||||||||||
Net income | — | — | — | — | 131,733 | — | 131,733 | |||||||||||||||||||
Other comprehensive loss | — | — | — | — | — | (10,268 | ) | (10,268 | ) | |||||||||||||||||
Balance at November 30, 2013 | 67,382 | 679 | 788,670 | (45,945 | ) | 1,220,520 | (56,961 | ) | 1,906,963 | |||||||||||||||||
Stock-based award activity | 990 | 15 | 154,414 | (59,928 | ) | — | — | 94,501 | ||||||||||||||||||
Excess tax benefit on vested shares | — | — | 13,297 | — | — | — | 13,297 | |||||||||||||||||||
Net income | — | — | — | — | 194,549 | — | 194,549 | |||||||||||||||||||
Other comprehensive loss | — | — | — | — | — | (49,764 | ) | (49,764 | ) | |||||||||||||||||
Balance at November 30, 2014 | 68,372 | $ | 694 | $ | 956,381 | $ | (105,873 | ) | $ | 1,415,069 | $ | (106,725 | ) | $ | 2,159,546 | |||||||||||
See accompanying notes.
43
IHS INC.
NOTES TO CONSOLIDATED FINANCIAL STATEMENTS
1. | Nature of Business |
We are a leading source of information, insight, and analytics in critical areas that shape today's business landscape. Businesses and governments in more than 150 countries around the globe rely on our comprehensive content, expert independent analysis, and flexible delivery methods. Our aim is to embed our solutions within the entire spectrum of our customers’ organization, enabling executive level capital deployment strategies and following decision-making activities throughout their organizations to front-line employees tasked with managing their company’s complex core daily operations. We have been in business since 1959 and became a publicly traded company on the New York Stock Exchange in 2005. Headquartered in Englewood, Colorado, USA, we are committed to sustainable, profitable growth and employ approximately 8,800 people in 32 countries around the world.
To best serve our customers and be as close to them as possible, we are organized by geographies into three business segments: Americas, which includes the United States, Canada, and Latin America; EMEA, which includes Europe, the Middle East, and Africa; and APAC, or Asia Pacific. Our integrated global organization is designed to make it easier for our customers to do business with us by providing a cohesive, consistent, and effective sales-and-marketing approach in each local region. We sell our offerings primarily through subscriptions, which tend to generate recurring revenue and cash flow for us. Our subscription agreements are typically annual and non-cancellable for the term of the subscription and may contain provisions for minimum monthly payments. For subscription revenue, the timing of our cash flows generally precedes the recognition of revenue and income.
Our business has seasonal aspects. Our fourth quarter typically generates our highest quarterly levels of revenue and profit. Conversely, our first quarter generally has our lowest quarterly levels of revenue and profit. We also experience event-driven seasonality in our business; for instance, IHS Energy CERAWeek, an annual energy executive gathering, is held during our second quarter. Another example is the biennial release of the Boiler Pressure Vessel Code (BPVC) engineering standard, which generates revenue for us predominantly in the third quarter of every other year. We most recently recognized a benefit in connection with the BPVC release in the third quarter of 2013.
2. | Significant Accounting Policies |
Fiscal Year End
Our fiscal year ends on November 30 of each year. References herein to individual years mean the year ended November 30. For example, 2014 means the year ended November 30, 2014.
Consolidation Policy
The consolidated financial statements include the accounts of all wholly-owned subsidiaries. All significant intercompany accounts and transactions have been eliminated in consolidation.
Use of Estimates
The preparation of financial statements in conformity with U.S. generally accepted accounting principles (GAAP) requires that we make estimates and assumptions that affect the reported amounts of assets and liabilities and disclosure of contingent assets and liabilities at the date of the financial statements, as well as the reported amounts of revenues and expenses during the reporting period. Significant estimates have been made in areas that include valuation of long-lived and intangible assets and goodwill, income taxes, pension and postretirement benefits, allowance for doubtful accounts, and stock-based compensation. Actual results could differ from those estimates.
Concentration of Credit Risk
We are exposed to credit risk associated with cash equivalents, foreign currency and interest rate derivatives, and trade receivables. We do not believe that our cash equivalents or investments present significant credit risks because the counterparties to the instruments consist of major financial institutions that are financially sound or have been capitalized by the U.S. government, and we manage the notional amount of contracts entered into with any counterparty. Substantially all trade receivable balances are unsecured. The concentration of credit risk with respect to trade receivables is limited by the large number of customers in our customer base and their dispersion across various industries and geographic areas. We perform ongoing credit evaluations of our customers and maintain an allowance for probable credit losses. The allowance is based upon management’s assessment of known credit risks as well as general industry and economic conditions. Specific accounts receivable are written off upon notification of bankruptcy or once the account is significantly past due and our collection efforts are unsuccessful.
44
Fair Value Measurements
Fair value is determined based on the assumptions that market participants would use in pricing the asset or liability. We utilize the following fair value hierarchy in determining fair values:
Level 1 – Quoted prices for identical assets or liabilities in active markets.
Level 2 – Inputs other than quoted prices within Level 1 that are observable either directly or indirectly, including quoted prices in markets that are not active, quoted prices in active markets for similar assets or liabilities, and observable inputs other than quoted prices such as interest rates or yield curves.
Level 3 – Unobservable inputs reflecting our view about the assumptions that market participants would use in pricing the asset or liability.
Our cash, accounts receivable, and accounts payable are all short-term in nature; therefore, the carrying value of these items approximates their fair value. The carrying value of our debt instruments other than our 5% senior notes due 2022 (5% Notes) approximate their fair value because of the variable interest rate associated with those instruments. The fair value of the 5% Notes is included in Note 8, and is measured using observable inputs in markets that are not active; consequently, we have classified the 5% Notes within Level 2 of the fair value hierarchy. Our derivatives, as further described in Note 7, are measured at fair value on a recurring basis by reference to similar transactions in active markets and observable inputs other than quoted prices; consequently, we have classified those financial instruments within Level 2 of the fair value hierarchy. Our pension plan assets, as further described in Note 13, are measured at fair value on a recurring basis by reference to similar assets in active markets and are therefore also classified within Level 2 of the fair value hierarchy.
Revenue Recognition
Revenue is recognized when all of the following criteria have been met: (a) persuasive evidence of an arrangement exists, (b) delivery has occurred or services have been rendered, (c) the price to the customer is fixed or determinable, and (d) collectibility is reasonably assured.
The majority of our revenue is derived from the sale of subscriptions. Our subscription agreements are typically annual and non-cancellable and may contain provisions for minimum monthly payments. For subscription revenue, the timing of our cash flows generally precedes the recognition of revenue and income, as we defer any initial payments and recognize revenue ratably as delivered over the subscription period.
Revenue is recognized upon delivery for non-subscription sales.
In certain locations, we use dealers to distribute our product offerings. For subscription product offerings sold through dealers, revenue is recognized ratably as delivered to the end user over the subscription period. For non-subscription product offerings sold through dealers, revenue is recognized upon delivery to the dealer.
We do not defer revenue for the limited number of subscription sales where we act as a sales agent for third parties and have no continuing responsibility to maintain and update the underlying database. We recognize this revenue on a net basis upon the sale of these subscriptions and delivery of the information and tools.
Services
We provide our customers with service offerings that are primarily sold on a stand-alone basis and on a significantly more limited basis as part of a multiple-element arrangement. Our service offerings are generally separately priced in a standard price book. For services that are not in a standard price book, as the price varies based on the nature and complexity of the service offering, pricing is based on the estimated amount of time to be incurred at standard billing rates for the estimated underlying effort for executing the associated deliverable in the contract. Revenue related to services performed under time-and-material-based contracts is recognized in the period performed at standard billing rates. Revenue associated with fixed-price contracts is recognized upon completion of each specified performance obligation. See discussion of “multiple-element arrangements” below. If the contract includes acceptance contingencies, revenue is recognized in the period in which we receive documentation of acceptance from the customer.
Software
In addition to meeting the standard revenue recognition criteria described above, revenue from software arrangements must also meet the requirement that vendor-specific objective evidence (“VSOE”) of the fair value of undelivered elements exists. As a significant portion of our software licenses are sold in multiple-element arrangements that include either
45
maintenance or, in more limited circumstances, both maintenance and professional services, we use the residual method to determine the amount of license revenue to be recognized. Under the residual method, consideration is allocated to undelivered elements based upon VSOE of the fair value of those elements, with the residual of the arrangement fee allocated to and recognized as license revenue. We recognize license revenue upon delivery, with maintenance revenue recognized ratably over the maintenance period. We have established VSOE of the fair value of maintenance through independent maintenance renewals, which demonstrate a consistent relationship of pricing maintenance as a percentage of the discounted or undiscounted license list price. VSOE of the fair value of professional services is established based on daily rates when sold on a stand-alone basis.
Multiple-element arrangements
Occasionally, we may execute contracts with customers which contain multiple offerings. In our business, multiple-element arrangements refer to contracts with separate fees for subscription offerings, decision-support tools, maintenance, and/or related services. We have established separate units of accounting as each offering is primarily sold on a stand-alone basis. Using the relative selling price method, each element of the arrangement is allocated based generally on stand-alone sales of these products and services, which constitutes VSOE of selling price. We do not use any other factors, inputs, assumptions, or methods to determine an estimated selling price. We recognize the elements of the contract as follows:
• | Subscription offerings and license fees are recognized ratably over the license period as long as there is an associated licensing period or a future obligation. Otherwise, revenue is recognized upon delivery. |
• | For non-subscription offerings of a multiple-element arrangement, the revenue is generally recognized for each element in the period in which delivery of the product to the customer occurs, completion of services occurs or, for post-contract support, ratably over the term of the maintenance period. |
• | In some instances, customer acceptance is required for consulting services rendered. For those transactions, the service revenue component of the arrangement is recognized in the period that customer acceptance is obtained. |
Cash and Cash Equivalents
We consider all highly liquid investments purchased with an original maturity of three months or less to be cash equivalents. Cash equivalents are carried at cost, which approximates fair value.
Deferred Subscription Costs
Deferred subscription costs represent royalties and certain dealer commissions associated with customer subscriptions. These costs are deferred and amortized to expense over the period of the subscriptions.
Property and Equipment
Property and equipment is stated at cost. Depreciation is recorded using the straight-line method over the estimated useful lives of the assets as follows:
Buildings and improvements | 7 | to | 30 | years | |
Capitalized software | 3 | to | 7 | years | |
Computers and office equipment | 3 | to | 10 | years | |
Leasehold improvements are depreciated over the shorter of their estimated useful life or the life of the lease. Maintenance, repairs, and renewals of a minor nature are expensed as incurred. Betterments and major renewals which extend the useful lives of buildings, improvements, and equipment are capitalized. We also capitalize certain internal-use software development costs in accordance with applicable accounting principles.
We review the carrying amounts of long-lived assets such as property and equipment whenever current events or circumstances indicate their value may be impaired. A long-lived asset with a finite life is considered to be impaired if its carrying value exceeds the estimated future undiscounted cash flows to be derived from it. Any impairment is measured by the amount that the carrying value of such assets exceeds their fair value, primarily based on estimated discounted cash flows. Considerable management judgment is necessary to estimate the fair value of assets. Assets to be disposed of are carried at the lower of their financial statement carrying amount or fair value, less cost to sell.
Leases
In certain circumstances, we enter into leases with free rent periods or rent escalations over the term of the lease. In such cases, we calculate the total payments over the term of the lease and record them ratably as rent expense over that term.
46
Intangible Assets and Goodwill
We account for our business acquisitions using the purchase method of accounting. We allocate the total cost of an acquisition to the underlying net assets based on their respective estimated fair values. As part of this allocation process, we must identify and attribute values and estimated lives to the intangible assets acquired. We evaluate our intangible assets and goodwill for impairment at least annually, as well as whenever events or changes in circumstances indicate that carrying amounts may not be recoverable. Impairments are expensed as incurred.
Finite-lived intangible assets
Identifiable intangible assets with finite lives are generally amortized on a straight-line basis over their respective lives, as follows:
Information databases | 2 | to | 15 | years | |
Customer relationships | 4 | to | 17 | years | |
Developed computer software | 5 | to | 10 | years | |
Trademarks | 1 | to | 15 | years | |
Other | 1 | to | 8 | years | |
Indefinite-lived intangible assets
When performing the impairment test for indefinite-lived intangible assets, which consist of trade names and perpetual licenses, we first conduct a qualitative analysis to determine whether we believe it is more likely than not that an asset has been impaired. If we believe an impairment has occurred, we then evaluate for impairment by comparing the amount by which the carrying value of the asset exceeds its fair value. An impairment charge is recognized if the asset’s estimated fair value is less than its carrying value.
We estimate the fair value based on the relief from royalty method using projected discounted future cash flows, which, in turn, are based on our views of uncertain variables such as growth rates, anticipated future economic conditions, and the appropriate discount rates relative to risk and estimates of residual values. The use of different estimates or assumptions within our discounted cash flow model when determining the fair value of our indefinite-lived intangible assets or using a methodology other than a discounted cash flow model could result in different values for our indefinite-lived intangible assets and could result in an impairment charge.
Goodwill
We test goodwill for impairment on a reporting unit level. A reporting unit is a group of businesses (i) for which discrete financial information is available and (ii) that have similar economic characteristics. We have determined that our reporting units are Americas, EMEA, APAC, and CARFAX. We test goodwill for impairment by determining the fair value of each reporting unit and comparing it to the reporting unit's carrying value. We determine the fair value of our reporting units based on projected future discounted cash flows, which, in turn, are based on our views of uncertain variables such as growth rates, anticipated future economic conditions and the appropriate discount rates relative to risk and estimates of residual values. There were no deficiencies in reporting unit fair values versus carrying values in the fiscal years ended November 30, 2014, 2013, and 2012.
Income Taxes
Deferred income taxes are provided using tax rates enacted for periods of expected reversal on all temporary differences. Temporary differences relate to differences between the book and tax basis of assets and liabilities, principally intangible assets, property and equipment, deferred revenue, pension and other postretirement benefits, accruals, and stock-based compensation. Valuation allowances are established to reduce deferred tax assets to the amount that will more likely than not be realized. To the extent that a determination is made to establish or adjust a valuation allowance, the expense or benefit is recorded in the period in which the determination is made.
Judgment is required in determining the worldwide provision for income taxes. Additionally, the income tax provision is based on calculations and assumptions that are subject to examination by many different tax authorities and to changes in tax law and rates in many jurisdictions. We adjust our income tax provision in the period in which it becomes probable that actual results will differ from our estimates.
Pension and Other Postretirement Benefits
During the fourth quarter of each fiscal year (or upon any other remeasurement date), we immediately recognize net actuarial gains or losses in excess of a corridor in our operating results. The corridor amount is equivalent to 10 percent of the
47
greater of the market-related value of plan assets or the plan's benefit obligation at the beginning of the year. We use the actual fair value of plan assets at the measurement date as the measure of the market-related value of plan assets.
Treasury Stock
For all stock retention and buyback programs and transactions, we utilize the cost method of accounting. We employ the weighted-average cost method as our costing method for treasury stock issuances. Treasury stock purchases are recorded at actual cost.
Earnings per Share
Basic earnings per share (EPS) is computed by dividing net income by the weighted-average number of shares of Class A common stock outstanding during the period. Diluted EPS is computed using the weighted-average number of shares of Class A common stock and dilutive potential shares of Class A common stock outstanding during the period. Diluted EPS reflects the potential dilution that could occur if securities were exercised or converted into shares of Class A common stock.
Advertising Costs
Production costs are expensed as of the first date that the advertisements take place. Advertising expense was approximately $35.2 million for 2014 and $12.7 million for 2013, and was primarily comprised of Polk and CARFAX advertising; advertising expense for 2012 was insignificant.
Foreign Currency
The functional currency of each of our foreign subsidiaries is typically such subsidiary’s local currency. Assets and liabilities are translated at period-end exchange rates. Income and expense items are translated at weighted-average rates of exchange prevailing during the year. Any translation adjustments are included in other comprehensive income. Transactions executed in currencies other than a subsidiary's functional currency (which result in exchange adjustments) are remeasured at spot rates and resulting foreign-exchange-transaction gains and losses are included in the results of operations.
Stock-Based Compensation
All stock-based awards are recognized in the income statement based on their grant date fair values. In addition, we estimate forfeitures at the grant date. Compensation expense is recognized based on the number of awards expected to vest. We adjust compensation expense in future periods if actual forfeitures differ from our estimates. Our forfeiture rate is based upon historical experience as well as anticipated employee turnover considering certain qualitative factors. We amortize the value of stock-based awards to expense over the vesting period on a straight-line basis. For awards with performance conditions, we evaluate the probability of the number of shares that are expected to vest, and compensation expense is then adjusted to reflect the number of shares expected to vest and the cumulative vesting period met to date.
Recent Accounting Pronouncements
In April 2014, the FASB issued ASU 2014-08, which changes the criteria for determining which disposals can be presented as discontinued operations and modifies related disclosure requirements. The ASU is intended to reduce the frequency of disposals reported as discontinued operations by focusing on strategic shifts that have (or will have) a major effect on an entity’s operations and financial results. The standard will be effective for us in the first quarter of our fiscal year 2016, although early adoption is permitted. We do not expect that the adoption of this ASU will have a significant impact on our consolidated financial statements other than changing the classification criteria and related disclosures for any potential future disposals.
In May 2014, the FASB issued ASU 2014-09, which establishes a comprehensive new revenue recognition model designed to depict the transfer of goods or services to a customer in an amount that reflects the consideration the entity expects to receive in exchange for those goods or services. The ASU allows for the use of either the full or modified retrospective transition method, and the standard will be effective for us in the first quarter of our fiscal year 2018; early adoption is not permitted. We are currently evaluating the impact of this new standard on our consolidated financial statements, as well as which transition method we intend to use.
In August 2014, the FASB issued ASU 2014-15, which requires that management evaluate the entity's ability to continue as a going concern within one year after the date that the financial statements are issued. Disclosure is required if there is substantial doubt about the entity's ability to continue as a going concern. The standard will be effective for us in the fourth quarter of our fiscal year 2017, although early adoption is permitted. We do not expect that the adoption of this ASU will have a significant impact on our consolidated financial statements.
48
3. | Business Combinations |
During the year ended November 30, 2014, we completed the following acquisitions, none of which were material either individually or in the aggregate:
Global Trade Information Services (GTI). On August 1, 2014, we acquired GTI, a leading provider of international merchandise trade data. We acquired GTI in order to support our strategy of building integrated workflow solutions that target industry needs related to global trade.
PCI Acrylonitrile Limited (PCI Acrylonitrile). On August 28, 2014, we acquired PCI Acrylonitrile, a provider of information and analysis on the acrylonitrile propylene derivative product. We acquired PCI Acrylonitrile in order to strengthen our position in chemical market advisory services.
DisplaySearch and Solarbuzz. On November 6, 2014, we acquired the DisplaySearch and Solarbuzz businesses of The NPD Group. DisplaySearch conducts global primary research in display technology and Solarbuzz provides market intelligence, research, and forecasting for the solar industry. We acquired these two businesses in order to strengthen our supply chain offerings for displays and to help us develop new offerings in the solar market.
PacWest Consulting Partners (PacWest). On November 17, 2014, we acquired PacWest, a provider of information, market intelligence, and strategic analysis to the upstream unconventional oil and gas industry. We acquired PacWest in order to expand our presence in the hydraulic fracturing and related unconventional space.
The following table summarizes the preliminary purchase price allocation, net of acquired cash, for these acquisitions (in thousands):
Total | ||||
Assets: | ||||
Current assets | $ | 6,574 | ||
Property and equipment | 345 | |||
Intangible assets | 88,465 | |||
Goodwill | 130,267 | |||
Other long-term assets | 31 | |||
Total assets | 225,682 | |||
Liabilities: | ||||
Current liabilities | 632 | |||
Deferred revenue | 14,322 | |||
Other long-term liabilities | 333 | |||
Total liabilities | 15,287 | |||
Purchase price | $ | 210,395 | ||
In December 2014, we acquired JOC Group, a leading global supplier of U.S. seaborne trade intelligence, and Infonetics Research, a global leader in communications technology market intelligence. The total purchase price for these acquisitions was approximately $123 million, net of cash acquired.
During 2013, we completed the following acquisitions, among others:
Exclusive Analysis and the business of Dodson Data Systems. On December 12, 2012, we announced the completion of two strategic acquisitions: Exclusive Analysis, a specialist intelligence company that forecasts political and violent risks worldwide, and the business of Dodson Data Systems, a leading provider of strategic information for companies engaged in oil and gas operations located in the Gulf of Mexico and the United States. We acquired these two businesses in order to augment our existing product portfolio by providing our customers with additional information, forecasting, and analytics.
Energy Publishing Inc. (Energy Publishing). On December 31, 2012, we acquired Energy Publishing, a leading provider of North American and Australasian coal intelligence. We acquired Energy Publishing in order to strengthen our position in
49
coal intelligence and give us an immediate presence and deep coverage in North American and Australasian coal markets, complementing our existing global Energy and Power product offerings.
Fekete Associates. On April 5, 2013, we acquired Fekete Associates, a leading provider of integrated reservoir management software and services to the oil and gas industry. We acquired Fekete in order to combine Fekete's workflow tools with our existing energy information products to create efficiencies for customers by helping them make timely exploration and production decisions.
Waterborne Energy. On May 13, 2013, we acquired Waterborne Energy, a company that provides global research, analysis, and price information in the Liquefied Petroleum Gas (LPG) and Liquefied Natural Gas (LNG) sector. We acquired Waterborne in order to help us provide our customers with comprehensive and complete LPG and LNG intelligence that will aid them in making key business decisions regarding demand, supply, and pricing. The purchase price allocation for this acquisition is preliminary and may change upon completion of the determination of fair value.
PFC Energy. On June 19, 2013, we acquired PFC Energy, a provider of upstream and downstream energy information, research, and analysis. We acquired PFC Energy because of its product offering set, geographical footprint, and customer relationships, all of which are complementary to IHS and bring greater depth and breadth in key areas of the IHS energy solution set.
R. L. Polk & Co. (Polk). On July 15, 2013, we acquired Polk, a recognized leader in providing automotive information and analytics solutions, for approximately $1.4 billion, consisting of approximately $1.25 billion in cash, net of cash acquired, and 1,334,477 shares of our common stock (at a value of $131.5 million), which we issued from our treasury stock. The cash portion of the transaction was funded with cash on hand, cash from our amended existing revolving credit facility, and a new bank term loan. We acquired Polk in order to further establish our automotive business as a strategic partner for the automotive industry worldwide.
We have included revenue and expenses attributable to Polk in the appropriate geographic segment (principally the Americas) from the date of acquisition. The Polk acquisition contributed $165.9 million of revenue and $14.4 million of income from continuing operations for the post-acquisition period ended November 30, 2013.
The following unaudited pro forma information has been prepared as if the Polk acquisition had been consummated at December 1, 2011. This information is presented for informational purposes only, and is not necessarily indicative of the operating results that would have occurred if the acquisition had been consummated as of that date. This information should not be used as a predictive measure of our future financial position, results of operations, or liquidity.
Year ended November 30, | ||||||||
Supplemental pro forma financial information (Unaudited) | 2013 | 2012 | ||||||
(In thousands, except per share data) | ||||||||
Total revenue | $ | 2,105,314 | $ | 1,923,901 | ||||
Net income | $ | 102,107 | $ | 160,991 | ||||
Diluted earnings per share | $ | 1.50 | $ | 2.37 | ||||
The 2013 pro forma net income excludes $26.4 million of one-time change in control and transaction costs.
The following table summarizes the purchase price allocation, net of acquired cash, for all acquisitions completed in 2013 (in thousands):
50
Polk | All others | Total | |||||||||
Assets: | |||||||||||
Current assets | $ | 87,076 | $ | 16,524 | $ | 103,600 | |||||
Property and equipment | 32,311 | 2,759 | 35,070 | ||||||||
Intangible assets | 620,700 | 83,646 | 704,346 | ||||||||
Goodwill | 935,450 | 170,224 | 1,105,674 | ||||||||
Other long-term assets | 11,032 | 210 | 11,242 | ||||||||
Total assets | 1,686,569 | 273,363 | 1,959,932 | ||||||||
Liabilities: | |||||||||||
Current liabilities | 53,785 | 29,673 | 83,458 | ||||||||
Deferred taxes | 243,842 | 4,250 | 248,092 | ||||||||
Other long-term liabilities | 8,926 | 936 | 9,862 | ||||||||
Total liabilities | 306,553 | 34,859 | 341,412 | ||||||||
Purchase price | $ | 1,380,016 | $ | 238,504 | $ | 1,618,520 | |||||
During 2012, we completed the following acquisitions:
Acquisitions announced March 5, 2012. On March 5, 2012, we announced the acquisition of Displaybank Co., Ltd., a global authority in market research and consulting for the flat-panel display industry, and the Computer Assisted Product Selection (CAPS™) electronic components database and tools business, including CAPS Expert, from PartMiner Worldwide. We acquired Displaybank in order to deepen our Asia Pacific research and analysis capabilities and we acquired the CAPS family of products in order to enhance our existing electronic parts information business.
IMS Group Holdings Ltd. (IMS Research). On March 22, 2012, we acquired IMS Research, a leading independent provider of market research and consultancy to the global electronics industry. We acquired IMS Research in order to help us expand our products and services in the technology, media and telecommunications value chain.
BDW Automotive GmbH (BDW). On March 29, 2012, we acquired BDW, a leader in the development of information and planning systems and intelligent processing of vehicle databases for the automotive industry. We acquired BDW in order to expand our capabilities in the automotive dealer and aftermarket data and systems market.
XēDAR Corporation (XēDAR). On May 11, 2012, we acquired XēDAR, a leading developer and provider of geospatial information products and services. We acquired XēDAR primarily to use its proprietary geographic and land information system solutions to contribute to our energy technical information and analytical tools.
CyberRegs. On July 2, 2012, we acquired the CyberRegs business from Citation Technologies, Inc. The CyberRegs business is designed to help customers make business decisions about regulatory compliance for Enterprise Sustainability Management. We acquired CyberRegs in order to help our customers reduce IT system and workflow complexity by reducing the number of vendors they rely on to support their strategies for Enterprise Sustainability Management.
GlobalSpec, Inc. (GlobalSpec). On July 9, 2012, we acquired GlobalSpec, a leading specialized vertical search, product information, and digital media company serving the engineering, manufacturing, and related scientific and technical market segments. We acquired GlobalSpec in order to help us improve our product design portfolio and create an expanded destination for our products and services.
Invention Machine. On July 11, 2012, we acquired Invention Machine, a leader in semantic search technology. We acquired Invention Machine in order to utilize its semantic search engine to help customers accelerate innovation and develop, maintain, and produce superior products and services.
The following table summarizes the purchase price allocation, net of acquired cash, for all acquisitions completed in 2012 (in thousands):
51
GlobalSpec | All others | Total | |||||||||
Assets: | |||||||||||
Current assets | $ | 4,740 | $ | 11,702 | $ | 16,442 | |||||
Property and equipment | 1,880 | 2,531 | 4,411 | ||||||||
Intangible assets | 44,500 | 72,034 | 116,534 | ||||||||
Goodwill | 114,778 | 115,987 | 230,765 | ||||||||
Other long-term assets | 772 | 282 | 1,054 | ||||||||
Total assets | 166,670 | 202,536 | 369,206 | ||||||||
Liabilities: | |||||||||||
Current liabilities | 80 | 8,191 | 8,271 | ||||||||
Deferred revenue | 12,238 | 12,926 | 25,164 | ||||||||
Deferred taxes | 17,661 | 11,631 | 29,292 | ||||||||
Other long-term liabilities | 211 | — | 211 | ||||||||
Total liabilities | 30,190 | 32,748 | 62,938 | ||||||||
Purchase price | $ | 136,480 | $ | 169,788 | $ | 306,268 | |||||
4. | Accounts Receivable |
Our accounts receivable balance consists of the following as of November 30, 2014 and 2013 (in thousands):
2014 | 2013 | |||||||
Accounts receivable | $ | 433,586 | $ | 470,251 | ||||
Less: Accounts receivable allowance | (12,212 | ) | (10,988 | ) | ||||
Accounts receivable, net | $ | 421,374 | $ | 459,263 | ||||
We record an accounts receivable allowance when it is probable that the accounts receivable balance will not be collected. The amounts comprising the allowance are based upon management’s estimates and historical collection trends. The activity in our accounts receivable allowance consists of the following for the years ended November 30, 2014, 2013, and 2012, respectively (in thousands):
2014 | 2013 | 2012 | ||||||||||
Balance at beginning of year | $ | 10,988 | $ | 4,346 | $ | 4,300 | ||||||
Provision for bad debts | 12,487 | 9,496 | 2,661 | |||||||||
Other additions | 1,052 | 2,133 | 1,056 | |||||||||
Write-offs and other deductions | (12,315 | ) | (4,987 | ) | (3,671 | ) | ||||||
Balance at end of year | $ | 12,212 | $ | 10,988 | $ | 4,346 | ||||||
5. | Property and Equipment |
Property and equipment consists of the following as of November 30, 2014 and 2013 (in thousands):
2014 | 2013 | |||||||
Land, buildings and improvements | $ | 114,618 | $ | 108,287 | ||||
Capitalized software | 271,556 | 149,681 | ||||||
Computers and office equipment | 163,825 | 195,006 | ||||||
Property and equipment, gross | 549,999 | 452,974 | ||||||
Less: Accumulated depreciation | (248,580 | ) | (207,408 | ) | ||||
Property and equipment, net | $ | 301,419 | $ | 245,566 | ||||
52
Depreciation expense was $68.3 million, $48.8 million, and $36.1 million for the years ended November 30, 2014, 2013, and 2012, respectively.
6. | Intangible Assets |
The following table presents details of our acquired intangible assets, other than goodwill (in thousands):
As of November 30, 2014 | As of November 30, 2013 | ||||||||||||||||||||||
Gross | Accumulated Amortization | Net | Gross | Accumulated Amortization | Net | ||||||||||||||||||
Intangible assets subject to amortization: | |||||||||||||||||||||||
Information databases | $ | 607,655 | $ | (210,105 | ) | $ | 397,550 | $ | 633,347 | $ | (194,904 | ) | $ | 438,443 | |||||||||
Customer relationships | 511,680 | (116,138 | ) | 395,542 | 470,632 | (90,827 | ) | 379,805 | |||||||||||||||
Developed computer software | 138,940 | (63,561 | ) | 75,379 | 159,413 | (64,514 | ) | 94,899 | |||||||||||||||
Trademarks | 163,739 | (22,937 | ) | 140,802 | 167,179 | (13,300 | ) | 153,879 | |||||||||||||||
Other | 28,408 | (8,844 | ) | 19,564 | 28,121 | (15,076 | ) | 13,045 | |||||||||||||||
Total | 1,450,422 | (421,585 | ) | 1,028,837 | 1,458,692 | (378,621 | ) | 1,080,071 | |||||||||||||||
Intangible assets not subject to amortization: | |||||||||||||||||||||||
Trademarks | 61,101 | — | 61,101 | 63,144 | — | 63,144 | |||||||||||||||||
Perpetual licenses | 1,171 | — | 1,171 | 1,249 | — | 1,249 | |||||||||||||||||
Total intangible assets | $ | 1,512,694 | $ | (421,585 | ) | $ | 1,091,109 | $ | 1,523,085 | $ | (378,621 | ) | $ | 1,144,464 | |||||||||
Intangible asset amortization expense was $133.8 million, $109.9 million, and $82.1 million for the years ended November 30, 2014, 2013, and 2012, respectively. Estimated future amortization expense related to intangible assets held as of November 30, 2014 is as follows:
Year | Amount (in thousands) | |||
2015 | $ | 129,199 | ||
2016 | $ | 120,417 | ||
2017 | $ | 106,060 | ||
2018 | $ | 94,106 | ||
2019 | $ | 86,715 | ||
Thereafter | $ | 492,340 | ||
Changes in our goodwill and gross intangible assets from November 30, 2013 to November 30, 2014 were primarily the result of our recent acquisition activities, partially offset by the writeoff of fully amortized intangible assets that are no longer in service. The change in net intangible assets was primarily due to current year amortization, partially offset by the addition of intangible assets associated with the acquisitions described in Note 3, Business Combinations. Goodwill, gross intangible assets, and net intangible assets were all subject to foreign currency translation effects.
7. | Derivatives |
Our business is exposed to various market risks, including interest rate and foreign currency risks. We utilize derivative instruments to help us manage these risks. We do not hold or issue derivatives for speculative purposes.
Interest Rate Swaps
To mitigate interest rate exposure on our outstanding revolving facility debt, we utilize the following types of derivative instruments:
53
• | Interest rate derivative contracts that effectively swap $100 million of floating rate debt at a 1.80 percent weighted-average fixed interest rate, plus the applicable revolving facility spread. We entered into these swap contracts in 2011, and both contracts expire in July 2015. |
• | Forward-starting interest rate derivative contracts that effectively swap $400 million of floating rate debt at a 2.86 percent weighted-average fixed interest rate, plus the applicable revolving facility spread. We entered into these swap contracts in November 2013 and January 2014. The contracts take effect between May 2015 and November 2015, with respective expiration dates between May 2020 and November 2020. |
Because the terms of these swaps and the variable rate debt (as amended or extended over time) coincide, we do not expect any ineffectiveness. We have designated and accounted for these instruments as cash flow hedges, with changes in fair value being deferred in accumulated other comprehensive income/loss (AOCI) in the consolidated balance sheets.
Foreign Currency Forwards
To mitigate foreign currency exposure, we utilize the following derivative instruments:
• | Foreign currency forward contracts that hedge the foreign currency exposure on Euro-denominated receipts in our U.S. Dollar functional entities. We utilize a rolling hedging program to mitigate a portion of this exposure. Because the critical terms of the forward contracts and the forecasted cash flows coincide, we do not expect any ineffectiveness associated with these contracts. We have designated and accounted for these derivatives as cash flow hedges, with changes in fair value being deferred in AOCI in our consolidated balance sheets. The notional amount of outstanding foreign currency forwards under these agreements was approximately $11.0 million and $15.9 million as of November 30, 2014 and 2013, respectively. |
• | Short-term foreign currency forward contracts that manage market risks associated with fluctuations in balances that are denominated in currencies other than the local functional currency. We account for these forward contracts at fair value and recognize the associated realized and unrealized gains and losses in other expense (income), net, since we have not designated these contracts as hedges for accounting purposes. The following table summarizes the notional amounts of these outstanding foreign currency forward contracts as of November 30, 2014 and 2013 (in thousands): |
November 30, 2014 | November 30, 2013 | |||||||
Notional amount of currency pair: | ||||||||
Contracts to buy USD with CAD | $ | 51,194 | $ | 142,606 | ||||
Contracts to buy CAD with GBP | C$ | 50,000 | C$ | 28,741 | ||||
Contracts to buy USD with EUR | $ | 12,517 | $ | 17,522 | ||||
Contracts to buy CHF with USD | CHF | 9,000 | CHF | 14,000 | ||||
Contracts to buy GBP with EUR | £ | 4,774 | £ | 5,866 | ||||
Contracts to buy USD with GBP | $ | 48,000 | $ | 3,000 | ||||
Contracts to buy USD with JPY | $ | 8,778 | $ | — | ||||
Contracts to buy USD with KRW | $ | 10,000 | $ | — | ||||
Fair Value of Derivatives
Since our derivative instruments are not listed on an exchange, we have evaluated fair value by reference to similar transactions in active markets; consequently, we have classified all of our derivative instruments within Level 2 of the fair value measurement hierarchy. The following table shows the classification, location, and fair value of our derivative instruments as of November 30, 2014 and 2013 (in thousands):
54
Fair Value of Derivative Instruments | ||||||||||
November 30, 2014 | November 30, 2013 | Balance Sheet Location | ||||||||
Assets: | ||||||||||
Derivatives designated as accounting hedges: | ||||||||||
Foreign currency forwards | $ | 987 | $ | 8 | Other current assets | |||||
Derivatives not designated as accounting hedges: | ||||||||||
Foreign currency forwards | 1,005 | 1,548 | Other current assets | |||||||
Total | $ | 1,992 | $ | 1,556 | ||||||
Liabilities: | ||||||||||
Derivatives designated as accounting hedges: | ||||||||||
Interest rate swaps | $ | 16,662 | $ | 3,366 | Other accrued expenses and other liabilities | |||||
Foreign currency forwards | — | 423 | Other accrued expenses | |||||||
Derivatives not designated as accounting hedges: | ||||||||||
Foreign currency forwards | 475 | 957 | Other accrued expenses | |||||||
Total | $ | 17,137 | $ | 4,746 | ||||||
The net gain (loss) on foreign currency forwards that are not designated as hedging instruments for the years ended November 30, 2014, 2013, and 2012, respectively, was as follows (in thousands):
Amount of (gain) loss recognized in the consolidated statements of operations | ||||||||||||||
Location on consolidated statements of operations | 2014 | 2013 | 2012 | |||||||||||
Foreign currency forwards | Other expense (income), net | $ | (6,293 | ) | $ | (5,372 | ) | $ | 2,491 | |||||
The following table provides information about the cumulative amount of unrecognized hedge losses recorded in AOCI as of November 30, 2014 and November 30, 2013, as well as the activity on our cash flow hedging instruments for the years ended November 30, 2014, 2013, and 2012, respectively (in thousands):
Year ended November 30, | ||||||||||||
2014 | 2013 | 2012 | ||||||||||
Beginning balance | $ | (2,199 | ) | $ | (2,225 | ) | $ | (1,918 | ) | |||
Amount of gain (loss) recognized in AOCI on derivative: | ||||||||||||
Interest rate swaps | (8,941 | ) | (797 | ) | (1,123 | ) | ||||||
Foreign currency forwards | 598 | (153 | ) | — | ||||||||
Amount of loss reclassified from AOCI into income: | ||||||||||||
Interest rate swaps (1) | 950 | 935 | 816 | |||||||||
Foreign currency forwards (1) | 110 | 41 | — | |||||||||
Ending balance | $ | (9,482 | ) | $ | (2,199 | ) | $ | (2,225 | ) | |||
(1) Amounts reclassified from AOCI into income related to interest rate swaps are recorded in interest expense, and amounts reclassified from AOCI into income related to foreign currency forwards are recorded in revenue. | ||||||||||||
The unrecognized gains relating to the foreign currency forwards are expected to be reclassified into revenue within the next 12 months, and approximately $2.9 million of the $16.7 million unrecognized losses relating to the interest rate swaps are expected to be reclassified into interest expense within the next 12 months.
8. | Debt |
55
The following table summarizes total indebtedness as of November 30, 2014 and 2013 (in thousands):
November 30, 2014 | November 30, 2013 | |||||||
2011 credit facility: | ||||||||
Revolver | $ | — | $ | 770,000 | ||||
Term loans | — | 446,904 | ||||||
2012 term loan | — | 250,000 | ||||||
2013 term loan | 700,000 | 700,000 | ||||||
2014 revolving facility | 385,000 | — | ||||||
5% senior notes due 2022 | 750,000 | — | ||||||
Capital leases | 7,355 | 7,688 | ||||||
Total debt | $ | 1,842,355 | $ | 2,174,592 | ||||
Current portion | (36,257 | ) | (395,527 | ) | ||||
Total long-term debt | $ | 1,806,098 | $ | 1,779,065 | ||||
2011 credit facility. Our 2011 credit facility was a syndicated bank credit agreement that consisted of amortizing term loans and a $1.0 billion revolver. All borrowings under the credit facility were unsecured. The term loans and revolver included in the credit facility had a five-year tenor ending in January 2016. The interest rates for borrowings under the credit facility were the applicable LIBOR plus a spread of 1.00 percent to 2.25 percent, depending upon our Leverage Ratio, which is defined as the ratio of Consolidated Funded Indebtedness to rolling four-quarter Consolidated Earnings Before Interest Expense, Taxes, Depreciation and Amortization (EBITDA), as such terms were defined in the credit facility. A commitment fee on any unused balance was payable periodically and ranged from 0.15 percent to 0.40 percent based upon our Leverage Ratio. The credit facility contained certain financial and other covenants, including a maximum Leverage Ratio and a minimum Interest Coverage Ratio, as such terms were defined in the credit facility. In October 2014, we repaid all amounts and cancelled all commitments outstanding under the 2011 credit facility.
2012 term loan. During the third quarter of 2012, we entered into a $250 million interest-only term loan agreement with a two-and-a-half year tenor ending in March 2015. Borrowings under the loan were unsecured. The interest for borrowing under this loan, as well as certain financial and other covenants, including a maximum Leverage Ratio and a minimum Interest Coverage ratio, was consistent with the amendment made to the existing 2011 credit facility term loans in the third quarter of 2013 described above. In October 2014, we repaid all amounts outstanding under the 2012 term loan.
2013 term loan. During the third quarter of 2013, we entered into a $700 million amortizing term loan agreement to facilitate a portion of the funding for the Polk acquisition. This term loan had a five-year tenor ending in July 2018, and borrowings under the loan were unsecured. The interest for borrowing under this term loan, as well as certain financial and other covenants, including a maximum Leverage Ratio and a minimum Interest Coverage ratio, were consistent with the 2011 credit facility described above. In October 2014, we entered into an amendment, restatement, and refinancing of the 2013 term loan, pursuant to which we borrowed $25 million to replace previously amortized principal and extended the maturity of the loan to October 2019. The interest rates for borrowings under the 2013 term loan are the applicable LIBOR plus a spread of 1.00 percent to 1.75 percent, depending upon our Leverage Ratio.
2014 revolving facility. In October 2014, we entered into a new $1.3 billion senior unsecured revolving credit agreement (2014 revolving facility). Commitments of $500 million are available for borrowing by certain of our foreign subsidiaries and $50 million is available for letters of credit. Subject to certain conditions, the 2014 revolving facility may be expanded by up to $500 million in the aggregate in additional commitments. Borrowings under the 2014 revolving facility mature in October 2019 and bear interest at the same rates and spreads as the 2013 term loan. A commitment fee on any unused balance is payable periodically and ranges from 0.13 percent to 0.30 percent based upon our Leverage Ratio. The 2014 revolving facility contains certain financial and other covenants, including a maximum Leverage Ratio and a minimum Interest Coverage Ratio, as such terms are defined in the 2014 revolving facility. Our Leverage Ratio as of November 30, 2014, was approximately 2.6x. The credit agreements allow for leverage up to 3.5x, with the ability to temporarily increase that leverage to 3.75x for two quarters. Amounts borrowed under the 2014 revolving facility were used to repay all amounts borrowed under the 2011 credit facility.
5% Notes. In October 2014, we issued $750 million aggregate principal amount of senior unsecured notes due 2022 in an offering not subject to the registration requirements of the Securities Act of 1933, as amended. The net proceeds from the 5% Notes were used to repay all amounts outstanding under the 2012 term loan and a portion of amounts borrowed under the 2014
56
revolving facility. The 5% Notes bear interest at a fixed rate of 5.00% and mature on November 1, 2022. Interest on the 5% Notes is due semiannually on May 1 and November 1 of each year, commencing May 1, 2015. We may redeem the 5% Notes in whole or in part at a redemption price equal to 100% of the principal amount of the notes plus the Applicable Premium, as defined in the indenture governing the 5% Notes. Additionally, at the option of the holders of the notes, we may be required to purchase all or a portion of the notes upon occurrence of a Change of Control Triggering Event as defined in the indenture, at a price equal to 101 percent of the principal amount thereof, plus accrued and unpaid interest to the date of purchase. The indenture contains covenants that limit our ability to, among other things, incur or create liens and enter into sale and leaseback transactions. In addition, the indenture contains a covenant that limits our ability to consolidate or merge with another entity or to sell all or substantially all of our assets to another entity. The indenture contains customary default provisions. We are required to register the notes within 365 days of their issuance. The fair value of the 5% Notes as of November 30, 2014 was approximately $765 million.
As a result of the 5% Notes issuance, 2014 revolving facility agreement, and amendment and restatement of the 2013 term loan, we capitalized approximately $18.8 million of new debt issuance costs and recorded a $1.4 million loss on debt extinguishment associated with a portion of prior capitalized debt issuance costs. We capitalized approximately $13.1 million of debt issuance costs in 2013.
As of November 30, 2014, we were in compliance with all of our debt covenants. We have classified short-term debt based on principal maturities and expected cash availability over the next 12 months. As of November 30, 2014, we had approximately $385 million of outstanding borrowings under the 2014 revolving facility at a current annual interest rate of 1.65 percent and approximately $700 million of outstanding borrowings under the 2013 term loan at a current weighted average annual interest rate of 1.92 percent, including the effect of the interest rate swaps.
We also had approximately $1.9 million of outstanding letters of credit under the 2014 revolving facility as of November 30, 2014, which reduces the available borrowing under the 2014 revolving facility by an equivalent amount.
Maturities of outstanding borrowings under the 2013 term loan and 5% Notes as of November 30, 2014 are as follows (in thousands):
Year | Amount (in thousands) | |||
2015 | $ | 35,000 | ||
2016 | 35,000 | |||
2017 | 70,000 | |||
2018 | 70,000 | |||
2019 | 490,000 | |||
Thereafter | 750,000 | |||
$ | 1,450,000 | |||
9. | Restructuring Charges |
During 2012, we consolidated positions to our accounting and customer care Centers of Excellence (COE) locations as we completed successive ERP releases, as well as eliminated positions to accomplish other operational efficiencies. We also began consolidating legacy data centers in 2012, which included certain contract termination costs. We recorded approximately $16.8 million of restructuring charges for these activities. The activities included the movement or elimination of 271 positions. Of the total charge, approximately $13.4 million of the charge was recorded in the Americas segment, approximately $3.0 million was recorded in the EMEA segment and approximately $0.4 million was recorded in the APAC segment.
During 2013, we eliminated 245 positions and incurred additional direct and incremental costs related to identified operational efficiencies, continued consolidation of positions to our COE locations, and further consolidation of our legacy data centers. We recorded approximately $13.5 million of restructuring charges for these activities. Of these charges, approximately $9.4 million was recorded in the Americas segment, $3.5 million was recorded in the EMEA segment, and $0.6 million was recorded in the APAC segment.
57
During 2014, we eliminated 168 positions and incurred additional direct and incremental costs related to identified operational efficiencies (including lease abandonments), continued consolidation of positions to our COE locations, and further consolidation of our legacy data centers. We recorded approximately $9.3 million of restructuring charges for these activities. Of these charges, approximately $5.8 million was recorded in the Americas segment, $3.1 million was recorded in the EMEA segment, and $0.4 million was recorded in the APAC segment. We expect to continue to incur costs related to these and other similar activities in future periods, resulting in additional restructuring charges.
The following table shows our restructuring activity and provides a reconciliation of the restructuring liability as of November 30, 2014 (in thousands):
Employee Severance and Other Termination Benefits | Contract Termination Costs | Other | Total | ||||||||||||
Balance at November 30, 2011 | $ | 540 | $ | — | $ | — | $ | 540 | |||||||
Add: Restructuring costs incurred | 13,847 | 2,228 | 1,008 | 17,083 | |||||||||||
Revision to prior estimates | (254 | ) | — | — | (254 | ) | |||||||||
Less: Amount paid | (10,970 | ) | (725 | ) | (949 | ) | (12,644 | ) | |||||||
Balance at November 30, 2012 | 3,163 | 1,503 | 59 | 4,725 | |||||||||||
Add: Restructuring costs incurred | 13,906 | 525 | 450 | 14,881 | |||||||||||
Revision to prior estimates | (1,498 | ) | 75 | — | (1,423 | ) | |||||||||
Less: Amount paid | (13,002 | ) | (2,000 | ) | (486 | ) | (15,488 | ) | |||||||
Balance at November 30, 2013 | 2,569 | 103 | 23 | 2,695 | |||||||||||
Add: Restructuring costs incurred | 8,755 | 575 | 1,269 | 10,599 | |||||||||||
Revision to prior estimates | (1,586 | ) | 259 | — | (1,327 | ) | |||||||||
Less: Amount paid | (6,771 | ) | (920 | ) | (1,152 | ) | (8,843 | ) | |||||||
Balance at November 30, 2014 | $ | 2,967 | $ | 17 | $ | 140 | $ | 3,124 | |||||||
As of November 30, 2014, approximately $2.3 million of the remaining liability was in the Americas segment and approximately $0.8 million was in the EMEA segment. The entire $3.1 million is expected to be paid in 2015.
10. | Acquisition-related Costs |
During 2012, we incurred approximately $4.1 million in costs associated with acquisitions, including legal and professional fees, the elimination of certain positions, and a facility closure. Substantially all of the costs were incurred within the Americas segment.
During 2013, we incurred approximately $23.4 million in costs associated with acquisitions, primarily related to the Polk acquisition. Acquisition-related costs for 2013 included investment adviser fees, severance, a lease abandonment, and legal and professional fees. Certain of these costs were incurred for a transaction that we chose not to consummate. Approximately $19.6 million of the costs were incurred in the Americas segment and $3.9 million of the costs were incurred in the EMEA segment.
During 2014, we incurred approximately $1.9 million in costs associated with acquisitions, including severance, lease abandonments, and professional fees. Approximately $1.5 million of the total charge was recorded in the Americas segment and $0.4 million was recorded in the EMEA segment.
The following table provides a reconciliation of the acquisition-related costs accrued liability as of November 30, 2014 (in thousands):
58
Employee Severance and Other Termination Benefits | Contract Termination Costs | Other | Total | ||||||||||||
Balance at November 30, 2011 | $ | 1,619 | $ | 469 | $ | 185 | $ | 2,273 | |||||||
Add: Costs incurred | 1,912 | 138 | 2,119 | 4,169 | |||||||||||
Revision to prior estimates | (22 | ) | — | — | (22 | ) | |||||||||
Less: Amount paid | (2,925 | ) | (523 | ) | (2,304 | ) | (5,752 | ) | |||||||
Balance at November 30, 2012 | $ | 584 | $ | 84 | $ | — | $ | 668 | |||||||
Add: Costs incurred | 7,828 | 1,291 | 14,487 | 23,606 | |||||||||||
Revision to prior estimates | (114 | ) | (44 | ) | (20 | ) | (178 | ) | |||||||
Less: Amount paid | (2,439 | ) | (1,130 | ) | (14,396 | ) | (17,965 | ) | |||||||
Balance at November 30, 2013 | $ | 5,859 | $ | 201 | $ | 71 | $ | 6,131 | |||||||
Add: Costs incurred | 897 | 515 | 702 | 2,114 | |||||||||||
Revision to prior estimates | (230 | ) | 17 | — | (213 | ) | |||||||||
Less: Amount paid | (5,940 | ) | (618 | ) | (356 | ) | (6,914 | ) | |||||||
Balance at November 30, 2014 | $ | 586 | $ | 115 | $ | 417 | $ | 1,118 | |||||||
As of November 30, 2014, the $1.1 million remaining liability was in the Americas segment, and we expect that it will be substantially paid in 2015.
11. | Discontinued Operations |
Effective December 31, 2009, we sold our small non-core South African business for approximately $2 million with no gain or loss on sale. The sale of this business included a building and certain intellectual property. In exchange for the sale of these assets, we received two three-year notes receivable, one secured by a mortgage on the building and the second secured by a pledge on the shares of the South African company. In December 2010, we received full payment of the note receivable that was secured by a mortgage on the building. In November 2013, we received final payment of the remaining note receivable.
Operating results of these discontinued operations for the years ended November 30, 2014, 2013, and 2012, respectively, were as follows (in thousands):
2014 | 2013 | 2012 | ||||||||||
Income (loss) from discontinued operations before income taxes | — | (163 | ) | 36 | ||||||||
Tax benefit (expense) | — | 62 | (17 | ) | ||||||||
Income (loss) from discontinued operations, net | $ | — | $ | (101 | ) | $ | 19 | |||||
12. | Income Taxes |
The amounts of income from continuing operations before income taxes by U.S. and foreign jurisdictions for the years ended November 30, 2014, 2013, and 2012, respectively, is as follows (in thousands):
2014 | 2013 | 2012 | |||||||||
U.S. | $ | 13,046 | $ | (41,924 | ) | $ | 10,693 | ||||
Foreign | 236,151 | 196,817 | 177,020 | ||||||||
$ | 249,197 | $ | 154,893 | $ | 187,713 | ||||||
The provision for income taxes from continuing operations for the years ended November 30, 2014, 2013, and 2012, respectively, is as follows (in thousands):
59
2014 | 2013 | 2012 | |||||||||
Current: | |||||||||||
U.S. | $ | 19,615 | $ | 15,388 | $ | 17,301 | |||||
Foreign | 37,731 | 38,069 | 24,224 | ||||||||
State | 7,587 | 3,914 | 4,490 | ||||||||
Total current | 64,933 | 57,371 | 46,015 | ||||||||
Deferred: | |||||||||||
U.S. | (8,688 | ) | (24,313 | ) | (13,420 | ) | |||||
Foreign | 1,234 | (7,336 | ) | (2,592 | ) | ||||||
State | (2,831 | ) | (2,663 | ) | (439 | ) | |||||
Total deferred | (10,285 | ) | (34,312 | ) | (16,451 | ) | |||||
Provision for income taxes | $ | 54,648 | $ | 23,059 | $ | 29,564 | |||||
The following table presents the reconciliation of the provision for income taxes to the U.S. statutory tax rate for the years ended November 30, 2014, 2013, and 2012, respectively (in thousands):
2014 | 2013 | 2012 | |||||||||
Statutory U.S. federal income tax | $ | 87,219 | $ | 54,213 | $ | 65,700 | |||||
State income tax, net of federal benefit | 2,715 | (62 | ) | 1,523 | |||||||
Foreign rate differential | (68,543 | ) | (62,448 | ) | (38,153 | ) | |||||
Tax rate change | 366 | 5,286 | (2,162 | ) | |||||||
Valuation allowance | 25,503 | 29,288 | (1,429 | ) | |||||||
Change in reserves | 28 | (1,387 | ) | 586 | |||||||
Other | 7,360 | (1,831 | ) | 3,499 | |||||||
Provision for income taxes | $ | 54,648 | $ | 23,059 | $ | 29,564 | |||||
Effective tax rate expressed as a percentage of pre-tax earnings | 21.9 | % | 14.9 | % | 15.7 | % | |||||
The tax rate change reflects the impact of legislative changes to statutory rates as well as the impact of acquisitions on our global footprint and the related measurement of deferred taxes.
Undistributed earnings of our foreign subsidiaries were approximately $636.3 million at November 30, 2014. Those earnings are considered to be indefinitely reinvested, and do not include earnings from certain subsidiaries which are considered distributed. Accordingly, no provision for U.S. federal and state income taxes has been provided for those earnings. If we were to repatriate those earnings, in the form of dividends or otherwise, we would be subject to both U.S. income taxes (subject to an adjustment for foreign tax credits) and withholding taxes payable to the various foreign countries. Determination of the amount of unrecognized deferred U.S. income tax liability is not practicable due to the complexity associated with the hypothetical calculation.
60
The significant components of deferred tax assets and liabilities as of November 30, 2014 and 2013 are as follows (in thousands):
2014 | 2013 | ||||||
Deferred tax assets: | |||||||
Accruals and reserves | $ | 21,299 | $ | 22,209 | |||
Deferred revenue | 1,654 | 773 | |||||
Pension and postretirement benefits | 12,708 | 9,254 | |||||
Tax credits | 9,787 | 14,211 | |||||
Deferred stock-based compensation | 52,052 | 49,453 | |||||
Loss carryforwards | 85,706 | 80,152 | |||||
Other | 10,657 | 4,933 | |||||
Gross deferred tax assets | 193,863 | 180,985 | |||||
Valuation allowance | (66,232 | ) | (46,664 | ) | |||
Realizable deferred tax assets | 127,631 | 134,321 | |||||
Deferred tax liabilities: | |||||||
Fixed assets | (18,107 | ) | (7,668 | ) | |||
Intangibles | (375,163 | ) | (417,102 | ) | |||
Gross deferred tax liabilities | (393,270 | ) | (424,770 | ) | |||
Net deferred tax liability | $ | (265,639 | ) | $ | (290,449 | ) | |
As of November 30, 2014, we had loss carryforwards for tax purposes totaling approximately $282.0 million, comprised of $42.5 million of U.S. net operating loss carryforwards and $239.5 million of foreign loss carryforwards, both of which will be available to offset future taxable income. If not used, the U.S. net operating loss carryforwards will begin to expire in 2018 and the foreign tax loss carryforwards generally may be carried forward indefinitely. We have analyzed the foreign net operating losses and placed valuation allowances on those where we have determined the realization is not more likely than not to occur.
As of November 30, 2014, we had approximately $12.0 million of foreign tax credit (FTC) carryforwards that will be available to offset future U.S. tax liabilities. If not used, the FTC carryforwards will expire between 2016 and 2023. We believe that it is more likely than not that we will realize our FTC.
The valuation allowance for deferred tax assets increased by $19.6 million in 2014. The increase is primarily attributable to foreign net operating losses, incurred and acquired, for which there is no objective indication that taxable income of the foreign entity will be generated in the future.
We have provided what we believe to be an appropriate amount of tax for items that involve interpretation of the tax law. However, events may occur in the future that will cause us to reevaluate our current reserves and may result in an adjustment to the reserve for taxes.
61
A summary of the activities associated with our reserve for unrecognized tax benefits, interest, and penalties follows (in thousands):
Unrecognized Tax Benefits | Interest and Penalties | ||||||
Balance at November 30, 2013 | $ | 1,658 | $ | 526 | |||
Additions: | |||||||
Current year tax positions | 206 | — | |||||
Prior year tax positions | 99 | — | |||||
Associated with interest | — | 116 | |||||
Decreases: | |||||||
Lapse of statute of limitations | (187 | ) | (89 | ) | |||
Prior year tax positions | (117 | ) | — | ||||
Balance at November 30, 2014 | $ | 1,659 | $ | 553 | |||
As of November 30, 2014, the total amount of unrecognized tax benefits was $2.2 million, of which $0.6 million related to interest and penalties. We include accrued interest and accrued penalties related to amounts accrued for unrecognized tax benefits in our provision for income taxes. The entire amount of unrecognized benefits at November 30, 2014 may affect the annual effective tax rate if the benefits are eventually recognized.
It is reasonably possible that we will experience a $0.8 million decrease in the reserve for unrecognized tax benefits within the next 12 months. We would experience this decrease in relation to uncertainties associated with the expiration of applicable statutes of limitation.
We and our subsidiaries file federal, state, and local income tax returns in multiple jurisdictions around the world. With few exceptions, we are no longer subject to income tax examinations by tax authorities for years before 2010.
13. | Pensions and Postretirement Benefits |
Defined Benefit Plans
We sponsor a non-contributory, frozen defined-benefit retirement plan (the U.S. RIP) for certain of our U.S. employees. We also have a frozen defined-benefit pension plan (the U.K. RIP) that covers certain employees of a subsidiary based in the United Kingdom. We also have a frozen unfunded Supplemental Income Plan (SIP), which is a non-qualified pension plan, for certain U.S. employees who earn over a federally stipulated amount. Benefits for all three plans are generally based on years of service and either average or cumulative base compensation, depending on the plan. Plan funding strategies are influenced by employee benefit laws and tax laws. The U.K. RIP includes a provision for employee contributions and inflation-based benefit increases for retirees.
In 2012, we contributed approximately $65 million to the U.S. RIP, with approximately $57 million of the contribution used to bring all deficit funding current through November 30, 2011 and pay fees and expenses associated with third-party annuity contracts, with the remaining $8 million used to fund estimated 2012 pension costs. In 2013, we contributed approximately $10 million to the U.S. RIP to fund estimated 2013 pension costs. In 2014, we also contributed $10 million to the U.S. RIP, which we used to fund estimated 2014 pension costs.
In the first quarter of fiscal 2012, we made the decision to close the U.S. RIP to new participants effective January 1, 2012. In place of the U.S. RIP benefits, colleagues hired after January 1, 2012 receive a company non-elective contribution to their 401(k) plan balances if they are an active employee at the end of the year. In the third quarter of 2014, we discontinued all future accruals to the U.S. RIP and SIP, which necessitated a remeasurement of the plan obligations and resulted in a curtailment gain. In lieu of future accruals to the U.S. RIP and SIP, we will now provide an annual company non-elective contribution to the 401(k) accounts of affected eligible employees if they are active employees at the end of the calendar year.
During fiscal 2012, we offered lump-sum buyouts to former colleagues who were not yet receiving benefits. The payout associated with these lump-sum offers was accounted for as a settlement.
62
We expect to contribute approximately $3 million to our pension and postretirement benefit plans in 2015.
The following table provides the expected benefit payments for our pension plans (in thousands):
Total | ||||
2015 | $ | 10,682 | ||
2016 | $ | 11,709 | ||
2017 | $ | 11,733 | ||
2018 | $ | 11,250 | ||
2019 | $ | 11,580 | ||
2020-2024 | $ | 55,188 | ||
Our net periodic pension expense for the pension plans was comprised of the following (in thousands):
Year Ended November 30, | |||||||||||
2014 | 2013 | 2012 | |||||||||
Service costs incurred | $ | 8,356 | $ | 10,420 | $ | 10,494 | |||||
Interest costs on projected benefit obligation | 8,442 | 7,017 | 9,044 | ||||||||
Expected return on plan assets | (8,354 | ) | (7,550 | ) | (10,719 | ) | |||||
Amortization of prior service credit | (791 | ) | (1,350 | ) | (1,350 | ) | |||||
Amortization of transitional obligation | 40 | 40 | 40 | ||||||||
Settlements | — | — | 4,930 | ||||||||
Curtailment gain | (2,806 | ) | — | — | |||||||
Fourth quarter expense recognition of actuarial loss in excess of corridor | 1,020 | 2,620 | 11,189 | ||||||||
Net periodic pension expense | $ | 5,907 | $ | 11,197 | $ | 23,628 | |||||
63
The changes in the projected benefit obligation, plan assets and the funded status of the pension plans were as follows (in thousands):
2014 | 2013 | ||||||
Change in projected benefit obligation: | |||||||
Net benefit obligation, beginning of year | $ | 184,117 | $ | 180,736 | |||
Service costs incurred | 8,356 | 10,420 | |||||
Interest costs on projected benefit obligation | 8,442 | 7,017 | |||||
Actuarial loss (gain) | 21,462 | (2,382 | ) | ||||
Gross benefits paid | (9,133 | ) | (12,849 | ) | |||
Plan amendment | 495 | — | |||||
Curtailment gain | (2,842 | ) | — | ||||
Foreign currency exchange rate change | (2,347 | ) | 1,175 | ||||
Net benefit obligation, end of year | $ | 208,550 | $ | 184,117 | |||
Change in plan assets: | |||||||
Fair value of plan assets, beginning of year | $ | 165,741 | $ | 161,134 | |||
Actual return on plan assets | 22,293 | 4,066 | |||||
Employer contributions | 12,484 | 12,280 | |||||
Gross benefits paid | (9,133 | ) | (12,849 | ) | |||
Foreign currency exchange rate change | (2,329 | ) | 1,110 | ||||
Fair value of plan assets, end of year | $ | 189,056 | $ | 165,741 | |||
Funded status (underfunded) | $ | (19,494 | ) | $ | (18,376 | ) | |
Amounts in Accumulated Other Comprehensive Income not yet recognized as components of net periodic pension and postretirement expense, pretax | |||||||
Net prior service benefit | $ | — | $ | (4,173 | ) | ||
Net actuarial loss | 20,160 | 16,704 | |||||
Net transitional obligation | — | 119 | |||||
Total not yet recognized | $ | 20,160 | $ | 12,650 | |||
The net underfunded status of the plans is recorded in accrued pension liability in the consolidated balance sheets. Any future reclassification of actuarial loss from AOCI to income would only be recognized if the cumulative actuarial loss exceeds the corridor, and the reclassification would be recognized as a fourth quarter mark-to-market adjustment.
Pension expense is actuarially calculated annually based on data available at the beginning of each year. We determine the expected return on plan assets by multiplying the expected long-term rate of return on assets by the market-related value of plan assets. The market-related value of plan assets is the fair value of plan assets. Assumptions used in the actuarial calculation include the discount rate selected and disclosed at the end of the previous year as well as the expected rate of return on assets detailed in the table below, as of the years ended November 30, 2014 and 2013:
U.S. RIP | U.K. RIP | ||||||||||
2014 | 2013 | 2014 | 2013 | ||||||||
Weighted-average assumptions as of year-end | |||||||||||
Discount rate | 4.20 | % | 4.90 | % | 3.80 | % | 4.40 | % | |||
Expected long-term rate of return on assets | 4.70 | % | 5.40 | % | 4.90 | % | 5.00 | % | |||
For 2014, as a result of the U.S. RIP plan freeze and associated remeasurement, we used a weighted-average 5.2 percent expected long-term rate of return on plan assets and a weighted-average 4.7 percent discount rate for the U.S. RIP.
Fair Value of Pension Assets
64
As of November 30, 2014, the U.S. RIP plan assets consist primarily of fixed-income securities, with a moderate amount of equity securities. We employed a similar investment strategy as of November 30, 2013. The U.K. RIP plan assets consist primarily of equity securities, with smaller holdings of bonds and other assets. Equity assets are diversified between international and domestic investments, with additional diversification in the domestic category through allocations to large-cap, mid-cap, and growth and value investments.
The U.S. RIP’s established investment policy seeks to align the expected rate of return with the discount rate, while allowing for some equity variability to allow for upside market potential that would strengthen the overall asset position of the plan. The U.K. RIP’s established investment policy is to match the liabilities for active and deferred members with equity investments and match the liabilities for pensioner members with fixed-income investments. Asset allocations are subject to ongoing analysis and possible modification as basic capital market conditions change over time (interest rates, inflation, etc.).
The following table compares target asset allocation percentages with actual asset allocations at the end of 2014:
U.S. RIP Assets | U.K. RIP Assets | ||||||||||
Target Allocations | Actual Allocations | Target Allocations | Actual Allocations | ||||||||
Fixed Income | 75 | % | 76 | % | 45 | % | 43 | % | |||
Equities | 25 | % | 24 | % | 55 | % | 50 | % | |||
Alternatives/Other | — | % | — | % | — | % | 7 | % | |||
Investment return assumptions for both plans have been determined by obtaining independent estimates of expected long-term rates of return by asset class and applying the returns to assets on a weighted-average basis.
All of our pension plan assets are measured at fair value on a recurring basis by reference to similar assets in active markets and are therefore classified within Level 2 of the fair value hierarchy. Plan assets as of November 30, 2014 and 2013 were classified in the following categories (in thousands):
2014 | 2013 | |||||||
Interest-bearing cash | $ | 3,940 | $ | 6,540 | ||||
Collective trust funds: | ||||||||
Fixed income funds | 127,063 | 106,007 | ||||||
Equity funds | 58,053 | 53,194 | ||||||
$ | 189,056 | $ | 165,741 | |||||
Postretirement Benefits
We sponsor a contributory postretirement medical plan. The plan grants access to group rates for retiree-medical coverage for all U.S. employees who terminate between ages 55 and 64 with at least 10 years of IHS service. Additionally, we subsidize the cost of coverage for retiree-medical coverage for certain grandfathered employees. Our subsidy is capped at different rates per month depending on individual retirees’ Medicare eligibility.
The obligation under our plan was determined by the application of the terms of medical and life insurance plans together with relevant actuarial assumptions. Effective 2006, we do not provide prescription drug coverage for Medicare-eligible retirees except through a Medicare Advantage fully insured option; therefore our liability does not reflect any impact of the Medicare Modernization Act Part D subsidy. The discount rate used in determining the accumulated postretirement benefit obligation was 4.20 percent and 4.90 percent at November 30, 2014, and 2013, respectively.
Our net periodic postretirement expense (income) and changes in the related projected benefit obligation were as follows (in thousands):
65
Year Ended November 30, | |||||||||||
2014 | 2013 | 2012 | |||||||||
Service costs incurred | $ | 16 | $ | 23 | $ | 21 | |||||
Interest costs | 412 | 399 | 466 | ||||||||
Fourth quarter expense recognition of actuarial loss in excess of corridor | 439 | — | 802 | ||||||||
Net periodic postretirement expense | $ | 867 | $ | 422 | $ | 1,289 | |||||
November 30, 2014 | November 30, 2013 | ||||||
Change in projected postretirement benefit obligation: | |||||||
Postretirement benefit obligation at beginning of year | $ | 8,815 | $ | 10,425 | |||
Service costs | 16 | 23 | |||||
Interest costs | 412 | 399 | |||||
Actuarial (gain) loss | 1,407 | (1,047 | ) | ||||
Benefits paid | (1,005 | ) | (985 | ) | |||
Postretirement benefit obligation at end of year | $ | 9,645 | $ | 8,815 | |||
Unfunded status | $ | (9,645 | ) | $ | (8,815 | ) | |
Amounts in Accumulated Other Comprehensive Income not yet recognized as components of net periodic pension and postretirement expense, pretax | |||||||
Net actuarial loss | $ | 964 | $ | (4 | ) | ||
The net unfunded status of the postretirement benefit plan is recorded in accrued pension liability in the consolidated balance sheets. Any future reclassifications of actuarial loss from AOCI to income would only be recognized if the cumulative actuarial loss exceeds the corridor and would be recognized as a fourth quarter mark-to-market adjustment.
The following table provides the expected benefit payments for the plan (in thousands):
Year | Amount (in thousands) | |||
2015 | $ | 772 | ||
2016 | $ | 769 | ||
2017 | $ | 766 | ||
2018 | $ | 760 | ||
2019 | $ | 727 | ||
2020-2024 | $ | 3,288 | ||
A one-percentage-point change in assumed health-care-cost-trend rates would have no effect on service cost, interest cost, or the postretirement benefit obligation as of November 30, 2014 because our subsidy is capped.
Defined Contribution Plan
Employees of certain subsidiaries may participate in defined contribution plans. Benefit expense relating to these plans was approximately $13.7 million, $11.9 million, and $10.6 million for the years ended November 30, 2014, 2013, and 2012, respectively.
14. | Stock-based Compensation |
As of November 30, 2014, we had one stock-based compensation plan: the Amended and Restated IHS Inc. 2004 Long-Term Incentive Plan (LTIP). The LTIP provides for the grant of non-qualified stock options, incentive stock options, stock appreciation rights, restricted stock, restricted stock units, performance units and performance shares, cash-based awards, other stock based awards and covered employee annual incentive awards. Upon vesting of an award, we may either issue new shares or reissue treasury shares, but only to the extent that the reissued shares were previously withheld for taxes under the LTIP provisions. The 2004 Directors Stock Plan, a sub-plan under our LTIP, provides for the grant of restricted stock and restricted
66
stock units to non-employee directors as defined in that plan. We believe that such awards better align the interests of our employees and non-employee directors with those of our stockholders. We have an authorized maximum of 14.75 million shares for issuance under the LTIP. As of November 30, 2014, the number of shares available for future grant was 2.2 million.
Total unrecognized compensation expense related to all nonvested awards was $127.0 million as of November 30, 2014, with a weighted-average recognition period of approximately 1.4 years.
Restricted Stock Units (RSUs). RSUs typically vest from one to three years, and are generally subject to either cliff vesting (performance-based RSUs) or graded vesting (time-based RSUs). RSUs do not have nonforfeitable rights to dividends or dividend equivalents. The fair value of RSUs is based on the fair value of our common stock on the date of grant. We amortize the value of these awards to expense over the vesting period on a straight-line basis. For performance-based RSUs, an evaluation is made each quarter about the likelihood that the performance criteria will be met. As the number of performance-based RSUs expected to vest increases or decreases, compensation expense is also adjusted up or down to reflect the number expected to vest and the cumulative vesting period met to date. For all RSUs, we estimate forfeitures at the grant date and recognize compensation cost based on the number of awards expected to vest. There may be adjustments in future periods if the likelihood of meeting performance criteria changes or if actual forfeitures differ from our estimates. Our forfeiture rate is based upon historical experience as well as anticipated employee turnover considering certain qualitative factors.
The following table summarizes RSU activity for the year ended November 30, 2014:
Shares | Weighted- Average Grant Date Fair Value | |||||
(in thousands) | ||||||
Balance at November 30, 2013 | 3,017 | $ | 92.93 | |||
Granted | 1,210 | $ | 115.39 | |||
Vested | (1,517 | ) | $ | 93.99 | ||
Forfeited | (192 | ) | $ | 104.11 | ||
Balance at November 30, 2014 | 2,518 | $ | 102.24 | |||
The total fair value of RSUs that vested during the year ended November 30, 2014 was $181.4 million.
Stock Options. Option awards are generally granted with an exercise price equal to the fair market value of our stock at the date of grant. No stock options were outstanding as of November 30, 2014.
Stock-based compensation expense for the years ended November 30, 2014, 2013, and 2012, respectively, was as follows (in thousands):
2014 | 2013 | 2012 | ||||||||||
Cost of revenue | $ | 8,520 | $ | 8,271 | $ | 6,206 | ||||||
Selling, general and administrative | 158,839 | 154,180 | 115,337 | |||||||||
Total stock-based compensation expense | $ | 167,359 | $ | 162,451 | $ | 121,543 | ||||||
Total income tax benefits recognized for stock-based compensation arrangements were as follows (in thousands):
2014 | 2013 | 2012 | ||||||||||
Income tax benefits | $ | 49,903 | $ | 53,614 | $ | 42,959 | ||||||
No stock-based compensation cost was capitalized during the years ended November 30, 2014, 2013, or 2012.
15. | Commitments and Contingencies |
Commitments
Rental charges in 2014, 2013, and 2012 approximated $58.9 million, $46.3 million and $43.4 million, respectively. Minimum rental commitments under non-cancelable operating leases in effect at November 30, 2014, are as follows:
67
Year | Amount (in thousands) | |||
2015 | $ | 56,159 | ||
2016 | 51,890 | |||
2017 | 48,937 | |||
2018 | 37,804 | |||
2019 | 24,811 | |||
Thereafter | 53,449 | |||
$ | 273,050 | |||
We also had outstanding letters of credit and bank guarantees in the aggregate amount of approximately $5.6 million and $5.2 million at November 30, 2014 and 2013, respectively.
Indemnifications
In the normal course of business, we are party to a variety of agreements under which we may be obligated to indemnify the other party for certain matters. These obligations typically arise in contracts where we customarily agree to hold the other party harmless against losses arising from a breach of representations or covenants for certain matters such as title to assets and intellectual property rights associated with the sale of products. We also have indemnification obligations to our officers and directors. The duration of these indemnifications varies, and in certain cases, is indefinite. In each of these circumstances, payment by us depends upon the other party making an adverse claim according to the procedures outlined in the particular agreement, which procedures generally allow us to challenge the other party’s claims. In certain instances, we may have recourse against third parties for payments that we make.
We are unable to reasonably estimate the maximum potential amount of future payments under these or similar agreements due to the unique facts and circumstances of each agreement and the fact that certain indemnifications provide for no limitation to the maximum potential future payments under the indemnification. We have not recorded any liability for these indemnifications in the accompanying consolidated balance sheets; however, we accrue losses for any known contingent liability, including those that may arise from indemnification provisions, when the obligation is both probable and reasonably estimable.
Litigation
From time to time, we are involved in litigation in the ordinary course of our business, including claims or contingencies that may arise related to matters occurring prior to our acquisition of businesses, such as the matter described below. At the present time, primarily because the matters are generally in early stages, we can give no assurance as to the outcome of any pending litigation to which we are currently a party and we are unable to determine the ultimate resolution of or provide a reasonable estimate of the range of possible loss attributable to these matters or the effect they may have on us. However, we do not expect the outcome of such proceedings to have a material adverse effect on our results of operations or financial condition. We have and will continue to vigorously defend ourselves against these claims.
On April 23, 2013 (prior to our acquisition of R.L. Polk & Co.) our CARFAX subsidiary (“CARFAX”) was served with a complaint filed in the U.S. District Court for the Southern District of New York, purportedly on behalf of certain auto and light truck dealers. The complaint alleges, among other things that, in violation of antitrust laws, CARFAX entered into exclusive arrangements regarding the sale of CARFAX vehicle history reports with certain auto manufacturers and owners of two websites providing classified listings of used autos and light trucks. The complaint seeks three times the actual damages that a jury finds the plaintiffs have sustained, injunctive relief, costs and attorneys’ fees. On October 25, 2013, the plaintiffs served a second amended complaint with similar allegations purporting to name approximately 469 auto dealers as plaintiffs. The proceedings are in an early stage and there are significant legal and factual issues to be determined. We believe, however, that the probability that the outcome of the litigation will have a material adverse effect on our results of operations or financial condition is remote.
16. | Common Stock and Earnings per Share |
Weighted average shares of Class A common stock outstanding for the years ended November 30, 2014, 2013, and 2012, respectively, were calculated as follows (in thousands):
68
2014 | 2013 | 2012 | |||||||
Weighted-average shares outstanding: | |||||||||
Shares used in basic EPS calculation | 68,163 | 66,434 | 65,840 | ||||||
Effect of dilutive securities: | |||||||||
Restricted stock units | 957 | 1,006 | 866 | ||||||
Stock options and other stock-based awards | — | 2 | 29 | ||||||
Shares used in diluted EPS calculation | 69,120 | 67,442 | 66,735 | ||||||
Share Buyback Programs
During 2006, our board of directors approved a program to reduce the dilutive effects of employee equity grants, by allowing employees to surrender shares back to the Company for a value equal to their minimum statutory tax liability. We then pay the statutory tax on behalf of the employee. For the year ended November 30, 2014, we accepted 527,497 shares surrendered by employees under the tax withholding program for approximately $62.9 million, or $119.33 per share.
In March 2011, our board of directors authorized the repurchase of up to one million common shares per fiscal year in the open market (the March 2011 Program). We may execute on this program at our discretion, balancing dilution offset with other investment opportunities of the business, including acquisitions. The March 2011 Program does not have an expiration date. No shares were repurchased under this plan during 2012, 2013, or 2014.
In October 2012, our board of directors authorized the repurchase of shares of Class A common stock with a maximum aggregate value of $100 million (the October 2012 Program). We may repurchase shares of Class A common stock in open market purchases or through privately negotiated transactions in compliance with Exchange Act Rule 10b-18, subject to market conditions, applicable legal requirements, and other relevant factors. The October 2012 Program does not obligate us to repurchase any dollar amount or number of shares of Class A common stock, and it may be suspended at any time at our discretion. For the year ended November 30, 2013, we repurchased 467,500 shares for approximately $46.2 million, or $98.80 per share. For the year ended November 30, 2012, we repurchased 563,221 shares for approximately $49.8 million, or $88.40 per share.
17. | Accumulated Other Comprehensive Income (Loss) |
Accumulated other comprehensive income (AOCI) consists of foreign currency translation adjustments, net pension and postretirement liability adjustments, and net gain (loss) on hedging activities. Each item is reported net of the related income tax effect. The following table summarizes the changes in AOCI by component (net of tax) for the year ended November 30, 2014 (in thousands):
Foreign currency translation | Net pension and OPEB liability | Unrealized losses on hedging activities | Total | |||||||||||||
Balance at November 30, 2011 | $ | (41,611 | ) | $ | (5,673 | ) | $ | (1,918 | ) | $ | (49,202 | ) | ||||
Other comprehensive income (loss) before reclassifications | 6,237 | (13,946 | ) | (1,123 | ) | (8,832 | ) | |||||||||
Reclassifications from AOCI to income | — | 10,525 | 816 | 11,341 | ||||||||||||
Balance at November 30, 2012 | $ | (35,374 | ) | $ | (9,094 | ) | $ | (2,225 | ) | $ | (46,693 | ) | ||||
Other comprehensive income (loss) before reclassifications | (11,191 | ) | 85 | (950 | ) | (12,056 | ) | |||||||||
Reclassifications from AOCI to income | — | 812 | 976 | 1,788 | ||||||||||||
Balance at November 30, 2013 | $ | (46,565 | ) | $ | (8,197 | ) | $ | (2,199 | ) | $ | (56,961 | ) | ||||
Other comprehensive loss before reclassifications | (37,069 | ) | (4,144 | ) | (8,343 | ) | (49,556 | ) | ||||||||
Reclassifications from AOCI to income | — | (1,268 | ) | 1,060 | (208 | ) | ||||||||||
Balance at November 30, 2014 | $ | (83,634 | ) | $ | (13,609 | ) | $ | (9,482 | ) | $ | (106,725 | ) | ||||
Amounts reclassified from AOCI to income related to net pension and OPEB liability are recorded in net periodic pension and postretirement expense.
69
18. | Supplemental Cash Flow Information |
Net cash provided by operating activities reflects cash payments for interest and income taxes as shown below, for the years ended November 30, 2014, 2013, and 2012, respectively (in thousands):
2014 | 2013 | 2012 | ||||||||||
Interest paid | $ | 45,396 | $ | 39,023 | $ | 19,315 | ||||||
Income tax payments (refunds), net | $ | 52,030 | $ | (9,458 | ) | $ | 24,279 | |||||
Interest paid during 2013 and 2014 increased primarily due to increased borrowings associated with the Polk acquisition, including the amortization of bridge financing fees in 2013.
Cash and cash equivalents amounting to approximately $153.2 million and $258.4 million reflected on the consolidated balance sheets at November 30, 2014 and 2013, respectively, are maintained primarily in U.S. Dollars, Canadian Dollars, British Pounds, and Euros, and were subject to fluctuations in the currency exchange rate.
19. | Segment Information |
We prepare our financial reports and analyze our business results within our three reportable geographic segments: Americas, EMEA, and APAC. We evaluate segment performance primarily at the revenue and operating profit level for each of these three segments. We also evaluate revenues by transaction type and product category.
Information about the operations of our three segments is set forth below. Our Chief Executive Officer and our Chief Financial Officer constitute the role of the chief operating decision maker, and they evaluate segment performance based primarily on revenue and operating profit of these three segments. In addition, they review revenue by transaction type and product category. The accounting policies of our segments are the same as those described in the summary of significant accounting policies (see Note 2).
No single customer accounted for 10 percent or more of our total revenue for the years ended November 30, 2014, 2013, and 2012. There are no material inter-segment revenues for any period presented. Certain corporate transactions are not allocated to the reportable segments, including such items as stock-based compensation expense, net periodic pension and postretirement expense, corporate-level impairments, and gain (loss) on sale of corporate assets.
Americas | EMEA | APAC | Shared Services | Consolidated Total | |||||||||||||||
(In thousands) | |||||||||||||||||||
Year Ended November 30, 2014 | |||||||||||||||||||
Revenue | $ | 1,470,282 | $ | 549,061 | $ | 211,451 | $ | — | $ | 2,230,794 | |||||||||
Operating income | $ | 356,310 | $ | 129,766 | $ | 48,792 | $ | (231,276 | ) | $ | 303,592 | ||||||||
Depreciation and amortization | $ | 167,351 | $ | 22,730 | $ | 4,798 | $ | 7,266 | $ | 202,145 | |||||||||
Total Assets | $ | 4,103,862 | $ | 886,000 | $ | 219,053 | $ | 139,515 | $ | 5,348,430 | |||||||||
Year Ended November 30, 2013 | |||||||||||||||||||
Revenue | $ | 1,162,582 | $ | 483,373 | $ | 194,676 | $ | — | $ | 1,840,631 | |||||||||
Operating income | $ | 303,803 | $ | 81,048 | $ | 42,089 | $ | (228,736 | ) | $ | 198,204 | ||||||||
Depreciation and amortization | $ | 123,477 | $ | 25,688 | $ | 2,363 | $ | 7,209 | $ | 158,737 | |||||||||
Total Assets | $ | 4,215,949 | $ | 874,602 | $ | 158,963 | $ | 110,099 | $ | 5,359,613 | |||||||||
Year Ended November 30, 2012 | |||||||||||||||||||
Revenue | $ | 912,490 | $ | 443,385 | $ | 173,994 | $ | — | $ | 1,529,869 | |||||||||
Operating income | $ | 262,953 | $ | 95,144 | $ | 46,042 | $ | (196,852 | ) | $ | 207,287 | ||||||||
Depreciation and amortization | $ | 88,456 | $ | 22,188 | $ | 1,065 | $ | 6,534 | $ | 118,243 | |||||||||
Total Assets | $ | 2,437,903 | $ | 881,499 | $ | 114,426 | $ | 115,383 | $ | 3,549,211 | |||||||||
70
The table below provides information about revenue and long-lived assets for the U.S. and individual material foreign countries for 2014, 2013, and 2012. Revenue by geographic area is generally based on the "ship to" location. Long-lived assets include net property and equipment, net intangible assets, and net goodwill.
2014 | 2013 | 2012 | |||||||||||||||||||||
(in thousands) | Revenue | Long-lived assets | Revenue | Long-lived assets | Revenue | Long-lived assets | |||||||||||||||||
United States | $ | 1,290,570 | $ | 3,481,629 | $ | 992,640 | $ | 3,413,351 | $ | 775,630 | $ | 1,849,244 | |||||||||||
United Kingdom | 254,743 | 633,042 | 243,608 | 555,732 | 231,671 | 434,192 | |||||||||||||||||
Rest of world | 685,481 | 435,181 | 604,383 | 486,128 | 522,568 | 393,352 | |||||||||||||||||
Total | $ | 2,230,794 | $ | 4,549,852 | $ | 1,840,631 | $ | 4,455,211 | $ | 1,529,869 | $ | 2,676,788 | |||||||||||
Revenue by transaction type was as follows:
(in thousands) | 2014 | 2013 | 2012 | |||||||||
Subscription revenue | $ | 1,719,617 | $ | 1,404,984 | $ | 1,157,347 | ||||||
Non-subscription revenue | 511,177 | 435,647 | 372,522 | |||||||||
Total revenue | $ | 2,230,794 | $ | 1,840,631 | $ | 1,529,869 | ||||||
Revenue by product category was as follows:
(in thousands) | 2014 | 2013 | 2012 | |||||||||
Resources | $ | 927,211 | $ | 865,125 | 775,331 | |||||||
Industrials | 736,394 | 427,623 | 259,063 | |||||||||
Horizontal products | 567,189 | 547,883 | 495,475 | |||||||||
Total revenue | $ | 2,230,794 | $ | 1,840,631 | $ | 1,529,869 | ||||||
Activity in our goodwill account was as follows:
(in thousands) | Americas | EMEA | APAC | Consolidated Total | |||||||||||
Balance at November 30, 2012 | $ | 1,450,061 | $ | 417,411 | $ | 91,751 | $ | 1,959,223 | |||||||
Acquisitions | 1,035,692 | 69,982 | — | 1,105,674 | |||||||||||
Adjustments to purchase price | (511 | ) | — | — | (511 | ) | |||||||||
Foreign currency translation | (7,756 | ) | 7,602 | 949 | 795 | ||||||||||
Balance at November 30, 2013 | 2,477,486 | 494,995 | 92,700 | 3,065,181 | |||||||||||
Acquisitions | 35,990 | 78,136 | 16,141 | 130,267 | |||||||||||
Adjustments to purchase price | 2,712 | (8,203 | ) | — | (5,491 | ) | |||||||||
Foreign currency translation | (14,988 | ) | (16,962 | ) | (683 | ) | (32,633 | ) | |||||||
Balance at November 30, 2014 | $ | 2,501,200 | $ | 547,966 | $ | 108,158 | $ | 3,157,324 | |||||||
The adjustments to purchase price in 2013 and 2014 related primarily to deferred tax true-ups that we finalized for our 2012 and 2013 acquisitions, respectively.
71
20. | Quarterly Results of Operations (Unaudited) |
The following table summarizes certain quarterly results of operations (in thousands):
Three Months Ended | |||||||||||||||
February 28 | May 31 | August 31 | November 30 | ||||||||||||
2014 | |||||||||||||||
Revenue | $ | 524,458 | $ | 568,008 | $ | 556,011 | $ | 582,317 | |||||||
Cost of revenue | $ | 212,925 | $ | 224,945 | $ | 219,208 | $ | 221,973 | |||||||
Net income | $ | 32,422 | $ | 55,492 | $ | 46,517 | $ | 60,118 | |||||||
Earnings per share: | |||||||||||||||
Basic | $ | 0.48 | $ | 0.81 | $ | 0.68 | $ | 0.88 | |||||||
Diluted | $ | 0.47 | $ | 0.81 | $ | 0.68 | $ | 0.87 | |||||||
2013 | |||||||||||||||
Revenue | $ | 382,525 | $ | 418,143 | $ | 480,288 | $ | 559,675 | |||||||
Cost of revenue | $ | 160,075 | $ | 172,424 | $ | 198,279 | $ | 217,406 | |||||||
Net income | $ | 24,671 | $ | 42,890 | $ | 23,362 | $ | 40,810 | |||||||
Earnings per share: | |||||||||||||||
Basic | $ | 0.37 | $ | 0.65 | $ | 0.35 | $ | 0.61 | |||||||
Diluted | $ | 0.37 | $ | 0.65 | $ | 0.35 | $ | 0.60 | |||||||
Item 9. | Changes in and Disagreements with Accountants on Accounting and Financial Disclosure |
Not applicable.
Item 9A. Controls and Procedures
Disclosure Controls and Procedures
Under the supervision and with the participation of our management, including the Chief Executive Officer and Chief Financial Officer, we have evaluated the effectiveness of our disclosure controls and procedures pursuant to Rules 13a-15(e) and 15d-15(e) under the Securities Exchange Act of 1934, as amended (the “Exchange Act”), as of the end of the period covered by this Form 10-K. Based on that evaluation, the Chief Executive Officer and Chief Financial Officer concluded that our disclosure controls and procedures as defined in Rules 13a-15(e) and 15d-15(e) under the Exchange Act are effective to ensure that information required to be disclosed in the reports required to be filed or submitted under the Exchange Act is (i) recorded, processed, summarized, and reported within the time periods specified in the Securities and Exchange Commission’s rules and forms, and (ii) accumulated and communicated to our management, including our Chief Executive Officer and Chief Financial Officer, to allow timely decisions regarding required disclosure.
Internal Control over Financial Reporting
Our Chief Executive Officer and our Chief Financial Officer are responsible for establishing and maintaining adequate internal control over financial reporting, as such term is defined in Exchange Act rule 13a-15(f). A company’s internal control over financial reporting is a process designed by, or under the supervision of, the company’s principal executive and principal financial officers, or persons performing similar functions, and effected by the company’s board of directors, management, and other personnel, to provide reasonable assurance regarding the reliability of financial reporting and the preparation of financial statements for external purposes in accordance with generally accepted accounting principles and includes those policies and procedures that (i) pertain to the maintenance of records that, in reasonable detail, accurately and fairly reflect the transactions and dispositions of the assets of the company; (ii) provide reasonable assurance that transactions are recorded as necessary to permit the preparation of financial statements in accordance with GAAP, and that receipts and expenditures of the company are being made only in accordance with authorizations of management and directors of the company; and (iii) provide reasonable assurance regarding prevention or timely detection of unauthorized acquisition, use, or disposition of the company’s assets that
72
could have a material effect on the financial statements. Because of its inherent limitations, internal control over financial reporting may not prevent or detect misstatements. Also, projections of any evaluation of effectiveness to future periods are subject to the risk that controls may become inadequate because of changes in conditions, or that the degree of compliance with the policies or procedures may deteriorate.
Management is required to base its assessment of the effectiveness of our internal control over financial reporting on a suitable, recognized control framework, such as the framework developed by the Committee of Sponsoring Organizations of the Treadway Commission (the “COSO framework”). Our principal executive officer and our principal financial officer have chosen the COSO framework on which to base their assessment. Based on this evaluation, our management concluded that our internal control over financial reporting was effective as of November 30, 2014.
Our independent registered public accounting firm has audited, and reported on, the effectiveness of our internal control over financial reporting. Management’s report and the independent registered public accounting firm’s report are included under the captions entitled “Management’s Report on Internal Control Over Financial Reporting” and “Report of Independent Registered Public Accounting Firm on Internal Control Over Financial Reporting,” respectively, in Item 8 of this Form 10-K and are incorporated herein by reference.
Changes in Internal Control over Financial Reporting
There were no changes in our internal control over financial reporting that occurred during the quarter ended November 30, 2014, that have materially affected, or are reasonably likely to materially affect, our internal control over financial reporting.
Item 9B. Other Information
Iran Threat Reduction and Syria Human Rights Act Disclosure
Under the Iran Threat Reduction and Syrian Human Rights Act of 2012, which added Section 13(r) of the Exchange Act, we are required to include certain disclosures in our periodic reports if we or any of our affiliates knowingly engaged in certain specified activities during the period covered by the report. Disclosure is generally required even if the transactions or dealings were conducted in compliance with applicable law and regulations. During the third quarter of 2014, we acquired Global Trade Information Services, a Virginia corporation (“GTIS”). GTIS publishes the Global Trade Atlas (the “GTA”), an online trade data system offering global merchandise trade statistics such as import and export data from official sources in more than 65 countries. Included in the GTA is certain trade data sourced from Iran for which GTIS pays an annual fee of approximately $30,000. The procurement of this information is exempt from applicable economic sanctions laws and regulations as a funds transfer related to the exportation or importation of information and informational materials. Sales attributable to this Iranian trade data represented approximately $75,000 in gross revenue for GTIS in the fourth quarter of 2014 and would have represented approximately 0.01% of our company’s fourth quarter 2014 consolidated revenues and gross profits. Subject to any changes in the exempt status of such activities, we intend to continue these business activities as permissible under applicable export control and economic sanctions laws and regulations.
PART III
Item 10. Directors, Executive Officers and Corporate Governance
Information required by this Item 10 will be set forth in the Proxy Statement for our 2015 Annual Meeting of Stockholders (the "Proxy Statement") and is incorporated herein by reference.
Item 11. Executive Compensation
Information required by this Item 11 will be set forth in the Proxy Statement and is incorporated herein by reference.
Item 12. Security Ownership of Certain Beneficial Owners and Management and Related Stockholder Matters
Information required by this Item 12 will be set forth in the Proxy Statement and is incorporated herein by reference.
Item 13. Certain Relationships and Related Transactions, and Director Independence
Information required by this Item 13 will be set forth in the Proxy Statement and is incorporated herein by reference.
73
Item 14. Principal Accountant Fees and Services
Information required by this Item 14 will be set forth in the Proxy Statement and is incorporated herein by reference.
PART IV
Item 15. | Exhibits, Financial Statement Schedules |
(a) | Index of Financial Statements |
The Financial Statements listed in the Index to Consolidated Financial Statements are filed as part of this report on Form 10-K (see Part II, Item 8 – Financial Statements and Supplementary Data).
(b) | Index of Exhibits |
The following exhibits are filed as part of this report:
Exhibit Number | Description | |
2.1 | Stock Purchase Agreement by and among IHS Inc., R. L. Polk & Co. and the individuals and entities identified as Sellers on the signature pages thereto, dated as of June 8, 2013 (15) | |
3.1 | Amended and Restated Certificate of Incorporation (13) | |
3.2 | Certificate of Amendment of Amended and Restated Certificate of Incorporation (3) | |
3.3 | Amended and Restated Bylaws (1) | |
4.1 | Form of Class A Common Stock Certificate (4) | |
4.2 | Form of Rights Agreement between IHS Inc. and Computershare Trust Company, Inc., as Rights Agent (4) | |
4.3 | Agreement of Substitution and Amendment of Rights Agreement by and between IHS Inc. and American Stock Transfer and Trust Company, LLC, as Rights Agent, dated as of January 20, 2009 (5) | |
4.4 | Indenture, dated as of October 28, 2014, among the Company, the Guarantors and Wells Fargo Bank, National Association as trustee (20) | |
10.1*+ | Amended and Restated IHS Inc. 2004 Long-Term Incentive Plan | |
10.2+ | Amended and Restated IHS Inc. 2004 Directors Stock Plan (18) | |
10.3+ | IHS Inc. Employee Stock Purchase Plan (4) | |
10.4+ | IHS Inc. Supplemental Income Plan (4) | |
10.5+ | Summary of Non-Employee Director Compensation (18) | |
10.6+ | Form of Indemnification Agreement between the Company and its Directors (4) | |
10.7+ | IHS Inc. 2004 Long-Term Incentive Plan, Form of 2007 Stock Option Award—Senior Executive Level (6) | |
10.8+ | IHS Inc. 2004 Long-Term Incentive Plan, Form of 2007 Stock Option Award—Executive Level (6) | |
10.9+ | IHS Inc. 2004 Long-Term Incentive Plan, Form of 2007 Restricted Stock Unit Award—Time-Based (6) | |
10.10+ | IHS Inc. 2004 Long-Term Incentive Plan, Form of 2007 Restricted Stock Unit Award—Performance-Based(6) | |
74
10.11+ | IHS Inc. 2004 Long-Term Incentive Plan, Form of 2010 Restricted Stock Unit Award—Performance-Based (9) | |
10.12+ | IHS Inc. 2004 Long-Term Incentive Plan, Form of 2011 Restricted Stock Unit Award—Performance-Based (3) | |
10.13*+ | IHS Inc. Hedging and Pledging Policy | |
10.14*+ | IHS Inc. Policy on Recoupment of Incentive Compensation | |
10.15*+ | IHS Inc. Deferred Compensation Plan | |
10.16*+ | IHS Inc. Deferred Compensation Plan Adoption Agreement | |
10.17+ | Employment Agreement by and between IHS Inc. and Scott Key, dated as of October 31, 2007 (7) | |
10.18+ | Amendment to Employment Agreement by and between IHS Inc. and Scott Key, dated as of October 22, 2009 (7) | |
10.19+ | Amendment to Employment Agreement by and between IHS Inc. and Scott Key, dated as of December 3, 2010 (8) | |
10.20+ | Amendment to Employment Agreement by and between IHS Inc. and Scott Key, dated as of December 31, 2012 (14) | |
10.21+ | Employment Agreement by and between IHS Inc. and Todd Hyatt, dated as of October 31, 2013 (21) | |
10.22+ | Employment Agreement by and between IHS Global Inc. and Daniel H. Yergin, dated as of July 2, 2010 (3) | |
10.23+ | Amendment to Employment Agreement by and between IHS Inc. and Daniel Yergin, dated as of December 3, 2010 (19) | |
10.24+ | Amendment to Employment Agreement by and between IHS Inc. and Daniel Yergin, dated as of December 28, 2012 (14) | |
10.25+ | Employment Agreement by and between IHS Inc. and Anurag Gupta, dated as of February 1, 2013 (21) | |
10.26+ | Amendment to Employment Agreement by and between IHS Inc. and Anurag Gupta, dated June 1, 2014 (18) | |
10.27+ | Employment Agreement by and between IHS Inc. and Sean Menke, dated as of February 4, 2013 (21) | |
10.28+ | Amendment to Employment Agreement by and between IHS Inc. and Sean Menke, dated June 1, 2014 (18) | |
10.29+ | Employment Agreement by and between IHS Inc. and Richard Walker, dated as of October 31, 2007 (2) | |
10.30+ | Amendment to Employment Agreement by and between IHS Inc. and Richard Walker, dated as of October 22, 2009 (2) | |
10.31+ | Amendment to Employment Agreement by and between IHS Inc. and Richard Walker, dated as of December 3, 2010 (2) | |
10.32+ | Amendment to Employment Agreement by and between IHS Inc. and Richard Walker, dated as of December 31, 2012 (14) | |
10.33+ | Termination Agreement by and between IHS Inc. and Richard Walker, dated September 18, 2013 (16) | |
10.34 | Registration Rights Agreement, dated as of October 28, 2014, among the Company, the Guarantors and J.P. Morgan Securities LLC, as representative of the initial purchasers named therein (20) | |
10.35* | Credit Agreement by and among IHS Inc., certain of its subsidiaries, Bank of America, N.A., Bank of America, N.A. (Canada Branch), JPMorgan Chase Bank, N.A., JPMorgan Chase Bank, N.A., Toronto Branch, Royal Bank of Canada, Wells Fargo Bank N.A., Compass Bank, TD Bank, N.A., Citizens Bank, N.A., PNC Bank, National Association, U.S. Bank National Association, Goldman Sachs Bank USA, HSBC Bank USA, N.A., Sumitomo Mitsui Banking Corporation, BNP Paribas, Bank of the West, SunTrust Bank, Morgan Stanley Bank, N.A. and The Bank of Tokyo-Mitsubishi UFJ, Ltd., dated as of October 17, 2014 | |
75
10.36 | Credit Agreement by and among IHS Inc., IHS Global Inc., JPMorgan Chase Bank, N.A., Bank of America, N.A., RBS Citizens, N.A., Wells Fargo Bank, N.A., BBVA Compass, HSBC Bank USA, N.A., Royal Bank of Canada, PNC Bank, National Association, U.S. Bank National Association, TD Bank, N.A., Goldman Sachs Bank USA, The Bank of Tokyo-Mitsubishi UFJ, Ltd, Hua Nan Commercial, Ltd, New York Agency, Sumitomo Mitsui Banking Corporation and Commercial Bank, dated as of July 15, 2013 (16) | |
10.37 | First Amendment to Credit Agreement by and among IHS Inc., IHS Global Inc., JPMorgan Chase Bank, N.A., Bank of America, N.A., RBS Citizens, N.A., Wells Fargo Bank, N.A., BBVA Compass, HSBC Bank USA, N.A., Royal Bank of Canada, PNC Bank, National Association, U.S. Bank National Association, TD Bank, N.A., Goldman Sachs Bank USA, The Bank of Tokyo-Mitsubishi UFJ, Ltd, Hua Nan Commercial, Ltd, New York Agency, Sumitomo Mitsui Banking Corporation and Commercial Bank, dated as of June 30, 2014 (18) | |
10.38* | Credit Agreement (amending and restating the Credit Agreement dated as of July 15, 2013, as amended) by and among IHS Inc., IHS Global Inc., Bank of America, N.A., JPMorgan Chase Bank, N.A., Royal Bank of Canada, Wells Fargo Bank N.A., Compass Bank, TD Bank, N.A., Sumitomo Mitsui Banking Corporation, Citizens Bank, N.A., The Bank of Tokyo-Mitsubishi UFJ, Ltd., PNC Bank, National Association, U.S. Bank National Association, Goldman Sachs Bank USA, HSBC Bank USA, N.A., BNP Paribas, Bank of the West, and SunTrust Bank, dated as of October 17, 2014 | |
10.39 | Credit Agreement by and among IHS Inc., certain of its subsidiaries, J.P. Morgan Chase Bank, National Association, Bank of America N.A., RBS Citizens, N.A., Bank of America, N.A. (Canada Branch), Wells Fargo Bank, National Association, HSBC Bank USA, National Association, U.S. Bank, National Association, TD Bank, N.A., Barclays Bank PLC, PNC Bank, National Association, Citibank, N.A., HSBC Bank PLC and Compass Bank dated as of January 5, 2011 (10) | |
10.40 | First Amendment to Credit Agreement by and among IHS Inc., certain of its subsidiaries, J.P. Morgan Chase Bank, National Association, Bank of America N.A., RBS Citizens, N.A., Bank of America, N.A. (Canada Branch), Wells Fargo Bank, National Association, HSBC Bank USA, National Association, U.S. Bank, National Association, TD Bank, N.A., Barclays Bank PLC, PNC Bank, National Association, Citibank, N.A., HSBC Bank PLC and Compass Bank dated as of October 11, 2011 (11) | |
10.41 | Second Amendment to Credit Agreement by and among IHS Inc., certain of its subsidiaries, J.P. Morgan Chase Bank, National Association, Bank of America N.A., RBS Citizens, N.A., Wells Fargo Bank, National Association, HSBC Bank USA, National Association, U.S. Bank, National Association, TD Bank, N.A., Barclays Bank PLC, PNC Bank, National Association, Goldman Sachs Bank USA, Morgan Stanley Bank, N.A., Union Bank, N.A., Royal Bank of Canada, Hua Nan Commercial Bank, Ltd, New York and Compass Bank, dated as of July 15, 2013 (16) | |
10.42 | Third Amendment to Credit Agreement by and among IHS Inc., certain of its subsidiaries, J.P. Morgan Chase Bank, National Association, Bank of America N.A., RBS Citizens, N.A., Wells Fargo Bank, National Association, HSBC Bank USA, National Association, U.S. Bank, National Association, TD Bank, N.A., Barclays Bank PLC, PNC Bank, National Association, Goldman Sachs Bank USA, Morgan Stanley Bank, N.A., Union Bank, N.A., Royal Bank of Canada, Hua Nan Commercial Bank, Ltd, New York and Compass Bank, dated as of June 30, 2014 (18) | |
10.43 | Credit Agreement by and among IHS Inc., IHS Global Inc., Royal Bank of Canada, and Bank of America, N.A., dated as of August 29, 2012 (12) | |
10.44 | First Amendment to Credit Agreement by and among IHS Inc., IHS Global Inc., Royal Bank of Canada, and Bank of America, N.A., dated as of July 15, 2013 (16) | |
10.45 | Second Amendment to Credit Agreement by and among IHS Inc., IHS Global Inc., Royal Bank of Canada, and Bank of America, N.A., dated as of June 30, 2014 (18) | |
21* | List of Subsidiaries of the Registrant | |
23* | Consent of Ernst & Young LLP | |
24* | Power of Attorney | |
31.1* | Certification of the Chief Executive Officer Pursuant to Rules 13a-14(a) and 15d-14(a) of the Securities Exchange Act. | |
31.2* | Certification of the Chief Financial Officer Pursuant to Rules 13a-14(a) and 15d-14(a) of the Securities Exchange Act. | |
32* | Certification of the Chief Executive Officer and Chief Financial Officer Pursuant to 18 U.S.C. Section 1350, as adopted Pursuant to Section 906 of the Sarbanes-Oxley Act of 2002. | |
101.INS* | XBRL Instance Document | |
101.SCH* | XBRL Taxonomy Extension Schema Document | |
101.CAL* | XBRL Taxonomy Extension Calculation Linkbase Document | |
101.DEF* | XBRL Taxonomy Extension Definition Linkbase Document | |
76
101.LAB* | XBRL Taxonomy Extension Label Linkbase Document | |
101.PRE* | XBRL Taxonomy Extension Presentation Linkbase Document | |
___________________
* | Filed electronically herewith. |
+ | Compensatory plan or arrangement. |
(1) | Previously filed with the Securities and Exchange Commission as an exhibit to the Registrant's Annual Report on Form 10-K for the period ended November 30, 2011, and incorporated herein by reference. |
(2) | Previously filed with the Securities and Exchange Commission as an exhibit to the Registrant's Quarterly Report on Form 10-Q for the period ended August 31, 2011, and incorporated herein by reference. |
(3) | Previously filed with the Securities and Exchange Commission as an exhibit to the Registrant's Annual Report on Form 10-K for the period ended November 30, 2010, and incorporated herein by reference. |
(4) | Previously filed with the Securities and Exchange Commission as an exhibit to the Registration Statement on Form S-1 (No. 333-122565) of the Registrant filed on February 4, 2005, as amended, and incorporated herein by reference. |
(5) | Previously filed with the Securities and Exchange Commission as an exhibit to the Registrant's Annual Report on Form 10-K for the period ended November 30, 2008, and incorporated herein by reference. |
(6) | Previously filed with the Securities and Exchange Commission as an exhibit to the Registrant's Annual Report on Form 10-K for the period ended November 30, 2006, as amended, and incorporated herein by reference. |
(7) | Previously filed with the Securities and Exchange Commission as an exhibit to the Registrant's Annual Report on Form 10-K for the period ended November 30, 2009, and incorporated herein by reference. |
(8) | Previously filed with the Securities and Exchange Commission as an exhibit to the Registrant's Quarterly Report on Form 10-Q for the period ended February 28, 2011, and incorporated herein by reference. |
(9) | Previously filed with the Securities and Exchange Commission as an exhibit to the Registrant's Periodic Report on Form 8-K dated December 10, 2010, and incorporated herein by reference. |
(10) | Previously filed with the Securities and Exchange Commission as an exhibit to the Registrant's Periodic Report on Form 8-K dated January 6, 2011, and incorporated herein by reference. |
(11) | Previously filed with the Securities and Exchange Commission as an exhibit to the Registrant's Periodic Report on Form 8-K dated October 13, 2011, and incorporated herein by reference. |
(12) | Previously filed with the Securities and Exchange Commission as an exhibit to the Registrant's Quarterly Report on Form 10-Q for the period ended August 31, 2012, and incorporated herein by reference. |
(13) | Previously filed with the Securities and Exchange Commission as an exhibit to the Registrant's Quarterly Report on Form 10-Q for the period ended May 31, 2009, and incorporated herein by reference. |
(14) | Previously filed with the Securities and Exchange Commission as an exhibit to the Registrant's Quarterly Report on Form 10-Q for the period ended February 28, 2013, and incorporated herein by reference. |
(15) | Previously filed with the Securities and Exchange Commission as an exhibit to the Registrant's Periodic Report on Form 8-K dated July 16, 2013, and incorporated herein by reference. |
(16) | Previously filed with the Securities and Exchange Commission as an exhibit to the Registrant's Quarterly Report on Form 10-Q for the period ended August 31, 2013, and incorporated herein by reference. |
(17) | Previously filed with the Securities and Exchange Commission as an exhibit to the Registrant's Annual Report on Form 10-K for the period ended November 30, 2012, and incorporated herein by reference. |
77
(18) | Previously filed with the Securities and Exchange Commission as an exhibit to the Registrant's Quarterly Report on Form 10-Q for the period ended August 31, 2014, and incorporated herein by reference. |
(19) | Previously filed with the Securities and Exchange Commission as an exhibit to the Registrant's Quarterly Report on Form 10-Q for the period ended February 28, 2014, and incorporated herein by reference. |
(20) | Previously filed with the Securities and Exchange Commission as an exhibit to the Registrant's Periodic Report on Form 8-K dated October 28, 2014, and incorporated herein by reference. |
(21) | Previously filed with the Securities and Exchange Commission as an exhibit to the Registrant's Annual Report on Form 10-K for the period ended November 30, 2013, and incorporated herein by reference. |
(c) Financial Statement Schedules
All schedules for the Registrant have been omitted since the required information is not present or because the information is included in the financial statements or notes thereto.
78
SIGNATURES
Pursuant to the requirements of Section 13 or 15(d) of the Securities Exchange Act of 1934, the Registrant has duly caused this report to be signed on its behalf by the undersigned, thereunto duly authorized.
IHS INC. | ||||
By: | /s/ Stephen Green | |||
Name: | Stephen Green | |||
Title: | Executive Vice President, Legal and Corporate Secretary | |||
Date: | January 16, 2015 | |||
79
Pursuant to the requirements of the Securities Exchange Act of 1934, as amended, this report has been signed by the following persons on behalf of the registrant and in the capacities indicated on January 16, 2015.
Signature | Title | |
/s/ Scott Key | Director, President and Chief Executive Officer | |
Scott Key | (Principal Executive Officer) | |
/s/ Todd S. Hyatt | Executive Vice President, Chief Financial Officer | |
Todd S. Hyatt | (Principal Financial Officer) | |
/s/ Heather Matzke-Hamlin | Senior Vice President and Chief Accounting Officer | |
Heather Matzke-Hamlin | (Principal Accounting Officer) | |
* | Director | |
Ruann F. Ernst | ||
* | Director | |
Brian H. Hall | ||
* | Director | |
Roger Holtback | ||
* | Director | |
Balakrishnan S. Iyer | ||
* | Director | |
Jean-Paul L. Montupet | ||
* | Director | |
Richard W. Roedel | ||
* | Director | |
Jerre L. Stead | ||
* | Director | |
Christoph v. Grolman | ||
*By: /s/ Stephen Green | ||
Stephen Green | ||
Attorney-in-Fact | ||
80