Attached files
| file | filename |
|---|---|
| 8-K - AIR METHODS CORPORATION 8-K 12-23-2015 - AIR METHODS CORP | form8k.htm |
Exhibit 99.1
Air Methods CorporationNASDAQ: AIRM Corporate Presentation – December 2015

* Forward Looking Statements/Non-GAAP Financial Information Forward Looking Statements: Forward-looking statements in this news release are made pursuant to the safe harbor provisions of the Private Securities Litigation Reform Act of 1995. Statements in this press release that are “forward-looking statements”, including those related to (i) preliminary flight volume for April 2015; and (ii) increasing demand for our services, are based on current expectations and assumptions that are subject to risks and uncertainties. Actual results could differ materially from those currently anticipated due to a number of factors, including but not limited to, the size, structure and growth of the Company's air medical services, United Rotorcraft Division and Tourism Division; the collection rates for patient transports; pace of collections; the continuation and/or renewal of air medical service contracts; the final results of April 2015 flight volume; weather conditions across the U.S.; development and changes in laws and regulations, including, without limitation, the impact of the Patient Protection and Affordable Care Act; increased regulation of the health care and aviation industry through legislative action and revised rules and standards; and other matters set forth in the Company's filings with the SEC. The Company is under no obligation (and expressly disclaims any obligation) to update or alter its forward-looking statements, whether as a result of new information, future events or otherwise.Non-GAAP Financial Information: This presentation discusses EBITDA, which is not calculated in conformity with U.S. Generally Accepted Accounting Principles (GAAP). The Company defines EBITDA as earnings before interest, income taxes, depreciation, amortization and gain or loss on disposition of assets. A table is provided in this press release to reconcile such non-GAAP financial measure to net income, which is the most directly comparable financial measure prepared in accordance with GAAP. Such table below includes all information reasonably available to the Company at the date of this press release and adjustments that the Company can reasonably predict. Events that could cause the reconciliation to change include, but are not limited to, acquisitions and divestitures of businesses and goodwill and other asset impairments. To supplement the Company’s consolidated financial statements presented on a GAAP basis, management believes that this non-GAAP measure provides useful information about the Company’s core operating results and thus is appropriate to enhance the overall understanding of the Company’s past financial performance and its prospects for the future. Management believes the additions and subtractions from net income used to calculate EBITDA reflect the measurements that its bank creditors and third party stock analysts use in evaluating the Company. These adjustments to the Company’s GAAP results are made with the intent of providing both management and investors a more complete understanding of the Company’s underlying operational results and trends and performance. Management uses this non-GAAP measure to evaluate the Company’s financial results. The presentation of non-GAAP measures is not meant to be considered in isolation or as a substitute for or superior to financial results determined in accordance with GAAP.

* Air Methods’ Profile AIRM is the largest provider of air medical transportation services in the estimated $4.0 Billion U.S. market, transporting approximately 98,765 patients (TTM 9/30/15) and operating in 42 states.AIRM’s helicopter tourism operations generated $125 Million of revenue (TTM 9/30/15). Total US helicopter tourism revenue is estimated to be in excess of $500 Million.

* Services Provided Air Medical Services (AMS) (86% of TTM 9/30/15 Revenue)Patient Transport (70%)AMS Contract (15%)Dispatch & Billing Services (1%)Tourism (12%)United Rotorcraft (2%)

* Differences of Two Air Medical Service Delivery Models Patient Transport Revenue (CBS)TTM Revenue of $741 Million Typically no contract with third partyAviation services PLUS medical staffing, dispatch and communications, and billing and collections100% variable revenue stream200 Bases Approx. $3.9 million of revenue and $1.5 million of contribution per base before any allocation of G&A costs Growth primarily driven from outsourced hospital programs, new base expansion and increases in reimbursement AMS Contract Revenue (HBS)TTM Revenue of $162 Million Long term contract with hospitalAviation services onlyApprox. 80% fixed revenue stream 93 Bases Approx. $1.7 million of revenue and $304,000 of contribution per base before any allocation of G&A costsGrowth primarily driven from satellite expansion, new contracts and annual contractual prices

* Growth of Air Medical Operations 2012 2013 %Change 2014 %Change TTM 9/30/15 %Change Patient Transport Revenue $590,718 $585,459 (0.9%) $676,213 15.5% $741,261 9.6% Net Revenue / Transport $10,509 $10,861 3.4% $11,643 7.2% $12,029 3.3% Transports 56,210 53,805 (4.3%) 57,940 7.7% 61,496 6.1% Transports + Weather Cancellations 72,005 72,117 0.2% 76,566 6.2% 84,283 10.1% # Bases 169 179 5.9% 189 5.6% 200 5.8% AMS Contract Revenue $224,956 $204,512 (9.1%) $176,744 (13.6%) $161,658 -8.5% # Bases 139 109 (21.6%) 97 (11.0%) 93 -4.1%

* Air Medical Flight Services Map

* Patient Transport RevenueSeasonal Fluctuations for Patient Transports # of Transports/Cancellations

* Scene vs Inter-Facility Flights # of Transports
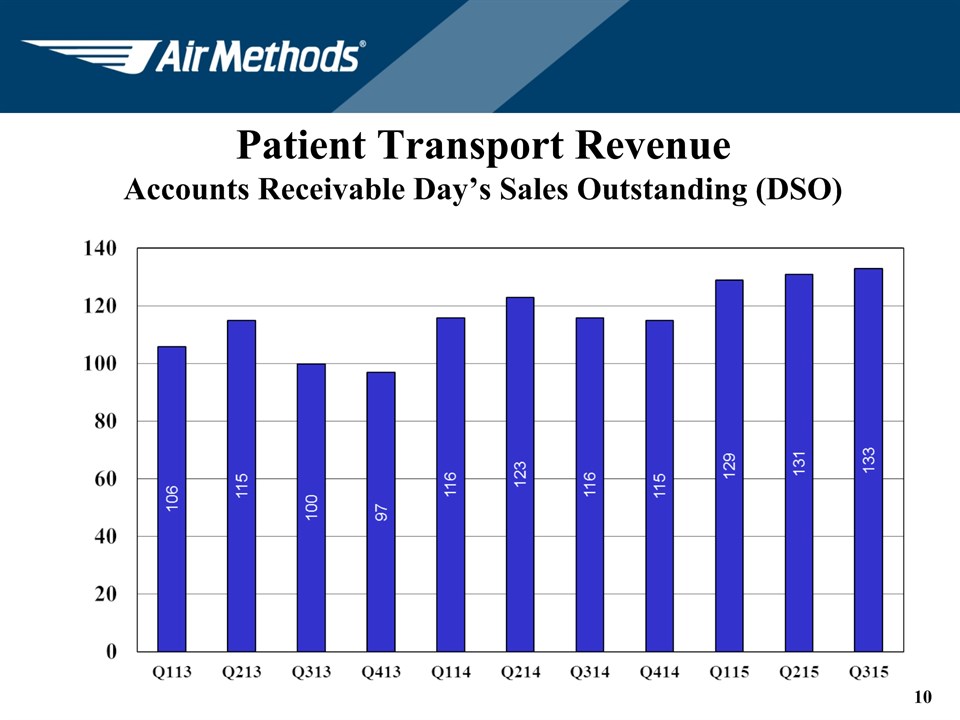
* Patient Transport RevenueAccounts Receivable Day’s Sales Outstanding (DSO)

* Growth in DSOs The Company’s DSO calculation methodology excludes 3rd party collection agency receivables. If these receivables were included in the calculation in both periods, the YOY increase in DSOs would have been 10 days instead of 17.Drivers of the growth include payor delay tactics (e.g., medical necessity denials, additional record requests, etc.), increases in out-of-network billing, and other factors.
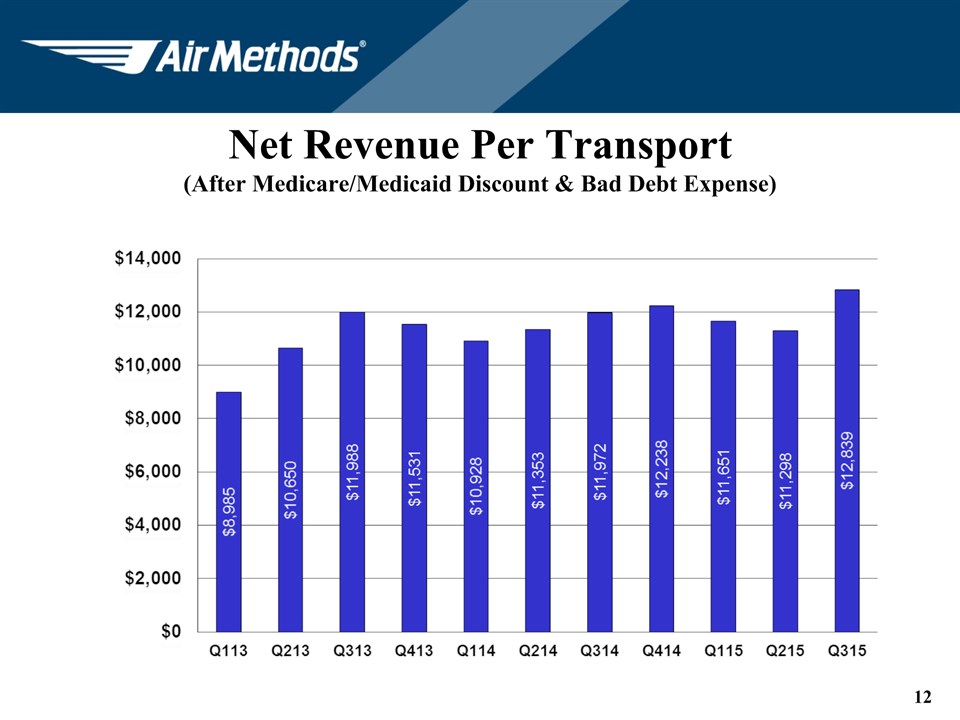
* Net Revenue Per Transport(After Medicare/Medicaid Discount & Bad Debt Expense)
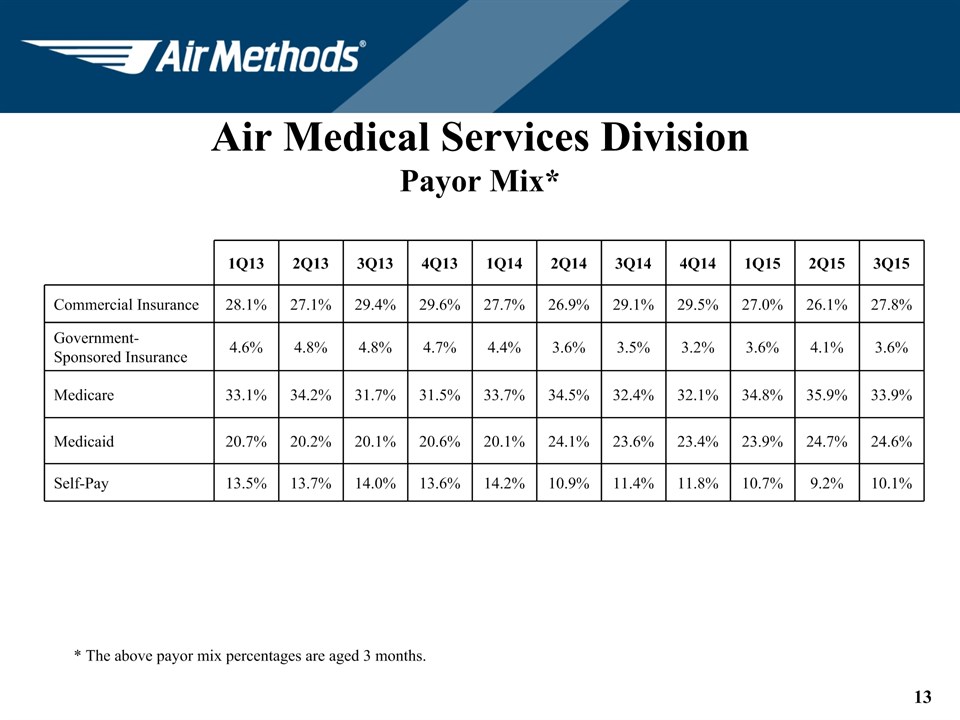
* Air Medical Services DivisionPayor Mix* * The above payor mix percentages are aged 3 months. 1Q13 2Q13 3Q13 4Q13 1Q14 2Q14 3Q14 4Q14 1Q15 2Q15 3Q15 Commercial Insurance 28.1% 27.1% 29.4% 29.6% 27.7% 26.9% 29.1% 29.5% 27.0% 26.1% 27.8% Government-Sponsored Insurance 4.6% 4.8% 4.8% 4.7% 4.4% 3.6% 3.5% 3.2% 3.6% 4.1% 3.6% Medicare 33.1% 34.2% 31.7% 31.5% 33.7% 34.5% 32.4% 32.1% 34.8% 35.9% 33.9% Medicaid 20.7% 20.2% 20.1% 20.6% 20.1% 24.1% 23.6% 23.4% 23.9% 24.7% 24.6% Self-Pay 13.5% 13.7% 14.0% 13.6% 14.2% 10.9% 11.4% 11.8% 10.7% 9.2% 10.1%

* Patient Transport Revenue(Commercial Private Insurance Collection Rate Percentage)

* Air Medical Competitors AIRM - $903M TTMNational Competitors (3)Air Medical Group Holdings (Air Evac/MedTrans)- est. TTM $620MPHI, Inc. - $305MMetro Aviation, Inc. - est. TTM $100MRegional Competitors (numerous)Hospitals and Other Based on Revenue

* Tourism Operations Largest tour operator in Hawaii (Blue Hawaiian) and third largest operator in Las Vegas (Sundance Helicopters).TTM 9/30/15 revenue of $125 million.Low working capital requirements – revenue paid mostly in advance.Relatively stable operations and cash flow.Common fleet with AMS creates operational synergies and purchasing power.Provides strong talent pipeline into AMS as Tourism pilots fly up to 4 times the flight hours per year.

* Tourism Flight Services SundanceFlights to Grand Canyon, the Strip and Hoover Dam30 aircraftHeadquarters in Las Vegas Blue HawaiianFlights to tourist attractions31 aircraftHeadquarters in Maui

* Summary of Tourism OperationsSeptember 30, 2015 TTM Tourism Revenue $125,204 Operating and Other Expenses $111,777 EBITDA $20,992 # of Passengers 456,370 # of Aircraft 61

* Tourism Competitors AIRM - $125M TTM combined for Blue Hawaiian and Sundance HelicoptersRegional Competitors (2)Maverick – Las Vegas est. $65MPapillion – Las Vegas est. - $120MOther Operators - est. $190M Based on Revenue

* Operating Fleet SummarySeptember 30, 2015 Helicopters Airplanes Total Air Medical Services Owned – Unencumbered 115 16 131 Owned – Promissory Note 91 3 94 Leased 94 2 96 Customer Owned 50 4 54 350 25 375 Tourism Owned - Unencumbered 42 1 43 Owned – Promissory Note 17 1 18 59 2 61

* Operational Fleet SummaryAverage Age of Fleet (including Tourism)
* Growth and Value Drivers Solid participation in price increases.Hospital base conversions (28 bases since 2010).Average growth in base revenue of $2.2 million and base contribution of $1.2 million before any allocation of G&A costs.9 bases outsourced in 2014 and 13 through October 2015.18 bases in discussion for conversion.Greenfield base expansions (44 bases since 2012).Annualized contribution of $38.8 million.Declining fuel prices lower costs and increase demand.

* Growth and Value Drivers Positive reimbursement outlook from healthcare reform and/or an improving economy.Healthcare reform (movement in payor mix currently unknown but should be positive).1% shift from Uninsured to Medicaid = $1.0 million.1% shift from Uninsured to Medicare = $3.0 million.1% shift from Uninsured to Government Insured = $6.0 million.1% shift from Uninsured to Commercial Insured = $21.0 million.Expanded insurance coverage as national employment profile improves - if the labor force participation rate improves, the number of Americans with commercial insurance likely will increase as well.

* Growth and Value Drivers National relationships/transfer center servicesCHS agreement potentialOver 4,500 total CBS transports in 2014 vs 3,000 in 2013, 2,800 in 2012 and 1,100 in 2011.Additional CBS transports with the HMA acquisition.Transfer center operationsFacilitating the movement of patients between hospitals.Total air medical flight volume of over 9,200 TTM September 30, 2015, 7,800 in 2014, 6,000 in 2013 and 5,000 in 2012.TTM September 30, 2015 flight volume includes over 2,700 CBS flights and over 2,800 HBS flights.Never lost a customer where we have provided transfer center or other value-added services.

* Growth and Value Drivers Tourism diversification and consolidationSundance Helicopters acquired in December 2012 and Blue Hawaiian acquired in December 2013.Attractive purchase price multiples and availability of leverage financing.Operational efficiencies around fleet and spare parts procurement, and employee recruitment.Can use existing tourism operations as a platform for future acquisitions.Talent pipeline for pilots and mechanics.Ability to re-deploy air medical aircraft into the Tourism Division.OtherInternational.Government services contracts.
* Growth and Value Drivers Solid free cash flow.Continue to buy out aircraft leases – bought out $43 million in 2014 and expect to buyout $23 million in 2015.Over $110 million of lease buyouts in 2013.Reduces depreciation and interest expense.Reduces monthly capital lease payments.Some financed with fixed interest rate, long term promissory notes.Provides current tax deductions. 9.4% cash tax rate in 2014 vs. 17.0% in 2013 and 28.1% in 2012.Continue to pay down variable rate debt – approximately 48% of outstanding indebtedness (excluding capital leases).Continue M&A activity.Cash dividends and stock buybacks.

* AIRM Free Cash Flow Before Debt Service($ Millions) FY 2011* FY 2012* FY 2013* FY 2014* TTM 9/30/15* EBITDA-Continuing Operations $170.9 $257.4 $203.0 $265.6 $286.3 Interest $19.4 $20.1 $19.6 $20.8 $19.3 Cash Payments for Income Taxes $15.4 $43.0 $17.4 $15.4 $31.1 Capital Expenditures Exclusive of Aircraft Lease Buyouts ** $21.5 $27.0 $62.4 $119.8 $127.4 Excess Cash Flow $114.6 $167.3 $103.6 $109.6 $108.5 Excess Cash Flow/Share $2.98 $4.28 $2.64 $2.79 $2.75 (*) Includes Omniflight operations from August 1, 2011.(**) Capital Expenditures includes aircraft that have been financed and excludes asset sale proceeds.

* Accidents.Variability in operating results due to seasonality, weather, changes in patient mix, timing of maintenance and changes in fuel prices.Regulations – aviation, reimbursement, licensure, government contracts.Growth in industry capacity, changes in technology and general health care trends could curtail utilization of air ambulance services.Increasingly higher reliance on private insurance for net revenue – currently 73% of patient transport revenue.Portfolio of like kind aircraft – cost effective platform.Availability of talented labor force. Operational Challenges/Uncertainties
